the Creative Commons Attribution 4.0 License.
the Creative Commons Attribution 4.0 License.
 | 16 Dec 2021
Reduced-complexity air quality intervention modeling over China: the development of InMAPv1.6.1-China and a comparison with CMAQv5.2
Ruili Wu
Christopher W. Tessum
Yang Zhang
Chaopeng Hong
Yixuan Zheng
Xinyin Qin
Shigan Liu
Qiang Zhang
This paper presents the first development and evaluation of a reduced-complexity air quality model for China. In this study, the reduced-complexity Intervention Model for Air Pollution over China (InMAP-China) is developed by linking a regional air quality model, a reduced-complexity air quality model, an emission inventory database for China, and a health impact assessment model to rapidly estimate the air quality and health impacts of emission sources in China. The modeling system is applied over mainland China for 2017 under various emission scenarios. A comprehensive model evaluation is conducted by comparison against conventional Community Multiscale Air Quality (CMAQ) modeling system simulations and ground-based observations. We found that InMAP-China satisfactorily predicted total PM2.5 concentrations in terms of statistical performance. Compared with the observed PM2.5 concentrations, the mean bias (MB), normalized mean bias (NMB) and correlations of the total PM2.5 concentrations are −8.1 µg m−3, −18 % and 0.6, respectively. The statistical performance is considered to be satisfactory for a reduced-complexity air quality model and remains consistent with that evaluated in the USA. The underestimation of total PM2.5 concentrations was mainly caused by its composition, primary PM2.5. In terms of the ability to quantify source contributions of PM2.5 concentrations, InMAP-China presents similar results to those based on the CMAQ model, with variation mainly caused by the different treatment of secondary inorganic aerosols in the two models. Focusing on the health impacts, the annual PM2.5-related premature mortality estimated using InMAP-China in 2017 was 1.92 million, which was 250 000 deaths lower than estimated based on CMAQ simulations as a result of the underestimation of PM2.5 concentrations. This work presents a version of the reduced-complexity air quality model over China that provides a powerful tool to rapidly assess the air quality and health impacts associated with control policy and to quantify the source contribution attributable to many emission sources.
- Article
(7555 KB) - Full-text XML
-
Supplement
(932 KB) - BibTeX
- EndNote


With rapid urbanization and industrialization, fine particulate matter pollution less than 2.5 µm in diameter (PM2.5) has become a major environmental issue in China. High PM2.5 concentrations can be observed over eastern China from satellite observations (Xiao et al., 2020); however, PM2.5 concentrations have largely decreased since 2013 due to the effective control measures taken by the Chinese government (Zhao et al., 2021). PM2.5 can affect air quality, ecosystems, and climate change, and it can also damage human health via short-term or long-term exposure. The Global Burden of Disease (GBD) study reported that 1.1 million premature deaths were caused by long-term PM2.5 exposure over China in 2015 (Cohen et al., 2017).
State-of-the-art three-dimensional air quality models (AQMs) have been widely used in China as tools to simulate regional PM2.5 concentrations, quantify the contributions to total PM2.5 concentrations resulting from emission sources and assess the benefits associated with control measures (Chang et al., 2019; Li et al., 2015; Zhang et al., 2015, 2019). The Weather Research and Forecasting–Community Multiscale Air Quality (WRF-CMAQ) modeling system (Appel et al., 2018; Chang et al., 2019), the Weather Research and Forecasting model coupled with Chemistry (WRF-Chem) (Reddington et al., 2019), the Weather Research and Forecasting–Comprehensive Air Quality Model Extension (WRF-CAMx) modeling system (Li et al., 2015), and the adjoint of global chemistry model GEOS-Chem (GEOS-Chem Adjoint) (Zhang et al., 2015) have been frequently used in previous studies. To conduct a series of simulations for multiple scenarios or quantify the separate contributions attributable to multiple sources, large computational resources and runtimes are required when utilizing conventional AQMs. To address these challenges and to improve the availability and accessibility of air quality modeling, several reduced-complexity models have been developed by the air quality research community. The three representative reduced-complexity air quality models frequently used are the Estimating Air Pollution Social Impact Using Regression (EASIUR) model (Heo et al., 2016, 2017), the updated Air Pollution Emission Experiments and Policy (APEEP2) model (Muller and Mendelsohn, 2007; Muller et al., 2011) and the Intervention Model for Air Pollution (InMAP) (Tessum et al., 2017). A recent study compared three reduced-complexity models, EASIUR, APEEP2, and InMAP, and the results indicate that these three models are consistent in their assessment of the marginal social cost at the county level (Gilmore et al., 2019). Reduced-complexity air quality models are less computationally intensive and easier to use. However, no such model is currently available for China. Therefore, it is essential to develop a reduced-complexity air quality model over China to quickly predict PM2.5 concentrations and the associated health impacts of emission sources.
The reduced-complexity Intervention Model for Air Pollution (InMAP) was developed by Tessum et al. (2017) to rapidly assess the air pollution, health and economic impacts resulting from marginal changes in air pollutant emissions. Compared with conventional air quality models, InMAP has the advantage of being temporally efficient: it can predict annual average PM2.5 concentrations within a few hours with only a modest reduction in accuracy compared with chemistry transport models (CTMs). InMAP reduces the runtime by simplifying the physical and chemical processes, and it has been used to assess marginal health damage of location-specific emission sources (Goodkind et al., 2019), to quantify the health impacts of individual coal-fired power plants in the USA (Thind et al., 2019) and to estimate the health benefits of control policies with respect to specific locations (Sergi et al., 2020). However, to date, a version of the reduced-complexity Intervention Model for Air Pollution for China is absent.
In this work, based on the source code of version 1.6.1 of InMAP, the reduced-complexity Intervention Model for Air Pollution over China (InMAP-China) is developed to rapidly predict the air quality and estimate the health impacts of emission sources in China. The total simulation time for the year 2017 using the InMAP-China model established in this study is approximately 1 h with a single 24-node central processing unit (CPU). Therefore, this model is convenient when conducting multiple simulations of PM2.5 concentrations due to air pollutant emissions in 2017. The modeling system is applied over mainland China for 2017 under various emission scenarios to examine model performance. Comparisons against conventional air quality models and surface observations are performed in this study. The model applicability and limitations are also declared.
The paper is organized as follows: Sect. 2.1 presents the components of InMAP-China, including the interface development between WRF-CMAQ and InMAP to generate the base atmospheric state parameters, the preprocessing process for emission input data and the exposure–response functions employed in this model; Sect. 2.2 introduces the evaluation protocol, including the statistical variables adopted and the simulation design in this study; Sect. 3 presents the evaluation of the InMAP-China predictions of PM2.5 air quality and PM2.5-related health impacts in several simulations; and, finally, Sect. 4 summarizes the conclusions and limitations of this study.
2.1 Model components and configurations
InMAP has been widely used in studies (Sergi et al., 2020; Thind et al., 2019; Goodkind et al., 2019; Dimanchevi et al., 2019) focusing on PM2.5 pollution as well as health and economic impacts resulting from emission sources in the USA. In this model, the continuous equation of atmospheric pollutants is solved at an annual scale, and the runtime can be reduced. The parameters used to represent physical and chemical processes for simplified simulation are calculated beforehand using CTM output data. PM2.5 air quality and PM2.5-related premature mortality are predicted and output in the InMAP model.
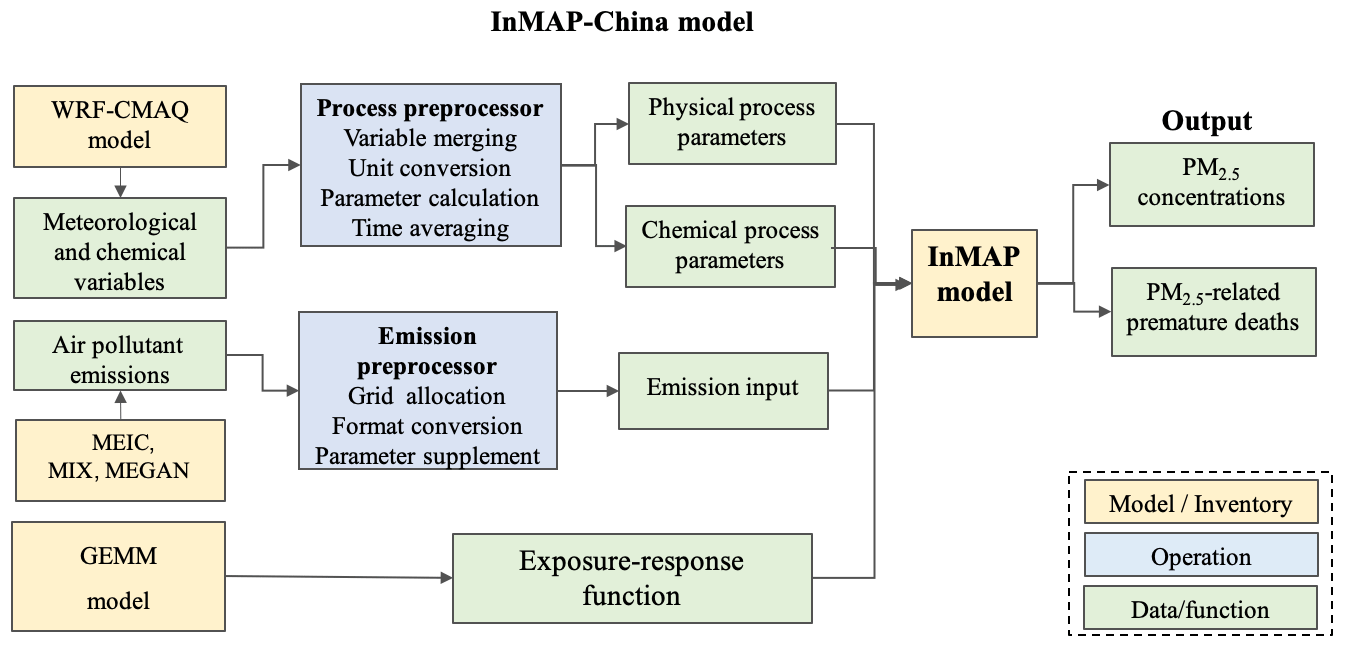
In this work, a Chinese version of the reduced-complexity Intervention Model for Air Pollution (InMAP-China) is developed to rapidly estimate the PM2.5 concentration and associated health impacts of emission sources. Figure 1 shows the model framework. Based on the source code of the InMAP model, three-step development work is conducted to establish InMAP-China. First, we develop a preprocessed interface to calculate physical and chemical process parameters using WRF-CMAQ output variables to support the simplified simulation in InMAP-China. Second, air pollutant emission data are preprocessed to an appropriate format for the InMAP-China simulation. Third, the exposure–response function of the Global Exposure Mortality Model (GEMM) is employed in InMAP-China and replaces the original default function to assess PM2.5-related health impacts.
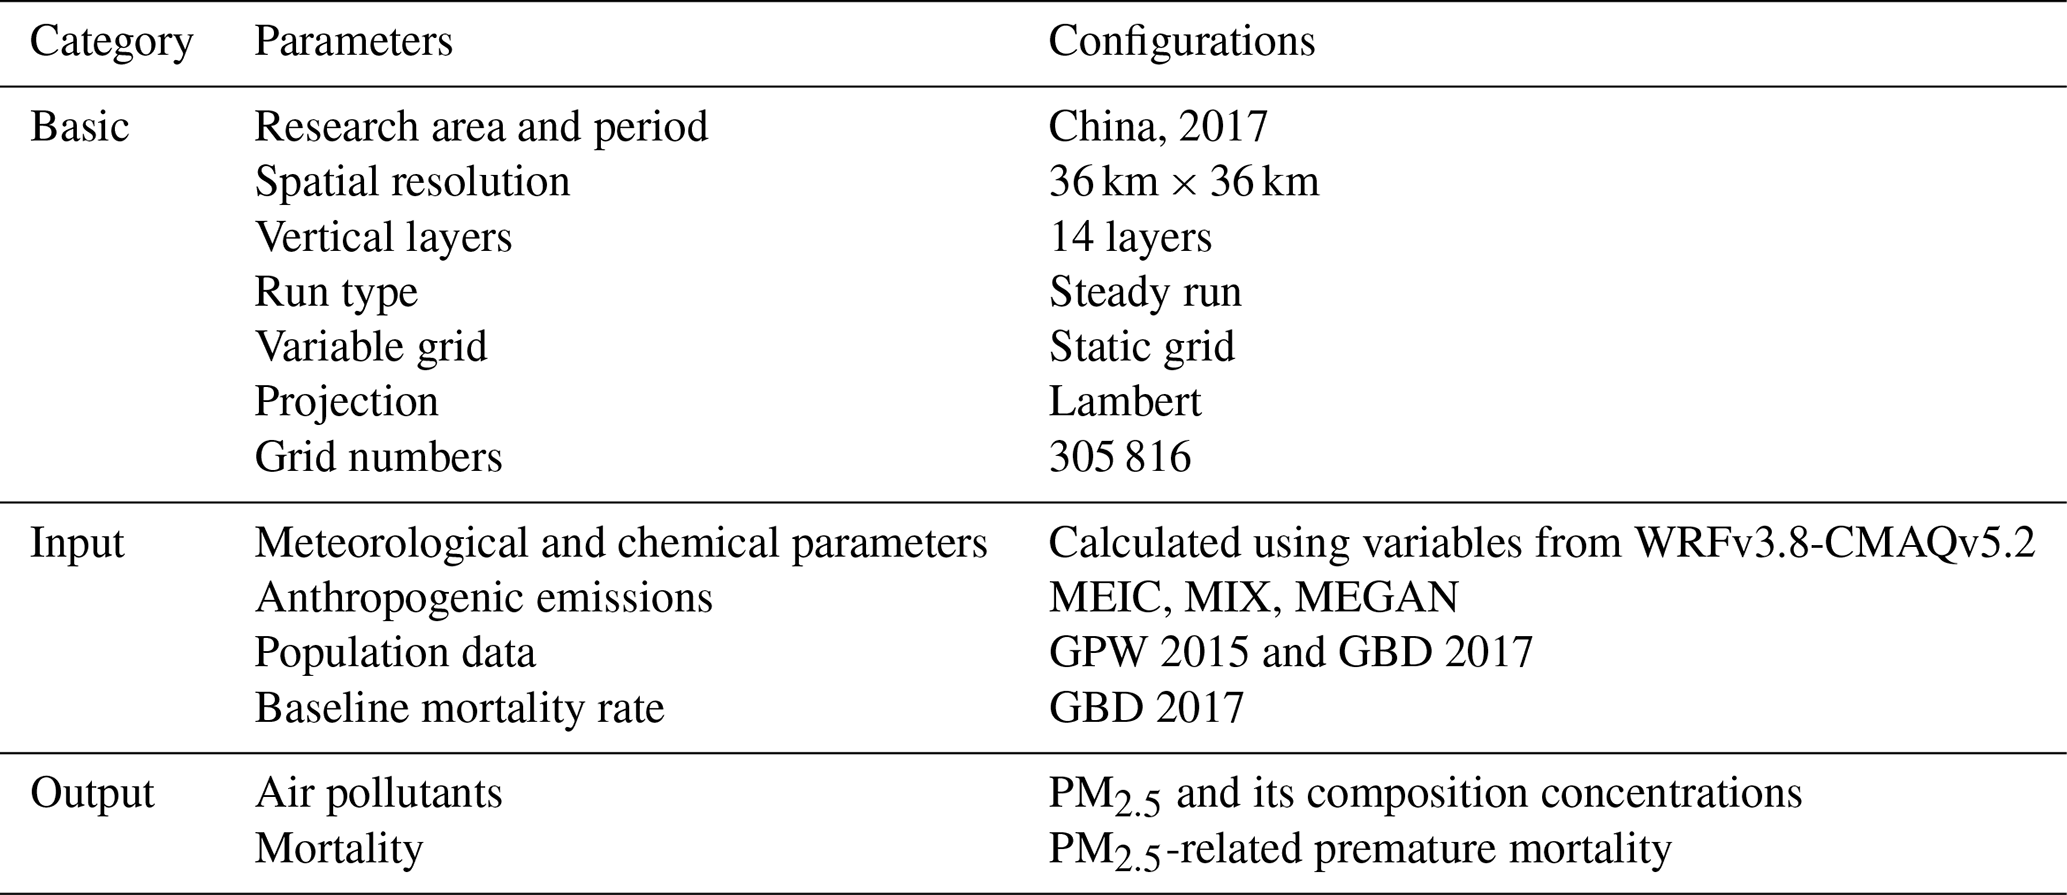
Table 1 presents the basic configurations of InMAP-China. The simulation domain is over East Asia and covers mainland China. The spatial resolution is 36 km. Fourteen vertical layers are used in InMAP-China, ranging from the surface layer to the top level of the tropospheric layer.
2.1.1 Parameter interface development for simplified simulation in InMAP-China
We develop a preprocessed interface to calculate physical and chemical process parameters using WRF-CMAQ output variables for simplified simulation in InMAP-China based on work from the Environmental Protection Agency (EPA) (Baker et al., 2020). Two NetCDF (Network Common Data Form) files containing the key parameters for simplified simulation are generated using the parameter interface developed here: one is at a 36 km resolution across the entire mainland of China and another is at a 4 km resolution over the Beijing–Tianjin–Hebei (BTH) region. The main step of the preprocessed interface includes meteorological and chemical variable extraction and merging, unit conversion, vertical layer mapping, physical and chemical process parameter calculation, and average processing. The hourly chemical and meteorological variable outputs from the WRF-CMAQ modeling system are converted into the annual average physical and chemical process parameters required for simplified simulation.
Table 2The relationship between parameters for simplified simulation and original variables.
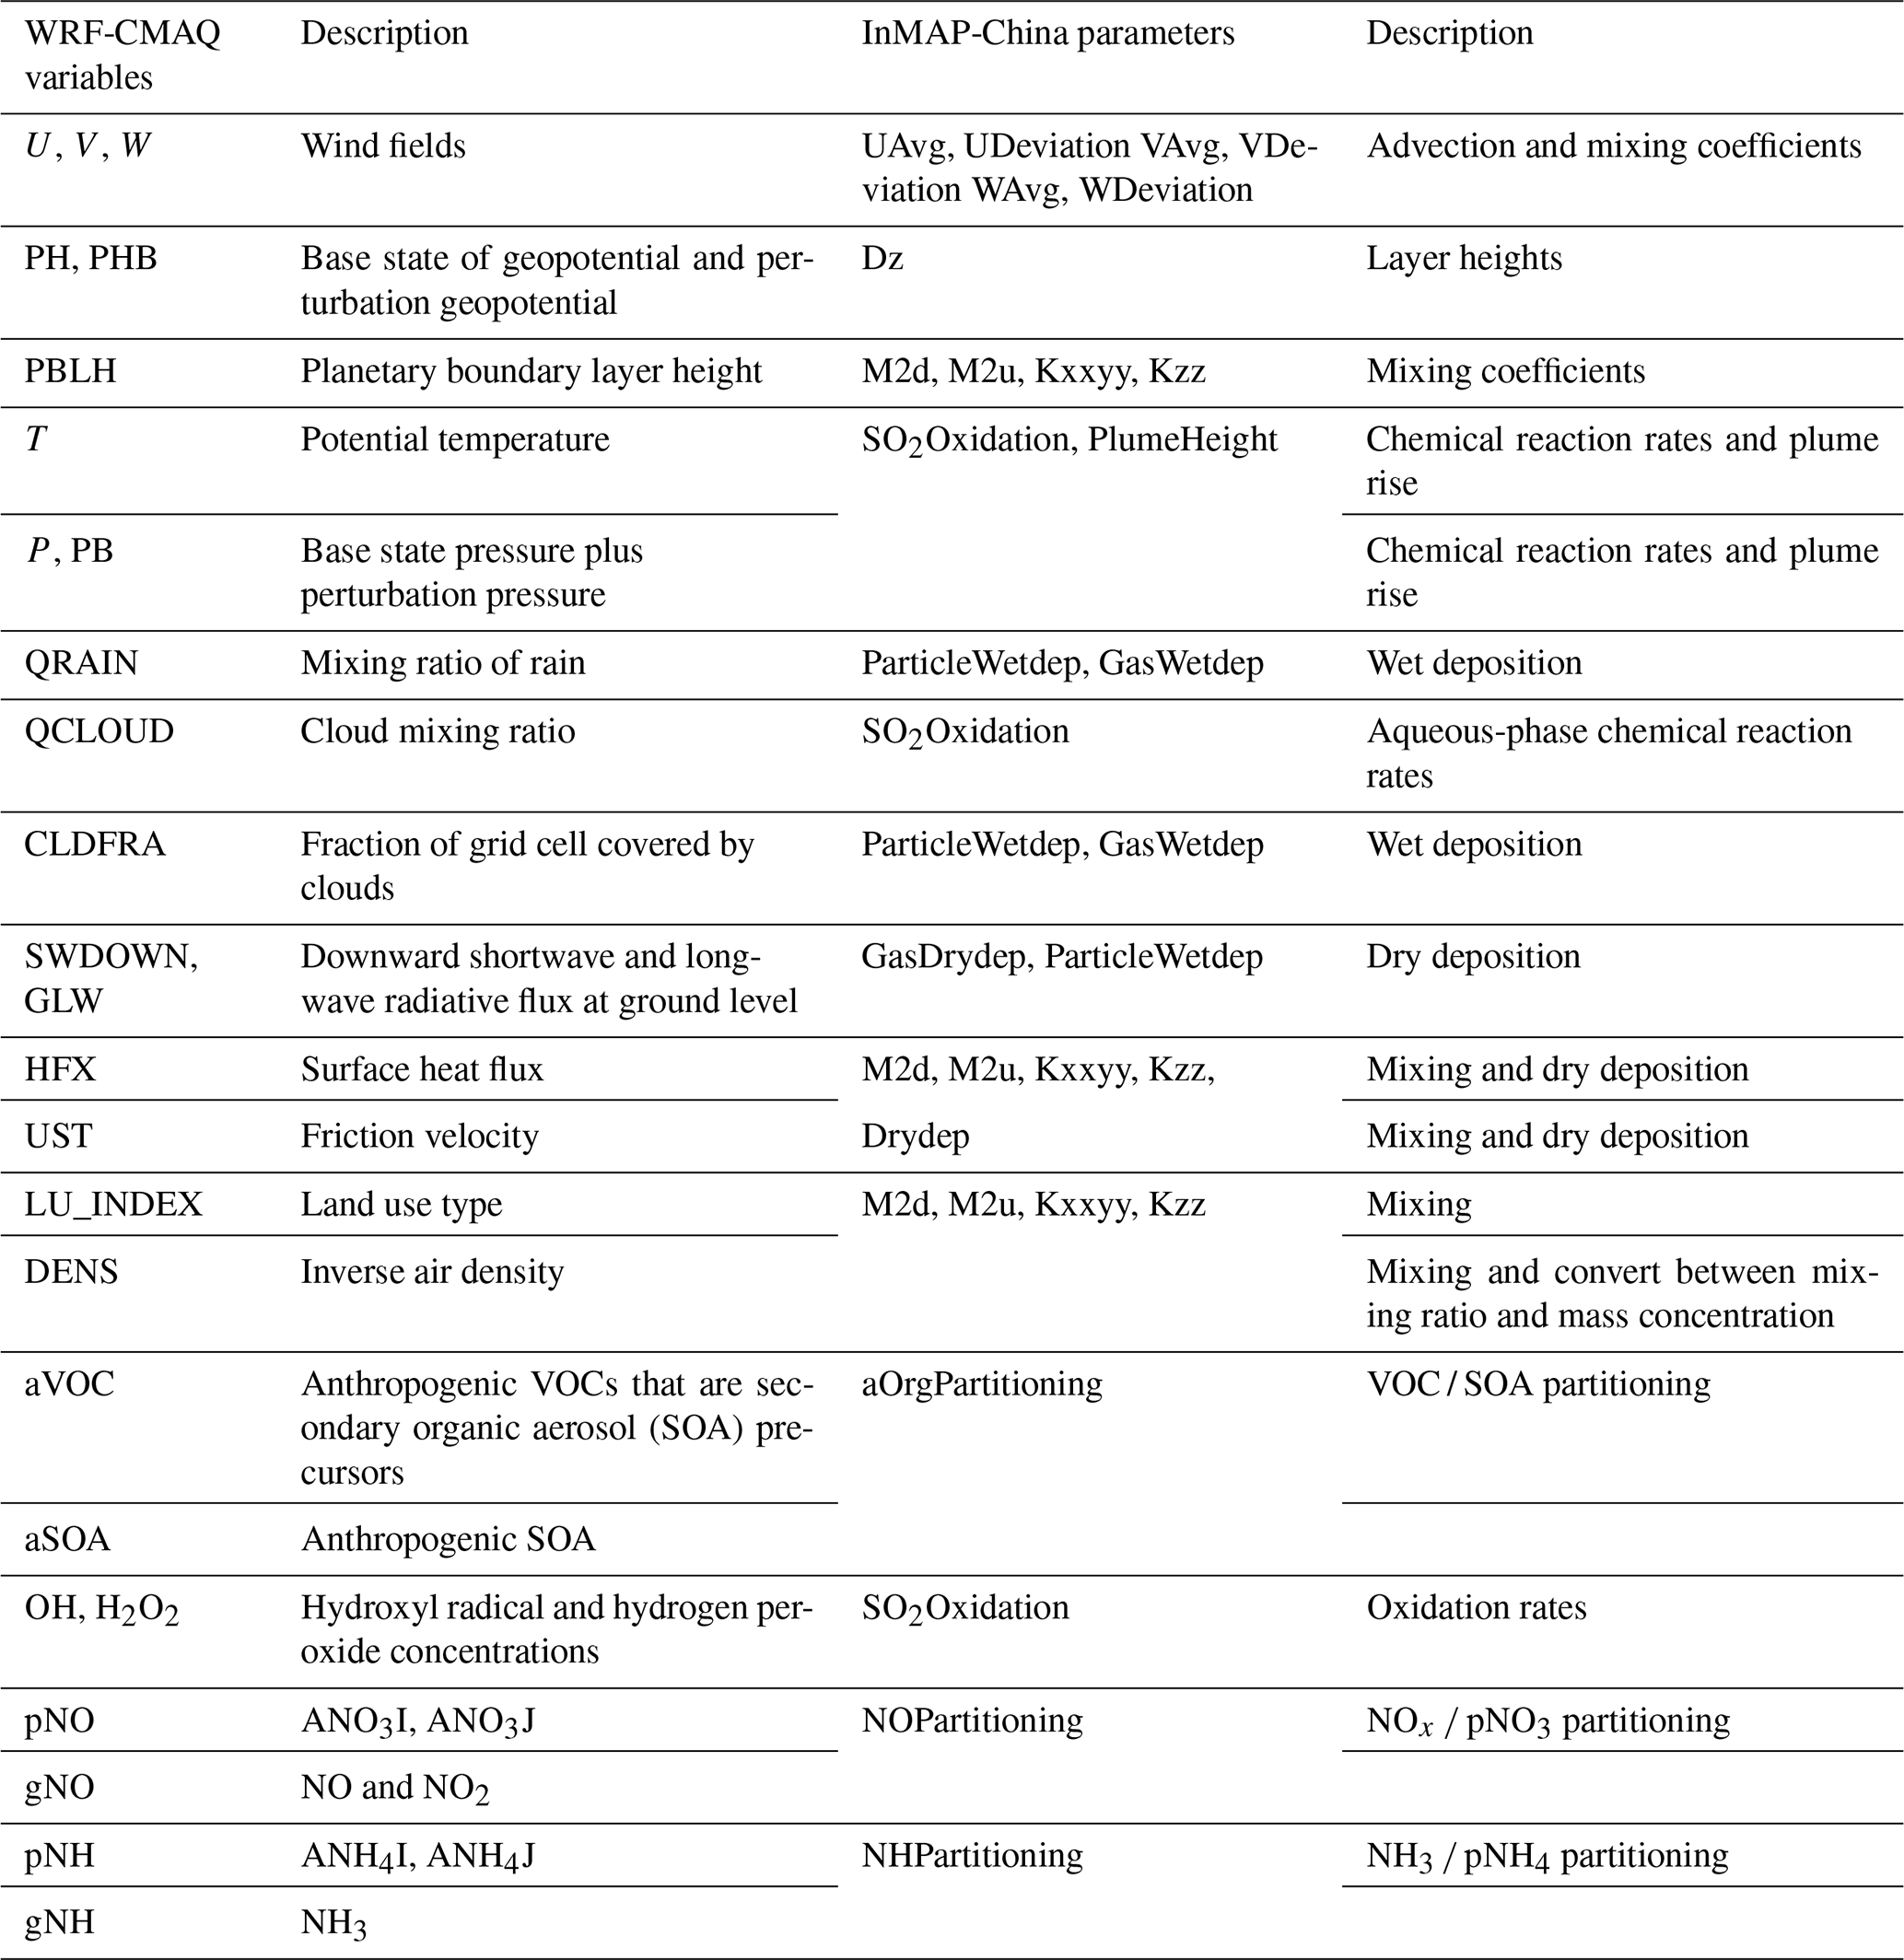
A NetCDF file containing the three-dimensional annually averaged parameters to characterize atmospheric advection, dispersion, mixing, chemical reaction and deposition is generated. Table 2 shows the relationship between the annually averaged parameters for simplified simulation and the original hourly variables. In InMAP-China, the annually averaged component and the deviation of wind speed to represent advection are calculated using hourly elements. The offset of wind vectors in different directions may result in some uncertainties in this process. The parameters of eddy diffusion and convective transport are pre-calculated using hourly elements, including temperature, pressure and boundary layer height, among others. The annual wet deposition rate is determined by the rainwater mixing ratio and cloud fractions. The annual dry deposition rate of particles and gaseous pollutants at the surface level is pre-calculated using friction speed, heat flux, radiation flux and land cover. The simplification of chemical reactions is different among pollutants. For NOx, NH3 and volatile organic compound (VOC) precursors, the annual average gas–particle partitioning is adopted and calculated before using the output concentrations of species from CMAQ. For SO2 pollutants, the annual oxidation rate of two major conversion pathways for SO2 is calculated using concentrations of the hydroxyl radical (HO) and hydrogen peroxide (H2O2) in CMAQ, and the conversion is estimated in InMAP-China.
2.1.2 Prior WRF-CMAQ simulation
To generate the meteorological and chemical parameters required by InMAP-China, a 1-year WRF-CMAQ simulation covering the entirety of mainland of China is conducted to output hourly meteorological and chemistry-related variables in 2017. Furthermore, a nested WRF-CMAQ simulation over the BTH region is also conducted and validated using observed data. The corresponded output data are used to generate the meteorological and chemical parameters required by InMAP-China for the 4 km resolution simulations in the BTH region. Tables S1 and S2 in the Supplement show the major configurations of the WRF-CMAQ modeling system. The WRF model (Skamarock et al., 2008) is driven by the National Centers for Environmental Prediction Final Analysis (NCEP-FNL) (https://doi.org/10.5065/D6M043C6; National Centers for Environmental Prediction, 2000) reanalysis data to provide the initial and boundary conditions. The meteorological fields derived from the WRF model are used to drive the CMAQ model (Appel et al., 2018) simulations. The air pollutant emissions used here include anthropogenic emissions over China derived from the Multi-resolution Emission Inventory for China (MEIC) model (http://meicmodel.org/, last access: 9 December 2021), anthropogenic emissions over the region of East Asia outside China derived from the MIX-2010 (a mosaic Asian anthropogenic emission inventory) inventory (Li et al., 2017) and biogenic emissions derived from the Model of Emissions of Gases and Aerosols from Nature (MEGAN) v2.10 model. The Carbon Bond 05 (CB05) mechanism and the aerosols 6 (AERO6) module are employed in the model simulation.
Table S3 summarizes the performance statistics of meteorological variables, including surface temperature, relative humidity and wind speed, in China in 2017, as simulated by the WRF model. The hourly observed data of major meteorological variables derived from the National Climatic Data Center (NCDC) are utilized here. The results show that the meteorological variables simulated by the WRF model agree well with the surface observations, which is consistent with previous studies (Wu et al., 2019; Zheng et al., 2015; Hong et al., 2017). The model performs well with respect to the prediction of surface temperature, with a mean bias (MB) of −0.7 K, a normalized mean bias (NMB) of −6.1 % and an R value of 0.9. The predictions of relative humidity at a height of 2 m are relatively satisfactory with an MB of 4.1 % and an NMB of 6.1 %. The predictions of wind speed at a height of 10 m are slightly overestimated, with an MB of 0.3 m s−1 and an NMB of 12.4 %, which may be caused by out-of-date United States Geological Survey (USGS) land use data employed in the model runs.
The SO2, NO2 and PM2.5 concentrations modeled across the domain agree well with the surface observations in terms of the statistical performance and monthly variations. Table S4 summarizes the performance of the statistics of major air pollutant concentrations. The nationwide annual average PM2.5 concentration simulated in China in 2017 was 42.1 µg m−3. Compared with the observed PM2.5 of 45.9 µg m−3, there are slight underpredictions, with an MB of 3.7 µg m−3 and an NMB of 8.1 %. The CMAQ model shows moderate underpredictions of the NO2 and SO2 concentrations, which may be related to the uncertainties in the emission inputs. For modeled NO2 concentrations, the MB and NMB are −4.6 µg m−3 and −13.9 %, respectively. For modeled SO2 concentrations, MB and NMB are −0.8 µg m−3 and −4.5 %, respectively. Figure S3 shows the monthly variation. The variation trend in the observed SO2, NO2 and PM2.5 concentrations can be reproduced in the CMAQ simulations.
2.1.3 Preprocessed emission input data
We develop the preprocessed module to generate vector emission input for the InMAP-China simulation. This module can allocate air pollutant emissions to vertically and horizontally supply the missing parameters for the emission file and convert them into a shapefile vector format. The shapefile vector format's 36 km resolution emission data for the entirety of mainland of China and 4 km resolution data for the BTH region in 2017 are preprocessed using this module.
In this module, the emission data are preprocessed by source and altitude. The anthropogenic emissions of five sectors in China in 2017 from the MEIC inventory (http://meicmodel.org/, last access: 9 December 2021; Liu et al., 2015), the anthropogenic emissions over Asian regions outside of mainland China from the MIX-2010 inventory (Li et al., 2017) and the natural emissions estimated using the MEGANv2.10 model (Guenther et al., 2012) are employed in this study.
In more detail, the 0.3∘ gridded anthropogenic emissions for the residential, transportation and agricultural sectors are preprocessed and input to the surface layer. The gridded air pollutant emissions for the industrial sector and non-coal power plants are preprocessed for allocation to attitudes ranging from 130 to 240 m and from 130 to 890 m, respectively. The emissions from coal-fired power plants (CPPs) are preprocessed as point sources. The air pollutant emissions and the stack attribution of each unit are provided in the emission file. Because the stack attribution of the power unit is not provided in the MEIC inventory, we supplied the information in the preprocessed module based on NEI (National Emissions Inventory) data of power units (United States Environmental Protection Agency, 2011). For the stack height/stack diameter, a linear relationship is first established (see Fig. S1); supplementation of these two parameters for Chinese power plants is then conducted using the relationships. A fixed value for the other two stack attribution variables is set here because the PM2.5 concentrations attributable to power plants (CPP-PM2.5) are less sensitive to these two variables (see Fig. S2). The stack gas exit velocity and stack gas exit temperature of the power unit are 6 m s−1 and 313 K, respectively. The air pollutant emissions over Asian regions outside of mainland China and the natural emissions simulated by MEGANv2.10 are preprocessed and input to the surface layer.
2.1.4 Exposure–response function from GEMM
To rapidly estimate the premature mortality attributable to PM2.5 exposure, we employ the exposure–response function from GEMM, developed by Burnett et al. (2018), to estimate PM2.5-related premature mortality. The PM2.5 concentration predicted by InMAP-China is also utilized in the estimation of premature mortality. Premature mortality due to noncommunicable diseases (NCDs) and lower respiratory infections (LRIs) was considered in this study. Mortality is determined by the mortality incidence rate, the population and the attributable fraction (AF) to certain PM2.5 concentrations. The national mortality incidence rate and the population data were derived from the GBD 2017 study (Institute for Health Metrics and Evaluation; Global Burden of Disease Collaborative Network, 2018a, b). The spatial distribution of the population in 2015 from the Gridded Population of World (GPW) version 4 (Doxsey et al., 2015) was employed to allocate the population in 2017.
2.2 Evaluation protocol
2.2.1 Evaluation method
In this study, the performance of the InMAP-China predictions are evaluated by comparison against CMAQ simulations and surface observations. Model–model and model–observation comparison have both been used to evaluate the performance of reduced-complexity air quality models in previous studies (Tessum et al., 2017; Gilmore et al., 2019).
The following aspects are considered when carrying out an evaluation. First, we examine the ability of InMAP-China to predict PM2.5 concentrations at different emission levels, which will be introduced in Sect. 3.1. We define four key regions here (see Fig. 2) and examine the performance for each region. Second, to examine the ability of the model to quantify source contributions to PM2.5 concentrations, we compare the InMAP-China predictions of the sectoral contributions attributable to power, industry, residential, transportation and agriculture with those based on the CMAQ model, which will be presented in Sect. 3.2. Third, to comprehensively understand the model's performance at a higher spatial resolution, we compare the predictions of PM2.5 concentrations at a 4 km spatial resolution in the BTH region modeled by both InMAP-China and the conventional CMAQ model with the observations (see Sect. 3.3). Fourth, focusing on the health impacts, the PM2.5-related premature mortality predicted by InMAP-China is also compared with a mortality estimation based on PM2.5 exposure derived from CMAQ, which is presented in Sect. 3.4.
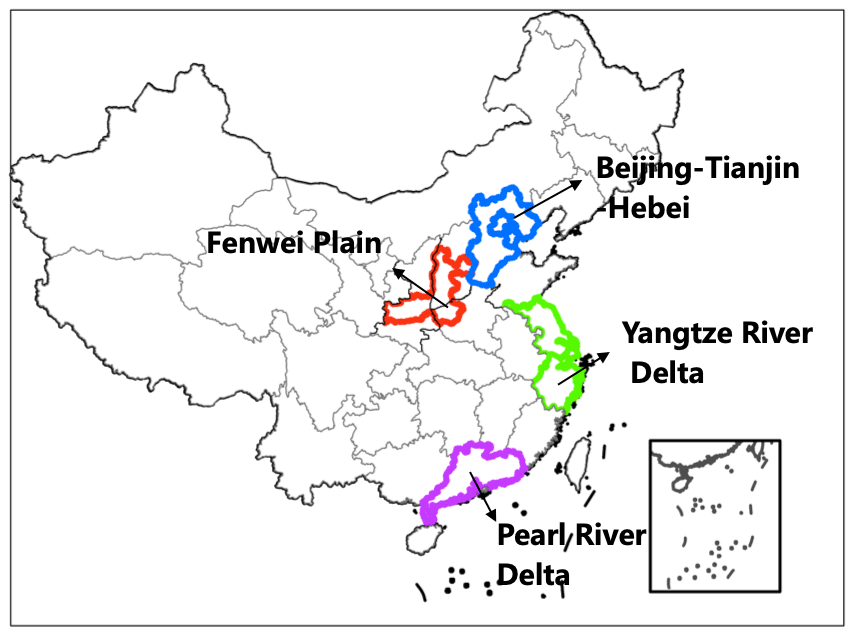
Figure 2Four key regions are defined in this study: the Beijing–Tianjin–Hebei region, the Yangtze River Delta region, the Pearl River Delta region, and the Fenwei Plain region.
For the observed PM2.5 concentration data, the annual average observed PM2.5 concentrations in 2017 were calculated using hourly concentration data from the China National Environmental Monitoring Centre (CNEMC; http://www.cnemc.cn/, last access: 9 December 2021). More than 1400 national monitoring sites for air pollutant concentrations are included in the simulation domain. The statistical parameters used in this study include the correlation coefficient (R), mean bias (MB), mean error (ME), normalized mean bias (NMB), normalized mean error (NME) and root-mean-square error (RMSE). The statistical analyses on the performance of InMAP-China are similar to our previous evaluation of conventional CTMs (Zheng et al., 2015; Wu et al., 2019).
2.2.2 Experimental design
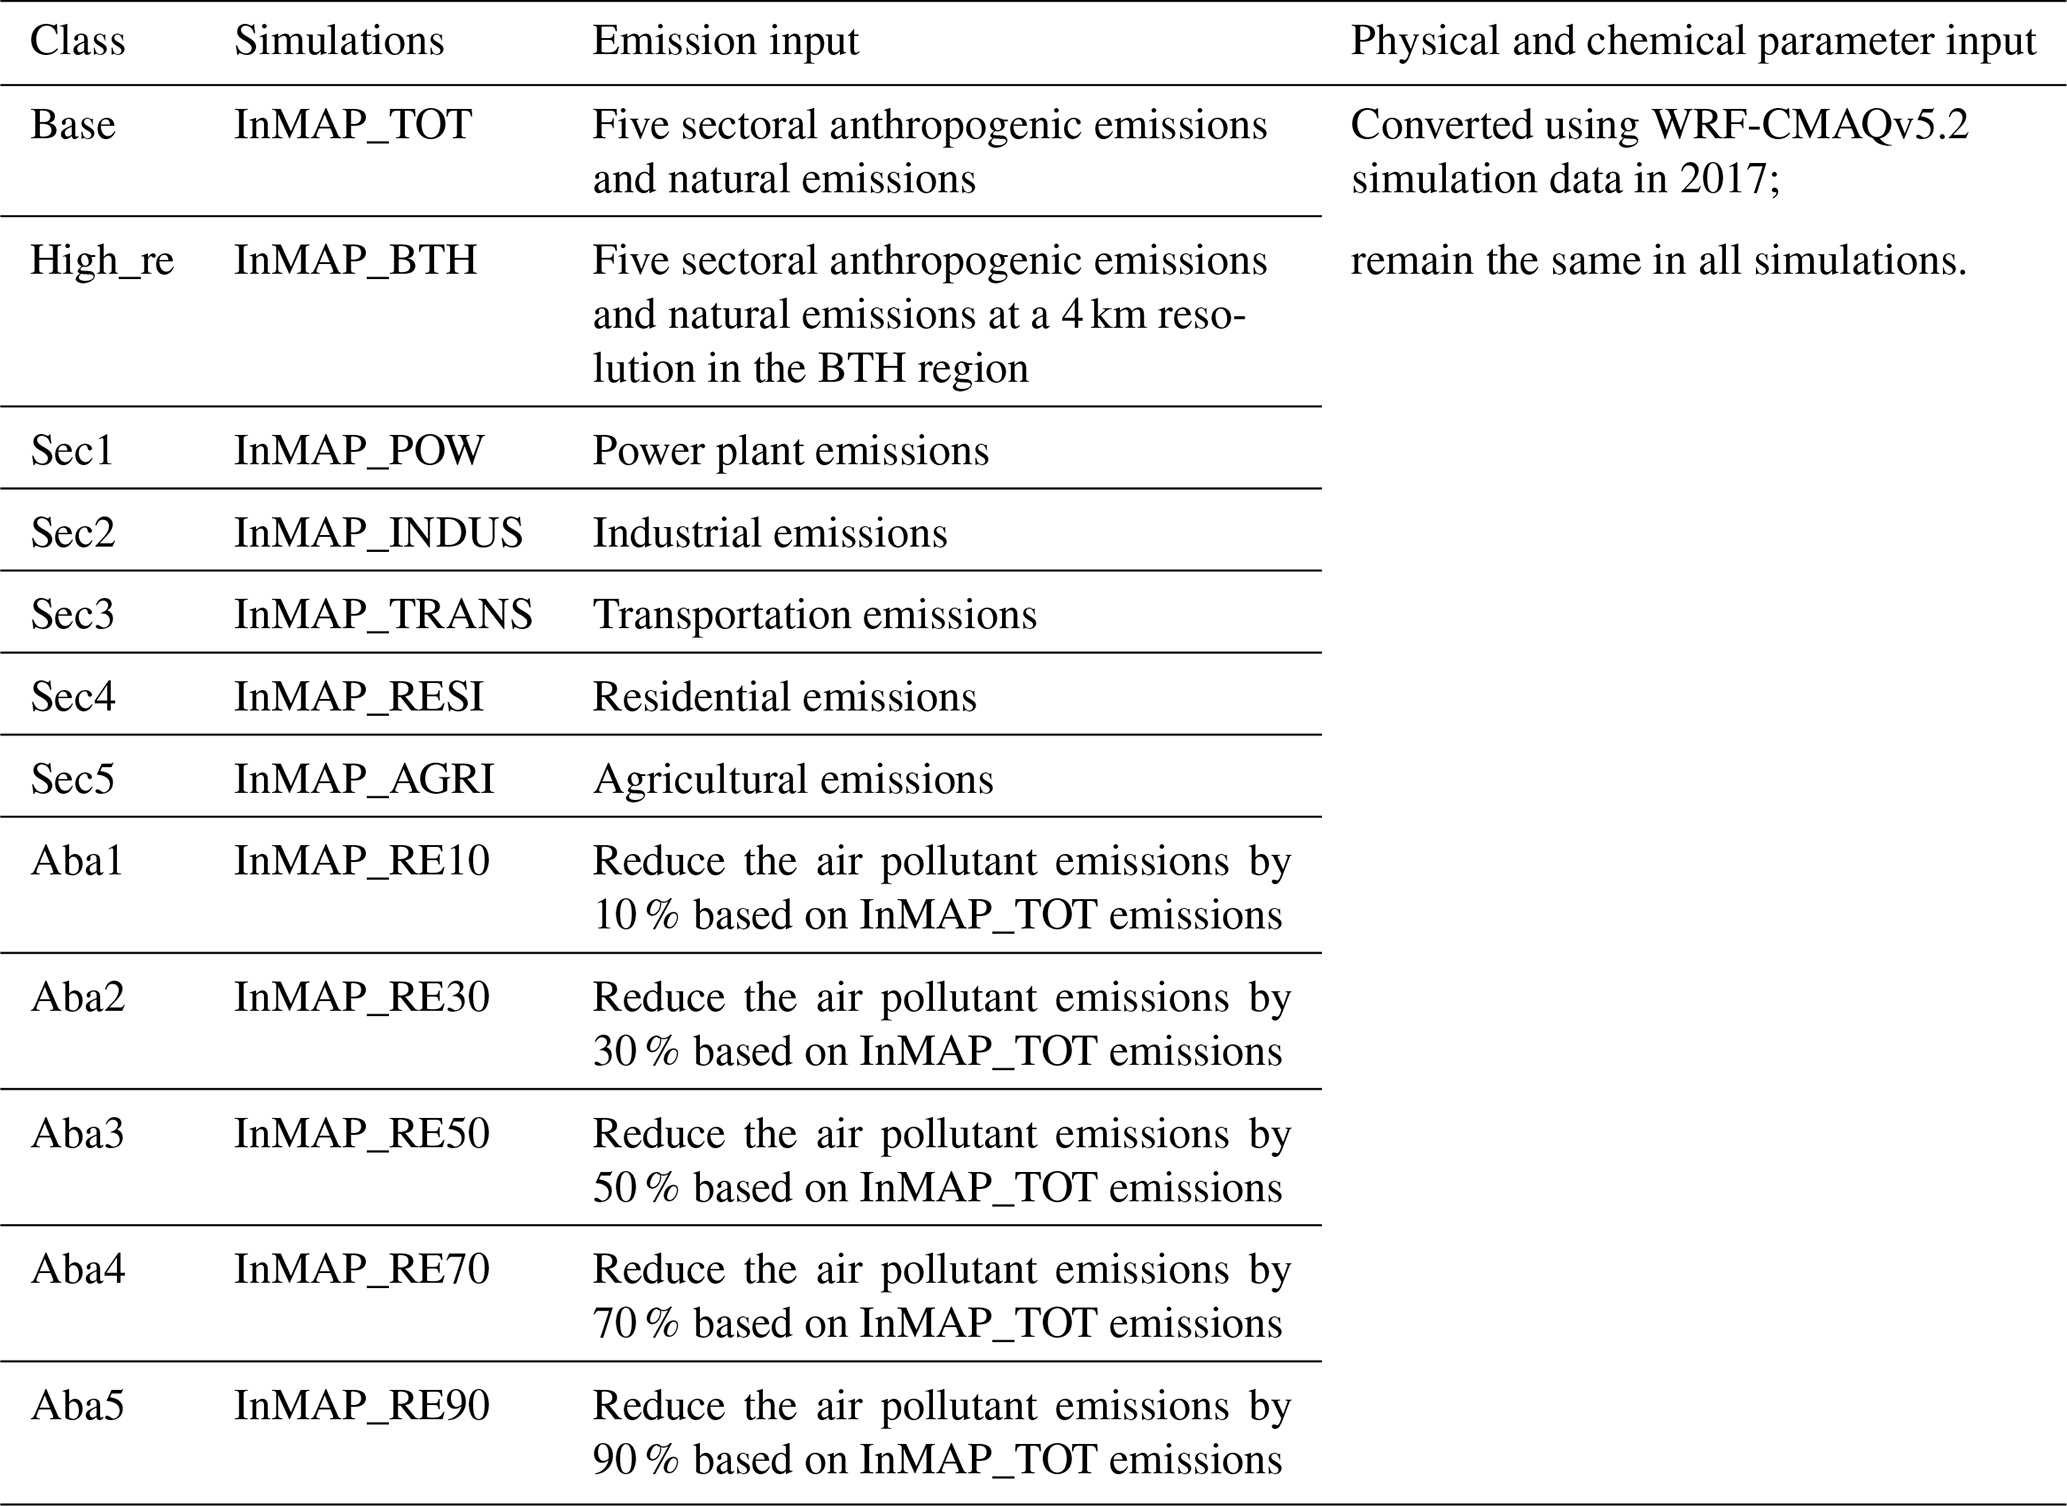
We designed 12 simulations to examine the model ability of InMAP-China in this study. Table 3 shows the sequence of simulations.
“InMAP_TOT” represents the baseline simulation with the maximum input of combined emissions. Five sectoral anthropogenic emissions derived from the MEIC inventory, natural emissions derived from the MEGANv2.10 model and Asian emissions outside of mainland China derived from the MIX-2010 inventory are utilized in the simulation. Five sectoral and five abatement simulations are also conducted to examine the ability of InMAP-China to predict concentration changes in response to sectoral emissions and abatement emissions. The emission inputs for these 10 simulations are given in Table 3. The annual average physical and chemical process parameters are calculated based on the output variables of the WRF-CMAQ model, which has already been mentioned in Sect. 2.1.2. Based on the above input, the particle continuity equations are solved by the InMAP-China model to obtain the annual average PM2.5 concentrations at atmospheric steady state. The above simulations are all conducted at a 36km spatial resolution across the entirety of mainland of China. Furthermore, another simulation represented by “InMAP-BTH” is conducted at a 4 km spatial resolution over the BTH region using the anthropogenic emission input data at a 4 km resolution derived from the MEIC inventory and the natural emission data derived from the MEGANv2.10 model.
To carry out a comparison with the InMAP-China simulations, 11 CMAQ simulations are also performed using the same emission inputs. The hourly PM2.5 concentrations simulated by CMAQ in 2017 are averaged over the entire year. Due to limited computational resources, each simulation is conducted for four representative months (January, April, July and October) in 2017.
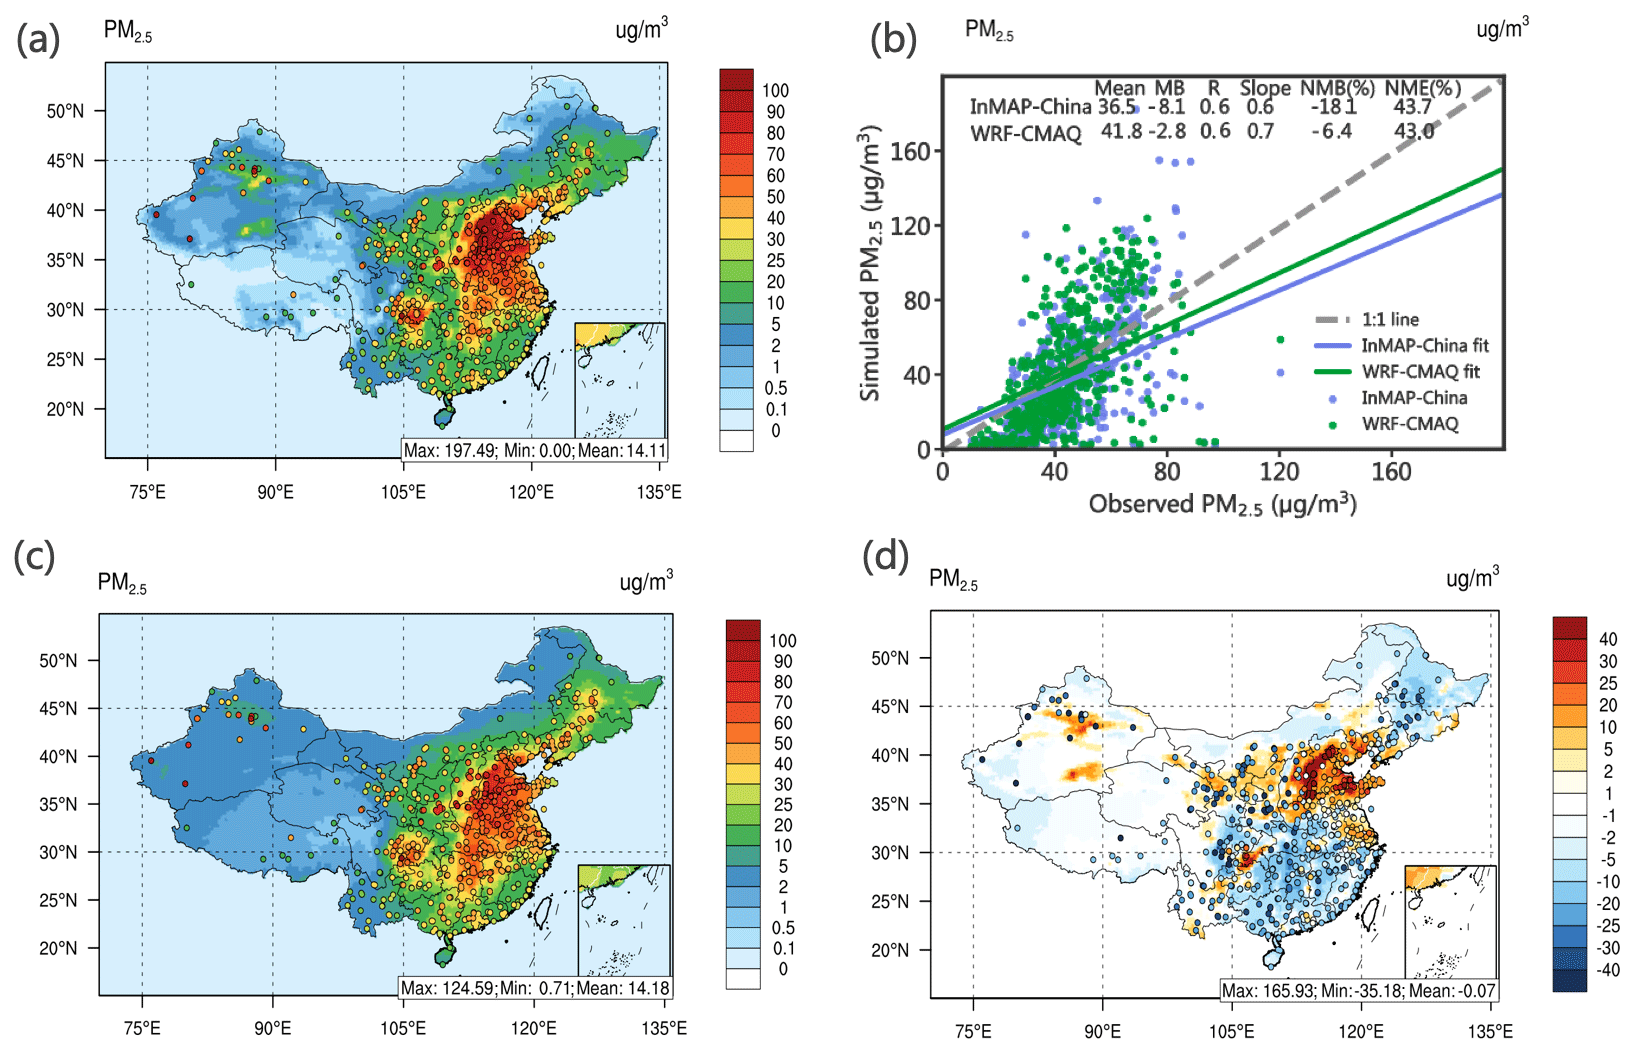
Figure 3The spatial pattern and statistical metrics of total PM2.5 concentrations predicted by InMAP-China and WRF-CMAQ. Panels (a) and (c) display the spatial patterns of total PM2.5 concentrations predicted by InMAP-China and WRF-CMAQ, respectively. Panel (d) presents the difference in the spatial distribution of the total PM2.5 concentrations predicted by the two models. Panel (b) shows the statistical metrics between the simulated and observed PM2.5. The observed total PM2.5 concentrations are marked as circles in panels (a) and (c). In panel (d), the circle shows the difference between the PM2.5 simulated by InMAP-China and the observed PM2.5. The same color bar is utilized for the contours and the marked circles.
3.1 Model performance for PM2.5 concentrations in China
3.1.1 Total PM2.5 concentrations
Figure 3 shows the performance evaluation of total PM2.5 concentrations in the InMAP_TOT simulations. Compared with the observed annual average PM2.5 concentrations, the total PM2.5 concentrations are moderately underpredicted by InMAP-China, with an MB of −8.1 µg m−3 and an NMB of −18.1 %. Compared with the CMAQ predictions, the total PM2.5 concentrations are also underpredicted, with an MB of −5.3 µg m−3, due to the underprediction of primary PM2.5. Consistent air pollutant emissions are employed in the CMAQ and InMAP-China simulations. Therefore, the underpredictions are caused by the different mechanisms in the two models. InMAP-China reproduces the spatial pattern of total PM2.5 concentrations simulated by CMAQ. Notably, significant overpredictions of PM2.5 concentrations can be observed over mountainous areas across northern China, and the complex terrain and high emission intensity increase the challenge of predicting PM2.5 concentrations using the reduced-complexity air quality model in this region.
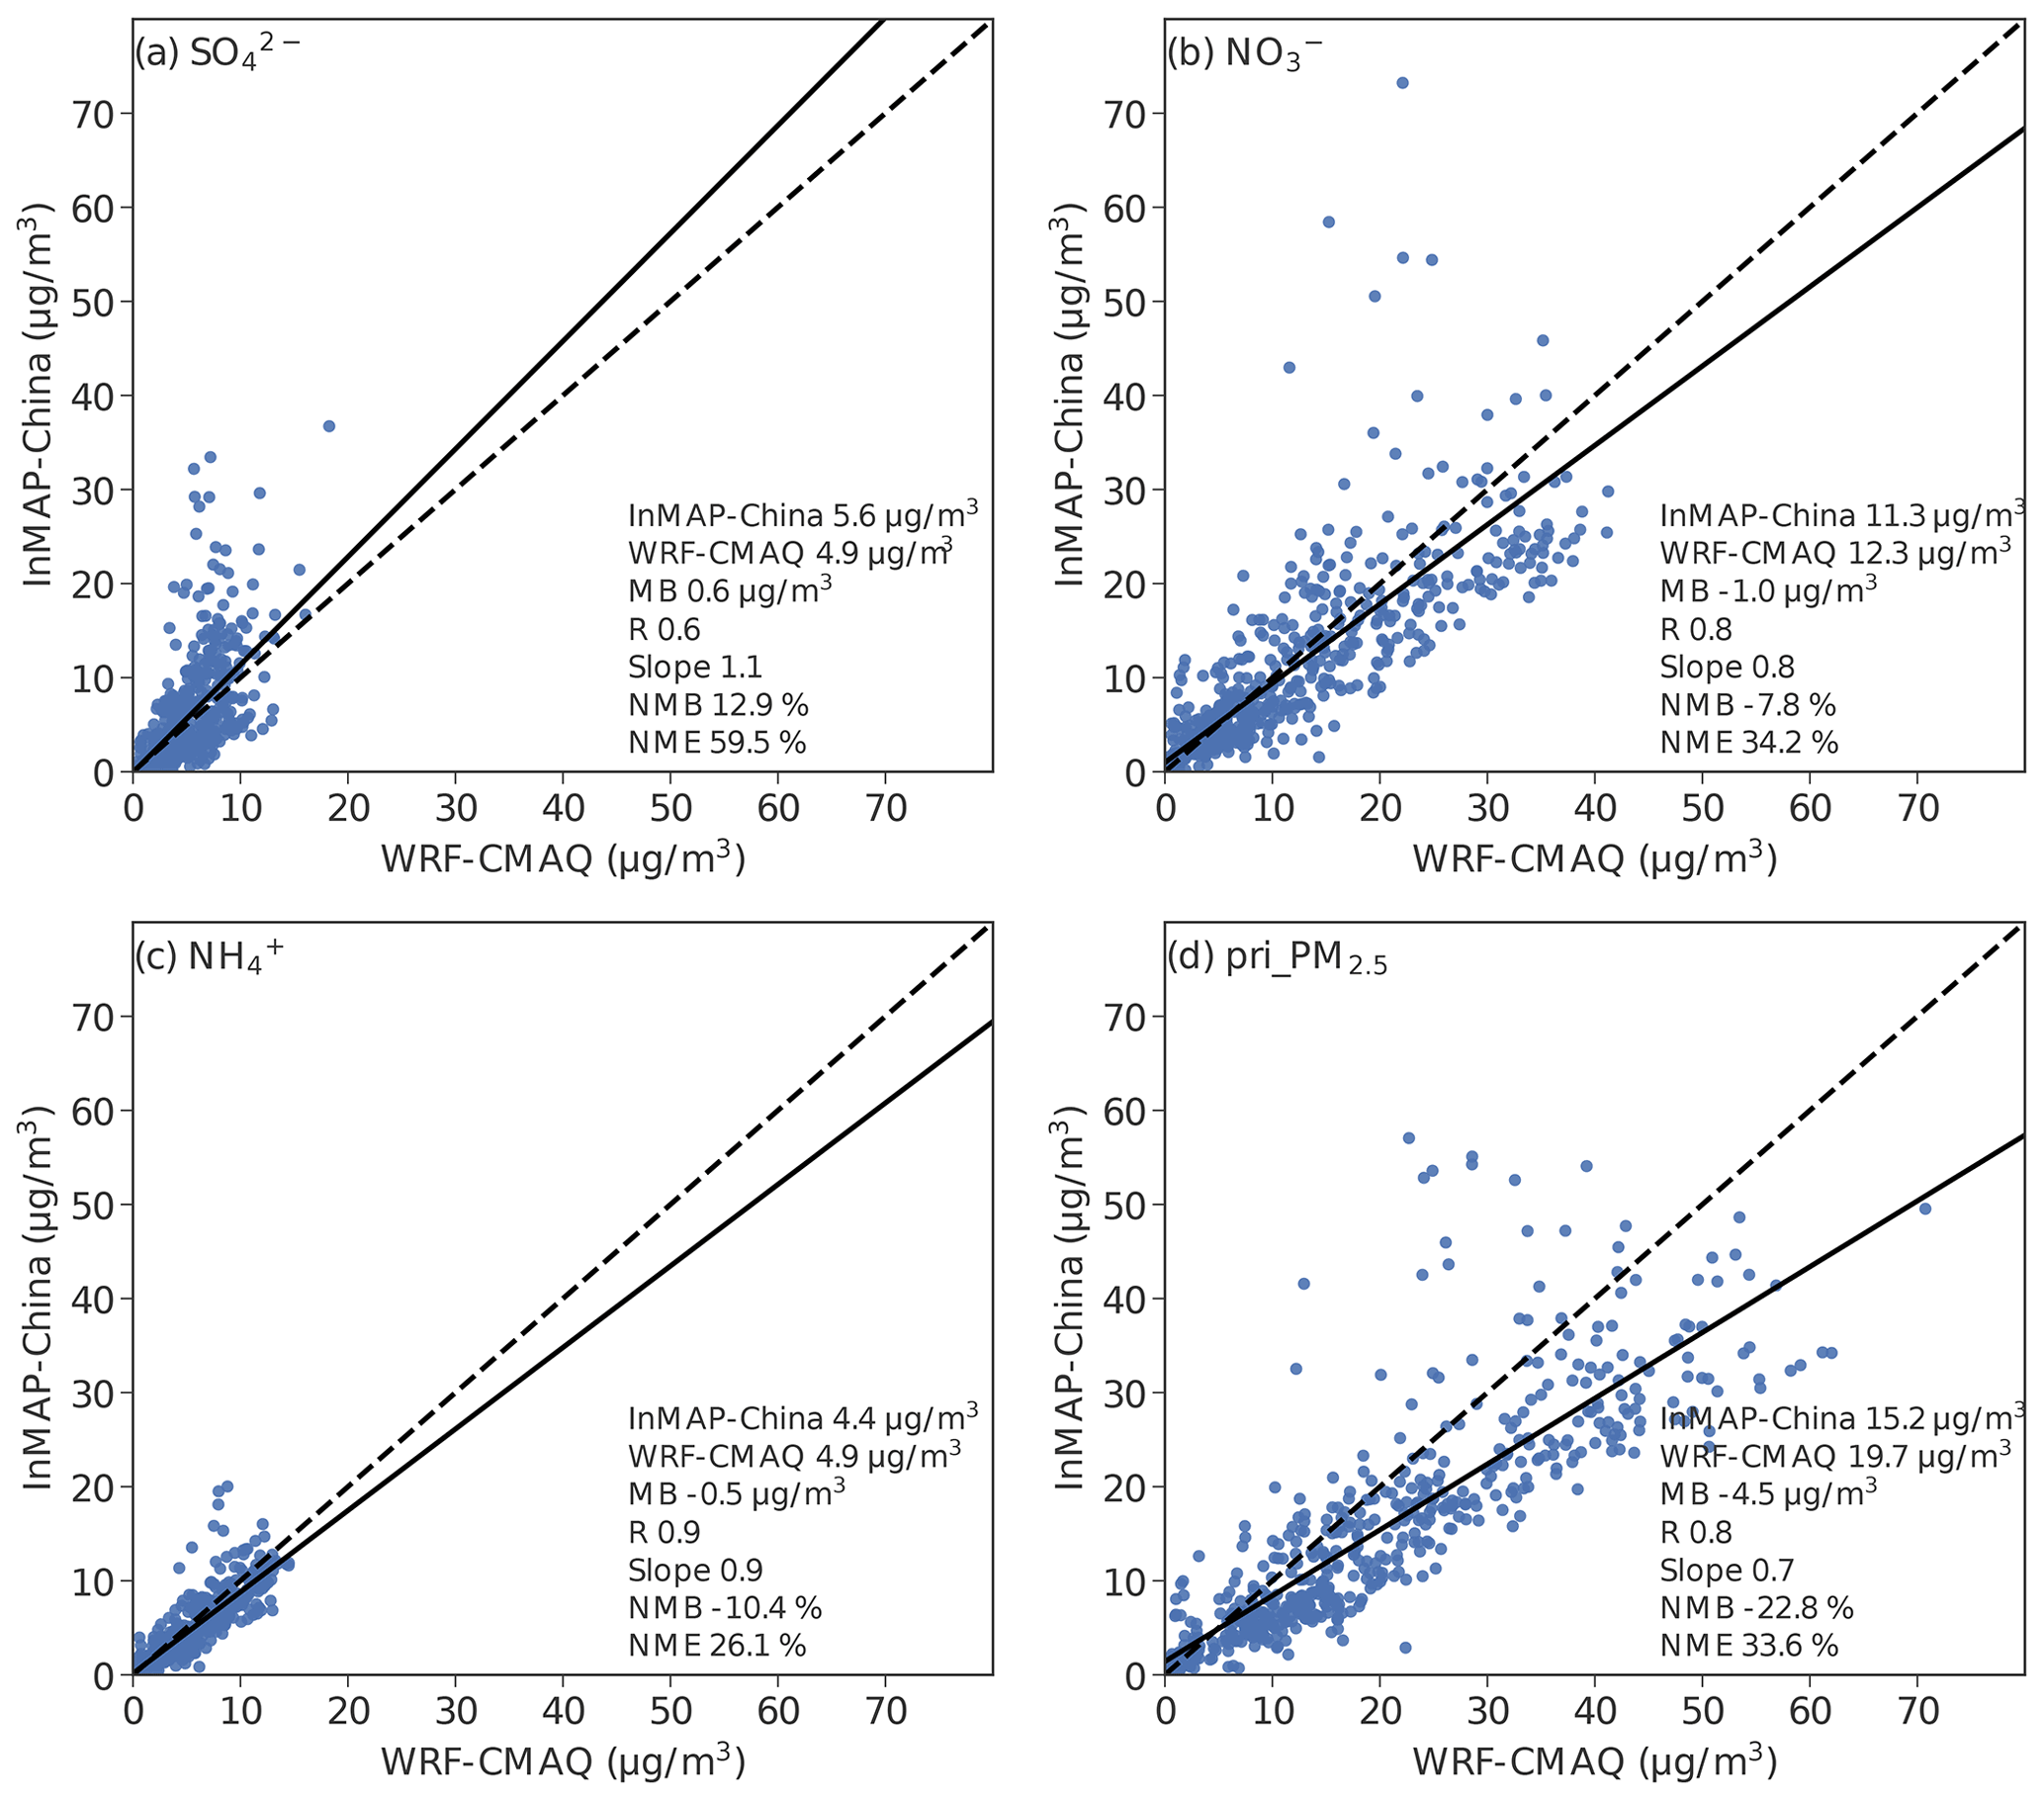
Figure 4Scatterplot comparing the PM2.5 composition concentration modeled by the InMAP-China and WRF-CMAQ models. Panels (a), (b), (c) and (d) display sulfate, nitrate, ammonium and primary PM2.5, respectively. The statistical metrics are given in the lower right-hand corner of each panel.
Figure 4 shows a comparison of PM2.5 compositions. Compared with the CMAQ results, the InMAP-China predictions of PM2.5 compositions are satisfactory, with NMBs for SO, NO, NH and primary PM2.5 of 13 %, −8 %, −10 % and −23 %, respectively. The predictions of SO, NO and NH perform better than those of primary PM2.5. Figures 5 and 6 compare the spatial distribution of PM2.5 compositions, and similar overpredictions of PM2.5 compositions can be observed in the mountainous area in northern China.

Figure 5The spatial pattern of PM2.5 compositions modeled by the InMAP-China and WRF-CMAQ models. Panels (a), (c), (e) and (g) present the respective sulfate, nitrate, ammonium and primary PM2.5 simulated by InMAP-China in the InMAP-TOT scenario. Panels (b), (d), (f) and (h) present the corresponding results modeled by WRF-CMAQ.
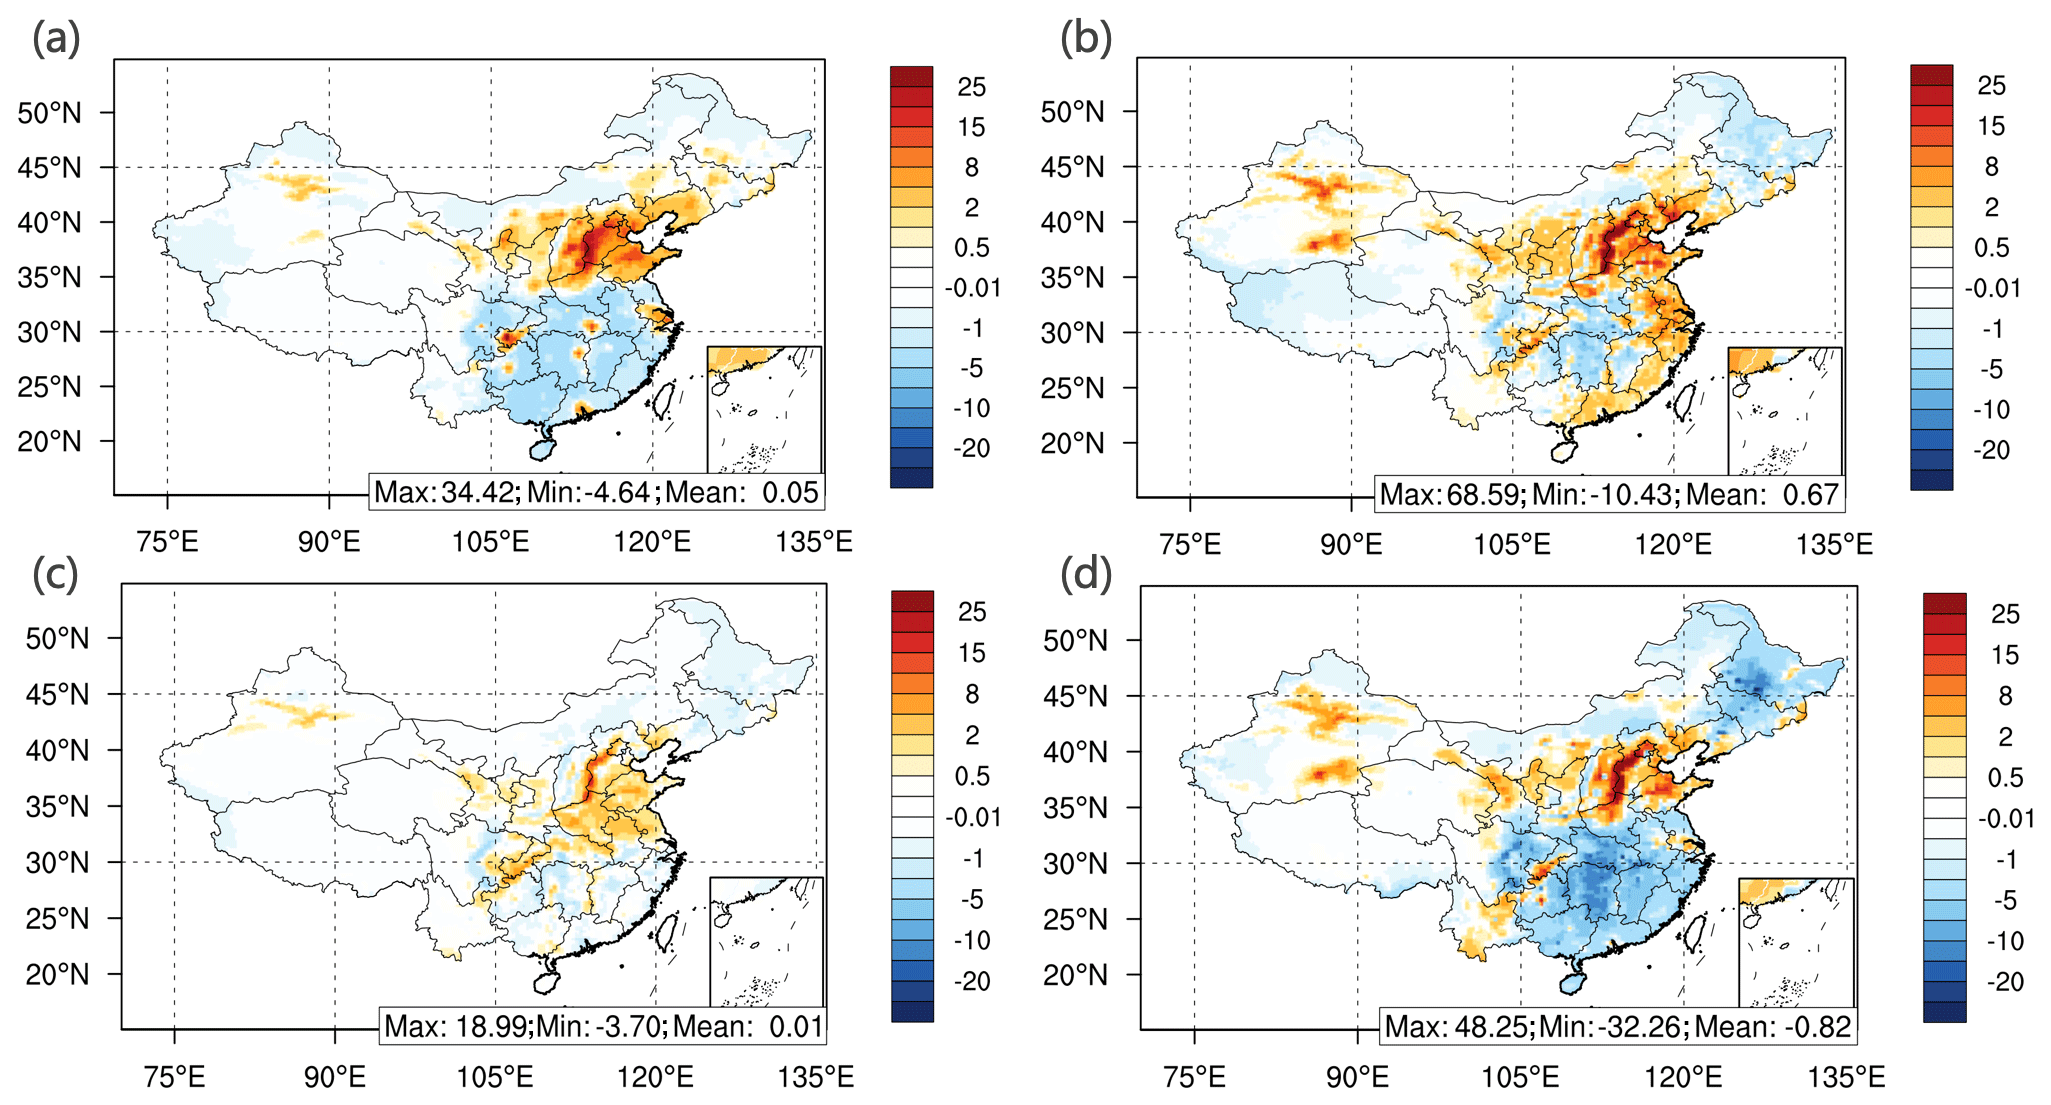
Figure 6The difference in the spatial pattern of PM2.5 compositions between InMAP-China and WRF-CMAQ. Panels (a), (b), (c) and (d) display sulfate, nitrate, ammonium and primary PM2.5, respectively.
The ability of InMAP-China to predict PM2.5 compositions is also examined at various emission levels. Figure 7 compares the concentrations of PM2.5 compositions and the proportions of secondary inorganic aerosols (hereafter, SNA) in total PM2.5 concentrations in different scenarios run by the two models. In the InMAP_TOT scenario, the proportion of SNA is 56 %, which is extremely close to the 50 % proportion in the WRF-CMAQ simulations. In five emission abatement simulations, the proportion was approximately equal to that in the baseline scenario because the linearly treated chemical reaction relationship of SNA was employed in InMAP-China. However, focusing on the five sectoral emission scenario simulations, a significant difference can be observed, which is mainly caused by the difference in the treatment of chemicals in InMAP-China and CMAQ. In this situation, the impacts on PM2.5 concentrations are distinct due to the nonlinear emission-concentration process.
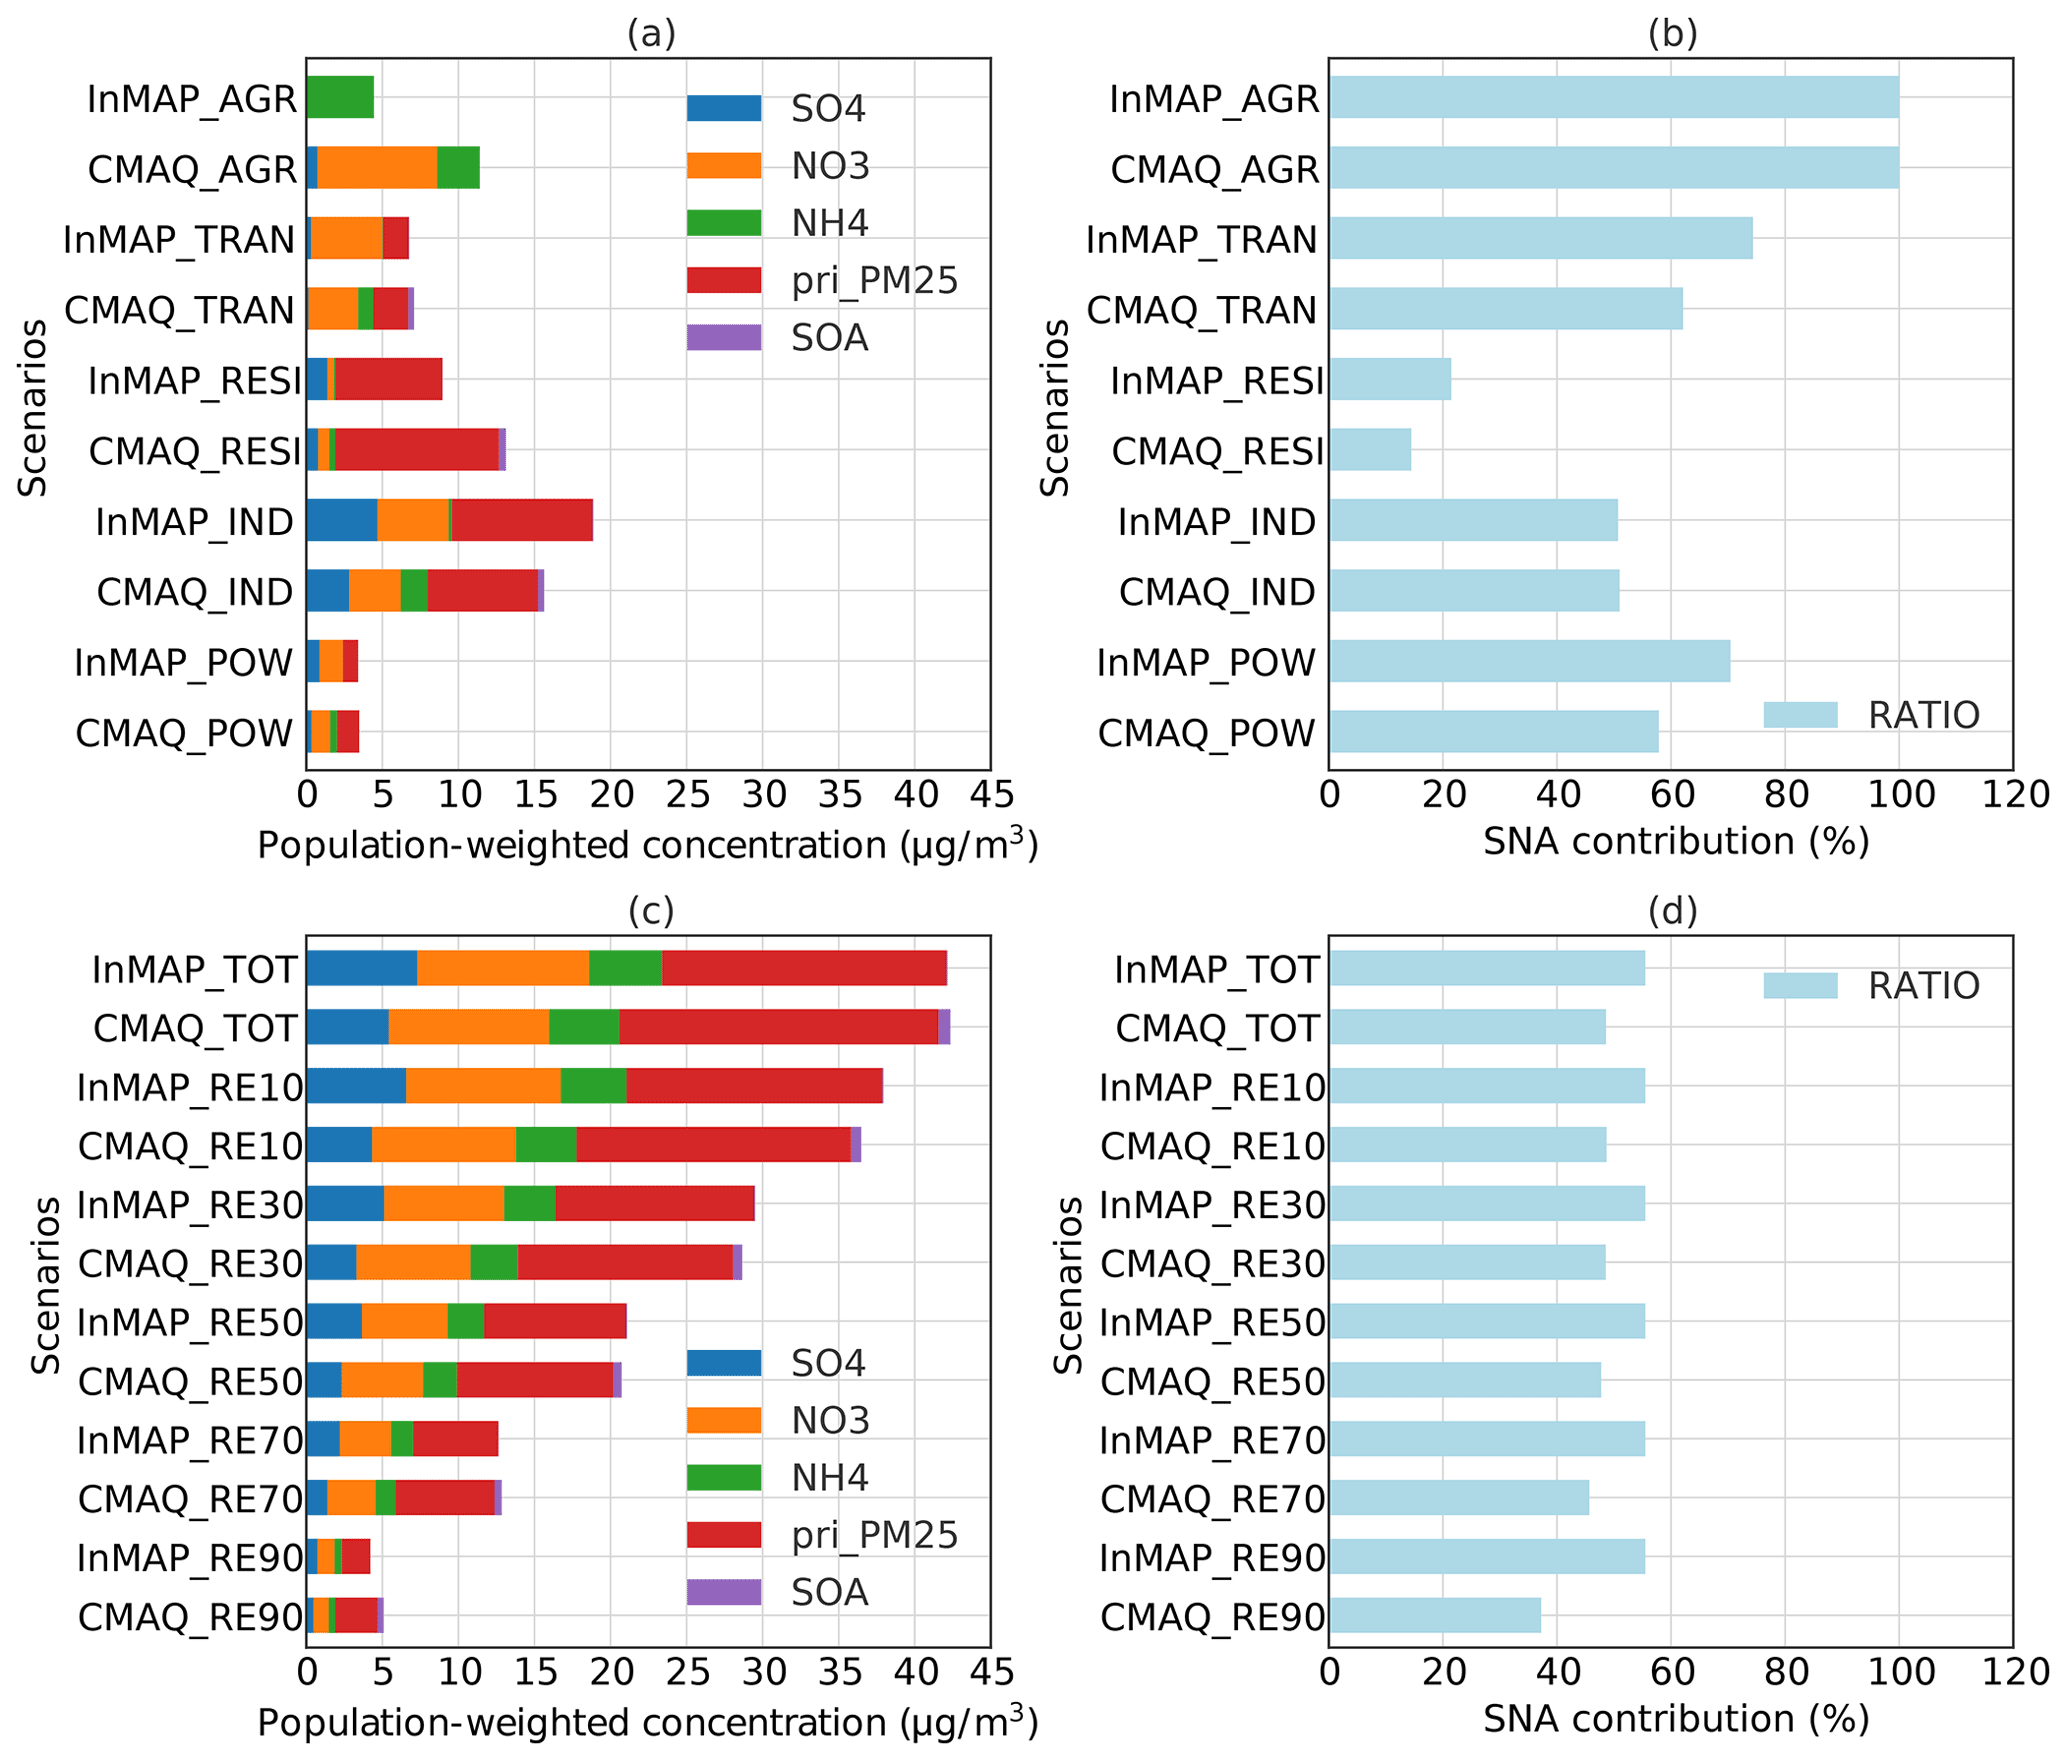
Figure 7Comparison of PM2.5 component concentrations and SNA contributions in the 11 simulations. Panels (a) and (c) show the modeled PM2.5 compositions: panel (a) presents the results of sectoral emission scenarios, and panel (c) presents the results of the baseline and emission abatement scenarios. Panels (b) and (d) present the SNA contribution (%) for each scenario.
3.1.2 Marginal change in PM2.5 concentrations
Figure 8 compares the InMAP-China and CMAQ predictions of population-weighted PM2.5 concentrations and PM2.5 compositions for 11 emission scenarios. Marginal changes in air pollutant concentrations are defined as 1 µg m−3 by normalizing the population-weighted air pollutant concentrations of each scenario using the largest value among all scenarios modeled by CMAQ. InMAP-China reproduces CMAQ predictions with respect to the marginal change in population-weighted PM2.5 concentrations, with an NMB of −12 % and correlations of 0.98, as shown in Fig. 8a. This performance is similar to that predicted by InMAP in the USA (Tessum et al., 2017).
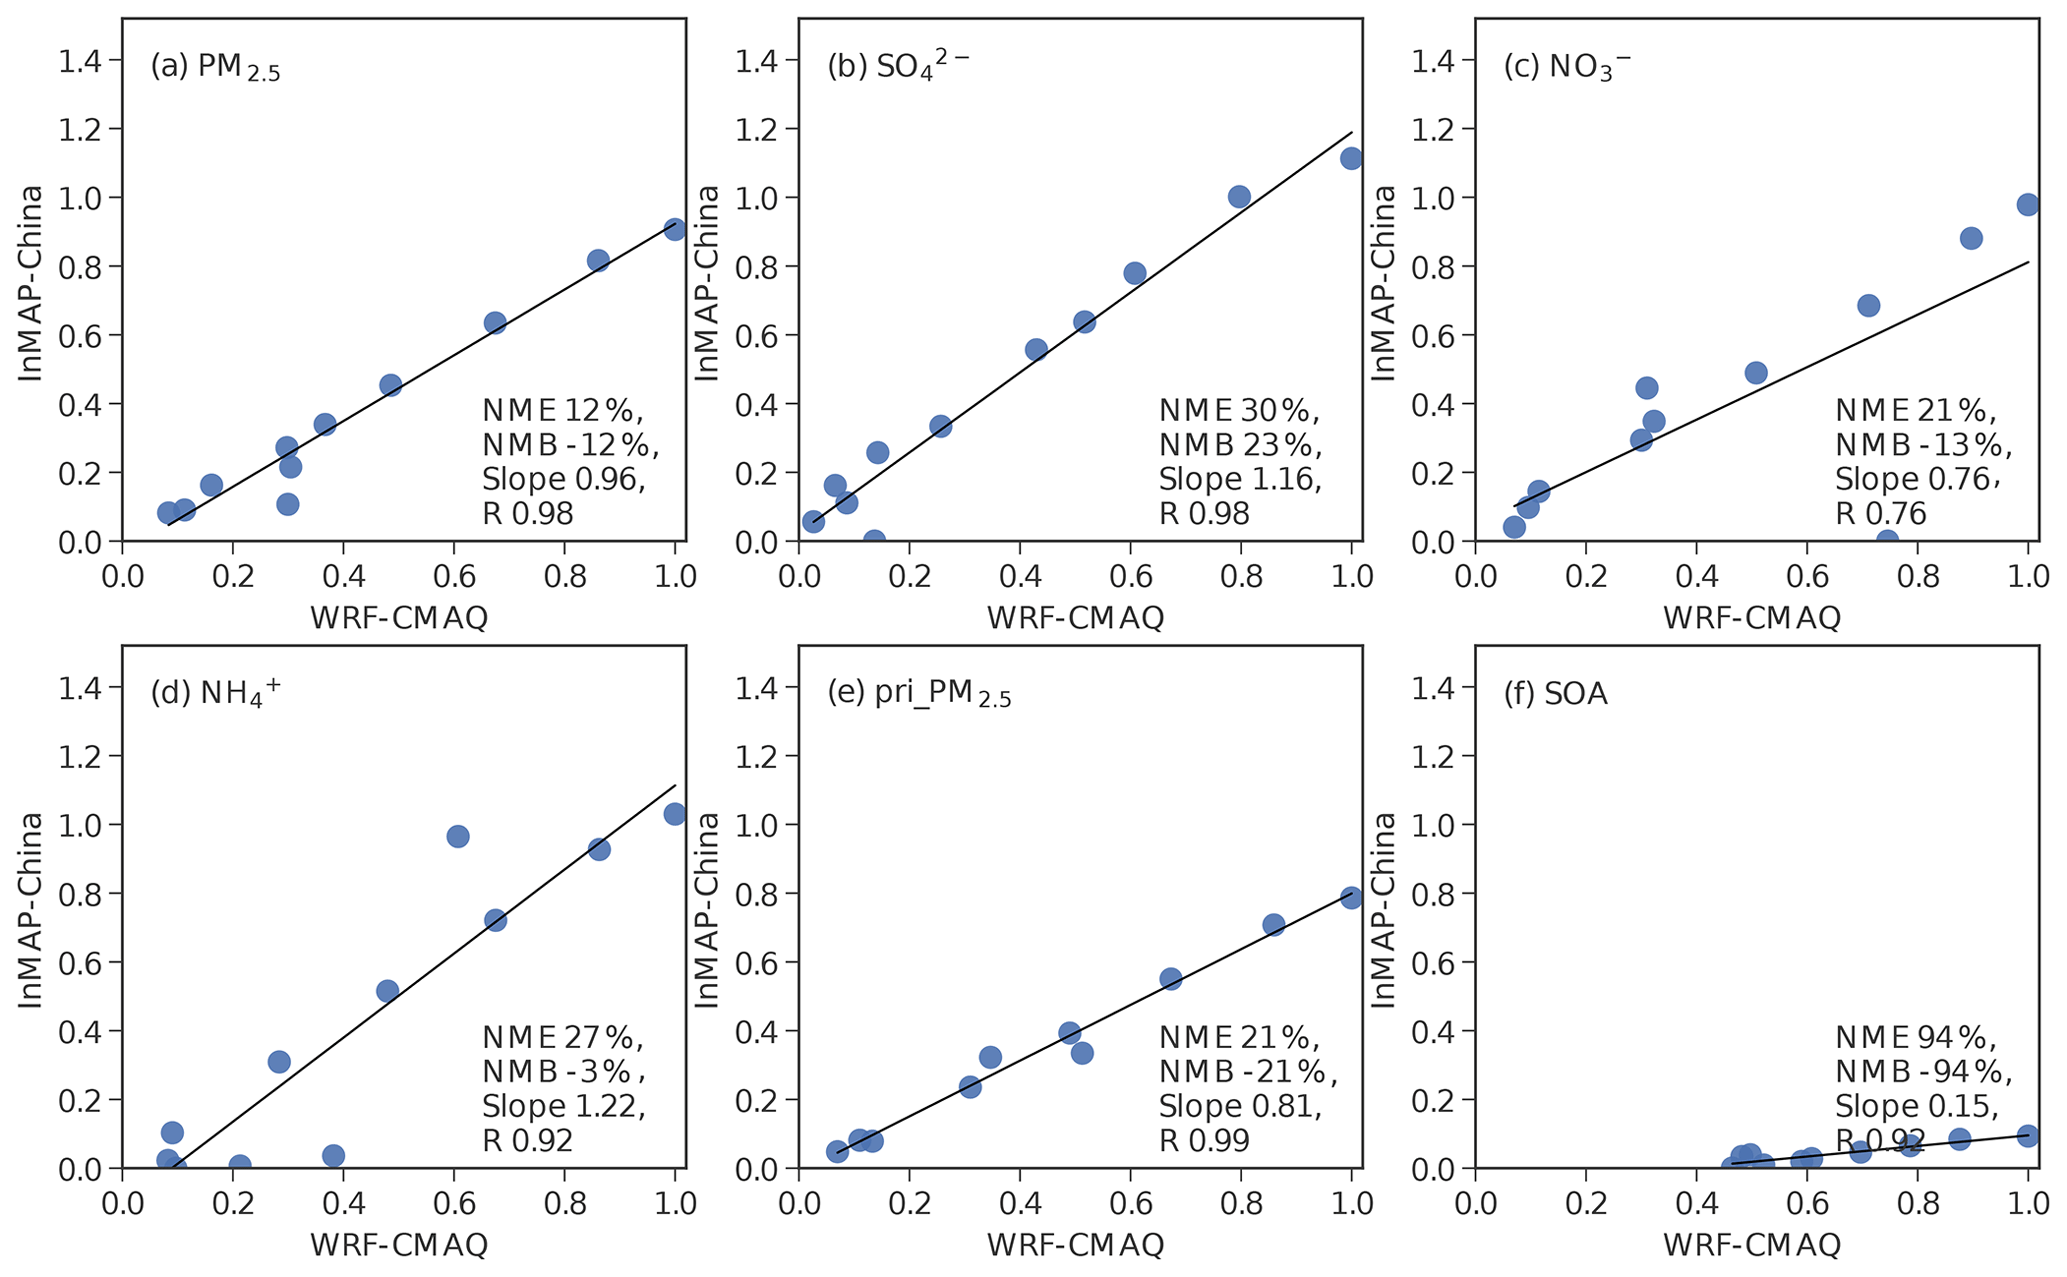
Figure 8Marginal change in the nationwide annual average population-weighted PM2.5 concentration and its composition as modeled by InMAP-China and WRF-CMAQ for 11 emission scenarios. The population-weighted pollutant concentration for each scenario is normalized using the largest value among all scenarios modeled by CMAQ. The 11 dots represent the 11 scenarios, and the statistical metrics are given in the lower right-hand corner of each panel.
Figure 8b–f compare the predictions of PM2.5 compositions. InMAP-China predictions of SO, NO, NH and primary PM2.5 agree well with the CMAQ results, but the predictions of secondary organic aerosol (SOA) are the poorest. The marginal changes in NO and primary PM2.5 concentrations are moderately underpredicted by InMAP-China, with NMB values of −13 % and −21 %, respectively. Conversely, the marginal change in the SO concentrations are overpredicted, with an NMB of 23 %. The marginal change in NH predicted by InMAP-China agrees well with the CMAQ predictions. Because few reaction pathways of SOA are included in the CB05 mechanism in the CMAQ simulations, SOAs are underpredicted in the entire modeling system.
The regional performance of the changes in PM2.5 and its compositions for the 11 emission scenarios are also examined in this study. Figures S4–S7 show the regional results. Four regions, including the Beijing–Tianjin–Hebei region (BTH), the Yangtze River Delta (YRD), the Pearl River Delta (PRD) and the Fenwei Plain (FWP), are analyzed here (see Fig. 2). At the regional level, the CMAQ predicted marginal changes in population-weighted PM2.5 concentrations, and its composition can be reproduced by InMAP-China, which is similar to the nationwide performance. However, the marginal change in the SO concentrations over the BTH is significantly overpredicted by InMAP-China, with an NMB of 135 %, which is expected to be improved by optimizing the representation of the annual sulfate oxidation rate in this region.
Table 4Comparison of the proportions of sectoral contributions to PM2.5 concentrations using InMAP-China and CMAQ.

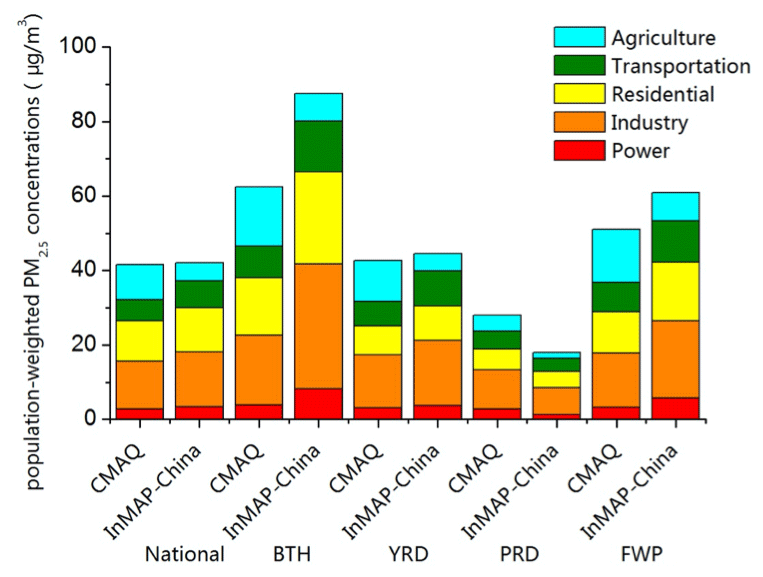
Figure 9Comparison of source contributions to population-weighted PM2.5 concentrations estimated by the two models.
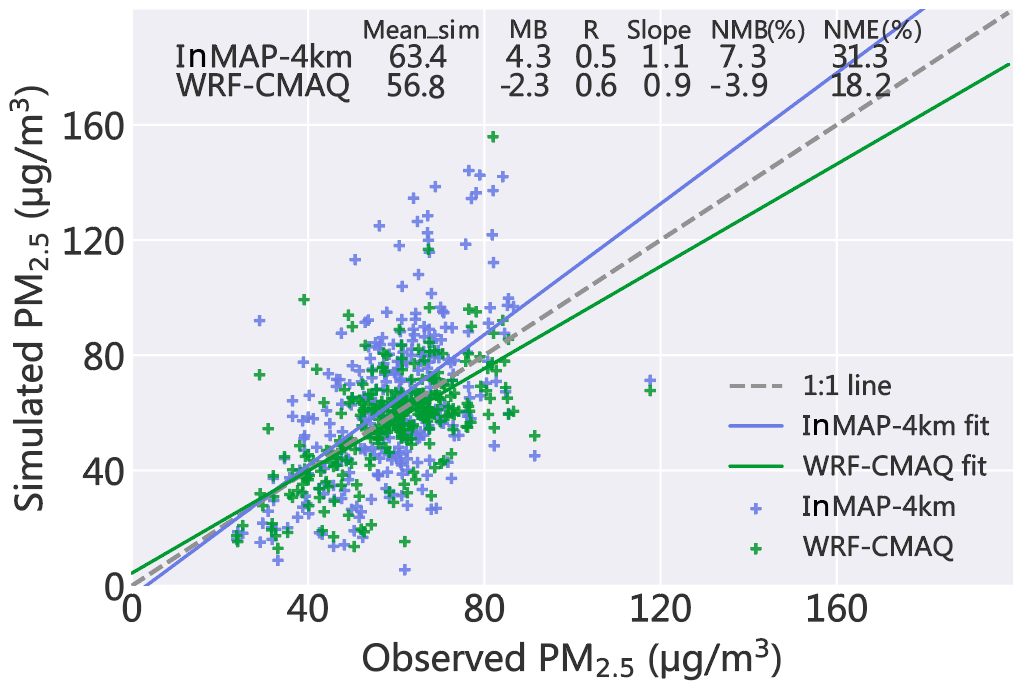
Figure 10Scatterplot comparing the PM2.5 concentration modeled in the BTH region at a 4 km spatial resolution by the InMAP-China and WRF-CMAQ models. The statistical metrics are given in the panel.
3.2 Model performance of source contributions in China
Figure 9 shows the nationwide and regional-scale contributions of each sector to PM2.5 concentrations, and Table 4 displays the proportions of the sectoral contributions based on the two models. The predictions of the PM2.5 concentration source contributions in InMAP-China are reliable compared with those based on the CMAQ model, and the difference can be explained.
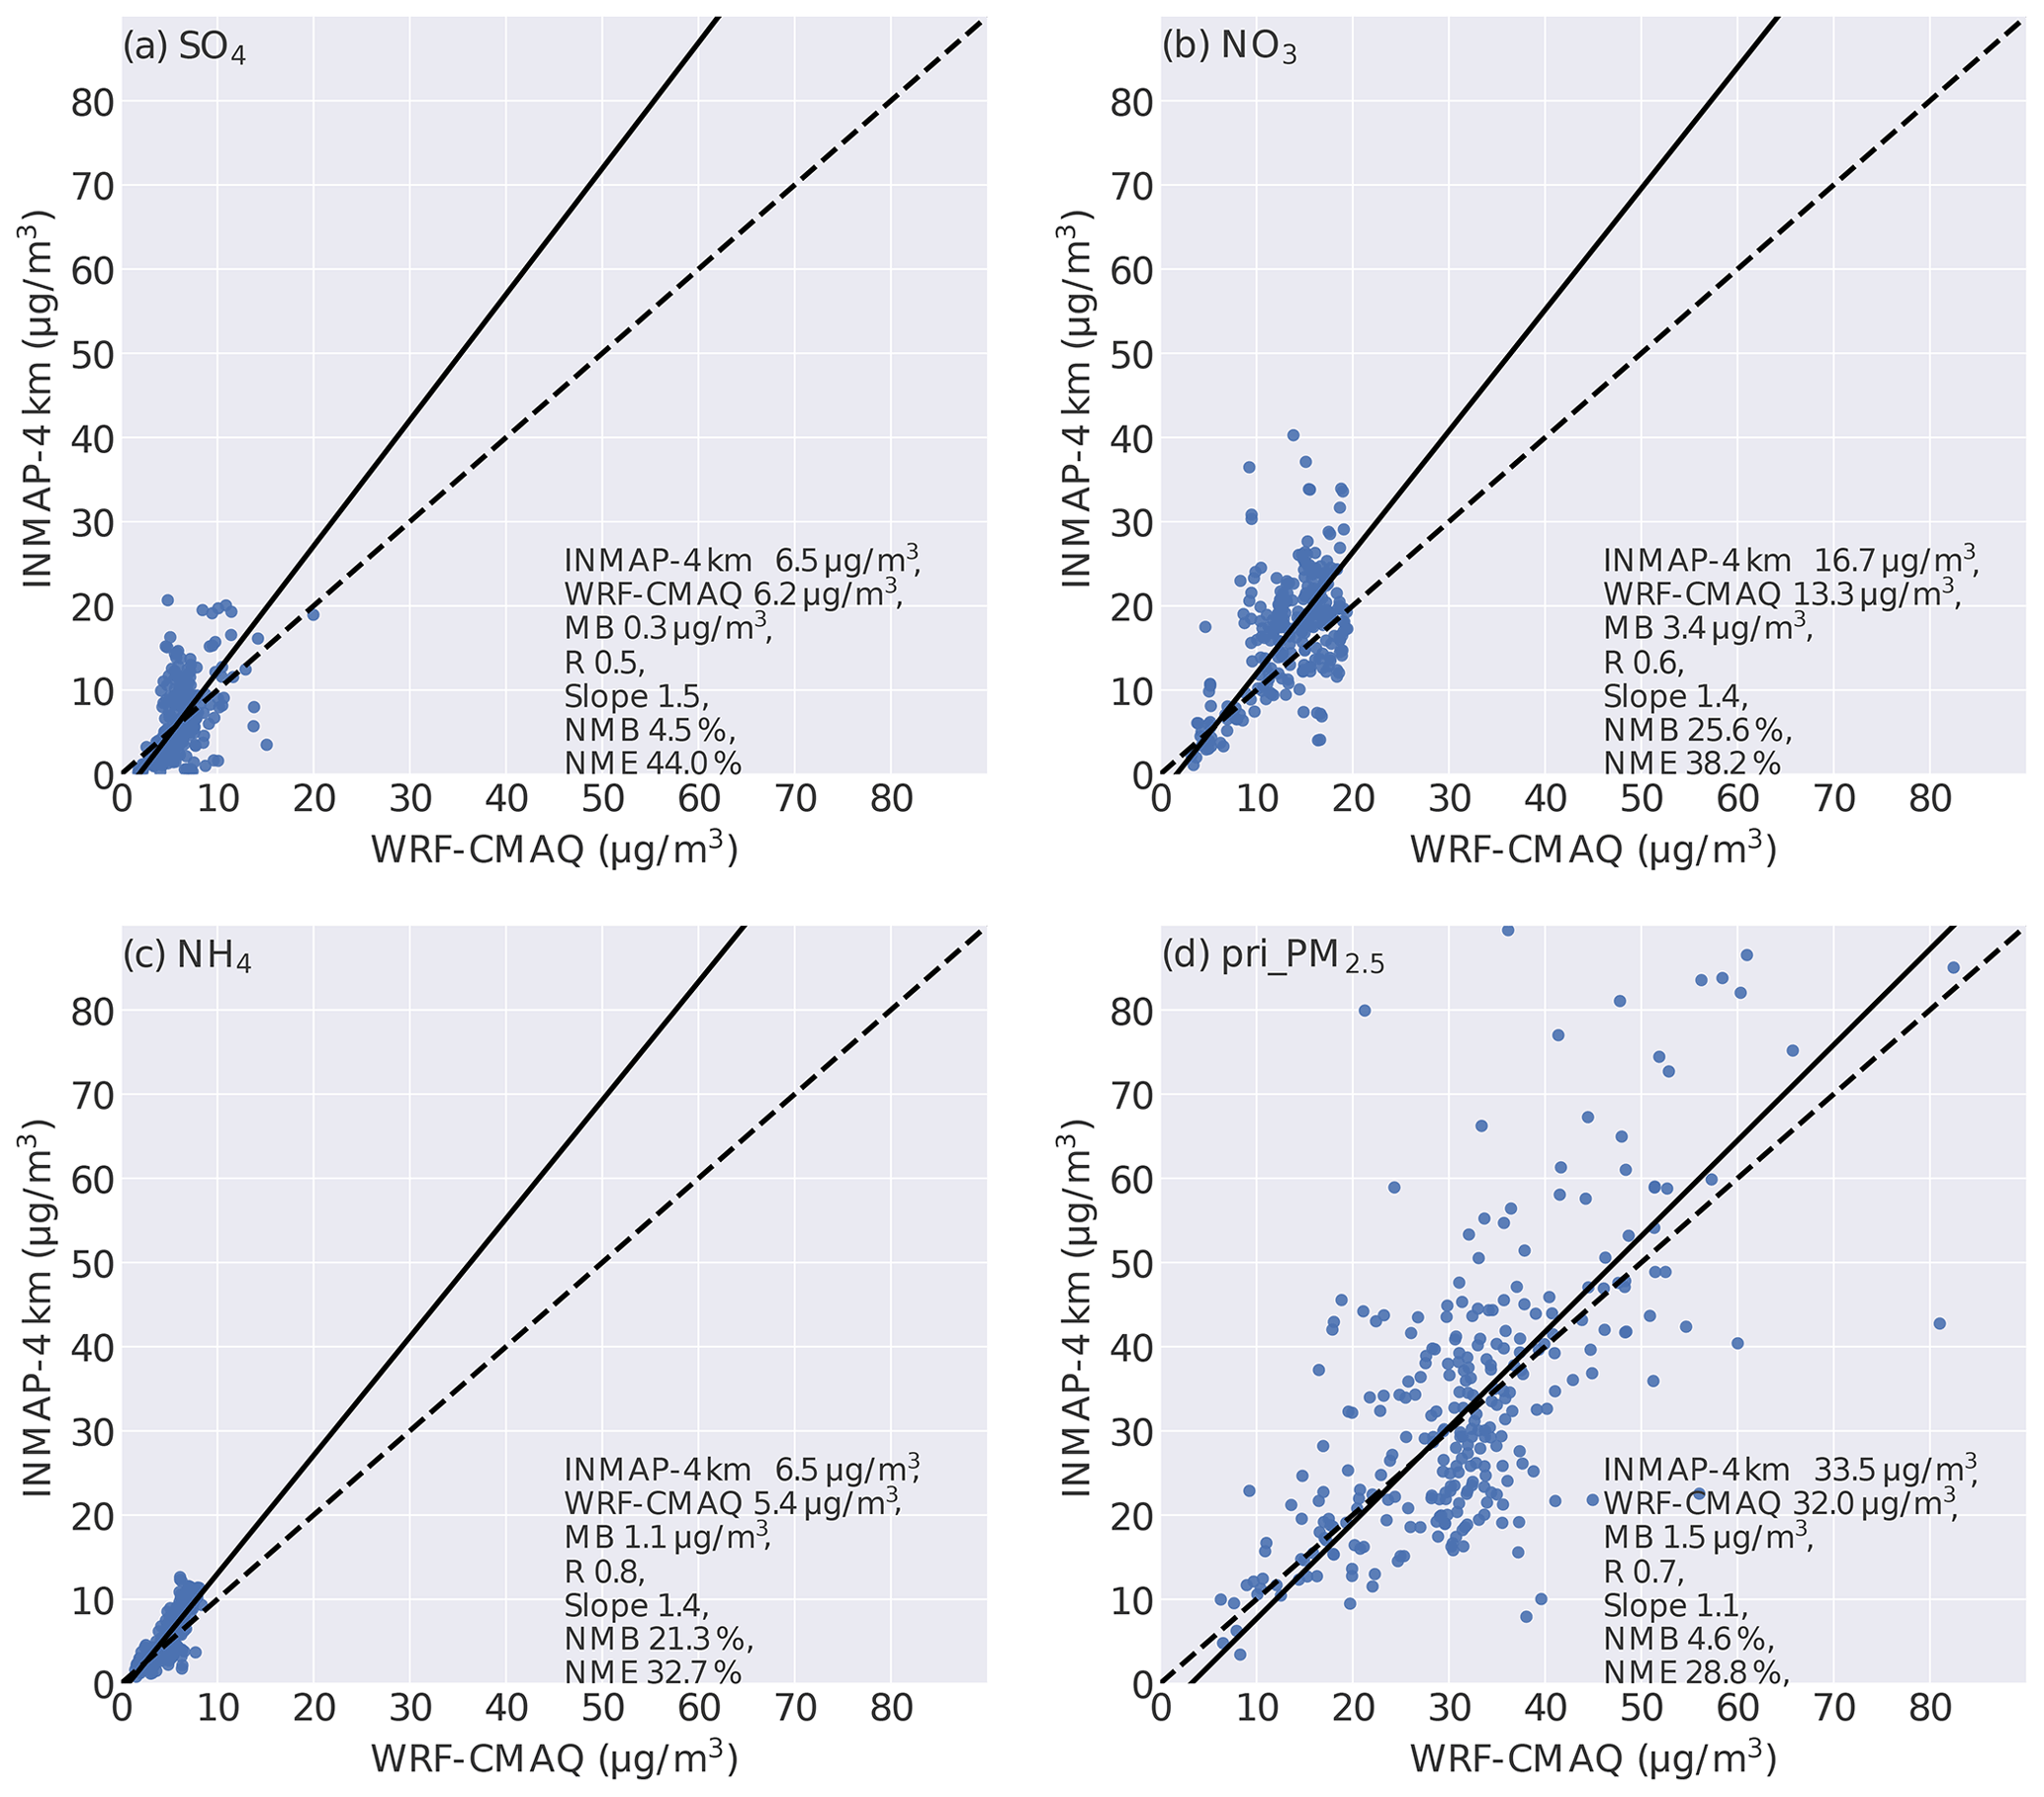
Figure 11Scatterplot comparing the PM2.5 composition concentration modeled in the BTH region at a 4 km spatial resolution by the InMAP-China and WRF-CMAQ models. Panels (a), (b), (c) and (d) display the sulfate, nitrate, ammonium and primary PM2.5, respectively. The statistical metrics are given in the lower right-hand corner of each panel.
The results based on the two models indicate that the industrial and residential sectors are the first and second contributors among the five sectors. The contribution of the electricity sector is comparable when using the two models, whereas the contributions of transportation and agriculture are moderately different, which is mainly due to the difference in the model mechanism and the treatment of secondary inorganic aerosols in the two models. At the regional scale, the difference in the sectoral contribution caused by the mechanism in the two models is more significant than at the national scale.
3.3 Model performance of PM2.5 predictions at a higher resolution in the BTH region
We also conducted a simulation with a higher spatial resolution of 4 km in the BTH region using InMAP-China and compared the results to the WRF-CMAQ nested simulation for the same area. Figures 10 and 11 show the performance evaluation of total PM2.5 concentration and the composition in the InMAP_BTH scenario. Compared with the observed annual average PM2.5 concentrations, the total PM2.5 concentrations are moderately overpredicted in InMAP_BTH, with an NMB of 7.3 % and an R value of 0.5.
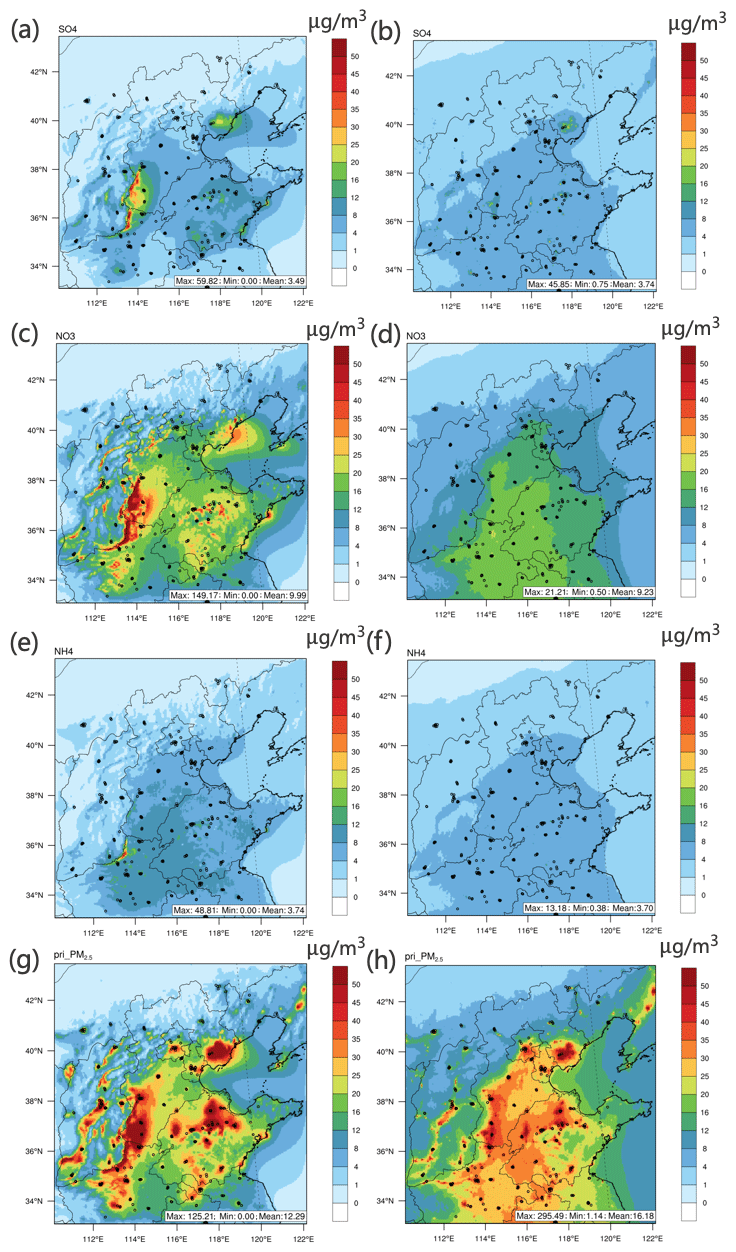
Figure 12The spatial pattern of PM2.5 compositions simulated in the BTH region at a 4 km spatial resolution by the InMAP-China and WRF-CMAQ models. Panels (a), (c), (e) and (g) present the respective sulfate, nitrate, ammonium and primary PM2.5, simulated by InMAP-China. Panels (b), (d), (f) and (h) present the corresponding results simulated by WRF-CMAQ.
Further comparison with the nested CMAQ predictions shows that the total PM2.5 concentrations are also overpredicted by InMAP-China. The predictions of PM2.5 compositions in the InMAP_BTH scenario are partially satisfactory with NMBs for SO, NO, NH and primary PM2.5 of 4.5 %, 25.6 %, 21.3 % and 4.6 %, respectively. Figure 12 further shows the comparison of the spatial distribution of PM2.5 compositions in the BTH region. The overall spatial distribution pattern of PM2.5 compositions is similarly modeled by the two models; however, an obvious difference can be observed across the mountainous area in the BTH region, for instance, the overpredictions of PM2.5 compositions SO and NO observed near the Taihang Mountains.
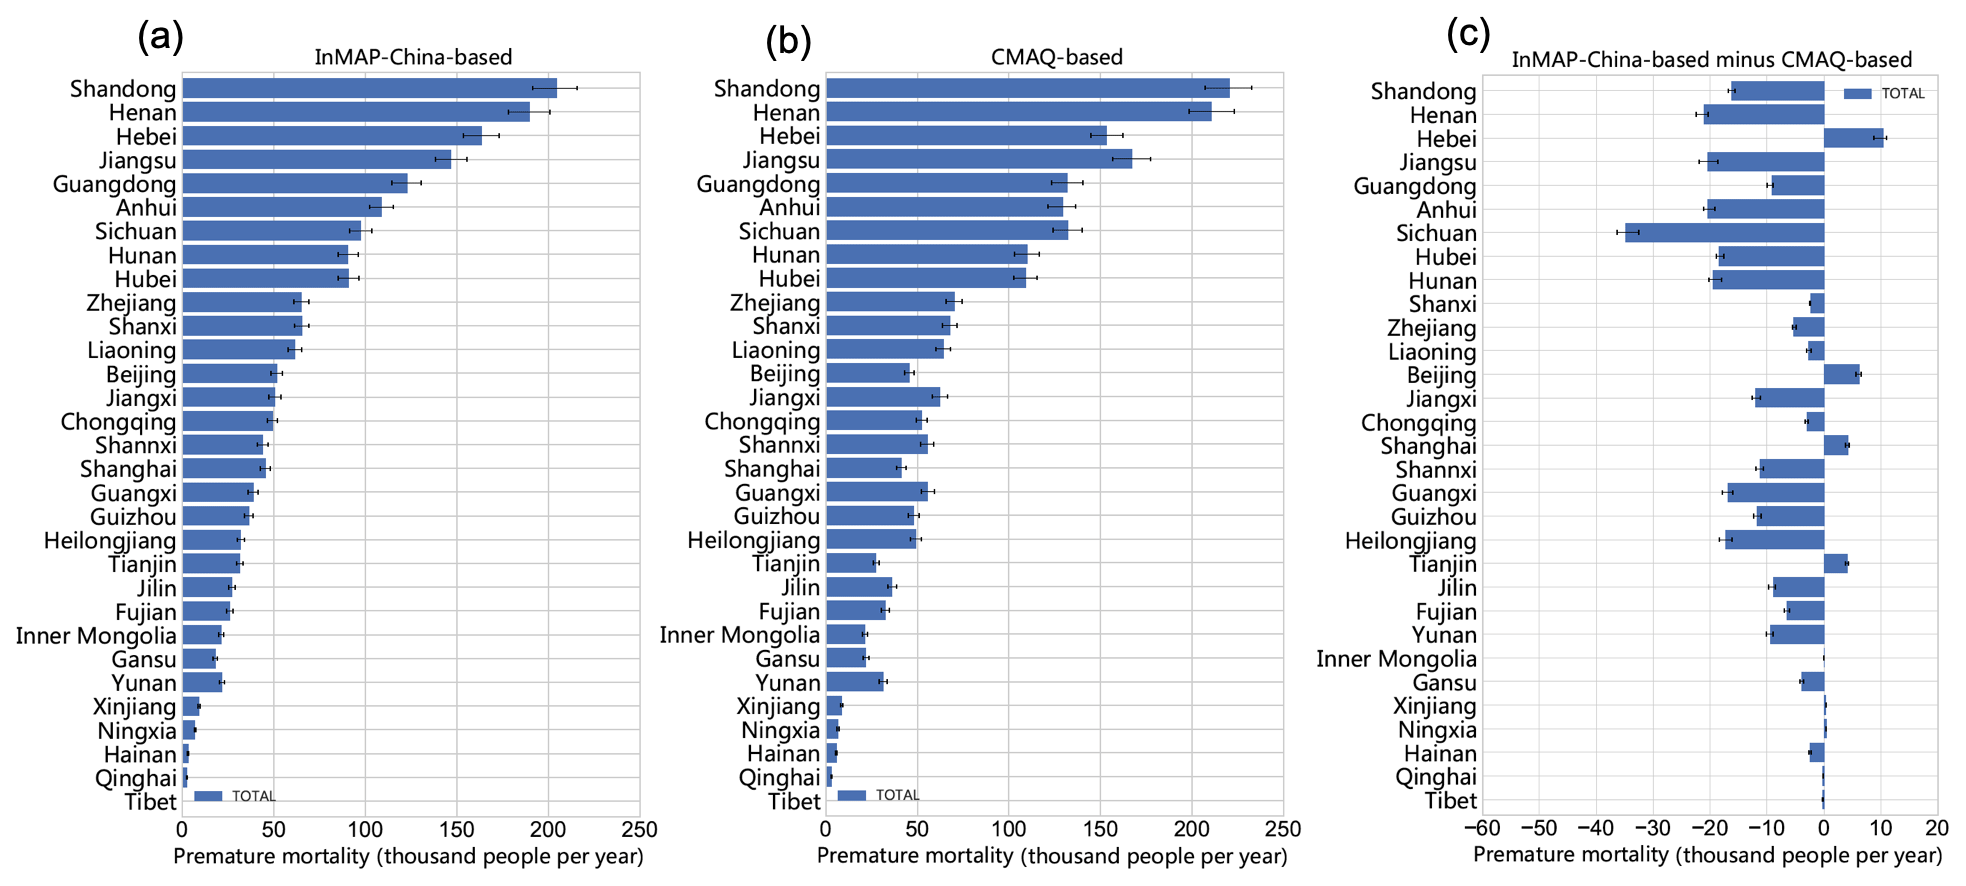
Figure 13Comparison of PM2.5-related premature mortality using the PM2.5 predictions from the two models. The panels show (a) InMAP-China-based values, (b) CMAQ-based values and (c) the difference between the two models. Note that we use Shanxi and Shannxi to avoid the duplication of province names. Shanxi is adjacent to Hebei Province, whereas Shannxi is adjacent to Gansu Province.
3.4 Model performance for PM2.5-related premature mortality in China
To examine the performance of the predictions of PM2.5-related premature mortality, a comparison of premature mortality using the PM2.5 predictions from the respective InMAP-China and CMAQ models is performed here. Figure 13 shows the comparison based on two models for all provinces. The results demonstrate that, compared with the premature mortality based on CMAQ, the relative difference ranges from −44 % to 15 % at the provincial level due to the difference in the PM2.5 concentrations in the two models.
At the provincial level, the PM2.5-related premature mortality in Beijing, Tianjin, Hebei Province and Shanghai is slightly overpredicted by InMAP-China, with the relative difference ranging from 4 % to 15 %. Conversely, for the other majority of provinces, PM2.5-related premature mortality is underpredicted by InMAP-China, with the relative difference ranging from −3 % to −44 %. Overall, the PM2.5-related premature mortality estimated using InMAP-China was 1.92 million people in 2017. Compared with the CMAQ-based estimations, this is an underprediction of 250 000 deaths, which stems from underestimations in the total PM2.5 concentrations in the baseline simulation.
This work develops a reduced-complexity air quality intervention model over China, InMAP-China, and presents a comprehensive evaluation by comparing CMAQ simulations and surface observations. InMAP-China aims at providing a simplified modeling tool to rapidly predict PM2.5 concentrations, owing to emission changes and the health impact of emission sources in China. After the model is established, the total runtime for a new simulation under atmospheric conditions in the year 2017 across mainland China is only 1 h with a single 24-node CPU. Therefore, the model is temporally efficient when conducting new simulations of PM2.5 concentrations in China. Notably, running WRF-CMAQ simulations is only necessary for the development stage of InMAP-China. For the application of InMAP-China, we recommend that users select InMAP-China as a prior tool when conducting multiple simulations, for instance, to quantify the PM2.5 concentrations due to hundreds of pollution emitters or to rapidly estimate the PM2.5 concentrations caused by dozens of respective control policies. Furthermore, the variable grid in InMAP-China can also be set to allow a high spatial resolution of 1 km or even higher in a certain urban area.
InMAP-China has moderately satisfactory performance in this study; however, this model has decreased accuracy compared with conventional CTMs. Overall, InMAP-China satisfactorily predicts total PM2.5 concentrations in the baseline simulation in terms of statistical performance. Compared with the observed PM2.5 concentrations, the MB, NMB and correlations of the total PM2.5 concentrations are −8.1 µg m−3, −18 % and 0.6, respectively. The statistical performance is satisfactory for a reduced-complexity air quality model and remains consistent with the performance evaluation in the USA. The underestimation of total PM2.5 mainly comes from the primary PM2.5. Moreover, the spatial pattern of total PM2.5 concentrations can be reproduced in InMAP-China, although an overestimation can be observed over the mountainous area in northern China. The large emission intensity and complex terrain over this region increase the difficulty of modeling concentrations in this area. The predictions of source contributions to PM2.5 concentrations by InMAP-China are comparable with those based on the CMAQ model, and the difference is mainly caused by the uncertainty in the simplification of the chemical process in the InMAP-China. The global version of the reduced-complexity Intervention Model for Air Pollution (Global-InMAP) has also been developed and released recently (Thakrar et al., 2021); thus, our results from InMAP-China can provide more accurate results for mainland China.
This study is subject to some limitations and uncertainties. In InMAP-China, the annual average chemical and physical process parameters are calculated using hourly parameters from WRF-CMAQ. Complicated seasonal and daily variations affecting the formation and transportation of particulate matter are challenging to retain. The intensity of advection of the air mass is supposed to be weakened due to the offset of the wind vector in the averaging process, which was also pointed out in a previous study. Moreover, InMAP-China has difficulty predicting SOA concentrations because reaction pathways for SOA are insufficient in this modeling system. Further research is suggested to improve the model performance; for instance, the combination of a machine learning technique and a reduced complexity air quality model may improve the model performance in China.
The source code of InMAP-China, the user manual, and data related to this study are all available at https://doi.org/10.5281/zenodo.5111961 (Wu, 2021).
The supplement related to this article is available online at: https://doi.org/10.5194/gmd-14-7621-2021-supplement.
QZ and RW designed the research, and RW carried it out. RW, CWT and YaZ contributed to model develop- ment. CH and YZ contributed to data analysis. XQ and SL contributed to data preprocessing. RW and QZ interpreted the results. RW prepared the paper with contributions from all co-authors.
The contact author has declared that neither they nor their co-authors have any competing interests.
The views expressed in this paper are those of the authors alone and do not necessarily reflect the views and policies of the U.S. EPA. The EPA does not endorse any products or commercial services mentioned in this publication.
Publisher's note: Copernicus Publications remains neutral with regard to jurisdictional claims in published maps and institutional affiliations.
This work was supported by the National Natural Science Foundation of China (grant nos. 41625020 and 41921005). It was also funded under Assistance Agreement No. RD835871 awarded by the U.S. EPA to Yale University.
This research has been supported by the National Natural Science Foundation of China (grant nos. 41921005 and 41625020) and by the U.S. Environmental Protection Agency (assistance agreement no. RD835871 awarded to Yale University through the SEARCH – Solutions for Energy, AiR, Climate, and Health – Center).
This paper was edited by Gunnar Luderer and reviewed by two anonymous referees.
Appel, K. W., Napelenok, S. L., Hogrefe, C., Foley, K. M., Pouliot, G. A., Murphy, B., Heath, N., Roselle, S., Pleim, J., Bash, J. O., Pye, H. O. T., and Mathur, R.: Overview and evaluation of the Community Multiscale Air Quality (CMAQ) modelling system version 5.2, Air Pollution Modeling and its Application XXV, ITM 2016, Springer Proceedings in Complexity, edited by: Mensink, C. and Kallos, G., Springer, Cham, 69–73, https://doi.org/10.1007/978-3-319-57645-9_11, 2018.
Baker, K. R., Amend, M., Penn, S., Bankert, J., Simon, H., Chan, E., Fann, N., Zawacki, M., Davidson, K., and Roman, H.: A database for evaluating the InMAP, APEEP, and EASIUR reduced complexity air-quality modelling tools, Data in Brief, 28, 104886, https://doi.org/10.1016/j.dib.2019.104886, 2020.
Burnett, R., Chen, H., Szyszkowicz, M., Fann, N., Hubbell, B., Pope, C. A., Apte, J. S., Brauer, M., Cohen, A., Weichenthal, S., Coggins, J., Di, Q., Brunekreef, B., Frostad, J., Lim, S. S., Kan, H. D., Walker, K. D., Thurston, G. D., Hayes, R. B., Lim, C. C., Turner, M. C., Jerrett, M., Krewski, D., Gapstur, S. M., Diver, W. R., Ostro, B., Goldberg, D., Crouse, D. L., Martin, R. V., Peters, P., Pinault, L., Tjepkema, M., Donkelaar, A., Villeneuve, P. J., Miller, A. B., Yin, P., Zhou, M. G., Wang, L. J., Janssen, N. A. H., Marra, M., Atkinson, R. W., Tsang, H., Thach, Q., Cannon, J. B., Allen, R. T., Hart, J. E., Laden, F., Cesaroni, G., Forastiere, F., Weinmayr, G., Jaensch, A., Nagel, G., Concin, H., and Spadaro, J. V.: Global estimates of mortality associated with long-term exposure to outdoor fine particulate matter, P. Natl. Acad. Sci. USA, 115, 9592–9597, https://doi.org/10.1073/pnas.1803222115, 2018.
Chang, X., Wang, S., Zhao, B., Xing, J., Liu, X., Wei, L., Song, Y., Wu, W., Cai, S., Zheng, H., Ding, D., and Zheng, M.: Contributions of inter-city and regional transport to PM2.5 concentrations in the Beijing-Tianjin-Hebei region and its implications on regional joint air pollution control, Sci. Total Environ., 660, 1191–1200, https://doi.org/10.1016/j.scitotenv.2018.12.474, 2019.
Cohen, A. J., Brauer, M., Burnett, R., Anderson, H. R., Frostad, J., Estep, K., Balakrishnan, K., Brunekreef, B., Dandona, L., Dandona, R., Feigin, V., Freedman, G., Hubbell, B., Jobling, A., Kan, H., Knibbs, L., Liu, Y., Martin, R., Morawska, L., Pope III, C. A., Shin, H., Straif, K., Shaddick, G., Thomas, M., van Dingenen, R., van Donkelaar, A., Vos, T., Murray, C. J. L., and Forouzanfar, M. H.: Estimates and 25-year trends of the global burden of disease attributable to ambient air pollution: an analysis of data from the Global Burden of Diseases Study 2015, Lancet, 389, 1907–1918, https://doi.org/10.1016/S0140-6736(17)30505-6, 2017.
Dimanchevi, E. G., Paltsev, S., Yuan, M., Rothenberg, D., Tessum, C. W., Marshall, J. D., and Selin, N. E.: Health co-benefits of sub-national renewable energy policy in the US, Environ. Res. Lett., 14, 085012, https://doi.org/10.1088/1748-9326/ab31d9, 2019.
Doxsey-Whitfield, E., MacManus, K., Adamo, S. B., Susana, B., Pistolesi, L., Squires, J., Borkovska,O., and Baptista, S. R.: Taking advantage of the improved availability of census data: a first look at the gridded population of the world, version 4, Papers in Applied Geography, 1, 226–34, https://doi.org/10.1080/23754931.2015.1014272, 2015.
Gilmore, E. A., Heo, J., Muller, N. Z., Tessum, C. W., Hill, J. D., Marshall, J. D., and Adams, P. J.: An inter-comparison of the social costs of air quality from reduced-complexity models, Environ. Res. Lett., 14, 074016, https://doi.org/10.1088/1748-9326/ab1ab5, 2019.
Global Burden of Disease Collaborative Network: Global Burden of Disease Study 2017 (GBD 2017) Population Estimates 1950–2017, Institute for Health Metrics and Evaluation (IHME), Seattle, USA, 2018a.
Global Burden of Disease Collaborative Network: Global Burden of Disease Study 2017 (GBD 2017) Cause-Specific Mortality 1980–2017, Institute for Health Metrics and Evaluation (IHME), Seattle, USA, 2018b.
Goodkind, A. L., Tessum, C. W., Coggins, J. S., Hill, J. D., and Marshall, J. D.: Fine-scale damage estimates of particulate matter air pollution reveal opportunities for location-specific mitigation of emissions, P. Natl. Acad. Sci. USA, 116, 8775–8780, https://doi.org/10.1073/pnas.1816102116, 2019.
Guenther, A. B., Jiang, X., Heald, C. L., Sakulyanontvittaya, T., Duhl, T., Emmons, L. K., and Wang, X.: The Model of Emissions of Gases and Aerosols from Nature version 2.1 (MEGAN2.1): an extended and updated framework for modeling biogenic emissions, Geosci. Model Dev., 5, 1471–1492, https://doi.org/10.5194/gmd-5-1471-2012, 2012.
Heo, J., Adams, P. J., and Gao, H. O.: Reduced-form modelling of public health impacts of inorganic PM2.5 and precursor emissions, Atmos. Environ., 137, 80–89, https://doi.org/10.1016/j.atmosenv.2016.04.026, 2016.
Heo, J., Adams, P. J., and Gao, H. O.: Public health costs accounting of inorganic PM2.5 pollution in metropolitan areas of the United States using a risk-based source-receptor model, Environ. Int., 106, 119–126, https://doi.org/10.1016/j.envint.2017.06.006, 2017.
Hong, C., Zhang, Q., Zhang, Y., Tang, Y., Tong, D., and He, K.: Multi-year downscaling application of two-way coupled WRF v3.4 and CMAQ v5.0.2 over east Asia for regional climate and air quality modeling: model evaluation and aerosol direct effects, Geosci. Model Dev., 10, 2447–2470, https://doi.org/10.5194/gmd-10-2447-2017, 2017.
Li, M., Zhang, Q., Kurokawa, J.-I., Woo, J.-H., He, K., Lu, Z., Ohara, T., Song, Y., Streets, D. G., Carmichael, G. R., Cheng, Y., Hong, C., Huo, H., Jiang, X., Kang, S., Liu, F., Su, H., and Zheng, B.: MIX: a mosaic Asian anthropogenic emission inventory under the international collaboration framework of the MICS-Asia and HTAP, Atmos. Chem. Phys., 17, 935–963, https://doi.org/10.5194/acp-17-935-2017, 2017.
Li, X., Zhang, Q., Zhang, Y., Zheng, B., Wang, K., Chen, Y., Wallington, T. J., Han, W., Shen, W., Zhang, X., and He, K.: Source contributions of urban PM2.5 in the Beijing-Tianjin-Hebei region: Changes between 2006 and 2013 and relative impacts of emissions and meteorology, Atmos. Environ., 123, 229–239, https://doi.org/10.1016/j.atmosenv.2015.10.048, 2015.
Liu, F., Zhang, Q., Tong, D., Zheng, B., Li, M., Huo, H., and He, K. B.: High-resolution inventory of technologies, activities, and emissions of coal-fired power plants in China from 1990 to 2010, Atmos. Chem. Phys., 15, 13299–13317, https://doi.org/10.5194/acp-15-13299-2015, 2015.
Muller, N. Z. and Mendelsohn, R.: Measuring the damages of air pollution in the United States, J. Environ. Econ. Manage., 54, 1–14, https://doi.org/10.1016/j.jeem.2006.12.002, 2007.
Muller, N. Z., Mendelsohn, R., and Nordhaus, W.: Environmental accounting for pollution in the United States economy, Am. Econ. Rev., 101, 1649–1675, https://doi.org/10.1257/aer.101.5.1649, 2011.
National Centers for Environmental Prediction/National Weather Service/NOAA/US Department of Commerce: NCEP FNL Operational Model Global Tropospheric Analyses, continuing from July 1999 Dataset [data set], https://doi.org/10.5065/D6M043C6, 2000.
Reddington, C. L., Conibear, L., Knote, C., Silver, B. J., Li, Y. J., Chan, C. K., Arnold, S. R., and Spracklen, D. V.: Exploring the impacts of anthropogenic emission sectors on PM2.5 and human health in South and East Asia, Atmos. Chem. Phys., 19, 11887–11910, https://doi.org/10.5194/acp-19-11887-2019, 2019.
Sergi, B. J., Adams, P. J., Muller, N. Z., Robinson, A. L., Davis, S. J., Marshall, J. D., and Azevedo, I. L.: Optimizing Emissions Reductions from the U.S. Power Sector for Climate and Health Benefits, Environ. Sci. Technol., 54, 7513–7523, https://doi.org/10.1021/acs.est.9b06936, 2020.
Skamarock, W., Klemp, J., Dudhia, J., Gill, D., Barker, D., Duda, M., Huang, X., Wang, W., and Powers, J.: A description of the Advanced Research WRF Version 3 NCAR technical note, National Center for Atmospheric Research, Boulder, CO, USA, 2008.
Tessum, C. W., Hill, J. D., and Marshall, J. D.: InMAP: A model for air pollution interventions, PLoS One, 12, e0176131, https://doi.org/10.1371/journal.pone.0176131, 2017.
Thakrar, S., Tessum, C., Apte, J., Balasubramanian, S., Millet, D. B., Pandis, S., Marshall, J. D., and Hill, J.: Global, High-Resolution, Reduced-Complexity Air Quality Modeling Using InMAP (Intervention Model for Air Pollution), ChemRxiv, https://doi.org/10.33774/chemrxiv-2021-wn21q-v2, 2021.
Thind, M. P. S., Tessum, C. W., Azevedo, I. L., and Marshall, J. D.: Fine Particulate Air Pollution from Electricity Generation in the US: Health Impacts by Race, Income, and Geography, Environ. Sci. Technol., 53, 14010–14019, https://doi.org/10.1021/acs.est.9b02527, 2019.
United States Environmental Protection Agency: National Emission Inventory data, available at: https://www.epa.gov/air-emissions-inventories/2011-national-emissions-inventory-nei-data (last access: 9 December 2021), 2011.
Wu, R.: A localized version of reduced-complexity air quality intervention model over China (InMAPv1.6.1-China), Zenodo [code], https://doi.org/10.5281/zenodo.5111961, 2021.
Wu, R., Liu, F., Tong, D., Zheng, Y., Lei, Y., Hong, C., Li, M., Liu, J., Zheng, B., Bo, Y., Chen, X., Li, X., and Zhang, Q.: Air quality and health benefits of China's emission control policies on coal-fired power plants during 2005–2020, Environ. Res. Lett., 14, 094016, https://doi.org/10.1088/1748-9326/ab3bae, 2019.
Xiao, Q. Y., Geng, G. N., Liang, F. C., Wang, X., Lv, Z., Lei, Y., Huang, X. M., Zhang, Q., Liu, Y., and He, K.: Changes in spatial patterns of PM2.5 pollution in China 2000–2018: Impact of clean air policies, Environ. Int., 141, 105776, https://doi.org/10.1016/j.envint.2020.105776, 2020.
Zhang, L., Liu, L. C., Zhao, Y. H., Gong, S. L., Zhang, X. Y., Henze, D. K., Capps, S. L., Fu, T. M., Zhang, Q., and Wang, Y. X.: Source attribution of particulate matter pollution over North China with the adjoint method. Environ. Res. Lett., 10, 084011, https://doi.org/10.1088/1748-9326/10/8/084011, 2015.
Zhang, Q., Zheng, Y., Tong, D., Shao, M., Wang, S., Zhang, Y., Xu, X., Wang, J., He, H., Liu, W., Ding, Y., Lei, Y., Li, J., Wang, Z., Zhang, X., Wang, Y., Cheng, J., Liu, Y., Shi, Q., Yan, L., Geng, G., Hong, C., Li, M., Liu, F., Zheng, B., Cao, J., Ding, A., Gao, J., Fu, Q., Huo, J., Liu, B., Liu, Z., Yang, F., He, K., and Hao, J.: Drivers of improved PM2.5 air quality in China from 2013 to 2017, P. Natl. Acad. Sci. USA, 116, 24463–24469, https://doi.org/10.1073/pnas.1907956116, 2019.
Zhao, H., Chen, K., Liu, Z., Zhang, Y., and Zhang, H.: Coordinated control of PM2.5 and O3 is urgently needed in China after implementation of the “Air Pollution Prevention and Control Action Plan”, Chemosphere, 270, 129441, https://doi.org/10.1016/j.chemosphere.2020.129441, 2021.
Zheng, B., Zhang, Q., Zhang, Y., He, K. B., Wang, K., Zheng, G. J., Duan, F. K., Ma, Y. L., and Kimoto, T.: Heterogeneous chemistry: a mechanism missing in current models to explain secondary inorganic aerosol formation during the January 2013 haze episode in North China, Atmos. Chem. Phys., 15, 2031–2049, https://doi.org/10.5194/acp-15-2031-2015, 2015.