the Creative Commons Attribution 4.0 License.
the Creative Commons Attribution 4.0 License.
 | 16 Dec 2021
Application of CCM SOCOL-AERv2-BE to cosmogenic beryllium isotopes: description and validation for polar regions
Kseniia Golubenko
Eugene Rozanov
Gennady Kovaltsov
Ari-Pekka Leppänen
Timofei Sukhodolov
Ilya Usoskin
The short-living cosmogenic isotope 7Be, which is produced by cosmic rays in the atmosphere, is often used as a tracer for atmospheric dynamics, with precise and high-resolution measurements covering the recent decades. The long-living isotope 10Be, as measured in polar ice cores with an annual resolution, is a proxy for long-term cosmic-ray variability, whose signal can, however, be distorted by atmospheric transport and deposition that need to be properly modeled to be accounted for. While transport of 7Be can be modeled with high accuracy using the known meteorological fields, atmospheric transport of 10Be was typically modeled using case-study-specific simulations or simplified box models based on parameterizations. Thus, there is a need for a realistic model able to simulate atmospheric transport and deposition of beryllium with a focus on polar regions and (inter)annual timescales that is potentially able to operate in a self-consistent mode without the prescribed meteorology. Since measurements of 10Be are extremely laborious and hence scarce, it is difficult to compare model results directly with measurement data. On the other hand, the two beryllium isotopes are believed to have similar transport and deposition properties, being different only in production and lifetime, and thus the results of 7Be transport can be generally applied to 10Be. Here we present a new model, called CCM SOCOL-AERv2-BE, to trace isotopes of 7Be and 10Be in the atmosphere based on the chemistry–climate model (CCM) SOCOL (SOlar Climate Ozone Links), which has been improved by including modules for the production, deposition, and transport of 7Be and 10Be. Production of the isotopes was modeled for both galactic and solar cosmic rays by applying the CRAC (Cosmic Ray Atmospheric Cascade) model. Transport of 7Be was modeled without additional gravitational settling due to the submicron size of the background aerosol particles. An interactive deposition scheme was applied including both wet and dry deposition. Modeling was performed using a full nudging to the meteorological fields for the period of 2002–2008 with a spin-up period of 1996–2001. The modeled concentrations of 7Be in near-ground air were compared with the measured ones at a weekly time resolution in four nearly antipodal high-latitude locations: two in the Northern (Finland and Canada) and two in the Southern (Chile and the Kerguelen Islands) Hemisphere. The model results agree with the measurements in the absolute level within error bars, implying that the production, decay, and lateral deposition are correctly reproduced. The model also correctly reproduces the temporal variability of 7Be concentrations on annual and sub-annual scales, including the presence and absence of the annual cycle in the Northern and Southern Hemisphere, respectively. We also modeled the production and transport of 7Be for a major solar energetic particle event (SPE) on 20 January 2005, which appears insufficient to produce a measurable signal but may serve as a reference event for historically known extreme SPEs. Thus, a new full 3D time-dependent model, based on CCM SOCOL, of 7Be and 10Be atmospheric production, transport, and deposition has been developed. Comparison with real data on the 7Be concentration in the near-ground air validates the model and its accuracy.
- Article
(2811 KB) - Full-text XML
- BibTeX
- EndNote


One of the most important outer-space factors affecting Earth is related to cosmic rays (highly energetic nuclei of extraterrestrial origin), which cause nucleonic–electromagnetic–muon cascade in the terrestrial atmosphere (Dorman, 2004). These cosmic-ray-induced atmospheric cascades form the main source of ionization in the troposphere and stratosphere (e.g., Mironova et al., 2015). Nuclear interactions between the nucleonic component of the cascade and nuclei of atmospheric gases such as nitrogen and oxygen can produce radioactive nuclides (e.g., Lal and Peters, 1967; Beer et al., 2012) including 7Be (half-life 53.22 d) and 10Be (half-life 1.4×10⁶ years). They are called cosmogenic isotopes since galactic and solar cosmic rays form the dominant source of these nuclides in the terrestrial system. Production rates of 7Be and 10Be vary in time following the intensity of galactic cosmic rays (GCRs) modulated by solar magnetic activity (the 11-year solar cycle), geomagnetic field strength, and also sporadic solar energetic particle events (SPEs) (see, e.g., Usoskin and Kovaltsov, 2008; Kovaltsov and Usoskin, 2010).
The short-living cosmogenic isotope 7Be, which is relatively easy to measure via a proper collection system and γ spectrometry, is routinely measured with daily, weekly, and monthly time resolution in near-ground air and precipitating water at different places around the globe in the framework of atmospheric radiation monitoring. Concentrations of long-living 10Be are measured (via acceleration mass spectrometry, AMS) in natural stratified archives, typically in polar ice cores, with pseudo-annual or longer time resolution (e.g., Beer et al., 2012). In particular, 10Be recorded in polar ice cores serves as a main proxy for long-term solar activity reconstructions in the past (e.g., Steinhilber et al., 2012; Usoskin, 2017; Wu et al., 2018).
In addition to the production pattern defined by cosmic-ray fluxes, concentrations of beryllium isotopes at any location are also affected by atmospheric transport and deposition processes, which may essentially distort the production signal. Thanks to the short life of 7Be, high-time-resolution data, and broad distribution of the measuring sites, this isotope has often been used as a tracer for atmospheric dynamics during the recent decades. Its atmospheric transport can be modeled with high accuracy using the known meteorological fields as summarized in Sect. 2. On the other hand, data on 10Be are mainly measured in polar regions with low temporal resolution and extend far back in the past to times when meteorological data are not available. Accordingly, the atmospheric transport of 10Be is typically modeled using simplified box models based on a parameterization of some specific simulations (e.g., Heikkilä et al., 2013). Thus, there is a need for a realistic model able to simulate atmospheric transport and deposition of beryllium focused in polar regions and (inter)annual timescales that is potentially able to operate in a self-consistent mode without the prescribed meteorology. Such a model needs to be able to reproduce the main pattern of beryllium transport and its deposition in polar regions on the annual timescale.
Since measurements of 10Be are laborious and expensive, their coverage for the last decades is low, making it difficult to compare model results directly with measured data. Moreover, they can be additionally distorted by deposition and post-depositional processes. However, since the two beryllium isotopes are believed to have similar transport and deposition, being different only in production and lifetime, a model applied and verified for 7Be transport can also be generally applied to 10Be (Heikkilä et al., 2008b). Here we develop such a model, CCM SOCOL-AERv2-BE, to trace isotopes of 7Be and 10Be in the atmosphere with modules for the production, deposition, and transport of 7Be and 10Be.
The main purpose of this work is to present a new combined model of beryllium production and transport and to confront its results with high-resolution (weekly) measurements of 7Be in near-ground air and precipitating water in polar regions. The isotope 7Be was chosen for the analysis because of the following reasons: (i) there are no systematic high-quality 10Be data in air samples since measurements of 10Be are much more difficult (AMS technology) than those of 7Be (γ spectrometry); (ii) 10Be measured in ice cores contains an additional component (deposition), which also affects the measured data and needs to be modeled separately. On the other hand, the model eventually aims at the modeling of the 10Be isotope including its deposition. Since 10Be is typically measured in polar ice cores with pseudo-annual or longer resolution, we are primarily interested in validating the model for high-latitude regions and (inter)annual timescales. The new model version CCM SOCOL-AERv2-BE has been developed here for systematic modeling of 7Be and 10Be production, transport, and deposition in the atmosphere. This model set forms a methodological basis for a detailed study of the atmospheric dynamic and cosmogenic isotope distribution in the terrestrial system. The model computations were performed with full nudging (using ERA5) to the observed meteorological data to verify the capability of the model to trace beryllium isotopes in the atmosphere. The model computations were directly compared with measurements of 7Be isotopes in different high-latitude locations to validate the model.
The paper is organized as follows: a summary of the previous and existing models is presented in Sect. 2; data from 7Be measurements are presented in Sect. 3; the model is described in great detail in Sect. 4; obtained results are discussed in Sect. 5; validation of the model by means of comparisons with measurements is presented in Sect. 6; Sect. 7 summarizes conclusions of the paper.
Studies of the short-living 7Be isotope and its ratio to 10Be provide a precise way to probe large-scale atmospheric dynamical properties and validate the corresponding atmospheric models (e.g., Raisbeck et al., 1981; Jordan et al., 2003; Ioannidou and Paatero, 2014). For the long-living 10Be isotope, different transport and deposition assumptions as well as models were used (e.g., McCracken, 2004; Heikkilä et al., 2009; Sukhodolov et al., 2017; Usoskin et al., 2020a). Here we review some key models.
Earlier simulations with the transport model GLOMAC1 by Brost et al. (1991) yielded the concentration and deposition of 7Be isotopes in agreement with the data within 20 %. However, the authors conclude that the application of this transport model and scavenging scheme for simulations of deposition and concentration was not well suited for polar regions.
Later, simulations of 7Be and 10Be transport for present and future climatic conditions were performed by Land and Feichter (2003) with the general circulation model MA-ECHAM4. The model successfully captured the maximum 10BeBe ratio in the lower polar stratosphere.
The general ability of a full atmospheric–dynamic model to reproduce the pattern of beryllium transport and deposition even at regional spatial and synoptic temporal scales was demonstrated by Usoskin et al. (2009a), who used the GISS model (Field et al., 2006) to simulate 7Be production and transport for the 2 months of January–February 2005 and compared the model's results with daily-resolution near-ground 7Be air concentrations measured at 11 sites worldwide (see Table 1 in Usoskin et al., 2009a). The results implied that the model captures 7Be transport at synoptic and longer timescales (longer than 4–10 d; see Fig. 5 in Usoskin et al., 2009a) in both absolute levels and time variability. However, as noted by Koch et al. (2006), the GISS model has a low bias (a factor of two) in the upper troposphere and lower stratosphere, while agreeing well with the surface concentrations. It was proposed that this can be related to model production that is too low and the fact that either the model delivers too much 7Be to the surface or does not scavenge efficiently enough. The GISS model was not further developed in this direction.
Modeling of beryllium isotopes in the Earth's atmosphere was performed earlier using the ECHAM5-HAM atmospheric model (Heikkilä et al., 2008a, 2009) and zonal mean production rates. Cosmogenic radionuclides 10Be and 7Be were modeled during the Maunder Minimum and the present-day climate (Heikkilä et al., 2008b). ECHAM5-HAM simulates beryllium fluxes and concentrations in ice at Greenland sites well, in agreement with the data. In Antarctica, however, the model has some difficulties in reproducing the very low level of precipitation, which leads to an underestimation of the 10Be concentrations in ice. The precipitation rate modeled at the Concordia site was a factor 2–3 too high, leading to 10Be concentrations in ice that are too low, since, after full depletion of 10Be from the atmosphere, further rain or snow dilutes its concentration in the ice. The 7Be surface air concentrations generally agree within a factor of 2 with the observed concentrations. However, modeled concentrations at two Antarctic stations appeared too low. This model was very roughly parameterized (Heikkilä et al., 2013), being effectively reduced to a six-box model and not developed further in the application to beryllium transport modeling.
A simplified 2D model of beryllium stratospheric sedimentation was developed by Delaygue et al. (2015) but also not supported further.
Even though a full modeling can be done, transport of 7Be is typically considered, for application purposes, with simple box–reservoir exchange models (e.g., Pacini et al., 2015; Zheng et al., 2021) or with air-mass tracing codes (Pacini et al., 2011; Brattich et al., 2020).
In chemical transport models, wind and temperature values are taken from either (1) general circulation models or from (2) meteorological data. The advantage of the second approach is that chemical transport simulations are linked to real meteorology and the results are inherently compared to observations. Reanalysis extends meteorological data to the past. This allows us to perform long-term simulations which show temporal evolution of the atmosphere's composition. The success of such a task relies on the reanalysis quality, i.e., on the accuracy of the indicator's distributions. This also makes chemical transfer models a powerful tool for evaluating the reanalyses themselves (Monge-Sanz and Chipperfield, 2006).
The Global Modeling Initiative (GMI) chemistry and transport model (a model with prescribed meteorology) driven by NASA's MERRA assimilated meteorological data was applied to understand the roles of transport and precipitation scavenging processes using the cosmogenic 7Be tracer (Brattich et al., 2017). The model results agree reasonably well with the 7Be data in general but diverge by a factor of 2 for warm periods. The discrepancy was ascribed to the model's insufficiently detailed spatial sampling.
The approach based on prescribed meteorology is applicable only to recent years when the wind field is known; moreover, it includes neither stratospheric dynamics nor depositional processes and is therefore not suitable for 10Be in polar ice.
Thus, several models of different complexity and accuracy have been developed in the recent past to model transport and deposition of 7Be and 10Be. However, due to the lack of support for radionuclide simulations with the ECHAM-HAM (Heikkilä et al., 2008b) and GISS (Field et al., 2006) climate models, a full working model capable of simulating production, transport, and deposition of 7Be and 10Be from all sources is presently missing. The model should be “user-friendly” (i.e., for a user without deep knowledge of climate modeling) and applicable for past or future projections when direct nudging to the meteorological reanalysis data is not possible.
Here we present a new version of CCM SOCOL – CCM SOCOL-AERv2-BE – for modeling of production, transport, and deposition of the cosmogenic isotopes of beryllium as well as its validation with the available measurements of 7Be at high-latitude locations. CCM SOCOL is potentially capable of simulating the beryllium transport and deposition and was already used (Sukhodolov et al., 2017; Usoskin et al., 2020a) for the estimation of 10Be deposition after major solar energetic particle (SPE) events, but it did not include the state-of-the-art interactive parameterization of the wet and dry deposition introduced recently (Feinberg et al., 2019). A recent model version of CCM SOCOL that simulates aerosols more realistically, however, does not include the treatment of all processes relevant to the beryllium life cycle, and its applicability has not been evaluated. We have further upgraded CCM SOCOL (Feinberg et al., 2019) here by adding the production, transport, and deposition of 7Be and 10Be isotopes from both GCRs and SPEs.
For the model verification, we used data on the measured activity (concentration) of the 7Be isotope in near-ground air, with weekly sampling (corrected for the decay) performed in different hemispheres for the period 2002–2008. Higher-time-resolution data are not necessary for several reasons: (i) data availability, since weekly sampling is a standard resolution for most 7Be-measuring stations; (ii) inability of full atmospheric–dynamic models to catch the sub-synoptic timescales because of the rough grid size (see Heikkilä et al., 2009; Usoskin et al., 2009b); and (iii) focus on longer timescales (annual and interannual) for the application to 10Be in ice cores. On the other hand, rougher-resolution data (e.g., monthly or quarterly) are more uncertain because of the decay of short-living 7Be. Thus, we found the weekly-resolution data to be optimal for our purposes.
Traditionally, for short-living isotopes, the measured quantity is not concentration but activity in units of becquerels (number of radioactive decays per second) per cubic meter of air (Bq m−3), as directly measured by a γ spectrometer. Correction for decay between the times of sample collection and measurement is standardly performed (see Leppänen et al., 2012). The activity and concentration can be easily translated to each other using the known lifetime of the isotope.
Table 1List of stations whose data were used for the present study. Data sources are the Finnish National Radiation and Nuclear Safety Authority (STUK), the Radiation Protection Bureau of Health Canada (RPBHC), and the Comprehensive Nuclear Test-Ban-Treaty Organization (CTBTO).
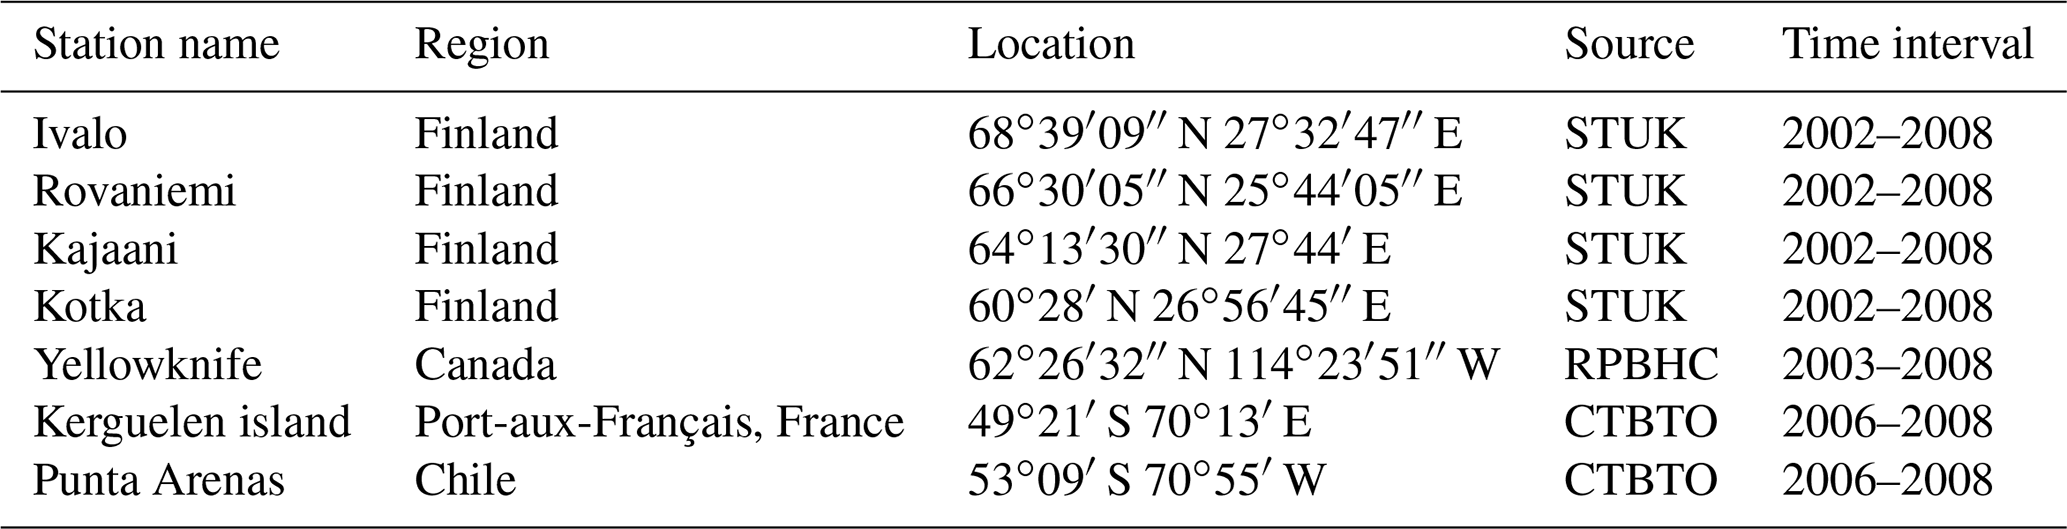
Here we use data from four nearly antipodal high-latitude locations (see Table 1). Two locations are in the Northern Hemisphere in Finland (a set of stations) and Canada (Yellowknife), and two are in the Southern Hemisphere: Kerguelen island (French) and Punta Arenas (Chile). The longitudinal separation between the locations in each hemisphere is greater than 140∘. The data series are shown in Fig. 1 and described below.

Figure 1Datasets of 7Be activity in the near-ground air used in this study, including (panels a through d, respectively) Finland (a composite of four stations), Yellowknife (Canada), Punta Arenas (Chile), and Kerguelen island (France) – see detailed information in Table 1. The measured and modeled activities are shown as solid red and dashed blue curves, respectively.
Finnish data on the measured 7Be activity were provided for the period 2002–2008 by the Finnish National Radiation and Nuclear Safety Authority (STUK) for four sites (see Table 1): Ivalo, Rovaniemi, Kajaani, and Kotka, spanning meridionally 8∘ in latitude. The isotope of 7Be was collected on air filters using a high-volume air sampler on a weekly basis, and then its activity was measured with an HPGe (high-purity germanium) detector inside a 4 in. thick lead shielding in the STUK laboratory. The statistical measurement uncertainty is 3 %–5 % (see a detailed description of the sampling and measurement procedure in Leppänen et al., 2012). The data from the four stations were combined as the average of the four locations for each time interval to represent a regional-scale dataset, as shown in Fig. 1a.
We also used 7Be data from the Yellowknife site (Canada; see Fig. 1b) kindly provided by the Radiation Protection Bureau of Health Canada. The original data are with daily time resolution but have been combined into weekly samples (correction for decay applied) for consistency with other datasets. The total uncertainty for the measured 7Be activity is defined mostly by statistics and is approximately 7 %–8 %.
For the Southern Hemisphere, we considered weekly 7Be activities measured at Punta Arenas (Chile, CTBTO station code CLP18). During 2002–2006, the data contain many long breaks (about half of weekly data are missing), and hence we considered data since October 2006 only, as shown in Fig. 1c.
Another Southern Hemisphere station is located at Port-aux-Français, Kerguelen island (CTBT station code FRP30), with data available since 2006 (Fig. 1d). The data for Punta Arenas and Kerguelen island were obtained via the virtual Data Exploration Centre (vDEC) of the Preparatory Commission for the Comprehensive Nuclear Test-Ban-Treaty Organization (CTBTO). A full description of the sampling and measurement of the CTBTO data is available elsewhere (Miley et al., 1998; Medici, 2001).
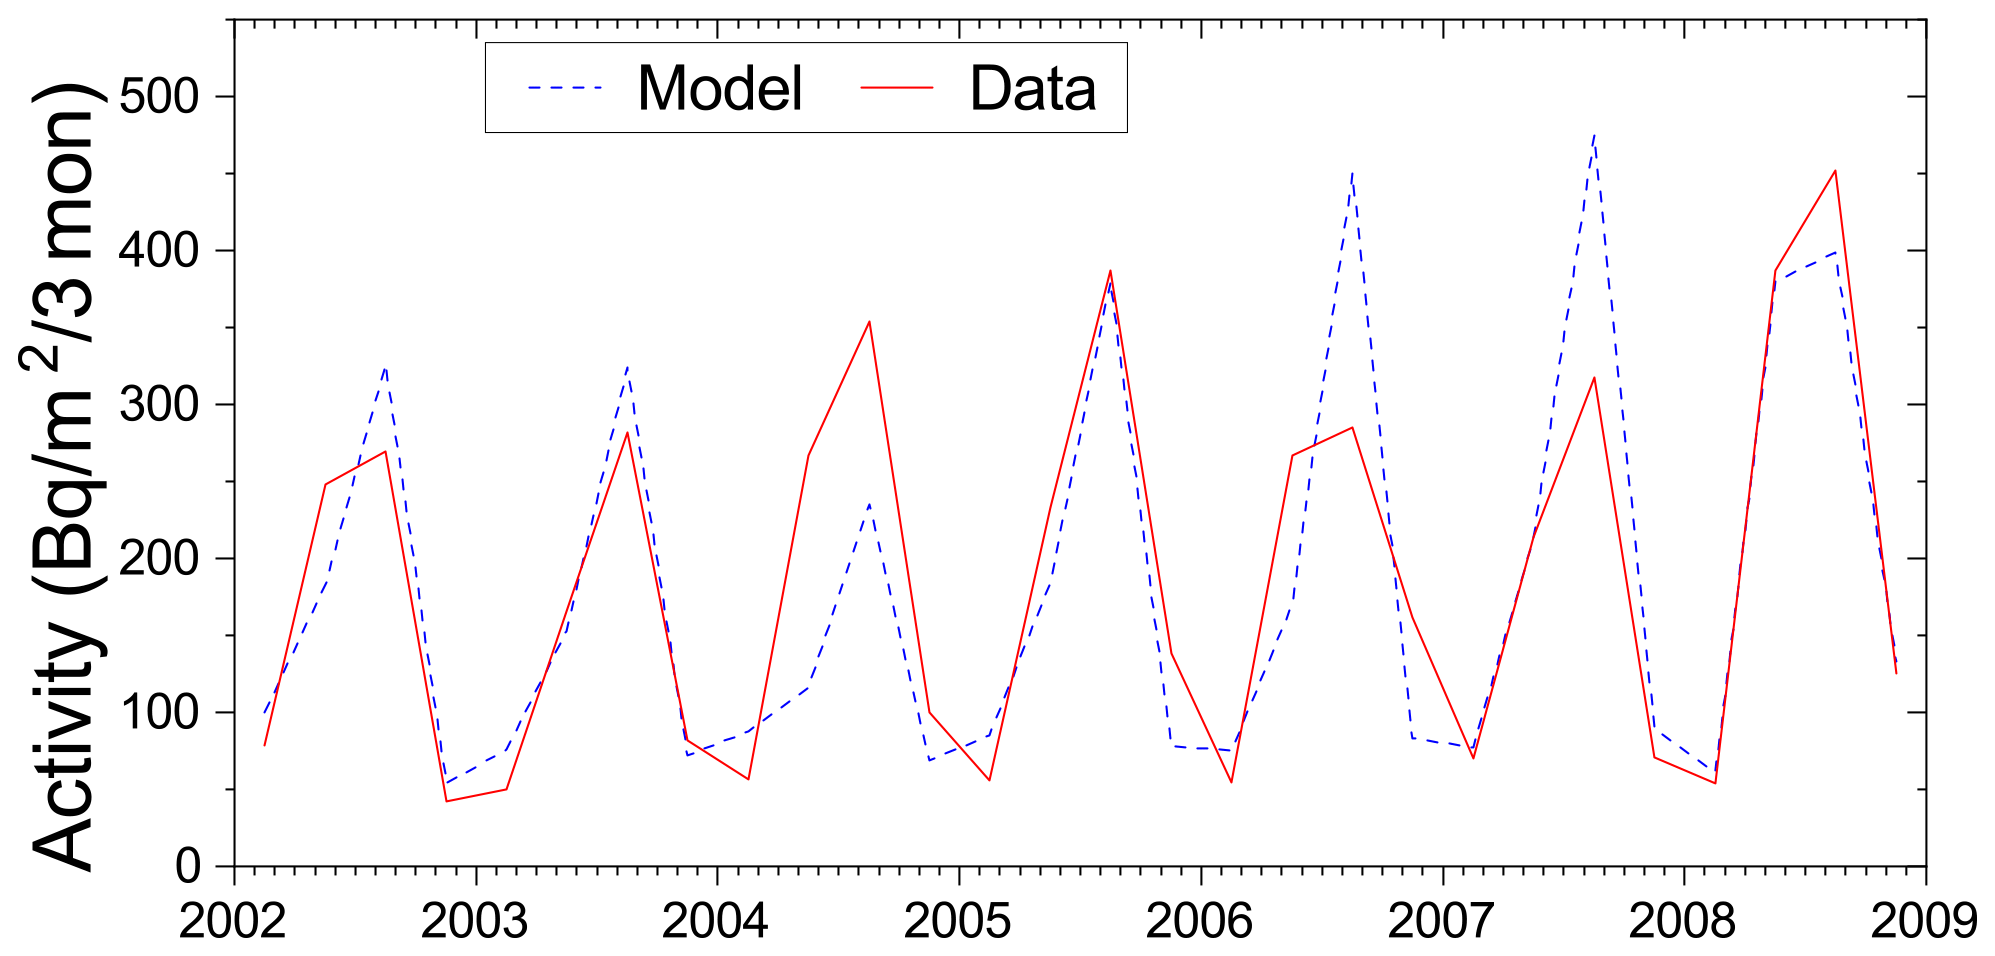
Figure 2Quarterly total deposition of 7Be at northern Finland stations (Ivalo and Rovaniemi) for the period 2002–2008. The blue dashed line represents the total modeled deposition, while the red line depicts the measured data.
In addition to 7Be activity measured in near-ground air, we also exploited data on the quarterly total-deposition 7Be measurements (without separating dry and wet depositions) measured in collected precipitation water at Rovaniemi and Ivalo stations, as provided by STUK. The fallout sample collection period was 1 month, but the three samples were combined together to form a quarterly sample. Hence, the four measured samples for each year cover the period of January to March, April to June, July to September, and October to December. The reference date was set to the middle of the sampling period (since the decay time of 7Be is shorter than the sampling interval) and the activities were decay-corrected to this date (see Leppänen, 2019). The 7Be deposition averaged over the two locations is shown in Fig. 2.
We used an extended version of CCM SOCOL (Stenke et al., 2013) with the aerosol module – AERv2 (Feinberg et al., 2019). This version consists of the general circulation model MA-ECHAM5 (Hommel et al., 2011) and the atmospheric chemistry module MEZON (Egorova et al., 2003) combined with an aerosol module AER (Weisenstein et al., 1997), interacting with each other every 2 h of modeling. In this study, MA-ECHAM5 is nudged with fifth-generation ECMWF atmospheric reanalysis data from the global climate ERA5 (eraiaT42L39) reanalyses. The chemical part of the MEZON core includes 56 chemical species of oxygen, hydrogen, nitrogen, carbon, chlorine, bromine, and sulfur groups, 295 gas-phase reactions, 64 photolysis reactions, and 16 heterogeneous reactions on stratospheric aqueous sulfuric acid aerosols as well as three types of polar stratospheric clouds. CCM SOCOL-AERv2-BE uses the horizontal resolution T42, where T refers to triangular truncation and the number denotes the series of spherical harmonics. The horizontal resolution is about ( km in the equatorial region). The vertical grid is defined using a sigma-hybrid coordinate system, which is calculated by a linear combination of surface pressure and constant coefficients that define the vertical coordinate. The model has 39 vertical levels between the Earth's surface and the 0.01 hPa level (≈80 km). The real orography is smoothed over the model grid cells. The aerosol module exploits a sectional microphysical scheme whereby the aerosol particle size distribution is represented by 40 discrete size bins. The model simulates the advective transport of stratospheric aerosol by the Brewer–Dobson large-scale circulation (Butchart, 2014) and gravitational sedimentation. We have made some adaptations of the main model to focus on beryllium transport, as described below.
4.1 Production rates of 7Be
Production of both 7Be and 10Be was computed using the CRAC : Be (Cosmic Ray Atmospheric Cascade: application to Beryllium) model (Poluianov et al., 2016), which is the most recent and accurate model of cosmogenic isotope production. This model simulates, using the GEANT4 Monte Carlo simulation tool (Geant4 collaboration, 2020), the full nucleonic–muon–electromagnetic cascade induced by primary cosmic-ray particles in the atmosphere. This model is an essential upgrade of the previous versions of the CRAC : Be model (Usoskin and Kovaltsov, 2008; Kovaltsov and Usoskin, 2010) based on the CORSIKA simulation tool (Heck et al., 1998). The CRAC model presents a set of accurately computed yield functions of production of cosmogenic isotopes for different primary particle types, energy, and atmospheric depths. By a numerical integration above the local geomagnetic rigidity cutoff (Cooke et al., 1991) of the product of the yield function and the known (or assumed) energy spectrum of primary cosmic rays (of either GCR or SPE origin), one can obtain the isotope's production rate as a function of location (via the geomagnetic rigidity cutoff), atmospheric height (via the yield function), and time (via the time-variable energy spectrum). These production rates, computed for each location and with hourly temporal time resolution, were used as input for CCM SOCOL-AERv2-BE, providing a 3D + time source of the 7Be and 10Be in the atmosphere.
Production due to galactic cosmic rays (GCRs), which always bombard the Earth with slightly variable intensity due to solar modulation, was computed by applying the force-field model (Gleeson and Axford, 1968) with the modulation potential reconstructed from the World Neutron Monitor Network (Usoskin et al., 2017). The geomagnetic field was taken according to the International Geomagnetic Reference Field model (IGRF; Thébault et al., 2015) in the eccentric dipole approximation (Fraser-Smith, 1987; Usoskin et al., 2010). While GCRs are always present near Earth, sporadic solar particle events (SPEs) take place occasionally (Vainio et al., 2009; Desai and Giacalone, 2016) and can be sufficiently strong to be recorded by ground-based neutron monitors (Raukunen et al., 2018; Usoskin et al., 2020b). A large number of cosmogenic isotopes can be produced during such events (Usoskin et al., 2020a), which can be several orders of magnitude stronger on the multimillennial timescale than for the last decades covered by direct observations, with strong signals in the polar 10Be concentrations (e.g., Sukhodolov et al., 2017). To model the contribution of severe SPEs, we modeled the production of beryllium by the SPE on 20 January 2005 (GLE no. 69), which was the strongest event during the studied period (1996–2008) and the second strongest directly observed (1951–2020). The same yield function and geomagnetic cutoff approach as for GCR were applied along with the SPE energy spectrum obtained for this event by Koldobskiy et al. (2021). To study the possible effect of seasonality on the 7Be and 10Be transport we simulated the same SPE event as if it occurred not only on its actual date in midwinter (20 January 2005) but also mid-spring, summer, and autumn (20 April, 20 July, and 20 October 2005, respectively).
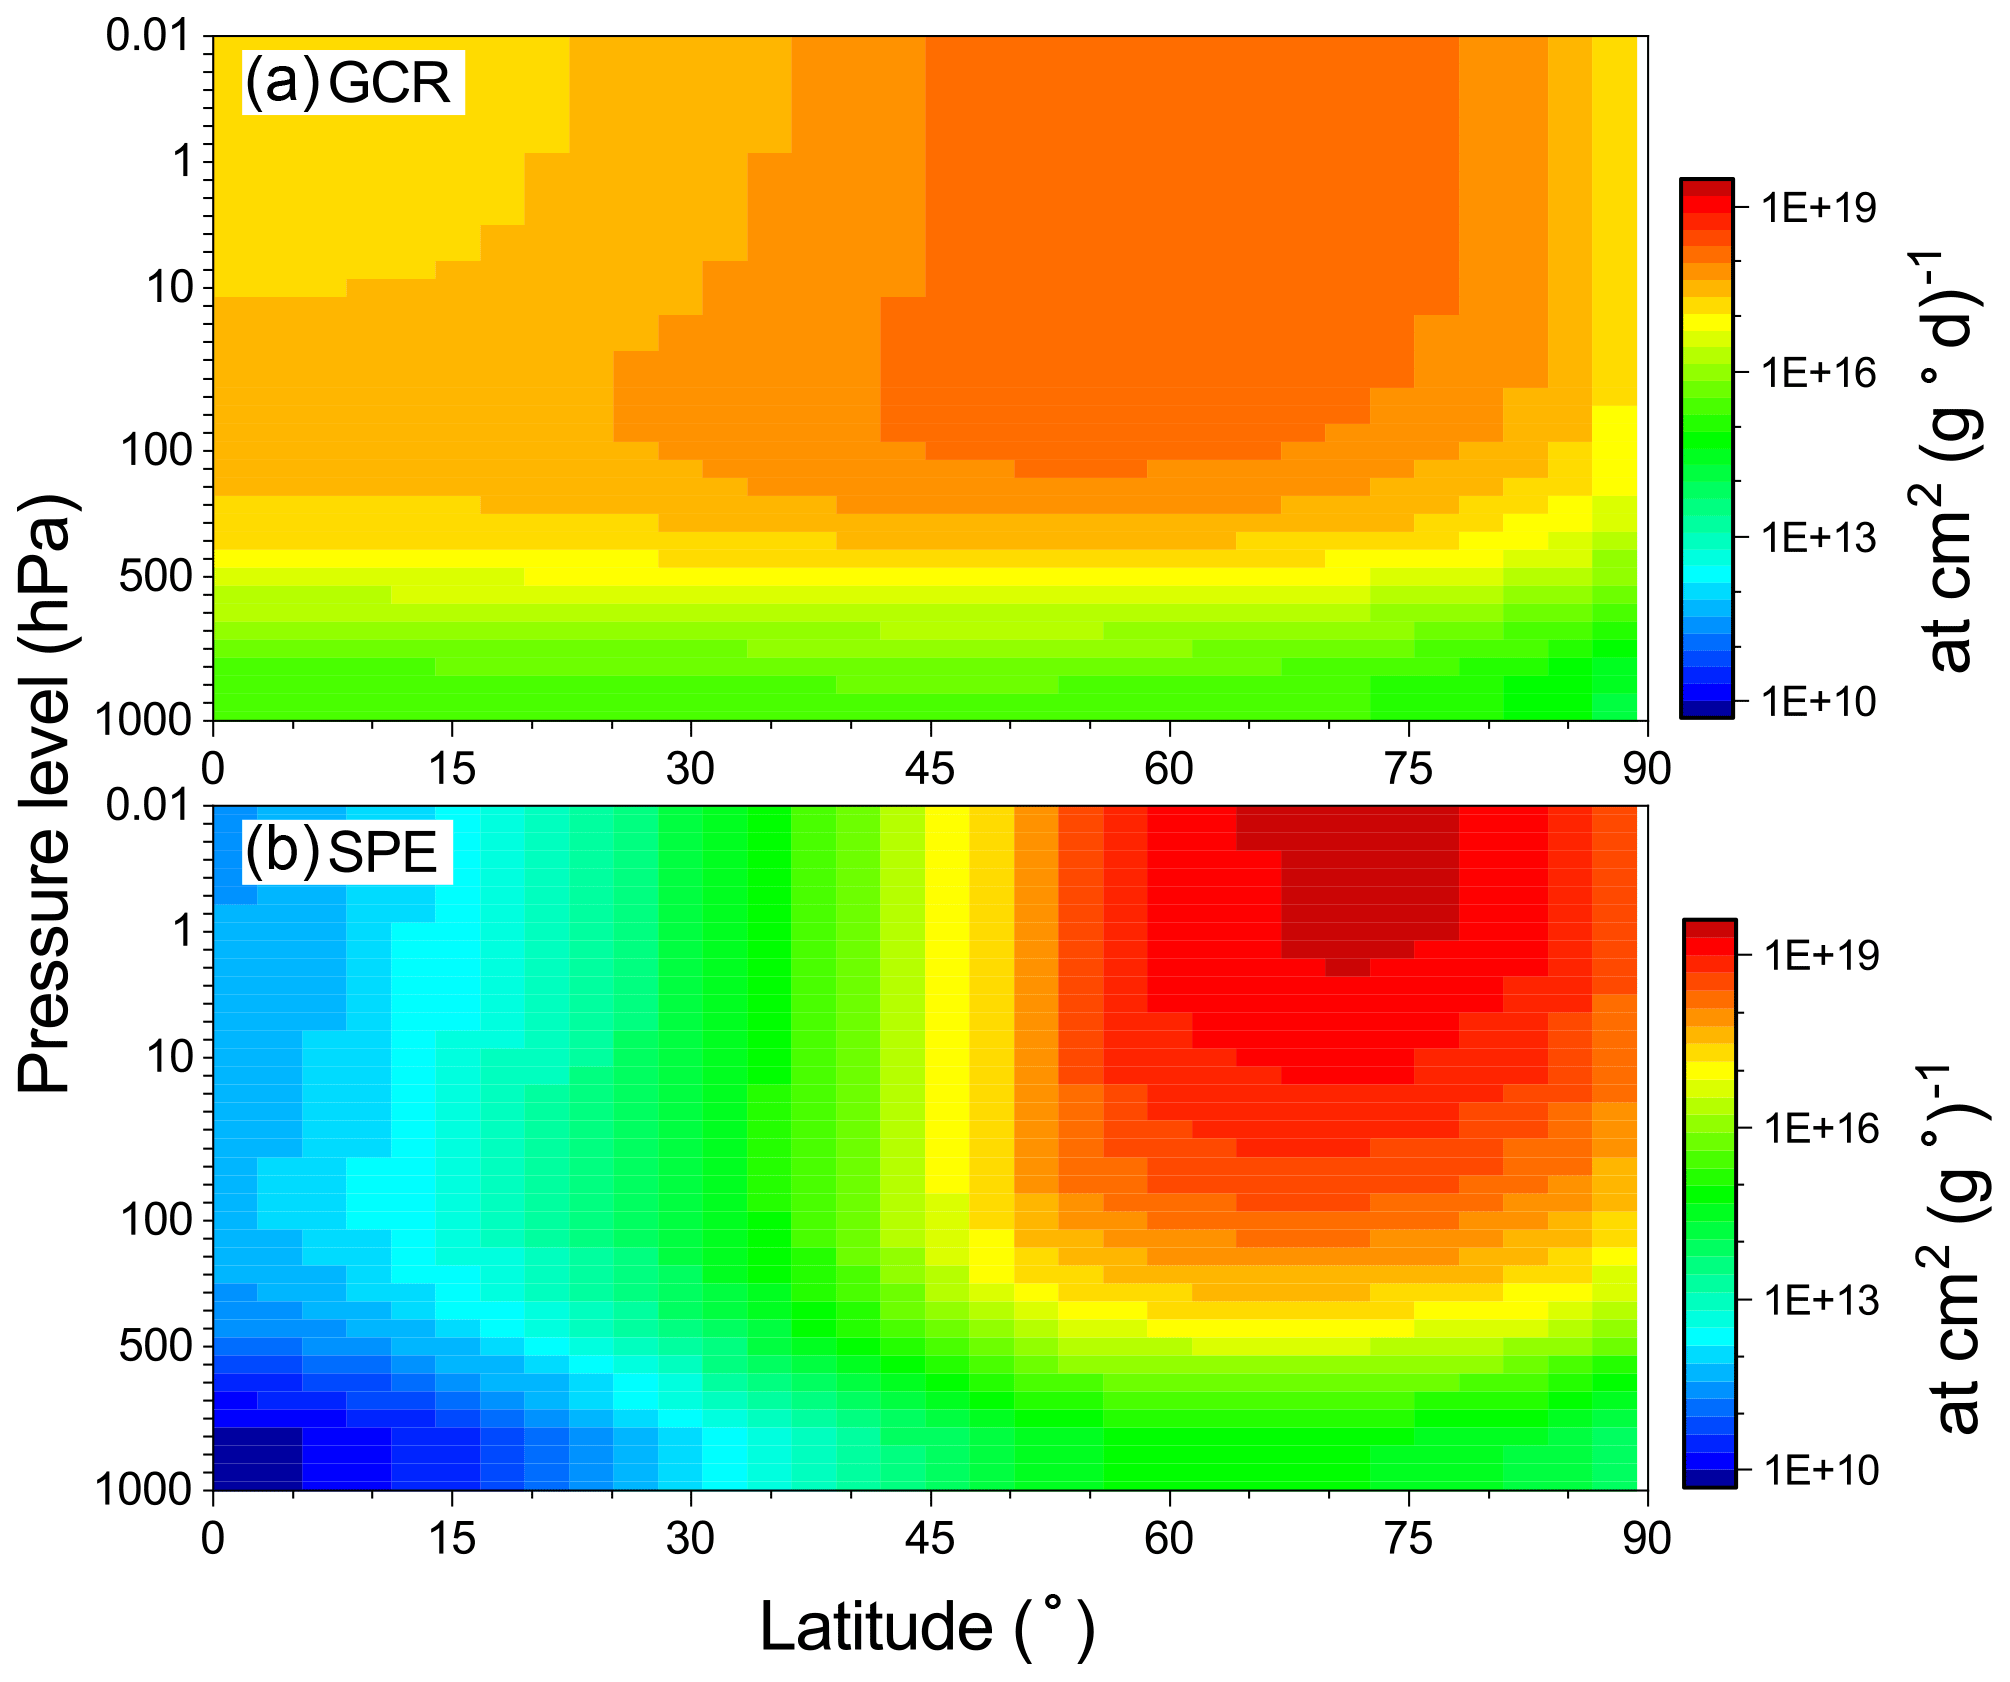
Figure 3Zonal mean production of 7Be in the Northern Hemisphere as a function of geographical latitude and the model's atmospheric pressure level. (a) Daily production by GCRs averaged over the period of 2002–2008. The color scale (on the right) is given in units of atoms per day per degree of latitude per gram per square centimeter (g cm−2). (b) Total production by SPE on 20 January 2005. The color scale is in units of atoms per degree of latitude per gram per square centimeter (g cm−2).
Figure 3 shows the zonal mean production of 7Be as a function of the atmospheric pressure and northern geographical latitude from two sources: daily GCRs (panel a) and SPEs (panel b). Since the duration of a strong SPE takes several hours, we compare it with the daily production of 7Be by GCR. One can see that the polar stratospheric production due to SPE grossly overwhelms that by the daily GCR flux, but it fades towards tropical latitudes. Since the production of 7Be is nearly symmetric between the global hemispheres, as defined by the geomagnetic shielding, only the Northern Hemisphere is shown. Even though the production rate is significantly higher in the polar region, its contribution to the global production is not dominant because of the small area of the polar regions. For the GCR-related production, the dominant production region is located in the middle- to high-latitude (40–70∘) stratosphere and upper troposphere (above 400 hPa level or ≈7 km). Production of 7Be by SPEs is confined to the polar (latitude >55∘) upper stratosphere and mesosphere (above 50 hPa level or ≈35 km). Hardly any beryllium nuclei are produced by SPEs in the tropical region. In all cases, the maximum of production lies at middle to high latitudes in the stratosphere, and the production decreases towards the surface because of the increasing atmospheric depth and equatorward due to the geomagnetic shielding. Because of the much softer energy spectrum, SPEs produce 7Be at shallower atmospheric depths and higher latitudes than GCRs do. The production pattern for 10Be is similar to that for 7Be but with smaller absolute values.
4.2 Decay of 7Be
7Be is a short-living isotope whose decay cannot be neglected in comparison with the typical transport and deposition time, especially in the stratosphere, in contrast to the long-living 10Be isotope. Accordingly, a standard decay probability of 0.054 % per hour (corresponding to the isotope's mean half-life of 53.22 d) was applied during tracing of 7Be in a way similar to that used by Golubenko et al. (2020) for 222Rn. No decay needs to be applied to 10Be for this kind of modeling. Figure 4 shows the modeled global content of the two beryllium isotopes in the atmosphere after an instant production by the SPE event on 20 January 2005 (day zero). One can see that the amount of 10Be decreases nearly exponentially, reflecting a slow removal of the isotope through precipitation. The typical time of the isotope removal is d, implying a residence time of a few years (e.g., Beer et al., 2012). This time is comparable to the 1–2-year atmospheric residence time of other isotopes (e.g., 137Cs and 241Am) defined after nuclear weapon tests (Haltia et al., 2021). The decrease in the 7Be isotope concentration is much faster and nearly perfectly exponential with d, which includes both decay and removal. Since the removal process is assumed to be identical for both isotopes, the concentrations of 10Be can be used to correct the 7Be decay for the system effects. The decay time of 7Be estimated in this way is as d, which is generally consistent with the expected e-folding lifetime of 7Be of 77 d, implying that the decay was accounted for correctly in the model. Thus, the 7Be isotope is fully removed from the atmosphere, mostly due to decay, within several months.
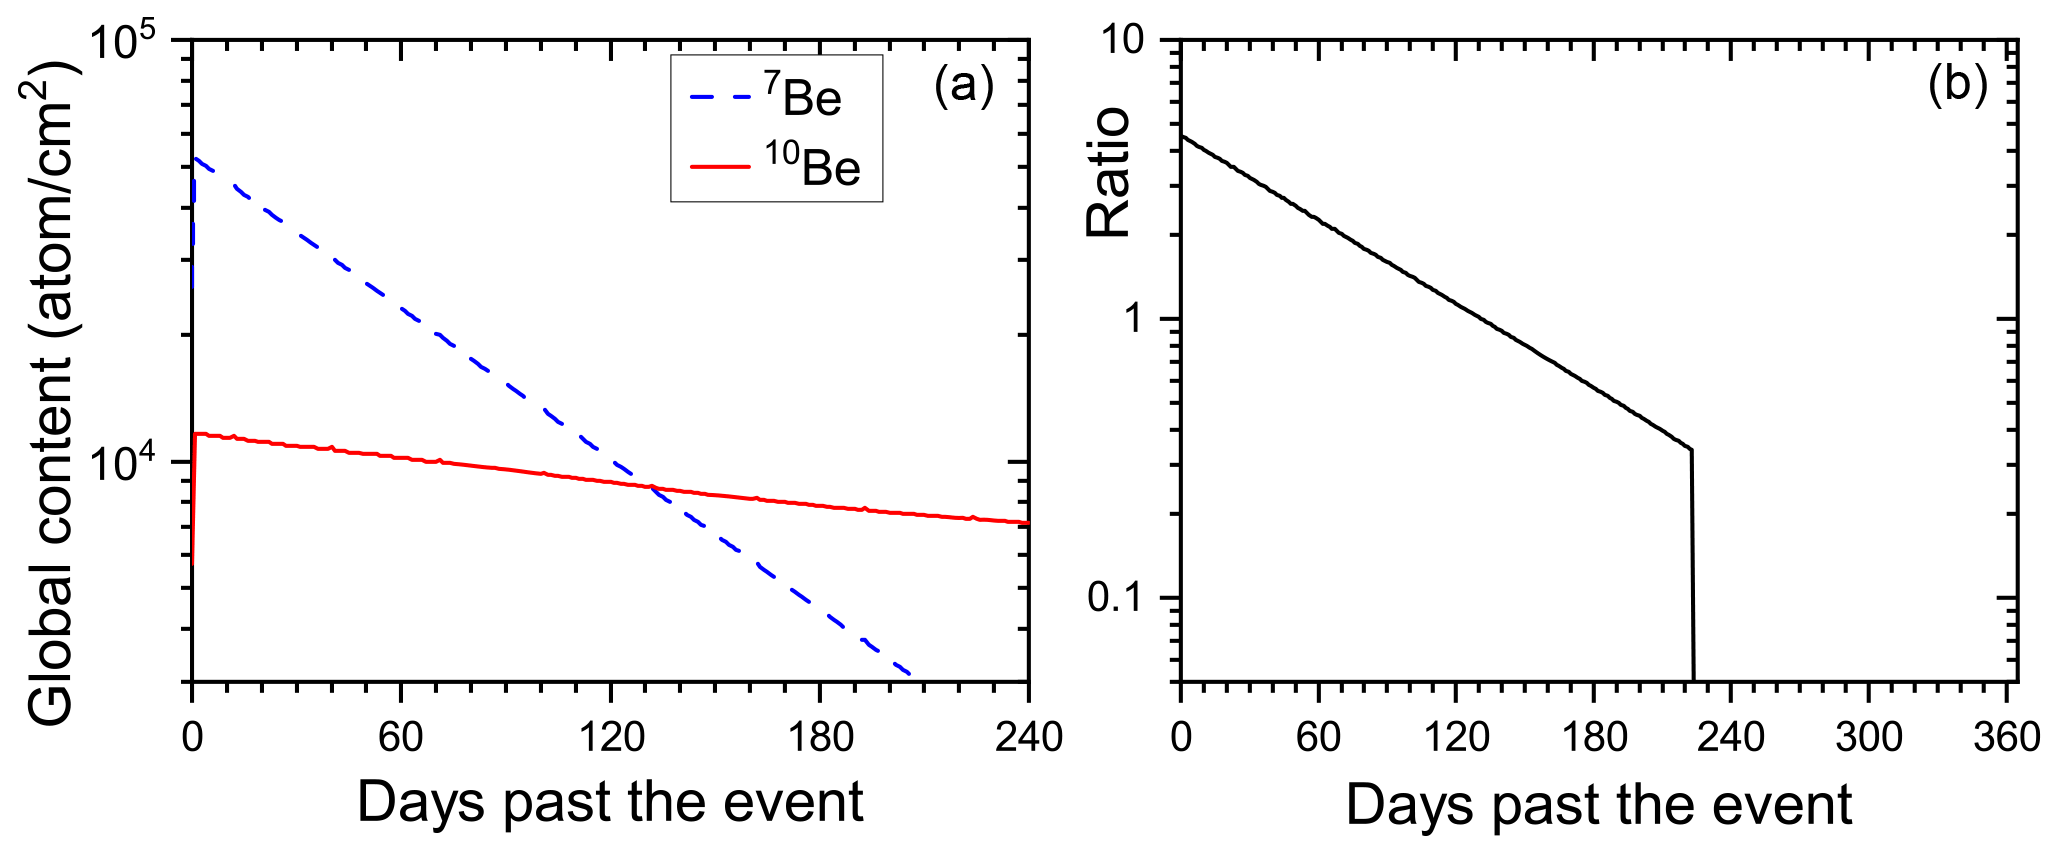
Figure 4Computed global mean columnar content of two beryllium isotopes, 7Be and 10Be, produced by SPE on 20 January 2005 (day zero) as a function of time. The nearly exponential decay of the concentration ( d and 72±2 d for 10Be and 7Be, respectively) includes both decay and sink (deposition) of the isotopes.
4.3 Transport of cosmogenic isotopes 7Be and 10Be
Beryllium atoms are captured by different aerosols in the air that can enhance or suppress its transport by gravitational sedimentation. Since the typical size of aerosol particles is less than 0.2 µm (Pierce et al., 2010), with a modal value of 0.05 µm, the corresponding gravitational sedimentation velocity ranges between 200 and 1000 m yr−1 and does not play an important role in the lower stratosphere, where it is much smaller than the vertical wind speed (e.g., Weisenstein et al., 2015; Zhou et al., 2006). The role of gravitational sedimentation was evaluated by Delaygue et al. (2015) using numerical experiments with a 2D model, which includes detailed sulfate aerosol microphysics. By comparing no-gravitational-sedimentation and reference model runs, they concluded that “sedimentation of 7Be atoms does not seem to play an important role in removing 7Be out of the stratosphere, because radioactive decay and transport are faster processes”. The marginal importance of gravitational settling and identical transport of isotopes in gas and aerosol forms was also described in the seminal work of Lal and Peters (1967). It should be noted that we treat 7Be as a passive tracer only for the advective transport when the result is the same for the small particles and gas components.
Different processes such as stratospheric mixing, stratosphere–troposphere exchange, and tropospheric transport and deposition are realistically modeled by CCM SOCOL (Feinberg et al., 2019). In this study, the advective transport of 7Be and 10Be as passive tracers was performed using flux-form semi-Lagrangian transport schemes (Lin and Rood, 1996) embedded in ECHAM5.
Beryllium is also transported vertically by deep, shallow, and mid-level convective motions. The transport is defined by the convective mass fluxes of the standard grid-box ECHAM5 convection scheme described by Tiedtke (1989) and Nordeng (1994). The transport parameterization by mixing in the boundary layer is based on the eddy diffusion method, and the vertical turbulent fluxes are related to the gradient of the considered quantity (Roeckner et al., 2003).
4.4 Deposition of 7Be and 10Be
Dry deposition is typically modeled using a simplified approach that assumes constant dry deposition velocities over land and ocean, without accounting for seasonal or geographical variability. The tropospheric washout of gases can be calculated by using a constant removal rate, irrespective of precipitation occurrence (Hauglustaine et al., 1994). CCM SOCOL-AERv2-BE employs a more sophisticated scheme based on the surface resistance approach for the estimation of dry deposition velocities (Wesely, 1989). Deposition of beryllium isotopes is parameterized as a function of surface properties, solubility, and reactivity of the considered species (Kerkweg et al., 2006a). These properties for the modeled beryllium are identical to those for small sulfate aerosols. It means that beryllium atoms are considered passive tracers only for the transport process, while with respect to the dry and wet deposition, they are treated as sulfates. The applied dry deposition scheme also considers the actual meteorological conditions and different surface types.
The interactive wet deposition scheme used in CCM SOCOL-AERv2-BE exploits the EAYSY2 version of the Scavenging (SCAV) submodule in the ECHAM/MESSy Atmospheric Chemistry (EMAC) model. A detailed description of the interactive wet deposition scheme is presented and discussed elsewhere (Kerkweg et al., 2006b; Tost et al., 2007, 2010). The parameterization is based on the model-generated available liquid water in (cloud water content) and below (precipitating water) clouds as well as uptake and release form droplets, which depends on the concentration and solubility of the considered species. Scavenging coefficients for all tracers are calculated based on Henry's law equilibrium constants. The Henry constants for beryllium are considered identical to those of small sulfate aerosols.
4.5 Setup of numerical experiments
Since 10Be is removed from the stratosphere via stratosphere–troposphere exchange and the stratospheric mixing time is long (a few years), we have performed a 6-year spin-up of the model for the period 1996–2001 to allow 10Be to reach equilibrium conditions. For 7Be, such a long spin-up is not needed since it is mostly removed from the atmosphere by decay, but we kept it similar to 10Be for consistency. After the spin-up period, we initiated a 7-year (2002–2008) run with full nudging (a linear relaxation of thermodynamic parameters: temperature, divergence, and vorticity of the wind field). In this way, we can validate the model by comparing the results with the measurements.
5.1 Global patterns of 7Be transport and deposition
Figure 5 shows the zonal mean concentration of 7Be averaged over the boreal summer and winter for 2002–2008, as modeled here. While the isotope production is symmetric between the hemispheres, the concentrations are not completely symmetric and depend on the large-scale circulation patterns, which are different in the summer and winter hemispheres (Terzi et al., 2020). The stratospheric meridional transport is driven by forces from the breaking planetary, synoptic-scale, and gravity waves. Stratospheric air ascends inside the so-called tropical pipe and then moves poleward, descending at middle and high latitudes, predominantly in the winter hemisphere where a more intensive stratosphere–troposphere exchange leads to slightly smaller concentrations of the 7Be in the stratosphere during the cold seasons. Lower-stratospheric air descends relatively fast over the middle latitudes at which the stratosphere–troposphere exchange is fast, while at high latitudes it resides longer in the lower stratosphere (Cohen et al., 2014).
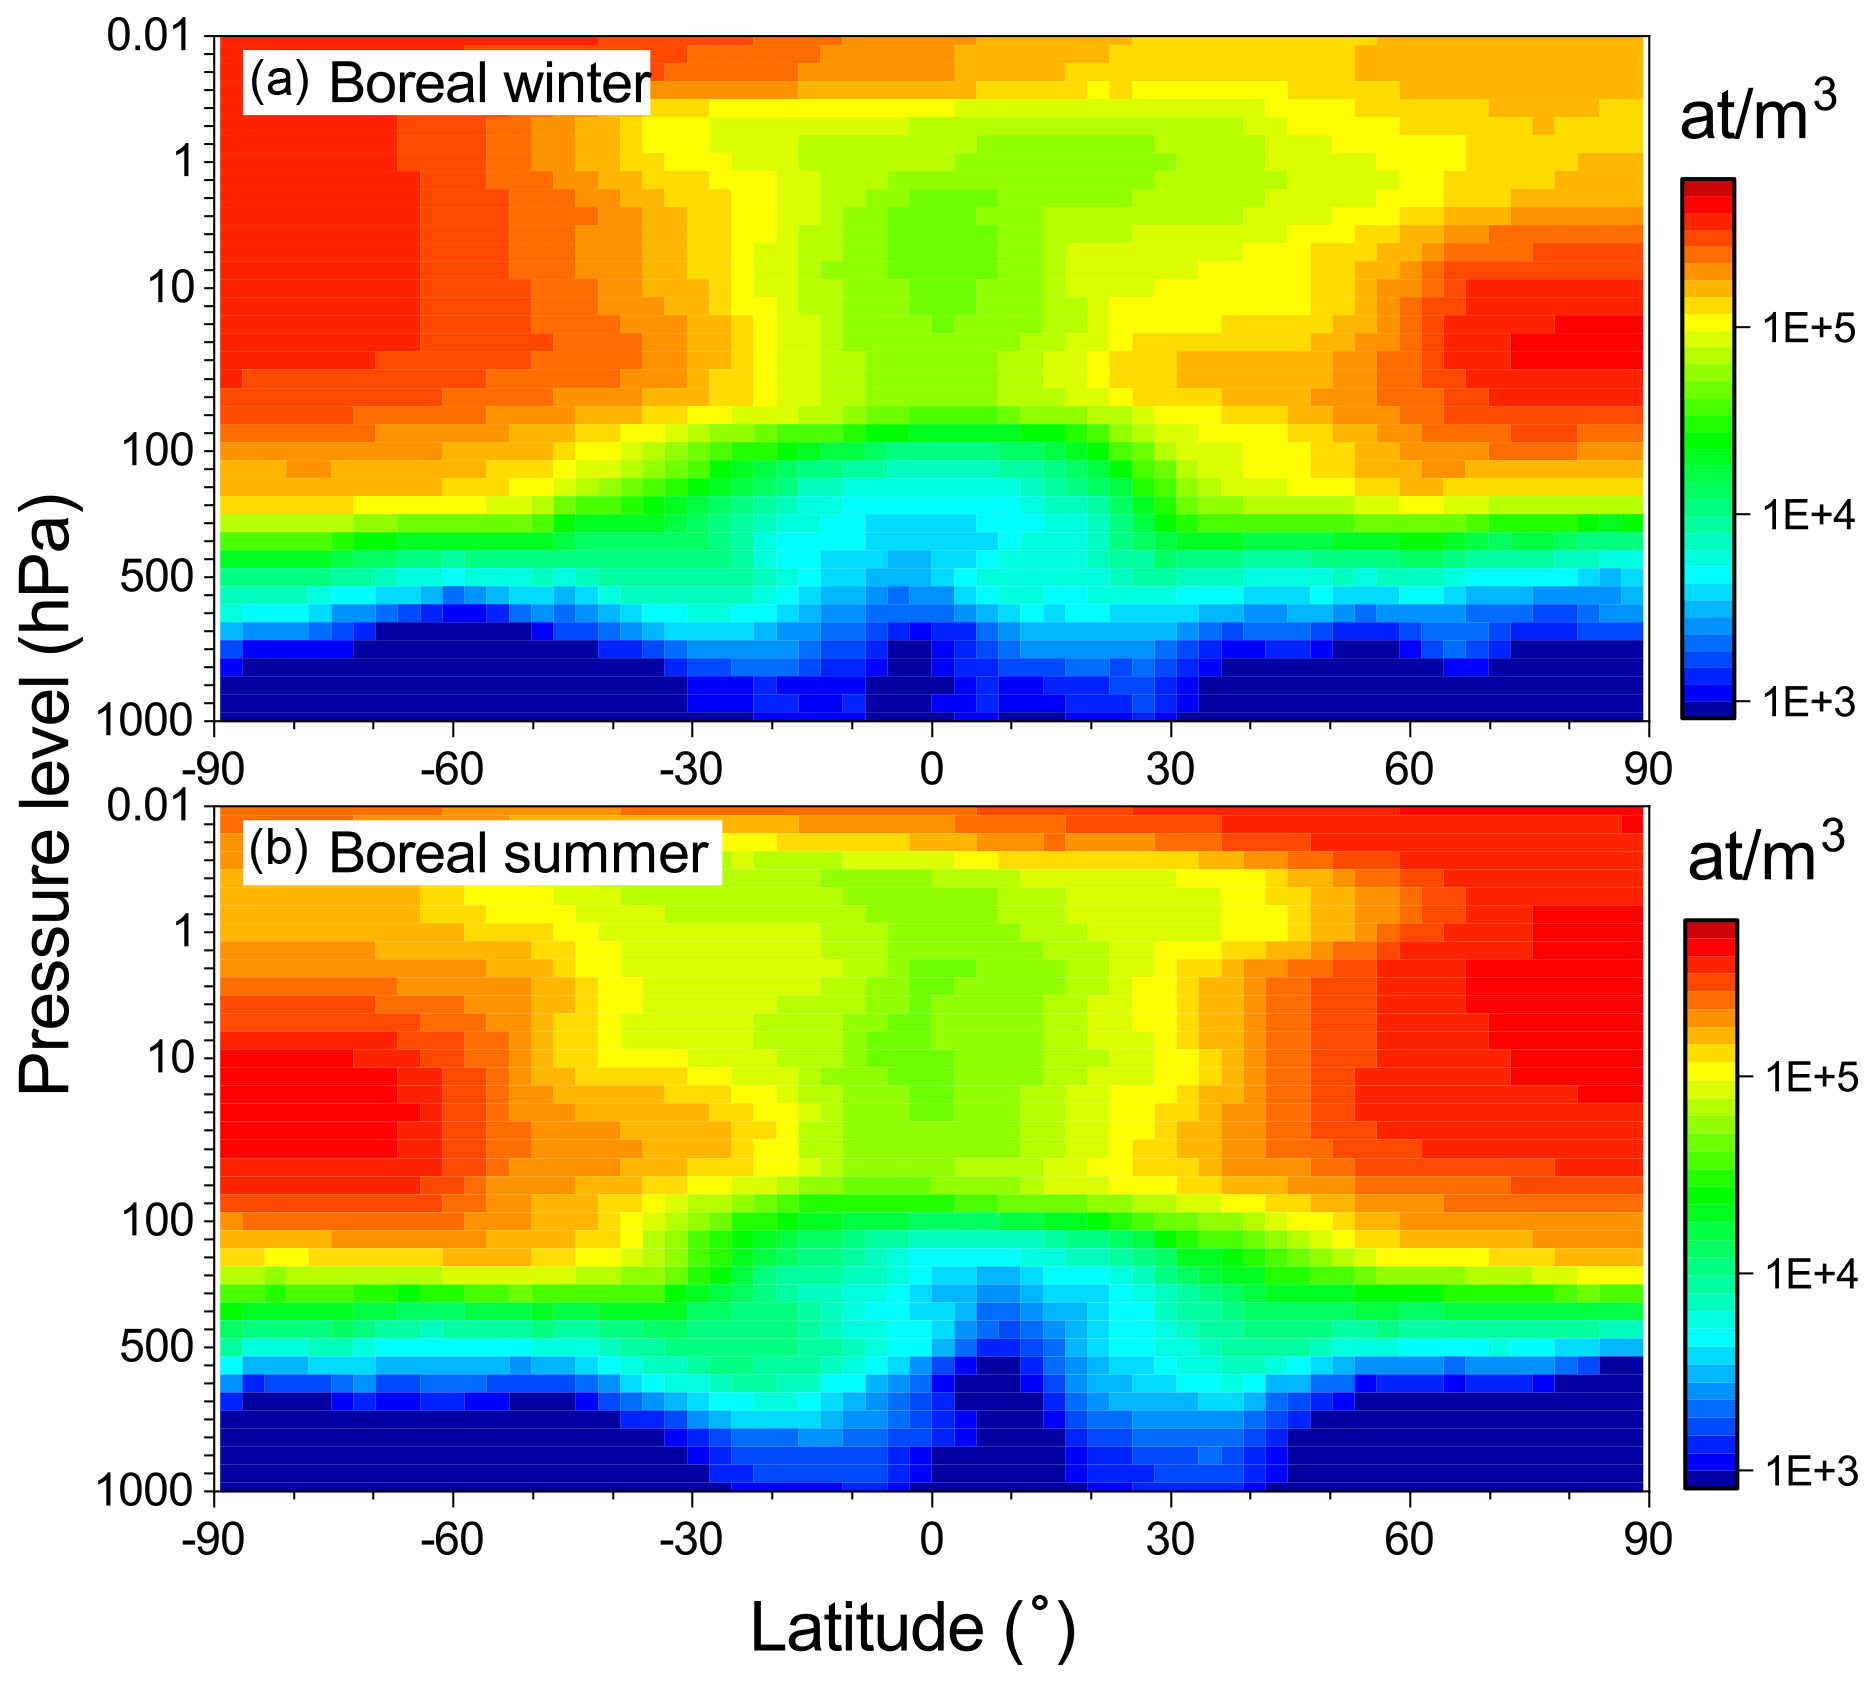
Figure 5Modeled zonal mean concentrations of 7Be during the boreal winter (a) and boreal summer (b) averaged over 2002–2008.
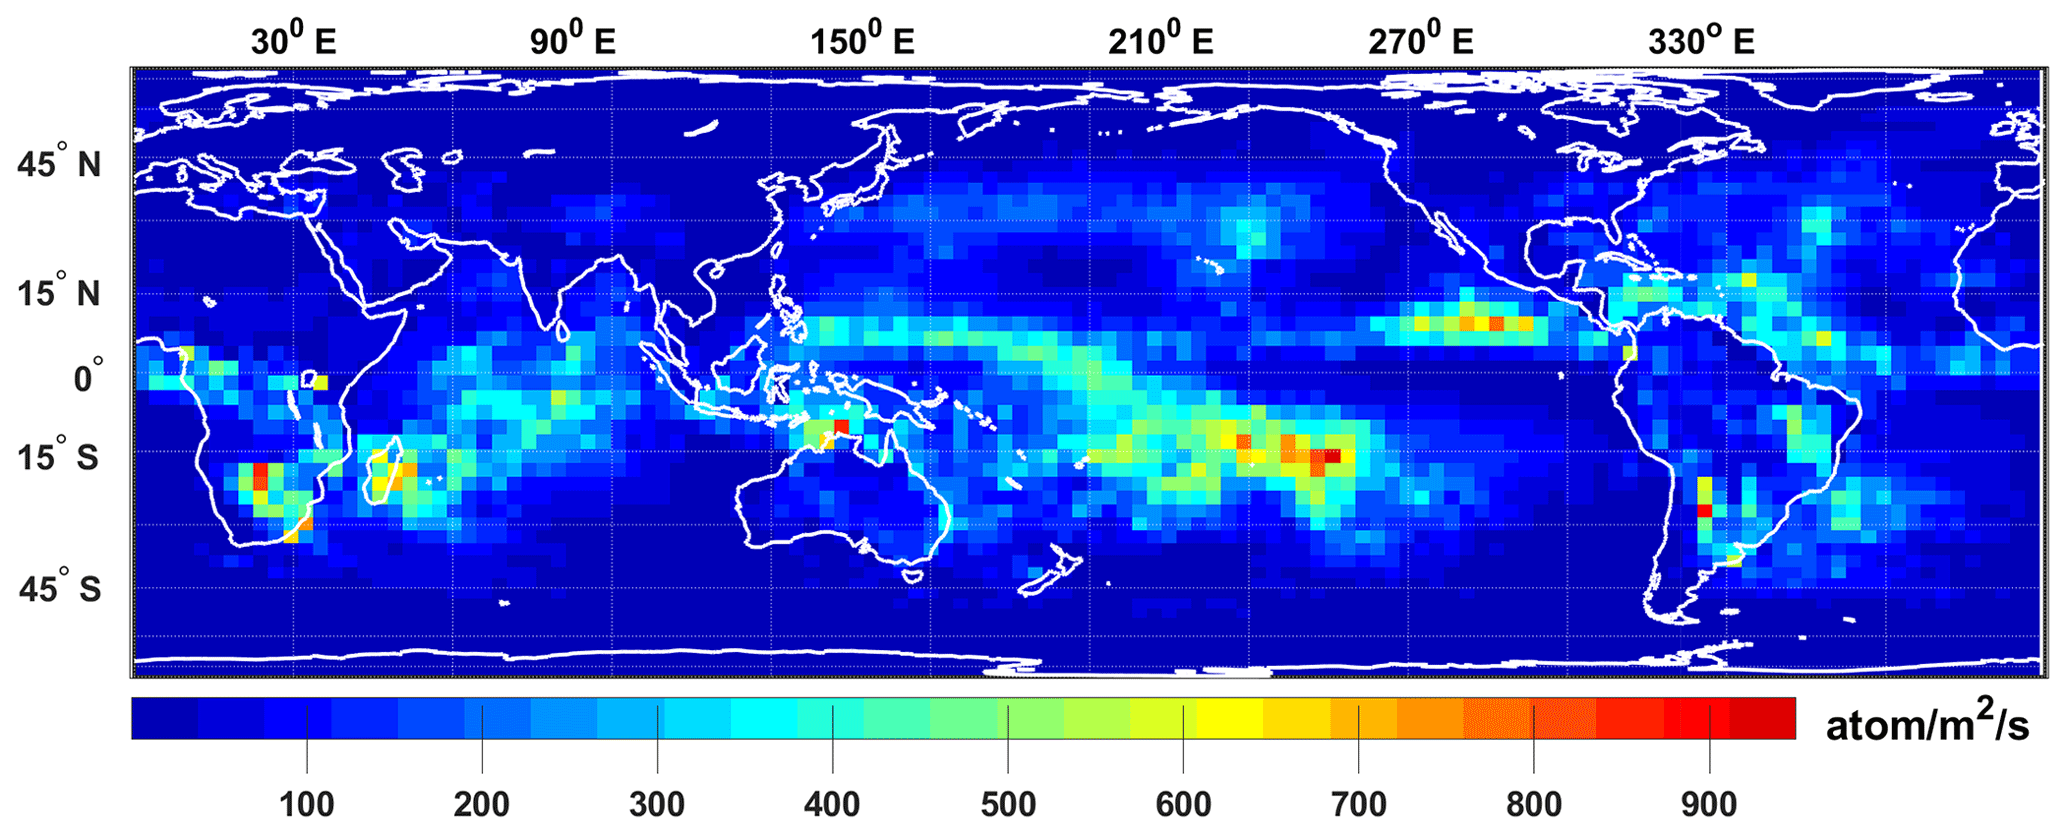
Figure 6Lambert equal-area cylindrical projection map of 7Be total (wet and dry) deposition averaged over the period of 2002–2008.
Figure 6 presents distributions of the total (wet and dry) deposition of 7Be averaged over 2002–2008. The deposition is low in arid regions, e.g., the Sahara and the Middle East. It is also low to the west of the continents, following the low precipitation above the cold ocean currents. The precipitation rate is the highest in the tropical convection zone due to the highest temperature gradients and strong convection in the equatorial area. The deposition, however, is not very high at low latitudes because both the production rate and the downward transport of 7Be are low in the tropics. It is important that gradients of the deposition can be strong even on the regional scale, suggesting that meteorological processes can strongly influence beryllium deposition at any given location (e.g., Usoskin et al., 2009b). This pattern agrees well with a similar previous study (Heikkilä et al., 2009).
5.2 The effect of a strong SPE
While GCRs always bombard the Earth's atmosphere with slightly variable intensity, major SPEs make a different impact, producing sporadic and short (typically several hours) but very intense fluxes of energetic particles entering the atmosphere mostly in polar regions. Potentially, extreme SPEs that are orders of magnitude stronger than those observed during the recent decades can be recorded in cosmogenic isotope data (Usoskin et al., 2006, 2020a; Miyake et al., 2012), and a proper model is needed to study them (Sukhodolov et al., 2017). Here we modeled transport of such SPE-produced beryllium based on the strong SPE on 20 January 2005. In order to distinguish between different sources, we traced five beryllium tracers for the 7Be isotope: one for GCR-produced beryllium and four tracers for the SPE scenarios as described above.
Production of the 7Be isotope during this SPE (Fig. 3b) appears mostly in the polar stratosphere and lower mesosphere. After production, the isotope starts decaying and being transported by the air dynamic. Figure 7 shows an example of the SPE-produced isotope concentration on the 30th day after the event (19 February 2005). One can see that the production pattern is smeared by the transport, leading in particular to an essential hemispheric difference. It is interesting that tropospheric concentrations are higher at middle and low latitudes of about 30∘ than in polar regions because of the atmospheric circulation. As an example, the modeled activity of 7Be in near-ground air is shown in Fig. 8 as averaged over Finland. The locally (polar troposphere) produced beryllium dominates during the first 20 d after the event, but then the transport starts playing a role, leading to the very low concentration during the subsequent period. The level of activity for this event in the near-air in Finland is very low: a factor 30–100 lower than the typical level of activity due to GCRs during the winter season (see Fig. 1a).
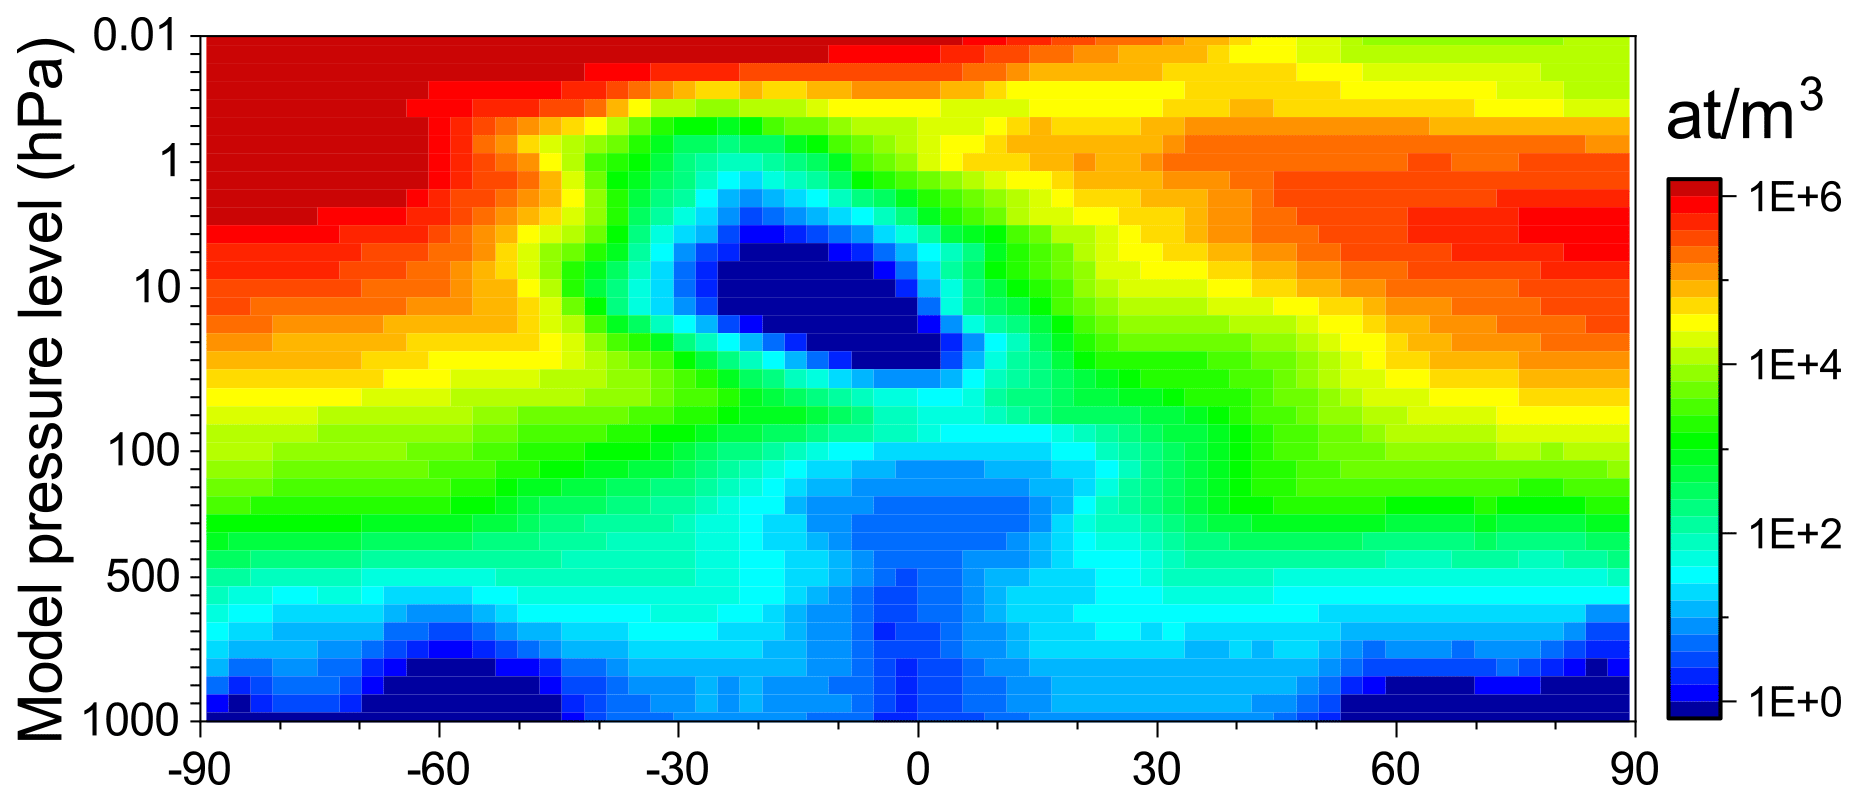
Figure 7Distribution of the concentrations of 7Be produced by the SPE on 20 January 2005 shown on 19 February 2005, 30 d after the event.
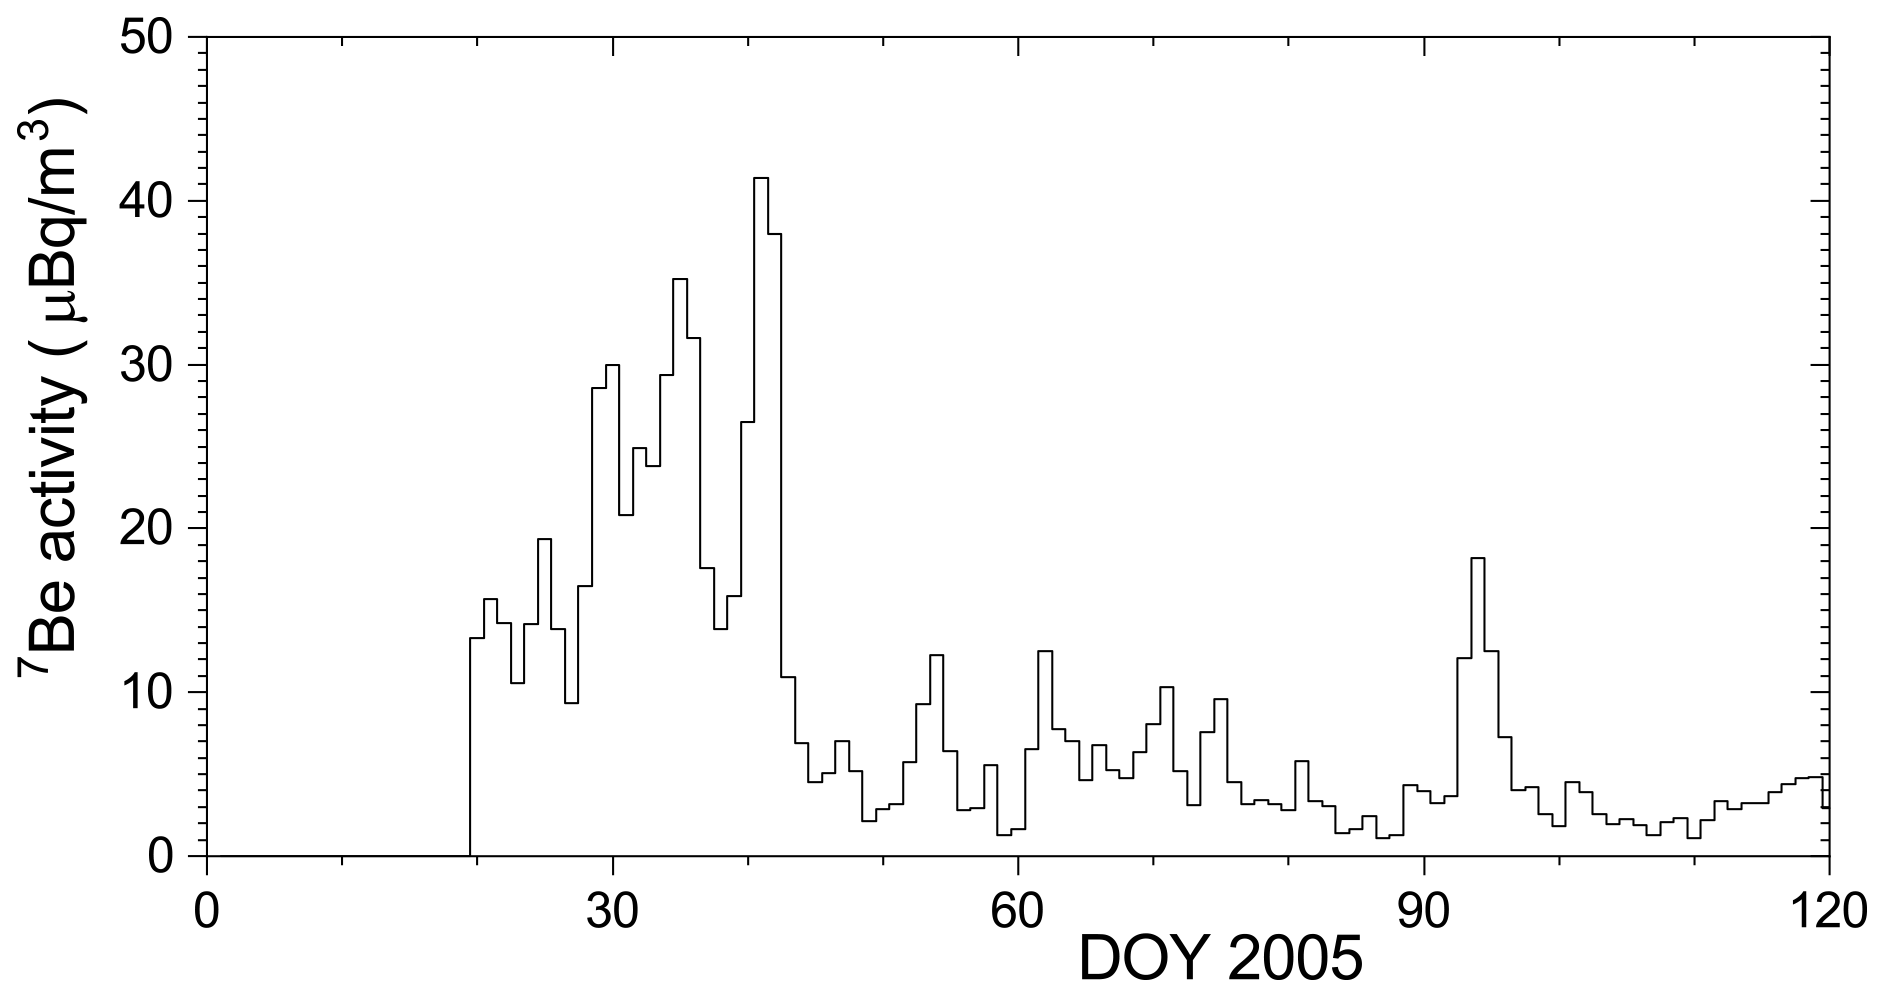
Figure 8Modeled activity of 7Be produced by the SPE on 20 January 2005 in near-ground air in Finland.
Although the SPE on 20 January 2005 was a very strong one (the second-strongest directly observed), its imprint in cosmogenic isotopes is not detectable on the background of air transport dynamic and GCR variability. An SPE must be stronger by a factor of 10 or more than this one to become detectable in isotope records even on the daily scale (Sukhodolov et al., 2017; Usoskin et al., 2020a).
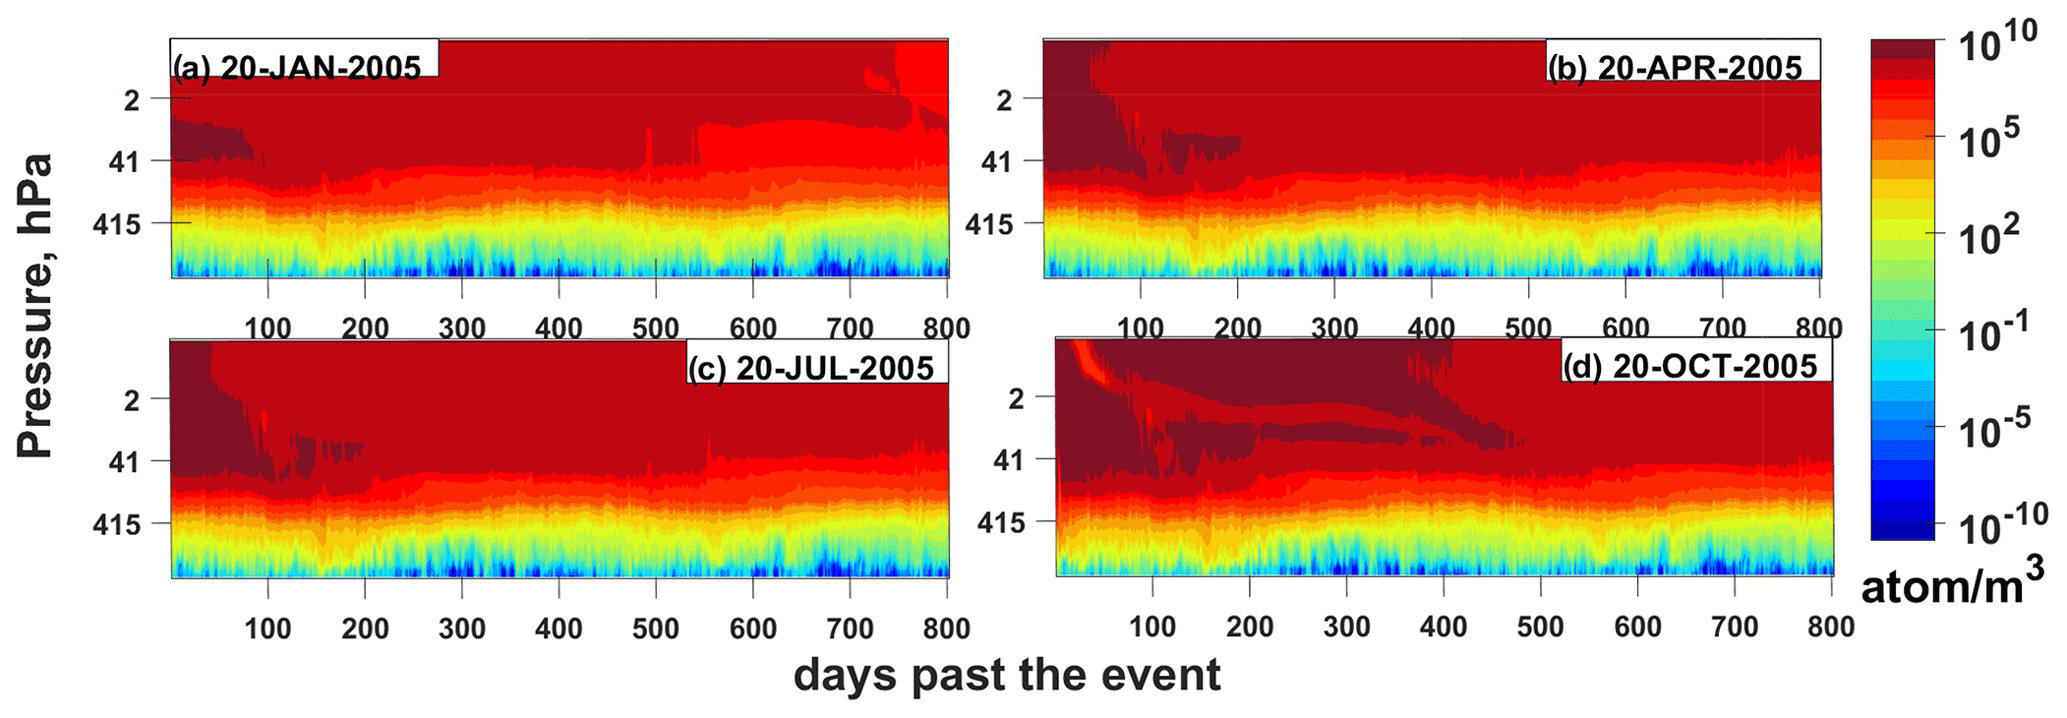
Figure 9Polar (at 85∘ N latitude) mean concentration of 10Be in the Northern Hemisphere for SPEs occurring in different seasons.
The transport of 7Be and 10Be after production may differ for different seasons. In order to study that, we simulated the same SPE on 20 January 2005 as if it occurred in mid-spring (20 April 2005), midsummer (20 July 2005), and mid-autumn (20 October 2005). Figure 9 shows the concentration of 10Be in the Northern Hemisphere (85∘ latitude) for these cases. Here we consider 10Be because of the fast decay of 7Be, which smears the time variability of the concentration. The most pronounced and long-lasting effect occurs from the SPE taking place during the autumn (panel d) when a strong concentration of 10Be persists in the stratospheric region for about 1 year and gradually decreases after that for a few more years. The patterns of the SPE occurring during summer (panel c) and spring (panel b) are similar to each other in that it has a shorter residence time (only a few months) and a smaller spread of 10Be. The winter scenario suggests somewhat faster removal of 10Be from the atmosphere, but it also stays in the upper atmosphere for several years. The concentration in near-ground air is mostly defined by the seasonal cycle and is consistent between different scenarios of the SPE occurrence date.
In this section, we validate the model by comparing the simulation results with actual measurements of the near-ground-air 7Be concentration in air filters performed in boreal and austral high-latitude regions (Sect. 3), as shown in Fig. 1.
First, we compared the modeled 7Be activity with the measured one for the all-Finland record, which was compiled from four stations (see Sect. 3) as shown in Fig. 1a. The linear Pearson correlation between the modeled and measured weekly series is highly significant at (p value ). The standard correlation analysis does not distinguish between different frequencies and/or timescales. Therefore, we show in Fig. 10 the global wavelet coherence, which is an analog of the correlation coefficient but extending it into the frequency domain between the modeled and measured 7Be activities.
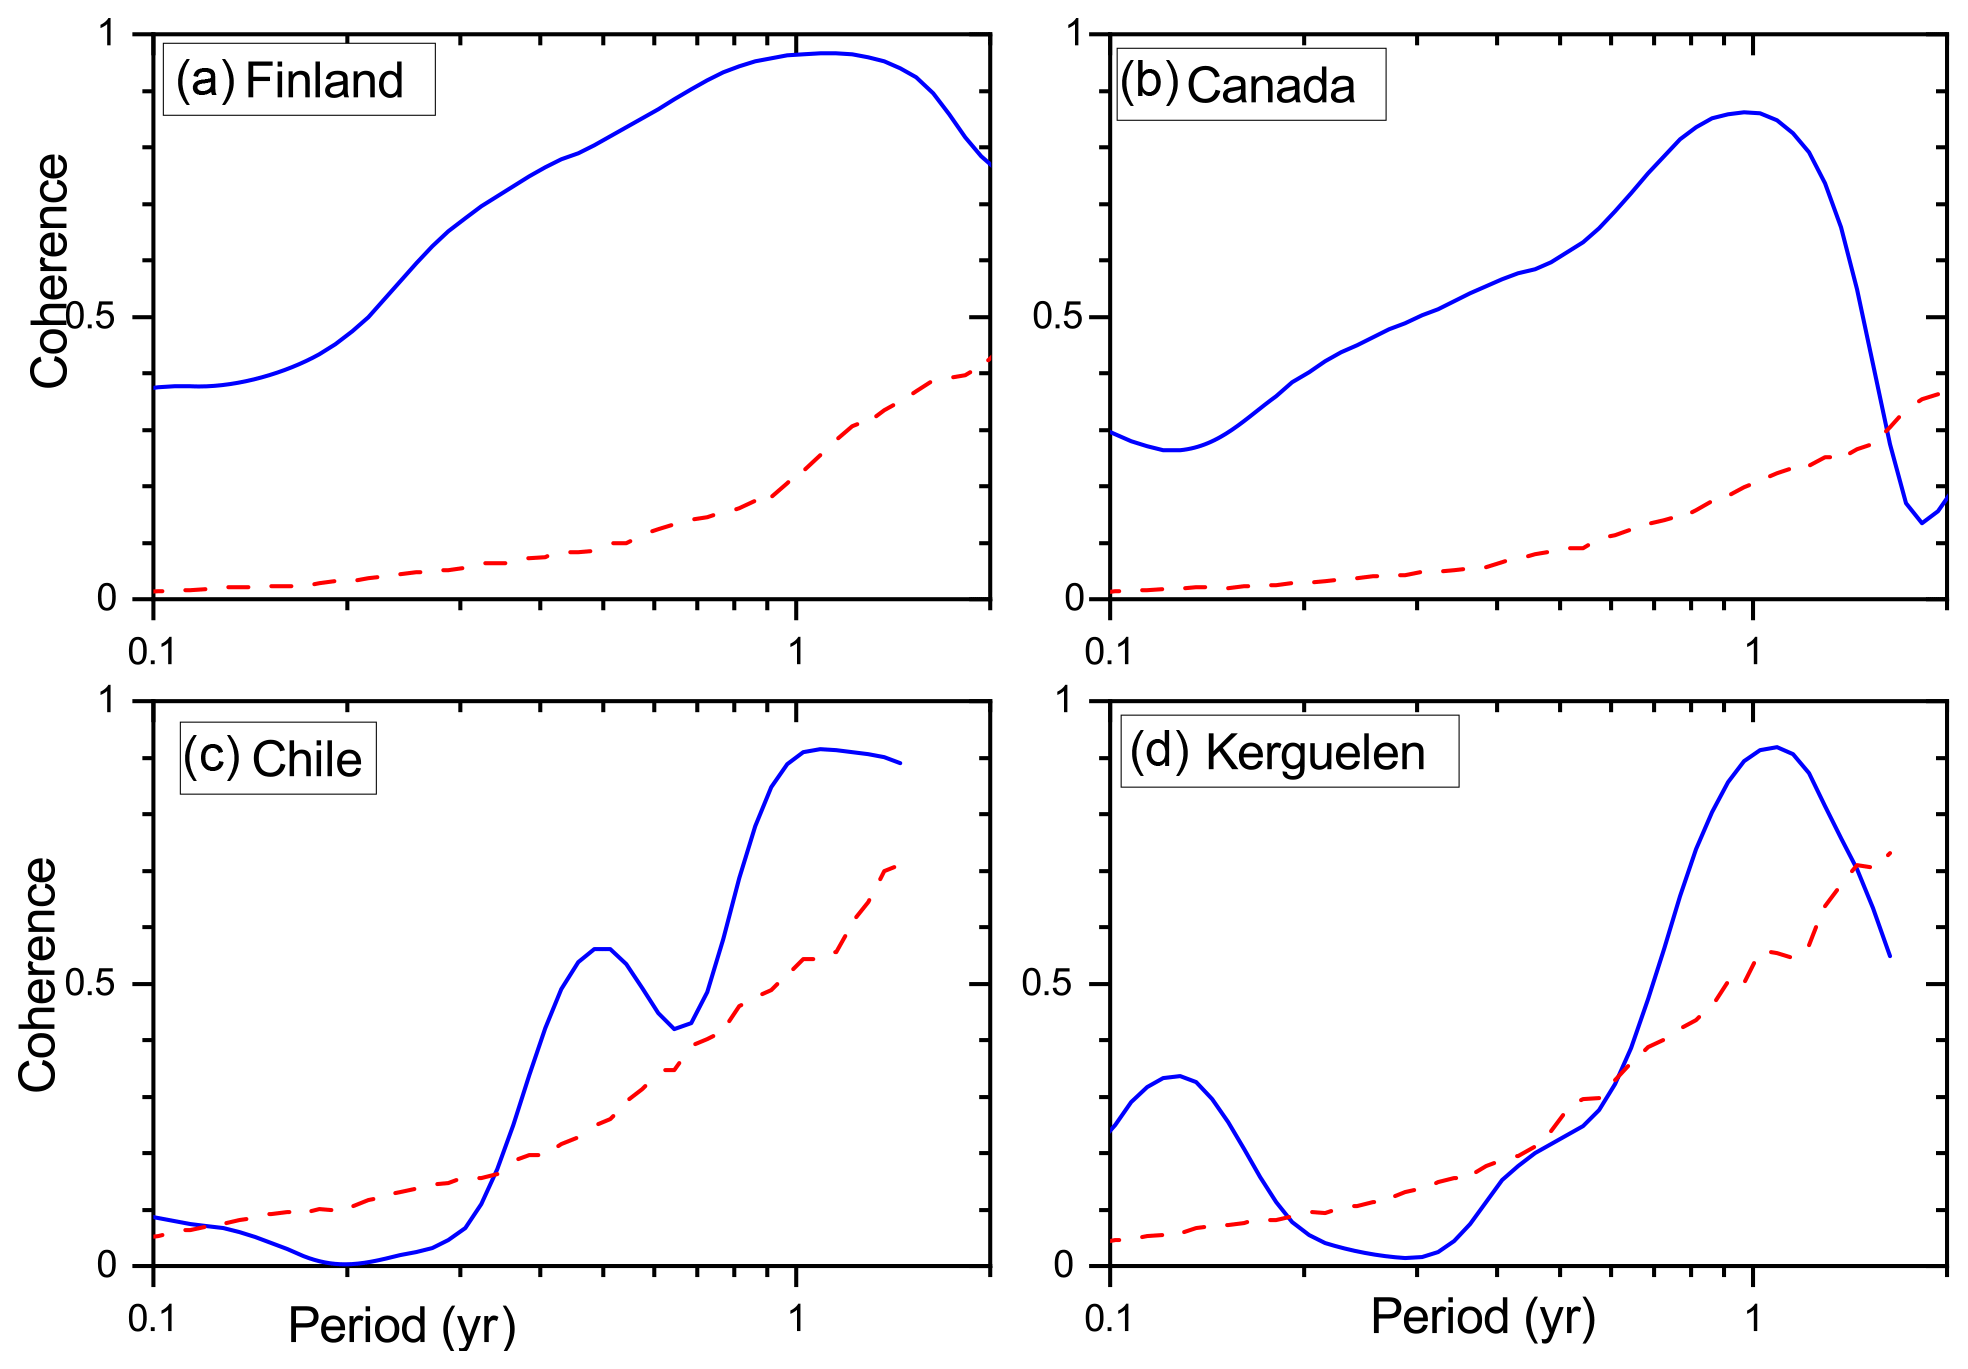
Figure 10Global wavelet coherence (Morlet base, k=3) between modeled and measured 7Be activity for the four locations considered here. The red dashed line denotes the 95 % confidence level against the AR(1) red noise.
Figure 10 depicts the coherence for the Finnish stations. The coherence is highly significant (confidence level above 95 %) at all timescales between 1 month and 2 years. Although there are discrepancies on the very short timescales related to synoptic noise, the model correctly reproduces some strong spikes in the beryllium activity, such as earlier in 2003, which are often related to sudden stratospheric warming (SSW) events (Pacini et al., 2015; Brattich et al., 2021). It is important that the long-term variability (at an annual timescale) is correctly reproduced by the model.
However, neither correlation coefficient nor coherence analyses provide information on the absolute level match between the series. In order to assess possible model biases we considered the difference between the modeled and measured weekly 7Be concentrations as shown in Fig. 11a. The difference is insignificant at 0.16±0.7 mBq m−3, implying the absence of a systematic bias in the model. The mean (averaged over seven yearly values) level of the modeled activity (2.05 mBq m−3) is close to the measured one (1.86 mBq m−3), within 10 % (the difference is 0.19±0.19 mBq m−3). The z test suggests that this difference is insignificant. On the other hand, there is an essential difference between the model and the measurements regarding the magnitude of summer peaks in 2007 and 2008. It could potentially be related to the local atmospheric aerosol properties, but the AERONET (AErosol RObotic NETwork) (Emery and Camps, 2017) station in Sodankylä (northern Finland) did not show any anomalies for that time. The discrepancies appear during warm periods, in agreement with other direct models (Brattich et al., 2017).
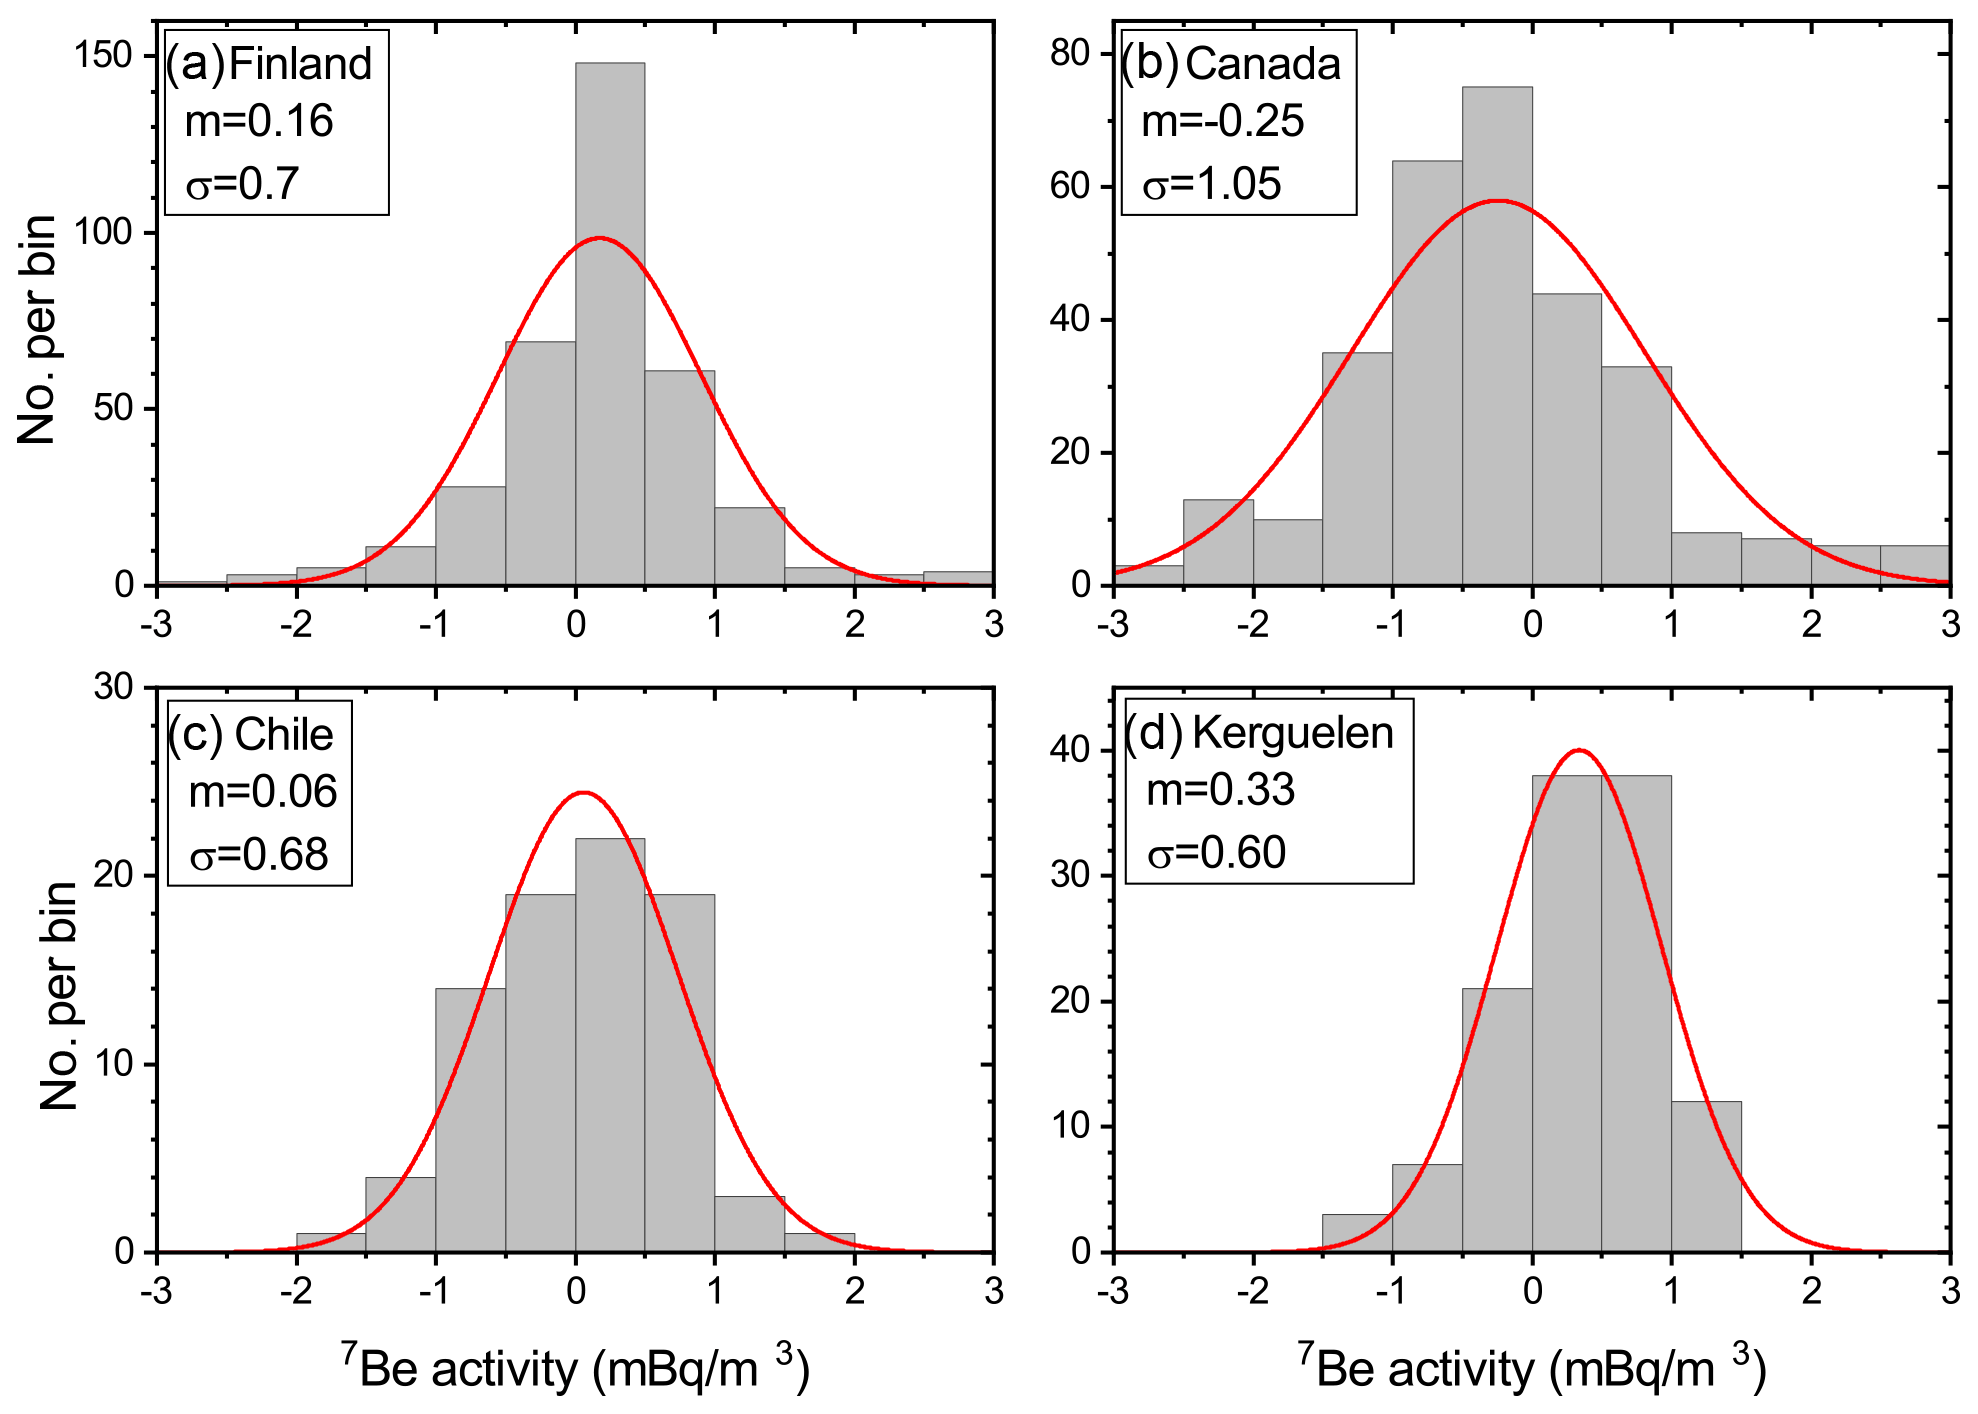
Figure 11Histograms of the difference between modeled and measured 7Be weekly concentrations (blue and red curves in Fig. 1, respectively) for the four locations analyzed here (see Table 1). Red curves depict the best-fit Gaussians whose parameters (the mean m and standard deviation σ) are quantified in the legends.
For the Canadian station, the agreement between the modeled and measured activities (Fig. 1b) is nearly perfect, including a correct reproduction of the very strong seasonal cycle and sudden short spikes, e.g., in late 2003. The Pearson correlation coefficient is (p value ). The coherence between the simulated and measured datasets (Fig. 10b) is highly significant at all timescales between 1 month and 1.5 years. The difference between the modeled and measured concentrations is mBq m−3 (Fig. 11b). The overall mean level of modeled activity (2.15 mBq m−3) is close to the measured one (2.4 mBq m−3), within 10 % (the difference is 0.24±0.22 mBq m−3). The z test suggests that the difference is insignificant, implying the absence of the model bias. The most pronounced difference between the model and the measurements was observed in 2008.
The Chilean data (Fig. 1c) depict reasonable agreement between the model and the measurements. Since the data contain no seasonal pattern, as correctly reproduced by the model, the formal correlation is insignificant at r=0.06. However, it is dominated by the short-term variability, while the wavelet coherence analysis (Fig. 10c) suggests that the two datasets are significantly coherent at timescales longer than 3 months. The difference between the modeled and measured concentrations is 0.06±0.68 mBq m−3 (Fig. 11c). The mean levels of the modeled and measured series agree nearly perfectly, within 2 %: 1.74 vs. 1.71 mBq m−3 for the modeled and measured activities, respectively, implying the absence of bias.
Data from Kerguelen island (Fig. 1d) also depict reasonable agreement, including correctly reproduced spikes and the lack of an annual cycle. Similar to the Chilean data, the formal correlation is insignificant at r=0.06, but the coherence (Fig. 10d) is highly significant at monthly and annual timescales. The difference between the modeled and measured concentrations is 0.33±0.6 mBq m−3 (Fig. 11d). The mean levels of the modeled and measured series are reasonably matched, with a difference of 18 %: 2.02 vs. 1.65 mBq m−3 for the modeled and measured activities, respectively, also indicating no significant bias. The observed small systematic discrepancy may be related to the peculiarity of this site, which is located on a small island (about 100 km across) in the middle of the ocean, while the model grid (about 300×300 km) may be too rough to catch the actual orography.
Therefore, we conclude that the model correctly (within 10 %) calculates the mean levels of beryllium concentration for both northern and southern high-latitude locations and contains no biases, at least for the locations where the orographic scale is comparable to the model's grid size, but it may have larger uncertainties for unresolvable spatial scales. It is important that the model correctly reproduces the seasonal variability or its absence as well as some sudden spikes, particularly during the late winter and spring seasons, likely related to SSW events.
In addition to the concentration of 7Be in the near-surface air (expressed in measured activity), we also compared the 7Be deposition modeled by CCM SOCOL-AERv2-BE with that measured in northern Finland, as shown in Fig. 2. The agreement is very good: the average levels (183 and 188 Bq m−2 for the modeled and measured data, respectively) agree within 2.5 %, and the correlation is highly significant (, ). However, while the overall agreement is very good, the discrepancy can be significant for individual years. Thus, we conclude that the model also reproduces the depositional flux of 7Be reasonably well on the yearly timescale.
A full 3D transient model of production, transport, and deposition of cosmogenic 7Be and 10Be isotopes in the atmosphere has been developed. The model, named CCM SOCOL-AERv2-BE, is based on CCM SOCOL, specifically tuned for the best performance in tracing beryllium, and the CRAC production model. Realistic modeling of the 7Be isotope was performed for the years 2002–2008, with a 5-year model spin-up during 1996–2001. The measured weekly concentrations of 7Be in near-ground air have been compared with the model prediction for four nearly antipodal high-latitude locations: two in the Northern (Finland and Canada) and two in the Southern (Chile and Kerguelen island) Hemisphere. The model results generally agree well with the measurements in the absolute level within error bars, implying that the production, decay, and lateral deposition are correctly reproduced by the model. However, a larger discrepancy (up to 20 %) was observed at Kerguelen island where the orographic scale is much smaller than the model grid size. The model correctly reproduces the temporal variability of 7Be concentrations on the annual and sub-annual scales, including a good reproduction of the annual cycle, which dominates data in the Northern Hemisphere, and the absence of such a cycle in the Southern Hemisphere. In addition, occasional anomalous events such as SSWs are well reproduced by the model. This validates the newly developed model to be able to correctly simulate the production, transport, and deposition of the 7Be (and hence, 10Be) isotope on local or regional spatial (in high-latitude regions) and monthly or annual temporal scales. The modeled 7Be distribution is also in general agreement with earlier computations based on a similar approach (e.g., Heikkilä et al., 2008a; Field et al., 2006).
We have also modeled the production and transport of 7Be for a major solar energetic particle event on 20 January 2005, which was one of the largest directly observed events. It was shown that, at minimum, an order-of-magnitude stronger event is needed to become observable in the beryllium data.
Concluding, the new full 3D time-dependent CCM SOCOL-AERv2-BE model of 7Be and 10Be atmospheric production, transport, and deposition has been developed and validated using directly measured data. The model is recommended to be used in studies related to, e.g., atmospheric dynamical patterns, extreme solar particle storms, long-term solar activity reconstruction from cosmogenic proxy data, and solar–terrestrial relations.
The data from CTBTO are available free upon request at https://www.ctbto.org/specials/vdec/vdec-request-for-access (Comprehensive Nuclear Test-Ban-Treaty Organization, 2021). According to the EU's iNSPIRE directive, STUK provides measurement data connected to geospatial information free of charge. The data from STUK are available at https://www.stuk.fi/avoin-data and https://www.stuk.fi/avoin-data/ohjeet (Finnish National Radiation and Nuclear Safety Authority, 2021). Data from the Radiation Protection Bureau of Health Canada are available free upon request via https://www.canada.ca/en/health-canada/corporate/contact-us/radiation-protection-bureau.html (Radiation Protection Bureau of Health Canada, 2021). CCM SOCOL-AERv2-BE is available at Zenodo: https://doi.org/10.5281/zenodo.5006356 (Golubenko et al., 2021). ERA5 data are available on the Copernicus Climate Change Service (C3S) Climate Data Store at https://cds.climate.copernicus.eu/#!/search?text=ERA5&type=dataset (Copernicus Climate Change Service, 2021).
All authors participated in the model development, verification, discussions about the results, and revisions to the article. IU, GK, and ER designed the main ideas of this study, and KG carried them out. KG was supervised directly by ER and TS during the model code improvement work. APL found and prepared the real beryllium data for the model verification. IU and KG were responsible for data processing and figure preparation. IU prepared the paper.
The contact author has declared that neither they nor their co-authors have any competing interests.
The views expressed herein are those of the authors and do not necessarily reflect the views of the CTBTO Preparatory Commission.
Publisher's note: Copernicus Publications remains neutral with regard to jurisdictional claims in published maps and institutional affiliations.
The authors would like to thank Weihua Zhang, Ian Hoffman, and Kurt Ungar of the Radiation Protection Bureau of Health Canada for providing the Yellowknife data. The authors acknowledge the work of CTBTO staff as well as the CL18 and FRP30 station operating staff for producing and providing the corresponding data under a vDEC agreement (https://www.ctbto.org/specials/vdec/, last access: 1 September 2021).
This research has been supported by the Academy of Finland (ESPERA (grant no. 321882)), the Schweizerischer Nationalfonds zur Förderung der Wissenschaftlichen Forschung (grant nos. 200021-169241 (VEC) and 200020-182239 (POLE)), and the Russian Science Foundation (RSF project no. 20-67-46016). Kseniia Golubenko has been granted a scholarship by the Suomalainen Tiedeakatemia (grant no. 2021; the Vilho, Yrjö, and Kalle Väisälä Foundation). Timofei Sukhodolov worked on the model development as part of the SPbSU “Ozone Layer and Upper Atmosphere Research laboratory” activity supported by the Government of the Russian Federation (grant no. 075-15-2021-583).
This paper was edited by Josef Koller and reviewed by four anonymous referees.
Beer, J., McCracken, K., and von Steiger, R.: Cosmogenic Radionuclides: Theory and Applications in the Terrestrial and Space Environments, Springer, Berlin, 2012. a, b, c
Brattich, E., Liu, H., Tositti, L., Considine, D. B., and Crawford, J. H.: Processes controlling the seasonal variations in 210Pb and 7Be at the Mt. Cimone WMO-GAW global station, Italy: a model analysis, Atmos. Chem. Phys., 17, 1061–1080, https://doi.org/10.5194/acp-17-1061-2017, 2017. a, b
Brattich, E., Orza, J. A. G., Cristofanelli, P., Bonasoni, P., Marinoni, A., and Tositti, L.: Advection pathways at the Mt. Cimone WMO-GAW station: Seasonality, trends, and influence on atmospheric composition, Atmos. Environ., 234, 117513, https://doi.org/10.1016/j.atmosenv.2020.117513, 2020. a
Brattich, E., Liu, H., Zhang, B., Hernández-Ceballos, M. Á., Paatero, J., Sarvan, D., Djurdjevic, V., Tositti, L., and Ajtić, J.: Observation and modeling of high-7Be events in Northern Europe associated with the instability of the Arctic polar vortex in early 2003, Atmos. Chem. Phys. Discuss. [preprint], https://doi.org/10.5194/acp-2020-1121, in review, 2021. a
Brost, R. A., Feichter, J., and Heimann, M.: Three-dimensional simulation of 7Be in a global climate model, J. Geophys. Res.-Atmos., 96, 22423–22445, https://doi.org/10.1029/91JD02283, 1991. a
Butchart, N.: The Brewer-Dobson circulation, Rev. Geophys., 52, 157–184, https://doi.org/10.1002/2013RG000448, 2014. a
Cohen, N., Gerber, E., and Bühler, O.: What Drives the Brewer-Dobson Circulation?, J. Atmos. Sci., 71, 3837–3855, https://doi.org/10.1175/JAS-D-14-0021.1, 2014. a
Comprehensive Nuclear Test-Ban-Treaty Organization: Beryllium-7 data, CTBTO [data set], available at: https://www.ctbto.org/specials/vdec/vdec-request-for-access, last access: 1 September 2021. a
Cooke, D., Humble, J., Shea, M., Smart, D., Lund, N., Rasmussen, I., Byrnak, B., Goret, P., and Petrou, N.: On cosmic-ray cut-off terminology, Nuovo Cimento C, 14, 213–234, 1991. a
Copernicus Climate Change Service: ERA5 data, Climate Data Store [data set], available at: https://cds.climate.copernicus.eu/#!/search?text=ERA5&type=datase, last access: 1 September 2021. a
Delaygue, G., Bekki, S., and Bard, E.: Modelling the stratospheric budget of beryllium isotopes, Tellus B, 67, 28582, https://doi.org/10.3402/tellusb.v67.28582, 2015. a, b
Desai, M. and Giacalone, J.: Large gradual solar energetic particle events, Living Rev. Sol. Phys., 13, 3, https://doi.org/10.1007/s41116-016-0002-5, 2016. a
Dorman, L.: Cosmic Rays in the Earth's Atmosphere and Underground, Kluwer Academic Publishers, Dordrecht, 2004. a
Egorova, T., Rozanov, E., Zubov, V., and Karol, I.: Model for investigating ozone trends (MEZON), Izv. Atmos. Ocean Phy., 39, 277–292, 2003. a
Emery, W. and Camps, A.: Introduction to Satellite Remote Sensing, Elsevier, https://doi.org/10.1016/B978-0-12-809254-5.00008-7, 2017. a
Feinberg, A., Sukhodolov, T., Luo, B.-P., Rozanov, E., Winkel, L. H. E., Peter, T., and Stenke, A.: Improved tropospheric and stratospheric sulfur cycle in the aerosol–chemistry–climate model SOCOL-AERv2, Geosci. Model Dev., 12, 3863–3887, https://doi.org/10.5194/gmd-12-3863-2019, 2019. a, b, c, d
Field, C., Schmidt, G., Koch, D., and Salyk, C.: Modeling production and climate-related impacts on 10Be concentration in ice cores, J. Geophys. Res., 111, D15107, https://doi.org/10.1029/2005JD006410, 2006. a, b, c
Finnish National Radiation and Nuclear Safety Authority: Beryllium-7 data, STUK [data set], available at: https://www.stuk.fi/avoin-data/ohjeet, last access: 1 September 2021. a
Fraser-Smith, A. C.: Centered and eccentric geomagnetic dipoles and their poles, 1600–1985., Rev. Geophys., 25, 1–16, 1987. a
Geant4 collaboration: Physics reference manual (version Geant4 10.6.0), available at: https://geant4.web.cern.ch/support (last access: 1 September 2021), 2020. a
Gleeson, L. and Axford, W.: Solar Modulation of Galactic Cosmic Rays, Astrophys. J., 154, 1011–1026, https://doi.org/10.1086/149822, 1968. a
Golubenko, K., Rozanov, E., Mironova, I., Karagodin, A., and Usoskin, I.: Natural Sources of Ionization and Their Impact on Atmospheric Electricity, Geophys. Res. Lett., 47, e88619, https://doi.org/10.1029/2020GL088619, 2020. a
Golubenko, K., Rozanov, E., Sukhodolov, T., and Usoskin, I.: CCM SOCOL-AERv2-BEv1, Zenodo [code], https://doi.org/10.5281/zenodo.5006356, 2021. a
Haltia, E., Leppänen, A.-P., Kallio, A., and Saarinen, T.: Sediment profile dating and reconstructing nuclear events from annually laminated lake sediments in northern Finland, J. Environ. Radioactiv., 233, 106611, https://doi.org/10.1016/j.jenvrad.2021.106611, 2021. a
Hauglustaine, D. A., Granier, C., Brasseur, G. P., and MéGie, G.: The importance of atmospheric chemistry in the calculation of radiative forcing on the climate system, J. Geophys. Res., 99, 1173–1186, https://doi.org/10.1029/93JD02987, 1994. a
Heck, D., Knapp, J., Capdevielle, J., Schatz, G., and Thouw, T.: CORSIKA: A Monte Carlo Code to Simulate Extensive Air Showers, in: FZKA 6019, Forschungszentrum, Karlsruhe, 1998. a
Heikkilä, U., Beer, J., and Alfimov, V.: Beryllium-10 and beryllium-7 in precipitation in Dübendorf (440 m) and at Jungfraujoch (3580 m), Switzerland (1998–2005), J. Geophys. Res., 113, D11104, https://doi.org/10.1029/2007JD009160, 2008a. a, b
Heikkilä, U., Beer, J., and Feichter, J.: Modeling cosmogenic radionuclides 10Be and 7Be during the Maunder Minimum using the ECHAM5-HAM General Circulation Model, Atmos. Chem. Phys., 8, 2797–2809, https://doi.org/10.5194/acp-8-2797-2008, 2008b. a, b, c
Heikkilä, U., Beer, J., and Feichter, J.: Meridional transport and deposition of atmospheric 10Be, Atmos. Chem. Phys., 9, 515–527, https://doi.org/10.5194/acp-9-515-2009, 2009. a, b, c, d
Heikkilä, U., Beer, J., Abreu, J. A., and Steinhilber, F.: On the Atmospheric Transport and Deposition of the Cosmogenic Radionuclides (10Be): A Review, Space Sci. Rev., 176, 321–332, https://doi.org/10.1007/s11214-011-9838-0, 2013. a, b
Hommel, R., Timmreck, C., and Graf, H. F.: The global middle-atmosphere aerosol model MAECHAM5-SAM2: comparison with satellite and in-situ observations, Geosci. Model Dev., 4, 809–834, https://doi.org/10.5194/gmd-4-809-2011, 2011. a
Ioannidou, A. and Paatero, J.: Activity size distribution and residence time of 7Be aerosols in the Arctic atmosphere, Atmos. Environ., 88, 99–106, https://doi.org/10.1016/j.atmosenv.2013.12.046, 2014. a
Jordan, C. E., Dibb, J. E., and Finkel, R. C.: 10BeBe tracer of atmospheric transport and stratosphere-troposphere exchange, J. Geophys. Res., 108, 4234, https://doi.org/10.1029/2002JD002395, 2003. a
Kerkweg, A., Buchholz, J., Ganzeveld, L., Pozzer, A., Tost, H., and Jöckel, P.: Technical Note: An implementation of the dry removal processes DRY DEPosition and SEDImentation in the Modular Earth Submodel System (MESSy), Atmos. Chem. Phys., 6, 4617–4632, https://doi.org/10.5194/acp-6-4617-2006, 2006a. a
Kerkweg, A., Buchholz, J., Ganzeveld, L., Pozzer, A., Tost, H., and Jöckel, P.: Technical Note: An implementation of the dry removal processes DRY DEPosition and SEDImentation in the Modular Earth Submodel System (MESSy), Atmos. Chem. Phys., 6, 4617–4632, https://doi.org/10.5194/acp-6-4617-2006, 2006b. a
Koch, D., Schmidt, G. A., and Field, C. V.: Sulfur, sea salt and radionuclide aerosols in GISS ModelE, J. Geophys. Res., 111, D06206, https://doi.org/10.1029/2004JD005550, 2006. a
Koldobskiy, S. A., Raukunen, O., Vainio, R., Kovaltsov, G., and Usoskin, I.: New reconstruction of event-integrated spectra (spectral fluences) for major solar energetic particle events, Astron. Astrophys., 647, A132, https://doi.org/10.1051/0004-6361/202040058, 2021. a
Kovaltsov, G. and Usoskin, I.: A new 3D numerical model of cosmogenic nuclide 10Be production in the atmosphere, Earth Planet. Sc. Lett., 291, 182–188, 2010. a, b
Lal, D. and Peters, B.: Cosmic Ray Produced Radioactivity on the Earth, in: Handbuch der Physik, edited by: Sittle, K., vol. 46, Springer, Berlin, 551–612, 1967. a, b
Land, C. and Feichter, J.: Stratosphere–troposphere exchange in a changing climate simulated with the general circulation model MAECHAM4, J. Geophys. Res.-Atmos., 108, 8523, https://doi.org/10.1029/2002JD002543, 2003. a
Leppänen, A.: Deposition of naturally occurring 7Be and 210Pb in Northern Finland, J. Environ. Radioactiv., 208–209, 105995, https://doi.org/10.1016/j.jenvrad.2019.105995, 2019. a
Leppänen, A.-P., Usoskin, I. G., Kovaltsov, G. A., and Paatero, J.: Cosmogenic 7Be and 22Na in Finland: Production, observed periodicities and the connection to climatic phenomena, J. Atmos. Sol.-Terr. Phy., 74, 164–180, https://doi.org/10.1016/j.jastp.2011.10.017, 2012. a, b
Lin, S. and Rood, R.: Multidimensional flux-form semi-Lagrangian transport schemes, Mon. Weather Rev., 124, 2046–2070, 1996. a
McCracken, K.: Geomagnetic and atmospheric effects upon the cosmogenic 10Be observed in polar ice, J. Geophys. Res., 109, A04101, https://doi.org/10.1029/2003JA010060, 2004. a
Medici, F.: Particulate sampling in the IMS radionuclide network of the Comprehensive-Nuclear Test Ban Treaty, Kerntechnik, 66, 121–125, 2001. a
Miley, H., Bowyer, S., Hubbard, C., McKinnon, A., Perkins, R., Thompson, R., and Warner, R.: A description of the DOE Radionuclide Aerosol Sampler/Analyzer for the Comprehensive Test Ban Treaty, J. Radioanal. Nucl. Ch., 235, 83–87, 1998. a
Mironova, I. A., Aplin, K. L., Arnold, F., Bazilevskaya, G. A., Harrison, R. G., Krivolutsky, A. A., Nicoll, K. A., Rozanov, E. V., Turunen, E., and Usoskin, I. G.: Energetic Particle Influence on the Earth's Atmosphere, Space Sci Rev., 194, 1–96, https://doi.org/10.1007/s11214-015-0185-4, 2015. a
Miyake, F., Nagaya, K., Masuda, K., and Nakamura, T.: A signature of cosmic-ray increase in ad 774–775 from tree rings in Japan, Nature, 486, 240–242, https://doi.org/10.1038/nature11123, 2012. a
Monge-Sanz, B. and Chipperfield, M.: Chemical transport modelling, in: ECMWF/Geo Workshop on Atmospheric Reanalyis, 19–22 June 2006, ECMWF, Shinfield Park, Reading, 39–44, available at: https://www.ecmwf.int/node/11221 (last access: 1 May 2021), 2006. a
Nordeng, T.-E.: Extended versions of the convective parametrization scheme at ECMWF and their impact on the mean and transient activity of the model in the tropics, p. 41, https://doi.org/10.21957/e34xwhysw, https://www.ecmwf.int/node/11393 (last access: 1 September 2021), 1994. a
Pacini, A. A., Usoskin, I. G., Evangelista, H., Echer, E., and de Paula, R.: Cosmogenic isotope 7Be: A case study of depositional processes in Rio de Janeiro in 2008–2009, Adv. Space Res., 48, 811–818, https://doi.org/10.1016/j.asr.2011.04.035, 2011. a
Pacini, A. A., Usoskin, I. G., Mursula, K., Echer, E., and Evangelista, H.: Signature of a sudden stratospheric warming in the near-ground 7Be flux, Atmos. Environ., 113, 27–31, https://doi.org/10.1016/j.atmosenv.2015.04.065, 2015. a, b
Pierce, J. R., Weisenstein, D. K., Heckendorn, P., Peter, T., and Keith, D. W.: Efficient formation of stratospheric aerosol for climate engineering by emission of condensible vapor from aircraft, Geophys. Res. Lett., 37, L18805, https://doi.org/10.1029/2010GL043975, 2010. a
Poluianov, S., Kovaltsov, G. A., Mishev, A. L., and Usoskin, I. G.: Production of cosmogenic isotopes 7Be, 10Be, 14C, 22Na, and 36Cl in the atmosphere: Altitudinal profiles of yield functions, J. Geophys. Res.-Atmos., 121, 8125–8136, https://doi.org/10.1002/2016JD025034, 2016. a
Radiation Protection Bureau of Health Canada: Beryllium-7 data, RPBHC [data set], available at: https://www.canada.ca/en/health-canada/corporate/contact-us/, last access: 1 September 2021. a
Raisbeck, G. M., Yiou, F., Fruneau, M., Loiseaux, J. M., Lieuvin, M., and Ravel, J. C.: Cosmogenic 10BeBe as a probe of atmospheric transport processes, Geophys. Res. Lett., 8, 1015–1018, https://doi.org/10.1029/GL008i009p01015, 1981. a
Raukunen, O., Vainio, R., Tylka, A. J., Dietrich, W. F., Jiggens, P., Heynderickx, D., Dierckxsens, M., Crosby, N., Ganse, U., and Siipola, R.: Two solar proton fluence models based on ground level enhancement observations, J. Space Weather Spac., 8, A04, https://doi.org/10.1051/swsc/2017031, 2018. a
Roeckner, E., Bauml, G., Bonaventura, L., Brokopf, R., Esch, M., Giorgetta, M., Hagemann, S., Kirchner, I., Kornblueh, L., Manzini, E., Rhodin, A., Schlese, U., Schulzweida, U., and Tompkins, A.: The atmospheric general circulation model ECHAM5, PART I: Model description, Tech. rep., Max Planck Institute for Meteorology, MPI-Report 349, available at: http://www.mpimet.mpg.de/fileadmin/publikationen/Reports/max scirep 349.pdf (last access: 1 September 2021), 2003. a
Steinhilber, F., Abreu, J., Beer, J., Brunner, I., Christl, M., Fischer, H., Heikkilae, U., Kubik, P., Mann, M., McCracken, K., Miller, H., Miyahara, H., Oerter, H., and Wilhelms, F.: 9,400 years of cosmic radiation and solar activity from ice cores and tree rings, P. Natl. Acad. Sci. USA, 109, 5967–5971, https://doi.org/10.1073/pnas.1118965109, 2012. a
Stenke, A., Schraner, M., Rozanov, E., Egorova, T., Luo, B., and Peter, T.: The SOCOL version 3.0 chemistry–climate model: description, evaluation, and implications from an advanced transport algorithm, Geosci. Model Dev., 6, 1407–1427, https://doi.org/10.5194/gmd-6-1407-2013, 2013. a
Sukhodolov, T., Usoskin, I., Rozanov, E., Asvestari, E., Ball, W., Curran, M., Fischer, H., Kovaltsov, G., Miyake, F., Peter, T., Plummer, C., Schmutz, W., Severi, M., and Traversi, R.: Atmospheric impacts of the strongest known solar particle storm of 775 AD, Sci. Rep.-UK, 7, 45257, https://doi.org/10.1038/srep45257, 2017. a, b, c, d, e
Terzi, L., Wotawa, G., Schoeppner, M., Kalinowski, M., Saey, P. R. J., Steinmann, P., Luan, L., and Staten, P. W.: Radioisotopes demonstrate changes in global atmospheric circulation possibly caused by global warming, Sci. Rep.-UK, 10, 10695, https://doi.org/10.1038/s41598-020-66541-5, 2020. a
Thébault, E., Finlay, C. C., Beggan, C. D., Alken, P., Aubert, J., Barrois, O., Bertrand, F., Bondar, T., Boness, A., Brocco, L., Canet, E., Chambodut, A., Chulliat, A., Coïsson, P., Civet, F., Du, A., Fournier, A., Fratter, I., Gillet, N., Hamilton, B., Hamoudi, M., Hulot, G., Jager, T., Korte, M., Kuang, W., Lalanne, X., Langlais, B., Léger, J.-M., Lesur, V., Lowes, F. J., Macmillan, S., Mandea, M., Manoj, C., Maus, S., Olsen, N., Petrov, V., Ridley, V., Rother, M., Sabaka, T. J., Saturnino, D., Schachtschneider, R., Sirol, O., Tangborn, A., Thomson, A., Tøffner-Clausen, L., Vigneron, P., Wardinski, I., and Zvereva, T.: International Geomagnetic Reference Field: the 12th generation, Earth Planets Space, 67, 79, https://doi.org/10.1186/s40623-015-0228-9, 2015. a
Tiedtke, M.: A comprehensive mass flux scheme for cumulus parameterization in large-scale models, Mon. Weather Rev., 117, 1779–1800, 1989. a
Tost, H., Jöckel, P., Kerkweg, A., Pozzer, A., Sander, R., and Lelieveld, J.: Global cloud and precipitation chemistry and wet deposition: tropospheric model simulations with ECHAM5/MESSy1, Atmos. Chem. Phys., 7, 2733–2757, https://doi.org/10.5194/acp-7-2733-2007, 2007. a
Tost, H., Lawrence, M. G., Brühl, C., Jöckel, P., The GABRIEL Team, and The SCOUT-O3-DARWIN/ACTIVE Team: Uncertainties in atmospheric chemistry modelling due to convection parameterisations and subsequent scavenging, Atmos. Chem. Phys., 10, 1931–1951, https://doi.org/10.5194/acp-10-1931-2010, 2010. a
Usoskin, I. and Kovaltsov, G.: Production of cosmogenic 7Be isotope in the atmosphere: Full 3D modelling, J. Geophys. Res., 113, D12107, https://doi.org/10.1029/2007JD009725, 2008. a, b
Usoskin, I., Solanki, S., Kovaltsov, G., Beer, J., and Kromer, B.: Solar proton events in cosmogenic isotope data, Geophys. Res. Lett., 33, L08107, https://doi.org/10.1029/2006GL026059, 2006. a
Usoskin, I., Koldobskiy, S., Kovaltsov, G., Rozanov, E., Sukhodolov, T., Mishev, A., and Mironova, I.: Revisited Reference Solar Proton Event of 23 February 1956: Assessment of the Cosmogenic-Isotope Method Sensitivity to Extreme Solar Events, J. Geophys. Res.-Space, 125, e27921, https://doi.org/10.1029/2020JA027921, 2020a. a, b, c, d, e
Usoskin, I., Koldobskiy, S., Kovaltsov, G. A., Gil, A., Usoskina, I., Willamo, T., and Ibragimov, A.: Revised GLE database: Fluences of solar energetic particles as measured by the neutron-monitor network since 1956, Astron. Astrophys., 640, A17, https://doi.org/10.1051/0004-6361/202038272, 2020b. a
Usoskin, I. G.: A History of Solar Activity over Millennia, Living Rev. Sol. Phys., 14, 3, https://doi.org/10.1007/s41116-017-0006-9, 2017. a
Usoskin, I. G., Field, C. V., Schmidt, G. A., Leppänen, A.-P., Aldahan, A., Kovaltsov, G. A., Possnert, G., and Ungar, R. K.: Short-term production and synoptic influences on atmospheric 7Be concentrations, J. Geophys. Res., 114, D06108, https://doi.org/10.1029/2008JD011333, 2009a. a, b, c
Usoskin, I. G., Horiuchi, K., Solanki, S., Kovaltsov, G. A., and Bard, E.: On the common solar signal in different cosmogenic isotope data sets, J. Geophys. Res., 114, A03112, https://doi.org/10.1029/2008JA013888, 2009b. a, b
Usoskin, I. G., Mironova, I. A., Korte, M., and Kovaltsov, G. A.: Regional millennial trend in the cosmic ray induced ionization of the troposphere, J. Atmos. Sol.-Terr. Phy., 72, 19–25, https://doi.org/10.1016/j.jastp.2009.10.003, 2010. a
Usoskin, I. G., Gil, A., Kovaltsov, G. A., Mishev, A. L., and Mikhailov, V. V.: Heliospheric modulation of cosmic rays during the neutron monitor era: Calibration using PAMELA data for 2006–2010, J. Geophys. Res.-Space, 122, 3875–3887, https://doi.org/10.1002/2016JA023819, 2017. a
Vainio, R., Desorgher, L., Heynderickx, D., Storini, M., Flückiger, E., Horne, R. B., Kovaltsov, G. A., Kudela, K., Laurenza, M., McKenna-Lawlor, S., Rothkaehl, H., and Usoskin, I. G.: Dynamics of the Earth's particle radiation environment, Space Sci. Rev., 147, 187–231, https://doi.org/10.1007/s11214-009-9496-7, 2009. a
Weisenstein, D. K., Yue, G. K., Ko, M. K. W., Sze, N.-D., Rodriguez, J. M., and Scott, C. J.: A two-dimensional model of sulfur species and aerosols, J. Geophys. Res.-Atmos., 102, 13019–13035, https://doi.org/10.1029/97JD00901, 1997. a
Weisenstein, D. K., Keith, D. W., and Dykema, J. A.: Solar geoengineering using solid aerosol in the stratosphere, Atmos. Chem. Phys., 15, 11835–11859, https://doi.org/10.5194/acp-15-11835-2015, 2015. a
Wesely, M. L.: Parameterization of surface resistances to gaseous dry deposition in regional-scale numerical models, Atmos. Environ., 23, 1293–1304, https://doi.org/10.1016/0004-6981(89)90153-4, 1989. a
Wu, C. J., Usoskin, I. G., Krivova, N., Kovaltsov, G. A., Baroni, M., Bard, E., and Solanki, S. K.: Solar activity over nine millennia: A consistent multi-proxy reconstruction, Astron. Astrophys., 615, A93, https://doi.org/10.1051/0004-6361/201731892, 2018. a
Zheng, M., Sjolte, J., Adolphi, F., Aldahan, A., Possnert, G., Wu, M., and Muscheler, R.: Solar and meteorological influences on seasonal atmospheric 7Be in Europe for 1975 to 2018, Chemosphere, 263, 128318, https://doi.org/10.1016/j.chemosphere.2020.128318, 2021. a
Zhou, T., Geller, M. A., and Hamilton, K.: The roles of the Hadley circulation and downward control in tropical upwelling, J. Atmos. Sci., 63, 2740–2757, https://doi.org/10.1175/JAS3770.1, 2006. a
- Abstract
- Introduction
- Overview of previous and existing models
- Data on 7Be measurements
- Model description
- Modeling results
- Evaluation of the model by comparison with direct 7Be measurements
- Conclusions
- Data availability
- Author contributions
- Competing interests
- Disclaimer
- Acknowledgements
- Financial support
- Review statement
- References