the Creative Commons Attribution 4.0 License.
the Creative Commons Attribution 4.0 License.
 | 03 Feb 2021
Development of WRF/CUACE v1.0 model and its preliminary application in simulating air quality in China
Lei Zhang
Sunling Gong
Tianliang Zhao
Chunhong Zhou
Yuesi Wang
Jiawei Li
Dongsheng Ji
Jianjun He
Hongli Liu
Xiaomei Guo
Jinhui Gao
Yunpeng Shan
Hong Wang
Yaqiang Wang
Huizheng Che
Xiaoye Zhang
The development of chemical transport models with advanced physics and chemical schemes could improve air-quality forecasts. In this study, the China Meteorological Administration Unified Atmospheric Chemistry Environment (CUACE) model, a comprehensive chemistry module incorporating gaseous chemistry and a size-segregated multicomponent aerosol algorithm, was coupled to the Weather Research and Forecasting (WRF) framework with chemistry (WRF-Chem) using an interface procedure to build the WRF/CUACE v1.0 model. The latest version of CUACE includes an updated aerosol dry deposition scheme and the introduction of heterogeneous chemical reactions on aerosol surfaces. We evaluated the WRF/CUACE v1.0 model by simulating PM2.5, O3, NO2, and SO2 concentrations for January, April, July, and October (representing winter, spring, summer and autumn, respectively) in 2013, 2015, and 2017 and comparing them with ground-based observations. Secondary inorganic aerosol simulations for the North China Plain (NCP), Yangtze River Delta (YRD), and Sichuan Basin (SCB) were also evaluated. The model captured well the variations of PM2.5, O3, and NO2 concentrations in all seasons in eastern China. However, it is difficult to accurately reproduce the variations of air pollutants over SCB, due to its deep basin terrain. The simulations of SO2 were generally reasonable in the NCP and YRD with the bias at −15.5 % and 24.55 %, respectively, while they were poor in the Pearl River Delta (PRD) and SCB. The sulfate and nitrate simulations were substantially improved by introducing heterogeneous chemical reactions into the CUACE model (e.g., change in bias from −95.0 % to 4.1 % for sulfate and from 124.1 % to 96.0 % for nitrate in the NCP). Additionally, The WRF/CUACE v1.0 model was revealed with better performance in simulating chemical species relative to the coupled Fifth-Generation Penn State/NCAR Mesoscale Model (MM5) and CUACE model. The development of the WRF/CUACE v1.0 model represents an important step towards improving air-quality modeling and forecasts in China.
- Article
(5705 KB) - Full-text XML
-
Supplement
(1093 KB) - BibTeX
- EndNote


The atmosphere is an extremely complex reaction system in which a large number of chemical and physical processes occur at every moment. Numerical modeling has become an effective means to study atmospheric environmental changes and their mechanisms due to its capability at large spatial-temporal scales and with high resolution. Against the continuing rapid increase in fine-particle pollution in China, chemical transport models (CTMs) have been developed in recent years, and new physical and chemical atmospheric mechanisms have been presented, for instance, heterogeneous chemical reactions, the production of secondary organic and inorganic aerosols, and dry deposition schemes. However, some of the mechanisms have yet to be well parameterized into CTMs for air-quality forecasts in China. Numerical modeling in combination with field observations and laboratory analyses is constantly improving our understanding of atmospheric physical and chemical processes. There is an urgent need to develop and improve CTMs to provide more powerful tools for studying the atmospheric environment, in particular for the mitigation of fine-particle pollution in China.
Meteorological conditions are accepted as one of the main factors affecting atmospheric chemical processes and the aerial transport of noxious materials, and, in turn, chemical species can impact meteorological conditions by radiation feedback and cloud formation (Grell and Baklanov, 2011). Historically, CTMs were developed separately from meteorological models owing to the complexity of the atmosphere and the economics of computer calculations. Thus, CTMs were generally driven by meteorological datasets from a pre-run of the meteorological model. Information about the rapid meteorological processes, such as changes in wind direction and speed or the planetary boundary layer, are barely recorded by the low-temporal-resolution meteorological outputs (typically once or twice per hour), which may impact the accuracy of the air-quality forecasts. Coupled systems that realize the synchronous integration and two-way interactions of meteorology and chemistry are an important development for the traditional CTM approach to air-quality forecasting, and there have been many endeavors devoted to this (Jacobson et al., 1996; Lin et al., 2020; Lu et al., 2020; Zhang et al., 2010).
To tackle serious air pollution in China and East Asia, with a particular focus on haze pollution forecasting, the China Meteorological Administration (CMA) has been developing the Chinese Unified Atmospheric Chemistry Environment (CUACE) model, a chemistry module that can be driven by meteorological models. The CUACE has been integrated into the Fifth-Generation Penn State/NCAR Mesoscale Model (MM5) and the mesoscale version of the Global/Regional Assimilation and Prediction System (GRAPES, a meteorological model developed by CMA) to build a fog–haze forecasting system (An et al., 2016; H. Wang et al., 2015; Zhou et al., 2012). Both of these coupled systems have been running operationally at national and provincial meteorological administrations since 2014 and have been used for air-quality assurance for many major events in China. However, active development of the MM5 model ended with version 3.7.2 in 2005, and it has been largely superseded by the Weather Research and Forecasting (WRF) model (Skamarock et al., 2008). The WRF model has been shown to have a better performance relative to the MM5 model due to its better numerical dynamic core and greater number of physical parameterization schemes, and it is now used as a host model for coupling with different CTMs for scientific research and air-quality forecasting, such as the WRF-Chem and WRF-CMAQ models (Grell et al., 2005; Wong et al., 2012). The WRF model has also been used to provide pre-run meteorological fields to drive models such as CAMx and FLEXPART, as well as to provide boundary and initial fields for local-scale models. Therefore, it is important to develop the CUACE module by coupling it with state-of-the-art meteorological models.
The chemical reaction mechanisms in the CUACE module, as well as in current CTMs, are proposed under clean conditions. In the context of composite air pollution in China, particularly during severe haze episodes with a rapid increase in fine particles (PM2.5), their applicability needs to be improved. Heterogeneous chemical reactions, mechanisms missing in current models, were revealed as a crucial factor to explain the dramatic increase in PM2.5 during hazy days (Zheng et al., 2015), such as the heterogeneous uptake of dinitrogen pentoxide at night (Wang et al., 2017), and the heterogeneous oxidation of dissolved SO2 by NO2 (Gao et al., 2016; Seinfeld and Pandis, 1998). Another process focused on here is the dry deposition of particles, where the difference between model predictions and field measurements appears greatest for vegetated canopies and for the accumulation size range of airborne particles. Ongoing research is investigating the factors that give rise to this discrepancy and providing new approaches to predicting the deposition (Hicks et al., 2016). However, few studies have incorporated these mechanisms into 3D CTMs (Wu et al., 2018).
The objectives of this study were to develop the CUACE module from three aspects: (1) introduce heterogeneous reactions and update the dry deposition scheme of particles, (2) couple the CUACE to the WRF model to build the WRF/CUACE v1.0 system, and (3) evaluate the model against observations of surface air pollutants.
2.1 WRF model
The Advanced Research WRF version 3 (WRF-ARW) is used to simulate meteorological processes and advection of atmospheric components in the WRF/CUACE v1.0 model. The WRF-ARW is a state-of-the-science mesoscale meteorological model, making simulations that are based on actual atmospheric conditions or idealized conditions feasible (Langkamp and Böhner, 2011). The equation set for the WRF-ARW is fully compressible and Eulerian non-hydrostatic with a run-time hydrostatic option. It is conservative for scalar variables. The prognostic variables consist of velocity components u and v in Cartesian coordinates, vertical velocity w, perturbation potential temperature, perturbation geopotential, and perturbation surface pressure of dry air, as well as several optional prognostic variables depending on the model physical options (Skamarock et al., 2008; Wong et al., 2012).
2.2 CUACE module
The CUACE is a unified chemistry module, which treats most of the physical and chemical processes, except advection and convection processes that are done by its host model. The main processes treated in the CUACE module include emissions, gas chemistry, dry and wet deposition, vertical mixing, aerosol–cloud interaction, and clear air (i.e., aerosols produced by chemical transformation of their precursors together with particle nucleation, condensation, and coagulation) (An et al., 2016; Zhou et al., 2012; Gong et al., 2003).
The CUACE is typically configured with the second generation of the Regional Acid Deposition Model (RADM2) as its gas chemistry module, which represents 63 species through 21 photochemical reactions and 136 gas phase reactions. As the gaseous chemistry (RADM2) in the CUACE module is not computationally economic and it is hard coded, which means that it is not conducive to adapting chemical reactions in the future, the CBM-Z photochemical mechanism (Zaveri and Peters, 1999) with a better computational efficiency is added with the KPP protocol (Damian et al., 2002) to replace the RADM2 mechanism. The CBM-Z mechanism contains 55 species, 114 reactions, and 20 photochemical reactions. It is based on the widely used carbon bond mechanism (CBM-IV) and uses the lumped structure approach for condensing organic species and reactions. CBM-Z extends the CBM-IV to include revised inorganic chemistry; explicit treatment of the lesser reactive paraffins, methane and ethane; revised treatments of reactive paraffin, olefin, and aromatic reactions; inclusion of alkyl and acyl peroxy radical interactions and their reactions with NO3; inclusion of organic nitrates and hydroperoxides; and revised isoprene chemistry. Currently, stratospheric chemistry is not included in the CUACE module. Species (i.e., CH4, CO, O3, NO, NO2, HNO3, N2O5, and N2O) above a specified pressure level are fixed to climatological values. Between the specified pressure level and the tropopause level, the species was relaxed with a 10 d relaxation factor.
The Canadian Aerosol Module (CAM) (Gong et al., 2003) is adopted as its aerosol module. There are in total seven types of aerosols treated in CAM, i.e., black carbon, primary organic carbon, sulfates, nitrates, ammonium, soil dust, and sea salts. The sea salt emissions are calculated online using the parametrization scheme developed by Gong et al. (2003). Soil dust emissions are simulated using the Marticorena–Bergametti–Alfaro scheme (Alfaro and Gomes, 2001; Marticorena and Bergametti, 1995). With the exception of ammonium, the aerosol size spectrum is divided into 12 bins with fixed boundaries of 0.005–0.01, 0.01–0.02, 0.02–0.04, 0.04–0.08, 0.08–0.16, 0.16–0.32, 0.32–0.64, 0.64–1.28, 1.28–2.56, 2.56–5.12, 5.12–10.24, and 10.24–20.48 µm. A detailed description of aerosol physical and chemical processes in the CAM module can be found in Gong et al. (2003).
3.1 Update with particle dry deposition scheme
The CUACE module currently parameterizes particle dry deposition velocity according to the method of Zhang et al. (2001) (Z01), which tends to overestimate the dry deposition, especially for fine particles (Petroff and Zhang, 2010). In this study, we use the scheme developed by Petroff and Zhang (2010) (PZ10) to replace the original scheme in the CUACE module. The most significant difference between the Z01 and PZ10 scheme is the treatment of Rs, which stands for the dry velocity contributed by surface resistance, consisting of Brownian diffusion, turbulent impaction, interception, and rebound. According to the study of Wu et al. (2018), the dry deposition velocity of fine particles is strongly affected by the Brownian diffusion and turbulent impaction. Thereby, it could be inferred that the Z01 scheme is prone to overestimate the effect of Brownian diffusion and turbulent impaction. In a recent study by Emerson et al. (2020), with an observationally constrained approach, the Z01 scheme was revised to have a weaker effect of Brownian diffusion and as a result showed better performance in simulating the dry deposition velocity of fine particles.
Both of the Z01 and PZ10 schemes use the “resistance” analogy, but with quite different formulas. The PZ10 scheme improved the surface resistance and collection efficiency of the Z01 scheme to overcome the problem of overestimating the dry deposition velocity of fine particles. The PZ10 scheme is detailed as follows:
Here Vd is the dry deposition velocity; Vdrift represents drift velocity, which is equal to the sum of gravitational settling and phoretic velocity and is expressed as
where Vg is the gravitational settling velocity and Vphor accounts for the phoretic effects that are related to differences in temperature, water vapor, or electricity between the collecting surfaces and the air (Wu et al., 2018).
The aerodynamic resistance (Ra) and surface resistance (Rs) are calculated differently for vegetated and unvegetated surfaces. For vegetated surfaces, Ra is parameterized as
where κ is the von Karman constant (0.4), u∗ is the friction velocity above the canopy, zR is the reference height, h is the canopy height, d is the displacement height of the canopy, LO is the Obhukov length, and Ψh is the integrated form of the stability function for heat.
Surface resistance (Rs) is generally expressed as the reciprocal of the surface deposition velocity (Vds), which is parameterized as
where is the total collection efficiency on the ground below the vegetation. Egb and Egt represent Brownian diffusion and turbulent impaction, respectively. Egb is parameterized as
where F is a function of the Schmidt number (Sc) and is parameterized as . Egt is expressed as
where CIT is a constant taken as 0.14, and is a function of non-dimensional relaxation time of the particle (Petroff et al., 2010).
In Eq. (4), the non-dimensional timescale parameter, Q, represents the ratio of the turbulent transport timescale to vegetation collection timescale, and Qg is the analogy of Q used for the transfer to the ground. Q≪1 characterizes a situation where turbulent mixing is efficient and the transfer of particles is limited by the collection efficiency on leaves. Meanwhile, Q≫1 corresponds to a situation where particles are efficiently collected by leaves and transfer of turbulent mixing is limited. Q and Qg are defined as
where LAI is the two-sided leaf area index, ET is the total collection efficiency by various physical processes, and lmp is the mixing length for particles. ET is expressed as
where Uh is the horizontal mean wind speed at canopy height h, and EB, EIN, EIM, and EIT are the collection efficiencies by Brownian diffusion, interception, inertial impaction, and turbulent impaction, respectively. The term η is taken as
where α is the aerodynamic extinction coefficient and is expressed as
where kx is the inclination coefficient of the canopy elements and ϕm is the non-dimensional stability function for momentum.
For non-vegetated surfaces, the aerodynamic resistance Ra is calculated as
and the surface deposition velocity Vds is expressed as
3.2 Introduction of heterogeneous chemistry
The study of heterogeneous chemical reactions mostly focuses on the surface of dust aerosols, but the parameterization schemes of heterogeneous chemical reactions on different types of aerosol have not been well established (Zheng et al., 2015). The following are the heterogeneous chemical reactions on aerosol surfaces that added to the CUACE module in this study (“Aerosol” in the reactions stands for all the aerosols in the model):
Reactions (R2), (R4)–(R6), and (R9) describe the formation of sulfate and nitrate on the surface of sand dust, and the other four reactions describe mineral aerosols as sinks of gaseous substances. In this study, these nine heterogeneous reactions were extended to all types of aerosol surface in the CUACE, referring to the approach of Zheng et al. (2015) for the CMAQ model. The first-order chemical kinetic equation for calculating the adsorption efficiency of a gas on an aerosol surface is
where Ci represents the concentration of gas i, and ki is the pseudo-first-order rate constant and is supposed to be irreversible. The value of ki is defined referring to Jacob (2000) as
where a is the aerosol diameter, Di is the diffusion coefficient for gas reactant i, vi is the mean molecule speed of gas reactant i, γi is the uptake coefficient of the heterogeneous reaction for the gas reactant i, and A is the surface area of aerosols in unit volume air. The value of γi is obtained from previous laboratory studies (Table 1), and other parameters are calculated in the WRF/CUACE v1.0 model.
Table 1Uptake coefficients for Reactions (R1)–(R9).
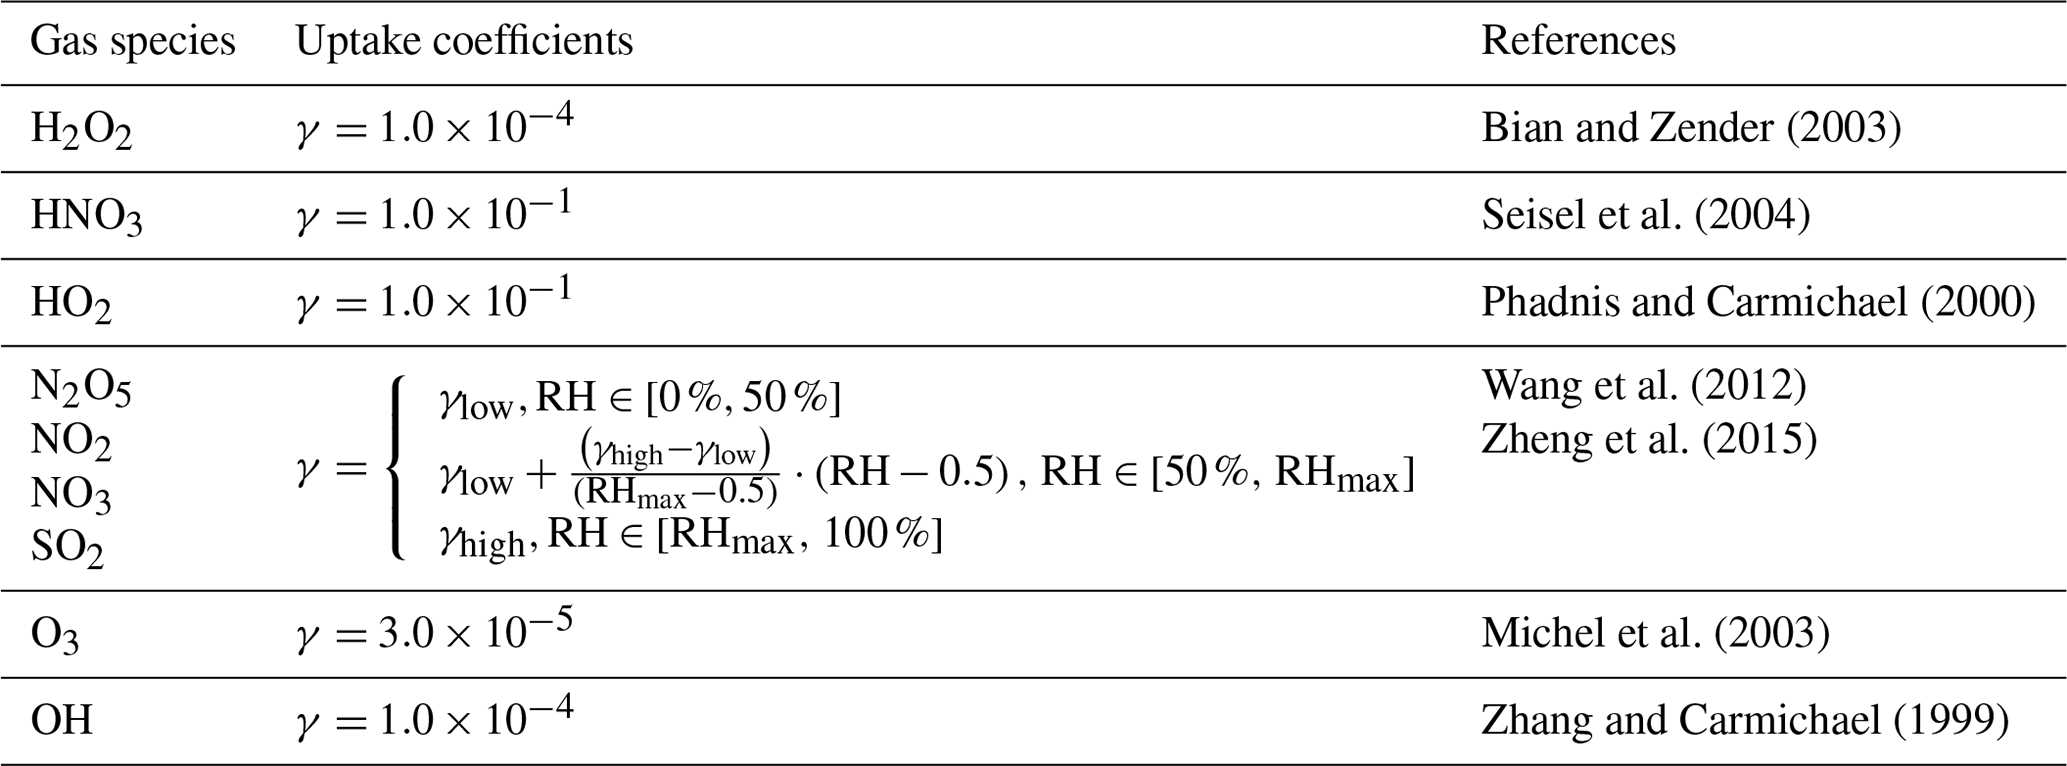
The γlow and γhigh are the lower and upper limits of γ values. The RHmax is the RH value at which the γ reaches the upper limit. The values of γlow, γhigh, and RHmax are taken from the work of Zheng et al. (2015) and Wang et al. (2012). That is, values of γlow for N2O5, NO2, NO3, and SO2 are , , 0.1, and , respectively, corresponding to the values of γhigh at 0.1, , 0.23, and . The RHmax is 70 % for NxOy, and is 100 % for SO2.
The coupling of the WRF/CUACE v1.0 model is based on the framework of the WRF-Chem model and uses most of its existing infrastructure. WRF-Chem is a meteorology–chemistry coupled model. In the chemical module of the WRF-Chem, the processes are split to emissions, vertical mixing, dry deposition, convection, gas chemistry, cloud chemistry, aerosol chemistry, and wet deposition, all of which are integrated in an interface procedure (chem_driver). The advection process is treated in the WRF model. Information, such as rainfall rates, vertical mixing coefficients, and convective updraft properties, is provided by WRF to calculate the processes treated in the chemical module. WRF-Chem uses registry tools for automatic generation of application code. Physical and chemical variables as well as options of parameterization schemes are coded in files (such as registry.chem) in the directory of WRFV3/Registry, which provides the convenience for developers to add variables and options.
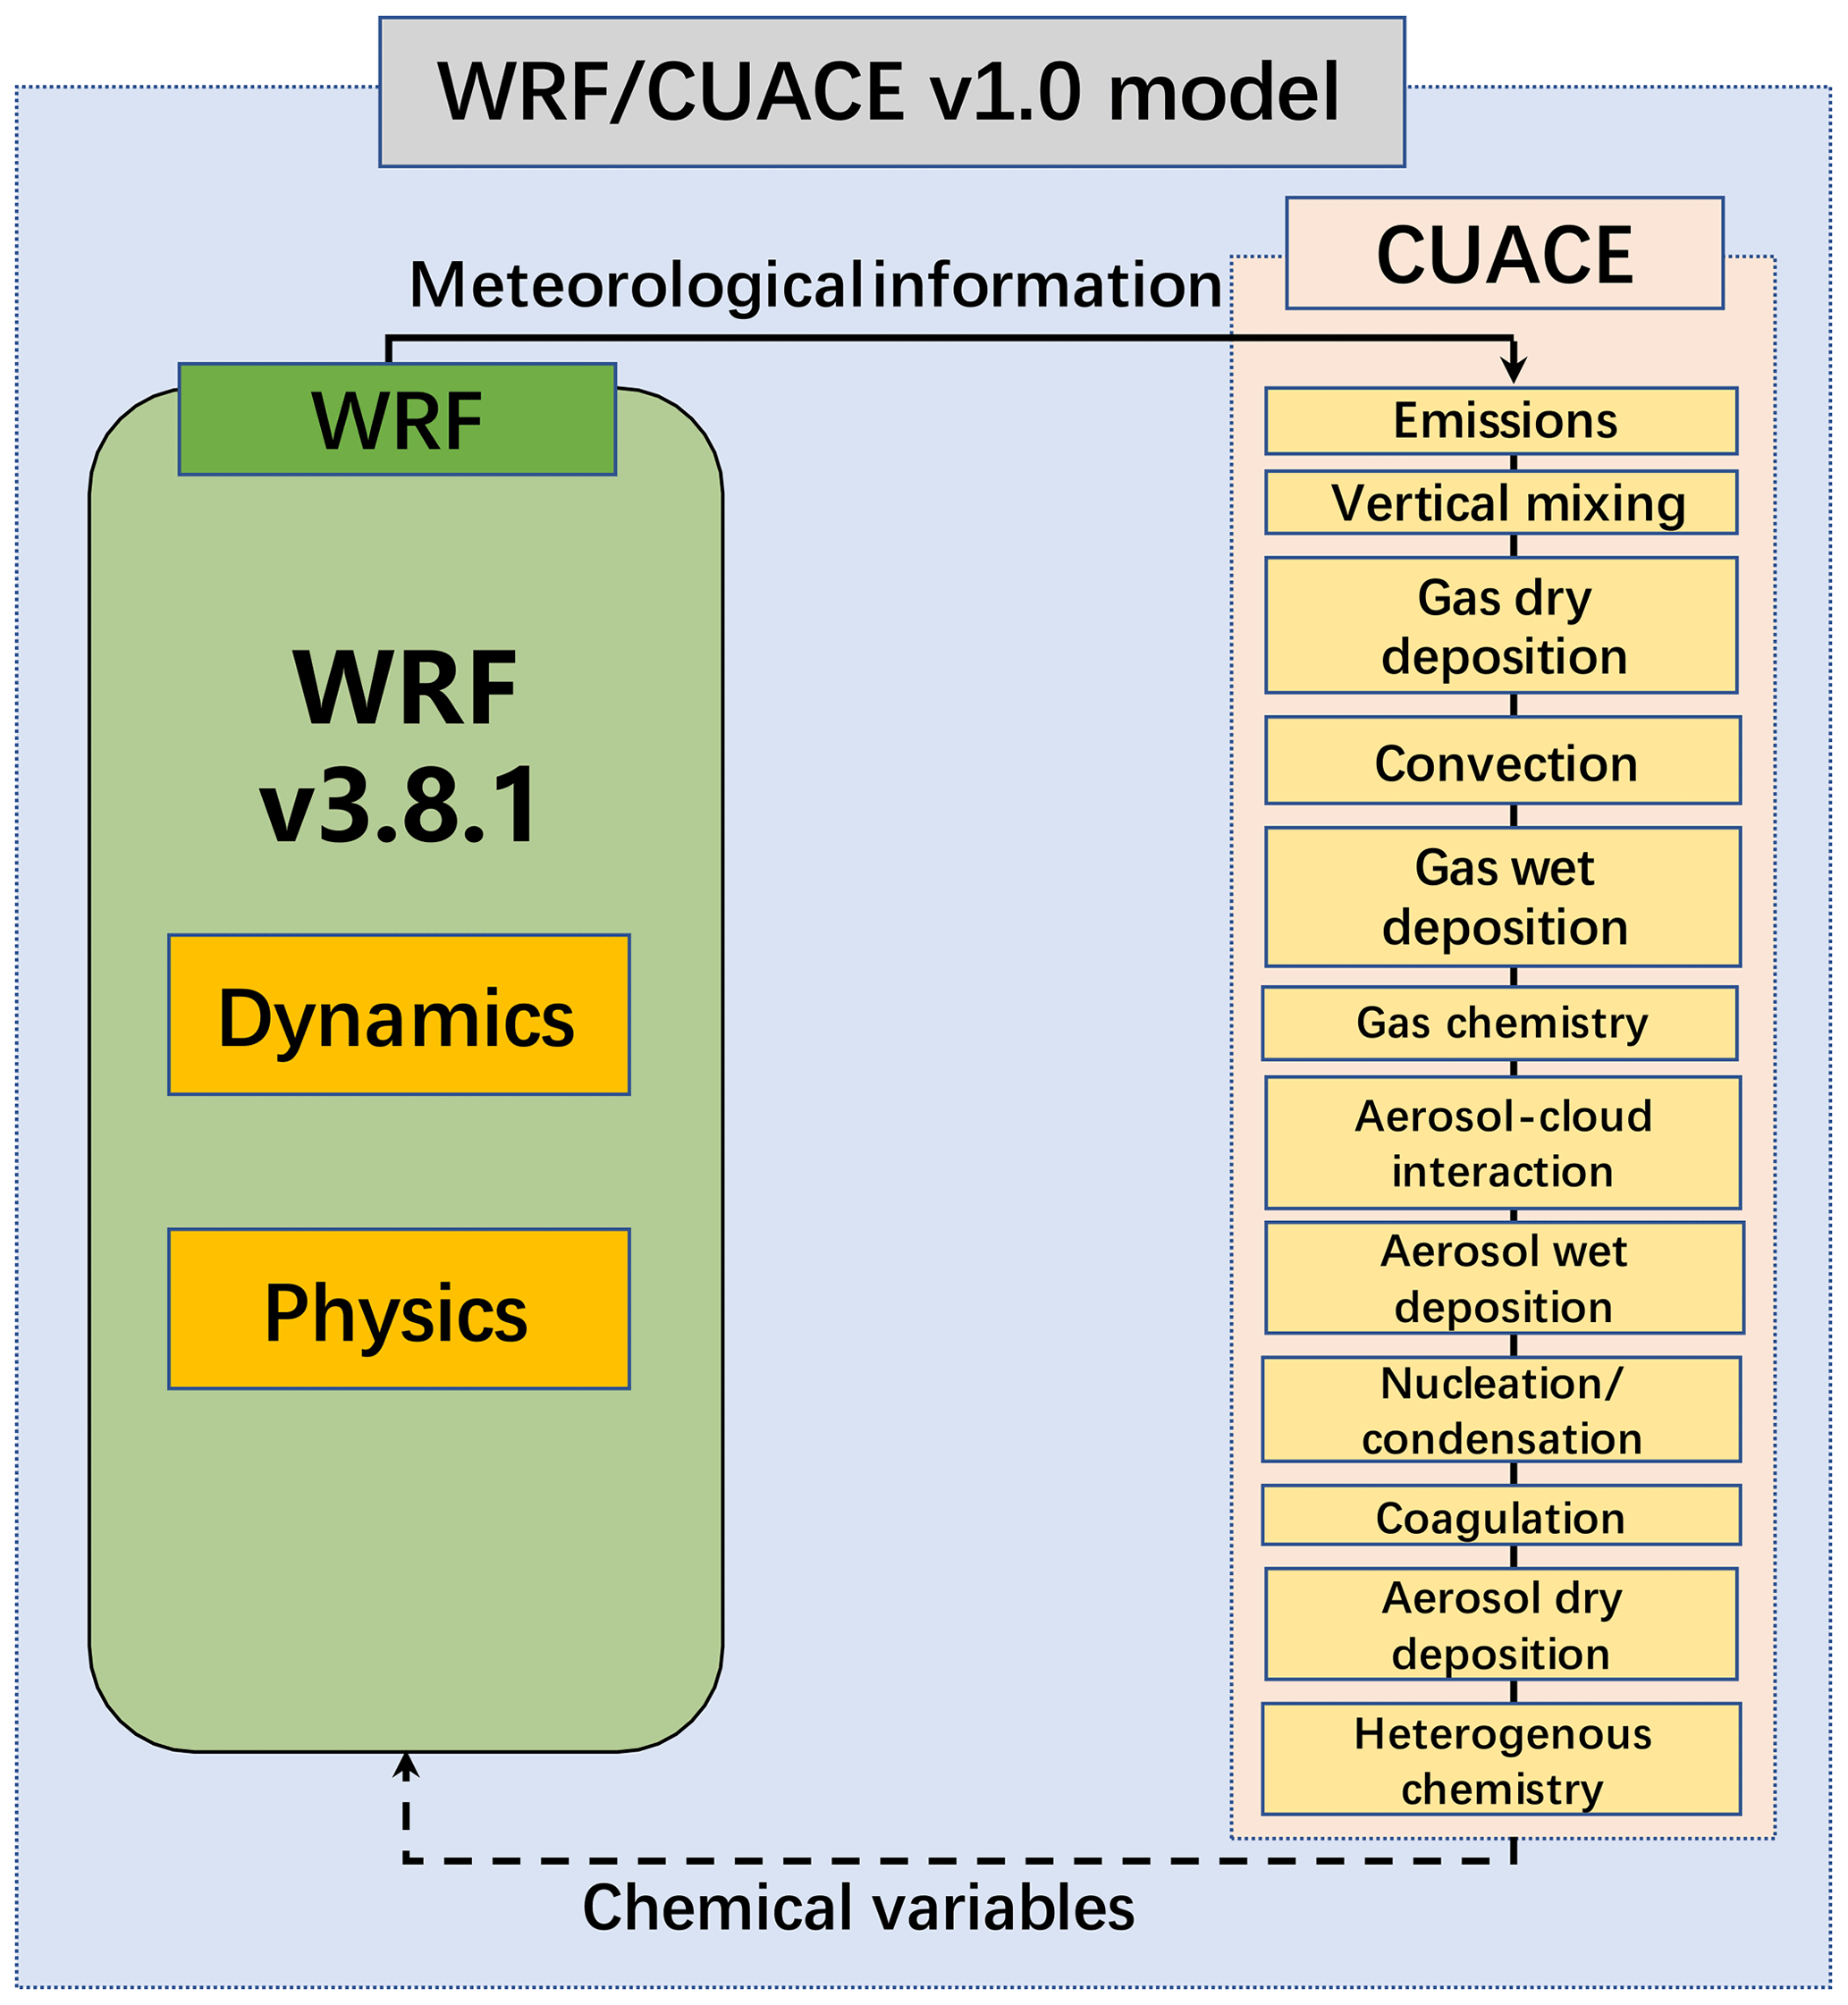
Following the registry tools in the WRF-Chem model, a registry file (registry.cuace) is written to store the chemical variables and startup option of the CUACE module. The flow of the major process splitting in the coupled WRF/CUACE v1.0 model is illustrated in Fig. 1 with the structure of related subroutines given in Fig. S1 in the Supplement. The WRF/CUACE v1.0 model uses several modules of the original WRF-Chem model, i.e., modules of advection, vertical mixing, convection, biomass emissions, anthropogenic gas emissions, photolysis, and gas dry and wet deposition (Fig. S1). As described in Sect. 2.2, the CBM-Z mechanism is newly added with the KPP protocol (Damian et al., 2002) to replace the RADM2 mechanism in the original CUACE module. An interface procedure, cuace_driver, is designed to integrate the core sections of the aerosol physical and chemical processes of the CUACE module with the WRF framework (Fig. S1).
No spatial interpolation of the meteorological and chemical data is required as both the CUACE and the WRF models can be configured to the same grid configurations and coordinate systems. The feedback of chemical species on meteorology in the current WRF/CUACE version is not realized but is under development and will be released in a future paper.
Table 2Physical parameterization schemes used in the modeling study.
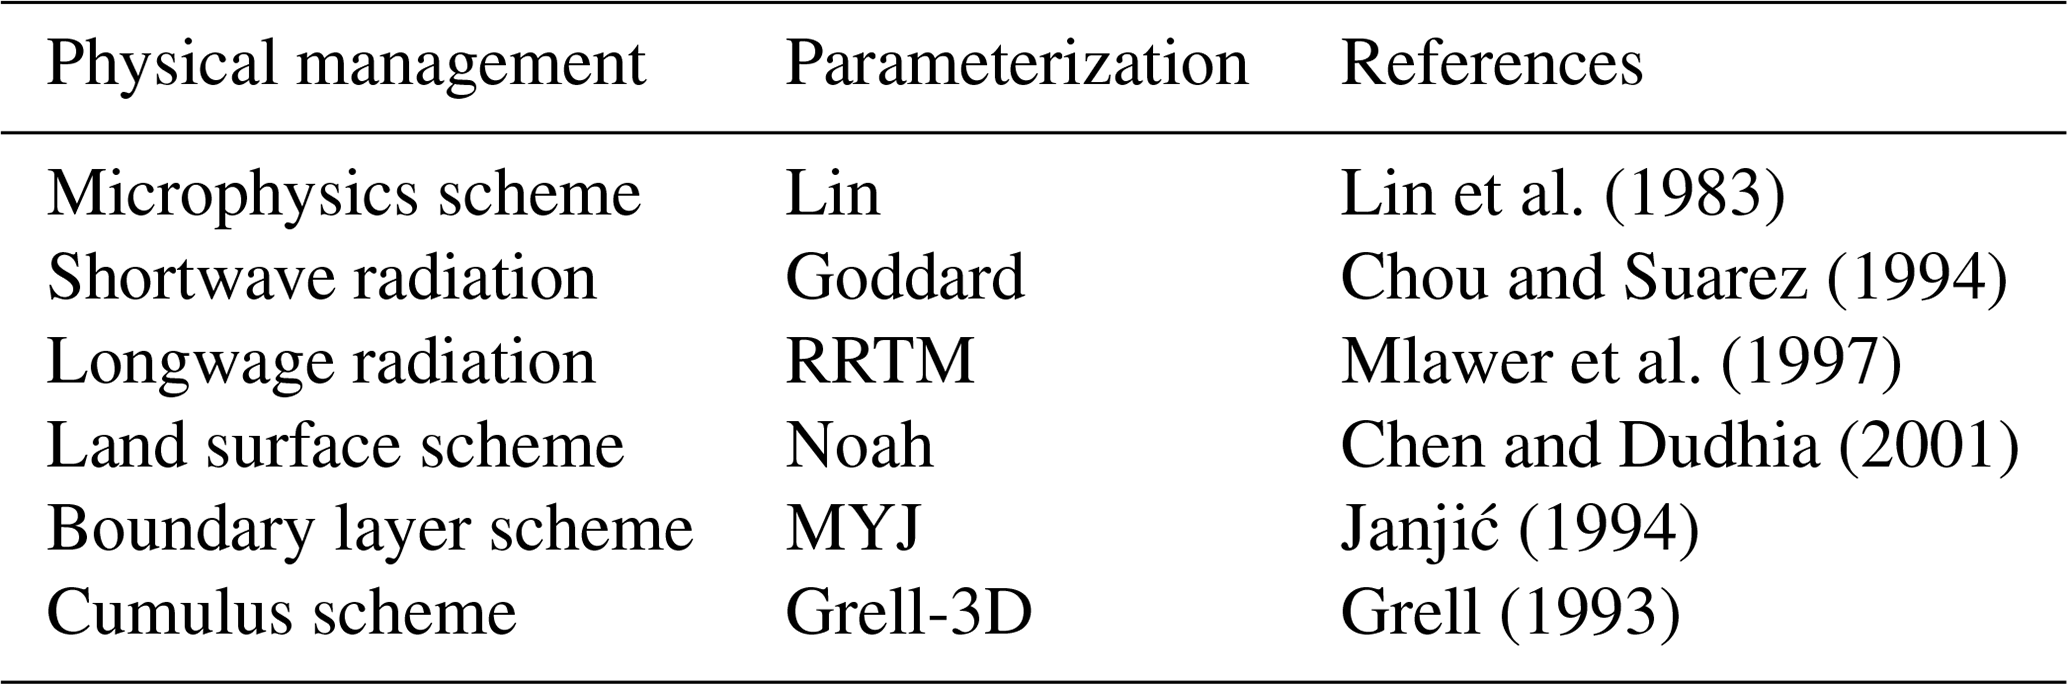

Figure 2Model domains with the terrain distribution, and the locations of cities where the surface observations of air pollutants are used for model evaluation. Langfang, Nanjing, and Chengdu marked in this figure indicate where the SIA observations are collected for evaluation of SIA simulations.
5.1 Model configuration
At present, there are four major polluted areas in China, namely, the North China Plain (NCP), the Yangtze River Delta (YRD), the Pearl River Delta (PRD), and Sichuan Basin (SCB). To include all these regions, the simulation area is configured as in Fig. 2. There are two domains in total. The boundary field of the inner domain is obtained by the interpolation of its outer domain. The outer region covers the whole of East Asia and its adjacent areas with a horizontal resolution of 54 km and a total of 120×110 grids centered at 30.46∘ N and 105.82∘ E. The inner region covers most of China on the east side of the Qinghai–Tibet Plateau with a horizontal resolution of 18 km and 193×175 grids. There are 32 vertical layers with the top pressure at about 100 hPa. The main physical and chemical options in the model are shown in Table 2. With WRF used in non-hydrostatic mode, we performed two simulations: one for January, April, July, and October in three years, 2013, 2015, and 2017, to evaluate the model on a long timescale, and one for three periods during which SIA observations were conducted (i.e., 5–16 January 2019 in Langfang, 3–29 December 2013 in Nanjing, and 1–10 January 2017 in Chengdu), to investigate improvements in simulating SIA with heterogeneous chemistry.
The model uses the FNL global reanalysis data of the NCEP (National Centers for Environmental Prediction) to provide the meteorological initial and boundary fields with spatial and temporal resolution of 6 h and 1∘ × 1∘, respectively. The initial and boundary chemistry conditions are based on the vertical profiles of O3, SO2, NO2, VOCs (volatile organic compounds), and other air pollutants from the NOAA Aeronomy Lab Regional Oxidant Model (NALROM) (Liu et al., 1996).
Anthropogenic emissions are derived from the MIX emission inventory representative for 2010 (http://www.meicmodel.org/dataset-mix.html, last access: 18 February 2020) (Li et al., 2017), which is an Asian anthropogenic emissions inventory developed for the third phase of the East Asian Model Comparison Plan (MICS-Asia III) and the United Nations Hemispheric Atmospheric Pollution Transport Plan (HTAP). The inventory provides monthly grid emission data with 0.25∘ spatial resolution for five emission sectors (electricity, industry, civil, transportation, and agriculture), including PM2.5, PM10, nitrogen oxides (NOx), sulfur dioxide (SO2), carbon monoxide (CO), NH3, black carbon (BC), organic carbon (OC), and non-methane volatile organic compounds (NMVOCs). During the simulation span from 2013 to 2017, China carried out strict air pollution control measures, which had a considerable impact on anthropogenic emissions. To make the anthropogenic emissions more suitable for the real emissions scenarios in the simulated years, the emissions in mainland China were replaced with the MEIC emissions inventory representative for 2012, 2014, and 2016 to represent the emissions scenarios in 2013, 2015, and 2017, respectively. Figure S2 in the supplement shows the MEIC emissions of PM2.5, NOx, SO2, and CO in the three years, from which it can be seen that anthropogenic emissions of PM2.5, SO2, and CO decreased remarkably from 2012 to 2016.
For the vertical interpolation, we used the settings of Wang et al. (2010) and Zhou et al. (2017). The industrial emissions were allocated as 50 %, 30 %, and 20 % in layers one to three of the model, respectively, and the power plant emission sources were allocated as 14 %, 46 %, 35 %, and 5 % in model layers two to five, respectively. The emissions from transportation, residential areas, and agriculture were 95 % and 5 %, respectively, in the first and second layers of the model. Then, the inventory was distributed into hourly emissions using the monthly, weekly, and hourly profiles established by Tsinghua University (2006). VOCs released from vegetation were calculated online using the MEGAN model (Guenther, 2006).
5.2 Evaluation against ground-based observations
5.2.1 Meteorological evaluation
The simulated hourly temperature at 2 m (T2), hourly relative humidity at 2 m (RH2), and hourly wind speed at 10 m (WS10) were selected for evaluation. Table S1 in the Supplement shows the observation mean, simulation mean, correlation coefficient (R), mean bias (MB), mean error (ME), and root mean square error (RMSE) of the meteorological fields in the NCP, YRD, PRD, and SCB. The MB and RMSE for T2 vary from 0.48 to 1.14 ∘C and from 2.01 to 2.50 ∘C, respectively, indicating surface temperatures are slightly overestimated in the four regions. The R value for T2, ranging from 0.88 to 0.93, indicates the variation trends are captured well by the model. The model underestimates RH2 in the four regions with the MB ranging from −6.22 % to −14.30 % and the RMSE ranging from 13.95 % to 18.77 %, which are comparable with previous studies in China (Wang et al., 2014; Gao et al., 2016). The RMSE for WS10 in the four regions varies from 1.47 to 1.61 m s−1, falling within the “good” model performance criteria (less than 2 m s−1) proposed by Emery et al. (2001). However, it should be noted that the R for WS10 in the SCB is relatively poor, indicating the variation trends were not captured well. The simulations of T2 and RH2 in the SCB are relatively poorer than other regions as well. For example, the R, MB, and RMSE values of T2 in the SCB are 0.88, 1.52, and 2.50 ∘C, respectively, while the values in the other three regions vary from 0.91 to 0.93, 0.48 to 1.14 ∘C, and 2.01 to 2.39 ∘C. Generally, the model performed best in the YRD, followed by the PRD and NCP, and performed worst in the SCB for meteorological fields.
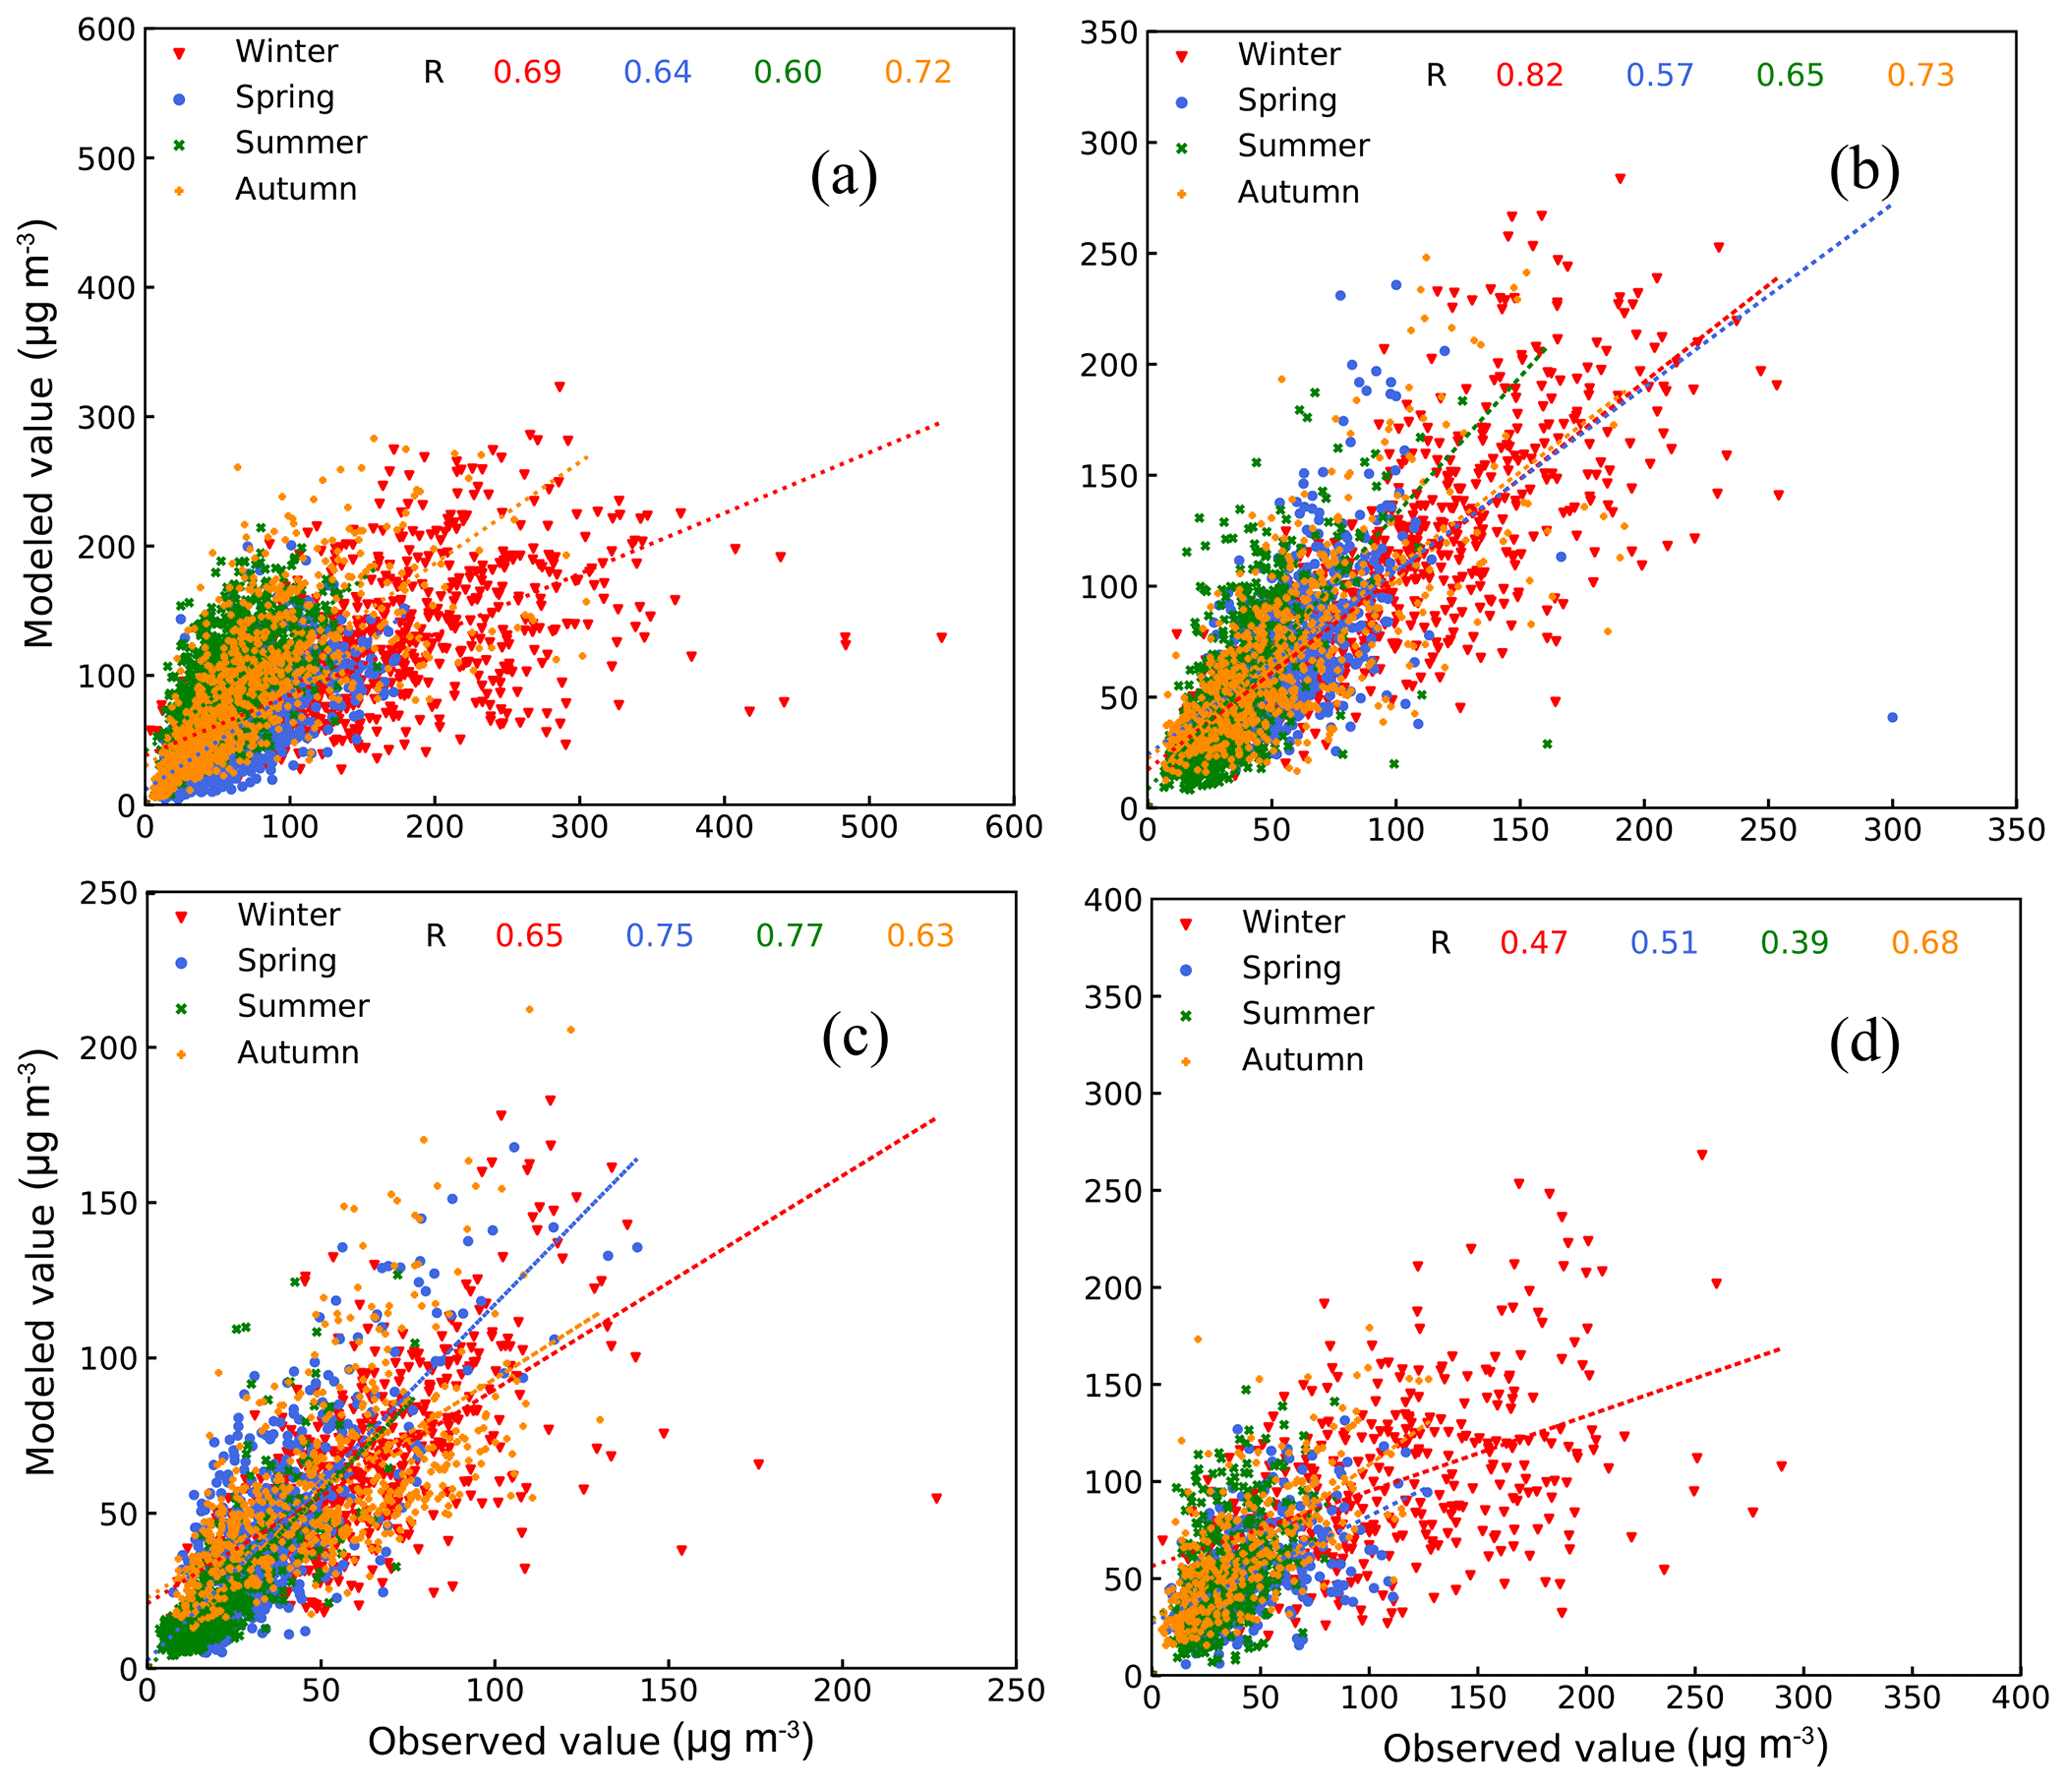
Figure 3Scatter plots and correlation coefficients of daily PM2.5 concentrations between observed and simulated values in different seasons in the (a) NCP, (b) YRD, (c) PRD, and (d) SCB regions.
5.2.2 Chemical evaluation
In view of the spatial–temporal differences in the haze pollution that occur in the four different regions (i.e., NCP, YRD, PRD, and SCB), here we assessed surface PM2.5, O3, NO2, and SO2 simulated in the WRF/CUACE v1.0 model by region and season. Figure 3 presents a comparison of the modeled and observed daily mean PM2.5 concentrations in spring, summer, autumn, and winter in the four regions. Overall, the WRF/CUACE v1.0 model well captured the variations in the PM2.5 concentration, but with different performance in different regions and seasons. The correlation coefficients (R) for the NCP, YRD, and PRD are mostly above 0.60 and passed the 99 % significance test. The R value between the YRD and PRD is the highest (generally higher than 0.65), followed by the NCP. The NCP, YRD, and SCB simulations in autumn and winter are generally better than those in spring and summer according to the R values, while that in the PRD is the opposite with a better performance during spring and summer seasons. The simulations are relatively poor in the SCB, where the complex terrain poses great challenges to meteorological field simulations (Table S1 in the Supplement).

Figure 4Scatter plots of modeled and observed hourly concentrations of (a–d) O3, (e–h) NO2, and (i–l) SO2 in the NCP, YRD, PRD, and SCB regions.
It is noteworthy that the WRF/CUACE v1.0 model systematically underestimated the daily PM2.5 concentrations in the NCP when it exceeded about 200 µg m−3, which mostly happened during winter (Fig. 4a). By comparing the time series of observations and simulations (not shown), we found that the underestimation mainly occurred in the period of heavy haze pollution in some cities (such as Shijiazhuang, Hengshui, Handan, etc.). Two factors might be responsible for this. One is the uncertainty of emission sources. The formulation of an accurate emissions source inventory is always a difficult problem, especially in China. In the NCP, the seasonal difference in emission sources is substantial. A large number of unorganized loose coal combustion emissions during the winter heating season cannot be promptly accounted for by the emissions source inventory system, which increases the uncertainty of the local emission sources. The other factor might be problems in the chemical reaction mechanisms. The haze pollution study found that PM2.5 was mainly composed of secondary particulate matter, including sulfate, nitrate, ammonium salt, and SOA (Huang et al., 2014). During heavy haze episodes, the concentration of sulfate increased substantially, but its formation mechanism remains not well recognized. The main international atmospheric chemical models (such as CMAQ, WRF-Chem, CAMx, etc.) are also found to be not ideal enough to simulate sulfate and SOA during heavy haze pollution in North China. Zheng et al. (2015) and Gao et al. (2016) initially added SO2 heterogeneous processes in the CMAQ and WRF-Chem models, and the simulation results of sulfate improved. Although heterogeneous chemical reaction mechanisms are introduced in this study, the simulation effect of sulfate needs to be further evaluated, and the simulation of SOA is more challenging, involving thousands of VOC species and determination of their saturation, atmospheric oxidation, free radicals, acidity, and basicity. The development of a volatility basis set (VBS) is a major breakthrough that treats the organic gas/particle partitioning with a spectrum of volatilities using a saturation vapor concentration as the surrogate of volatility (Ahmadov et al., 2012; Donahue et al., 2006; K. Wang et al., 2015).
Table 3Statistical metrics for hourly PM2.5 in four haze-contaminated areas (2013–2017), in which bold, normal and italic font for MFB and MFE correspond to the “excellent”, “good” and “average” levels in Morris et al. (2005), respectively.
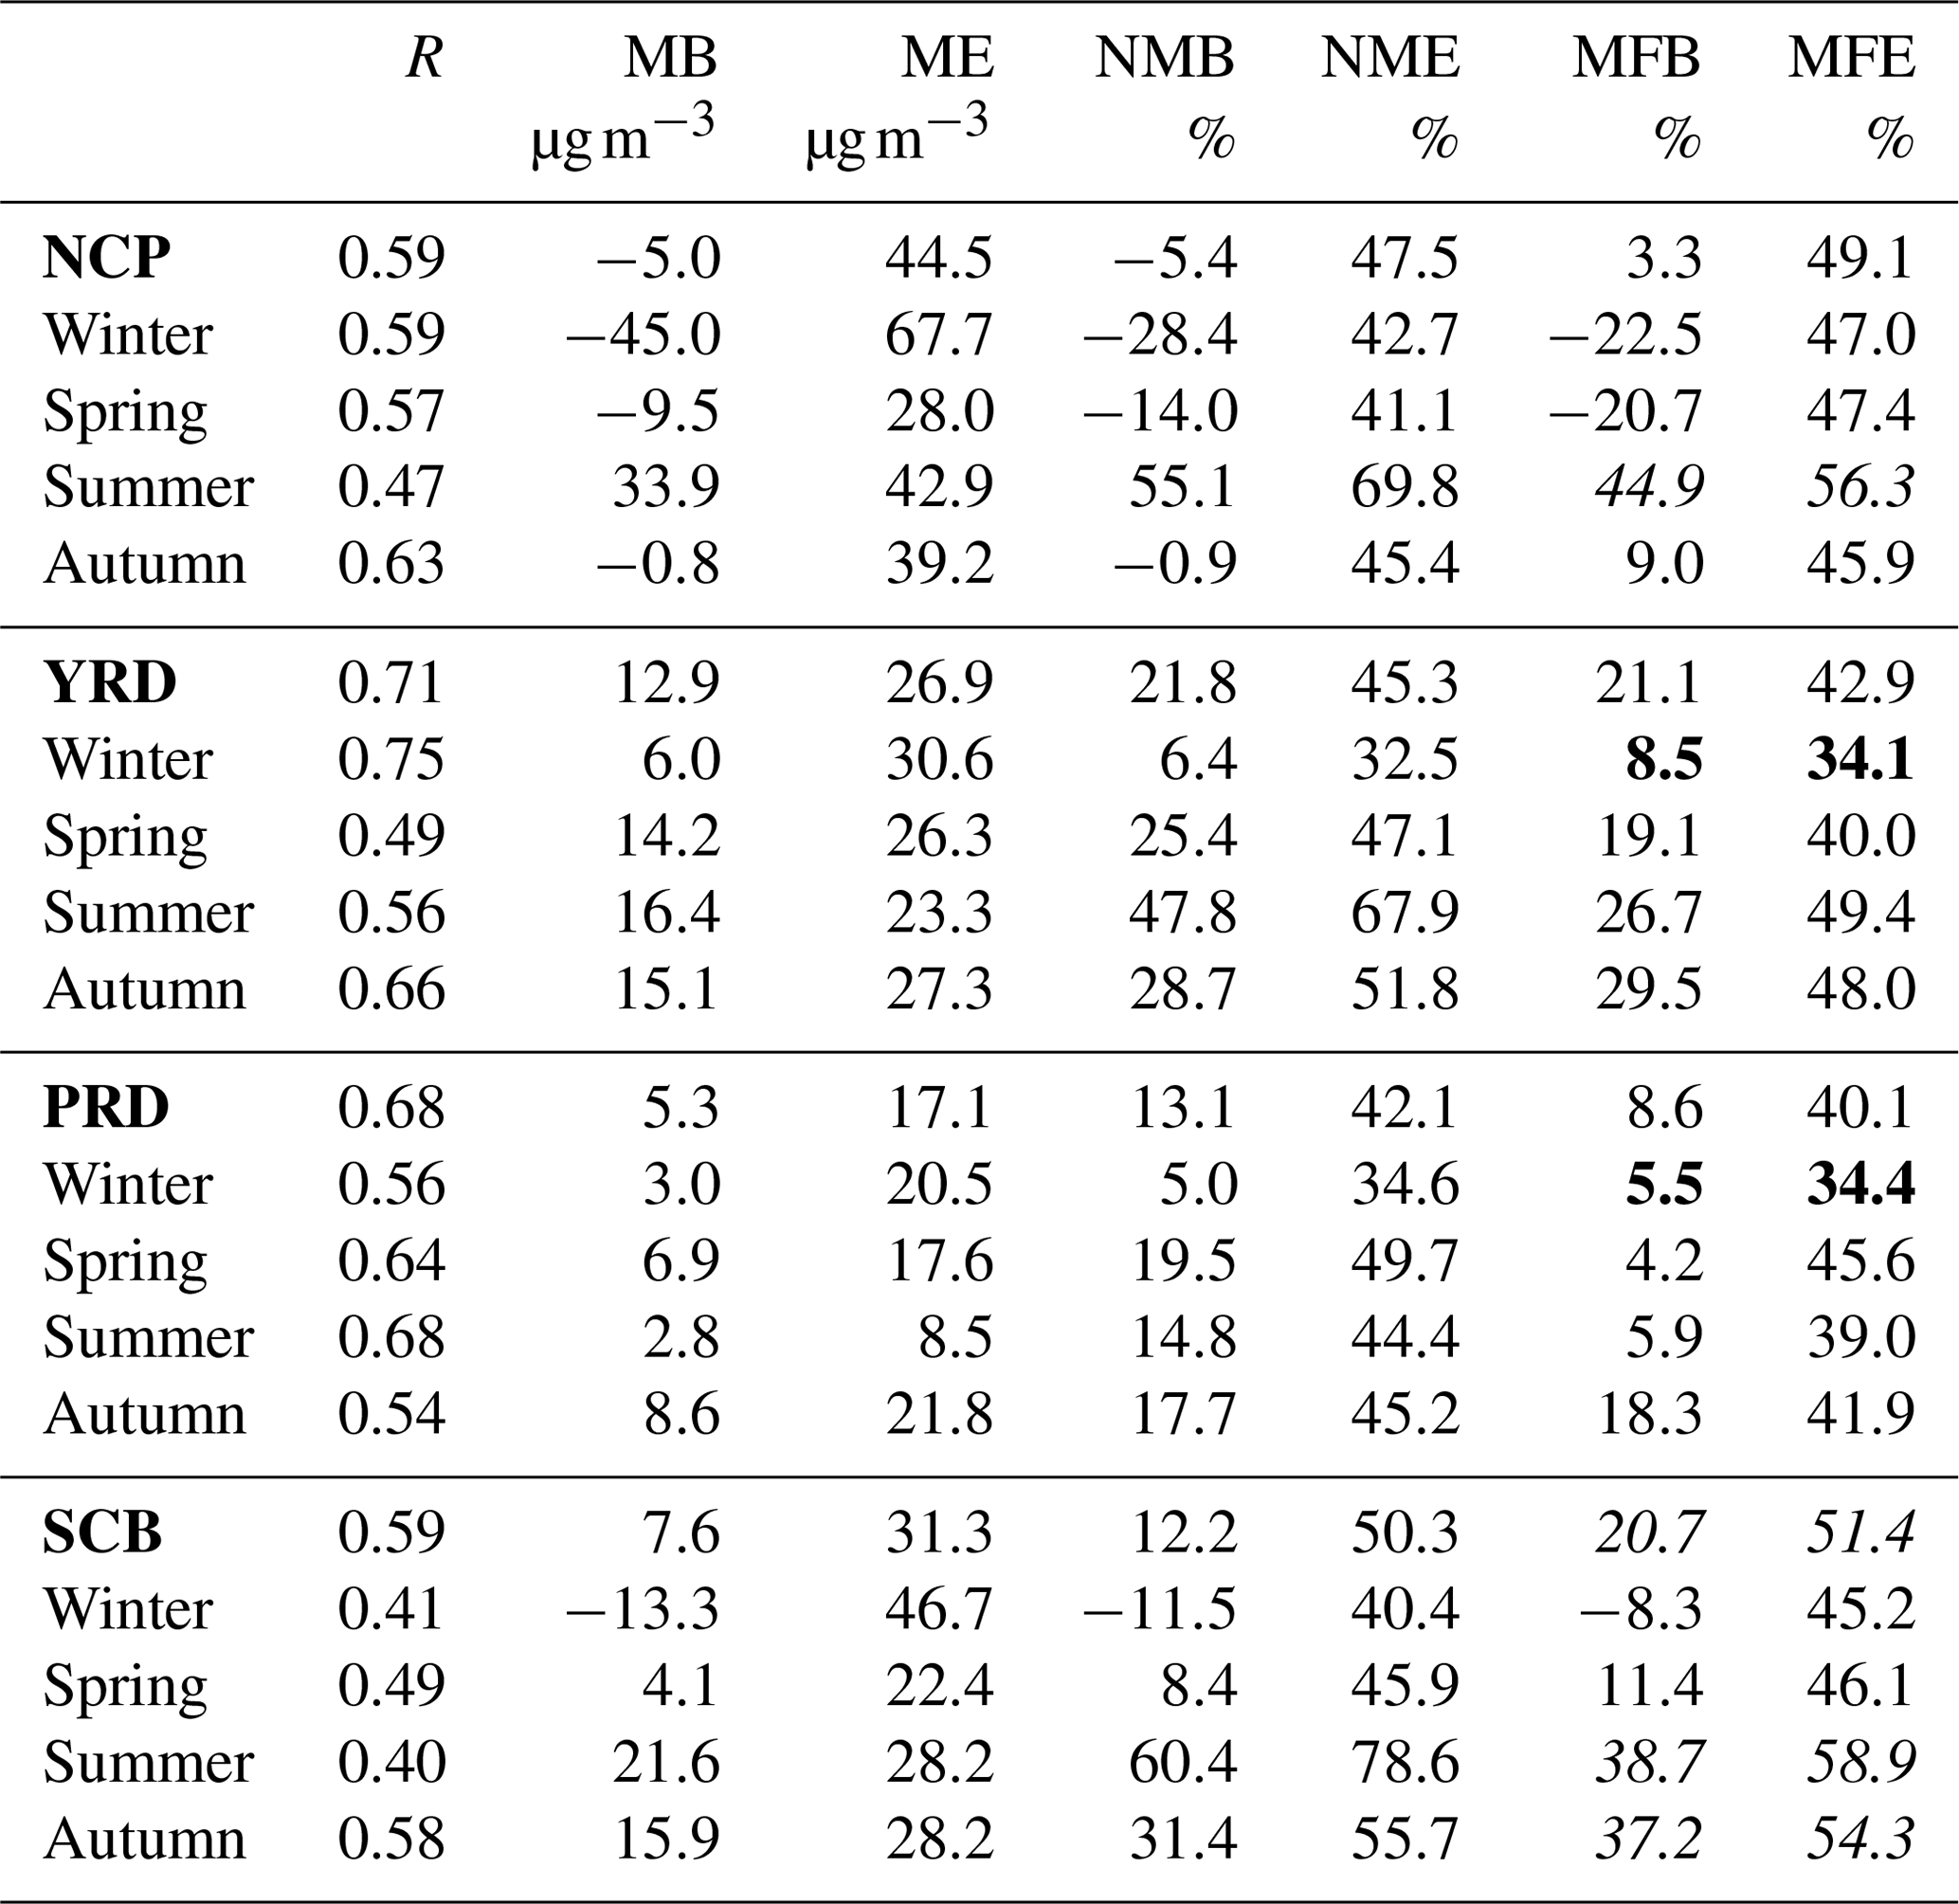
The WRF/CUACE v1.0 model was further evaluated using hourly PM2.5 concentrations and R, MB, ME, normalized mean bias (NMB), normalized mean error (NME), mean fractional bias (MFB), and mean fractional error (MFE) (Table 3). As can be seen from Table 3, the correlation coefficients R for the NCP, YRD, PRD, and SCB are 0.59, 0.71, 0.68, and 0.59, respectively, all of which passed the 99 % significance test. The YRD has the best correlation, followed by the PRD. MB values reflect that the performance of the model is reasonable in all regions, among which those in NCP and PRD are the best, with the MB values reaching −5.0 and 5.3 µg m−3, respectively. However, the MB values show that the simulated concentration of PM2.5 in NCP during winter is generally underestimated by 45 µg m−3 and overestimated by 33.9 µg m−3. The dramatic positive bias in summer in the NCP is mainly due to the uncertainty in anthropogenic emissions. It is known that PM2.5 concentration is mainly driven by primary emissions, meteorology, and chemical reactions. Table S2 in the Supplement shows the statistical metrics for hourly meteorological fields in winter and summer in the NCP. It can be seen that the bias of summer meteorological fields is reasonable and is comparable to those in winter (Table S2) as well as to those in the YRD and PRD (Table S1), which indicates bias in meteorological fields is not the reason. Additionally, in the YRD and PRD, where the uncertainties of anthropogenic emissions are generally known to be less than those of NCP, the biases of PM2.5 between winter and summer are comparable (Table 3), implying chemical formation of PM2.5 in summer is not overestimated by the WRF/CUACE v1.0 model.
From the point of view of relative deviation, the overall level of standard mean deviation NMB in the NCP is slightly better than that in the YRD and PRD, but the seasonal difference is significant, and the NMB values of the latter two (especially in the PRD) are more uniform in different seasons, maintaining at about 20 %, indicating that the simulation level of the model is relatively stable in the region. The NMB of SCB is 12.2 %, which is similar to that of NCP with a significant seasonal difference (11.5 % in winter and 60.4 % in summer). The NMBs in the NCP, YRD, and PRD are basically the same, about 45 %, slightly better than 50.3 % in SCB.
Morris et al. (2005) provided a reference standard for MFB and MFE using hourly concentrations of simulated and observed PM2.5. The simulation performance is identified to be excellent when MFB <15 % and MFE <35 %, identified to be good when MFB <30 % and MFE <50 %, and identified to be average when MFB <60 % and MFE <75 %, which are marked as bold, normal, and italic font, respectively, in Table 3. It can be seen that simulations in the YRD and PRD fall within the good level with the MFB (MFE) reaching 21.1 % (42.9 %) and 8.6 % (40.1 %), respectively. Both reached excellent levels in winter, which are 8.5 % (34.1 %) and 5.5 % (34.4 %), respectively, indicating that the WRF/CUACE v1.0 model accurately captures the hourly variations of PM2.5 in the two regions. In the NCP region, the model still maintains a good simulation level of 3.3 % (49.1 %) in the area, with obvious overestimates in summer but still maintaining an average level of 44.9 % (56.3 %). The SCB region as a whole is at the average level of 20.7 % (51.4 %). The simulation of winter and spring is better than that of spring and summer. The reason why the simulation in SCB is relatively poor is that its topography is complex, which leads to inaccurate simulation of meteorological fields and further affects the simulation of chemical species. In addition, the uncertainty of emission sources over the region is also a major factor (Zhang et al., 2019).
As a whole, the seven statistical error indicators R, MB, ME, NMB, NME, MFB, and MFE in the four regions reached 0.63 (99 % significance test), 2.7 µg m−3, 33.3 µg m−3, 2.8 %, 46.8 %, 10.6 %, and 46.2 %, respectively, which showed that the WRF/CUACE v1.0 model can reasonably reproduce the changes in PM2.5.
Table 4Statistical metrics for O3 and NO2 concentrations. Criteria for O3 are from the EPA (2005, 2007). The value that does not meet the criteria is in bold.
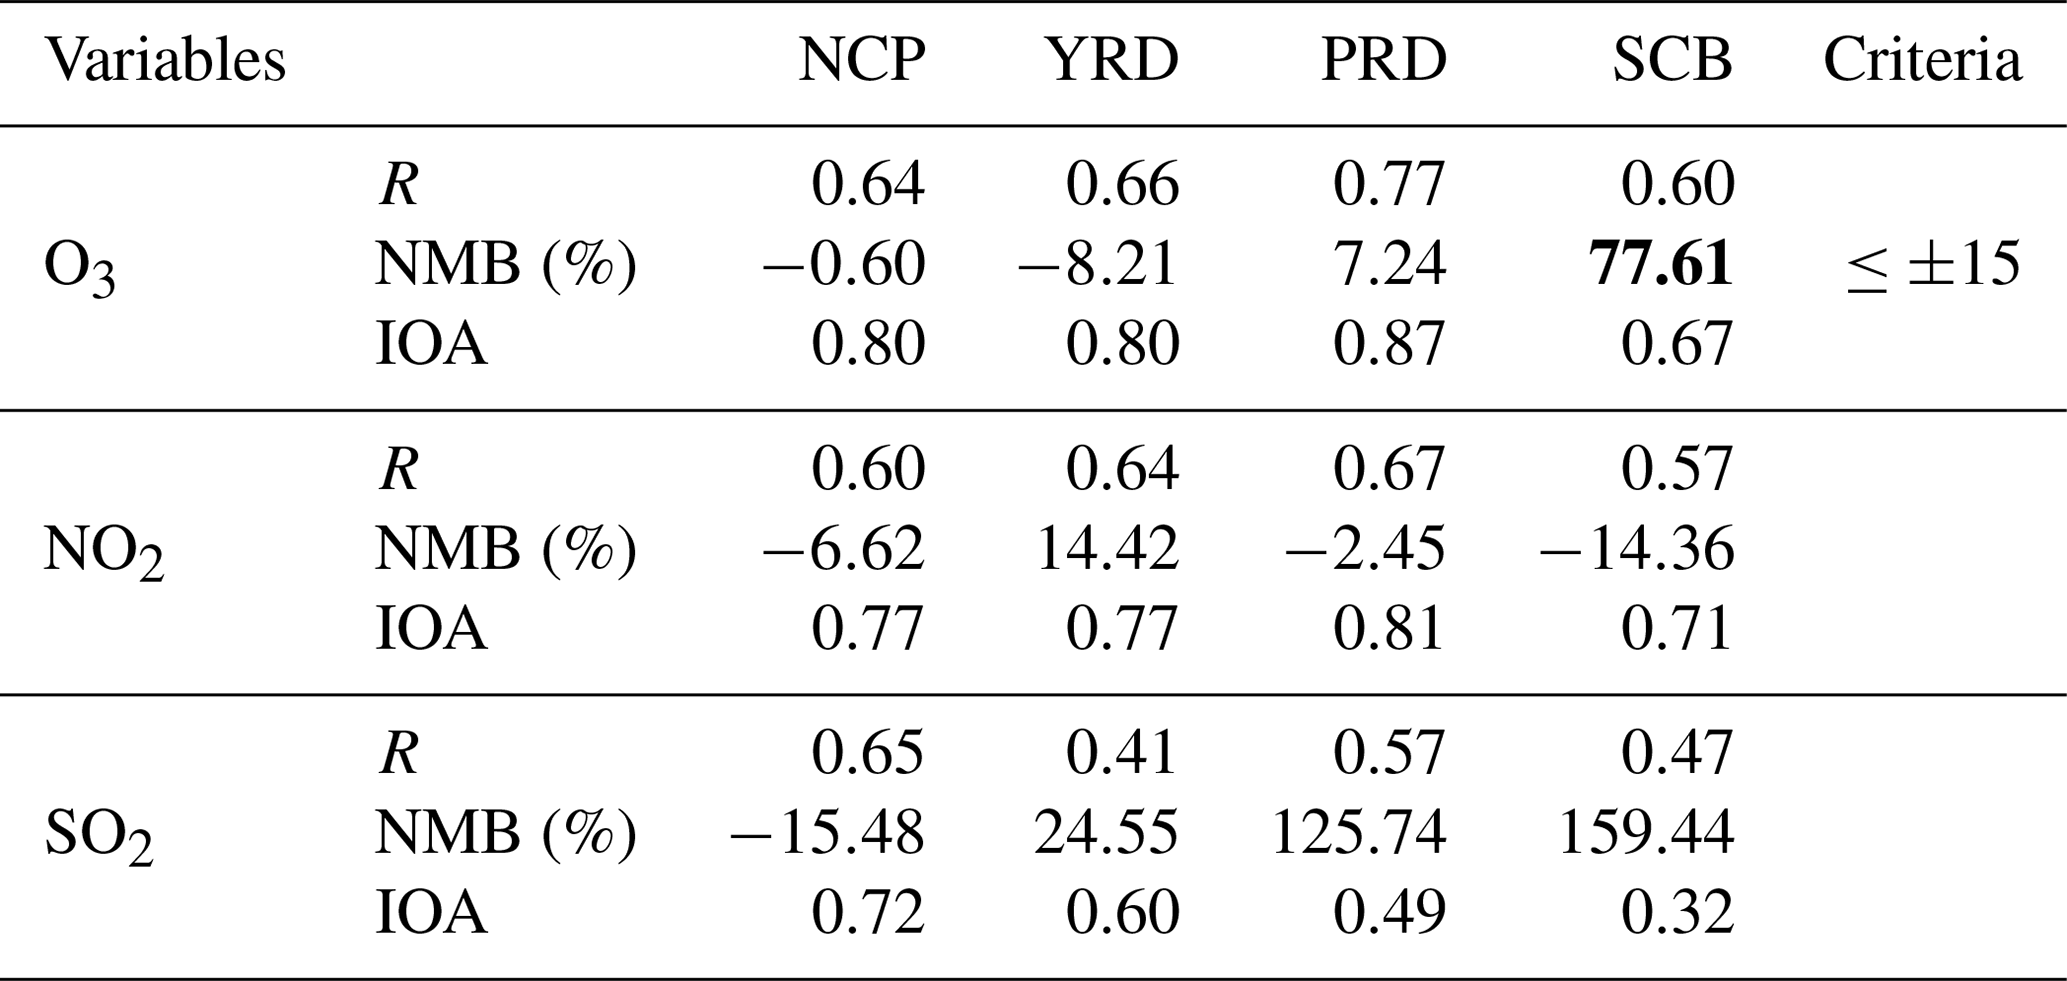
Statistical metrics for O3, NO2, and SO2, including index of agreement (IOA; see its definition in the Supplement) (Willmott and Wicks, 1980), NMB, and R, are shown in Table 4, along with a benchmark derived from the EPA (2005, 2007). In general, the R values of O3 and NO2 in the four regions are about 0.6, which pass the 99 % significance test. For O3, NMBs indicate that the concentrations in the NCP, YRD, and PRD were well reproduced by simulations. The high consistency of the time series between the simulations and measurements was also reflected by the high values of IOA (>0.8). It should be noted that the NMB indicates that the O3 concentrations in SCB were overestimated, which is also reflected in the scatter plot (Fig. 4d), partially due to the relatively poor simulation of meteorological fields (Table S1). As the precursor of O3, simulation of NO2 over the NCP, YRD, PRD, and SCB was acceptable, with the NMBs all falling within the benchmark and IOAs greater than 0.70. In general, the statistical metrics for O3 and NO2 are comparable with other studies (Gao et al., 2018; Hu et al., 2016). The variations of SO2 in NCP and YRD were generally reproduced by the model with bias at −15.5 % and 24.55 %, respectively. However, in the PRD and SCB, SO2 concentrations were substantially overestimated (Table 4 and Fig. 4k–l). As previous studies revealed, emissions of SO2 in eastern China were overestimated by national emission inventories (Zhang et al., 2018; Zhou et al., 2017; Gao et al., 2016), which might partially contribute to the overestimation of SO2 in YRD and PRD. On the basis of the above analysis results, the simulation results are satisfactory, with the exception of SCB.
5.3 Evaluation of SIA simulations with heterogeneous chemical reactions
Heterogeneous chemical reactions have been shown to have important effects on the formation of SIA, especially during severe haze events with high humidity (Li et al., 2011; Wang et al., 2006; Zhao et al., 2013). The ground observations of SIA from 5 to 16 January 2019 in Langfang (NCP), from 3 to 29 December 2013 in Nanjing (YRD), and from 1 to 10 January 2017 in Chengdu (SCB) were collected for the evaluation of SIA simulations. Following the model configurations in Sect. 4.2, we performed WRF/CUACE v1.0 simulations with (Exp_WH) and without (Exp_WoH) heterogeneous chemistry on the three periods.
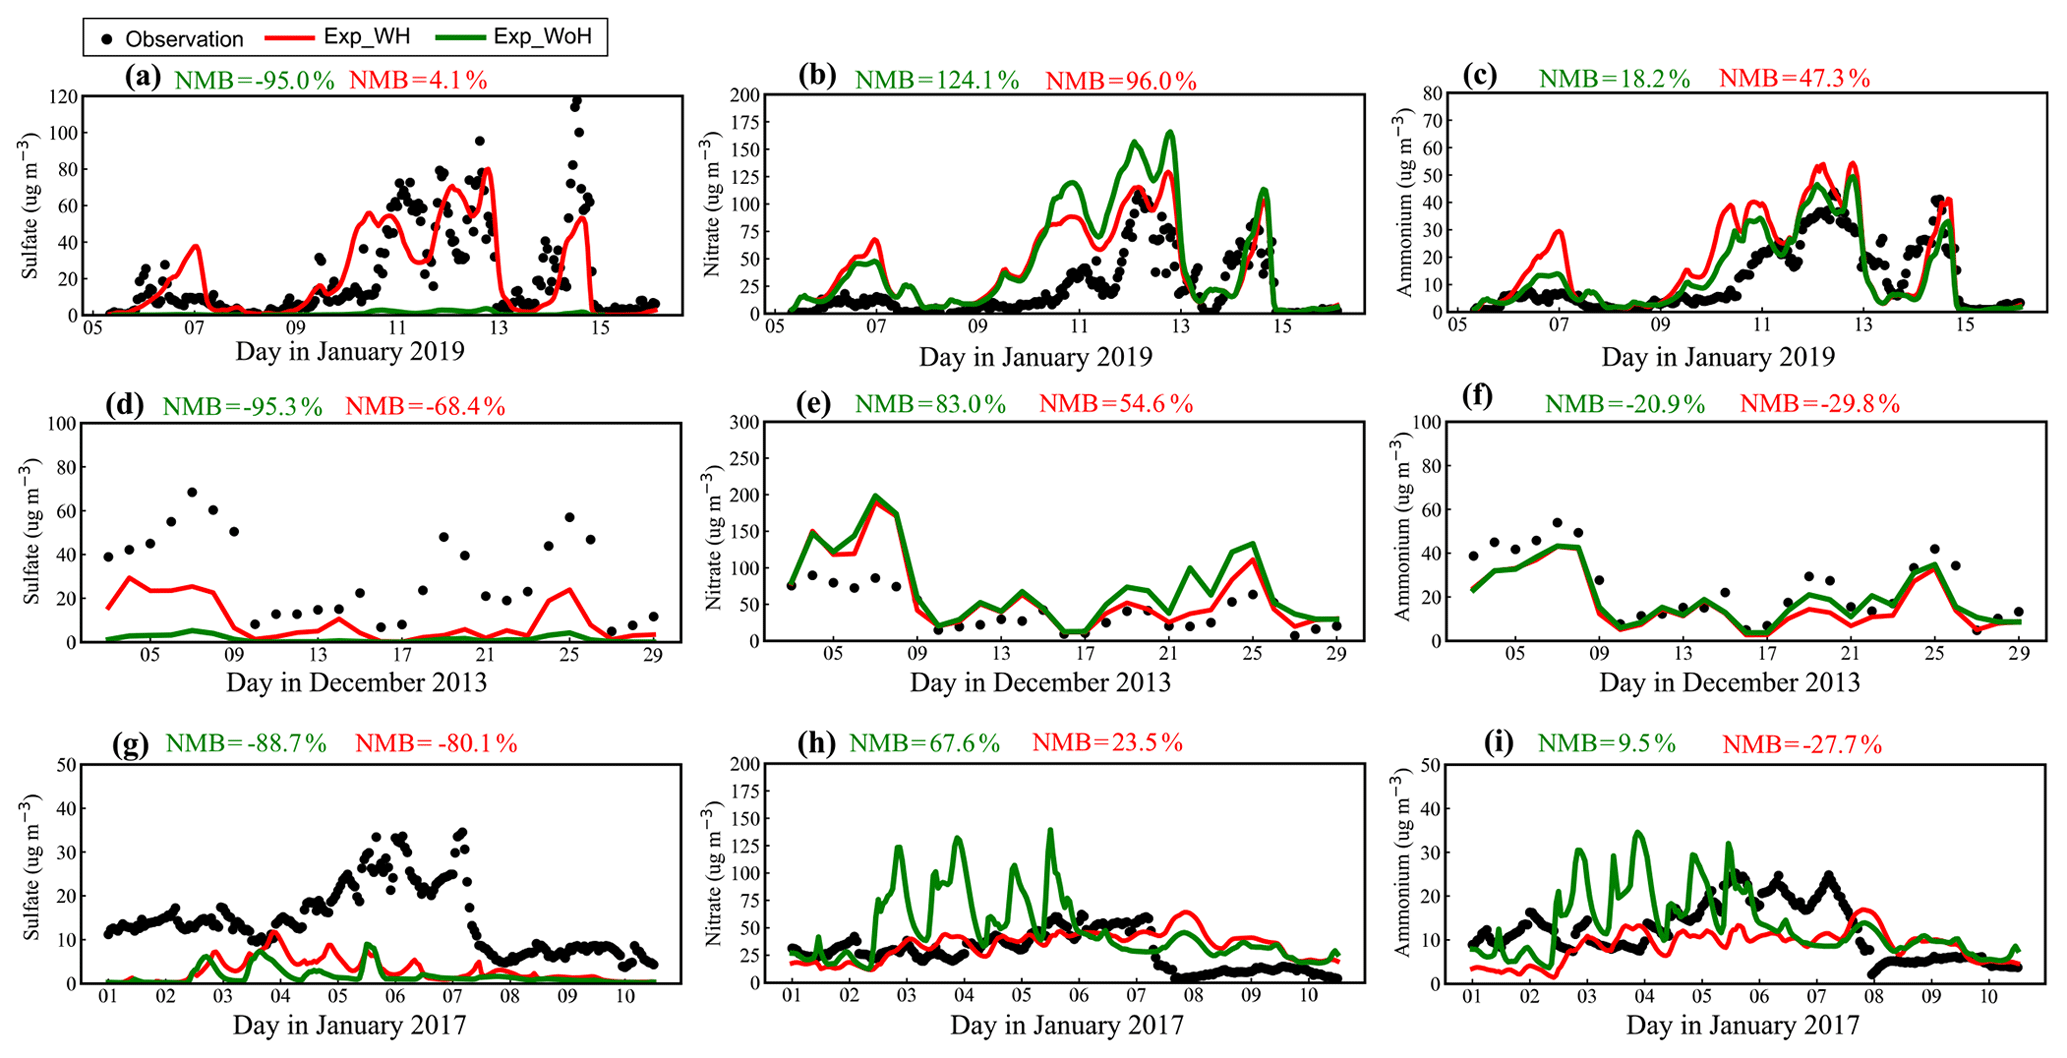
Figure 5Observed and simulated hourly SIA concentrations from the Exp_WH and Exp_WoH experiments at the (a–c) Langfang, (d–f) Nanjing, and (g–i) Chengdu sites.
Figure 5 illustrates the hourly variations of observed SIA concentration from the Exp_WH and Exp_WoH experiments. For Langfang site, the simulation without heterogeneous chemistry (Exp_WoH) barely captured the sulfate increase (Fig. 5a). This was substantially improved when heterogeneous chemistry was included (Exp_WH), although some observed peak values are not well captured, such as those on 14 January. The overestimation of nitrate was also improved, with the NMBs changing from 124.1 % to 96.0 % (Fig. 5b). It should be noted that the responses of sulfate and nitrate to heterogeneous chemistry are inverse, which might be attributed to the complex thermodynamic processes of SIA formation (Zheng et al., 2015). Sulfate and nitrate will compete for ammonium, which is now the only cation in the CUACE model, resulting in less ammonium nitrate and more ammonium sulfate because of the more thermodynamically stable features of ammonium sulfate. As a result of the dramatic increase in sulfate in Exp_WH, the ammonium concentrations increase slightly relative to those in Exp_WoH to achieve anion–cation balance, which leads to more overestimations in the Exp_WH experiment (Fig. 5c). For Nanjing and Chengdu site, the underestimation of sulfate (Fig. 5d and g) and overestimation of nitrate (Fig. 5e and h) were also improved to varying degrees, with bias of sulfate changing from −95.3 % to −68.4 % in Nanjing and from −88.7 % to −80.1 % in Chengdu and the bias of nitrate changing from 83.0 % to 54.6 % in Nanjing and from 67.6 % to 23.5 % in Chengdu. Nonetheless, deviations in SIA simulations are still too large to neglect in those regions.
5.4 Comparison between the MM5/CUACE model and the WRF/CUACE v1.0 model
It is necessary to compare the MM5/CUACE model with the new WRF/CUACE model for the purpose of assessing the viability of the newly developed model. To this end, a simulation was performed using the MM5/CUACE model for a winter month, i.e., January 2013, during which a long-lasting haze event occurred in central and eastern China. The domain setting, anthropogenic emission inventory and initial and boundary fields of meteorology and chemistry are as the same as those of the WRF/CUACE in Sect. 5.1. It should be known that the gas-phase chemistry mechanism and particle dry deposition scheme in the MM5/CUACE model are RADM2 and Z01, respectively, that updated to CBM-Z and PZ10 in the new WRF/CUACE model. The physical parameterization used in the MM5/CUACE is shown in Table S3 in the Supplement.
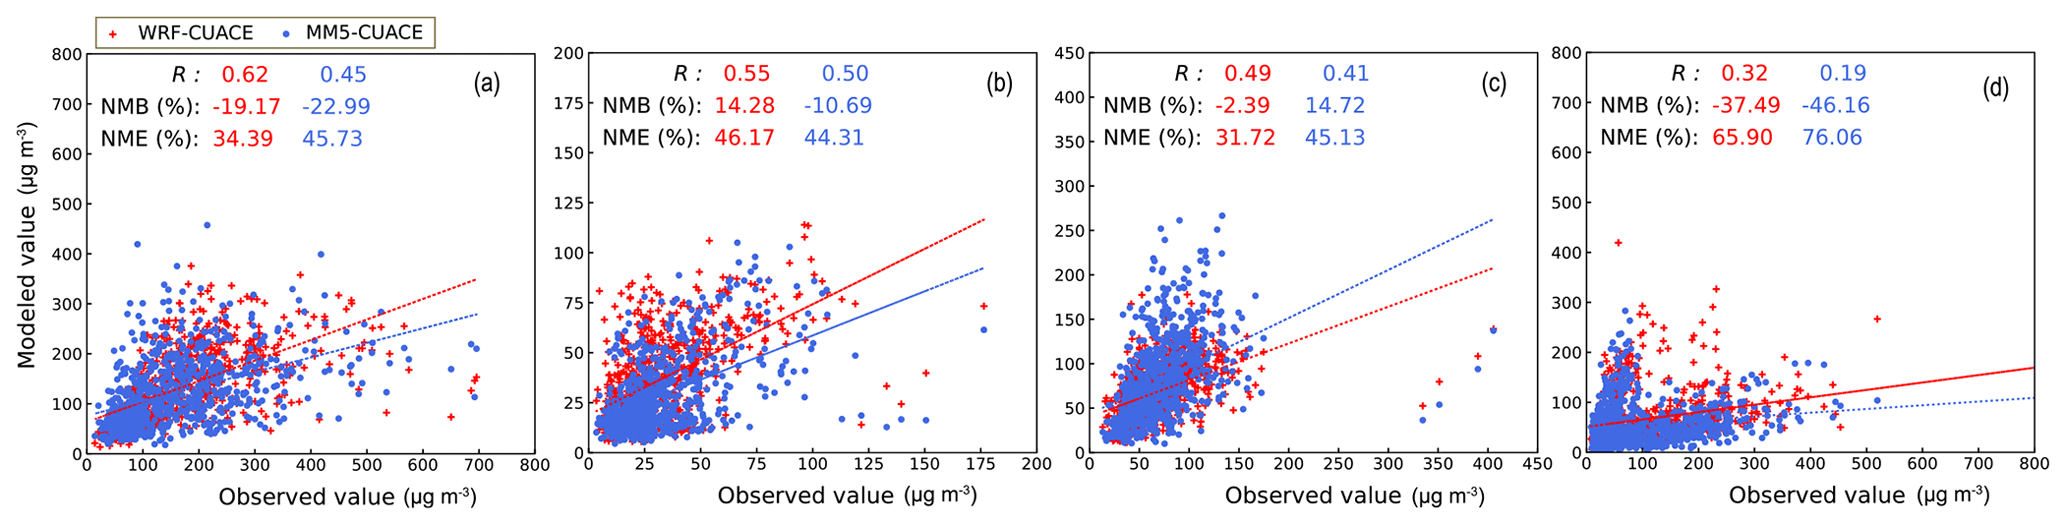
Figure 6Scatter plots of simulated daily concentrations, with MM5/CUACE (blue) and WRF/CUACE (red), and observed daily concentrations of (a) PM2.5, (b) O3, (c) NO2, and (d) SO2.
Figure 6 presents a comparison of the modeled and observed daily concentrations of PM2.5, O3, NO2, and SO2 in the four regions. It can be seen that the concentrations of PM2.5, NO2, and SO2 simulated in WRF/CUACE are closer to the observations relative to those of MM5/CUACE model (change in bias from −23.0 % to −19.2 % for PM2.5, from 14.7 % to −2.4 % for NO2, and from −46.2 % to −37.5 % for SO2). The daily variations of the three species are also relatively better captured by the WRF/CUACE model (reflected by the R values changing from 0.45 to 0.62 for PM2.5, from 0.41 to 0.49 for NO2, and from 0.19 to 0.32 for SO2). For O3, the differences of statistical metrics between the two models are not obvious. The MM5/CUACE model performed with a slightly smaller bias of −10.7 % but with a lower R value of 0.50, which are 14.3 % and 0.55, respectively, in the WRF/CUACE simulation. In summary, the new WRF/CUACE model performed better than the MM5/CUACE model in simulating air pollutants.
This study develops the chemical module CUACE by adding heterogeneous chemical reactions and introducing a particle dry deposition scheme developed by Petroff and Zhang (2010). The CUACE module is then incorporated into the WRF-Chem model to build the WRF/CUACE v1.0 modeling system to take advantage of the better numerical dynamic core and the greater number of physical parameterization schemes of the WRF model compared with the MM5 model.
We perform a three-year (2013, 2015, and 2017) model simulation using the WRF/CUACE v1.0 model to evaluate its performance on reproducing surface concentration variations of PM2.5, O3, and NO2, which are now the main pollutants in China. Three heavy haze pollution events that occurred in the NCP, YRD, and SCB, respectively, are also selected to evaluate the SIA simulations compared with intensive ground SIA observations. The results show that WRF/CUACE v1.0 can capture the daily and hourly variations of PM2.5 well, especially in the YRD and PRD regions, throughout the three years. For the NCP in winter, observed high concentrations larger than 200 µg m−3 are not well reproduced, which might be mainly due to uncertainties in the emissions inventory and the lack of some chemical reactions in the model. For NO2 and O3, the model shows small biases in the NCP, YRD, and PRD regions with correlation coefficients all larger than 0.60, and the NMBs all fall within the EPA benchmark (2005, 2007). The model shows relatively notable biases in the SCB region compared with the NCP, YRD, and PRD regions for the three pollutants, which may be mainly due to the complex terrain in the SCB (Zhang et al., 2019) and insufficient meteorological data available for the region for assimilation in the NCEP-FNL reanalysis data. Simulations of SIA are generally improved, especially for sulfate in the NCP. However, large uncertainties remain in the mechanisms of the heterogeneous chemical reactions in the model, such as the determination of the uptake coefficients, which is based on previous studies on dust surfaces.
There are still several limitations in the current version of the WRF/CUACE v1.0 model that need to be addressed in future development. The feedback of particles, which can be divided into direct and indirect effects, is recognized to be crucial in online coupled models, especially during periods with high particle loading. Currently in the WRF-Chem model, the direct effects of aerosols are processed following the methodology described by Ghan et al. (2001). Our future work will first focus on implementing the direct effects of aerosols, i.e., radiation feedback, following the Mie calculation to realize the direct aerosol forcing. The second step is to implement the VBS scheme to add the missing processes of SOA, which has been implied to be a main cause in the underestimation of OA formation (Gao et al., 2017; Heald et al., 2005; Spracklen et al., 2011). Although the original particle dry deposition scheme is updated with that developed by Petroff and Zhang (2010), it is difficult to evaluate whether the dry deposition process is improved as the limited technology of dry deposition observations restricts direct observations of particle dry deposition. With the observed PM2.5 concentrations, model improvements with and without the updated dry deposition scheme are preliminarily evaluated (Fig. S3 in the Supplement). With regard to particle dry deposition, our aim is to implement several schemes in the CUACE module, such as the schemes developed by Emerson et al. (2020), Zhang and He (2014), Zhang and Shao (2014), and Kouznetsov and Sofiev (2012), to evaluate uncertainties in the schemes on aerosol simulation, which might help the development of the particle dry deposition scheme.
The WRF/CUACE v1.0 model is open-source and can be accessed at a DOI repository https://doi.org/10.5281/zenodo.3872620 (Zhang et al., 2020). All source code and data can also be accessed by contacting the corresponding authors Sunling Gong (gongsl@cma.gov.cn) and Tianliang Zhao (tlzhao@nuist.edu.cn).
The supplement related to this article is available online at: https://doi.org/10.5194/gmd-14-703-2021-supplement.
SG, TZ, HW, HC, and XZ led the project. LZ, SG, CZ, and HL developed the model code, with assistance from JL, JH, KG, and YaW. LZ performed the simulations and wrote the paper with suggestions from all authors. YuW, DJ, and XG provided the data of secondary inorganic aerosols. JG and YS contribute to data processing. All authors contributed to the discussion and improvement of the paper.
The authors declare that they have no conflict of interest.
We gratefully acknowledge the Atmosphere Sub-Center of Chinese Ecosystem Research Network (SCAS-CERN) for providing the data of secondary inorganic aerosols and thank Leiming Zhang (Air Quality Research Division, Science and Technology Branch, Environment Canada) for sharing the code of the aerosol dry deposition scheme.
This research has been supported by the National Key Foundation Study Developing Programs (grant no. 2019YFC0214601), the National Natural Science Foundation of China (grant nos. 91744209, 41975131, and 41705080), and the CAMS Basis Research Project (grant no. 2020Y001).
This paper was edited by Samuel Remy and reviewed by two anonymous referees.
Ahmadov, R., McKeen, S., Robinson, A., Bahreini, R., Middlebrook, A., De Gouw, J., Meagher, J., Hsie, E. Y., Edgerton, E., and Shaw, S.: A volatility basis set model for summertime secondary organic aerosols over the eastern United States in 2006, J. Geophys. Res.-Atmos., 117, D06301, https://doi.org/10.1029/2011JD016831, 2012.
Alfaro, S. C. and Gomes, L.: Modeling mineral aerosol production by wind erosion: Emission intensities and aerosol size distributions in source areas, J. Geophys. Res.-Atmos., 106, 18075–18084, https://doi.org/10.1029/2000JD900339, 2001.
An, X. Q., Zhai, S. X., Jin, M., Gong, S., and Wang, Y.: Development of an adjoint model of GRAPES–CUACE and its application in tracking influential haze source areas in north China, Geosci. Model Dev., 9, 2153–2165, https://doi.org/10.5194/gmd-9-2153-2016, 2016.
Bian, H. and Zender, C. S.: Mineral dust and global tropospheric chemistry: Relative roles of photolysis and heterogeneous uptake, J. Geophys. Res.-Atmos., 108, D21, https://doi.org/10.1029/2002jd003143, 2003.
Chen, F. and Dudhia, J.: Coupling an advanced land surface–hydrology model with the Penn State–NCAR MM5 modeling system. Part I: Model implementation and sensitivity, Mon. Weather Rev., 129, 569–585, https://doi.org/10.1175/1520-0493(2001)129<0587:caalsh>2.0.co;2, 2001.
Chou, M.-D. and Suarez, M. J.: An efficient thermal infrared radiation parameterization for use in general circulation models, NASA Tech. Memorandum 104606 – Vol. 3, NASA, Goddard Space Flight Center, Greenbelt, MD, 1994.
Damian, V., Sandu, A., Damian, M., Potra, F., and Carmichael, G. R.: The kinetic preprocessor KPP-a software environment for solving chemical kinetics, Comput. Chem., 26, 1567–1579, https://doi.org/10.1016/s0098-1354(02)00128-x, 2002.
Donahue, N., Robinson, A., Stanier, C., and Pandis, S.: Coupled partitioning, dilution, and chemical aging of semivolatile organics, Environ. Sci. Technol., 40, 2635–2643, https://doi.org/10.1021/es052297c, 2006.
Emery, C., Tai, E., and Yarwood, G.: Enhanced meteorological modeling and performance evaluation for two Texas ozone episodes, in: Prepared for the Texas Natural Resource Conservation Commission, ENVIRON International Corporation, Novato, CA, USA, 2001.
Emerson, E. W., Hodshire, A. L., DeBolt, H. M., Bilsback, K. R., Pierce, J. R., McMeeking, G. R., and Farmer, D. K.: Revisiting particle dry deposition and its role in radiative effect estimates, P. Natl. Acad. Sci. USA, 117, 26076–26082, https://doi.org/10.1073/pnas.2014761117, 2020.
EPA, U. S.: Guidance on the Use of Models and Other Analyses in Attainment Demonstrations for the 8-hour Ozone NAAQS, Office of Air Quality Planning and Standards, Research Triangle Park, North Carolina, USA, EPA-454/R-05-002, 128 pp., 2005.
EPA, U. S.: Guidance on the Use of Models and Other Analyses for Demonstrating Attainment of Air Quality Goals for Ozone, PM2.5, and Regional Haze, Office of Air Quality Planning and Standards, Research Triangle Park, North Carolina, USA, EPA-454/B-07-002, 262 pp., 2007.
Gao, C. Y., Tsigaridis, K., and Bauer, S. E.: MATRIX-VBS (v1.0): implementing an evolving organic aerosol volatility in an aerosol microphysics model, Geosci. Model Dev., 10, 751–764, https://doi.org/10.5194/gmd-10-751-2017, 2017.
Gao, J., Zhu, B., Xiao, H., Kang, H., Pan, C., Wang, D., and Wang, H.: Effects of black carbon and boundary layer interaction on surface ozone in Nanjing, China, Atmos. Chem. Phys., 18, 7081–7094, https://doi.org/10.5194/acp-18-7081-2018, 2018.
Gao, M., Carmichael, G. R., Wang, Y., Ji, D., Liu, Z., and Wang, Z.: Improving simulations of sulfate aerosols during winter haze over Northern China: the impacts of heterogeneous oxidation by NO2, Front. Environ. Sci. Eng., 10, 16, https://doi.org/10.1007/s11783-016-0878-2, 2016.
Ghan, S., Laulainen, N., Easter, R., Wagener, R., Nemesure, S., Chapman, E., Zhang, Y., and Leung, R.: Evaluation of aerosol direct radiative forcing in MIRAGE, J. Geophys. Res.-Atmos., 106, 5295–5316, https://doi.org/10.1029/2000jd900502, 2001.
Gong, S. L., Barrie, L. A., Blanchet, J.-P., von Salzen, K., Lohmann, U., and Lesins, G.: Canadian Aerosol Module: A size-segregated simulation of atmospheric aerosol processes for climate and air quality models 1. Module development, J. Geophys. Res., 108, 4007, https://doi.org/10.1029/2001jd002002, 2003.
Grell, G. and Baklanov, A.: Integrated modeling for forecasting weather and air quality: A call for fully coupled approaches, Atmos. Environ., 45, 6845–6851, https://doi.org/10.1016/j.atmosenv.2011.01.017, 2011.
Grell, G. A.: Prognostic evaluation of assumptions used by cumulus parameterizations, Mon. Weather Rev., 121, 764–787, https://doi.org/10.1175/1520-0493(1993)121<0764:peoaub>2.0.co;2, 1993.
Grell, G. A., Peckham, S. E., Schmitz, R., McKeen, S. A., Frost, G., Skamarock, W. C., and Eder, B.: Fully coupled “online” chemistry within the WRF model, Atmos. Environ., 39, 6957–6975, https://doi.org/10.1016/j.atmosenv.2005.04.027, 2005.
Guenther, A., Karl, T., Harley, P., Wiedinmyer, C., Palmer, P. I., and Geron, C.: Estimates of global terrestrial isoprene emissions using MEGAN (Model of Emissions of Gases and Aerosols from Nature), Atmos. Chem. Phys., 6, 3181–3210, https://doi.org/10.5194/acp-6-3181-2006, 2006.
Heald, C. L., Jacob, D. J., Park, R. J., Russell, L. M., Huebert, B. J., Seinfeld, J. H., Liao, H., and Weber, R. J.: A large organic aerosol source in the free troposphere missing from current models, Geophys. Res. Lett., 32, L18809, https://doi.org/10.1029/2005gl023831, 2005.
Hicks, B. B., Saylor, R. D., and Baker, B. D.: Dry deposition of particles to canopies-A look back and the road forward, J. Geophys. Res.-Atmos., 121, 14691–14707, https://doi.org/10.1002/2015jd024742, 2016.
Hu, J., Chen, J., Ying, Q., and Zhang, H.: One-year simulation of ozone and particulate matter in China using WRF/CMAQ modeling system, Atmos. Chem. Phys., 16, 10333–10350, https://doi.org/10.5194/acp-16-10333-2016, 2016.
Huang, R. J., Zhang, Y., Bozzetti, C., Ho, K. F., Cao, J. J., Han, Y., Daellenbach, K. R., Slowik, J. G., Platt, S. M., and Canonaco, F.: High secondary aerosol contribution to particulate pollution during haze events in China, Nature, 514, 218–222, https://doi.org/10.1038/nature13774, 2014.
Jacob, D. J.: Heterogeneous chemistry and tropospheric ozone, Atmos. Environ., 34, 2131–2159, https://doi.org/10.1016/s1352-2310(99)00462-8, 2000.
Jacobson, M. Z., Tabazadeh, A., and Turco, R. P.: Simulating equilibrium within aerosols and nonequilibrium between gases and aerosols, J. Geophys. Res.-Atmos., 101, 9079–9091, https://doi.org/10.1029/96jd00348, 1996.
Janjić, Z. I.: The step-mountain eta coordinate model: Further developments of the convection, viscous sublayer, and turbulence closure schemes, Mon. Weather Rev., 122, 927–945, https://doi.org/10.1175/1520-0493(1994)122<0927:tsmecm>2.0.co;2, 1994.
Kouznetsov, R. and Sofiev, M.: A methodology for evaluation of vertical dispersion and dry deposition of atmospheric aerosols, J. Geophys. Res.-Atmos., 117, D01202, https://doi.org/10.1029/2011jd016366, 2012.
Langkamp, T. and Böhner, J.: Influence of the compiler on multi-CPU performance of WRFv3, Geosci. Model Dev., 4, 611–623, https://doi.org/10.5194/gmd-4-611-2011, 2011.
Li, M., Zhang, Q., Kurokawa, J.-I., Woo, J.-H., He, K., Lu, Z., Ohara, T., Song, Y., Streets, D. G., Carmichael, G. R., Cheng, Y., Hong, C., Huo, H., Jiang, X., Kang, S., Liu, F., Su, H., and Zheng, B.: MIX: a mosaic Asian anthropogenic emission inventory under the international collaboration framework of the MICS-Asia and HTAP, Atmos. Chem. Phys., 17, 935–963, https://doi.org/10.5194/acp-17-935-2017, 2017.
Li, W., Zhou, S., Wang, X., Xu, Z., Yuan, C., Yu, Y., Zhang, Q., and Wang, W.: Integrated evaluation of aerosols from regional brown hazes over northern China in winter: Concentrations, sources, transformation, and mixing states, J. Geophys. Res.-Atmos., 116, D09301, https://doi.org/10.1029/2010jd015099, 2011.
Lin, H., Feng, X., Fu, T.-M., Tian, H., Ma, Y., Zhang, L., Jacob, D. J., Yantosca, R. M., Sulprizio, M. P., Lundgren, E. W., Zhuang, J., Zhang, Q., Lu, X., Zhang, L., Shen, L., Guo, J., Eastham, S. D., and Keller, C. A.: WRF-GC (v1.0): online coupling of WRF (v3.9.1.1) and GEOS-Chem (v12.2.1) for regional atmospheric chemistry modeling – Part 1: Description of the one-way model, Geosci. Model Dev., 13, 3241–3265, https://doi.org/10.5194/gmd-13-3241-2020, 2020.
Lin, Y.-L., Farley, R. D., and Orville, H. D.: Bulk parameterization of the snow field in a cloud model, J. Clim. Appl. Meteor., 22, 1065–1092, https://doi.org/10.1175/1520-0450(1983)022<1065:bpotsf>2.0.co;2, 1983.
Liu, S., McKeen, S., Hsie, E. Y., Lin, X., Kelly, K., Bradshaw, J., Sandholm, S., Browell, E., Gregory, G., Sachse, G., Bandy, A., Thornton, D., Blake, D., Rowland, F., Newell, R., Heikes, B., Singh, H., and Talbot, R.: Model study of tropospheric trace species distributions during PEM-West A, J. Geophys. Res.-Atmos., 101, 2073–2085, https://doi.org/10.1029/95jd02277, 1996.
Lu, X., Zhang, L., Wu, T., Long, M. S., Wang, J., Jacob, D. J., Zhang, F., Zhang, J., Eastham, S. D., Hu, L., Zhu, L., Liu, X., and Wei, M.: Development of the global atmospheric chemistry general circulation model BCC-GEOS-Chem v1.0: model description and evaluation, Geosci. Model Dev., 13, 3817–3838, https://doi.org/10.5194/gmd-13-3817-2020, 2020.
Marticorena, B. and Bergametti, G.: Modeling the atmospheric dust cycle: 1. Design of a soil-derived dust emission scheme, J. Geophys. Res.-Atmos., 100, 16415–16430, https://doi.org/10.1029/95jd00690, 1995.
Michel, A., Usher, C., and Grassian, V.: Reactive uptake of ozone on mineral oxides and mineral dusts, Atmos. Environ., 37, 3201–3211, https://doi.org/10.1016/s1352-2310(03)00319-4, 2003.
Mlawer, E. J., Taubman, S. J., Brown, P. D., Iacono, M. J., and Clough, S. A.: Radiative transfer for inhomogeneous atmospheres: RRTM, a validated correlated-k model for the longwave, J. Geophys. Res.-Atmos., 102, 16663–16682, https://doi.org/10.1029/97jd00237, 1997.
Morris, R. E., McNally, D. E., Tesche, T. W., Tonnesen, G., Boylan, J. W., and Brewer, P.: Preliminary Evaluation of the Community Multiscale Air Quality Model for 2002 over the Southeastern United States, JAPCA J. Air Waste Ma., 55, 1694–1708, https://doi.org/10.1080/10473289.2005.10464765, 2005.
Petroff, A. and Zhang, L.: Development and validation of a size-resolved particle dry deposition scheme for application in aerosol transport models, Geosci. Model Dev., 3, 753–769, https://doi.org/10.5194/gmd-3-753-2010, 2010.
Phadnis, M. J. and Carmichael, G. R.: Numerical investigation of the influence of mineral dust on the tropospheric chemistry of East Asia, J. Atmos. Chem., 36, 285–323, 2000.
Seinfeld, J. H. and Pandis, S. N.: Atmospheric chemistry and physics: from air pollution to climate change, John Wiley & Sons, New York, USA, https://doi.org/10.5860/choice.35-5721, 1998.
Seisel, S., Börensen, C., Vogt, R., and Zellner, R.: The heterogeneous reaction of HNO3 on mineral dust and γ-alumina surfaces: a combined Knudsen cell and DRIFTS study, Phys. Chem. Chem. Phys., 6, 5498–5508, https://doi.org/10.1039/b410793d, 2004.
Skamarock, W. C., Klemp, J. B., Dudhia, J., Gill, D. O., Barker, D. M., Wang, W., and Powers, J. G.: A description of the Advanced Research WRF version 3, National Center for Atmospheric Research Technical note, Colorado, USA, NCAR/TN-475+STR, 113 pp., 2008.
Spracklen, D. V., Jimenez, J. L., Carslaw, K. S., Worsnop, D. R., Evans, M. J., Mann, G. W., Zhang, Q., Canagaratna, M. R., Allan, J., Coe, H., McFiggans, G., Rap, A., and Forster, P.: Aerosol mass spectrometer constraint on the global secondary organic aerosol budget, Atmos. Chem. Phys., 11, 12109–12136, https://doi.org/10.5194/acp-11-12109-2011, 2011.
Tsinghua University: Control Strategy and Measurement of PM10 and O3 Pollution in Beijing City. Report to Beijng Environmental Protection Bureau, Beijing, China, 2006 (in Chinese).
Wang, H., Xue, M., Zhang, X. Y., Liu, H. L., Zhou, C. H., Tan, S. C., Che, H. Z., Chen, B., and Li, T.: Mesoscale modeling study of the interactions between aerosols and PBL meteorology during a haze episode in Jing–Jin–Ji (China) and its nearby surrounding region – Part 1: Aerosol distributions and meteorological features, Atmos. Chem. Phys., 15, 3257–3275, https://doi.org/10.5194/acp-15-3257-2015, 2015.
Wang, K., Zhang, Y., Nenes, A., and Fountoukis, C.: Implementation of dust emission and chemistry into the Community Multiscale Air Quality modeling system and initial application to an Asian dust storm episode, Atmos. Chem. Phys., 12, 10209–10237, https://doi.org/10.5194/acp-12-10209-2012, 2012.
Wang, K., Zhang, Y., Yahya, K., Wu, S.-Y., and Grell, G.: Implementation and initial application of new chemistry-aerosol options in WRF/Chem for simulating secondary organic aerosols and aerosol indirect effects for regional air quality, Atmos. Environ., 115, 716–732, https://doi.org/10.1016/j.atmosenv.2014.12.007, 2015.
Wang, L., Jang, C., Zhang, Y., Wang, K., Zhang, Q., Streets, D., Fu, J., Lei, Y., Schreifels, J., He, K., Hao, J., Lam, Y.-F., Lin, J., Meskhidze, N., Voorhees, S., Evarts, D., and Phillips, S.: Assessment of air quality benefits from national air pollution control policies in China. Part II: Evaluation of air quality predictions and air quality benefits assessment, Atmos. Environ., 44, 3449–3457, https://doi.org/10.1016/j.atmosenv.2010.05.058, 2010.
Wang, X., Wang, H., Xue, L., Wang, T., Wang, L., Gu, R., Wang, W., Tham, Y. J., Wang, Z., Yang, L., Chen, J., and Wang, W.: Observations of N2O5 and ClNO2 at a polluted urban surface site in North China: High N2O5 uptake coefficients and low ClNO2 product yields, Atmospheric Environment, 156, 125–134, https://doi.org/10.1016/j.atmosenv.2017.02.035, 2017.
Wang, Y., Zhang, Q., Jiang, J., Zhou, W., Wang, B., He, K., Duan, F., Zhang, Q., Philip, S., and Xie, Y.: Enhanced sulfate formation during China's severe winter haze episode in January 2013 missing from current models, J. Geophys. Res.-Atmos., 119, 10425–10440, https://doi.org/10.1002/2013jd021426, 2014.
Wang, Y., Zhuang, G., Sun, Y., and An, Z.: The variation of characteristics and formation mechanisms of aerosols in dust, haze, and clear days in Beijing, Atmos. Environ., 40, 6579–6591, https://doi.org/10.1016/j.atmosenv.2006.05.066, 2006.
Willmott, C. J. and Wicks, D. E.: An empirical method for the spatialinterpolation of monthly precipitation within California, Phys. Geogr. 1, 59–73, https://doi.org/10.1080/02723646.1980.10642189, 1980.
Wong, D. C., Pleim, J., Mathur, R., Binkowski, F., Otte, T., Gilliam, R., Pouliot, G., Xiu, A., Young, J. O., and Kang, D.: WRF-CMAQ two-way coupled system with aerosol feedback: software development and preliminary results, Geosci. Model Dev., 5, 299–312, https://doi.org/10.5194/gmd-5-299-2012, 2012.
Wu, M., Liu, X., Zhang, L., Wu, C., Lu, Z., Ma, P.-L., Wang, H., Tilmes, S., Mahowald, N., Matsui, H., and Easter, R. C.: Impacts of Aerosol Dry Deposition on Black Carbon Spatial Distributions and Radiative Effects in the Community Atmosphere Model CAM5, J. Adv. Model. Earth Sy., 10, 1150–1171, https://doi.org/10.1029/2017ms001219, 2018.
Zaveri, R. A. and Peters, L. K.: A new lumped structure photochemical mechanism for large-scale applications, J. Geophys. Res.-Atmos., 104, 30387–30415, https://doi.org/10.1029/1999JD900876, 1999.
Zhang, J. and Shao, Y.: A new parameterization of particle dry deposition over rough surfaces, Atmos. Chem. Phys., 14, 12429–12440, https://doi.org/10.5194/acp-14-12429-2014, 2014.
Zhang, L. and He, Z.: Technical Note: An empirical algorithm estimating dry deposition velocity of fine, coarse and giant particles, Atmos. Chem. Phys., 14, 3729–3737, https://doi.org/10.5194/acp-14-3729-2014, 2014.
Zhang, L., Gong, S., Padro, J., and Barrie, L.: A size-segregated particle dry deposition scheme for an atmospheric aerosol module, Atmos. Environ., 35, 549–560, https://doi.org/10.1016/s1352-2310(00)00326-5, 2001.
Zhang, L., Zhao, T., Gong, S., Kong, S., Tang, L., Liu, D., Wang, Y., Jin, L., Shan, Y., Tan, C., Zhang, Y., and Guo, X.: Updated emission inventories of power plants in simulating air quality during haze periods over East China, Atmos. Chem. Phys., 18, 2065–2079, https://doi.org/10.5194/acp-18-2065-2018, 2018.
Zhang, L., Guo, X., Zhao, T., Gong, S., Xu, X., Li, Y., Luo, L., Gui, K., Wang, H., Zheng, Y., and Yin, X.: A modelling study of the terrain effects on haze pollution in the Sichuan Basin, Atmos. Environ., 196, 77–85, https://doi.org/10.1016/j.atmosenv.2018.10.007, 2019.
Zhang, L., Gong, S., and Zhao, T.: WRF/CUACE v1.0 source code, Zenodo, https://doi.org/10.5281/zenodo.3872620, 2020.
Zhang, Y. and Carmichael, G. R.: The role of mineral aerosol in tropospheric chemistry in East Asia – A model study, J. Appl. Meteor., 38, 353–366, https://doi.org/10.1175/1520-0450(1999)038<0353:tromai>2.0.co;2, 1999.
Zhang, Y., Pan, Y., Wang, K., Fast, J. D., and Grell, G. A.: WRF/Chem-MADRID: Incorporation of an aerosol module into WRF/Chem and its initial application to the TexAQS2000 episode, J. Geophys. Res., 115, D18202, https://doi.org/10.1029/2009jd013443, 2010.
Zhao, X. J., Zhao, P. S., Xu, J., Meng,, W., Pu, W. W., Dong, F., He, D., and Shi, Q. F.: Analysis of a winter regional haze event and its formation mechanism in the North China Plain, Atmos. Chem. Phys., 13, 5685–5696, https://doi.org/10.5194/acp-13-5685-2013, 2013.
Zheng, B., Zhang, Q., Zhang, Y., He, K. B., Wang, K., Zheng, G. J., Duan, F. K., Ma, Y. L., and Kimoto, T.: Heterogeneous chemistry: a mechanism missing in current models to explain secondary inorganic aerosol formation during the January 2013 haze episode in North China, Atmos. Chem. Phys., 15, 2031–2049, https://doi.org/10.5194/acp-15-2031-2015, 2015.
Zhou, C.-H., Gong, S., Zhang, X.-Y., Liu, H.-L., Xue, M., Cao, G.-L., An, X.-Q., Che, H.-Z., Zhang, Y.-M., and Niu, T.: Towards the improvements of simulating the chemical and optical properties of Chinese aerosols using an online coupled model – CUACE/Aero, Tellus B, 64, 18965, https://doi.org/10.3402/tellusb.v64i0.18965, 2012.
Zhou, Y., Zhao, Y., Mao, P., Zhang, Q., Zhang, J., Qiu, L., and Yang, Y.: Development of a high-resolution emission inventory and its evaluation and application through air quality modeling for Jiangsu Province, China, Atmos. Chem. Phys., 17, 211–233, https://doi.org/10.5194/acp-17-211-2017, 2017.
- Abstract
- Introduction
- Model description
- Development of the CUACE module
- Coupling of the CUACE module with the WRF model
- Performance of WRF/CUACE v1.0 in air-quality simulation
- Summary and future work
- Code and data availability
- Author contributions
- Competing interests
- Acknowledgements
- Financial support
- Review statement
- References
- Supplement