
the Creative Commons Attribution 4.0 License.
the Creative Commons Attribution 4.0 License.
 | 12 Oct 2026
Improving the CLASSIC (v1.8) snow model to better simulate Arctic snowpacks
Mickaël Lalande

Alexandre Roy
Libo Wang
Diana Verseghy
Vincent Vionnet
Florent Dominé
Christophe Kinnard
This study enhances the snow model of the Canadian Land Surface Scheme including Biogeochemical Cycles (CLASSIC), with a particular focus on Arctic environments. Key snow model physics improvements include adjustments to the thermal conductivity at the top of the first soil layer, a revised computation of the temperature at the snow–soil interface (hereafter, bottom snow temperature), and the addition of a windless exchange coefficient in sensible heat flux calculations. Arctic-specific adaptations include blowing-snow sublimation losses, a new snow compaction scheme, and snow thermal conductivity parameterization. Evaluations at seven mid-latitude and alpine sites (SnowMIP sites) and three Arctic sites (Bylot Island, Umiujaq, and Trail Valley Creek) show that these enhancements improve the overall simulated snowpack characteristics and soil temperatures across both SnowMIP and Arctic sites. The revised bottom snow temperature yields better agreement between simulated and observed snow and bottom snow temperatures. The new windless exchange coefficient reduced the surface temperature RMSE from 3.50 to 1.93 °C on average across all sites. The improved snow compaction scheme reduces the snow depth biases from 12.0 to 0.1 cm on average across the Arctic sites and improves the simulated snow densities while not degrading the overall model performance at the SnowMIP sites. Blowing-snow sublimation had a negligible effect at most sites, except at the wind-exposed sites of Umiujaq, Trail Valley Creek, and Senator Beck, decreasing snow depth on average by 2–4 cm. Adding a new snow thermal conductivity parameterization – combined with all previous developments – reduces the RMSE of the simulated soil temperatures from 5.3 to 3.0 °C on average at all Arctic sites. Our new developments demonstrate the ability of a single-layer snow model to reasonably reproduce Arctic bulk snowpack characteristics, while maintaining good performance at the SnowMIP sites. Inherent uncertainties remain in the forcing datasets, especially due to the harsh Arctic environment characterized by strong winds, snow redistribution, frost, and polar night. Future model developments will focus on spatial-scale simulations across the whole Arctic, with particular attention to snow cover fraction parameterizations to better capture sub-grid-scale spatial heterogeneity in Arctic environments.
- Article
(16495 KB) - Full-text XML
-
Supplement
(2007 KB) - BibTeX
- EndNote


During winter, snow covers up to 40 % of the Northern Hemisphere (NH) land surface, predominantly in mid- to high-latitude regions (Robinson and Frei, 2000; Lemke et al., 2007). Its presence and characteristics profoundly impact regional and global climate dynamics (e.g., Vernekar et al., 1995; Xu and Dirmeyer, 2011; Cohen et al., 2012), as snow plays a critical role in land–atmosphere interactions, particularly due to its high albedo, which reflects a large portion of incoming shortwave radiation (Flanner et al., 2011). Due to its low thermal conductivity, snow insulates the underlying soil in winter, which strongly influences the soil temperature regime and thus the thermal state of permafrost and its carbon balance (Groffman et al., 2001; Zhang, 2005; Vavrus, 2007; Cook et al., 2008; Gouttevin et al., 2012; Park et al., 2015; Campbell and Laudon, 2019; Mavrovic et al., 2023). In addition, snow influences the ecosystems by protecting low vegetation in winter from frost damage (Sturm et al., 2001), conditioning the springtime onset of the growing season (Pulliainen et al., 2017), and affecting Arctic animals such as caribou and lemmings (e.g., Domine et al., 2018b; Pedersen et al., 2021). It also significantly contributes to the hydrological cycle in cold regions, where its accumulation and melt control the timing and magnitude of spring runoff, impacting water resources and ecosystem dynamics (e.g., Barnett et al., 2005; Bring et al., 2016).
Climate change is altering snow conditions, particularly in the Arctic regions, which are warming significantly faster than the global average (Stuecker et al., 2018; Rantanen et al., 2022). These changes affect the hydrological cycle, infrastructures, and ecosystems (Bokhorst et al., 2016; Bring et al., 2016), and may trigger interconnected but asynchronous state shifts among northern ecosystem components, including snowpack, vegetation, permafrost, lakes, and peatlands (Saulnier-Talbot et al., 2024). Carbon stocks in the Arctic permafrost are important because they contain nearly twice as much carbon as the atmosphere, and their thawing could release large amounts of greenhouse gases, amplifying climate change (Schuur et al., 2022). This stresses the need to better simulate carbon fluxes of these ecosystems in response to climate change, including the snow cover, which affects these fluxes through its impacts on soil thermal and hydrological conditions and on gas diffusion between the soil and the atmosphere (Natali et al., 2019; Miner et al., 2022; Mavrovic et al., 2023, 2025). Noticeable reductions in global snow mass and extent have been documented over the last decades, albeit with marked regional variability (Liston and Hiemstra, 2011; Pulliainen et al., 2020; Mohammadzadeh Khani et al., 2022), and are projected to continue into the 21st century (Bring et al., 2016; Mudryk et al., 2018, 2020). It is therefore crucial to adequately simulate snow cover across all environments, particularly in the Arctic, where amplified warming and the vulnerability of substantial permafrost carbon stocks pose significant climate feedback risks (e.g., Burke et al., 2017; Comyn-Platt et al., 2018; Yokohata et al., 2020).
Snow models have been developed with varying degrees of complexity depending on the intended application (e.g., Magnusson et al., 2015; Terzago et al., 2020). Land surface models (LSMs) embedded in general circulation models (GCMs) include snow schemes varying from simple single-layer snow models (Manabe, 1969; Verseghy, 1991; Douville et al., 1995) to medium-complexity multi-layer ones taking into account additional processes such as snow compaction, water percolation, and refreezing (e.g., Loth et al., 1993; Lynch-Stieglitz, 1994; Sun et al., 1999; Boone and Etchevers, 2001; Dai et al., 2003; Yang and Niu, 2003; Xue et al., 2003; Dutra et al., 2010; Shrestha et al., 2010; Best et al., 2011; Wang et al., 2013; Decharme et al., 2016). However, most of these models have been designed for alpine snowpacks and do not adequately simulate Arctic snowpack characteristics (Domine et al., 2019).
Arctic snowpacks are exposed to extreme weather conditions with low precipitation, cold temperatures, and high wind speeds over exposed landscapes. This results in a shallow snowpack shaped by wind-induced compaction of the upper layers, forming a dense “wind slab” at the top of the snowpack. Meanwhile, strong vertical temperature gradients arise within the snowpack – especially during autumn, when unfrozen soils coexist with very cold air temperatures – inducing an upward moisture flux leading to the formation of depth hoar in the lower part of the snowpack with low-density and large snow grain size (Sturm and Benson, 1997; Domine et al., 2015, 2016; Gouttevin et al., 2018). In contrast, snowpacks in mid-latitude alpine environments are generally thicker and characterized by smaller vertical temperature gradients, such that compaction of the lower snow layers under the weight of the overlying snow becomes the dominant process. Consequently, even the most detailed snow models developed for alpine environments, such as Crocus (Vionnet et al., 2012), SNOWPACK (Bartelt and Lehning, 2002; Lehning et al., 2002b, a), and SnowModel (Liston et al., 2020), fail in simulating the vertical profile of snow properties in Arctic snowpacks (e.g., Barrere et al., 2017; Gouttevin et al., 2018; Royer et al., 2021b).
Solutions have been explored, such as introducing explicit moisture fluxes within the snowpacks (e.g., Jafari et al., 2020; Simson et al., 2021; Jafari et al., 2022; Brondex et al., 2023). However, this option is still under exploration, as it presents significant challenges related to computational scheme and cost arising from the complexity of coupling the moisture fluxes with snowpack dynamics and thermodynamics. Alternatively, modifications have been introduced to overcome the lack of water vapor transport, such as increasing the maximum density of wind-induced snow compaction of the upper snowpack layers and reducing the density of the lower layers. This considerably improved the simulated density profiles and made them more comparable to observations at site scales (e.g., Barrere et al., 2017; Gouttevin et al., 2018; Royer et al., 2021b; Lackner et al., 2022; Woolley et al., 2024). However, these modifications remain site-specific, having often been calibrated to one or a few Arctic sites, and have not been designed for global applicability.
Whether multiple snow layers are needed to accurately simulate bulk snowpack properties and the thermal regime of underlying soil in climate models, and if so, how many, remains an open question in the snow modeling community. Evaluations from the Snow Model Intercomparison Project (SnowMIP) have shown no simple relationship between overall model complexity and performance, and some single-layer schemes can perform comparably to substantially more detailed models for bulk snow properties (e.g., Brown et al., 2006; Etchevers et al., 2004; Krinner et al., 2018; Menard et al., 2021). Conversely, controlled sensitivity studies have shown that increasing the number of snow layers can improve the representation of internal mass and energy transfer, snowmelt, and snowpack temperature, although the magnitude of these improvements depends on the model formulation, snow conditions, and target variables (e.g., Essery et al., 2013; Augas et al., 2020; Cristea et al., 2022). Domine et al. (2019) further showed with an ideal snow modeling case study that as long as the bulk thermal resistance of the snowpack is well simulated, having an inverted density profile has little impact on ground and surface temperatures (averaged over several days). However, Gouttevin et al. (2018) and Royer et al. (2021b) showed that the adaptations made to simulate Arctic snowpacks in Crocus and SNOWPACK tended to modify the bulk snow density and thermal conductivity, thus impacting soil temperatures.
The Canadian Land Surface Scheme including Biogeochemical Cycles (CLASSIC; Melton et al., 2020; Seiler et al., 2021) is the LSM used within the Canadian Earth System Model (CanESM; Swart et al., 2019) used for climate change impact assessments (e.g., Eyring et al., 2016; IPCC, 2021; Mudryk et al., 2020). CLASSIC includes a one-layer snow model that demonstrates comparable performance to the most detailed snow models in terms of bulk snow properties according to SnowMIP (Etchevers et al., 2004; Krinner et al., 2018; Menard et al., 2021). Although CLASSIC uses a single prognostic snow layer, an assumed quadratic internal temperature profile provides an indirect representation of its vertical thermal structure. Nevertheless, diagnosing snow thermal conductivity directly from bulk density may constitute an intrinsic limitation for strongly stratified snowpacks, such as Arctic snowpacks, because the density–conductivity relationship is nonlinear. Moreover, the SnowMIP evaluation sites do not include representative Arctic sites – apart from Sodankylä in Finland (67.368° N; Essery et al., 2016), which lies at the border of the boreal forest but is not characterized by typical Arctic snowpack conditions. Therefore, evaluating the CLASSIC snow model at Arctic sites is crucial in order to ascertain whether its simple single-layer snow scheme can capture key snowpack processes in this environment.
This study aims to evaluate and improve the current 1D physics of the CLASSIC snow model worldwide, with a particular focus on the Arctic, using offline land simulations driven by observed meteorological forcing at seven SnowMIP sites and three additional Arctic sites. We aim to address the following questions: (1) Can a single-layer snow model reproduce the bulk characteristics of Arctic snowpacks? (2) What effect do the adaptations for Arctic conditions have on the model performance elsewhere (e.g., mid-latitude Alpine snowpacks)? (3) How do those adaptations impact the simulated soil temperatures and carbon fluxes? The data and methods are presented in Sect. 2. The results are presented in Sect. 3, and discussed in Sect. 4. The conclusion is presented in Sect. 5.
2.1 SnowMIP and Arctic sites
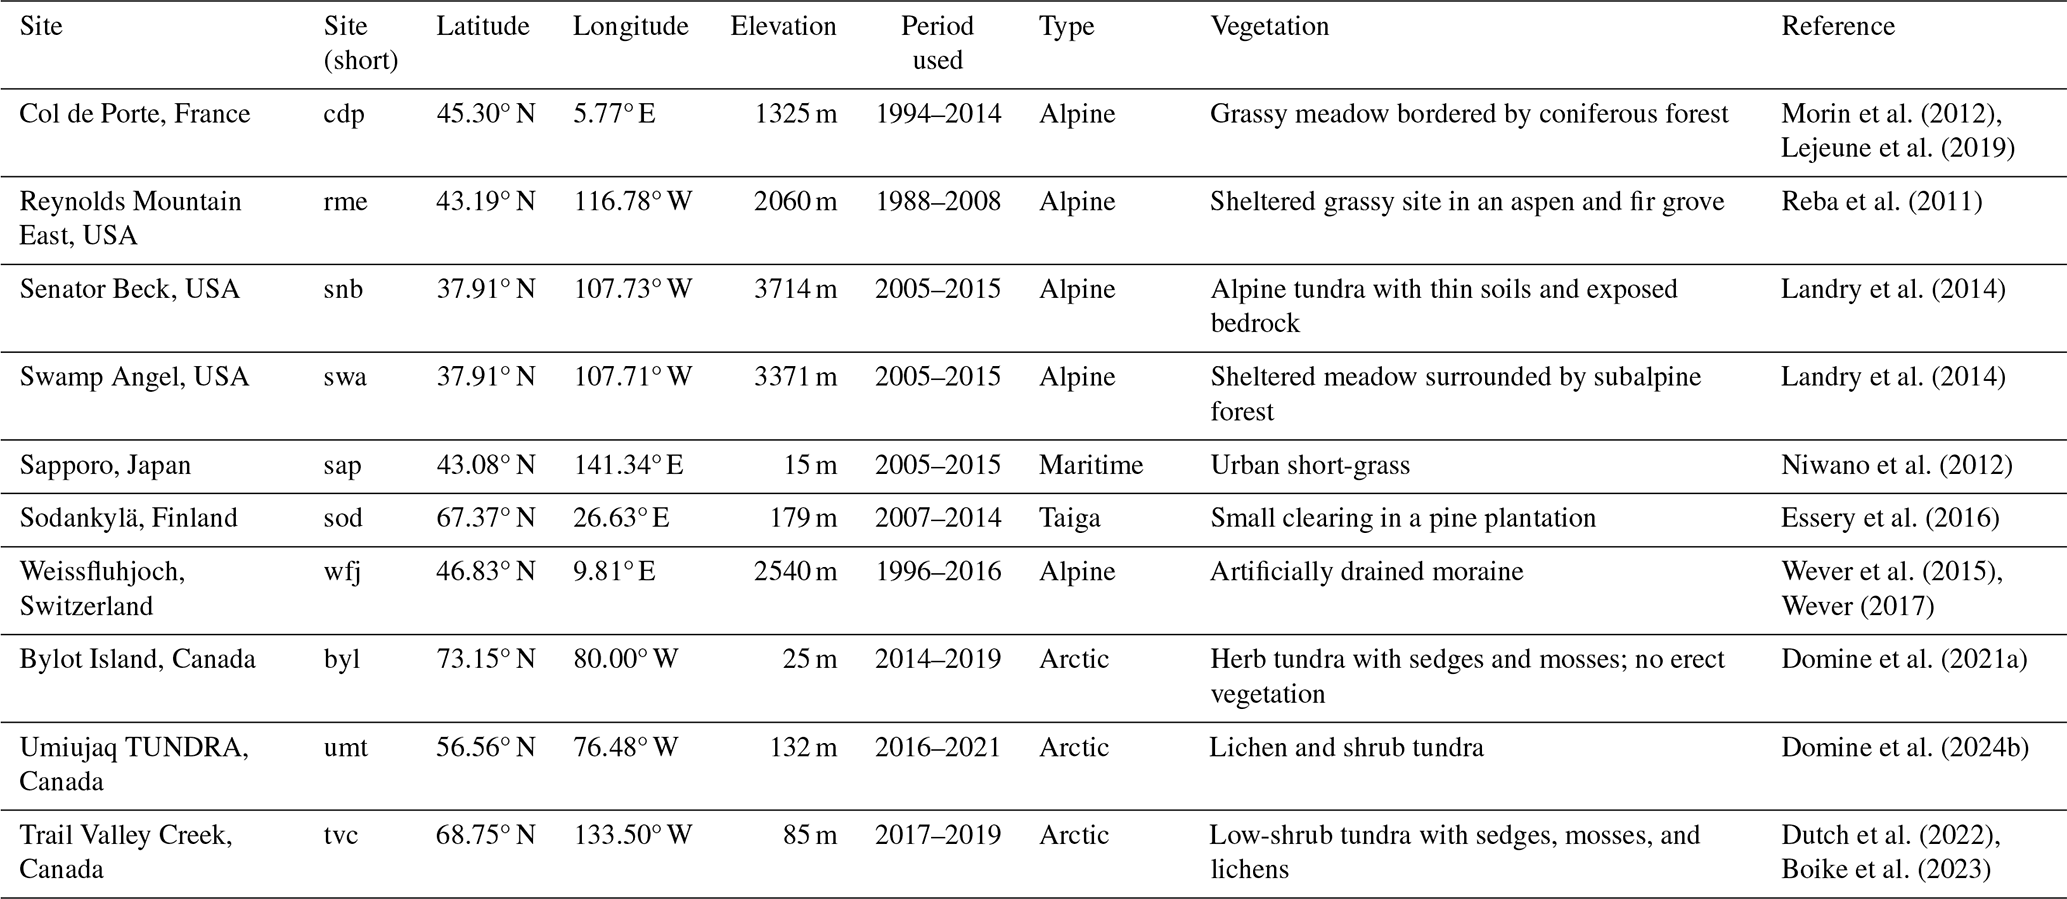
CLASSIC requires the following seven meteorological forcings: incoming short- and long-wave radiation, near-surface air temperature, wind speed, specific humidity, total precipitation rate (and optionally snowfall rate), and air pressure. Both total precipitation and snowfall rates were prescribed at all sites to minimize uncertainties related to snow accumulation. The quality-controlled and standardized SnowMIP data are used, which combine meteorological forcings and snow measurements such as snow depth, snow water equivalent, albedo, surface and soil temperatures, depending on sites (Krinner et al., 2018; Ménard et al., 2019; Menard et al., 2021). Additionally, three Arctic sites are considered in this study: Bylot Island (Domine et al., 2021a), Umiujaq TUNDRA (Domine et al., 2024b), and Trail Valley Creek (Dutch et al., 2022) (Fig. 1). The boreal SnowMIP sites (Old Aspen, Old Black Spruce, and Old Jack Pine) are excluded from our study because of the uncertainties due to snow canopy processes, which are out of the scope of this work. All sites are described in Table 1. More information about site initialization and variables is available Tables S1–S3 in the Supplement.
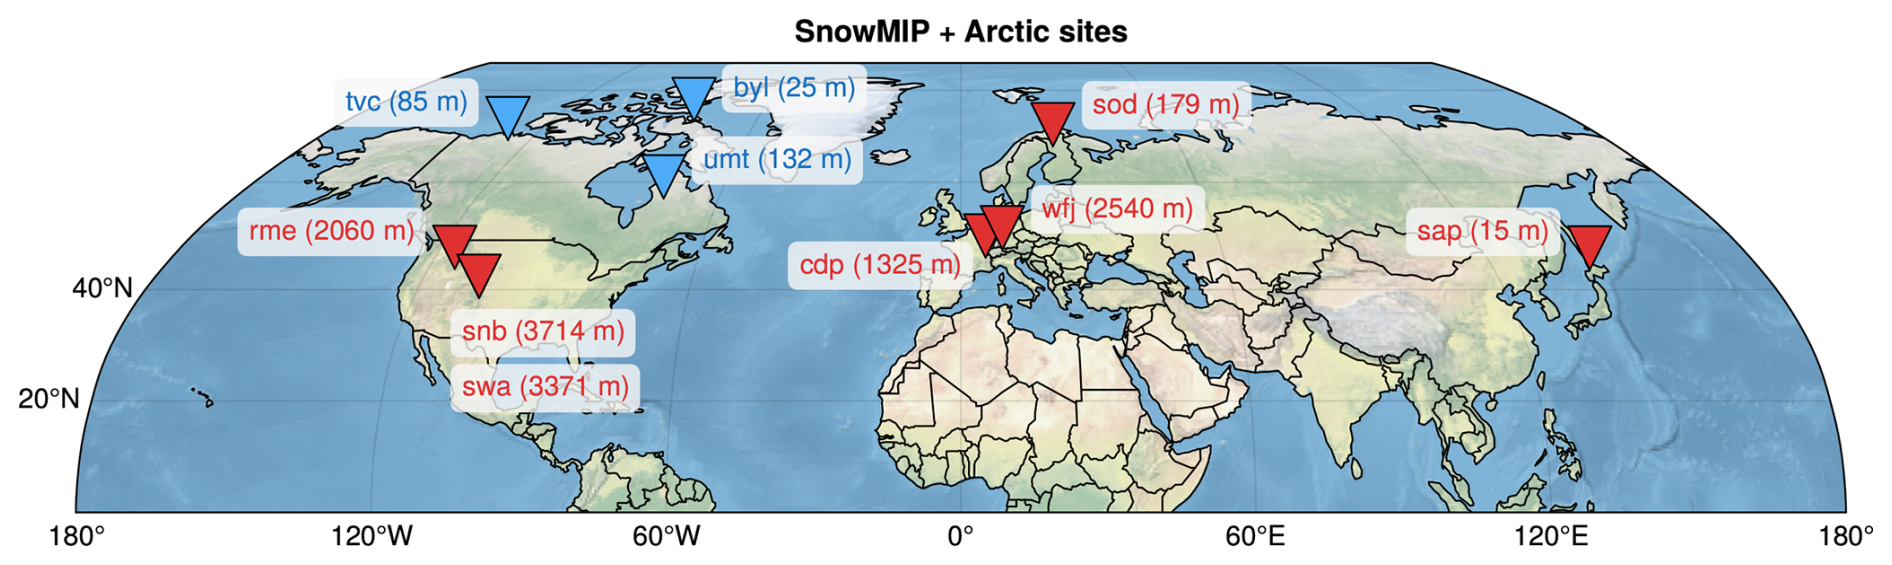
Figure 1Map showing the locations of the SnowMIP (red; cdp: Col de Porte, rme: Reynolds Mountain East, snb: Senator Beck, swa: Swamp Angel, sap: Sapporo, sod: Sodankylä, wfj: Weissfluhjoch) and Arctic sites (blue; byl: Bylot Island, umt: Umiujaq TUNDRA, tvc: Trail Valley Creek) with the Natural Earth background (license: public domain). Site elevations are indicated in brackets. See Table 1 for further information about the sites.
Table 1SnowMIP (cdp, rme, snb, swa, sap, sod, wfj) and Arctic (byl, umt, tvc) sites. Additional information on site setup, including the plant functional types (PFTs) prescribed in CLASSIC, soil initialization, and the observational variables available for model evaluation is provided in Tables S1–S3, respectively. Further information about the SnowMIP sites is available at https://www.geos.ed.ac.uk/~ressery/ESM-SnowMIP/ESMSnowMIP_Reference_sites.pdf (last access: 12 March 2024).
The relative humidity at Umiujaq and TVC was converted to specific humidity as an input for CLASSIC (see Sect. S2). The data from Umiujaq FOREST were not used because of the uncertainties related to snow trapping by tall vegetation (tall shrubs and black spruce) (Domine et al., 2024b). At the Umiujaq TUNDRA, soil data are available separately for the shrub and lichen subareas but were averaged here, as the snow measurements and meteorological forcing are based on a single location between the two subareas. To best match the observations, the plant functional type at this site was prescribed in the model as 50 % broadleaf deciduous cold shrub (Betula glandulosa) and 50 % bare soil, as lichen is not currently represented as a plant functional type in CLASSIC (Table S1). At all Arctic sites, a fibric peat layer (Letts et al., 2000) was prescribed in the uppermost soil layer (top 10 cm) to partially alleviate the absence of explicit lichen and moss representations in CLASSIC and to mimic the insulating properties of the lichen or moss layers present at these sites. This imperfect solution is further discussed in Sect. 4.6. The thickness of the peat layer (10 cm) was set to best match the observed amplitude of summer soil temperatures and soil water content (not shown). When needed, the simulated soil variables (soil temperature and soil water content) were linearly interpolated to the first observational measurement depth greater than or equal to 5 cm (corresponding to the center of the first model soil layer) for comparison with observations.
At TVC, the dataset used in Woolley et al. (2024) was not publicly available at the time of this study; therefore, we relied on the forcing data from Dutch et al. (2022), which span a two-year period and include precipitation corrected for gauge undercatch following Pan et al. (2016). As only total precipitation was provided, rainfall and snowfall rates were estimated using the suggested temperature threshold of 1 °C from Woolley et al. (2024). This temperature-based rain–snow partitioning may introduce uncertainties, especially for mixed-phase events or precipitation occurring near the threshold temperature (e.g., Dai, 2008; Harder and Pomeroy, 2014; Feiccabrino et al., 2015; Jennings et al., 2018; Jennings and Molotch, 2019). The station location itself may act as a local snow accumulation zone, leading to measured snow depths that are likely larger than those representative of the surrounding tundra (Brampton Dakin and Georgina Woolley, personal communication, 2023). Despite the prior gauge-undercatch correction, the initial simulated snow depth was too low and the snow density was underestimated relative to snow-pit measurements. We therefore adjusted the snowfall rate in Dutch et al. (2022) to match the snow depth at peak snow accumulation in our simulations including our new Arctic snow model developments (corresponding to a scaling of the snowfall rates by a factor of two; Fig. S1a–d in the Supplement blue and green lines in Sect. S3), which will be further discussed in Sect. 4.5. The updated dataset used in Woolley et al. (2024) is expected to provide improved forcing data and may help resolve these snowfall rate uncertainties in future studies.
The precipitation at Umiujaq was measured only from 2016 onward, and ERA5 data are used prior to that (Domine et al., 2024b). Therefore, only the period after 2016 is considered for the model evaluation. The albedo at the Arctic sites can be retrieved from the incoming and outgoing shortwave radiation measurements. However, due to frost-related issues with the instruments, some data are inaccurate and gap-filled, often leading to unrealistic values; therefore, the simulated albedo will not be assessed against observations at those sites. All data provided are quality-controlled and use snowfall wind undercatch corrections (Ménard et al., 2019; Domine et al., 2021a, 2024b; Dutch et al., 2022). Further in-depth discussion on the measurement uncertainties is addressed in Sect. 4.5. The snow depth time series at all sites are shown in Fig. A1.
2.2 CLASSIC and model developments
This study introduces three snow model physics improvements: (1) a correction of the computation of the thermal conductivity at the top of the first soil layer (Sect. 2.3.1), (2) a revised computation of the bottom snow temperature (Sect. 2.3.2), and (3) the addition of a windless exchange coefficient within the sensible heat flux calculation (Sect. 2.3.3). Furthermore, three Arctic-specific snowpack adaptations are proposed: (1) the inclusion of blowing-snow sublimation losses (Sect. 2.4.1), (2) a revised compaction scheme (Sect. 2.4.2), and (3) a modification of the snow thermal conductivity parameterization (Sect. 2.4.3). All details about the code implementation are available in Sect. S4.
2.2.1 General model description
In this study, we use the Canadian Land Surface Scheme Including Biogeochemical Cycles (CLASSIC v1.8; Melton et al., 2020) that is based on the coupled Canadian Land Surface Scheme (CLASS; Verseghy et al., 2017) and the Canadian Terrestrial Ecosystem Model (CTEM; Melton and Arora, 2016). The physical component (formerly CLASS) operates at a time step of up to 30 min and includes 20 soil layers up to 61 m depth. The vertical energy and water fluxes are modeled separately for four subareas in each grid cell: vegetated, bare soil, vegetated with snow cover, and bare soil with snow cover. The biogeochemistry component (formerly CTEM) provides the model physics with dynamically simulated vegetation structural attributes – such as leaf area index (LAI), vegetation height, and rooting depth. The model represents vegetation using twelve plant functional types (PFTs) for biogeochemical processes (including three PFTs – sedges and evergreen/cold-deciduous shrubs – introduced by Meyer et al. (2021) in addition to the 9 PFTs used in CLASSIC v1.0), which are aggregated into five PFTs for the physical component.
2.2.2 Snow model description
Snow in CLASSIC is modeled as a single layer, with thermal properties distinct from the underlying soil. A fitted quadratic temperature curve is assigned within the snow layer as a first-order method of accounting for the characteristic sharp near-surface temperature gradient in snowpacks. The snow albedo decreases, and the snow density increases exponentially with time from fresh snow values according to empirically derived functions (Brown et al., 2006; Verseghy et al., 2017). The fresh snow density is determined as a function of the air temperature (Pomeroy and Gray, 1995). The snow thermal conductivity is derived from the snow density (Sturm et al., 1997). Melting of the snow layer can occur either from above (in response to surface energy fluxes) or from below (in response to conduction from the underlying soil); if melting occurs at the top, percolation and refreezing of meltwater in the snowpack occur until the snow is isothermal at 0 °C, after which meltwater can infiltrate into the soil. Water retention in snowpacks is taken into account (Bruce and Clark, 1966). The interception of snowfall by vegetation is explicitly modeled, with the interception capacity depending on the vegetation leaf area index (Hedstrom and Pomeroy, 1998; Bartlett et al., 2006; Bartlett and Verseghy, 2015). The snow cover fraction (SCF) is considered complete (100 %) when the average snow depth (ds) reaches 0.1 m. When ds is lower than this threshold, the SCF is calculated as and ds is reset to 0.1 m over the subfraction covered by snow (following snow mass conservation). More details on the previous CLASS snow model developments and evaluations are available in Bartlett et al. (2006), Brown et al. (2006), Langlois et al. (2014) and Verseghy et al. (2017).
2.3 Snow model: physics improvements
2.3.1 Thermal conductivity at the top of the first soil layer
In CLASSIC, the effective thermal conductivity at the top of the first soil layer (λ0) below the snowpack is computed as the harmonic mean of the thermal conductivity at the top of the first soil layer (λ1,t) and that of the snowpack (λs) as follows:
However, when snow cover is partial ( %), Eq. (1) was applied uniformly across all grid-cell subareas, including both snow-covered and snow-free fractions. As a result, the effective thermal conductivity at the top of the first soil layer over snow-free areas was underestimated, leading to an overestimated insulating effect under snow-free conditions when SCF<100 %. This issue was corrected in this study: Eq. 1 is applied only to snow-covered subareas, while is prescribed for snow-free subareas. More details are available at: https://gitlab.com/cccma/classic/-/issues/119 (last access: 10 October 2025).
2.3.2 Bottom snow temperature
The bottom snow temperature Ts,b – defined as the temperature at the interface between the snowpack and the soil – was estimated as an average of the first soil layer T1 and snow Ts temperature weighted by their depth d1 and ds respectively, as follows (https://gitlab.com/cccma/classic/-/blob/CLASSICv1.0/src/snowTempUpdate.f90?ref_type=tags#L139; last access: 10 October 2025):
This bottom snow temperature serves as the boundary condition for computing the ground heat flux and then updating the snow and soil temperatures via the quadratic temperature profile (https://cccma.gitlab.io/classic/snowTempUpdate_8f90.html, last access: 10 October 2025 and https://cccma.gitlab.io/classic/soilHeatFluxPrep_8f90.html, last access: 10 October 2025). However, this equation tended to underestimate the simulated bottom snow temperature and induce an overestimated snow temperature compared to observations (see results in Sect. 3.2.2). Indeed, as the snowpack thickens, its insulating effect increases; as a result, the bottom snow temperature becomes less influenced by the snowpack's bulk (average) temperature and instead approaches the temperature of the underlying soil layer (fixed thickness of 10 cm). The underestimated simulated bottom snow temperature induces, in turn, an overestimated conductive heat flux from the soil into the snowpack (especially at the beginning of the winter). A better option was implemented by weighting the soil and snow temperatures with the inverse depth of the snow and soil layers, respectively (improved results are presented in Sect. 3.2.2 and Appendix B):
2.3.3 Windless exchange coefficient
Brown et al. (2006) reports that “a number of studies have shown that the traditional Monin-Obukhov similarity theory is unable to explain turbulent energy exchanges over snow and ice surfaces under stable atmospheric conditions (King, 1990; Morris et al., 1994; Yen, 1995; Martin and Lejeune, 1998). Under these conditions, turbulence does not shut down completely and is characterized by intermittent bursts. […] This has prompted a range of solutions, including the introduction of a “windless transfer coefficient” into sensible heat calculations (Jordan et al., 1999)”. For a comprehensive review of this issue, see Sect. 4e of Brown et al. (2006). This deficiency led to a cold bias in simulated snow surface temperatures, particularly during nighttime temperature inversions, reaching up to about 10 °C in CLASS v3.1 (Fig. 11 of Brown et al., 2006, thin solid line). A similar behavior was observed in CLASSIC at most SnowMIP sites (not shown), resulting in an average cold bias of approximately 2 °C in daily simulated snow surface temperature (see results in Sect. 3.3.2). Brown et al. (2006) alleviated this bias by introducing a windless transfer coefficient (E0) into the sensible heat flux formulation (QH) as follows:
where ρair is the density of air (kg m−3), cP is the specific heat capacity of air (set to 1.00464×10³ J kg−1 K−1 in CLASSIC), CH is the surface drag coefficient (unitless), U the wind speed at reference height (m s−1), Ts the surface temperature (K), and θa the potential air temperature at the reference height (K). E0 is set to 2 W m−2 K−1 when Ts<θa (i.e., for atmospheric stable condition) and 0 W m−2 K−1 otherwise. This correction is applied only over non-vegetated subareas. Following Brown et al. (2006)'s study, this windless transfer coefficient was not activated by default in CLASSIC, as it was tested at only a limited number of sites. The present study extends this evaluation to the selected SnowMIP and Arctic sites.
2.4 Snow model: Arctic adaptations
2.4.1 Blowing-snow sublimation losses
The blowing-snow sublimation loss parameterization of Gordon et al. (2006) is implemented. It computes the blowing-snow sublimation rate as a function of near-surface meteorological conditions when the wind speed exceeds the threshold for snow transport. This empirical formulation was derived by averaging sublimation rates from several existing models and parameterizations – including the Prairie Blowing Snow Model (PBSM; Pomeroy et al., 1993). The total sublimation rate Qs [kg m−2 s−1] is defined as:
with:
where Ut [m s−1] is the threshold wind speed at 10 m for the initiation of blowing snow, Tair is the near-surface air temperature [K], T0 is the freezing point of water (defined as 273.16 K in CLASSIC), ρa is the density of air [kg m−3], qsi is the saturation specific humidity of ice at reference height [kg kg−1], RHi is the relative humidity with respect to ice [fraction], U10 is the wind speed at 10 m above the snow surface [m s−1]. This equation is applied only to bare-ground subareas covered with snow (i.e., to bare ground and to subareas where snow buries vegetation). The blowing-snow sublimation losses from the intercepted snow on the canopy are not considered.
2.4.2 Snow compaction
The aim of modifying the compaction scheme is to represent first-order Arctic snow densification processes, including depth hoar and wind slab formation, in a “bulk” approach. Initial results revealed that CLASSIC tended to underestimate snow density and overestimate snow depth at the Arctic sites (see results in Sect. 3.2.3). Indeed, Arctic snowpacks tend to be characterized by shallow snow depth (usually less than 0.5 m) composed of a low-density depth hoar layer (≃250 kg m−3) overlain with denser wind slabs (>300 kg m−3), while the average bulk snow densities tends to have high values ranging from about 250 to 400 kg m−3 (e.g., Gouttevin et al., 2018; Domine et al., 2021a; Royer et al., 2021a). Consequently, several parameters controlling snow compaction – such as fresh snow density, maximum snow density, and compaction rate – can be adjusted to better represent Arctic bulk snow densities.
Fresh snow density
CLASSIC's fresh snow density ρi is based on the equations of Pomeroy and Gray (1995) and Pomeroy et al. (1998) for temperatures above and below 0 °C respectively:
New parameterizations such as the ones based on CROCUS (Vionnet et al., 2012), SNOWPACK (Lehning et al., 2002b), or SnowTran-3D (Liston et al., 2007) based on relative humidity, (wet-bulb) air temperature, and/or wind speed were tested, including their “Arctic-tuned” versions (e.g., Royer et al., 2021b; Walter et al., 2024). However, none of those new, fresh snow density equations brought significant improvements over time in CLASSIC at the Arctic sites, and they worsened its performance at the SnowMIP sites (not shown). Indeed, they mostly increase the fresh snow density at the start and end of the season for the Arctic sites when air temperatures are in the range of −10 to 0 °C, but have a negligible impact over most of the snow season, because the temperature term dominates over the wind term under very cold (below −20 to −30 °C) conditions. So Eq. (7) was kept unchanged in this study despite its non-consideration of the wind speed.
Maximum snow density
The snow density ρs in CLASSIC increases exponentially towards a maximum snow density ρmax as follows:
with:
and,
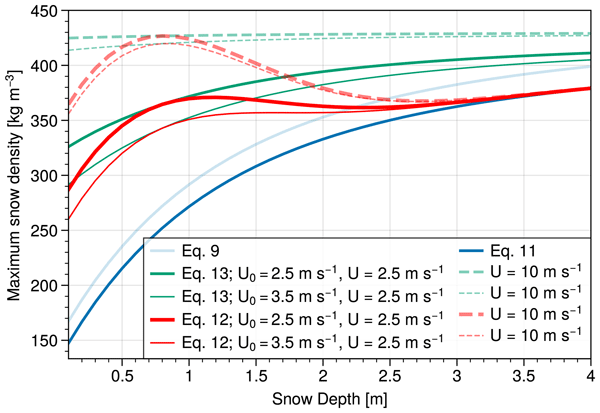
where ds is the snow depth [m], Ts the snow temperature [°C], and Δt the model time step [s]. The maximum snow density formulations are based on Tabler et al. (1990), with additional temperature threshold and enhanced settling rates determined empirically (Brown et al., 2006, unpublished manuscript, 2001). However, the maximum snow density values for dry snow (Eq. 9) do not reflect actual measured snow densities in Arctic environments under strong wind conditions, where values can reach 250–400 kg m−3 for thin snowpacks (<1 m) (e.g., Domine et al., 2021a; Royer et al., 2021a). Indeed, those observed values are above the maximum snow density defined by Brown et al. (2006): e.g., 235.4 kg m−3 for a typical Arctic snowpack height of 50 cm (Fig. 2, shaded blue curve). The following equations are thus proposed to take into account the effect of wind on the maximum snow density for dry snow:
and,
with:
where U is the wind speed at 2 m above the snowpack [m s −1], U0=2.5 m s−1 (or 3.5 m s−1 for the TVC adjusted version; see Sect. 2.5 and 2.6), d0=0.8 m, and σ=1.0 m. The constant 450 is reduced to 430 to better fit the observations across all sites, given the increased wind compaction during wind events. The wind-induced compaction is only applied over the bare ground subfraction (i.e., over non-vegetated subareas and/or when the snow entirely buries the vegetation) as we consider that there is no further snow compaction within the canopy – vegetation reduces near-surface wind exposure and can therefore limit wind-driven snow redistribution and densification within the canopy (e.g., Lackner et al., 2022), although vegetation–snow–wind interactions may involve more complex relationships that are not explored in the present study. Over the vegetated subarea ρno wind (Eq. 11) is maintained regardless of the wind speed. We adjust the wind speed provided at specific measurement heights to 2 m above the snowpack in the model using a logarithmic wind profile (Sect. S5). For wet snow, Eq. (10) is kept unchanged.

Figure 2Maximum snow density with respect to snow depth for dry snow of Eq. (9) (shaded blue), Eq. (11) (blue), Eq. (12) (red), and Eq. (13) (green). The solid and dashed green lines represent wind speeds of 2.5 and 10 m s−1 respectively, as an example. The thick and thin red and green lines represent, respectively, the U0 values of 2.5 and 3.5 m s−1 optimized without or with TVC (see Sect. 2.5 and 2.6).
Figure 2 shows Eq. (9) (shaded blue), Eq. (11) (blue), Eq. (12) (red), and Eq. (13) (green) for different wind speed and U0 values. The wind-induced compaction term (Eq. 13; green curves) increases the snow density for thin snowpacks proportionally to the wind speed. However, it also affects thick snowpacks, where gravitational and metamorphic compaction dominate over wind effects, and, when used as is, it degrades model skill at SnowMIP sites (not shown). Equation (12) (red curves) introduces a Gaussian formula that peaks around an optimized value of 80 cm towards this wind-induced compaction term ρwind (Eq. 13) and tends towards ρno wind (Eq. 11) for values lower and higher than 80 cm of snow depth. This enables the indirect consideration of depth hoar in very thin snowpacks, while affecting less snowpacks with a thickness greater than 2 to 3 m. This semi-empirical formulation primarily represents wind-induced densification while accounting, at the bulk scale, for the contrasting contributions of low-density basal depth hoar and denser upper wind-slab layers. It is not intended to explicitly represent the physical processes governing the formation and evolution of these layers.
Compaction rate
Alternatively, the compaction rate could also be increased, either alone or in combination with increasing the fresh snow density and/or the maximum snow density (e.g., Royer et al., 2021b; Woolley et al., 2024). However, no further improvements were observed compared to increasing the maximum snow density alone, which can indirectly account for these processes. This will be further discussed in Sect. 4.4.
2.4.3 Snow thermal conductivity
The current CLASSIC snow thermal conductivity parameterization is based on Sturm et al. (1997):
with λs the snow thermal conductivity [W m−1 K−1], and ρs the snow density [kg m−3]. We propose a more recent formulation based on Calonne et al. (2011):
This new parameterization has the advantage of having been calibrated using high-resolution three-dimensional images of snow microstructure, covering a wide range of seasonal snow types, including wind slabs and depth hoar samples formed under controlled temperature-gradient conditions. However, it does not include natural Arctic depth-hoar samples representative of strongly stratified tundra snowpacks. The sample size in Calonne et al. (2011) is smaller than in Sturm et al. (1997), whose dataset includes a larger number of high-latitude snow samples. Nevertheless, the Calonne et al. (2011) approach provides a more physically based and potentially more reliable estimate of thermal conductivity by directly resolving the three-dimensional microstructural geometry. In contrast, the Sturm et al. (1997) relationship is based on heated-needle-probe measurements, which are subject to known methodological limitations and may substantially underestimate thermal conductivity, particularly for fragile and highly anisotropic depth hoar (Fourteau et al., 2022). Although grouped with the Arctic adaptations, the Calonne et al. (2011) parameterization is not intrinsically Arctic-specific. It was evaluated at this stage because its thermal effects could be better constrained at the Arctic sites, where soil temperatures exhibit larger winter amplitudes, and only after obtaining reasonable snow depth, SWE, and bulk density to limit potential compensating biases in snow thermal resistance.
2.5 Simulation setup
This study uses CLASSIC v1.8 (Melton et al., 2020) in a 1D point-scale configuration. In practice, strictly point-scale simulations are somewhat idealized, given that the meteorological forcing data and validation measurements cover different areas around the stations, and the spatial footprint of each sensor varies. We therefore prescribed soil properties, vegetation cover, and other site characteristics to be as representative as possible of the area surrounding the measurement sensors. CLASSIC point-scale simulations are treated similarly to single-grid-cell simulations, allowing fractional vegetation cover and separate surface energy and water balances over different subareas, including snow-covered and snow-free fractions. The snow cover fraction parameterization was kept active and follows a linear relationship between 0 and 10 cm snow depth, as further discussed in Sect. 4. However, the presence of snow at the scale of a snow depth sensor is effectively binary; consequently, this introduces uncertainties when comparing model outputs with point-based measurements, particularly during shallow or patchy snow conditions and in wind-affected environments where snow redistribution can generate strong small-scale variability in snow depth. Scanning laser measurements could help improve the spatial representativeness of snow depth observations in future studies (e.g., Picard et al., 2016). To limit these effects, evaluation metrics were computed only when observed snow depth exceeded 10 cm (Sect. 2.6), and further discussion about the uncertainties related to point-scale simulations is covered in Sect. 4.
The meteorological forcings at all sites described in Sect. 2.1 were used to force the model and were linearly interpolated from 1 h to the chosen 30 min model physics time step. CLASSIC requires full-year forcing files; therefore, the forcing data were extended at both the beginning and end of the time series by replicating the first and last available full years over any missing periods, and analyses were carried out only on the available data period. All the forcing files were provided in local time or were converted to local time. Uncertainties related to the meteorological forcing can also affect the simulations, particularly at Arctic sites where precipitation, radiation, and near-surface meteorological measurements are more prone to errors due to wind undercatch, frost, polar night conditions, and data gap filling; these uncertainties are further discussed in Sect. 4.5.
The soil texture (sand, clay, and organic matter content) was prescribed based on site information when available (Tables 1 and S2) and complemented with the global gridded dataset SoilGrids250m version 1 (Hengl et al., 2017) when needed. Soil permeable depth and soil color index were prescribed with the nearest grid cell of the gridded dataset from Hengl et al. (2017) and Shangguan et al. (2017). The PFTs were prescribed with site information (Tables 1 and S1). The proportions of C3 and C4 grasses were derived from Still et al. (2003). The model was run with the biogeochemistry component (CTEM) enabled, allowing vegetation to evolve dynamically and CO2 fluxes to be simulated. The methane and nitrogen cycle, fire, competition, and dynamic tiling options were not activated (the default options in the current CLASSIC version). The CO2 forcing was derived from Friedlingstein et al. (2023). Further information is available in Sect. S1 of the Supplement.
A first spin-up phase was performed at all sites over 100 to 300 years by looping over the forcing files (with an accelerated carbon pool storage – spinfast parameter set to 10) until reaching the equilibrium in the carbon pools. A final spin-up phase was performed over the same duration with the spinfast parameter set to 1 to ensure the conservation of carbon (see Sect. S6 for further details on the spin-up procedure). During the spin-up phases, the CO2 concentration was held constant at the value corresponding to the first year of the meteorological forcing file specific to each station; then, for the runs, the CO2 concentration evolved on an annual basis, following the values from Friedlingstein et al. (2023).
Table 2 presents the set of experiments conducted at the SnowMIP and Arctic sites, designed to sequentially test the improvements and modifications introduced above in the CLASSIC snowpack scheme (Sect. 2.3 and 2.4).
Calonne et al. (2011)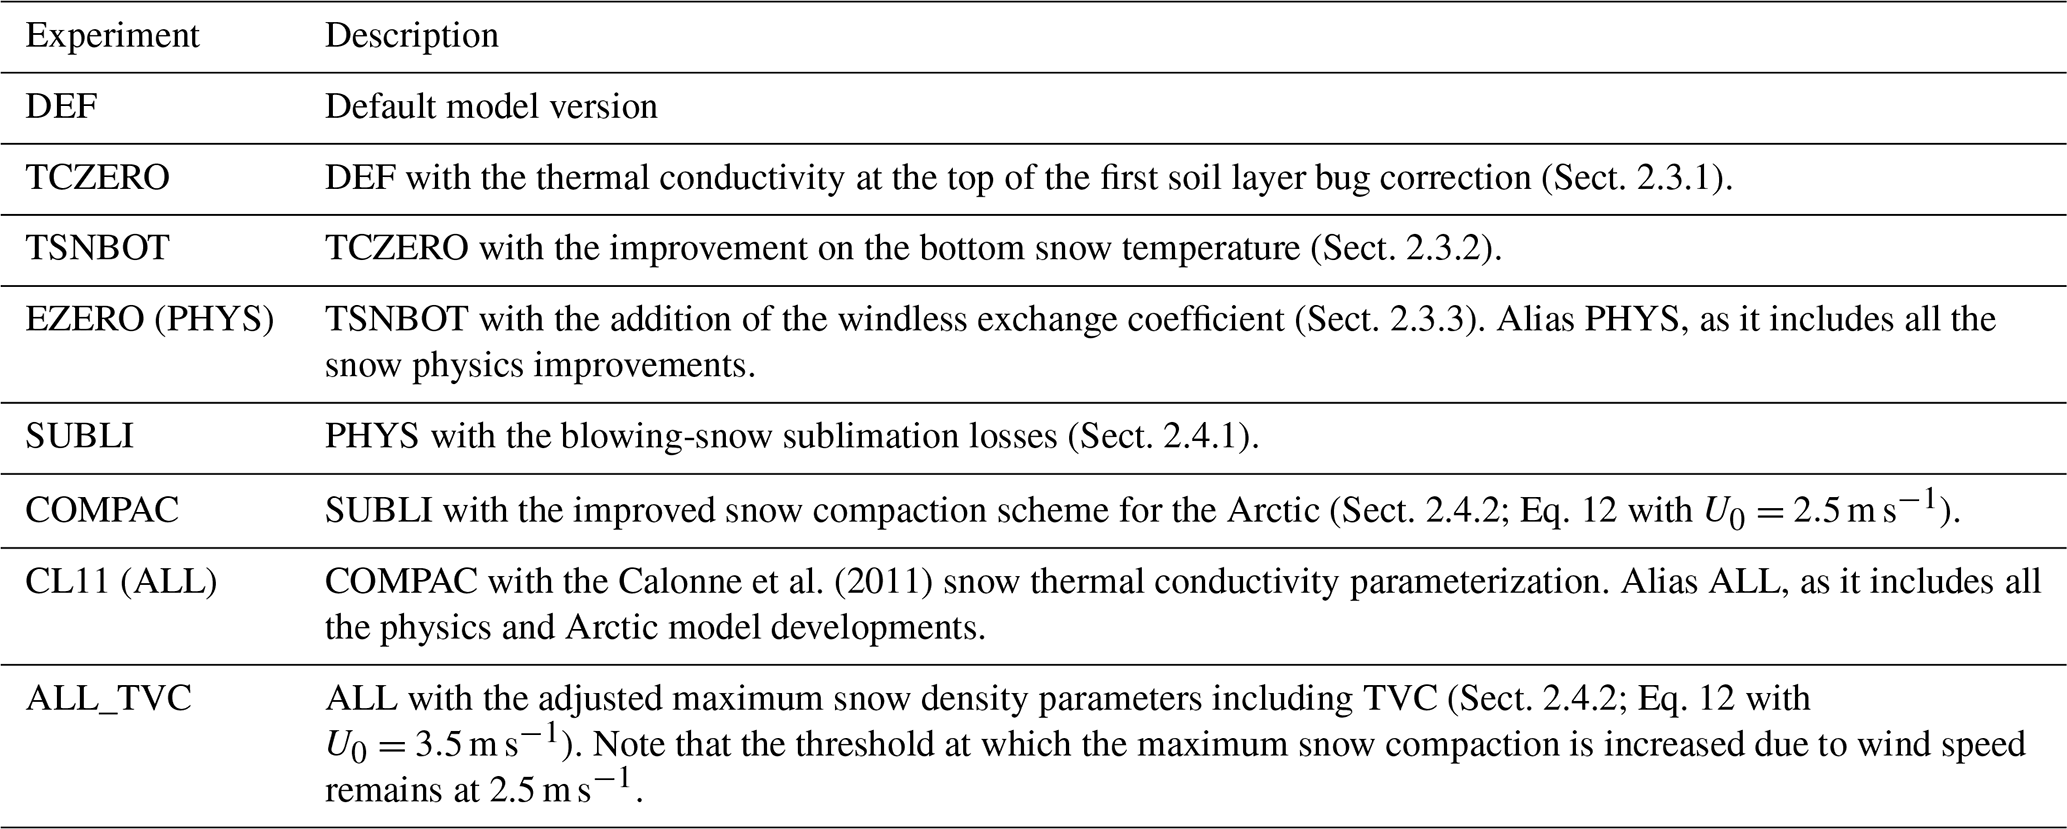
2.6 Evaluation metrics
Model skill is evaluated using observed manual and automatic snow depth and SWE, snow albedo (excluding Arctic sites; see Sect. 2.1), surface temperature, soil temperature in the upper soil layers (1–30 cm, depending on the site), and snow cover duration (SCD), which is derived as the number of days within a snow season (September to August) with snow depth exceeding 10 cm. Table S3 lists the measurements available at each site. To avoid uncertainties arising from patchy snow in both the model and observations, the metrics are computed for snow depth greater than 10 cm. In addition, observed snow albedo values are constrained to be between 0.4 and 0.9, and snow surface temperature to be less than or equal to 0 °C, to ensure that they remain within a realistic physical range and to avoid potential artifacts or errors from observational measurements. Observed albedo may still be influenced by protruding vegetation, especially during shallow snow conditions, despite the 10 cm snow depth threshold. However, albedo measurements are available mainly at sites with short or mowed grass, alpine tundra, or little vegetation cover, making them broadly comparable to the simulated snow albedo. Remaining uncertainties may instead arise from limitations in the representation of vegetation in CLASSIC, including possible overestimation of simulated vegetation height and the absence of vegetation bending, as further discussed in Sect. 4.6. For the soil temperatures, the first soil layer measurement at a depth greater than or equal to 5 cm is used for comparison with the model.
The following mean bias (MB), normalized mean bias (NMB), root-mean-square error (RMSE), and normalized RMSE (NRMSE) are used for each site:
where Mt and Ot denote the daily modeled and in situ observed values at time t, d is the number of days available within the analysis period for each variable and site, and σO is the standard deviation of the daily observed values over the corresponding period. An NRMSE greater than 1 indicates poorer RMSE-based performance than using the observed temporal mean as a constant predictor. The normalized RMSE and MB allow for better comparison among sites and variables.
In addition, we define an overall score over all sites and variables as follows:
where n is the number of variables, mi is the number of available sites for each variable i, RMSEij is the root-mean-square error for the variable i at site j, and σO,ij is the standard deviation of the corresponding observations. The score is equal to 1 when the model perfectly matches the observations, equal to 0 when the RMSE equals the observational standard deviation, and becomes negative when the RMSE exceeds the observational variability. Each variable enumerated before is counted (snow depth, SWE, snow albedo, surface temperature, soil temperatures, and SCD). The snow depth and SWE include both the automatic and manual measurements, giving slightly more weight to those variables.
Pearson correlation coefficients were also computed as a complementary diagnostic to assess the temporal agreement between simulated and observed daily time series. These values should be interpreted with caution, as daily simulated time series are not expected to exactly follow the observations, especially for snow depth at Arctic sites where wind-driven redistribution can cause local snow depth changes that are not directly related to precipitation events. Therefore, correlations are used only as an additional diagnostic and are not included in the overall score. All metric values are reported in Sect. S11.
2.7 Optimization process
The snow model physics developments (Sect. 2.3) were mainly carried out independently of each other, guided by physical considerations and evaluated against available observations, without aiming to optimize scores or overall model performance. The snow Arctic adaptations (Sect. 2.4) were developed upon the physics developments by testing various formulations with manual iteration and exploration of the parameter space. All sites except TVC were used in this process in order to preserve TVC as an independent validation site – and given the substantial uncertainties associated with the snowfall rates at this site (see Sect. 2.1). Nevertheless, we also propose an adjusted version that includes TVC (experiment ALL_TVC; Table 2), motivated by the distinct behavior observed at this site and the limited number of available Arctic sites (see details below).
This study presents only the optimal solutions, although additional combinations of parameters and parameterizations were tested (not shown). The key tuning process was focused on the dry maximum snow density (Eq. 12). The following spaces of parameters were tested: with increments of 0.1 m, with increments of 0.1 m, with increments of 0.1 m s−1 and the maximum constant of 430 (Eqs. 11 and 12) was tested between 400 and 450 kg m−3 with increments of 5 kg m−3. The threshold wind speed at which wind-induced compaction is triggered was tested as U0 (independently). Modifications to the constant 700 kg m−3 in the wet maximum snow density Eq. (10) were tested but did not yield any enhancements; therefore, this value was left unchanged. Note that snow density can exceed this value through melting and refreezing processes, but the snowpack will not undergo further compaction.
The overall score presented in Eq. (20) was used as the most objective metric to tune those parameters across all sites and variables, but when similar scores occurred (difference lower than 0.1), further investigation was carried out at individual sites to choose the most physically-based option (considering consistency between the simulated snow depth, soil temperatures, and snow density), and/or we favored best performances at the Arctic sites (Bylot and Umiujaq) because of their underrepresentation. Even though the simulations and results are presented stepwise, we calibrated the effects of the three Arctic model enhancements by systematically testing each possibility back and forth to ensure consistent tuning.
TVC was excluded from the tuning process and only added in the ALL_TVC experiment by adjusting the U0 parameter in Eq. (12) – by exploring the same parameter space described above – to get the best score at all sites (including TVC), but without redoing the whole tuning process mentioned above. Despite the large uncertainties associated with TVC (snowfall rates, limited number of years, etc.), this approach allows us to provide a range of possible values for the U0 parameter. Furthermore, given the limited number of Arctic sites currently available and the uncertainties inherent to Arctic environments (such as drifting snow, frost on sensors, and snowfall rate measurements), this allows us to retain a parameter to fine-tune for future spatial simulations.
Section 3.1 first provides an overview of the main results and key takeaways across the different model experiments. Section 3.2 then examines the seasonal evolution of simulated snowpack and soil conditions at all sites and for each variable, in a qualitative manner, for the DEF experiment (Sect. 3.2.1), the physics improvements (Sect. 3.2.2), and the Arctic adaptations (Sect. 3.2.3). Section 3.3 provides quantitative analyses and comparisons of the different experiments based on the metrics introduced in Sect. 2.6. Finally, Sect. 3.4 presents a complementary diagnostic of temporal agreement between simulated and observed daily time series using the Pearson correlation coefficient. Some experiments are superimposed in certain figures owing to similar model responses; each figure therefore provides complementary insights, supported by the main text and by additional clarifying plots in the Appendix and Supplement.
3.1 Overview of the main results
Overall, the default version of CLASSIC (DEF) reasonably reproduces the seasonal evolution of snow depth and most variables at the SnowMIP sites (see Sect. 3.2.1 for the site-specific details). The main biases occur at the Arctic sites, where simulated snow depth is overestimated by about 10–20 cm – a large relative bias given the thin Arctic snowpacks – and winter soil temperatures by about 5–10 °C (Fig. 3jj, oo, tt, nn, ss, and xx). This suggests that the simulated Arctic snowpack is too insulating, mainly because the default compaction scheme produces bulk snow densities that are too low for thin, wind-exposed Arctic snowpacks, resulting in snowpacks that are too deep for a given snow mass.

Figure 3Annual cycles at all sites (rows) of the snow depth (automatic measurement), SWE (automatic measurement), snow albedo, surface temperature, and soil temperature at the first measured depth (columns) of the daily time series of the experiments described in Table 2 over the available analysis period (shown in each panel). At snb and swa only, automatic snow depth observations were extended to zero after melt-out when the observational time series stopped abruptly at zero or near-zero snow depth, while remaining gaps were linearly interpolated; this adjustment is applied only for the annual cycle visualization and not for the computation of the evaluation metrics. The blue shading corresponds to the 10 %–90 % quantile range of the interannual daily variability of the DEF experiment, and the black shading corresponds to the observational uncertainties estimated at Col de Porte (Lejeune et al., 2019) and shown at the other sites as an indicative reference. Values for the last three variables (snow albedo, surface temperature, and soil temperature) are considered only when snow depth is larger than 10 cm.
The main improvement for the Arctic sites is the revised snow compaction scheme (Sect. 2.4.2). By allowing thin, wind-exposed snowpacks to reach higher maximum dry-snow densities while having little effect on deeper snowpacks or under weak-wind conditions, this scheme produces simulated bulk snow densities more consistent with Arctic observations. At Bylot, for example, the snow depth bias decreases from about 7.5 cm to nearly zero, while simulated bulk snow density approaches the observed values of about 300 kg m−3 (further details are presented in Sect. 3.2.3). This denser and thinner snowpack reduces excessive soil insulation and improves simulated snow, bottom snow, and soil temperatures, with the mean temperature bias at Bylot decreasing from about 10 to 5 °C between the PHYS and COMPAC experiments (which is further enhanced in the CL11 experiment detailed below). Similar improvements are found at TVC, whereas the impact on most SnowMIP sites remains limited, as intended. Lastly, blowing-snow sublimation losses have a smaller impact than the revised compaction scheme but still affect some sites, as further discussed in Sect. 3.2.3.
On the other hand, the physics improvements (Sect. 2.3) provide further physical consistency in the snowpack thermal regime and allow the Arctic developments to be built on a more robust basis. The original bottom snow temperature formulation in the DEF experiment tended to overestimate the simulated snow temperature and underestimate the bottom snow temperature, thereby inducing excessive heat storage within the snowpack and biasing temperature gradients at the snow–atmosphere and snow–soil interfaces (see Sect. 3.2.2 for further details). The revised bottom snow temperature formulation addresses these deficiencies. For example, at Col de Porte, the vertically-averaged snow temperature bias decreases from 0.8 to 0.3 °C and the bottom snow temperature bias from −0.4 to −0.1 °C (e.g., Fig. 4g–j). These new developments do not necessarily improve the performance of all variables and can even degrade simulated soil temperatures when applied alone. However, they are essential for representing the snowpack thermal regime more consistently and for avoiding bias compensation.
The use of the snow thermal conductivity parameterization of Calonne et al. (2011) (Sect. 2.4.3), in combination with the Arctic developments (CL11), further improves simulated snow, bottom snow, and soil temperatures. This suggests that the previous snow thermal conductivity parameterization partly compensated for the bottom snow temperature bias. For example, at Bylot, the winter soil temperature bias increases from 6.8 °C in the DEF experiment to 9.6 °C in the PHYS experiment before decreasing to 0.9 °C in the CL11 experiment (Fig. 5m).
Finally, the addition of the windless exchange coefficient in the formulation of turbulent fluxes (Sect. 2.3.3) has a more targeted effect. It substantially improves simulated snow surface temperatures at the SnowMIP sites, reducing the average RMSE from 3.4 to 1.5 °C and the mean bias from −2.2 to −0.3 °C (Figs. 6k and 7k), while having limited effects on snow depth, SWE, and soil temperatures. More detailed results are presented below.
3.2 Seasonal evolution across sites and experiments
3.2.1 DEF experiment
Figure 3 shows the annual cycles of the snow depth, SWE, snow albedo, surface temperature, and soil temperatures for all experiments at all sites. Generally, the default model version (DEF; dark blue line) demonstrates good skills in representing the annual cycle of the snow depth (first column; mean RMSE of 25 cm and correlation of 0.90 across all SnowMIP sites) and SWE (second column; mean RMSE of 40 mm and correlation of 0.95 across all SnowMIP sites) at most of the SnowMIP sites compared to the observations (black line). However, the DEF experiment overestimates and underestimates the snow depth at the Senator Beck and Swamp Angel sites with mean biases of 31 and −38 cm, respectively (Fig. 3k and p). These discrepancies may be related to wind-driven snow redistribution and are further discussed in Sect. 4.2. At Weissfluhjoch, the simulated snowpack melts too early, with a decrease in snow depth starting in mid-March, almost 1 month earlier than in the observations (Fig. 3ee). This problem may be related to an underestimated simulated albedo (of about 0.05 from November to April; Fig. 3gg) or issues with light-absorbing particles (LAPs).
Arctic sites exhibit thinner snowpacks in general, with a maximum snow depth of about 50 cm at Bylot and TVC (Fig. 3jj and tt) to about 1 m at Umiujaq (Fig. 3oo). In the DEF experiment, simulated snow depth at the Arctic sites is overestimated by about 10–20 cm, corresponding to a large relative bias for these thin snowpacks. This bias is particularly important because even small errors in snow depth can strongly affect snow insulation and soil temperatures under the large thermal gradients typical of Arctic winter conditions, as further discussed below.
Overall, snow albedo (third column) is reasonably well simulated (mean RMSE of 0.077 and correlation of 0.64 across the five sites where observations are available), although it is overestimated by about 0.1–0.2 toward the end of the snow season at four of these five sites (Fig. 3c, m, r, and w). This bias may be related to the lack of representation of light-absorbing particles (LAPs) in the simulations and is further discussed in Sect. 4.2.
The simulated snow surface temperature (fourth column) has a mean bias of −2.2 °C across the SnowMIP sites in the DEF experiment compared to observations. This bias is mainly caused by excessive cooling under stable atmospheric conditions, which often occur at night during winter (not shown), as already discussed in Sect. 2.3.3.
In contrast, soil temperatures remain close to the 0 °C curtain at most SnowMIP sites in both the observations and simulations. At the Arctic sites (Bylot, Umiujaq, and TVC), larger discrepancies are observed between the model and the observations. In particular, simulated soil temperatures are overestimated by about 5–10 °C in the DEF experiment relative to observations, which reach −10 to −25 °C in winter (Fig. 3nn, ss, and xx). Given the strong temperature gradients between the atmosphere and the soil – particularly in autumn and spring – and the relatively thin snowpacks (<1 m) at these sites, the overestimation in simulated snow depths likely leads to an excessive insulating effect and can partly explain the discrepancies in simulated soil temperatures.
3.2.2 Physical improvements
The inclusion of the new physics (PHYS; orange line in Fig. 3) has only a limited impact on the overall model performance, with scores remaining close to those of the DEF experiment when all sites are considered (Table 3). However, it tends to degrade performance at Arctic sites, where the overall score decreases from 0.119 to −0.003, likely due to the improved bottom snow temperature formulation, which removes a previous bias compensation in the snow thermal conductivity parameterization, as discussed below. The correction of the thermal conductivity at the top of the first soil layer (TCZERO; orange line in Fig. C1) does not lead to substantial differences relative to the DEF experiment (blue line) at most sites. An exception is observed at Bylot, where a slight decrease in simulated soil temperature occurs of a few degrees at the beginning of winter (Fig. C1nn). This behavior is consistent with the strong atmosphere–soil temperature gradients during early winter and partial snow cover conditions, under which snow-free subareas cool more efficiently once the overestimated insulating effect is resolved (Sect. 2.4.3). Aside from this site-specific response, changes are limited and mainly occur during periods of partial snow cover and strong temperature gradients at other sites, but do not persist throughout the snow season (not shown). Further investigation will be carried out in future spatial studies, where larger impacts are expected.
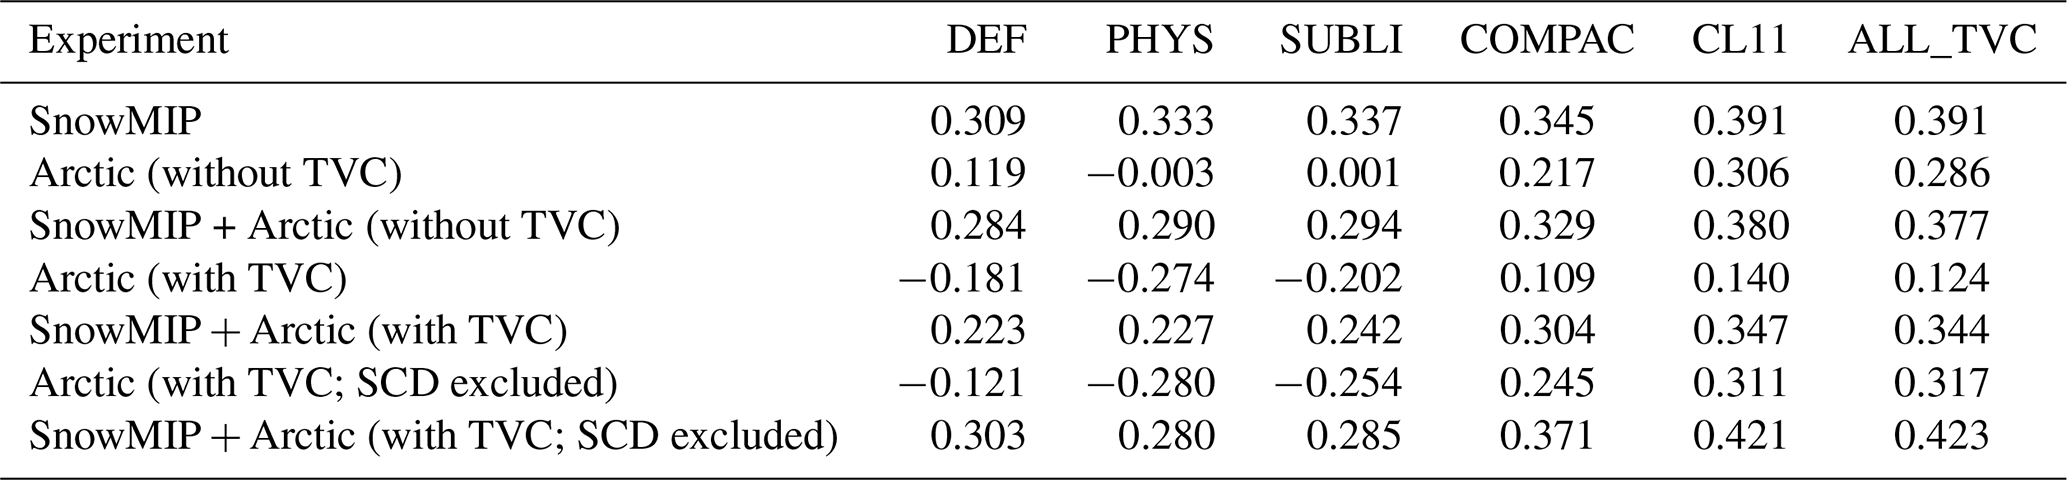
Table 3Scores (Eq. 20) computed for each experiment at the SnowMIP, Arctic, and all sites (with and without TVC) for all variables. The last two rows exclude the SCD in the score computation.
The implementation of the new bottom snow temperature computation (Eq. 3; Sect. 2.3.2) substantially reduces biases in simulated snow temperatures. At Col de Porte over the 2002–2014 period, the mean snow temperature bias decreases from 0.8 to 0.3 °C (with the RMSE decreasing from 1.4 to 1.2 °C), while the bottom snow temperature bias is reduced from −0.4 to −0.1 °C (RMSE from 0.5 to 0.3 °C). Figures 4g–j and B1g–j illustrate these improvements on specific snow seasons reflected by the PHYS experiment (orange line; affected mainly by the bottom snow temperature change) compared to the DEF experiment (blue line). At Bylot, we assessed the estimation of the theoretical bottom snow temperature – not to get affected by the initial poor performance of the DEF experiment – which is markedly improved with the RMSE decreasing from 4.2 to 0.9 °C (Fig. B2). Appendix B provides additional information on the method used to compute the bottom snow temperature.

Figure 4Example of time series of the snow depth (a), snow density (c), surface temperature (e), snow temperature (g), bottom snow temperature (i), and soil temperature at 10 cm (k) at Col de Porte during the 2005–2006 snow season. Automatic (black line) and manual (black dots) measurements are shown when available. The black shading represents the average uncertainty derived from Lejeune et al. (2019). The snow density uncertainty σρ was derived from the median value of the automatic snow depth ds, SWE measurements, and their associated uncertainties ( and σSWE) as follows: over the whole period. The right panels indicate the mean error and RMSE over the example period (2005–2006) for snow depth > 10 cm. The simulated time series correspond to the default configuration (DEF; blue), the physics improvements (PHYS; orange), and the physics and Arctic modifications (ALL; yellow). See Table 2 for the description of the experiments.
These improvements to the new estimate of temperature at the base of the snowpack alone, however, worsen the simulated soil temperatures at several sites, particularly at Arctic sites (TSNBOT; green line in the last column of Fig. C1nn and ss; mean RMSE increasing from 4.6 to 6.3 °C on average across Arctic sites). Indeed, because the simulated bottom snow temperature tended to be underestimated in the DEF experiments for most of the snow season (e.g., Figs. 4i, B1i and B2, blue line), it was leading to an overestimated soil heat loss toward the snowpack, inducing an overestimated snow temperature (e.g., Figs. 4g and B1g blue line). Changing the snow thermal conductivity from Sturm et al. (1997) to Calonne et al. (2011) allows the soil temperature to revert to similar performances to the DEF experiment (see next Sect. 3.2.3). Indeed, the parameterization proposed by Calonne et al. (2011) leads to higher snow thermal conductivity values than that of Sturm et al. (1997) (see Fig. 1 of Calonne et al., 2011), which enhances heat exchange between the soil and the atmosphere without significantly affecting snow or bottom snow temperatures (differences <0.5 °C; Figs. 4g–j and B1g–j, orange and yellow lines). Consequently, the current model performance of the simulated soil temperatures in the DEF experiment was likely induced by a bias compensation related to the bottom snow temperature computation and snow thermal conductivity.
The addition of the windless exchange coefficient in the sensible heat flux during stable atmospheric conditions (EZERO; pink line in Fig. C1) alleviates most of the surface temperature underestimation with mean bias decreasing from −2.2 to −0.3 °C on average across SnowMIP sites (Fig. C1, fourth column). The EZERO experiment does not affect simulated soil temperatures, which remain comparable to those of the TSNBOT experiment (green line; Fig. C1, last column), but it triggers a slightly earlier melt at Col de Porte, Reynolds Mountain East, and Swamp Angel (Fig. C1a, b, f, g, p, and q).
3.2.3 Arctic adaptations
Introducing the new physics (PHYS experiment) alone is not sufficient to improve the model skills at the Arctic sites. Indeed, Arctic environments are subjected to strong winds and high temperature gradients, which involve other processes such as blowing-snow sublimation and the formation of wind slabs and depth hoar. The impacts of the Arctic-specific model developments are detailed below.
Applying the blowing-snow sublimation loss parameterization of Gordon et al. (2006) (SUBLI; green line in Fig. 3) has little impact at most sites, except at Umiujaq and TVC, where the snow depth is decreased by about 2–4 cm (Figs. 3oo and tt, and D1 and D2a and b). Large snow depth biases still persist at Bylot and TVC, with overestimations of about 7 and 18 cm, respectively. A slight improvement is also observed at Senator Beck, with a reduction in snow depth of a few centimeters (Fig. 3k). The impacts on soil temperature are negligible.
The new compaction scheme (COMPAC; pink line in Fig. 3), which accounts for wind-induced increases in snow compaction, has the most important impact on the simulated snow depth, snow density, and soil temperatures at the Arctic sites, while it has a negligible effect at most SnowMIP sites. This new scheme substantially reduces the snow depth bias at Bylot, from about 7.5 cm to nearly zero (Fig. 5a and b, pink line). It also improves simulated snow density and thermal conditions, with snow density reaching values closer to observations (around 300 kg m−3; Fig. 5c and d, pink line) and reduced biases in snow, bottom snow, and soil temperatures (mean bias decreasing from about 10 to 5 °C between the PHYS and COMPAC experiments; Fig. 5i–n, orange and pink lines, respectively).

Figure 5Time series of snow depth (a), snow density (c), snow thermal conductivity (e), snow surface temperature (g), bulk snowpack temperature (i), bottom snowpack temperature (k), and soil temperatures at 5 cm (m) at Bylot from August 2014 to the end of June 2019 for all experiments. Automatic measurements are shown in black, and alternative snow depth measurements from a nearby site (SALIX-F; 9 km away) are shown as dashed lines in panel (a). The black shading corresponds to measurement uncertainties derived at Col de Porte (Lejeune et al., 2019) as an indicative reference. Panel (e) displays the measured snow thermal conductivities at various heights (dashed lines), and the black line represents the weighted harmonic average of those values. The snow density measurements are derived from snow pits in 2015, 2017, 2018, and 2019. Because of early melt in the model (see panel a), the observed snow density is compared to the simulated values 2 weeks before (blue cross). The right panels correspond to the mean error and RMSE over the period 2014–2019 for snow depth > 10 cm.
Similar improvements are observed at TVC, with decreased snow depth, increased snow density, and reduced soil temperatures, which are in better agreement with observations (Fig. D2, pink line). In contrast, a slight deterioration in simulated snow depth is found at Umiujaq (Fig. D1a and b, pink line), where it becomes underestimated by about 10 cm relative to observations, likely due to earlier simulated melt and/or the absence of snow trapping by shrubs, which can locally increase snow depth in reality (further discussed in Sect. 4). Moreover, an improvement in simulated snow depth is also observed at Senator Beck (mean bias decreasing from 23.1 to 12.8 cm between the SUBLI and COMPAC experiments), a site subject to strong wind conditions (Fig. 3k, pink line), while the remaining overestimation is likely related to wind-induced snow erosion that is not accounted for in CLASSIC.
The implementation of the new snow thermal conductivity parameterization (CL11; yellow line in Fig. 3) improves the simulated soil temperatures compared to observations at Bylot and, to a lesser extent, at Umiujaq (Fig. 3nn and ss; mean bias decreasing from 4.6 to 0.9 °C and 3.6 to 2.5 °C, respectively, between the COMPAC and CL11 experiments), whereas they become underestimated at TVC (Fig. 3xx; mean bias increasing from 1.25 to −2.19 °C). In the CL11 experiment, the simulated snow thermal conductivity at Bylot and TVC is, on average, overestimated by about 0.1 W m−1 K−1 relative to the bulk snow thermal conductivity inferred from observations (Figs. 5e and f, and D2c, yellow line). These values approach those typically associated with wind slabs, as indicated by the dark blue horizontal shading at TVC (Fig. D2c) and the dashed lines at Bylot (Fig. 5e), which will be further discussed in Sect. 4.4. The new snow thermal conductivity parameterization also improves the simulated snow and bottom snow temperatures at Bylot (Fig. 5i–l; mean bias decreasing from about 6 to 4 °C and 5 to 2 °C, respectively, between the COMPAC and CL11 experiments).
The adjusted parameters of the compaction scheme, including TVC (ALL_TVC; light blue line in Fig. 3), do not significantly affect most sites (further discussed in Sect. 3.3). The ALL_TVC experiment includes a slight reduction of the impact of wind-induced compaction in Eq. (12), by setting U0 to 3.5 m s−1 instead of 2.5 m s−1 as in the COMPAC experiment. This leads to snow depths that are a few centimeters higher at the Arctic sites, thereby slightly enhancing snow insulation. As a result, ALL_TVC improves simulated soil temperatures at TVC with a mean bias decreasing from −2.2 to −1.3 °C, but it increases the warm soil temperature biases at Bylot and Umiujaq from 0.9 to 1.8 °C and from 2.5 to 2.9 °C, respectively.
3.3 Experiment ranking
Figures 6 and 7 show the RMSE and mean bias for each variable and site and their normalized values (i.e., divided by the standard deviation of the observations) to better compare between the different sites with varying amplitudes. The following subsections provide a more quantitative assessment of the incremental model developments for each variable, complementing the more qualitative analysis of the seasonal cycles presented in Sect. 3.2. Section 3.3.5 then summarizes the overall model performance using the aggregated scores, while Sect. 3.4 presents Pearson correlation coefficients as a complementary diagnostic of temporal agreement between simulated and observed daily time series.
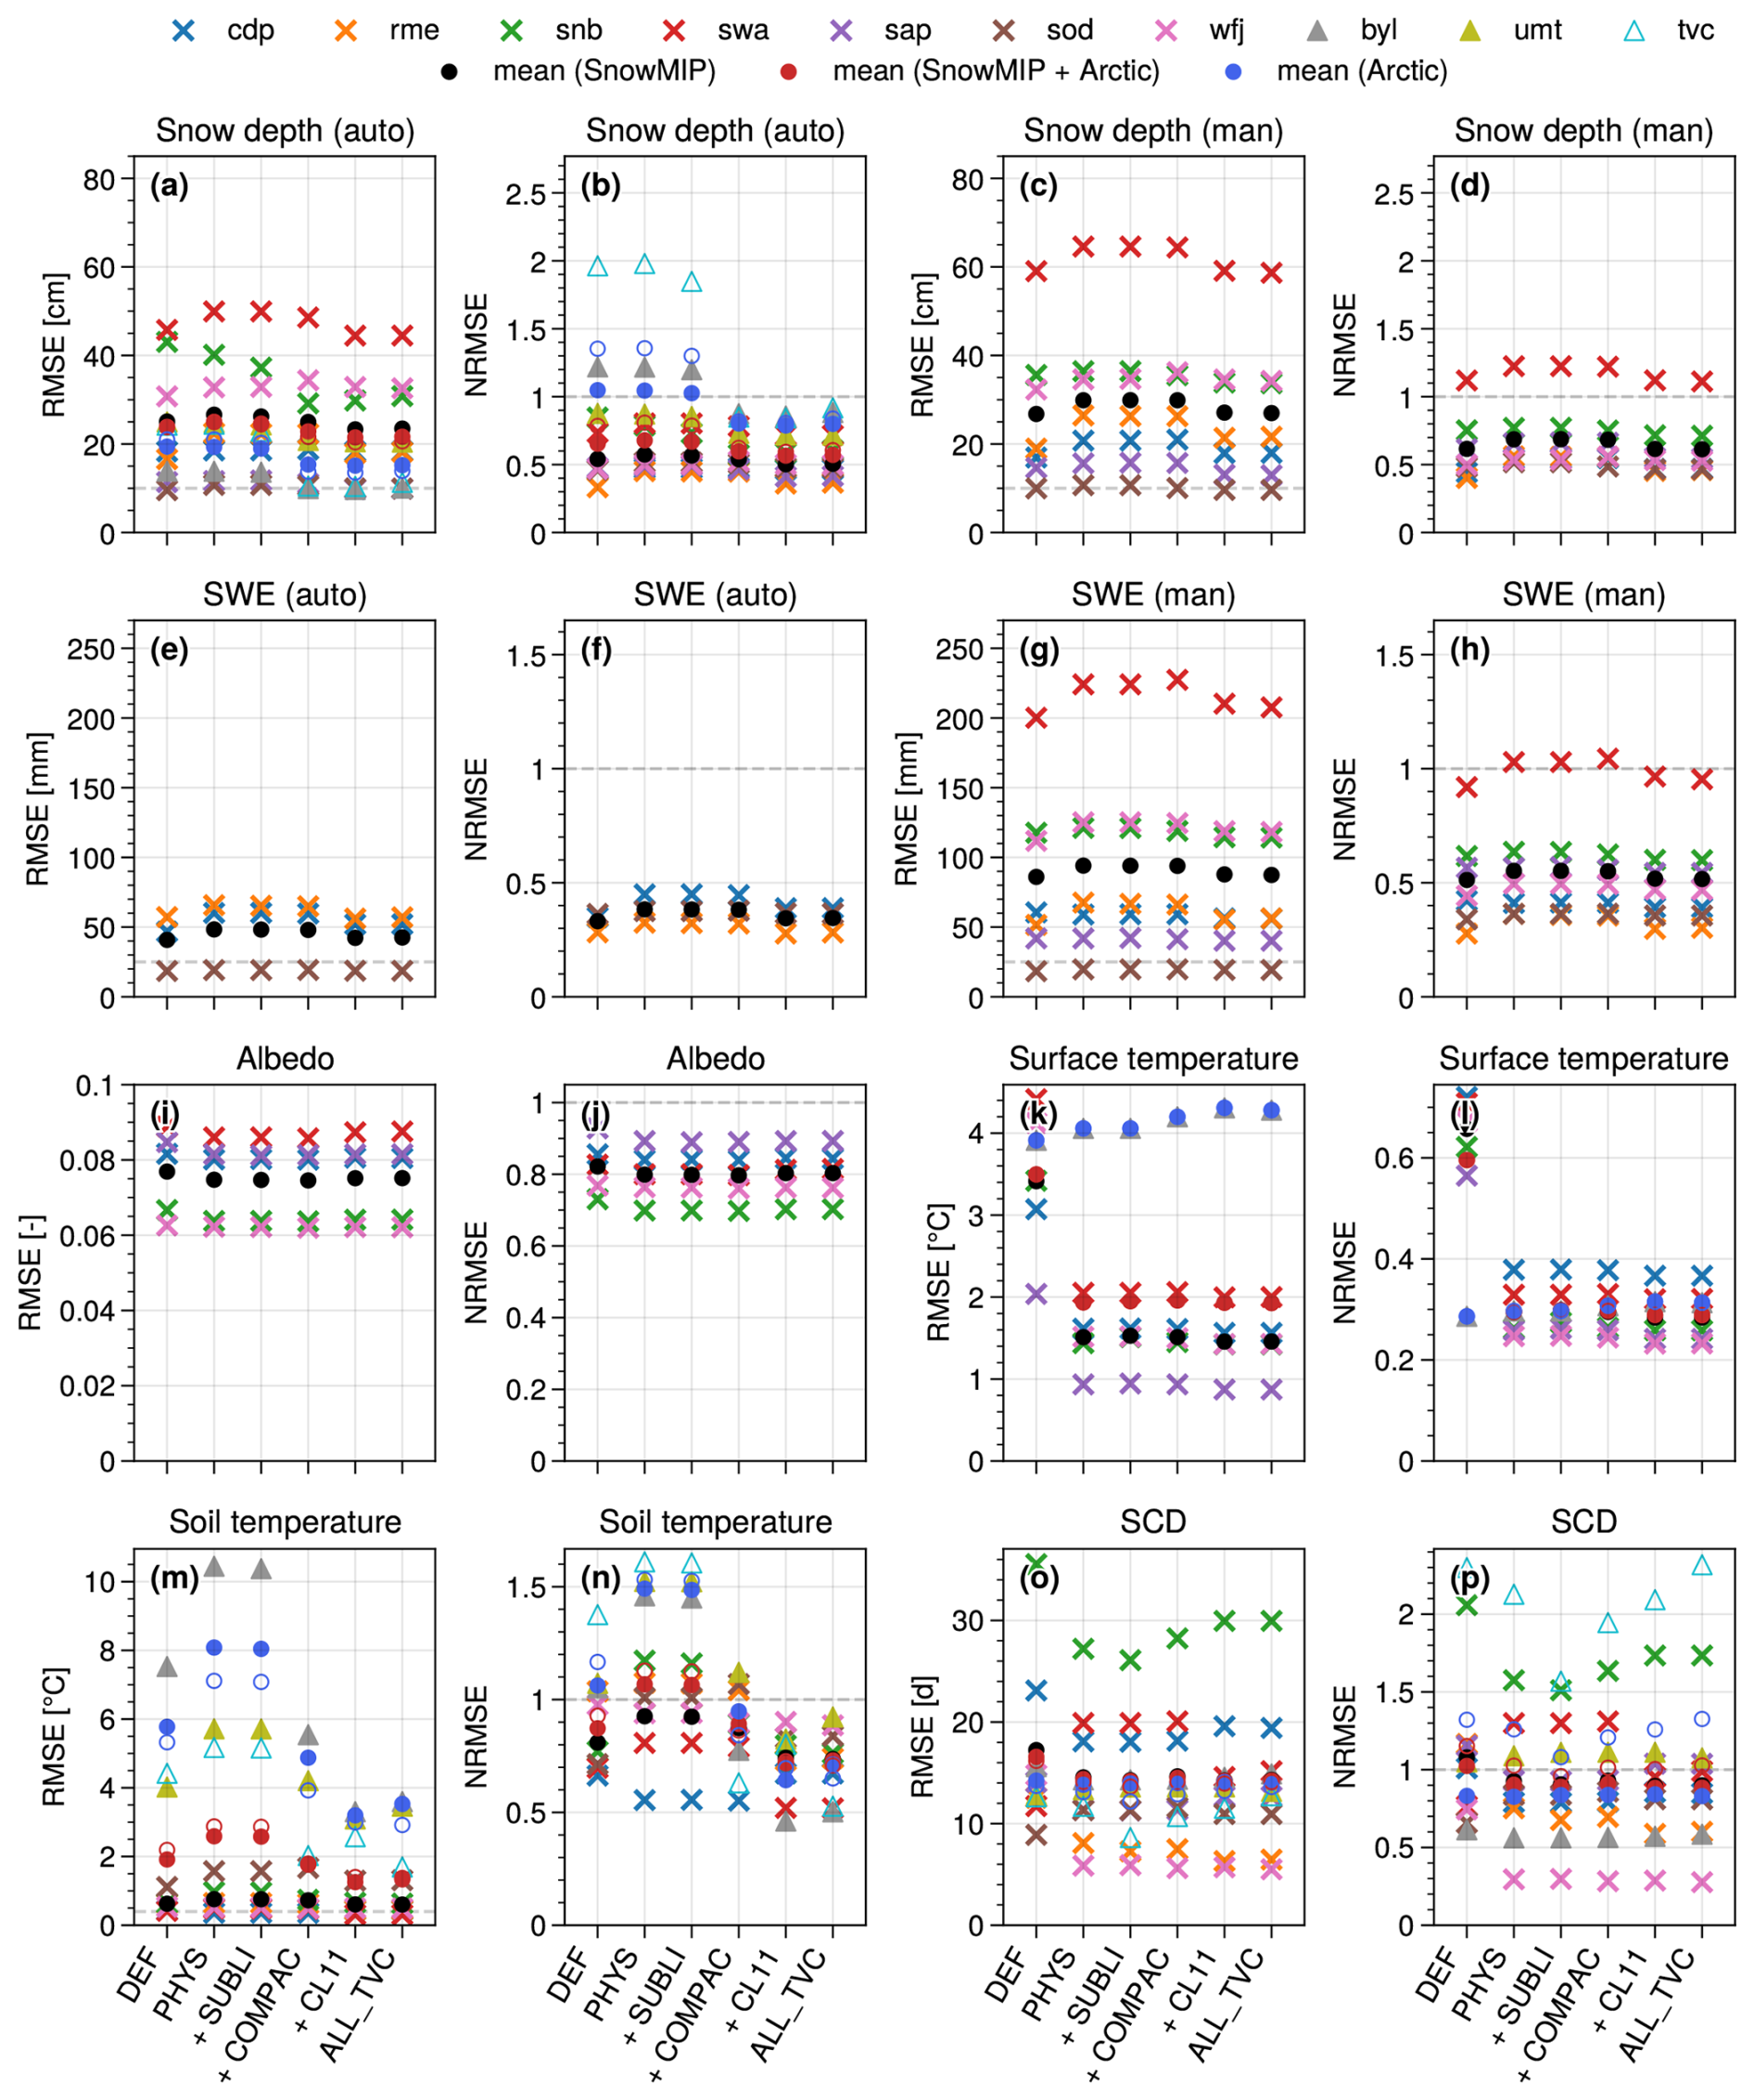
Figure 6RMSE and normalized RMSE (NRMSE; normalized by the standard deviation of the observations) computed for daily time series of snow depth (automatic and manual; a–d), SWE (automatic and manual; e–h), snow albedo (i, j), surface temperature (k, l), soil temperature at the first measured depth (m, n), and snow cover duration (SCD; snow depth > 10 cm; o, p) for the experiments listed in Table 2, over the available analysis period at each site. The SnowMIP sites are shown as crosses, and the Arctic sites as triangles. The black, red, and blue circles represent, respectively, the mean RMSE/NRMSE of all the SnowMIP sites, the SnowMIP and Arctic sites, and the Arctic sites only. The full circles exclude TVC (independent validation site), and the empty circles include TVC. The black dotted lines correspond to the observation uncertainties estimated at Col de Porte (Lejeune et al., 2019), applied to the other sites as an indicative reference for the RMSE, and to 1 standard deviation of the observations for the NRMSE. All metrics are computed only over the period of snow depths greater than 10 cm in the automatic measurements for each site.
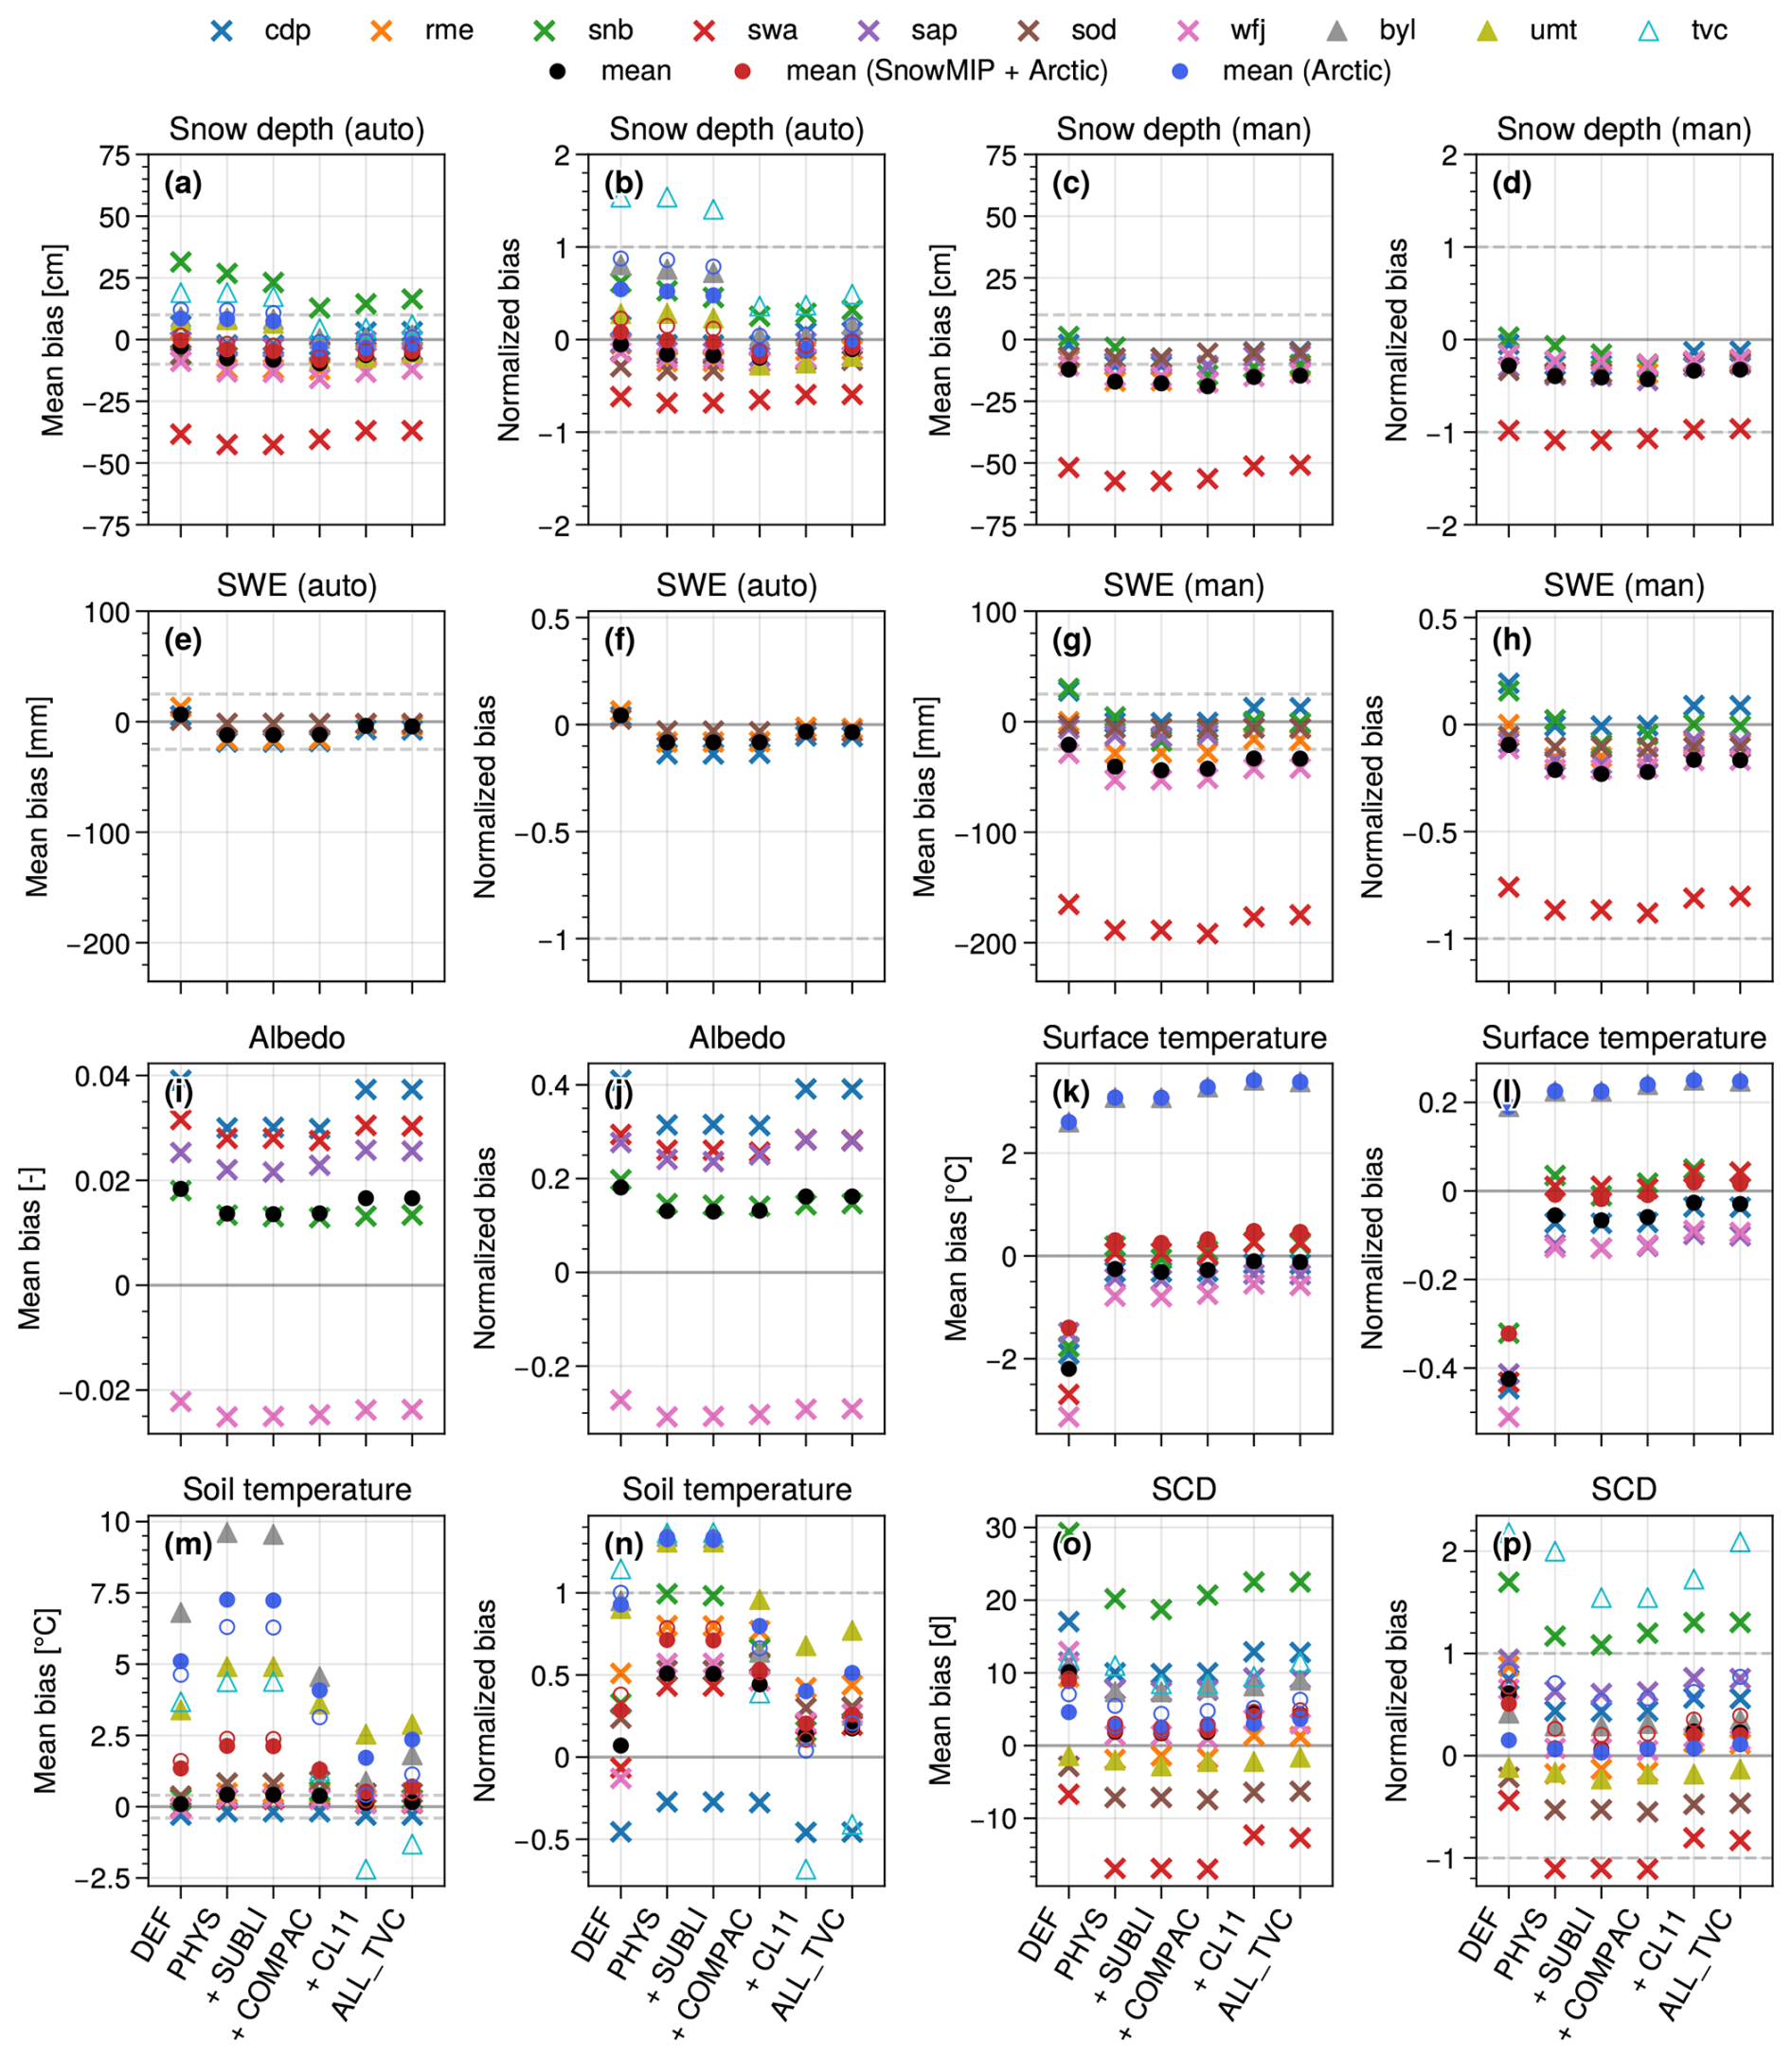
Figure 7Same as Fig. 6 but for the mean bias (MB) and normalized mean bias (NMB; divided by the standard deviation of the observations).
3.3.1 Snow depth and SWE
The largest snow depth and SWE errors are observed at Swamp Angel (red cross), with RMSE values ranging from 45 to 65 cm and from 200 to 225 mm, respectively, across all experiments and for both manual and automatic measurements (Fig. 6a–h). These errors primarily reflect a strong underestimation of snow depth and SWE (reaching close to −50 cm and −200 mm for the manual measurements, respectively; Fig. 7c and g), already apparent in Fig. 3. This systematic underestimation could be related to snow trapping in the sheltered subalpine forest environment of Swamp Angel, where part of the snow eroded from the upper Senator Beck terrain may be deposited locally without being fully captured in the precipitation forcing, as further discussed in Sect. 4.2.
In contrast, the largest relative errors for automatic snow depth are found at the Arctic sites, especially at TVC and Bylot (cyan and gray triangles; Fig. 6b). In the DEF experiment, the snow depth NRMSE reaches 1.96 at TVC and 1.22 at Bylot, thus exceeding one standard deviation of the observations, whereas all SnowMIP sites remain below this threshold (even at Swamp Angel despite the large absolute errors). The corresponding normalized mean biases are also largest at TVC and Bylot, reaching 1.54 and 0.81, respectively (Fig. 7b). This reflects the relatively thin snowpacks at these Arctic sites, for which even moderate absolute errors translate into large relative errors. At Umiujaq, where the observed snowpack is deeper, the relative error is lower, with an NRMSE of 0.88 and a normalized mean bias of 0.28 in the DEF experiment.
Overall, the new physics (PHYS; second x axis tick) degrades the simulated snow depths by about 5 % compared to the DEF experiment (first x axis tick), with an average RMSE across all sites of 25.0 cm compared to 23.8 cm in the DEF experiment, with respect to the automatic measurements (Fig. 6a; red plain circles excluding TVC). Similar results are observed for the manual snow depth and SWE measurements (with slightly larger errors).
The addition of the blowing-snow sublimation loss parameterization (SUBLI; third x axis tick) has only a limited impact on average snow depth and SWE RMSE across all sites, with small improvements generally below 1 %–2 % relative to the PHYS experiment, owing to its influence being restricted to only a few sites (as mentioned in Sect. 3.2.3). The new compaction scheme (COMPAC experiment; fourth x axis tick) and the inclusion of the new thermal conductivity (CL11 experiment; fifth x-axis tick) improve the results with mean snow depth RMSEs across all sites decreasing to 22.8 and 21.5 cm, respectively. Results are improved at both SnowMIP (black circles) and Arctic (blue plain circles) sites, with snow depth RMSE decreasing from 25.1 to 23.3 cm (NRMSE from 0.54 to 0.50) at SnowMIP sites and from 19.4 to 15.1 cm (NRMSE from 1.05 to 0.79) at Arctic sites between the DEF and CL11 experiments (Fig. 6a and b). Including TVC (empty circles) in the evaluation only slightly changes the average snow depth metrics across all sites for the CL11 and ALL_TVC experiments (fifth and last x axis ticks, respectively): the mean RMSE decreases from 21.5 to 20.4 cm and from 21.6 to 20.6 cm, respectively, while the mean NRMSE increases from 0.57 to 0.59 and from 0.57 to 0.61.
3.3.2 Snow albedo and surface temperature
Impacts on snow albedo are limited, with an average RMSE ranging between 0.07 and 0.08 across all SnowMIP sites for all the experiments (Fig. 6i). Snow albedo measurements at Arctic sites are prone to errors (due to gap-filling, frost, etc.) and are therefore not shown. The implementation of the new physics (PHYS) improves the simulated surface temperature at all SnowMIP sites by decreasing the RMSE from 3.41 to 1.51 °C and the mean bias from −2.20 to −0.25 °C (Figs. 6 and 7k and l), mainly due to the implementation of the windless exchange coefficient in the sensible heat flux (EZERO; Figs. C2 and C3k and l). The simulated surface temperature worsens slightly at Bylot; however, given the larger temperature amplitude at Arctic sites, the NRMSE increases only from 0.29 to 0.30. Overall, considering the Arctic and SnowMIP sites, the average NRMSE decreases from 0.60 to 0.30 (although the Arctic sites are underrepresented).
3.3.3 Soil temperatures
Soil temperature RMSEs and mean biases show large dispersion, especially at the Arctic sites, due to large warm biases in the model for the DEF, PHYS, and SUBLI experiments (Figs. 6 and 7m and n; first to third x axis ticks). The DEF experiment has a mean RMSE (MB) of 5.78 °C (5.10 °C) and NRMSE (NMB) of 1.06 (0.93) at the Arctic sites and 0.63 °C (0.09 °C) and 0.81 (0.07) at the SnowMIP sites. The normalized RMSEs and mean biases show smaller differences between the Arctic and SnowMIP sites because of the larger (smaller) soil temperature amplitudes at the Arctic (SnowMIP) sites. Implementing the new bottom snow temperature formulation degrades overall model performance, as discussed in Sect. 3.2 and illustrated in Figs. C2 and C3m and n (TSNBOT; third x axis tick). This is reflected in the PHYS experiment (Fig. 6m and n; second x axis tick) with an increase of the RMSE (NRMSE) to 8.08 °C (1.49) and 0.76 °C (0.93) on average at the Arctic and SnowMIP sites, respectively.
The addition of the new compaction scheme (COMPAC) and the snow thermal conductivity parameterization (CL11) improves simulated soil temperatures (Fig. 6m and n; fourth and fifth x axis ticks). At Arctic sites, the RMSE (NRMSE) decreases to 4.88 °C (0.95) with COMPAC and to 3.20 °C (0.64) with CL11. At SnowMIP sites, the corresponding RMSE (NRMSE) values are 0.73 °C (0.87) and 0.61 °C (0.74), respectively. Including TVC slightly improves the performance of the simulated soil temperature in the CL11 experiment to an RMSE (NRMSE) of 2.99 °C (0.70) at the Arctic sites (Fig. 6m and n; blue empty circles), despite a negative soil temperature bias of −2.19 °C at TVC (Fig. 7m; light blue empty triangle). The adjusted compaction scheme, including TVC (ALL_TVC; blue empty circles, last x axis tick in Fig. 6m and n), further reduces the RMSE (NRMSE) on average at all Arctic sites to 2.92 °C (0.65). However, a persistent cold bias of −1.31 °C remains at TVC, while warm biases increase at Bylot and Umiujaq, from 0.89 to 1.81 °C and from 2.54 to 2.89 °C, respectively (Fig. 7m; triangles).
3.3.4 Snow cover days
The average SCD RMSE (NRMSE) improves on average at both SnowMIP (black circles) and Arctic sites (including TVC; empty blue circles) from 16.2 d (1.2) for the DEF experiment to 14.1 d (1.0) for the ALL_TVC experiment (Fig. 6o and p; first and last x axis ticks, respectively). However, the improvement is not systematic at all sites; for example, SCD RMSE increases from 11.7 to 15.2 d at Swamp Angel and from 8.9 to 10.9 d at Sodankylä between the DEF and ALL_TVC experiments. SCD biases span about ±20 d depending on the site, and about ±10 d when excluding Senator Beck and Swamp Angel (Fig. 7o).
3.3.5 Scores
The overall scores (Eq. 20) at all sites excluding TVC incrementally improve from 0.284 (DEF) to 0.380 (CL11; Table 3). The model performs better at the SnowMIP than at the Arctic sites, although the new snow model developments (CL11) yield larger improvements at the Arctic sites (where the model performed poorly compared to the SnowMIP sites). Indeed, scores increase between the DEF and CL11 experiments from 0.309 to 0.391 at the SnowMIP sites and from 0.119 to 0.306 at the Arctic sites (excluding TVC). Including TVC degrades model performance across all sites, with scores decreasing to 0.140 for the Arctic-only sites and to 0.347 when considering all sites in the CL11 experiment. Including the adapted compaction scheme with TVC (ALL_TVC) does not improve the overall score. Indeed, no overall calibration with TVC was performed, but only an adjustment of the compaction parameters (in Eq. 12), with the main aim of improving soil temperatures while limiting the degradation of simulated snow depth (Sect. 2.6).
For the Arctic sites, the scores were computed using only the following available variables: automatic snow depth, soil temperature, and SCD (in addition to surface temperature at Bylot). Therefore, the scores are more sensitive to variations in individual variables. The SCD metric at TVC spans only two snow seasons and exhibits a large NRMSE (>2.0 for the CL11 and ALL_TVC experiments), whereas the NRMSEs for the other variables are generally below 1.5 (Fig. 6b, n, and p; last two x axis ticks; triangles). As a result, SCD contributes substantially to the overall score at TVC. Nevertheless, the seasonal evolution of snow depth at TVC is reasonably well captured by the final model configurations, with automatic snow depth RMSEs of 10.4 and 11.3 cm and Pearson correlations of 0.78 for the CL11 and ALL_TVC experiments, respectively (Fig. D2a). The low score contribution at TVC is therefore mainly related to SCD, for which the observed standard deviation is only 5.5 d over the two available snow seasons, while the SCD RMSE reaches 11.5 and 12.7 d in the CL11 and ALL_TVC experiments, corresponding to high NRMSE values of 2.09 and 2.32, respectively. This high SCD error is partly caused by an early simulated snow onset in 2017 relative to observations, which may be related to forcing or measurement uncertainties (Fig. D2a).
Consequently, the strong weight given to SCD in the score computation at TVC may overemphasize this metric and does not necessarily reflect a generally poor model performance at this site. Excluding SCD from the score computation yields comparable scores for the CL11 and ALL_TVC experiments, with values of 0.311 and 0.317, respectively, at the Arctic sites, and 0.421 and 0.423 when considering all sites. These small differences should not be overinterpreted as a statistically significant ranking. Rather, they indicate that the two final configurations provide comparable overall performance, with slightly different trade-offs among variables and sites. In particular, the TVC-adjusted compaction parameters (ALL_TVC) improve soil temperatures at TVC but slightly increase warm soil temperature biases at Bylot and Umiujaq, as discussed above. The scores should therefore be interpreted as a diagnostic guide, while the robustness of the model developments is assessed primarily from the physical consistency of the changes across snow depth, snow density, snow thermal properties, and soil temperature, as further discussed in Sect. 4.1.
3.4 Temporal correlation
Pearson correlation coefficients were computed as an additional diagnostic of the temporal agreement between simulated and observed daily time series and are reported in Table S8. Daily simulated and observed variations are not necessarily expected to be strongly correlated, especially at Arctic sites where wind-driven snow redistribution can produce local snow depth changes not directly related to the precipitation forcing. Correlations are therefore used only as complementary information and did not inform the model development or the ranking of the experiments.
Overall, the correlations support the main conclusions drawn from the RMSE, bias, and score analyses. For automatic snow depth, correlations are generally high at the SnowMIP sites, with values mostly between 0.84 and 0.94 depending on the site and experiment. Lower correlations are found at the Arctic sites, ranging from about 0.49 to 0.78, particularly at Bylot. This is consistent with the stronger influence of local wind-driven snow redistribution in Arctic environments, which can cause point-scale snow depth variations that are not directly related to precipitation events and are not explicitly represented in the 1D simulations. At the SnowMIP sites, the new model developments do not substantially modify the snow depth correlation patterns compared to the DEF experiment, whereas slight improvements are found at some Arctic sites, especially Umiujaq and TVC, where correlations increase from about 0.73 in DEF to 0.77 and 0.78, respectively, after the implementation of the new compaction (COMPAC) and thermal conductivity schemes (CL11) at both sites.
The SWE correlations are also generally high, with values mostly above 0.8 for manual measurements and above 0.9 where automatic SWE measurements are available. Albedo correlations are more moderate, around 0.7 at most sites, with lower values at Sapporo, likely reflecting processes not represented in the model, such as light-absorbing particle deposition, as already discussed. Surface temperature correlations are high at most sites, generally exceeding 0.9, while soil temperature correlations vary more strongly among sites, from about 0.5 to 0.97. Lower soil temperature correlations are found at some sites where soil temperatures remain close to the zero-curtain or where small differences in the timing of snow accumulation, melt, or soil freezing can strongly affect temporal agreement (e.g., at Senator Beck, Sodankylä, and Weissfluhjoch). At TVC, the soil temperature correlation substantially improves from 0.76 in the DEF experiment to 0.97 in the CL11 and ALL_TVC experiments, consistent with the improved representation of snow insulation and soil thermal conditions.
In this study, we introduce six new snow model developments in the CLASSIC LSM – three physics improvements and three Arctic-specific adaptations. These developments are evaluated using 1D site simulations at seven SnowMIP and three Arctic sites. The discussion is organized as follows. Section 4.1 first discusses the physical consistency of the model improvements across the different evaluation variables. Section 4.2 then interprets the site-specific biases and discusses their likely links to unresolved or simplified snow processes. Section 4.3 discusses limitations related to unresolved spatial heterogeneities in snow accumulation and melt processes. Sect. 4.4 focuses on limitations associated with energy transfer and vertical (1D) processes within the snowpack. Section 4.5 focuses on uncertainties related to meteorological forcing and observations. Finally, Sect. 4.6 addresses limitations arising from interactions between snow, soil, vegetation, and carbon fluxes.
4.1 Physical consistency of model improvements across variables
The evaluation metrics and aggregated scores were used as diagnostic tools to compare experiments across sites and variables, but they were not intended as formal statistical rankings. No significance tests were applied to differences in metrics or scores, given the diversity of variables, site conditions, observational uncertainties (not always characterized or available), and temporal autocorrelation in the errors. The model developments were instead primarily guided by identified physical limitations and by the consistency of the simulated responses across snow depth, SWE, snow density, snow thermal properties, and soil temperature.
For instance, we first identified that simulated bulk snow densities were consistently too low compared to available snow pit observations at Arctic sites, with underestimations exceeding 50 kg m−3 in some cases (Sect. 2.4.2; Fig. 5c and d). This bias was physically consistent with the overestimation of snow depth by about 10–20 cm and winter soil temperatures by about 5–10 °C in the DEF experiment at Arctic sites (Sect. 3.1; Fig. 3jj, nn, oo, ss, tt, and xx). Together, these biases suggest that the default snowpack was too insulating, mainly because the original CLASSIC maximum dry-snow density was too low for thin, wind-exposed Arctic snowpacks and because enhanced wind-induced compaction was not explicitly represented. Although low-density depth hoar can partly counterbalance the formation of dense wind slabs in terms of bulk density, the available observations still indicate that CLASSIC underestimated bulk snow density. The revised compaction scheme therefore consistently increases snow density, reduces snow depth, and decreases soil temperatures through a reduced insulating effect and an increased density-dependent snow thermal conductivity. For example, at the Arctic sites, including TVC, the mean snow depth bias decreases from 12.0 to −1.0 cm between the DEF and COMPAC experiments, while the associated warm soil temperature bias decreases from 4.6 to 3.1 °C (Fig. 7a and m; blue empty circles). Nevertheless, persistent soil temperature overestimation remained even when simulated snow depth and snow density became more consistent with observations, suggesting that snow thermal conductivity was still underestimated. Using the Calonne et al. (2011) parameterization instead of the default Sturm et al. (1997) formulation improves this aspect and provides a more physically based estimate of snow thermal conductivity, as further discussed below.
These improvements related to the compaction scheme did not substantially impact the SWE, which is driven by other processes such as precipitation forcing, sublimation losses, and snow redistribution. Indeed, snow depth and density errors can persist even when SWE biases are reduced, highlighting the importance of evaluating snow compaction processes and complementary snowpack variables in addition to SWE alone (e.g., Abolafia-Rosenzweig et al., 2024). The blowing-snow sublimation parameterization has only a limited effect at most sites, reducing snow depth by about 2–4 cm, mainly at Umiujaq, TVC, and Senator Beck (Sect. 3.2.3), and therefore cannot, by itself, explain the initial soil temperature bias. Only the combination of the blowing snow sublimation losses parameterization with the new compaction scheme and snow thermal conductivity can provide consistent improvements in the model for snow depth, SWE, snow densities, and soil temperatures.
The improvements related to snow compaction must also be interpreted together with the full snow–soil thermal regime, including the revised bottom snow temperature formulation (Sect. 2.3.2) and the snow thermal conductivity parameterization (Sect. 2.4.3). These developments also illustrate why scores alone are not sufficient for interpreting model performance and how compensating errors can mask process-level deficiencies (e.g., Chen et al., 2014). Indeed, the revised bottom snow temperature formulation was motivated by a physical inconsistency identified from snow temperature observations at Col de Porte and theoretical estimates at Bylot (Figs. 4g–j and B2). It reduces the vertically averaged snow temperature bias at Col de Porte from 0.8 to 0.3 °C and the bottom snow temperature bias from −0.4 to −0.1 °C, and decreases the theoretical bottom snow temperature RMSE at Bylot from 4.2 to 0.9 °C. However, when applied without the updated snow thermal conductivity parameterization, it amplifies soil temperature biases at the Arctic sites (Sect. 3.2.2; Fig. C2m). For instance, at Bylot, the snow temperature bias decreases from 10.6 to 9.0 °C, while the 5 cm soil temperature bias increases from 6.8 to 9.6 °C between the DEF and PHYS experiments (Fig. 5).
Indeed, in the original formulation, the bottom snow temperature (Eq. 2) was too strongly influenced by the bulk snow temperature, which tended to underestimate the temperature at the snow–soil interface. This produced an overly strong temperature gradient between the soil and the base of the snowpack, thereby resulting in an excessive conductive heat flux from the soil into the snowpack. As a result, part of the soil heat was artificially transferred into the snow layer, contributing to warm snow temperature biases while partly compensating for the warm soil temperature bias. This behavior highlights a second deficiency of the original configuration: the thermal conductivity of the snowpack was too low, limiting the transfer of heat through the snowpack toward the atmosphere. This interpretation is physically consistent with the fact that the Sturm et al. (1997) parameterization is based on needle-probe measurements, which have since been shown to tend to underestimate snow thermal conductivity when used with standard, uncorrected protocols (e.g., Calonne et al., 2011; Fourteau et al., 2022).
By increasing snow thermal conductivity, the Calonne et al. (2011) parameterization enhances heat transfer through the snowpack and allows excess soil heat to be more efficiently dissipated to the atmosphere. At Bylot, along with the other model developments, especially the revised compaction scheme, the Calonne et al. (2011) parameterization led to a consistent improvement in the snow–soil thermal regime. The snow temperature bias decreases from 10.6 °C in the DEF experiment to 3.6 °C in the CL11 experiment. Similarly, the bottom snow temperature bias decreases from 6.7 to 1.5 °C, and the soil temperature bias decreases from 6.8 to 0.9 °C (Fig. 5). Similar improvements are observed at TVC and Umiujaq, where the final configurations also reduce soil temperature biases relative to the DEF experiment (Figs. D2 and D1). These simultaneous improvements in snow temperature, bottom snow temperature, and soil temperature support the interpretation that the final configuration reduces previous bias compensations and provides a more physically consistent representation of heat transfer through the Arctic snowpack.
By contrast, changes in snow albedo and surface temperature are less directly coupled in this study. No albedo-specific development was introduced, and the effects of light-absorbing particles on snow albedo are not represented; consequently, albedo RMSE remains nearly unchanged across experiments, with average values around 0.07–0.08 at the SnowMIP sites (Sect. 3.3.2; Fig. 6i and j). The improvement in surface temperature is mainly caused by the windless exchange coefficient, which reduces excessive surface cooling under stable atmospheric conditions, especially at night, and decreases, at SnowMIP sites, the mean surface temperature RMSE from 3.41 to 1.51 °C and the mean bias from −2.20 to −0.25 °C (Figs. 6k and 7k). Because this correction acts primarily on turbulent heat exchange under stable conditions, it is not expected to produce systematic albedo improvements. However, by modifying the snow surface energy balance, it can contribute to slightly earlier melt at some sites, such as Col de Porte, Reynolds Mountain East, and Swamp Angel (Sect. 3.2.2; Fig. C1). This indicates that the windless exchange coefficient is useful for reducing a clear surface temperature bias, but may remain a simplified solution that requires further investigation in future work.
In summary, the different developments are physically linked and need to be interpreted as a combined adjustment of the snow–soil system rather than as independent improvements of individual metrics. The revised compaction scheme first reduces biases in snow depth and snow density, limiting the risk of compensating thermal errors with an unrealistic snowpack structure. The revised bottom snow temperature formulation then corrects the thermal state at the snow–soil interface and improves snow and bottom snow temperatures, but also reveals the need for a more conductive snowpack to avoid excessive heat retention in the soil. Finally, the Calonne et al. (2011) thermal conductivity parameterization increases heat transfer through the snowpack and improves the consistency between snow, bottom snow, and soil temperatures. This sequence explains why some intermediate experiments may degrade specific metrics, while the final combination of developments improves model performance in a physically consistent way, especially at Arctic sites, without degrading the overall performance at the SnowMIP sites. The model developments were therefore primarily driven by identified physical limitations rather than by maximizing the aggregated score. The scores and normalized metrics provided a practical way to compare experiments across variables and sites and to constrain plausible parameter ranges, especially for the wind-dependent compaction parameters, but the final interpretation relies on whether the changes are consistent with the expected physical relationships among snow mass, density, insulation, heat transfer, and soil temperature. This is why the CL11 and ALL_TVC configurations should be viewed as physically plausible final configurations with slightly different trade-offs among variables and Arctic sites, rather than as a strictly ranked pair of solutions. The remaining uncertainties in forcing data, observations, and unresolved processes are discussed in the following sections.
4.2 Site-specific limitations related to unresolved processes
The discrepancies in simulated snow depth with respect to observations at Senator Beck and Swamp Angel (Fig. 3k and p) could be due to the lack of representation of wind-driven snow redistribution in the model. Indeed, Senator Beck is located at 3714 m a.s.l. in an alpine tundra with thin soils and exposed bedrock, subject to strong winds that favor snow erosion, whereas Swamp Angel is located in a sheltered meadow surrounded by subalpine forest at 3371 m a.s.l., lower down in the same watershed. Therefore, Swamp Angel could trap part of the wind-redistributed snow during wind events (not reflected in the snowfall measurements), leading to higher observed snow depths than simulated, while wind-driven snow erosion at Senator Beck – not accounted for in the model – could lead to an overestimation of simulated snow depth at this site. Alternatively, the current snow compaction scheme could not be adapted to the conditions at these sites. Further investigation would be needed to unravel this uncertainty, especially since most models underestimate the simulated SWE at Swamp Angel (Menard et al., 2021, their Fig. 2).
The early melt at Weissfluhjoch (Fig. 3ee) could be due to the lack of representation of the effects of LAPs on snow albedo in our simulations. Indeed, the model uses a single time constant for the albedo decay for dry snow and cannot capture differences in albedo decay due to differences in LAP deposition. For example, snow albedo tends to be overestimated during the ablation period at Col de Porte, Senator Beck, Swamp Angel, and Sapporo (Fig. 3c, m, r, and w), which are all known to be affected by LAPs (Niwano et al., 2012; Painter et al., 2012; Skiles et al., 2012; Réveillet et al., 2022). Niwano et al. (2012) show that the snow albedo can be reduced by up to 0.18 during the ablation period at Sapporo due to the deposition of LAPs on the snow surface, which corresponds to the discrepancies between the simulated and observed snow albedo in our simulations (Fig. 3w). At Weissfluhjoch, the simulated albedo is closer to observations during the ablation period, suggesting that this site is likely less subject to LAPs. However, because the CLASSIC snow scheme was calibrated to fit sites, including Col de Porte (Brown et al., 2006, unpublished manuscript, 2001), it indirectly takes into account the LAPs, which could partly explain the good performance at the Col de Porte and early melt at Weissfluhjoch. Alternatively, this early melt at Weissfluhjoch could result from an underestimated simulated albedo during the accumulation period (Fig. 3gg), leading to excessive absorption of solar radiation and, in turn, a warmer snowpack, which could trigger an earlier onset of melt. Further investigation will be needed by including LAPs and/or adapting the albedo scheme to distinguish the contribution of these respective phenomena to those discrepancies, especially since early melt is also observed at other sites (discussed in other sections below). Future developments could therefore target a more explicit representation of snow albedo evolution, including snow aging, grain-size effects, and light-absorbing particles, following both the theoretical basis of snow radiative transfer (e.g., Warren and Wiscombe, 1980) and recent land-surface-model applications (e.g., Ménégoz et al., 2014; Abolafia-Rosenzweig et al., 2022; Lin et al., 2025).
4.3 Spatial heterogeneities
A key limitation of this study is the use of point-scale simulations at Arctic sites, where snow processes are strongly influenced by spatial heterogeneity (e.g., Mohammadzadeh Khani et al., 2023). Arctic environments are subjected to harsh conditions, including strong winds that induce significant snow drifting and sublimation losses, which are difficult to quantify. As a result, simulated snow depth is not necessarily correlated with observed precipitation (e.g., strong snowstorms can erode an entire snowfall event). For instance, on 12 April 2018, Lackner et al. (2022) conducted 172 distributed snow depth measurements within a 100 m radius of the Umiujaq TUNDRA site. Observed snow depths ranged from 50 to 210 cm, with a mean value of 109 cm, which is within 8 cm of the value measured by the automatic station on the same day (117 cm). This suggests that we can reasonably assume the station is representative of the surrounding snow depth, although it demonstrates the intrinsic spatial heterogeneity of snow characteristics in these environments. Large-scale LSMs such as CLASSIC are designed to represent processes at grid-cell scales of tens to hundreds of kilometers. Consequently, our simulations are not intended to reproduce the exact snowpack evolution at a specific site affected by wind-driven redistribution, but rather to capture its key characteristics over multiple snow seasons.
Enabling or deactivating SCF parameterizations is also a thorny question for point-scale simulations. Krinner et al. (2018) and Menard et al. (2021) advise deactivating the SCF parameterizations in the ESM-SnowMIP exercise, as they assume that snow cover is either present or absent in site simulations. Indeed, SCF parameterizations are generally designed to represent large-scale spatial heterogeneities (e.g., Niu and Yang, 2007; Swenson and Lawrence, 2012; Lalande et al., 2023). However, time-lapse camera observations at Arctic sites (e.g., Bylot and Umiujaq) reveal small-scale spatial variability at meter or sub-meter scales, driven by microtopography, vegetation, and surface roughness, particularly during the ablation period or at the onset of the snow season. In addition, the presence of instruments themselves can locally enhance melt around the measurement station (e.g., Morin et al., 2012, their Fig. 3). Such small-scale snow cover heterogeneities can affect the surface energy budget, soil temperatures, and measurements of upward long- and shortwave radiation, whose instruments have larger spatial footprints than automatic snow depth sensors, thereby influencing the measured albedo, for example. A 10 cm snow depth threshold is usually applied – excluding periods with shallow snow cover – to limit those uncertainties in point-scale snow studies; however, it is not obvious whether considering a complete snow cover for point-scale simulations is always relevant. Further investigation should be conducted at specific sites, including with cameras, to clarify this issue. Estimating the average snow depth and SCF around a station could help develop site-dependent SCF parameterizations, which could alternatively be inferred indirectly from albedo measurements using known snow and snow-free albedo values at those sites (e.g., Essery et al., 2013, their Eq. 54).
In CLASSIC, the model imposes a minimum snow depth of 10 cm – when snow is present – over the snow-covered subfraction of the grid cell to ensure numerical stability of the time-stepping scheme. Consequently, the snow cover parameterization cannot be deactivated without compromising numerical stability at snow depths below 10 cm. We tested minimum snow depth thresholds ranging from 5 to 20 cm at a subset of sites where such experiments could be performed without compromising numerical stability. These tests showed limited impacts on simulated soil temperatures, except during occasional periods characterized by strong temperature gradients between the soil and the atmosphere, combined with thin snowpacks. Overall, these effects were transient and smaller than those associated with the new snow model developments (not shown); however, they may still affect model tuning parameters. Furthermore, the choice of SCF parameterization (e.g., Swenson and Lawrence, 2012; Lalande et al., 2023; Wang et al., 2025) is expected to exert a stronger influence in spatial simulations and will be investigated in future studies using the new snow model developments.
4.4 Energy transfer and vertical snowpack processes
The vertical energy and water fluxes are modeled separately in CLASSIC for the four subareas in each grid cell: vegetated and bare soil surfaces, each with and without snow cover. However, at each model time step, all variables of each subarea are averaged together. Therefore, the separate energy budgets of each subarea do not persist over time. This assumption is particularly critical for snow because the presence or absence of snow cover strongly modifies the surface energy balance (e.g., albedo, insulation, and latent heat exchanges). Averaging the subareas may artificially smooth sharp contrasts between snow-covered and snow-free fractions, which can in turn affect simulated snow accumulation and melt rates. Further investigation could assess whether this assumption is realistic and at which spatial scales it applies.
Furthermore, the current hypothesis of quadratic temperature profiles within the snowpack could reach some limitations. On the one hand, it allows for an indirect representation of multilayer heat transfer within the snowpack, which may be more realistic than a simple linear profile in a single-layer snow model. On the other hand, it is known that snowpack temperature profiles may be more complex (e.g., Fierz, 2011, their Fig. 1). For instance, cold temperatures accumulated during the night can persist in the mid-upper layers of the snowpack, while the surface warms during the day and the bottom remains relatively warm due to ground heat flux, resulting in a temperature profile that deviates from a simple quadratic curve. Therefore, when the surface and soil temperatures simulated by CLASSIC both approach 0 °C, the modeled average snowpack temperature will also approach 0 °C, whereas in reality the bulk snowpack could still be colder. Despite its good overall performance, this may be a limitation of the single-layer CLASSIC snowpack and could be one of the causes of the early melt observed at a few sites, especially at the Arctic ones (e.g., Figs. 5, D1, and D2a).
Some limitations in the representation of bulk snow properties may also arise from the use of a single-layer snow model. As shown in Sect. 3.2.3, the simulated bulk snow thermal conductivity in the CL11 experiment is overestimated at Bylot and TVC by about 0.1 W m−1 K−1 relative to observations (Figs. 5e and f and D2c). Generally, estimating an effective snow thermal conductivity from the mean snow density can be misleading in a single-layer framework. Indeed, the relationship between density and thermal conductivity is nonlinear (e.g., Calonne et al., 2011), and thermal resistances (i.e., layer thickness divided by thermal conductivity) – not conductivities – combine in series in vertically stratified snowpacks. As a result, applying a density-dependent snow thermal conductivity parameterization to the mean snow density cannot reproduce the equivalent conductivity of a multilayer snowpack. An idealized two-layer sensitivity analysis presented in Sect. S12 indicates that the bulk approximation underestimates the integrated thermal resistance by approximately 7, 26, and 48 % for moderate, strong, and very strong stratification (represented by depth-hoar/wind-slab density pairs of 250/350, 200/400, and 150/450 kg m−3, respectively). This limitation could partly explain why the model reproduces observed snow density reasonably well while still deviating from observed snow thermal conductivity. Heated-needle-probe measurements are also known to underestimate snow thermal conductivity because of contact-resistance effects and assumptions inherent to the heating method (Fourteau et al., 2022), potentially contributing to the model–observation differences. In addition, the limited number of point measurements may not adequately capture the vertical snow stratigraphy needed to estimate an effective bulk conductivity.
The improved performance of the CL11 experiment should therefore be interpreted within the context of the CLASSIC single-layer framework rather than as evidence that the Calonne et al. (2011) parameterization is universally more appropriate for Arctic snowpacks. Under the assumptions of the sensitivity analysis (Sect. S12), explicitly representing the stratified layers using the same density–conductivity relationship would reduce the effective snowpack conductance relative to that obtained in the successful bulk CL11 experiment. Reproducing this bulk conductance would therefore likely require layer-scale conductivities at least as high as, and potentially higher than, those predicted by the Calonne et al. (2011) parameterization. This result is directionally more consistent with the higher conductivities predicted by Calonne et al. (2011) than with the lower values predicted by Sturm et al. (1997), although it does not establish the universal validity of either relationship for natural Arctic depth hoar. Conversely, the better performance obtained with the Sturm et al. (1997) parameterization in some previous Arctic studies can also partly reflect compensating biases when snow depth and/or density remain inadequately represented, as a lower conductivity can compensate for a snowpack that is too thin or too dense without improving its overall physical representation (e.g., Dutch et al., 2022; Damseaux et al., 2025). Our sequential evaluation, in which snow depth and bulk density were improved before modifying thermal conductivity, was specifically designed to mitigate this risk. More generally, density alone is insufficient to characterize snow thermal conductivity, which also depends strongly on snow microstructure. This limitation is particularly important for depth hoar, whose pronounced anisotropy and evolving grain and bond structure can produce substantially different thermal conductivities at similar densities (e.g., Satyawali et al., 2008; Löwe et al., 2013; Barrere et al., 2017). Further evaluation using vertically resolved conductivity measurements, multilayer snow models, and microtomographic measurements of representative natural Arctic depth-hoar samples is therefore needed. Future parameterizations could incorporate microstructural descriptors, such as anisotropy or grain and bond geometry, in addition to density (e.g., Domine et al., 2011; Löwe et al., 2013; Calonne et al., 2019; Fourteau et al., 2021). In addition, future CLASSIC developments could diagnose an internal density profile within the single prognostic snow layer, similarly to the quadratic temperature profile already used in the model, or implement a fully multilayer snow scheme.
Despite the model improvements, persistent warm biases remain in the simulated snowpack and snow surface temperatures at some Arctic sites (e.g., at Bylot; Fig. 5c–j), which may contribute to an early onset of melt. A first possible explanation is related to the treatment of meltwater refreezing in CLASSIC: meltwater can refreeze entirely within the snowpack if the available heat sink is sufficient, thereby releasing latent heat and warming the snowpack. However, in reality, preferential flow pathways may allow some of the meltwater to reach the soil without fully refreezing, even when the snowpack heat sink would be sufficient to refreeze it. This effect may be particularly important in Arctic environments, where the formation of depth hoar at the base of the snowpack can enhance water drainage due to its larger grain size (e.g., Marsh and Woo, 1984; Wever et al., 2018). Alternatively, the simulated early melt at Arctic sites may also arise from uncertainties in the forcing datasets, especially in spring when radiative sensors are often affected by frost (e.g., Domine et al., 2019), or from limitations of the albedo scheme, since light-absorbing particles are not represented (as discussed for the Weissfluhjoch site in Sect. 4.2). Furthermore, warm biases may arise from radiative heating of near-surface air temperature sensors under high incoming and reflected shortwave radiation combined with weak wind conditions, which can lead to air temperature overestimations of several degrees Celsius (e.g., Georges and Kaser, 2002; Genthon et al., 2011) – conditions that could occur at Bylot given its relatively low wind speeds (e.g., Domine et al., 2018a). A sensitivity test applying a radiation-dependent correction to spring air temperatures could help assess its contribution to the simulated early melt (e.g., Huwald et al., 2009; Yang et al., 2016; Morino et al., 2021).
Ultimately, the new wind-dependent compaction scheme could be further refined using additional datasets in future work. The most sensitive parameters in Eq. (12) are U0 and the wind speed threshold triggering enhanced wind compaction. In this study, the latter was fixed at 2.5 m s−1, while a range of U0 values between 2.5 and 3.5 m s−1 was explored. Additional Arctic sites and improved forcing data would help reassess these values and better constrain the center (d0=0.8 m) and width (σ=1.0 m) of the Gaussian function controlling wind-enhanced compaction. More generally, better constraining fresh snow density, maximum snow density, and compaction rates will likely require dedicated experimental and field studies – such as wind tunnel experiments (e.g., Walter et al., 2024) and targeted in situ observations – to jointly inform and disentangle the effects of snowfall properties, wind redistribution, and mechanical compaction in Arctic snowpacks. In addition, both the fixed wind threshold used for enhanced compaction and the temperature-only threshold used for blowing-snow sublimation (Eq. 6) could be refined by accounting for additional controls on surface-snow erodibility, such as snow density and microstructural properties (e.g., Liston et al., 2007; Vionnet et al., 2012; Amory et al., 2021).
4.5 Forcing and observation uncertainties
Large uncertainties can also arise from forcing and observation data. Indeed, Arctic field sites often face extreme conditions, including prolonged polar nights and harsh weather, which can impact sensor reliability and data collection, especially due to frost and solid precipitation wind undercatch (e.g. Pan et al., 2016; Domine et al., 2021a). The remote nature of these sites also makes it difficult to perform regular maintenance and verification of instruments. Therefore, the measurements can have many gaps, which are often filled with data from nearby stations and/or reanalysis products. For example, at Bylot, the Geonor 200 measurements are complemented with data from nearby Geonor gauge stations at Pond Inlet (84.1 km to the southeast) and Cape Liverpool (79.5 km to the northeast; Domine et al., 2021a), which adds further uncertainties. An alternative precipitation gap-filling method was tested at Bylot (Mohammadzadeh Khani, 2024), resulting in significant differences in simulated snow depth and soil temperatures, reaching up to 10 cm and a few degrees, respectively, within a few years (not shown). Although those differences were, on average, of lower magnitude than the impact of our model developments, they could affect parameter optimization.
At TVC, large uncertainties arise because the station itself may act as a local snow accumulation zone (Brampton Dakin, personal communication, 2023), further complicating the interpretation of snow depth measurements. In addition, the site lacks direct snowfall measurements and, although the precipitation forcing had already been corrected for gauge undercatch following Pan et al. (2016), it remained inconsistent with the simulated snowpack evolution, as discussed in Sect. 2.1. In particular, the initial simulated snow depth is too low, and snow density is underestimated relative to snow pit measurements (Fig. S1a–c; DEF (1xSnowf), blue line in the Sect. S3). To address this, we doubled the snowfall rates (Sect. 2.1) to obtain more realistic simulated snow depth, density, and soil temperature values in better agreement with observations when using our new model developments (Fig. S1a–c; ALL_TVC (2xSnowf), green line). This additional empirical adjustment introduces uncertainties into the analysis and may bias the tuning applied at TVC in the ALL_TVC experiment. Residual discrepancies may arise from precipitation-phase partitioning, remaining measurement uncertainties, local snow trapping, and wind-driven snow redistribution, which cannot be resolved by a gauge-undercatch correction alone. A wind-dependent adjustment representing lateral snow transport and local deposition, conceptually similar to that proposed by Lackner et al. (2022), could be explored as an alternative to the uniform snowfall scaling. However, because snow drifting can occur even in the absence of precipitation, it remains challenging to determine which correction approach is most accurate. In this context, the forthcoming 32-year dataset at TVC (Woolley et al., 2024; Tutton et al., 2025) will be particularly valuable for better constraining these model developments and ascertaining whether the two snow seasons currently available from Dutch et al. (2022) are representative, or whether snow redistribution processes compensate over longer time scales.
4.6 Soil, vegetation, and carbon fluxes
Using CLASSIC enables the simulation of carbon fluxes and dynamically evolving vegetation. However, simulated vegetation height can differ from observations at specific sites. For example, at Col de Porte, grass is regularly mowed (Lejeune et al., 2019), which is not represented in the model and leads to overestimated vegetation height, affecting simulated albedo when vegetation is not yet fully buried by snow (Figs. 3 and S3c). In addition, CLASSIC does not account for vegetation bending under snow load (e.g., Ménard et al., 2014), further increasing uncertainty in the representation of vegetation height. As a result, simulated surface albedos (Fig. S3, third column in Sect. S7) differ substantially from observations, particularly at the beginning of the snow season at Col de Porte, Senator Beck, and Swamp Angel, with underestimations exceeding 0.2 (Fig. S3c, m, and r). This bias is partly related to unrealistic vegetation heights, which can reach 50 cm to 1 m in the model, even at Arctic sites, where the vegetation is in reality dominated by short grasses, mosses, and lichens. Sensitivity tests comparing bare-ground and grass configurations showed only minor impacts on snowpack evolution in these offline simulations, despite noticeable albedo differences during transition periods (not shown). However, such effects are expected to be more pronounced in land–atmosphere coupled simulations, where albedo biases can feed back on surface energy fluxes, near-surface temperatures, and snow evolution and will become increasingly important in a changing climate, inducing Arctic greening (Bayle et al., 2022).
Uncertainties in simulated soil temperatures at Arctic sites may also partly arise from the thermal bridge effect associated with shrubs, which is not represented in CLASSIC. This effect can enhance heat exchange between the atmosphere and the ground and reduce soil temperatures by up to 4 °C during cold spells compared to shrub-free areas (Domine et al., 2023). Its absence in the model could therefore contribute to the limited improvement and remaining warm biases in simulated soil temperatures at Umiujaq TUNDRA, where broadleaf deciduous cold shrubs are present (e.g., Fig. 3ss). Consistent with this interpretation, Meyer et al. (2021) reported that simulated soil temperatures in shrub-dominated environments were generally slightly warmer in winter and slightly cooler in summer than observations (their Fig. 1). However, this effect may yet be weak at Umiujaq TUNDRA, as shrubs are short relative to snow depth, largely bent under the snow, and characterized by very small branch diameters, all of which strongly limit the efficiency of thermal bridging. Uncertainties may also stem from the pedotransfer functions used in CLASSIC (Cosby et al., 1984), which are calibrated over a broad range of soil types and may perform poorly for extreme cases (e.g., nearly pure sand; Wösten et al., 2001; Vereecken et al., 2010; Van Looy et al., 2017). Such limitations can affect the estimation of key soil properties, such as soil moisture at saturation, and consequently influence simulated soil water content and soil temperatures.
Using a peat layer to compensate for the absence of explicit moss and lichen representation at Arctic sites (Sect. 2.1) also highlights important model limitations. Mosses and lichens exhibit distinct behaviors in terms of water drainage, heat transfer, and carbon fluxes (Beringer et al., 2001; Gornall et al., 2007), which are not fully captured by this simplified approach. This may introduce additional uncertainties in our simulations, even if its impact appears limited in winter and mainly leads to improved summer albedo, soil temperatures, and soil moisture (not shown). However, remaining biases in simulated volumetric water content persist (Fig. S4 in Sect. S8) and may still affect winter soil temperatures, particularly during zero-curtain periods when excess liquid water delays soil freezing. Previous studies that explicitly implemented mosses in land surface models, such as JSBACH and JULES, reported notable improvements, particularly for permafrost dynamics (Ekici et al., 2014; Chadburn et al., 2015).
Additional analyses of Arctic carbon budgets are presented in Sect. S9. They show that improved simulation of winter soil temperatures can substantially affect modeled net ecosystem exchange (NEE), particularly by reducing winter CO2 emissions at sites with the largest soil temperature biases (e.g., Bylot and TVC). In these cases, lower winter soil temperatures reduce heterotrophic respiration and shift the annual carbon balance toward weaker sources or net sinks (Fig. S5a and c in Sect. S9). In contrast, changes in NEE at Umiujaq are limited, consistent with the smaller soil temperature differences simulated at this site (Fig. S5b). While simulated NEE amplitudes remain smaller than observed (Fig. S6), large uncertainties in winter flux measurements and limitations in Arctic vegetation representation complicate a direct evaluation. Overall, these results highlight the strong coupling between snow processes, soil thermal regimes, and Arctic carbon fluxes and emphasize the need to improve the representation of Arctic snowpacks and their interactions with vegetation – such as vegetation bending, thermal bridging in shrubs, and explicit moss and lichen plant functional types – particularly in the context of ongoing Arctic shrubification and greening, to achieve more consistent simulations of energy, water, and carbon budgets in Arctic environments (e.g., Sturm et al., 2001; Myers-Smith et al., 2011; Bayle et al., 2022).
Another source of uncertainty arises from the lack of detailed information on soil composition and measurement locations at some sites (e.g., soil temperature sensors and snow pits), which hampers accurate simulation of snow–soil interactions. This is particularly relevant at TVC, where hummock and inter-hummock zones can exhibit markedly different thermal properties (Brampton Dakin, personal communication, 2023). More broadly, the absence of standardized, homogenized Arctic snow datasets comparable to those of SnowMIP (Menard and Essery, 2019) remains a major challenge for Arctic snow model evaluation and intercomparison. Expanded and more comprehensive observations – including snow temperature, snow thermal conductivity, and camera-based monitoring – are also needed to better constrain and evaluate snow processes in Arctic environments.
This study introduces three physics-based snow model improvements in the Canadian Land Surface Scheme including Biogeochemical Cycles (CLASSIC; Melton et al., 2020): (1) a correction to the computation of thermal conductivity at the top of the first soil layer, (2) a revised formulation for bottom snow temperature, and (3) the inclusion of a windless exchange coefficient in the sensible heat flux calculation. In addition, three Arctic-specific snowpack adaptations are implemented: (1) the representation of blowing-snow sublimation losses, (2) a revised snow compaction scheme, and (3) a modification of the snow thermal conductivity parameterization.
To assess the new model developments, seven sites from the Snow Model Intercomparison Project (SnowMIP; Krinner et al., 2018; Ménard et al., 2019; Menard et al., 2021) are used, together with three Arctic sites: Bylot Island (Domine et al., 2021a), Umiujaq TUNDRA (Domine et al., 2024b), and Trail Valley Creek (TVC; Dutch et al., 2022) (Fig. 1). The model is evaluated against automatic and manual measurements of snow depth and SWE, albedo, surface temperature, soil temperature, and snow cover duration (SCD) at all sites except TVC. When available, snow thermal conductivity, bulk snow temperature, and bottom snow temperature are also used to provide additional process-level insights at selected sites. Trail Valley Creek is retained as an independent evaluation site; however, an adjusted version of the new compaction scheme that includes TVC is additionally proposed.
The revised computation of bottom snow temperature (Sect. 2.3.2), combined with the updated snow thermal conductivity parameterization of Calonne et al. (2011) (Sect. 2.4.3), alleviates a bias compensation that previously led to an overestimation of heat storage within the snowpack (e.g., Fig. 4g–j and Sect. B in Appendix). The new formulation of the bottom snow temperature (Eq. 3) reduces the mean simulated snow temperature bias at Col de Porte over 2002–2014 from 0.8 to 0.3 °C (RMSE from 1.4 to 1.2 °C), and the bottom snow temperature bias from −0.4 to −0.1 °C (RMSE from 0.5 to 0.3 °C). It also substantially improves bottom snow temperature estimates at Bylot, with the RMSE decreasing from 4.2 to 0.9 °C (Fig. B2).
The addition of a windless exchange coefficient in the sensible heat flux calculation (Sect. 2.3.3) improves the simulated surface temperature at all SnowMIP sites, reducing the RMSE from 3.41 to 1.51 °C (Fig. 6k) and the mean bias from −2.20 to −0.25 °C (Fig. 7k). At Bylot, surface temperature performance is slightly degraded; however, given the larger temperature amplitude at Arctic sites, the corresponding NRMSE increases only marginally, from 0.29 to 0.30. Overall, when considering both Arctic and SnowMIP sites, the average NRMSE decreases from 0.60 to 0.30 (Fig. 6l).
The snow sublimation scheme (Sect. 2.4.1) has a negligible impact at most sites, except at Umiujaq, TVC, and Senator Beck, where it leads to an average snow depth reduction of 2–4 cm. Large uncertainties remain in the estimation of snow sublimation losses, owing to snow drifting processes and the difficulty of accurately measuring snowfall rates.
The revised snow compaction scheme (Sect. 2.4.2), which accounts for wind effects, has the most pronounced impact at the Arctic sites. Indeed, the previous compaction formulation (Brown et al., 2006) constrained the maximum dry-snow density to values lower than those observed in Arctic environments, leading to an underestimation of bulk snow density by more than 50 kg m−3 and, consequently, to an overestimation of simulated snow depth (e.g., Figs. 2 and 5a–d blue line). The new scheme allows higher maximum snow densities during strong wind events for snowpacks around 80 cm (corresponding to the center of the Gaussian formulation of Eq. 12; Fig. 2, red line), while avoiding impacts on deeper mid-latitude snowpacks, where compaction is primarily governed by gravity and metamorphism. As a result, the mean snow depth bias at the Arctic sites (including TVC) is reduced from 12.0 to −1.0 cm, and the associated warm bias in simulated soil temperatures decreases from 4.6 to 3.1 °C from the DEF to the COMPACT experiment (Fig. 7a and m, blue empty circles; Table 2).
The inclusion of the snow thermal conductivity parameterization of Calonne et al. (2011) (Sect. 2.4.3) further improves model performance. At the SnowMIP sites, the overall soil temperature RMSE remains stable at about 0.6 °C between the DEF and CL11 experiments (Fig. 6m, black circles; Table 2). In contrast, at the Arctic sites (including TVC), the soil temperature RMSE decreases substantially from 5.3 to 3.0 °C, and the mean bias is further reduced to 0.41 °C (Figs. 6 and 7m, blue empty circles). Incorporating TVC-adjusted parameters in the compaction scheme (ALL_TVC) yields a modest additional improvement in soil temperature RMSE across all sites (SnowMIP and Arctic), from 1.40 to 1.37 °C (Fig. 6m, red empty circles). Meanwhile, the snow depth RMSE remains close to 20 cm across all sites (Fig. 6a, red empty circles), and the mean snow depth bias at the Arctic sites is reduced to 0.9 cm (Fig. 7a, blue empty circles).
The improved simulated soil temperatures induced by the new snow model physics yield changes in simulated net ecosystem exchange (NEE) – the net flux of CO2 between the land surface and the atmosphere – at all Arctic sites (especially in the winter land surface respiration), which can trigger a switch from carbon sources to sinks (Sect. S9). Accurate representation of Arctic snowpacks and soil thermal regimes is therefore essential for robust estimates of Arctic carbon fluxes. Such improvements are especially important in the context of climate change and Arctic amplification (e.g., Serreze and Barry, 2011; AMAP, 2024), as well as for Arctic carbon budget assessments, which remain highly uncertain (e.g., McGuire et al., 2012; Natali et al., 2019).
Despite the inherent limitations of the CLASSIC single-layer snow model, including its inability to explicitly represent Arctic snow stratigraphy (Sect. 4), this study shows that it can reproduce first-order bulk snowpack characteristics and the coupled snow–soil thermal response at the evaluated sites. In particular, we introduce a novel wind-dependent compaction scheme (Sect. 2.4.2) that enables the simulated snowpack to perform as well at Arctic sites as at mid-latitude sites. Together with the revised bottom snow temperature formulation and the updated snow thermal conductivity parameterization, this new development provides physically consistent model responses across snow depth, snow density, snow thermal properties, and soil temperature, supporting the robustness of the proposed developments despite remaining forcing, observational, and site-specific uncertainties. Moreover, the substantial variability in simulated snow depth and soil temperature across the three Arctic sites highlights the need to calibrate and evaluate snow models using multiple Arctic sites, rather than relying on a single location, as has often been the case in previous studies (e.g., Barrere et al., 2017; Gouttevin et al., 2018; Lackner et al., 2022).
Uncertainties remain in the forcing and evaluation datasets, particularly owing to the harsh Arctic environments – characterized by strong winds, frost-affected sensors, polar night conditions, and wind-driven snow redistribution. Overall, there is a crucial need for more measurements in Arctic environments and standardized quality-controlled snow datasets to enable modeling teams to incorporate Arctic sites into their model assessments. To further improve the representation of energy, water, and carbon fluxes in Arctic environments in CLASSIC, future work should incorporate moss and lichen dynamics, along with a more refined assessment of carbon fluxes. Integrating vegetation bending may also be important, as non-buried protruding vegetation may significantly bias surface albedo and the energy budget, particularly in autumn and spring (Sect. 4.6). Accounting for light-absorbing particles on the snowpack and revising the compaction and/or albedo scheme accordingly should also be considered (e.g., Gaillard et al., 2025). Developing an internal snow-density profile could help reconcile bulk density with effective thermal conductivity within the current single-layer framework. Alternatively, transitioning to a multilayer snow scheme would allow Arctic snow stratigraphy to be represented explicitly, but would require a substantial restructuring of the model architecture, including its snow thermodynamics and mass and energy balance calculations. More physically based formulations of wind-slab and depth-hoar development should also be explored. Future work will focus on performing spatial simulations to evaluate the 1D snow model developments of this study over the Arctic, in addition to assessing new snow cover fraction parameterizations to better account for spatial snow heterogeneities.
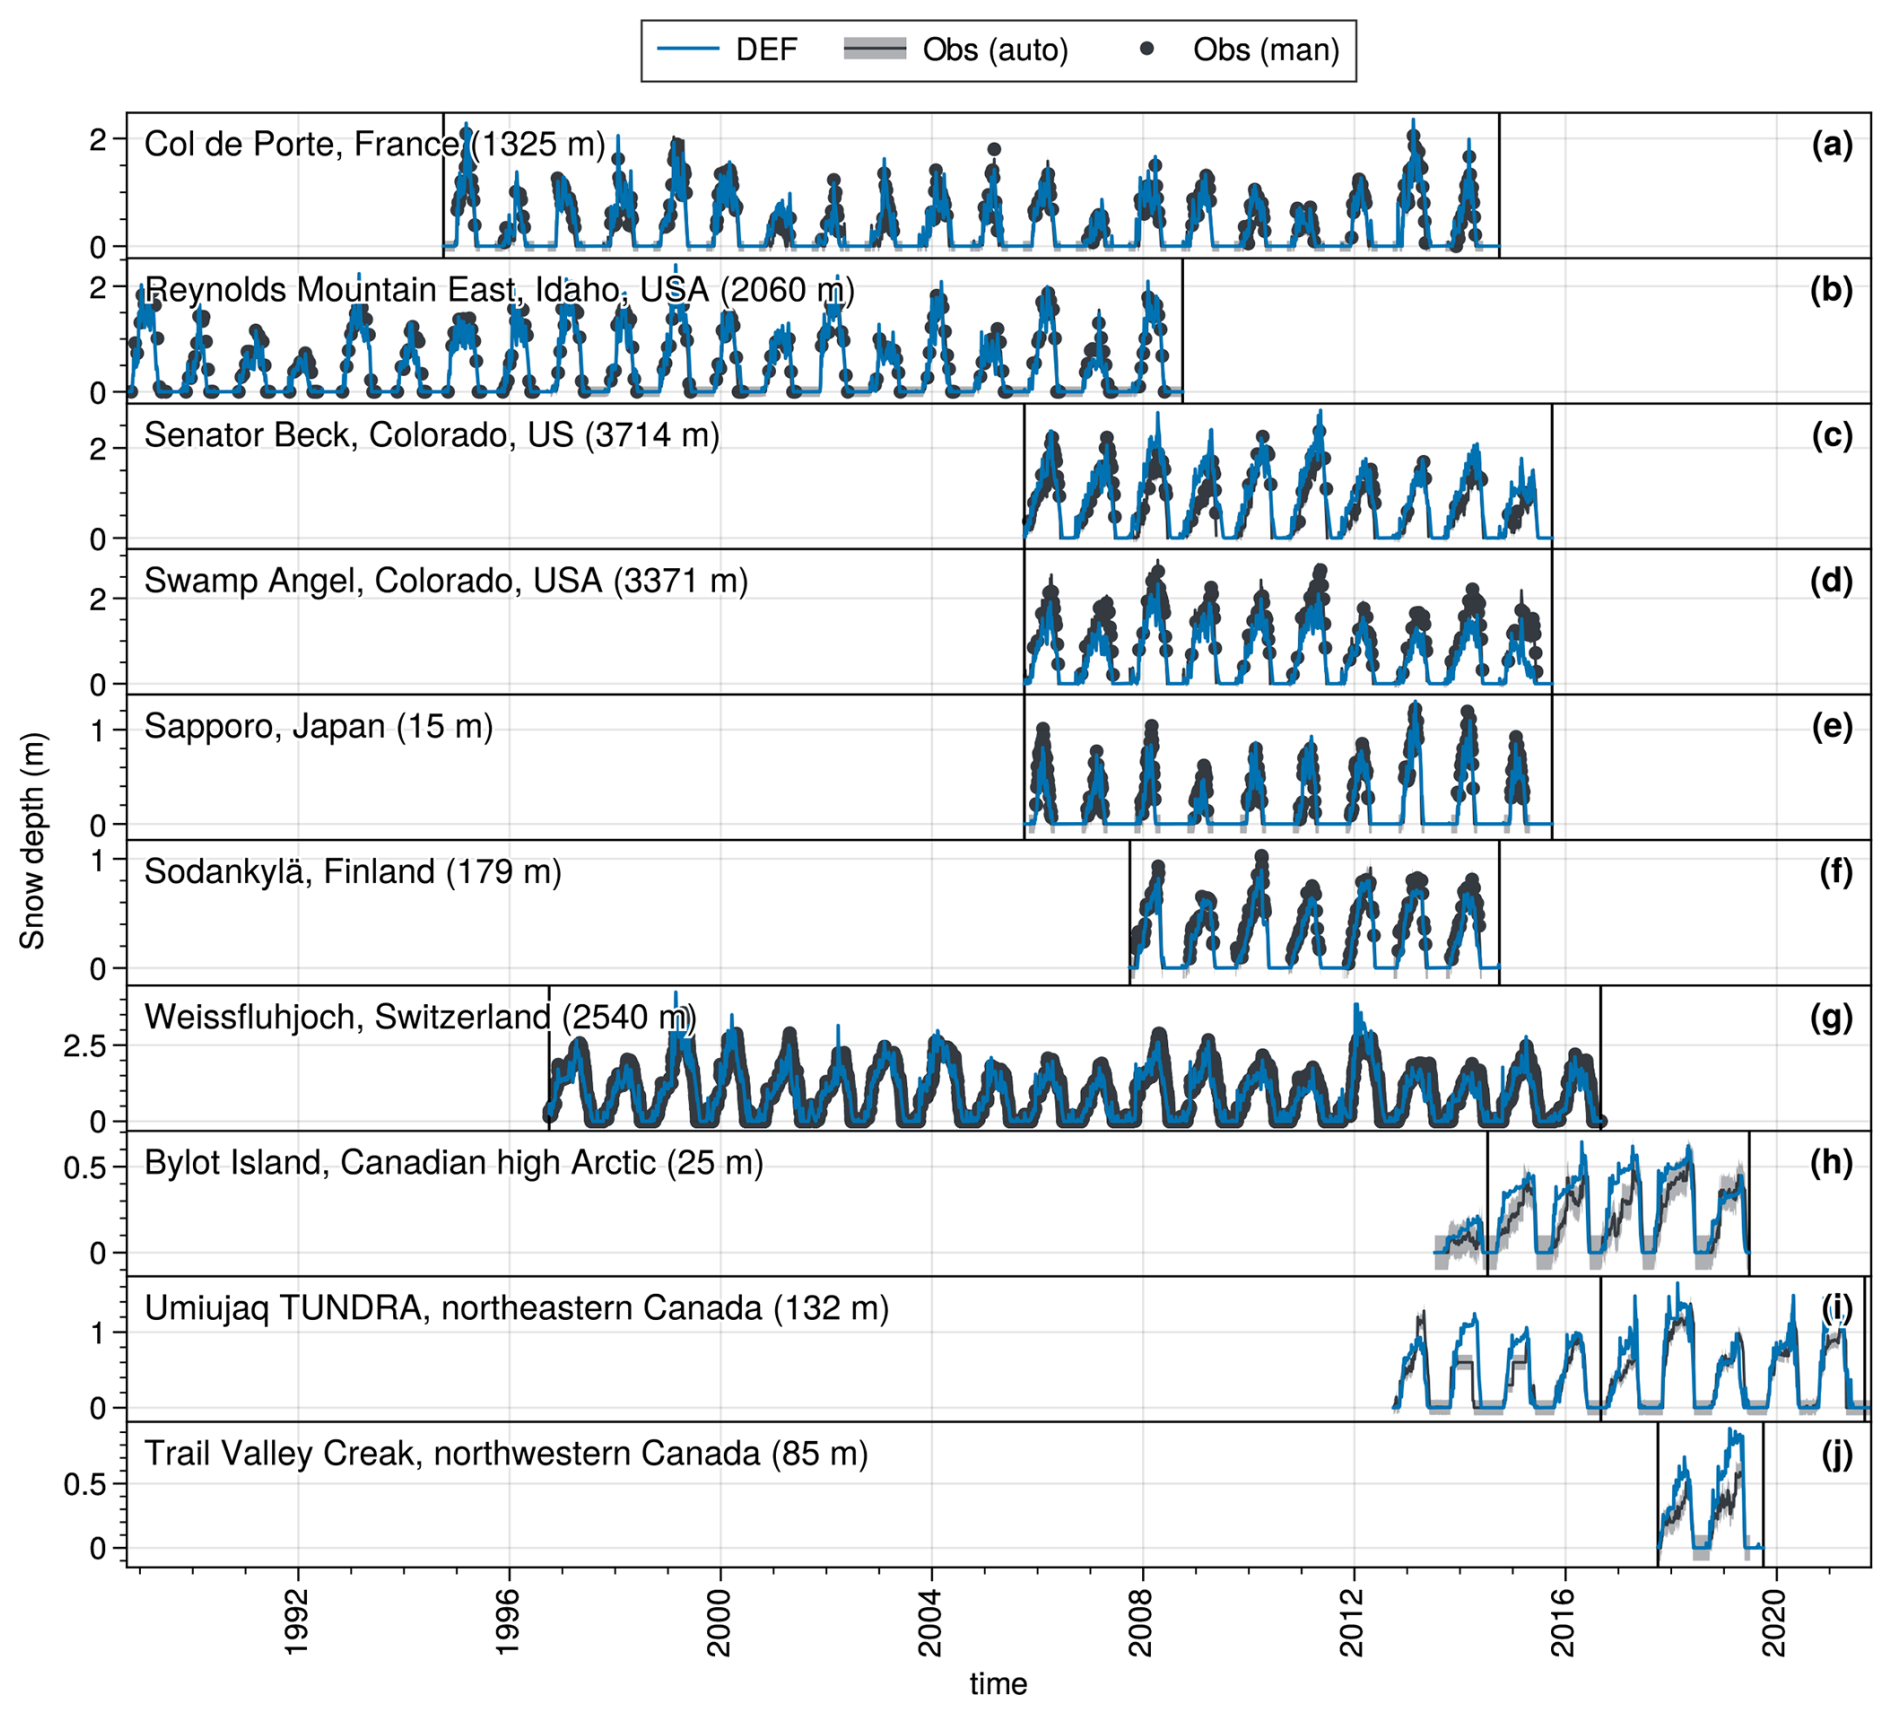
Figure A1Snow depth time series for the DEF experiment (blue line), and the automatic (black line) and manual (black dots) observations. The black shading represents the snow depth uncertainty of ±10 cm estimated at Col de Porte (Lejeune et al., 2019) and applied to the other sites as an indicative reference. The black vertical lines correspond to the analysis period for each site.
The snow and bottom snow temperatures were estimated at Col de Porte and Bylot. At Col de Porte, weekly snow profiles have been available since 1993. A trapezoidal integration was applied to obtain the bulk snow temperature and density. The evaluation period was chosen between 2002 and 2014 to compare with the automatic SWE measurements. The bottom snow temperature was derived from the lowest snow measurement (typically at 0 cm). Two example snow seasons are shown in Figs. 4 and B1 of simulated versus observed variables. The metrics (bias and RMSE) mentioned in Sect. 2.3.2 are computed over the whole period.
At Bylot, because the initial model version (DEF) did not simulate correct snow depth and densities (e.g., Fig. 5a–d), the observed bottom snow temperature was directly compared to the theoretical Eqs. (2) and (3) in Fig. B2. The observed bulk snow temperature is estimated by integrating (trapezoidal method) the measured snow temperatures at 2, 7, 17, 27, and 37 cm or at 0, 5, 15, 25, 35 cm after July 2018 (Domine et al., 2021a), considering only the sensors when the snow depth exceeds their respective height. The bottom snow temperature is estimated as the average of the shallowest soil and snow temperature measurements, i.e., at ±2 cm before July 2018, and the snow temperature measurement at 0 cm is taken after. The automatic snow depth measurement was used to estimate the snow depth. A data gap is present at the end of the 2016 snow season, but the available period for that year is still used for the comparison.
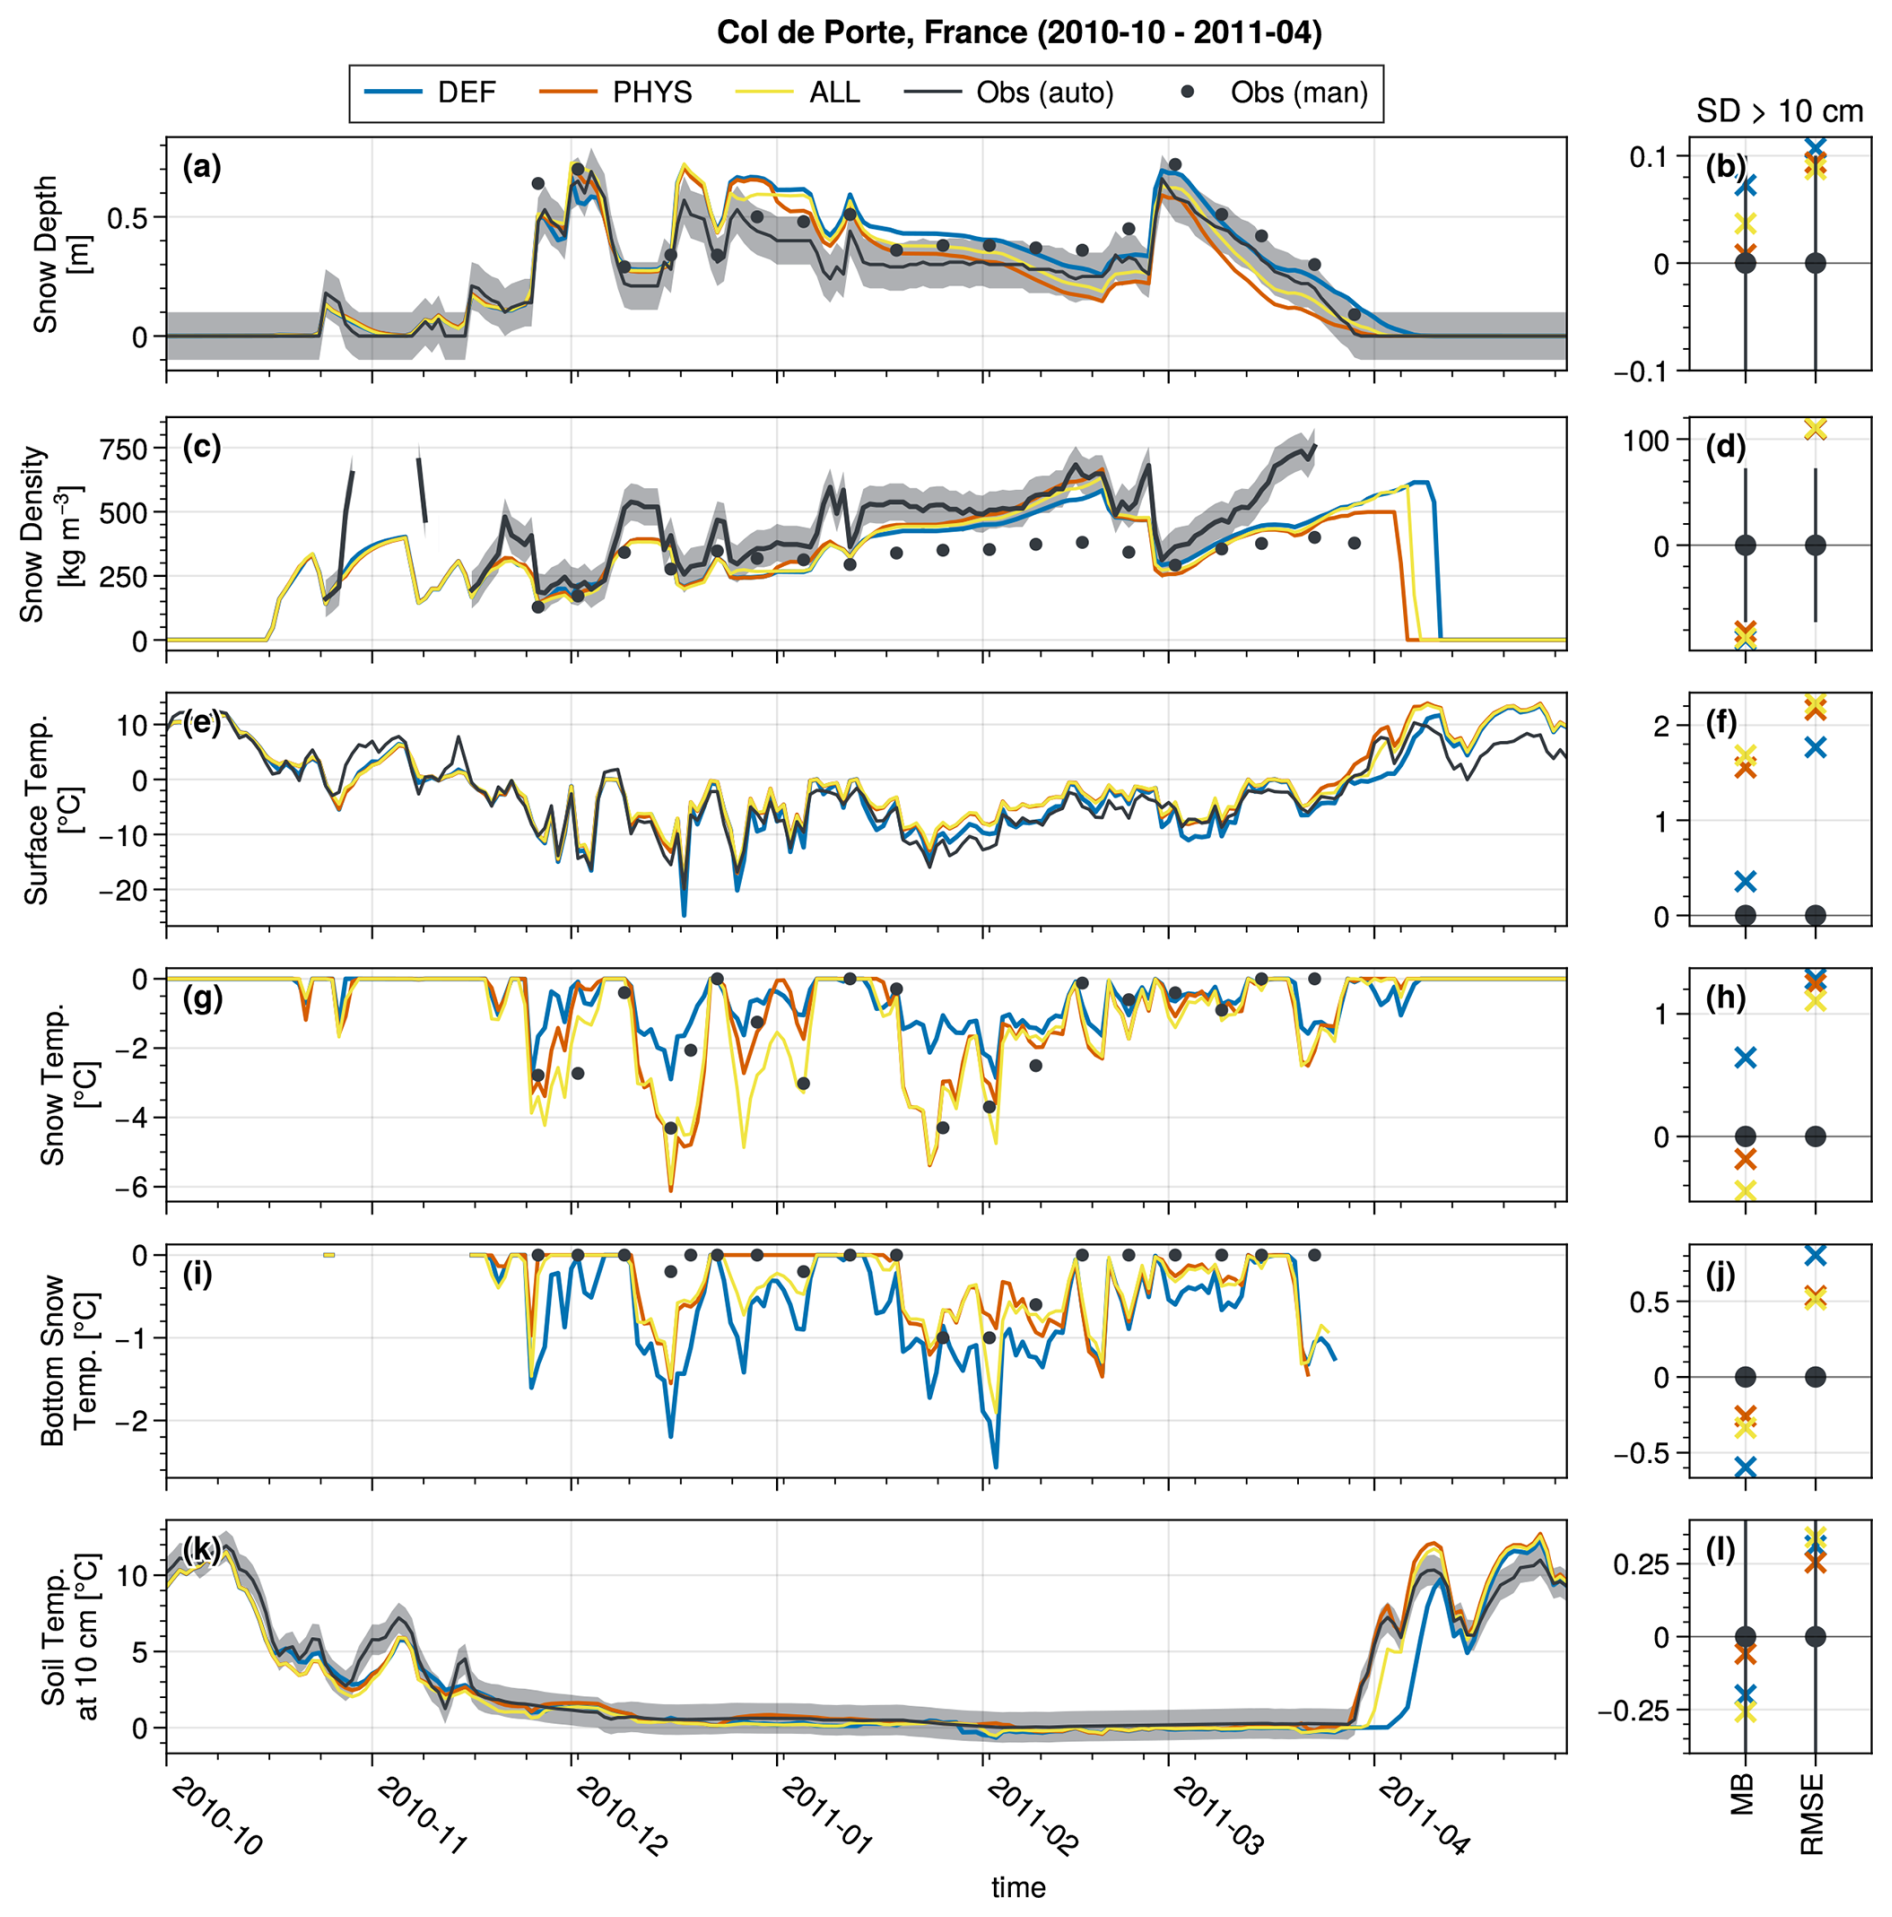

Figure B2Daily time series of the observed bottom snow temperature (black line) and its theoretical estimation with Eqs. (2) and (3) (blue and orange lines, respectively) at Bylot over the period 2015–2019. The dashed lines correspond to the differences between the theoretical estimate and the observed bottom snow temperature. The averaged RMSE is also indicated in the legend.


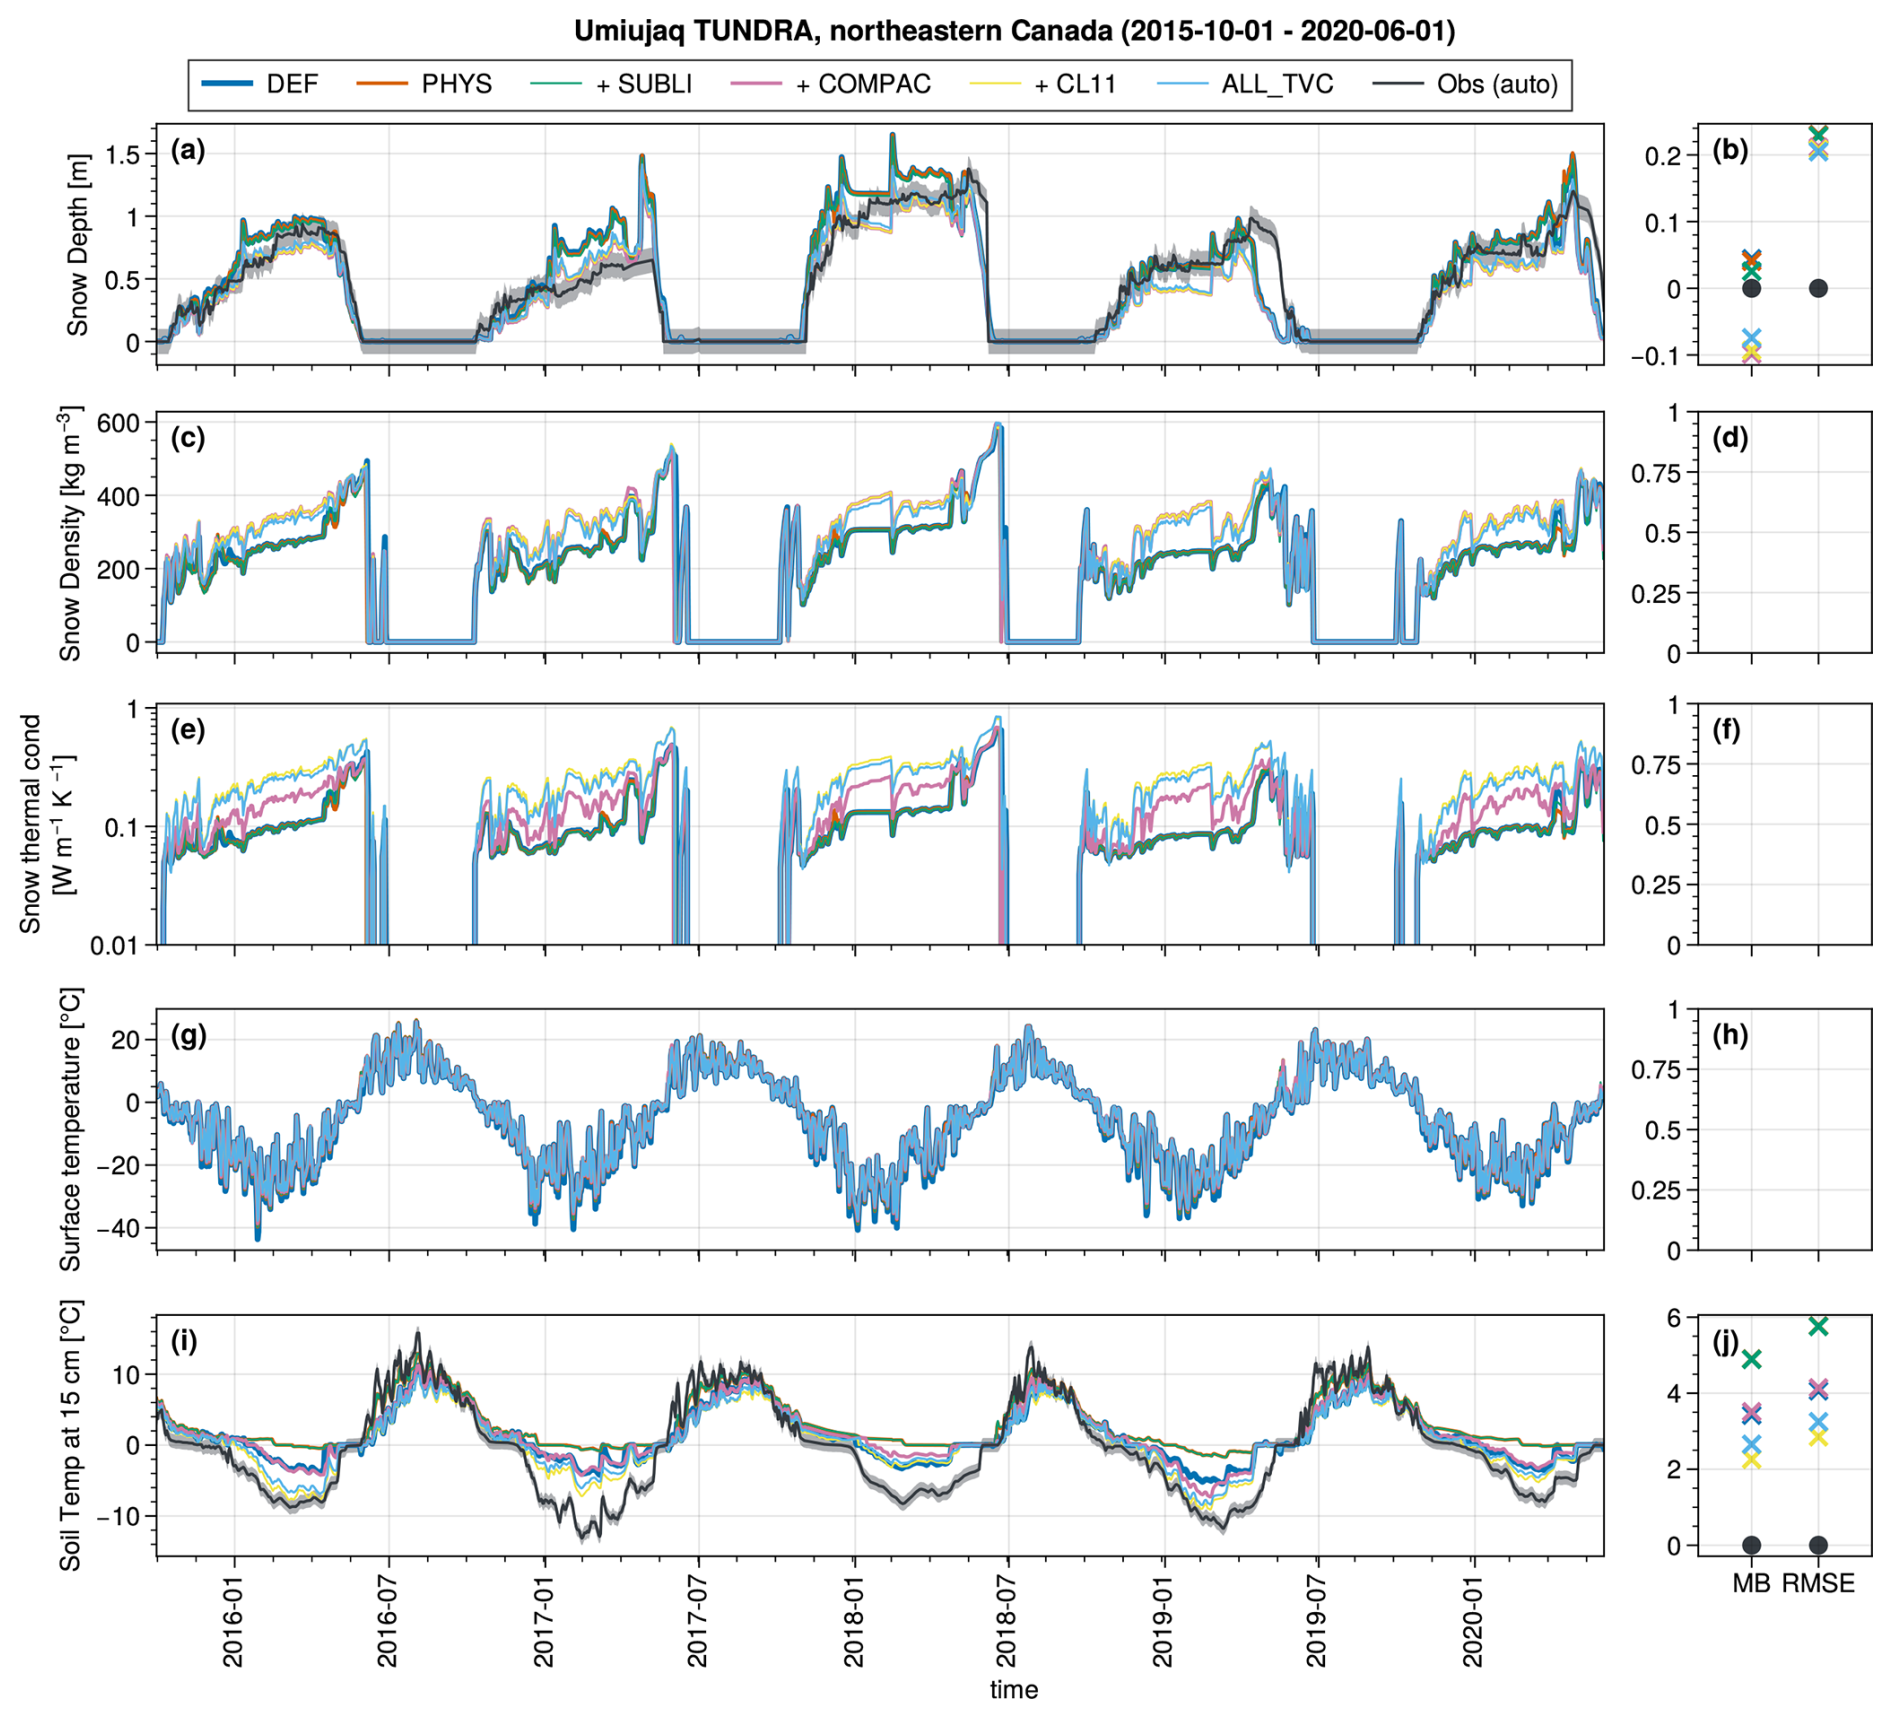
Figure D1Same as Fig. 5 but only for the snow depth (a), snow density (c), snow thermal conductivity (e), snow surface temperature (g), and soil temperatures at 15 cm (i) at Umiujaq TUNDRA from October 2015 to the end of June 2020.
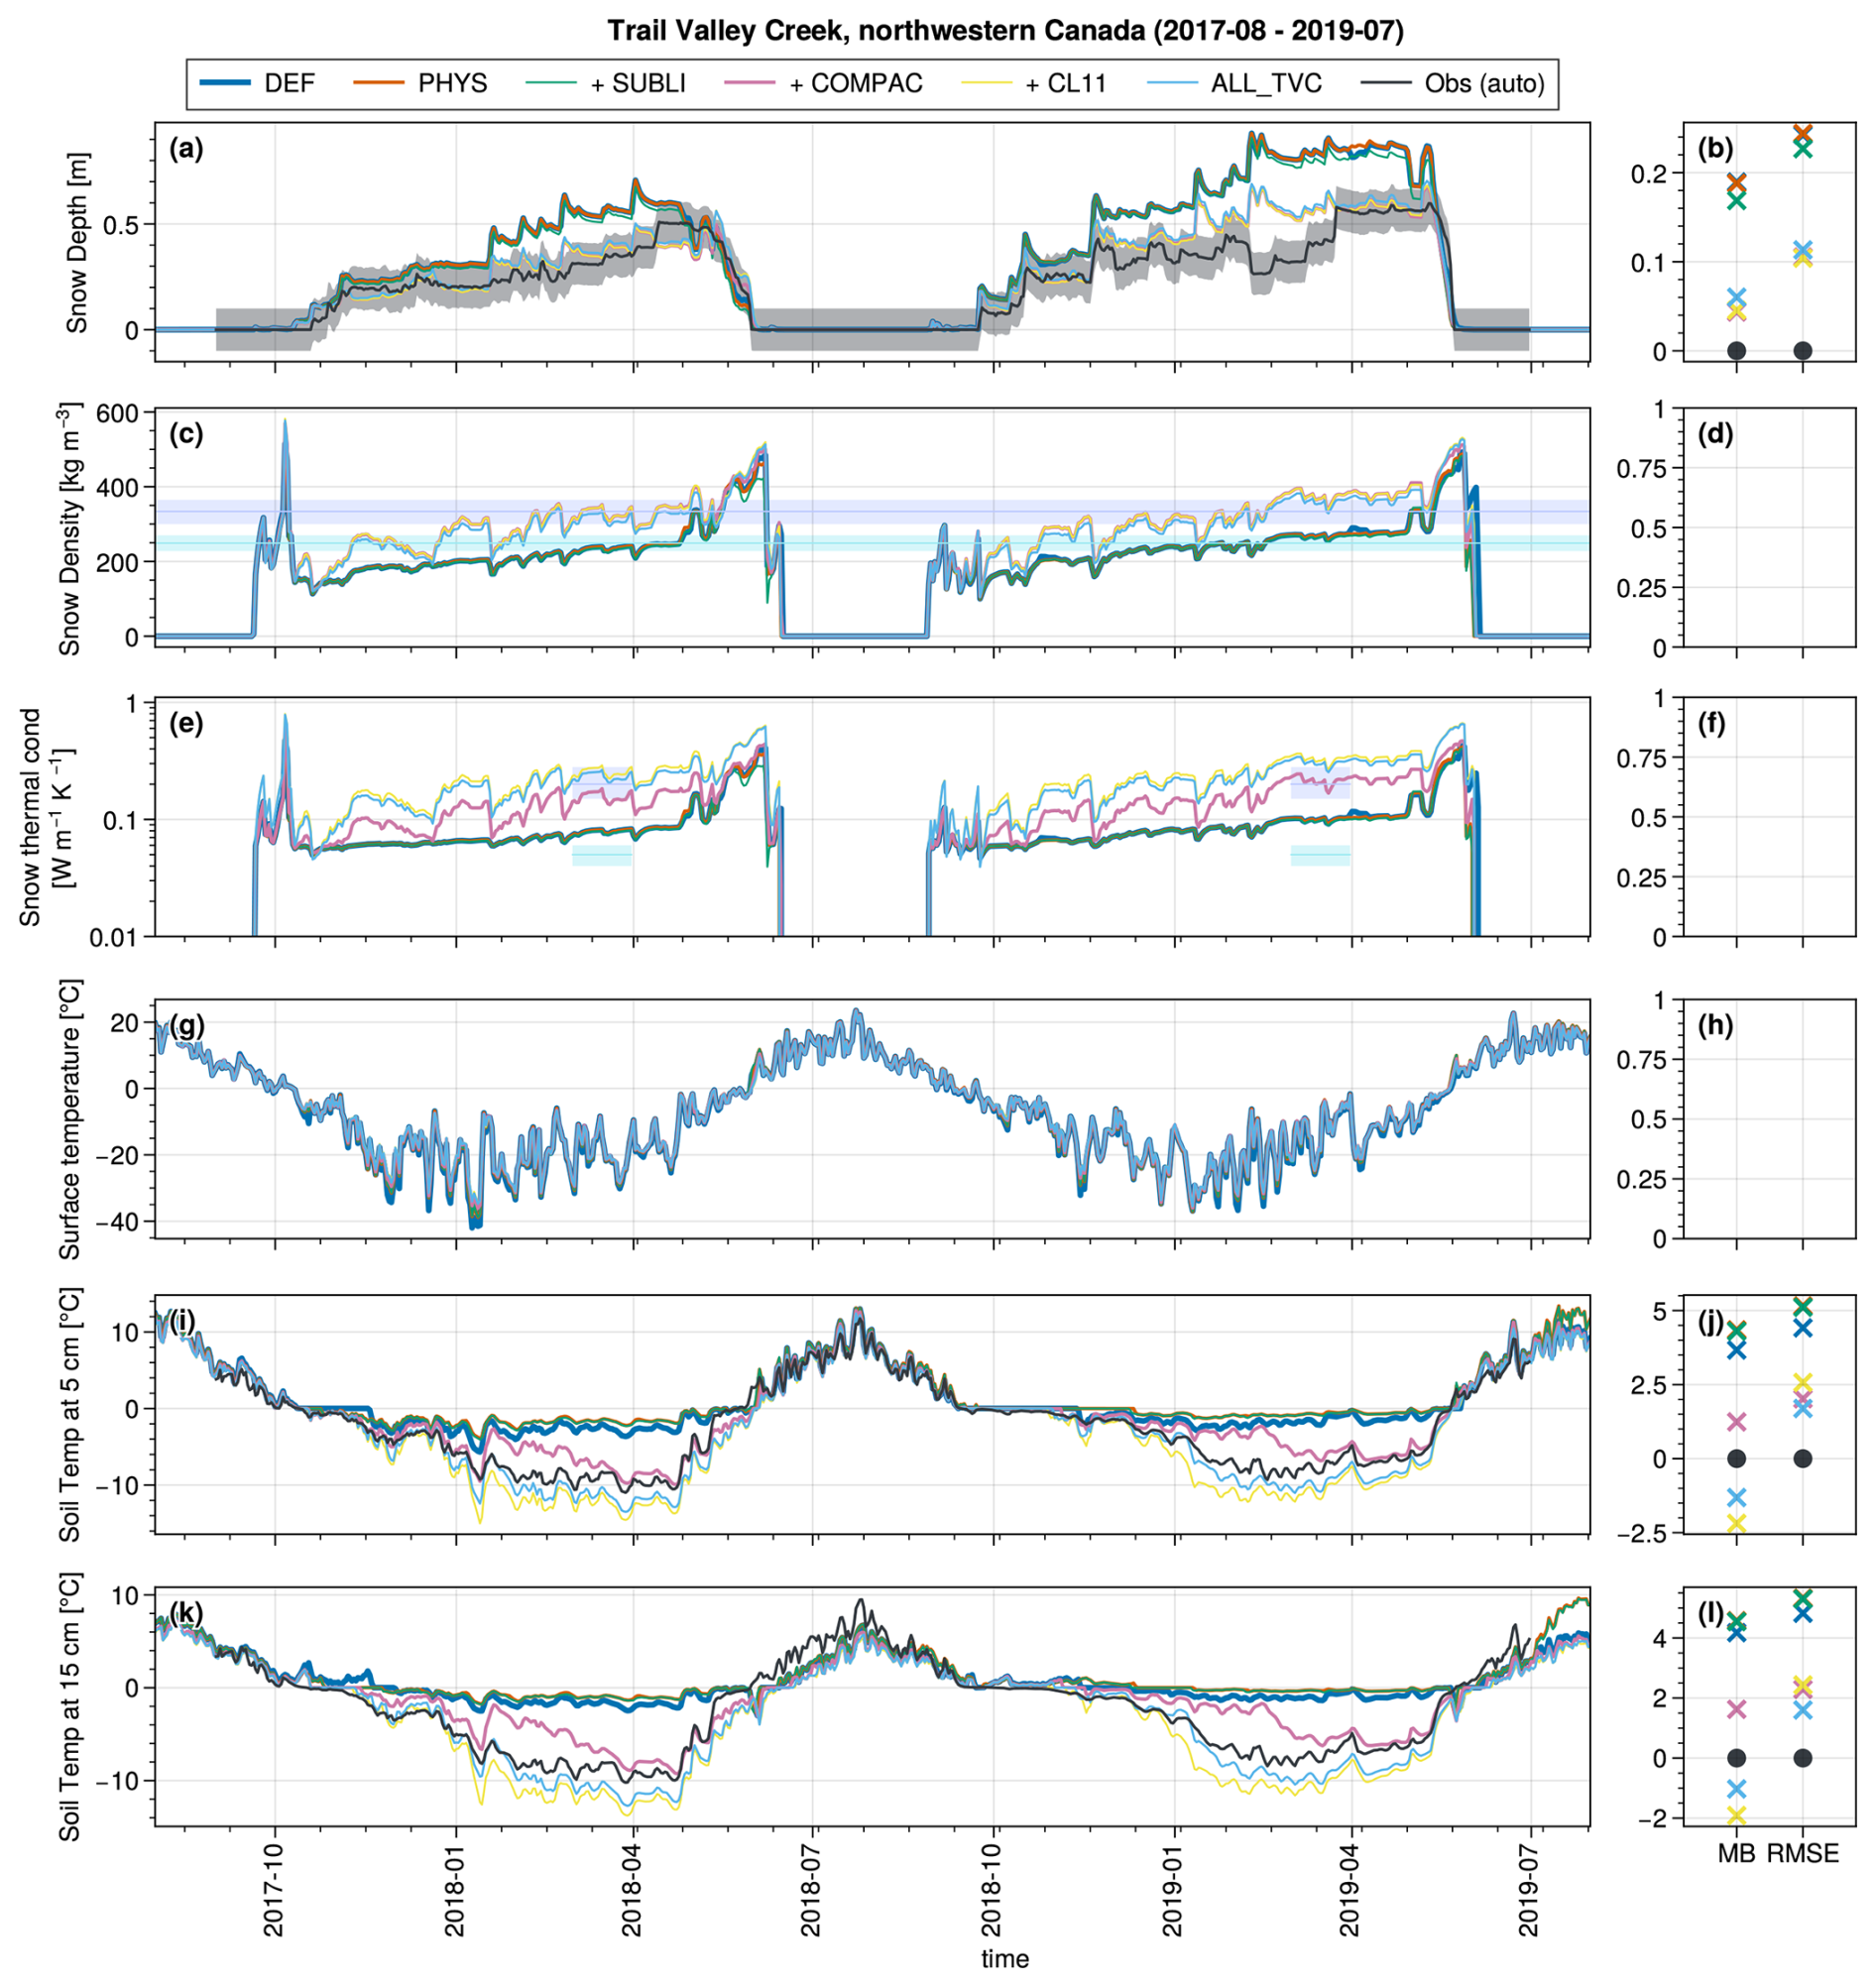
Figure D2Same as Fig. 5 but for the snow depth (a), snow density (c), snow thermal conductivity (e), snow surface temperature (g), and soil temperatures at 5 and 15 cm (i, k) at TVC from September 2017 to the end of June 2019. The dark and light blue horizontal shadings in panels (c) and (e) represent the pooled medians and interquartile ranges of wind-slab and depth-hoar properties, respectively, reported by Dutch et al. (2022) (their Table 2). The density ranges combine the March and November 2018 and January and March 2019 field campaigns and are extended over the full period for reference. The thermal-conductivity ranges combine the March 2018 and March 2019 campaigns and are shown only during those months.
All scripts to produce the figures and results are available at: https://doi.org/10.5281/zenodo.18154778 (Lalande, 2026a). The CLASSIC code used for this study can be accessed at https://doi.org/10.5281/zenodo.18175771 (Lalande, 2026b). The SnowMIP data used in this paper are available in the data repository PANGAEA: https://doi.org/10.1594/PANGAEA.897575 (Menard and Essery, 2019). Additional snow temperatures were extracted from Lejeune et al. (2019). The Bylot driving and validating data, are available on the Nordicana D repository: https://doi.org/10.5885/45693CE-02685A5200DD4C38 (Domine et al., 2021b). The Umiujaq TUNDRA data are available in the PANGAEA repository at https://doi.org/10.1594/PANGAEA.964743 (Domine et al., 2024a). Trail Valley Creek data are available at https://doi.org/10.5281/zenodo.7137729 (V-Dutch, 2022).
The supplement related to this article is available online at https://doi.org/10.5194/gmd-19-9581-2026-supplement.
ML, CK, and AR designed the study. ML implemented the model developments, performed the simulations, and produced the figures. LW, DV, and VV provided valuable insights, ideas, and critical perspectives on the new snow model developments. FD helped set up Arctic sites and provided expertise in Arctic snow and field observations. ML wrote the manuscript, and all co-authors contributed through revisions, comments, and suggestions. All authors discussed the results and provided critical feedback.
The contact author has declared that none of the authors has any competing interests.
Publisher's note: Copernicus Publications remains neutral with regard to jurisdictional claims made in the text, published maps, institutional affiliations, or any other geographical representation in this paper. The authors bear the ultimate responsibility for providing appropriate place names. Views expressed in the text are those of the authors and do not necessarily reflect the views of the publisher.
We acknowledge Mark D. Gordon for sharing his expertise on the implementation of the snow sublimation loss parameterization. We are grateful to Ross Brown for providing valuable insights into previous CLASS snow model developments, particularly regarding the snow compaction scheme. We thank Brampton Dakin and Georgina J. Woolley for sharing additional information on the Trail Valley Creek (TVC) site, as well as Oliver Sonnentag for providing the meteorological forcing data used in this study, made available through the dataset compiled by Victoria Dutch. We also thank Paul Bartlett for providing the latest configuration of the SnowMIP experiments. We are grateful to Joe R. Melton and Gesa Meyer for their extensive help with the CLASSIC model and simulation setup, as well as for their valuable comments that helped improve this study. We also thank the two anonymous reviewers for their constructive comments, which helped improve the manuscript. Finally, we thank Anna Maria Trofaier and Clément Albergel for supervising the European Space Agency (ESA) Climate Change Initiative Research Fellowships project: Snow cover heterogeneity and its impact on the Climate and Carbon cycle of Arctic regions (SnowC2), which supported this work.
This research has been supported by the European Space Agency (grant no. 4000142354/23/I/DT-lr). This work was also supported by the NOVA-FRQNT-NSERC grant (2023-NOVA-314203).
This paper was edited by Cenlin He and reviewed by two anonymous referees.
Abolafia-Rosenzweig, R., He, C., McKenzie Skiles, S., Chen, F., and Gochis, D.: Evaluation and Optimization of Snow Albedo Scheme in Noah-MP Land Surface Model Using In Situ Spectral Observations in the Colorado Rockies, J. Adv. Model. Earth Syst., 14, e2022MS003141, https://doi.org/10.1029/2022MS003141, 2022. a
Abolafia-Rosenzweig, R., He, C., Chen, F., and Barlage, M.: Evaluating and Enhancing Snow Compaction Process in the Noah-MP Land Surface Model, J. Adv. Model. Earth Syst., 16, e2023MS003869, https://doi.org/10.1029/2023MS003869, 2024. a
AMAP: AMAP Arctic Climate Change Update 2024: Key Trends and Impacts, AMAP – Arctic Monitoring and Assessment Programme, Tromsø, Norway, https://doi.org/10.21352/fz60-s852, 2024. a
Amory, C., Kittel, C., Le Toumelin, L., Agosta, C., Delhasse, A., Favier, V., and Fettweis, X.: Performance of MAR (v3.11) in Simulating the Drifting-Snow Climate and Surface Mass Balance of Adélie Land, East Antarctica, Geosci. Model Dev., 14, 3487–3510, https://doi.org/10.5194/gmd-14-3487-2021, 2021. a
Augas, J., Abbasnezhadi, K., Rousseau, A. N., and Baraer, M.: What Is the Trade-Off between Snowpack Stratification and Simulated Snow Water Equivalent in a Physically-Based Snow Model?, Water, 12, 3449, https://doi.org/10.3390/w12123449, 2020. a
Barnett, T. P., Adam, J. C., and Lettenmaier, D. P.: Potential Impacts of a Warming Climate on Water Availability in Snow-Dominated Regions, Nature, 438, 303–309, https://doi.org/10.1038/nature04141, 2005. a
Barrere, M., Domine, F., Decharme, B., Morin, S., Vionnet, V., and Lafaysse, M.: Evaluating the Performance of Coupled Snow–Soil Models in SURFEXv8 to Simulate the Permafrost Thermal Regime at a High Arctic Site, Geosci. Model Dev., 10, 3461–3479, https://doi.org/10.5194/gmd-10-3461-2017, 2017. a, b, c, d
Bartelt, P. and Lehning, M.: A Physical SNOWPACK Model for the Swiss Avalanche Warning: Part I: Numerical Model, Cold Reg. Sci. Technol., 35, 123–145, https://doi.org/10.1016/S0165-232X(02)00074-5, 2002. a
Bartlett, P. A. and Verseghy, D. L.: Modified Treatment of Intercepted Snow Improves the Simulated Forest Albedo in the Canadian Land Surface Scheme, Hydrol. Process., 29, 3208–3226, https://doi.org/10.1002/hyp.10431, 2015. a
Bartlett, P. A., MacKay, M. D., and Verseghy, D. L.: Modified Snow Algorithms in the Canadian Land Surface Scheme: Model Runs and Sensitivity Analysis at Three Boreal Forest Stands, Atmos.-Ocean, 44, 207–222, https://doi.org/10.3137/ao.440301, 2006. a, b
Bayle, A., Roy, A., Dedieu, J.-P., Boudreau, S., Choler, P., and Lévesque, E.: Two distinct waves of greening in northeastern Canada: summer warming does not tell the whole story, Environ. Res. Lett., 17, 064051, https://doi.org/10.1088/1748-9326/ac74d6, 2022. a, b
Beringer, J., Lynch, A. H., Chapin, F. S., Mack, M., and Bonan, G. B.: The Representation of Arctic Soils in the Land Surface Model: The Importance of Mosses, J. Climate, 14, 3324–3335, https://doi.org/10.1175/1520-0442(2001)014<3324:TROASI>2.0.CO;2, 2001. a
Best, M. J., Pryor, M., Clark, D. B., Rooney, G. G., Essery, R. L. H., Ménard, C. B., Edwards, J. M., Hendry, M. A., Porson, A., Gedney, N., Mercado, L. M., Sitch, S., Blyth, E., Boucher, O., Cox, P. M., Grimmond, C. S. B., and Harding, R. J.: The Joint UK Land Environment Simulator (JULES), Model Description – Part 1: Energy and Water Fluxes, Geosci. Model Dev., 4, 677–699, https://doi.org/10.5194/gmd-4-677-2011, 2011. a
Boike, J., Miesner, F., Bornemann, N., Cable, W. L., and Grünberg, I.: Trail Valley Creek, NWT, Canada Soil Moisture and Temperature 2016 et Seq, PANGAEA [data set], https://doi.org/10.1594/PANGAEA.962726, 2023. a
Bokhorst, S., Pedersen, S. H., Brucker, L., Anisimov, O., Bjerke, J. W., Brown, R. D., Ehrich, D., Essery, R. L. H., Heilig, A., Ingvander, S., Johansson, C., Johansson, M., Jónsdóttir, I. S., Inga, N., Luojus, K., Macelloni, G., Mariash, H., McLennan, D., Rosqvist, G. N., Sato, A., Savela, H., Schneebeli, M., Sokolov, A., Sokratov, S. A., Terzago, S., Vikhamar-Schuler, D., Williamson, S., Qiu, Y., and Callaghan, T. V.: Changing Arctic Snow Cover: A Review of Recent Developments and Assessment of Future Needs for Observations, Modelling, and Impacts, Ambio, 45, 516–537, https://doi.org/10.1007/s13280-016-0770-0, 2016. a
Boone, A. and Etchevers, P.: An Intercomparison of Three Snow Schemes of Varying Complexity Coupled to the Same Land Surface Model: Local-Scale Evaluation at an Alpine Site, J. Hydrometeorol., 2, 374–394, https://doi.org/10.1175/1525-7541(2001)002<0374:AIOTSS>2.0.CO;2, 2001. a
Bring, A., Fedorova, I., Dibike, Y., Hinzman, L., Mård, J., Mernild, S. H., Prowse, T., Semenova, O., Stuefer, S. L., and Woo, M.-K.: Arctic Terrestrial Hydrology: A Synthesis of Processes, Regional Effects, and Research Challenges, J. Geophys. Res.-Biogeo., 121, 621–649, https://doi.org/10.1002/2015JG003131, 2016. a, b, c
Brondex, J., Fourteau, K., Dumont, M., Hagenmuller, P., Calonne, N., Tuzet, F., and Löwe, H.: A Finite-Element Framework to Explore the Numerical Solution of the Coupled Problem of Heat Conduction, Water Vapor Diffusion, and Settlement in Dry Snow (IvoriFEM v0.1.0), Geosci. Model Dev., 16, 7075–7106, https://doi.org/10.5194/gmd-16-7075-2023, 2023. a
Brown, R., Bartlett, P., MacKay, M., and Verseghy, D.: Evaluation of Snow Cover in CLASS for SnowMIP, Atmos.-Ocean, 44, 223–238, https://doi.org/10.3137/ao.440302, 2006. a, b, c, d, e, f, g, h, i, j, k, l
Bruce, J. P. and Clark, R. H.: Introduction to Hydrometeorology, Elsevier Science & Technology, ISBN 978-0-08-011714-0, 1966. a
Burke, E. J., Ekici, A., Huang, Y., Chadburn, S. E., Huntingford, C., Ciais, P., Friedlingstein, P., Peng, S., and Krinner, G.: Quantifying Uncertainties of Permafrost Carbon–Climate Feedbacks, Biogeosciences, 14, 3051–3066, https://doi.org/10.5194/bg-14-3051-2017, 2017. a
Calonne, N., Flin, F., Morin, S., Lesaffre, B., du Roscoat, S. R., and Geindreau, C.: Numerical and Experimental Investigations of the Effective Thermal Conductivity of Snow, Geophys. Res. Lett., 38, L23501, https://doi.org/10.1029/2011GL049234, 2011. a, b, c, d, e, f, g, h, i, j, k, l, m, n, o, p, q, r, s, t
Calonne, N., Milliancourt, L., Burr, A., Philip, A., Martin, C. L., Flin, F., and Geindreau, C.: Thermal Conductivity of Snow, Firn, and Porous Ice From 3-D Image-Based Computations, Geophys. Res. Lett., 46, 13079–13089, https://doi.org/10.1029/2019GL085228, 2019. a
Campbell, J. L. and Laudon, H.: Carbon Response to Changing Winter Conditions in Northern Regions: Current Understanding and Emerging Research Needs, Environ. Rev., 27, 545–566, https://doi.org/10.1139/er-2018-0097, 2019. a
Chadburn, S., Burke, E., Essery, R., Boike, J., Langer, M., Heikenfeld, M., Cox, P., and Friedlingstein, P.: An Improved Representation of Physical Permafrost Dynamics in the JULES Land-Surface Model, Geosci. Model Dev., 8, 1493–1508, https://doi.org/10.5194/gmd-8-1493-2015, 2015. a
Chen, F., Barlage, M., Tewari, M., Rasmussen, R., Jin, J., Lettenmaier, D., Livneh, B., Lin, C., Miguez-Macho, G., Niu, G.-Y., Wen, L., and Yang, Z.-L.: Modeling seasonal snowpack evolution in the complex terrain and forested Colorado Headwaters region: A model intercomparison study, J. Geophys. Res.-Atmos., 119, 13795–13819, https://doi.org/10.1002/2014JD022167, 2014. a
Cohen, J. L., Furtado, J. C., Barlow, M. A., Alexeev, V. A., and Cherry, J. E.: Arctic Warming, Increasing Snow Cover and Widespread Boreal Winter Cooling, Environ. Res. Lett., 7, 014007, https://doi.org/10.1088/1748-9326/7/1/014007, 2012. a
Comyn-Platt, E., Hayman, G., Huntingford, C., Chadburn, S. E., Burke, E. J., Harper, A. B., Collins, W. J., Webber, C. P., Powell, T., Cox, P. M., Gedney, N., and Sitch, S.: Carbon Budgets for 1.5 and 2 °C Targets Lowered by Natural Wetland and Permafrost Feedbacks, Nat. Geosci., 11, 568–573, https://doi.org/10.1038/s41561-018-0174-9, 2018. a
Cook, B. I., Bonan, G. B., Levis, S., and Epstein, H. E.: The Thermoinsulation Effect of Snow Cover within a Climate Model, Clim. Dynam., 31, 107–124, https://doi.org/10.1007/s00382-007-0341-y, 2008. a
Cosby, B. J., Hornberger, G. M., Clapp, R. B., and Ginn, T. R.: A Statistical Exploration of the Relationships of Soil Moisture Characteristics to the Physical Properties of Soils, Water Resour. Res., 20, 682–690, https://doi.org/10.1029/WR020i006p00682, 1984. a
Cristea, N. C., Bennett, A., Nijssen, B., and Lundquist, J. D.: When and Where Are Multiple Snow Layers Important for Simulations of Snow Accumulation and Melt?, Water Resour. Res., 58, e2020WR028993, https://doi.org/10.1029/2020WR028993, 2022. a
Dai, A.: Temperature and pressure dependence of the rain-snow phase transition over land and ocean, Geophys. Res. Lett., 35, https://doi.org/10.1029/2008GL033295, 2008. a
Dai, Y., Zeng, X., Dickinson, R. E., Baker, I., Bonan, G. B., Bosilovich, M. G., Denning, A. S., Dirmeyer, P. A., Houser, P. R., Niu, G., Oleson, K. W., Schlosser, C. A., and Yang, Z.-L.: The Common Land Model, B. Am. Meteorol. Soc., 84, 1013–1024, https://doi.org/10.1175/BAMS-84-8-1013, 2003. a
Damseaux, A., Matthes, H., Dutch, V. R., Wake, L., and Rutter, N.: Impact of Snow Thermal Conductivity Schemes on Pan-Arctic Permafrost Dynamics in the Community Land Model Version 5.0, The Cryosphere, 19, 1539–1558, https://doi.org/10.5194/tc-19-1539-2025, 2025. a
Decharme, B., Brun, E., Boone, A., Delire, C., Le Moigne, P., and Morin, S.: Impacts of Snow and Organic Soils Parameterization on Northern Eurasian Soil Temperature Profiles Simulated by the ISBA Land Surface Model, The Cryosphere, 10, 853–877, https://doi.org/10.5194/tc-10-853-2016, 2016. a
Domine, F., Bock, J., Morin, S., and Giraud, G.: Linking the Effective Thermal Conductivity of Snow to Its Shear Strength and Density, J. Geophys. Res.-Earth, 116, https://doi.org/10.1029/2011JF002000, 2011. a
Domine, F., Barrere, M., Sarrazin, D., Morin, S., and Arnaud, L.: Automatic Monitoring of the Effective Thermal Conductivity of Snow in a Low-Arctic Shrub Tundra, The Cryosphere, 9, 1265–1276, https://doi.org/10.5194/tc-9-1265-2015, 2015. a
Domine, F., Barrere, M., and Sarrazin, D.: Seasonal Evolution of the Effective Thermal Conductivity of the Snow and the Soil in High Arctic Herb Tundra at Bylot Island, Canada, The Cryosphere, 10, 2573–2588, https://doi.org/10.5194/tc-10-2573-2016, 2016. a
Domine, F., Belke-Brea, M., Sarrazin, D., Arnaud, L., Barrere, M., and Poirier, M.: Soil Moisture, Wind Speed and Depth Hoar Formation in the Arctic Snowpack, J. Glaciol., 64, 990–1002, https://doi.org/10.1017/jog.2018.89, 2018a. a
Domine, F., Gauthier, G., Vionnet, V., Fauteux, D., Dumont, M., and Barrere, M.: Snow Physical Properties May Be a Significant Determinant of Lemming Population Dynamics in the High Arctic, Arctic Sci., 4, 813–826, https://doi.org/10.1139/as-2018-0008, 2018b. a
Domine, F., Picard, G., Morin, S., Barrere, M., Madore, J.-B., and Langlois, A.: Major Issues in Simulating Some Arctic Snowpack Properties Using Current Detailed Snow Physics Models: Consequences for the Thermal Regime and Water Budget of Permafrost, J. Adv. Model. Earth Syst., 11, 34–44, https://doi.org/10.1029/2018MS001445, 2019. a, b, c
Domine, F., Lackner, G., Sarrazin, D., Poirier, M., and Belke-Brea, M.: Meteorological, Snow and Soil Data (2013–2019) from a Herb Tundra Permafrost Site at Bylot Island, Canadian High Arctic, for Driving and Testing Snow and Land Surface Models, Earth Syst. Sci. Data, 13, 4331–4348, https://doi.org/10.5194/essd-13-4331-2021, 2021a. a, b, c, d, e, f, g, h, i
Domine, F., Lackner, G., Sarrazin, D., Poirier, M., and Belke-Brea, M.: Meteorological, Snow and Soil Data from Bylot Island, Canadian High Arctic, for Driving and Testing Snow and Land Surface Models, v. 1.100000 (2013–2019), Nordicana D86 [data set], https://doi.org/10.5885/45693CE-02685A5200DD4C38, 2021b. a
Domine, F., Fourteau, K., and Choler, P.: Exploration of Thermal Bridging Through Shrub Branches in Alpine Snow, Geophysi. Res. Lett., 50, e2023GL105100, https://doi.org/10.1029/2023GL105100, 2023. a
Domine, F., Sarrazin, D., Nadeau, D., Lackner, G., and Belke-Brea, M.: Hydrometeorological, Snow and Soil Data from a Low-Arctic Valley in the Forest-Tundra Ecotone in Northern Quebec, PANGAEA [data set], https://doi.org/10.1594/PANGAEA.964743, 2024a. a
Domine, F., Sarrazin, D., Nadeau, D. F., Lackner, G., and Belke-Brea, M.: Meteorological, Snow and Soil Data, CO2, Water and Energy Fluxes from a Low-Arctic Valley of Northern Quebec, Earth Syst. Sci. Data, 16, 1523–1541, https://doi.org/10.5194/essd-16-1523-2024, 2024b. a, b, c, d, e, f
Douville, H., Royer, J. F., and Mahfouf, J. F.: A New Snow Parameterization for the Météo-France Climate Model, Clim. Dynam., 12, 21–35, https://doi.org/10.1007/BF00208760, 1995. a
Dutch, V. R., Rutter, N., Wake, L., Sandells, M., Derksen, C., Walker, B., Hould Gosselin, G., Sonnentag, O., Essery, R., Kelly, R., Marsh, P., King, J., and Boike, J.: Impact of Measured and Simulated Tundra Snowpack Properties on Heat Transfer, The Cryosphere, 16, 4201–4222, https://doi.org/10.5194/tc-16-4201-2022, 2022. a, b, c, d, e, f, g, h, i
Dutra, E., Balsamo, G., Viterbo, P., Miranda, P. M. A., Beljaars, A., Schär, C., and Elder, K.: An Improved Snow Scheme for the ECMWF Land Surface Model: Description and Offline Validation, J. Hydrometeorol., 11, 899–916, https://doi.org/10.1175/2010JHM1249.1, 2010. a
Ekici, A., Beer, C., Hagemann, S., Boike, J., Langer, M., and Hauck, C.: Simulating High-Latitude Permafrost Regions by the JSBACH Terrestrial Ecosystem Model, Geosci. Model Dev., 7, 631–647, https://doi.org/10.5194/gmd-7-631-2014, 2014. a
Essery, R., Morin, S., Lejeune, Y., and Ménard, C. B.: A Comparison of 1701 Snow Models Using Observations from an Alpine Site, Adv. Water Resour., 55, 131–148, https://doi.org/10.1016/J.ADVWATRES.2012.07.013, 2013. a, b
Essery, R., Kontu, A., Lemmetyinen, J., Dumont, M., and Ménard, C. B.: A 7-Year Dataset for Driving and Evaluating Snow Models at an Arctic Site (Sodankylä, Finland), Geoscientific Instrumentation, Meth. Data Syst., 5, 219–227, https://doi.org/10.5194/gi-5-219-2016, 2016. a, b
Etchevers, P., Martin, E., Brown, R., Fierz, C., Lejeune, Y., Bazile, E., Boone, A., Dai, Y.-J., Essery, R., Fernandez, A., Gusev, Y., Jordan, R., Koren, V., Kowalczyk, E., Nasonova, N. O., Pyles, R. D., Schlosser, A., Shmakin, A. B., Smirnova, T. G., Strasser, U., Verseghy, D., Yamazaki, T., and Yang, Z.-L.: Validation of the Energy Budget of an Alpine Snowpack Simulated by Several Snow Models (Snow MIP Project), Ann. Glaciol., 38, 150–158, https://doi.org/10.3189/172756404781814825, 2004. a, b
Eyring, V., Bony, S., Meehl, G. A., Senior, C. A., Stevens, B., Stouffer, R. J., and Taylor, K. E.: Overview of the Coupled Model Intercomparison Project Phase 6 (CMIP6) Experimental Design and Organization, Geosci. Model Dev., 9, 1937–1958, https://doi.org/10.5194/gmd-9-1937-2016, 2016. a
Feiccabrino, J., Graff, W., Lundberg, A., Sandström, N., and Gustafsson, D.: Meteorological Knowledge Useful for the Improvement of Snow Rain Separation in Surface Based Models, Hydrology, 2, 266–288, https://doi.org/10.3390/hydrology2040266, 2015. a
Fierz, C.: Temperature Profile of Snowpack, in: Encyclopedia of Snow, Ice and Glaciers, edited by: Singh, V. P., Singh, P., and Haritashya, U. K., Springer Netherlands, Dordrecht, 1151–1154, ISBN 978-90-481-2642-2, https://doi.org/10.1007/978-90-481-2642-2_569, 2011. a
Flanner, M. G., Shell, K. M., Barlage, M., Perovich, D. K., and Tschudi, M. A.: Radiative Forcing and Albedo Feedback from the Northern Hemisphere Cryosphere between 1979 and 2008, Nat. Geosci., 4, 151–155, https://doi.org/10.1038/ngeo1062, 2011. a
Fourteau, K., Domine, F., and Hagenmuller, P.: Impact of Water Vapor Diffusion and Latent Heat on the Effective Thermal Conductivity of Snow, The Cryosphere, 15, 2739–2755, https://doi.org/10.5194/tc-15-2739-2021, 2021. a
Fourteau, K., Hagenmuller, P., Roulle, J., and Domine, F.: On the Use of Heated Needle Probes for Measuring Snow Thermal Conductivity, J. Glaciol., 68, 705–719, https://doi.org/10.1017/jog.2021.127, 2022. a, b, c
Friedlingstein, P., O'Sullivan, M., Jones, M. W., Andrew, R. M., Bakker, D. C. E., Hauck, J., Landschützer, P., Le Quéré, C., Luijkx, I. T., Peters, G. P., Peters, W., Pongratz, J., Schwingshackl, C., Sitch, S., Canadell, J. G., Ciais, P., Jackson, R. B., Alin, S. R., Anthoni, P., Barbero, L., Bates, N. R., Becker, M., Bellouin, N., Decharme, B., Bopp, L., Brasika, I. B. M., Cadule, P., Chamberlain, M. A., Chandra, N., Chau, T.-T.-T., Chevallier, F., Chini, L. P., Cronin, M., Dou, X., Enyo, K., Evans, W., Falk, S., Feely, R. A., Feng, L., Ford, D. J., Gasser, T., Ghattas, J., Gkritzalis, T., Grassi, G., Gregor, L., Gruber, N., Gürses, Ö., Harris, I., Hefner, M., Heinke, J., Houghton, R. A., Hurtt, G. C., Iida, Y., Ilyina, T., Jacobson, A. R., Jain, A., Jarníková, T., Jersild, A., Jiang, F., Jin, Z., Joos, F., Kato, E., Keeling, R. F., Kennedy, D., Klein Goldewijk, K., Knauer, J., Korsbakken, J. I., Körtzinger, A., Lan, X., Lefèvre, N., Li, H., Liu, J., Liu, Z., Ma, L., Marland, G., Mayot, N., McGuire, P. C., McKinley, G. A., Meyer, G., Morgan, E. J., Munro, D. R., Nakaoka, S.-I., Niwa, Y., O'Brien, K. M., Olsen, A., Omar, A. M., Ono, T., Paulsen, M., Pierrot, D., Pocock, K., Poulter, B., Powis, C. M., Rehder, G., Resplandy, L., Robertson, E., Rödenbeck, C., Rosan, T. M., Schwinger, J., Séférian, R., Smallman, T. L., Smith, S. M., Sospedra-Alfonso, R., Sun, Q., Sutton, A. J., Sweeney, C., Takao, S., Tans, P. P., Tian, H., Tilbrook, B., Tsujino, H., Tubiello, F., van der Werf, G. R., van Ooijen, E., Wanninkhof, R., Watanabe, M., Wimart-Rousseau, C., Yang, D., Yang, X., Yuan, W., Yue, X., Zaehle, S., Zeng, J., and Zheng, B.: Global Carbon Budget 2023, Earth Syst. Sci. Data, 15, 5301–5369, https://doi.org/10.5194/essd-15-5301-2023, 2023. a, b
Gaillard, M., Vionnet, V., Lafaysse, M., Dumont, M., and Ginoux, P.: Improving Large-Scale Snow Albedo Modeling Using a Climatology of Light-Absorbing Particle Deposition, The Cryosphere, 19, 769–792, https://doi.org/10.5194/tc-19-769-2025, 2025. a
Genthon, C., Six, D., Favier, V., Lazzara, M., and Keller, L.: Atmospheric Temperature Measurement Biases on the Antarctic Plateau, J. Atmos. Ocean Tech., 28, 1598–1605, https://doi.org/10.1175/JTECH-D-11-00095.1, 2011. a
Georges, C. and Kaser, G.: Ventilated and Unventilated Air Temperature Measurements for Glacier-Climate Studies on a Tropical High Mountain Site, J. Geophys. Res.-Atmos., 107, ACL 15-1–ACL 15-10, https://doi.org/10.1029/2002JD002503, 2002. a
Gordon, M., Simon, K., and Taylor, P. A.: On Snow Depth Predictions with the Canadian Land Surface Scheme Including a Parametrization of Blowing Snow Sublimation, Atmos.-Ocean, 44, 239–255, https://doi.org/10.3137/ao.440303, 2006. a, b
Gornall, J. L., Jónsdóttir, I. S., Woodin, S. J., and Van der Wal, R.: Arctic Mosses Govern Below-Ground Environment and Ecosystem Processes, Oecologia, 153, 931–941, https://doi.org/10.1007/s00442-007-0785-0, 2007. a
Gouttevin, I., Menegoz, M., Dominé, F., Krinner, G., Koven, C., Ciais, P., Tarnocai, C., and Boike, J.: How the Insulating Properties of Snow Affect Soil Carbon Distribution in the Continental Pan-Arctic Area, J. Geophys. Res.-Biogeo., 117, G02020, https://doi.org/10.1029/2011JG001916, 2012. a
Gouttevin, I., Langer, M., Löwe, H., Boike, J., Proksch, M., and Schneebeli, M.: Observation and Modelling of Snow at a Polygonal Tundra Permafrost Site: Spatial Variability and Thermal Implications, The Cryosphere, 12, 3693–3717, https://doi.org/10.5194/tc-12-3693-2018, 2018. a, b, c, d, e, f
Groffman, P. M., Driscoll, C. T., Fahey, T. J., Hardy, J. P., Fitzhugh, R. D., and Tierney, G. L.: Colder Soils in a Warmer World: A Snow Manipulation Study in a Northern Hardwood Forest Ecosystem, Biogeochemistry, 56, 135–150, 2001. a
Harder, P. and Pomeroy, J. W.: Hydrological model uncertainty due to precipitation-phase partitioning methods, Hydrol. Process., 28, 4311–4327, https://doi.org/10.1002/hyp.10214, 2014. a
Hedstrom, N. R. and Pomeroy, J. W.: Measurements and Modelling of Snow Interception in the Boreal Forest, Hydrol. Process., 12, 1611–1625, https://doi.org/10.1002/(SICI)1099-1085(199808/09)12:10/11<1611::AID-HYP684>3.0.CO;2-4, 1998. a
Hengl, T., de Jesus, J. M., Heuvelink, G. B. M., Gonzalez, M. R., Kilibarda, M., Blagotić, A., Shangguan, W., Wright, M. N., Geng, X., Bauer-Marschallinger, B., Guevara, M. A., Vargas, R., MacMillan, R. A., Batjes, N. H., Leenaars, J. G. B., Ribeiro, E., Wheeler, I., Mantel, S., and Kempen, B.: SoilGrids250m: Global Gridded Soil Information Based on Machine Learning, PLOS ONE, 12, e0169748, https://doi.org/10.1371/journal.pone.0169748, 2017. a, b
Huwald, H., Higgins, C. W., Boldi, M.-O., Bou-Zeid, E., Lehning, M., and Parlange, M. B.: Albedo Effect on Radiative Errors in Air Temperature Measurements, Water Resour. Res., 45, https://doi.org/10.1029/2008WR007600, 2009. a
IPCC: Summary for Policymakers, in: Climate Change 2021: The Physical Science Basis, in: Contribution of Working Group I to the Sixth Assessment Report of the Intergovernmental Panel on Climate Change, Cambridge University Press, Cambridge, UK and New York, NY, USA, 3–32, https://doi.org/10.1017/9781009157896.001, 2021. a
Jafari, M., Gouttevin, I., Couttet, M., Wever, N., Michel, A., Sharma, V., Rossmann, L., Maass, N., Nicolaus, M., and Lehning, M.: The Impact of Diffusive Water Vapor Transport on Snow Profiles in Deep and Shallow Snow Covers and on Sea Ice, Front. Earth Sci., 8, 249, https://doi.org/10.3389/feart.2020.00249, 2020. a
Jafari, M., Sharma, V., and Lehning, M.: Convection of Water Vapour in Snowpacks, J. Fluid Mech., 934, A38, https://doi.org/10.1017/jfm.2021.1146, 2022. a
Jennings, K. S. and Molotch, N. P.: The Sensitivity of Modeled Snow Accumulation and Melt to Precipitation Phase Methods across a Climatic Gradient, Hydrol. Earth Syst. Sci., 23, 3765–3786, https://doi.org/10.5194/hess-23-3765-2019, 2019. a
Jennings, K. S., Winchell, T. S., Livneh, B., and Molotch, N. P.: Spatial Variation of the Rain-Snow Temperature Threshold across the Northern Hemisphere, Nat. Commun., 9, 1–9, https://doi.org/10.1038/s41467-018-03629-7, 2018. a
Jordan, R. E., Andreas, E. L., and Makshtas, A. P.: Heat Budget of Snow-Covered Sea Ice at North Pole 4, J. Geophys. Res.-Oceans, 104, 7785–7806, https://doi.org/10.1029/1999JC900011, 1999. a
King, J. C.: Some Measurements of Turbulence over an Antarctic Ice Shelf, Q. J. Roy. Meteorol. Soc., 116, 379–400, https://doi.org/10.1002/qj.49711649208, 1990. a
Krinner, G., Derksen, C., Essery, R., Flanner, M., Hagemann, S., Clark, M., Hall, A., Rott, H., Brutel-Vuilmet, C., Kim, H., Ménard, C. B., Mudryk, L., Thackeray, C., Wang, L., Arduini, G., Balsamo, G., Bartlett, P., Boike, J., Boone, A., Chéruy, F., Colin, J., Cuntz, M., Dai, Y., Decharme, B., Derry, J., Ducharne, A., Dutra, E., Fang, X., Fierz, C., Ghattas, J., Gusev, Y., Haverd, V., Kontu, A., Lafaysse, M., Law, R., Lawrence, D., Li, W., Marke, T., Marks, D., Ménégoz, M., Nasonova, O., Nitta, T., Niwano, M., Pomeroy, J., Raleigh, M. S., Schaedler, G., Semenov, V., Smirnova, T. G., Stacke, T., Strasser, U., Svenson, S., Turkov, D., Wang, T., Wever, N., Yuan, H., Zhou, W., and Zhu, D.: ESM-SnowMIP: Assessing Snow Models and Quantifying Snow-Related Climate Feedbacks, Geosci. Model Dev., 11, 5027–5049, https://doi.org/10.5194/gmd-11-5027-2018, 2018. a, b, c, d, e
Lackner, G., Domine, F., Sarrazin, D., Nadeau, D., and Belke-Brea, M.: Hydrometeorological, Snow and Soil Data from a Low-Arctic Valley in the Forest-Tundra Ecotone in Northern Quebec, PANGAEA [data set], https://doi.org/10.1594/PANGAEA.946538, 2022. a, b, c, d, e
Lalande, M.: SnowC2-CLASSIC-1D-analysis: Analysis and Figure-Generation Code, Zenodo [code], https://doi.org/10.5281/zenodo.18154778, 2026a. a
Lalande, M.: SnowC2-CLASSIC-1D: Model Configuration, Forcing Data, and Simulation Outputs, Zenodo [data set], https://doi.org/10.5281/zenodo.18175771, 2026b. a
Lalande, M., Ménégoz, M., Krinner, G., Ottlé, C., and Cheruy, F.: Improving Climate Model Skill over High Mountain Asia by Adapting Snow Cover Parameterization to Complex-Topography Areas, The Cryosphere, 17, 5095–5130, https://doi.org/10.5194/tc-17-5095-2023, 2023. a, b
Landry, C. C., Buck, K. A., Raleigh, M. S., and Clark, M. P.: Mountain System Monitoring at Senator Beck Basin, San Juan Mountains, Colorado: A New Integrative Data Source to Develop and Evaluate Models of Snow and Hydrologic Processes, Water Resour. Res., 50, 1773–1788, https://doi.org/10.1002/2013WR013711, 2014. a, b
Langlois, A., Bergeron, J., Brown, R., Royer, A., Harvey, R., Roy, A., Wang, L., and Thériault, N.: Evaluation of CLASS 2.7 and 3.5 Simulations of Snow Properties from the Canadian Regional Climate Model (CRCM4) over Québec, Canada, J. Hydrometeorol., 15, 1325–1343, https://doi.org/10.1175/JHM-D-13-055.1, 2014. a
Lehning, M., Bartelt, P., Brown, B., and Fierz, C.: A Physical SNOWPACK Model for the Swiss Avalanche Warning: Part III: Meteorological Forcing, Thin Layer Formation and Evaluation, Cold Reg. Sci. Technol., 35, 169–184, https://doi.org/10.1016/S0165-232X(02)00072-1, 2002a. a
Lehning, M., Bartelt, P., Brown, B., Fierz, C., and Satyawali, P.: A Physical SNOWPACK Model for the Swiss Avalanche Warning: Part II. Snow Microstructure, Cold Reg. Sci. Technol., 35, 147–167, https://doi.org/10.1016/S0165-232X(02)00073-3, 2002b. a, b
Lejeune, Y., Dumont, M., Panel, J.-M., Lafaysse, M., Lapalus, P., Le Gac, E., Lesaffre, B., and Morin, S.: 57 Years (1960–2017) of Snow and Meteorological Observations from a Mid-Altitude Mountain Site (Col de Porte, France, 1325 m of Altitude), Earth Syst. Sci. Data, 11, 71–88, https://doi.org/10.5194/essd-11-71-2019, 2019. a, b, c, d, e, f, g, h
Lemke, P., Ren, J., Alley, R., Allison, I., Carrasco, J., Flato, G., Fujii, Y., Kaser, G., Mote, P., Thomas, R., and Zhang, T.: Observations: Changes in Snow, Ice and Frozen Ground, in: Climate Change 2007: The Physical Science Basis, Contribution of Working Group I to the Fourth Assessment Report of the Intergovernmental Panel on Climate Change, edited by: Solomon, S., Qin, D., Manning, M., Chen, Z., Marquis, M., Averyt, K. B., Tignor, M., and Miller, H. L., Cambridge University Press, Cambridge, UK and New York, NY, USA, ISBN 978-0-521-70596-7, 2007. a
Letts, M. G., Roulet, N. T., Comer, N. T., Skarupa, M. R., and Verseghy, D. L.: Parametrization of Peatland Hydraulic Properties for the Canadian Land Surface Scheme, Atmos.-Ocean, 38, 141–160, https://doi.org/10.1080/07055900.2000.9649643, 2000. a
Lin, T.-S., He, C., Abolafia-Rosenzweig, R., Chen, F., Wang, W., Barlage, M., and Gochis, D.: Improved Snow Albedo Evolution in Noah-MP Land Surface Model Coupled with a Physical Snowpack Radiative Transfer Scheme, J. Hydrometeorol., 26, 185–200, https://doi.org/10.1175/JHM-D-24-0082.1, 2025. a
Liston, G. E. and Hiemstra, C. A.: The Changing Cryosphere: Pan-Arctic Snow Trends (1979–2009), J. Climate, 24, 5691–5712, https://doi.org/10.1175/JCLI-D-11-00081.1, 2011. a
Liston, G. E., Haehnel, R. B., Sturm, M., Hiemstra, C. A., Berezovskaya, S., and Tabler, R. D.: Simulating Complex Snow Distributions in Windy Environments Using SnowTran-3D, J. Glaciol., 53, 241–256, https://doi.org/10.3189/172756507782202865, 2007. a, b
Liston, G. E., Itkin, P., Stroeve, J., Tschudi, M., Stewart, J. S., Pedersen, S. H., Reinking, A. K., and Elder, K.: A Lagrangian Snow-Evolution System for Sea-Ice Applications (SnowModel-LG): Part I – Model Description, J. Geophys. Res.-Oceans, 125, e2019JC015913, https://doi.org/10.1029/2019JC015913, 2020. a
Loth, B., Graf, H.-F., and Oberhuber, J. M.: Snow Cover Model for Global Climate Simulations, J. Geophys. Res., 98, 10451, https://doi.org/10.1029/93JD00324, 1993. a
Löwe, H., Riche, F., and Schneebeli, M.: A general treatment of snow microstructure exemplified by an improved relation for thermal conductivity, The Cryosphere, 7, 1473–1480, https://doi.org/10.5194/tc-7-1473-2013, 2013. a, b
Lynch-Stieglitz, M.: The Development and Validation of a Simple Snow Model for the GISS GCM, J. Climate, 7, 1842–1855, https://doi.org/10.1175/1520-0442(1994)007<1842:TDAVOA>2.0.CO;2, 1994. a
Magnusson, J., Wever, N., Essery, R., Helbig, N., Winstral, A., and Jonas, T.: Evaluating Snow Models with Varying Process Representations for Hydrological Applications, Water Resourc. Res., 51, 2707–2723, https://doi.org/10.1002/2014WR016498, 2015. a
Manabe, S.: climate and the Ocean circulation: I. The atmospheric circulation and the hydrology of the Earth's surface, Mon. Weather Rev., 97, 739–774, https://doi.org/10.1175/1520-0493(1969)097<0739:CATOC>2.3.CO;2, 1969. a
Marsh, P. and Woo, M.-K.: Wetting Front Advance and Freezing of Meltwater within a Snow Cover: 1. Observations in the Canadian Arctic, Water Resour. Res., 20, 1853–1864, https://doi.org/10.1029/WR020i012p01853, 1984. a
Martin, E. and Lejeune, Y.: Turbulent Fluxes above the Snow Surface, Ann. Glaciol., 26, 179–183, https://doi.org/10.3189/1998AoG26-1-179-183, 1998. a
Mavrovic, A., Sonnentag, O., Lemmetyinen, J., Voigt, C., Rutter, N., Mann, P., Sylvain, J.-D., and Roy, A.: Environmental Controls of Winter Soil Carbon Dioxide Fluxes in Boreal and Tundra Environments, Biogeosciences, 20, 5087–5108, https://doi.org/10.5194/bg-20-5087-2023, 2023. a, b
Mavrovic, A., Sonnentag, O., Voigt, C., Lemmetyinen, J., Aurela, M., and Roy, A.: Winter Methane Fluxes Over Boreal and Arctic Environments, Geophys. Res. Lett., 52, e2025GL118367, https://doi.org/10.1029/2025GL118367, 2025. a
McGuire, A. D., Christensen, T. R., Hayes, D., Heroult, A., Euskirchen, E., Kimball, J. S., Koven, C., Lafleur, P., Miller, P. A., Oechel, W., Peylin, P., Williams, M., and Yi, Y.: An Assessment of the Carbon Balance of Arctic Tundra: Comparisons among Observations, Process Models, and Atmospheric Inversions, Biogeosciences, 9, 3185–3204, https://doi.org/10.5194/bg-9-3185-2012, 2012. a
Melton, J. R. and Arora, V. K.: Competition between Plant Functional Types in the Canadian Terrestrial Ecosystem Model (CTEM) v. 2.0, Geosci. Model Dev., 9, 323–361, https://doi.org/10.5194/gmd-9-323-2016, 2016. a
Melton, J. R., Arora, V. K., Wisernig-Cojoc, E., Seiler, C., Fortier, M., Chan, E., and Teckentrup, L.: CLASSIC v1.0: The Open-Source Community Successor to the Canadian Land Surface Scheme (CLASS) and the Canadian Terrestrial Ecosystem Model (CTEM) – Part 1: Model Framework and Site-Level Performance, Geosci. Model Dev., 13, 2825–2850, https://doi.org/10.5194/gmd-13-2825-2020, 2020. a, b, c, d
Menard, C. and Essery, R.: ESM-SnowMIP Meteorological and Evaluation Datasets at Ten Reference Sites (in Situ and Bias Corrected Reanalysis Data), PANGAEA [data set], https://doi.org/10.1594/PANGAEA.897575, 2019. a, b
Ménard, C. B., Essery, R., Pomeroy, J., Marsh, P., and Clark, D. B.: A Shrub Bending Model to Calculate the Albedo of Shrub-Tundra, Hydrol. Process., 28, 341–351, https://doi.org/10.1002/hyp.9582, 2014. a
Ménard, C. B., Essery, R., Barr, A., Bartlett, P., Derry, J., Dumont, M., Fierz, C., Kim, H., Kontu, A., Lejeune, Y., Marks, D., Niwano, M., Raleigh, M., Wang, L., and Wever, N.: Meteorological and Evaluation Datasets for Snow Modelling at 10 Reference Sites: Description of in Situ and Bias-Corrected Reanalysis Data, Earth Syst. Sci. Data, 11, 865–880, https://doi.org/10.5194/essd-11-865-2019, 2019. a, b, c
Menard, C. B., Essery, R., Krinner, G., Arduini, G., Bartlett, P., Boone, A., Brutel-Vuilmet, C., Burke, E., Cuntz, M., Dai, Y., Decharme, B., Dutra, E., Fang, X., Fierz, C., Gusev, Y., Hagemann, S., Haverd, V., Kim, H., Lafaysse, M., Marke, T., Nasonova, O., Nitta, T., Niwano, M., Pomeroy, J., Schädler, G., Semenov, V. A., Smirnova, T., Strasser, U., Swenson, S., Turkov, D., Wever, N., and Yuan, H.: Scientific and Human Errors in a Snow Model Intercomparison, B. Am. Meteorol. Soc., 102, E61–E79, https://doi.org/10.1175/BAMS-D-19-0329.1, 2021. a, b, c, d, e, f
Ménégoz, M., Krinner, G., Balkanski, Y., Boucher, O., Cozic, A., Lim, S., Ginot, P., Laj, P., Gallée, H., Wagnon, P., Marinoni, A., and Jacobi, H. W.: Snow Cover Sensitivity to Black Carbon Deposition in the Himalayas: From Atmospheric and Ice Core Measurements to Regional Climate Simulations, Atmos. Chem. Phys., 14, 4237–4249, https://doi.org/10.5194/acp-14-4237-2014, 2014. a
Meyer, G., Humphreys, E. R., Melton, J. R., Cannon, A. J., and Lafleur, P. M.: Simulating Shrubs and Their Energy and Carbon Dioxide Fluxes in Canada's Low Arctic with the Canadian Land Surface Scheme Including Biogeochemical Cycles (CLASSIC), Biogeosciences, 18, 3263–3283, https://doi.org/10.5194/bg-18-3263-2021, 2021. a, b
Miner, K. R., Turetsky, M. R., Malina, E., Bartsch, A., Tamminen, J., McGuire, A. D., Fix, A., Sweeney, C., Elder, C. D., and Miller, C. E.: Permafrost Carbon Emissions in a Changing Arctic, Nat. Rev. Earth Environ., 3, 55–67, https://doi.org/10.1038/s43017-021-00230-3, 2022. a
Mohammadzadeh Khani, H.: Sensitivity of the Snow Cover and the Active Layer to Landscape Spatial Heterogeneity and Climate Change over a Canadian High Arctic Tundra Environment = Sensibilité de La Couverture de Neige et de La Couche Active à l'hétérogénéité Spatiale Du Paysage et Aux Changements Climatiques Sur Un Environnement Canadien de Toundra Dans Le Haut Arctique, PhD thesis, Université du Québec à Montréal, Université du Québec à Trois-Rivières, Montréal, Trois-Rivières, https://depot-e.uqtr.ca/id/eprint/11208 (last access: 6 October 2026), 2024. a
Mohammadzadeh Khani, H., Kinnard, C., and Lévesque, E.: Historical Trends and Projections of Snow Cover over the High Arctic: A Review, Water, 14, 587, https://doi.org/10.3390/w14040587, 2022. a
Mohammadzadeh Khani, H., Kinnard, C., Gascoin, S., and Lévesque, E.: Fine-Scale Environment Control on Ground Surface Temperature and Thaw Depth in a High Arctic Tundra Landscape, Permafrost Periglac. Process., 34, 467–480, https://doi.org/10.1002/ppp.2203, 2023. a
Morin, S., Lejeune, Y., Lesaffre, B., Panel, J.-M., Poncet, D., David, P., and Sudul, M.: An 18-Yr Long (1993–2011) Snow and Meteorological Dataset from a Mid-Altitude Mountain Site (Col de Porte, France, 1325 m Alt.) for Driving and Evaluating Snowpack Models, Earth System Science Data, 4, 13–21, https://doi.org/10.5194/essd-4-13-2012, 2012. a, b
Morino, S., Kurita, N., Hirasawa, N., Motoyama, H., Sugiura, K., Lazzara, M., Mikolajczyk, D., Welhouse, L., Keller, L., and Weidner, G.: Comparison of Ventilated and Unventilated Air Temperature Measurements in Inland Dronning Maud Land on the East Antarctic Plateau, J. Atmos. Ocean Tech., 38, 2061–2070, https://doi.org/10.1175/JTECH-D-21-0107.1, 2021. a
Morris, E. M., Anderson, P. S., Bader, H.-P., Weilnmann, P., and Blight, C.: Modelling mass and energy exchange over polar snow using the DAISY model, in: Snow and ice covers: interactions with the atmosphere and ecosystems, edited by: Jones, H. G., Davies, T. D., Ohmura, A., and Morris, E. M., Proceedings of Yokohama Symposium J2 and J5, July 1993, Wallingford, IAHS Publication 223, International Association of Hydrological Sciences, 53–60, ISBN 0-947571-14-0, 1994. a
Mudryk, L., Santolaria-Otín, M., Krinner, G., Ménégoz, M., Derksen, C., Brutel-Vuilmet, C., Brady, M., and Essery, R.: Historical Northern Hemisphere Snow Cover Trends and Projected Changes in the CMIP6 Multi-Model Ensemble, The Cryosphere, 14, 2495–2514, https://doi.org/10.5194/tc-14-2495-2020, 2020. a, b
Mudryk, L. R., Derksen, C., Howell, S., Laliberté, F., Thackeray, C., Sospedra-Alfonso, R., Vionnet, V., Kushner, P. J., and Brown, R.: Canadian Snow and Sea Ice: Historical Trends and Projections, The Cryosphere, 12, 1157–1176, https://doi.org/10.5194/tc-12-1157-2018, 2018. a
Myers-Smith, I. H., Forbes, B. C., Wilmking, M., Hallinger, M., Lantz, T., Blok, D., Tape, K. D., Macias-Fauria, M., Sass-Klaassen, U., Lévesque, E., Boudreau, S., Ropars, P., Hermanutz, L., Trant, A., Collier, L. S., Weijers, S., Rozema, J., Rayback, S. A., Schmidt, N. M., Schaepman-Strub, G., Wipf, S., Rixen, C., Ménard, C. B., Venn, S., Goetz, S., Andreu-Hayles, L., Elmendorf, S., Ravolainen, V., Welker, J., Grogan, P., Epstein, H. E., and Hik, D. S.: Shrub expansion in tundra ecosystems: dynamics, impacts and research priorities, Environ. Research Lett., 6, 045509, https://doi.org/10.1088/1748-9326/6/4/045509, 2011. a
Natali, S. M., Watts, J. D., Rogers, B. M., Potter, S., Ludwig, S. M., Selbmann, A.-k., Sullivan, P. F., Abbott, B. W., Arndt, K. A., Birch, L., Björkman, M. P., Bloom, A. A., Celis, G., Christensen, T. R., Christiansen, C. T., Commane, R., Cooper, E. J., Crill, P., Czimczik, C., Davydov, S., Du, J., Egan, J. E., Elberling, B., Euskirchen, E. S., Friborg, T., Genet, H., Göckede, M., Goodrich, J. P., Grogan, P., Helbig, M., Jafarov, E. E., Jastrow, J. D., Kalhori, A. A. M., Kim, Y., Kimball, J. S., Kutzbach, L., Lara, M. J., Larsen, K. S., Lee, B.-y., Liu, Z., Loranty, M. M., Lund, M., Lupascu, M., Madani, N., Malhotra, A., Matamala, R., McFarland, J., McGuire, A. D., Michelsen, A., Minions, C., Oechel, W. C., Olefeldt, D., Parmentier, F.-J. W., Pirk, N., Poulter, B., Quinton, W., Rezanezhad, F., Risk, D., Sachs, T., Schaefer, K., Schmidt, N. M., Schuur, E. A. G., Semenchuk, P. R., Shaver, G., Sonnentag, O., Starr, G., Treat, C. C., Waldrop, M. P., Wang, Y., Welker, J., Wille, C., Xu, X., Zhang, Z., Zhuang, Q., and Zona, D.: Large Loss of CO2 in Winter Observed across the Northern Permafrost Region, Nat. Clim. Change, 9, 852–857, https://doi.org/10.1038/s41558-019-0592-8, 2019. a, b
Niu, G.-Y. and Yang, Z.-L.: An Observation-Based Formulation of Snow Cover Fraction and Its Evaluation over Large North American River Basins, J. Geophys. Res., 112, D21101, https://doi.org/10.1029/2007JD008674, 2007. a
Niwano, M., Aoki, T., Kuchiki, K., Hosaka, M., and Kodama, Y.: Snow Metamorphism and Albedo Process (SMAP) Model for Climate Studies: Model Validation Using Meteorological and Snow Impurity Data Measured at Sapporo, Japan, J. Geophys. Res.-Earth, 117, F03008, https://doi.org/10.1029/2011JF002239, 2012. a, b, c
Painter, T. H., Skiles, S. M., Deems, J. S., Bryant, A. C., and Landry, C. C.: Dust radiative forcing in snow of the Upper Colorado River Basin: 1. A 6 year record of energy balance, radiation, and dust concentrations, Water Resour. Res., 48, https://doi.org/10.1029/2012WR011985, 2012. a
Pan, X., Yang, D., Li, Y., Barr, A., Helgason, W., Hayashi, M., Marsh, P., Pomeroy, J., and Janowicz, R. J.: Bias Corrections of Precipitation Measurements across Experimental Sites in Different Ecoclimatic Regions of Western Canada, The Cryosphere, 10, 2347–2360, https://doi.org/10.5194/tc-10-2347-2016, 2016. a, b, c
Park, H., Fedorov, A. N., Zheleznyak, M. N., Konstantinov, P. Y., and Walsh, J. E.: Effect of Snow Cover on Pan-Arctic Permafrost Thermal Regimes, Clim. Dynam., 44, 2873–2895, https://doi.org/10.1007/s00382-014-2356-5, 2015. a
Pedersen, S. H., Bentzen, T. W., Reinking, A. K., Liston, G. E., Elder, K., Lenart, E. A., Prichard, A. K., and Welker, J. M.: Quantifying Effects of Snow Depth on Caribou Winter Range Selection and Movement in Arctic Alaska, Move. Ecol., 9, 48, https://doi.org/10.1186/s40462-021-00276-4, 2021. a
Picard, G., Arnaud, L., Panel, J.-M., and Morin, S.: Design of a scanning laser meter for monitoring the spatio-temporal evolution of snow depth and its application in the Alps and in Antarctica, The Cryosphere, 10, 1495–1511, https://doi.org/10.5194/tc-10-1495-2016, 2016. a
Pomeroy, J. and Gray, D.: Snowcover: Accumulation, Relocation, and Management, in: vol. 7 of NHRI Science Report, NHRI, ISBN 0-660-15816-7, 1995. a, b
Pomeroy, J., Gray, D., and Landine, P.: The Prairie Blowing Snow Model: Characteristics, Validation, Operation, J. Hydrol., 144, 165–192, https://doi.org/10.1016/0022-1694(93)90171-5, 1993. a
Pomeroy, J. W., Gray, D. M., Shook, K. R., Toth, B., Essery, R. L. H., Pietroniro, A., and Hedstrom, N.: An Evaluation of Snow Accumulation and Ablation Processes for Land Surface Modelling, Hydrol. Process., 12, 2339–2367, https://doi.org/10.1002/(SICI)1099-1085(199812)12:15<2339::AID-HYP800>3.0.CO;2-L, 1998. a
Pulliainen, J., Aurela, M., Laurila, T., Aalto, T., Takala, M., Salminen, M., Kulmala, M., Barr, A., Heimann, M., Lindroth, A., Laaksonen, A., Derksen, C., Mäkelä, A., Markkanen, T., Lemmetyinen, J., Susiluoto, J., Dengel, S., Mammarella, I., Tuovinen, J.-P., and Vesala, T.: Early Snowmelt Significantly Enhances Boreal Springtime Carbon Uptake, P. Natl. Acad. Sci. USA, 114, 11081–11086, https://doi.org/10.1073/pnas.1707889114, 2017. a
Pulliainen, J., Luojus, K., Derksen, C., Mudryk, L., Lemmetyinen, J., Salminen, M., Ikonen, J., Takala, M., Cohen, J., Smolander, T., and Norberg, J.: Patterns and Trends of Northern Hemisphere Snow Mass from 1980 to 2018, Nature, 581, 294–298, https://doi.org/10.1038/s41586-020-2258-0, 2020. a
Rantanen, M., Karpechko, A. Y., Lipponen, A., Nordling, K., Hyvärinen, O., Ruosteenoja, K., Vihma, T., and Laaksonen, A.: The Arctic Has Warmed Nearly Four Times Faster than the Globe since 1979, Commun. Earth Environ., 3, 168, https://doi.org/10.1038/s43247-022-00498-3, 2022. a
Reba, M. L., Marks, D., Seyfried, M., Winstral, A., Kumar, M., and Flerchinger, G.: A Long-Term Data Set for Hydrologic Modeling in a Snow-Dominated Mountain Catchment, Water Resour. Res., 47, W07702, https://doi.org/10.1029/2010WR010030, 2011. a
Réveillet, M., Dumont, M., Gascoin, S., Lafaysse, M., Nabat, P., Ribes, A., Nheili, R., Tuzet, F., Ménégoz, M., Morin, S., Picard, G., and Ginoux, P.: Black Carbon and Dust Alter the Response of Mountain Snow Cover under Climate Change, Nat. Commun., 13, 5279, https://doi.org/10.1038/s41467-022-32501-y, 2022. a
Robinson, D. and Frei, A.: Seasonal Variability of Northern Hemisphere Snow Extent Using Visible Satellite Data, Profess. Geogr., 52, 307–315, https://doi.org/10.1111/0033-0124.00226, 2000. a
Royer, A., Domine, F., Roy, A., Langlois, A., Marchand, N., and Davesne, G.: New Northern Snowpack Classification Linked to Vegetation Cover on a Latitudinal Mega-Transect across Northeastern Canada, Écoscience, 28, 225–242, https://doi.org/10.1080/11956860.2021.1898775, 2021a. a, b
Royer, A., Picard, G., Vargel, C., Langlois, A., Gouttevin, I., and Dumont, M.: Improved Simulation of Arctic Circumpolar Land Area Snow Properties and Soil Temperatures, Front. Earth Sci., 9, 1–19, https://doi.org/10.3389/feart.2021.685140, 2021b. a, b, c, d, e
Satyawali, P. K., Singh, A. K., Dewali, S. K., Kumar, P., and Kumar, V.: Time dependence of snow microstructure and associated effective thermal conductivity, Ann. Glaciol., 49, 43–50, https://doi.org/10.3189/172756408787814753, 2008. a
Saulnier-Talbot, É., Duchesne, É., Antoniades, D., Arseneault, D., Barnard, C., Berteaux, D., Bhiry, N., Bouchard, F., Boudreau, S., Cazelles, K., Comte, J., Corbeil-Robitaille, M.-Z., Côté, S. D., Couture, R.-M., De Lafontaine, G., Domine, F., Fauteux, D., Fortier, D., Garneau, M., Gauthier, G., Gravel, D., Laurion, I., Lavoie, M., Lecomte, N., Legagneux, P., Lévesque, E., Naud, M.-J., Paquette, M., Payette, S., Pienitz, R., Rautio, M., Roy, A., Royer, A., Simard, M., Vincent, W. F., and Bêty, J.: Expert Elicitation of State Shifts and Divergent Sensitivities to Climate Warming across Northern Ecosystems, Commun. Earth Environ., 5, 624, https://doi.org/10.1038/s43247-024-01791-z, 2024. a
Schuur, E. A., Abbott, B. W., Commane, R., Ernakovich, J., Euskirchen, E., Hugelius, G., Grosse, G., Jones, M., Koven, C., Leshyk, V., Lawrence, D., Loranty, M. M., Mauritz, M., Olefeldt, D., Natali, S., Rodenhizer, H., Salmon, V., Schädel, C., Strauss, J., Treat, C., and Turetsky, M.: Permafrost and Climate Change: Carbon Cycle Feedbacks From the Warming Arctic, Annu. Rev. Environ. Resour., 47, 343–371, https://doi.org/10.1146/annurev-environ-012220-011847, 2022. a
Seiler, C., Melton, J. R., Arora, V. K., and Wang, L.: CLASSIC v1.0: The Open-Source Community Successor to the Canadian Land Surface Scheme (CLASS) and the Canadian Terrestrial Ecosystem Model (CTEM) – Part 2: Global Benchmarking, Geosci. Model Dev., 14, 2371–2417, https://doi.org/10.5194/gmd-14-2371-2021, 2021. a
Serreze, M. C. and Barry, R. G.: Processes and Impacts of Arctic Amplification: A Research Synthesis, Global Planet. Change, 77, 85–96, https://doi.org/10.1016/j.gloplacha.2011.03.004, 2011. a
Shangguan, W., Hengl, T., Mendes de Jesus, J., Yuan, H., and Dai, Y.: Mapping the Global Depth to Bedrock for Land Surface Modeling, J. Adv. Model. Earth Syst., 9, 65–88, https://doi.org/10.1002/2016MS000686, 2017. a
Shrestha, M., Wang, L., Koike, T., Xue, Y., and Hirabayashi, Y.: Improving the Snow Physics of WEB-DHM and Its Point Evaluation at the SnowMIP Sites, Hydrol. Earth Syst. Sci., 14, 2577–2594, https://doi.org/10.5194/hess-14-2577-2010, 2010. a
Simson, A., Löwe, H., and Kowalski, J.: Elements of Future Snowpack Modeling – Part 2: A Modular and Extendable Eulerian–Lagrangian Numerical Scheme for Coupled Transport, Phase Changes and Settling Processes, The Cryosphere, 15, 5423–5445, https://doi.org/10.5194/tc-15-5423-2021, 2021. a
Skiles, S. M., Painter, T. H., Deems, J. S., Bryant, A. C., and Landry, C. C.: Dust radiative forcing in snow of the Upper Colorado River Basin: 2. Interannual variability in radiative forcing and snowmelt rates, Water Resour. Res., 48, https://doi.org/10.1029/2012WR011986, 2012. a
Still, C. J., Berry, J. A., Collatz, G. J., and DeFries, R. S.: Global Distribution of C3 and C4 Vegetation: Carbon Cycle Implications, Global Biogeochem. Cy., 17, 6-1–6-14, https://doi.org/10.1029/2001GB001807, 2003. a
Stuecker, M. F., Bitz, C. M., Armour, K. C., Proistosescu, C., Kang, S. M., Xie, S.-P., Kim, D., McGregor, S., Zhang, W., Zhao, S., Cai, W., Dong, Y., and Jin, F.-F.: Polar Amplification Dominated by Local Forcing and Feedbacks, Nat. Clim. Change, 8, 1076–1081, https://doi.org/10.1038/s41558-018-0339-y, 2018. a
Sturm, M. and Benson, C. S.: Vapor Transport, Grain Growth and Depth-Hoar Development in the Subarctic Snow, J. Glaciol., 43, 42–59, https://doi.org/10.3189/S0022143000002793, 1997. a
Sturm, M., Holmgren, J., König, M., and Morris, K.: The Thermal Conductivity of Seasonal Snow, J. Glaciol., 43, 26–41, https://doi.org/10.3189/S0022143000002781, 1997. a, b, c, d, e, f, g, h, i, j
Sturm, M., Holmgren, J., McFadden, J. P., Liston, G. E., Chapin, F. S., and Racine, C. H.: Snow – Shrub Interactions in Arctic Tundra: A Hypothesis with Climatic Implications, J. Climate, 14, 336–344, https://doi.org/10.1175/1520-0442(2001)014<0336:SSIIAT>2.0.CO;2, 2001. a, b
Sun, S., Jin, J., and Xue, Y.: A Simple Snow-Atmosphere-Soil Transfer Model, J. Geophys. Res.-Atmos., 104, 19587–19597, https://doi.org/10.1029/1999JD900305, 1999. a
Swart, N. C., Cole, J. N. S., Kharin, V. V., Lazare, M., Scinocca, J. F., Gillett, N. P., Anstey, J., Arora, V., Christian, J. R., Hanna, S., Jiao, Y., Lee, W. G., Majaess, F., Saenko, O. A., Seiler, C., Seinen, C., Shao, A., Sigmond, M., Solheim, L., von Salzen, K., Yang, D., and Winter, B.: The Canadian Earth System Model Version 5 (CanESM5.0.3), Geosci. Model Dev., 12, 4823–4873, https://doi.org/10.5194/gmd-12-4823-2019, 2019. a
Swenson, S. C. and Lawrence, D. M.: A New Fractional Snow-Covered Area Parameterization for the Community Land Model and Its Effect on the Surface Energy Balance, J. Geophys. Res.-Atmos., 117, D21107, https://doi.org/10.1029/2012JD018178, 2012. a, b
Tabler, R. D., Benson, C. S., Santana, B. W., and Ganguly, P.: Estimating Snow Transport from Wind Speed Records: Estimates versus Measurements at Prudhoe Bay, Alaska, in: 58th Annual Western Snow Conference, Proceedings of the 58th Annual Western Snow Conference, Western Snow Conference, Sacramento, California, 61–72, https://westernsnowconference.org/node/620 (last access: 12 March 2024), 1990. a
Terzago, S., Andreoli, V., Arduini, G., Balsamo, G., Campo, L., Cassardo, C., Cremonese, E., Dolia, D., Gabellani, S., von Hardenberg, J., Morra di Cella, U., Palazzi, E., Piazzi, G., Pogliotti, P., and Provenzale, A.: Sensitivity of Snow Models to the Accuracy of Meteorological Forcings in Mountain Environments, Hydrol. Earth Syst. Sci., 24, 4061–4090, https://doi.org/10.5194/hess-24-4061-2020, 2020. a
Tutton, R., Dakin, B., Essery, R., Griffith, J., Hould-Gosselin, G., Marsh, P., Sonnentag, O., Thorne, R., and Walker, B.: A hydrometeorological dataset from the taiga-tundra ecotone in the western Canadian Arctic: Trail Valley Creek, Northwest Territories, Borealis [data set], https://doi.org/10.5683/SP3/BXV4DE, 2025. a
Van Looy, K., Bouma, J., Herbst, M., Koestel, J., Minasny, B., Mishra, U., Montzka, C., Nemes, A., Pachepsky, Y. A., Padarian, J., Schaap, M. G., Tóth, B., Verhoef, A., Vanderborght, J., van der Ploeg, M. J., Weihermüller, L., Zacharias, S., Zhang, Y., and Vereecken, H.: Pedotransfer Functions in Earth System Science: Challenges and Perspectives, Rev. Geophys., 55, 1199–1256, https://doi.org/10.1002/2017RG000581, 2017. a
Vavrus, S.: The Role of Terrestrial Snow Cover in the Climate System, Clim. Dynam., 29, 73–88, https://doi.org/10.1007/s00382-007-0226-0, 2007. a
V-Dutch: V-Dutch/TVCSnowCLM (v1), Zenodo [data set], https://doi.org/10.5281/zenodo.7137729, 2022. a
Vereecken, H., Weynants, M., Javaux, M., Pachepsky, Y., Schaap, M. G., and van Genuchten, M. Th.: Using Pedotransfer Functions to Estimate the van Genuchten–Mualem Soil Hydraulic Properties: A Review, Vadose Zone J., 9, 795–820, https://doi.org/10.2136/vzj2010.0045, 2010. a
Vernekar, A. D., Zhou, J., and Shukla, J.: The Effect of Eurasian Snow Cover on the Indian Monsoon, J. Climate, 8, 248–266, https://doi.org/10.1175/1520-0442(1995)008<0248:TEOESC>2.0.CO;2, 1995. a
Verseghy, D., Brown, R., and Wang, L.: Evaluation of CLASS Snow Simulation over Eastern Canada, J. Hydrometeorol., 18, 1205–1225, https://doi.org/10.1175/JHM-D-16-0153.1, 2017. a, b, c
Verseghy, D. L.: Class – A Canadian Land Surface Scheme for GCMS. I. Soil Model, Int. J. Climatol., 11, 111–133, https://doi.org/10.1002/joc.3370110202, 1991. a
Vionnet, V., Brun, E., Morin, S., Boone, A., Faroux, S., Le Moigne, P., Martin, E., and Willemet, J. M.: The Detailed Snowpack Scheme Crocus and Its Implementation in SURFEX v7.2, Geosci. Model Dev., 5, 773–791, https://doi.org/10.5194/gmd-5-773-2012, 2012. a, b, c
Walter, B., Weigel, H., Wahl, S., and Löwe, H.: Wind Tunnel Experiments to Quantify the Effect of Aeolian Snow Transport on the Surface Snow Microstructure, The Cryosphere, 18, 3633–3652, https://doi.org/10.5194/tc-18-3633-2024, 2024. a, b
Wang, L., Mudryk, L., Melton, J. R., Mortimer, C., Cole, J., Meyer, G., Bartlett, P., and Lalande, M.: Impact of topography and meteorological forcing on snow simulation in the Canadian Land Surface Scheme Including Biogeochemical Cycles (CLASSIC), Geosci. Model Dev., 18, 6597–6621, https://doi.org/10.5194/gmd-18-6597-2025, 2025. a
Wang, T., Ottlé, C., Boone, A., Ciais, P., Brun, E., Morin, S., Krinner, G., Piao, S., and Peng, S.: Evaluation of an Improved Intermediate Complexity Snow Scheme in the ORCHIDEE Land Surface Model, J. Geophys. Res.-Atmos., 118, 6064–6079, https://doi.org/10.1002/jgrd.50395, 2013. a
Warren, S. G. and Wiscombe, W. J.: A Model for the Spectral Albedo of Snow. II: Snow Containing Atmospheric Aerosols, J. Atmos. Sci., 37, 2734–2745, https://doi.org/10.1175/1520-0469(1980)037<2734:AMFTSA>2.0.CO;2, 1980. a
Wever, N.: Weissfluhjoch Dataset for ESM-SnowMIP, EnviDat [data set], https://doi.org/10.16904/16, 2017. a
Wever, N., Schmid, L., Heilig, A., Eisen, O., Fierz, C., and Lehning, M.: Verification of the Multi-Layer SNOWPACK Model with Different Water Transport Schemes, The Cryosphere, 9, 2271–2293, https://doi.org/10.5194/tc-9-2271-2015, 2015. a
Wever, N., Vera Valero, C., and Techel, F.: Coupled Snow Cover and Avalanche Dynamics Simulations to Evaluate Wet Snow Avalanche Activity, J. Geophys. Res.-Earth, 123, 1772–1796, https://doi.org/10.1029/2017JF004515, 2018. a
Woolley, G. J., Rutter, N., Wake, L., Vionnet, V., Derksen, C., Essery, R., Marsh, P., Tutton, R., Walker, B., Lafaysse, M., and Pritchard, D.: Multi-Physics Ensemble Modelling of Arctic Tundra Snowpack Properties, The Cryosphere, 18, 5685–5711, https://doi.org/10.5194/tc-18-5685-2024, 2024. a, b, c, d, e, f
Wösten, J. H. M., Pachepsky, Y. A., and Rawls, W. J.: Pedotransfer Functions: Bridging the Gap between Available Basic Soil Data and Missing Soil Hydraulic Characteristics, J. Hydrol., 251, 123–150, https://doi.org/10.1016/S0022-1694(01)00464-4, 2001. a
Xu, L. and Dirmeyer, P.: Snow-Atmosphere Coupling Strength in a Global Atmospheric Model, Geophys. Res. Lett., 38, L13401, https://doi.org/10.1029/2011GL048049, 2011. a
Xue, Y., Sun, S., Kahan, D. S., and Jiao, Y.: Impact of Parameterizations in Snow Physics and Interface Processes on the Simulation of Snow Cover and Runoff at Several Cold Region Sites, J. Geophys. Res.-Atmos., 108, 2002JD003174, https://doi.org/10.1029/2002JD003174, 2003. a
Yang, J., Liu, Q., Dai, W., and Ding, R.: A Temperature Error Correction Method for a Naturally Ventilated Radiation Shield, J. Atmos. Sol.-Terr. Phy., 149, 40–45, https://doi.org/10.1016/j.jastp.2016.09.010, 2016. a
Yang, Z.-L. and Niu, G.-Y.: The Versatile Integrator of Surface and Atmosphere Processes, Global Planet. Change, 38, 175–189, https://doi.org/10.1016/S0921-8181(03)00028-6, 2003. a
Yen, Y.-C.: Sensible Heat Flux Measurements Near A Cold Surface, Tech. Rep. CRREL Report 95-22, US Army Corps of Engineers, Hanover, New Hampshire, https://apps.dtic.mil/sti/tr/pdf/ADA353423.pdf (last access: 4 February 2025), 1995. a
Yokohata, T., Saito, K., Takata, K., Nitta, T., Satoh, Y., Hajima, T., Sueyoshi, T., and Iwahana, G.: Model Improvement and Future Projection of Permafrost Processes in a Global Land Surface Model, Prog. Earth Planet. Sci., 7, 69, https://doi.org/10.1186/s40645-020-00380-w, 2020. a
Zhang, T.: Influence of the Seasonal Snow Cover on the Ground Thermal Regime: An Overview, Rev. Geophys., 43, RG4002, https://doi.org/10.1029/2004RG000157, 2005. a
- Abstract
- Introduction
- Data and methods
- Results
- Discussion
- Conclusions
- Appendix A: Snow depth time series
- Appendix B: Bottom snow temperature
- Appendix C: Physics improvements
- Appendix D: Arctic sites time series
- Code and data availability
- Author contributions
- Competing interests
- Disclaimer
- Acknowledgements
- Financial support
- Review statement
- References
- Supplement
- Abstract
- Introduction
- Data and methods
- Results
- Discussion
- Conclusions
- Appendix A: Snow depth time series
- Appendix B: Bottom snow temperature
- Appendix C: Physics improvements
- Appendix D: Arctic sites time series
- Code and data availability
- Author contributions
- Competing interests
- Disclaimer
- Acknowledgements
- Financial support
- Review statement
- References
- Supplement