
the Creative Commons Attribution 4.0 License.
the Creative Commons Attribution 4.0 License.
 | 24 Sep 2026
Natural methane emissions feedbacks in MAGICC v. 7.6
Trevor Sloughter

Zebedee Nicholls
Gang Tang
Thomas Kleinen
Zhen Zhang
Joeri Rogelj
Literature estimates of natural methane emissions, particularly from wetlands, have a wide range of uncertainty. Meanwhile, few Earth System Models (ESMs) explicitly model wetlands as a potential source of methane. As a result, Simple Climate Models that aim to emulate the behaviour of ESMs have little to constrain their present and future contributions. MAGICC, as of version 7.5.3, fixed natural methane concentrations as constant after the historical period. Two studies that model wetland methane emissions over the 21st century both find a relationship between those emissions and global temperature, though disagree on the extent of this temperature sensitivity. An updated version of MAGICC has been created that uses this evidence to include a linearised representation of the relationship between wetland methane emissions and global temperature. The temperature-sensitivity parameter in this relationship has been parametrised in a way such that its distribution encompasses the uncertainty in both modelling literature and carbon budget studies, reflecting the currently high degree of uncertainty in wetland emissions. Our results show how incorporating a temperature feedback in methane emissions leads to both higher temperature projections for all scenarios used here, and a widening of the uncertainty in global temperature response.
- Article
(2905 KB) - Full-text XML
- BibTeX
- EndNote


Globally, wetland area has been estimated at around 12 million km2 (Davidson et al., 2018), nearly 8 % of Earth's land surface area. With their emissions accounting for anywhere between 20 % and 30 % of all global natural and anthropogenic methane emissions (Saunois et al., 2020; Zhang et al., 2025), wetlands are the largest source of methane emissions in the coupled Human-Earth System (Gedney et al., 2019), and potentially represent important components of the Earth system for modelling future climate. However, as yet few Earth System Models (ESMs) explicitly model wetlands.
One ESM which did incorporate a wetlands module (Kleinen et al., 2021a) reported CH4 emissions from wetlands alone rivalling, or in some scenarios even overtaking, anthropogenic sources within the next century. This was attributed in large part to the rise in temperature spurring greater productivity in wetlands, as well as changing precipitation inundating a larger land area, resulting in this substantial additional methane source. Increased inundation has also been reported as a cause of increased emissions in recent years (Qu et al., 2024). Wetland methane emissions are partially dependent on temperature, but due to the other drivers mentioned, which are themselves partially dependent on temperature, emissions do not necessarily follow the same trajectory with decreasing temperatures as they do with increasing temperatures. This potential hysteresis was noted on seasonal time scales (Chang et al., 2021).
Wetland methane surface models often reproduce the historical period, incorporating measurement data to attempt estimates of the current emission rates, and few project future trends over the next century (Skeie et al., 2023; Zhang et al., 2023; Peng et al., 2022). Feedbacks are easier to detect in future projections than in historical simulations, and without more models of 21st century wetland methane there are limits to how simple climate models (SCMs) can be calibrated. To date, most SCMs do not incorporate explicit derivation of wetland feedbacks, although some are adding modules that capture related processes, such as OSCAR adding a peatland component (Zhu et al., 2025). One such SCM, the Model for the Assessment of Greenhouse-gas-Induced Climate Change (MAGICC) (Meinshausen et al., 2011a), had previously not incorporated dynamic natural methane in its future projections, instead taking historical concentrations up to the present, after which natural methane is kept constant (Meinshausen et al., 2011a, 2020).
MAGICC is particularly relevant as it is used to prepare concentration inputs for ESM experiments from the scenario emissions data, such as those in ScenarioMIP (O'Neill et al., 2016; Riahi et al., 2017). Kleinen et al. (2021a) cite the risk of CMIP potentially greatly under-estimating natural methane emissions, with wetlands being the largest single source in their results. Here we present a version of MAGICC which incorporates an approximation of the effect of wetlands on natural methane emissions as found in two global models for the period up to 2100 and beyond.
2.1 Methane data
Projections of wetland methane emissions were taken from two prior modelling studies which provided global coverage up to and beyond 2100. One, Kleinen et al. (2021a), added a wetlands component to the Max Planck Institute for Meteorology Earth System Model (MPI-ESM) (Mauritsen et al., 2019), the results of which over the next millennium are shown in Fig. A1. The other, Zhang et al. (2017), used a wetlands model whose emissions were fed into MAGICC v. 6 to calculate global temperatures, which were then fed back into the wetlands model. Kleinen et al. (2021a) ran their modified ESM for several scenarios based on the Shared Socioeconomic Pathways (SSPs), SSP1-1.9, SSP1-2.6, SSP2-4.5, SSP3-7.0, and SSP5-8.5 up to 2100 and then extended by Kleinen et al. (2021a) to the year 3000, following the same method that had been used in Meinshausen et al. (2020) to extend them to 2500. Zhang et al. (2017) used the older Representative Concentration Pathways RCP2.6, RCP4.5, and RCP6.0 and RCP8.5 (Meinshausen et al., 2011b). Due to issues of data availability, when calibrating to Zhang et al. (2017), this study uses only RCP2.6 and RCP8.5.
2.1.1 Model and calibration
Both available papers on wetland methane emissions found a strong linear correlation between emissions and global temperature in their models. Results from Kleinen et al. (2021a) are shown in Fig. A2, plotting the methane emissions from wetlands versus surface warming, wetland CH4 emissions versus atmospheric CO2 concentrations, and atmospheric CO2 versus surface warming. These are plotted up to the year 3000 using a 50-year running mean. Shown in Fig. A3 are the annual methane emissions, averaged using a 50-year running mean, against global temperature anomaly up to the year 2300 in Kleinen et al. (2021a).
The aforementioned linear relationship between wetland methane emissions and global temperature holds in the cited models at least for the next century. Beyond 2300, as global temperatures stabilise, wetland methane emissions decrease in the MPI-ESM, and thus the linear model no longer fits (compare Fig. A2a with Fig. A3). This can be seen in Fig. 2 of Kleinen et al. (2021a), which is reproduced in Fig. A1 here. This nonlinear effect is also evident when comparing the scatter plots shown in Fig. A2 which use all the data up to the year 3000, versus the scatter plot in Fig. A3 which only includes data up to 2500. The nonlinear effects are much less prominent in the near centuries than further into the millennium. And, as mentioned above and described by the authors, with every additional century the uncertainty in the results increases.
For this reason, here we model wetland methane emissions () as a linear function of the global average temperature anomaly T with a slope m and intercept E0:
This equation was fit to the available data using the Nelder–Mead method (Nelder and Mead, 1965) and a cost function calculating the root mean-squared error (RMSE). The Kleinen et al. (2021a) time series extends up to the year 3000, but the authors express increasing degrees of uncertainty beyond 2300. Equation (1) was calibrated using the full time series up to 3000, but also using subsets ending at 2500 and 2300.
This linear model was fit to each study's data separately, one calibration simultaneously fitting to the five SSPs used in Kleinen et al. (2021a), and the other simultaneously fit to the two RCPs used in Zhang et al. (2017).
These calibrations of slope m to the available simulation data from Kleinen et al. (2021a) and Zhang et al. (2017) were used to define a normal distribution. Values from the fit to Kleinen et al. (2021a) were as high as 52.6 Mt K−1 (see Table A1) and were assumed to be on the high end of sensitivity due to evidence from ensemble estimates of wetland emissions from 2000–2020 (Zhang et al., 2025) and more recent 21st century simulations (Im et al., 2025). The evidence surveyed in Zhang et al. (2025) were not usable for calibration as they covered too short of a time span, but they suggest lower temperature sensitivities may also be reasonable, as do the results in Im et al. (2025) which became available during the writing of this paper. Therefore, the distribution was given a median of 30 Mt K−1 with a standard deviation of 13 Mt K−1. Thus the slope derived from Kleinen et al. (2021a) falls within 2 SD (standard deviations) of the mean, which is close to the slope derived from Zhang et al. (2017). This distribution is also consistent with temperature sensitivities of wetland emissions found in an analysis of 16 process-based models (Zhang et al., 2025). This distribution thus encompasses the wide uncertainty range applicable to the quantification of this effect. The lower bound is not clearly constrained in this framework, but is consistent with a more recent study that was published after the above analysis (Im et al., 2025). That study also modelled wetlands and other natural sources of methane into the future, but did not find a strong temperature sensitivity, and hence there was little to no increase in wetland emissions over the next century. This suggests that modelling estimates of temperature sensitivity do indeed span a range from near zero to the high end of Kleinen et al. (2021a).
Here, MAGICC, both with and without wetland methane, is concentration-driven until 2015 when it switches to emissions-driven. Thus, after 2015 is also when the natural methane emissions are calculated with Equation 1, allowing for historical methane to be constrained by observational data. The resulting version with wetlands methane is MAGICC v7.6.0 (Nicholls et al., 2025).
2.2 Scenario experiments
Both the new MAGICC and the previous version (v. 7.5.3) were run with the IPCC AR6 scenarios in categories C1, C2 and C3 (Byers et al., 2022; Kikstra et al., 2022), to compare the effects of emissions generated by Eq. (1). The categories are defined with respect to the limits of either their peak warming or their end-of-century (EOC) warming in the case of overshoot. The first category, C1, are scenarios defined as reaching or exceeding “1.5 °C” during the 21st century with a likelihood of ≤67 %, and limit warming to 1.5 °C in 2100 with a likelihood > 50 %. Limited overshoot refers to exceeding 1.5 °C by up to about 0.1 ° C and for up to several decades” (Riahi et al., 2022). The second, C2, is defined similarly but allowing for higher overshoot, these scenarios “[e]xceed warming of 1.5 °C during the 21st century with a likelihood of >67 %, and limit warming to 1.5 °C in 2100 with a likelihood of >50 %. High overshoot refers to temporarily exceeding 1.5 °C global warming by 0.1 °C–0.3 °C for up to several decades”. The third, C3, are scenarios which “[l]imit peak warming to 2 °C throughout the 21st century with a likelihood of >67 %”.
Both versions of MAGICC were run from 1750 to 2105 (Meinshausen et al., 2020), the extra five years allowing for any potential numerical issues with the end of the simulation to be cut off. The runs used a probabilistic approach with 600 draws of parameter combinations for each scenario (Sloughter and Nicholls, 2025). Each draw pulls values of parameters, including the temperature sensitivity of wetland methane emissions, from established distributions that have been calibrated to higher resolution models. This allows for MAGICC to simulate the spread of uncertainty from disagreements between ESMs, and while the default number of draws (600) was used here, this can be changed for future uses. The runs were concentration-driven up to 2015, using the same historical data previously described in Nicholls et al. (2021), before switching to emissions-driven scenarios from 2015 onward.
3.1 Parametrisation
Temperature sensitivity calibrated using the Zhang et al. (2017) data was 35.5 Mt CH4 K−1. Calibrating to the full Kleinen et al. (2021a) data, up to the year 3000, resulted in a temperature sensitivity of 37.5 Mt CH4 K−1. This is a lower slope for Eq. (1) than if the calibration only used data up to the year 2500, giving a slope of 45.8 Mt CH4 K−1, or to 2300, with a slope of 52.6 Mt CH4 K−1 (see also Table A1). Considering the aforementioned high uncertainty beyond 2300, the nonlinearity after this point, and the focus of these experiments on this century, the higher estimate of 52.6 Mt K−1 was used to inform the higher end of the parameter distribution for the linear model.
MAGICC v7.6 draws slopes from a normal distribution with a mean of 30 Mt K−1, and a standard deviation of 13 Mt K−1. This kept the majority of slopes near to the estimate derived from Zhang et al. (2017) while allowing for a number to extend above the Kleinen et al. (2021a) fit on the high end.
3.2 Emissions and concentrations
The new version of MAGICC has higher natural methane emissions. Even in cooler scenarios, such as SSP1-2.6, CH4 emissions rise to over 200 Mt yr−1 by the middle of the century in the new model, an increase of over 20 Mt yr−1 relative to the older version's constant emission rate of ∼182 Mt yr−1 in the 21st century. Warmer temperatures necessarily lead to higher emissions, with median peak natural methane emissions rising above 216 Mt K−1 in C3 scenarios, and as high as 265.8 Mt yr−1 in the 95th percentile of emissions.
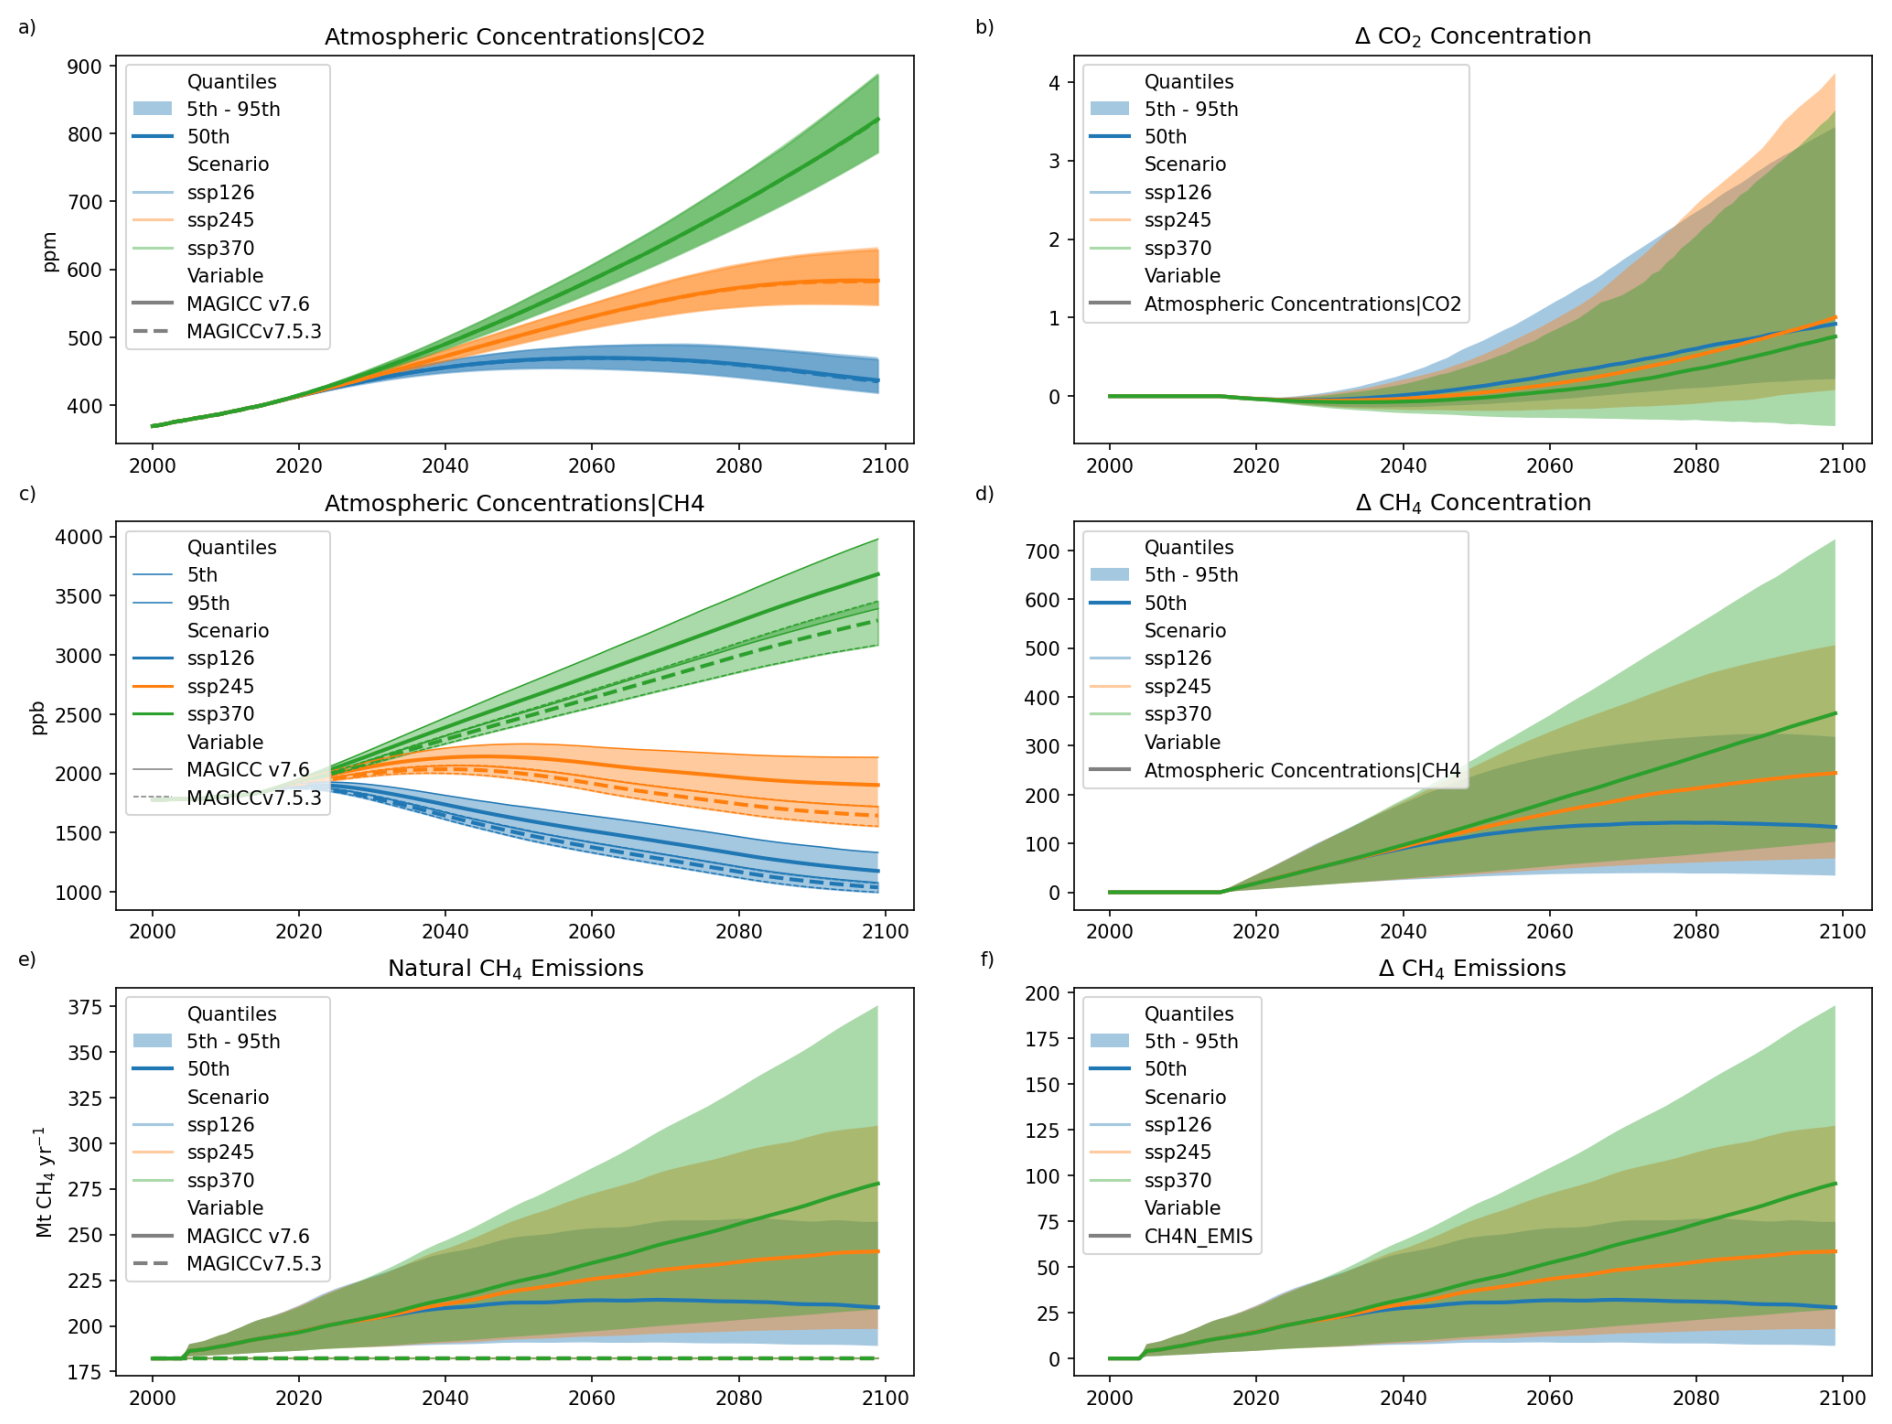
Figure 1(a, c, e) Comparisons of the atmospheric CO2 and CH4 concentrations and natural CH4 emissions between MAGICC v7.5.3 (dashed lines) and v7.6 (solid lines) for three SSP scenarios. (b, d, f) The differences between versions in concentrations of CO2 and CH4 and natural emissions of CH4. As the older version of MAGICC held natural methane sources constant, it has a flat line in the emissions plot. The 5th and 95th quantiles are shown for all. In sub-figure (a), the difference in atmospheric CO2 is so small that the change in median and the upper and lower quantiles is not visible here. In (e), natural methane in v7.5.3 has no quantiles as these were constant in all scenarios. And in (c), the lower and upper quantile boundaries are indicated with thinner lines than the median (solid for v7.6, dashed for v7.5.3), and slight overlap between the lowest quantiles of v7.6 and the highest of v7.5.3 can be seen where the filled-in colour is darker.
Figure 1 shows atmospheric concentrations of carbon dioxide and methane, as well as the annual natural CH4 emissions from the simulation of the SSP1-2.6, SSP2-4.5 and SSP3-7.0 scenarios. MAGICC v7.5.3's natural emissions are constant. Emissions are converted into concentrations according to the same carbon and methane processes described in Meinshausen et al. (2011a), which remain unchanged in v7.6. Atmospheric methane has a default tropospheric life-time of 9.6 years, which decreases with increases in tropospheric OH. Oxidation of methane contributes to CO2 concentrations, and by default tropospheric OH decreases by 0.32 % for every 1 % increase in methane. The temperature sensitivity of atmospheric reaction rates affects tropospheric CH4, with higher temperatures leading to lower lifetimes. The emission differences in v7.6 result in the higher CH4 concentrations in MAGICC v7.6 than MAGICC v7.5, following global temperatures. This also leads to the higher CO2 concentrations in the new model version, a small increase on the order of a few ppm, as a result of the increased CH4 oxidation and the increased CO2 respiration (under higher temperature).
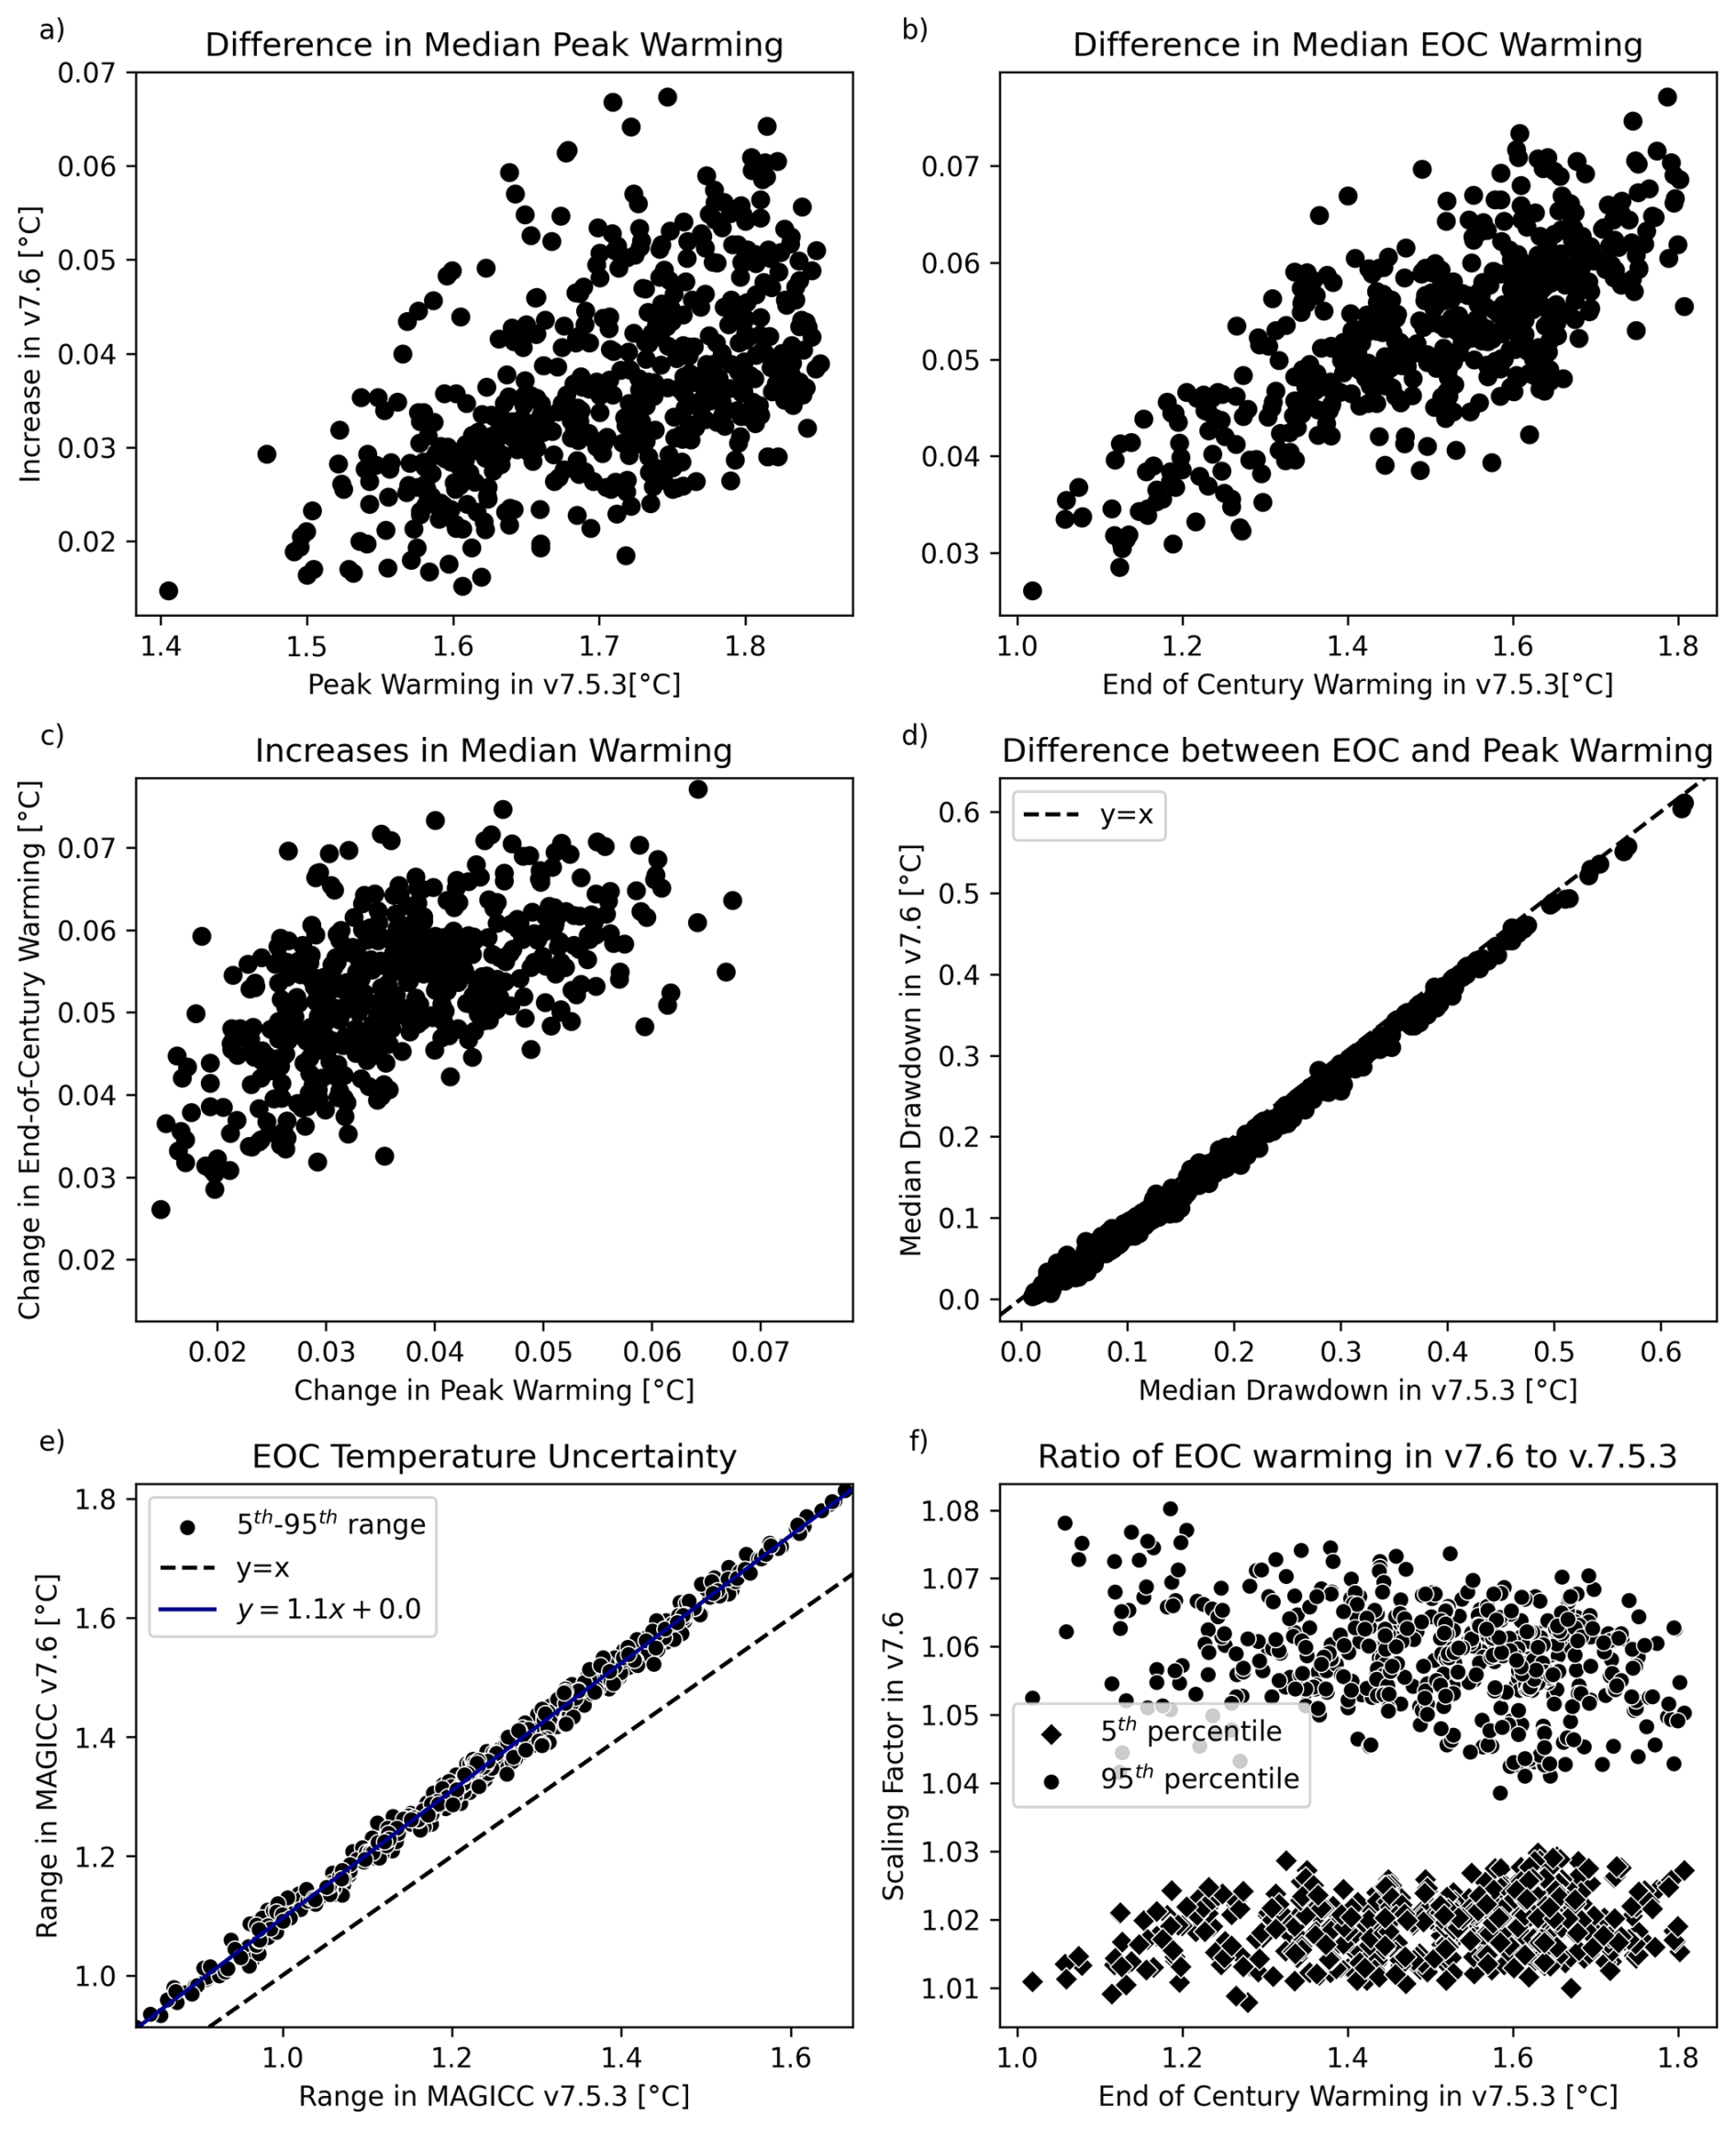
Figure 2Comparisons of the changes to peak and end-of-century (EOC) warming in MAGICC v7.6 when compared with v7.5.3. (a) The increase in peak temperatures between model versions plotted against the peak warming in v7.5.3. (b) The increase in EOC temperatures between model versions plotted against EOC warming in v7.5.3. (c) The increase in peak temperatures plotted against the increase in EOC tempreatures. (d) Drawdown, the difference between peak and EOC temperatures, for v7.6 plotted against drawdown in v7.5.3. (e) The range of EOC temperatures between the 5th and 95th percentiles for v7.6 plotted against those ranges for v7.5.3. (f) The ratio of EOC temperatures in v7.6 to those in v7.5.3 for the 5th and 95th percentiles.
3.3 Temperatures and scenarios
As the new model necessarily includes higher methane emissions from the addition of wetlands, all scenarios see higher atmospheric methane concentration and subsequently higher temperatures across the next century. This is most evident in comparing the peak and end-of-century (EOC) temperatures. Figure 2a shows the amount of increase in peak and EOC temperatures in v7.6 plotted against the amount of peak and EOC warming in v7.5.3, for scenarios in the AR6 categories C1–3. Figure 2b compares the relative change in peak versus EOC temperatures. Both demonstrate that not only are all scenarios warmer in v7.6, but the warmer a scenario was previously, the greater its increase in temperature with the added wetlands feedback. Figure 2d illustrates the slight decrease in total drawdown in the newer version. Drawdown, defined here as the difference between the peak and end-of-century warming, is slightly weaker for warmer scenarios.
Moreover, the uncertainty in global temperature also increases. Figure 2d plots the differences, for each scenario, between the temperatures in 2100 for the 95th and 5th percentiles, for both versions of MAGICC. Not only are the temperatures warmer, but the range between these extremes widens with warmer scenarios. Higher uncertainty in v7.5.3 leads to even higher uncertainty in v7.6, roughly ten percent higher. Figure 2e shows how EOC temperatures in v7.6 compare to v7.5.3 as a ratio, for both the 5th and 95th percentiles, demonstrating how both the lower and higher end of temperature estimates increase in v7.6.
As a result, all scenarios have a higher probability of exceeding 2 °C. While the overall impact on peak temperature is on the order of a few hundredths to a tenth of a degree Celsius, this pushes a number of scenarios above 2° in this percentile.
When run with MAGICC v7.6, nine of the 97 C1 scenarios exceed the EOC warming limit of 1.5 °C with a greater than 50 % probability. These scenarios would then be more in line with the C3 category as their peak warming would still not have a greater than 33 % probability of exceeding 2 °C. Of the 133 C2 scenarios, 33 no longer stay below 1.5 °C warming at the end of the century with a 50 % probability. Of those, 130 would still meet the cutoff for C3, The remaining three have a greater than 33 % chance of exceeding 2° of warming, though they would still have a 50 % probability of remaining below 2 °C (the cutoff for the C4 category). Of the 311 C3 scenarios, 82 no longer stay below 2 °C warming throughout the century with a 67 % probability, but do stay below with a 50 % probability. Figure 3 shows the scenarios in each category along with their respective cutoffs.
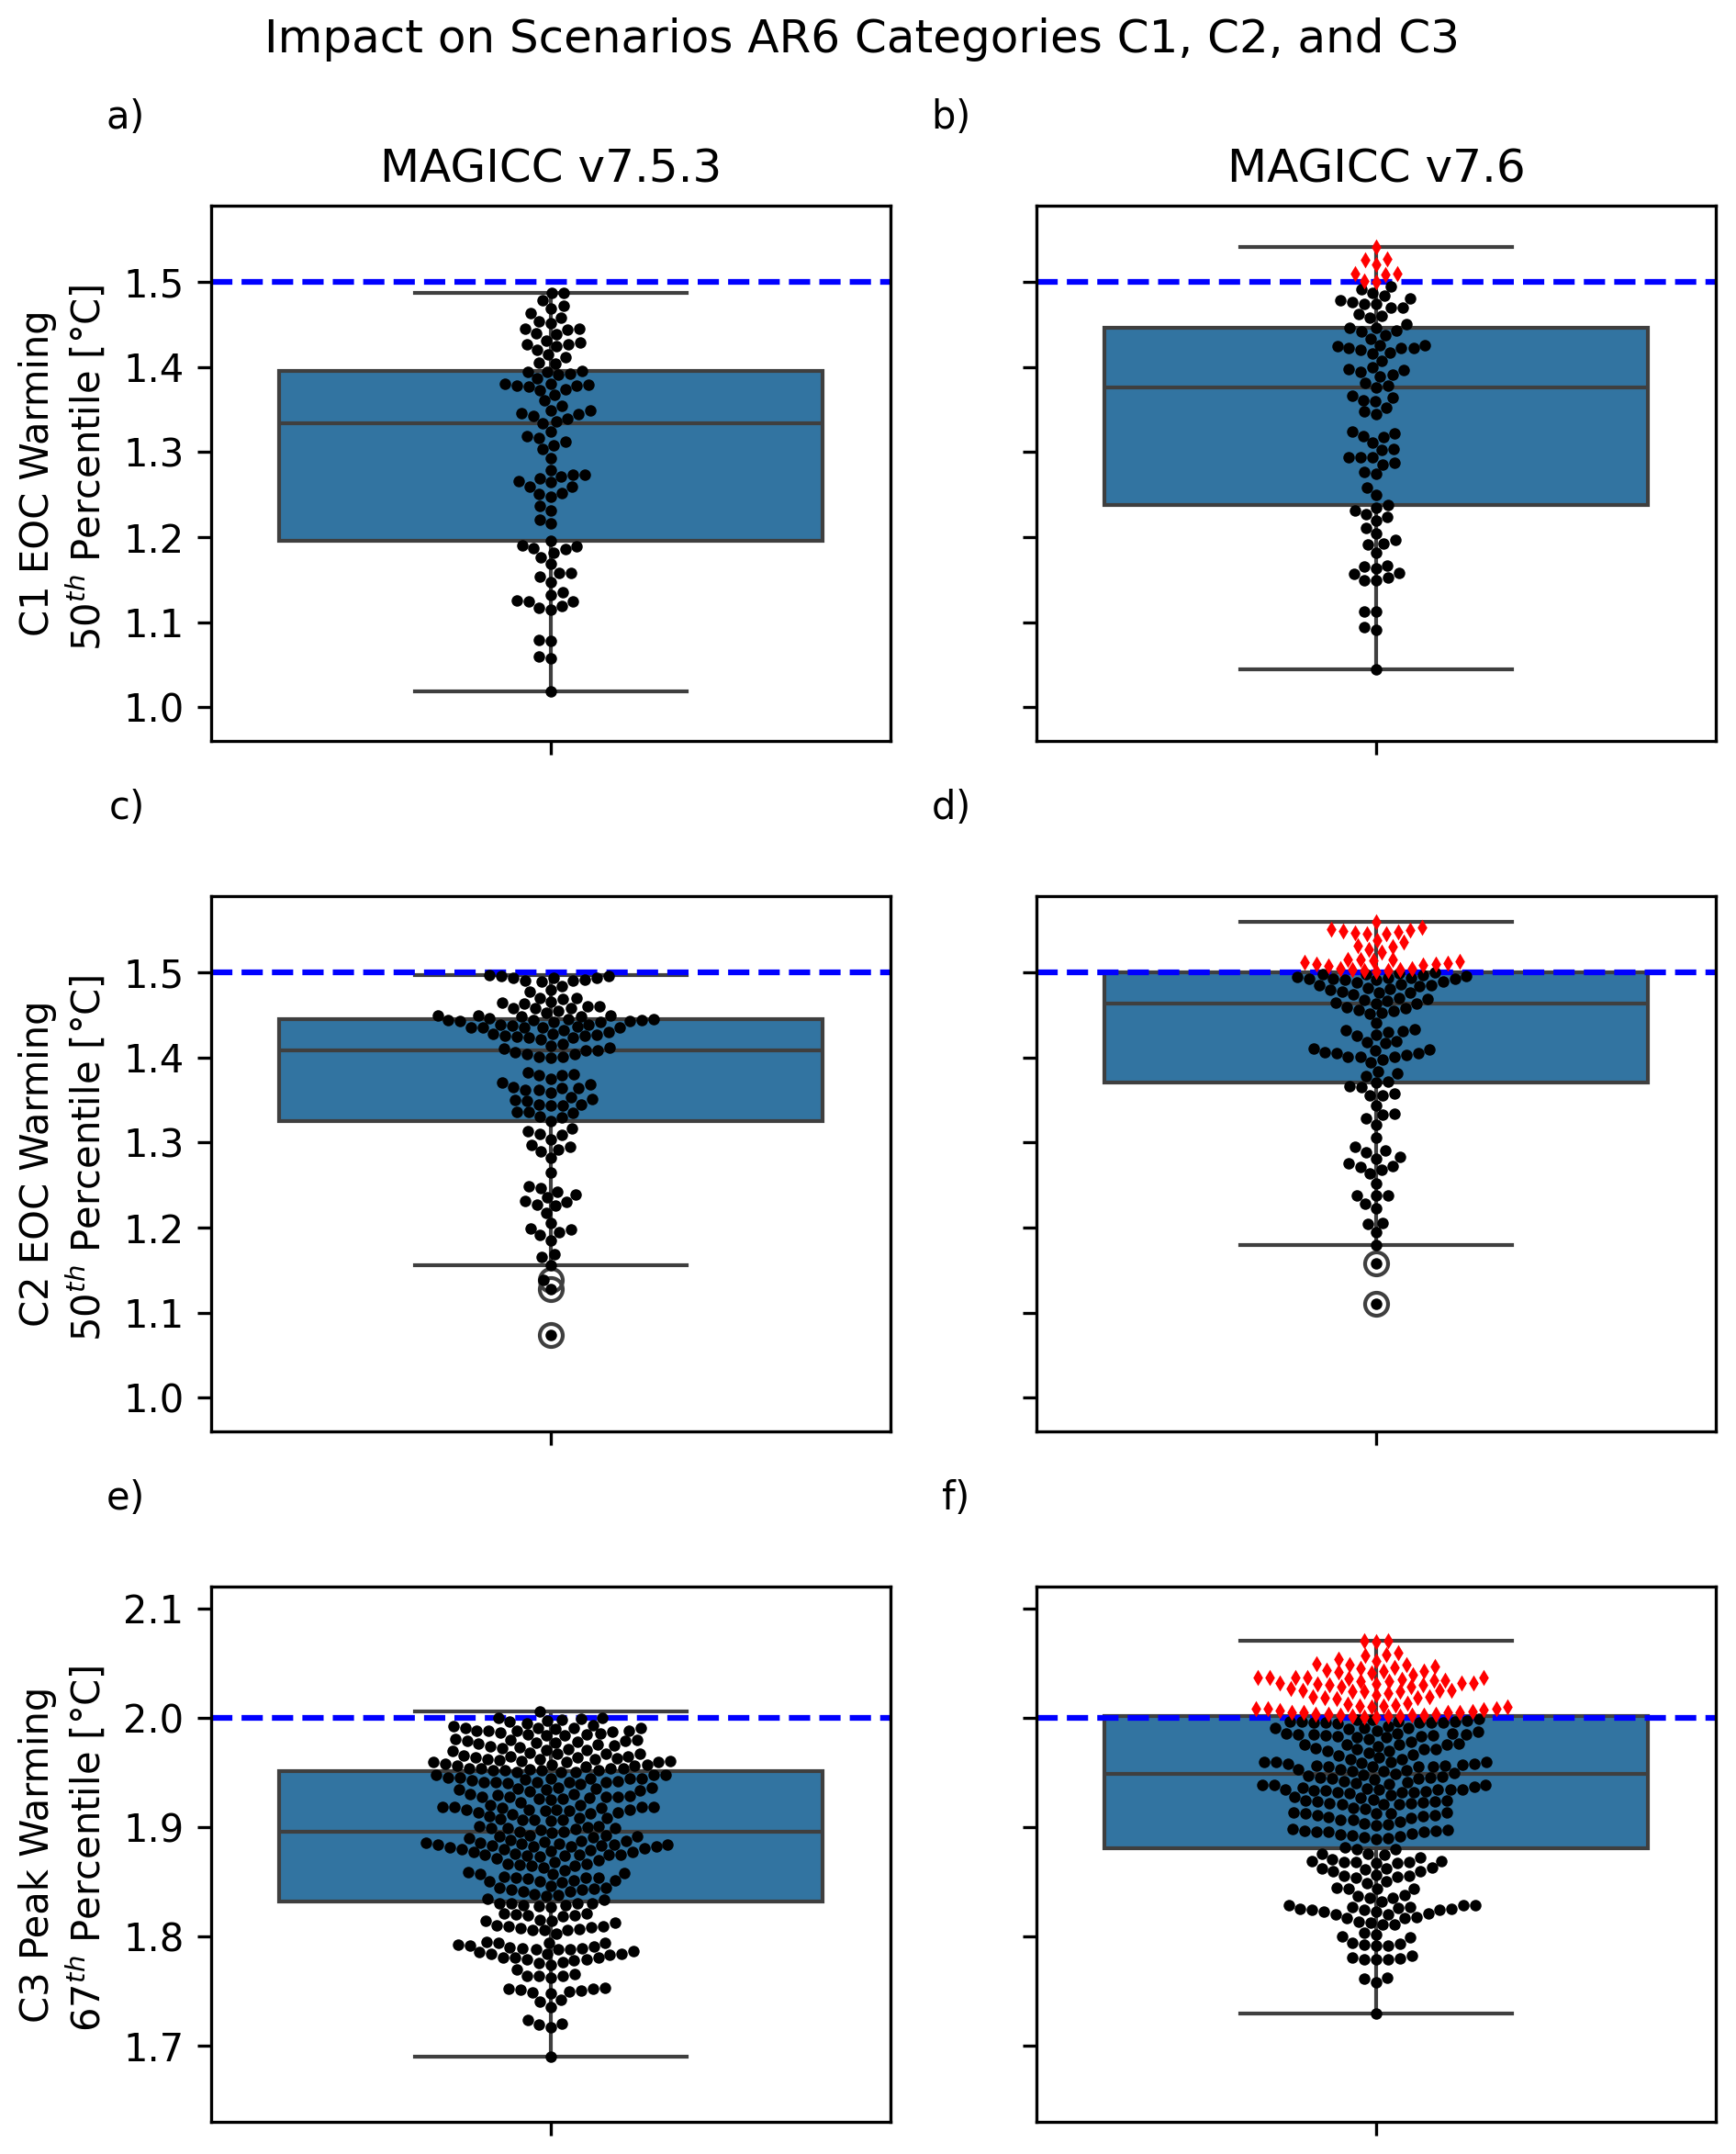
Figure 3Effect of additional natural methane emissions on scenarios with respect to the AR6 category cutoffs. Top and middle rows show median end-of-century surface air temperature anomalies in each version of MAGICC for the C1 and C2 scenarios. The 1.5 °C limit is indicated with the dashed line, and the scenarios in red exceed the limiting definitions of their categories when wetland methane is included. The bottom row shows the 67th percentile peak surface air temperature anomalies for the C3 scenarios. The 2 °C limit is indicated with the dashed line, and the scenarios in red exceed this peak warming cutoff which defines the category.
The C1 and C2 scenarios represent overshoot pathways that return to 1.5 °C of warming by the end of the century. In MAGICC v7.5.3, the C1 scenarios have a mean overshoot duration of 28.7 years (SD: 13.7), and C2 scenarios overshoot for a mean of 53.3 years (SD: 10.8). By contrast, in v7.6 the duration of overshoot is longer, with a mean of 38.9 years (SD: 15.9) for C1 scenarios and 59.9 years (SD: 9.9) for C2. As the length of the overshoot period is longer and the temperatures higher, the integral of the temperature curve exceeding 1.5 °C, expressed in degree-years, is also increased. In v7.5.3 the means are 1.5 (SD: 1.0) and 7.0 (SD: 3.1) degree-years for C1 and C2, respectively. In v7.6, the means are 2.7 (SD: 1.6) and 9.3 (SD: 3.6) degree-years for C1 and C2.
As established, the distribution of the temperature-sensitivity parameters in MAGICC v7.6 encompasses a range of estimates from the modelling literature (Zhang et al., 2017; Kleinen et al., 2021a; Im et al., 2025). The resulting wetland methane emissions are consistent with results from modelling studies such as Folberth et al. (2022), as well as the wide range of estimated methane emissions in the present estimated in the Global Methane Budget (GMB) (Saunois et al., 2025). The average bottom-up estimate of global wetland methane emissions between 2010 and 2019 is 165 Mt yr−1. The top-down estimate for the same time period, which also include emissions from inland waters, has a mean of 248 Mt yr−1. The median temperature sensitivity in MAGICC v7.6 leads to wetland methane emissions estimates in between these two values in the GMB (Saunois et al., 2020), close to 200 Mt yr−1 for most scenarios in the 2015–2019 period. Likewise, the upper and lower bounds of temperature sensitivity align with the upper and lower GMB emissions estimates.
While the change in emissions is noticeable, the effect on temperature is smaller. Peak and end-of-century temperatures are higher across all scenarios, by a few hundredths of a degree Celsius, and hence this affects scenario categorisation and projections of the magnitude and length of temperature overshoot. The magnitude of temperature increase may be small for any given year, but this can add up to many years longer of overshoot.
With the limited number of models at hand for calibration, there is a risk of results being skewed. Additionally, Kleinen et al. (2021a) notes the many processes that affect wetland emissions are entangled with temperature. Changes in precipitation and the expansion of tropical wetland area were large drivers of increasing emissions in their study, while here we use temperature only as a proxy for all of these. This is one of the reasons that in the latter half of the millennium, wetland emissions decrease even as temperatures stabilise. The model in this paper is reversible, decreasing temperatures decreases wetland emissions, but this is a simplification. In Kleinen et al. (2021a), the linear relationship between wetland methane and surface warming holds even in overshoot scenarios, where temperatures decline after a peak, for the next century, but extending beyond 2100 this does not appear to be the case (see also Figs. A2c and A3). Beyond 2100, especially for much higher cases of warming, reversibility is in question.
Future research can consider these interdependencies by including variables other than temperature, such as precipitation or wetlands area. However, these are typically not modelled or emulated by current SCMs. More ESMs for calibration would also be invaluable for better parameterisation.
We have included a wetland methane feedback, proportional to temperature, in MAGICC. This makes a noticeable difference in projected atmospheric methane concentrations across a range of scenarios over the next centuries. For mitigation scenarios assessed in AR6, the rise in methane concentrations leads to a small increase in temperature on the order of a hundredth of a degree Celsius at the peak. This temperature change is small, but nevertheless affects the number of scenarios that initially projected to return warming below 1.5 °C with at least 50 % probability in 2100 or those limiting warming to 2 °C.
MAGICC is being used for CMIP7's boundary conditions, and will ensure that the low bias, from having assumed constant natural methane emissions previously in CMIP6, is not repeated. While these boundary conditions will be imperfect both in hindsight and for the reasons already discussed above, this progress will be strengthened by the new insights that are expected from CMIP7-generation models. As new modelling results of 21st century wetland methane emissions are published, the calibration of our model of temperature sensitivity can be better refined, or even replaced with a more sophisticated relationship if more data are available.
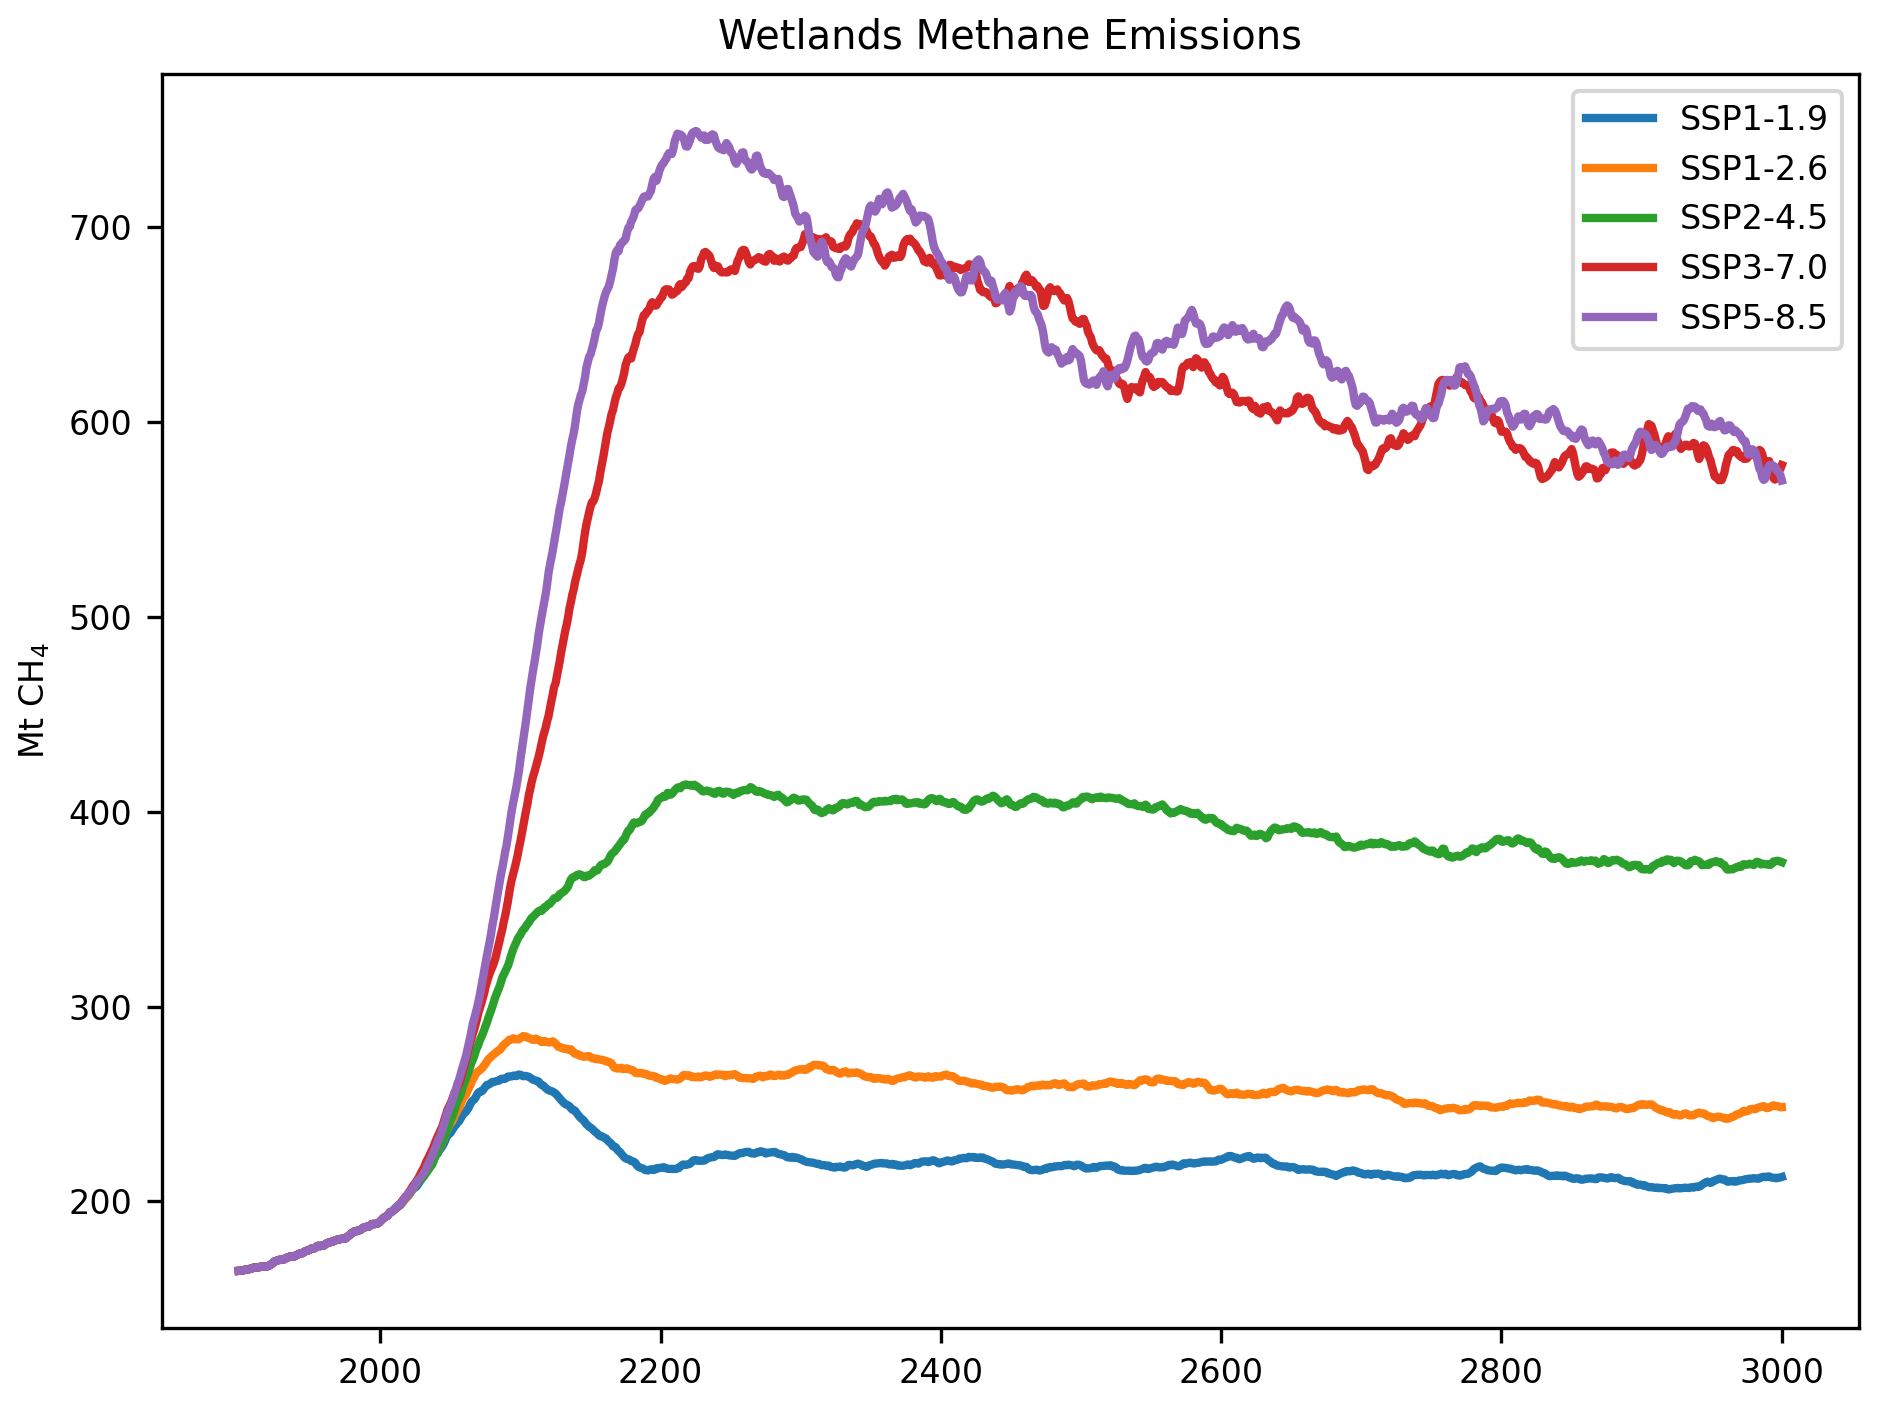
Figure A150-year running mean of Wetland methane emissions, reproduced from Fig. 2 in Kleinen et al. (2021a).
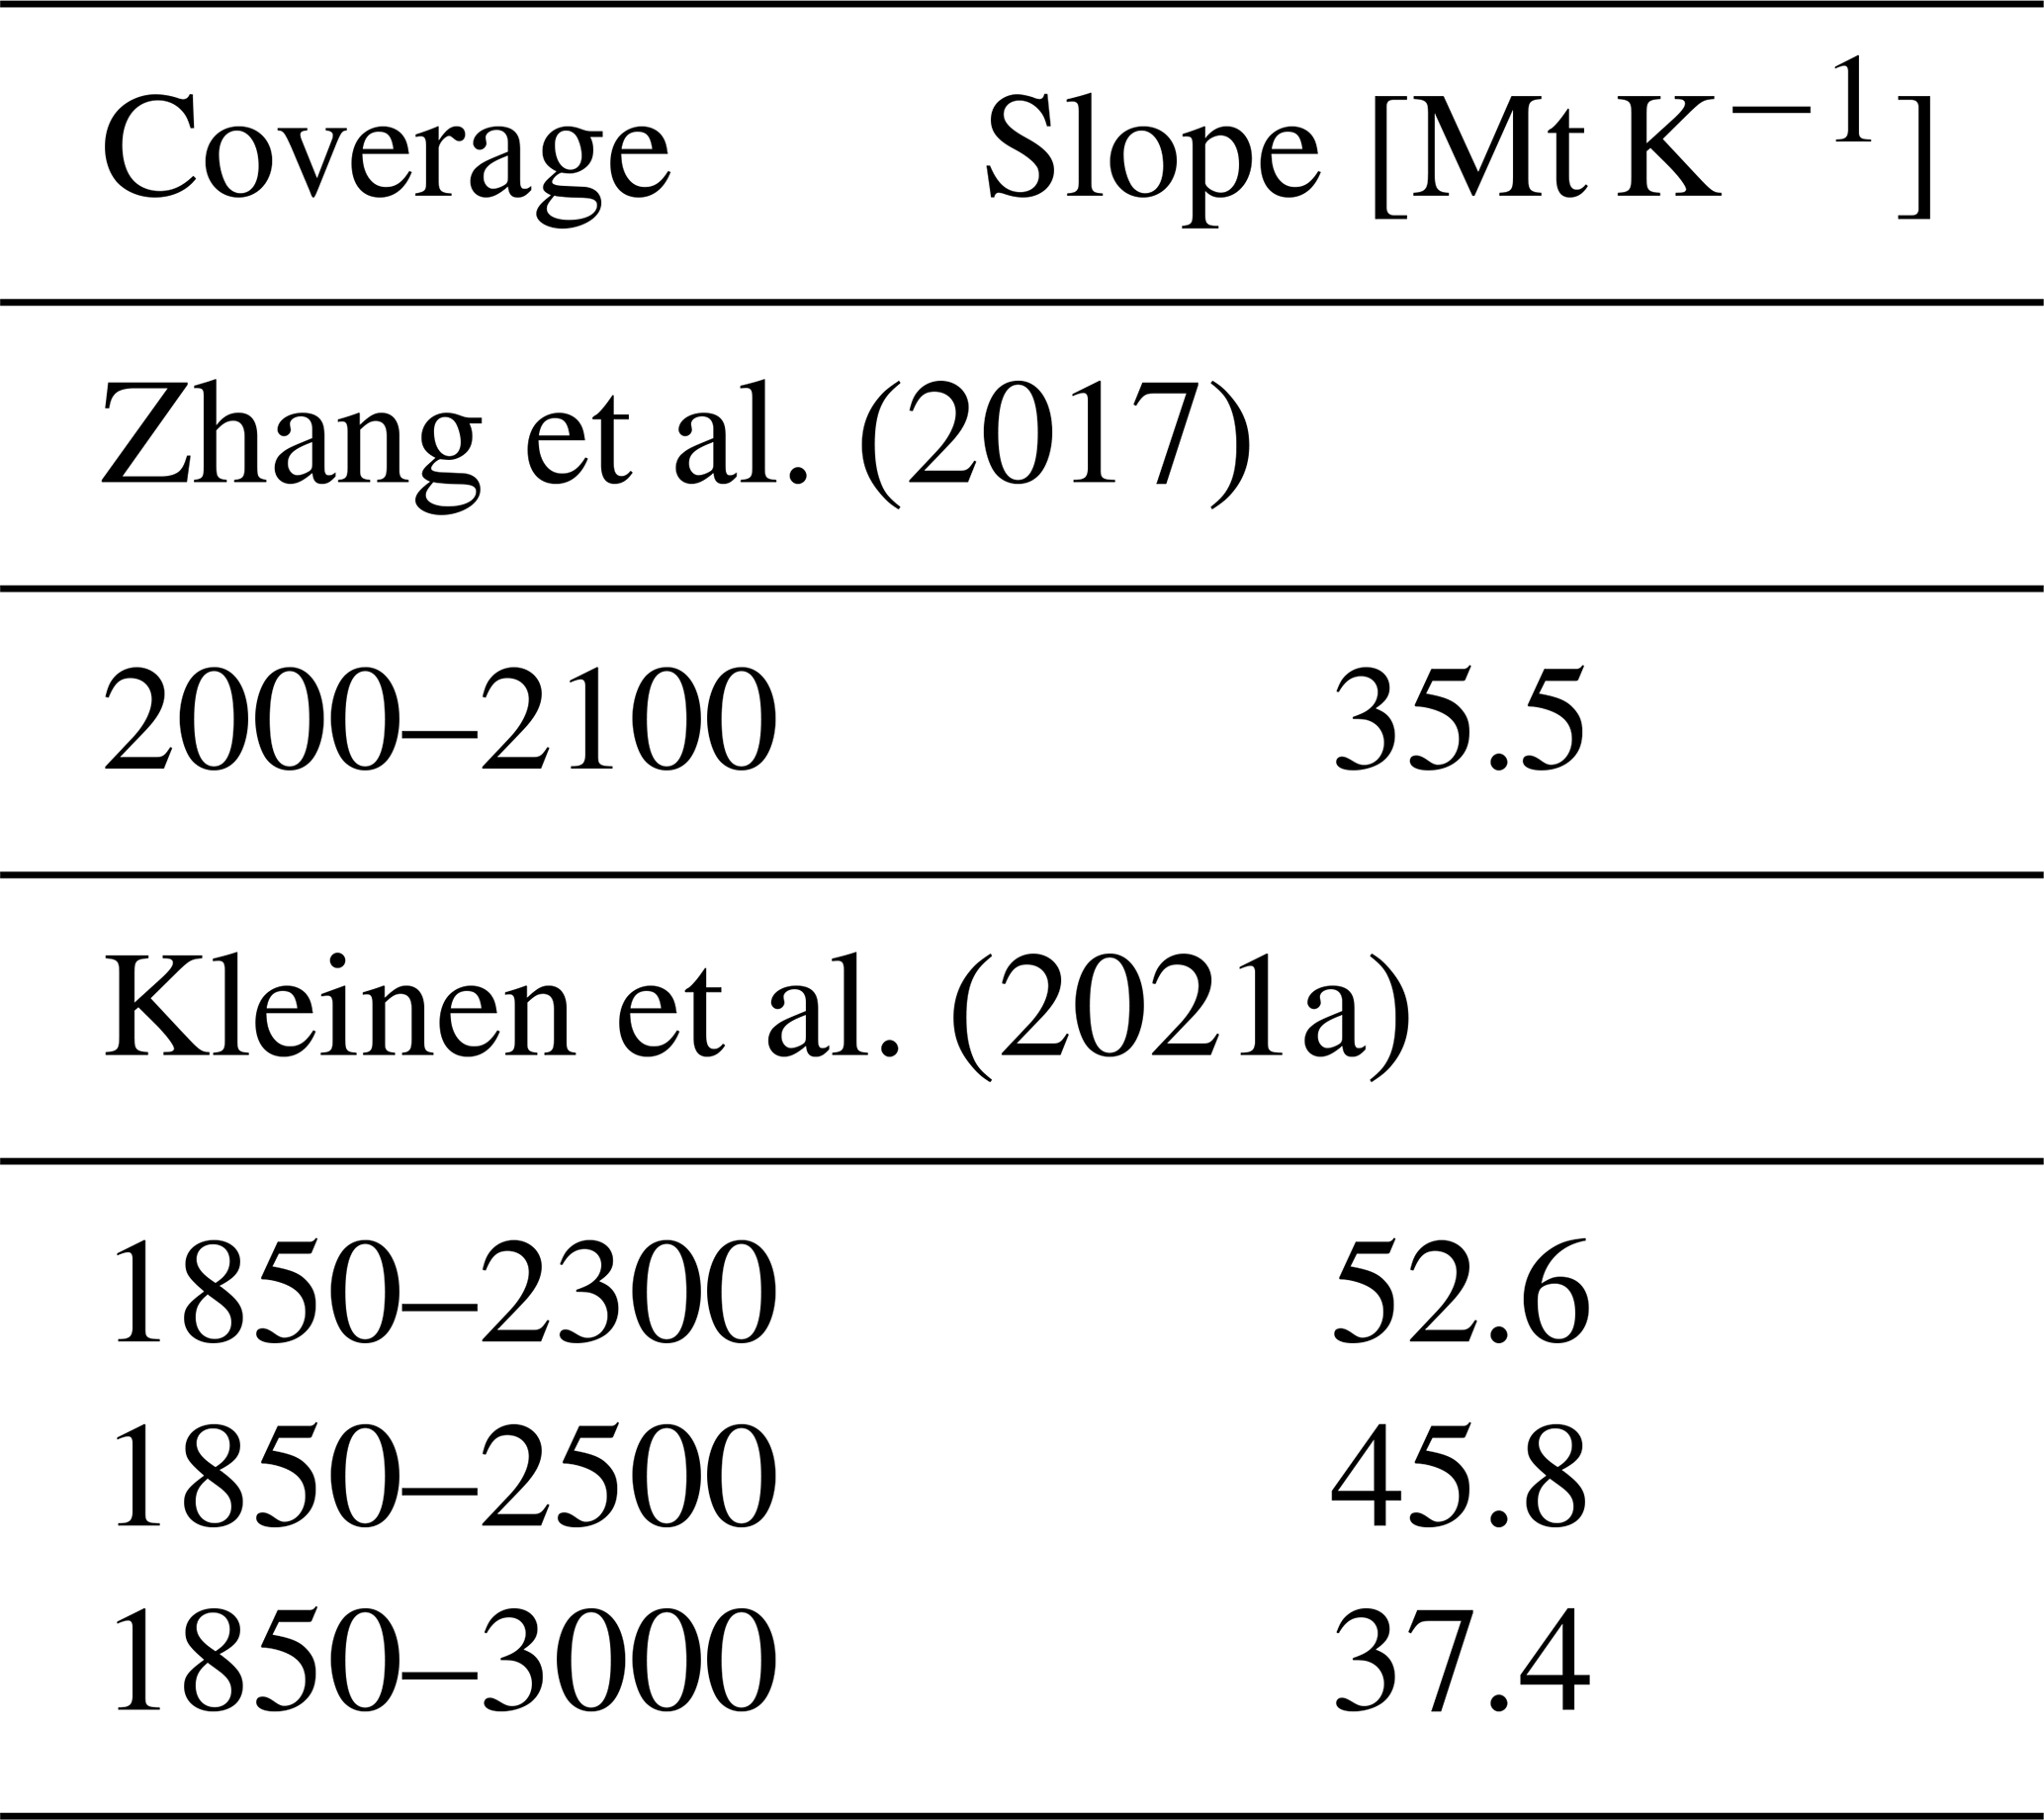
Table A2Summary statistics of the overshoot scenarios in the AR6 C1 and C2 categories. For both versions of MAGICC, the total number of years above 1.5 °C and the integral of the curve above 1.5° were calculated for all scenarios, with the means (and standard deviations) presented above.
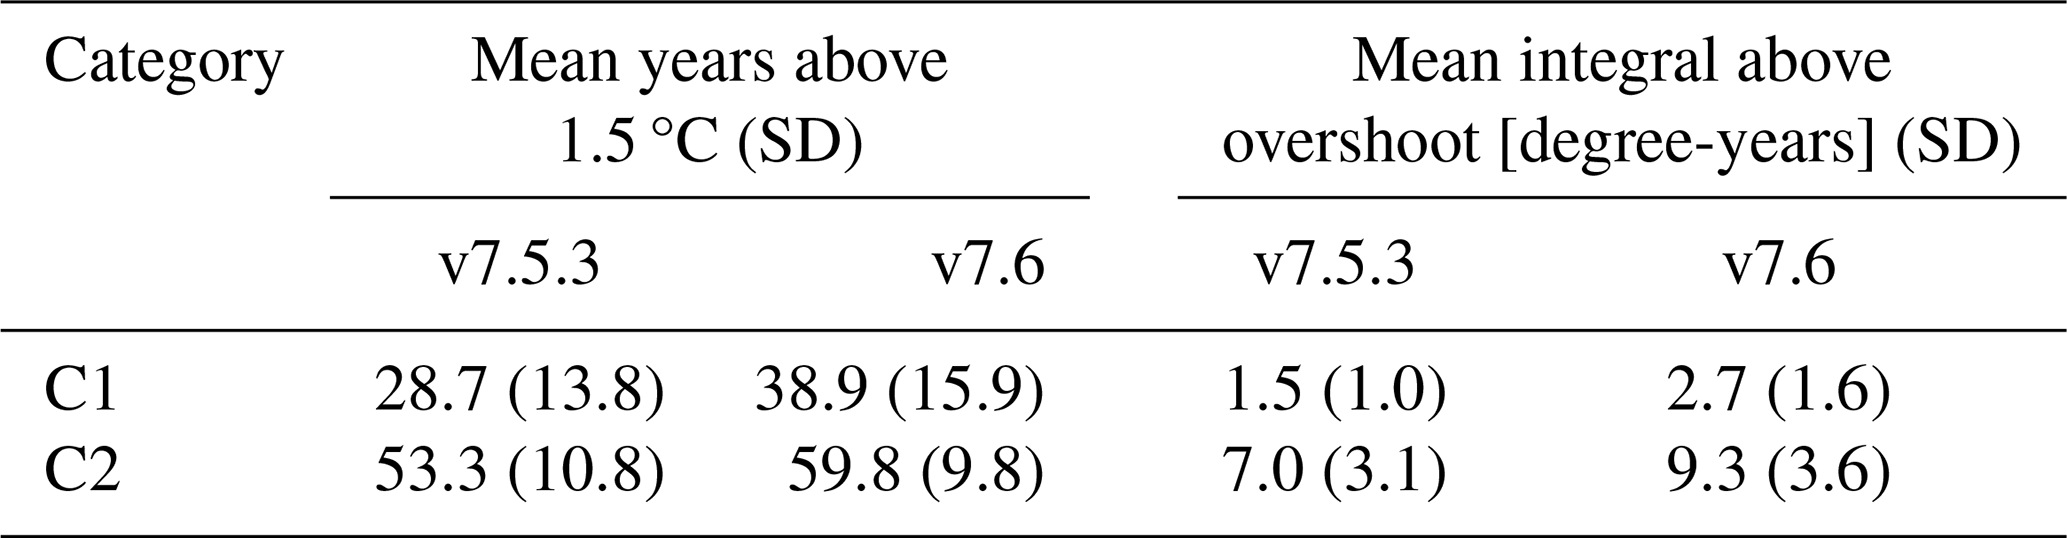
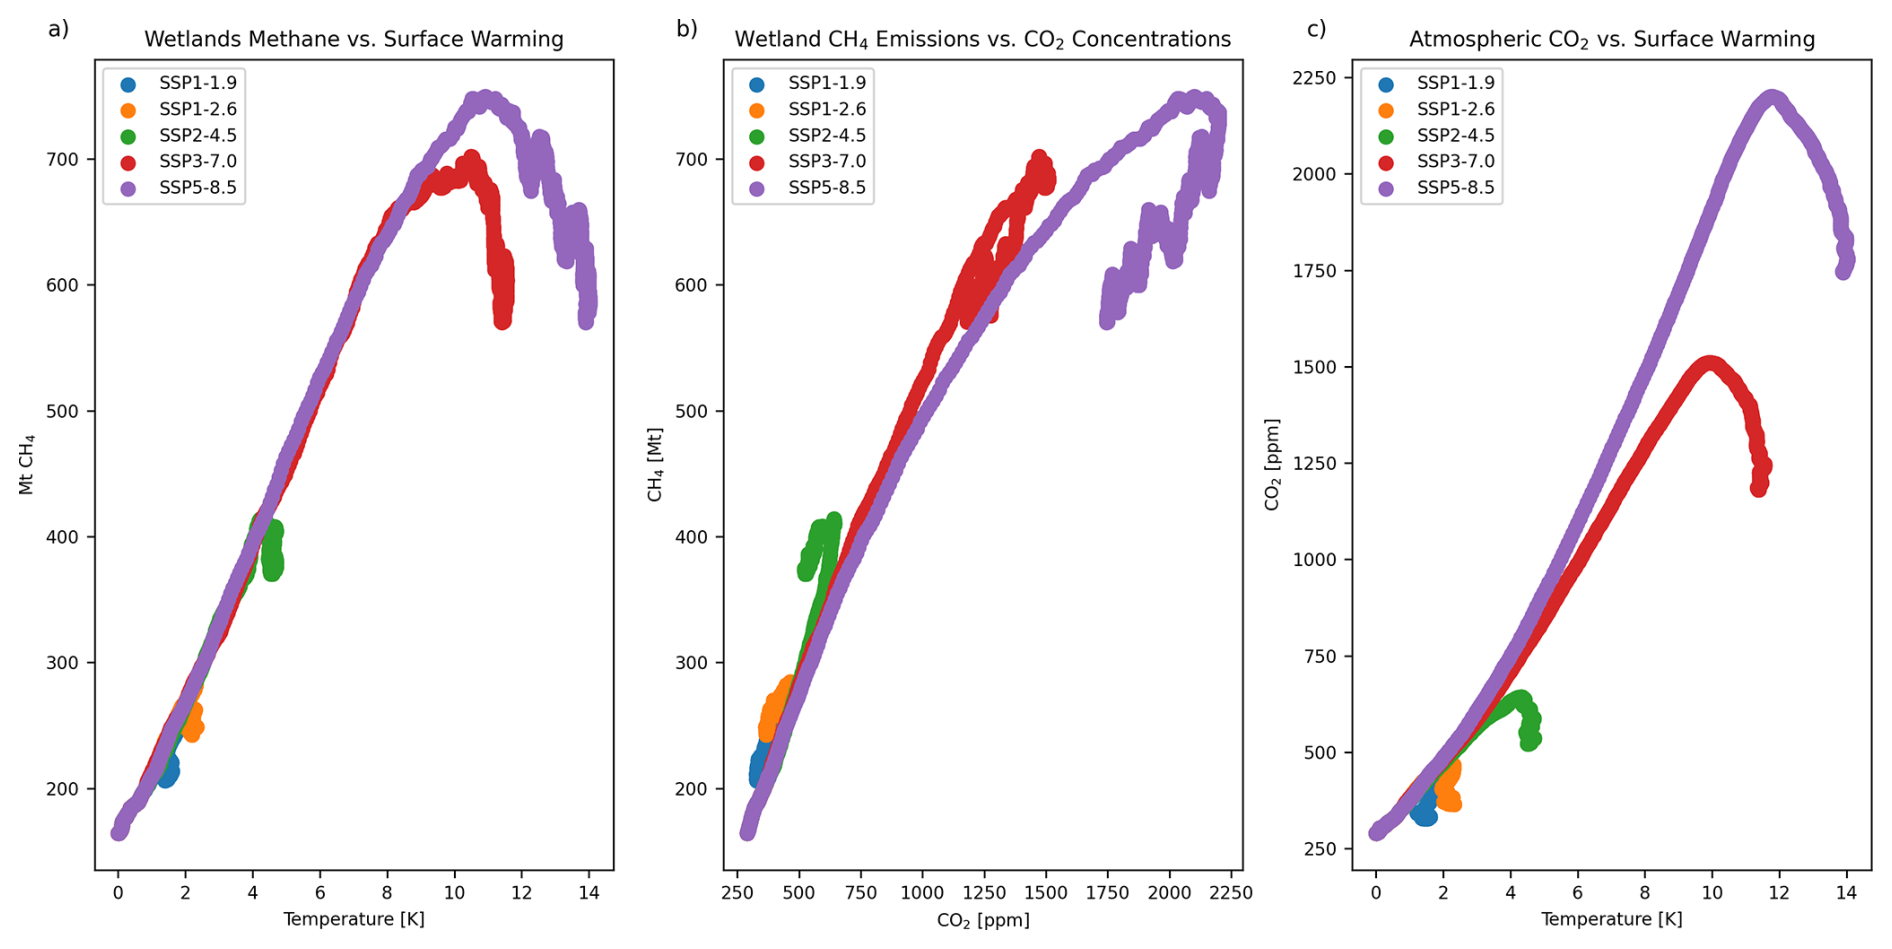
Figure A2Relationships between wetland methane emissions, atmospheric carbon dioxide concentrations, and surface warming from 1850 to 3000 in Kleinen et al. (2021a).
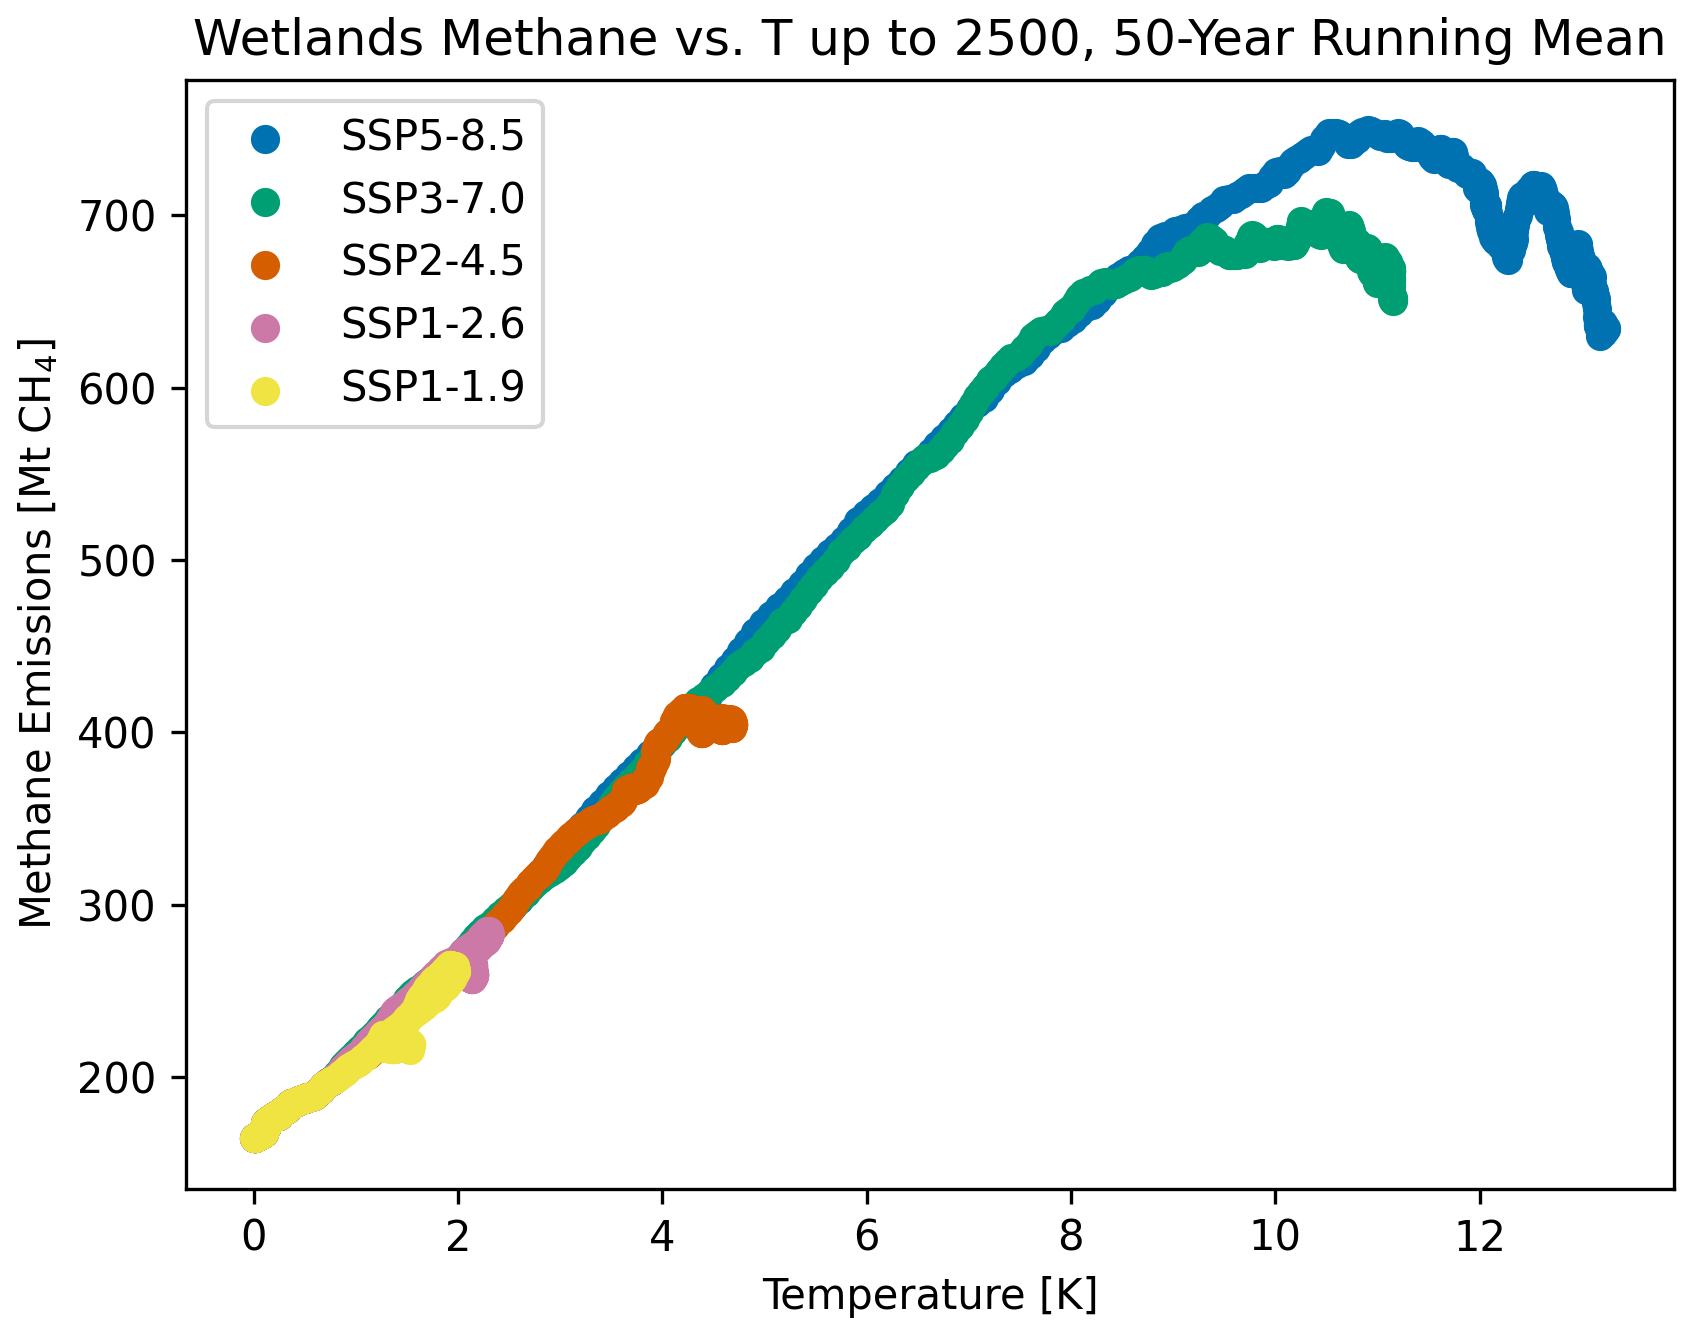
Figure A350-year running mean of Wetland methane emissions vs. global average temperature anomaly for each scenario run in Kleinen et al. (2021a).
Table A3C1 scenarios which no longer meet the criteria of staying below 1.5 °C warming in 2100 with a 50 % probability.
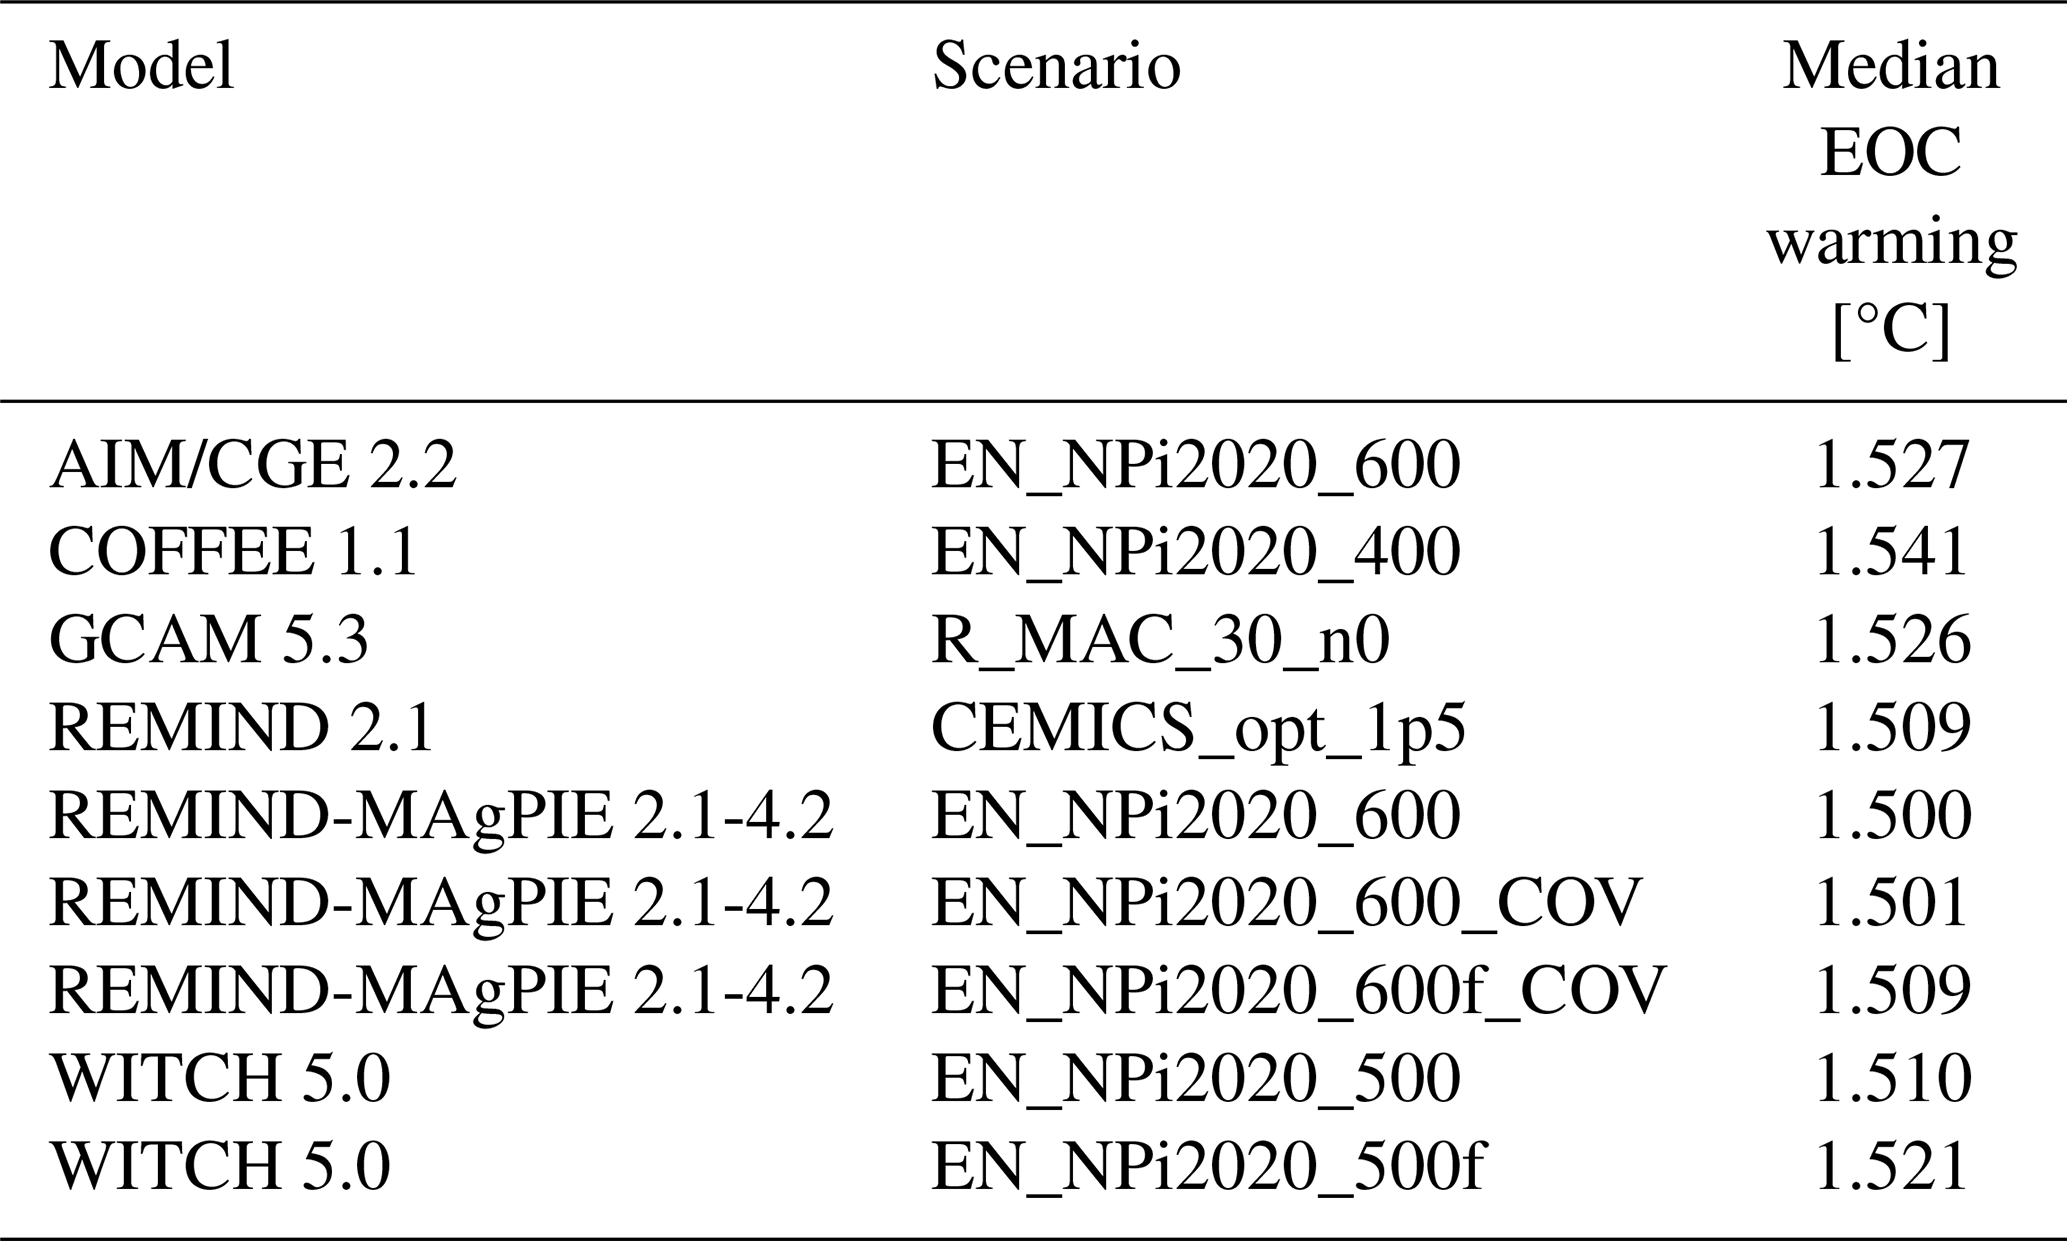
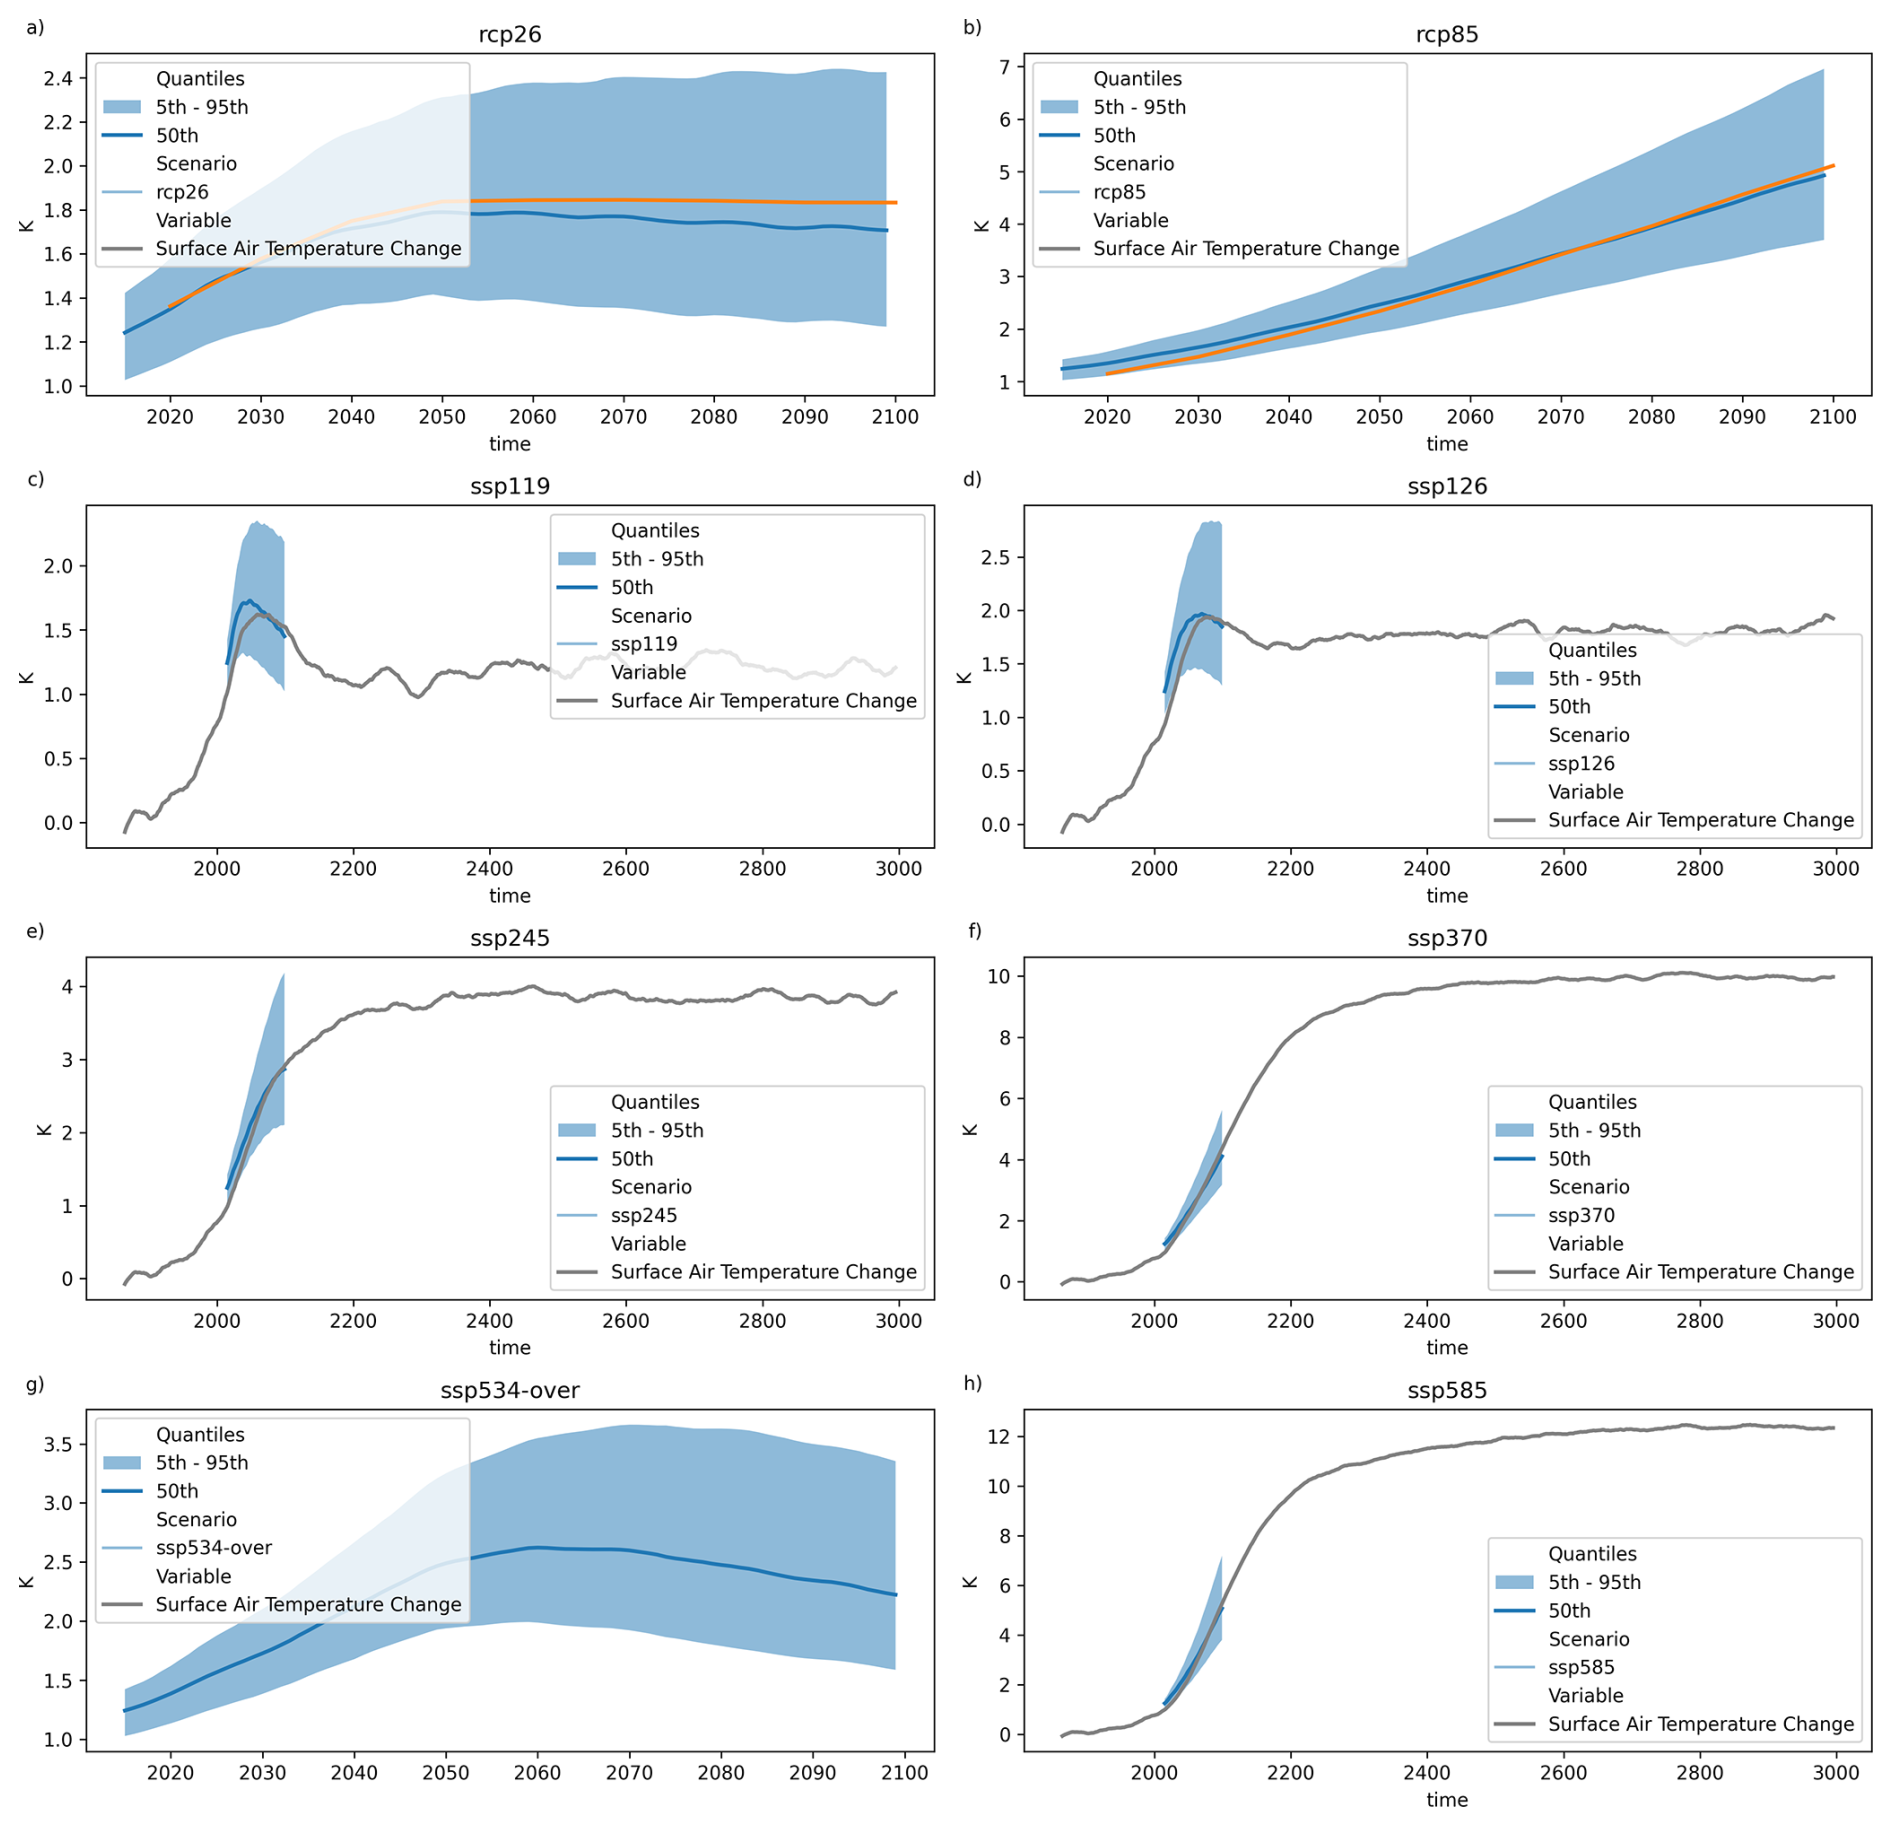
Figure A4Comparison of temperature data in Zhang et al. (2017) and Kleinen et al. (2021a) with the outputs from the same scenarios in MAGICC v7.6. The Kleinen et al. (2021a) runs extend to 3000, while the Zhang et al. (2017) and the MAGICC runs end in 2100.
Table A4C2 scenarios which no longer meet the criteria of staying below 1.5 °C warming in 2100 with a 50 % probability.
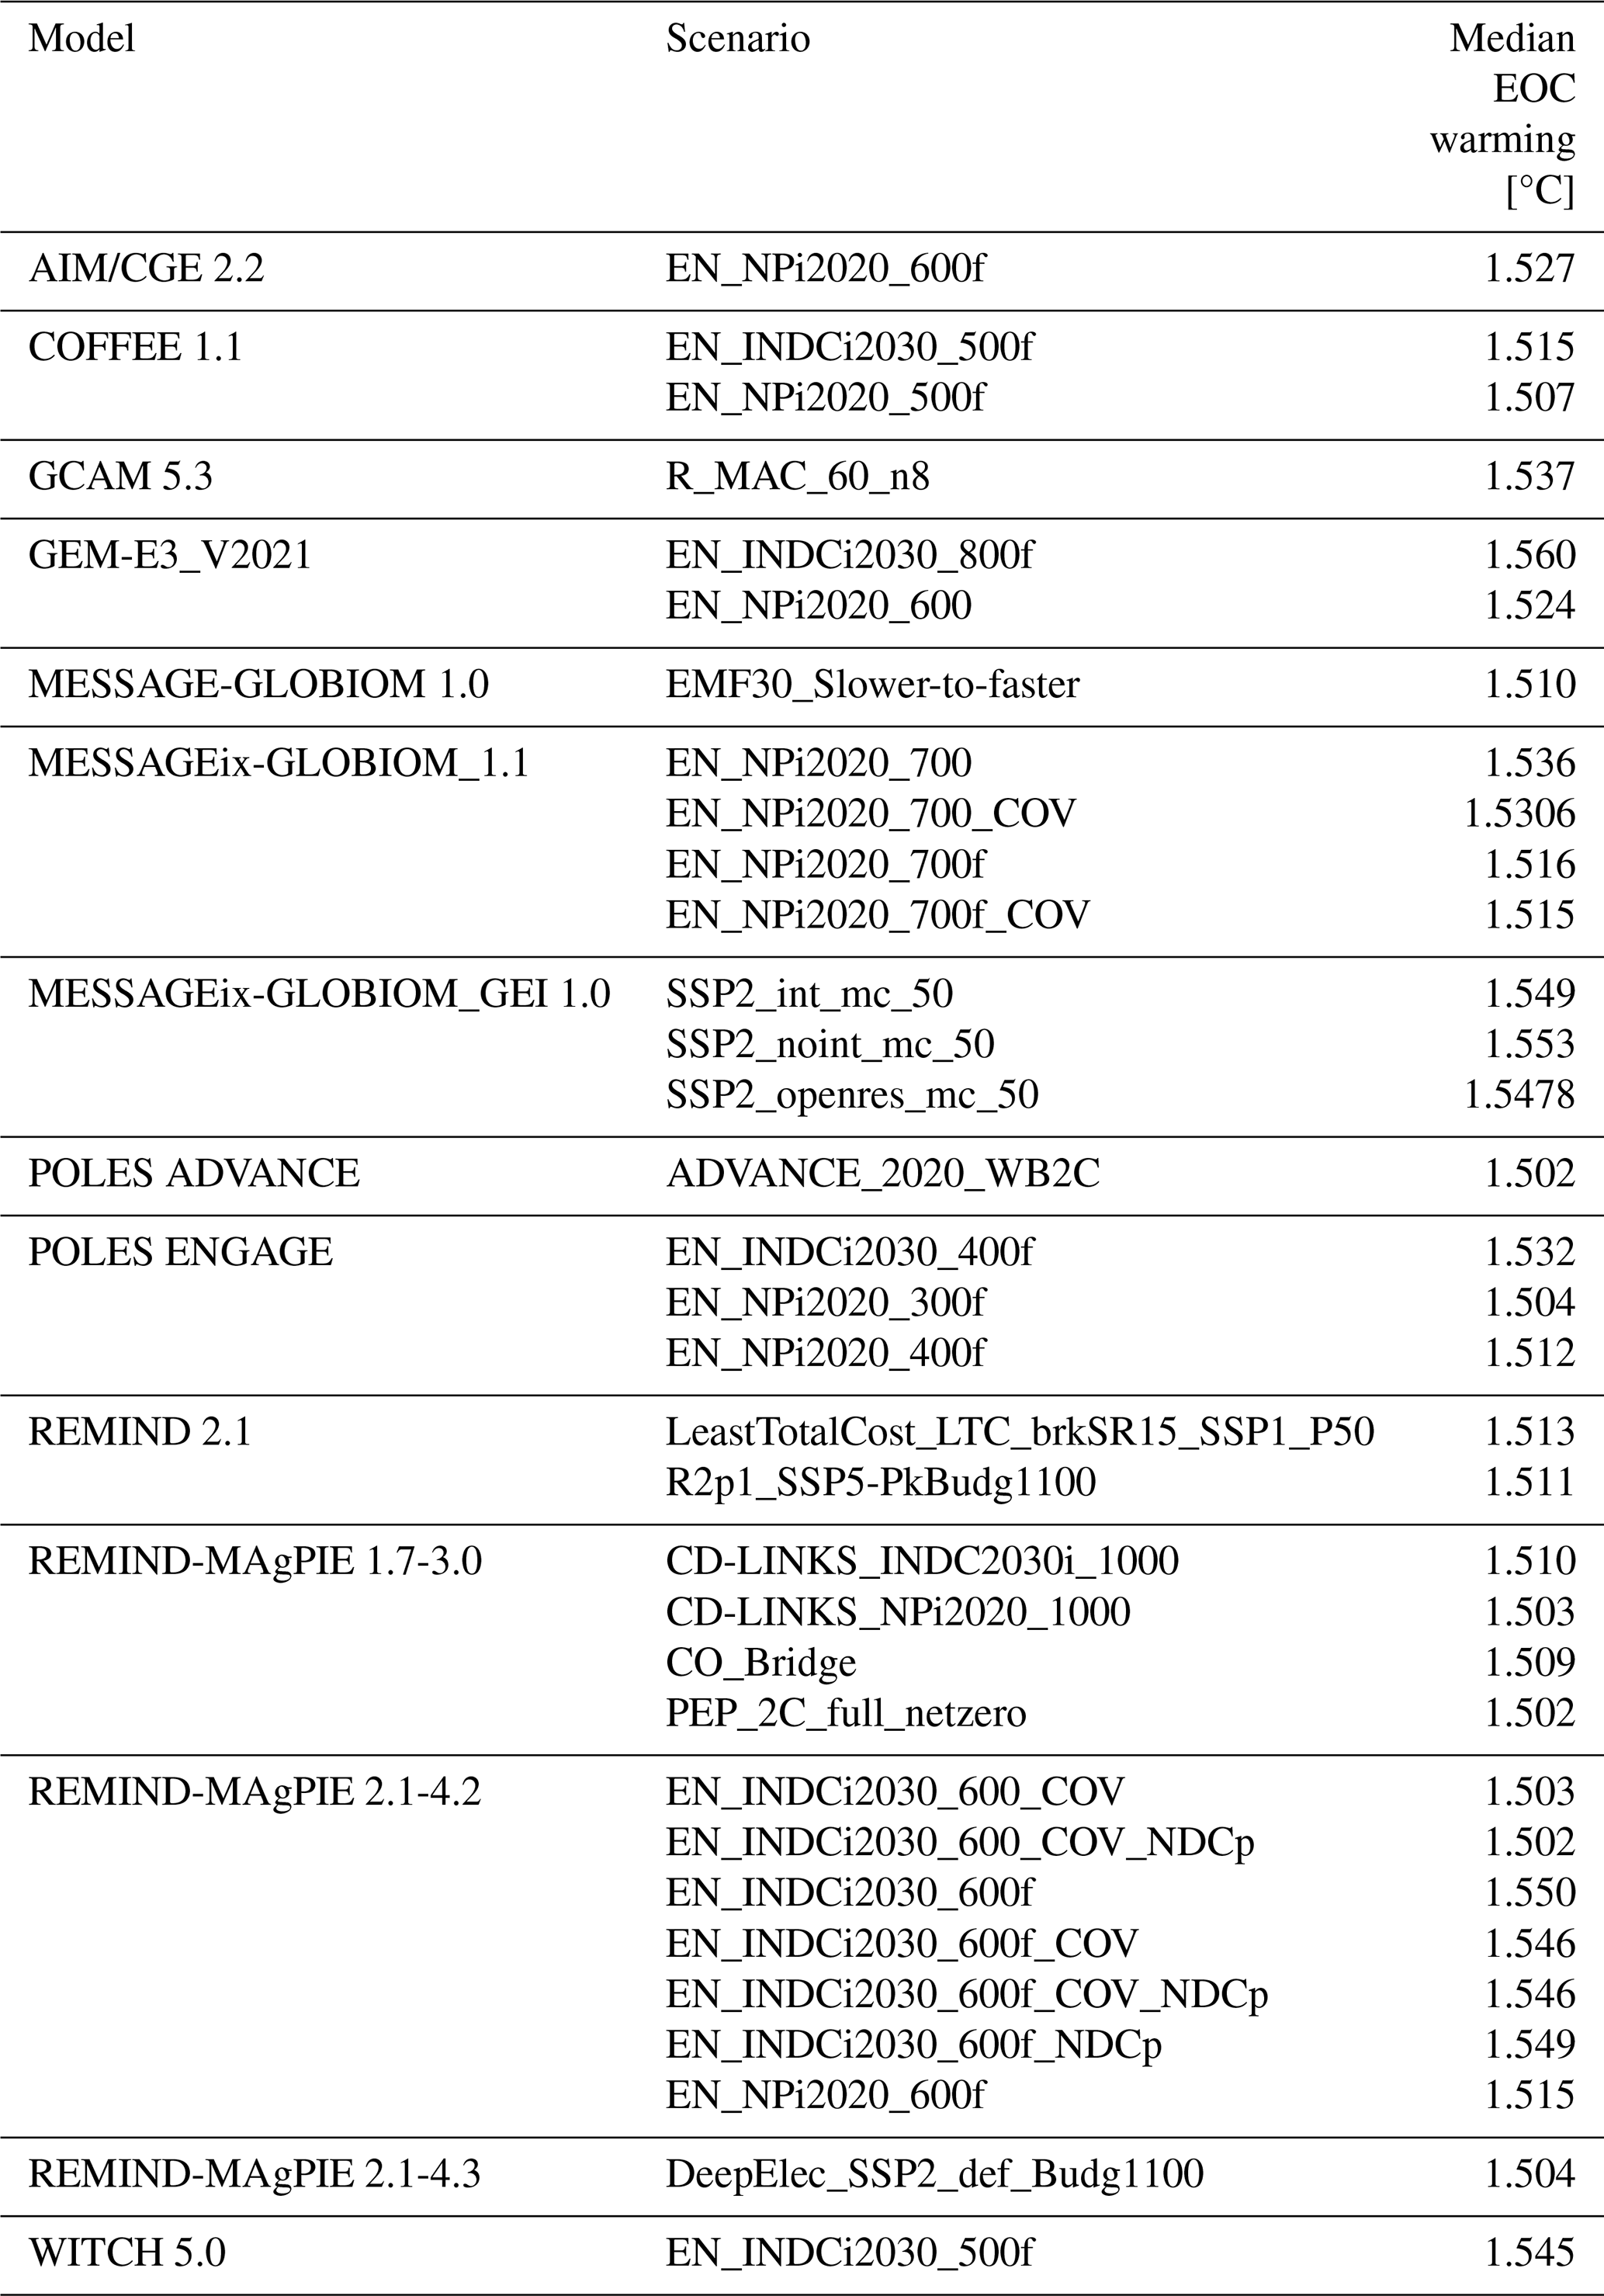
Table A5C3 scenarios which no longer meet the criteria of staying below 2 °C peak warming with a 67 % probability.
The current version of MAGICC v7.6 is available from the project website https://doi.org/10.5281/zenodo.17054564 (Nicholls et al., 2025) under the Creative Commons Attribution 4.0 International License (CC BY 4.0). The exact version of the probabilistic distribution used to produce the results used in this paper is archived on repository under https://doi.org/10.5281/zenodo.14678474 (Sloughter and Nicholls, 2025). The data from Kleinen et al. (2021a) is available from the World Data Center for Climate (WDCC) at DKRZ (Kleinen et al., 2021b). The data from Zhang et al. (2017) is available on the article website.
TS performed the data analysis, calibration, and updates to the code under supervision of ZN and JR and with input from GT, TK, and ZZ. ZN provided template notebooks for the calibration. TK and ZZ provided the data for analysis and gave feedback on the model development. TS wrote the first draft of this paper, all co-authors reviewed and edited the whole of the manuscript.
The contact author has declared that none of the authors has any competing interests.
Publisher's note: Copernicus Publications remains neutral with regard to jurisdictional claims made in the text, published maps, institutional affiliations, or any other geographical representation in this paper. The authors bear the ultimate responsibility for providing appropriate place names. Views expressed in the text are those of the authors and do not necessarily reflect the views of the publisher.
Trevor Sloughter acknowledges support from the project ESM2025 which received funding from the European Union's Horizon 2020 research and innovation programme under grant agreement no. 101003536. Thomas Kleinen acknowledges support from the PalMod project, funded by the German Federal Ministry of Education and Research (BMBF) (01LP1921A), and from the European Research Council (ERC) under the European Union's Horizon 2020 research and innovation program (grant agreement no. 951288, Q-Arctic).
This paper was edited by Cynthia Whaley and reviewed by two anonymous referees.
Byers, E., Krey, V., Kriegler, E., Riahi, K., Schaeffer, R., Kikstra, J., Lamboll, R., Nicholls, Z., Sandstad, M., Smith, C., van der Wijst, K., Al Khourdajie, A., Lecocq, F., Portugal-Pereira, J., Saheb, Y., Stromman, A., Winkler, H., Auer, C., Brutschin, E., Gidden, M., Hackstock, P., Harmsen, M., Huppmann, D., Kolp, P., Lepault, C., Lewis, J., Marangoni, G., Müller-Casseres, E., Skeie, R., Werning, M., Calvin, K., Forster, P., Guivarch, C., Hasegawa, T., Meinshausen, M., Peters, G., Rogelj, J., Samset, B., Steinberger, J., Tavoni, M., and van Vuuren, D.: AR6 Scenarios Database, Zenodo [data set], https://doi.org/10.5281/zenodo.7197970, 2022. a
Chang, K.-Y., Riley, W. J., Knox, S. H., Jackson, R. B., McNicol, G., Poulter, B., Aurela, M., Baldocchi, D., Bansal, S., Bohrer, G., Campbell, D. I., Cescatti, A., Chu, H., Delwiche, K. B., Desai, A. R., Euskirchen, E., Friborg, T. Goeckede, M., Helbig, M., Hemes, K. S., Hirano, T., Iwata, H., Kang, M., Keenan, T., Krauss, K. W., Lohila, A., Mammarella, I., Mitra, B., Miyata, A., Nilsson, M. B., Noormets, A., Oechel, W. C., Papale, D., Peichl, M., Reba, M. L., Rinne, J., Runkle, B. R. K., Ryu, Y., Sachs, T., Schäfer, K. V. R., Schmid, H. P., Shurpali, N., Sonnentag, O., Tang, A. C. I., Torn, M. S., Trotta, C., Tuittila, E.-S., Ueyama, M. Vargas, R., Vesala, T., Windham-Myers, L., Zhang, Z., and Zona, D.: Substantial hysteresis in emergent temperature sensitivity of global wetland CH4 emissions, Nat. Commun., 12, 2266, https://doi.org/10.1038/s41467-021-22452-1, 2021. a
Davidson, N. C., Fluet-Chouinard, E., and Finlayson, C. M.: Global extent and distribution of wetlands: trends and issues, Mar. Freshw. Res., 69, 620–627, 2018. a
Folberth, G., Staniaszek, Z., Archibald, A., Gedney, N., Griffiths, P., Jones, C., O'connor, F., Parker, R., Sellar, A., and Wiltshire, A.: Description and evaluation of an emission-driven and fully coupled methane cycle in UKESM1, J. Adv. Model. Earth Syst., 14, e2021MS002982, https://doi.org/10.1029/2021MS002982, 2022. a
Gedney, N., Huntingford, C., Comyn-Platt, E., and Wiltshire, A.: Significant feedbacks of wetland methane release on climate change and the causes of their uncertainty, Environ. Res. Lett., 14, 084027, https://doi.org/10.1088/1748-9326/ab2726, 2019. a
Im, U., Tsigaridis, K., Bauer, S. E., Shindell, D. T., Olivié, D., Wilson, S., Sørensen, L. L., Langen, P. L., and Eckhardt, S.: Future CH4 as modelled by a fully coupled Earth system model: prescribed GHG concentrations vs. interactive CH4 sources and sinks, Environ. Res.: Climate, 4, 015008, https://doi.org/10.1088/2752-5295/adb3c0, 2025. a, b, c, d
Kikstra, J. S., Nicholls, Z. R. J., Smith, C. J., Lewis, J., Lamboll, R. D., Byers, E., Sandstad, M., Meinshausen, M., Gidden, M. J., Rogelj, J., Kriegler, E., Peters, G. P., Fuglestvedt, J. S., Skeie, R. B., Samset, B. H., Wienpahl, L., van Vuuren, D. P., van der Wijst, K.-I., Al Khourdajie, A., Forster, P. M., Reisinger, A., Schaeffer, R., and Riahi, K.: The IPCC Sixth Assessment Report WGIII climate assessment of mitigation pathways: from emissions to global temperatures, Geosci. Model Dev., 15, 9075–9109, https://doi.org/10.5194/gmd-15-9075-2022, 2022. a
Kleinen, T., Gromov, S., Steil, B., and Brovkin, V.: Atmospheric methane underestimated in future climate projections, Environ. Res. Lett., 16, 094006, https://doi.org/10.1088/1748-9326/ac2f66, 2021a. a, b, c, d, e, f, g, h, i, j, k, l, m, n, o, p, q, r, s, t, u, v, w, x, y, z
Kleinen, T., Gromov, S., Steil, B., and Brovkin, V.: Natural methane emissions 1850–3009, https://hdl.handle.net/21.14106/edf716626b6105380067d7eeece2e4020464c793 (last access: 15 May 2025), 2021b. a
Mauritsen, T., Bader, J., Becker, T., Behrens, J., Bittner, M., Brokopf, R., Brovkin, V., Claussen, M., Crueger, T., Esch, M., Fast, I., Fiedler, S., Fläschner, D., Gayler, V., Giorgetta, M., Goll, D. S., Haak, H., Hagemann, S., Hedemann, C., Hohenegger, C., Ilyina, T., Jahns, T., Jimenéz-de-la Cuesta, D., Jungclaus, J., Kleinen, T., Kloster, S., Kracher, D., Kinne, S., Kleberg, D., Lasslop, G., Kornblueh, L., Marotzke, J., Matei, D., Meraner, K., Mikolajewicz, U., Modali, K., Möbis, B., Müller, W. A., Nabel, J. E. M. S., Nam, C. C. W., Notz, D., Nyawira, S.-S., Paulsen, H., Peters, K., Pincus, R., Pohlmann, H., Pongratz, J., Popp, M., Raddatz, T. J., Rast, S., Redler, R., Reick, C. H., Rohrschneider, T., Schemann, V., Schmidt, H., Schnur, R., Schulzweida, U., Six, K. D., Stein, L., Stemmler, I., Stevens, B., von Storch, J.-S., Tian, F., Voigt, A., Vrese, P., Wieners, K.-H., Wilkenskjeld, S., Winkler, A., and Roeckner, E.: Developments in the MPI-M Earth System Model version 1.2 (MPI-ESM1.2) and Its Response to Increasing CO2, J. Adv. Model. Earth Syst., 11, 998–1038, https://doi.org/10.1029/2018MS001400, 2019. a
Meinshausen, M., Raper, S. C. B., and Wigley, T. M. L.: Emulating coupled atmosphere-ocean and carbon cycle models with a simpler model, MAGICC6 – Part 1: Model description and calibration, Atmos. Chem. Phys., 11, 1417–1456, https://doi.org/10.5194/acp-11-1417-2011, 2011a. a, b, c
Meinshausen, M., Smith, S. J., Calvin, K., Daniel, J. S., Kainuma, M. L. T., Lamarque, J.-F., Matsumoto, K., Montzka, S. A., Raper, S. C. B., Riahi, K., Thomson, A., Velders, G. J. M., and van Vuuren, D. P. P.: The RCP greenhouse gas concentrations and their extensions from 1765 to 2300, Climatic Change, 109, 213, https://doi.org/10.1007/s10584-011-0156-z, 2011b. a
Meinshausen, M., Nicholls, Z. R. J., Lewis, J., Gidden, M. J., Vogel, E., Freund, M., Beyerle, U., Gessner, C., Nauels, A., Bauer, N., Canadell, J. G., Daniel, J. S., John, A., Krummel, P. B., Luderer, G., Meinshausen, N., Montzka, S. A., Rayner, P. J., Reimann, S., Smith, S. J., van den Berg, M., Velders, G. J. M., Vollmer, M. K., and Wang, R. H. J.: The shared socio-economic pathway (SSP) greenhouse gas concentrations and their extensions to 2500, Geosci. Model Dev., 13, 3571–3605, https://doi.org/10.5194/gmd-13-3571-2020, 2020. a, b, c
Nelder, J. A. and Mead, R.: A simplex method for function minimization, Comput. J., 7, 308–313, 1965. a
Nicholls, Z., Meinshausen, M., Lewis, J., Corradi, M. R., Dorheim, K., Gasser, T., Gieseke, R., Hope, A. P., Leach, N. J., McBride, L. A., Quilcaille, Y., Rogelj, J., Salawitch, R. J., Samset, B. H., Sandstad, M., Shiklomanov, A., Skeie, R. B., Smith, C. J., Smith, S. J., Su, X., Tsutsui, J., Vega-Westhoff, B., and Woodard, D. L.: Reduced Complexity Model Intercomparison Project Phase 2: Synthesizing Earth System Knowledge for Probabilistic Climate Projections, Earth's Future, 9, e2020EF001900, https://doi.org/10.1029/2020EF001900, 2021. a
Nicholls, Z., Lewis, J., Tang, G., Trevor, S., Nauels, A., Norton, A., Wigley, T., and Meinshausen, M.: Model for the Assessment of Greenhouse gas Induced Climate Change (MAGICC), Zenodo [code], https://doi.org/10.5281/zenodo.17054564, 2025. a, b
O'Neill, B. C., Tebaldi, C., van Vuuren, D. P., Eyring, V., Friedlingstein, P., Hurtt, G., Knutti, R., Kriegler, E., Lamarque, J.-F., Lowe, J., Meehl, G. A., Moss, R., Riahi, K., and Sanderson, B. .: The Scenario Model Intercomparison Project (ScenarioMIP) for CMIP6, Geosci. Model Dev., 9, 3461–3482, https://doi.org/10.5194/gmd-9-3461-2016, 2016. a
Peng, S., Lin, X., Thompson, R. L., Xi, Y., Liu, G., Hauglustaine, D., Lan, X., Poulter, B., Ramonet, M., Saunois, M., Yin, Y., Zhang, Z., Zheng, B., and Ciais, P.: Wetland emission and atmospheric sink changes explain methane growth in 2020, Nature, 612, 477–482, https://doi.org/10.1038/s41586-022-05447-w, 2022. a
Qu, Z., Jacob, D. J., Bloom, A. A., Worden, J. R., Parker, R. J., and Boesch, H.: Inverse modeling of 2010–2022 satellite observations shows that inundation of the wet tropics drove the 2020–2022 methane surge, P. Natl. Acad. Sci. USA, 121, e2402730121, https://doi.org/10.1073/pnas.2402730121, 2024. a
Riahi, K., van Vuuren, D. P., Kriegler, E., Edmonds, J., O'Neill, B. C., Fujimori, S., Bauer, N., Calvin, K., Dellink, R., Fricko, O., Lutz, W., Popp, A., Cuaresma, J. C., KC, S., Leimbach, M., Jiang, L., Kram, T., Rao, S., Emmerling, J., Ebi, K., Hasegawa, T., Havlik, P., Humpenöder, F., Da Silva, L. A., Smith, S., Stehfest, E., Bosetti, V., Eom, J., Gernaat, D., Masui, T., Rogelj, J., Strefler, J., Drouet, L., Krey, V., Luderer, G., Harmsen, M., Takahashi, K., Baumstark, L., Doelman, J. C., Kainuma, M., Klimont, Z., Marangoni, G., Lotze-Campen, H., Obersteiner, M., Tabeau, A., and Tavoni, M.: The Shared Socioeconomic Pathways and their energy, land use, and greenhouse gas emissions implications: An overview, Global Environ. Change, 42, 153–168, https://doi.org/10.1016/j.gloenvcha.2016.05.009, 2017. a
Riahi, K., Schaeffer, R., Arango, J., Calvin, K., Guivarch, C., Hasegawa, T., Jiang, K., Kriegler, E., Matthews, R., Peters, G., Rao, A., Robertson, S., Sebbit, A., Steinberger, J., Tavoni, M., and Van Vuuren, D.: Mitigation pathways compatible with long-term goals, in: Climate Change 2022: Mitigation of Climate Change. Contribution of Working Group III to the Sixth Assessment Report of the Intergovernmental Panel on Climate Change, book section 3, edited by: Shukla, P., Skea, J., Slade, R., Khourdajie, A. A., van Diemen, R., McCollum, D., Pathak, M., Some, S., Vyas, P., Fradera, R., Belkacemi, M., Hasija, A., Lisboa, G., Luz, S., and Malley, J., Cambridge University Press, Cambridge, UK and New York, NY, USA, https://doi.org/10.1017/9781009157926.005, 2022. a
Saunois, M., Stavert, A. R., Poulter, B., Bousquet, P., Canadell, J. G., Jackson, R. B., Raymond, P. A., Dlugokencky, E. J., Houweling, S., Patra, P. K., Ciais, P., Arora, V. K., Bastviken, D., Bergamaschi, P., Blake, D. R., Brailsford, G., Bruhwiler, L., Carlson, K. M., Carrol, M., Castaldi, S., Chandra, N., Crevoisier, C., Crill, P. M., Covey, K., Curry, C. L., Etiope, G., Frankenberg, C., Gedney, N., Hegglin, M. I., Höglund-Isaksson, L., Hugelius, G., Ishizawa, M., Ito, A., Janssens-Maenhout, G., Jensen, K. M., Joos, F., Kleinen, T., Krummel, P. B., Langenfelds, R. L., Laruelle, G. G., Liu, L., Machida, T., Maksyutov, S., McDonald, K. C., McNorton, J., Miller, P. A., Melton, J. R., Morino, I., Müller, J., Murguia-Flores, F., Naik, V., Niwa, Y., Noce, S., O'Doherty, S., Parker, R. J., Peng, C., Peng, S., Peters, G. P., Prigent, C., Prinn, R., Ramonet, M., Regnier, P., Riley, W. J., Rosentreter, J. A., Segers, A., Simpson, I. J., Shi, H., Smith, S. J., Steele, L. P., Thornton, B. F., Tian, H., Tohjima, Y., Tubiello, F. N., Tsuruta, A., Viovy, N., Voulgarakis, A., Weber, T. S., van Weele, M., van der Werf, G. R., Weiss, R. F., Worthy, D., Wunch, D., Yin, Y., Yoshida, Y., Zhang, W., Zhang, Z., Zhao, Y., Zheng, B., Zhu, Q., Zhu, Q., and Zhuang, Q.: The Global Methane Budget 2000–2017, Earth Syst. Sci. Data, 12, 1561–1623, https://doi.org/10.5194/essd-12-1561-2020, 2020. a, b
Saunois, M., Martinez, A., Poulter, B., Zhang, Z., Raymond, P. A., Regnier, P., Canadell, J. G., Jackson, R. B., Patra, P. K., Bousquet, P., Ciais, P., Dlugokencky, E. J., Lan, X., Allen, G. H., Bastviken, D., Beerling, D. J., Belikov, D. A., Blake, D. R., Castaldi, S., Crippa, M., Deemer, B. R., Dennison, F., Etiope, G., Gedney, N., Höglund-Isaksson, L., Holgerson, M. A., Hopcroft, P. O., Hugelius, G., Ito, A., Jain, A. K., Janardanan, R., Johnson, M. S., Kleinen, T., Krummel, P. B., Lauerwald, R., Li, T., Liu, X., McDonald, K. C., Melton, J. R., Mühle, J., Müller, J., Murguia-Flores, F., Niwa, Y., Noce, S., Pan, S., Parker, R. J., Peng, C., Ramonet, M., Riley, W. J., Rocher-Ros, G., Rosentreter, J. A., Sasakawa, M., Segers, A., Smith, S. J., Stanley, E. H., Thanwerdas, J., Tian, H., Tsuruta, A., Tubiello, F. N., Weber, T. S., van der Werf, G. R., Worthy, D. E. J., Xi, Y., Yoshida, Y., Zhang, W., Zheng, B., Zhu, Q., Zhu, Q., and Zhuang, Q.: Global Methane Budget 2000–2020, Earth Syst. Sci. Data, 17, 1873–1958, https://doi.org/10.5194/essd-17-1873-2025, 2025. a
Skeie, R. B., Hodnebrog, Ø., and Myhre, G.: Trends in atmospheric methane concentrations since 1990 were driven and modified by anthropogenic emissions, Commun. Earth Environ., 4, 317, https://doi.org/10.1038/s43247-023-00969-1, 2023. a
Sloughter, T. and Nicholls, Z.: MAGICC AR7 fast track probabilistic distribution, Zenodo [data set], https://doi.org/10.5281/zenodo.14678474, 2025. a, b
Zhang, Z., Zimmermann, N. E., Stenke, A., Li, X., Hodson, E. L., Zhu, G., Huang, C., and Poulter, B.: Emerging role of wetland methane emissions in driving 21st century climate change, P. Natl. Acad. Sci. USA, 114, 9647–9652, 2017. a, b, c, d, e, f, g, h, i, j, k, l, m
Zhang, Z., Poulter, B., Feldman, A. F., Ying, Q., Ciais, P., Peng, S., and Li, X.: Recent intensification of wetland methane feedback, Nat. Clim. Change, 13, 430–433, 2023. a
Zhang, Z., Poulter, B., Melton, J. R., Riley, W. J., Allen, G. H., Beerling, D. J., Bousquet, P., Canadell, J. G., Fluet-Chouinard, E., Ciais, P., Gedney, N., Hopcroft, P. O., Ito, A., Jackson, R. B., Jain, A. K., Jensen, K., Joos, F., Kleinen, T., Knox, S. H., Li, T., Li, X., Liu, X., McDonald, K., McNicol, G., Miller, P. A., Müller, J., Patra, P. K., Peng, C., Peng, S., Qin, Z., Riggs, R. M., Saunois, M., Sun, Q., Tian, H., Xu, X., Yao, Y., Xi, Y., Zhang, W., Zhu, Q., Zhu, Q., and Zhuang, Q.: Ensemble estimates of global wetland methane emissions over 2000–2020, Biogeosciences, 22, 305–321, https://doi.org/10.5194/bg-22-305-2025, 2025. a, b, c, d
Zhu, B., Qiu, C., Gasser, T., Ciais, P., Lamboll, R. D., Ballantyne, A., Chang, J., Chaudhary, N., Gallego-Sala, A. V., Guenet, B., Holden, J., Joos, F., Kleinen, T., Kwon, M. J., Melnikova, I., Müller, J., Page, S., Salmon, E., Schleussner, C.-F., Schurgers, G., Shrivastav, G. P., Shurpali, N. J., Tanaka, K., Wårlind, D., Westermann, S., Xi, Y., Zhang, W., Zhang, Y., and Zhu, D.: Warming of northern peatlands increases the global temperature overshoot challenge, One Earth, 8, https://doi.org/10.1016/j.oneear.2025.101353, 2025. a