
the Creative Commons Attribution 4.0 License.
the Creative Commons Attribution 4.0 License.
 | 23 Sep 2026
The North American CORDEX-CMIP6 WRF evaluation run: comparing historical simulations from 25 km to convection-permitting scales

Trude Eidhammer
Rachel McCrary
Melissa Bukovsky
Stefan Rahimi
Hsin-I Chang
Seth McGinnis
Earth system models (ESMs) provide essential insight into large-scale climate variability and change but often lack the spatial resolution required to represent fine-scale processes critical for regional impacts and adaptation planning. To help address this gap, we present an updated high-resolution regional climate simulation for North America (NA) as part of the Coordinated Regional Downscaling Experiment (CORDEX). We evaluate a new reanalysis forced NA-CORDEX simulation at 12 km resolution against observational datasets, an earlier NA-CORDEX CMIP5 simulation (25 km), and the convection-permitting CONUS-404 simulation (4 km). Through these comparisons, we assess how horizontal resolution and regional model configuration influence historical differences from reanalysis and the representation of extremes, with a particular focus on precipitation processes given that convection is parameterized at 12 km. Relative to previous NA-CORDEX-CMIP5 simulations, the new CMIP6-based evaluation run reduces mean differences in temperature and precipitation compared to reanalysis and other observationally based datasets, improves the magnitude and timing of the diurnal precipitation cycle across North America, and substantially improves the representation of tropical cyclone structure and intensity. Notably, extreme precipitation rates are well captured at 12 km when compared to the convection-permitting simulations. While long-term convection-permitting climate simulations remain a key objective for regional modeling, the current generation of CORDEX simulations provides a practical balance between computational efficiency and physical realism for continental-scale climate assessment.
- Article
(22778 KB) - Full-text XML
-
Supplement
(27996 KB) - BibTeX
- EndNote


Regional climate simulations provide critical information for climate adaptation and decision-making by resolving atmospheric processes at scales finer than global Earth System Models (ESMs). The Coordinated Regional Downscaling Experiment (CORDEX; Giorgi and Gutowski, 2015) has facilitated the production of dynamically downscaled climate projections suitable for regional impact assessment. However, the fidelity of these projections depends critically on both model resolution and the representation of key physical processes.
A fundamental consideration in regional atmospheric modeling is the spatial resolution at which different processes can be explicitly resolved versus parameterized. For convection, 4 km resolution represents a critical threshold where this process can be permitted (Langhans et al., 2012). While convection-permitting simulations remain computationally prohibitive for ensembles of multi-decadal climate projections that adequately sample structural uncertainty over large domains (Qian et al., 2016), current-generation North American CORDEX (NA-CORDEX) simulations have progressed from 25–50 km in the CMIP5 era (Bukovsky and Mearns, 2020; Mearns et al., 2017) to 12 km horizontal resolution when driven by CMIP6 ESMs (Paquin et al., 2025). Although this resolution refinement enables better representation of topographic effects, land-surface heterogeneity, and mesoscale atmospheric features, it still requires parameterization of convective processes.
Recent advances in the version of the Weather Research and Forecasting (WRF) model used in this study (Skamarock et al., 2019) include improvements to core physics schemes since the production of NA-CORDEX-CMIP5. The Noah Multi-Parameterization (Noah-MP) land surface model (Niu et al., 2011) offers advantages over the previous Noah land surface model (Tewari et al., 2004) through enhanced representation of vegetation dynamics, snow processes, and soil thermal and hydrological properties (He et al., 2023; Li et al., 2022). Multiple parameterization options in Noah-MP allow for more realistic simulation of land-atmosphere coupling and surface energy partitioning, which are critical for representing extremes in temperature and precipitation (Ma et al., 2017).
Similarly, the transition from the standard Rapid Radiative Transfer Model (RRTM) radiation scheme (Mlawer et al., 1997) to RRTMG (G stands for Global climate model) (Iacono et al., 2008) provides improved computational efficiency and more realistic treatment of aerosol and cloud radiative effects (Bae et al., 2016). The microphysics scheme has also evolved from the simpler WRF Single Moment 4 scheme (Hong et al., 2004) to the more sophisticated Thompson scheme (Thompson et al., 2008, 2016), which includes improved ice nucleation processes, graupel representation, and more realistic hydrometeor size distributions – all of which are essential for accurately simulating precipitation intensity and type.
Given the computational costs associated with convection-permitting simulations and the practical need for multi-decadal climate projections, we hypothesize that 12 km resolution represents a balance between physical realism and computational feasibility. However, evaluation is essential to understand which phenomena are well captured at this scale and where limitations persist. Here we present the model configuration and evaluation run of our contribution to NA-CORDEX, with two primary objectives: (1) assessing improvements from the corresponding previous-generation simulation in mean climatological biases, diurnal precipitation processes, seasonal hydroclimate, snow, and extreme events (precipitation extremes, tropical cyclones, and mesoscale convective systems), and (2) identifying how these improvements compare to a similar simulation at a convection-permitting scale.
To address these objectives, we compare climatological biases and meteorological phenomena between three WRF-based dynamically downscaled datasets: the 4 km convection-permitting CONUS404 (C404) dataset (Rasmussen et al., 2023a), the new 12 km NA-CORDEX-CMIP6 (NAC6) simulation presented here, and the NA-CORDEX-CMIP5 (NAC5) simulation at 25 km (Mearns et al., 2017). The C404 and NAC6 simulations downscale the ERA5 reanalysis (Hersbach et al., 2020), while NAC5 downscales ERA-Interim (Balsamo et al., 2015). Because all three simulations share the same WRF dynamical core, domain-nesting approach, and spectral nudging methodology, the remaining differences are largely isolated to physics parameterizations, resolution, and driving reanalysis, allowing us to assess the quality of the new NAC6 simulation with reduced confounding from structural differences between modeling systems.
2.1 Regional model configuration for NA-CORDEX-CMIP6
We use the WRF model version 4.6.1 with a domain that spans the North America CORDEX domain (Fig. 1): it is 708 gridpoints east-to-west and 674 north-to-south, and centered on 97° W and 45° N (8496 km by 8088 km). There are 38 stretched vertical levels with a model top of 50 hPa. The ERA5 reanalysis provides lateral boundary conditions, surface variables for initialization (soil moisture, skin temperature), sea surface temperature, and sea ice fraction. A relaxation layer of 10 gridpoints in each direction smooths the transition between the forcing data and the WRF simulation and is subsequently removed in post-processing. Spectral nudging of temperature, winds, and geopotential height is applied above the boundary layer for scales > 1000 km (von Storch et al., 2000; Miguez-Macho et al., 2004), similar to the WRF implementation of Bowden et al. (2012), to constrain the large-scale circulation toward the driving reanalysis while allowing mesoscale processes to develop more freely within the domain.
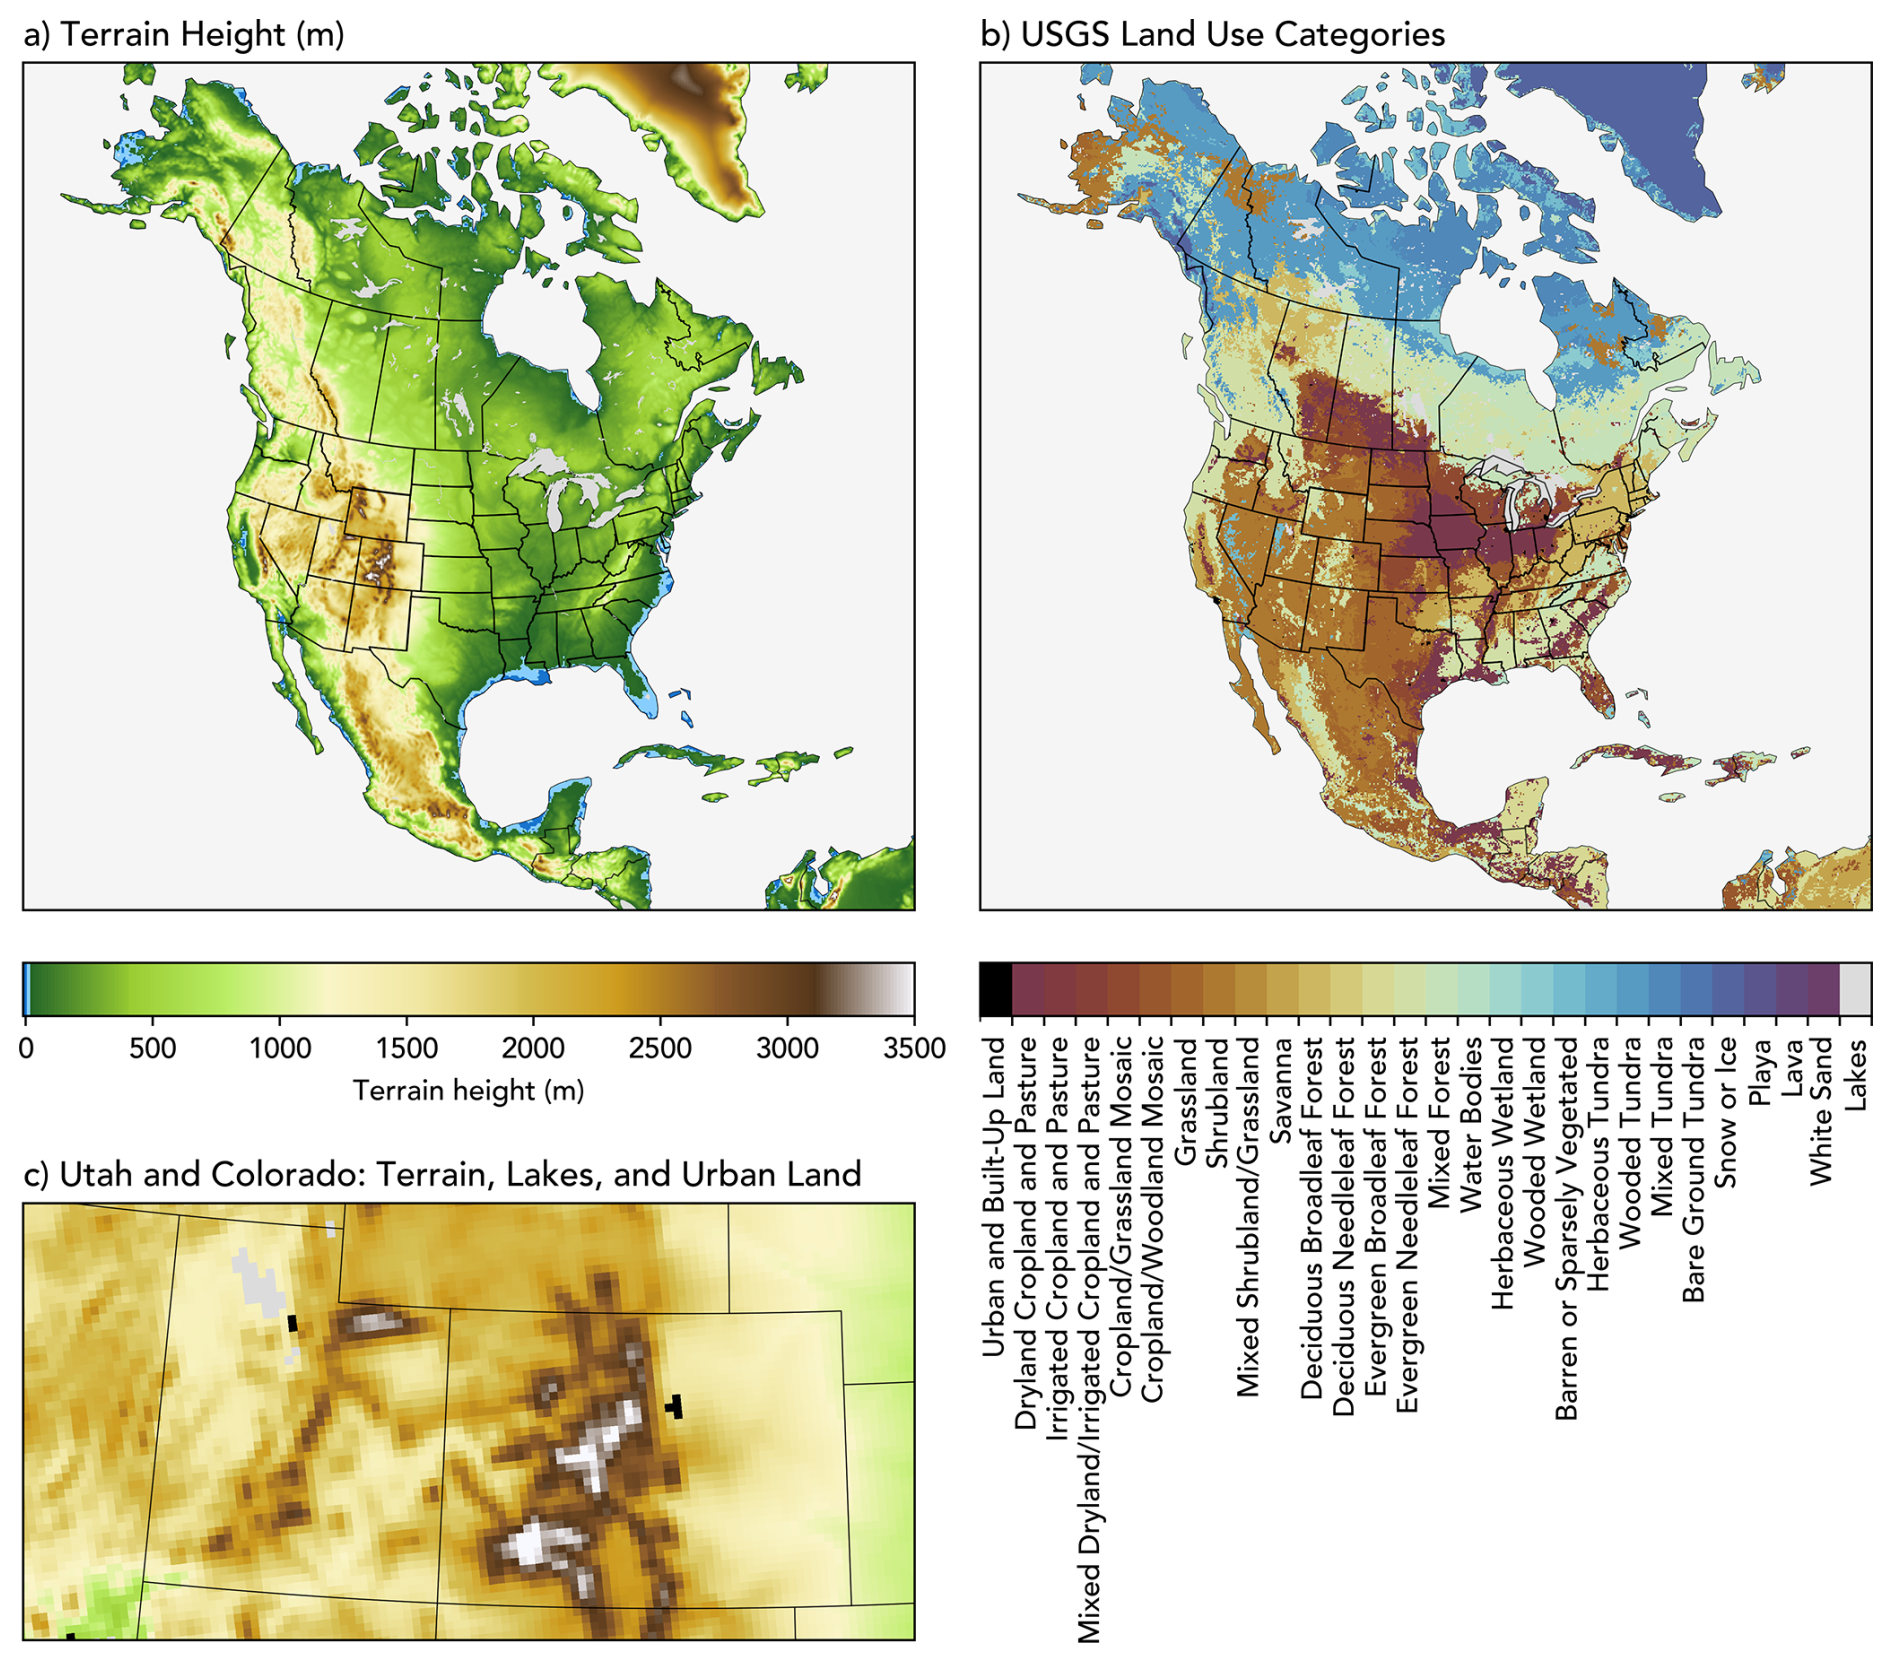
Figure 1Terrain height (a) and USGS land-use categories with vegetation types (b) for our WRF configuration. Panel (c) shows the USGS land-use categories for a smaller domain over Utah and Colorado.
Land use and land-cover data is ingested from the United States Geological Survey (USGS; Fig. 1b). To efficiently represent more local meteorological processes related to urban areas and lakes, a single-level urban canopy model and a one-dimensional lake physics scheme are active. Within Noah-MP, we retain the default compiled configuration: dynamic vegetation is disabled with leaf area index prescribed from look-up tables, stomatal resistance follows the Ball-Berry scheme, runoff and groundwater are represented through free drainage, and four vertical levels are output. Figure 1c shows a more detailed view of a topographically complex region encapsulating the states of Utah and Colorado, highlighting areas with lakes and urban land-use categories.
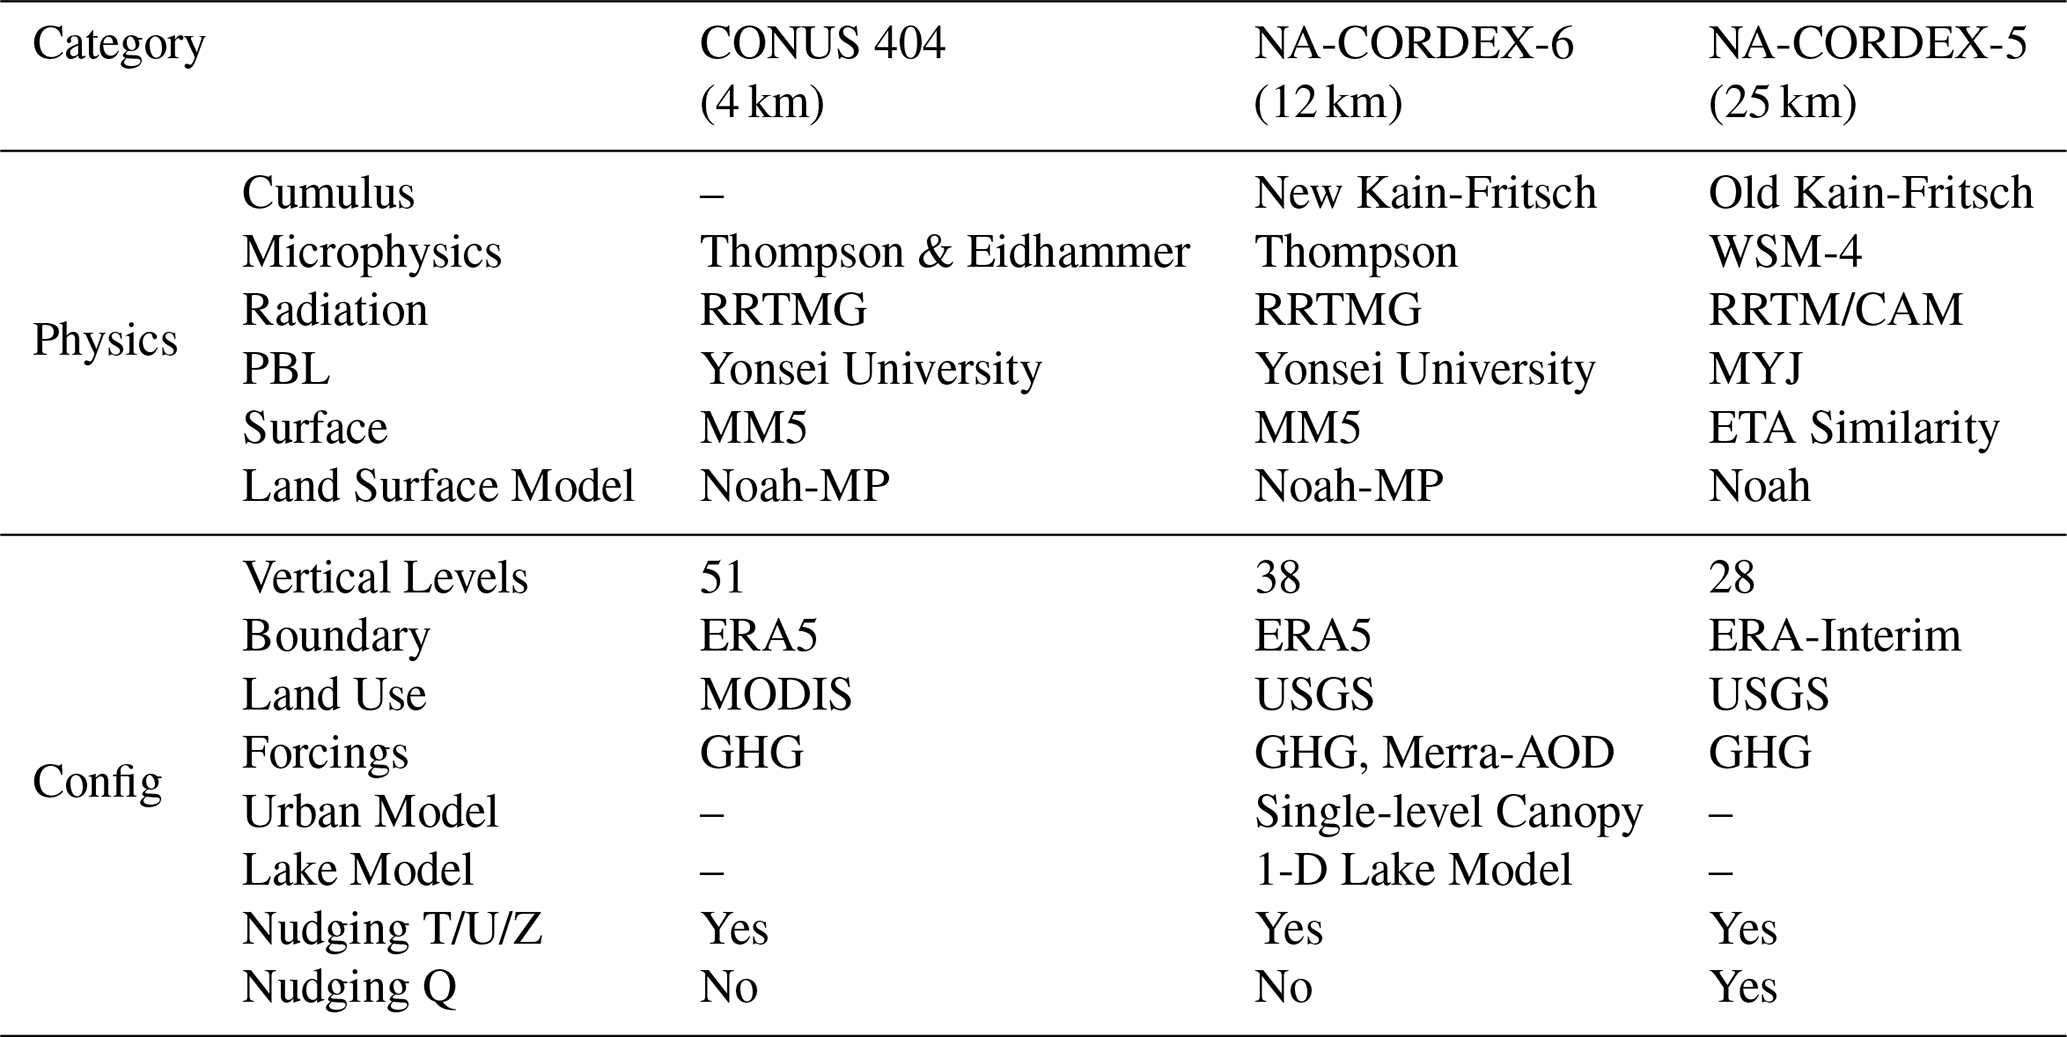
We employ the physical parameterizations and configuration options listed in Table 1. These schemes were chosen through a blend of team and institutional experience with WRF and through systematic testing. These sensitivity tests, and the resulting scheme selections described below, were conducted by our team for this study. In an effort to reduce climatological bias, we ran a suite of 15-month tests beginning in July of 1977. In these tests, one physics scheme was varied for up to four 15-month runs while the rest were held constant. For example, to choose a cumulus and convection scheme, we tested the following choices: the original Tiedtke (Tiedtke, 1989), an updated Tiedtke scheme which improved boundary-layer clouds (Zhang et al., 2011), the Kain-Fritsch cumulus potential scheme (Berg et al., 2013), and the Multi-Scale Kain-Fritsch scheme which employs a scale-dependent dynamic adjustment timescale (Zheng et al., 2016). In addition to cumulus scheme, we tested combinations of options for microphysics (WSM6, Thompson, WDM6, and Morrison and Milbrandt P3-nc), radiation (RRTMG and RRTMG-K), and planetary boundary layer/surface layer physics (YSU/Revised MM5, MYJ/ETA similarity, and MYNN2/MYNN). The resulting test simulation with the smaller differences from reanalysis based temperature and precipitation was retained, and the next physics scheme was evaluated in subsequent tests. Model performance was assessed via visual comparison of annual and seasonal biases in 2 m temperature and precipitation against ERA5 reanalysis; quantitative error statistics were not computed as part of this screening process. We acknowledge that these sensitivity tests are imperfect as there were untested combinations of physics parameterizations that may have resulted in reduced biases, but this framework allowed for a systematic screening of options at relatively small computational cost.
Because computational constraints made it infeasible to run the entire simulation in serial, the NAC6 ERA5 simulation is run in 12.4 year time-slices and initialized on 11 August of the starting year. The first two years and four months are discarded as spin-up, mostly to allow the land surface to equilibrate, and the next ten years are retained. In this case, 1 January of each new decade represents the beginning of a new time slice after spin up. The total retained simulation period spans from 1 January 1980 through 31 December 2023. Spectral nudging not only reduces general temperature and precipitation biases (von Storch et al., 2000; Bowden et al., 2012), but it also ensures continuity between these time slices.
This continuity is seamless for atmospheric and quickly varying fields, such as 500 hPa geopotential height and 500 hPa specific humidity. Figure S1a and b in the Supplement display snapshots of the middle-atmosphere on both sides of the time-slice boundary (31 December 2009 at 18:00 UTC and 1 January 2010 at 00:00 UTC). There is no clear synoptic scale artifact introduced by our methods. We further check total column soil moisture and snow water equivalent (SWE) as an area average over the Colorado Rockies (109–105° W and 38–44° N). The evolution of SWE over the time-slice discontinuity is also seamless, but total column soil moisture exhibits an approximately 7 kg m−2 step function change at the time-slice boundary. Over the course of a few days, this is a fairly substantial decrease which is critical to note for other users of this data, but this 7 kg m−2 discontinuity is quite small in the context of monthly to seasonal variability in total column soil moisture. To the eye, this artifact in the soil moisture field is practically invisible amid the normal variability in soil moisture throughout the simulation (Fig. S2). While a continuous simulation would be more desirable, running the model this way would take impractical amounts of wallclock time (without queue times, it takes approximately 60 h of computational time to simulate a single year), especially when we downscale ESM data from 1950 through 2100.
Table 1Configuration comparison of WRF simulations across different model versions and resolutions.
2.2 CONUS404 and NA-CORDEX-CMIP5
The CONUS404 (C404) dataset comprises a 42-year (October 1979–September 2021) convection-permitting WRF Model version 3.9.1 simulation at 4 km resolution over the conterminous United States with 51 vertical levels extending to 50 hPa (Rasmussen et al., 2023a). The physics configuration was optimized for convection-permitting simulations and includes custom land surface model modifications for improved snow cover representation. Initialized and integrated using ERA5 reanalysis boundary conditions, the model incorporates time-varying greenhouse gases corresponding to observations (Rasmussen et al., 2023a), aerosol and radiation interactions through a prescribed climatological aerosol dataset in the RRTMG scheme (Tegen et al., 1997), and prescribed time-varying ocean/lake temperatures from ERA5 (Hersbach et al., 2020; European Centre for Medium-Range Weather Forecasts, 2022). Spectral nudging of temperature, winds, and geopotential height is applied above the boundary layer for scales > 1800 km.
A disadvantage of using C404 for comparison is that it does not simulate much of Canada, Alaska, and Mexico. Much of our comparison and analysis is therefore focused on CONUS, even though the purpose of NA-CORDEX is to simulate the entire continent. However, C404 is the only large-domain convection resolving historical simulation with WRF that has 30 years of overlap with both NAC5 and NAC6.
The NAC5 WRF simulations were run with WRF 3.5.1 (Mearns et al., 2017). The model is configured at 25 km horizontal resolution. Land surface processes are represented using USGS 24-category land use data (Fig. 1), with boundary and initial conditions coming from ERA-Interim. Lateral boundary conditions are ingested from ERA-Interim Reanalysis with a linear relaxation over a relaxation zone of 10 gridpoints, with spectral nudging employed to maintain large-scale circulation consistency with driving data fields. Additional simulation details may be found in Diez-Sierra et al. (2022).
2.3 Evaluation Methods and Data
We evaluate the WRF simulations against a suite of observationally based reference datasets. For long-term climatological temperature and precipitation biases, we primarily use ERA5-Land (Muñoz-Sabater et al., 2021), a 9 km reanalysis product with temporal coverage back to 1950. We supplement this comparison with two independent gridded observational datasets, the Parameter-elevation Regressions on Independent Slopes Model (PRISM) data (Daly et al., 2008) and Daymet V3 (Thornton et al., 2016), which spatially interpolate direct surface station observations across CONUS rather than relying on physical modeling; PRISM was also used in the published C404 evaluation (Rasmussen et al., 2023a), enabling direct comparison with that work. For sub-daily and diurnal precipitation processes, we use GPM IMERG V07B (Huffman et al., 2023), which is preferred over ERA5-Land because it captures observed diurnal timing and amplitude rather than interpolated, model-generated precipitation (Tan et al., 2019). Snow water equivalent is evaluated against the gridded University of Arizona SWE dataset (Broxton et al., 2019) and against point-based SNOTEL station observations, the latter used to assess the seasonality of the snow accumulation, peak, and melt phases. Finally, tropical cyclone location and category are cross-referenced against the IBTrACS best-track dataset (Gahtan et al., 2024).
An important caveat applies throughout our comparisons involving NAC5: C404 and NAC6 are driven by ERA5, while NAC5 is driven by ERA-Interim. These reanalyses differ substantially in resolution (31 km versus 79 km), vertical levels (137 versus 60), and data assimilation (a 4D-Var ensemble versus a deterministic 4D-Var), and ERA5 assimilates roughly five times more observations (Hersbach et al., 2020). Because all three WRF simulations use spectral nudging toward their respective driving reanalysis, differences between NAC6 and NAC5 reflect a combination of WRF model configuration and the quality of the boundary and nudging fields themselves. We are not able to fully separate these two contributions in the present study, and note this where relevant in the results that follow.
2.3.1 Climatological Differences from ERA5-Land
We compare climatological differences across the three historical WRF experiments from 1980 through 2010, using ERA5-Land data at 9 km horizontal resolution as a reference. Reanalysis data are remapped to each WRF simulation's resolution using conservative regridding. Differences are calculated as simple differences between simulated and ERA5-Land values for temperature and as percent differences from climatological values for precipitation; precipitation differences are also computed as differences in climatological precipitation rate (mm d−1). Seasonal differences are assessed for winter (DJF) and summer (JJA) only, for brevity.
It is important to note that ERA5 and ERA5-Land are not direct observations, and these reanalysis products carry their own biases relative to station and satellite-based estimates (Lavers et al., 2022; Tarek et al., 2020; Sheridan et al., 2020). Direct comparison to point observations is also complicated by the scale mismatch between gridded model output and station data. We therefore use the term “difference” throughout the manuscript when referring to comparisons against ERA5-Land, reserving “bias” for cases where it is substantially more concise (e.g., “cold bias” rather than “negative temperature difference relative to ERA5-Land”). Additionally, to provide context about how the estimated bias can differ depending on the choice of reference dataset, we have included climatological differences of the WRF simulations from PRISM and Daymet.
2.3.2 Diurnal precipitation and temperature range
We estimate diurnal precipitation peaks following Scaff et al. (2020), fitting a second-order harmonic function (Eq. 1) to hourly precipitation from 1 June through 31 August for each year from 1980 through 2010, comparing the three WRF simulations against GPM IMERG V07B (Huffman et al., 2023).
Here Pt is precipitation at hour t, P is total daily precipitation, A1 and B1 control the 24 h cycle, and A2 and B2 control the 12 h cycle. Fourier transform estimates provide both the phase (hour of peak precipitation) and magnitude.
We also evaluate the mean Spring (March through May) diurnal temperature range, a period characterized by large differences in daily minimum and maximum temperatures.
2.3.3 Seasonal hydroclimate
We define the North American Monsoon region as northern Mexico (115–105° W and 25–32° N) and the southern US (115–105° W and 32–40° N) monsoon extent, comparing daily climatological precipitation against IMERG.
We assess snow biases across the three WRF simulations against the University of Arizona SWE dataset (Broxton et al., 2019), examining gridded differences in SWE for late winter and early spring (JFMAM) in the Western US. We additionally compare SWE at SNOTEL station locations to the closest gridpoint from each WRF simulation, aggregating results by hydrologic unit code-8 (HUC-8) watershed regions to assess the seasonality of the snow cycle, including the accumulation, peak, and melt phases.
2.3.4 Extreme events
We compare the three simulations using the “perfect model framework”, treating the results from C404 as the goal-post to assess the efficacy of NAC6 and NAC5. Comparisons to reanalysis data are also provided.
We evaluate precipitation extremes at three temporal scales: hourly, 6-hourly, and daily accumulated precipitation. To reduce data volumes and memory requirements, we compute the maximum precipitation value at each gridpoint for each calendar month and temporal scale, then flatten these gridpoint-level monthly maxima across space into a single distribution for each dataset. Histograms and extreme percentiles (90, 95, 99, 99.9, and 99.99th) of this flattened distribution are used to characterize the extreme tail of precipitation over the CONUS domain (130–60° W, 30–50° N).
For tropical cyclones (TCs), we select Hurricane Ivan as a case study, evaluating storm intensity and impact metrics (minimum surface pressure, maximum precipitation rate, and maximum wind speed) within a 150 km radius of the storm center, defined as the gridpoint with lowest surface pressure. We extend this into a climatology using the same metrics for every TC that tracked into the Gulf of Mexico (20–40° N, 105–75° W) and was labeled a hurricane by the National Hurricane Center. We use IBTrACS data for an initial guess at storm location, with the actual storm center in each WRF simulation identified as the minimum surface pressure within 50 km of the IBTrACS position; TC category is also taken from IBTrACS/National Hurricane Center classification.
For the mesoscale convective system case study, we examine the 22 July 2003 “Mid-South Derecho” using 750 hPa horizontal moisture flux () into the Midwest, moisture flux convergence (MFC; Eq. 2), and 850 hPa temperature advection (Eq. 3).
In these equations, q is specific humidity, u and v represent zonal and meridional winds, p is pressure, and T is temperature. Grid coordinates are represented by x and y.
3.1 Climatological Differences from ERA5-Land
Climatological temperature differences across all three simulations generally fall within ±3 K, with notable reductions at higher resolutions (Fig. 2). C404 and NAC6 exhibit very similar spatial patterns of temperature deviations, though the 12 km simulation shows slightly larger magnitudes. Rasmussen et al. (2023a) suggest that throughout much of the western continent, which is characterized by high elevation and extreme topographic heterogeneity, there may be a resolution-dependent temperature bias in valleys smaller than the grid scale. Inadequate resolution of topography, land-surface features, and terrestrial water storage in sub-grid valleys could produce systematic warm biases, particularly for daily minimum temperatures (Barlage et al., 2021). However, this shared warm bias pattern between C404 and NAC6, despite their differing horizontal resolutions, together with its comparative reduction in NAC5 (which uses the older Noah land surface model), points to processes in Noah-MP as a likely contributor to this bias.
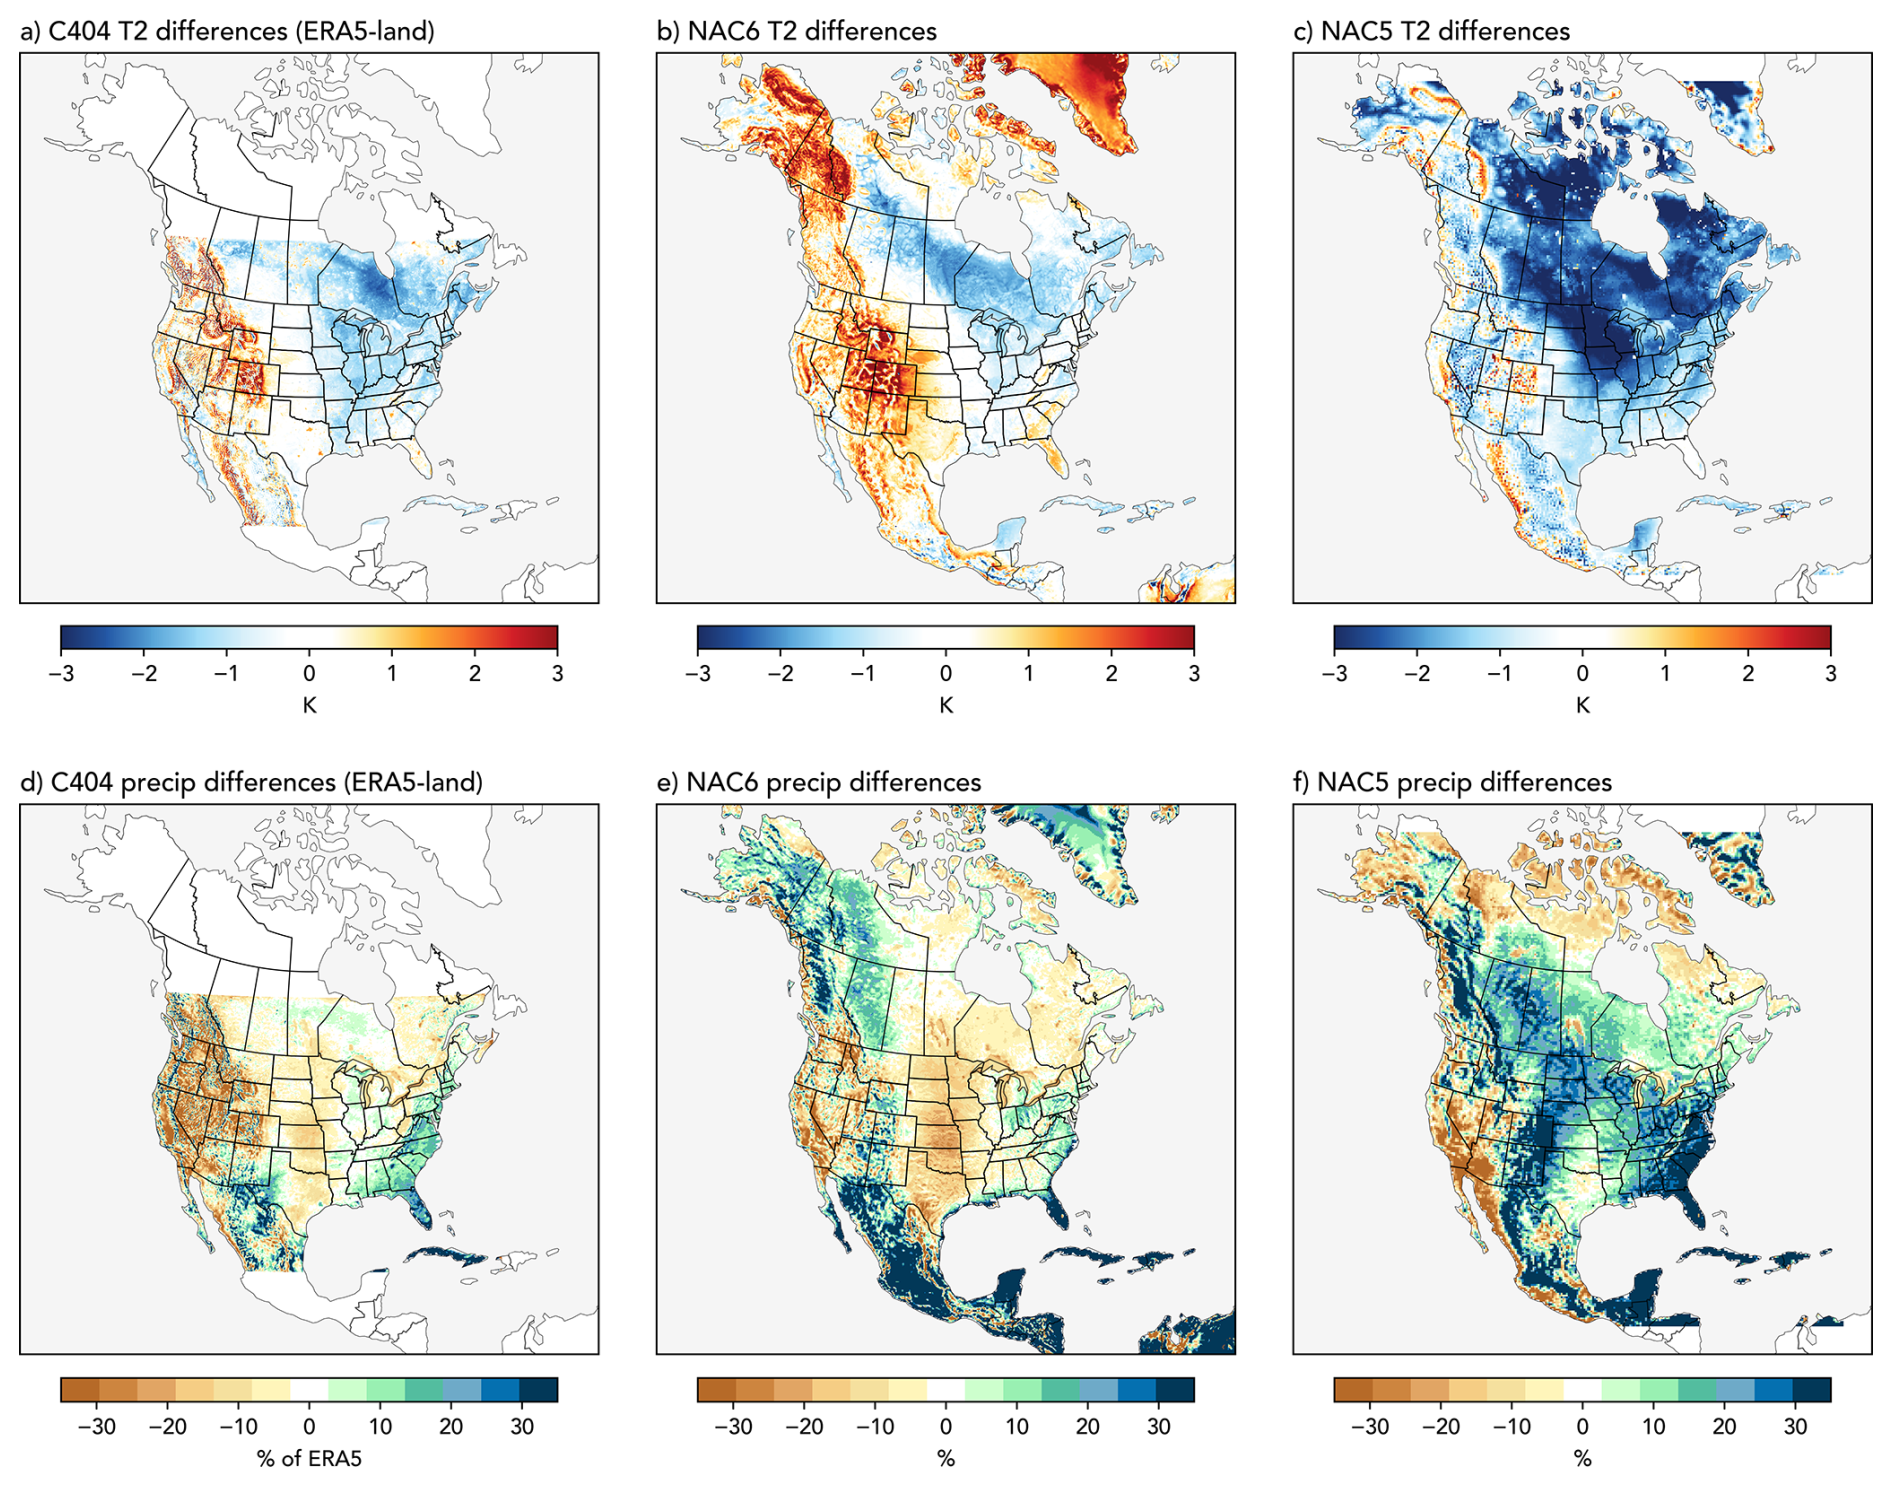
Figure 2Climatological differences of 2 m air temperature and precipitation for C404 (a, d), NAC6 (b, e), and NAC5 (c, f) using ERA5-Land as a reference dataset from 1980 through 2010.
Climatological precipitation differences, shown in Fig. 2d–f as percent differences from ERA5-Land climatological values, reveal distinct regional patterns. Both C404 and NAC6 show relatively dry conditions in lower elevation regions of the western US (about −20 % of ERA5-Land), with more balanced differences across higher elevations. The southeastern US exhibits a wet bias across all three simulations, though this feature is substantially larger in NAC5 (25 %–35 %) and systematically reduced in both NAC6 and C404. Beyond CONUS, NAC6 displays a prominent wet bias (>30 %) throughout most of Mexico and western Canada. Overall, the magnitude of precipitation differences decreases with increasing resolution when compared to NAC5. Precipitation differences are also presented in Fig. S3 as differences in climatological precipitation rate (mm d−1).
Recent work has suggested the eastern cold bias in newer versions of WRF is likely related to snow hydrological conductivity parameterizations in Noah-MP (Zhang et al., 2025). Consistent with these findings, the annual differences in C404 and NAC6 appear to be primarily driven by larger seasonal differences during winter (Fig. 3). Winter temperatures across all three datasets show systematic patterns: generally too warm across the western half of the continent and too cold in the east, especially at higher latitudes. NAC5 exhibits a much more extensive cold bias throughout central and eastern North America during winter, which is greatly reduced in both NAC6 and C404, apparently at the expense of a warmer western region.
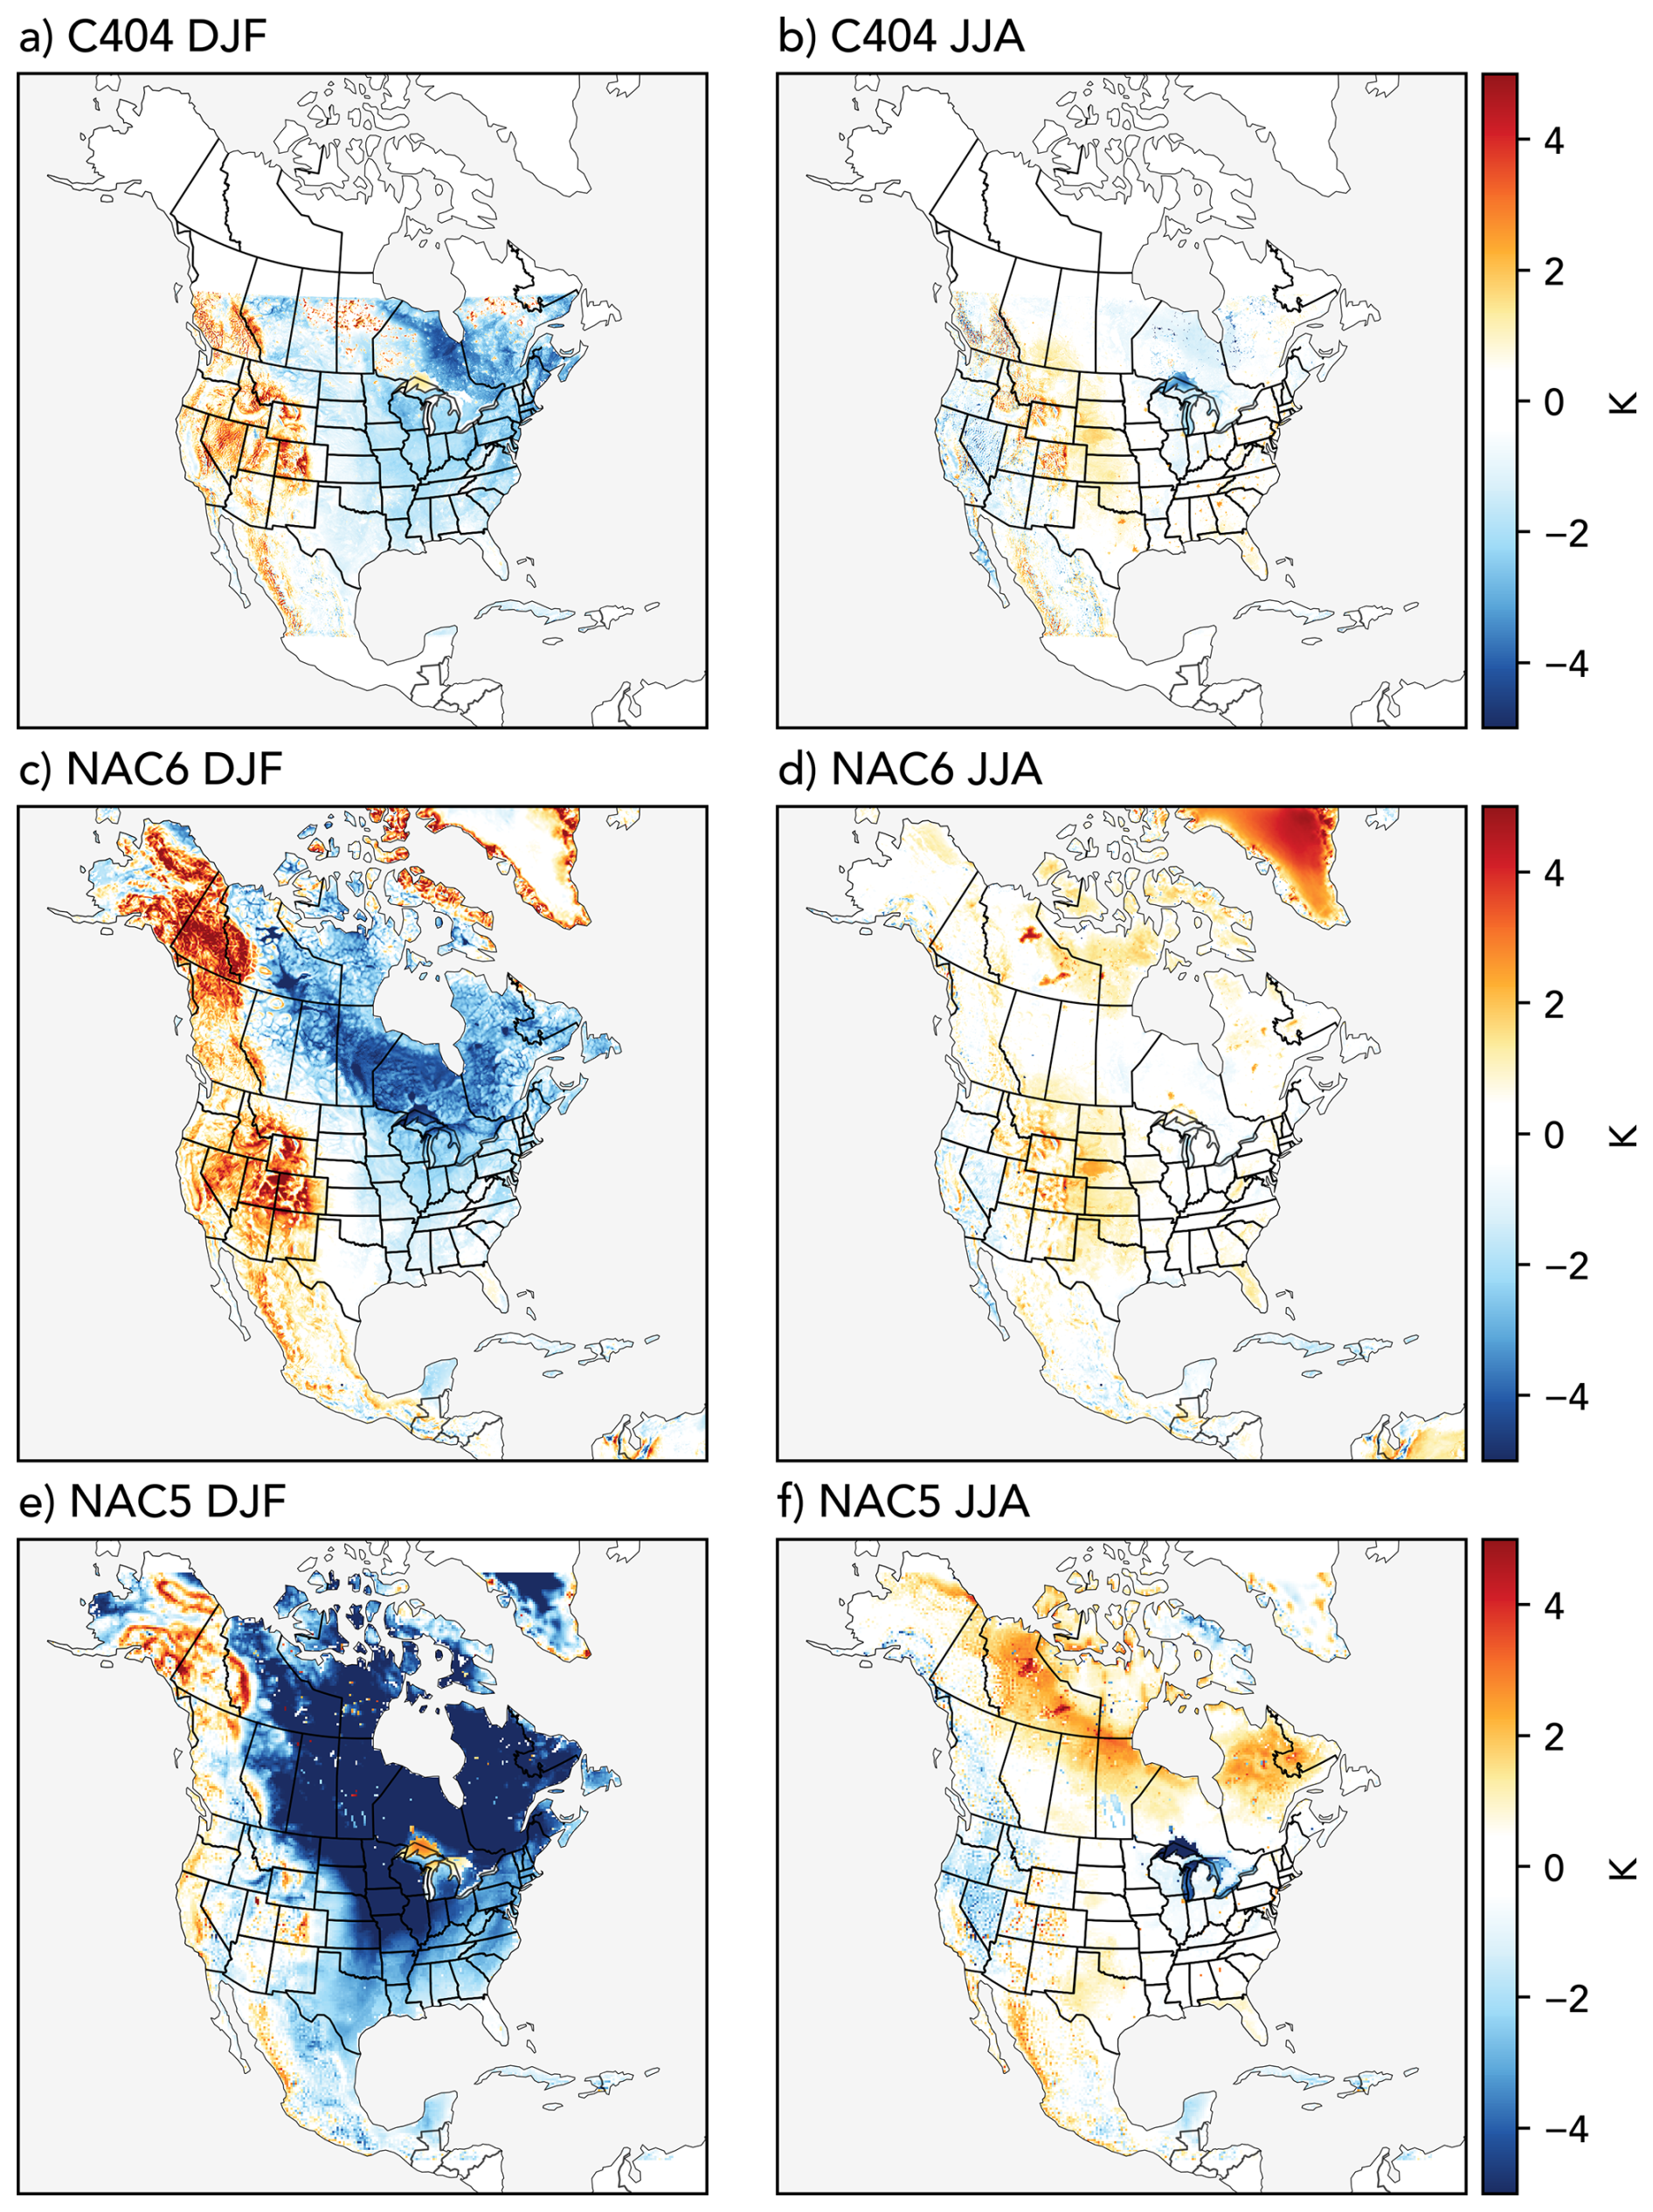
Figure 3Winter (DJF) and Summer (JJA) climatological differences of 2 m air temperature for C404 (a, b), NAC6 (c, d), and NAC5 (e, f) using ERA5-Land as a reference dataset.
NAC6 exhibits a well known summertime warm bias throughout the plains (Liu et al., 2017), which provided motivation for major modifications to the shallow groundwater scheme in C404 (Barlage et al., 2021; Rasmussen et al., 2023a). Coupled with this warm bias is a drier precipitation signal in JJA, which is still apparent in C404 (Figs. 3b, d and 4b, d) and other dynamically downscaled datasets using WRF (Rahimi et al., 2022; Liu et al., 2017). Precipitation comparisons are also presented in Fig. S4 as differences in seasonal precipitation rates (mm d−1).
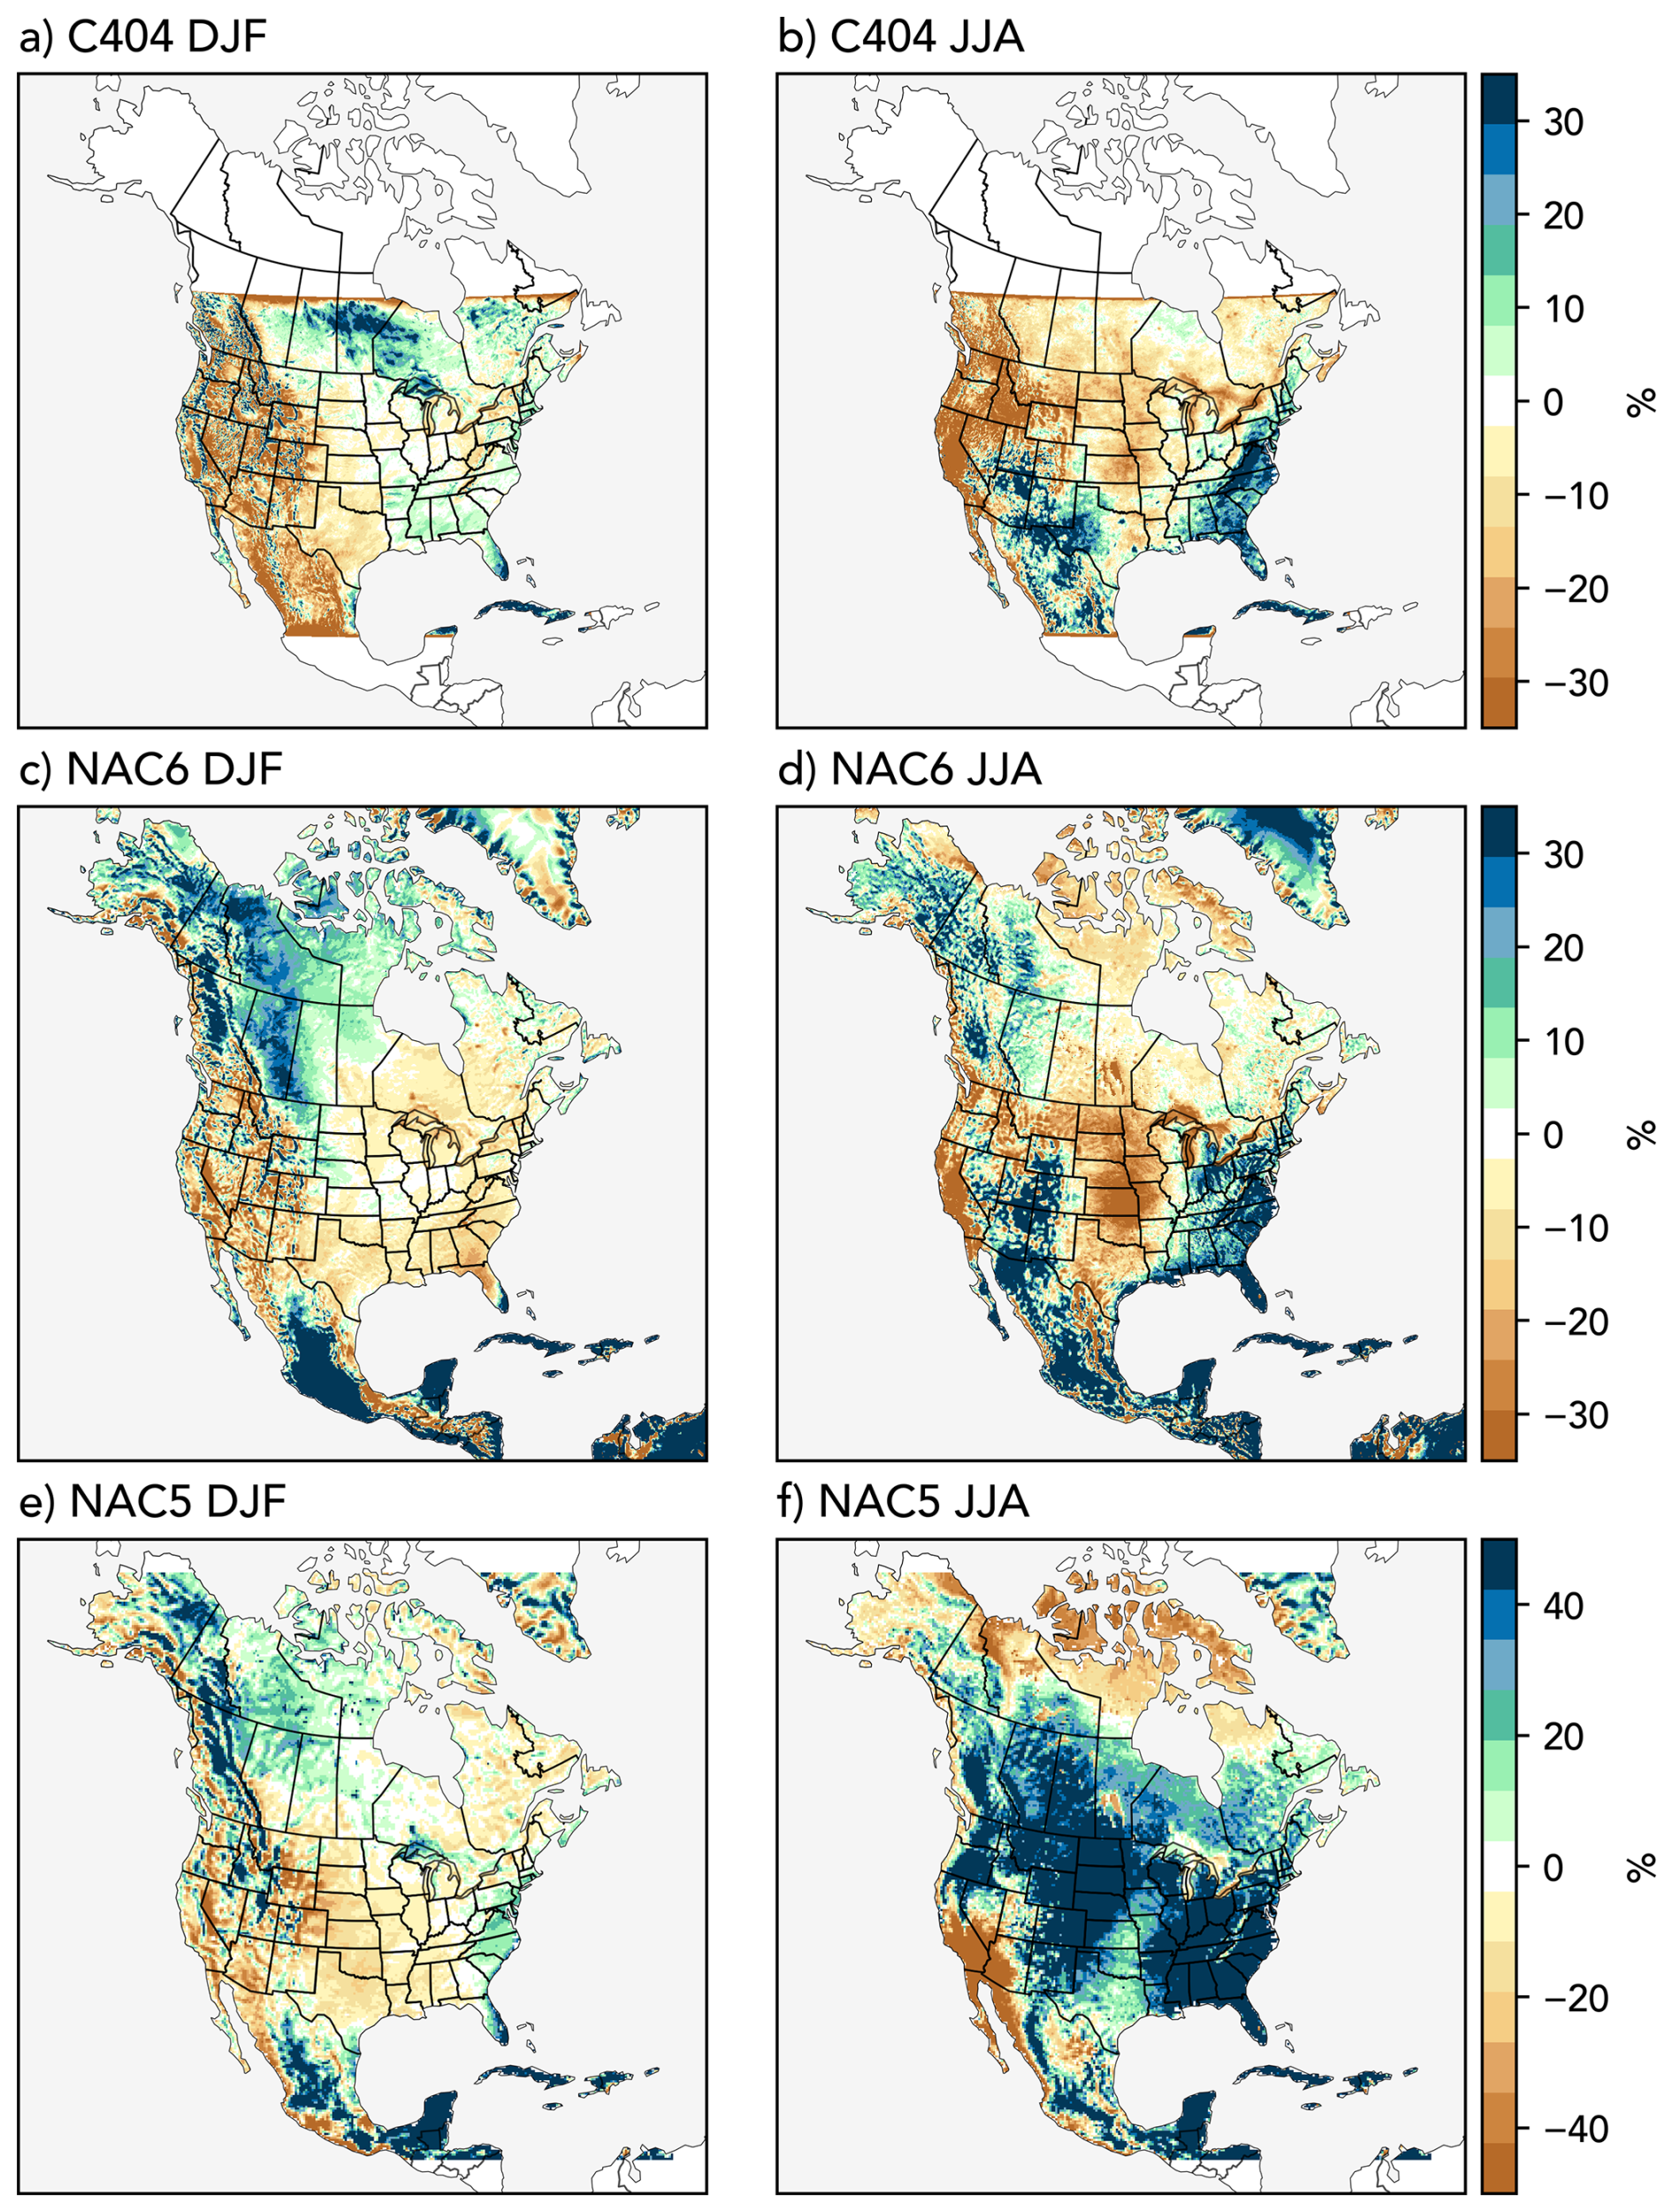
Figure 4Same as Fig. 3 but for seasonal precipitation. Differences are plotted as a percent of the climatological values from ERA5-Land.
The warm western United States in NAC6 and C404 is mostly accounted for by deficiencies in daily minimum temperatures (Fig. S5). When compared to ERA5-Land, daily maximum temperatures appear to be well simulated by C404 and NAC6, but daily minimum temperatures are consistently higher by about 3–5 K throughout the western two-thirds of the continent. This difference from ERA5-Land is consistent with other high-resolution and convection-permitting simulations over the North America (Gensini et al., 2023).
To further evaluate our climatological temperature and precipitation differences, we compare NAC6, NAC5, and C404 against the station-based PRISM and Daymet gridded datasets (Figs. S6–S9). Temperature biases are very consistent with those found using ERA5-Land as a reference, giving us added confidence in our assessment of model performance (Figs. S6 and S7). Precipitation differences are also quite consistent across datasets (Figs. S8 and S9), even though ERA5 precipitation is a model-generated product, while PRISM and Daymet are built from station observations that undergo statistical and physiographic adjustment (e.g., elevation-based regression) to produce a gridded field (Daly et al., 2008).
3.2 Diurnal Processes
Convective warm season precipitation has proven challenging to simulate in ESMs and coarser resolution models (Gutowski et al., 2020; Bukovsky and Karoly, 2011), especially diurnal precipitation processes linked to peak daytime heating (Kunkel et al., 2012; Geerts et al., 2017). We focus on three well documented diurnal processes: (1) afternoon precipitation peaks in high-elevation regions of the Sierra Madre and Rocky Mountains, (2) eastward propagation of convection into the Great Plains and Upper Midwest, producing evening and nocturnal precipitation peaks (Trier et al., 2010; Dirmeyer et al., 2012), and (3) afternoon peaks in the Southeast US driven by maximum daytime heating (Scaff et al., 2020).
Figure 5a–d displays peak timing in local solar time (LST), while Fig. 5e–h shows peak magnitude. IMERG (Fig. 5a) clearly depicts afternoon peaks over the southern Rockies and Southeast US, plus propagation into the Great Plains. C404 captures both the precipitation spatial patterns and propagation well, with a slight underestimation of afternoon convective peaks in the southern Rockies (Figs. 5b and S10b). NAC6 reasonably captures the diurnal cycle with better peak timing in the Southern Rockies. However, there is a clear deficiency in capturing the observed nocturnal precipitation peaks that are characteristic of central Canada, the Great Lakes region, and the eastern section of the continent. For much of the Great Lakes region where the difference in the timing of diurnal precipitation is the greatest, NAC6 simulates daily precipitation peaks that are almost 10 h later than IMERG (Fig. 5c). This is a substantial difference, but NAC6 improves upon NAC5 (Figs. 5d and S10d) which exhibits the homogeneous afternoon peak typical of ESMs and coarser regional climate models (Lee and Wang, 2021). Notably in all of the WRF simulations, the diurnal timing is well captured in the Southeastern United States.
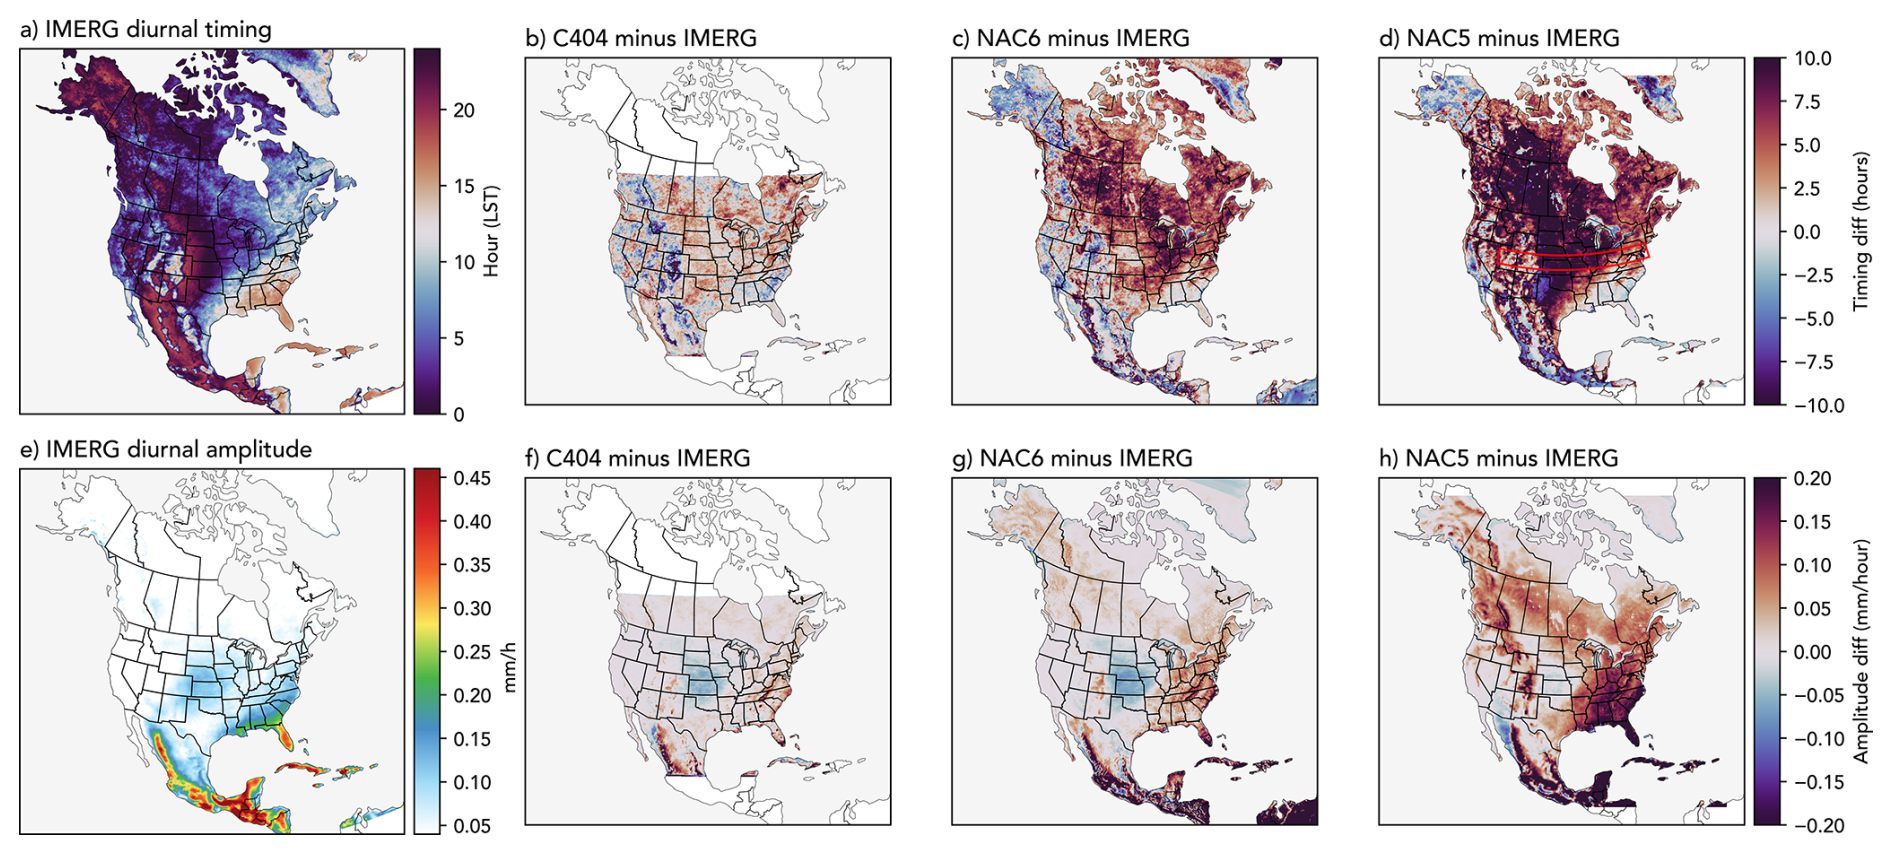
Figure 5Diurnal precipitation peak time (top row) and magnitude (bottom row) for IMERG (a, e), C404 (b, f), NAC6 (c, g) and NAC5 (d, h) estimated using a second order harmonic fit of hourly precipitation for June, July and August. The domain for the longitude and time Hovmöller diagrams in the next figure is shown in panel (d).
IMERG excels at capturing diurnal precipitation cycles (Tan et al., 2019), though it underrepresents rainfall rates on timescales of 1 h or less (Hosseini-Moghari and Tang, 2022), potentially explaining smaller magnitudes in Fig. 5e compared to WRF simulations (Fig. 5f–h). All three WRF simulations show higher afternoon rainfall rates in the southern Rockies, likely related to the North American Monsoon driving orographic precipitation (Boos and Pascale, 2021; Li et al., 2008). Beyond the southern Rockies, the NAC5 simulation in particular overestimates diurnal precipitation magnitude (by about 0.2 mm h−1), particularly in the Southeastern US, consistent with Scaff et al. (2020).
NAC6 also shows notably reduced propagation into the Great Plains, Upper Midwest and Mid-Atlantic regions of the United States. In Fig. S10c the dark blue shading representing nocturnal peaks does not extend as far eastward in NAC6 as it does in C404 and IMERG. Figure 6 shows a longitude-time Hovmöller diagram (latitudinally averaged from 38–42° N) of mean JJA hourly precipitation, revealing afternoon peaks at 105° W beginning around 14:00 LST in all datasets. However, eastward convective propagation comparable to observations appears only in C404, though even this convection-permitting simulation underestimates the magnitude. While NAC6 improves upon NAC5, as evident by the lack of a continuous longitudinal band of precipitation from 20:00 to 23:00 UTC, both CORDEX simulations underestimate the longitudinal extent and magnitude of propagating convection originating at the Rockies by about 0.2 mm h−1 at 05:00 UTC and 100° W.
Regional and global modeling experiments have generally underestimated the diurnal temperature range over land (Mearns et al., 1995; Wang and Clow, 2020), with variability across models likely depending on parameterizations of clouds, aerosols, land surface characteristics, and land-atmosphere interactions (Lindvall and Svensson, 2015; Mahony et al., 2022; Holt et al., 2006; Jach et al., 2022). While the numerous coupled sources of bias are difficult to disentangle, this problem provides an opportunity to compare each model's efficacy in simulating the diurnal temperature range.
C404 and NAC6 both overestimate the daily temperature range compared to ERA5-Land in Western Canada (and Alaska for NAC6), the Midwest, Great Lakes, and the eastern half of the continent (Fig. 7). NAC6 overestimates the diurnal temperature range more than C404 and NAC5, particularly across a wide swath of Canada that directly overlaps the evergreen needleleaf forest, wooded tundra, and mixed forest vegetation types (Fig. 1b). Box-and-whisker diagrams of the difference from ERA5-Land (Fig. S11) show median biases of 3.45, 4.05, and 4.41 K for the evergreen needleleaf, wooded tundra, and mixed forest regions, respectively.
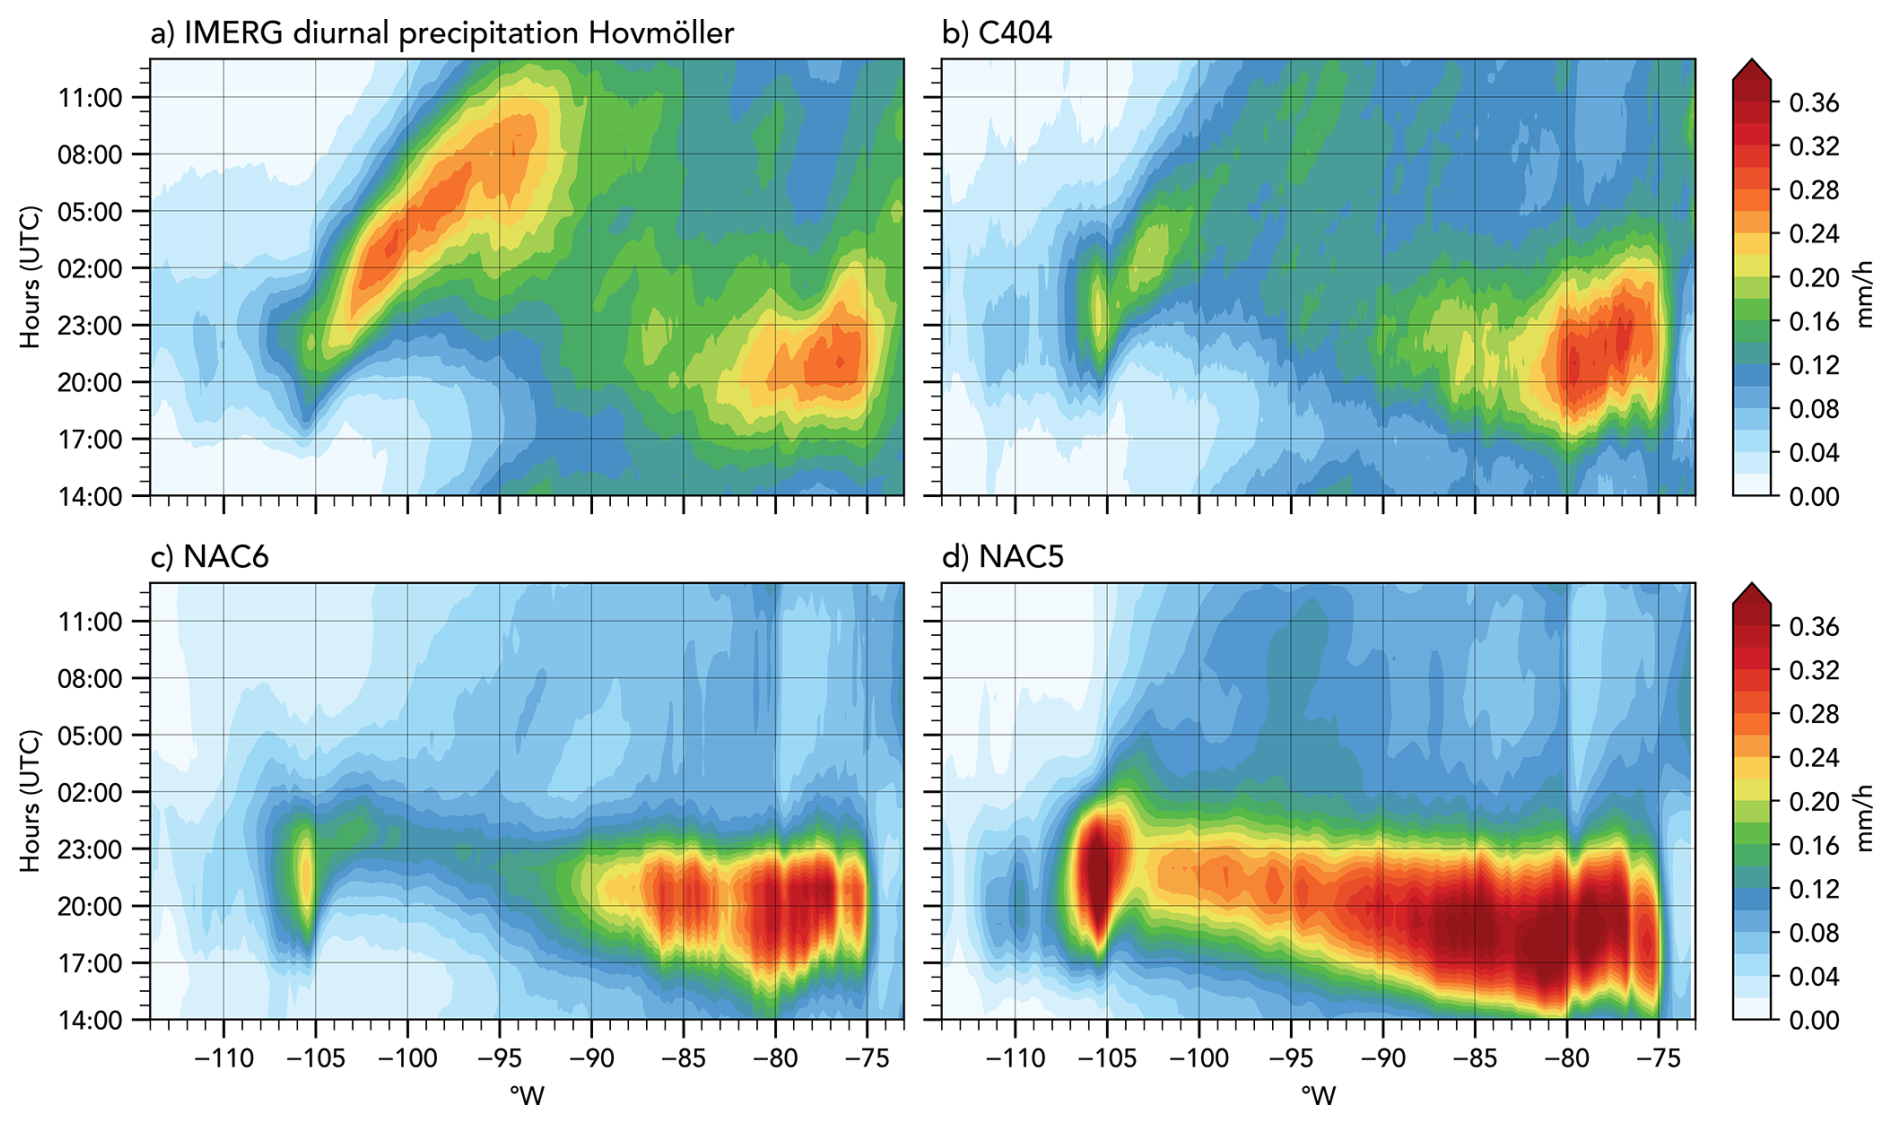
Figure 6Longitude and time Hovmöller of hourly average precipitation for June, July, and August for 120–60° W and 38–42° N. IMERG summer means (a) are compared with C404 (b), NAC6 (c), and NAC5 (d).
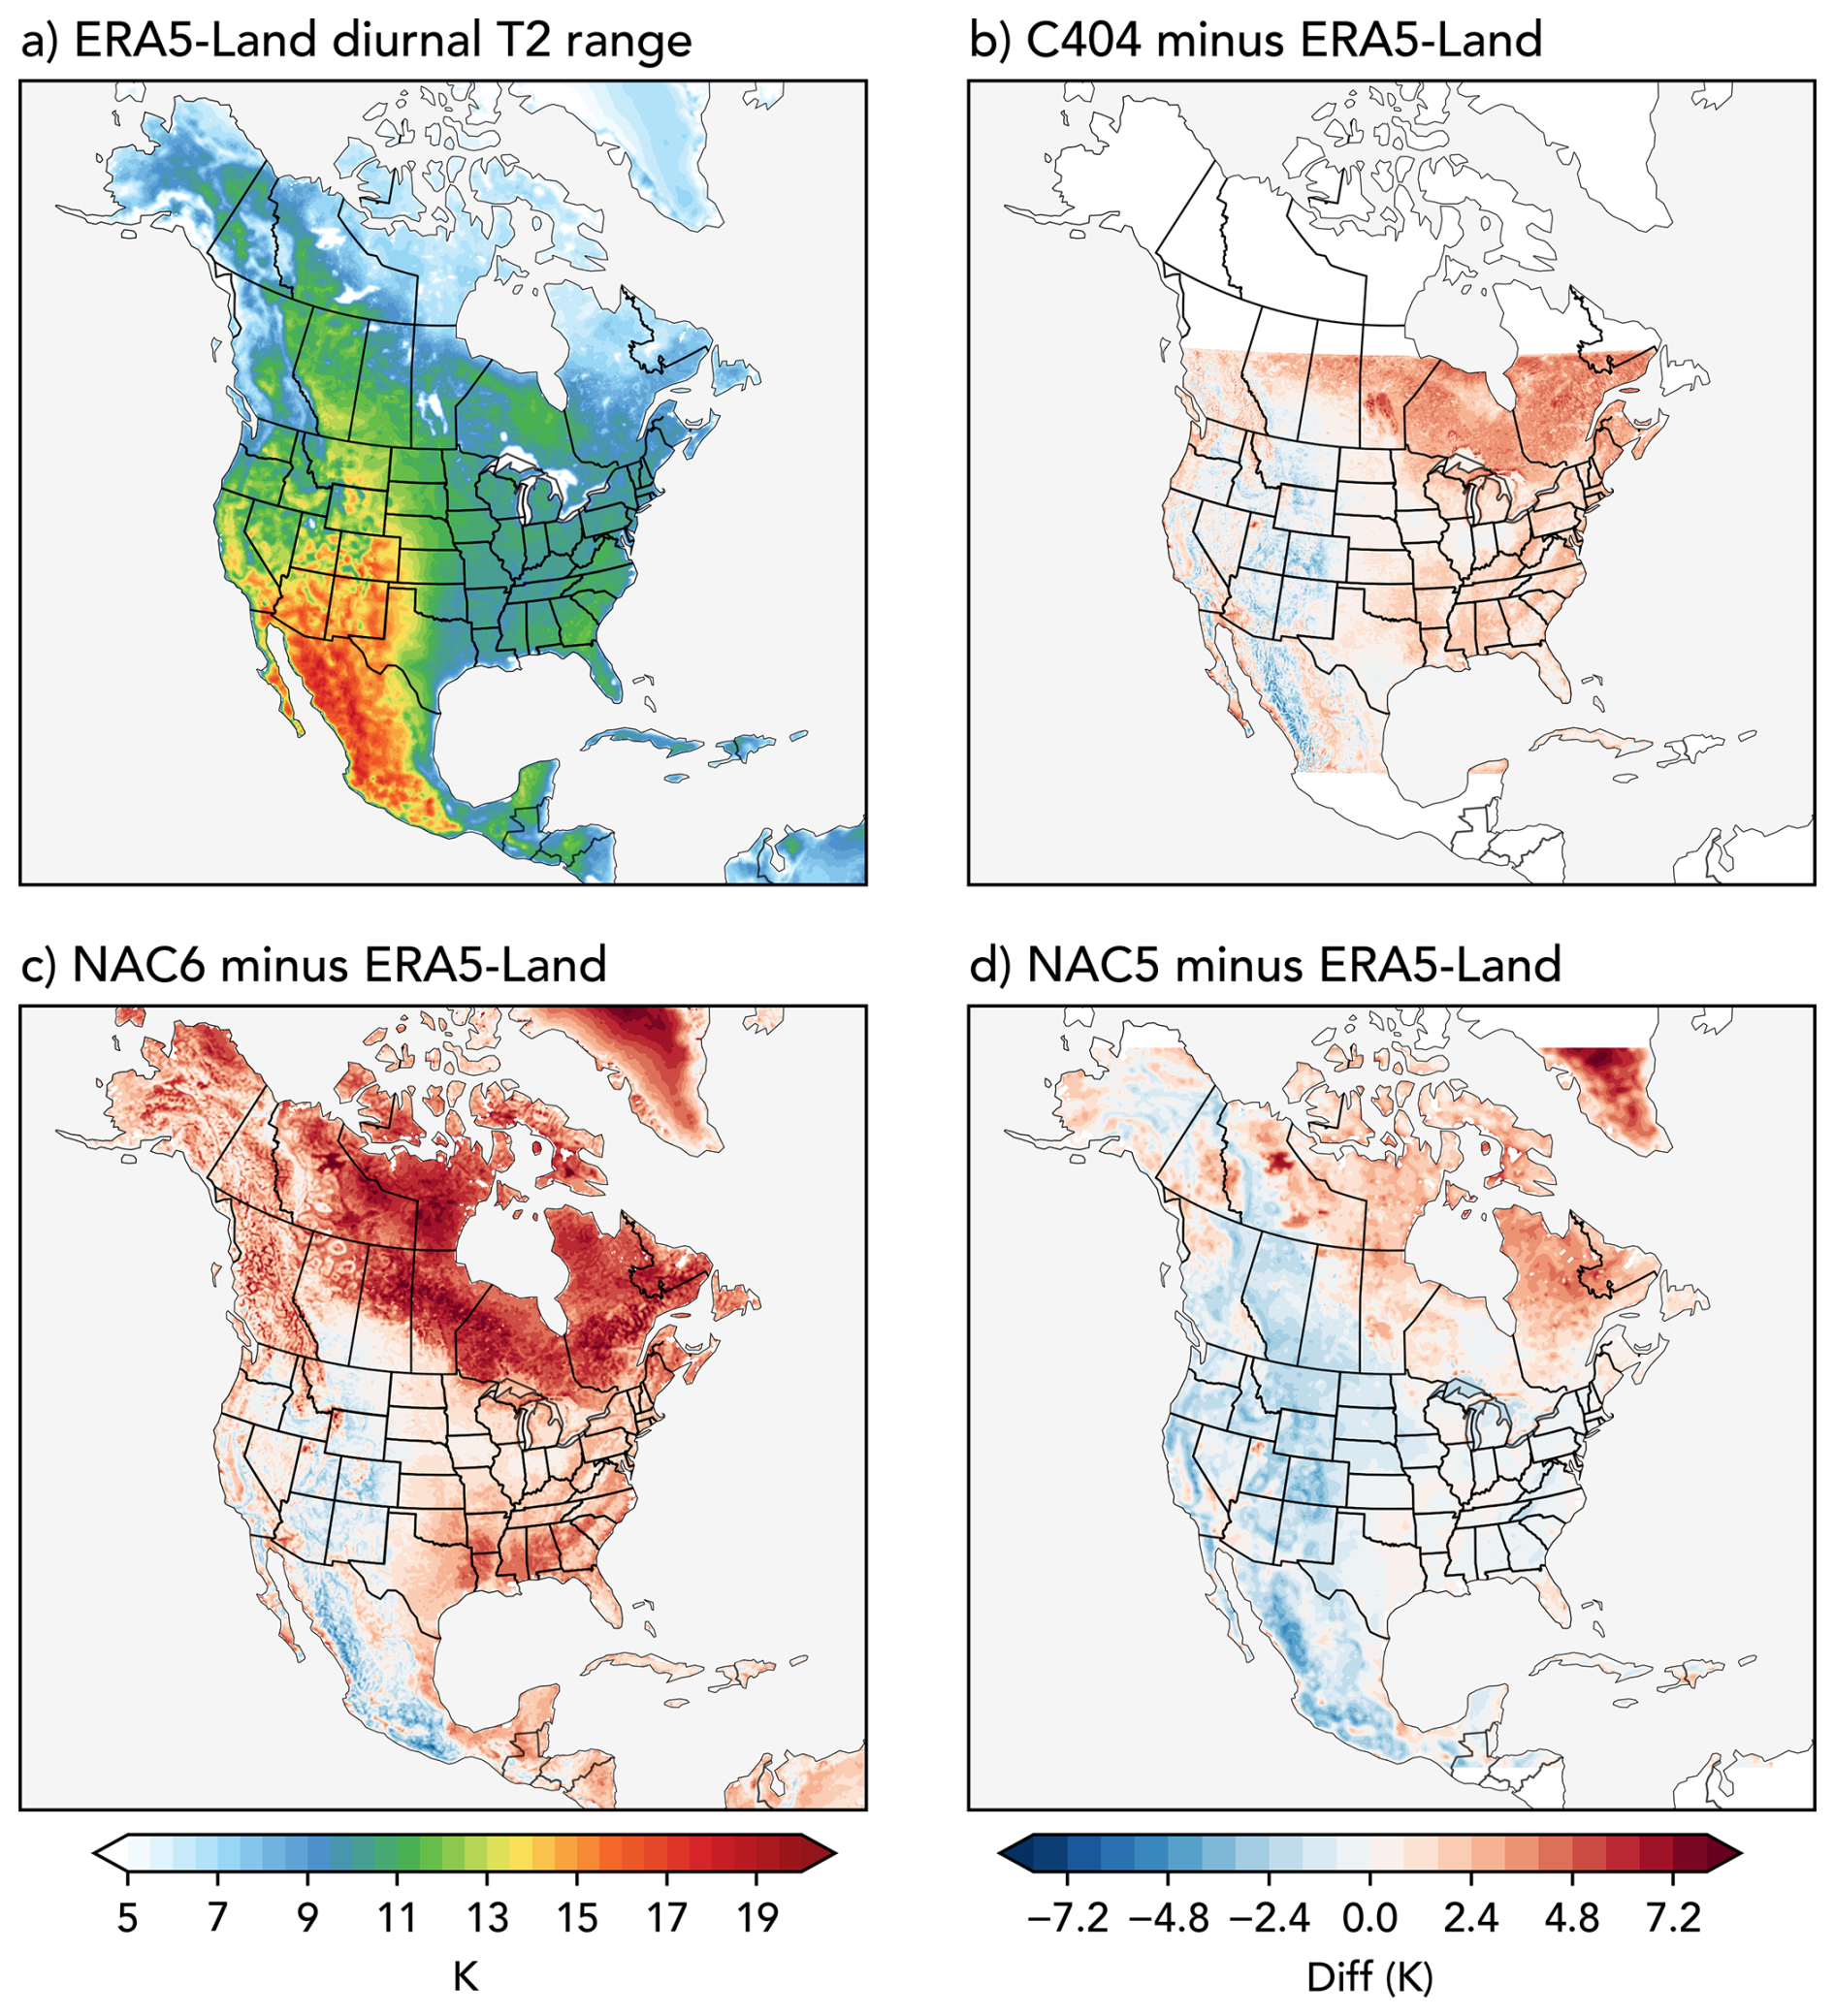
Figure 7Average springtime (MAM) diurnal temperature range (maximum temperature minus minimum temperature) for ERA5-Land (a). Difference of the diurnal temperature range for C404 (b), NAC6 (c), and NAC5 (d) compared to ERA5-Land.
Maximum daily temperatures show relatively small differences in these regions (generally less than 1 K; Fig. S5), so the diurnal temperature range bias stems primarily from minimum temperatures that are too cold. Because this pattern is concentrated in vegetation types with relatively tall canopies, this suggests a structural bias in Noah-MP surface fluxes for these land cover types, possibly related to parameterized canopy-to-surface heat exchange. This may be a distinct mechanism from the broader eastern North American cold bias discussed above, which Zhang et al. (2025) attribute to snow thermal conductivity parameters; increasing this parameter allows more heat exchange between the atmosphere and snowpack, raising winter temperatures substantially (up to 4 K) in the Northeast. Further analysis is needed to isolate the relative contributions of these two mechanisms and how they couple with the atmospheric model.
3.3 Seasonal Hydroclimate
3.3.1 The North American Monsoon
Analysis of precipitation biases and the diurnal cycle of precipitation has suggested that the North American Monsoon in these WRF simulations is wet biased in the southwest US (Figs. 4, 5), and Fig. 8 confirms this. In northern Mexico, the seasonal evolution of the monsoon in all three historical simulations matches IMERG quite well. Notably, the NAC6 simulation has the largest wet bias, though the magnitude of the simulated difference is quite small day-to-day (approximately 0.5 mm d−1). When integrated over the July through September months, NAC5 has the smallest difference from IMERG (+9.8 % of IMERG's climatological magnitude).
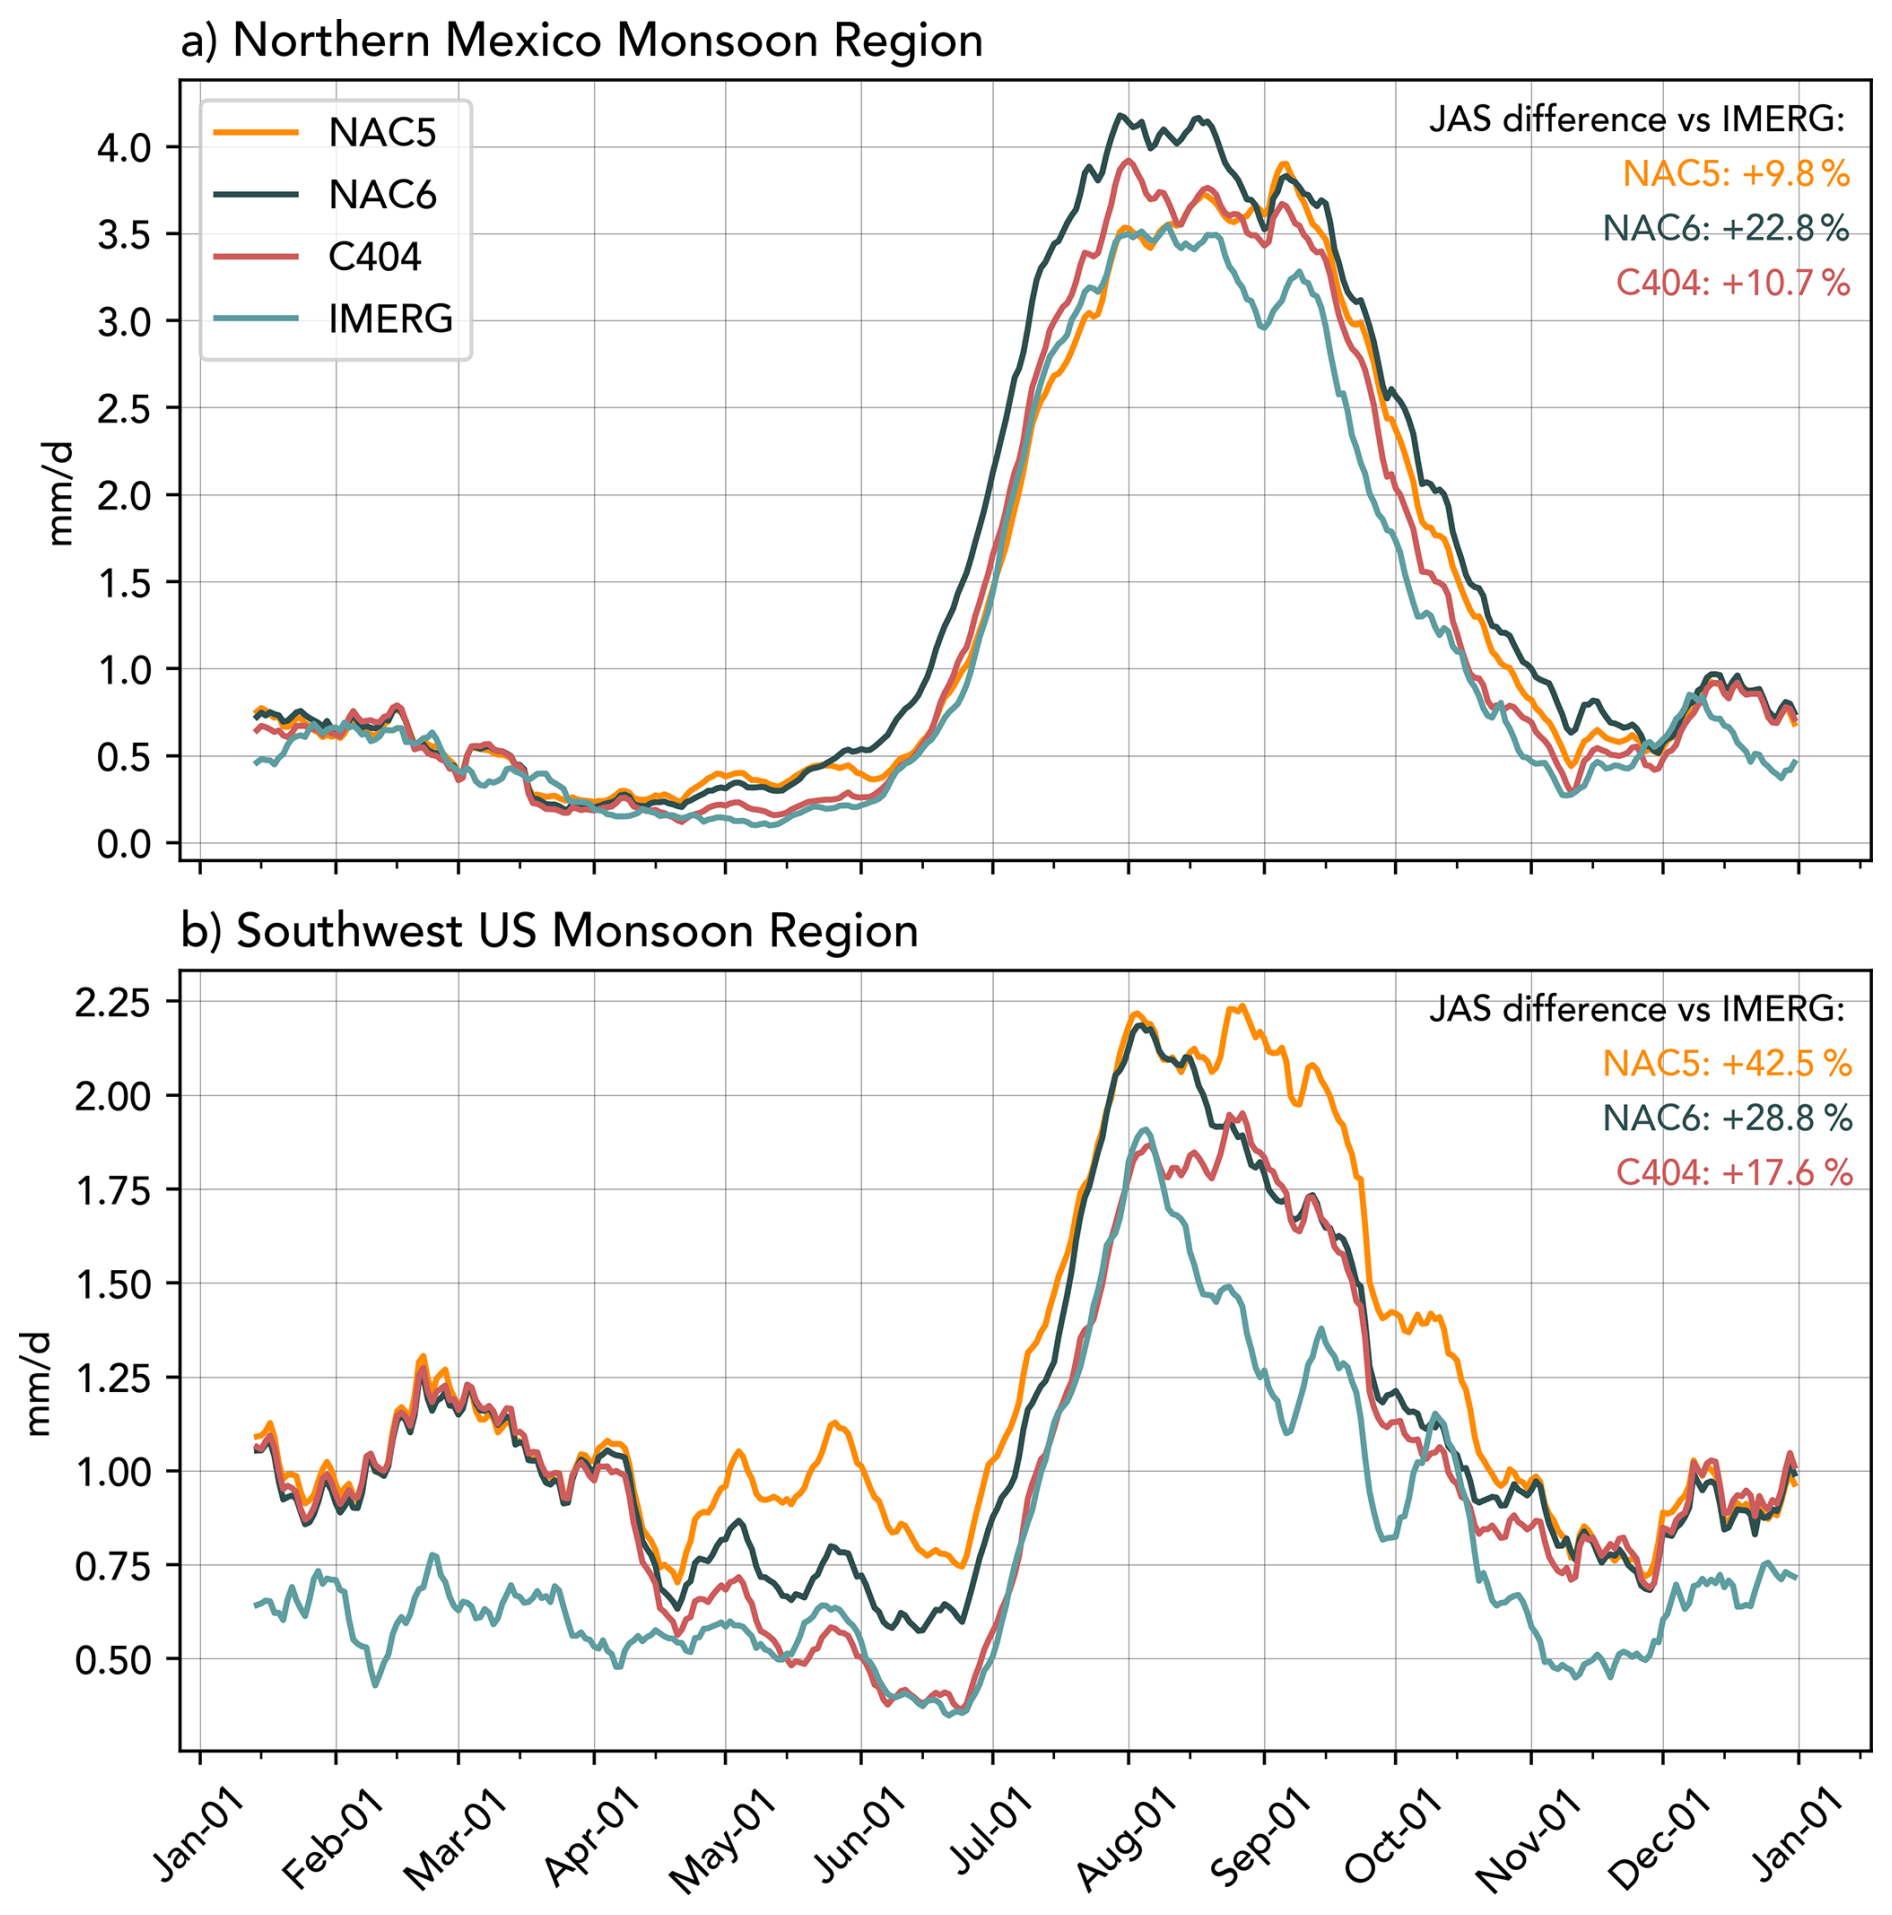
Figure 8Daily climatological mean of precipitation for an area average in northern Mexico (115–105° W and 25–32° N) and the southern US monsoon region (115–105° W and 32–40° N). A 7 d rolling mean is applied to the data to reduce daily variability. The magnitude of July through September mean precipitation over each region is annotated in the top right corner, expressed as a percent of the IMERG climatological value.
In contrast, for the northern extent of the monsoon region in the southern US (Fig. 8b), there is much more divergence in the simulated monsoon precipitation across the WRF simulations. All simulations produce more precipitation than IMERG in the cold season (November through April), and then begin to diverge in Spring (April through June), at which point C404 most closely matches observations. The NAC6 run is the best at capturing the timing of the monsoon precipitation peak in August (note how both C404 and NAC5 produce a secondary peak near 25 August), but it produces about 28. 8 % more precipitation than IMERG from July through September. This is a marked improvement from NAC5 (+42.5 % precipitation in July through September) for the southern US monsoon region.
3.3.2 Snow in the western United States
As estimated by the University of Arizona SWE dataset, climatological values are notably higher at high elevation throughout the western United States, with the prominent mountain ranges in the region experiencing normal SWE values well above 400 kg m−2 for the January through April mean (Fig. S12). We highlight this map to show that there are wide swaths of the region that also experience trace amounts of snow water equivalent below 50 kg m−2. The subsequent analysis focuses on the gridcells that have climatological values higher than 50 kg m−2 so that the bias assessment is not heavily skewed by these smaller SWE values.
The spatial maps (Fig. 9a, c, e) display very heterogeneous differences in January through April climatological SWE, but they highlight the granularity of SWE values for the higher resolution NAC6 and C404. A mean dry signal is evident in all simulations and at all elevation bands (Fig. 9b, d, f), and in general the magnitude of the difference from the reference SWE decreases with increasing spatial resolution. From the 4 km C404 to the 25 km NAC5, the mean dry differences substantially increase: 12 % (C404) to 35 % (NAC5) for 0–500 m, 33 % (C404) to 65 % (NAC5) for 500–1500 m, 29 % (C404) to 45 % (NAC5) for 1500–2500 m, and 25 % (C404) to 50 % (NAC5) for elevations greater than 2500 m. NAC6 has a higher mean bias in SWE than C404 at all elevation bands, but the differences are small: 15 % at the lowest elevation band, and only 1 %–3 % in the three elevation bands above 500 m.
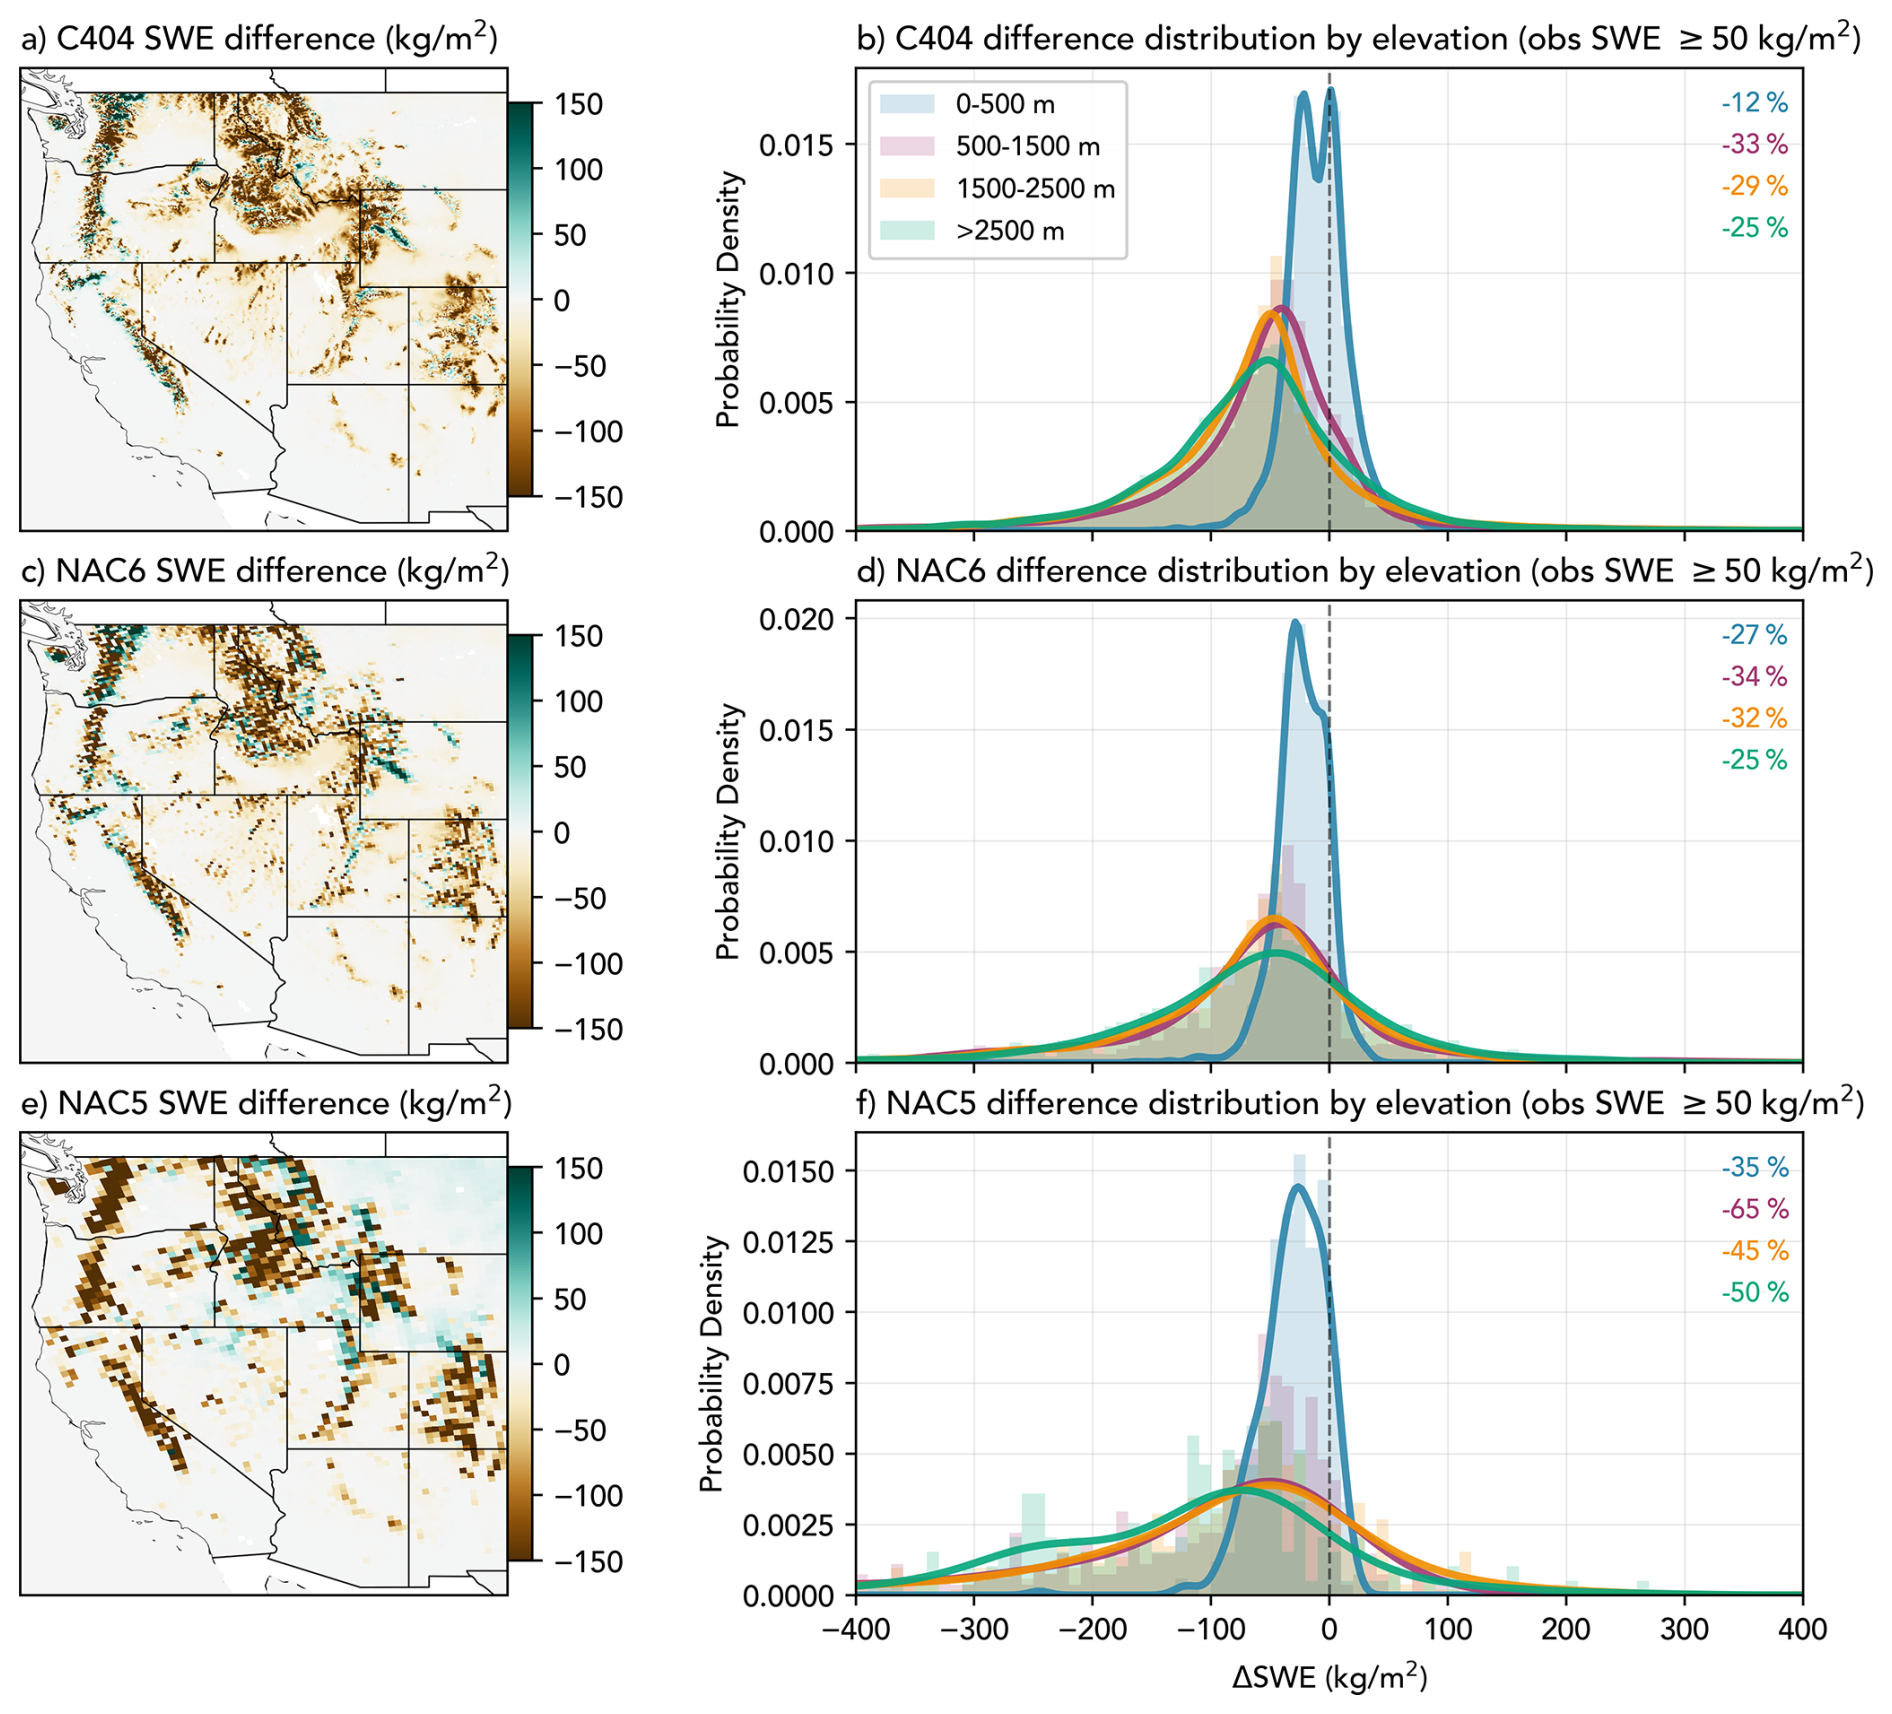
Figure 9Gridpoint bias in SWE for late winter and early spring (JFMAM) using the University of Arizona SWE 4 km dataset as a reference (left column). The right column shows the corresponding bias distribution for elevation bands for C404 (a, b), NAC6 (c, d) and NAC5 (e, f).
When comparing the gridded WRF data with station data, we expect WRF SWE to be lower than the SNOTEL sites because the gridpoint values represent an integration over a large area. In all simulations, the seasonal peak in SWE is earlier than the maximum seasonal peak from the SNOTEL stations, indicating that the snowpack accumulation phase is too short and snowmelt begins generally too early in the year. When all stations are integrated together, the peak SWE timing is 29 d too early in C404, 27 d too early in NAC6, and 41 d too early in NAC5 (Fig. S12). The seasonal cycle is improved from NAC5 to NAC6 and C404, with a notable elongation of the maximum SWE at all stations (Fig. 10b) and in the HUC-8 watershed regions (Fig. 10c–e). This early peak in SWE is consistent across the diverse watershed regions in the western US. He et al. (2021) showed that early season melt events accelerate snowmelt processes in WRF and Noah-MP simulations of the western US, likely due to poorly-represented snow albedo processes, excessive downward surface shortwave radiation, and strong surface winds that enhance surface heat exchange.
These improvements in the representation of the snow seasonal cycle and climatology likely come from the improved representation of snow-relevant orographic processes, including terrain-induced circulation features and local ridge shadowing that reduces snowmelt and sublimation (Rasmussen et al., 2011; McCrary et al., 2022; Ikeda et al., 2010). The land-surface model also plays a large role in the representation of snow and frozen water storage, which has been substantially improved in Noah-MP (used in NAC6 and CONUS404) by updates to radiative transfer and snow compaction (Abolafia-Rosenzweig et al., 2024; Lin et al., 2025).
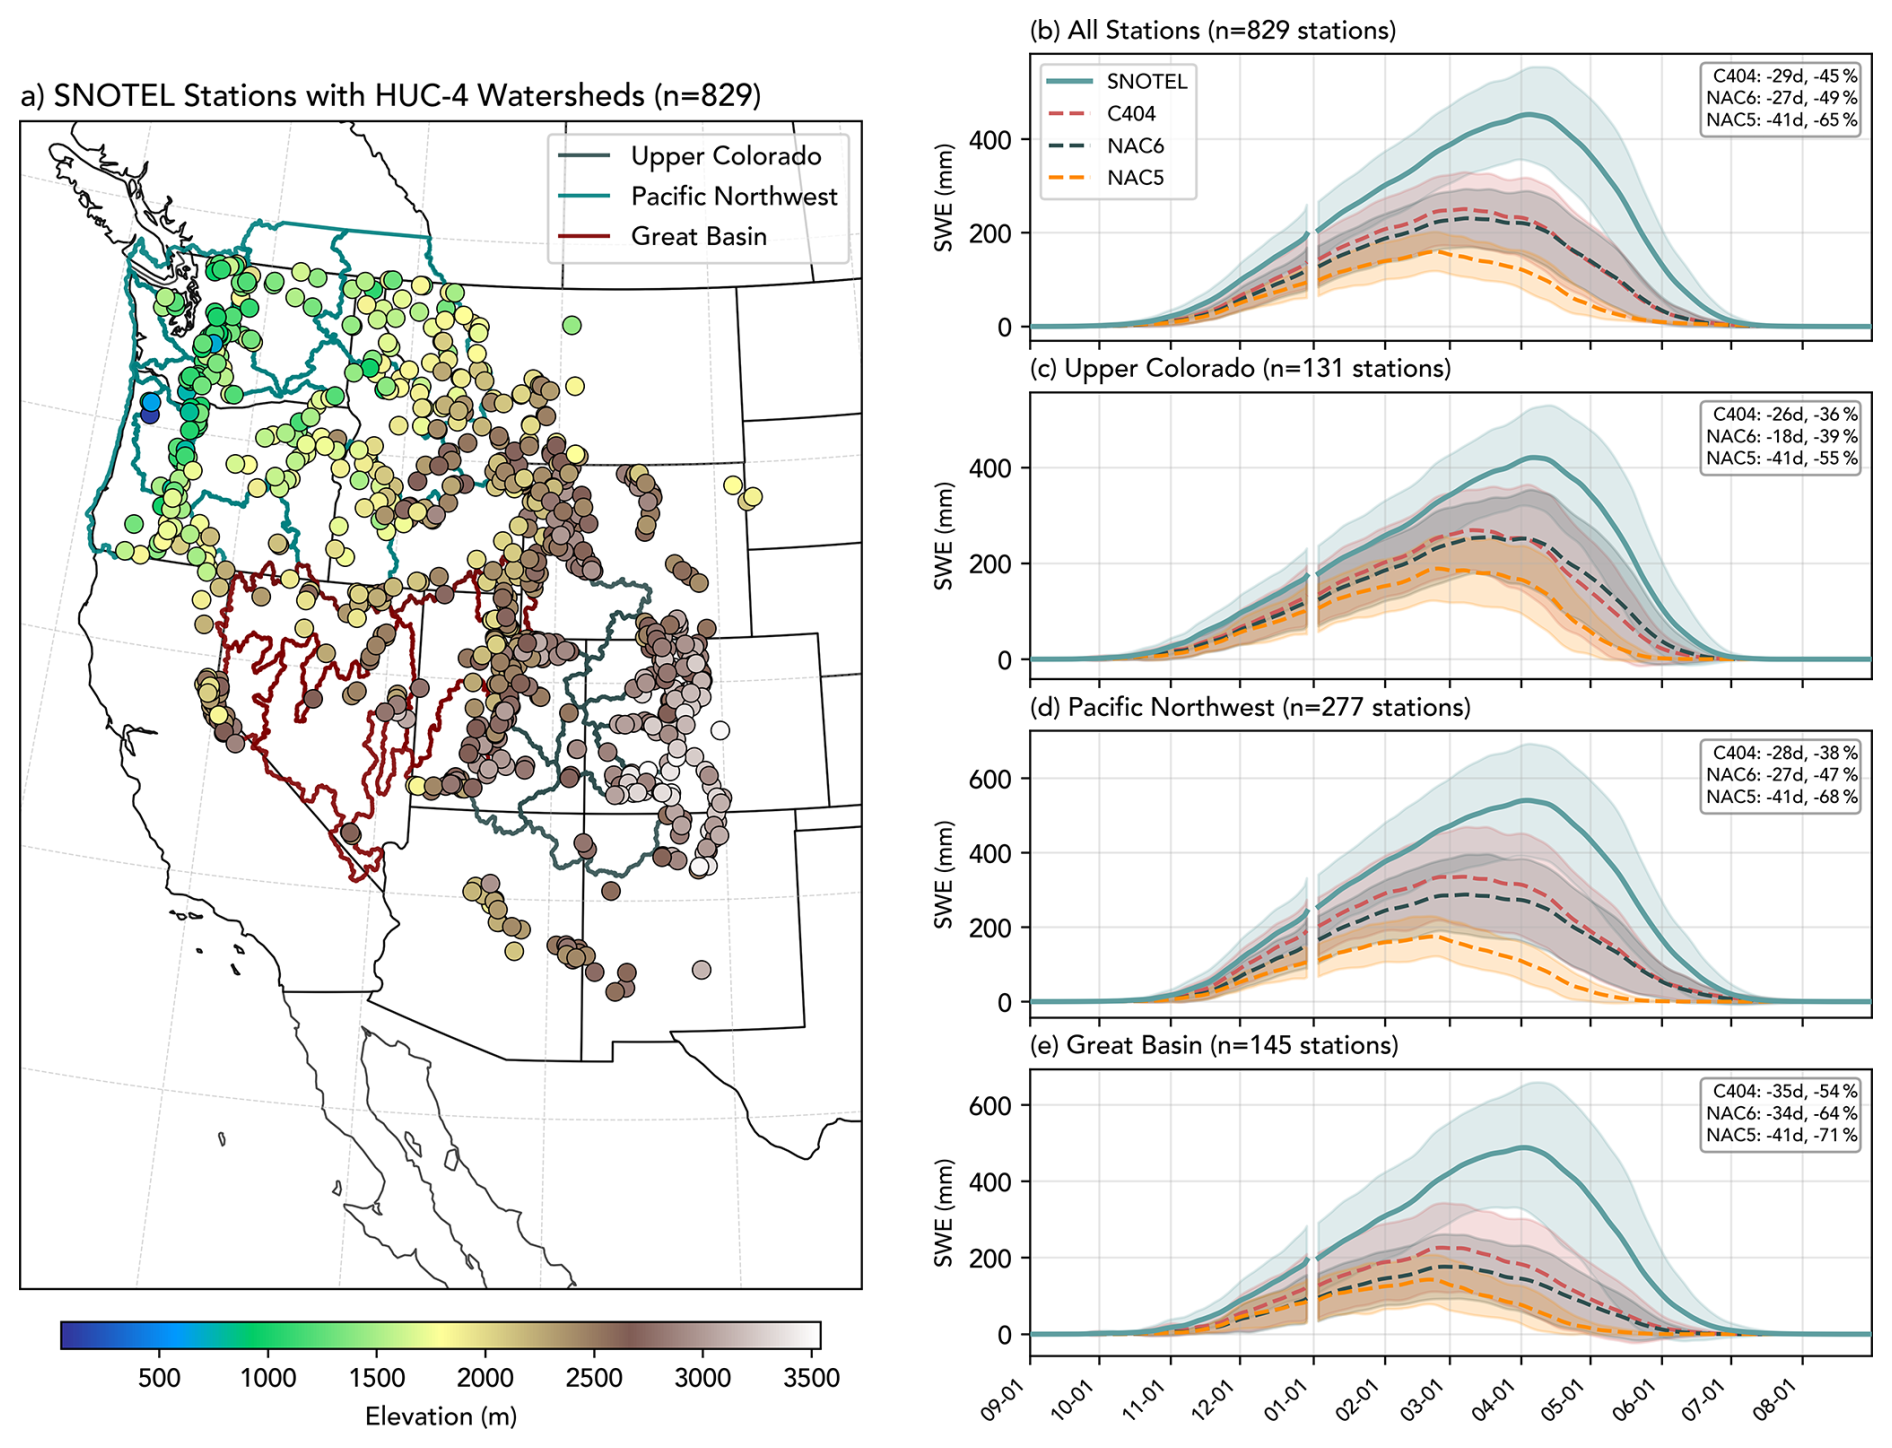
Figure 10Spatial location and elevation of SNOTEL sites used as reference data for station-based SWE, overlaid with Hydrologic Unit Code 8 (HUC8) watersheds (a). Comparison of daily-mean SWE (with a 5 d rolling mean applied) at the gridpoints in closest proximity to the SNOTEL sites for all SNOTEL stations (b) and three HUC-4 watersheds: the Upper Colorado River (c), the Pacific Northwest (d), and the Great Basin (e). Shading represents the year-to-year variability, expressed as the standard deviation of the smoothed daily-mean values for the analysis period (1980–2010). Annotated values in the top right of the time series panels indicate the number of days in which peak climatological SWE in each WRF simulation differs from the SNOTEL peak day, with the magnitude of the difference in peak SWE represented as a % difference compared to SNOTEL.
3.4 Evaluation of extremes
In the following analysis, we compare the three simulations using the “perfect model framework”, treating the results from C404 as the goal-post to compare the efficacy of NAC6 and NAC5. As simulations use spectral nudging, the large-scale circulation is quite similar between the datasets, and many weather events that are resolved by ERA5 are also resolved and simulated in these three simulations. This allows us to compare case studies and climatologies of observed extreme events to see how they were simulated by WRF in different dynamically downscaled configurations. As NAC5 used boundary conditions from ERA-Interim, some of the improvements or differences that are found in the NAC6 and C404 simulations may come from the updates in the driving reanalysis.
3.4.1 Extreme precipitation
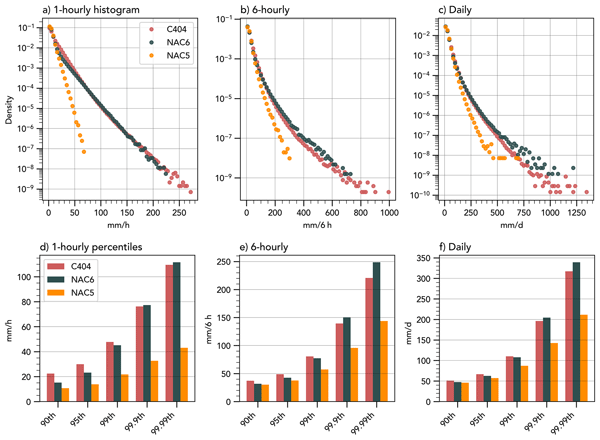
Figure 11 compares precipitation extremes by displaying histograms of the maximum 1-hourly, 6-hourly, and daily precipitation rates in each simulation over the CONUS domain (130–60° W and 30–50° N). In any precipitation dataset or simulation, the frequency and intensity of extreme precipitation rates are dependent on the spatial resolution, with precipitation intensity decreasing as gridpoint area becomes larger (Chen and Dai, 2018). While spatially integrating datasets or simulations with different horizontal resolution may provide more equitable precipitation rates, it is critically important to capture localized extreme rates too.
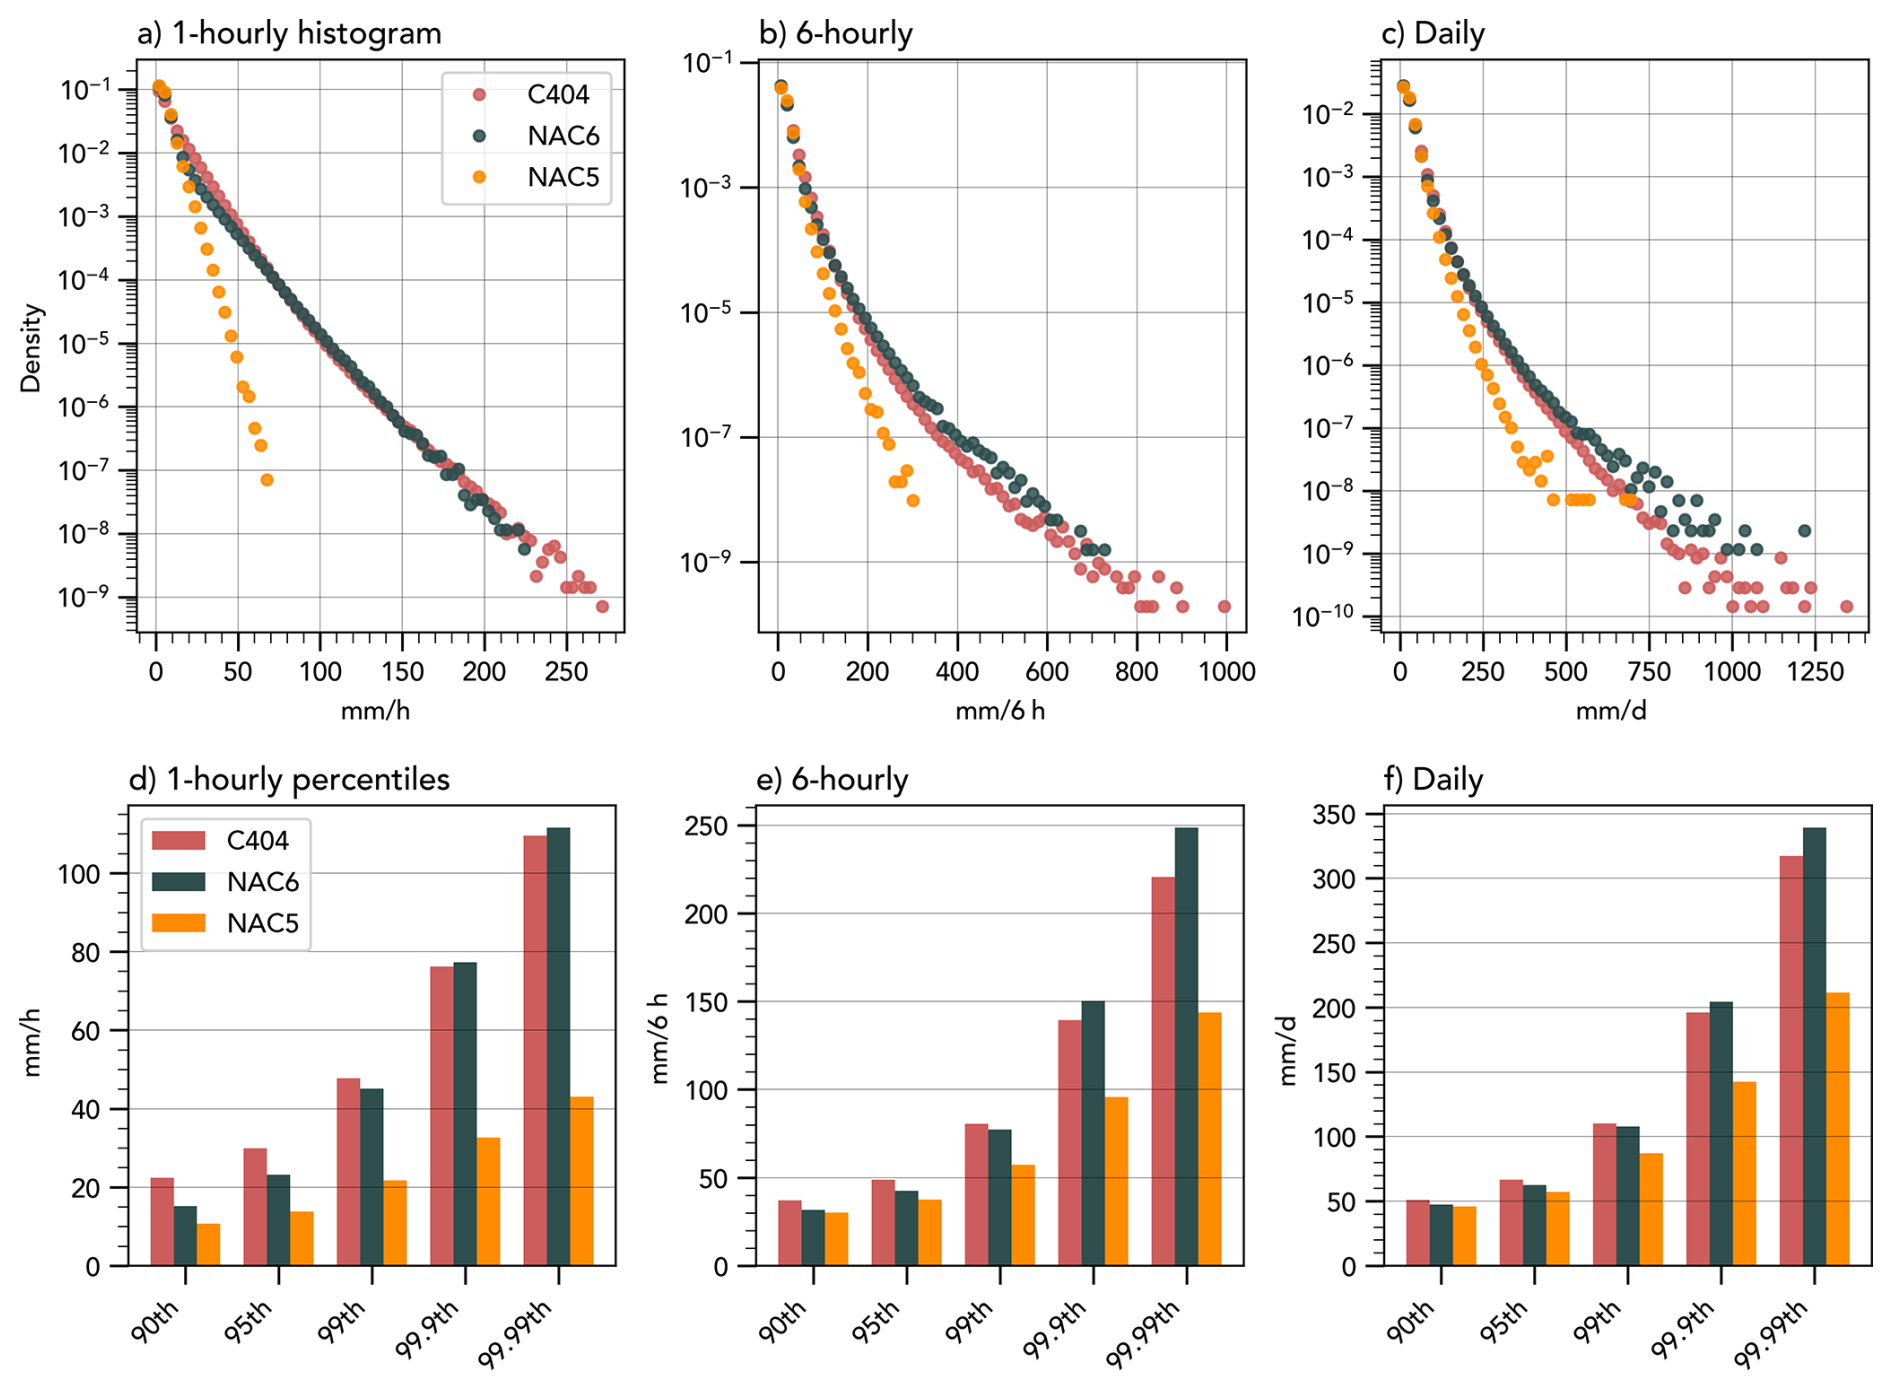
Figure 11Histogram of monthly maximum precipitation for all land grid-points over the CONUS domain (land gridpoints spanning 130–60° W and 30–50° N) at 1-hourly (a), 6-hourly (b) and daily (c) temporal frequencies. Histograms of the 90, 95, 99, 99.9, and 99.99th percentiles are also presented for these different frequencies (d–f).
Rasmussen et al. (2023a) showed that the C404 dataset simulates extreme precipitation rates that closely match station-based observational estimates, rendering this simulation a quality benchmark for our precipitation comparisons (Schumacher and Hill, 2026). Figure 11 shows that the probability density of extreme precipitation rates in NAC6 is very similar to C404 at all temporal frequencies (especially 1 h), even without resolved convection. Precipitation rates exceeding 224 mm h−1 are not found in the 12 km NAC6, but the overall distribution of extreme rainfall events is a marked improvement over NAC5 which more noticeably deviates from the extreme precipitation distribution at 1 h timescales.
Quantitative comparison of extreme precipitation percentiles (Fig. 11) confirms that this agreement between NAC6 and C404 holds across the tail of the distribution, not just in bulk. At 1 h resolution, NAC6 percentiles closely bracket C404 from the 99th through the 99.99th percentile (45.1 vs. 47.8 mm h−1 and 111.6 vs. 109.5 mm h−1, respectively), differing by only a few percent even at the most extreme thresholds. At the coarser 6 h and daily accumulations, NAC6 remains close to C404 through the 99th percentile but modestly exceeds it at the 99.9th and 99.99th percentiles (248.7 vs. 220.7 mm per 6 h at the 99.99th percentile, a 13 % difference), suggesting that parameterized convection at 12 km may produce proportionally larger accumulated totals over longer windows than explicitly resolved convection, even where the two simulations agree closely on sub-daily rates. NAC5, in contrast, underestimates extreme precipitation relative to C404 at every percentile and frequency, and the underestimate grows with percentile, widening from roughly 30 %–55 % at the 99th percentile to 35 %–61 % at the 99.99th percentile depending on frequency. This indicates that the improvement from NAC5 to NAC6 is not confined to the bulk of the precipitation distribution but extends into its extreme tail.
3.4.2 Tropical cyclones
The following analysis examines processes historically difficult to simulate at coarser model resolutions, including a case study and climatology of (TC) characteristics and a case study of a severe summertime convective storm. Hurricane Ivan is chosen as the TC case study because it was a strong TC within the temporal and spatial range of all datasets. Ivan reached Category 5 status on 9 September 2004 and then made landfall as a Category 3 hurricane in Orange Beach, Alabama on 16 September 2004, producing a record-breaking tornado outbreak and up to 43 cm of rainfall with widespread flooding (Steward, 2004). While these simulations cannot represent the tornado outbreak, we evaluate storm intensity and impact metrics: minimum surface pressure, maximum precipitation rate, and maximum wind speed within a 150 km radius of the storm center (the gridpoint with lowest surface pressure).
Figure 12a–c shows the downward shortwave radiation at the surface for the hurricane in each simulation. While outgoing longwave radiation would provide a better visualization of the TC structure, this variable is not output at the needed frequency in NAC5 to enable a comparison between the three datasets. C404 clearly resolves the inner eye and spiral rainbands, with a notably symmetric pre-landfall structure indicating low wind shear, closely resembling observed Hurricane Ivan at this time (15 September 2004, 18:00 UTC) (National Weather Service, Mobile/Pensacola Weather Forecast Office, 2024). NAC6 also resolves important storm characteristics, including a well-defined eye, coarse spiral banding, and symmetric structure (Fig. 12b). At 25 km, NAC5 still resolves a central eye but fails to depict realistic spiral banding or storm symmetry (Fig. 12c).
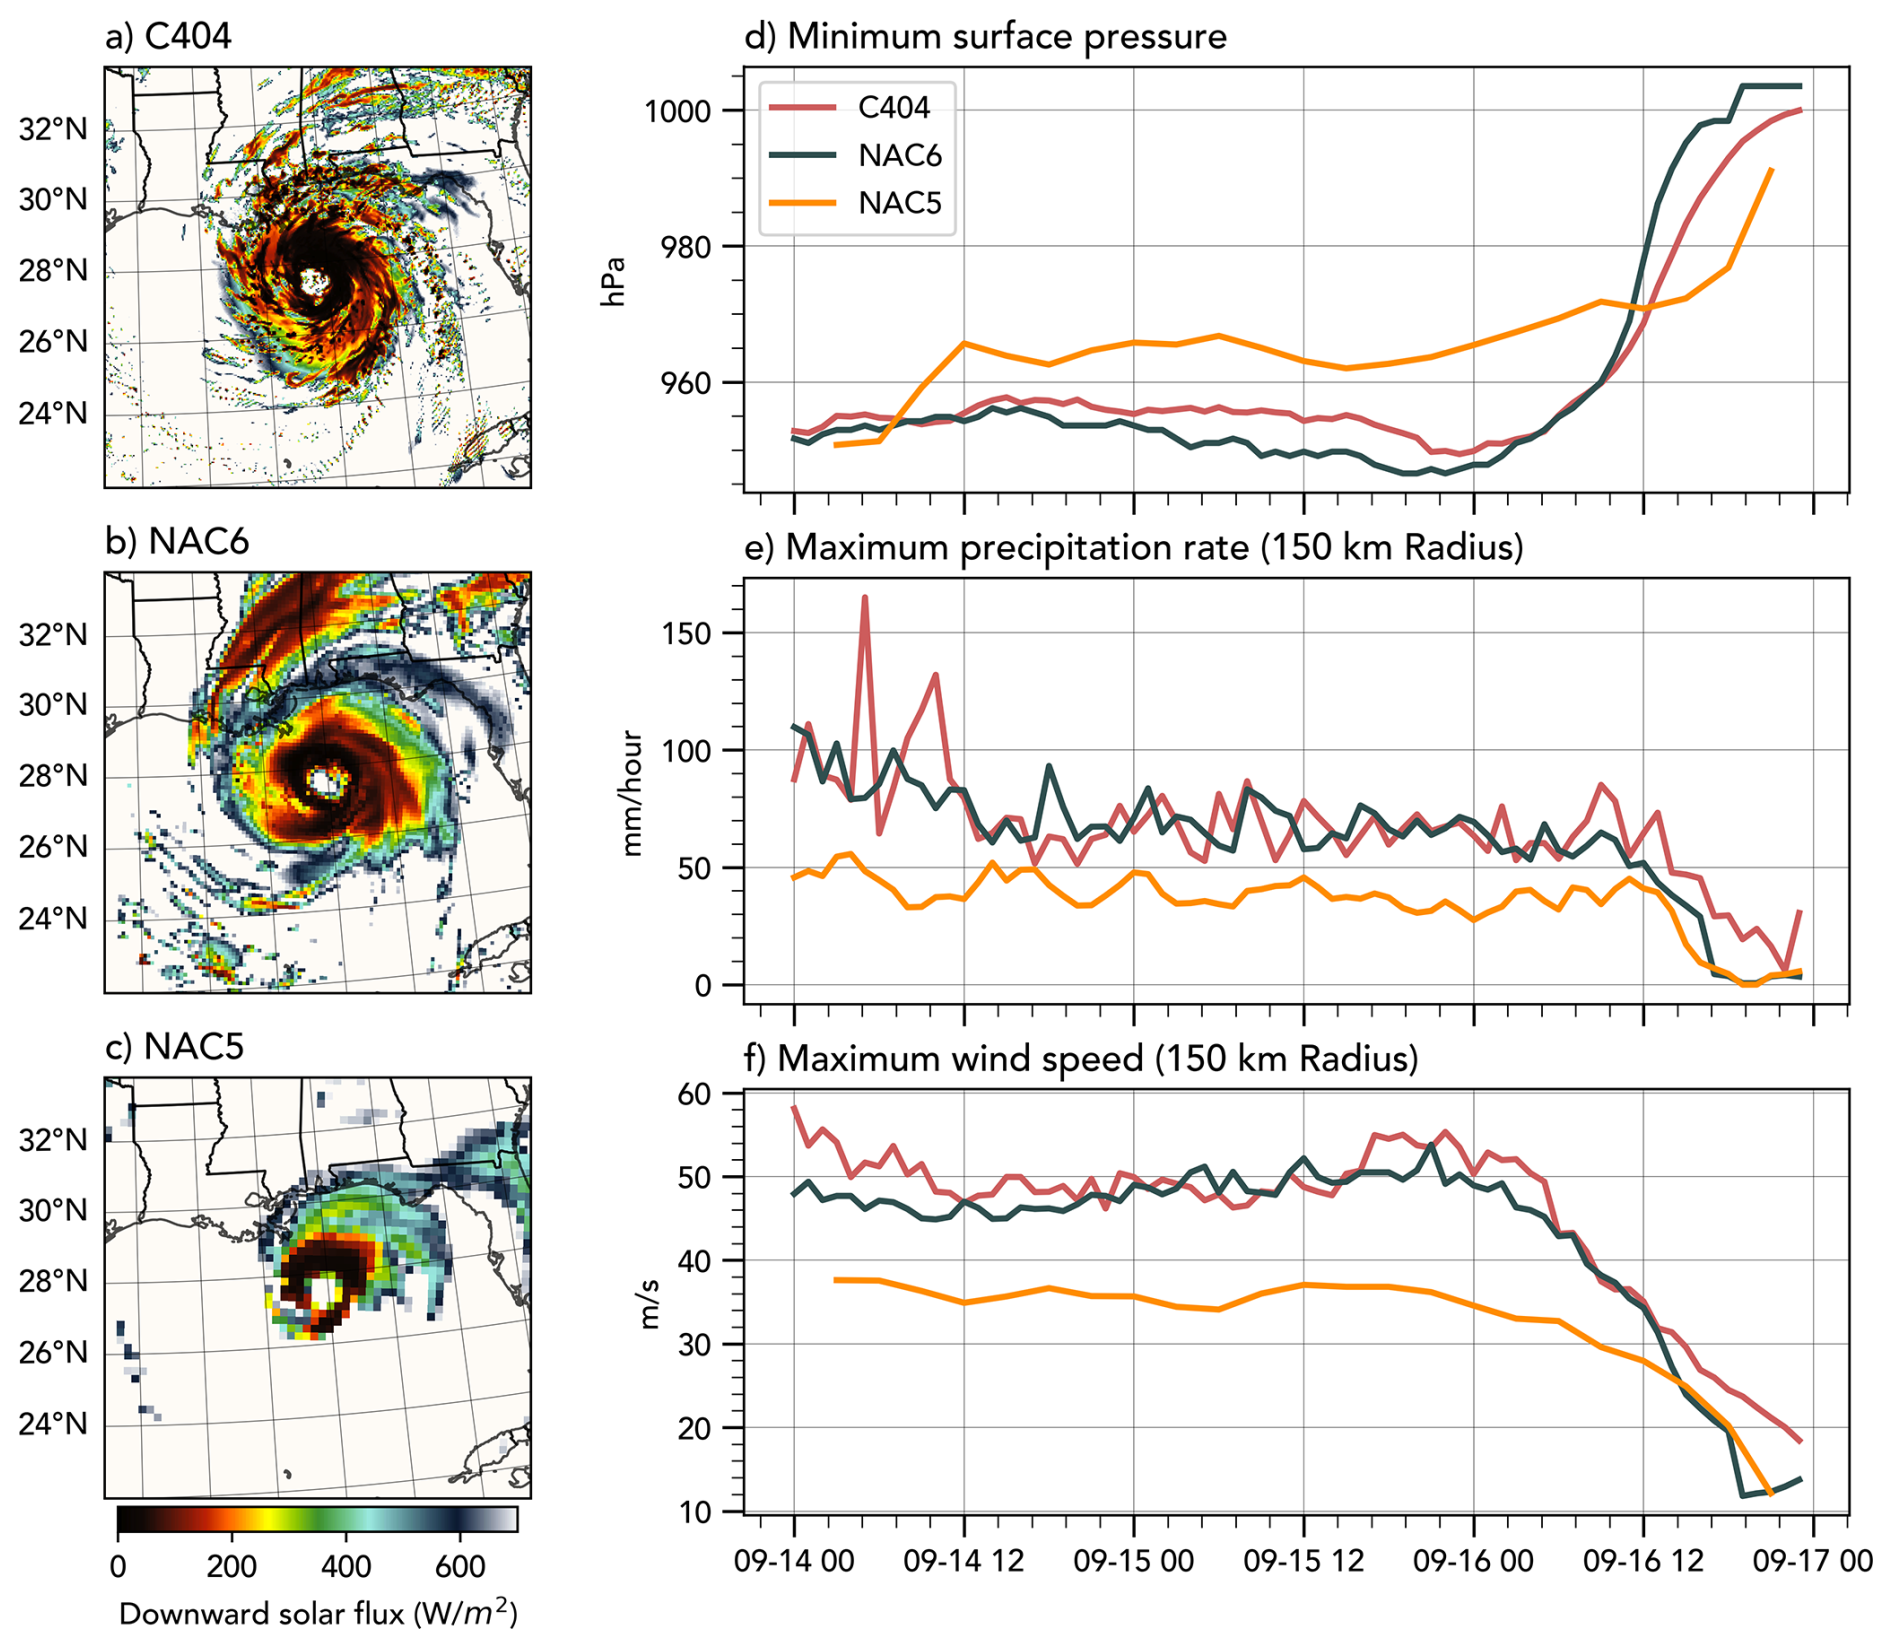
Figure 12Shortwave radiation flux revealing cloud structure of the simulated TC on 15 September 2004 at 18:00 UTC in all three simulations (a–c). The right column shows the minimum surface pressure (d), maximum precipitation rate (e), and maximum wind speeds (f) within 150 km radius of the minimum surface pressure value.
NAC6 also reliably produces metrics describing storm intensity and potential impacts (Fig. 12d–f). Both C404 and NAC6 show very similar evolutions of minimum surface pressure, maximum precipitation rate, and maximum wind speed while the TC was in the Gulf of Mexico (14 through 17 September). TC metrics from NAC5 are comparatively very weak.
We note that part of the improvement in simulated TC structure and intensity from NAC5 to NAC6 (Figs. 11, 12) may be attributable to the driving reanalysis rather than WRF resolution or physics alone. ERA5 represents tropical cyclones with greater intensity and structural realism than ERA-Interim, owing to its finer resolution and more advanced assimilation of observations (Hersbach et al., 2020). Since NAC6 is nudged toward ERA5 and NAC5 toward ERA-Interim, some of the TC improvement documented here likely reflects this difference in boundary conditions. Figure S13 highlights that the updates to ERA5 result in a much more realistic looking TC, as the ERA-Interim representation of Hurricane Ivan completely lacks an eye and has very weak TC intensity metrics throughout the life of the storm (minimum surface pressure of 975 hPa, a maximum precipitation rate of 20 mm h−1 and a maximum wind speed of about 31 m s−1).
This distinction also matters for interpreting these results in the context of the planned NA-CORDEX-CMIP6 ensemble, which will be driven by CMIP6 ESMs with resolution coarser than either reanalysis; TC statistics from that ensemble may therefore resemble NAC5 more closely than the ERA5-driven NAC6 evaluation run presented here.
We extend this analysis into a climatology by evaluating the same metrics–minimum pressure, maximum precipitation rate, and maximum 10 m wind speed – for every TC that tracked into the Gulf of Mexico within 20–40° N and 105–75° W, and was labeled a hurricane by the National Hurricane Center. We use the IBTrACS TC data for an initial guess at the storm location (the actual storm center in each WRF simulation is obtained by finding the minimum surface pressure within 50 km of the IBTrACS storm location) and for the TC category as defined by the US National Hurricane Center.
Violin and box plots of these metrics are shown for the three simulations in Fig. 13. For all three intensity metrics, the C404 and NAC6 runs have similar distributions associated with TCs, with the strongest similarity shown for minimum pressure (Fig. 13a) and maximum precipitation (Fig. 13b). The wind speed distributions do clearly decrease with the resolution (Fig. 13c), but NAC6 still performs well compared to C404. These results suggest that the NAC6 dataset is suitable for analyzing larger-scale statistics and impacts of tropical cyclones. Research focused on TC dynamics and storm structure (for example, eyewall updrafts and mesovortices) requires a much higher resolution than even 4 km (Liu et al., 2021).
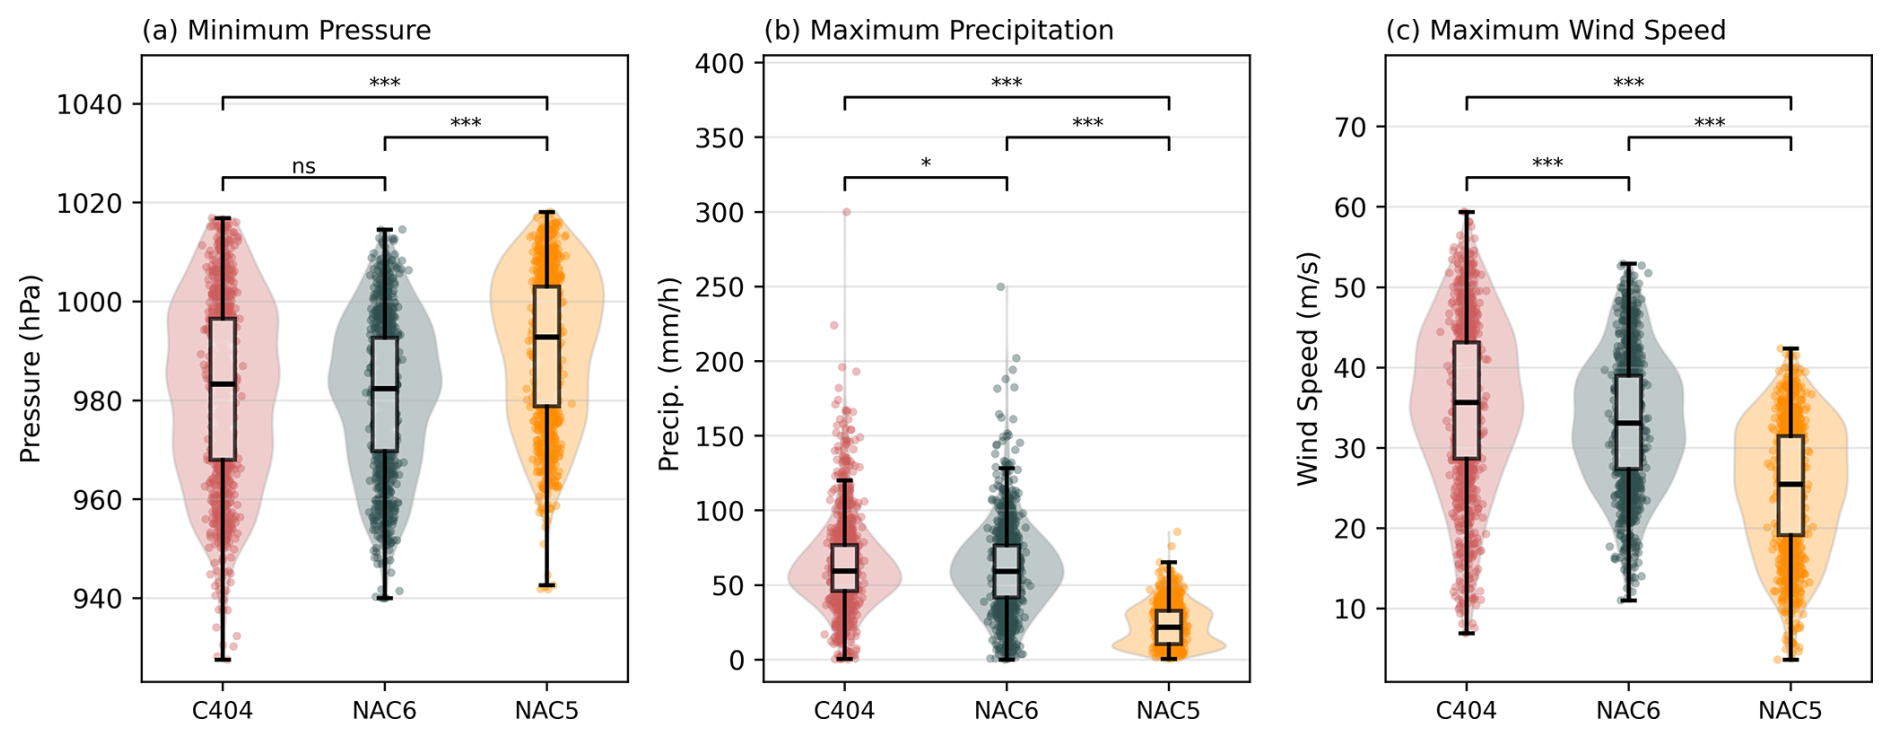
Figure 13Violin and box plots of minimum central pressure for all TCs within the Gulf from 1980 through 2010 in each simulated dataset (a). Panels (b) and (c) similarly display the maximum precipitation and maximum wind speed within 150 km radius of the storm center. Brackets denote pairwise statistical significance (Welch's t-test; , , , ns not significant); results were consistent with a non-parametric Mann-Whitney U test (not shown).
3.4.3 Case study of a mesoscale convective system
Convectively generated mid-latitude storms pose substantial threats to human life and cause significant economic damage each year (Ashley and Mote, 2005; Wade et al., 2025), especially in central North America. The most impactful are often mesoscale convective systems (MCSs), in which localized convection organizes into larger propagating complexes of intense thunderstorm activity, sometimes producing powerful windstorms or derechos.
On 22 July 2003, a powerful MCS known as the “Mid-South Derecho” propagated from Arkansas through Northern Alabama with wind gusts exceeding 40 m s−1 (McNeil et al., 2003). We compare the severe storm environment across the three runs using 750 hPa horizontal moisture flux () into the Midwest on 22 July 2003 (Fig. 14). Moisture flux at this level indicates increased atmospheric instability and potential for heavier precipitation (Gimeno-Sotelo and Gimeno, 2023; Barlow et al., 2019). The large-scale circulation (500 hPa) is similar across simulations, but notable differences emerge in the moisture flux fields, which are not nudged in C404 and NAC6. We do not expect parameterized convection to adequately simulate an MCS, but highlight differences in the resolved storm environment across simulations.
Figure 14 shows substantially different mesoscale storm structures in the three WRF runs. All datasets produce an elongated longitudinal band of enhanced moisture flux aligned with low-level winds, but smaller-scale convective features are only present in C404, visible as localized areas (< 20 km) of enhanced moisture flux, particularly in the northeast quadrant of Fig. 14a. Both NAC6 and NAC5 resolve a more contiguous moisture flux band lacking these smaller-scale convective features (Fig. 14b–c).
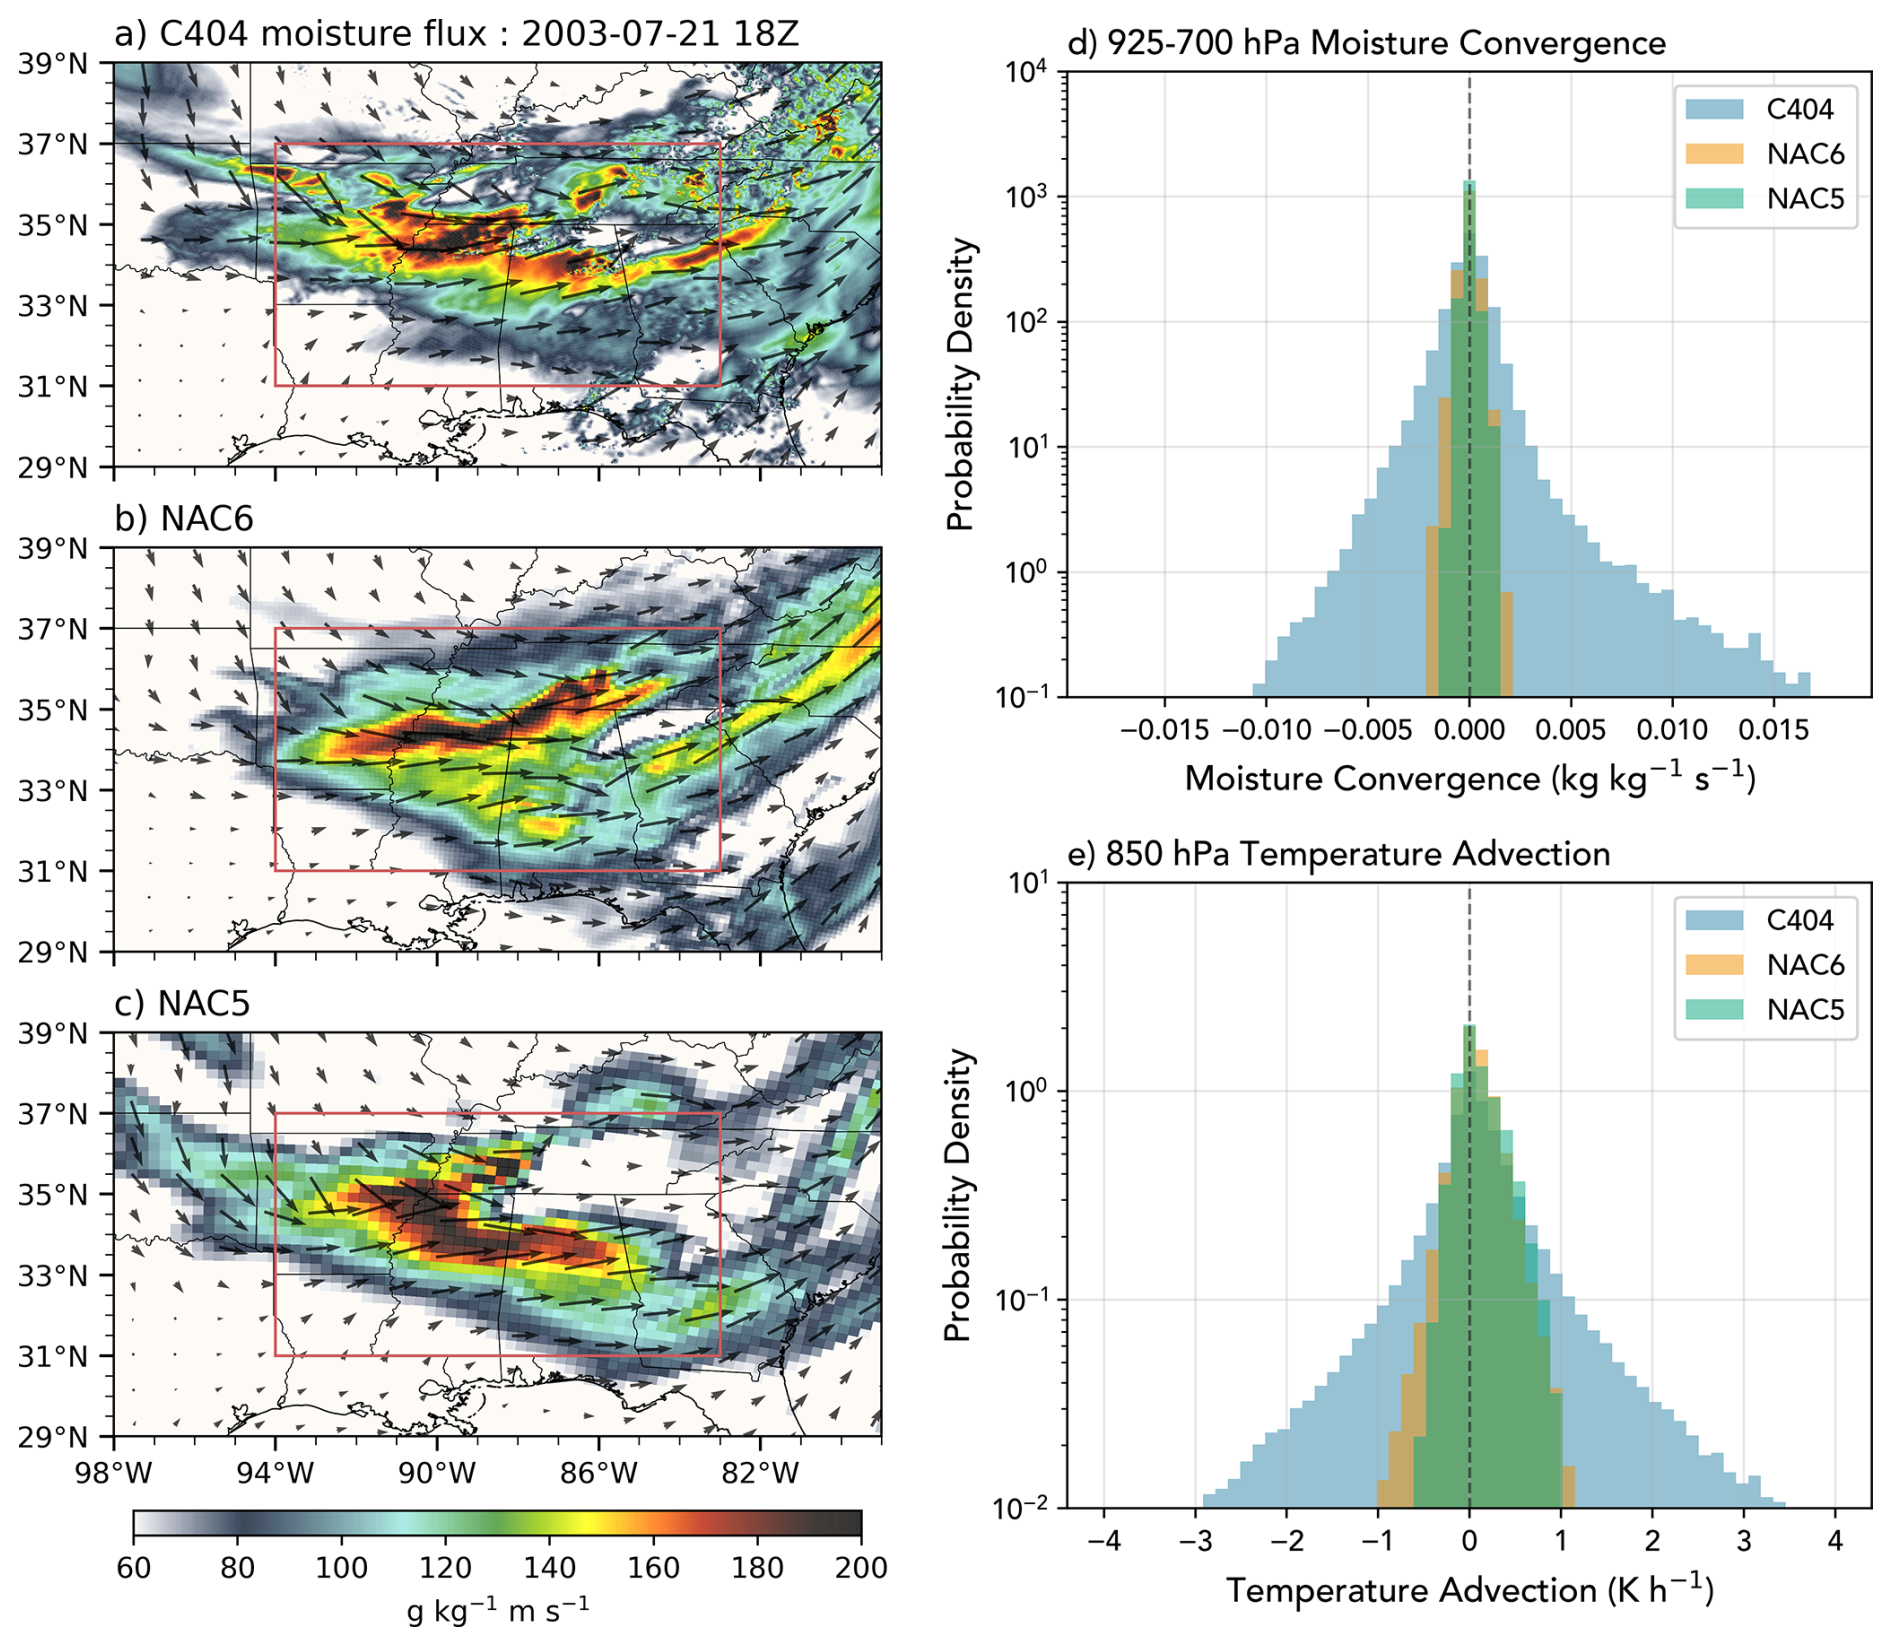
Figure 14750 hPa moisture flux during the “Mid-South Derecho”, which translated across the southern Great Plains on 22 July 2003 (18:00 Z pictured here). Shading indicates the magnitude of moisture flux; vectors indicate the direction and magnitude. Histograms of (d) 925–700 hPa column-integrated moisture convergence and (e) 850 hPa temperature advection at 00:00, 06:00, 12:00, and 18:00 Z on 21 July 2003 for each simulation over the domain shown by the red rectangle in panels (a)–(c).
Figure 14d–e highlights the importance of convection-permitting scales for representing distributions of moisture flux convergence (MFC; Eq. 2; Fig. 14d) and temperature advection (Eq. 3; Fig. 14e), two metrics associated with intense localized instability and extreme precipitation rates (spatial plots in Fig. S14). All simulations exhibit distributions centered near zero with similar overall structure, but both CORDEX simulations have substantially narrower distributions than the convection-resolving dataset, with far fewer high-magnitude convergence and advection events. C404 shows substantially larger variability than NAC6 and NAC5 in both moisture flux convergence and temperature advection, with 95th percentile magnitudes 3.0–4.0 times higher ( vs. and kg kg−1 s−1; 1.79 vs. 0.54 and 0.59 K h−1) than the CORDEX simulations. NAC6 and NAC5 show comparable magnitudes to each other in both metrics, with NAC6 only modestly exceeding NAC5 (e.g., 95th percentile moisture convergence of vs. kg kg−1 s−1), underscoring that resolved convection, not resolution alone, drives the sharper gradients captured by C404.
Both reanalyses show even narrower distributions than their driving simulations, consistent with their coarser native resolution (∼ 0.25° for ERA5, ∼ 0.7° for ERA-Interim) relative to the 12 and 25 km WRF grids (Fig. S15). Notably, NAC6's 95th percentile magnitudes closely track ERA5 ( vs. kg kg−1 s−1 for moisture convergence; 0.54 vs. 0.55 K h−1 for temperature advection), while NAC5 exceeds ERA-Interim by a larger margin, particularly for moisture convergence ( vs. kg kg−1 s−1, roughly 1.8 times higher). This suggests that part of the apparent gap between NAC6 and NAC5 reflects the difference in resolution and structure between their respective driving reanalyses, rather than the WRF grid spacing alone. Disentangling these reanalysis-driven contributions would require another simulation with the same forcing reanalysis at a different regional resolution, which is out of the scope of the current case study.
Our evaluation demonstrates notable improvements in the NAC6 configuration across nearly all metrics examined over NAC5. This 12 km ERA5-driven simulation exhibits reduced biases in temperature, precipitation, and snow, enhanced representation of diurnal processes, and improved simulation of extreme events compared to the previous-generation NAC5 simulation. Particularly encouraging is the performance of extreme precipitation rates and snow, which compare favorably with the convection-permitting C404 dataset. These results support NAC6 as a robust framework for investigating long-term changes in extreme precipitation and regional climate. Additionally, both our case-study analysis and climatological metrics of tropical cyclones simulated by NAC6 show promising skill, indicating the configuration's ability to represent key weather systems at convection-parameterized scales.
Relative to NAC6, the convection-permitting C404 simulation shows clear advantages in specific areas: reduced warm biases in daily minimum temperatures across the western US, more realistic diurnal temperature ranges, and superior representation of diurnal precipitation phasing, including the eastward propagation of convective events from the Rocky Mountains into the Great Plains and Midwest. C404 also shows modestly reduced SWE biases at low elevations (0–500 m). However, the precipitation comparison between NAC6 and C404 is more nuanced: NAC6 exhibits a less severe dry bias in parts of the western US, but neither dataset is uniformly superior, as relative skill varies by region and season. For resolved-scale climate characteristics such as mean temperature and precipitation biases, extreme precipitation rates, and tropical cyclone intensity, NAC6 demonstrates performance broadly consistent with C404 while offering the computational efficiency required for ensemble-based uncertainty quantification.
Our case-study analysis of a severe convective storm environment highlights the clearest resolution gap: the sharp temperature and moisture gradients that produce localized extremes during convective storms were only realistically simulated in C404, rendering both NAC6 and NAC5 less suitable for studies focused specifically on convective storm dynamics. Other notable deficiencies in the NAC6 simulation include the strong overestimation of the diurnal temperature range in much of the Northern sector of the continent, and the lack of a clear propagation of diurnal precipitation from the Rockies to the eastern half of North America. Nevertheless, there is substantial value in simulations at 12 km resolution, particularly given computational constraints.
As noted above, the difference in driving reanalysis between NAC6 and NAC5 also matters for interpreting these results in the context of the planned NA-CORDEX-CMIP6 ensemble, which will be driven by CMIP6 ESMs with resolution coarser than either reanalysis; TC and extreme event statistics from that ensemble will therefore differ from the results here based on higher fidelity reanalysis data.
At the time of writing, fully convection-permitting long-term climate ensembles that sample structural and emissions-scenario uncertainty (Qian et al., 2016) remain computationally prohibitive, especially over a large domain such as North America. Our results demonstrate that 12 km simulations provide substantial and scientifically robust information about weather and climate processes while enabling ensemble breadth. In this context, the 12 km CORDEX simulations will serve as a practical and defensible “workhorse” for dynamical downscaling efforts aimed at quantifying multiple sources of climate uncertainty. Continued reduction of climatological bias remains an important objective, but the demonstrated performance of NAC6 supports its use for ensemble-based downscaling and climate studies (Paquin et al., 2025; Rahimi et al., 2022).
This evaluation run represents one component of the planned NA-CORDEX-CMIP6 simulation suite. At the time of writing, simulations downscaling five CMIP6 ESMs with WRF are almost complete, and their outputs will be made publicly available through the NSF National Center for Atmospheric Research's Global Geoscience Data Exchange (NCAR GDEX). These ensemble simulations will enable more comprehensive assessments of climate change impacts across North America and provide crucial information for regional adaptation and decision-making.
The WRF model version 4.6.1 used in this study is open source and released under a public domain license. The exact source code is archived on Zenodo at https://doi.org/10.5281/zenodo.19010235 (Skamarock et al., 2019). The ERA5 reanalysis model-level data used to force the NAC6 and C404 simulations are available from the NSF NCAR Geoscience Data Exchange (GDEX) (https://doi.org/10.5065/XV5R-5344, Hersbach et al., 2020). ERA5-Land data used as a reference for climatological biases are also available from GDEX (https://doi.org/10.5065/SNVE-T250, European Centre for Medium-Range Weather Forecasts, 2026; Balsamo et al., 2015). GPM IMERG V07B precipitation data used for diurnal cycle evaluation are available from GDEX (https://doi.org/10.5065/KRNV-Y644, Huffman et al., 2024; Huffman et al., 2023). The University of Arizona 4 km gridded SWE dataset is available from the NASA National Snow and Ice Data Center DAAC (https://doi.org/10.5067/0GGPB220EX6A, Broxton et al., 2019). SNOTEL station data are maintained by the USDA Natural Resources Conservation Service (https://www.nrcs.usda.gov/wps/portal/wcc/home/snowData/, last access: 12 November 2024); the aggregated datafile used in this study is archived on Zenodo (https://doi.org/10.5281/zenodo.19010235, Stuivenvolt-Allen et al., 2026). The IBTrACS tropical cyclone best track data are available from NOAA NCEI (https://doi.org/10.25921/82ty-9e16, Gahtan et al., 2024). The CONUS404 simulation output is available from GDEX (https://doi.org/10.5065/ZYY0-Y036, Rasmussen et al., 2023b, a). The NA-CORDEX-CMIP5 dataset is available from GDEX (https://doi.org/10.5065/D6SJ1JCH, Mearns et al., 2017). Data and Python scripts needed to reproduce the analysis of the NAC6 simulation and derived analysis products supporting all figures in this study are archived on Zenodo along with our customized WRF namelist and model source code (https://doi.org/10.5281/zenodo.19010235). The NAC6 simulation output will be archived on NCAR GDEX (DOI forthcoming prior to final publication). All datasets are available under open-access licenses unless otherwise noted.
The supplement related to this article is available online at https://doi.org/10.5194/gmd-19-8995-2026-supplement.
JSA, TE, and SR configured the WRF model. JSA and TE performed the simulations. JSA, TE, RM, MB, SR, and HIC contributed to the selection of model physics and configuration options. All authors contributed to the study methodology. JSA conducted all analyses, developed the analysis code, and wrote the original draft. TE, RM, MB, SR, HIC, and SM reviewed and edited the manuscript. RM acquired funding. SR provided computational resources.
At least one of the (co-)authors is a member of the editorial board of Geoscientific Model Development. The peer-review process was guided by an independent editor, and the authors also have no other competing interests to declare.
Publisher's note: Copernicus Publications remains neutral with regard to jurisdictional claims made in the text, published maps, institutional affiliations, or any other geographical representation in this paper. The authors bear the ultimate responsibility for providing appropriate place names. Views expressed in the text are those of the authors and do not necessarily reflect the views of the publisher.
This material is based upon work supported by the NSF National Center for Atmospheric Research, which is a major facility sponsored by the U.S. National Science Foundation under Cooperative Agreement No. 1852977. Hsin-I Chang was supported by the Arizona Board of Regents Technology and Research Initiative Fund. We acknowledge high-performance computing support from the Derecho system (https://doi.org/10.5065/qx9a-pg09), provided by NSF NCAR's Computational and Information Systems Laboratory at the NSF NCAR-Wyoming Supercomputing Center, sponsored by the NSF and the State of Wyoming. Computing resources were provided through allocations to SR and MSB via the Wyoming-NCAR Alliance, and through NSF NCAR employee allocations to JSA, RM, SM, and TE. Additionally, the setup and configuration of WRF was aided by the expertise and support of Cenlin He, Jared Lee, and Zhe Zhang at NSF NCAR.
This material is based upon work supported by the NSF National Center for Atmospheric Research, which is a major facility sponsored by the National Science Foundation under Cooperative Agreement No. 1852977.
This paper was edited by Lluís Fita and reviewed by Silvina Solman and two anonymous referees.
Abolafia-Rosenzweig, R., He, C., Chen, F., and Barlage, M.: Evaluating and enhancing snow compaction process in the Noah-MP land surface model, J. Adv. Model.Earth Sy., 16, e2023MS003869, https://doi.org/10.1029/2023MS003869, 2024. a
Ashley, W. S. and Mote, T. L.: Derecho hazards in the United States, B. Am. Meteorol. Soc., 86, 1577–1592, https://doi.org/10.1175/BAMS-86-11-1577, 2005. a
Bae, S. Y., Hong, S.-Y., and Lim, K.-S. S.: Coupling WRF double-moment 6-class microphysics schemes to RRTMG radiation scheme in weather research forecasting model, Adv. Meteorol., 2016, 5070154, https://doi.org/10.1155/2016/5070154, 2016. a
Balsamo, G., Albergel, C., Beljaars, A., Boussetta, S., Brun, E., Cloke, H., Dee, D., Dutra, E., Muñoz-Sabater, J., Pappenberger, F., de Rosnay, P., Stockdale, T., and Vitart, F.: ERA-Interim/Land: a global land surface reanalysis data set, Hydrol. Earth Syst. Sci., 19, 389–407, https://doi.org/10.5194/hess-19-389-2015, 2015. a, b
Barlage, M., Chen, F., Rasmussen, R., Zhang, Z., and Miguez-Macho, G.: The importance of scale-dependent groundwater processes in land-atmosphere interactions over the central United States, Geophys. Res. Lett., 48, e2020GL092171, https://doi.org/10.1029/2020GL092171, 2021. a, b
Barlow, M., Gutowski Jr, W. J., Gyakum, J. R., Katz, R. W., Lim, Y.-K., Schumacher, R. S., Wehner, M. F., Agel, L., Bosilovich, M., Collow, A., Gershunov, A., Grotjahn, R., Leung, R., Milrad, S., and Min, S.-K.: North American extreme precipitation events and related large-scale meteorological patterns: a review of statistical methods, dynamics, modeling, and trends, Clim. Dynam., 53, 6835–6875, https://doi.org/10.1007/s00382-019-04958-z, 2019. a
Berg, L. K., Gustafson Jr, W. I., Kassianov, E. I., and Deng, L.: Evaluation of a modified scheme for shallow convection: Implementation of CuP and case studies, Mon. Weather Rev., 141, 134–147, https://doi.org/10.1175/MWR-D-12-00136.1, 2013. a
Boos, W. R. and Pascale, S.: Mechanical forcing of the North American monsoon by orography, Nature, 599, 611–615, https://doi.org/10.1038/s41586-021-03978-2, 2021. a
Bowden, J. H., Otte, T. L., Nolte, C. G., and Otte, M. J.: Examining interior grid nudging techniques using two-way nesting in the WRF model for regional climate modeling, J. Climate, 25, 2805–2823, 2012. a, b
Broxton, P., Zeng, X., and Dawson, N.: Daily 4 km Gridded SWE and Snow Depth from Assimilated In-Situ and Modeled Data over the Conterminous US, Version 1, NASA National Snow and Ice Data Center Distributed Active Archive Center [data set], https://doi.org/10.5067/0GGPB220EX6A, 2019. a, b, c
Bukovsky, M. S. and Karoly, D. J.: A regional modeling study of climate change impacts on warm-season precipitation in the central United States, J. Climate, 24, 1985–2002, https://doi.org/10.1175/2010JCLI3447.1, 2011. a
Bukovsky, M. S. and Mearns, L. O.: Regional climate change projections from NA-CORDEX and their relation to climate sensitivity, Climatic Change, 162, 645–665, https://doi.org/10.1007/s10584-020-02835-x, 2020. a
Chen, D. and Dai, A.: Dependence of estimated precipitation frequency and intensity on data resolution, Clim. Dynam., 50, 3625–3647, https://doi.org/10.1007/s00382-017-3830-7, 2018. a
Daly, C., Halbleib, M., Smith, J. I., Gibson, W. P., Doggett, M. K., Taylor, G. H., Curtis, J., and Pasteris, P. P.: Physiographically sensitive mapping of climatological temperature and precipitation across the conterminous United States, Int. J. Climatol., 28, 2031–2064, 2008. a, b
Diez-Sierra, J., Iturbide, M., Gutiérrez, J. M., Fernández, J., Milovac, J., Cofiño, A. S., Cimadevilla, E., Nikulin, G., Levavasseur, G., Kjellström, E., Bülow, K., Horányi, A., Brookshaw, A., García-Díez, M., Pérez, A., Baño-Medina, J., Ahrens, B., Alias, A., Ashfaq, M., Bukovsky, M., Buonomo, E., Cabos, W. D., Caluwaerts, S., Chou, S. C., Christensen, O. B., Ciarlò, J. M., Coppola, E., Corre, L., Demory, M.-E., Djurdjevic, V., Evans, J. P., Fealy, R., Feldmann, H., Jacob, D., Jayanarayanan, S., Katzfey, J., Keuler, K., Kittel, C., Kurnaz, M. L., Laprise, R., Lionello, P., McGinnis, S., Mercogliano, P., Nabat, P., Önol, B., Ozturk, T., Panitz, H.-J., Paquin, D., Pieczka, I., Raffaele, F., Remedio, A. R., Scinocca, J., Sevault, F., Somot, S., Steger, C., Tangang, F., Teichmann, C., Termonia, P., Thatcher, M., Torma, C., van Meijgaard, E., Vautard, R., Warrach-Sagi, K., Winger, K., and Zittis, G.: CORDEX model component description, Zenodo, https://doi.org/10.5281/zenodo.6553526, 2022. a
Dirmeyer, P. A., Cash, B. A., Kinter III, J. L., Jung, T., Marx, L., Satoh, M., Stan, C., Tomita, H., Towers, P., Wedi, N., Achuthavarier, D., Adams, J. M., Altshuler, E. L., Huang, B., Jin, E. K., and Manganello, J.: Simulating the diurnal cycle of rainfall in global climate models: Resolution versus parameterization, Clim. Dynam., 39, 399–418, https://doi.org/10.1007/s00382-011-1127-9, 2012. a
European Centre for Medium-Range Weather Forecasts: ERA5 Reanalysis Model Level Data, NSF National Center for Atmospheric Research [data set], https://doi.org/10.5065/XV5R-5344, 2022. a
European Centre for Medium-Range Weather Forecasts: ERA5-Land hourly data from 1950 to present (GDEX Subset), NSF National Center for Atmospheric Research [data set], https://doi.org/10.5065/SNVE-T250, 2026. a
Gahtan, J., Knapp, K. R., Schreck, C. J. I., Diamond, H. J., Kossin, J. P., and Kruk, M. C.: International Best Track Archive for Climate Stewardship (IBTrACS) Project, Version 4.01, NOAA National Centers for Environmental Information [data set], https://doi.org/10.25921/82ty-9e16, 2024. a, b
Geerts, B., Parsons, D., Ziegler, C. L., Weckwerth, T. M., Biggerstaff, M. I., Clark, R. D., Coniglio, M. C., Demoz, B. B., Ferrare, R. A., Gallus Jr, W. A., Haghi, K., Hanesiak, J. M., Klein, P. M., Knupp, K. R., Kosiba, K., McFarquhar, G. M., Moore, J. A., Nehrir, A. R., Parker, M. D., Pinto, J. O., Rauber, R. M., Schumacher, R. S., Turner, D. D., Wang, Q., Wang, X., Wang, Z., and Wurman, J.: The 2015 plains elevated convection at night field project, B. Am. Meteorol. Soc., 98, 767–786, https://doi.org/10.1175/BAMS-D-15-00257.1, 2017. a
Gensini, V. A., Haberlie, A. M., and Ashley, W. S.: Convection-permitting simulations of historical and possible future climate over the contiguous United States, Clim. Dynam., 60, 109–126, https://doi.org/10.1007/s00382-022-06306-0, 2023. a
Gimeno-Sotelo, L. and Gimeno, L.: Where does the link between atmospheric moisture transport and extreme precipitation matter?, Weather Climate Extremes, 39, 100536, https://doi.org/10.1016/j.wace.2022.100536, 2023. a
Giorgi, F. and Gutowski Jr., W. J.: Regional dynamical downscaling and the CORDEX initiative, Annu. Rev. Environ. Resour., 40, 467–490, https://doi.org/10.1146/annurev-environ-102014-021217, 2015. a
Gutowski Jr, W. J., Ullrich, P. A., Hall, A., Leung, L. R., O'Brien, T. A., Patricola, C. M., Arritt, R. W., Bukovsky, M. S., Calvin, K. V., Feng, Z., Jones, A. D., Kooperman, G. J., Monier, E., Pritchard, M. S., Pryor, S. C., Qian, Y., Rhoades, A. M., Roberts, A. F., Sakaguchi, K., Urban, N., and Zarzycki, C.: The ongoing need for high-resolution regional climate models: Process understanding and stakeholder information, B. Am. Meteorol. Soc., 101, E664–E683, https://doi.org/10.1175/BAMS-D-19-0113.1, 2020. a
He, C., Chen, F., Abolafia-Rosenzweig, R., Ikeda, K., Liu, C., and Rasmussen, R.: What causes the unobserved early-spring snowpack ablation in convection-permitting WRF modeling over Utah Mountains?, J. Geophys. Res.-Atmos., 126, e2021JD035284, https://doi.org/10.1029/2021JD035284, 2021. a
He, C., Valayamkunnath, P., Barlage, M., Chen, F., Gochis, D., Cabell, R., Schneider, T., Rasmussen, R., Niu, G.-Y., Yang, Z.-L., Niyogi, D., and Ek, M.: Modernizing the open-source community Noah with multi-parameterization options (Noah-MP) land surface model (version 5.0) with enhanced modularity, interoperability, and applicability, Geosci. Model Dev., 16, 5131–5151, https://doi.org/10.5194/gmd-16-5131-2023, 2023. a
Hersbach, H., Bell, B., Berrisford, P., Hirahara, S., Horányi, A., Muñoz-Sabater, J., Nicolas, J., Peubey, C., Radu, R., Schepers, D., Simmons, A., Soci, C., Abdalla, S., Abellan, X., Balsamo, G., Bechtold, P., Biavati, G., Bidlot, J., Bonavita, M., De Chiara, G., Dahlgren, P., Dee, D., Diamantakis, M., Dragani, R., Flemming, J., Forbes, R., Fuentes, M., Geer, A., Haimberger, L., Healy, S., Hogan, R. J., Hólm, E., Janisková, M., Keeley, S., Laloyaux, P., Lopez, P., Lupu, C., Radnoti, G., de Rosnay, P., Rozum, I., Vamborg, F., Villaume, S., and Thépaut, J.-N.: The ERA5 global reanalysis, Q. J. Roy. Meteor. Soc., 146, 1999–2049, https://doi.org/10.1002/qj.3803, 2020. a, b, c, d, e
Holt, T. R., Niyogi, D., Chen, F., Manning, K., LeMone, M. A., and Qureshi, A.: Effect of land–atmosphere interactions on the IHOP 24–25 May 2002 convection case, Mon. Weather Rev., 134, 113–133, https://doi.org/10.1175/MWR3057.1, 2006. a
Hong, S.-Y., Dudhia, J., and Chen, S.-H.: A revised approach to ice microphysical processes for the bulk parameterization of clouds and precipitation, Mon. Weather Rev., 132, 103–120, https://doi.org/10.1175/1520-0493(2004)132<0103:ARATIM>2.0.CO;2, 2004. a
Hosseini-Moghari, S.-M. and Tang, Q.: Can IMERG data capture the scaling of precipitation extremes with temperature at different time scales?, Geophys. Res. Lett., 49, e2021GL096392, https://doi.org/10.1029/2021GL096392, 2022. a
Huffman, G. J., Bolvin, D. T., Joyce, R., Kelley, O. A., Nelkin, E. J., Portier, A., Stocker, E. F., Tan, J., Watters, D. C., and West, B. J.: IMERG V07 Release Notes, NASA/GSFC, Greenbelt, MD, USA, 23 pp., NASA/GSFC technical white paper, https://gpm.nasa.gov/resources/documents/imerg-v07-release-notes (last access: 30 November 2025), 2023. a, b, c
Huffman, G. J., Stocker, E. F., Bolvin, D. T., Nelkin, E. J., and Tan, J.: GPM IMERG Final Precipitation L3 1 month 0.1 degree x 0.1 degree V07, NSF National Center for Atmospheric Research [data set], https://doi.org/10.5065/KRNV-Y644, 2024. a
Iacono, M. J., Delamere, J. S., Mlawer, E. J., Shephard, M. W., Clough, S. A., and Collins, W. D.: Radiative forcing by long-lived greenhouse gases: Calculations with the AER radiative transfer models, J. Geophys. Res.-Atmos., 113, https://doi.org/10.1029/2008JD009944, 2008. a
Ikeda, K., Rasmussen, R., Liu, C., Gochis, D., Yates, D., Chen, F., Tewari, M., Barlage, M., Dudhia, J., Miller, K., Arsenault, K., Grubišić, V., Thompson, G., and Gutmann, E.: Simulation of seasonal snowfall over Colorado, Atmos. Res., 97, 462–477, https://doi.org/10.1016/j.atmosres.2010.04.010, 2010. a
Jach, L., Schwitalla, T., Branch, O., Warrach-Sagi, K., and Wulfmeyer, V.: Sensitivity of land–atmosphere coupling strength to changing atmospheric temperature and moisture over Europe, Earth Syst. Dynam., 13, 109–132, https://doi.org/10.5194/esd-13-109-2022, 2022. a
Kunkel, K. E., Easterling, D. R., Kristovich, D. A., Gleason, B., Stoecker, L., and Smith, R.: Meteorological causes of the secular variations in observed extreme precipitation events for the conterminous United States, J. Hydrometeorol., 13, 1131–1141, https://doi.org/10.1175/JHM-D-11-0108.1, 2012. a
Langhans, W., Schmidli, J., and Schär, C.: Bulk convergence of cloud-resolving simulations of moist convection over complex terrain, J. Atmos. Sci., 69, 2207–2228, https://doi.org/10.1175/JAS-D-11-0252.1, 2012. a
Lavers, D. A., Simmons, A., Vamborg, F., and Rodwell, M. J.: An evaluation of ERA5 precipitation for climate monitoring, Q. J. Roy. Meteor. Soc., 148, 3152–3165, https://doi.org/10.1002/qj.4351, 2022. a
Lee, Y.-C. and Wang, Y.-C.: Evaluating diurnal rainfall signal performance from CMIP5 to CMIP6, J. Climate, 34, 7607–7623, https://doi.org/10.1175/JCLI-D-20-0812.1, 2021. a
Li, J., Sorooshian, S., Higgins, W., Gao, X., Imam, B., and Hsu, K.: Influence of spatial resolution on diurnal variability during the North American monsoon, J. Climate, 21, 3967–3988, https://doi.org/10.1175/2008JCLI2022.1, 2008. a
Li, J., Miao, C., Zhang, G., Fang, Y.-H., Shangguan, W., and Niu, G.-Y.: Global evaluation of the Noah-MP land surface model and suggestions for selecting parameterization schemes, J. Geophys. Res.-Atmos., 127, e2021JD035753, https://doi.org/10.1029/2021JD035753, 2022. a
Lin, T.-S., He, C., Abolafia-Rosenzweig, R., Chen, F., Wang, W., Barlage, M., and Gochis, D.: Improved snow albedo evolution in Noah-MP land surface model coupled with a physical snowpack radiative transfer scheme, J. Hydrometeorol., 26, 185–200, https://doi.org/10.1175/JHM-D-24-0082.1, 2025. a
Lindvall, J. and Svensson, G.: The diurnal temperature range in the CMIP5 models, Clim. Dynam., 44, 405–421, https://doi.org/10.1007/s00382-014-2144-2, 2015. a
Liu, C., Ikeda, K., Rasmussen, R., Barlage, M., Newman, A. J., Prein, A. F., Chen, F., Chen, L., Clark, M., Dai, A., Dudhia, J., Eidhammer, T., Gochis, D., Gutmann, E., Kurkute, S., Li, Y., Thompson, G., and Yates, D.: Continental-scale convection-permitting modeling of the current and future climate of North America, Clim. Dynam., 49, 71–95, https://doi.org/10.1007/s00382-016-3327-9, 2017. a, b
Liu, Q., Wu, L., Qin, N., and Li, Y.: Storm-scale and fine-scale boundary layer structures of tropical cyclones simulated with the WRF-LES framework, J. Geophys. Res.-Atmos., 126, e2021JD035511, https://doi.org/10.1029/2021JD035511, 2021. a
Ma, N., Niu, G.-Y., Xia, Y., Cai, X., Zhang, Y., Ma, Y., and Fang, Y.: A systematic evaluation of Noah-MP in simulating land-atmosphere energy, water, and carbon exchanges over the continental United States, J. Geophys. Res.-Atmos., 122, 12–245, https://doi.org/10.1002/2017JD027597, 2017. a
Mahony, C. R., Wang, T., Hamann, A., and Cannon, A. J.: A global climate model ensemble for downscaled monthly climate normals over North America, Int. J. Climatol., 42, 5871–5891, https://doi.org/10.1002/joc.7566, 2022. a
McCrary, R., Mearns, L., Abel, M., Biner, S., and Bukovsky, M.: Projections of North American snow from NA-CORDEX and their uncertainties, with a focus on model resolution, Climatic Change, 170, 20, https://doi.org/10.1007/s10584-021-03294-8, 2022. a
McNeil, S. J., Howell, J. L., Garrett, G. R., and Valle, D. N.: The Mid South Derecho – 22 July 2003, Tech. rep., National Weather Service Forecast Office, Memphis, Tennessee, https://www.weather.gov/media/meg/research/July22_2003.pdf (last access: 4 January 2026), 2003. a
Mearns, L., Giorgi, F., McDaniel, L., and Shields, C.: Analysis of variability and diurnal range of daily temperature in a nested regional climate model: Comparison with observations and doubled CO2 results, Clim. Dynam., 11, 193–209, https://doi.org/10.1007/BF00215007, 1995. a
Mearns, L., McGinnis, S., Korytina, D., Arritt, R., Biner, S., Bukovsky, M., Chang, H.-I., Christensen, O., Herzmann, D., Jiao, Y., Kharin, S., Lazare, M., Nikulin, G., Qian, M., Scinocca, J., Winger, K., Castro, C., Frigon, A., Gutowski, W., and Kessenich, L.: The NA-CORDEX dataset, version 1.0, NCAR Climate Data Gateway [data set], Boulder, CO, https://doi.org/10.5065/D6SJ1JCH, 2017. a, b, c, d
Miguez-Macho, G., Stenchikov, G. L., and Robock, A.: Spectral nudging to eliminate the effects of domain position and geometry in regional climate model simulations, J. Geophys. Res.-Atmos., 109, https://doi.org/10.1029/2003JD004495, 2004. a
Mlawer, E. J., Taubman, S. J., Brown, P. D., Iacono, M. J., and Clough, S. A.: Radiative transfer for inhomogeneous atmospheres: RRTM, a validated correlated-k model for the longwave, J. Geophys. Res.-Atmos., 102, 16663–16682, https://doi.org/10.1029/97JD00237, 1997. a
Muñoz-Sabater, J., Dutra, E., Agustí-Panareda, A., Albergel, C., Arduini, G., Balsamo, G., Boussetta, S., Choulga, M., Harrigan, S., Hersbach, H., Martens, B., Miralles, D. G., Piles, M., Rodríguez-Fernández, N. J., Zsoter, E., Buontempo, C., and Thépaut, J.-N.: ERA5-Land: a state-of-the-art global reanalysis dataset for land applications, Earth Syst. Sci. Data, 13, 4349–4383, https://doi.org/10.5194/essd-13-4349-2021, 2021. a
National Weather Service, Mobile/Pensacola Weather Forecast Office: Powerful Hurricane Ivan Slams the Central Gulf Coast as a Category 3 Hurricane – 16 September 2004, https://www.weather.gov/mob/ivan (last access: 12 March 2026), 2024. a
Niu, G.-Y., Yang, Z.-L., Mitchell, K. E., Chen, F., Ek, M. B., Barlage, M., Kumar, A., Manning, K., Niyogi, D., Rosero, E., Tewari, M., and Xia, Y.: The community Noah land surface model with multiparameterization options (Noah-MP): 1. Model description and evaluation with local-scale measurements, J. Geophys. Res.-Atmos., 116, https://doi.org/10.1029/2010JD015139, 2011. a
Paquin, D., McCray, C. D., Gauthier, C. B., Giguère, M., Asselin, O., Bourgault, P., Labonté, M.-P., and Matte, D.: The Ouranos CRCM5-CMIP6 ensemble: A dynamically downscaled ensemble of CMIP6 simulations over North America, Sci. Data, https://doi.org/10.1038/s41597-025-06289-7, 2025. a, b
Qian, Y., Jackson, C., Giorgi, F., Booth, B., Duan, Q., Forest, C., Higdon, D., Hou, Z. J., and Huerta, G.: Uncertainty quantification in climate modeling and projection, B. Am. Meteorol. Soc., 97, 821–824, https://doi.org/10.1175/BAMS-D-15-00297.1, 2016. a, b
Rahimi, S., Krantz, W., Lin, Y.-H., Bass, B., Goldenson, N., Hall, A., Lebo, Z. J., and Norris, J.: Evaluation of a reanalysis-driven configuration of WRF4 over the western United States from 1980 to 2020, J. Geophys. Res.-Atmos., 127, e2021JD035699, https://doi.org/10.1029/2021JD035699, 2022. a, b
Rasmussen, R., Liu, C., Ikeda, K., Gochis, D., Yates, D., Chen, F., Tewari, M., Barlage, M., Dudhia, J., Yu, W., Miller, K., Arsenault, K., Grubišić, V., Thompson, G., and Gutmann, E.: High-resolution coupled climate runoff simulations of seasonal snowfall over Colorado: a process study of current and warmer climate, J. Climate, 24, 3015–3048, https://doi.org/10.1175/2010JCLI3985.1, 2011. a
Rasmussen, R., Chen, F., Liu, C., Ikeda, K., Prein, A., Kim, J., Schneider, T., Dai, A., Gochis, D., Dugger, A., Zhang, Y., Jaye, A., Dudhia, J., He, C., Harrold, M., Xue, L., Chen, S., Newman, A., Dougherty, E., Abolafia-Rosenzweig, R., Lybarger, N. D., Viger, R., Lesmes, D., Skalak, K., Brakebill, J., Cline, D., Dunne, K., Rasmussen, K., and Miguez-Macho, G.: CONUS404: The NCAR–USGS 4-km long-term regional hydroclimate reanalysis over the CONUS, B. Am. Meteorol. Soc., 104, E1382–E1408, https://doi.org/10.1175/BAMS-D-21-0326.1, 2023a. a, b, c, d, e, f, g, h
Rasmussen, R. M., Liu, C., Ikeda, K., Chen, F., Kim, J., Schneider, T. L., Gochis, D., Dugger, A., and Viger, R. J.: Four-kilometer long-term regional hydroclimate reanalysis over the conterminous United States (CONUS), NSF National Center for Atmospheric Research [data set], https://doi.org/10.5065/ZYY0-Y036, 2023b. a
Scaff, L., Prein, A. F., Li, Y., Liu, C., Rasmussen, R., and Ikeda, K.: Simulating the convective precipitation diurnal cycle in North America’s current and future climate, Clim. Dynam., 55, 369–382, https://doi.org/10.1007/s00382-019-04754-9, 2020. a, b, c
Schumacher, R. S. and Hill, A. J.: Extreme Precipitation in the Contiguous United States in Gridded Analyses and a Convection-Permitting Model Simulation, J. Hydrometeorol., 27, 1025–1050, https://doi.org/10.1175/JHM-D-25-0212.1, 2026. a
Sheridan, S. C., Lee, C. C., and Smith, E. T.: A comparison between station observations and reanalysis data in the identification of extreme temperature events, Geophys. Res. Lett., 47, e2020GL088120, https://doi.org/10.1029/2020GL088120, 2020. a
Skamarock, W. C., Klemp, J. B., Dudhia, J., Gill, D. O., Liu, Z., Berner, J., Wang, W., Powers, J. G., Duda, M. G., Barker, D. M., and Huang, X.-Y.: A description of the advanced research WRF version 4, NCAR tech. note ncar/tn-556+ str, 145, https://doi.org/10.5065/1dfh-6p97, 2019. a, b
Steward, S. R.: Hurricane Ivan, Tropical Cyclone Report AL092004, National Hurricane Center, National Oceanic and Atmospheric Administration, https://www.nhc.noaa.gov/data/tcr/AL092004_Ivan.pdf (last access: 5 January 2025), 2004. a
Stuivenvolt-Allen, J., Eidhammer, T., McCrary, R., Bukovsky, M., Rahimi, S., Chang, H.-I., and McGinnis, S.: The North American CORDEX-CMIP6 WRF evaluation run: comparing historical simulations from 25km to convection-permitting scales, Zenodo [data set], https://doi.org/10.5281/zenodo.19010235, 2026. a
Tan, J., Huffman, G. J., Bolvin, D. T., and Nelkin, E. J.: Diurnal cycle of IMERG V06 precipitation, Geophys. Res. Lett., 46, 13584–13592, https://doi.org/10.1029/2019GL085395, 2019. a, b
Tarek, M., Brissette, F. P., and Arsenault, R.: Evaluation of the ERA5 reanalysis as a potential reference dataset for hydrological modelling over North America, Hydrol. Earth Syst. Sci., 24, 2527–2544, https://doi.org/10.5194/hess-24-2527-2020, 2020. a
Tegen, I., Hollrig, P., Chin, M., Fung, I., Jacob, D., and Penner, J.: Contribution of different aerosol species to the global aerosol extinction optical thickness: Estimates from model results, J. Geophys. Res.-Atmos., 102, 23895–23915, 1997. a
Tewari, M., Chen, F., Wang, W., Dudhia, J., LeMone, M. A., Mitchell, K., Ek, M., Gayno, G., Wegiel, J., and Cuenca, R. H.: Implementation and verification of the unified Noah land surface model in the WRF model, in: 20th Conference on Weather Analysis and Forecasting/16th Conference on Numerical Weather Prediction, American Meteorological Society, https://opensky.ucar.edu/islandora/object/conference:1576 (last access: 4 January 2026), 2004. a
Thompson, G., Field, P. R., Rasmussen, R. M., and Hall, W. D.: Explicit forecasts of winter precipitation using an improved bulk microphysics scheme. Part II: Implementation of a new snow parameterization, Mon. Weather Rev., 136, 5095–5115, https://doi.org/10.1175/2008MWR2387.1, 2008. a
Thompson, G., Tewari, M., Ikeda, K., Tessendorf, S., Weeks, C., Otkin, J., and Kong, F.: Explicitly-coupled cloud physics and radiation parameterizations and subsequent evaluation in WRF high-resolution convective forecasts, Atmos. Res., 168, 92–104, https://doi.org/10.1016/j.atmosres.2015.09.005, 2016. a
Thornton, P. E., Thornton, M. M., Mayer, B. W., Wei, Y., Devarakonda, R., Vose, R. S., and Cook, R. B.: Daymet: Daily surface weather data on a 1-km grid for North America, version 3, ORNL DAAC [data set], https://doi.org/10.3334/ORNLDAAC/1328, 2016. a
Tiedtke, M.: A comprehensive mass flux scheme for cumulus parameterization in large-scale models, Mon. Weather Rev., 117, 1779–1800, https://doi.org/10.1175/1520-0493(1989)117<1779:ACMFSF>2.0.CO;2, 1989. a
Trier, S., Davis, C., and Ahijevych, D.: Environmental controls on the simulated diurnal cycle of warm-season precipitation in the continental United States, J. Atmos. Sci., 67, 1066–1090, https://doi.org/10.1175/2009JAS3247.1, 2010. a
von Storch, H., Langenberg, H., and Feser, F.: A spectral nudging technique for dynamical downscaling purposes, Mon. Weather Rev., 128, 3664–3673, 2000. a, b
Wade, A. R., Squitieri, B. J., and Jirak, I. L.: Synoptic Characteristics of Derechos and Other Widespread Significant Severe Wind Events, Weather Forecast., e250038, https://doi.org/10.1175/WAF-D-25-0038.1, 2025. a
Wang, K. and Clow, G. D.: The diurnal temperature range in CMIP6 models: climatology, variability, and evolution, J. Climate, 33, 8261–8279, https://doi.org/10.1175/JCLI-D-19-0897.1, 2020. a
Zhang, C., Wang, Y., and Hamilton, K.: Improved representation of boundary layer clouds over the southeast Pacific in ARW-WRF using a modified Tiedtke cumulus parameterization scheme, Mon. Weather Rev., 139, 3489–3513, https://doi.org/10.1175/MWR-D-10-05091.1, 2011. a
Zhang, Z., He, C., Berner, J., Jaye, A., Barlage, M., Liu, C., Dudhia, J., Huang, K., Lin, T.-S., Abolafia-Rosenzweig, R., Kukulies, J., Fowler, M. D., and Richter, J. H.: Extending MPAS-NoahMP Model System Capability Beyond Weather Timescales: Evaluation of Hydroclimate and Land-Atmosphere Interactions, J. Geophys. Res.-Atmos., 131, e2025JD045334, https://doi.org/10.1029/2025JD045334, 2025. a, b
Zheng, Y., Alapaty, K., Herwehe, J. A., Del Genio, A. D., and Niyogi, D.: Improving high-resolution weather forecasts using the Weather Research and Forecasting (WRF) Model with an updated Kain–Fritsch scheme, Mon. Weather Rev., 144, 833–860, 2016. a
This study presents a new 12 km CORDEX (Coordinated Regional Downscaling Experiment )-CMIP6 (Coupled Model Intercomparison Project) WRF (Weather Research and Forecasting) simulation for North America, compared against an earlier 25 km CMIP5 version and a 4 km convection-permitting simulation. The updated run reduces temperature and precipitation biases, improves precipitation timing, and better captures tropical cyclone intensity. Extreme precipitation at 12 km closely matches convection-permitting results, offering a practical resolution for regional climate assessment.
This study presents a new 12 km CORDEX (Coordinated Regional Downscaling Experiment )-CMIP6...