
the Creative Commons Attribution 4.0 License.
the Creative Commons Attribution 4.0 License.
 | 18 Sep 2026
A new Earth Observation–based WRF configuration for urban regional climate simulations over Paris

Vasileios Pavlidis
Maria Gkolemi
Zina Mitraka
Nektarios Chrysoulakis
Josipa Milovac
Jesus Fernandez
Eleni Katragkou
In this study, Earth Observation (EO) data describing urban morphology and thermal properties are used to configure the urban representation of Paris in the Weather Research and Forecasting (WRF) model. Model performance is assessed in convective permitting simulations (3 km) in three configurations covering summer 2020: (i) a baseline simulation employing a bulk parameterization of urban areas (i.e. BULK); (ii) a simulation using the BEP-BEM urban canopy model with default urban parameter values (CTRL); and (iii) a simulation in which the BEP–BEM urban canopy parameters are specifically adapted to Paris using EO-derived information (PAR). Comparison with observations from the Météo-France RADOME meteorological network indicates that the BULK simulation produces a systematic warm bias, with a persistent overestimation of nighttime temperatures. Coupling of the urban canopy model leads to an improved overall model performance relative to the BULK configuration for summer-mean conditions. Both BEP–BEM simulations are comparable, with the best performance during summer daytime achieved for the CTRL (0.93 °C lower bias compared to BULK) and during summer nighttime for the PAR simulation (0.22 °C lower bias compared to BULK) over urban grid cells. Over non-urban grid cells, the best performance is exhibited for the PAR simulation with a summer daytime bias of −0.26 °C and a summer nighttime bias of 1.62 °C, results that are greatly influenced by internal model variability (IMV). The simulated urban–rural temperature contrast for both BEP–BEM simulations is improved compared to BULK, resulting in a more realistic representation of the Urban Heat Island (UHI). Applying the Local Climate Zones (LCZ) classification, which accounts for intraurban differences in urban form and land cover, an analysis was conducted for each urban-type LCZ class present within the Paris urban area, linking each urban station to its nearest LCZ grid cell, enabling station–based comparisons by urban–type LCZ category. This analysis indicates that the PAR configuration better captures spatial urban temperature variability, reflecting the differences in urban forcing introduced by the EO data. During the heatwave of August 2020, the model – regardless of the configuration – becomes warmer and particularly over the urbanized LCZs. The PAR simulation exhibits pronounced temperature overestimations in the city center, due to the methodology adopted for EO data implementation and the selection of the area from which the EO data were derived, leading to urban characteristics which intensified heat storage and trapping. Non-urban areas are better simulated in both BEP–BEM simulations compared to the BULK. Our results demonstrate the added value of (a) the coupling of an urban canopy model to WRF and (b) the city-tailored configuration of urban canopy morphological parameters in convection-permitting regional climate simulations. The PAR experiment further illustrates the potential of EO-derived datasets to inform urban canopy parameter configurations, enabling a more detailed representation of the urban form and improved simulation of UHI characteristics.
- Article
(10481 KB) - Full-text XML
-
Supplement
(1380 KB) - BibTeX
- EndNote


The world has become increasingly more urbanized, and projections indicate that two-thirds of the growth of the world's population between now and 2050 will take place in cities (United Nations, 2025). Urban areas influence climate across multiple spatial scales, ranging from the street up to the city, regional and global scale (Britter and Hanna, 2003). The continuing trend of urbanization substantially modifies the urban environment, thereby affecting urban biogeophysical and atmospheric chemical processes and generating numerous feedbacks on weather and, in turn, regional climate. To be able to forecast and project such interactions between urban environments and local to regional climate, particularly in the context of a changing climate, it is essential to develop tools that realistically represent urban-scale processes via urban parameterizations integrated in cross-scale atmospheric models. This is not a trivial task, as urban areas and urban dynamics are extensively complex. They consist of buildings and impervious surfaces with specific radiative and thermal properties as well as complex three-dimensional morphologies (e.g. building heights, roof and road widths). Urban environments also include anthropogenic activities and heterogeneous green/blue spaces that further alter energy and water fluxes. Together, these factors create a unique and highly challenging system to understand, simulate and project.
Currently, the Coupled Model Intercomparison Project (CMIP) protocols hardly represent urban environments in a homogeneous manner, due to their coarse resolution. Moreover, the spatial resolution of climate simulations, typically coarser than 50 km for global models and 12 km for regional models, does not allow for explicit identification of urban land uses or the adequate representation of urban-scale processes. Recognizing the importance of understanding the impact of urban environment on climate, a Flagship Pilot Study on Urban Environment and Regional Climate Change (FPS URB-RCC) was initiated within the framework of the World Climate Research Programme – Coordinated Regional Climate Downscaling Experiment (WCRP-CORDEX) community (Langendijk et al., 2024). The aim of this initiative is to coordinate and produce a high resolution (∼ 3 km) ensemble of urban regional climate simulations under a common protocol, perform robust analyses and provide valuable insights to the urban climate research community.
This study presents a comprehensive evaluation of a simplified and a more sophisticated representation of urban processes in WRF, the latter through the Building Effect Parameterization (BEP) coupled with a Building Energy Model (BEM) (Martilli et al., 2002; Salamanca et al., 2010; Salamanca and Martilli, 2010), which uses as input urban canopy parameters (UCPs). Although default UCP values are available in WRF, they can also be derived from earth observation (EO) data, enabling their modification in order to be tailored to a specific area of interest (AOI). While the FPS URB-RCC simulation protocol is closely followed, the key novelty of this work is the use of an EO-based dataset, employed to parameterize the distinctive urban characteristics of the AOI, which is the city of Paris (France). This approach enables an assessment of whether city-specific urban features based on EO data exert a significant influence on regional climate simulations and whether they can provide more accurate climate data and city-scale information. In the following sections we present the methodology followed to collect and process the EO data for Paris, describe their implementation within the Weather Research and Forecasting (WRF) regional climate model and evaluate model performance over the Paris region for three different urban model configurations.
2.1 The Weather Research and Forecasting model
2.1.1 Model configuration and physics
The WRF v4.5.1 (Skamarock et al., 2021) model configured in accordance with the CORDEX FPS URB-RCC (Langendijk et al., 2024) was employed in this study. The main physical parameterization schemes used in the simulations are summarized in Table 1. The model setup consists of a two-domain configuration. The parent domain (d01) covers Europe at a horizontal resolution of 12 km, following the EURO-CORDEX (Jacob et al., 2020) domain size, with a one-way nested inner domain centred over the greater Paris region with a horizonal resolution of 3 km (Fig. 1). Convection is explicitly resolved in the inner domain (d02); therefore, no cumulus parameterization scheme is applied at the 3 km resolution. The Noah-MP (Niu et al., 2011; Yang et al., 2011) land surface model (LSM) has been utilized, since, compared to its conventional version Noah LSM (Tewari et al., 2004), it improves the representation of land–surface heat and water exchanges across a range of surface types, including snow-covered terrain, grasslands and forests (Barlage et al., 2015; Chen et al., 2014, 2016; Gao et al., 2015). Furthermore, Noah-MP LSM applies a division of each grid cell in two tiles (vegetated and bare soil fractions), and the corresponding biogeophysical and biochemical processes are calculated separately for each. The vertical discretization includes 60 terrain-following sigma levels, with enhanced resolution within the planetary boundary layer to better represent near-surface processes. All simulations are driven by the ECMWF ERA5 reanalysis dataset (Hersbach et al., 2020) at a horizontal resolution of 0.25° × 0.25° and 6-hourly temporal intervals, without the use of spectral nudging. Each simulation was initialized on 1 March 2020 and integrated for a total period of six months, covering March through August 2020. The initial two months (March and April 2020) were discarded as spin-up period.

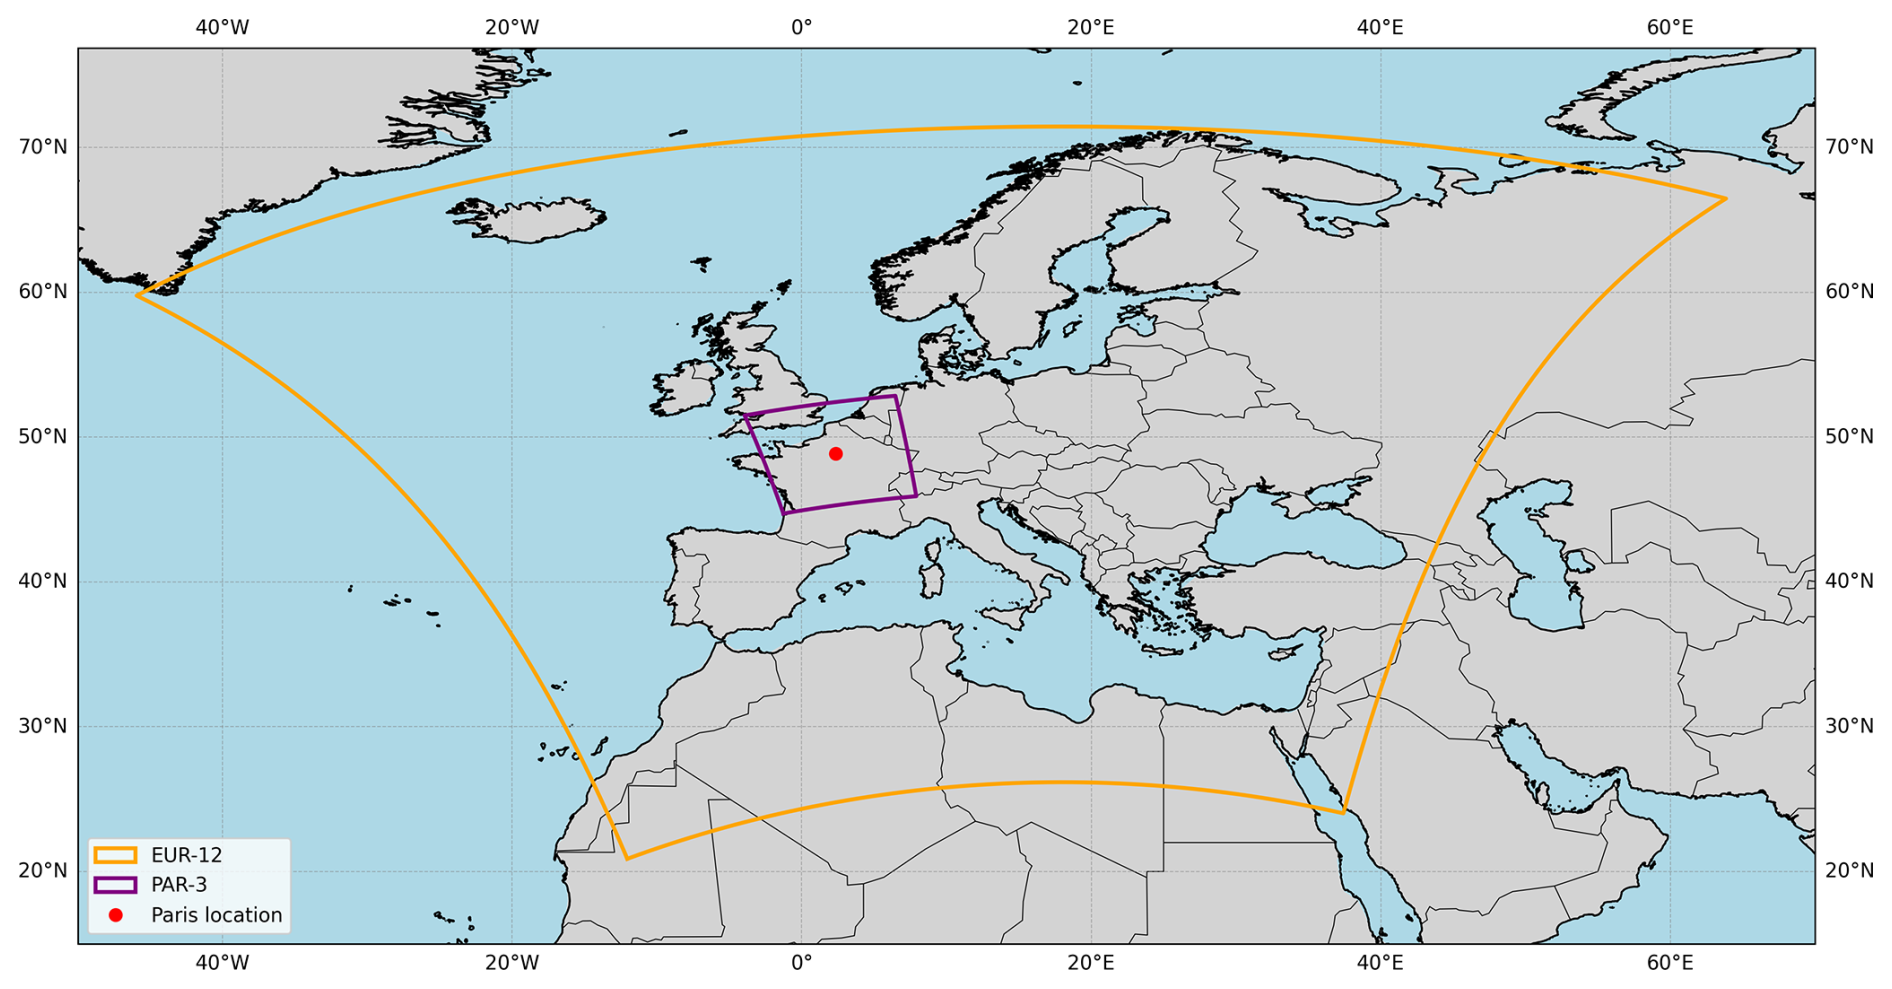
Figure 1Domain configuration. EUR-12 (coloured yellow) represents the outer d01 domain. PAR-3 (coloured purple) represents the inner d02 domain, while red dot points to Paris.
2.1.2 Urban parameterizations
To enhance the representation of natural and pervious surfaces in urban environments, Noah-MP LSM can therefore be coupled with existing UCMs within the WRF-Urban modeling system. Note that these UCMs are coupled only with Noah and Noah-MP LSMs available in WRF and can be activated through the namelist parameter sf_urban_physics. The simplest and default option for the representation of urban areas in WRF is the BULK approach (urban parameterization switched off, i.e. sf_urban_physics=0). In this approach, there is no fractional split between vegetated and bare soil for the urban grid cells, since the vegetated tile has zero weight. Consequently, all grid cells classified as urban are assigned generic urban properties (e.g. roughness length, surface albedo, heat capacity, thermal conductivity) through category ISURBAN in MPTABLE.TBL, without reference to the specific characteristics of a simulated city. Although no UCM is activated, BULK could still be considered a form of an urban parameterization, since the land use cover is adjusted by the LSM, in a way that parameters are modified for urban grid cells to better account for the zero-order effects of urban surfaces, particularly with respect to wind speed and heat storage capacity (Chen et al., 2011; Liu et al., 2006).
The coupling of different UCMs with Noah-MP LSM aims to improve the representation of urban areas and the processes that occur within them. Unlike BULK, this coupling involves activating UCMs for the urban fraction within urban grid cells only, replacing the LSM for this fraction when computing fluxes (e.g. heat and momentum). The LSM compute these fluxes for the remaining non-urban fraction. The final fluxes are area-weighted and averaged for the entire cell.
The single-layer urban canopy model (SLUCM) and the building effect parameterization (BEP) represent the thermal and momentum exchanges between the urban canopy and the overlying atmosphere using, respectively, a single- and multi-layer model grid. Thus, SLUCM (sf_urban_physics=1) consists of two-dimensional, symmetrical street canyons with infinite length and a simplified geometry of the urban canopy, while the radiation treatment is three-dimensional, since it includes both the canyon orientation and the diurnal variation of solar azimuth angle (Kusaka et al., 2001; Kusaka and Kimura, 2004). The scheme neglects the variation in building height within each urban land use category and treats the urban canopy as a single homogenous layer located below the first atmospheric layer of the mesoscale WRF model (Hang et al., 2024). On the other had BEP (sf_urban_physics=2) parameterizes a three-dimensional urban morphology within a multi-layer framework, enabling variations in building heights and building density, defined by the road and building widths in urban grid cells (Martilli et al., 2002). In this way, the urban canopy is resolved in multiple vertical layers, which lie within the WRF atmospheric column but do not necessarily coincide with the model's vertical levels. Consequently, this multi-layer treatment in BEP enables the vertical distribution of sources and sinks of heat, moisture and momentum induced by buildings to be explicitly represented, which shapes the thermodynamic profile of the urban roughness sub-layer and, consequently, the urban boundary layer, in more detail than SLUCM.
In this work we focus on the most sophisticated UCM available in WRF (sf_urban_physics=3). BEP, coupled to a building energy model (BEP-BEM), simulates in more detail the local urban processes, energy consumption and the urban heat island (UHI) effect by incorporating building morphology and anthropogenic heat release. The BEM component estimates anthropogenic heat emissions from air conditioning and heating systems and simulates heat exchanges between building interiors and the surrounding atmosphere, thereby representing the functional aspects of the urban environment (Salamanca et al., 2010; Salamanca and Martilli, 2010). Given the complexity of this urban scheme, its functionality is dependent on a variety of urban canopy parameters (UCPs) that are integrated into WRF. Thus, BEP-BEM uses as input UCPs with default values through predefined lookup tables (URBPARM_LCZ.TBL), based on the World Urban Database and Access Portal Tools (WUDAPT) Local Climate Zones (LCZ) (Brousse et al., 2016; Ching et al., 2018; Martilli et al., 2016) that capture aspects of (1) morphological, (2) thermal and (3) human related parameters. The first two categories describe the physical form of the urban environment, while the latter represents its functional characteristics. All these parameters can be modified to user-set values.
Until recently, each urban canopy parameter was assigned a default value based on the LCZ classification (Stewart and Oke, 2012). In short, this classification system defines 17 land cover types, of which 10 are urban (built type) classes, primarily based on morphological characteristics such as building heights (high-rise, mid-rise, low-rise) and building density (dense, open, sparse). The main theory of this classification is that neighborhoods with similar form and land cover produce similar local UHI effects and exhibit relatively homogeneous temperatures compared with other LCZs. Each LCZ also has predefined values concerning physical and thermal properties, based on measurements. However, it was found that these default values for some parameters affecting urban morphology (e.g. road widths for some LCZs) and thermal properties were unreasonable and can become unrealistic for European cities, given the heterogeneity of European urban structures. This issue was introduced through WRF Pull Request no. 1954 (https://github.com/wrf-model/WRF/issues/1954, last access: 31 July 2026) and settled in WRF Pull Request no. 1969 (https://github.com/wrf-model/WRF/pull/1969, last access: 31 July 2026) and incorporated in commit 0a62e59. As a result, an updated LCZ lookup table with more representative values was introduced and implemented for the FPS URB-RCC STAGE-0 simulations which, starting from WRF v4.6.0, it was defined as the default lookup table in WRF. Nevertheless, while the new values may be more realistic and better suited to Europe, they may be less suitable for other regions of the world.
2.2 Land use forcing
2.2.1 Standard land use data in WRF
In all simulations we employed the high-resolution land use and land cover dataset for regional climate modeling (Reinhart et al., 2022; Hoffmann et al., 2023) as described in the EURO-CORDEX simulation protocol (Katragkou et al., 2024). The land use and land cover information was held fixed at conditions representative of the year 2015, in accordance with the design of all evaluation runs within the EURO-CORDEX experiment. This land cover dataset was then translated to the International Geosphere-Biosphere Programme – Moderate Resolution Image Spectroradiometer (IGBP MODIS) classification inside WRF.
For the simulation employing the BULK approach, category 13 (“Urban and Built-Up”) of the IGBP MODIS classification was assigned to all urban cells, as the namelist parameter option sf_urban_physics=0 used in this occasion does not differentiate urban areas into multiple land use and physical property classes such as LCZs. Figure 2a illustrates the land use representation for domain d02.
For the simulations employing the BEP-BEM UCM, urban areas are represented using the 10 urban (built type) classes from the WUDAPT LCZ classification (Brousse et al., 2016; Ching et al., 2018; Martilli et al., 2016), with the inclusion of the “Bare rock or paved” category, interpreted as asphalt and aligned with LCZ land cover type E. As a consequence, to inject the LCZ information in WRF, the python-based WUDAPT-to-WRF package (Demuzere et al., 2022b) was utilized, replacing all listed urban grid cells from BULK and a part of non-urban grid cells. For the remaining non-urban grid cells, the model once again applies the modified IGBP MODIS land cover classification, which distinguishes 20 land cover types (codes 1 to 20). Compared to the single “Urban and Built-Up” category (IGBP MODIS category 13), this approach provides substantially greater detail and discretization of urban land use, thereby enhancing the representation of urban heterogeneity within the model. Figure 2b illustrates the land use distribution in the inner (d02) domain for the simulations employing the BEP-BEM UCM.
The land use categories inside the area of interest (Paris region, Île-de-France) are shown in Fig. 2c and d for BULK and BEP-BEM simulations, respectively. Beyond the increased urban detail provided by the BEP-BEM scheme through the use of LCZs, because of the W2W process, it was found that urban grid cells in the BEP-BEM simulations (LCZ classes) cover a larger portion of Île-de-France (23.4 %) compared to the urban area represented in the BULK simulations (16.6 %) (Tables S3 and S4).
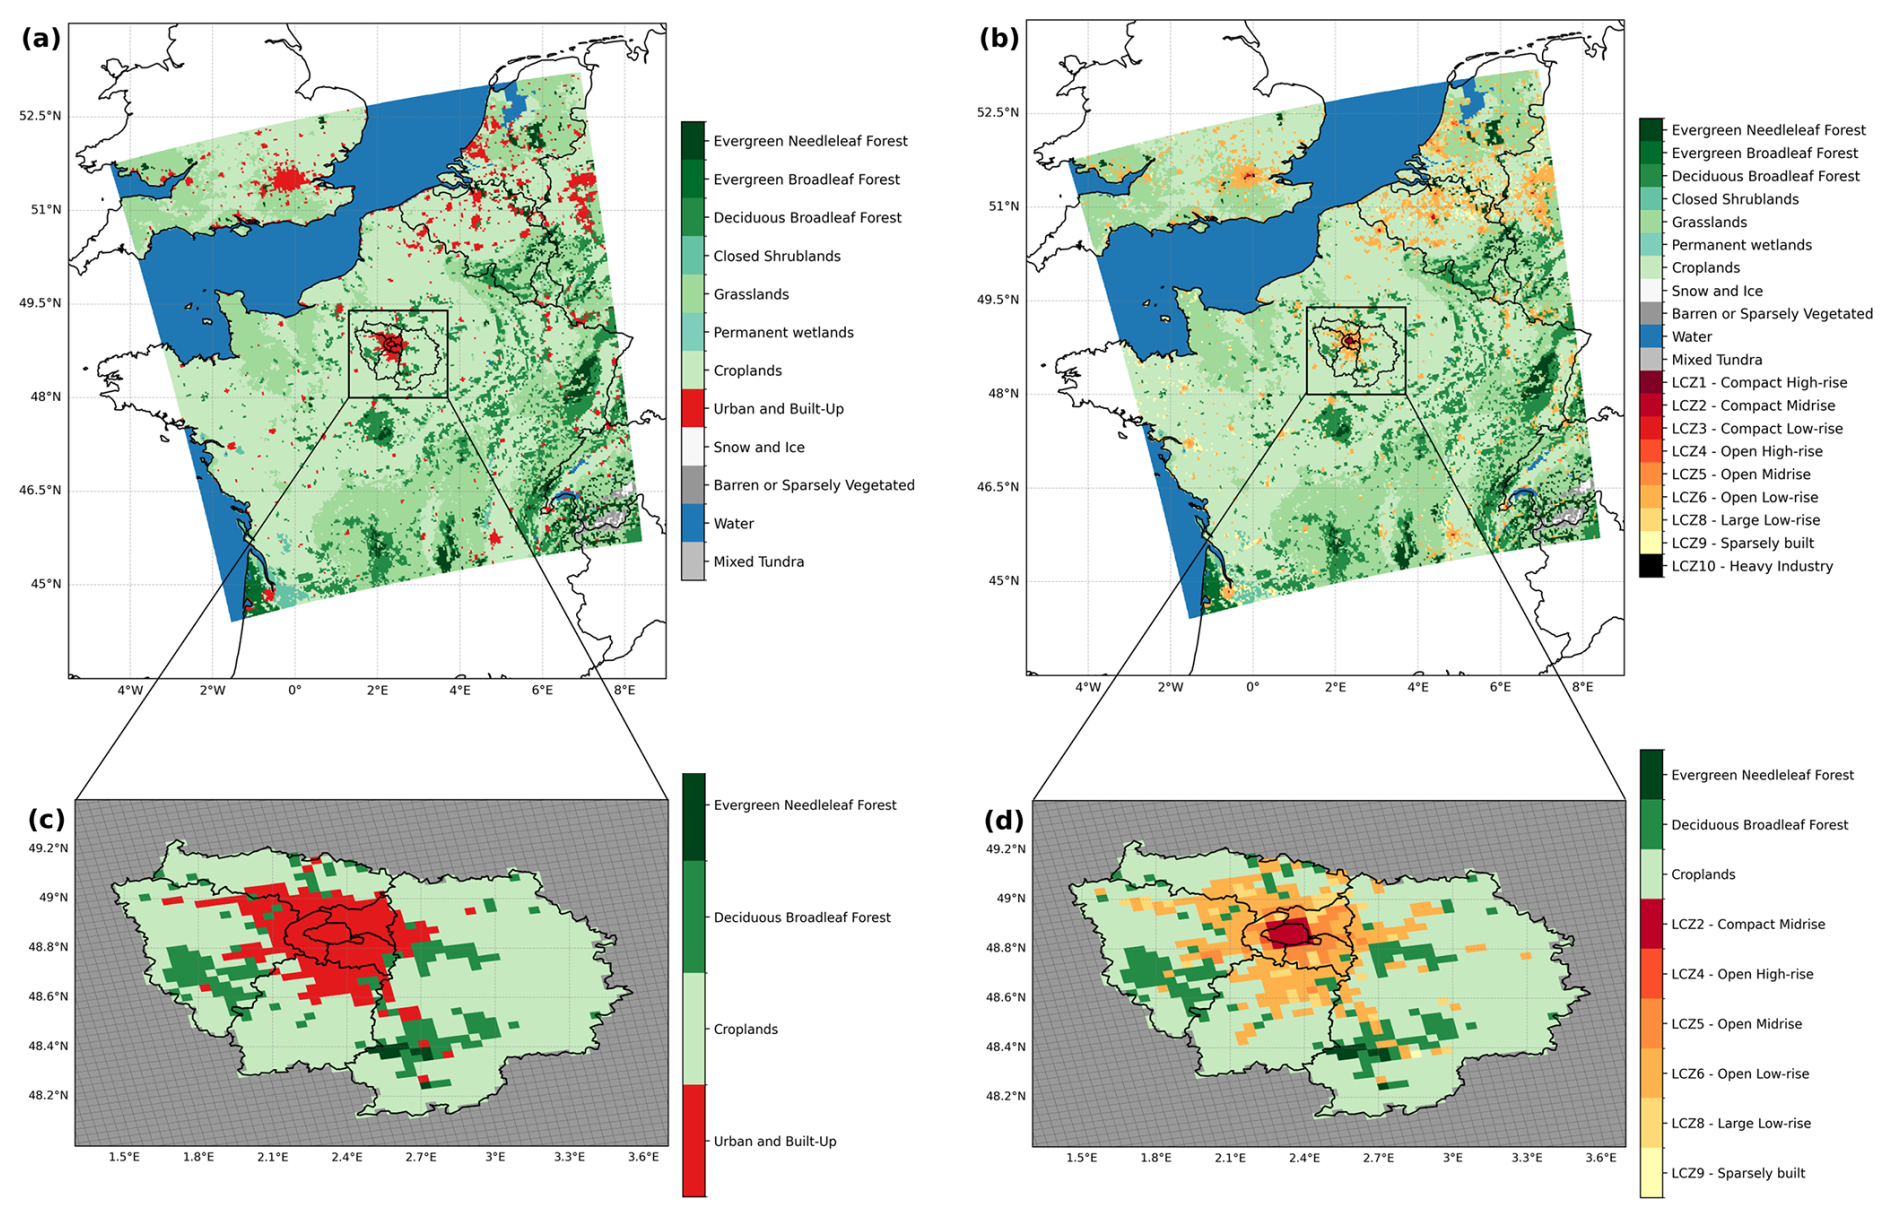
Figure 2Land use in the inner domain (d02) and Paris region (Île-de-France) for: BULK run (left column) and BEP-BEM runs (right column).
2.2.2 Improved urban canopy parameters derived from EO data
In this study, to better exploit the capabilities of the LCZ-based parameterization and to achieve a more realistic representation of the area of interest, all morphological parameters and a subset of the thermal parameters were updated in the lookup table for each LCZ class, using urban characteristics specifically tailored to the Paris region. This reference area used to construct the tailored dataset cover the city of Paris and its three adjacent departments: Seine-Saint-Denis, Val-de-Marne, and Hauts-de-Seine. It should be noted that these departments encompass only a part of the broader Paris metropolitan area, as the urban agglomeration extends well beyond these administrative boundaries, based on the Global Human Settlement Urban Database (GHS-UCDB) polygons delimiting urban areas (Florczyk et al., 2015), depicted in Fig. 3. Moreover, we must note that any changes in the LCZ UCP lookup table affected all LCZ grid cells throughout the inner domain in its entirety and not only the Paris region, even though the EO-derived UCP values were obtained using the reference area. Additionally, UCPs related to anthropogenic urban heat emissions remained unchanged from the default values WRF provides and air-conditioning systems were assumed to continuously operate over 24 h.
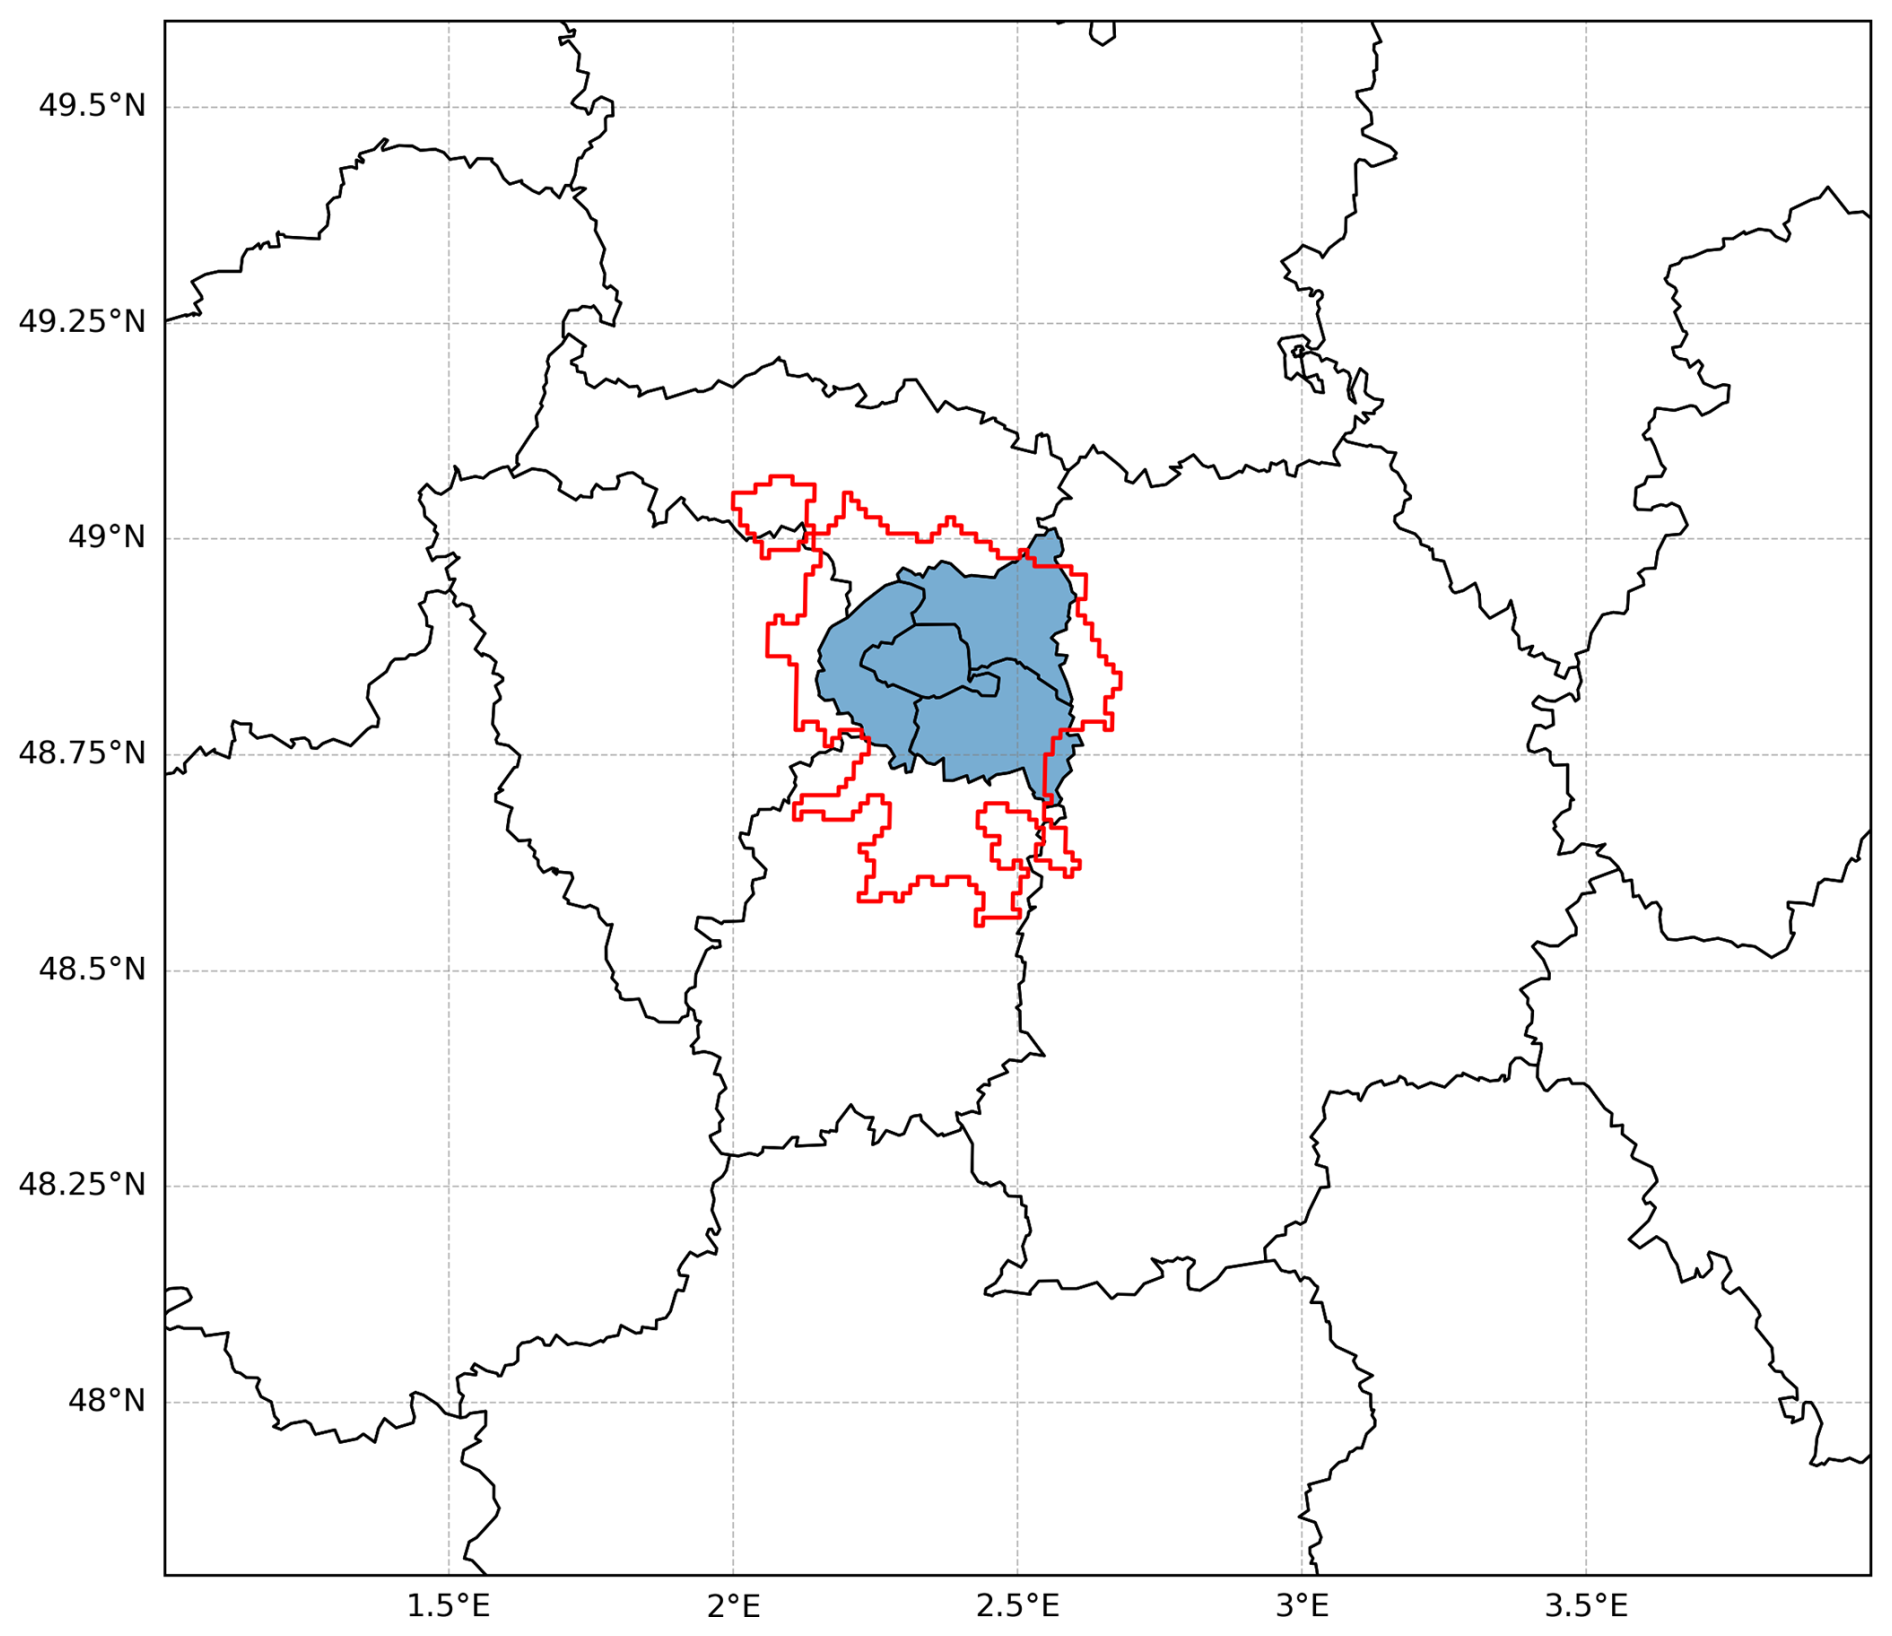
Figure 3Districts that were used (coloured blue) as a reference area for the urban form parameters tailored for Paris region. Red polygon the urban area of Paris, according to the GHS-UCDB polygons delimiting urban areas.
The EO datasets and their horizontal resolution used for each UCP respectfully are presented in Table 2. First, the urban parameters were computed at high spatial resolution (ranging from 1 to 100 m depending on the data source). These parameters were then aggregated to derive representative values for each LCZ at a spatial resolution of 100 m, following the methodology of Demuzere et al. (2022a). Subsequently, these LCZ-based parameters were further aggregated to match the horizontal resolution of the inner WRF domain (3 km) and implemented into the LCZ-lookup table for each urban class.
Table 2EO datasets and their respective resolutions for the derived tailored UCPs.

The roof and street albedo values were extracted from the Theia Albedo product (France, reference year 2022) based on the respective land cover classes. The same process was followed for the emissivity based on the ASTER GED product. The building Height distributions were derived per LCZ from the Copernicus Land Monitoring Service Urban Atlas Building Block Height (reference year 2012). The land cover was used to derive building and road width as well. For each building, the minimum bounding rectangle was calculated, and its shortest axis was considered the roof width. The roads were extracted from the Land Cover product by creating a binary mask using the Impermeable Zone class. Because this class also includes other impervious surfaces such as paved squares, the binary mask was refined manually to only include roads. To also update the thermal properties of building walls in the look-up table, the roof albedo and emissivity values derived from the abovementioned EO data were also assigned to the building walls. This was adopted as an assumption, in the absence of wall-specific observations. Thus, the parameters modified within WRF include: (1) building height distribution, (2) building width, (3) road width, (4) surface albedo of building wall, (5) surface albedo of roof, (6) surface albedo of road, (7) surface emissivity of building wall, (8) surface emissivity of roof and (9) surface emissivity of road. Details of the updated values from the EO data and those used as default in WRF4.6.0 for the abovementioned UCPs are shared in the Supplement (Tables S1 and S2). The EO data-driven values indicate a more urbanized environment than the default table, as for the majority of the LCZs height values are increased, with height distribution shifted towards taller buildings (Fig. S1 in the Supplement) and the buildings are denser, wider, while roads are narrower (Fig. S2). Table 3 further depicts that albedo (emissivity) values from EO data are universally lower (bigger) than the default ones across all LCZs.
Table 3Percentage differences in the derived UCPs, between Paris EO dataset and the default WRF v4.6.0 (and later) values for each LCZ class. Percentage differences were calculated relative to the default WRF values.
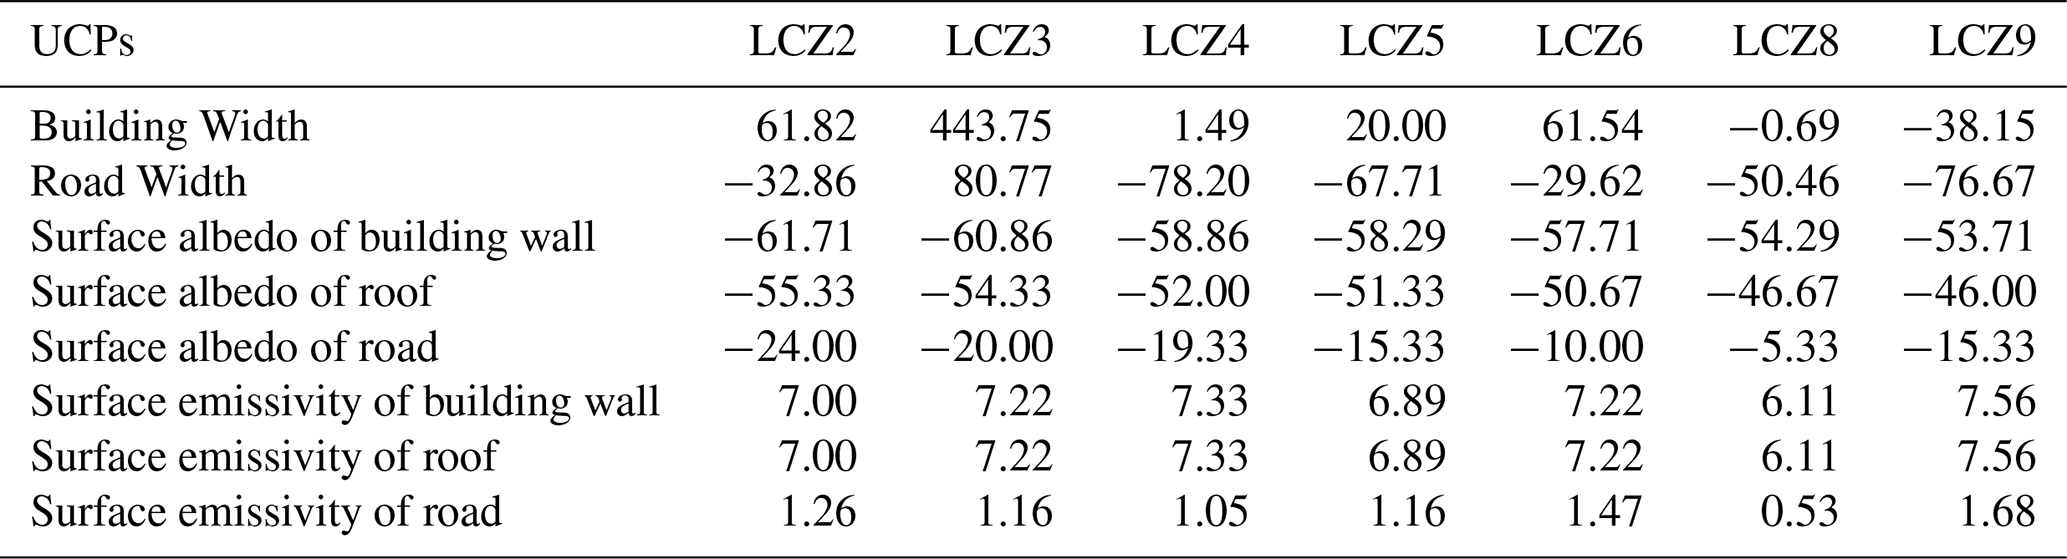
Note that three LCZ classes are not included in Paris area, namely: Compact Highrise (LCZ1), Lightweight low-rise (LCZ7) and Heavy Industry (LCZ10). Hence, for these three LCZs the values of the UCPs were not updated and therefore remained the same for all the simulations using the BEP-BEM urban parameterization. Furthermore, while there are no LCZ3 grid cells in Paris region (Table S3) due to the aggregation to the 3 km horizontal resolution, the UCP values were also updated for this class, due to the fact that they were given by the EO data.
2.3 WRF simulations
In this study, three simulations have been conducted under the umbrella of STAGE-0 simulations of the FPS URB-RCC protocol, which focuses on the examination of RCMs, urban schemes and the overall model and domain configuration. Simulations of STAGE-0 were planned to be centered over the Paris region, covering a period that includes two extreme weather events in 2020, namely a convective event during May and a heatwave during August, thus facilitating a coordinated analysis of both extremes. Here we focus on the latter event and the broader summer period of 2020, for the simulations to be assessed under both extreme and natural conditions, evaluating their ability to accurately reproduce extreme events and their overall long-term behavior. The heatwave event occurred from 7 to 13 August 2020 and affected western Europe, including the Paris region, with temperatures reaching up to 40 °C (https://climate.copernicus.eu/surface-air-temperature-august-2020, last access: 31 July 2026). Hence, the simulations conducted are: (1) PAR, in which urban canopy parameters specifically tailored to the Paris region and derived from EO data were applied; (2) CTRL, with the default UCPs used in WRF version 4.6.0; and (3) BULK, in which no UCM is activated for the parent and nested domain. BEP-BEM UCM was implemented in PAR and CTRL for both domains, while all three simulations had the same parent domain (d01) in terms of coverage and all the rest of physics options, as depicted in Table 1. PAR and CTRL shared the same values for the rest of the UCPs and urban fraction was defined on each grid cell by the W2W process.
2.4 Observations
Observational data were obtained from the Météo-France RADOME network, which comprises 51 stations around the greater Paris region, and provides measurements at 6 min intervals. The stations are classified as urban or rural based on the GHS-UCDB polygons. To minimize the impact of data gaps, only stations with less than 1 % missing observations relative to the total number of expected records were retained. In addition, to assess consistency between the station classifications and the land-use categories represented in the WRF simulations, a comparison revealed that for 9 stations the land-use category for their nearest model grid cells did not correspond to the actual land use, due to the coarse resolution of the model grid. Consequently, a total of 33 stations (Fig. 4) were ultimately used to evaluate the WRF simulations, focusing on 2 m air temperature, divided into two groups: “Urban” and “Non-Urban” stations. Of the 33 stations, 13 are associated with model grid cells classified as urban land-use types (“Urban and Built-Up” for BULK; LCZ2, LCZ5, LCZ6 and LCZ8 for BEP-BEM runs). The remaining 20 stations correspond to non-urban grid cells whose land-use categories are either “Croplands” or “Deciduous Broadleaf Forest” across all three simulations. Details regarding the elevation, coordinates, distance from Paris city centre, actual and modelled land use for each station are depicted in Table S5.
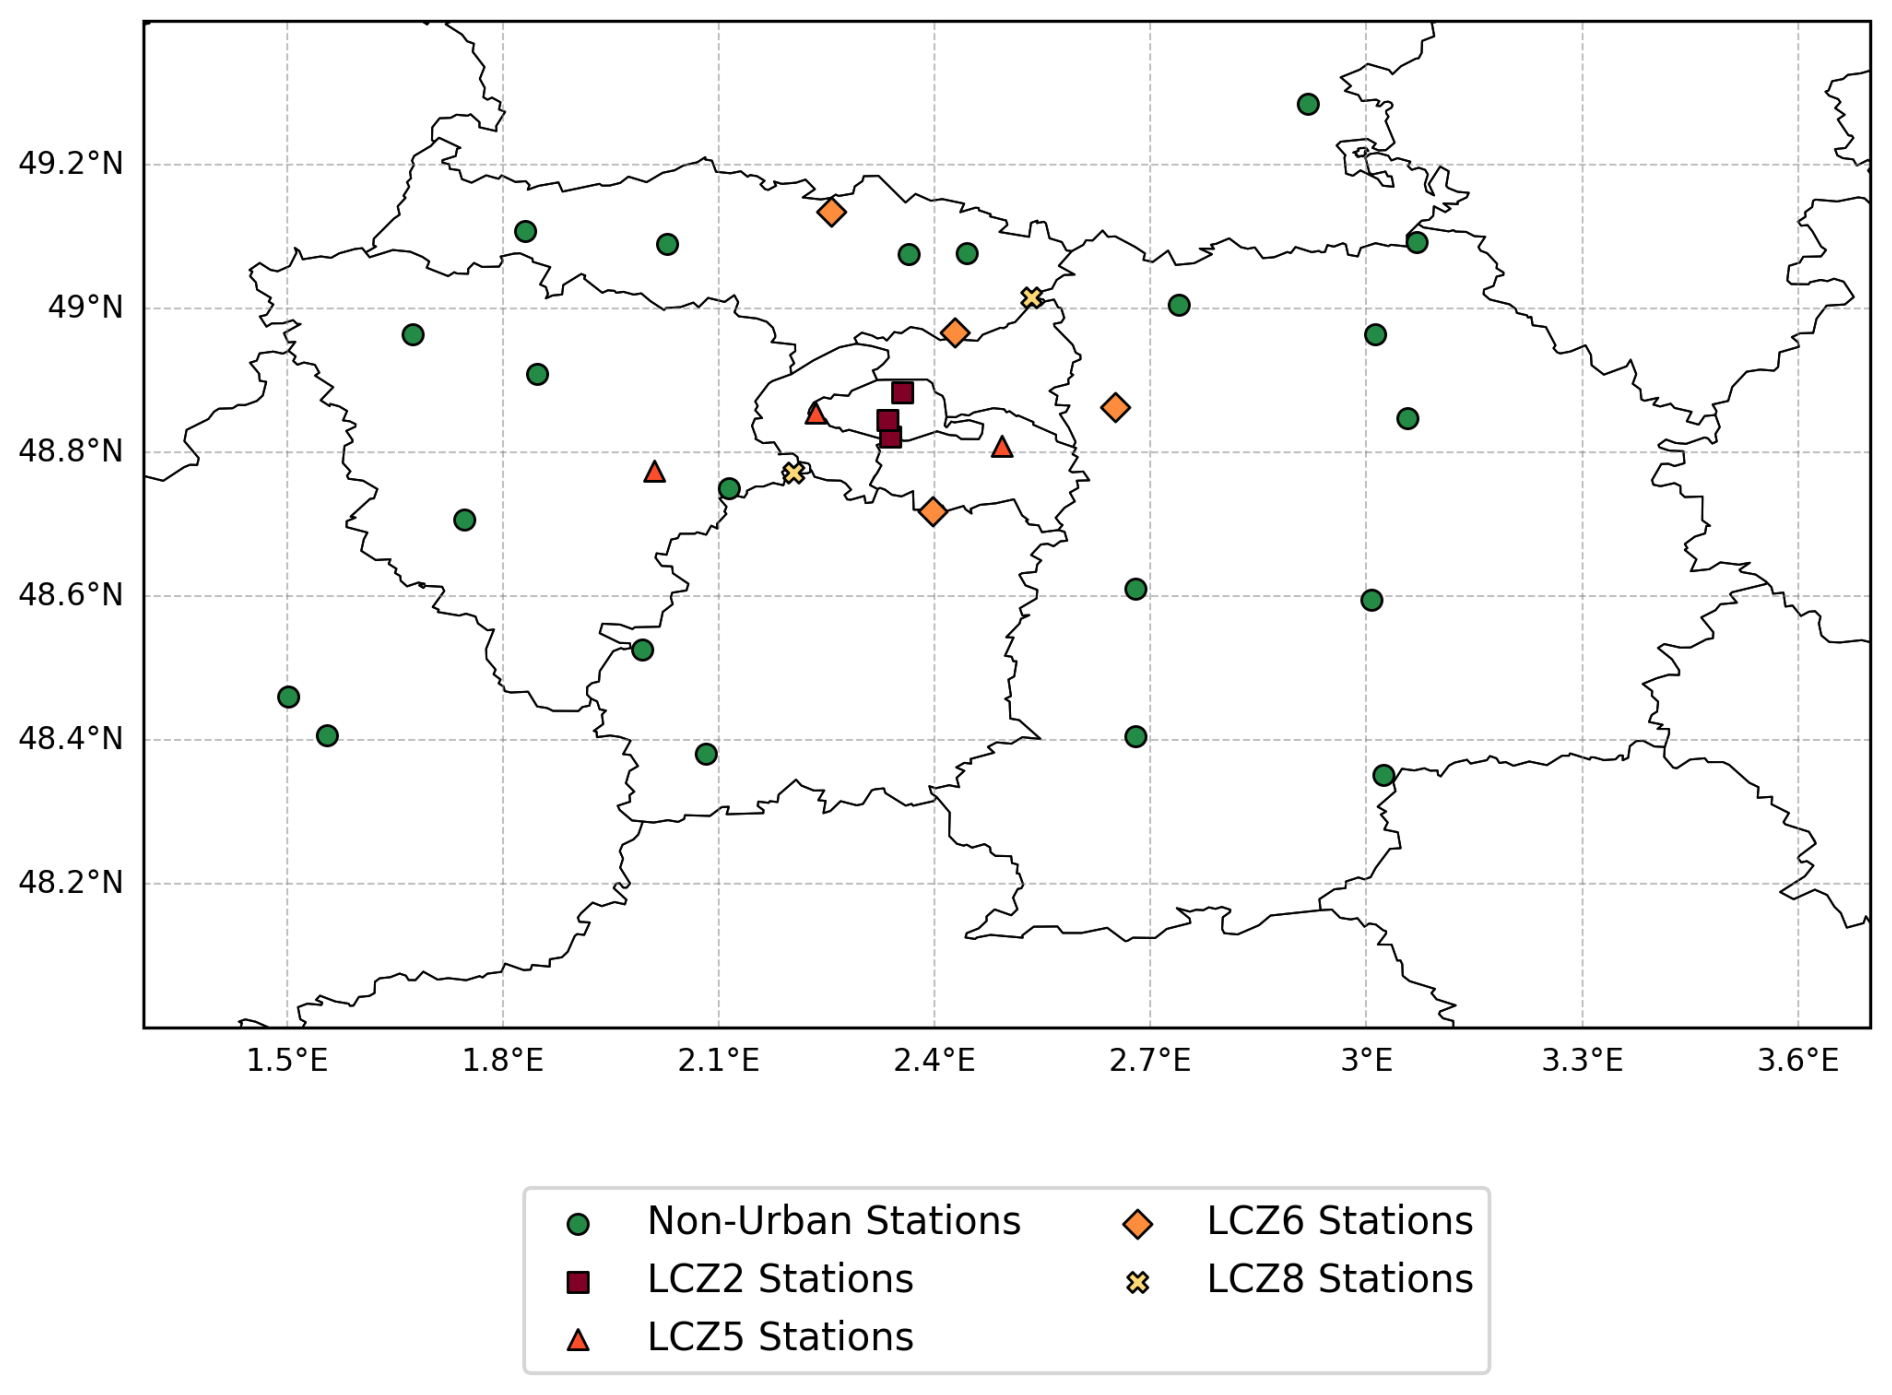
Figure 4Location and classification of the meteorological stations used for the evaluation of the experiments. Dot markers denote non-urban (rural) stations, while square, triangular, diamond and cross markers represent stations classified as LCZ2, LCZ5, LCZ6 and LCZ8, respectively. All stations assigned to an LCZ class are treated also as urban stations.
2.5 UHI Evaluation
To evaluate the performance of the simulations in the representation of the UHI over the Paris area, two masks (Fig. 5) – representing the urban core area and its rural surroundings – were created following the methodology of Diez-Sierra et al. (2025). These masks were based on threshold values of variables inside WRF, such as the urban fraction and additional static inputs such as terrain height and land-use fraction. This procedure effectively excludes the influence of altitude on temperature (i.e., adiabatic lapse rate), enabling a more accurate assessment of the UHI. As an additional refinement to this approach, in the urban mask we included only those urban grid cells (only after fulfilling the abovementioned criteria) located within the GHS-UCDB polygon, providing a more precise delineation of the urban area for mask generation. The magnitude of modelled UHI was then evaluated against the observed from stations located within the two masks, as a reference and not as quantitative comparison. Only urban (non-urban) grid cells were included in the urban (rural) mask, while a buffer zone was considered between the two masks to avoid overlap effects (Hawkins et al., 2003).
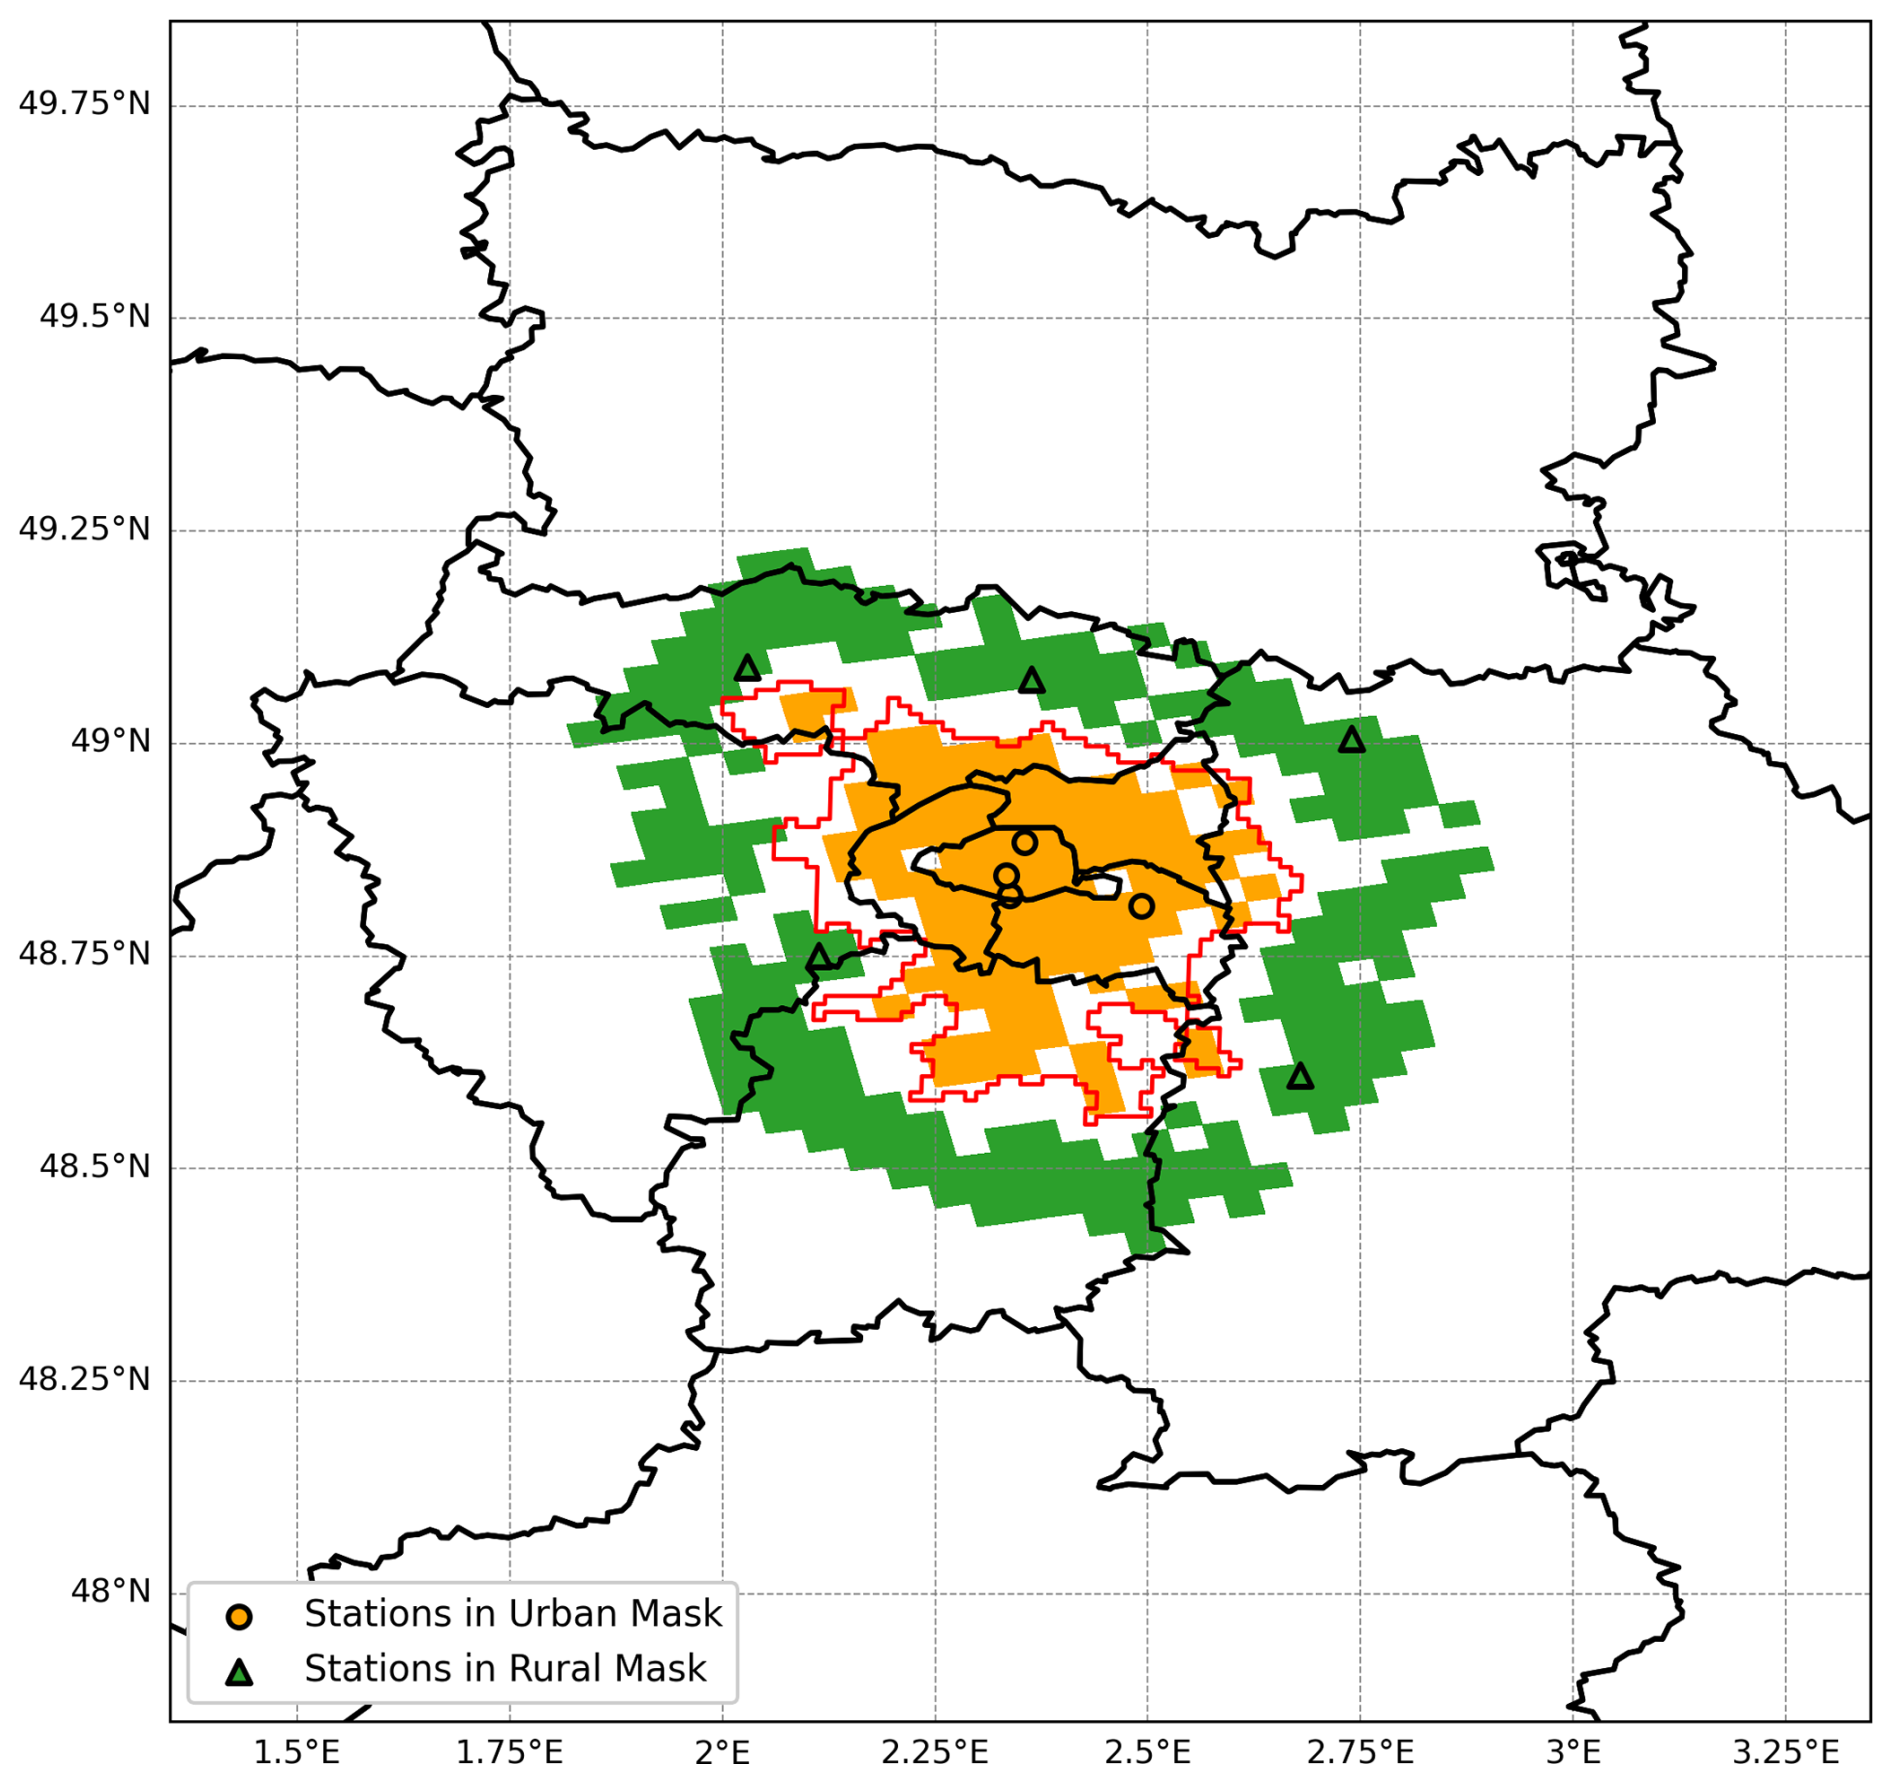
Figure 5Urban (orange) and rural mask (green). Dot (triangle) markers correspond to urban (rural) stations inside the urban (rural) mask, while the red polygon represents the urban area of Paris, according to GHS-UCDB polygons.
3.1 Model performance during summer 2020
Figure 6 shows the daily cycles for the two groups of stations averaged for the summer months (JJA) of 2020. Over urban stations (Fig. 6a), the 2 m air temperature is overestimated by all three simulations throughout the summer and across the entire diurnal cycle. Month to month variation is shown in the supplementary material (Fig. S3) and it is noticed that, while observational temperatures increase from June to August, BULK and PAR during midday hours in urban stations estimate bigger temperatures in July than in August. According to Table 4, the warm bias is systematically larger during nighttime (18:00–05:00 UTC) than during daytime (06:00–17:00 UTC) for all WRF simulations. Activation of the UCM reduces the warm bias compared to BULK, particularly during daytime (1.95 °C in BULK, 1.02 °C in CTRL, 1.53 °C in PAR), but has a negligible impact at night, lowering the bias by just 0.07 °C in CTRL and 0.2 °C in PAR. Therefore, in terms of overall model error (RMSE) the CTRL simulation performs better during both daytime and nighttime. The temporal correlation – associated with the 24 h diurnal cycle – remains practically the same for the three simulations.
In non-urban areas (Fig. 6b) all simulations perform better during daytime with biases below 0.5 °C, retaining the higher nighttime warm bias (Table 4). Introduction of the PAR configuration alters mostly the model behavior, since it is colder than the other two simulations both during the day and night. This leads to an improvement regarding nighttime hours, since PAR has the smallest bias during the night (1.62 °C), alongside with the lowest RMSE values among all three simulations and the highest temporal correlation. However, it also exhibits cold biases during the daytime.
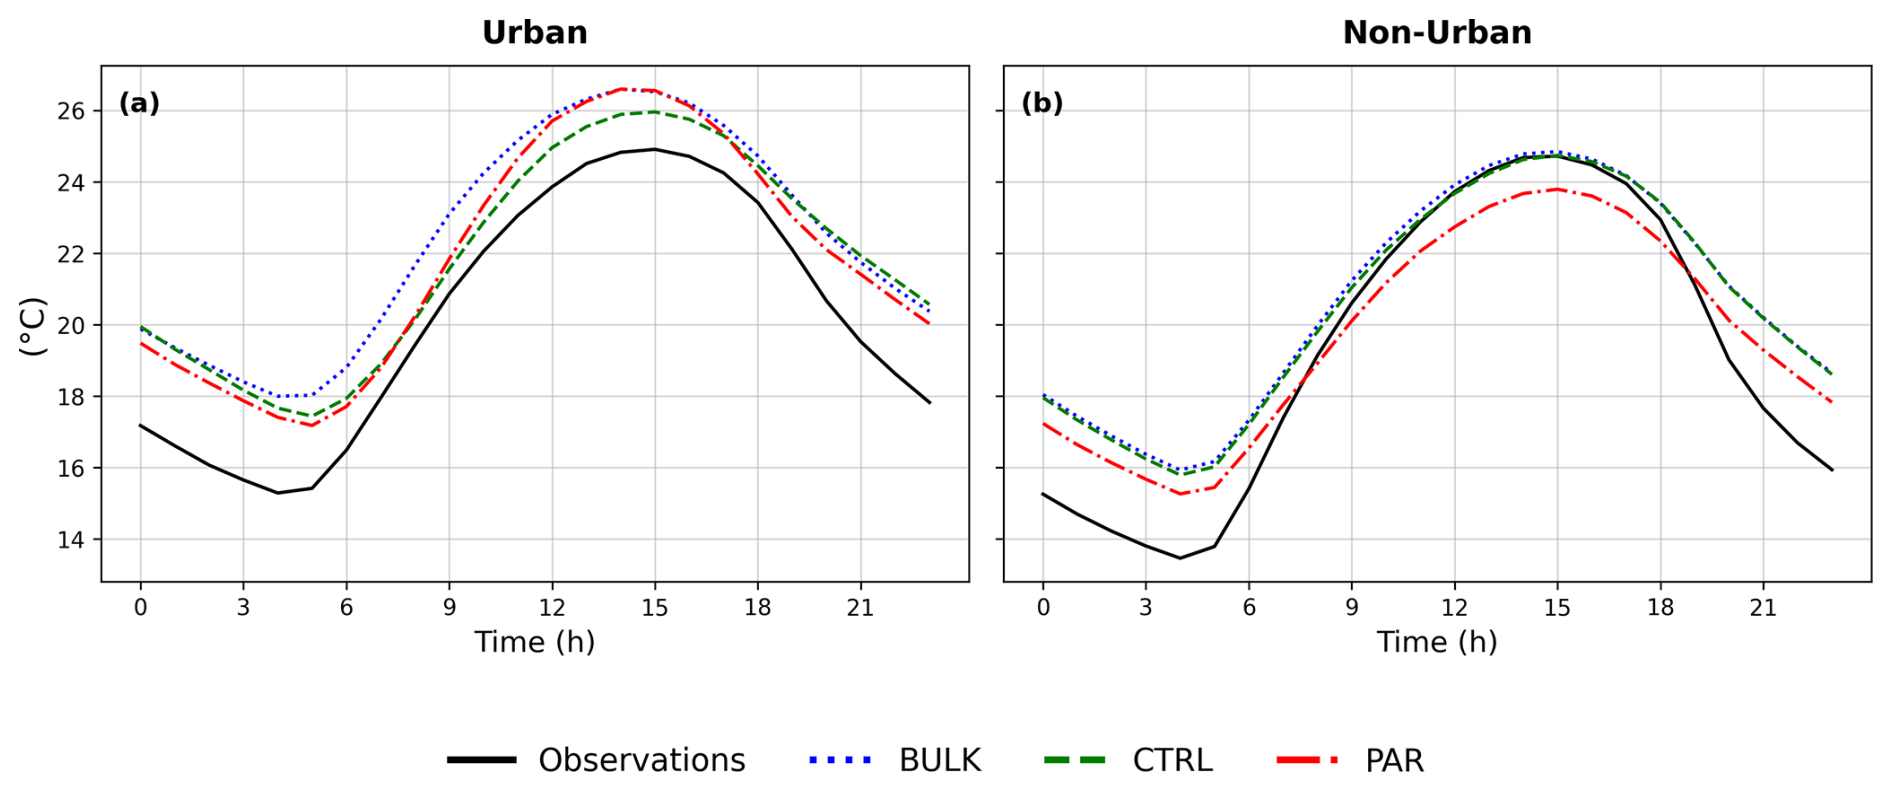
Figure 6Daily profiles of 2 m air temperature from observations (black solid line), BULK (blue dotted line), CTRL (green dashed line) and PAR (red dash-dot line) for: (a) Urban; (b)Non-Urban stations, during the summer (JJA) of 2020.
Table 4Statistical analysis (Bias, RMSE) of the three simulations concerning group stations (Urban, Non-Urban) during daytime and nighttime hours (indicated as D and N, respectively), for the summer (JJA) of 2020. Temporal correlation (R) is calculated on the totality of the 24 h span.

To further investigate the warm bias of WRF over urban areas, we perform a more detailed analysis over distinct LCZs, which correspond to urban land-use for BEP-BEM simulations, namely: LCZ2 (compact high-rise), LCZ5 (open midrise), LCZ6 (open lowrise), LCZ8 (large lowrise). Out of the 13 urban stations in the Météo-France RADOME network, three are classified as LCZ2 (Paris city centre), three as LCZ5, five as LCZ6, and two as LCZ8 (city outskirts). Although the BULK simulation does not use the LCZ land-use classification to urban grid cells (unlike the two BEP-BEM simulations), we extracted BULK values from the corresponding grid cells so that diurnal cycles could be compared across LCZ classes (Fig. 7). This allows the evaluation of whether incorporating the LCZ-driven heterogeneity improves the simulated urban climate. Month to month variation can be obtained in Fig. S4.
When the UCM is activated, the highest temperature overestimation occurs over LCZ2 stations (Fig. 7a), which is the most urbanized part of the greater Paris region. The mean biases over the complete 24 h diurnal cycle are 1.84 and 2.42 °C for the CTRL and PAR simulations, respectively (Table 5). Surprisingly, BULK outperforms both the BEP-BEM experiments at LCZ2 stations, having the lowest bias (1.82 °C). Moving outside the city's core over LCZ5 stations (Fig. 7b), the magnitude of the warm bias during the 24 h span remains relatively the same to that of LCZ2 for CTRL and decreases for the PAR configuration by approximately 0.5 °C (1.86 and 1.91 °C, respectively). PAR better performs over stations located at LCZ6 and LCZ8 (Fig. 7c, d) by further reducing the warm biases and slightly outperforming CTRL (Table 5). RMSE values come in accordance with biases, with CTRL (PAR) having the smaller deviations from observational values for LCZ2 and LCZ5 (LCZ6 and LCZ8). Temporal correlations in the diurnal cycles are slightly better for LCZ8 for the two simulations. Furthermore, despite the limited urban variability when urban areas are represented using a single land-use category BULK shows warm biases of similar magnitude across all LCZs and has a worse performance than PAR and CTRL for the rest of the LCZ stations. The analysis separated into daytime and nighttime period (Table S6) indicate the same pattern found in the urban stations group, with substantially warmer biases during the night than midday for both BEP-BEM simulations across all LCZs.
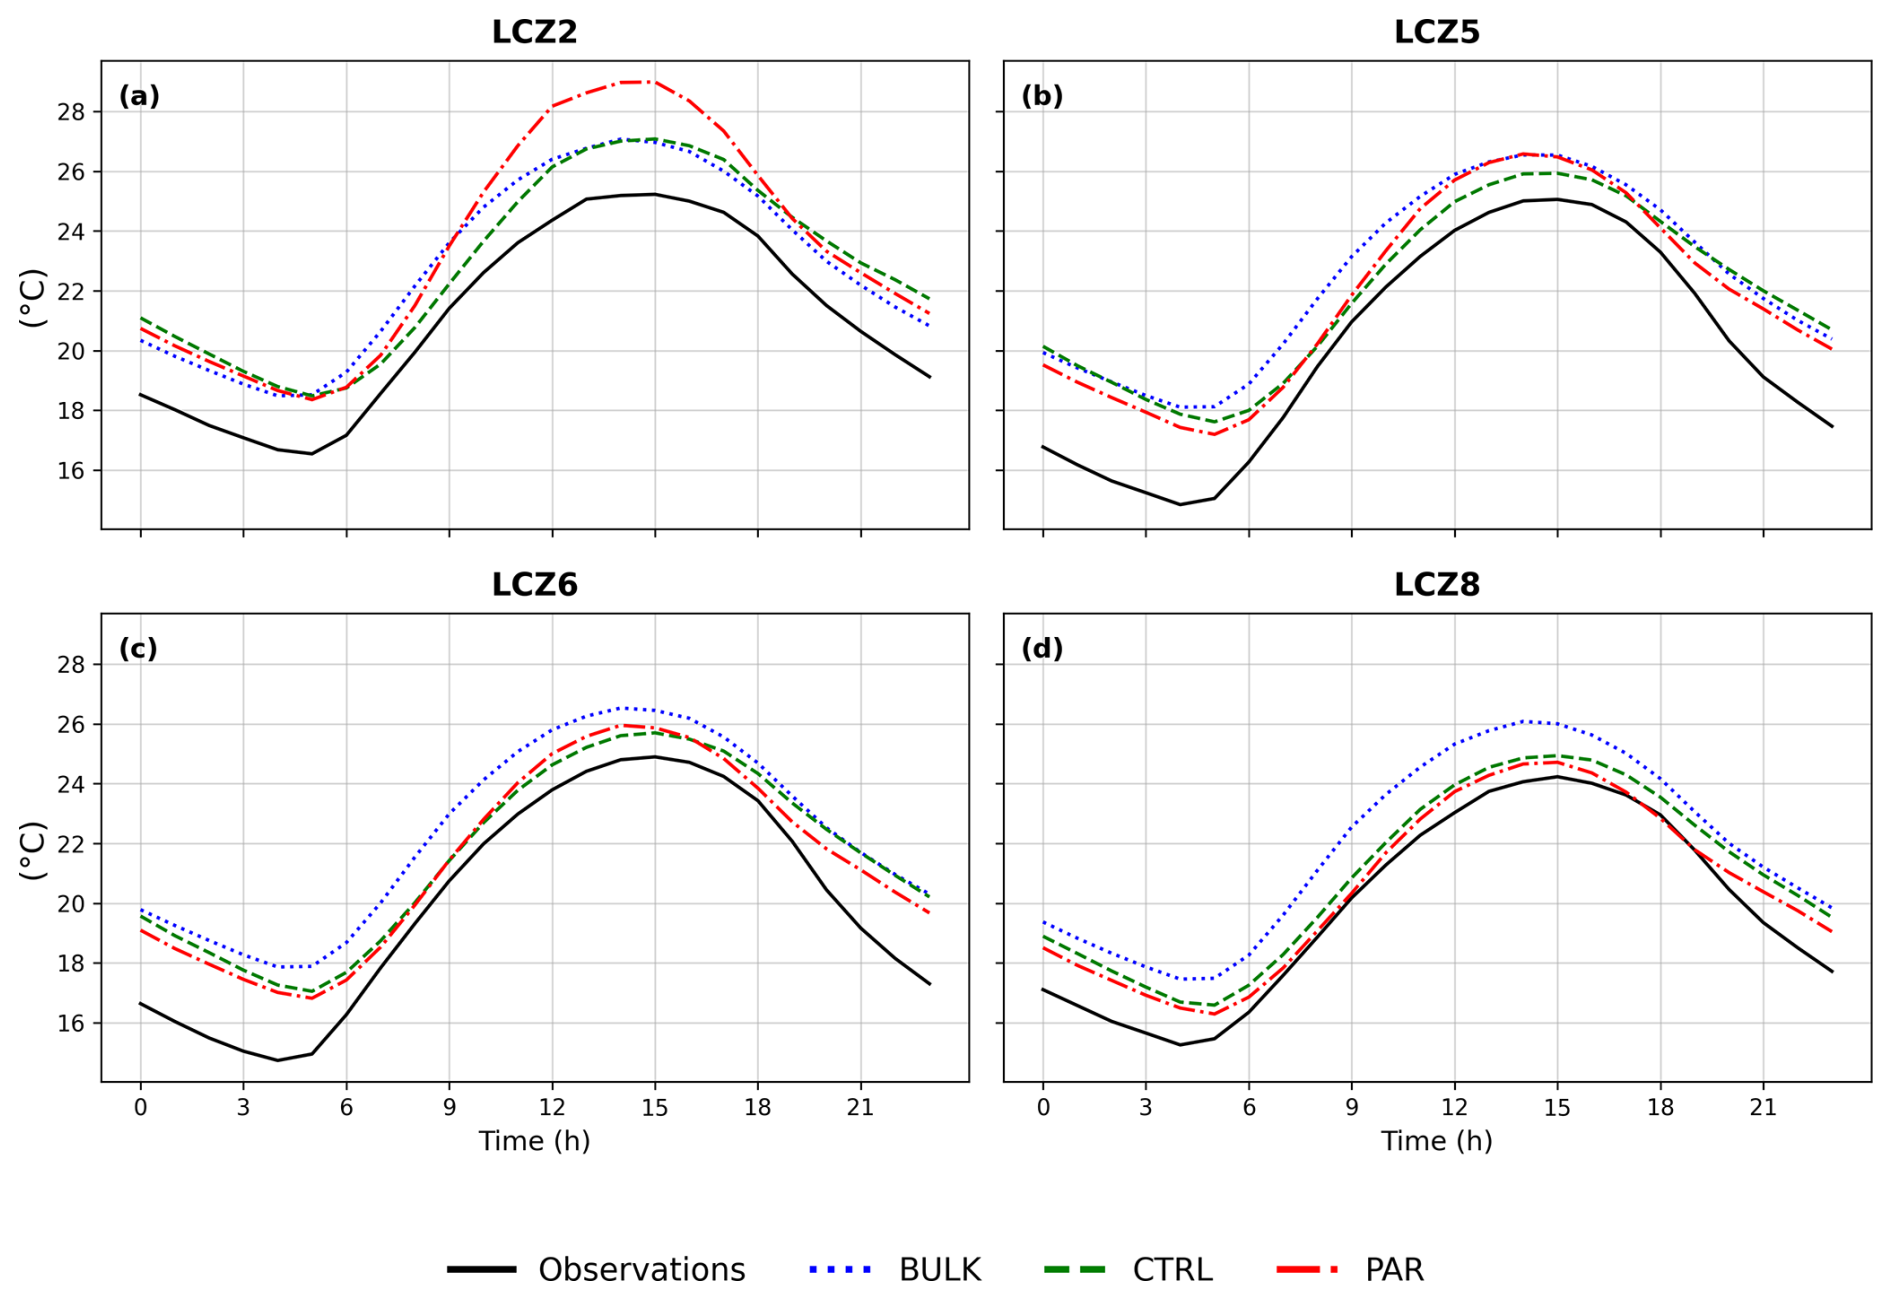
Figure 7Daily profiles of 2 m air temperature from observations (black solid line), BULK (blue dotted line), CTRL (green dashed line) and PAR (red dash-dot line) for: (a) LCZ2; (b) LCZ5; (c) LCZ6 and (d) LCZ8 stations, during the summer (JJA) of 2020.
Table 5Mean diurnal statistical analysis (Bias, RMSE, R) of thethree simulations, for stations located at corresponding LCZs, for the summer (JJA) of 2020.

3.2 Model performance during the Heatwave of August 2020
In both station groups (Urban and Non-Urban) the modelled diurnal cycles reveal a one to two-hour lag in the occurrence of maximum temperatures compared to observations (Fig. 8a, b), while this lag is also apparent in the BEP-BEM simulations for minimum temperatures in urban stations. During this heatwave period all three simulations show a warm bias over urban stations, which is consistently higher during nighttime (Fig. 8a). Activation of the UCM alleviates the daytime warm bias (1.45 °C in BULK, 0.53 °C in CTRL) but deteriorates the nighttime bias (3.52 °C in BULK, 4.25 °C in CTRL) (Table S7). It seems that urban heat is overproduced in the city centre and there is not sufficient cooling urban mechanisms to allow the city release the excess heat especially during the night.
At Non-Urban stations, again all three simulations exhibit prominent warm biases during the night (Fig. 8b). PAR simulation (Table 6) has the lowest RMSE and the highest time-correlation, slightly outperforming CTRL. BULK has the largest bias, while among the two BEP-BEM simulations, the implementation of EO data (through PAR) improves the model performance compared to CTRL (Table 6), with a decreased bias of 0.17 °C (1.82 and 1.99 °C, respectively).
Analysis by LCZ (Fig. 9 and Table 7) shows this excessive warm bias over the urban cells is concentrated in the most urbanized part of the city (stations for which the nearest grid cell is in LCZ2), which decreases towards the city outskirts. Temperatures are sensitive to the newly introduced PAR configuration, with the largest deviation from the CTRL simulation occurring in LCZ2 stations (warm biases of 3.62 and 2.47 °C, respectively). This indicates that the specifics of PAR overestimate the heat generated within the city core. Similar to the summer, BULK once again outperforms CTRL and PAR at LCZ2 stations. The lower the urbanization of the area, the smaller the warm bias in the 24 h span (Table 7) for PAR (3.28, 2.78, 1.65 °C for LCZ5, LCZ6, LCZ8, respectively). The difference between the two BEP-BEM simulations in LCZ2 is larger during sunlight hours and not during the night. The highest warm bias occurs during nighttime across all LCZs (Table S8). This behavior can be explained by the fact that BEP-BEM parameterization is able to store more energy in the urban fabric during the day (Martilli et al., 2002), allowing the formation of a more intense nocturnal urban heat island during the heatwave. Furthermore, the BouLac Planetary Boundary Layer scheme is found to cause nighttime overestimations of temperature in urban related grid cells (Segura et al., 2021), thus also partially explaining the nighttime warm bias not only of BEP-BEM simulations but also that of BULK.
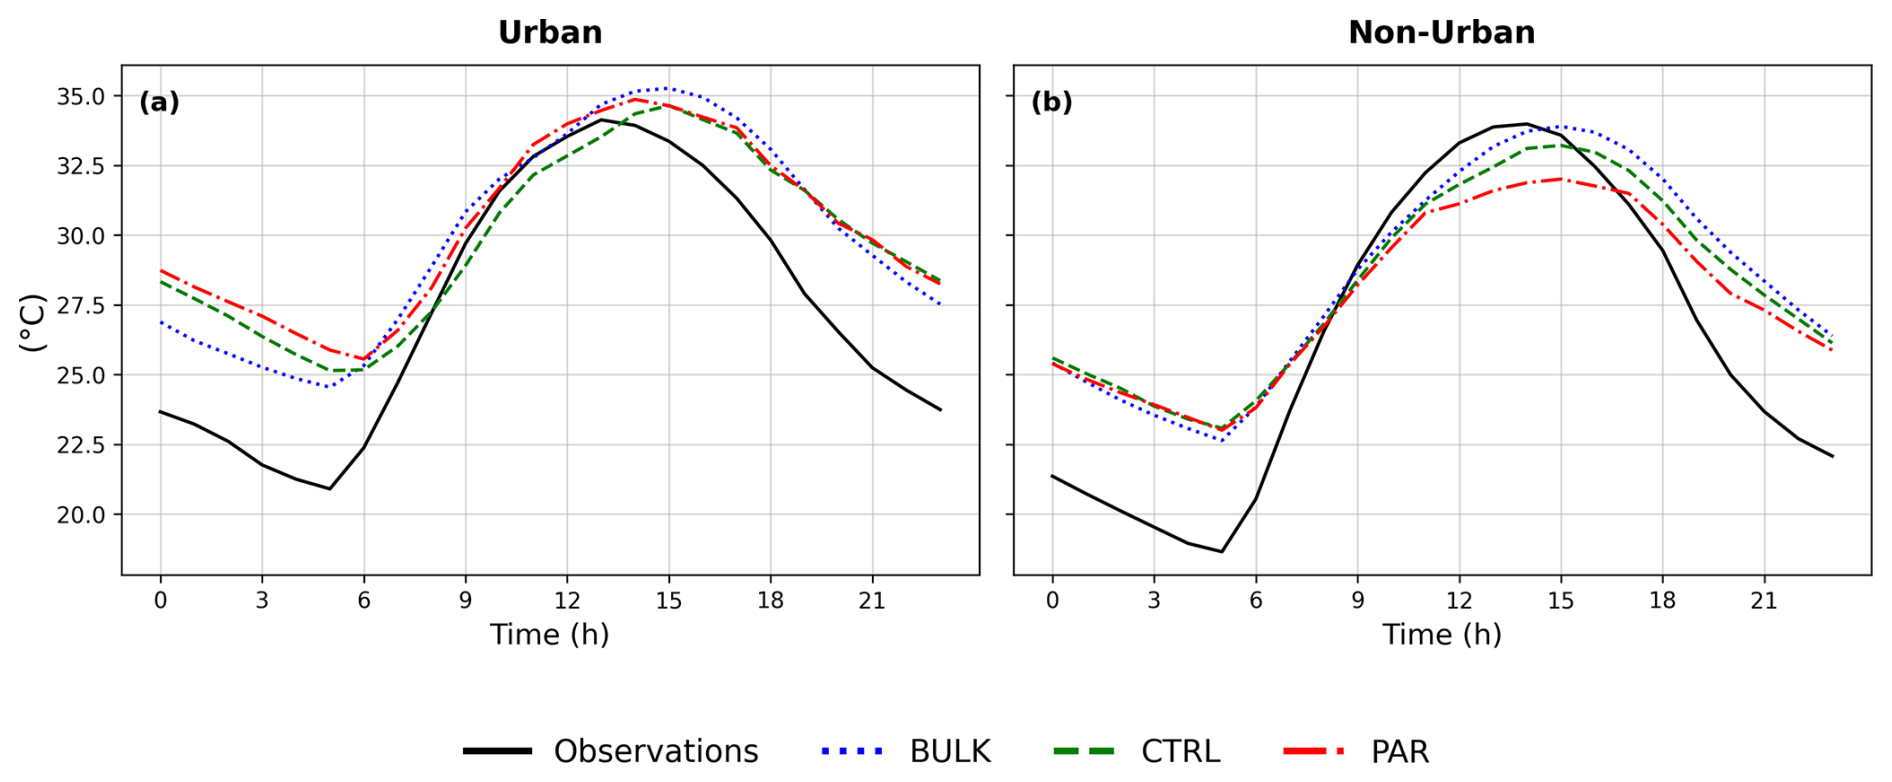
Figure 8Daily profiles of 2 m temperature from observations (black solid line), BULK (blue dotted line), CTRL (green dashed line) and PAR (red dash-dot line) for: (a) Urban; (b) Non-Urban stations, during the heatwave event of August 2020.
Table 6Mean diurnal statistical analysis (Bias, RMSE, R) of the three simulations, concerning group stations (Urban, Non-Urban), for the heatwave of August 2020.
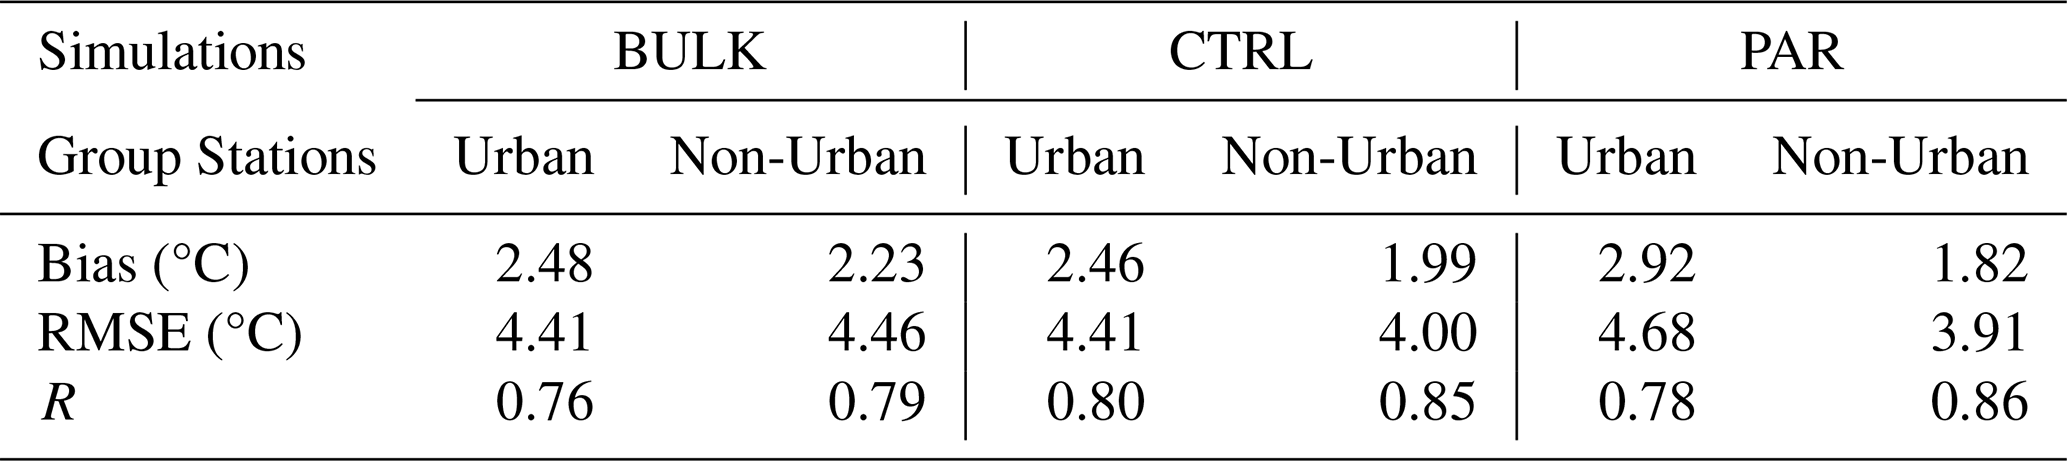
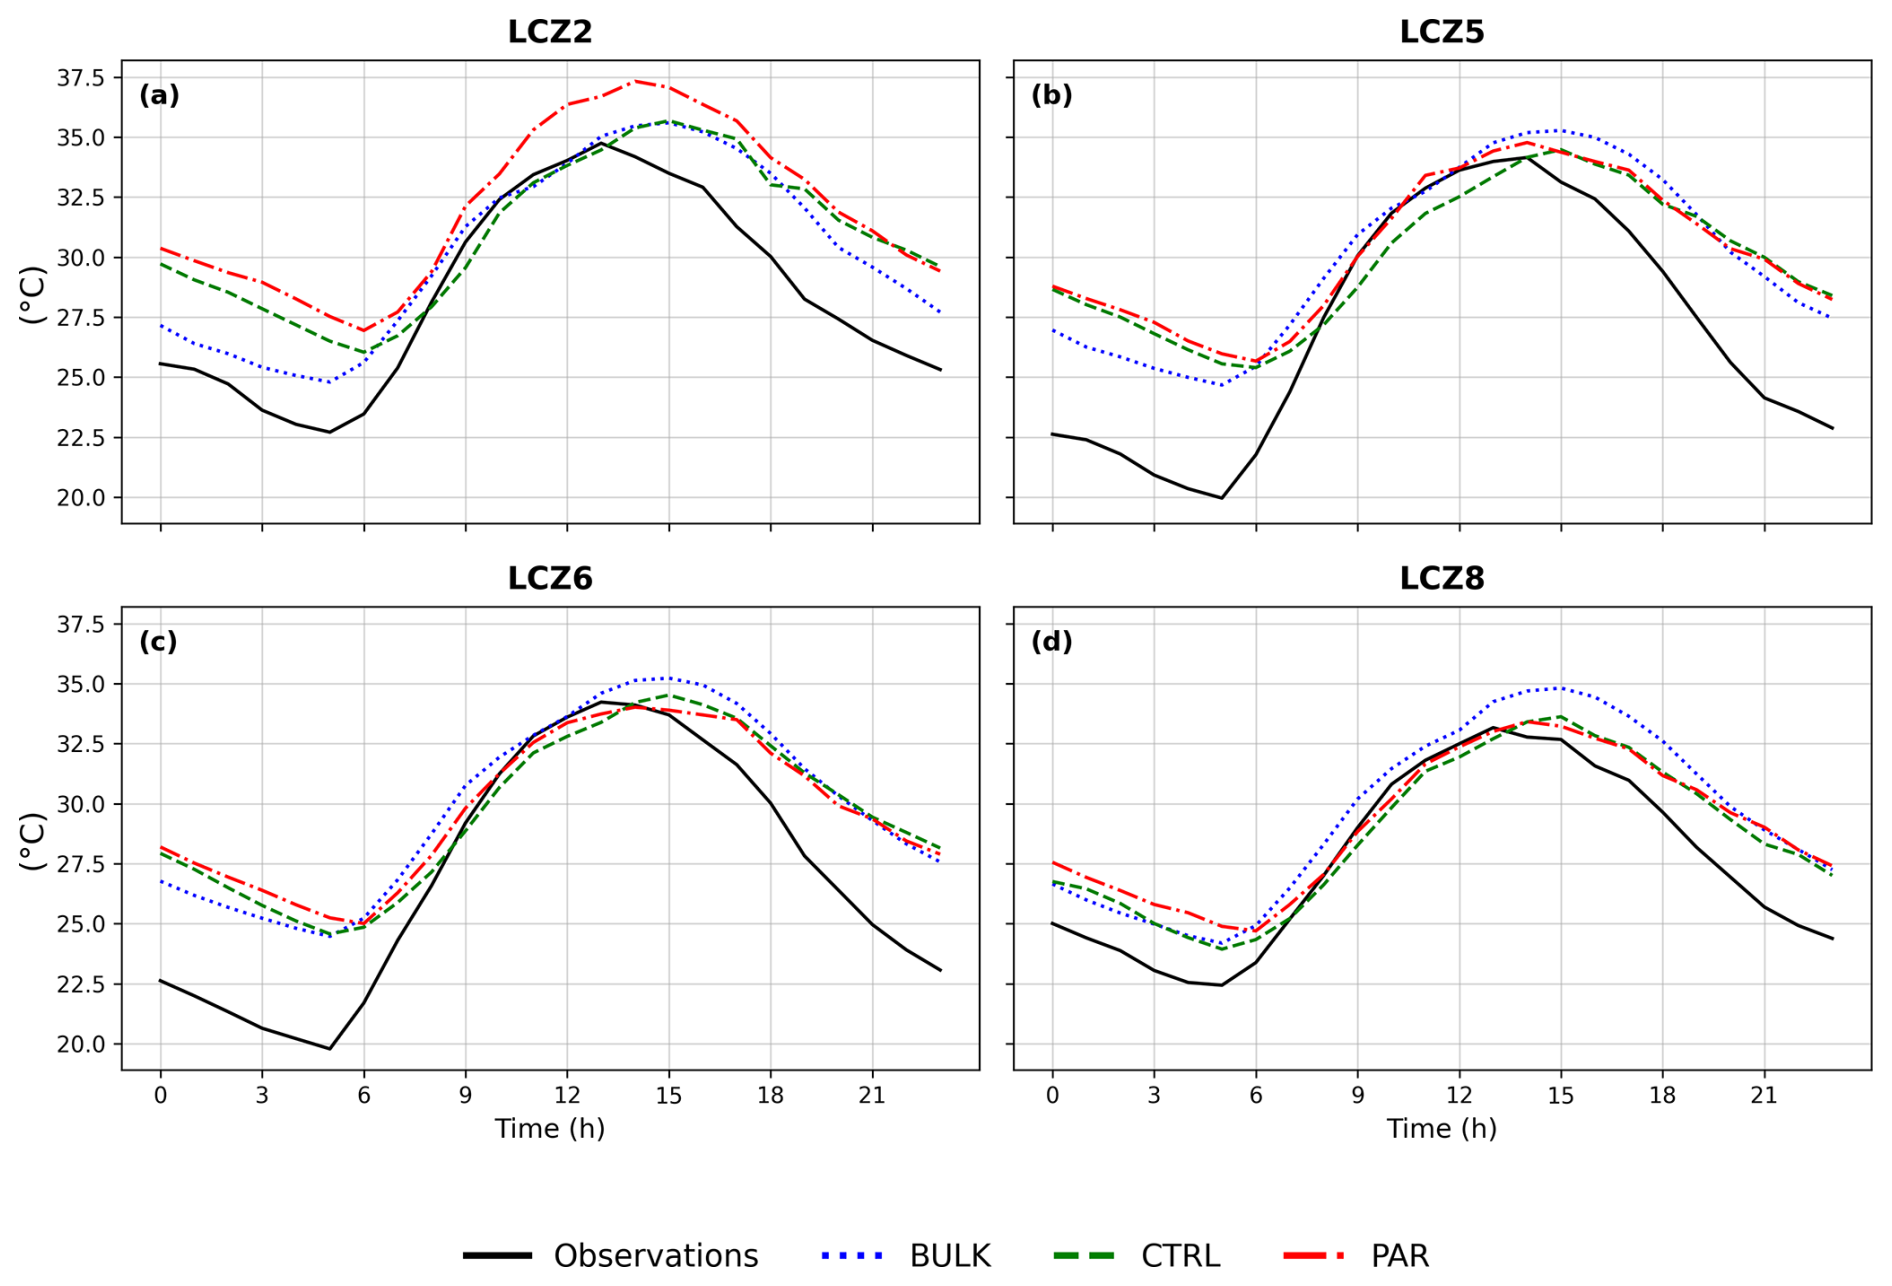
Figure 9Daily profiles of 2 m air temperature from observations (black solid line), BULK (blue dotted line), CTRL (green dashed line) and PAR (red dash-dot line) for: (a) LCZ2; (b) LCZ5; (c) LCZ6 and (d) LCZ8 stations, during the heatwave of August 2020.

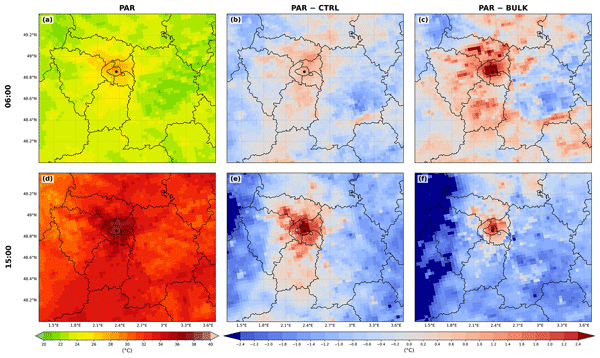
Figure 10 presents the averaged 2 m air temperature of the PAR experiment and its differences, when minimum and maximum temperatures occur at approximately 06:00 (upper panel) and 15:00 UTC (bottom panel), respectively, to highlight the spatial differences between the PAR configuration and the other two simulations, CTRL (middle panel) and BULK (right panel) during the heatwave. There is not much difference between the PAR and the CTRL simulations for minimum temperatures (Fig. 10b); in contrast, differences between the two simulations are found within the city core at maximum temperatures (Fig. 10e). On the other hand, activation of the UCM (PAR vs BULK) appears to substantially affect minimum temperatures across a large portion of the domain and Paris greater area (Fig. 10c), leading to an increase in minimum temperatures. The colder daytime climatology of PAR at the non-urban areas is also apparent spatially when compared with the CTRL and BULK simulations (Fig. 10e, f), a pattern already observed for the summer months. This feature of the PAR simulation may lead to an overestimation in the magnitude of the daytime UHI effect, which is discussed in the corresponding section.
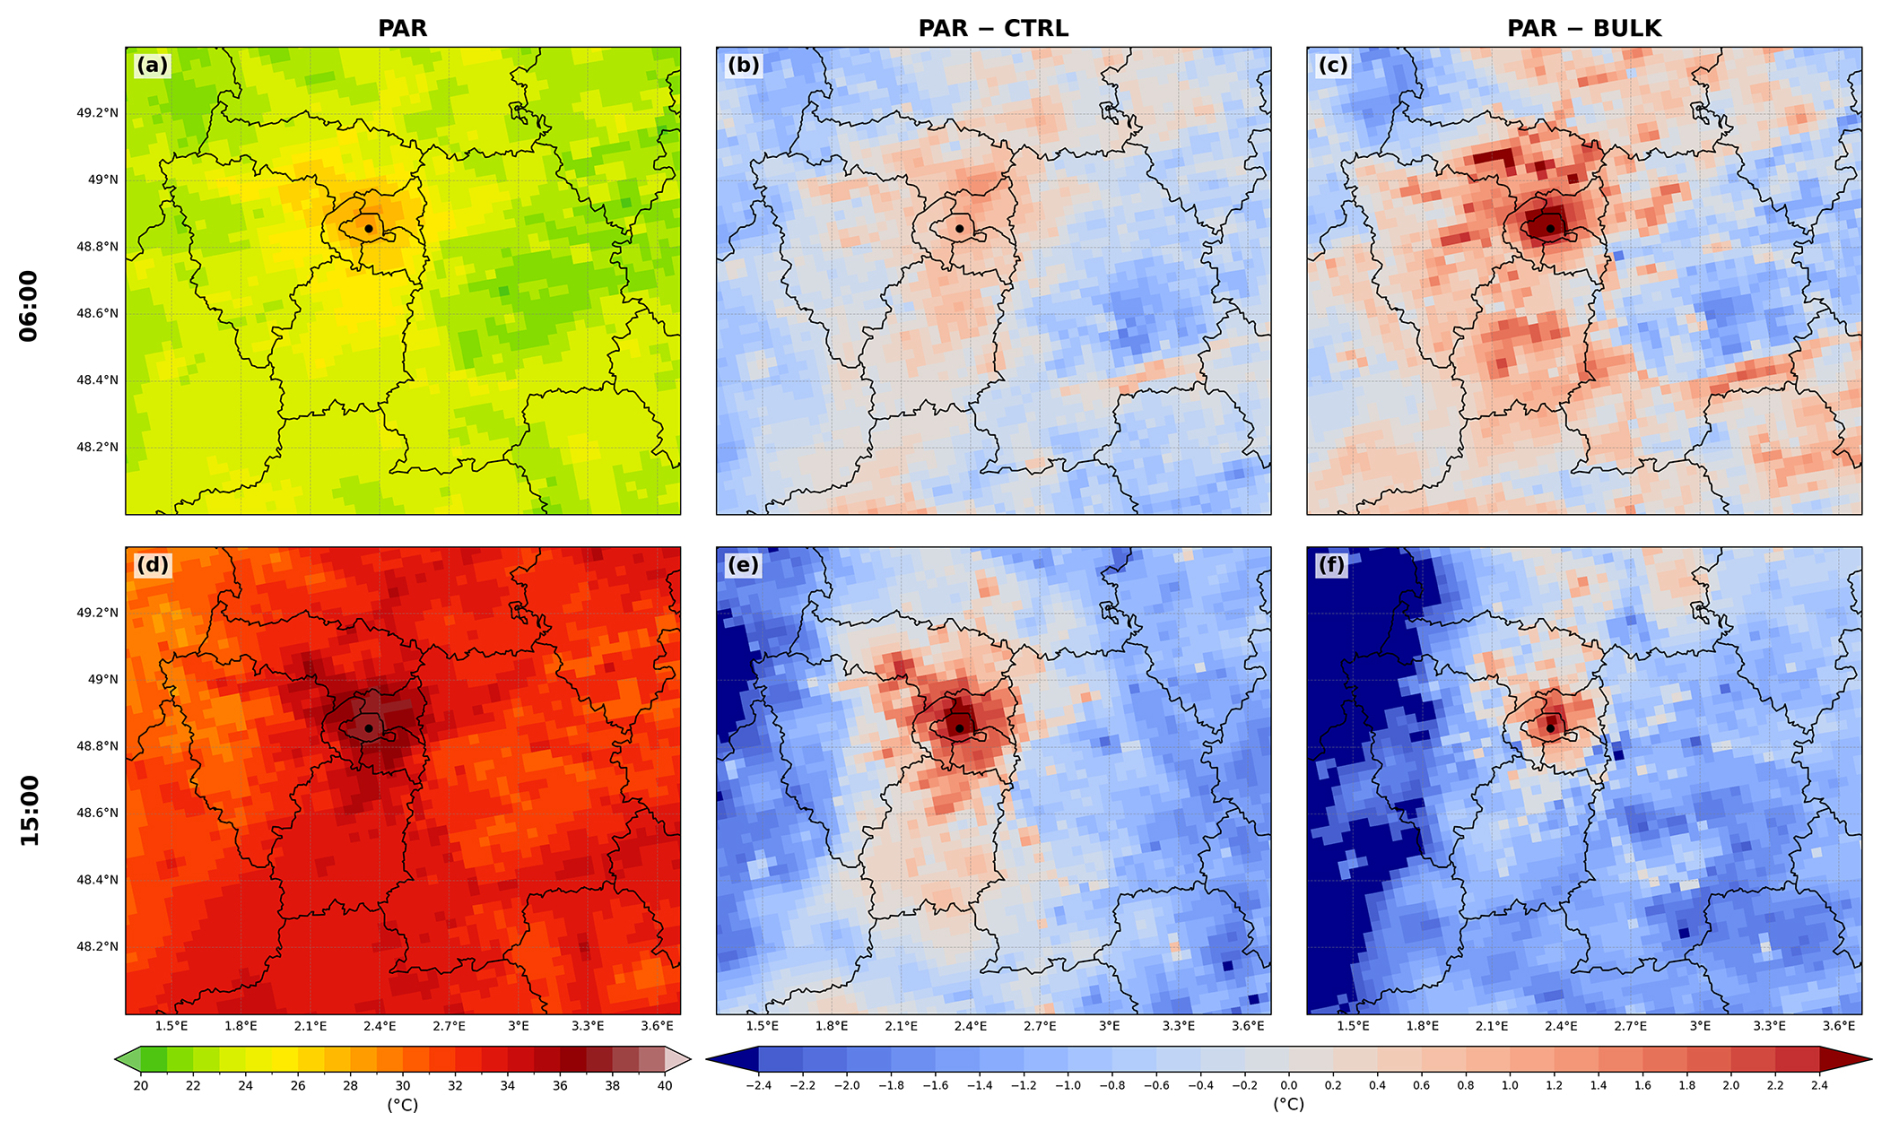
Figure 10Heatwave period mean 2 m air temperature for the PAR experiment and its corresponding differences relative to CTRL and BULK, at 06:00 UTC (upper row) and 15:00 UTC (lower row) in Paris region. Panels (a), (d) present the absolute PAR temperature, (b), (e) present PAR – CTRL, and (c), (f) present PAR – BULK. Dot represents Paris centre.
To examine also the temporal agreement between the three simulations and the observations during the heatwave, the hourly 2 m air temperature evolution was assessed for urban and non-urban stations over August 2020, to investigate the model response prior and after the event. Prior to the heatwave, all three simulations generally overestimated both daytime and nighttime temperatures at the urban stations (Fig. 11a). At the non-urban stations, however, the experiments tended to underestimate (overestimate) daytime (nighttime) temperatures (Fig. 11b).
During the days following the heatwave, simulations continued to overestimate daytime temperatures at the urban stations, although the nighttime warm biases were reduced compared to both the heatwave and the preceding days of it. A different response was noticed at non-urban stations after the event, whereas simulations started to overestimate daytime temperatures, particularly evident at BULK and CTRL.
A closer examination of the heatwave period (Fig. 11c, d) shows that the daytime cold biases at the non-urban stations became smaller during the second half of the event. In contrast, all three experiments showed pronounced warm biases at the urban stations, particularly during nighttime, compared to the first half of the event.
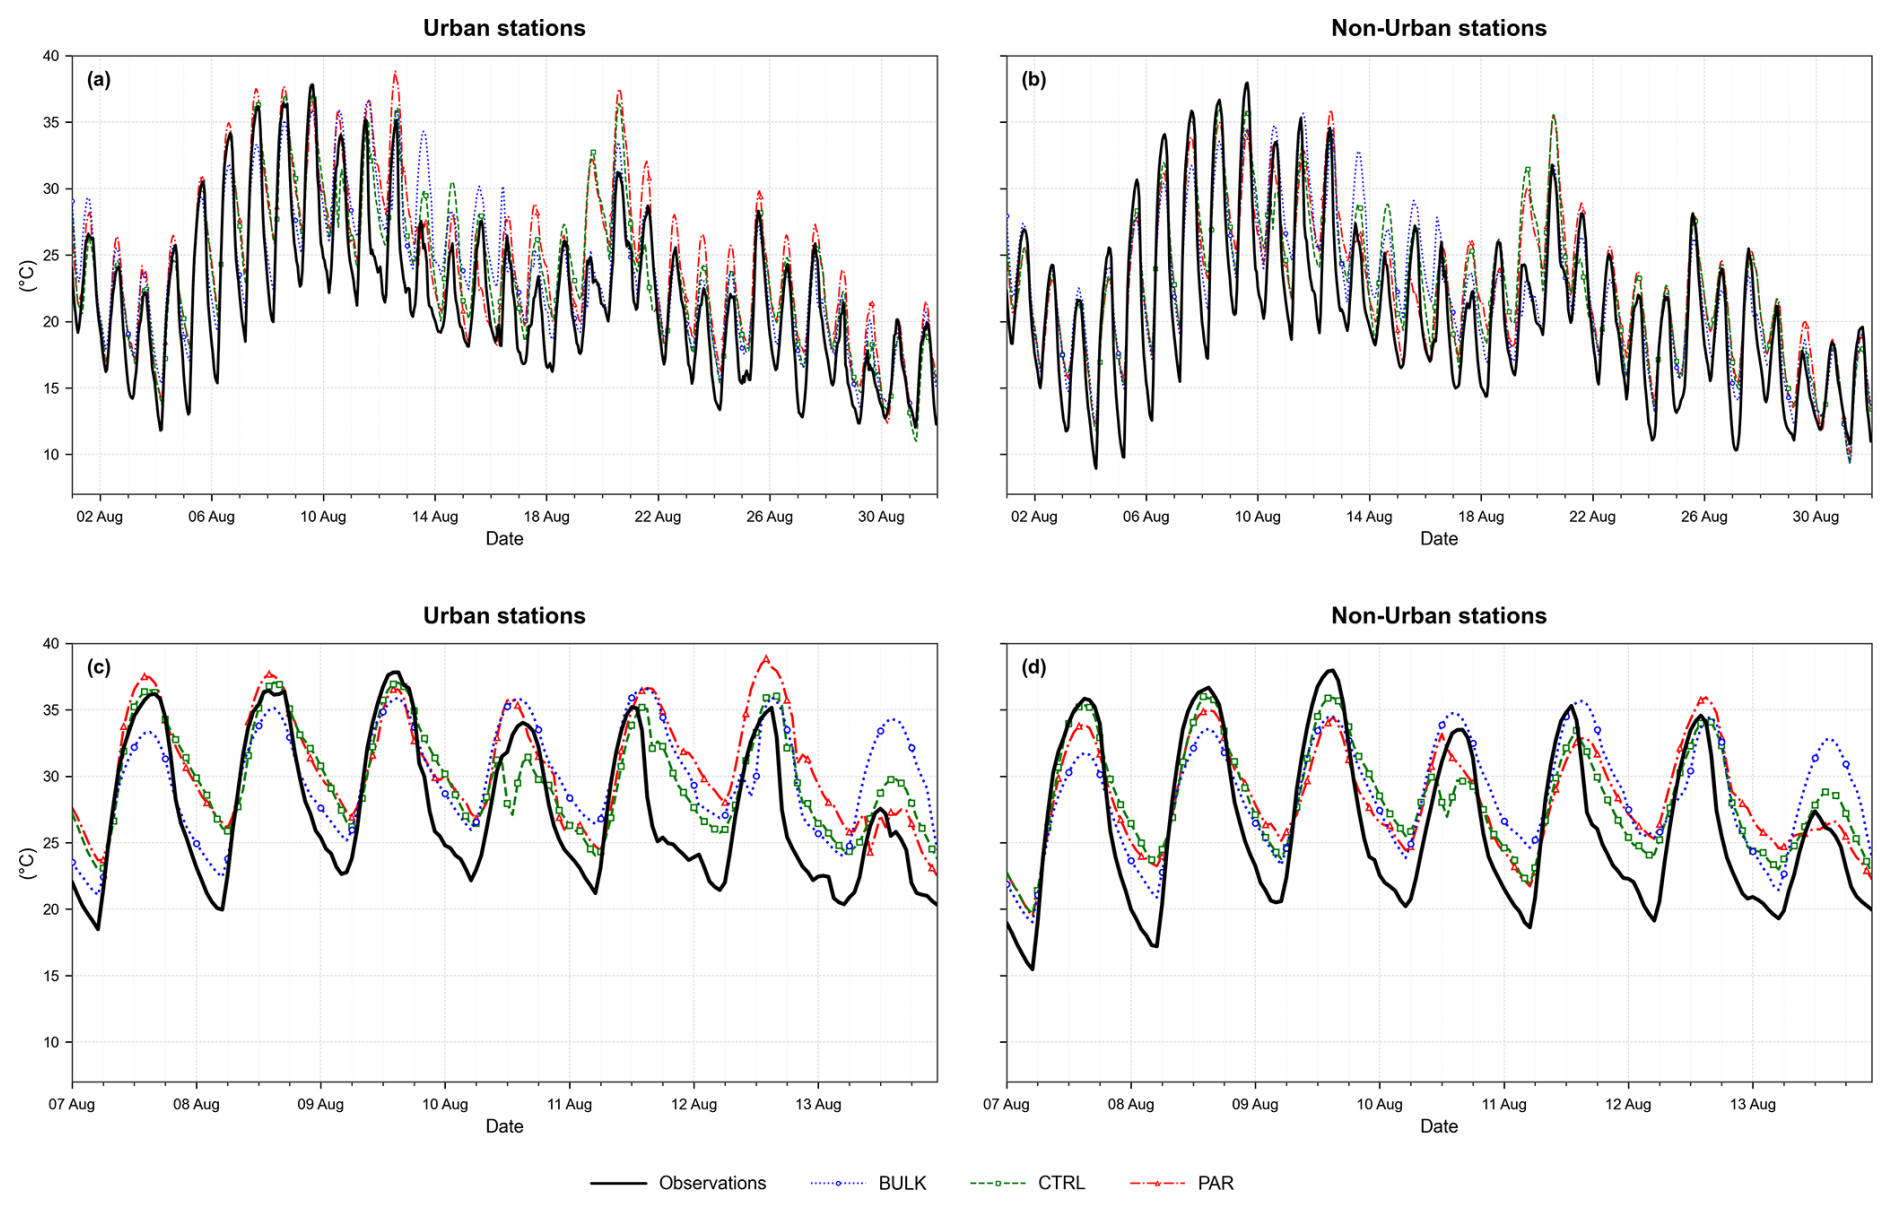
Figure 11Time series of hourly 2 m air temperature from observations (black solid line), BULK (blue dotted line), CTRL (green dashed line) and PAR (red dash-dot line) at Urban and Non-Urban stations for (a, b) August 2020 and (c, d) the heatwave event.
3.3 Model behavior in Non-Urban areas
While BULK and CTRL had a similar behavior at non-urban stations during both the summer period and the heatwave event, PAR showed a significant colder pattern, including cold biases relative to observations during midday hours (Figs. 6, 8). To investigate the processes contributing to this behavior, the differences in total cloud fraction (clt) and surface downwelling shortwave radiation (rsds) between PAR and CTRL were examined for the whole summer. Throughout the bigger part of the nested domain d02, clt was higher in PAR than in CTRL (Fig. 12a), whereas rsds was lower (Fig. 12b). The combination of the two is consistent with the generally lower 2 m air temperature indicated in non-urban stations by PAR. As the biggest part of d02 is covered by grid cells classified as non-urban (Fig. 2a, b), this colder response represents a broader domain feature of PAR. Figure 13 presents the summer-mean 2 m air temperature difference between PAR and CTRL. Grid cells for which the difference is not statistically significant at the 5 % level (p≥0.05) are marked. Only a small fraction of d02 is non-significant, indicating that the colder conditions in PAR relative to CTRL form a spatially coherent and systematic model response during summer. rather than an isolated distributed feature. However, this colder response in PAR is not constantly present over the entire 6-month period of the simulation but has strong temporal fluctuations. For example, during spin-up in March and April PAR is clearly warmer than CTRL over most of the domain. Moreover, even during summer the colder response of PAR can differ considerably in individual months, being more pronounced in July and much weaker in August while being clearly driven by the changes in cloudiness. Furthermore, cloudiness amount is a variable that is quite sensitive to internal model variability (IMV) whereas WRF is a model that presents strong IMV (Bassett et al., 2020). Therefore, we contend that the colder response of PAR during summer is the result of the coupling between a strong internal model variability and also a possible enhanced sensitivity of the model to the modified urban parameterization that led to an increase in cloudiness during this season. Interestingly, despite this overall colder summer response of PAR over non-urban areas, most of the urban areas of the domain and particularly those of the city of Paris are warmer in PAR than in CTRL during summer, clearly indicating the considerable impact of the updated UCPs.
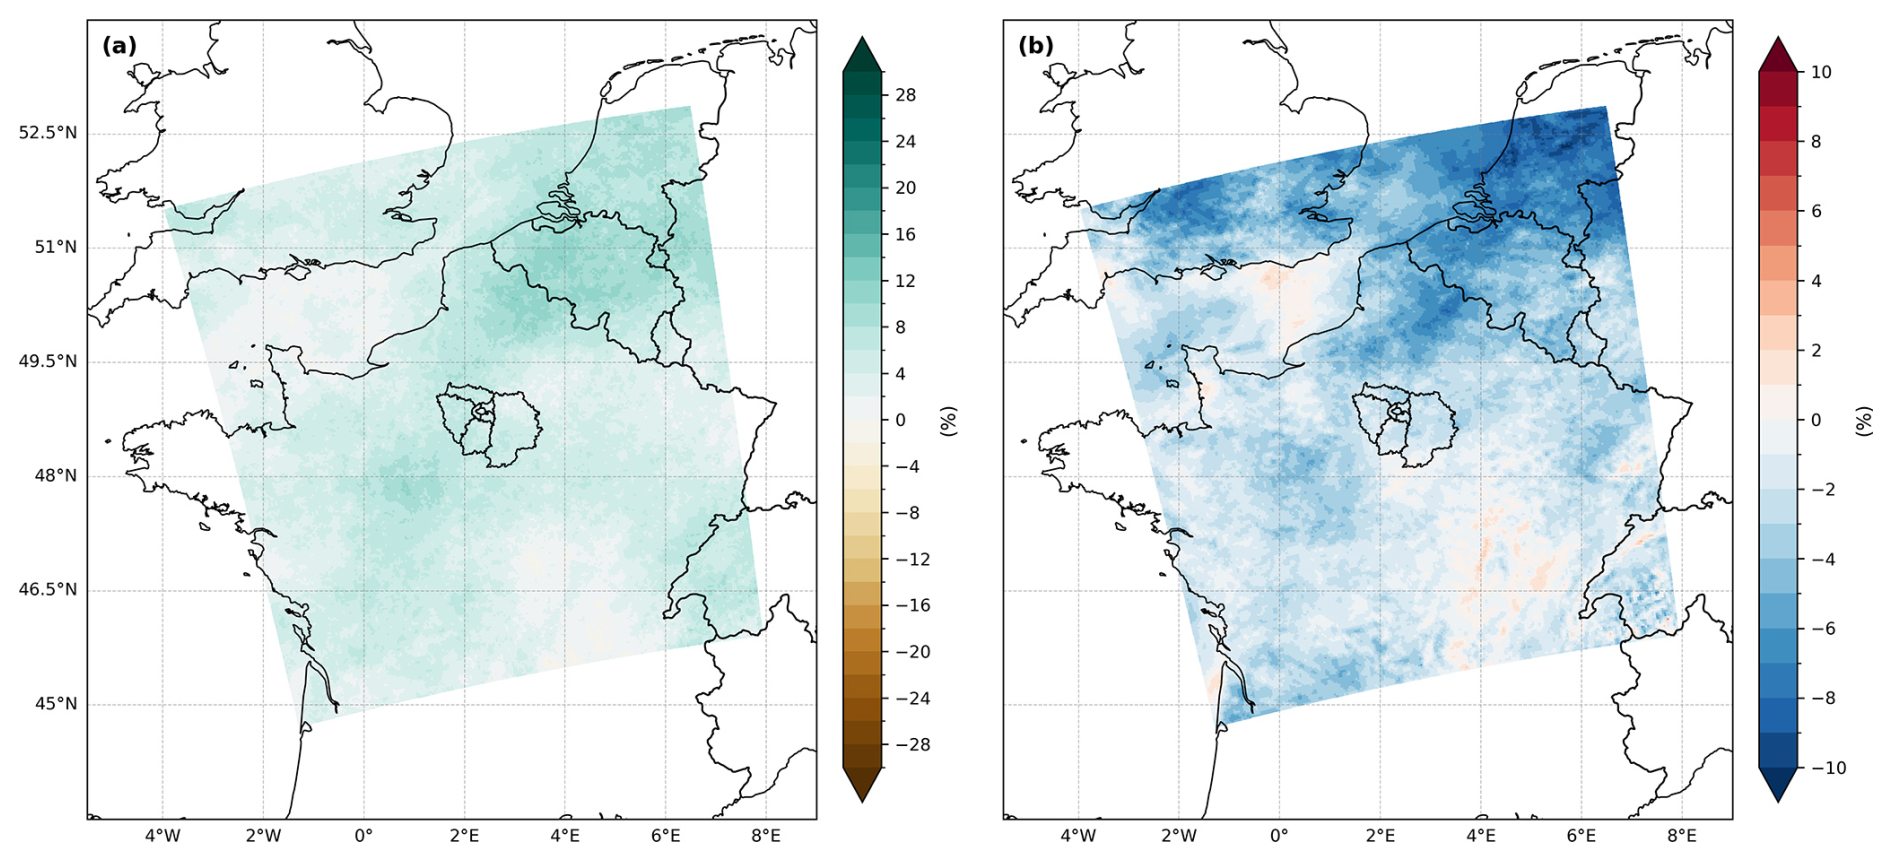
Figure 12Summer-mean differences between PAR and CTRL for: (a) total cloud fraction (%), (b) surface downwelling shortwave radiation (%). The administrative departments of Île-de-France are also depicted.
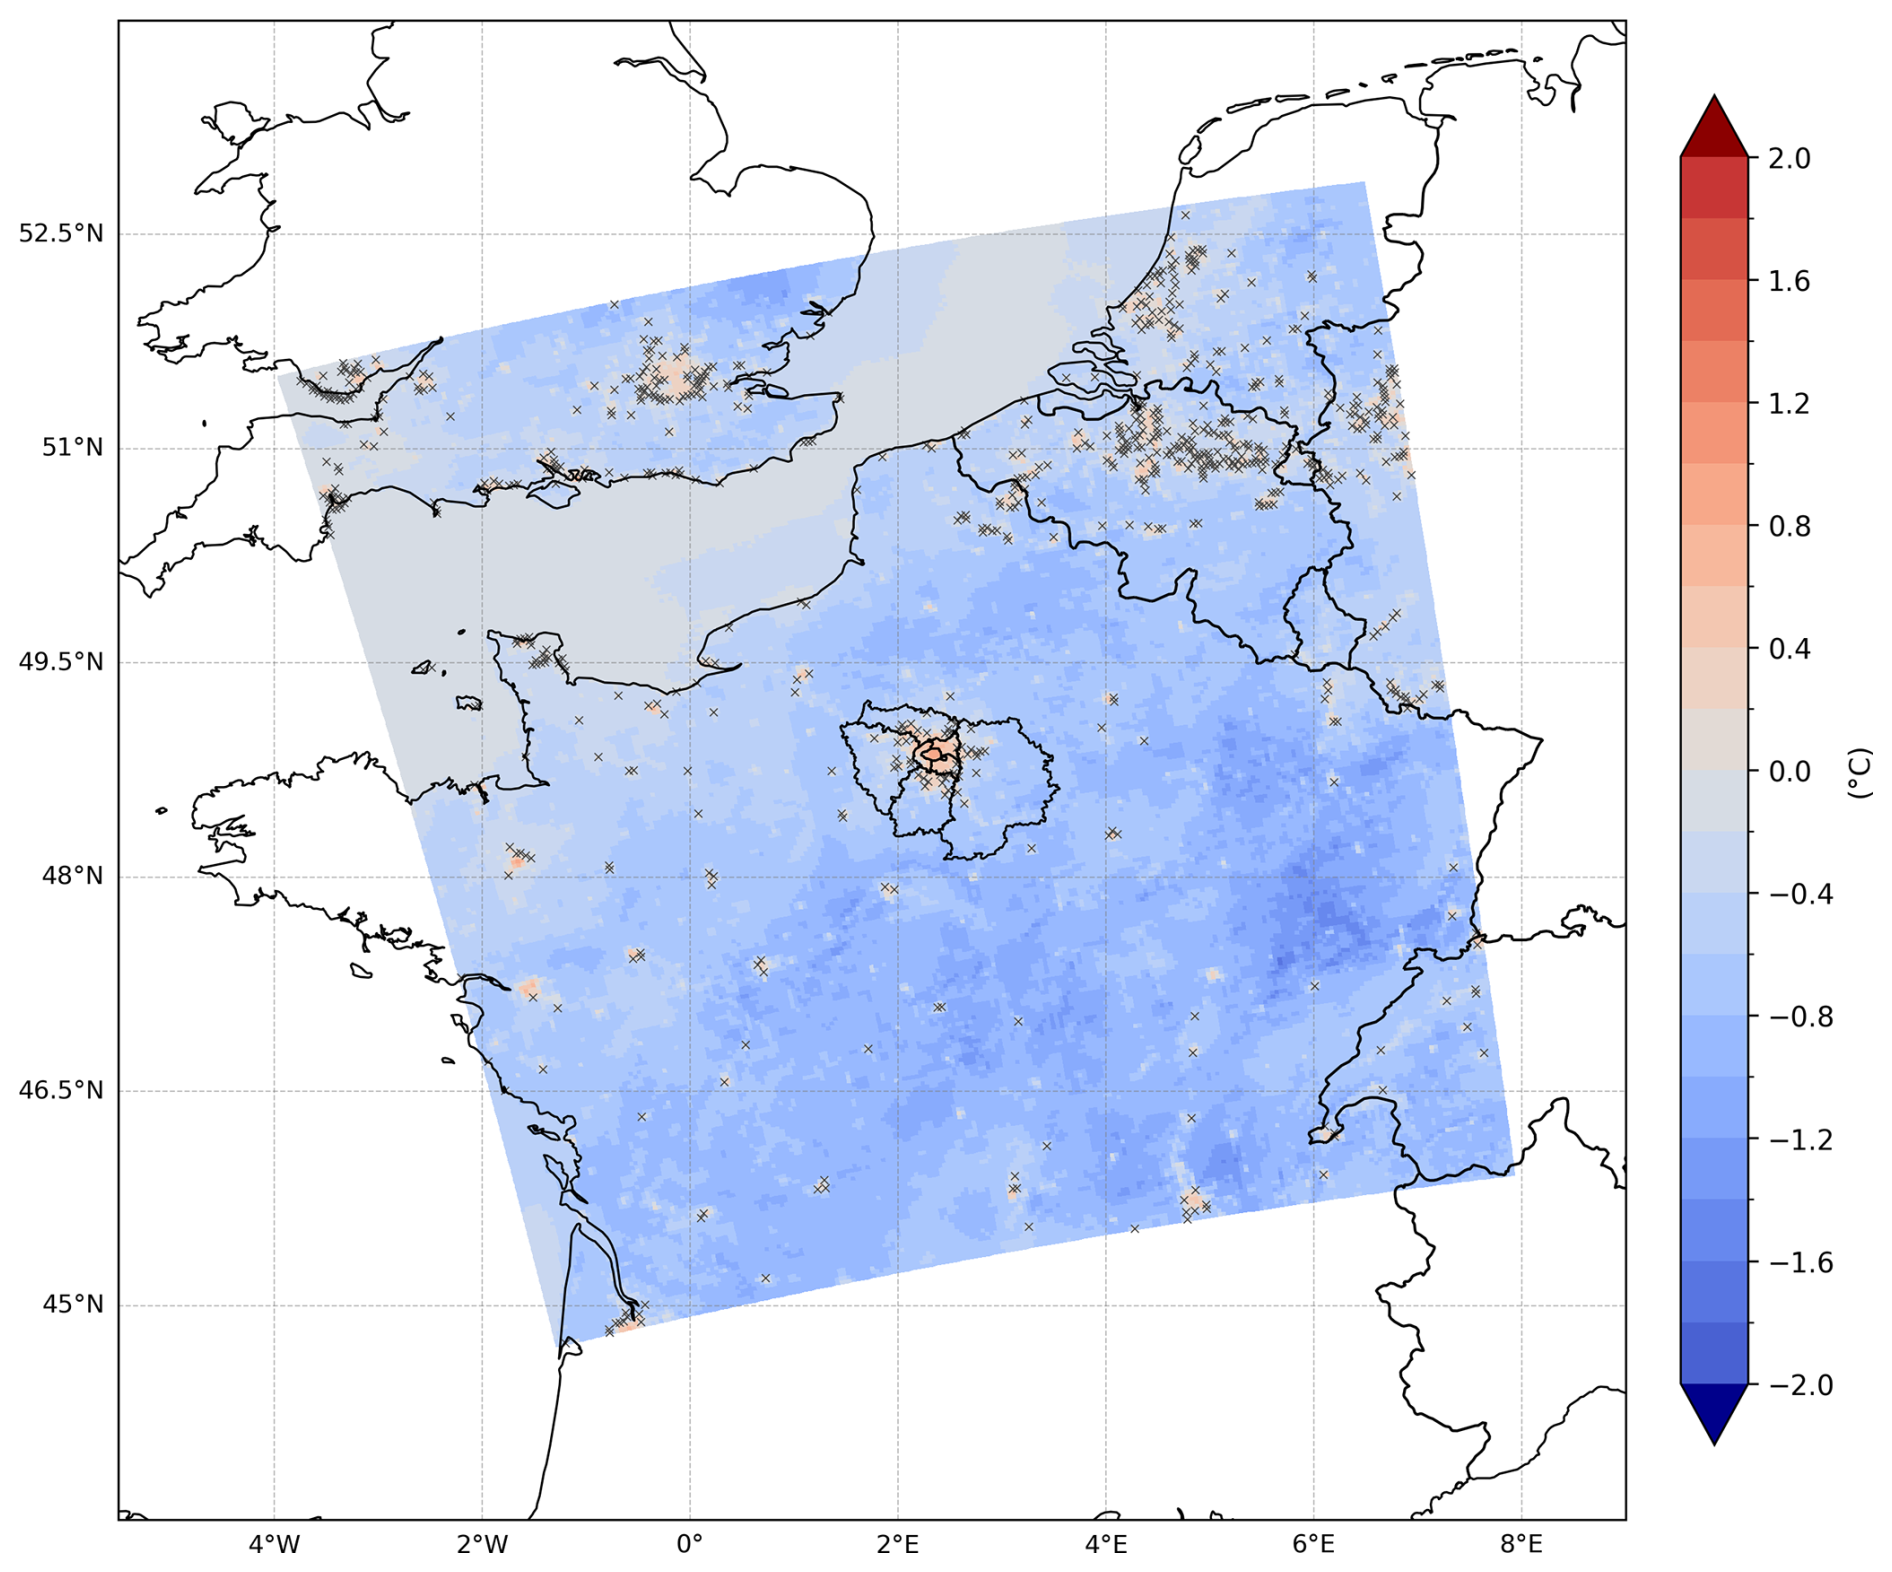
Figure 13Summer-mean differences in 2 m air temperature between PAR and CTRL. Crosses indicate grid cells where the difference is not statistically significant at the 5 % level (p≥0.05), according to a two-sided t-test applied to hourly values for the whole summer. The administrative departments of Île-de-France are also depicted.
3.4 Urban Heat Island representation
One of the main objectives of urban parameterizations implemented in numerical regional climate models is to accurately represent the UHI phenomenon, i.e. the temperature contrast between temperature in urban and non-urban areas. The UHI for each simulation is calculated as the difference between urban and rural temperatures, using minimum temperatures for nighttime-UHI and maximum temperatures for daytime-UHI. In both cases, the mean temperature of the grid cells within the rural mask (207 in total) is used as a reference, and temperature anomalies for all grid cells – both urban and rural – are computed relative to this value. In this way, the anomalies within the rural mask average to zero, while those within the urban mask average to the mean urban heat island intensity (UHII). The urban mask contains 109 grid cells. Figure 14 shows the daily nocturnal (left) and diurnal (right) UHII for August 2020 for BULK (top), CTRL (middle) and PAR (bottom). The purple shaded areas represent the values for all grid cells of the urban mask, indicating the range of UHII variability relative to the average rural temperature. The average UHII is also indicated in the plot (thick purple line). The green shaded areas indicate values for all grid cells of the rural mask, averaging to zero (thick green line). We also calculate the observed UHII comparing the mean temperature of the stations lying within the urban mask to that of the stations in the rural mask (dashed line) as a qualitative comparison (Langendijk et al., 2025). The mean observed rural temperature, albeit different from the mean model rural temperature, is also depicted in Fig. 14 as a line with zero value parallel to the x-axis, since it serves as a reference to the observed UHII.
All simulations are able to represent the nocturnal UHI. In BULK, grid cells within the urban mask show a smaller temperature range than the BEP-BEM simulations, highlighting the lack of urban variability in this approach. Deviations from the averaged UHII (thick red line) are larger in BEP-BEM simulations than in BULK, indicating a stronger model response to the urban heterogeneity introduced by the LCZ classification. The nocturnal UHII in CTRL is strong, like the observed. This can be interpreted as a confirmation of the correctness of the UCM physical process, according to which during night rural areas cool faster than urban areas, while urban areas store large amounts of heat and release it slowly at night. The BULK simulation produces a relatively flat UHII range of approximately 2–3 °C, whereas observations show substantially greater day-to-day variability, ranging from 1 to 5 °C. PAR reproduces well the variability and strength of the observed nocturnal UHII. The diurnal UHII is moderate (1–2 °C) according to observations and appropriately reproduced by the CTRL. With the PAR configuration the diurnal UHII becomes unrealistically strong (2–4 °C), indicating that the urban environment heats up a lot during the day, eventually as a result of the EO-derived urban morphological characteristics (Table 3) and their source-area selection, which is discussed in the following section. The nocturnal and dirunal UHII detected in the three experiments is also displayed spatially in Fig. S5. In general, the daytime UHI is weaker than nocturnal, since solar heating during the day tends to reduce temperature contrasts between rural and urban areas, especially during cloud-free and persistently good weather conditions. At night, due to the lower PBL height, radiative trapping and anthropogenic heating, a stronger UHI can be detected. In this context, the fact that PAR has a larger diurnal UHII than nocturnal indicates a potential overestimation of diurnal UHII. This led to taller buildings,narrower streets and significantly lower albedo values for all LCZs compared to default values inside the WRF lookup table, which potentially enhanced heat retention.
It should furthermore be emphasized that the agreement between modelled and observed UHII on certain days does not necessarily indicate an accurate simulation of the underlying temperature fields. For instance, during the heatwave event, the simulations exhibit a pronounced overestimation of nighttime 2 m air temperature. As a result, the modeled UHII may reproduce the observed intensity while being based on temperatures that are systematically higher than the observed. Nevertheless, urban and rural masks consistently capture the urban-rural temperature contrast, which demonstrates that the masks for grid cell selection are a well suited tool.
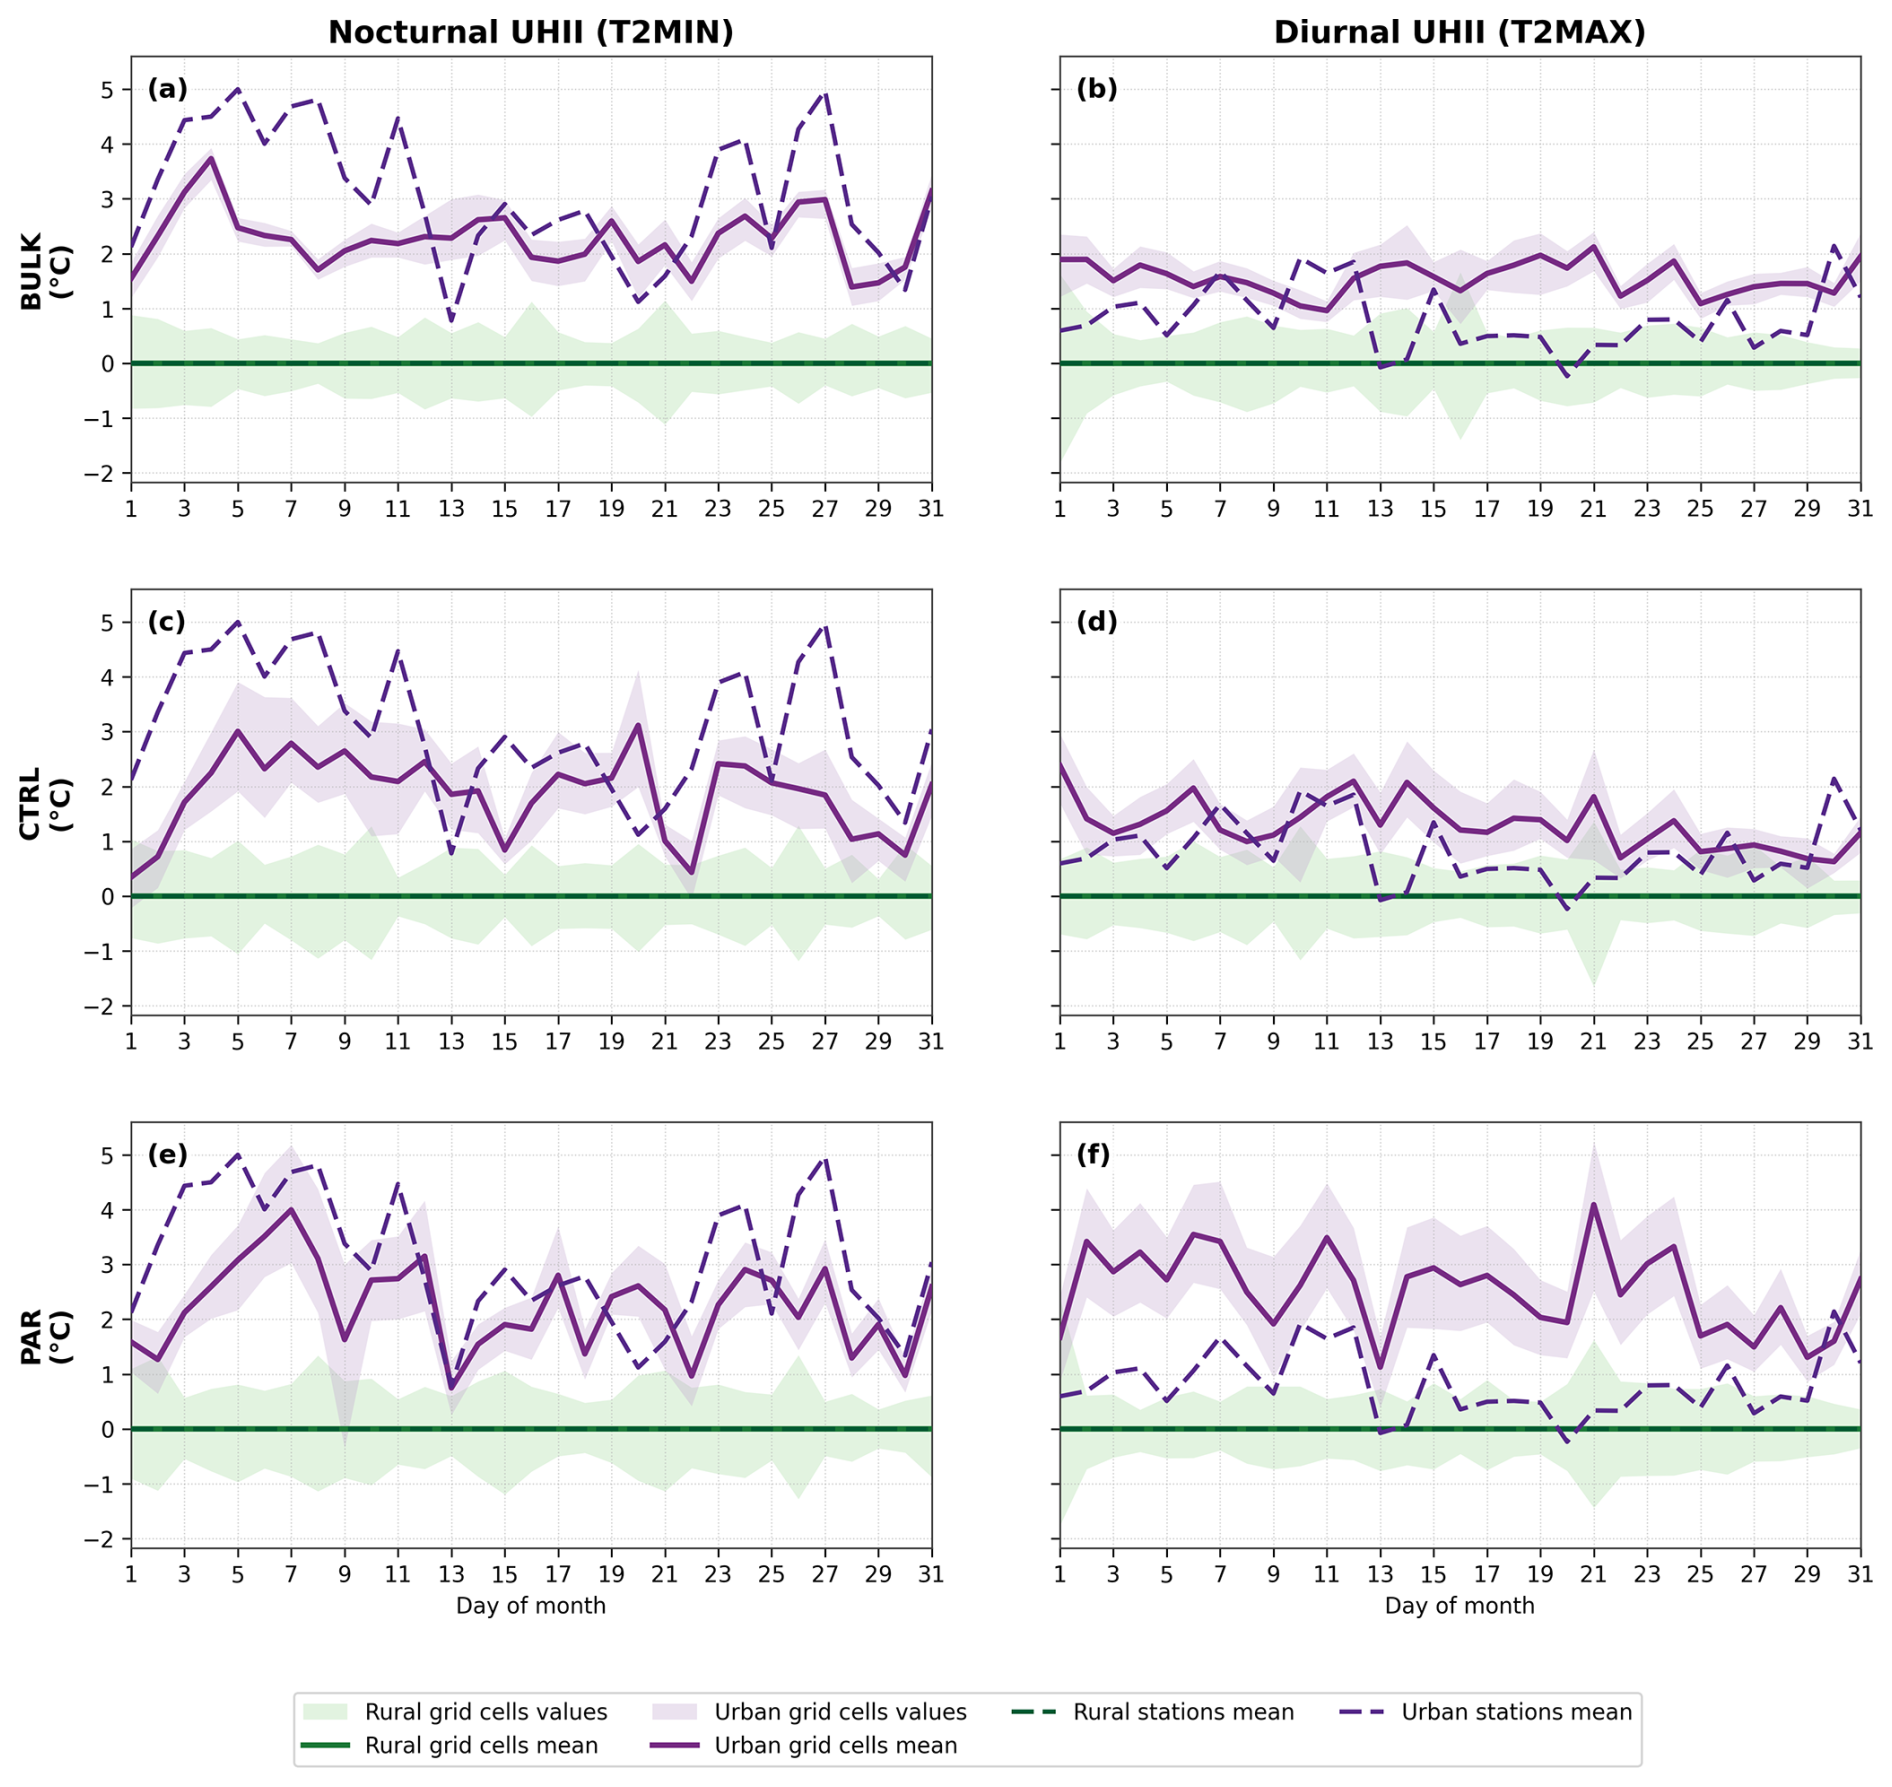
Figure 14Nocturnal (left column) and diurnal (right column) UHII for August 2020, seen by BULK (a, b); CTRL (c, d) and PAR (e, f). Dashed line indicates the observed urban heat island from the stations located within the two masks.
The present study investigates the impact of the BEP-BEM UCM implemented within WRF on temperatures and UHI representation of the greater Paris area. We performed three simulations: (a) BULK, which is the most simplistic approach of the urban environment representation within WRF, as no UCM is switched on and the urban areas are represented as one land use category (b) CTRL, in which the most complex multilayer UCM is switched on with the default WRF urban canopy parameters (as of version 4.6.0) and urban areas are represented by the urban LCZ classes and (c) PAR, which used the same setting as CTRL, but with Paris-tailored urban canopy parameters, based on high-resolution EO data. The analysis covers the time period from June to August 2020, a heatwave event during August and is compared to available observations from the RADOME network.
Over urban areas, the BULK configuration shows a persistent warm bias. During the whole summer period, the warm bias is mitigated when the BEP-BEM UCM is activated. The JJA daytime bias for the BULK simulation is 1.95 °C and it is reduced to 1.02 °C in CTRL. The PAR configuration produces more urban heat than CTRL, adding to the overall CTRL warm daytime bias (1.53 °C). Nighttime warm biases are consistently higher than daytime biases in BULK and are slightly decreased with the coupled BEP-BEM UCM (decreased by 0.07 °C for CTRL) and further decreased by 0.22 °C for the PAR configuration. To better assess how the degree of urbanization introduced in the model affects temperature, we conduct an LCZ-based analysis. In both BEP-BEM simulations a warmer environment is produced at the most urbanized zones (LCZ2 and LCZ5). During the heatwave event of August 2020 in Paris the warm biases become more severe. Implementation of the Paris-tailored UCPs in WRF results in even higher warm biases and RMSE values over all LCZs and urban stations, when compared to CTRL.
The pronounced daytime warm biases noticed in PAR both in summer and the heatwave can be attributed to the combined effects of the systematically lower albedo values and altered urban morphology. Compared to the default WRF UCPs implemented in CTRL, the EO-derived dataset reduces the albedo in every LCZ class, with the strongest reductions for building walls, followed by roofs and roads (Table 3). Furthermore, buildings – except LCZ8 and LCZ9 classes – are represented wider (Fig. S1), while height distributions in PAR (Fig. S2) point towards taller buildings. These modifications potentially lead to higher temperatures due to the increase of solar energy absorption, especially during clear sky conditions occurring on a heatwave event, while also promoting a more intense radiation trapping within street canyons.
At the non-urban areas, the PAR configuration has the most distinct performance compared to the other two simulations, and achieves the best overall performance with the lowest RMSE both in day and night, during the summer months. It also keeps daytime bias lower (−0.26 °C), reduces the nighttime bias to 1.62 °C and the temporal correlation is the highest (0.91). When the heatwave of Augst 2020 is investigated, the same results hold true: RMSE, bias and temporal correlation are best for the PAR simulation over the non-urban areas. Hence, while PAR exhibited lower errors at non-urban areas, this improvement is unlikely to be attributed to the implementation of the EO-derived UCPs. On the contrary, it may arise from internal model variability, alongside a model sensitivity to the modifications made in UCPs, which may have contributed to increased cloudiness.
Investigation of the UHII provides information about the temperature contrasts between the urban and non-urban areas. In general, the nocturnal UHI as a phenomenon is stronger than the daytime UHI, because during nighttime urban regions release the heat stored during the day, anthropogenic heat may be additionally added, while rural areas cool faster, thus amplifying the temperature contrast between urban vs rural areas. Indeed, the nocturnal UHII in CTRL is strong and similar to the observed (RADOME). This can be interpreted as a confirmation of the correct representation of the physical process within the urban canopy, according to which during night rural areas cool faster than urban areas, while urban areas store large amounts of heat and release it slowly at night. PAR reproduces the strong nocturnal UHII better, indicating an improved representation of the contrast between urban and non-urban nighttime environments. The diurnal UHII is moderate according to observations (1–2 °C) and appropriately reproduced by the CTRL simulation. For the PAR configuration, the diurnal UHII becomes unrealistically strong (2–4 °C), indicating that there is too much heat trapped in the urbanized zones of the city, while non-urban regions remain cooler during daytime. The BULK configuration underestimates the UHI effect, as it poorly discriminates urban vs rural environments.
Our overall conclusion on the behavior of the coupled BEP-BEM UCM is that it improves model performance. The additional configuration with UCPs tailored for Paris region (PAR) improves specific aspects of the model performance (like nighttime temperatures over non-urban areas), without being consistently better than the CTRL configuration, or systematically worse. Both BEP-BEM configurations replicate in a more accurate and realistic way the urban temperature spatial patterns in comparison to the BULK simulation, which represents the city as a homogenous space. The performance of the PAR simulation depends very much on the way that EO data has been implemented into the WRF model. As a result, while the PAR configuration had the more detailed representation for Paris region, the UCPs tailored for this area are based only from a fraction of the wider area of Paris city, specifically from the core of the city (see Fig. 3). This potentially led to misrepresentations of parameters such as albedo and emissivity as long as the morphological ones, whose values are expected to be altered in the vicinity of the city center, but were universally applied to the whole area. For instance, inside the area from where the UCPs for PAR simulation are tailored, LCZ2 urban grid cells do not extend beyond, but LCZ5, LCZ6 and LCZ8 can be found also in a wider area from the one mentioned. Thus, the three latter LCZs obtained values that were representative to the department of Paris and its three adjacent departments, potentially “widening” the city's center core characteristics further beyond and leading to such overestimations. Additionally, because LCZ6 and LCZ8 have the biggest coverage of all LCZs in Paris region (see Tables S3 and S4), plus that PAR exhibits higher buildings in these classes than CTRL (see Fig. S1), an exaggeration of heat accumulation in Paris' center core may take place in PAR simulation compared to CTRL. Indeed, the LCZ-based evaluation analysis indicates that the warmest biases appear in the most urbanized zone (compact high-rise) and are close to zero to the less urbanized environment (large lowrise).
The main recommendations arising from this study can be summarized as follows:
-
Activation of the UCM in WRF is highly recommended for numerical studies, particularly if the added computational cost (25 % compared to BULK simulation) can be afforded. The official CMIP6/EURO-CORDEX WRF configuration (WRF451Q in the Balanced Ensemble Design) (Sobolowski et al., 2025) is based on the urban option BULK, which captures some aspects of the urban climate (Langendijk et al., 2025); however, its representation remains less accurate than more advanced urban schemes.
-
Improved representation of urban, green, and blue spaces using urban EO data from European datasets (e.g., Copernicus) is expected to significantly enhance city-scale simulations, contingent upon parallel advancements in UCM capabilities. The EO-based city tailored information should cover the wider city area (not just the city core) to address properly all distinct urban characteristics. Ideally, the creation of a gridded dataset applicable in WRF in convection-permitting resolutions, with the morphological characteristics not only for the area of interest, but for every city in the globe, would lead to a more accurate urban representation of the whole domain.
The results of this study have some limitations. In particular, the analysis period (JJA 2020) is relatively short for climate-scale assessments. Despite this limitation, the consistency of the results supports their reliability for assessing the usefulness of BEP-BEM and its configuration within WRF. The impact of urban anthropogenic heat was not explicitly investigated in this study. The WRF default configuration assumes a continuous 24 h operation of air-conditioning systems for all LCZ classes, which may further contribute to the overproduction of urban heat in the present simulations. Future studies should revisit this assumption by incorporating more realistic diurnal profiles of anthropogenic heat emissions, ideally derived from national statistics on air-conditioning usage.
The run folder of WRF v4.5.1 model with the modified UCP lookup table (under the name URBPARM_LCZ_Paris.TBL) and the observational data from the Météo-France RADOME network used for validation are available at https://doi.org/10.5281/zenodo.19253784 (Kyriakidis et al., 2026).
The supplement related to this article is available online at https://doi.org/10.5194/gmd-19-8709-2026-supplement.
This study was conceptualized by EK and VP. The methodology was made by IK, VP, JM, EK, while software, analysis and validation was conducted by IK and MG. VP, IK and ZM took part in the research investigation, while EK, VP, JF and NC supervised the study. Visualisation was made by IK. VP and IK ran the model, while IK wrote the paper with contributions from all authors.
The contact author has declared that none of the authors has any competing interests.
Publisher's note: Copernicus Publications remains neutral with regard to jurisdictional claims made in the text, published maps, institutional affiliations, or any other geographical representation in this paper. The authors bear the ultimate responsibility for providing appropriate place names. Views expressed in the text are those of the authors and do not necessarily reflect the views of the publisher.
The authors would like to acknowledge the CORDEX-Flagship Pilot Study on “Urban environment and Regional Climate Change” (URB-RCC) for providing the framework of the regional urban climate simulations. We also acknowledge Météo-France for providing the standard meteorological variables used in this study, and the French national center for Atmospheric data and services AERIS for granting access to the data. This work was supported by computational time granted from the National Infrastructures for Research and Technology S.A. (GRNET S.A.) in the National HPC facility – ARIS – under project ID pr017036_thin – “FPS-urban Testing phase”. Results presented in this work have been also produced using the AUTH Compute Infrastructure and Resources. JM acknowledges funding by the Ministry for the Ecological Transition and the Demographic Challenge (MITECO) and the European Commission NextGenerationEU (Regulation EU 2020/2094), through CSIC's Interdisciplinary Thematic Platform Clima (PTI-Clima).
This study is part of the research project UpClim, which was implemented in the framework of Hellenic Foundation for Research and Innovation called “Basic Research Financing (Horizontal Support of All Sciences)” under the National Recovery and Resilience Plan “Greece 2.0”, funded by the European Union-NextGenerationEU (H.F.R.I. Project Number: 14696).
This paper was edited by Juan Antonio Añel and reviewed by two anonymous referees.
Barlage, M., Tewari, M., Chen, F., Miguez-Macho, G., Yang, Z. L., and Niu, G. Y.: The effect of groundwater interaction in North American regional climate simulations with WRF/Noah-MP, Climatic Change, 129, 485–498, https://doi.org/10.1007/s10584-014-1308-8, 2015.
Bassett, R., Young, P. J., Blair, G. S., Samreen, F., and Simm, W.: A Large Ensemble Approach to Quantifying Internal Model Variability Within the WRF Numerical Model, J. Geophys. Res.-Atmos., 125, https://doi.org/10.1029/2019JD031286, 2020.
Bougeault, P. and Lacarrere, P.: Parameterization of Orography-Induced Turbulence in a Mesobeta–Scale Model, Mon. Weather Rev., https://doi.org/10.1175/1520-0493(1989)117%3C1872:POOITI%3E2.0.CO;2, 1989.
Britter, R. E. and Hanna, S. R.: Flow and dispersion in urban areas, Annu. Rev. Fluid Mech., 35, 469–496, https://doi.org/10.1146/annurev.fluid.35.101101.161147, 2003.
Brousse, O., Martilli, A., Foley, M., Mills, G., and Bechtel, B.: WUDAPT, an efficient land use producing data tool for mesoscale models? Integration of urban LCZ in WRF over Madrid, Urban Clim., 17, 116–134, https://doi.org/10.1016/j.uclim.2016.04.001, 2016.
Chen, F., Kusaka, H., Bornstein, R., Ching, J., Grimmond, C. S. B., Grossman-Clarke, S., Loridan, T., Manning, K. W., Martilli, A., Miao, S., Sailor, D., Salamanca, F. P., Taha, H., Tewari, M., Wang, X., Wyszogrodzki, A. A., and Zhang, C.: The integrated WRF/urban modelling system: Development, evaluation, and applications to urban environmental problems, Int. J. Climatol., 31, 273–288, https://doi.org/10.1002/joc.2158, 2011.
Chen, F., Barlage, M., Tewari, M., Rasmussen, R., Jin, J., Lettenmaier, D., Livneh, B., Lin, C., Miguez-Macho, G., Niu, G. Y., Wen, L., and Yang, Z. L.: Modeling seasonal snowpack evolution in the complex terrain and forested colorado headwaters region: A model intercomparison study, J. Geophys. Res., 119, 13795–13819, https://doi.org/10.1002/2014JD022167, 2014.
Chen, L., Li, Y., Chen, F., Barr, A., Barlage, M., and Wan, B.: The incorporation of an organic soil layer in the Noah-MP land surface model and its evaluation over a boreal aspen forest, Atmos. Chem. Phys., 16, 8375–8387, https://doi.org/10.5194/acp-16-8375-2016, 2016.
Ching, J., Mills, G., Bechtel, B., See, L., Feddema, J., Wang, X., Ren, C., Brorousse, O., Martilli, A., Neophytou, M., Mouzourides, P., Stewart, I., Hanna, A., Ng, E., Foley, M., Alexander, P., Aliaga, D., Niyogi, D., Shreevastava, A., Bhalachandran, P., Masson, V., Hidalgo, J., Fung, J., Andrade, M., Baklanov, A., Dai, W., Milcinski, G., Demuzere, M., Brunsell, N., Pesaresi, M., Miao, S., Mu, Q., Chen, F., and Theeuwesits, N.: WUDAPT: An urban weather, climate, and environmental modeling infrastructure for the anthropocene, B. Am. Meteorol. Soc., 99, 1907–1924, https://doi.org/10.1175/BAMS-D-16-0236.1, 2018.
Demuzere, M., Kittner, J., Martilli, A., Mills, G., Moede, C., Stewart, I. D., van Vliet, J., and Bechtel, B.: A global map of local climate zones to support earth system modelling and urban-scale environmental science, Earth Syst. Sci. Data, 14, 3835–3873, https://doi.org/10.5194/essd-14-3835-2022, 2022a.
Demuzere, M., Argüeso, D., Zonato, A., and Kittner, J.: W2W: A Python package that injects WUDAPT's Local Climate Zone information in WRF, J. Open Source Softw., 7, 4432, https://doi.org/10.21105/joss.04432, 2022b.
Diez-Sierra, J., Quintana, Y., Langendijk, G. S., Milovac, J., Demuzere, M., Nogherotto, R., Pietikäinen, J. P., Rechid, D., Zazulie, N., Solman, S. A., and Fernández, J.: A global CORDEX-based dataset delineating urban areas and their surroundings to assess climate change in megacities, Sci. Data, 12, https://doi.org/10.1038/s41597-025-06257-1, 2025.
Earth Resources Observation and Science (EROS) Center: ASTER GED, Collection 2, U.S. Geological Survey [data set], https://doi.org/10.5066/P9ZQJ30Q, 2021.
European Environment Agency: Urban Atlas Building Height 2012 (raster 10 m), Europe, European Environment Agency [data set], https://doi.org/10.2909/42690e05-edf4-43fc-8020-33e130f62023, 2022.
Florczyk, A. J., Melchiorri, M., Corbane, C., Schiavina, M., Maffenini, M., Pesaresi, M., Politis, P., Sabo, S., Freire, S., Ehrlich, D., Kemper, T., Tommasi, P., Airaghi, D., and Zanchetta, L.: Description of the GHS Urban Centre Database, https://doi.org/10.2760/037310, 2015.
Gao, Y., Li, K., Chen, F., Jiang, Y., and Lu, C.: Assessing and improving Noah-MP land model simulations for the central Tibetan plateau, J. Geophys. Res., 120, 9258–9278, https://doi.org/10.1002/2015JD023404, 2015.
Garioud, A.: Artificial intelligence for country-scale land cover description, EGU General Assembly 2024, Vienna, Austria, 14–19 Apr 2024, EGU24-6477, https://doi.org/10.5194/egusphere-egu24-6477, 2024.
Hang, J., Zeng, L., Li, X., and Wang, D.: Evaluation of a single-layer urban energy balance model using measured energy fluxes by scaled outdoor experiments in humid subtropical climate, Build. Environ., 254, https://doi.org/10.1016/j.buildenv.2024.111364, 2024.
Hawkins, T. W., Brazel, A. J., Stefanov, W. L., Bigler, W., and Saffell, E. M.: The Role of Rural Variability in Urban Heat Island Determination for Phoenix, Arizona, J. Atmos. Meteorol. Clim., https://doi.org/10.1175/1520-0450(2004)043<0476:TRORVI>2.0.CO;2, 2003.
Hersbach, H., Bell, B., Berrisford, P., Hirahara, S., Horányi, A., Muñoz-Sabater, J., Nicolas, J., Peubey, C., Radu, R., Schepers, D., Simmons, A., Soci, C., Abdalla, S., Abellan, X., Balsamo, G., Bechtold, P., Biavati, G., Bidlot, J., Bonavita, M., De Chiara, G., Dahlgren, P., Dee, D., Diamantakis, M., Dragani, R., Flemming, J., Forbes, R., Fuentes, M., Geer, A., Haimberger, L., Healy, S., Hogan, R. J., Hólm, E., Janisková, M., Keeley, S., Laloyaux, P., Lopez, P., Lupu, C., Radnoti, G., de Rosnay, P., Rozum, I., Vamborg, F., Villaume, S., and Thépaut, J. N.: The ERA5 global reanalysis, Q. J. Roy. Meteor. Soc., 146, 1999–2049, https://doi.org/10.1002/qj.3803, 2020.
Hoffmann, P., Reinhart, V., Rechid, D., De Noblet-Ducoudré, N., Davin, E. L., Asmus, C., Bechtel, B., Böhner, J., Katragkou, E., and Luyssaert, S.: High-resolution land use and land cover dataset for regional climate modelling: Historical and future changes in Europe, Earth Syst. Sci. Data, 15, 3819–3852, https://doi.org/10.5194/essd-15-3819-2023, 2023.
Hong, S. Y. and Jang, J.: Impacts of Shallow Convection Processes on a Simulated Boreal Summer Climatology in a Global Atmospheric Model, Asia. Pac. J. Atmos. Sci., 54, 361–370, https://doi.org/10.1007/s13143-018-0013-3, 2018.
Iacono, M. J., Delamere, J. S., Mlawer, E. J., Shephard, M. W., Clough, S. A., and Collins, W. D.: Radiative forcing by long-lived greenhouse gases: Calculations with the AER radiative transfer models, J. Geophys. Res.-Atmos., 113, https://doi.org/10.1029/2008JD009944, 2008.
Jacob, D., Teichmann, C., Sobolowski, S., Katragkou, E., Anders, I., Belda, M., Benestad, R., Boberg, F., Buonomo, E., Cardoso, R. M., Casanueva, A., Christensen, O. B., Christensen, J. H., Coppola, E., De Cruz, L., Davin, E. L., Dobler, A., Domínguez, M., Fealy, R., Fernandez, J., Gaertner, M. A., García-Díez, M., Giorgi, F., Gobiet, A., Goergen, K., Gómez-Navarro, J. J., Alemán, J. J. G., Gutiérrez, C., Gutiérrez, J. M., Güttler, I., Haensler, A., Halenka, T., Jerez, S., Jiménez-Guerrero, P., Jones, R. G., Keuler, K., Kjellström, E., Knist, S., Kotlarski, S., Maraun, D., van Meijgaard, E., Mercogliano, P., Montávez, J. P., Navarra, A., Nikulin, G., de Noblet-Ducoudré, N., Panitz, H. J., Pfeifer, S., Piazza, M., Pichelli, E., Pietikäinen, J. P., Prein, A. F., Preuschmann, S., Rechid, D., Rockel, B., Romera, R., Sánchez, E., Sieck, K., Soares, P. M. M., Somot, S., Srnec, L., Sørland, S. L., Termonia, P., Truhetz, H., Vautard, R., Warrach-Sagi, K., and Wulfmeyer, V.: Regional climate downscaling over Europe: perspectives from the EURO-CORDEX community, Reg. Environ. Change, 20, https://doi.org/10.1007/s10113-020-01606-9, 2020.
Kain, J.: The Kain–Fritsch Convective Parameterization: An Update, J. Appl. Meteorol., 43, 170–181, https://doi.org/10.1175/1520-0450(2004)043<0170:TKCPAU>2.0.CO;2, 2004.
Katragkou, E., Sobolowski, S. P., Teichmann, C., Solmon, F., Pavlidis, V., Rechid, D., Hoffmann, P., Fernandez, J., Nikulin, G., and Jacob, D.: Delivering an Improved Framework for the New Generation of CMIP6-Driven EURO-CORDEX Regional Climate Simulations, B. Am. Meteorol. Soc., 105, E962–E974, https://doi.org/10.1175/BAMS-D-23-0131.1, 2024.
Kusaka, H. and Kimura, F.: Coupling a Single-Layer Urban Canopy Model with a Simple Atmospheric Model: Impact on Urban Heat Island Simulation for an Idealized Case, J. Meteorol. Soc. Jpn. Ser. II, 82, 67–80, https://doi.org/10.2151/jmsj.82.67, 2004.
Kusaka, H., Kondo, H., Kikegawa, Y., and Kimura, F.: A Simple Single-Layer Urban Canopy Model For Atmospheric Models: Comparison With Multi-Layer And Slab Models, Bound.-Lay. Meteorol., 101, 329–358, https://doi.org/10.1023/A:1019207923078, 2001.
Kyriakidis, I., Pavlidis, V., Gkolemi, M., Mitraka, Z., Chrysoulakis, N., Milovac, J., Fernández, J., and Katragkou, E.: A new Earth Observation–based WRF configuration for urban regional climate simulations over Paris, Zenodo [code and data set], https://doi.org/10.5281/zenodo.19253784, 2026.
Langendijk, G. S., Halenka, T., Hoffmann, P., Adinolfi, M., Aldama Campino, A., Asselin, O., Bastin, S., Bechtel, B., Belda, M., Bushenkova, A., Campanale, A., Chun, K. P., Constantinidou, K., Coppola, E., Demuzere, M., Doan, Q. Van, Evans, J., Feldmann, H., Fernandez, J., Fita, L., Hadjinicolaou, P., Hamdi, R., Hundhausen, M., Grawe, D., Johannsen, F., Milovac, J., Katragkou, E., Kerroumi, N. E. I., Kotlarski, S., Le Roy, B., Lemonsu, A., Lennard, C., Lipson, M., Mandal, S., Muñoz Pabón, L. E., Pavlidis, V., Pietikäinen, J. P., Raffa, M., Raluy-López, E., Rechid, D., Rui, I., Schulz, J. P., Soares, P. M. M., Takane, Y., Teichmann, C., Thatcher, M., Top, S., Van Schaeybroeck, B., Wang, F., and Yuan, J.: Towards better understanding the urban environment and its interactions with regional climate change – The WCRP CORDEX Flagship Pilot Study URB-RCC, Urban Clim., 58, https://doi.org/10.1016/j.uclim.2024.102165, 2024.
Langendijk, G. S., Fernandez, J., Demuzere, M., Diez-Sierra, J., Quintana, Y., Fita, L., Zazulie, N., Nogherotto, R., Carril, A. F., Chun, K. P., Giuliani, G., Halenka, T., Hoffmann, P., Muñoz, L. E., Pietikäinen, J.-P., Rechid, D., and Yuan, J.: Representation of global mega-cities and their urban heat island in CORDEX-CORE regional climate model simulations, npj Urban Sustainability, https://doi.org/10.1038/s42949-025-00325-6, 2025.
Liu, Y., Chen, F., Warner, T., and Basara, J.: Verification of a Mesoscale Data-Assimilation and Forecasting System for the Oklahoma City Area during the Joint Urban 2003 Field Project, J. Appl. Meteorol. Climatol., 45, 912–929, https://doi.org/10.1175/JAM2383.1, 2006.
Martilli, A., Clappier, A., and Rotach, M. W.: An Urban Surface Exchange Parameterisation for Mesoscale Models, Bound.-Lay. Meteorol., 104, 261–304, https://doi.org/10.1023/A:1016099921195, 2002.
Martilli, A., Brousse, O., and Ching, J.: Urbanized WRF modeling using WUDAPT, https://doi.org/10.13140/RG.2.1.3405.2724, 2016.
Niu, G. Y., Yang, Z. L., Mitchell, K. E., Chen, F., Ek, M. B., Barlage, M., Kumar, A., Manning, K., Niyogi, D., Rosero, E., Tewari, M., and Xia, Y.: The community Noah land surface model with multiparameterization options (Noah-MP): 1. Model description and evaluation with local-scale measurements, J. Geophys. Res.-Atmos., 116, https://doi.org/10.1029/2010JD015139, 2011.
Reinhart, V., Hoffmann, P., Rechid, D., Böhner, J., and Bechtel, B.: High-resolution land use and land cover dataset for regional climate modelling: a plant functional type map for Europe 2015, Earth Syst. Sci. Data, 14, 1735–1794, https://doi.org/10.5194/essd-14-1735-2022, 2022.
Roujean, J. L., Leon-Tavares, J., Smets, B., Claes, P., Camacho De Coca, F., and Sanchez-Zapero, J.: Surface albedo and toc-r 300 m products from PROBA-V instrument in the framework of Copernicus Global Land Service, Remote Sens. Environ., 215, 57–73, https://doi.org/10.1016/j.rse.2018.05.015, 2018.
Salamanca, F. and Martilli, A.: A new Building Energy Model coupled with an Urban Canopy Parameterization for urban climate simulations-part II. Validation with one dimension off-line simulations, Theor. Appl. Climatol., 99, 345–356, https://doi.org/10.1007/s00704-009-0143-8, 2010.
Salamanca, F., Krpo, A., Martilli, A., and Clappier, A.: A new building energy model coupled with an urban canopy parameterization for urban climate simulations-part I. formulation, verification, and sensitivity analysis of the model, Theor. Appl. Climatol., 99, 331–344, https://doi.org/10.1007/s00704-009-0142-9, 2010.
Segura, R., Badia, A., Ventura, S., Gilabert, J., Martilli, A., and Villalba, G.: Sensitivity study of PBL schemes and soil initialization using the WRF-BEP-BEM model over a Mediterranean coastal city, Urban Clim., 39, https://doi.org/10.1016/j.uclim.2021.100982, 2021.
Skamarock, W. C., Klemp, J. B., Dudhia, J., Gill, D. O., Liu, Z., Berner, J., Wang, W., Powers, J. G., Duda, M. G., Barker, D. M., and Huang, X.-Y.: A Description of the Advanced Research WRF Model Version 4, Boulder, CO, USA, https://doi.org/10.5065/1dfh-6p97, 2021.
Sobolowski, S., Somot, S., Fernandez, J., Evin, G., Brands, S., Maraun, D., Kotlarski, S., Jury, M., Benestad, R. E., Teichmann, C., Christensen, O. B., Bülow, K., Buonomo, E., Katragkou, E., Steger, C., Sørland, S., Nikulin, G., McSweeney, C., Dobler, A., Palmer, T., Wilcke, R., Boé, J., Brunner, L., Ribes, A., Qasmi, S., Nabat, P., Sevault, F., and Oudar, T.: GCM Selection and Ensemble Design: Best Practices and Recommendations from the EURO-CORDEX Community, B. Am. Meteorol. Soc., 106, E1834–E1850, https://doi.org/10.1175/BAMS-D-23-0189.1, 2025.
Stewart, I. D. and Oke, T. R.: Local climate zones for urban temperature studies, B. Am. Meteorol. Soc., 93, 1879–1900, https://doi.org/10.1175/BAMS-D-11-00019.1, 2012.
Tewari, M., Chen, F., Wang, W., Dudhia, J., LeMone, M. A., Mitchell, K. E., Ek, M. B., Gayno, G., Wegiel, J. W., and Cuenca, R. H.: Implementation and verification of the unified Noah land surface model in the WRF model, in: Proceedings of the 20th Conference on Weather Analysis and Forecasting/16th Conference on Numerical Weather Prediction, Seattle, Washington, USA, 11–15 January 2004, American Meteorological Society, paper 14.2a, 2004.
Thompson, G., Rasmussen, R. M., and Manning, K.: Explicit Forecasts of Winter Precipitation Using an Improved Bulk Microphysics Scheme. Part I: Description and Sensitivity Analysis, Mon. Weather Rev., https://doi.org/10.1175/1520-0493(2004)132<0519:EFOWPU>2.0.CO;2, 2004.
Thompson, G., Field, P. R., Rasmussen, R. M., and Hall, W. D.: Explicit forecasts of winter precipitation using an improved bulk microphysics scheme. Part II: Implementation of a new snow parameterization, Mon. Weather Rev., 136, 5095–5115, https://doi.org/10.1175/2008MWR2387.1, 2008.
United Nations: World Urbanization Prospects 2025 Summary of Results, ISBN: 9789211544589, eISBN: 9789211576788, 2025.
Yang, Z. L., Niu, G. Y., Mitchell, K. E., Chen, F., Ek, M. B., Barlage, M., Longuevergne, L., Manning, K., Niyogi, D., Tewari, M., and Xia, Y.: The community Noah land surface model with multiparameterization options (Noah-MP): 2. Evaluation over global river basins, J. Geophys. Res.-Atmos., 116, https://doi.org/10.1029/2010JD015140, 2011.