
the Creative Commons Attribution 4.0 License.
the Creative Commons Attribution 4.0 License.
 | 10 Sep 2026
Integrating ozone–vegetation damage schemes into SSiB4/TRIFFID: evaluation of six parameterizations and refinement of ozone decay process across plant functional types
Lingfeng Li
Bo Qiu

Siwen Zhao
Chaorong Chen
Jiuyi Chen
Yueyang Ni
Xin Huang
Haishan Chen
Weidong Guo
Tropospheric ozone (O3) is a major air pollutant that threatens vegetation productivity and terrestrial ecosystems. Quantifying O3-induced impacts on photosynthesis and stomatal conductance is crucial for understanding biosphere–atmosphere interactions at regional and global scales. In recent decades, several parameterization schemes have been developed to describe the photosynthetic and stomatal responses to O3 exposure. However, substantial discrepancies remain when applying different schemes in various model frameworks. In this study, we integrated six flux-based O3–vegetation damage parameterizations into SSiB4/TRIFFID, a well-established dynamic global vegetation model, to assess the impacts of O3 pollution on vegetation photosynthesis in China during the 2010s. Our results indicate that O3 pollution led to approximately a 21 % reduction in GPP during the 2010s, with discrepancies ranging from 17 %–27 % across different schemes. Comparison of the O3 damage schemes revealed substantial differences in plant O3 sensitivity across schemes and plant functional types (PFTs). When evaluated against observations, the newly developed Li2024 parameterization – which features non-linear response formulations – and the trait-informed approaches based on leaf mass per area (LMA) both reproduce observed O3 sensitivity more closely, as reflected in their consistently smaller biases. This improved performance can be attributed to the inclusion of a broader range of observational and experimental data, as well as key physiological parameters (e.g., LMA) to better capture O3 sensitivity. Furthermore, we found that the implementation of Li2024 scheme in SSiB4/TRIFFID exhibited strong inhibition of photosynthesis in the late growing season due to cumulative O3 exposure. By refining the “decay” process of O3 accumulation using leaf lifespan parameters and applying the “decay” and “healing” processes across all PFTs, we improved the spatial and temporal distribution of gross primary productivity (GPP) simulations. This study highlights the importance of observations and physiological insights in developing O3–vegetation damage parameterizations. Future efforts should focus on expanding observational and experimental data on O3 responses in China's natural ecosystems to enhance O3 damage assessment and model development.
- Article
(5741 KB) - Full-text XML
-
Supplement
(6460 KB) - BibTeX
- EndNote


Tropospheric ozone (O3) is a secondary air pollutant formed through the photochemical oxidation of carbon monoxide (CO), methane (CH4), volatile organic compounds (VOCs), and nitrogen oxides (NOx) in the presence of sunlight (Wang et al., 2022). As a short-lived climate forcer and a phytotoxic air pollutant, O3 concentrations have risen substantially since pre-industrial times, driven by increasing emissions of its precursors from fossil fuel combustion and industrial activities (Long et al., 2024; Lu et al., 2018; Li et al., 2021). As a result, current tropospheric O3 levels are estimated to be approximately 40 % higher than pre-industrial concentrations in many mid-latitude regions of the Northern Hemisphere (Tarasick et al., 2019; Turnock et al., 2020). In recent decades, rapid economic development and industrialization in China have driven a marked increase in surface O3 concentrations, making China a prominent hotspot for O3 pollution globally (Lu et al., 2018; Li et al., 2021). The elevated surface O3 in China poses severe threats to both public health and terrestrial ecosystems (Ainsworth et al., 2012; Monks et al., 2015; Agathokleous et al., 2020). Given the significant ecological impacts, systematically quantifying the effects of O3 on vegetation in China is essential for understanding its broader impacts on regional carbon uptake and climate change (Liu et al., 2025; Zhou et al., 2024).
Controlled fumigation and field exposure experiments are crucial for advancing our knowledge of O3 effects on vegetation. Observational evidences consistently show that elevated O3 reduces photosynthesis and biomass, with significant variability in plant functional type sensitivity (Wittig et al., 2007; Emberson, 2020; Cheesman et al., 2024). Diffusion of O3 fluxes through stomata triggers the formation of reactive oxygen species (ROS), leading to oxidative stress that damages photosynthetic activity, disrupts stomatal function, accelerates senescence, and reduces plant biomass accumulation (Grulke and Heath, 2020). In response, plants have evolved efficient antioxidant systems to counteract ROS and mitigate oxidative damage through various repair processes (Castagna and Ranieri, 2009; Li et al., 2017). Experimental evidence has provided valuable insights into the impacts of O3 on vegetation. However, much of the existing evidence comes from site-level studies, which is derived from artificially controlled open-top chamber (OTC) experiments rather than natural ambient O3 exposures. Moreover, due to the uncertainties arising from extrapolating beyond experimental conditions, the limited spatial coverage of site observations makes it challenging to accurately assess O3-induced vegetation damage at regional scales (Liu et al., 2024; Cao et al., 2024).
Alternatively, mechanistic parameterizations were proposed and implemented in numerical models as a feasible approach to quantify O3-induced vegetation damage across regional to global scales. Currently, three major flux-based frameworks for O3–vegetation damage have been developed and integrated into dynamic vegetation models (Sitch et al., 2007; Lombardozzi et al., 2015; Ma et al., 2023). Sitch et al. (2007) established a semi-mechanistic scheme (hereafter S2007) to describe the O3 impacts on photosynthesis as a function of instantaneous stomatal O3 flux, and the stomata response is calculated based on the coupling between stomatal conductance and leaf photosynthesis. This scheme was later implemented by Yue and Unger (2014) into the Yale Interactive terrestrial Biosphere (YIBs) model and estimated a 14 % net primary productivity (NPP) loss due to surface O3 pollution in China (Yue et al., 2017). On the other hand, Lombardozzi et al. (2015) proposed a new scheme (hereafter L2015) based on cumulative uptake of O3 (CUO), in which O3 effects on photosynthesis and stomatal conductance are described by independent response functions. Incorporation of L2015 scheme into Community Land Model (CLM) indicated an 8 %–12 % decline in gross primary productivity (GPP) globally, with localized reductions exceeding 20 % over hotspot regions such as eastern United States, western Europe, and eastern China. In addition to the approaches above, Ma et al. (2023) introduced leaf mass per area (LMA) to construct a trait-based O3 damage parameterization within the S2007 framework. The implementation of LMA unifies the representation of area-based plant sensitivities to O3 across global grids, thereby replacing the prescribed PFT-specific O3 sensitivity parameters in previous frameworks with a single, mass-based constant. Using this scheme, Ma et al. (2023) estimated a contemporary global mean reduction of 4.8 % in GPP, with large reductions (>10 %) occurring in the eastern US and eastern China.
Overall, numerous parameterizations have been proposed to quantify the O3-induced vegetation damage in land surface models. However, despite the ongoing advances in O3 damage parameterizations, large inter-scheme discrepancies persist in the simulated vegetation responses. These discrepancies are particularly critical in China, where severe O3 pollution, coupled with the urgent need for effective policy-making to mitigate its effects, highlights the need for accurate simulation of O3-induced vegetation losses. Previous studies using different models and parameterizations have reported a large spread in O3-induced GPP reductions ranging from −4 % to −40 % in China (Yue et al., 2017; Xie et al., 2019; Zhu et al., 2022; Jin et al., 2023; Cao et al., 2024). Such divergence reflects the discrepancies in simulation periods, model framework, and scheme selection, which underscores considerable uncertainties in current evaluations of O3 impacts. Moreover, several recently developed parameterizations have not been comprehensively evaluated in regional simulations over China, including the new O3–vegetation damage scheme in CLM proposed by Li et al. (2024), together with the recalibrated S2007 scheme and the LMA-based approach proposed by Ma et al. (2023). These uncertainties and research gaps underscore the need for long-term, systematic inter-scheme comparisons in O3–vegetation damage simulations. In this study, we address these gaps by conducting an intercomparison of six mechanistic O3 damage parameterizations within the well-established SSiB4/TRIFFID land surface model. Using this unified model framework, we quantify the O3-induced vegetation damage in China through a decade-long simulation of the 2010s. We then assess the inter-scheme discrepancies and evaluate each parameterization against observed dose–response relationships from fumigation experiments in peer-reviewed literature. Finally, we refine the representation of cumulative O3 uptake and update the parameters with trait observations. These modifications alleviate the overestimation of O3 damage and improve the spatial distribution and seasonality of GPP simulations.
2.1 SSiB4/TRIFFID model
The Simplified Simple Biosphere Model version 4 coupled with the Top-down Representation of Interactive Foliage and Flora Including Dynamics Model (SSiB4/TRIFFID) is used in this study to investigate the response of terrestrial ecosystems to stomatal uptake of O3. SSiB4/TRIFFID is a process-based land surface model integrated with dynamic global vegetation model. The model is designed to simulate the energy, water, and carbon cycles at the terrestrial surface, incorporating well-established mechanisms for calculating multi-timescale vegetation dynamics and land surface characteristics including vegetation cover and structure (Zhang et al., 2015; Liu et al., 2019). The photosynthesis and stomatal processes are based on the framework developed by Collatz et al. (1991) and incorporated by Zhan et al. (2003), with a leaf-to-canopy scaling strategy introduced by Sellers et al. (1996). To date, SSiB4/TRIFFID employs 7 plant functional types (PFTs) including evergreen broadleaf forest (EBF), evergreen needleleaf forest (ENF), deciduous broadleaf forest (DBF), shrubland (Shrub), C3 grassland (C3), C4 grassland (C4), and tundra (Tundra) (Liu et al., 2019). In this study, all of the SSiB4/TRIFFID simulations are conducted at a spatial resolution of 1°×1° and a temporal interval of 3 h.
2.2 Parameterization schemes for O3–vegetation damage
Six O3–vegetation damage schemes were implemented in SSiB4/TRIFFID, including: (1) the Lombardozzi et al. (2015) scheme used in CLM4.5 (hereafter L2015), (2) Li et al. (2024) scheme applied in CTSM 5.2 (hereafter Li2024), (3) the Sitch et al. (2007) scheme used in MOSES (hereafter S2007), (4) re-calibrated S2007 method by Ma et al. (2023) (hereafter CS2007), (5) LMA-based approach by Ma et al. (2023) using gridded global LMA map (hereafter LMAgrid), and (6) prescribed PFT-specific LMA values (hereafter LMApft). Although these schemes differ in their treatment of O3 damage, they are all based on stomatal O3 uptake. Therefore, we first define the instantaneous stomatal O3 flux , which represents the O3 uptake through stomata at each modelling time step:
where [O3] is the O3 concentration at the top of the canopy, r denotes the aerodynamic and boundary layer resistance between leaf surface and the reference level, is the ratio of leaf resistance for O3 relative to that for water vapor (1.67), and rs refers to the stomatal conductance for H2O (m s−1). Based on , the excessive instantaneous O3 flux above a threshold y () is defined as:
where y is the area-based flux threshold. U represents the portion of instantaneous stomatal O3 uptake that exceeds the critical threshold and is therefore assumed to trigger phytotoxic damage, and is used differently among parameterizations. In S2007 and CS2007, U is used directly at each model timestep to calculate the O3 damage factor. Whereas in L2015 and Li2024, U is accumulated into a prognostic cumulative O3 uptake metric to represent chronic O3 exposure and its impacts. In the LMA-based approaches, the area-based stomatal O3 uptake is reformulated on a leaf-mass basis. The key characteristics and differences among the six O3 damage schemes are summarized in Table 1, and the detailed formulation of each scheme is described below.
Table 1Key characteristics of the six O3–vegetation damage parameterizations implemented in SSiB4/TRIFFID.
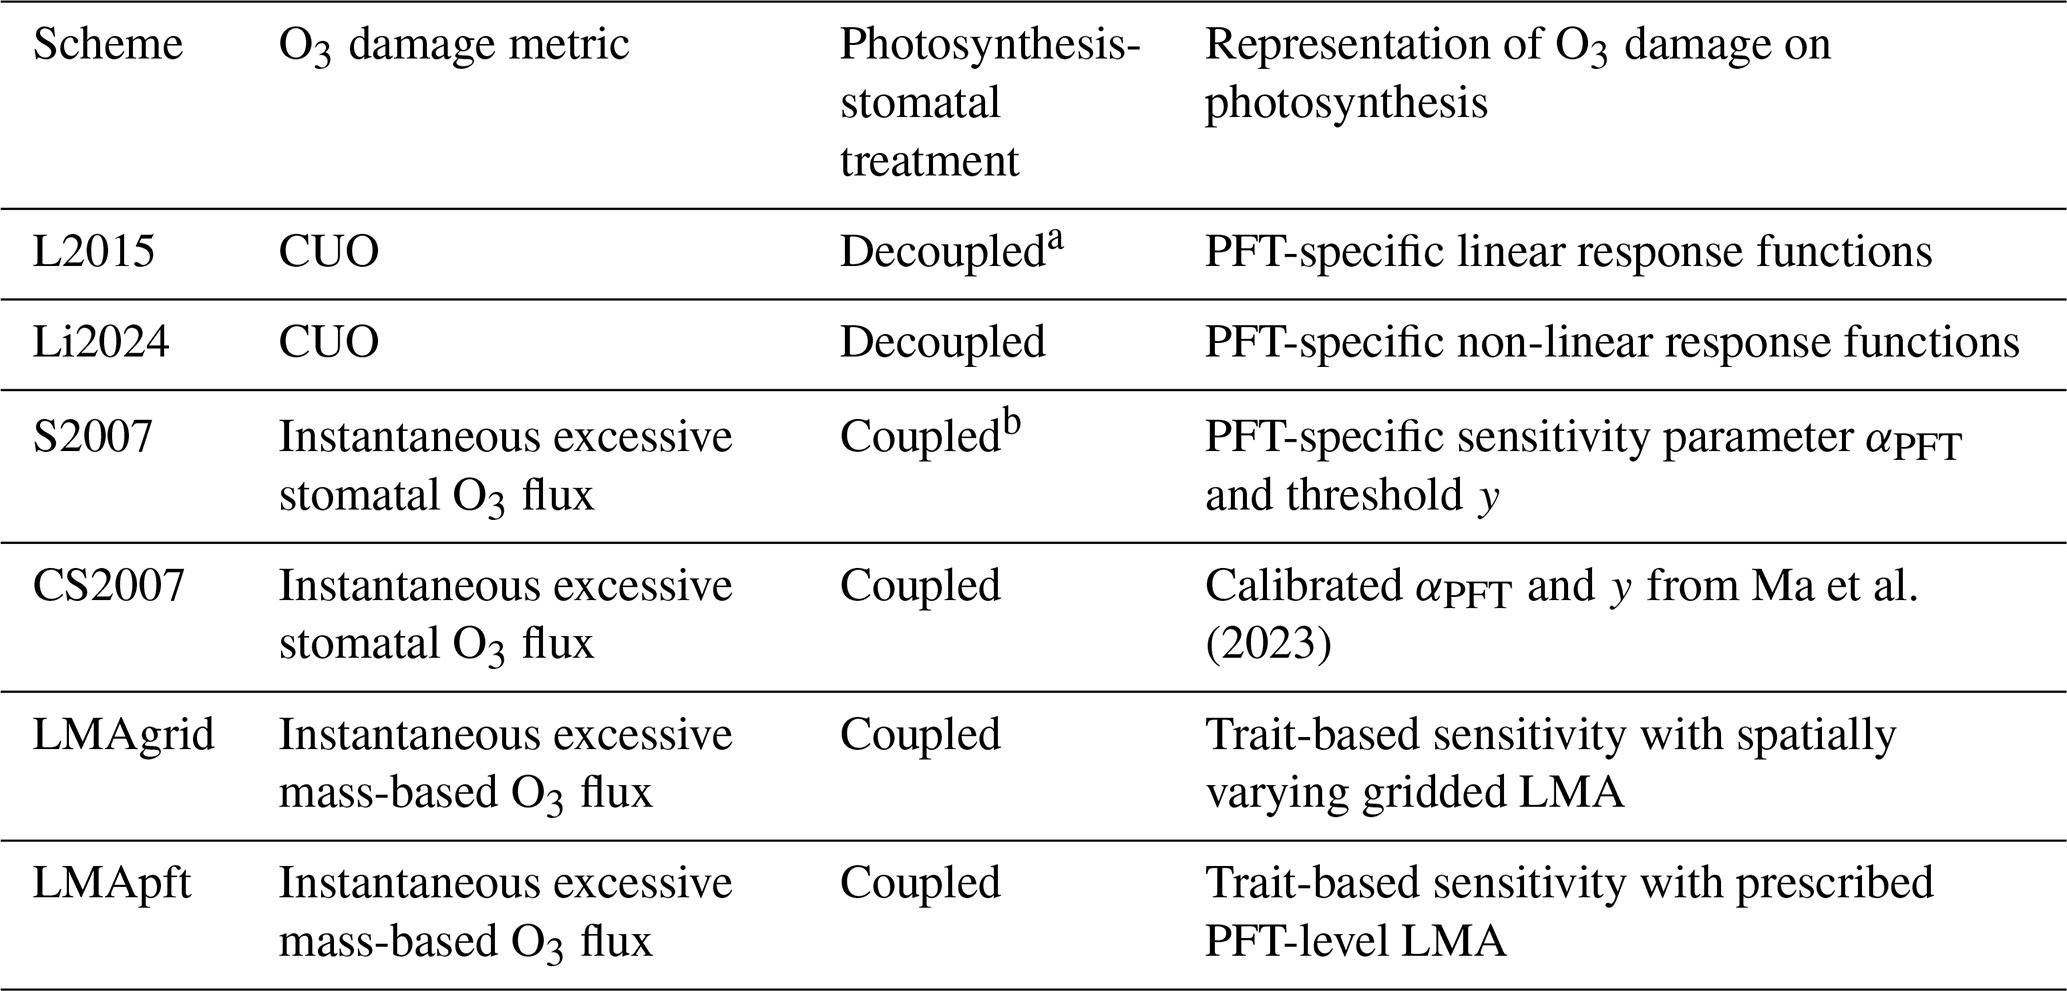
a Decoupled treatment indicates that O3 damage is applied separately to photosynthesis and stomatal conductance through independent response functions. b Coupled treatment indicates that O3 directly modifies photosynthesis, and stomatal conductance responds indirectly through Ball–Berry formulation driven by O3-modified photosynthesis.
Sitch et al. (2007) proposed a semi-mechanistic parameterization to represent the transient O3-induced damage to plants through the coupling between stomatal conductance and photosynthetic rate (S2007). The O3 modification factor on photosynthesis (F) is formulated as a function of the excessive instantaneous stomatal O3 flux:
where U is the excessive instantaneous stomatal O3 flux defined in Eq. (2), and αPFT is the PFT-specific O3 sensitivity coefficient derived from observations (Sitch et al., 2007). The coupled formulation of Eqs. (1)–(3) produces a quadratic in that can be solved analytically at each timestep. The resulting is then applied as a reduction factor on net photosynthetic rate, while stomatal conductance is subsequently calculated using the semi-empirical Ball–Berry formulation driven by the O3-modified photosynthetic rate (Collatz et al., 1991; Zhan et al., 2003).
Within the same framework, Ma et al. (2023) further recalibrated the sensitivity parameters of S2007 using observed dose–response relationships compiled from a wide range of field and experimental studies. This recalibrated version is denoted as CS2007 in this study. Although CS2007 is not structurally independent from S2007, it differs in the updated PFT-specific coefficients and thresholds. This distinction allows us to evaluate how updated observational constraints on plant O3 sensitivity influence simulated O3 vegetation damage within the original S2007 framework. It should be noted that both S2007 and CS2007 provide low-, moderate-, and high-sensitivity parameter sets to represent uncertainty in plant O3 responses. In this study, we used the moderate-sensitivity parameter sets as default configuration for both schemes to ensure a consistent comparison with the other parameterizations. The SSiB4/TRIFFID implementation of S2007 and CS2007 is summarized in Table S1 in the Supplement, and the corresponding sensitivity parameters are shown in Table S2. More details of the two schemes are provided in Sitch et al. (2007) and Ma et al. (2023).
Unlike S2007 and CS2007, which diagnose O3 damage from instantaneous excessive stomatal O3 uptake, L2015 and Li2024 calculate O3 damage based on cumulative uptake of O3 (CUO). According to Lombardozzi et al. (2015), CUO is calculated as a prognostic cumulative O3 exposure metric that evolves with O3 uptake, decay, and healing process.
where CUOt and CUOt−1 denote the cumulative O3 stress at the current and previous model time steps, respectively. U is the excessive instantaneous stomatal O3 flux defined in Eq. (2), representing the newly added O3 uptake at the current time step. D denotes the decay factor applied to the previously accumulated CUO, and is parameterized as a function of the leaf longevity lleaf (year). H denotes the healing factor, which is derived from the change in leaf area index (LAI) between the current and previous time steps. It represents the attenuation of previously accumulated O3stress by new leaf growth, assuming that newly formed leaves are initially free of O3 damage. Following Lombardozzi et al. (2015), CUO is accumulated only when LAI≥0.5. When LAI falls below this threshold, CUO is reset to zero to represent the end of the growing season and O3 stress accumulation.
Based on the CUO formulation described above, Lombardozzi et al. (2015) developed separate empirical response functions for photosynthesis and stomatal conductance using experimental data compiled from the peer-reviewed literature. Accordingly, the O3 modification factors for photosynthesis and stomatal conductance are expressed as linear functions of CUO:
where ap and bp are the intercept and slope coefficients for the photosynthetic response, and ag and bg are the corresponding coefficients for the stomatal conductance, respectively. The detailed response functions and PFT-specific parameter settings are shown in Table S2.
Building on the cumulative O3 stress framework of L2015, Li2024 updates the response functions using a substantially expanded observational database. Using an expanded O3 fumigation database compiled from the peer-reviewed literature, with a sample size approximately six times larger than that used in L2015, Li et al. (2024) developed PFT-specific response functions for photosynthesis and stomatal conductance. Unlike the linear or constant response functions that are used in L2015, Li2024 considers both linear and nonlinear functions to better capture the observed physiological responses across a wider range of vegetation types. Another difference between L2015 and Li2024 lies in the treatment of decay and healing process in the CUO calculation. In L2015, the healing factor is applied to the newly added uptake term. In contrast, following the logic of Li et al. (2024), both decay and healing are applied to the previously accumulated O3 stress for different PFTs. In our implementation, CUO is calculated as:
The main difference between this formulation and L2015 is how the healing process is applied. In L2015, H modifies the newly added uptake term. In Li2024, however, it is applied to the previously accumulated CUO, representing the attenuation of existing O3 stress by newly formed leaves. The two schemes also differ in their CUO accumulation periods. In Li2024, U contributes to CUO only during daytime, which is defined as timesteps when absorbed solar radiation is greater than zero. In contrast, L2015 retains full-day accumulation. The key formulations and parameter settings for the L2015 and Li2024 schemes implemented in SSiB4/TRIFFID are provided in Table S1.
Following the stomatal flux-based O3 damage framework of S2007, Ma et al. (2023) proposed a trait-based O3 damage parameterization in which the plant O3 sensitivity is represented using leaf mass per area. By using LMA to convert the area-based stomatal O3 flux into a mass-based flux, this conversion allows a unified representation of O3 sensitivity with a single PFT-independent parameter a across different plant species. The relationship between the original area-based sensitivity coefficient αPFT and the mass-based sensitivity parameter a is expressed as:
Accordingly, the O3 modification factor in Eq. (3) is reformulated as:
where a is the PFT-independent mass-based O3 sensitivity parameter (nmol−1 s g) within each LMA-based implementation. Specifically, we set to a=3.5 for LMAgrid and 2.82 for LMApft as suggested by Ma et al. (2023). x is the mass-based flux threshold. Following Feng et al. (2018) and Ma et al. (2023), we set based on the observations. In this study, we implement two versions of the LMA-based scheme with the same mathematical formulation but different sources of LMA information. The LMAgrid scheme uses a spatially explicit global LMA map from Moreno-Martínez et al. (2018), allowing O3 sensitivity to vary among grid cells. In contrast, the LMApft scheme uses prescribed PFT-specific LMA values, thereby keeping O3 sensitivity spatially uniform within each PFT (Table S2). Details of the LMA dataset and processing are described in Sect. 2.3.2.
2.3 Simulations
2.3.1 Site-level simulations
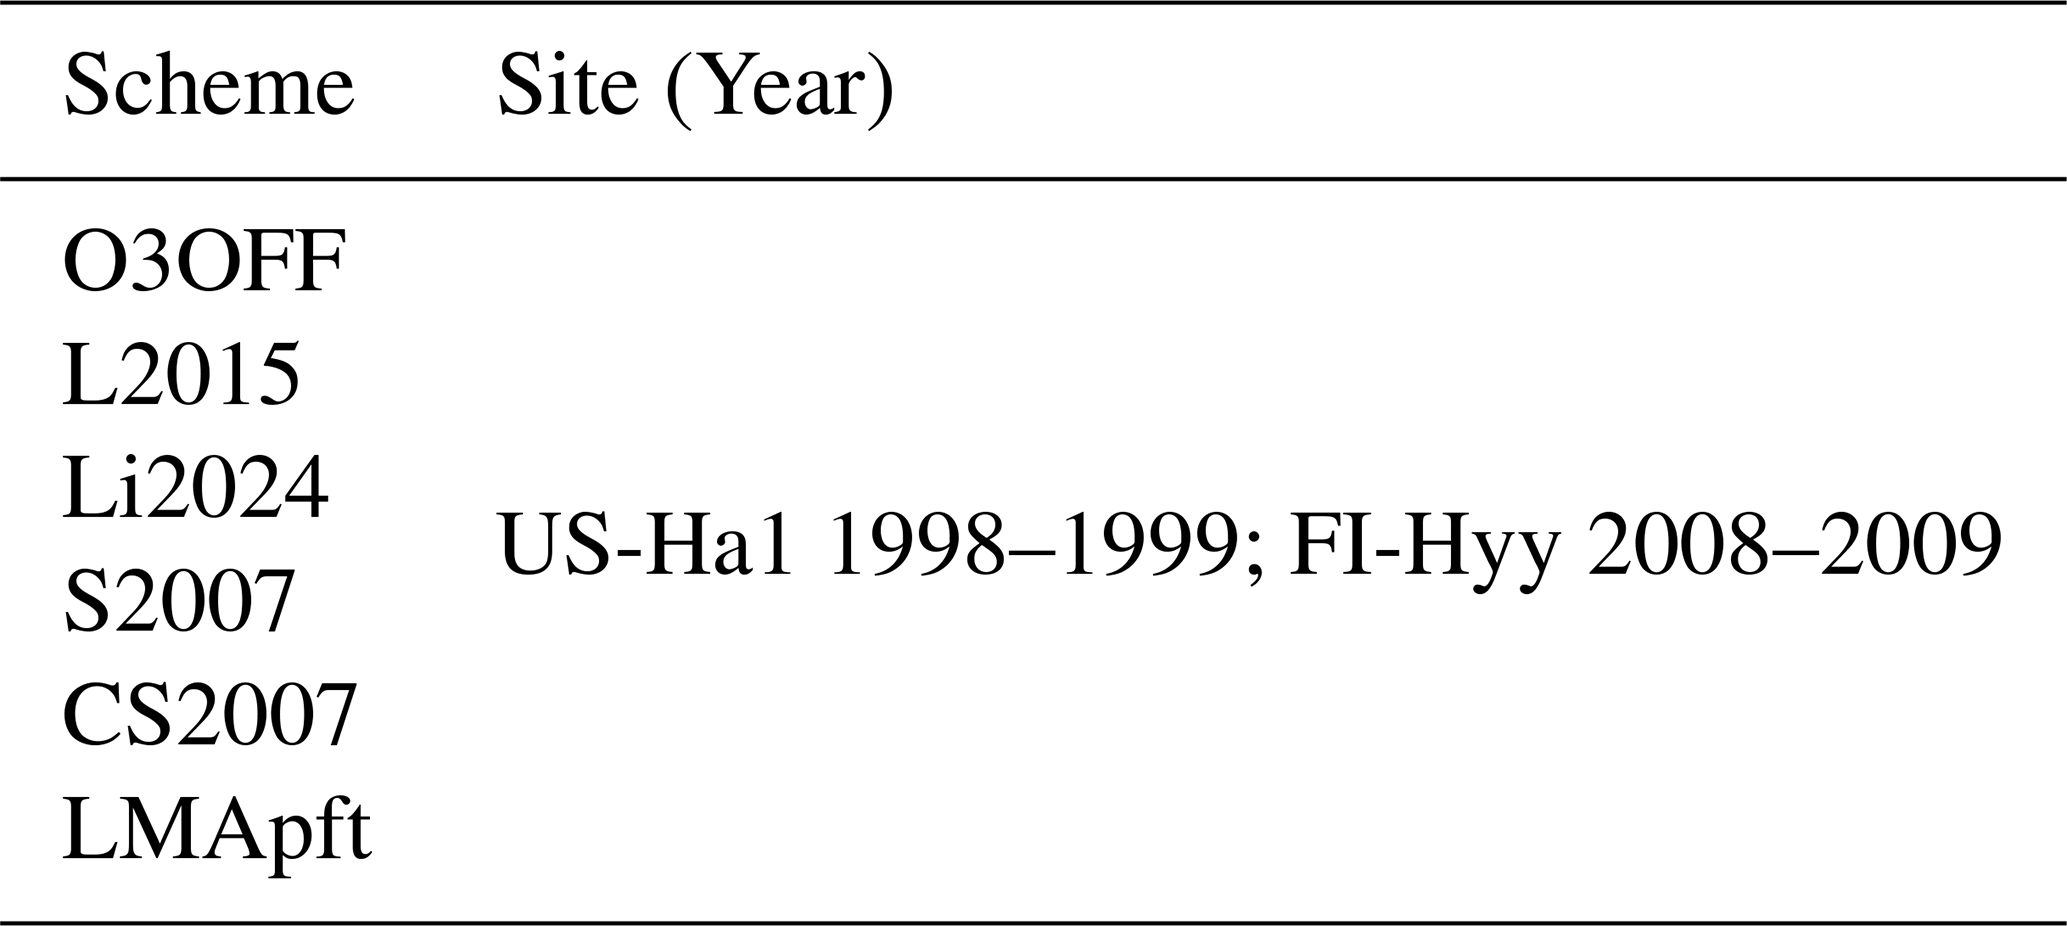
To assess the performance of the implemented O3-damage parameterizations, we perform site-level simulations at two eddy-covariance flux tower sites: Harvard Forest, United States (US-Ha1) (Munger et al., 1996); and Hyytiälä Forest, Finland (FI-Hyy) (Keronen et al., 2003). Currently, continuous, long-term observations of stomatal O3 uptake and carbon fluxes remain scarce in China, particularly for natural ecosystems under ambient O3 exposure. We therefore use US-Ha1 and FI-Hyy as benchmarks before conducting regional simulations over China.
US-Ha1 is a temperate deciduous broadleaf forest with long-term O3 and carbon fluxes measurements available for 1990–2000. FI-Hyy represents a boreal evergreen needleleaf forest dominated by Scots pine (Pinus sylvestris), with O3 and carbon fluxes available for 2001–2013. The meteorological forcing, O3 concentration and flux measurements were aggregated to 3 hourly resolution to match the model timestep. Missing values within 6 h were filled using the nearest timesteps, while gaps longer than 6 h were filled using a moving-window (15 d and 3 year windows) at the same hour of day. Years with remaining discontinuities after gap filling were excluded to ensure the continuous O3 input. As a result, we select 1998–1999 for US-Ha1 and 2008–2009 for FI-Hyy, because these periods provide the longest continuous records.
We conduct six experiments to evaluate the simulated stomatal O3 uptake and GPP fluxes across the implemented parameterizations (Table 2). These include one default experiment without O3 impacts (O3OFF) and five simulations that apply L2015, Li2024, S2007, CS2007, LMApft, respectively. At the site scale, we use LMApft to represent the LMA-based approach, whereas LMAgrid is evaluated in the regional simulations with gridded LMA forcing. The O3-induced vegetation damage is quantified as the difference between each simulation and the O3OFF experiment.
2.3.2 Regional simulations over China
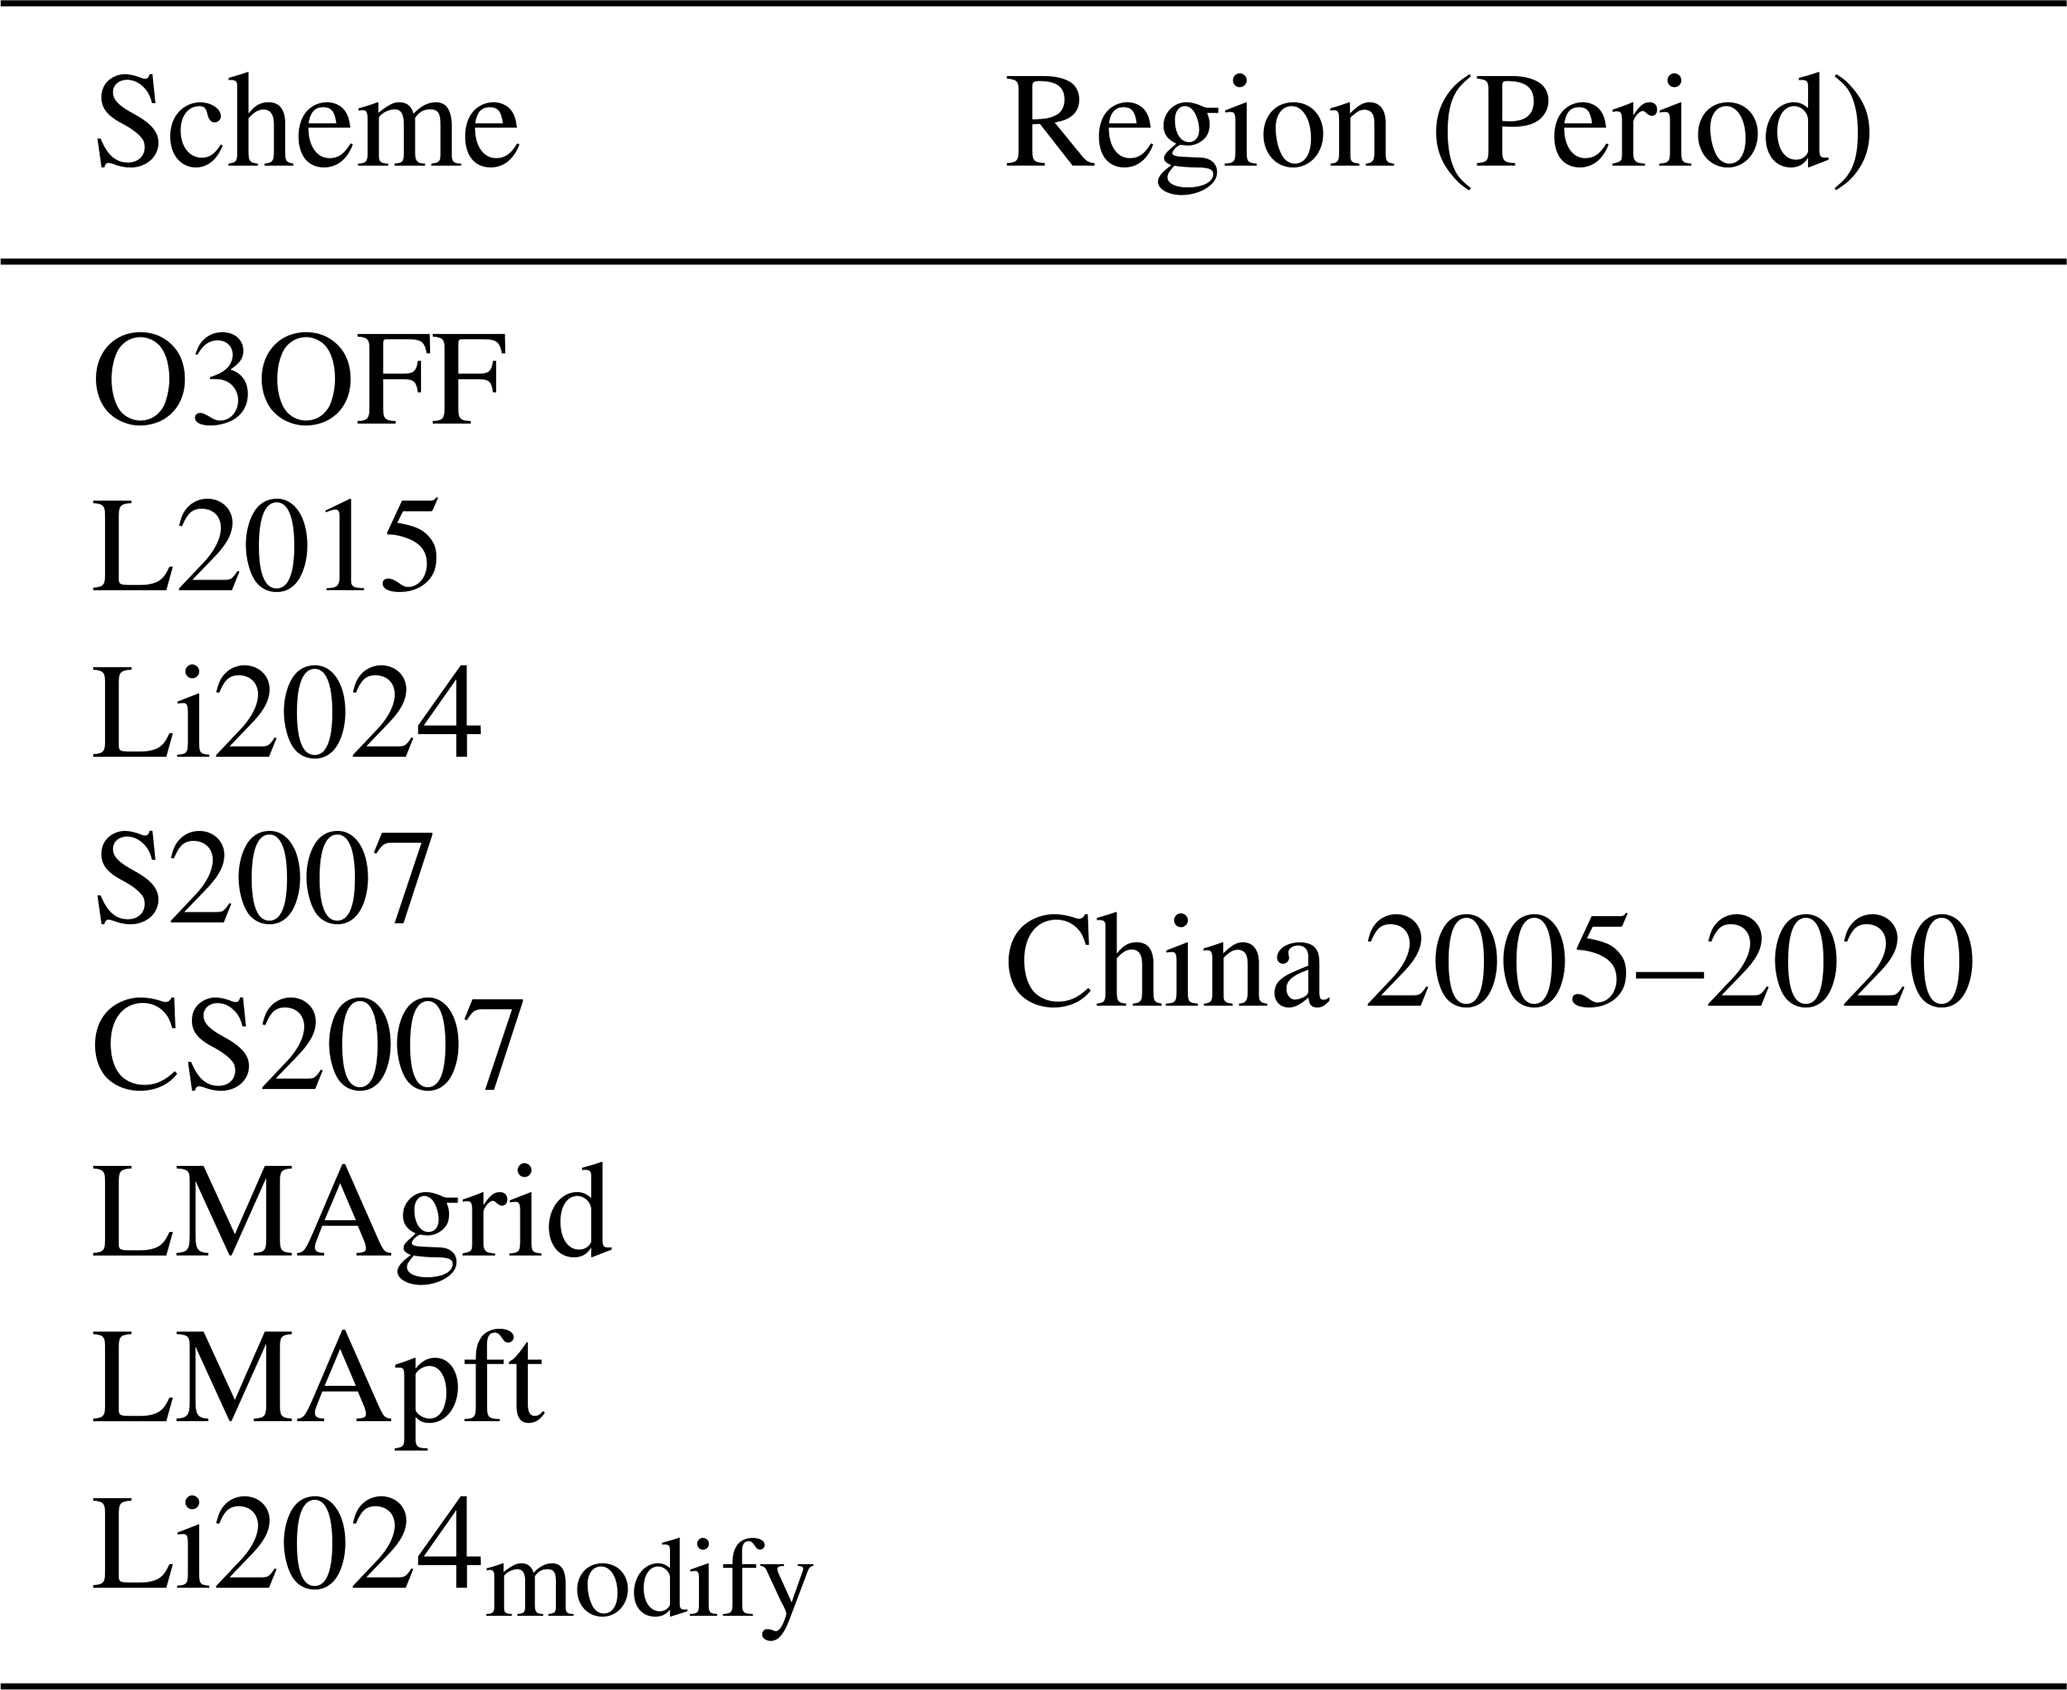
We conduct seven experiments to quantify the impacts of ambient O3 on GPP over China (Table 3). All simulations are performed for 2005–2020 with meteorological forcing from ERA5-Land (Muñoz Sabater, 2019), and the first six years (2005–2010) are discarded as spin-up. For all experiments except O3OFF, ambient O3 concentrations are derived from the Hourly Surface Ozone Data (HrSOD). HrSOD is an observation-constrained, machine learning-based gridded product that provides hourly surface O3 at a spatial resolution of 0.1°×0.1°, which can well capture the spatiotemporal variability of surface O3 pollution over China (Zhang et al., 2024). We further evaluated HrSOD against China's ground-level O3 monitoring network from the China National Environmental Monitoring Center (CNEMC) (Fig. S1 in the Supplement). The results show that HrSOD reproduces the observed spatial pattern of annual-mean O3 across China for 2015–2020 (R2=0.71; ). In this study, both HrSOD and ERA5-Land forcings are aggregated to 1° and 3 hourly to match the SSiB4/TRIFFID configuration.
For the LMAgrid experiment, we derive gridded LMA product from Moreno-Martínez et al. (2018) as input data for mass-based O3 damage scheme. Following Ma et al. (2023), we filled the missing LMA values using the global mean value of the corresponding PFT. The gap-filled LMA data is then aggregated to a spatial resolution of 1° to match the model configuration (Fig. S2).
In addition to the seven experiments described above, we performed an additional simulation, Li2024modify, to examine a refined treatment of CUO attenuation within the Li2024 framework. In the original Li2024 implementation, the decay and healing terms are applied differently among PFTs: the decay term is applied for evergreen species while LAI-related healing term is used for other PFTs. In Li2024modify, both processes are applied to all PFTs. This treatment is based on the interpretation that these two terms represent complementary pathways for attenuating CUO accumulation at different stages of canopy development. The LAI-related healing term represents a rapid dilution of CUO when LAI is increasing, which reflects the assumption that newly formed leaves are initially undamaged by O3 stress. In addition, the decay term represents a gradual attenuation of CUO when LAI is stable or declining. Importantly, this term should not be interpreted as an explicit representation of any specific physiological recovery mechanism. Instead, Li2024modify adopts a simplified, trait-informed treatment in which PFT-specific leaf longevity is used to inform the characteristic timescale of CUO attenuation. By using leaf longevity to describe how long leaves are exposed to O3 before leaf fall or replacement, the decay term links the attenuation of CUO to the life cycle of leaves under a natural trait-based constraint.
This modification is conceptually aligned with the injury–recovery framework proposed by Felzer et al. (2009), in which O3 damage is represented as a prognostic state variable governed by injury and recovery processes. In their framework, recovery comprises two components: (i) a characteristic healing rate indicating gradual physiological recovery due to cellular repair and leaf replacement when LAI is constant or decreasing, and (ii) a rapid healing associated with canopy growth, whereby newly formed leaves replace the damaged foliage as LAI increases. Following this concept, Li2024modify treats the decay and healing terms as complementary attenuation processes rather than separate treatments for different PFTs, which can be expressed as follows:
Furthermore, we update the key parameter lleaf using observed leaf longevity dataset to better constrain the decay process across PFTs (Wang et al., 2012). Leaf longevity is a key plant trait that reflects typical leaf life span of each PFT, and provides important physiological constraint for representing vegetation turnover in land surface models (Wang et al., 2012; Zhang et al., 2016). By linking the decay term to a measurable physiological trait, this refinement provides a trait-based constraint on the gradual attenuation of accumulated O3 stress within the existing CUO framework. Therefore, the Li2024modifyexperiment was designed to evaluate how the refined treatment affects CUO accumulation and the O3-induced vegetation damage in SSiB4/TRIFFID.
2.4 Benchmark data for model validation
For regional-scale model evaluation over China, we used independent satellite- and data-driven products of leaf area index (LAI) and gross primary productivity (GPP) to assess the simulated vegetation dynamics. For LAI, we obtain the Global Land Surface Satellite (GLASS) LAI product, which is generated using general regression neural networks and remote-sensing observations. Compared to other long-term LAI products, the GLASS LAI is characterized by high accuracy and temporal stability (Liang et al., 2021). In this study, the original GLASS LAI data at 0.05° for 2011–2020 were aggregated to 1° to validate and evaluate the SSiB4/TRIFFID simulations.
We used the GOSIF and FLUXCOM GPP product as independent benchmarks to evaluate the simulated GPP over China. GOSIF GPP is a satellite-based product derived from the Orbiting Carbon Observatory-2 (OCO-2) solar-induced chlorophyll fluorescence (SIF) data using a light-use-efficiency framework. GOSIF GPP provides seamless global estimates at 0.05° resolution since 2000 (Li and Xiao, 2019). The FLUXCOM RS+METEO GPP product is derived using machine-learning approaches that integrate eddy-covariance carbon flux measurements with satellite remote sensing and meteorological data, which is available at 0.5° resolution for 1979–2018 (Jung et al., 2020). We obtain GOSIF and FLUXCOM GPP data from 2011–2020 (2018 for FLUXCOM) and interpolate these products to a spatial resolution of 1° to match the model configuration. Both of the datasets have been widely applied in regional and global assessments of ecosystem productivity and model evaluations.
2.5 Observed and simulated vegetation O3 sensitivity derived from dose–response relationships
To ensure a consistent intercomparison of vegetation responses across different O3 damage parameterizations, we estimate PFT-specific O3 sensitivities from the dose–response relationships between relative GPP change (RGPP) and PODy. Here, PODy refers to the phytotoxic O3 dose over a flux threshold of y (). As a flux-based diagnostic metric, PODy directly links to biologically relevant stomatal O3 uptake by accounting for O3 concentration, stomatal conductance, and exposure duration (Mills et al., 2011; Pleijel et al., 2022). In this study, PODy is calculated from the simulated stomatal O3 flux as:
where is the instantaneous stomatal O3 flux defined in Eq. (1), and y is the prescribed flux threshold. We obtain the annual PODy by accumulating the above-threshold stomatal O3 flux within each simulation year. Different from CUO, which represents O3 stress after accounting for decay and healing, PODy is used as a diagnostic dose metric to compare vegetation responses among different parameterizations on a consistent basis. The dose–response relationship between RGPP and PODy can be expressed as:
where RGPP denotes the relative change in GPP under O3 exposure compared with the O3OFF experiment, b is the slope of the linear relationship, and c is the intercept. Following Ma et al. (2023), the slope b is used to quantify the PFT-specific O3 sensitivity for each scheme, with higher negative value indicating stronger GPP reduction per unit PODy. These sensitivities are compared across different PFTs and parameterization schemes.
Observations of O3 sensitivity are assembled from recent literature to evaluate the performance of the simulated dose–response relationships. We obtain the observational results from Ma et al. (2023) and Li et al. (2024), both of which compiled field measurements and O3 fumigation experiments across a range of literature sources. For Ma et al. (2023), PFT-specific O3 sensitivities were compiled from published studies based on regressions between biotic indicators and PODy. We use the median value for each PFT as the observed sensitivity and the reported minimum-maximum range as an uncertainty interval. In contrast, Li et al. (2024) provided a comprehensive database of >4000 paired observations of photosynthesis and PODy. We therefore derive the slopes of PFT-specific dose–response relationships directly from the raw data as the observed O3 sensitivity (Fig. S3). Uncertainty was quantified using bootstrap resampling (1000 iterations), with the 2.5th and 97.5th percentiles of the slope distribution taken as the confidence intervals (CIs).
3.1 Implementation of O3–vegetation damage schemes and site-level evaluation
Six O3–vegetation damage parameterizations were implemented in SSiB4/TRIFFID against field observations at two flux-tower sites with O3 flux measurements. Both sites have been widely used in previous studies to investigate O3–vegetation interactions and dry deposition (Ducker et al., 2018; Li et al., 2020; Lin et al., 2020). Figure 1 presents the simulated O3 flux and GPP for US-Ha1 in 1998 and FI-Hyy in 2009. The same evaluation for US-Ha1 in 1999 and FI-Hyy in 2008 is provided in Fig. S4 as well. Overall, all schemes agree well with observations in both amplitude and seasonality of stomatal O3 flux and GPP. However, stomatal O3 flux tends to be underestimated in November-February, likely due to the simulated weak photosynthetic activity in winter (Fig. 1).
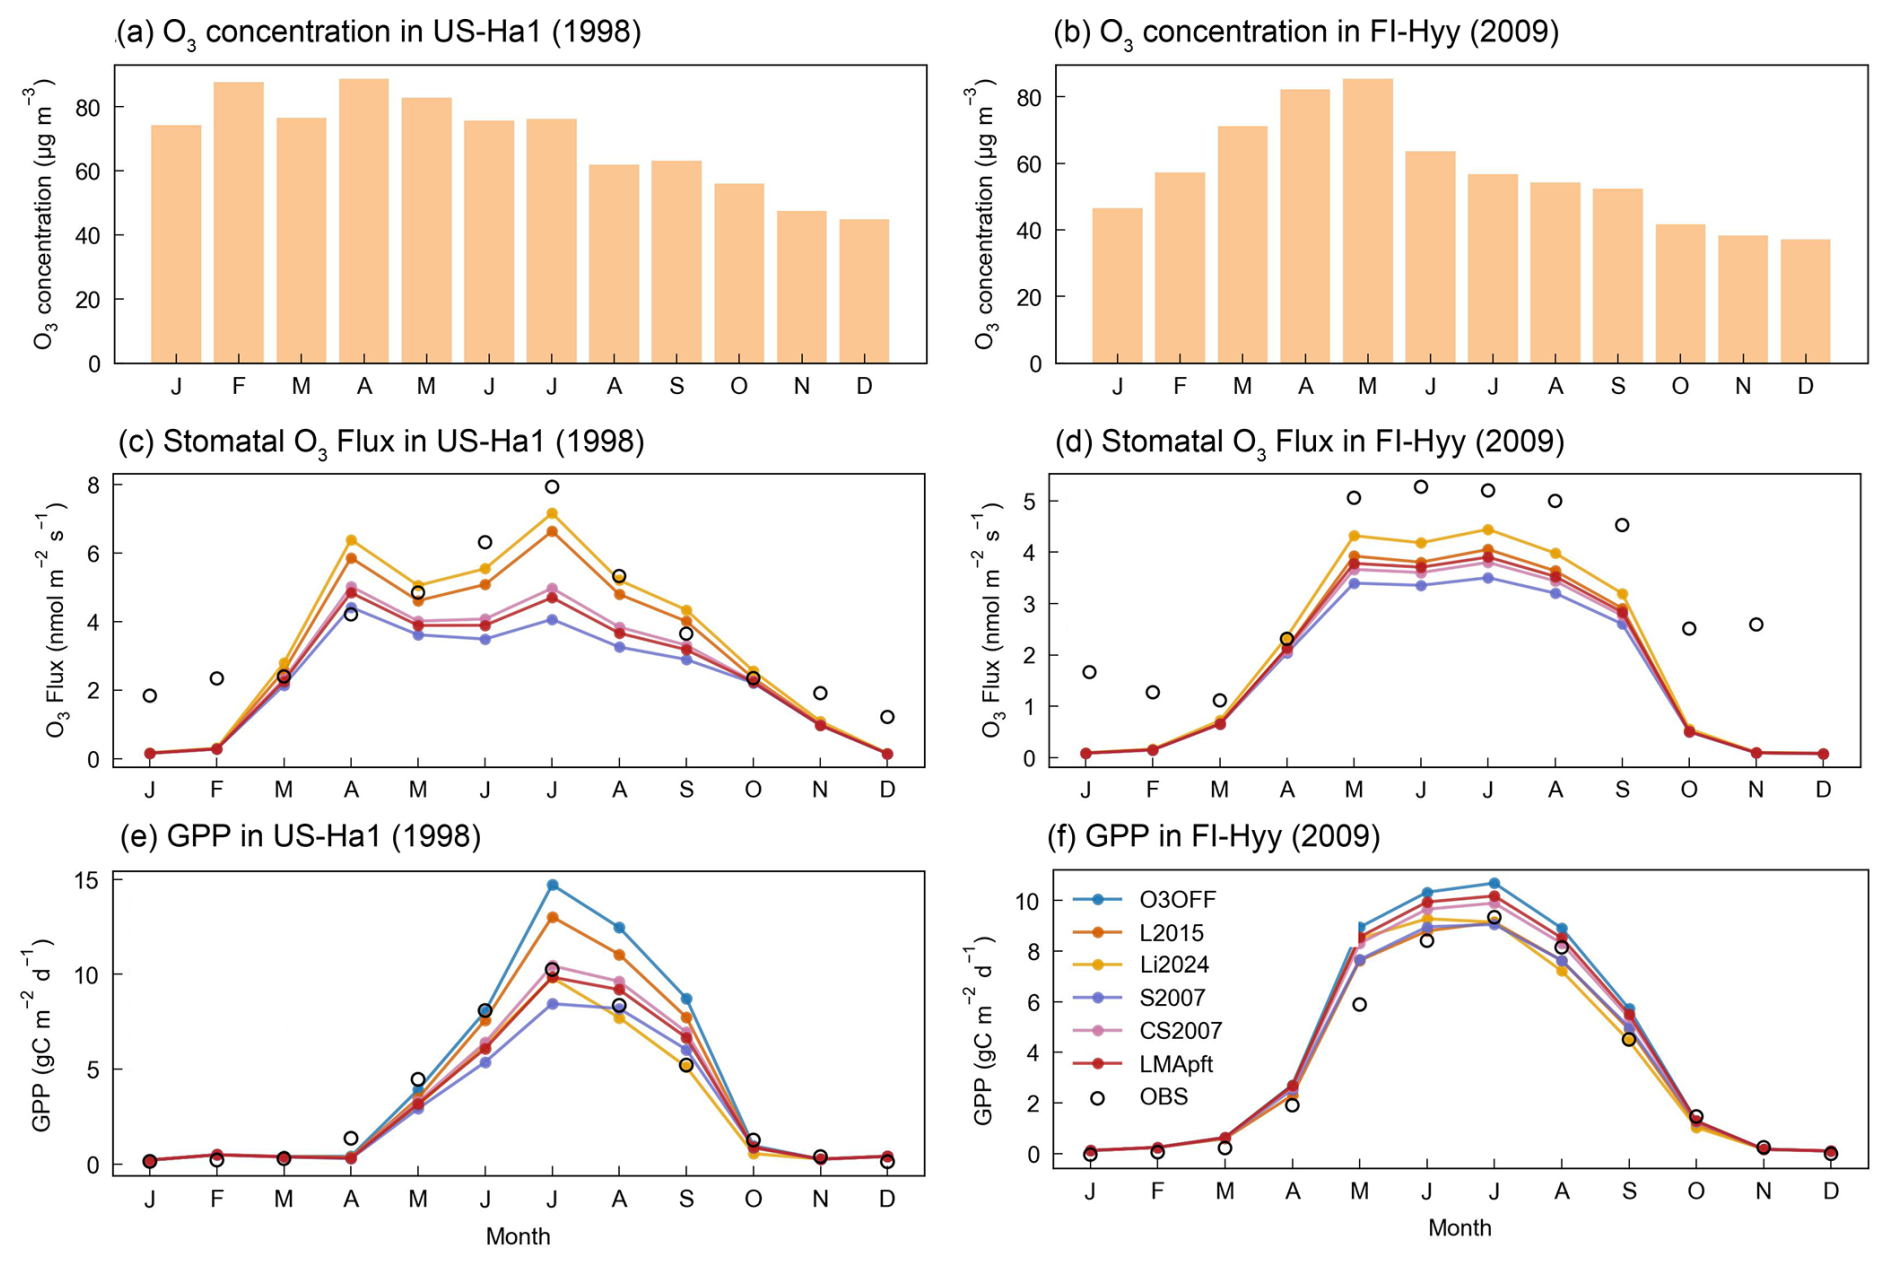
Figure 1Site-level observations and simulations of monthly O3 concentration (a, b), stomatal O3flux (c, d), and GPP (e, f) for US-Ha1 (1998) and FI-Hyy (2009), respectively. Colored lines denote different O3 damage parameterizations, bars and symbols indicate field observations.
Among the five schemes, L2015 and Li2024 generally exhibit smaller biases in simulated O3 flux, followed by LMApft and CS2007. The S2007 scheme consistently simulates the lowest O3 uptake (Fig. 1b and e). All schemes indicate O3-induced reductions in GPP at both sites, while the simulated magnitude varies substantially across parameterizations. At US-Ha1, L2015 produces the weakest O3-induced GPP reduction, followed by CS2007 and LMApft, whereas Li2024 and S2007 yield the largest reductions (Fig. 1c). At FI-Hyy, the simulated O3 impacts on GPP is weaker with a smaller inter-scheme spread. The CS2007 and LMApft simulate relatively smaller reductions, whereas L2015, Li2024, and S2007 produce larger GPP losses (Fig. 1e). We further quantified inter-scheme differences by computing the mean absolute error (MAE) of simulated stomatal O3 flux and GPP relative to site observations (Fig. S5). For stomatal O3 flux, Li2024 consistently yields the lowest MAE across all four site-years. For GPP, however, the MAE varies across site-years: L2015 shows the smallest MAE at FI-Hyy, while Li2024 and CS2007 produce the lowest errors in US-Ha1. Although the magnitude of simulated GPP response differs among the schemes, accounting for O3 effects consistently reduces GPP bias relative to the O3OFF experiment. Overall, all schemes reproduce the observed magnitude and seasonal cycle of both stomatal O3 flux and GPP values. Among the schemes, Li2024 shows the best agreement with observations for stomatal O3 flux, as indicated by the lowest MAE across sites.
3.2 Estimation of O3-induced vegetation damage in China in the 2010s
In regional simulation experiments, we first quantified the baseline performance of SSiB4/TRIFFID over China under the control experiment without O3-induced vegetation damage (i.e. O3OFF). Simulated GPP and LAI are compared with satellite measurements, including GPP from GOSIF and LAI from GLASS. The results indicate that SSiB4/TRIFFID is capable of realistically reproducing vegetation growth and photosynthetic activity over China, with high spatial correlations of 0.94 for GPP and 0.89 for LAI in the growing season (April–September), respectively (Figs. 2 and S6). Consistent with satellite observations, high GPP values are found in southern China and eastern China. At the national scale, the O3OFF experiment generally overestimates GPP and LAI compared to observations, with an annual positive bias of 14.88 % in GPP and 22.78 % in LAI, respectively.
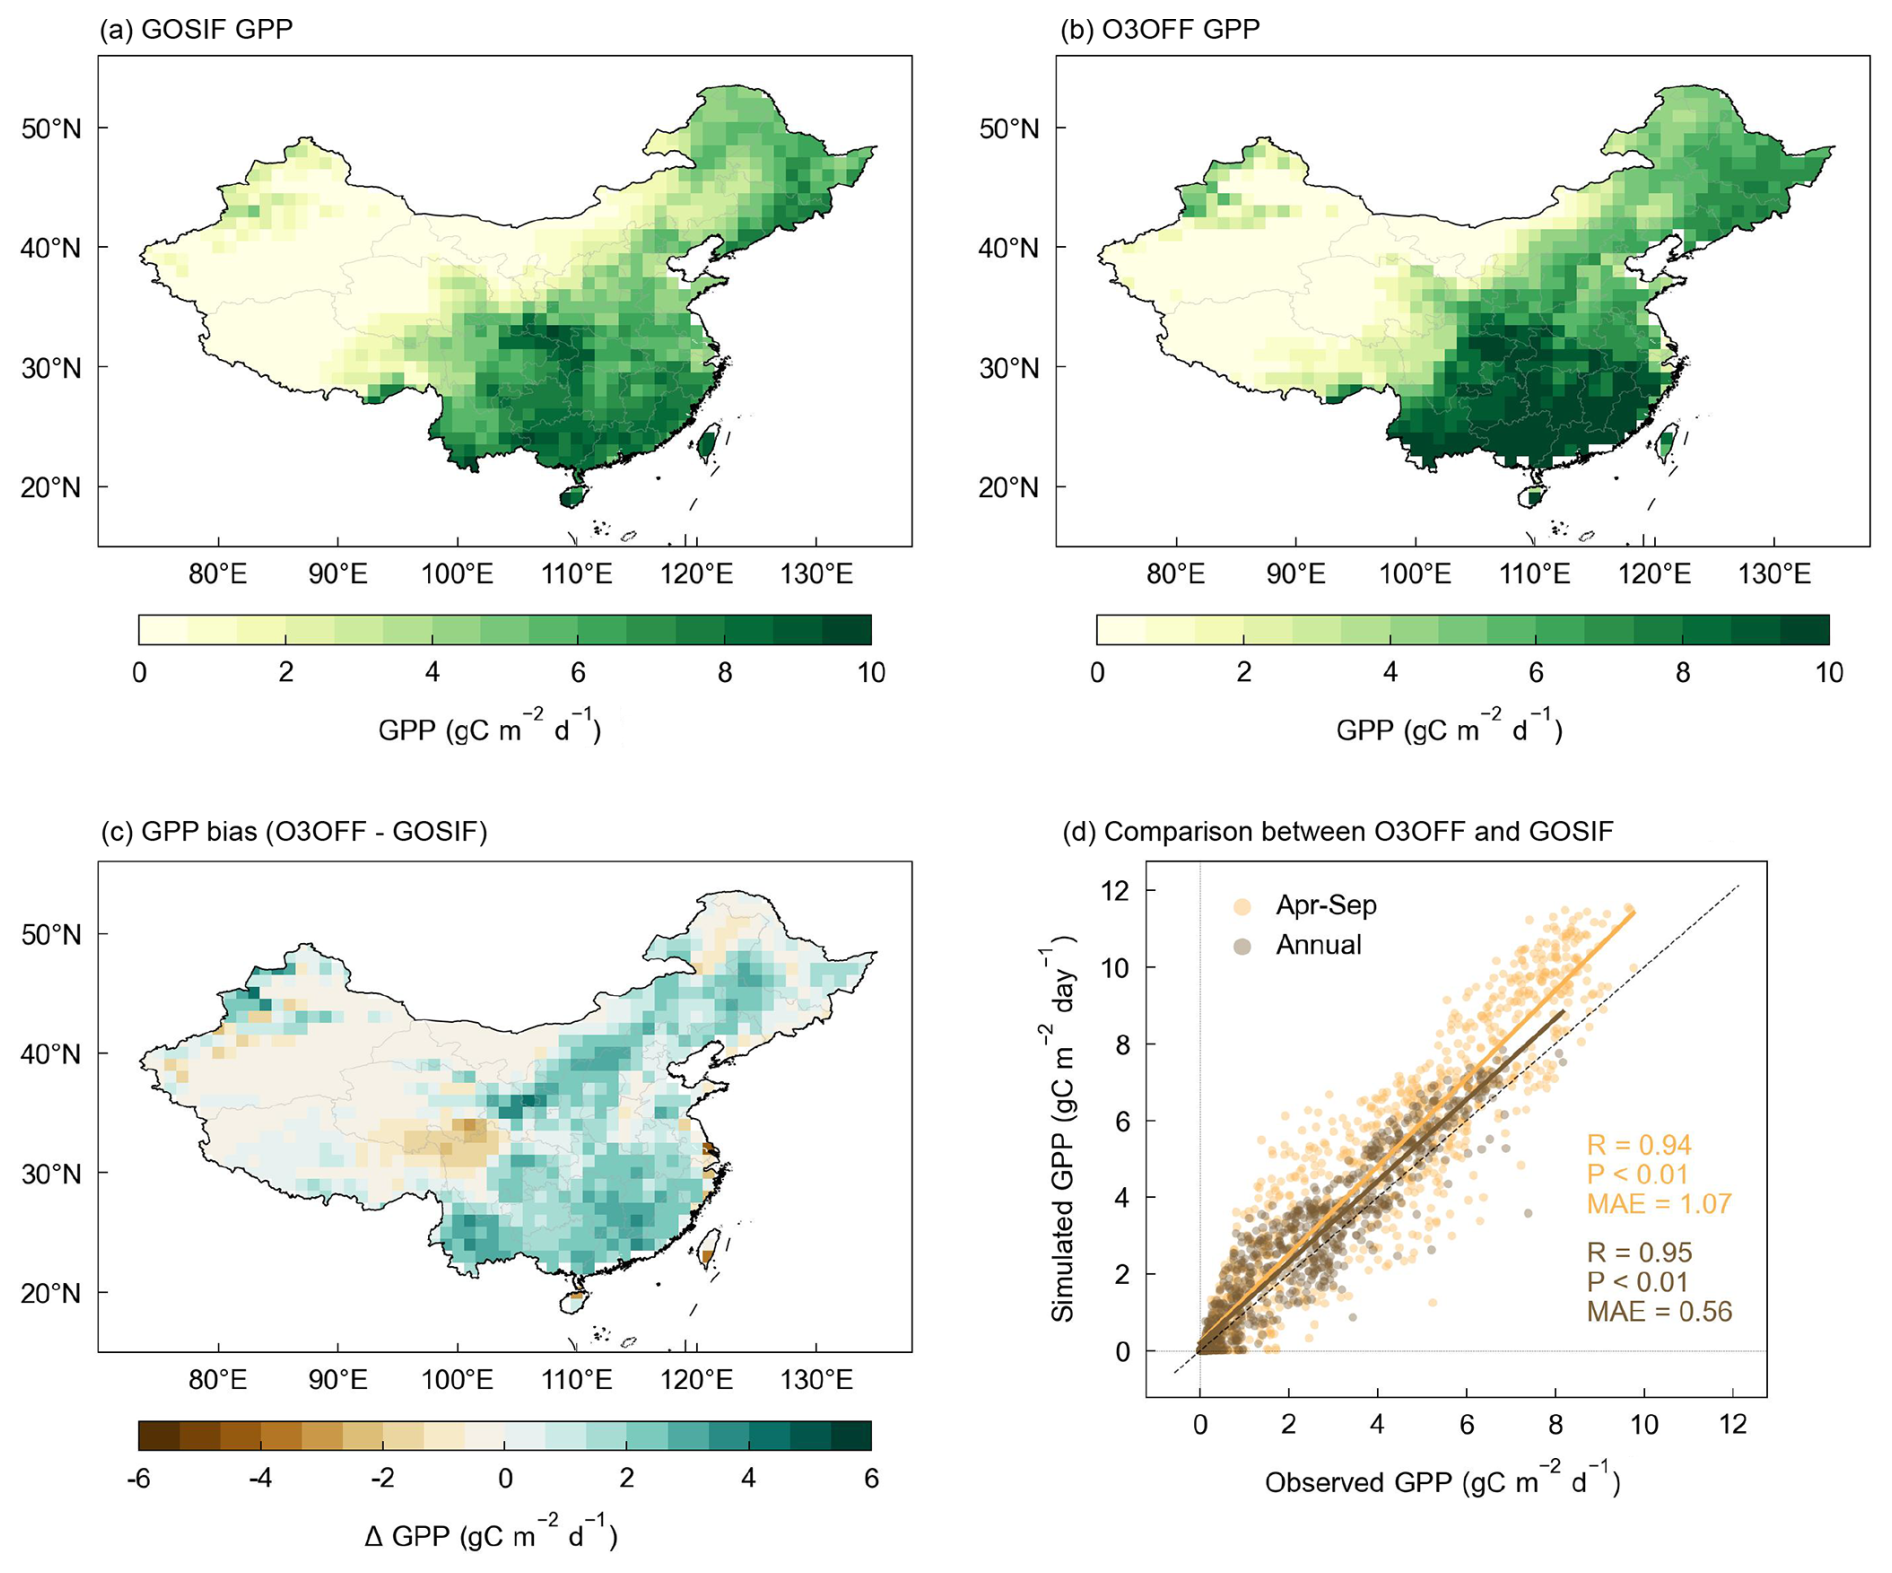
Figure 2Evaluation of simulated GPP against satellite-based observations over China. Panels (a, b) show growing-season mean GPP over China during April–September derived from GOSIF observations and O3OFF experiment, respectively. The difference between O3OFF simulation and GOSIF observation within the same period is shown in (c). Panel (d) presents grid-level comparisons between simulated and observed GPP over China for both growing-season (April–September) and annual values.
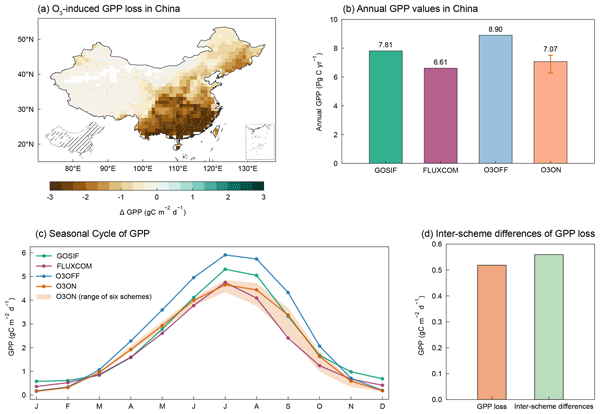
Using hourly surface O3 concentrations from HrSOD, we quantified O3-induced vegetation damage over China with the six O3–vegetation damage parameterizations implemented in SSiB4/TRIFFID model (Fig. 3). Across all schemes, ambient O3 pollution substantially suppresses vegetation photosynthesis nationwide. The largest reductions in GPP occur in southern China, where densely-distributed vegetation coincides with elevated O3 exposure. In eastern China, despite the comparatively lower vegetation distribution, severe O3 pollution still leads to pronounced photosynthetic damage. Based on the multi-scheme assessment, we estimate an average O3-induced GPP loss over China by 20.76 %, with a spread of 16.81 %–26.63 % among the six schemes during growing season (April–September). As a result, the national annual GPP decreases from 8.90 Pg C in O3OFF to 7.07 Pg C, with an inter-scheme range of 6.27–7.51 Pg C. The seasonal evolution of O3-induced GPP loss exhibits a clear unimodal pattern, with the largest reductions occurring during summer, coincident with peak O3 concentrations and maximum vegetation growth.
Overall, ambient O3 pollution leads to substantial reductions in GPP across China. Comparisons against observations further indicate that implementation of O3 damage schemes into land surface model can improve the simulation of carbon fluxes over China. Meanwhile, the six parameterizations yield marked discrepancies in O3-induced GPP damage, as evidenced by the large inter-scheme spread as shown by the shading in Fig. 3c. These divergences are particularly pronounced during the late growing season. At the annual scale, the inter-scheme spread is comparable in magnitude to the GPP loss itself, which indicates a large uncertainty in assessing O3-induced GPP reductions in China. Given the severe O3 burden in China and the pronounced differences among current parameterizations, a comprehensive investigation is needed to diagnose inter-scheme divergences and to evaluate their performance in China, which is crucial for narrowing the uncertainties in simulated O3 impacts on vegetation and improving regional GPP simulations over China.
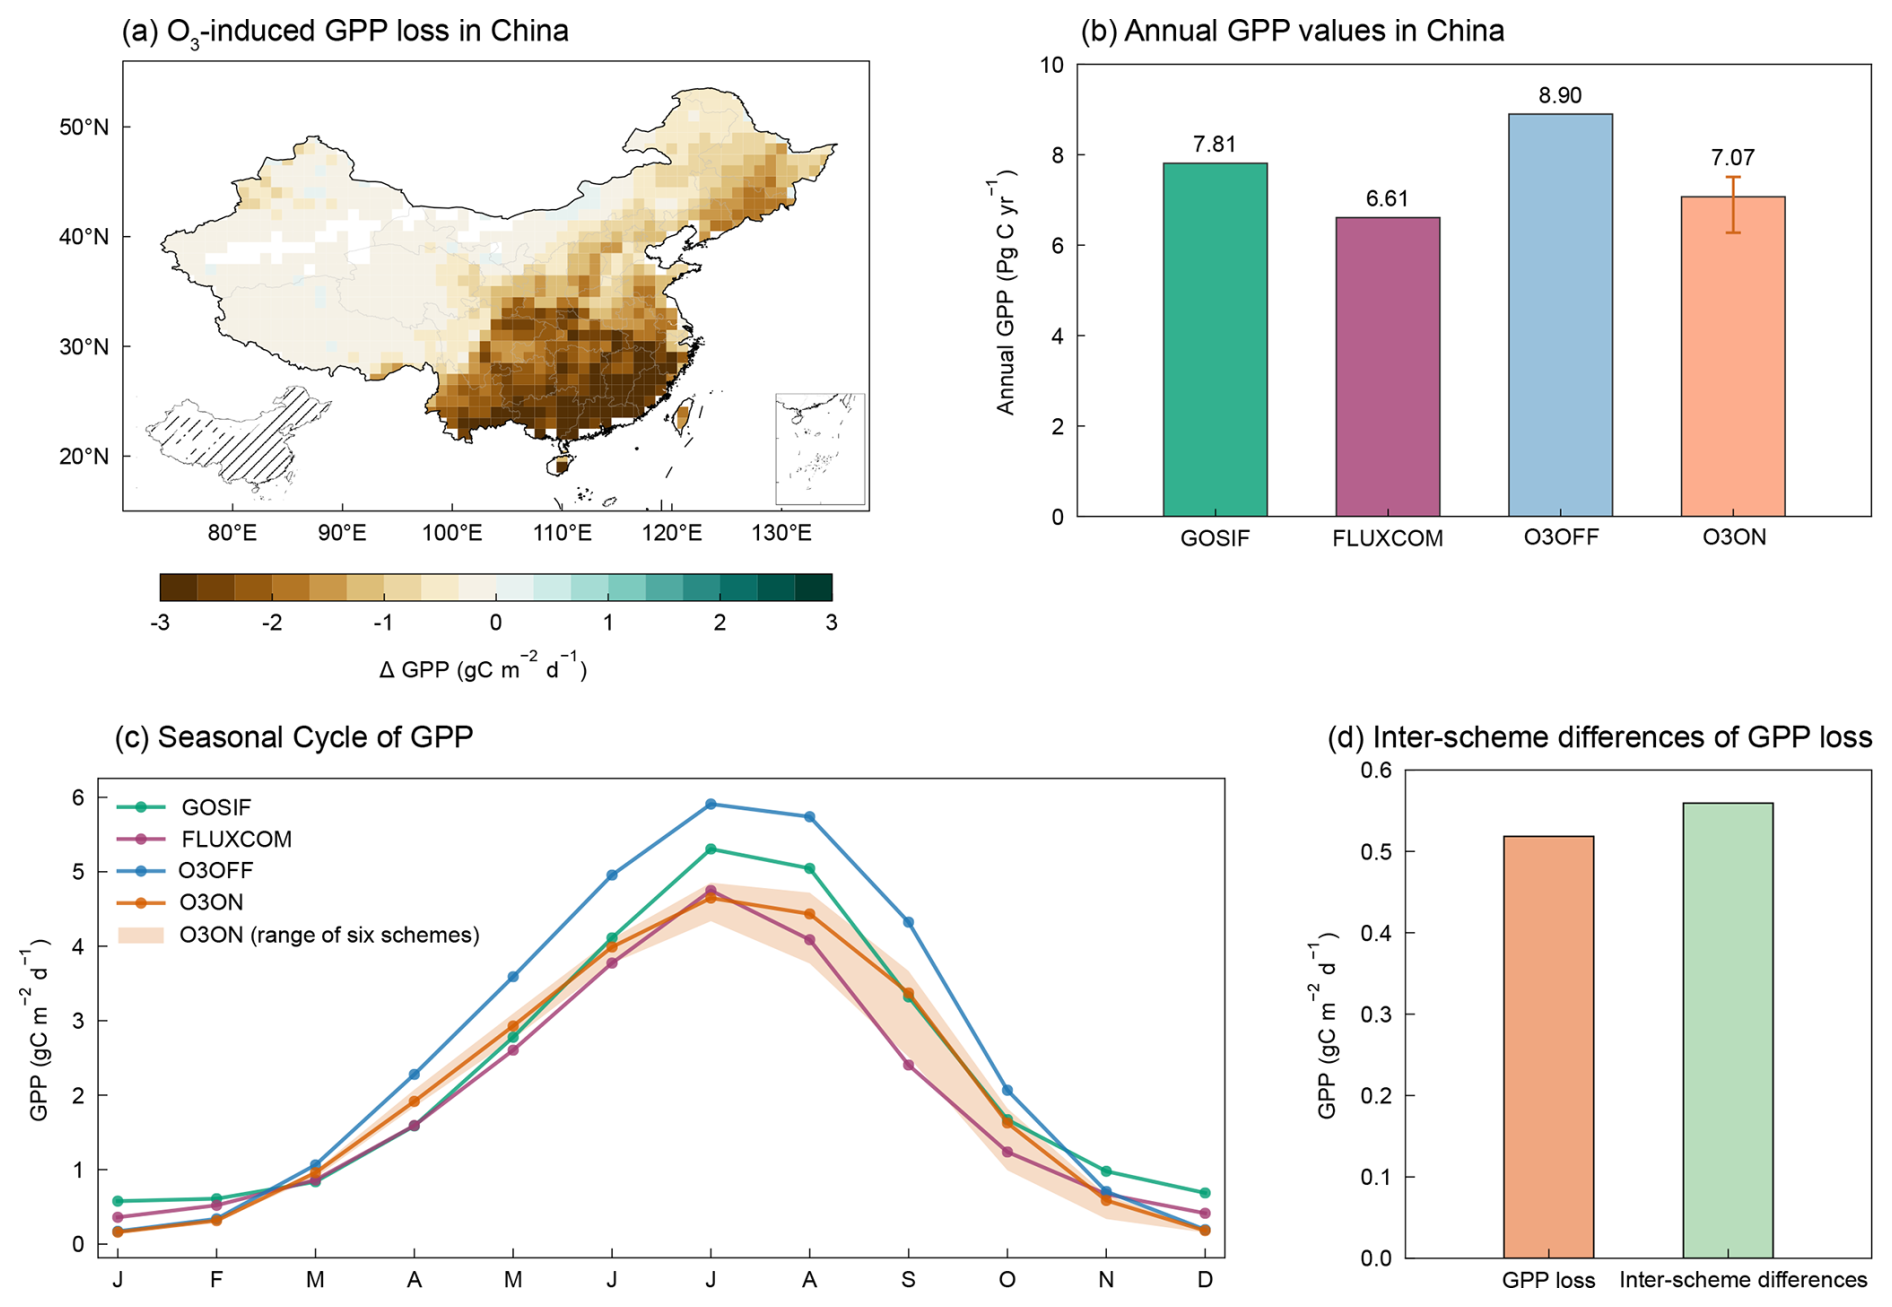
Figure 3Simulated O3-induced vegetation damage and the inter-scheme differences in China. (a) Spatial distribution of O3-induced GPP loss averaged from all six parameterizations during the growing season (April-September). (b) National annual GPP from GOSIF and FLUXCOM benchmarks compared with simulations under O3OFF and O3ON conditions. The O3ON shows the average from six O3 damage experiments, with the error bar indicating inter-scheme discrepancies. (c) Seasonal cycle of GPP in China, with shading indicating the range across the six O3 damage schemes. (d) Comparison between averaged GPP loss and inter-scheme differences of the simulations. The inter-scheme difference is defined as the range across the six parameterizations, calculated as the difference between the maximum and minimum values.
3.3 Inter-scheme variability in PFT-specific O3 sensitivity
Figure 4 shows the spatial distribution of O3-induced GPP loss simulated by the six O3–vegetation damage parameterizations. All schemes reproduce a similar spatial pattern, with the strongest losses in southern China, followed by eastern China, and weak O3 impacts are found in northwestern China where vegetation is sparsely distributed and baseline GPP is low. In contrast to the consistent spatial pattern, the simulated GPP loss differs substantially among the six schemes: Li2024 and S2007 yield the strongest O3-induced GPP reductions, while L2015 and CS2007 simulate the weakest responses, and the LMA-based schemes (LMAgrid and LMApft) show intermediate reductions. The O3-induced suppression in photosynthesis reduces carbon assimilation of plants, which in turn constrains vegetation growth and results in a modest decrease in LAI (Fig. S7). The schemes also diverge in simulated stomatal O3 uptake and associated impacts on stomatal conductance, with L2015 and Li2024 yielding the highest O3 uptake and S2007 the lowest, which consists with the site-level evaluation.
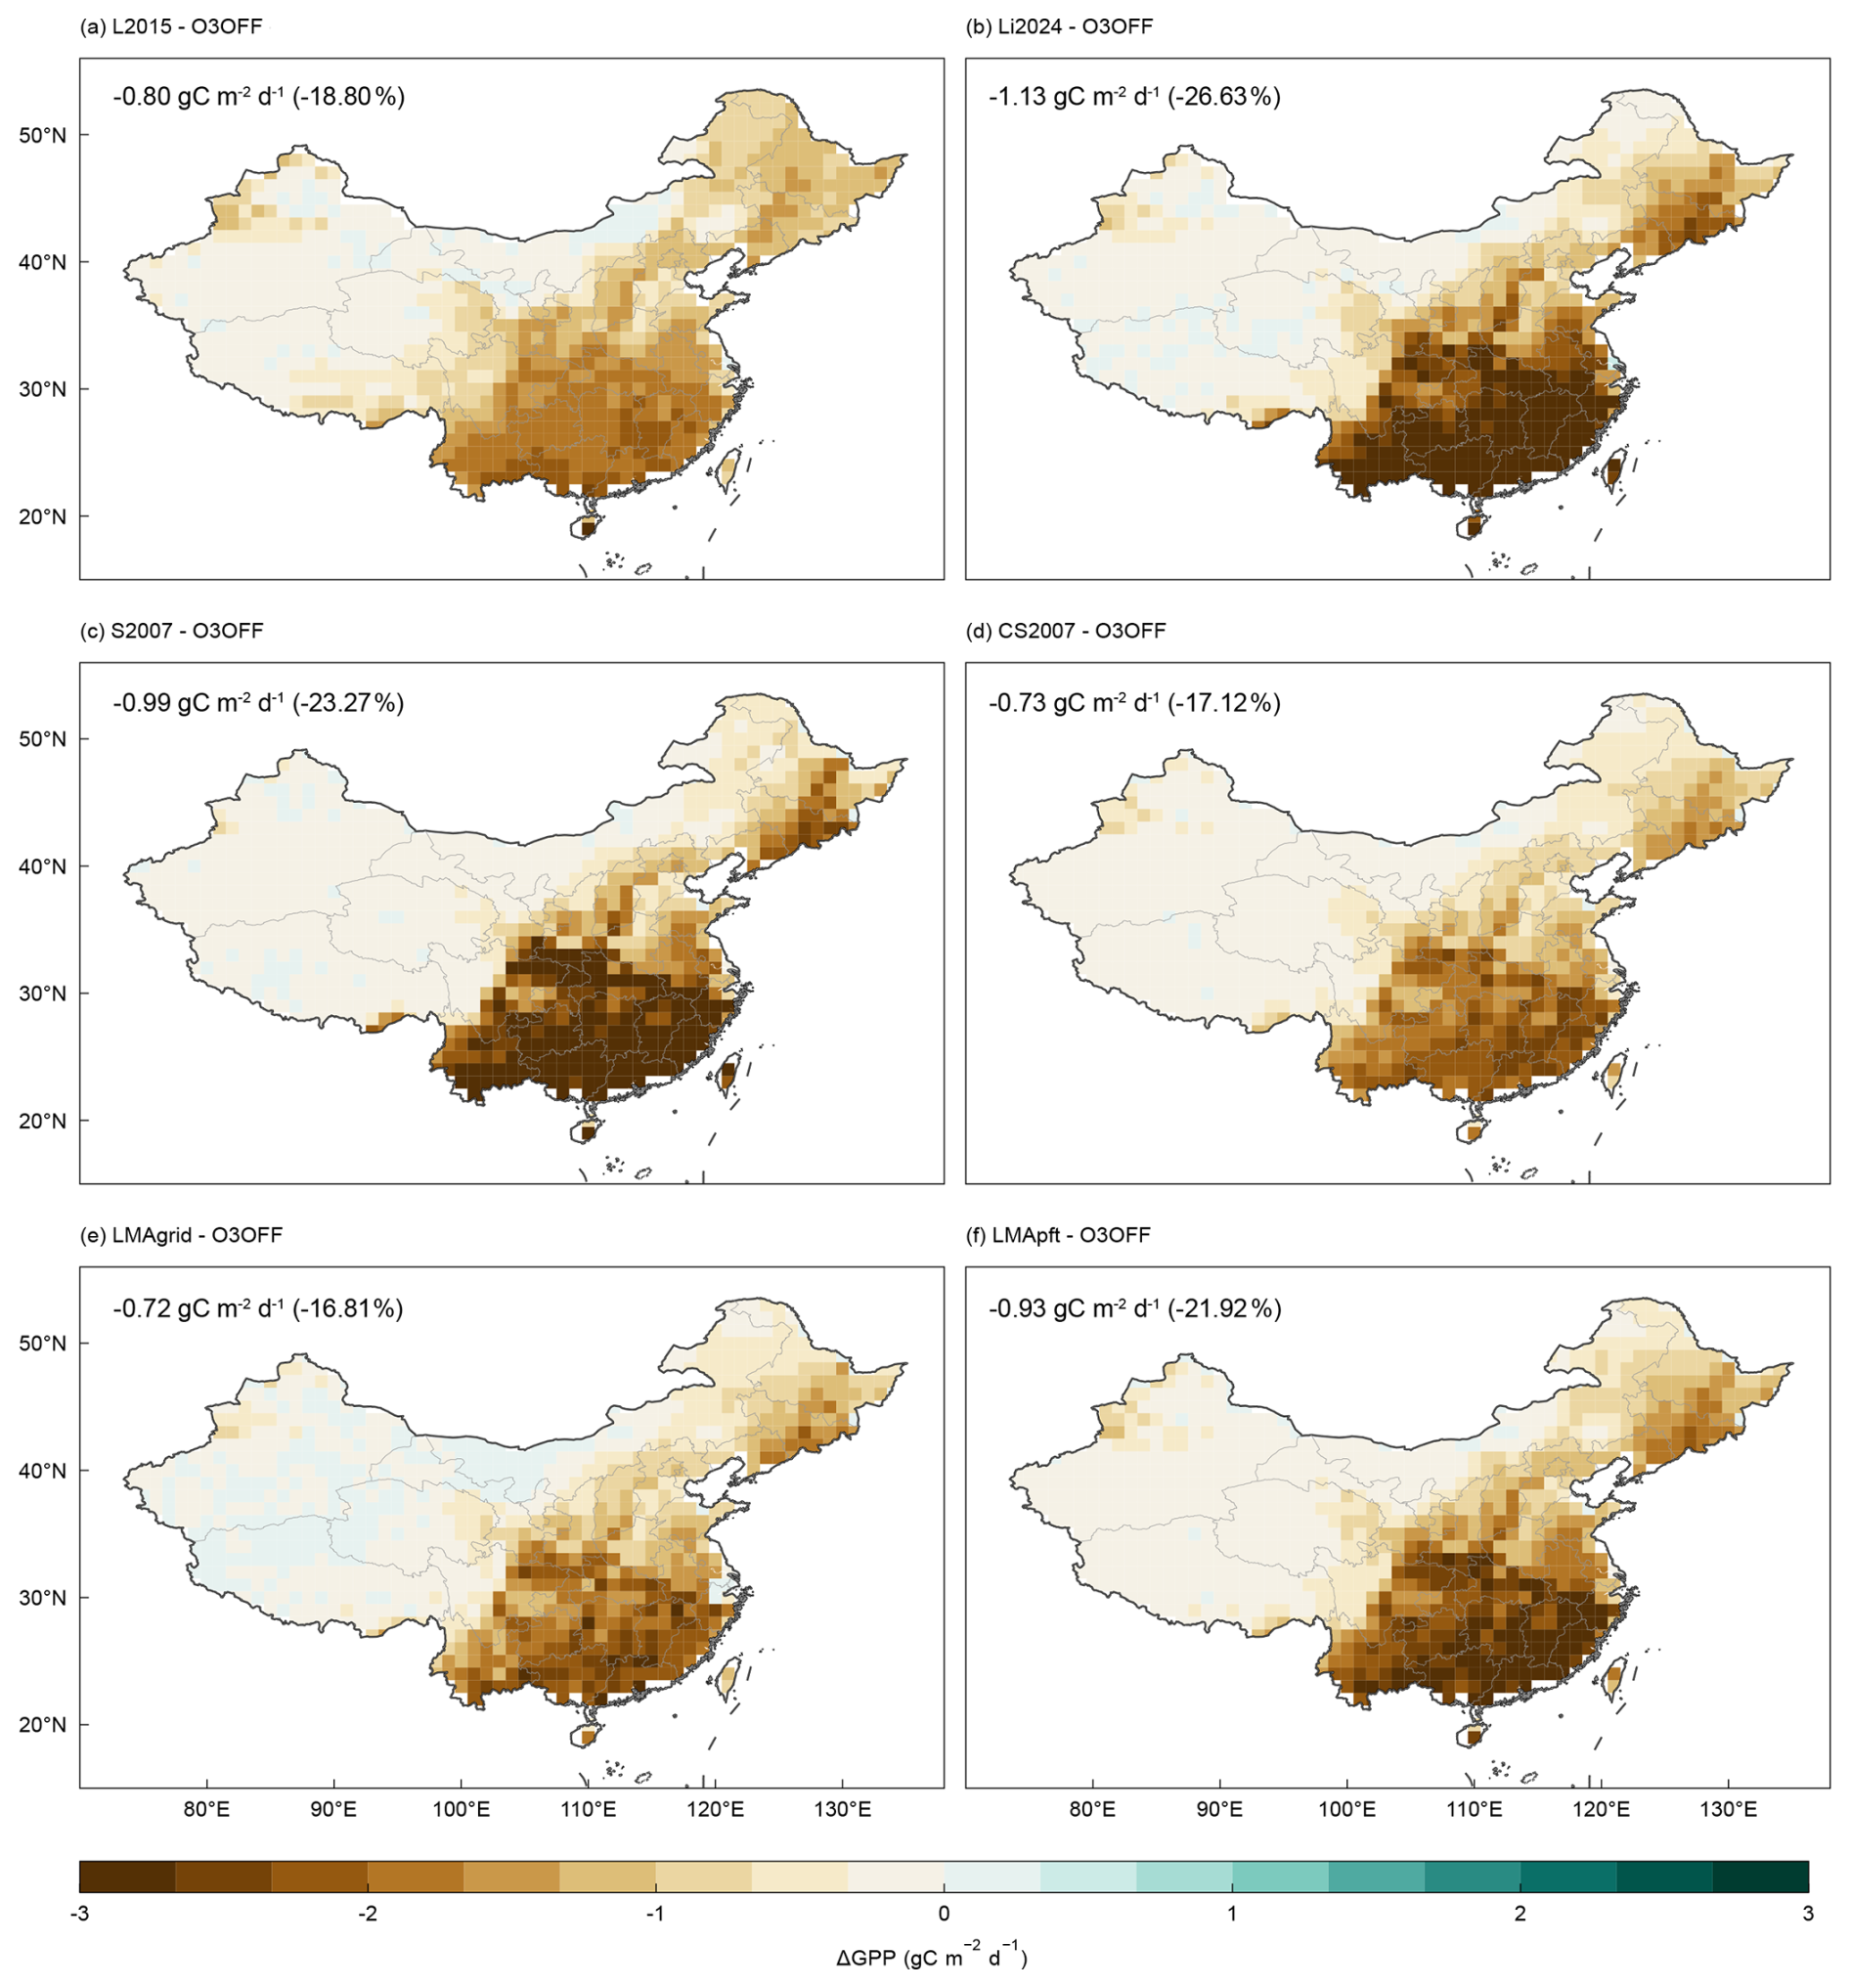
Figure 4Comparison of O3-induced GPP loss in China simulated by six damage parameterizations. The panels show the simulated O3 damage during the growing season (from April–September) for (a) L2015, (b) Li2024, (c) S2007, (d) CS2007, (e) LMAgrid, and (f) LMApft, respectively. The values in the upper-left corner indicate the area-weighted mean GPP loss over China and the corresponding relative change compared with O3OFF.
However, although higher O3 flux generally correlates with increased photosynthetic and stomatal damage within a single scheme, this relationship is not consistent across different parameterizations (Figs. 4, S8 and S9). This mismatch occurs because stomatal O3 uptake represents the amount of O3 entering the leaf, whereas GPP damage depends on how stomatal O3uptake is converted into photosynthetic reduction within each parameterization. The conversion differs among schemes due to discrepancies in response functions, phytotoxic thresholds, sensitivity coefficient settings, and the treatment of photosynthesis–stomatal coupling. For example, L2015 applies separate response functions for photosynthesis and stomatal conductance, and the response functions are either constant or linear with relatively small coefficients for several PFTs. Therefore, high stomatal O3 uptake does not necessarily lead to a strong GPP response. In contrast, the strong GPP reductions simulated by S2007 under relatively low O3uptake mainly reflect its parameter settings, including the prescribed sensitivity coefficients and flux thresholds. After recalibration, CS2007 yields weaker GPP reductions within the same stomatal flux-based framework. These variations indicate substantial differences in vegetation O3 sensitivity among schemes and highlight the need for a systematic assessment of scheme-specific O3 sensitivity. In the subsequent analysis, we quantify the vegetation O3 sensitivity of the six schemes and evaluate their performance against observational constraints.
Based on the simulated O3-induced vegetation damage over China, we derive the response relationships between GPP and O3 uptake for each of the six parameterizations. Specifically, we evaluate the RGPP as a function of PODy at the annual scale. As shown in Fig. 5, significant discrepancies arise among the schemes in the representation of RGPP–PODy relationship. Under the L2015 scheme, RGPP exhibits little sensitivity to increasing O3 uptake. This is because the O3 damage factor in L2015 remains constant for many PFTs, lacking a response to additional O3 absorption. As a result, while O3-induced GPP damage is simulated, the RGPP response to PODy is not captured. In contrast, S2007 displays the highest O3 sensitivity, which explains the substantial reductions in GPP under lower stomatal O3 uptake. The remaining schemes demonstrate moderate sensitivities with a small inter-scheme discrepancy: Li2024 shows a higher sensitivity than the LMA-based schemes, and the O3 sensitivity of CS2007 is slightly lower.
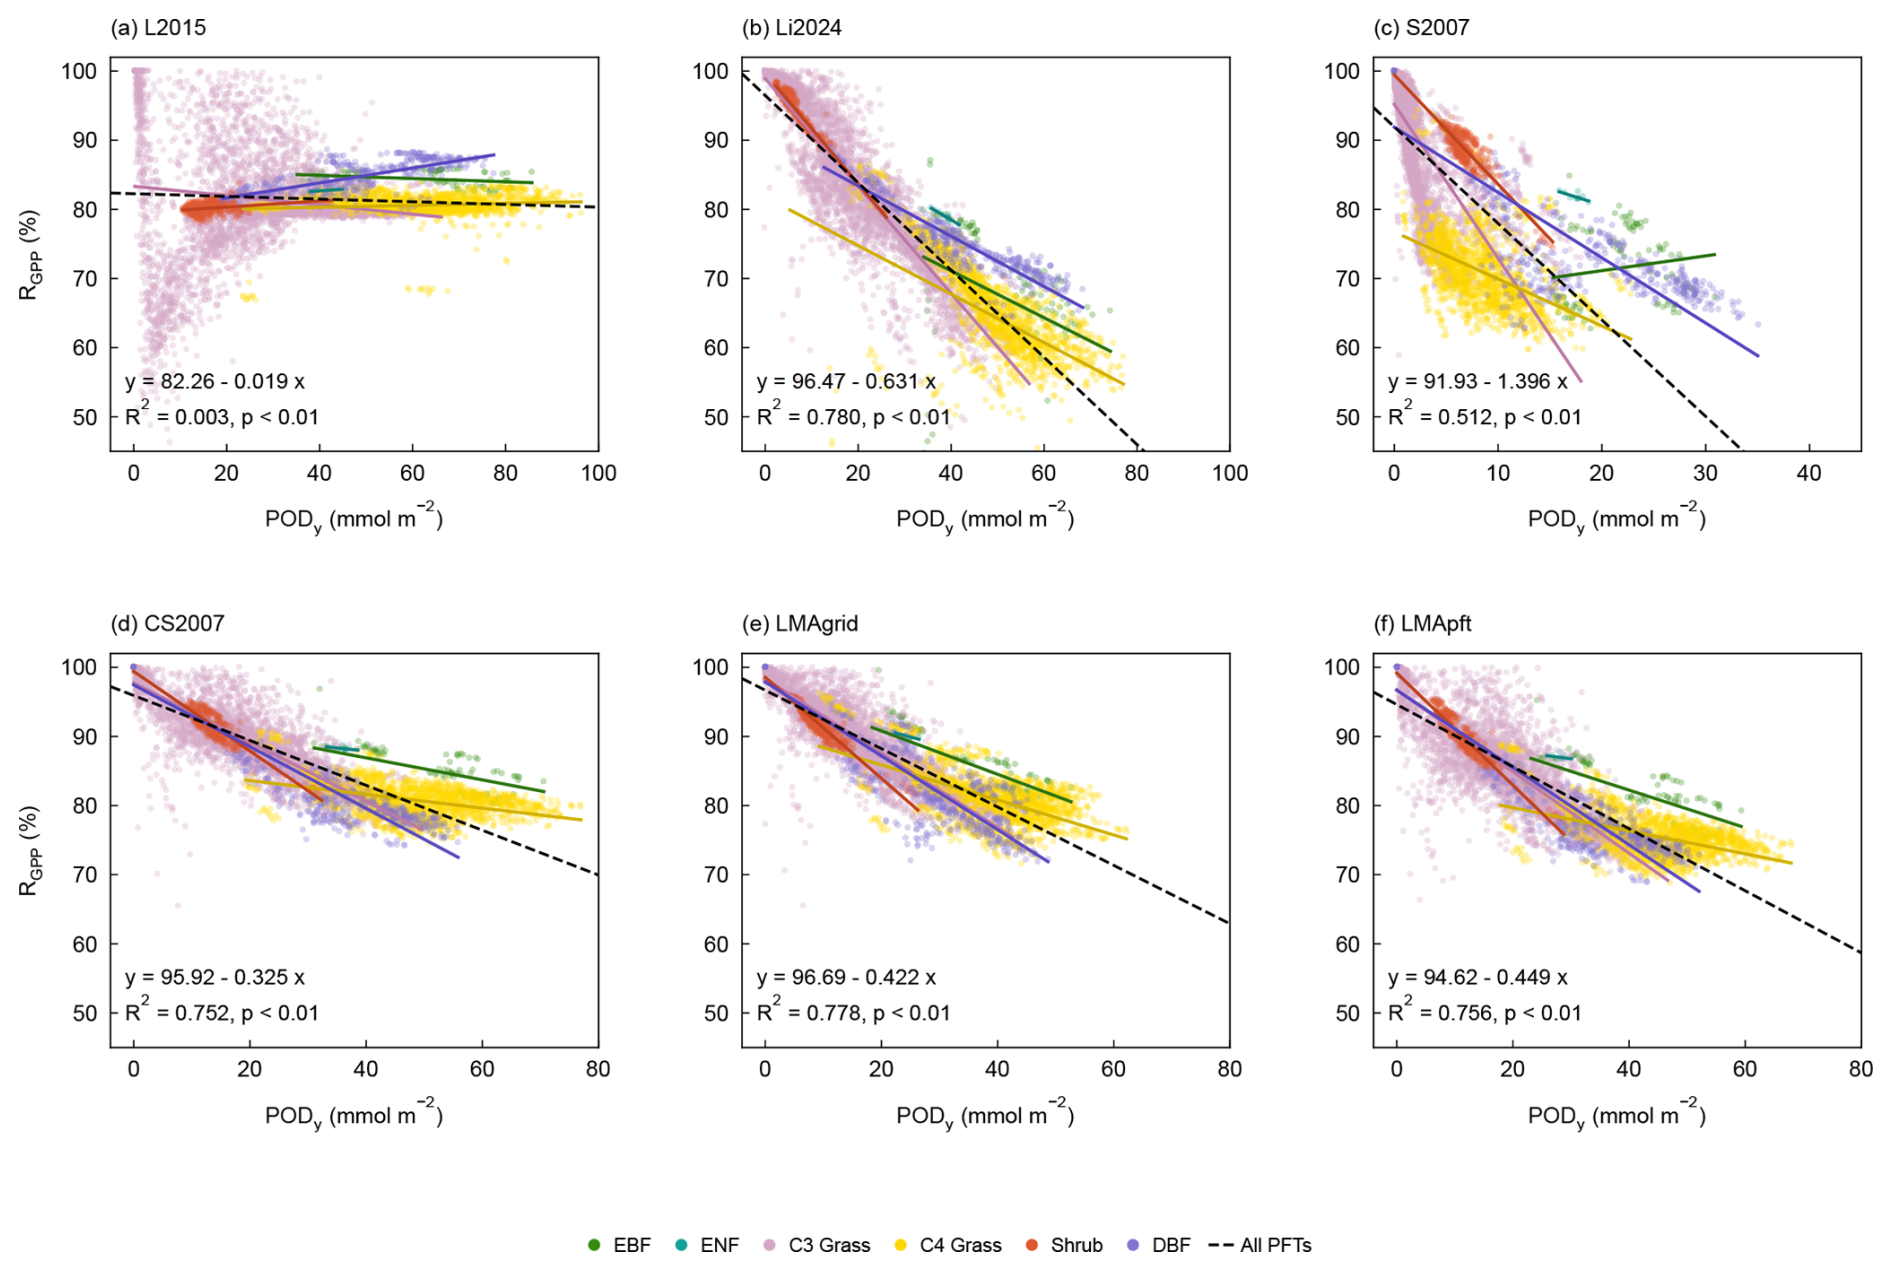
Figure 5Dose–response relationships between relative gross primary productivity (RGPP) and PODy for six O3 damage parameterizations: (a) L2015, (b) Li2024, (c) S2007, (d) CS2007, (e) LMAgrid, and (f) LMApft. Each point represents simulated annual values for one grid cell over China. Colors denote the dominant PFT of each grid cell. Solid lines show PFT-specific linear fits for each scheme, and the dashed lines indicate the overall dose–response relationship for each parameterization across all PFTs. Regression equations and coefficients of determination for each scheme are reported in the corresponding panel.
In addition to inter-scheme differences, significant variation in O3 sensitivity is observed across PFTs. According to our results, C3 vegetation, shrubs, and deciduous broadleaf forests (DBF) exhibit relatively high O3 sensitivity, whereas evergreen broadleaf forests (EBF), evergreen needleleaf forests (ENF), and C4 vegetation show greater tolerance to O3 exposure (Fig. 5). To quantify vegetation O3 sensitivity at the PFT level, we used the slope of the RGPP–PODy relationships in Fig. 5 as an indicator of O3 sensitivity for each PFT. These modelled sensitivities were then compared against observations from Ma et al. (2023) and Li et al. (2024), who synthesized field measurements and experimental results from peer-reviewed literature. The detailed methodology used to derive O3 sensitivity from simulation and observation is provided in Sect. 2.
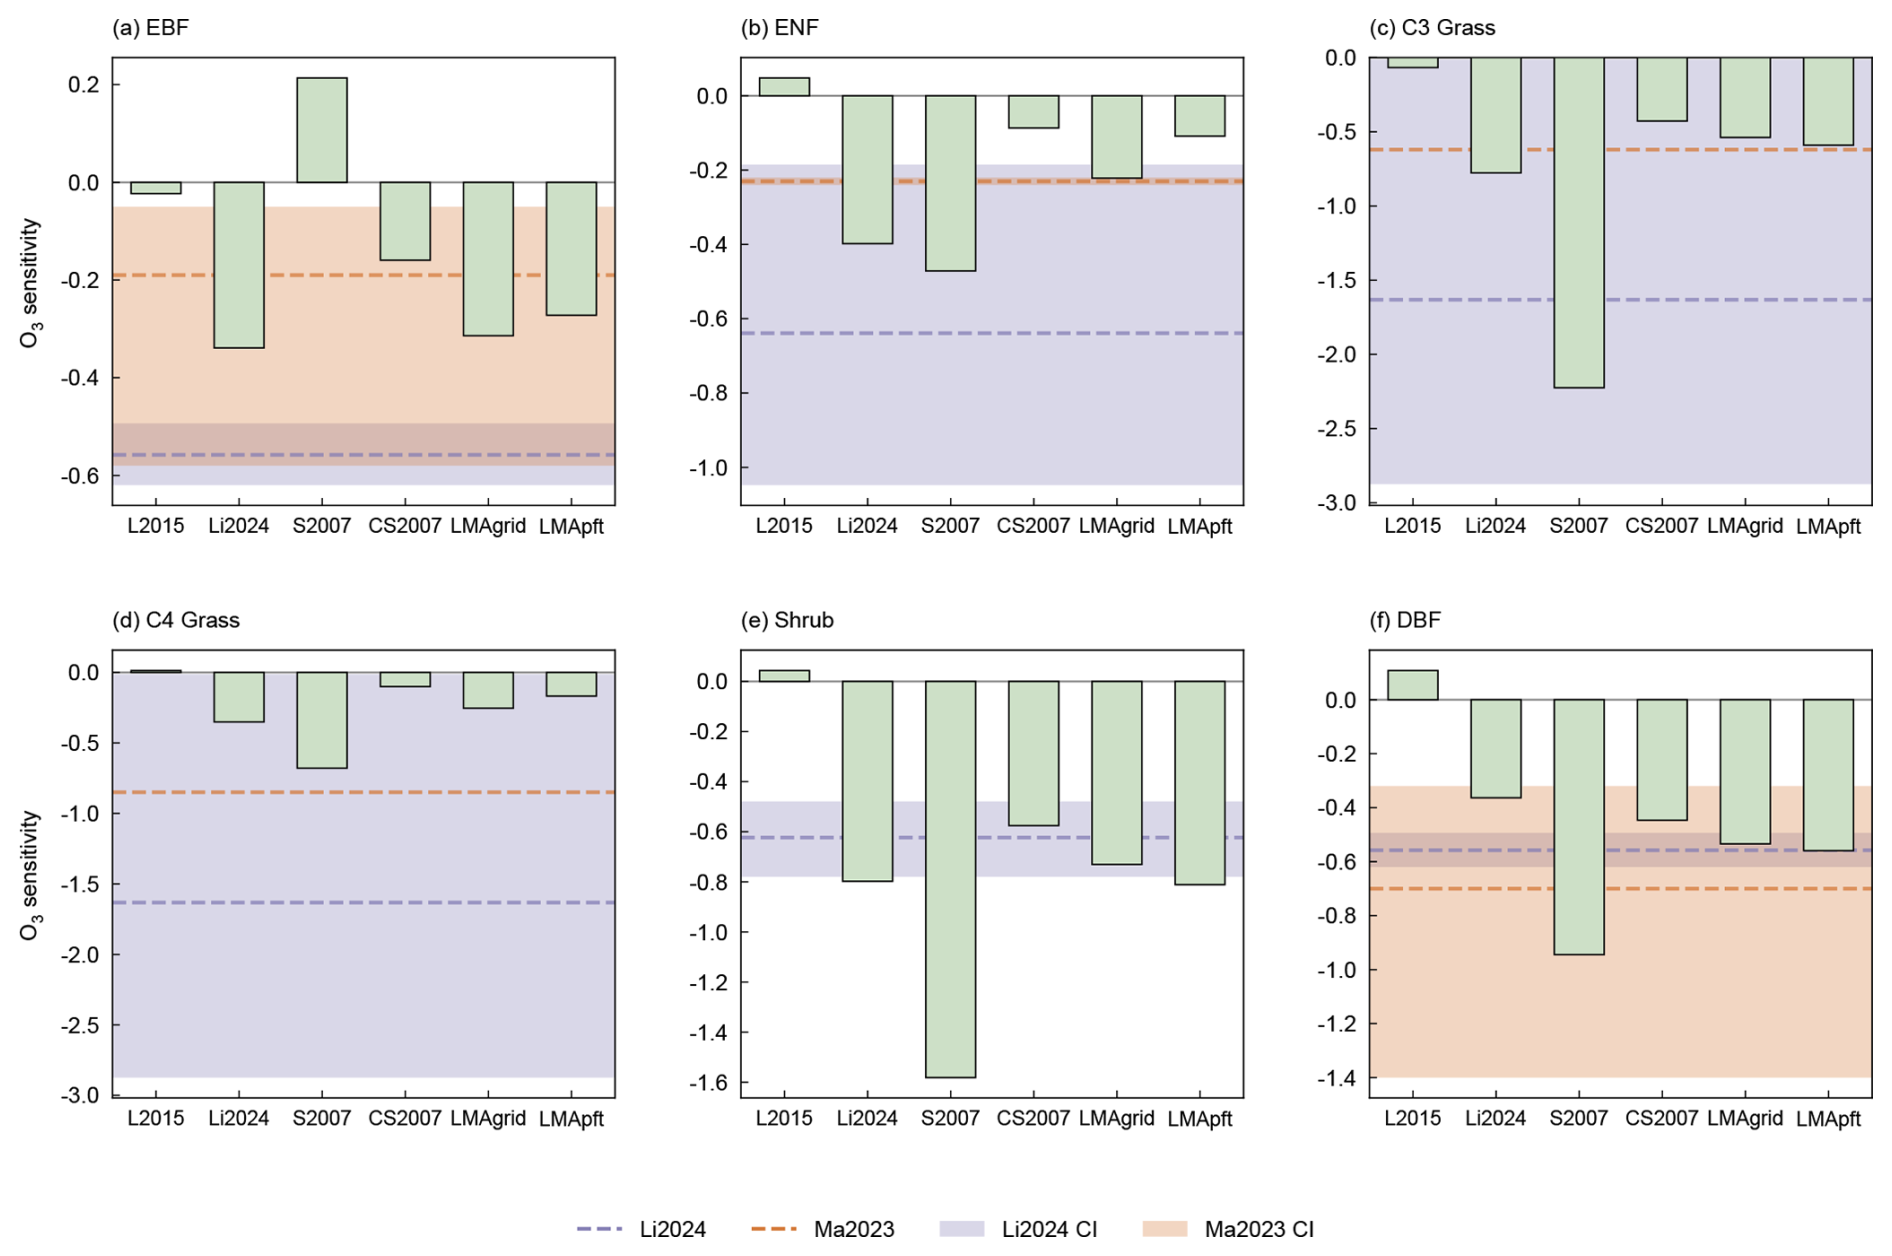
Figure 6PFT-specific O3 sensitivity derived from the dose–response relationships for six O3 damage parameterizations. Results are shown for (a) evergreen broadleaf forest (EBF), (b) evergreen needleleaf forest (ENF), (c) C3 grass, (d) C4 grass, (e) shrubland, and (f) deciduous broadleaf forest (DBF), respectively. Bars denote the simulated O3 sensitivity for each scheme, while shaded bands and dashed lines indicate observational constraints (central estimates and confidence intervals) compiled by Ma et al. (2023) and Li et al. (2024), respectively. For Li et al. (2024), observational sensitivities denote the PFT-specific slopes derived from the photosynthesis–PODy relationships shown in Fig. S3.
Figure 6 compares the modelled PFT-specific O3 sensitivities with observation datasets derived from Ma et al. (2023) and Li et al. (2024). Given the differences in observed O3 sensitivity between these two sources, we present the results from both datasets. Parameterizations exhibiting O3 sensitivities within the confidence intervals of both datasets or between them are considered the most reliable. Schemes that fall within the confidence intervals of only one dataset are considered moderately reliable, while those deviate from both ranges are regarded less reliable. For EBF, the Li2024, CS2007, and the LMA-based schemes fall within the confidence intervals of Ma et al. (2023) and exhibit sensitivities between the two observational datasets. L2015 substantially underestimates O3 sensitivity. As for S2007, a positive slope has been fitted to the RGPP–PODy relationship, which is inconsistent with expected behaviour and likely caused by sparse sampling and its distribution. For ENF, Li2024, S2007, and LMAgrid agree well with the two observational estimates, while L2015, CS2007, and LMApft fall outside the uncertainty range. For C3 and C4 grasses, sensitivity estimates remain highly uncertain due to the limited availability of observational data. For C3 grasses, Li2024 and the LMA-based schemes agree well with Ma et al. (2023), whereas for C4 vegetation, S2007 exhibits the closest agreement with both observational datasets. For shrubs, Li2024, CS2007, and the LMA-based schemes remain consistent with observations. For DBF, the LMA-based schemes show the strongest consistency, while Li2024, S2007, and CS2007 also fall within the observational confidence intervals.
Finally, we averaged the observational O3 sensitivities from the two datasets and benchmarked the simulated sensitivities across PFTs. Scheme performance was assessed using the MAE between modelled and observed sensitivities. Figure 7 shows that Li2024 matches observations most closely (mean bias=0.234; MAE=0.292), followed by LMAgrid and LMApft with similar average biases. CS2007 consistently underestimates O3 sensitivity across all PFTs. S2007 exhibits significant PFT-dependent errors, which results in a large MAE despite a modest mean bias. L2015 shows very weak O3 sensitivity, implying that vegetation responses to additional O3 uptake are not realistically represented. Overall, our assessment based on vegetation O3 sensitivity offers a clear, observation-based benchmark for evaluating reliability of O3–vegetation damage parameterization schemes. Among the six schemes, Li2024 shows the most consistent agreement with observed sensitivities across PFTs, and the LMA-based approaches show similarly good performance with modest bias. This benchmark helps identify the sources of inter-scheme differences in simulated O3 damage and provides a consistent basis for scheme comparison that is less affected by model-dependent biases in simulated GPP.
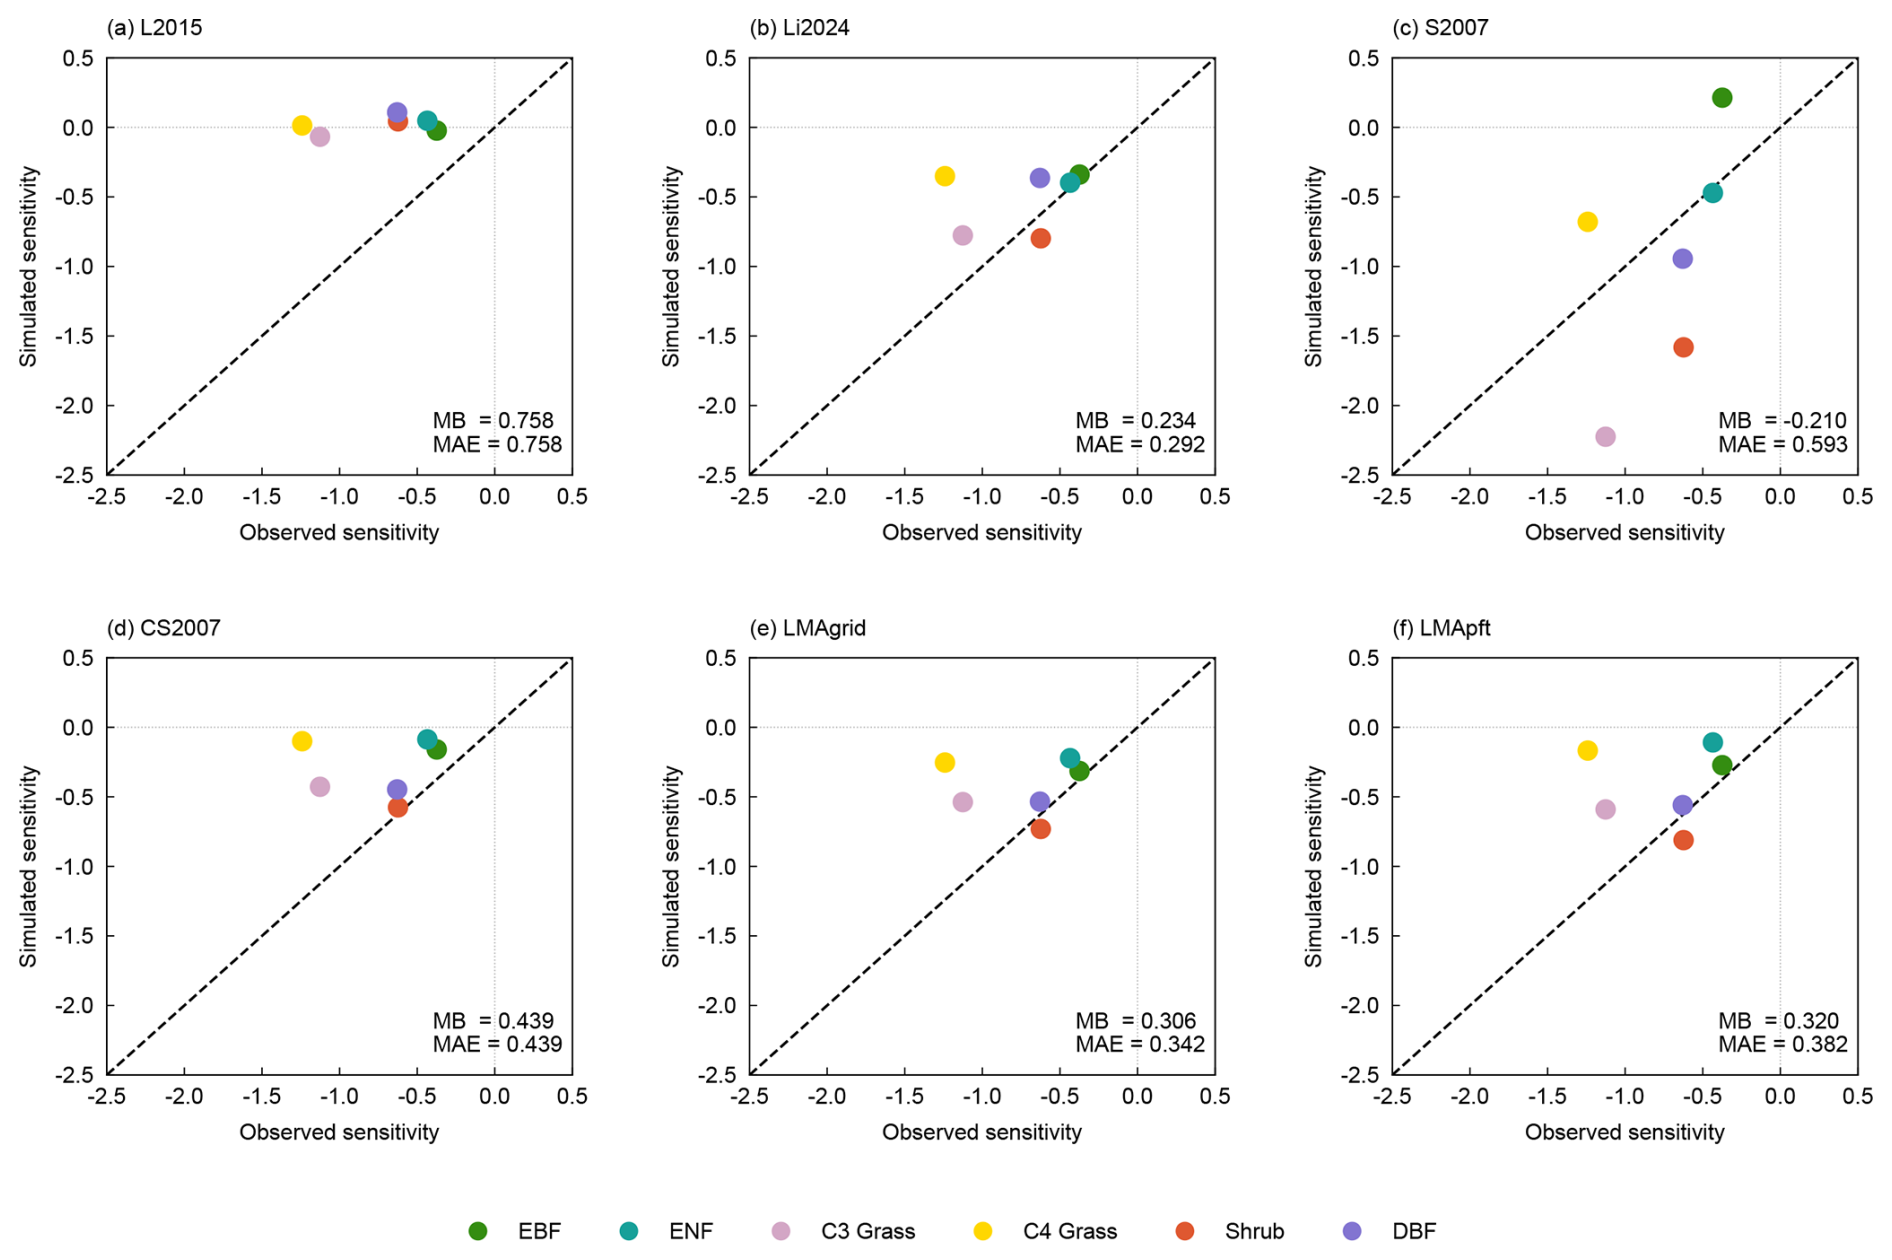
Figure 7Comparison between simulated and observed O3 sensitivity for six O3 damage parameterizations. For each scheme, scatter plots show O3 sensitivity simulated for different plant functional types (PFTs) against corresponding observational estimates, with colors denoting each PFT. The 1:1 line indicates agreement between simulations and observations. The mean bias (MB) and mean absolute error (MAE) of each scheme are reported in panels to summarize the deviation of simulated O3 sensitivity from observations.
3.4 Trait-based refinement of cumulative uptake of O3
Although the Li2024 scheme performs well in the inter-scheme comparison, our SSiB4/TRIFFID implementation shows strong CUO accumulation, which affects the simulated seasonal cycle of GPP. Unlike S2007 and the LMA-based schemes, which diagnose O3 damage from instantaneous stomatal O3 flux, Li2024 links the O3 damage factor to CUO, which is updated each timestep through uptake, decay, and healing process (see Sect. 2.2). In the original implementation, the LAI-based healing term reduces CUO mainly during leaf area expansion, while deciduous PFTs lack a continuous decay pathway after LAI reaches its seasonal peak. As a result, the accumulated CUO can lead to a persistent increasing suppression of photosynthesis over the growing season (Fig. 8a). Consequently, this carry-over effect from early-season CUO accumulation leads to a pronounced late-season GPP reduction and biases the simulated seasonal cycle (Fig. 8c).
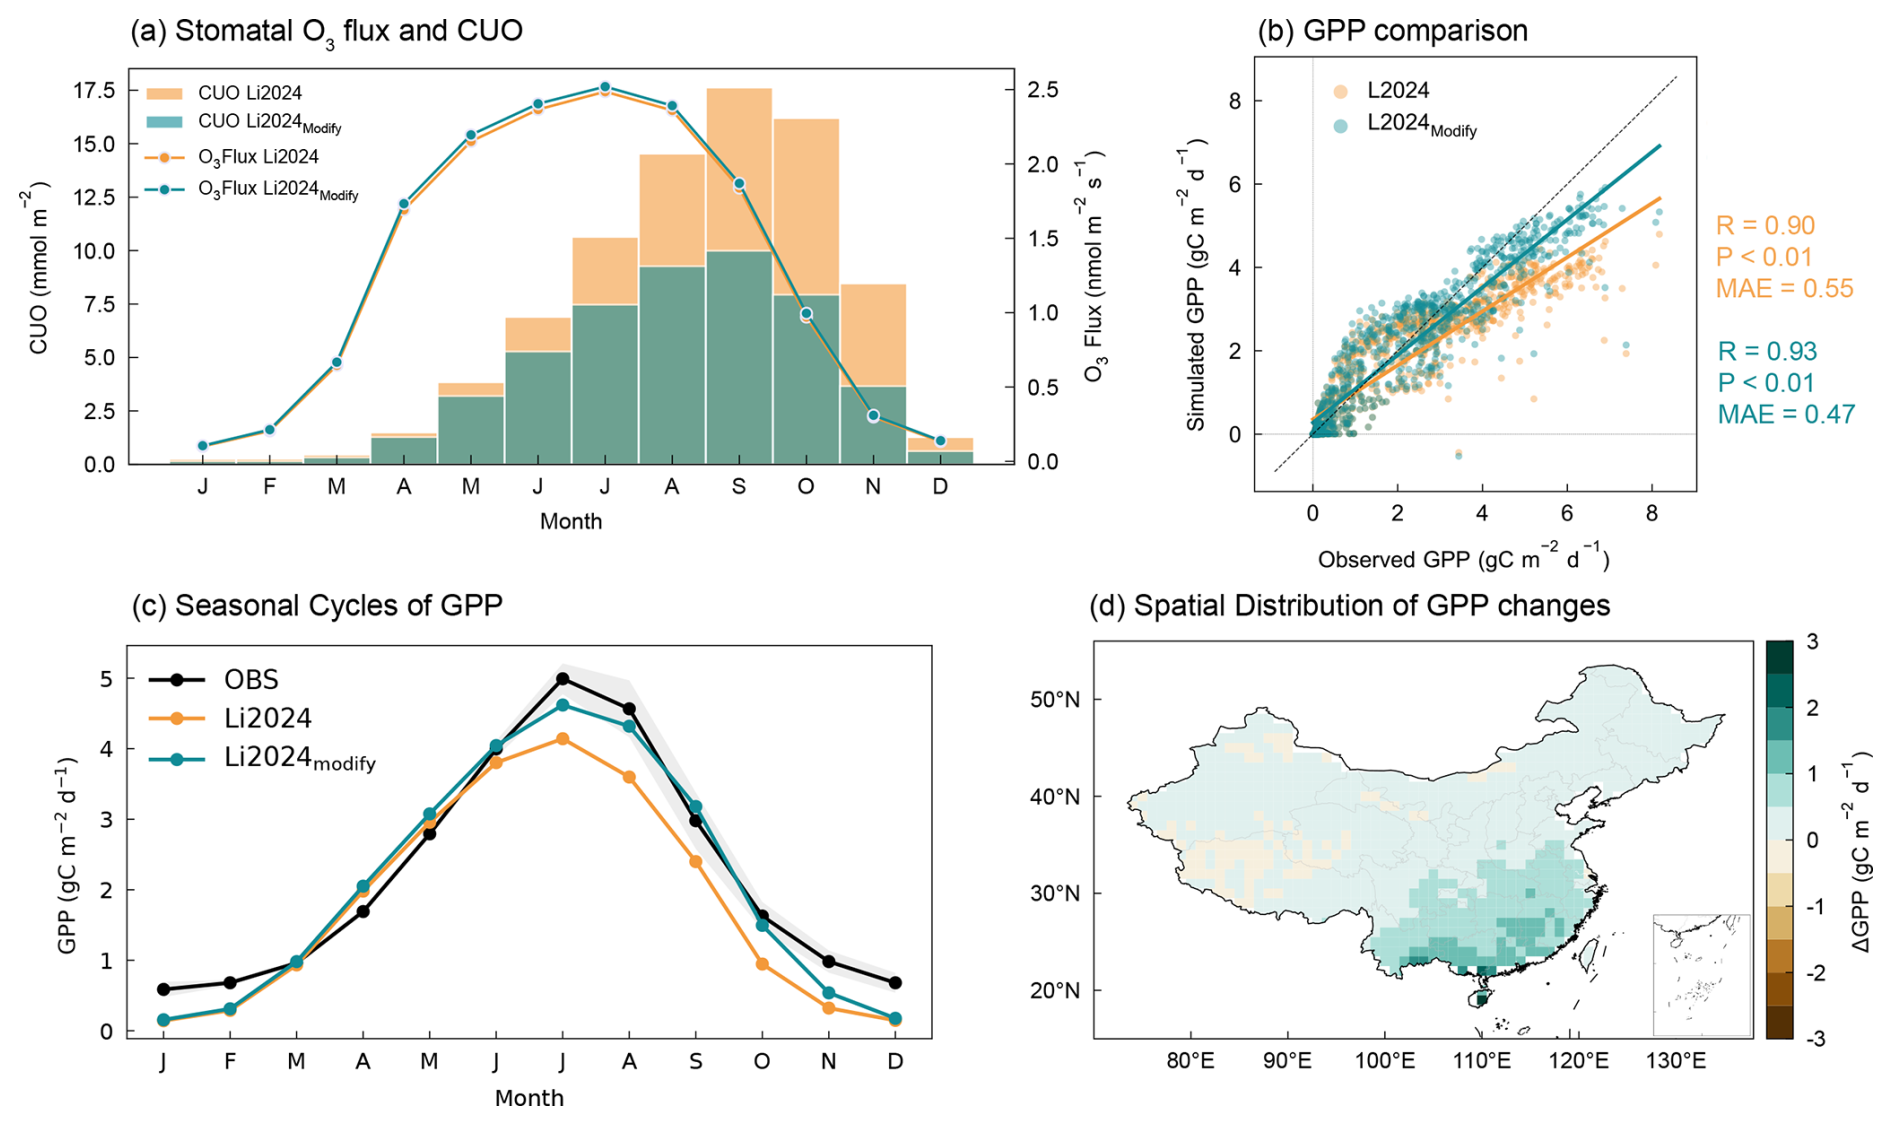
Figure 8Comparison between the original and refined Li2024 parameterizations. (a) Instantaneous stomatal O3 flux and cumulative uptake of O3 (CUO) simulated by the original Li2024 and the refined Li2024 formulation (Li2024modify). (b) Grid-level comparison of simulated and observed annual mean GPP. The observed GPP is calculated as the mean of GOSIF and FLUXCOM products at each grid cell. (c) Seasonal cycles of GPP from observations, the original Li2024, and the refined Li2024modify scheme. (d) Spatial patterns of annual GPP changes between the original and refined Li2024 formulations. The black line in (c) denotes the mean of GOSIF and FLUXCOM observations, and the grey shading indicates the range between these two products.
To address these issues, we implement two adjustments to Li2024. First, we extend the decay term of CUO to all PFTs, instead of restricting it to evergreen species. Second, we updated the key parameter lleaf by prescribing PFT-specific values using observed leaf lifespan estimates. These updates are designed to reduce persistent CUO carry-over during the mid-to-late growing season. As shown in Fig. 8a, the revised formulation (Li2024modify) shows a pronounced reduction in CUO accumulation with a similar instantaneous stomatal O3 uptake, indicating a altered CUO dynamics rather than changes in stomatal absorption. The reduced CUO weakens O3-induced GPP damage, lowering the annual GPP MAE by 15.9 % and increasing the spatial correlation with observations (Fig. 8b). Notably, the improvement is stronger under high-GPP conditions, where the original Li2024 scheme exhibits pronounced underestimations, implying that the overestimation of GPP damage is largely reduced in densely vegetated regions and seasons. As for seasonality, the reduced CUO limits the carry-over of accumulated O3 stress. Consequently, GPP increases later in the growing season, particularly in summer and autumn with high O3 exposures and high ecosystem productivity, which improves the simulated seasonal cycle of GPP compared with observations (Fig. 8c). Spatially, the strongest GPP recovery occurs over southern China (Fig. 8d), a hotspot of stomatal O3 uptake and O3-induced GPP reductions (Fig. 8d). Overall, the trait-constrained CUO attenuation treatment reduces the late-season CUO carry-over and moderates the associated GPP suppression, with the largest effects concentrated in densely vegetated areas of southern China.
4.1 PFT-specific O3 sensitivity in current O3–vegetation damage parameterizations
In this study, we implemented six up-to-date O3–vegetation damage parameterizations into SSiB4/TRIFFID to assess the impact of surface O3 pollution on vegetation in China. Our analysis revealed significant variation in the simulated O3 sensitivity across these schemes, largely attributed to discrepancies in how vegetation O3 sensitivity is represented within each scheme.
Despite the diverse physical processes emphasized by the individual schemes, all flux-based O3 damage parameterizations consistently recognize that vegetation O3 sensitivity varies substantially across PFTs. This variability is influenced by multiple factors, including foliar structural traits, stomatal regulation, antioxidant capacity, detoxification pathways, and underlying differences in photosynthetic metabolism, such as C3 versus C4 pathways (Hayes et al., 2007; Li et al., 2017; Agathokleous et al., 2020). Empirical studies have shown that evergreen species generally exhibit greater resilience to O3-induced oxidative stress compared to deciduous species, likely due to higher antioxidant enzyme activities and larger leaf mass per area (LMA) in evergreen leaves (Li et al., 2017). Leaves with high LMA are typically characterized by thicker or denser palisade mesophyll layers, which reduce O3 exposure per unit leaf mass and enhance antioxidant capacity through a larger apoplastic compartment (Feng et al., 2018). Therefore, LMA has been identified as a key factor in governing O3 sensitivity at the leaf level in recent studies (Agathokleous et al., 2020; Ma et al., 2023; Feng et al., 2021). In addition, species with shorter leaf lifespans tend to exhibit higher O3 sensitivity. Fast-growing species, such as grasses and crops, typically have lower leaf toughness and higher specific leaf area, which results in weaker structural and biochemical defences against environmental stressors, including O3 exposure (Ma et al., 2023). Moreover, recent studies have observed greater O3 sensitivity in C3 compared to C4 plants (Li et al., 2023). This difference can be attributed to the CO2-concentrating mechanism in C4 plants, which improves photosynthetic efficiency while reducing stomatal conductance. The lower stomatal conductance in C4 plants limits O3 uptake, while the higher photosynthetic efficiency supports enhanced detoxification processes and antioxidant biosynthesis, thereby reducing O3-induced damage and increasing O3 tolerance.
Consistent with these findings, our results indicate that shrubs, C3 grasses, and deciduous broadleaf trees exhibit higher O3 sensitivity, whereas C4 grasses, evergreen broadleaf forests, and evergreen needleleaf forests tend to be less sensitive (Fig. 6). Notably, the insufficient observation evidence of C3 and C4 species limited the ability to accurately assess O3 sensitivity between schemes, resulting in a broad confidence interval when comparing simulations with observed data. By comparing the results of all the schemes, we found that the recently-developed Li2024 scheme shows the closest agreement with observations in terms of simulated O3 sensitivity. This advantage can be attributed to its nonlinear formulation of plant responses to CUO, which is built upon an extensive database of more than 4000 experimental measurements (Li et al., 2024). Similarly, the LMA-based approaches also produced relatively accurate O3 sensitivity estimates due to its uniformed expression based on PFT- or grid-specific LMA, a key trait that governs O3 sensitivity across diverse plant species and functional types (Agathokleous et al., 2020; Feng et al., 2018). In contrast, S2007 and L2015 schemes exhibited larger deviations from the observational O3 sensitivity for several PFTs. For S2007, this likely reflects the selected sensitivity parameter set rather than a deficiency in the stomatal flux-based framework. For L2015, the deviations are more closely related to its linear or constant response functions and the relatively limited observational basis available when the scheme was proposed (Li et al., 2024). Consequently, these earlier schemes are less reliable in simulating O3 sensitivity compared to the more recent Li2024 and LMA-based parameterizations.
In summary, our study applies a sensitivity-based comparison approach that offers a reliable and robust framework for cross-scheme evaluation. This approach avoids the influence of model-specific biases and mitigates potential disturbance caused by model configurations. Our results underscore the importance of incorporating both observational constraints and mechanistic understanding from field experiments into O3 sensitivity parameterizations. This is essential for improving the realism of O3-damage simulations and for developing more robust parameterizations that can represent the diverse responses of terrestrial ecosystems to O3 exposure.
4.2 Improved CUO representation with trait-informed decay and LAI-based healing processes
Our evaluation shows that Li2024 provides the closest agreement with observed O3 sensitivity among the tested schemes. However, when implemented in SSiB4/TRIFFID, its CUO-based formulation also highlights the importance of how accumulated O3 stress is attenuated through the growing season. This is particularly important for deciduous vegetation, because the LAI-related healing term mainly operates during periods of canopy expansion. Once LAI reaches its seasonal peak and becomes stable or begins to decline, this healing pathway becomes ineffective to attenuate the accumulated O3 stress. To reduce this carry-over of CUO, we extended the decay term to all PFTs to provide a gradual attenuation for accumulated O3 stress. As shown in Sect. 3.4, the refined treatment reduces this carry-over effect and improves the simulated magnitude and seasonality of GPP. These results indicate that treating decay and healing as complementary processes is important for representing the seasonal evolution of CUO.
Experimental and modelling studies consistently indicate that vegetation responses to O3 exposure can be moderated over time through multiple physiological and canopy-level processes (Heath et al., 2009; Felzer et al., 2009). On the one hand, exposure to O3 can severely impair photosynthesis and stomatal functions, with the resulting stomatal closure acting as negative feedback that constrains further O3 uptake (Li et al., 2017). On the other hand, elevated O3 exposure alters hormone regulation and increases apoplastic antioxidant capacity (e.g., ascorbate, phenolic, glutathione), which can directly react with O3 and scavenge ROS, thereby enhancing the O3 tolerance (Castagna and Ranieri, 2009; Heath et al., 2009; Li et al., 2023). Recent evidence from tree species suggests that higher O3 doses can stimulate antioxidant production, which helps mitigate oxidative stress and enhance O3 tolerance (He et al., 2025). O3 is also known to damage leaf cells and accelerate senescence, while plants may partly offset these effects through cellular repair and the production of new leaves (Heath and Taylor, 1997; Grulke and Heath, 2020). Taken together, these mechanisms indicate that O3 damage is dynamically moderated over time and cannot be fully represented by a fixed PODy threshold alone (Heath et al., 2009). Motivated by this evidence, we apply the decay term for all PFTs as a simplified representation of the gradual attenuation of O3-induced oxidative stress, accompanied by the healing term to account for the dilution from emergence of new, undamaged leaves (Felzer et al., 2009; Li et al., 2024).
In our refined treatment, the decay term should not be interpreted as an explicit expression of a specific physiological mechanism. Instead, it provides a simplified representation of the gradual attenuation of accumulated O3 stress within the existing CUO framework. Observational leaf longevity is used here to provide a practical trait-based constraint for this process, as it represents the typical timescale over which O3 exposure can affect leaves before leaf fall or replacement, after which the accumulated O3 effect should be removed from the canopy. With these modifications, CUO accumulation is reduced through the growing season, which improves GPP simulations in both spatial patterns and seasonal cycles. This trait-based decay refinement acknowledges that O3 impacts on vegetation are dynamically regulated by physiological processes and feedbacks, rather than solely controlled by the rise in O3 uptake. Despite these improvements, an important uncertainty remains regarding the physiological interpretation of the gradual decay term. Direct observations and experimental evidence are currently insufficient to determine how canopy CUO evolves during leaf senescence, or to constrain the timescale over which accumulated O3 stress declines. Therefore, Li2024modify is not intended to explicitly resolve individual physiological processes, such as antioxidant regulation, detoxification, or cellular repair. Instead, it adopts a simplified, trait-informed treatment in which PFT-specific leaf longevity is used to inform the characteristic timescale of CUO attenuation. During leaf fall, a decrease in canopy-level CUO may reflect the turnover and removal of previously exposed foliage. The improvement in GPP simulations shows that the refinement is useful at the model level, but it does not directly validate its physiological interpretation. Further experimental and observational studies are therefore needed to quantify how antioxidant regulation, detoxification, cellular repair, and foliage turnover jointly regulate the persistence and attenuation of O3 effects over the leaf life cycle. Such knowledge would help clarify how vegetation moderates chronic O3 stress over time and provide a stronger mechanistic basis for representing O3 stress dynamics and long-term vegetation responses in numerical models.
4.3 Limitations
In this study, we integrated six flux-based O3–vegetation damage parameterizations into SSiB4/TRIFFID, and quantified the impacts of tropospheric O3 on terrestrial vegetation in China in the 2010s. Based on comprehensive evaluation of inter-scheme differences and refinement of O3 decay representations, our work provides a more comprehensive assessment of O3-induced GPP losses in China. Nevertheless, there are some limitations that should be acknowledged.
First, nitrogen deposition was not considered in this study. Given that nitrogen fertilization can alleviate nutrient limitation and thereby partially offset O3-induced productivity losses (Ren et al., 2011), this exclusion therefore introduces uncertainty into the estimated O3 damage, especially for nitrogen-limited regions. Moreover, although the effects of CO2 and vapor pressure deficit (VPD) on vegetation were included in our simulations, their interactions with O3 damage were not explicitly separated. Both elevated CO2 and increased VPD can regulate stomatal conductance and thereby modify stomatal O3 uptake. Therefore, the simulated O3 responses may incorporate indirect effects of these concurrent drivers, introducing additional uncertainty in the attribution of O3 impacts. In addition, our offline framework is not able to capture feedbacks mediated by land–atmosphere coupling. Previous studies indicate a positive O3–vegetation feedback, whereby O3-induced physiological and biophysical responses can both reduce O3 removal and enhance photochemical production. In particular, O3-driven stomatal closure weakens canopy O3 uptake and deposition, while the associated surface warming accelerates biogenic VOC emissions and O3 formation (Jin et al., 2023; Cao et al., 2024). Accordingly, the absence of land–atmosphere-chemistry feedbacks in our offline framework may contribute to a slightly weaker response and a modest underestimation of O3-induced vegetation damage relative to coupled simulations (Zhu et al., 2022; Jin et al., 2023). Our results should therefore be interpreted as conservative with respect to fully coupled modelling, and our intercomparison and refinement efforts offer a solid baseline for quantifying O3–vegetation interactions under coupled frameworks.
China is widely recognized as a hotspot of O3 pollution and associated vegetation impacts. As surface O3 levels rise while observations on O3–vegetation interactions remain limited, quantitative assessments increasingly rely on numerical models and parameterizations. By implementing six flux-based schemes in a unified SSiB4/TRIFFID framework, we estimate that O3 reduced China's national GPP by nearly 21 % in the 2010s, yet losses vary markedly across schemes (17 %–27 %). The inter-scheme discrepancies arise from the representation of plant O3 sensitivity and its dependence on PFT. Comparisons with published dose–response relationships indicate that the recently developed Li2024 and LMA-based schemes better reproduce observed O3 sensitivities, consistent with their incorporation of broad observational evidence and trait-informed physiological constraints. Furthermore, we refined the Li2024 formulation by applying both decay and healing processes across PFTs and updating leaf longevity with observational constraints. This treatment reduces late-season CUO carry-over and improves the simulated magnitude and seasonal cycle of GPP. Overall, our work highlights the importance of observation- and physiology-based constraints on O3 damage parameterizations for robust assessment of O3 impacts on vegetation. Looking ahead, expanding flux measurements and fumigation experiments, particularly in China's natural ecosystems, will provide stronger observational constraints to improve simulation of O3–vegetation interactions. By narrowing uncertainty, the advanced parameterizations and models can provide a firm scientific basis for policy-relevant quantification and projection of O3-driven ecological risks and the mitigation potential of emission controls in a warming future.
The code of the SSiB4/TRIFFID model with six O3-damage parameterizations is available at https://doi.org/10.5281/zenodo.18927710 (Li, 2026).
Results of all simulations (listed in Table 2 and 3) are shared at https://doi.org/10.5281/zenodo.18927710 (Li, 2026). The original source data are publicly available with details listed in Table S3.
The supplement related to this article is available online at https://doi.org/10.5194/gmd-19-8447-2026-supplement.
LL, BQ, and WG designed the research, LL and SZ developed the model code, LL performed modelling, data analyses, visualization and wrote the manuscript draft. BQ, XM, CC, JC and YN helped with data collection, advised on concepts and methods, and contributed to the interpretation of the results. XH, HC, and WG reviewed and edited the paper. All authors commented on and revised the manuscript.
The contact author has declared that none of the authors has any competing interests.
Publisher's note: Copernicus Publications remains neutral with regard to jurisdictional claims made in the text, published maps, institutional affiliations, or any other geographical representation in this paper. The authors bear the ultimate responsibility for providing appropriate place names. Views expressed in the text are those of the authors and do not necessarily reflect the views of the publisher.
We acknowledge the financial support provided by our funding sources. We thank the dataset providers for sharing the data. We also thank the editors and reviewers for their valuable feedback on the revisions.
This study is supported by the National Natural Science Foundation of China (grant nos. 424B2041, 42175136, and 42305033), the Fundamental Research Funds for the Central Universities (grant no. 020714380250) and the Jiangsu Collaborative Innovation Centre for Climate Change.
This paper was edited by Amos Tai and reviewed by two anonymous referees.
Agathokleous, E., Feng, Z., Oksanen, E., Sicard, P., Wang, Q., Saitanis, C. J., Araminiene, V., Blande, J. D., Hayes, F., Calatayud, V., Domingos, M., Veresoglou, S. D., Penuelas, J., Wardle, D. A., De Marco, A., Li, Z., Harmens, H., Yuan, X., Vitale, M., and Paoletti, E.: Ozone affects plant, insect, and soil microbial communities: A threat to terrestrial ecosystems and biodiversity, Sci. Adv., 6, https://doi.org/10.1126/sciadv.abc1176, 2020.
Ainsworth, E. A., Yendrek, C. R., Sitch, S., Collins, W. J., and Emberson, L. D.: The Effects of Tropospheric Ozone on Net Primary Productivity and Implications for Climate Change, Annu. Rev. Plant Biol., 63, 637–661, https://doi.org/10.1146/annurev-arplant-042110-103829, 2012.
Cao, J., Yue, X., and Ma, M.: Simulation of ozone–vegetation coupling and feedback in China using multiple ozone damage schemes, Atmos. Chem. Phys., 24, 3973–3987, https://doi.org/10.5194/acp-24-3973-2024, 2024.
Castagna, A. and Ranieri, A.: Detoxification and repair process of ozone injury: From O3 uptake to gene expression adjustment, Environ. Pollut., 157, 1461–1469, https://doi.org/10.1016/j.envpol.2008.09.029, 2009.
Cheesman, A. W., Brown, F., Artaxo, P., Farha, M. N., Folberth, G. A., Hayes, F. J., Heinrich, V. H. A., Hill, T. C., Mercado, L. M., Oliver, R. J., O' Sullivan, M., Uddling, J., Cernusak, L. A., and Sitch, S.: Reduced productivity and carbon drawdown of tropical forests from ground-level ozone exposure, Nat. Geosci., https://doi.org/10.1038/s41561-024-01530-1, 2024.
Collatz, G. J., Ball, J. T., Grivet, C., and Berry, J. A.: Physiological and environmental regulation of stomatal conductance, photosynthesis and transpiration: a model that includes a laminar boundary layer, Agr. Forest Meteorol., 54, 107–136, https://doi.org/10.1016/0168-1923(91)90002-8, 1991.
Ducker, J. A., Holmes, C. D., Keenan, T. F., Fares, S., Goldstein, A. H., Mammarella, I., Munger, J. W., and Schnell, J.: Synthetic ozone deposition and stomatal uptake at flux tower sites, Biogeosciences, 15, 5395–5413, https://doi.org/10.5194/bg-15-5395-2018, 2018.
Emberson, L.: Effects of ozone on agriculture, forests and grasslands, Philos. T. Roy. Soc. A, 378, https://doi.org/10.1098/rsta.2019.0327, 2020.
Felzer, B. S., Cronin, T. W., Melillo, J. M., Kicklighter, D. W., and Schlosser, C. A.: Importance of carbon–nitrogen interactions and ozone on ecosystem hydrology during the 21st century, J. Geophys. Res.-Biogeo., 114, https://doi.org/10.1029/2008jg000826, 2009.
Feng, Z., Büker, P., Pleijel, H., Emberson, L., Karlsson, P. E., and Uddling, J.: A unifying explanation for variation in ozone sensitivity among woody plants, Glob. Change Biol., 24, 78–84, https://doi.org/10.1111/gcb.13824, 2018.
Feng, Z. Z., Agathokleous, E., Yue, X., Oksanen, E., Paoletti, E., Sase, H., Gandin, A., Koike, T., Calatayud, V., Yuan, X. Y., Liu, X. J., De Marco, A., Jolivet, Y., Kontunen-Soppela, S., Hoshika, Y., Saji, H., Li, P., Li, Z., Watanabe, M., and Kobayashi, K.: Emerging challenges of ozone impacts on asian plants: actions are needed to protect ecosystem health, Ecosystem Health and Sustainability, 7, https://doi.org/10.1080/20964129.2021.1911602, 2021.
Grulke, N. E. and Heath, R. L.: Ozone effects on plants in natural ecosystems, Plant Biology, 22, 12–37, https://doi.org/10.1111/plb.12971, 2020.
Hayes, F., Jones, M. L. M., Mills, G., and Ashmore, M.: Meta-analysis of the relative sensitivity of semi-natural vegetation species to ozone, Environ. Pollut., 146, 754–762, https://doi.org/10.1016/j.envpol.2006.06.011, 2007.
He, L., Shang, B., Agathokleous, E., Yuan, X., Xu, Y., and Feng, Z.: Changes in the trade-offs between photosynthesis and detoxification capacity among different tree species under ozone pollution, Environ. Pollut., 384, 127013, https://doi.org/10.1016/j.envpol.2025.127013, 2025.
Heath, R. L. and Taylor, G. E.: Physiological Processes and Plant Responses to Ozone Exposure, in: Forest Decline and Ozone: A Comparison of Controlled Chamber and Field Experiments, edited by: Sandermann, H., Wellburn, A. R., and Heath, R. L., Springer, Berlin, Heidelberg, 317–368, https://doi.org/10.1007/978-3-642-59233-1_10, 1997.
Heath, R. L., Lefohn, A. S., and Musselman, R. C.: Temporal processes that contribute to nonlinearity in vegetation responses to ozone exposure and dose, Atmos. Environ., 43, 2919–2928, https://doi.org/10.1016/j.atmosenv.2009.03.011, 2009.
Jin, Z., Yan, D., Zhang, Z., Li, M., Wang, T., Huang, X., Xie, M., Li, S., and Zhuang, B.: Effects of Elevated Ozone Exposure on Regional Meteorology and Air Quality in China Through Ozone-Vegetation Coupling, J. Geophys. Res.-Atmos., 128, e2022JD038119, https://doi.org/10.1029/2022JD038119, 2023.
Jung, M., Schwalm, C., Migliavacca, M., Walther, S., Camps-Valls, G., Koirala, S., Anthoni, P., Besnard, S., Bodesheim, P., Carvalhais, N., Chevallier, F., Gans, F., Goll, D. S., Haverd, V., Köhler, P., Ichii, K., Jain, A. K., Liu, J., Lombardozzi, D., Nabel, J. E. M. S., Nelson, J. A., O'Sullivan, M., Pallandt, M., Papale, D., Peters, W., Pongratz, J., Rödenbeck, C., Sitch, S., Tramontana, G., Walker, A., Weber, U., and Reichstein, M.: Scaling carbon fluxes from eddy covariance sites to globe: synthesis and evaluation of the FLUXCOM approach, Biogeosciences, 17, 1343–1365, https://doi.org/10.5194/bg-17-1343-2020, 2020.
Keronen, P., Reissell, A., Rannik, Ü., Pohja, T., Siivola, E., Hiltunen, V., Hari, P., Kulmala, M., and Vesala, T.: Ozone flux measurements over a Scots pine forest using eddy covariance method: Performance evaluation and comparison with flux-profile method, Boreal Environ. Res., 8, 425–443, 2003.
Li, F., Zhou, Z., Levis, S., Sitch, S., Hayes, F., Feng, Z., Reich, P. B., Zhao, Z., and Zhou, Y.: Quantifying the role of ozone-caused damage to vegetation in the Earth system: a new parameterization scheme for photosynthetic and stomatal responses, Geosci. Model Dev., 17, 6173–6193, https://doi.org/10.5194/gmd-17-6173-2024, 2024.
Li, J., Wang, X., Wang, Z.-H., Wang, B., Wang, C.-Z., Deng, M.-F., and Liu, L.-L.: Effects of ozone and aerosol pollution on photosynthesis of poplar leaves, Chinese Journal of Plant Ecology, 44, 854–863, https://doi.org/10.17521/cjpe.2020.0022, 2020.
Li, K., Jacob, D. J., Liao, H., Qiu, Y. L., Shen, L., Zhai, S. X., Bates, K. H., Sulprizio, M. P., Song, S. J., Lu, X., Zhang, Q., Zheng, B., Zhang, Y. L., Zhang, J. Q., Lee, H. C., and Kuk, S. K.: Ozone pollution in the North China Plain spreading into the late-winter haze season, P. Natl. Acad. Sci. USA, 118, https://doi.org/10.1073/pnas.2015797118, 2021.
Li, L.: Dataset and Code for publication titled “Integrating Ozone–vegetation Damage Schemes into SSiB4/TRIFFID: Evaluation of Six Parameterizations and Refinement of Ozone Decay Process Across Plant Functional Types”, Zenodo [code and data set], https://doi.org/10.5281/zenodo.18927710, 2026.
Li, P., Feng, Z., Catalayud, V., Yuan, X., Xu, Y., and Paoletti, E.: A meta-analysis on growth, physiological, and biochemical responses of woody species to ground-level ozone highlights the role of plant functional types, Plant Cell Environ., 40, 2369–2380, https://doi.org/10.1111/pce.13043, 2017.
Li, S., Leakey, A. D. B., Moller, C. A., Montes, C. M., Sacks, E. J., Lee, D., and Ainsworth, E. A.: Similar photosynthetic but different yield responses of C3 and C3 crops to elevated O3, P. Natl. Acad. Sci. USA, 120, e2313591120, https://doi.org/10.1073/pnas.2313591120, 2023.
Li, X. and Xiao, J.: A Global, 0.05-Degree Product of Solar-Induced Chlorophyll Fluorescence Derived from OCO-2, MODIS, and Reanalysis Data, Remote Sens.-Basel, 11, https://doi.org/10.3390/rs11050517, 2019.
Liang, S. L., Cheng, J., Jia, K., Jiang, B., Liu, Q., Xiao, Z. Q., Yao, Y. J., Yuan, W. P., Zhang, X. T., Zhao, X., and Zhou, J.: The Global Land Surface Satellite (GLASS) Product Suite, B. Am. Meteorol. Soc., 102, E323-E337, https://doi.org/10.1175/bams-d-18-0341.1, 2021.
Lin, M., Horowitz, L. W., Xie, Y., Paulot, F., Malyshev, S., Shevliakova, E., Finco, A., Gerosa, G., Kubistin, D., and Pilegaard, K.: Vegetation feedbacks during drought exacerbate ozone air pollution extremes in Europe, Nat. Clim. Change, 10, 444–451, https://doi.org/10.1038/s41558-020-0743-y, 2020.
Liu, X., Chu, B., Tang, R., Liu, Y., Qiu, B., Gao, M., Li, X., Xiao, J., Sun, H. Z., Huang, X., Desai, A. R., Ding, A., and Wang, H.: Air quality improvements can strengthen China's food security, Nat. Food, https://doi.org/10.1038/s43016-023-00882-y, 2024.
Liu, Y., Xue, Y., MacDonald, G., Cox, P., and Zhang, Z.: Global vegetation variability and its response to elevated CO2, global warming, and climate variability – a study using the offline SSiB4/TRIFFID model and satellite data, Earth Syst. Dynam., 10, 9–29, https://doi.org/10.5194/esd-10-9-2019, 2019.
Liu, Z., Zhou, M., Li, D., Song, T., Yue, X., Lu, X., Zhao, Y., and Zhang, L.: Co-benefit of forestation on ozone air quality and carbon storage in South China, Nat. Commun., 16, 2429, https://doi.org/10.1038/s41467-025-57548-5, 2025.
Lombardozzi, D., Levis, S., Bonan, G., Hess, P. G., and Sparks, J. P.: The Influence of Chronic Ozone Exposure on Global Carbon and Water Cycles, J. Climate, 28, 292–305, https://doi.org/10.1175/jcli-d-14-00223.1, 2015.
Long, X., Han, Y., Wang, Q. Y., Li, X. K., Feng, T., Wang, Y. C., Wang, Y., Zhang, S. L., Han, Y. M., Li, G. H., Tie, X. X., Cao, J. J., and Chen, Y.: Adverse Effects of Ozone Pollution on Net Primary Productivity in the North China Plain, Geophys. Res. Lett., 51, e2023GL105209, https://doi.org/10.1029/2023GL105209, 2024.
Lu, X., Hong, J., Zhang, L., Cooper, O. R., Schultz, M. G., Xu, X., Wang, T., Gao, M., Zhao, Y., and Zhang, Y.: Severe Surface Ozone Pollution in China: A Global Perspective, Environ. Sci. Tech. Let., 5, 487–494, https://doi.org/10.1021/acs.estlett.8b00366, 2018.
Ma, Y., Yue, X., Sitch, S., Unger, N., Uddling, J., Mercado, L. M., Gong, C., Feng, Z., Yang, H., Zhou, H., Tian, C., Cao, Y., Lei, Y., Cheesman, A. W., Xu, Y., and Duran Rojas, M. C.: Implementation of trait-based ozone plant sensitivity in the Yale Interactive terrestrial Biosphere model v1.0 to assess global vegetation damage, Geosci. Model Dev., 16, 2261–2276, https://doi.org/10.5194/gmd-16-2261-2023, 2023.
Mills, G., Pleijel, H., Braun, S., Büker, P., Bermejo, V., Calvo, E., Danielsson, H., Emberson, L., Fernández, I. G., Grünhage, L., Harmens, H., Hayes, F., Karlsson, P.-E., and Simpson, D.: New stomatal flux-based critical levels for ozone effects on vegetation, Atmos. Environ., 45, 5064–5068, https://doi.org/10.1016/j.atmosenv.2011.06.009, 2011.
Monks, P. S., Archibald, A. T., Colette, A., Cooper, O., Coyle, M., Derwent, R., Fowler, D., Granier, C., Law, K. S., Mills, G. E., Stevenson, D. S., Tarasova, O., Thouret, V., von Schneidemesser, E., Sommariva, R., Wild, O., and Williams, M. L.: Tropospheric ozone and its precursors from the urban to the global scale from air quality to short-lived climate forcer, Atmos. Chem. Phys., 15, 8889–8973, https://doi.org/10.5194/acp-15-8889-2015, 2015.
Moreno-Martínez, Á., Camps-Valls, G., Kattge, J., Robinson, N., Reichstein, M., van Bodegom, P., Kramer, K., Cornelissen, J. H. C., Reich, P., Bahn, M., Niinemets, Ü., Peñuelas, J., Craine, J. M., Cerabolini, B. E. L., Minden, V., Laughlin, D. C., Sack, L., Allred, B., Baraloto, C., Byun, C., Soudzilovskaia, N. A., and Running, S. W.: A methodology to derive global maps of leaf traits using remote sensing and climate data, Remote Sens. Environ., 218, 69–88, https://doi.org/10.1016/j.rse.2018.09.006, 2018.
Munger, J. W., Wofsy, S. C., Bakwin, P. S., Fan, S.-M., Goulden, M. L., Daube, B. C., Goldstein, A. H., Moore, K. E., and Fitzjarrald, D. R.: Atmospheric deposition of reactive nitrogen oxides and ozone in a temperate deciduous forest and a subarctic woodland: 1. Measurements and mechanisms, J. Geophys. Res.-Atmos., 101, 12639–12657, https://doi.org/10.1029/96JD00230, 1996.
Muñoz Sabater, J.: ERA5-Land hourly data from 1981 to present [data set], https://doi.org/10.24381/cds.e2161bac, 2019.
Pleijel, H., Danielsson, H., and Broberg, M. C.: Benefits of the Phytotoxic Ozone Dose (POD) index in dose-response functions for wheat yield loss, Atmos. Environ., 268, 118797, https://doi.org/10.1016/j.atmosenv.2021.118797, 2022.
Ren, W., Tian, H., Tao, B., Chappelka, A., Sun, G., Lu, C., Liu, M., Chen, G., and Xu, X.: Impacts of tropospheric ozone and climate change on net primary productivity and net carbon exchange of China's forest ecosystems, Global Ecol. Biogeogr., 20, 391–406, https://doi.org/10.1111/j.1466-8238.2010.00606.x, 2011.
Sellers, P. J., Randall, D. A., Collatz, G. J., Berry, J. A., Field, C. B., Dazlich, D. A., Zhang, C., Collelo, G. D., and Bounoua, L.: A revised land surface parameterization (SiB2) for atmospheric GCMs, 1. Model formulation, J. Climate, 9, 676–705, https://doi.org/10.1175/1520-0442(1996)009<0676:Arlspf>2.0.Co;2, 1996.
Sitch, S., Cox, P. M., Collins, W. J., and Huntingford, C.: Indirect radiative forcing of climate change through ozone effects on the land-carbon sink, Nature, 448, 791-U794, https://doi.org/10.1038/nature06059, 2007.
Tarasick, D., Galbally, I. E., Cooper, O. R., Schultz, M. G., Ancellet, G., Leblanc, T., Wallington, T. J., Ziemke, J., Liu, X., Steinbacher, M., Staehelin, J., Vigouroux, C., Hannigan, J. W., García, O., Foret, G., Zanis, P., Weatherhead, E., Petropavlovskikh, I., Worden, H., Osman, M., Liu, J., Chang, K.-L., Gaudel, A., Lin, M., Granados-Muñoz, M., Thompson, A. M., Oltmans, S. J., Cuesta, J., Dufour, G., Thouret, V., Hassler, B., Trickl, T., and Neu, J. L.: Tropospheric Ozone Assessment Report: Tropospheric ozone from 1877–2016, observed levels, trends and uncertainties, Elementa: Science of the Anthropocene, 7, 39, https://doi.org/10.1525/elementa.376, 2019.
Turnock, S. T., Allen, R. J., Andrews, M., Bauer, S. E., Deushi, M., Emmons, L., Good, P., Horowitz, L., John, J. G., Michou, M., Nabat, P., Naik, V., Neubauer, D., O'Connor, F. M., Olivié, D., Oshima, N., Schulz, M., Sellar, A., Shim, S., Takemura, T., Tilmes, S., Tsigaridis, K., Wu, T., and Zhang, J.: Historical and future changes in air pollutants from CMIP6 models, Atmos. Chem. Phys., 20, 14547–14579, https://doi.org/10.5194/acp-20-14547-2020, 2020.
Wang, T., Xue, L., Feng, Z., Dai, J., Zhang, Y., and Tan, Y.: Ground-level ozone pollution in China: a synthesis of recent findings on influencing factors and impacts, Environ. Res. Lett., 17, https://doi.org/10.1088/1748-9326/ac69fe, 2022.
Wang, Y. P., Lu, X. J., Wright, I. J., Dai, Y. J., Rayner, P. J., and Reich, P. B.: Correlations among leaf traits provide a significant constraint on the estimate of global gross primary production, Geophys. Res. Lett., 39, https://doi.org/10.1029/2012GL053461, 2012.
Wittig, V. E., Ainsworth, E. A., and Long, S. P.: To what extent do current and projected increases in surface ozone affect photosynthesis and stomatal conductance of trees? A meta-analytic review of the last 3 decades of experiments, Plant Cell Environ., 30, 1150–1162, https://doi.org/10.1111/j.1365-3040.2007.01717.x, 2007.
Xie, X. D., Wang, T. J., Yue, X., Li, S., Zhuang, B. L., Wang, M. H., and Yang, X. Q.: Numerical modeling of ozone damage to plants and its effects on atmospheric CO2 in China, Atmos. Environ., 217, https://doi.org/10.1016/j.atmosenv.2019.116970, 2019.
Yue, X. and Unger, N.: Ozone vegetation damage effects on gross primary productivity in the United States, Atmos. Chem. Phys., 14, 9137–9153, https://doi.org/10.5194/acp-14-9137-2014, 2014.
Yue, X., Unger, N., Harper, K., Xia, X., Liao, H., Zhu, T., Xiao, J., Feng, Z., and Li, J.: Ozone and haze pollution weakens net primary productivity in China, Atmos. Chem. Phys., 17, 6073–6089, https://doi.org/10.5194/acp-17-6073-2017, 2017.
Zhan, X. W., Xue, Y. K., and Collatz, G. J.: An analytical approach for estimating CO2 and heat fluxes over the Amazonian region, Ecol. Model., 162, 97–117, https://doi.org/10.1016/s0304-3800(02)00405-2, 2003.
Zhang, H., Liu, D., Dong, W., Cai, W., and Yuan, W.: Accurate representation of leaf longevity is important for simulating ecosystem carbon cycle, Basic Appl. Ecol., 17, 396–407, https://doi.org/10.1016/j.baae.2016.01.006, 2016.
Zhang, W., Liu, D., Tian, H., Pan, N., Yang, R., Tang, W., Yang, J., Lu, F., Dayananda, B., Mei, H., Wang, S., and Shi, H.: Parsimonious estimation of hourly surface ozone concentration across China during 2015–2020, Sci. Data, 11, 492, https://doi.org/10.1038/s41597-024-03302-3, 2024.
Zhang, Z., Xue, Y., MacDonald, G., Cox, P. M., and Collatz, G. J.: Investigation of North American vegetation variability under recent climate: A study using the SSiB4/TRIFFID biophysical/dynamic vegetation model, J. Geophys. Res.-Atmos., 120, 1300–1321, https://doi.org/10.1002/2014jd021963, 2015.
Zhou, H., Yue, X., Dai, H., Geng, G., Yuan, W., Chen, J., Shen, G., Zhang, T., Zhu, J., and Liao, H.: Recovery of ecosystem productivity in China due to the Clean Air Action plan, Nat. Geosci., https://doi.org/10.1038/s41561-024-01586-z, 2024.
Zhu, J., Tai, A. P. K., and Hung Lam Yim, S.: Effects of ozone–vegetation interactions on meteorology and air quality in China using a two-way coupled land–atmosphere model, Atmos. Chem. Phys., 22, 765–782, https://doi.org/10.5194/acp-22-765-2022, 2022.