
the Creative Commons Attribution 4.0 License.
the Creative Commons Attribution 4.0 License.
 | 09 Sep 2026
Leveraging JEDI for atmospheric composition: a unified framework for evaluating observations and model forecasts
Shih-Wei Wei

Jérôme Barré
Maryam Abdi-Oskouei
Benjamin Ménétrier
Cheng Dang
Cheng-Hsuan Lu
Accurate evaluation of both observations and forecasts is essential for advancing atmospheric composition research and improving operational prediction. Traditionally, this has relied on separate workflows with product-specific preprocessing, often limiting reproducibility and creating inconsistencies between models and observational datasets or across different products. Modern data assimilation systems provide precise observation operators for mapping model variables into observation space, yet these capabilities remain underutilized outside assimilation. Here, we demonstrate how the Joint Effort for Data assimilation Integration (JEDI) framework addresses this gap by offering a unified, modular, and model-agnostic system that integrates data assimilation with systematic evaluation. JEDI enables consistent intercomparisons of observations, forecasts, and reanalyses by interfacing with diverse forecast models and gridded datasets, while leveraging carefully designed observation operators to compute model equivalent quantities for a wide range of observation products. These include satellite instruments such as Tropospheric Emissions: Monitoring of Pollution (TEMPO), The TROPOspheric Monitoring Instrument (TROPOMI), Moderate Resolution Imaging Spectroradiometer (MODIS), Visible Infrared Imaging Radiometer Suite (VIIRS), and Plankton, Aerosol, Cloud, and ocean Ecosystem (PACE), as well as ground-based networks like Aerosol Robotic Network (AERONET), Pandora, and U.S. Environmental Protection Agency (EPA) AirNow. Case studies illustrate the flexibility of this workflow: (1) NO2 forecasts from the Weather Research and Forecasting model coupled with Chemistry (WRF-Chem) evaluated against TEMPO, TROPOMI, and Pandora retrievals; (2) surface fine particulate matter and ozone forecasts from WRF-Chem assessed against AirNow measurements using EPA regulatory thresholds; and (3) aerosol optical depth (AOD) retrievals from multiple satellites compared with Modern-Era Retrospective analysis for Research and Applications, Version 2 (MERRA-2) and validated against AERONET. These examples highlight JEDI's ability to detect systematic regional biases, reconcile complementary sampling characteristics across platforms, and assess the added value of unified observation operators for cross-comparison. Overall, JEDI provides a consistent and extensible framework for model validation and observation assessment, reducing redundant preprocessing and aligning evaluation with operational data assimilation practices, and ultimately advancing both research and operational applications in atmospheric composition.
- Article
(7219 KB) - Full-text XML
- BibTeX
- EndNote


With the growth of Earth system observations from both spaceborne and ground-based platforms, new types of products enabled by advanced instruments and retrieval algorithms now provide increasingly detailed snapshots of atmospheric composition and dynamics. However, these observations are inherently limited: they represent discrete samples in space and time, they do not provide continuous global coverage, and they are restricted to the present and past. In addition, observations are subject to random and systematic errors arising from instrument precision, calibration uncertainties, and sensor degradation over time. As a result, observations alone are insufficient for comprehensive characterization of the Earth system state. Numerical models remain indispensable for filling these gaps. They produce three-dimensional fields at regular intervals, offering spatially and temporally continuous representations of processes across the Earth system in the past, present, and future – capabilities that are fundamentally beyond observational datasets. These include numerical weather prediction (NWP) models extended with atmospheric composition, global chemistry–climate models, and chemical transport models. Such models have been widely used for both operational forecasting and research. Yet, as with observations, model representations of the earth system are prone to errors as they remain constrained by underlying assumptions, approximations, and parameterizations that limit their accuracy and predictive skill.
In this context, it is essential to make systematic comparisons between observations and models. Such evaluation not only identifies systematic errors and uncertainties but also strengthens confidence in the use of datasets for prediction and analysis (Levy et al., 2013; Giles et al., 2019). Evaluation and data assimilation (DA) are intrinsically linked: observations are used to update (or initialize) the model state for forecasts, while forecasts can serve as both a baseline for assessing those observations or as a priori for retrieval algorithms (Bocquet et al., 2010).
Traditionally, evaluation has been performed outside of DA frameworks, often relying on ad hoc approaches or stand-alone verification tools, in which observations are compared against model simulations or, conversely, models are evaluated against observational datasets. Depending on the application, the baseline may be a single model used to assess multiple observational products, or a set of observations used to intercompare multiple models. For example, the MELODIES-MONET system (Baker and Pan, 2017) and the METplus system (Jensen et al., 2024) provide flexible platforms for model–observation comparison and verification, but they generally require product-specific preprocessing and rely sometimes on simplified transformations that are not fully representing the observation characteristics and or the underlying model physics.
In contrast, observation operators developed within DA systems are explicitly designed to represent the observational characteristics and physical processes that link model state variables to observed quantities. Because errors in these operators propagate during the DA procedure, they require the highest precision and consistency (Courtier et al., 1994; Bannister, 2017). Leveraging them for evaluation therefore provides a unique opportunity to evaluate observations and models within a unified DA framework. Without such integration in evaluation frameworks, separate forward models must be built, requiring redundant efforts and introducing additional sources of uncertainty. In that sense leveraging DA capabilities for evaluation purposes with well-vetted observation operators ensures consistency and reliability across both applications (Kalnay, 2003; Carrassi et al., 2018).
The Joint Effort for Data assimilation Integration (JEDI; Trémolet and Auligné, 2020) framework provides exactly this capability. Designed as a flexible, modular, and model-agnostic system, JEDI integrates observation operators, standardized data formats, and statistical tools to enable seamless comparison of forecasts, analyses, and diverse observational datasets through common interfaces. Its modular design allows users to engage with specific components without needing to master the full system. Although originally developed for DA, JEDI also supports consistent processing and evaluation of diverse observational datasets independent of assimilation. Built on object-oriented and generic programming principles, it facilitates side-by-side comparisons and cross-platform integration, creating new opportunities for unified evaluation and intercomparison studies.
In this paper, we showcase the evaluation capability of JEDI across a range of atmospheric composition datasets. Case studies demonstrate comparisons between forecast models, reanalysis fields, and diverse observational products, including satellite retrievals, ground-based networks, and regulatory air quality monitoring. The examples presented here highlight both the diagnostic power of JEDI's observation operators and its broader potential as a common system for evaluation, verification, and cross-comparison in atmospheric composition research and operations. The paper is organized as follows: Sect. 2 describes the evaluation framework and its components; Sects. 3 and 4 introduce the observation and model datasets used for this demonstration; Sect. 5 presents use cases for various atmospheric composition applications such as regional air quality and global aerosol composition using NO2 satellite retrievals, surface pollutants, and aerosol optical depth (AOD) observations; finally Sect. 6 provides a summary.
2.1 A model agnostic system
The system described in this paper is mainly based on the JEDI (Trémolet and Auligné, 2020) maintained by the Joint Center for Satellite Data Assimilation (JCSDA). The JEDI is a modular framework designed to support diverse DA and evaluation applications. Built with object-oriented and generic programming techniques, JEDI consists of independent components, allowing users to interact with specific DA aspects without needing to master in depth the entire system. Central to JEDI is the Object-Oriented Prediction System (OOPS), which provides abstraction for the DA building blocks (e.g., forecast models and observations with their respective errors) to interact modularly. By separating algorithm design from model- or observation-specific details, OOPS allows integration of different numerical models and observation datasets, while supporting variational, ensemble, and hybrid assimilation approaches.
Many applications of JEDI framework have been actively developed by the community. The AOD assimilations with satellite retrieval products and evaluated with ground base measurements are reported in Huang et al. (2023) and Wei et al. (2024). The analysis of composition forecast system with trace gas retrieval from satellite, aircraft, and ground base stations is reported in Abdi-Oskouei et al. (2025). The assimilation of surface fine particulate matter (PM2.5) measurements for regional air quality model is developed (Wang et al., 2026). For meteorological analysis, several studies report the development with assimilating conventional, satellite radiance, and radar measurements in JEDI on the global and regional application of Model for Prediction Across Scales model (MPAS; Liu et al., 2022; Guerrette et al., 2023; Jung et al., 2024; Ha et al., 2024; Nystrom et al., 2025; Sun et al., 2025; Park et al., 2025). With that extended capability of JEDI, the current system description leverages parts of the entire framework for the evaluation.
The overall workflow is illustrated in Fig. 1. Observations from satellite granules or ground stations are first converted into the common Interface for Observation Data Access (IODA) format using Python-based converters. IODA files store metadata (e.g., latitude, longitude, time, level), observation values, observation errors, quality control (QC) flags, and ancillary data (averaging kernels, scattering weights, a priori) in a standardized structure. Model forecast states (conventionally denoted x) are ingested through the gridded data interface VIND (Versatile Implementation for Native Data), which allows spatial interpolation onto the gridded state at observation locations to provide Geophysical Variables at Locations (GeoVaLs), i.e. the full model vertical profiles for a set of required variables. The Unified Forward Operator (UFO) then applies the observation operator (conventionally denoted H) on the GeoVaLs to derive model equivalents of the observations, H(x), which are stored in new IODA files alongside the original observations. The differences between observations and H(x) provide the basis for assimilation and also evaluation.
For evaluation, verification and statistics, resulting H(x) IODA files can be directly processed by users' own diagnostic and visualization tools or passed to a verification package, such as METplus (Jensen et al., 2024) via a Python utility that converts the paired data into METplus-readable format. Additional diagnostic and visualization tools are needed to process the statistical outputs produced by METplus.
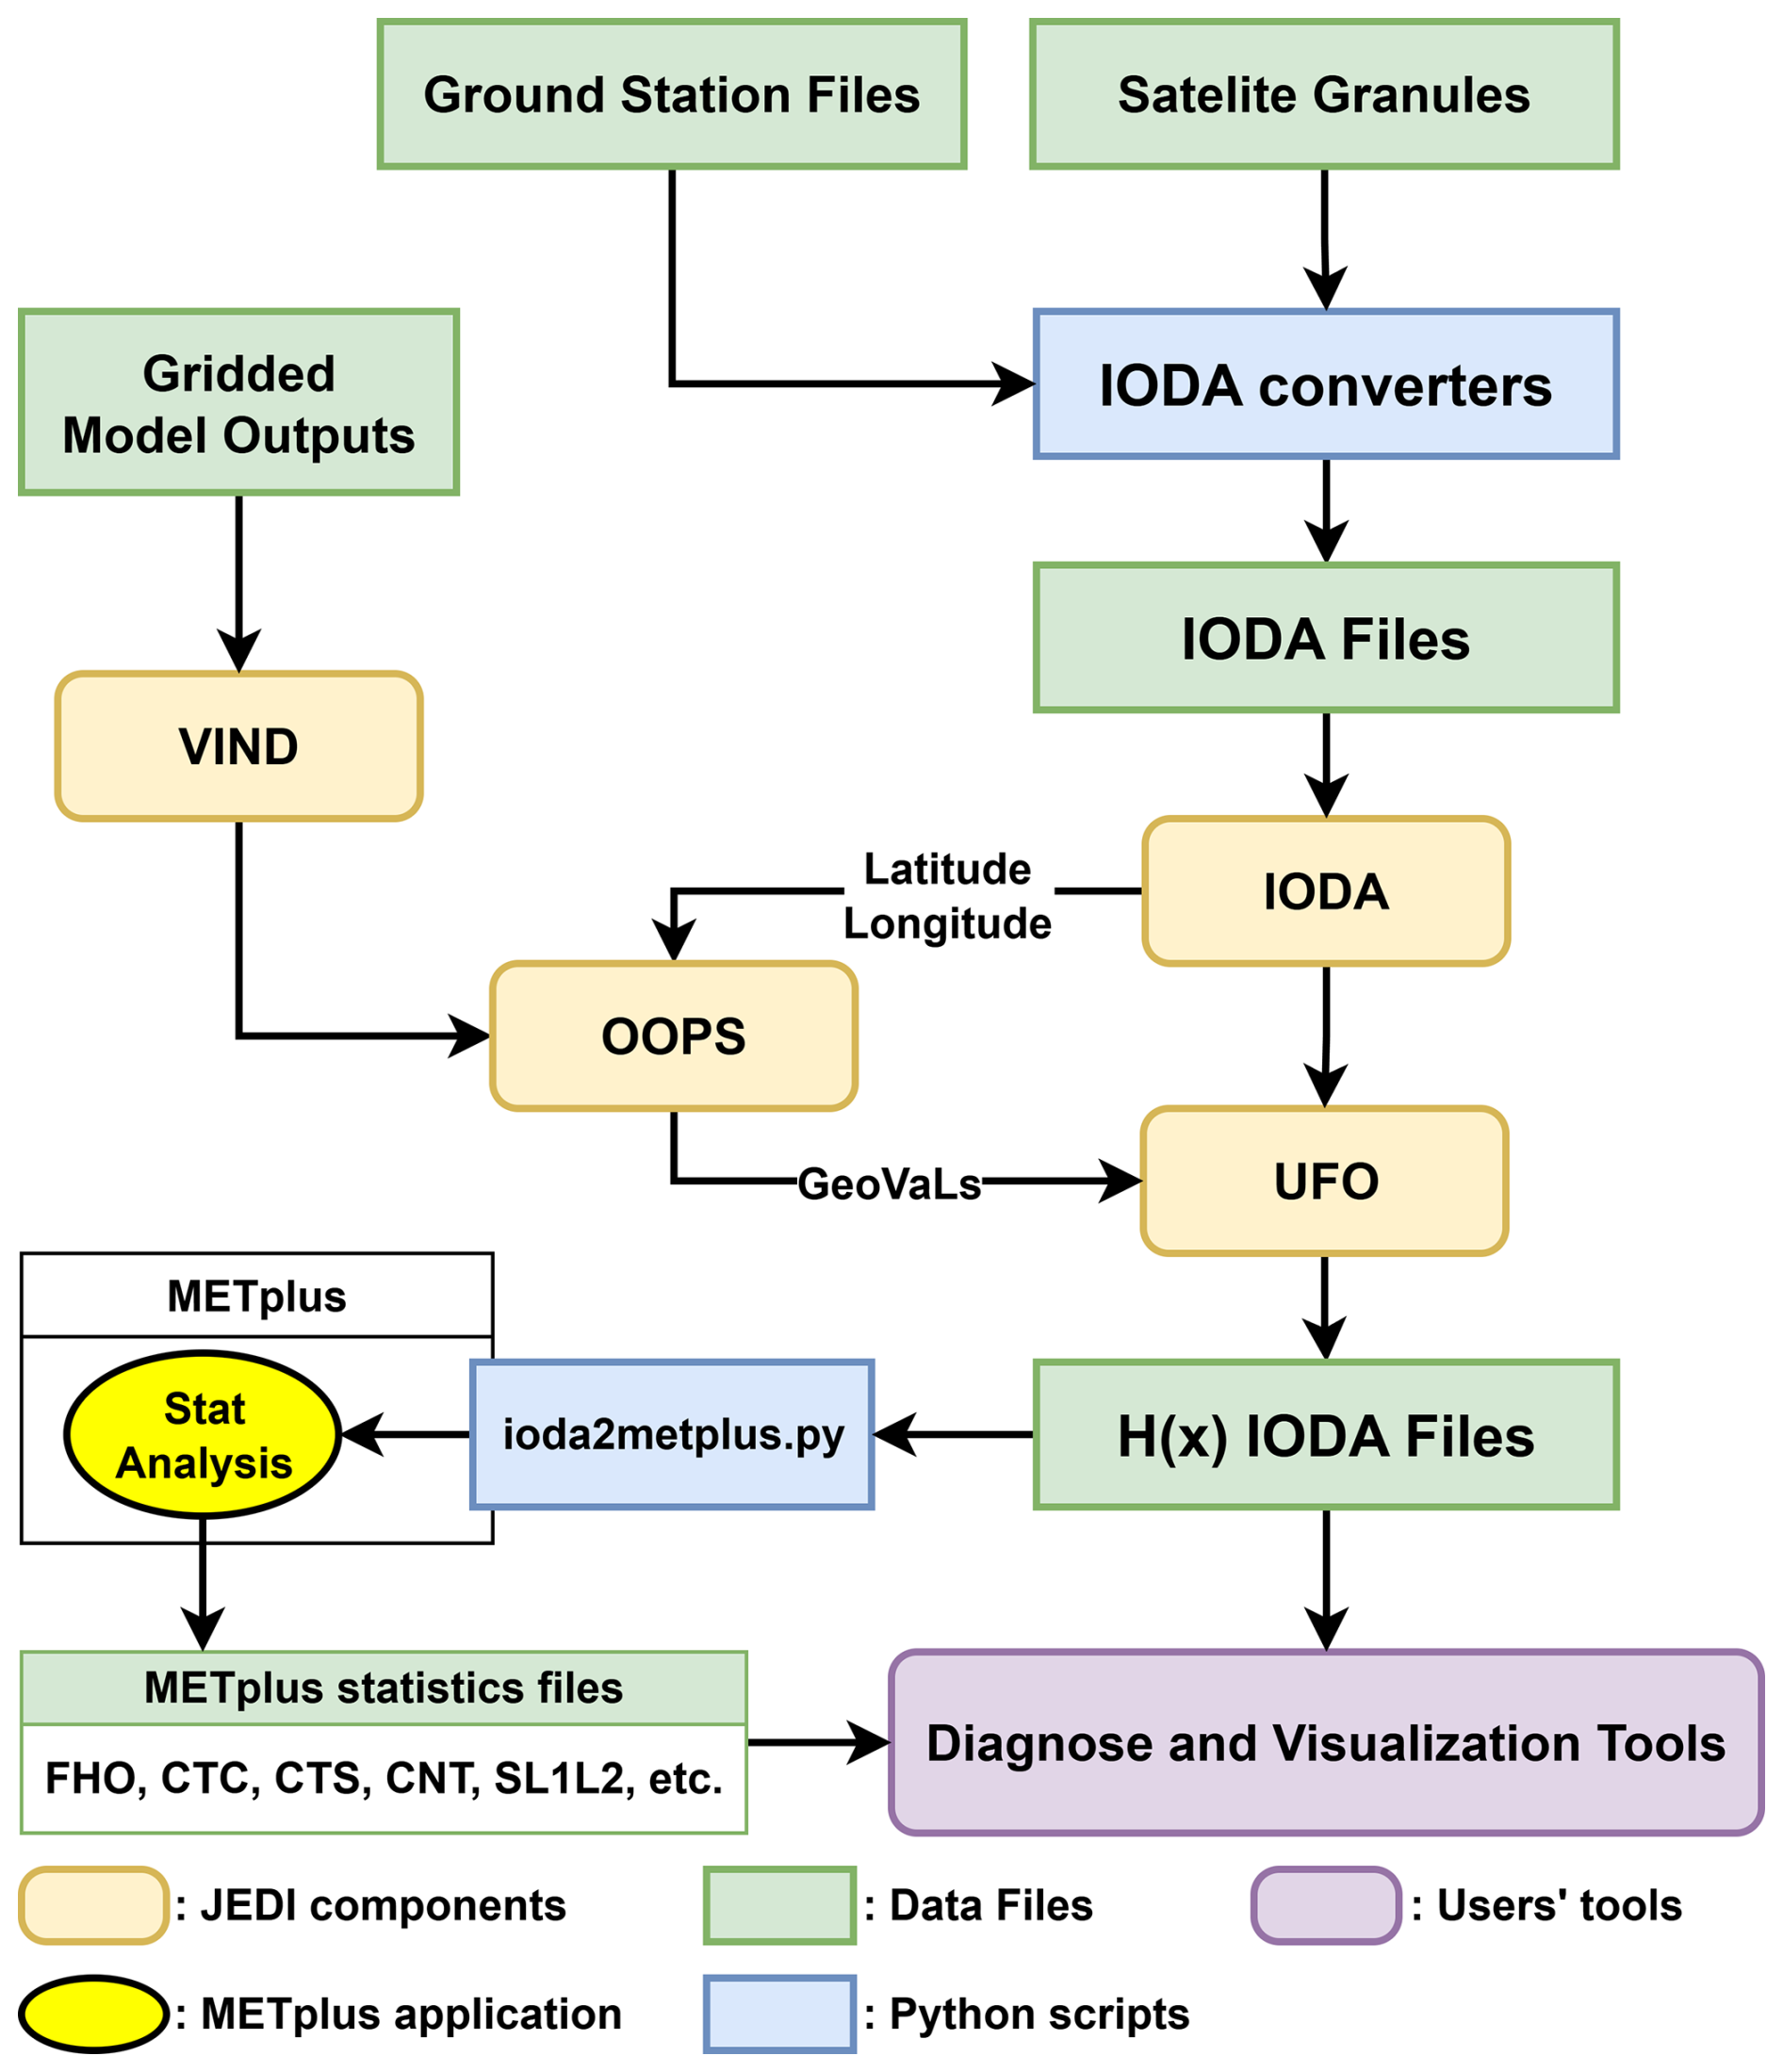
Figure 1Flowchart of the evaluation system combining JEDI and METplus (FHO for Forecast, Hit, Observation Rates; CTC for Contingency Table Counts; CTS for Contingency Table Statistics; CNT for Continuous Statistics; SL1L2 for Scalar L1L2 Partial Sums).
2.2 IODA and UFO
The IODA provides a unified data format within JEDI for storing and exchanging observational datasets. IODA files organize information into standardized groups, including MetaData (e.g., latitude, longitude, time, pressure level), ObsValue (measured quantities), and optional groups such as quality flags or error estimates. This consistent structure allows diverse observations (from satellite retrievals to in situ measurements) to be handled by the same tools and workflows. To generate these files, IODA converters are used to transform native observation formats (e.g., NASA satellite granules, EPA AirNow CSVs, or campaign data) into IODA format. These converters are typically implemented in Python and maintained within the JCSDA repositories (see code and data availability section), ensuring reproducibility and compatibility across applications. By adopting the IODA convention, JEDI facilitates interoperability and enables a seamless connection between observational data and forward operators.
The UFO plays a key role in linking model states to observations by simulating model equivalents of the observations. This capability enables direct comparison of forecasts with actual observations during DA cycles. The UFO offers a consistent, extensible interface that supports a wide variety of observation types, ranging from satellite radiances processed through radiative transfer models to satellite retrieval products to in situ measurements. Beyond forward modeling, the UFO also handles tasks such as specifying observations error, quality control, and bias correction based on observation-minus-background and observation-minus-analysis quantities.
The UFO is designed to operate independently of any specific forecast model interface. As mentioned in Sect. 2.1, it receives GeoVaLs as input, which are background state variables interpolated in space and time to the observation points by the model interface (see Sect. 2.3). Model interfaces within JEDI are responsible for producing GeoVaLs, while OOPS coordinates the transfer of information from the model to UFO. Once provided, the observation operator can perform further vertical processing, such as interpolation, coordinate transformations, or integration, depending on the nature of the measurements. This architecture keeps the interpolation process uniform across models while allowing each observation operator to encapsulate its own specialized logic, promoting flexibility, maintainability, and scalability. The following sections describe the three observation operators applied in this study.
2.2.1 Identity and Vertical interpolation
The identity operator in UFO is used to generate the H(x) quantities at the surface. This operator as default directly extracts the lowest model level in GeoVaLs, which are interpolated horizontally to observation locations. If users wish to perform a comparison with measurements over altitudes, the vertical interpolation is also available in UFO, which has not been used in this paper but widely used in other JEDI applications (i.e., Abdi-Oskouei et al., 2025). Additional technical details are provided in the JEDI online documentation: https://jointcenterforsatellitedataassimilation-jedi-docs.readthedocs-hosted.com/en/latest/inside/jedi-components/ufo/obsops.html#obsops-identity (last access: 22 July 2026) and https://jointcenterforsatellitedataassimilation-jedi-docs.readthedocs-hosted.com/en/latest/inside/jedi-components/ufo/obsops.html#vertical-interpolation (last access: 22 July 2026).
2.2.2 Column retrieval
The column retrieval operator in UFO provides a generalized capability for assimilating vertically integrated atmospheric retrievals from satellite, airborne, and ground-based sensors. By utilizing averaging kernels and a priori profiles included with retrieval products, the operator maps model state variables, such as trace gas mixing ratios, into the observation space, producing partial or total column quantities. In this work, we apply the column retrieval operator to various NO2 retrievals (see Sect. 3), demonstrating its ability to handle various observational datasets. Additional technical details are provided in the JEDI online documentation: https://jointcenterforsatellitedataassimilation-jedi-docs.readthedocs-hosted.com/en/latest/inside/jedi-components/ufo/obsops.html#column-retrieval-operator (last access: 22 July 2026)
2.3 CRTM AOD
The Community Radiative Transfer Model (CRTM) AOD operator in JEDI provides the capability to simulate satellite-retrieved aerosol quantities directly from model aerosol mixing ratios. Within UFO, CRTM is applied in a simplified configuration using pre-defined lookup tables (LUTs). These LUTs specify mass extinction coefficients for each aerosol species over a range of wavelengths, which are used as relative weights for mass concentration of each species to compute total aerosol AOD at each vertical level. With this design CRTM AOD allows for consistent forward modeling of diverse aerosol products, accounting for species-specific optical properties under assumptions of particle shape, size distributions, and refractive indices. In this work, we used the Goddard Chemistry Aerosol Radiation and Transport (GOCART) GEOS5 LUT with CRTM, which assumes non-spherical dust following the aerosol configuration in GOCART (Colarco et al., 2014). While currently demonstrated application relies on the GEOS-5 LUTs to approximate aerosol microphysics, the operator provides a flexible framework for future enhancements, including the use of other operational aerosol models or coupling with online microphysics schemes. Additional technical information of this operator can be found at: https://jointcenterforsatellitedataassimilation-jedi-docs.readthedocs-hosted.com/en/latest/inside/jedi-components/ufo/obsops.html#aerosol-optical-depth-aodcrtm (last access: 22 July 2026).
2.4 Versatile Implementation for Native Data (VIND)
While observations are processed through IODA and UFO components, as described above, numerical forecast models require a different set of common interfaces within JEDI. Regardless of the variables and native coordinates used in each model, they must implement OOPS abstract interfaces for shared components (for example what defines the model geometry, the state x, the model forecast and so on) in order to use the generic algorithms available in JEDI. JEDI currently includes interfaces tailored to specific models such as MPAS and FV3. In contrast, the Versatile Implementation for Native Data (VIND; Ménétrier et al., 2026) provides model-agnostic implementations of all required interfaces for shared components except for the forecast step. As a result, VIND can run any OOPS-based DA method that does not require a prediction model or its tangent-linear/adjoint formulation (e.g., in 4D-Var). VIND builds on ATLAS, an open-source C library from ECMWF (Deconinck et al., 2017; https://sites.ecmwf.int/docs/atlas/, last access: 22 July 2026), which provides data structures for handling fields on a wide range of global and regional grid geometries, including unstructured grid. Integrating a new modeling system into VIND requires little additional development, apart from implementing lightweight file readers and writers for model field data if existing ones are not already compatible. However, users are encouraged to leverage the existing model interface when their data is already in the grid geometry and structure that interface expects. Nevertheless, this simplicity, together with broad grid compatibility provided by ATLAS, makes VIND an attractive entry point for new users of the JEDI framework.
2.5 METplus
The Model Evaluation Tools (MET; Brown et al., 2021; Prestopnik et al., 2025) is a community-supported software package developed by the Developmental Testbed Center (DTC) to provide standardized methods for verifying NWP forecasts. MET includes a suite of applications for traditional grid-to-grid and grid-to-observation comparisons, statistical diagnostics, and visualization of forecast skill. Building on MET, METplus (Jensen et al., 2024) is a Python-based wrapper that streamlines the configuration and execution of MET tools through a modular, workflow-oriented interface. By abstracting the underlying MET applications into reusable components, METplus reduces the technical burden on users and enables flexible chaining of tasks for complex evaluation pipelines.
Within the atmospheric composition context, METplus allows users to compute a wide range of statistics – such as bias, root-mean-square error, contingency table counts, and categorical verification scores – using paired model and observational data. Its flexible configuration system supports both deterministic and ensemble forecasts and can be adapted to regulatory thresholds (e.g., EPA breakpoints for PM2.5 and ozone). The role of METplus is primarily in post-processing and verification; it does not provide complex observation operators to generate H(x) over a variety of model outputs. Instead, these functions are supplied through JEDI's IODA data format and observation operators. Together, these components provide a unified evaluation framework in which atmospheric composition forecasts can be systematically compared with in-situ and satellite retrievals in operational verification practices.
3.1 TEMPO NO2 tropospheric columns
The Tropospheric Emissions: Monitoring of Pollution (TEMPO) instrument is a geostationary ultraviolet–visible (UV–Vis) spectrometer that provides hourly observations of atmospheric pollutants over North America at 2×4.75 km2 resolution (Zoogman et al., 2017). Operating from 91° W longitude over the 290–740 nm spectral range, TEMPO measures key trace gases including nitrogen dioxide (NO2), ozone, and formaldehyde. NO2 retrievals are derived by estimating slant column densities (SCDs), removing the stratospheric contribution using GEOS-CF and DA constraints, and converting to vertical column densities (VCDs) via air mass factors (AMFs) that account for viewing geometry, surface reflectance, and atmospheric profiles (Nowlan et al., 2016). Algorithm details are provided in the TEMPO ATBD (Nowlan et al., 2025). In this study, we use version 3 Level 2 tropospheric NO2, retaining only pixels with quality flag being zero and cloud fraction less than 0.5 (https://doi.org/10.5067/IS-40e/TEMPO/NO2_L2.003, Liu, 2026).
3.2 TROPOMI NO2 tropospheric columns
The TROPOspheric Monitoring Instrument (TROPOMI), onboard Sentinel-5 Precursor since October 2017, is a nadir-viewing hyperspectral sensor operating in the ultraviolet and visible (UV–Vis) with spatial resolution improved from 3.5 × 7 km2 to 3.5 × 5.5 km2 in 2019, enabling urban-scale mapping of NO2 (Eskes et al., 2022). NO2 retrievals use the Differential Optical Absorption Spectroscopy (DOAS) technique to derive SCDs, which are converted to VCDs via AMFs based on radiative transfer and a priori profiles (Veefkind et al., 2012). The product includes both tropospheric and stratospheric NO2 and is widely applied in air quality and model validation studies. In this work, we use version 2.4.0 of the Level 2 tropospheric NO2 product, following the User Manual (Eskes et al., 2022) recommendation to retain only pixels with quality assurance value above 0.75, thereby excluding cloud fractions above 0.5 (https://doi.org/10.5270/S5P-9bnp8q8, Copernicus Sentinel-5P, 2021).
3.3 PANDORA NO2 total columns
The Pandora spectrometer system is a ground-based remote sensing instrument designed to provide high-resolution measurements of trace gases such as NO2 and ozone. Operating in the UV-Vis spectral range, Pandora instruments retrieve total column abundances by analyzing direct solar irradiance spectra and can also produce tropospheric columns when combined with a priori information and stratospheric corrections (Herman et al., 2009). Pandora systems have been deployed in networks such as the Pandonia Global Network (PGN), which supports long-term monitoring and satellite validation efforts. In this study, total column NO2 retrievals from Pandora are used to complement satellite observations, offering higher temporal resolution (with retrievals available at intervals of seconds to minutes) and localized ground-truth measurements.
3.4 AirNow ozone and PM2.5 at surface
The AirNow system is a cooperated platform across agencies, including the U.S. Environmental Protection Agency (EPA), National Oceanic and Atmospheric Administration (NOAA), National Park Service, National Aeronautics and Space Administration (NASA), Centers for Disease Control, and tribal, state, and local air quality agencies. It delivers near-real-time, surface-level air quality observations across the United States, focusing on key regulatory pollutants such as ozone and fine particulate matter (PM2.5). These data are collected from a network of fixed monitoring stations operated by federal, state, tribal, and local air quality agencies. Observations are reported hourly and undergo preliminary quality control to ensure reliability for operational applications and scientific analysis.
3.5 OCI AOD
The Plankton, Aerosol, Cloud, and ocean Ecosystem (PACE) mission was successfully launched in February 2024 (Werdell et al., 2019). PACE provides a broad suite of datasets through its primary sensor, the Ocean Color Instrument (OCI). In this paper we use AOD retrievals from OCI using the Unified Aerosol Algorithm (UAA; Remer et al., 2019a, b). The UAA inherits Dark Target (DT; Levy et al., 2024) and Deep Blue (DB; Hsu et al., 2013) algorithms for the ocean and land surface, respectively, and provides AOD retrievals at 0.354, 0.388, 0.48, 0.55, 0.67, 0.87, 1.24, 1.64, and 2.2 µm. Version 3 (https://doi.org/10.5067/PACE/OCI/L2/AER_UAA/3.0, NASA Ocean Biology Processing Group, 2025) of the product is used here, while version 3.1 was released during the preparation of this draft. The released versions of the UAA AOD product remain in testing mode and are not yet recommended for scientific applications. Once validated, however, these datasets will offer diverse spatial, spectral, and biogeophysical insight across Earth's ocean–atmosphere–land interface, providing unique opportunities to characterize global aerosol properties from space. In addition to AOD, various other observation types (https://pace.oceansciences.org/data_table.htm#23, last access: 22 July 2026) can be readily incorporated into JEDI with minimal implementation effort. By enabling retrieval assessment and unified intercomparison, the JEDI framework can play a pivotal role in maximizing the value of these novel datasets for both observational studies and forecasting applications.
3.6 MODIS AOD
The Level 2 AOD retrievals from Moderate Resolution Imaging Spectroradiometer (MODIS) Collection 6.1 (C6.1; Levy et al., 2015a) on satellite Terra (MOD04_L2) and Aqua (MYD04_L2) are processed in this study. It provides the combined product for AOD at 550 nm from DT (Levy et al., 2013) and DB (Hsu et al., 2013) algorithms, which were originally developed for different surface types. When the Normalized Difference Vegetation Index (NDVI) is larger than 0.3, DT retrievals are provided. When NDVI is smaller than 0.2, DB retrievals are provided. For the remaining pixels, the average of DT and DB retrievals or the available one passing the recommended quality assurance, which is 3 for DT and 2 for DB, is used. The retrieval is based on 20 by 20 pixels at the blue band (500 m resolution), resulting in a resolution of 10 km at nadir.
3.7 VIIRS AOD
The Visible Infrared Imaging Radiometer Suite (VIIRS), onboard the Suomi-NPP and NOAA-20 satellites, provides Level 2 aerosol optical depth (AOD) retrievals using two complementary algorithms developed in NASA: DT (Levy et al., 2015a; Sawyer et al., 2020) and DB (Hsu et al., 2013; Lee et al., 2024). The DT algorithm retrieves AOD over dark, vegetated land surfaces and oceans by exploiting the low surface reflectance in the visible and shortwave infrared bands, while the DB algorithm extends AOD retrievals to bright-reflecting surfaces such as deserts and arid regions, where DT is less reliable. Together, these products deliver near-global AOD coverage at a native resolution of approximately 6 km, enabling detailed monitoring of aerosol distributions. In this study, we utilize both NASA's DT and DB AOD products from Suomi-NPP and NOAA-20 to evaluate aerosol simulations, benefiting from their complementary spatial coverage and surface-type sensitivity.
3.8 AERONET AOD
The Aerosol Robotic Network (AERONET) provides high-quality ground-based observations of AOD through a global network of sun photometers. In this study, we use Level 1.5 AOD measurements from AERONET version 3 (Giles et al., 2019), which include cloud-screened and quality-assured retrievals at multiple wavelengths. AERONET data serve as an essential reference for evaluating aerosol products and observation operators, offering well-calibrated, long-term records with high temporal resolution.
4.1 WRF-Chem
A week of hourly simulation conducted from the 54 h forecasts initialized at 00:00 UTC everyday by a 4 km WRF-Chem v4.5.2 (Grell et al., 2005; Powers et al., 2017; Skamarock et al., 2021) system, focused on New York State and the surrounding areas, is used to demonstrate the case for trace gases evaluation. The system uses the National Center for Environmental Prediction (NCEP) Global Forecast System (GFS) forecasts as its meteorological initial and lateral boundary conditions. To constrain the meteorological conditions, a fully cycling 3-dimensional variational DA system based on the Gridpoint Statistical Interpolation (GSI) (Kleist et al., 2009) is implemented. It assimilates conventional data in the NCEP Global Data Assimilation System (GDAS) and the New York State Mesonet (NYSM) surface meteorological data (Brotzge et al., 2020) and wind profiler observations (Shrestha et al., 2021) every 6 h at 00:00, 06:00, 12:00, and 18:00 UTC.
For chemical initial and lateral boundary conditions, 6-hourly 0.9° × 1.25° forecasts from the Whole Atmosphere Community Climate Model's (WACCM; Gettelman et al., 2019) are used. Biogenic emissions are calculated by the Model of Emissions of Gases and Aerosols from Nature (MEGAN; Guenther et al., 2006), and biomass burning emissions are supplied from the FIre Inventory from NCAR (FINN) version 2.5.1 (Wiedinmyer et al., 2023). Anthropogenic emissions are based on the EPA National Emission Inventory (NEI) 2016 modeling platform. The chemistry scheme used in the system is T1-MOZCART, which couples the MOZART-T1 (Emmons et al., 2020) with GOCART aerosols (Chin et al., 2002; Colarco et al., 2010).
4.2 MERRA-2
MERRA-2 (Gelaro et al., 2017; Randles et al., 2017) is the reanalysis dataset produced by the NASA Global Modeling and Assimilation Office (GMAO) based on the GEOS-5 system. It assimilates AOD measurements from AERONET, the Multiangle Imaging Spectro Radiometer (MISR), MODIS, and the Advanced Very-High-Resolution Radiometer (AVHRR) instruments. Note that the MODIS AOD product assimilated in MERRA-2 is bias corrected via a neural network algorithm, which is a different product from the MODIS C6.1 used in this study. MERRA-2 data is publicly available at NASA's Goddard Earth Sciences Data and Information Services Center (https://gmao.gsfc.nasa.gov/gmao-products/merra-2/data-access_merra-2/, last access: 22 July 2026). In this study, preprocessing is performed to combine 3-hourly reanalysis of meteorological conditions (https://doi.org/10.5067/WWQSXQ8IVFW8, Global Modeling and Assimilation Office (GMAO), 2015a) and aerosol mixing ratios (https://doi.org/10.5067/LTVB4GPCOTK2, Global Modeling and Assimilation Office (GMAO), 2015b).
5.1 Space and ground-based NO2 retrievals vs WRF-Chem
Figure 2 compares tropospheric NO2 retrievals from TEMPO and TROPOMI with an example of a 1 h window centered at 19:00 UTC 24 August 2024 against corresponding 19 h forecast from WRF-Chem. This example shows the potential for evaluating forecast performance using satellite data, which is quantified by innovation statistics, i.e., the differences between H(x) and retrievals. In this example, TEMPO's higher spatial resolution provides finer detail, while discrepancies between TEMPO and TROPOMI are evident over Boston, western Pennsylvania, and southern New Jersey areas. WRF-Chem underestimates NO2 tropospheric columns over the New York metropolitan area, overestimates near Montreal and Vermont, and shows better agreement with elevated concentrations near Toronto. This highlights the capability to cross-compare different satellite products and model outputs.
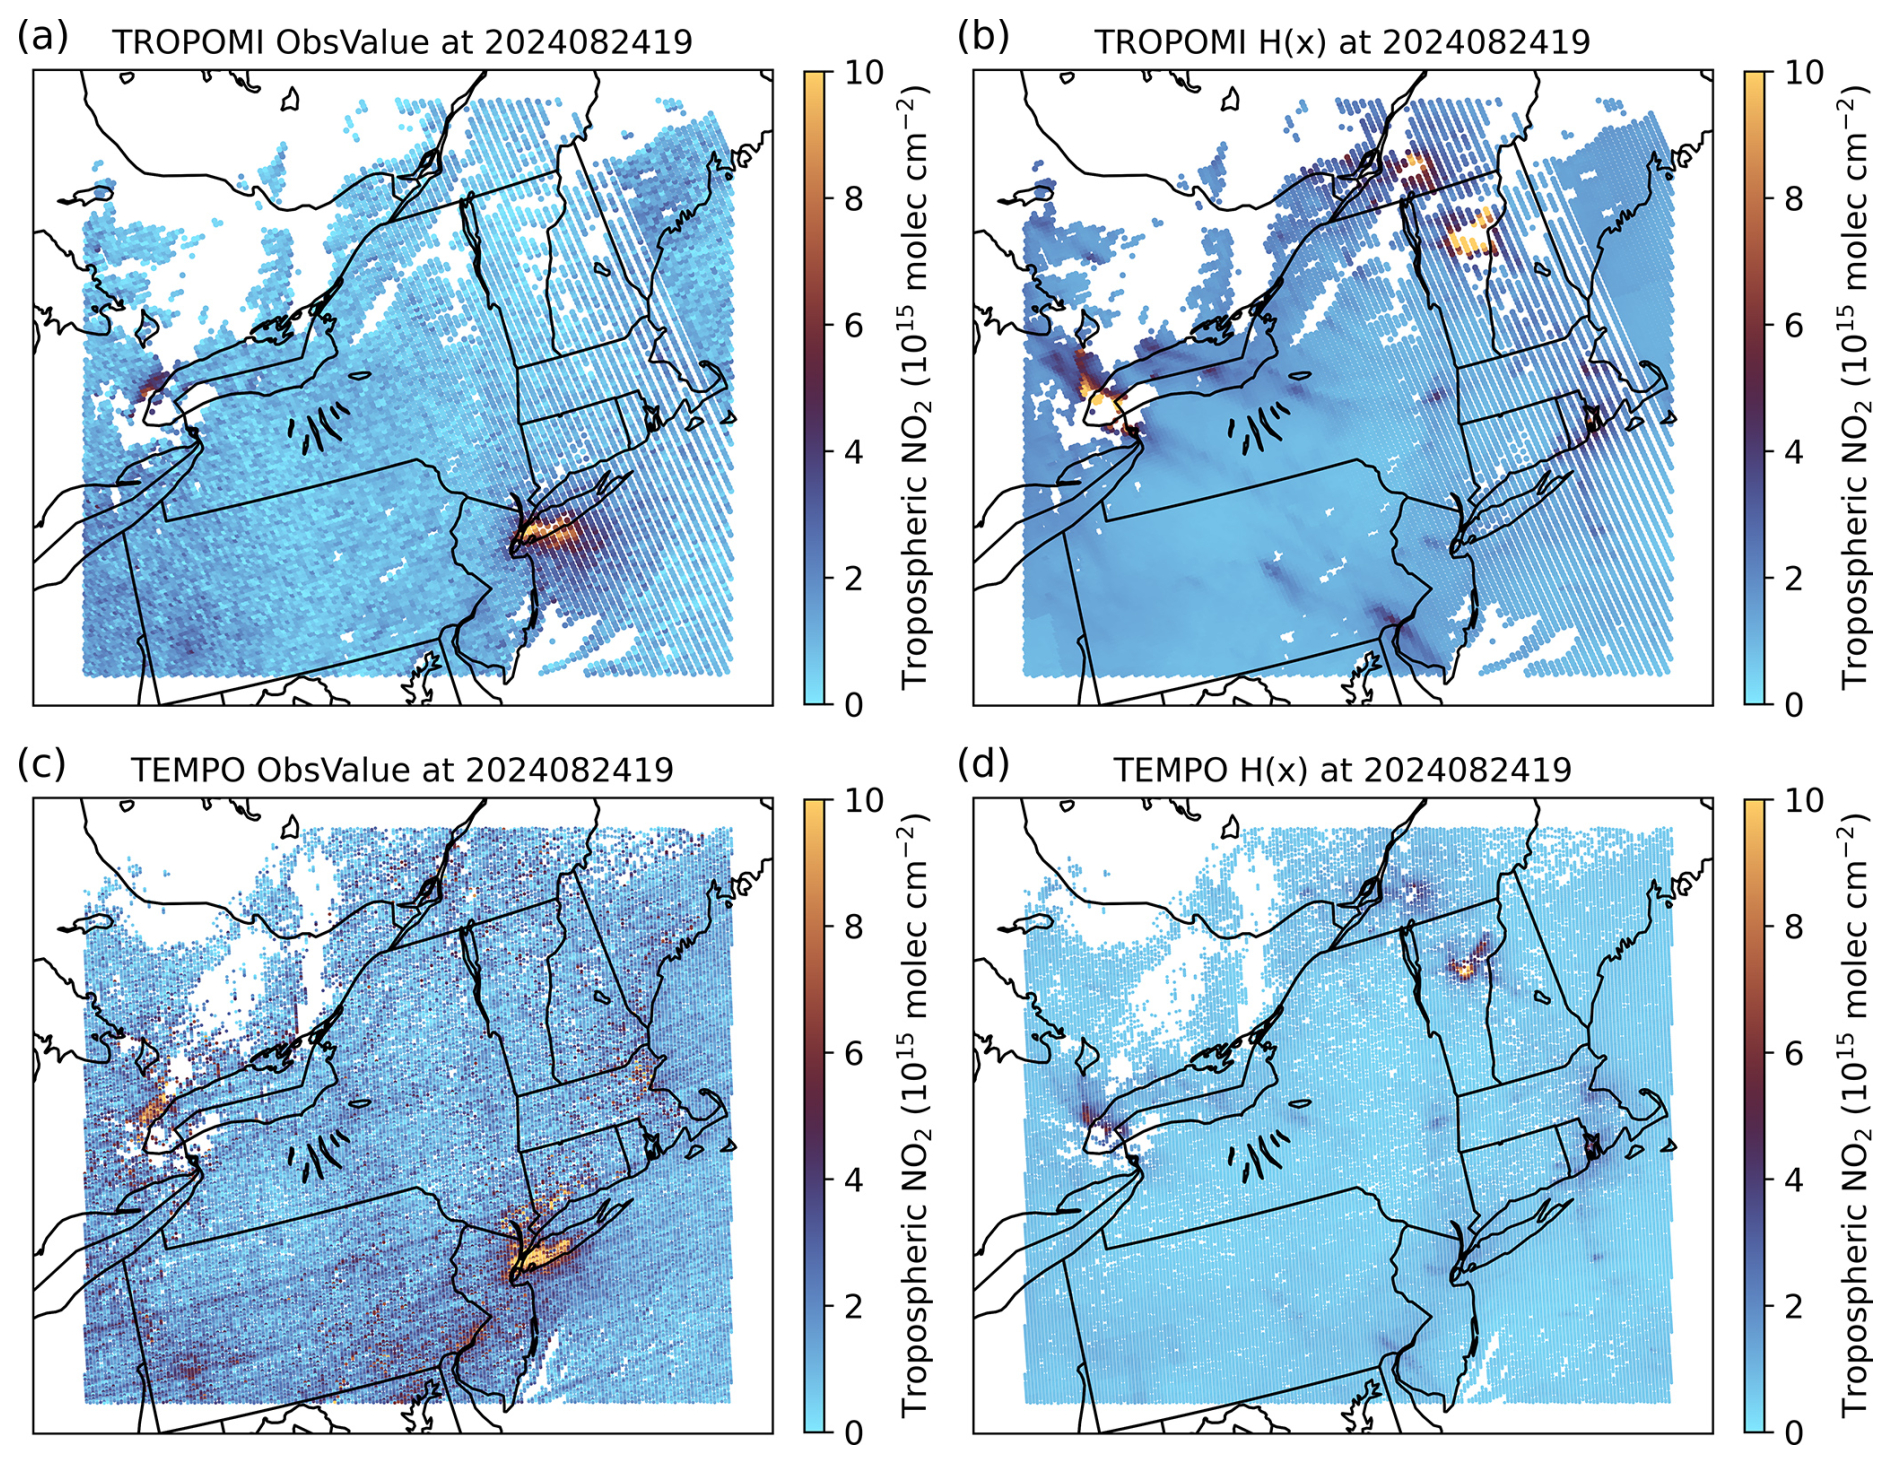
Figure 2Spatial distribution of tropospheric NO2 retrievals from (a) TROPOMI ObsValue and (b) TROPOMI H(x) and (c) TEMPO ObsValue and (d) TEMPO H(x) valid between 13:30 and 14:30 LST (18:30 and 19:30 UTC) 24 August 2024. H(x) is based on the 19 h forecast valid at 14:00 LST (19:00 UTC) 24 August 2024 from WRF-Chem.
Bias and centered root-mean-square error (CRMSE) statistics are computed over time in Fig. 3. Bias shows that the WRF-Chem system has overestimation against TROPOMI retrieval and underestimation against TEMPO retrieval. The diurnal variation of bias and CRMSE for TEMPO indicates the disagreement can be attributed to time-dependent and random errors, which could be the emission, retrieval algorithm, weather pattern, etc. This can inform the improvements to atmospheric/chemical model processes and emission inventories. The temporal sampling of TEMPO and TROPOMI provides complementary perspectives. TEMPO, in geostationary orbit, delivers hourly coverage across North America, capturing diurnal cycles and short-lived events. In contrast, polar low earth orbiting TROPOMI provides only one revisit per day around 01:30 p.m. local time for NO2 measurements, therefore is incapable of providing insights on diurnal variability.
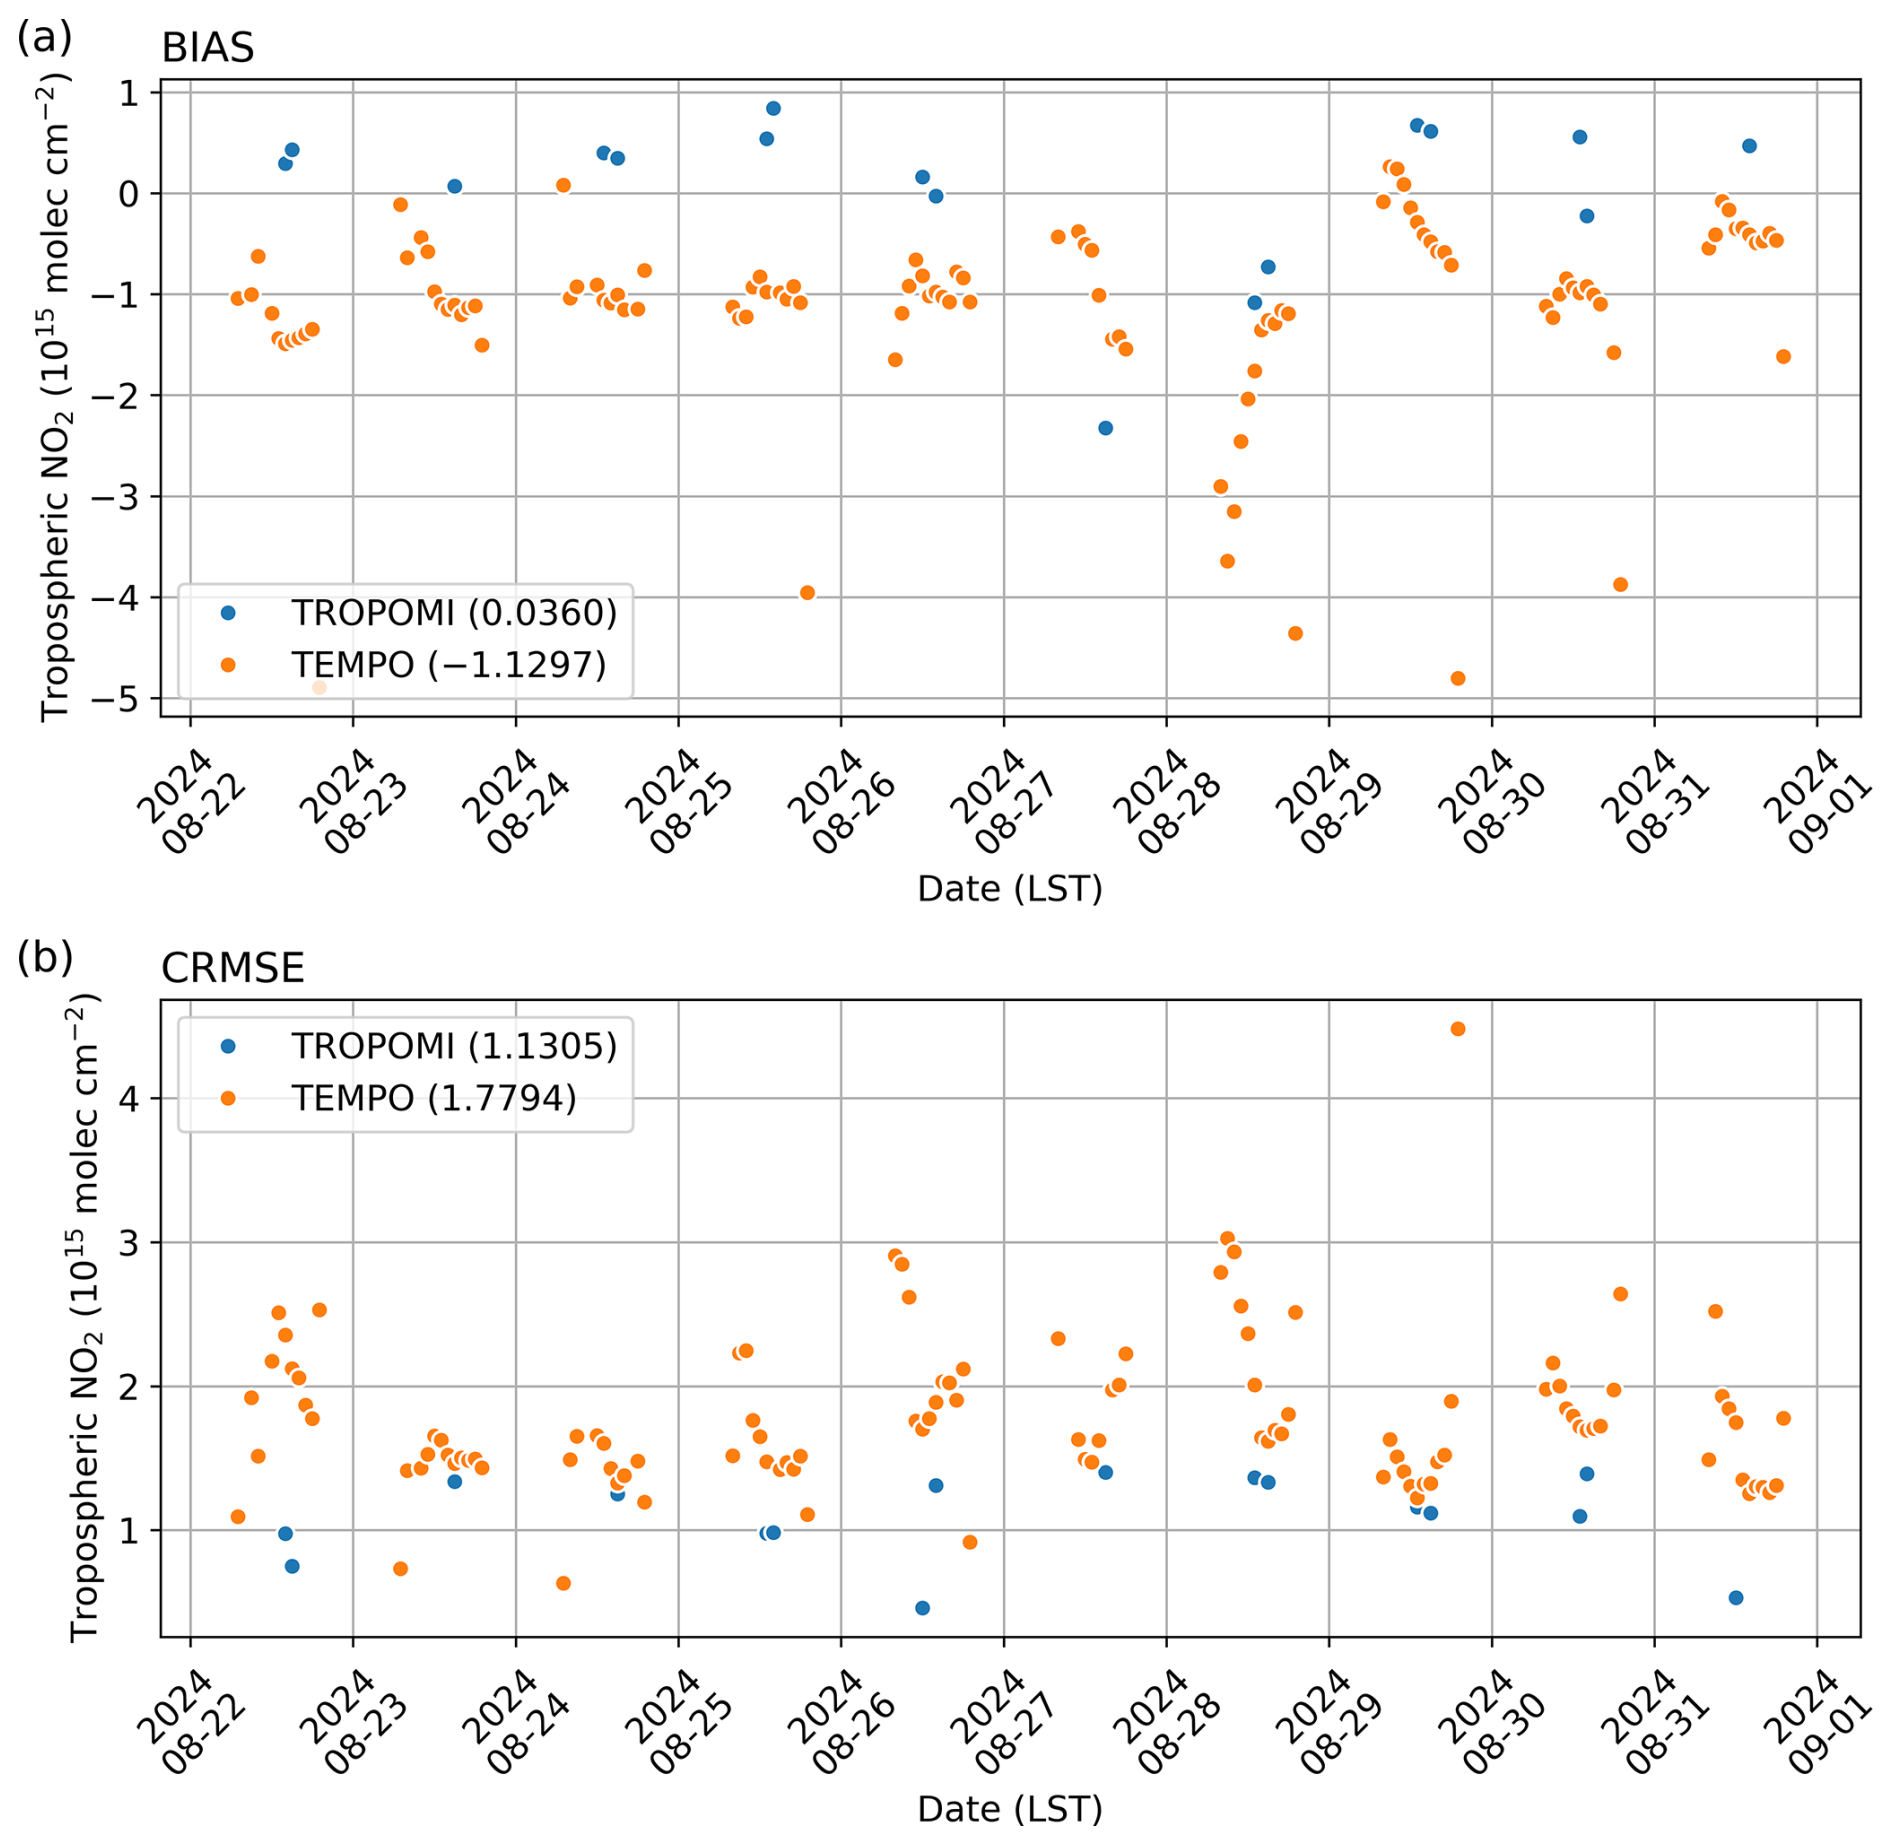
Figure 3Time series of (a) Bias and (b) RMSE derived from hourly differences of tropospheric NO2 between retrievals from satellite sensors (blue: TROPOMI; orange: TEMPO) and H(x) from WRF-Chem from 22 August to 1 September 2024. Mean values are provided in parentheses.
Beyond NO2 columns, the JEDI column retrieval operator supports evaluation of other trace gases. Tested cases include total and partial columns of carbon monoxide (CO) and ozone, demonstrating its flexibility across species with varying averaging kernels and a priori information dependencies. Although not shown here, these applications highlight the broader utility of JEDI for multi-species analysis. Looking ahead, the same framework can be extended to retrievals of formaldehyde (HCHO) and sulfur dioxide (SO2), key for studying photochemistry and emission sources. While not yet tested, their integration is expected to be straightforward within JEDI's modular design.
Figure 4 shows the PANDORA total column NO2 retrievals and corresponding H(x) based on WRF-Chem forecasts. The temporal resolution of PANDORA retrievals can vary from a few seconds to a couple of minutes, which is higher than the hourly outputs from WRF-Chem. WRF-Chem did not capture the high NO2 concentration event over New York City and its surrounding areas, while it shows better agreement with PANDORA retrievals in Boston and the west coast of Lake Ontario. In this use case, we produced H(x) within a 1 h window centered at 19:00 Z 24 August 2024. The type of H(x) demonstrated in this study follows what is typically used in a 3DVar assimilation. All observations in a given time window or more commonly called assimilation window time are compared to a single time background or model file. In our case study the observations are available every 6 s but we have hourly model output files. We average the results comparisons over the hourly time window. Note that if more frequent model output is available, users can adjust the window length (e.g., 30 min) for the VIND application.
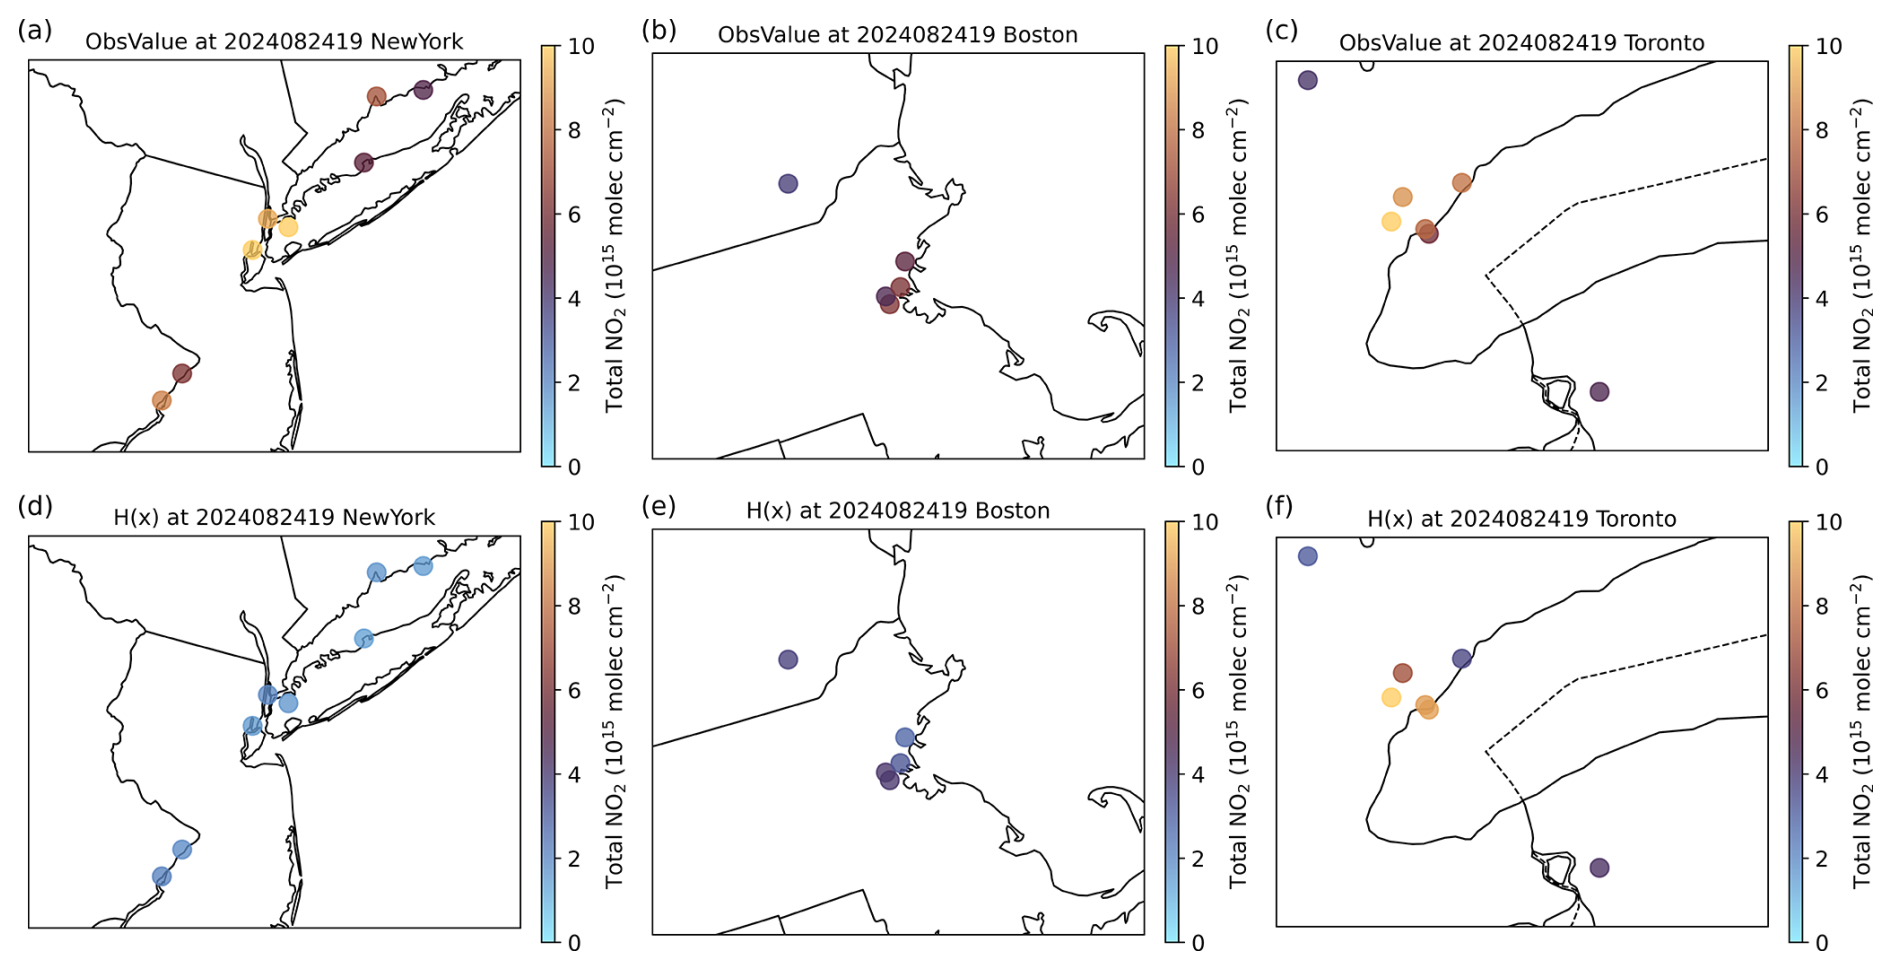
Figure 4Spatial distribution of PANDORA total column NO2 retrieval observations and H(x) over (a, d) New York, (b, e) Boston, and (c, f) Toronto areas valid between 13:30 and 14:30 LST (18:30 and 19:30 UTC) 24 August 2024. H(x) is based on the 19 h forecast valid at 14:00 LST (19:00 UTC) 24 August 2024 from WRF-Chem.
5.2 AirNow (PM2.5 and ozone) vs WRF-Chem
To evaluate and monitor surface levels of pollution, model forecasts and surface observations are typically evaluated against U.S. EPA regulatory thresholds. In this study, hourly forecasts from WRF-Chem were compared with hourly EPA AirNow measurements of PM2.5 and ozone. Although EPA air quality standards are defined for 24 h average PM2.5 and 8 h running mean ozone, we applied these breakpoints directly to hourly output data, enabling a consistent contingency table framework for categorical evaluation.
To facilitate this analysis, we developed a Python interface to the StatAnalysis tool in METplus (https://metplus.readthedocs.io/en/latest/Users_Guide/wrappers.html#statanalysis, last access: 22 July 2026) that reads paired model–observation data in IODA format. This workflow leverages the existing statistical capabilities of METplus, such as the computation of categorical counts based on user-defined thresholds, while maintaining compatibility with the JEDI-based H(x) outputs. Users can specify thresholds corresponding to regulatory breakpoints or other criteria of interest, allowing flexible evaluation of model skill across multiple categories.
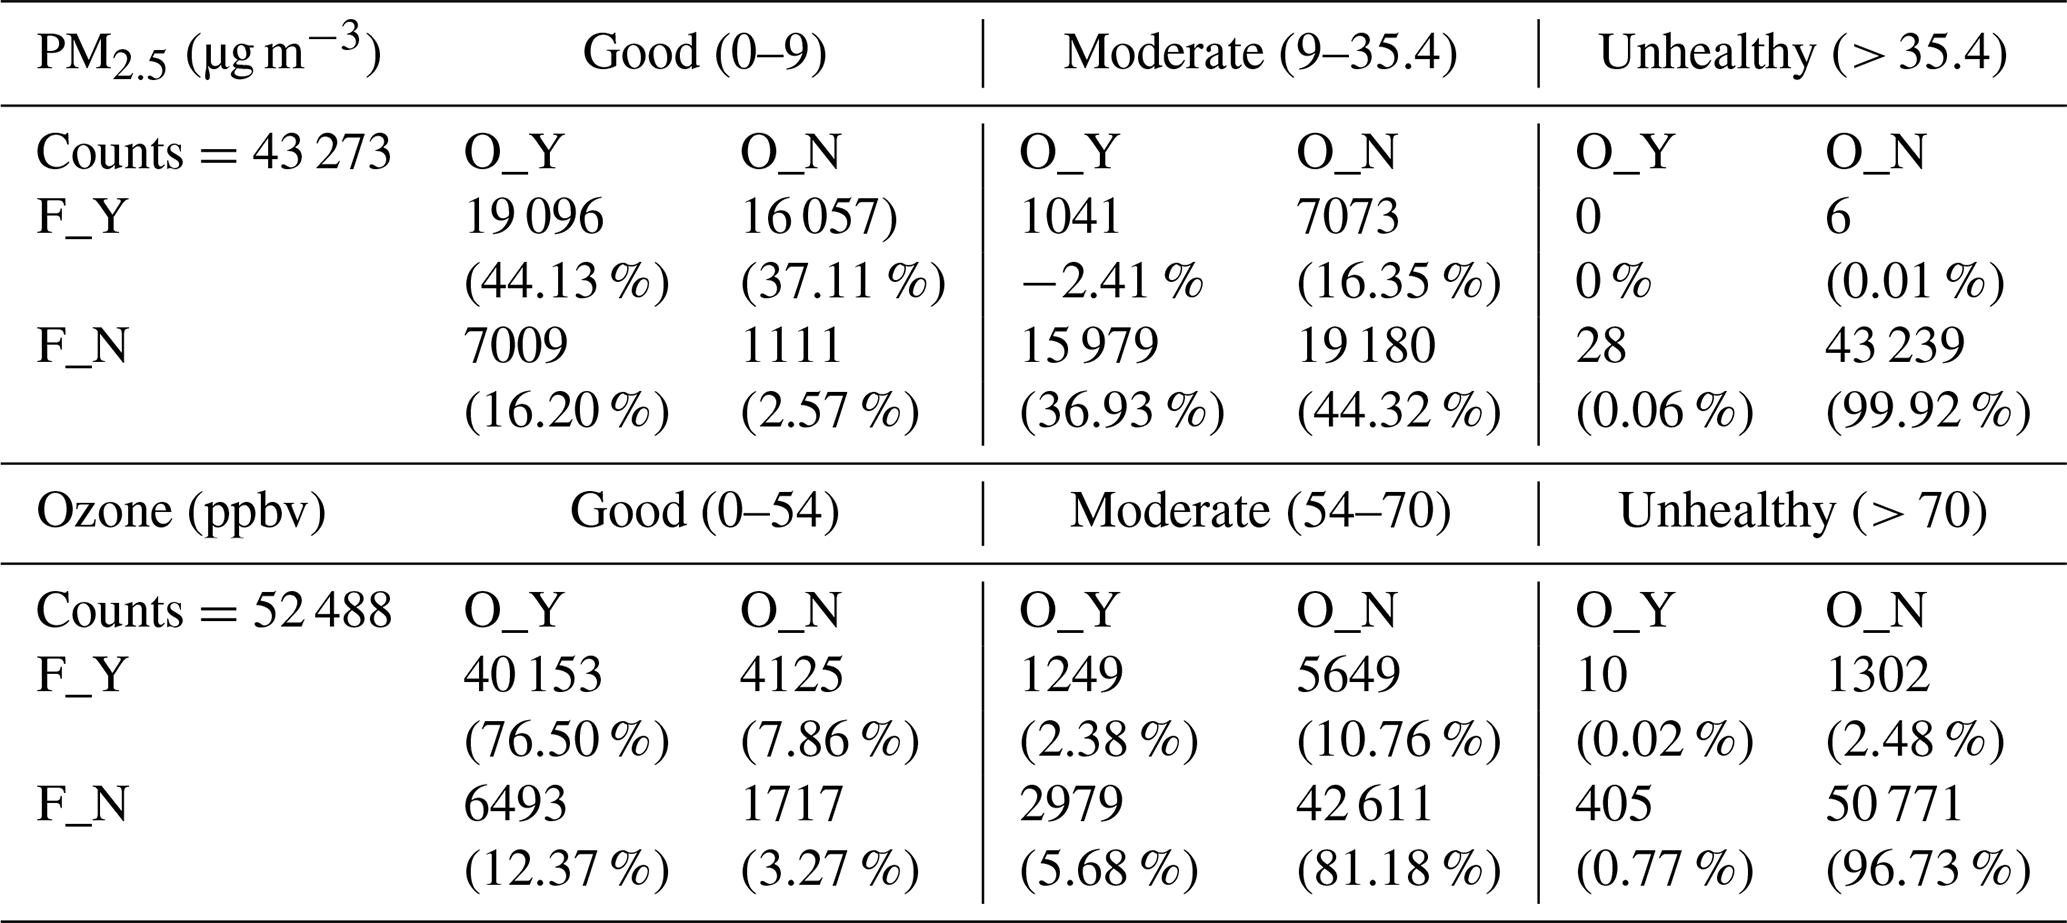
The mean bias of surface PM2.5 and ozone of the same WRF-Chem simulations as in Sect. 5.1 is provided in Fig. 5 and an example of resulting contingency statistics is provided in Table 1. The bias map (Fig. 5) shows underestimation in PM2.5 and overestimation in ozone across the domain. The contingency table based on EPA breakpoints shows that the WRF-Chem system can capture about 46 % cases for PM2.5 and about 80 % cases for ozone in Good and Moderate categories. The reduction of agreement percentage (44.13 % to 2.41 %) of O_Y columns in “Good” and “Moderate” categories for PM2.5 can also identify the underestimates in the simulations. The overestimation of ozone cannot be identified via the table because both model and observation have more than 80 % values falling into the “Good” category (0–54 ppbv).
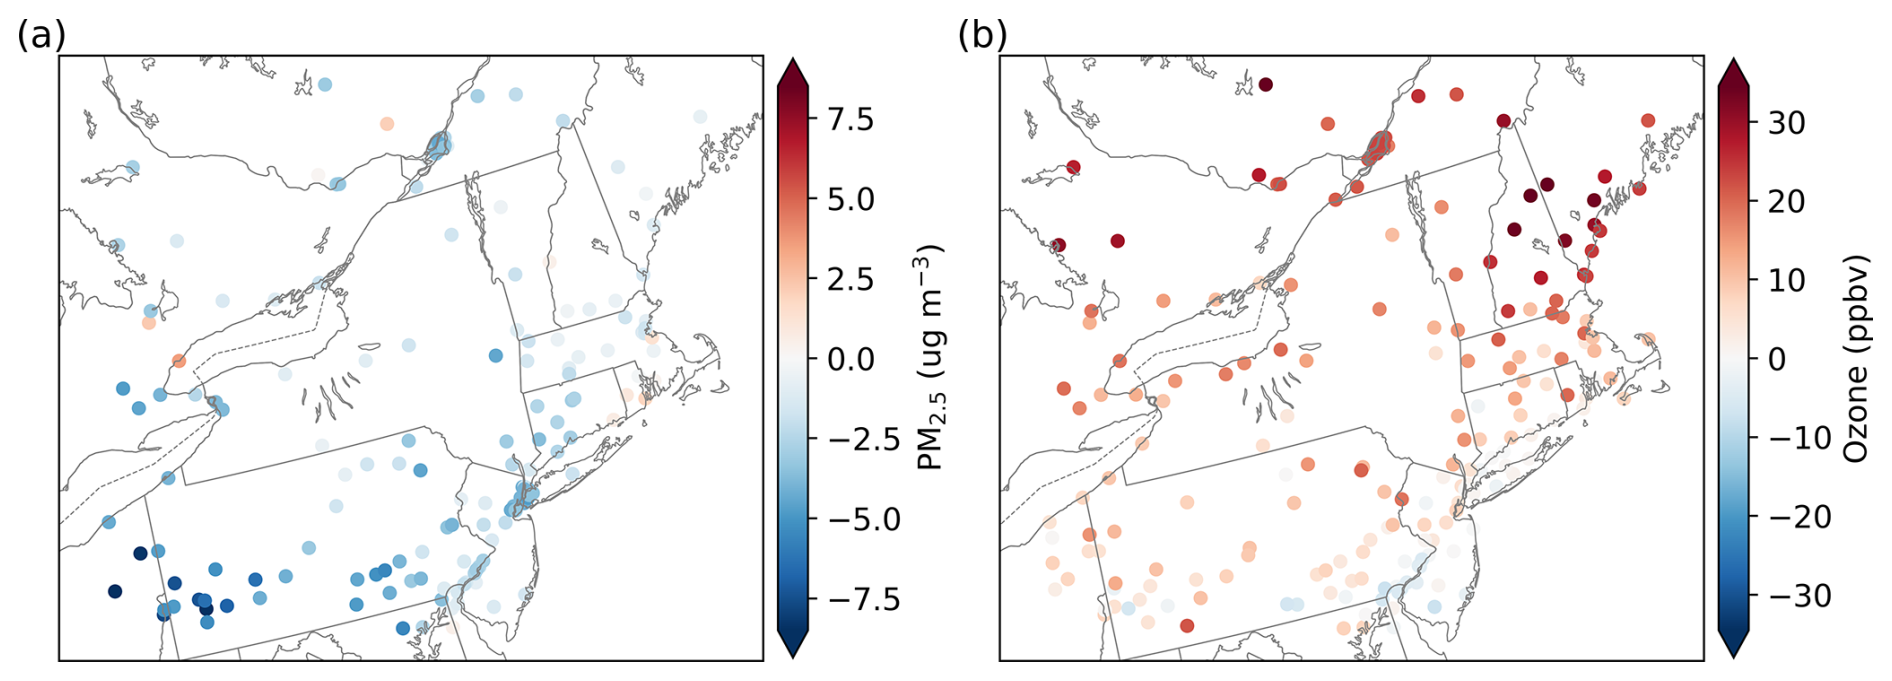
Figure 5Mean bias of WRF-Chem simulations of (a) PM2.5 and (b) ozone against AirNow sites from 22 August to 1 September 2024.
Here we showcase how JEDI's UFO observation operators, IODA observation format, and METplus' statistical analysis tools can be combined into a unified approach to assess forecast performance against regulatory air quality standards. This integration supports operational-style evaluations of air quality models, linking process-based research with metrics directly relevant to public health and policy.
Table 1Example of a contingency table of surface PM2.5 and ozone based on the EPA breakpoints table. (F: WRF-Chem forecasts, O: AirNow measurements, F/O_Y: Forecast or observation falls into the category, F/O_N: Forecast or observation does not fall into the category).
5.3 AOD products vs. MERRA-2
In this section, we demonstrate the capability of the JEDI system to evaluate AOD retrievals against reanalysis products, using the MERRA-2 reanalysis as a common baseline. The UFO/CRTM AOD operator with GEOS-5 LUTs was applied to aerosol mixing ratios from MERRA-2 to generate AOD H(x) at 550 nm. These were compared with multiple satellite AOD retrievals from NASA, including PACE OCI UAA, MODIS C6.1, and VIIRS DT and DB, as well as ground-based AERONET observations.
Figure 6 illustrates an example of the spatial distribution of observation-minus-background average (1–30 November 2024), with MERRA-2 reanalysis as the background, binned onto MERRA-2 grids (0.5° × 0.625°). Overall, AOD H(x) values from MERRA-2 is systematically lower than all the retrievals, with notable underestimation over India, Brazil, and tropical Africa. Regional patterns also emerge, with biases evident over North America, the Sahara Desert, and Australia, as well as fire-active regions such as central Africa and the Amazonia. These comparisons underscore the value of systematic intercomparisons across retrieval products using a consistent reanalysis baseline.
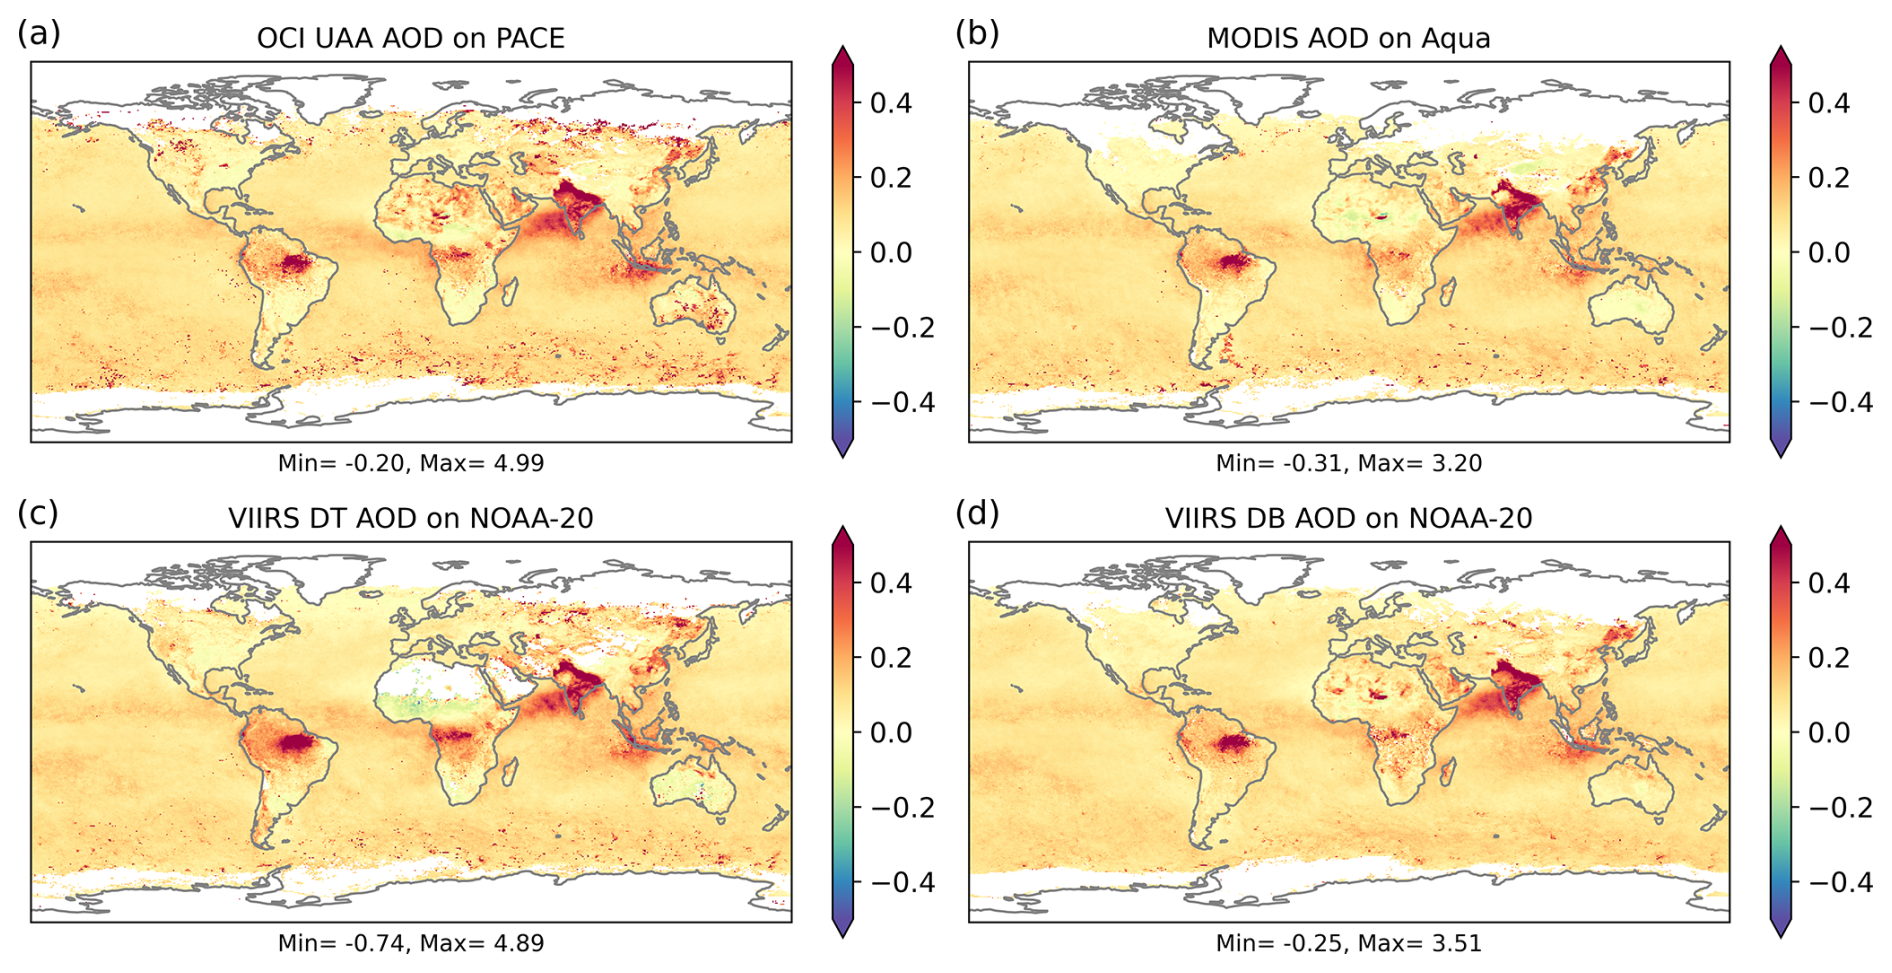
Figure 6Averaged observation-minus-background aggregated on MERRA-2 grids (0.5° × 0.625°) for 1–30 November 2024 from (a) OCI UAA AOD on PACE, (b) MODIS AOD on Aqua, (c) VIIRS Dark Target AOD on NOAA-20, and (d) VIIRS Deep Blue AOD on NOAA-20.
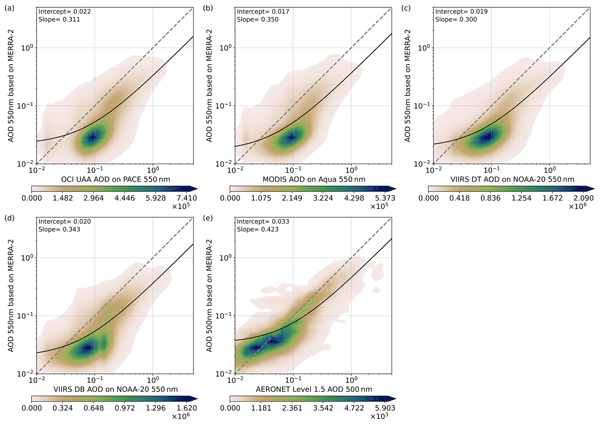
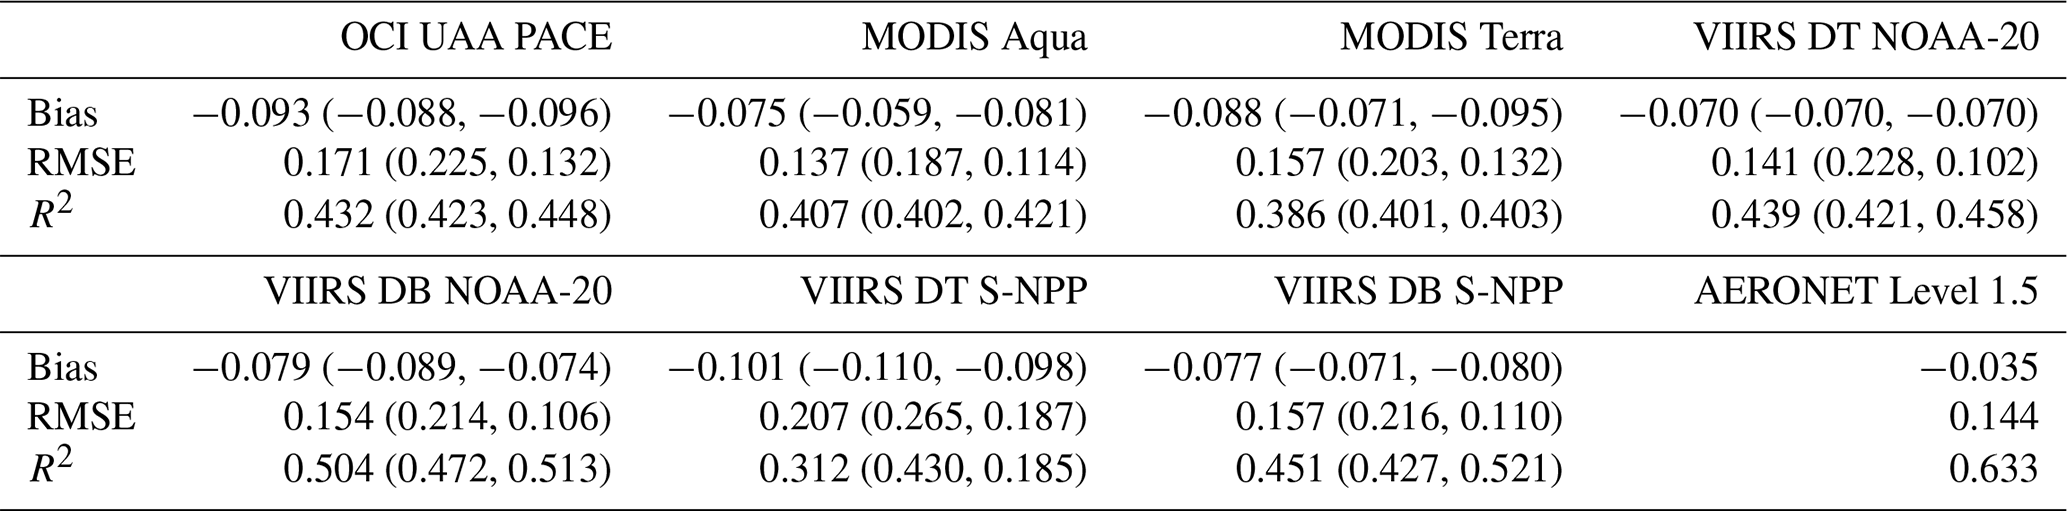
To quantify performance, Fig. 7 presents two-dimensional density distributions of AOD observations and the linear regression line from each product against H(x) of MERRA-2 reanalyses. Table 2 provides the descriptive statistics for each product. Both axes in Fig. 7 are logarithmic scale for detail in small values and it results in a curved linear regression line. It should be noted that the AERONET AOD data was not assimilated in the MERRA-2 system after October 2014 because the data is not available in near-real-time (Randles et al., 2017). Overall, the AOD H(x) from MERRA-2 shows better agreement with AERONET than with any of the satellite retrievals, exhibiting higher slope, higher correlations, lower RMSE, and smaller biases (Table 2), but it slightly overestimates the small AOD conditions. As MERRA-2 reanalyses show the best agreement with AERONET measurements, this highlights the utility of AERONET as a benchmark to evaluate the performance of both model simulations and observation operator. While model (weather and aerosols) fields, observation operator, and aerosol optical properties are identical for the H(x) calculation, this cross-comparison reveals the differences among AOD products, which are attributed to sensor characteristics and retrieval algorithms. Figure 8 displays the spatial distribution of mean biases over available AERONET sites and its data volume used for the verification. It shows that MERRA-2 has relatively good agreement with AERONET in most regions but India. The underestimation over India during this period can be attributed to the error associated with model states and the aerosol optical properties used in CRTM AOD operator. More thorough studies are needed to investigate this issue in the future.
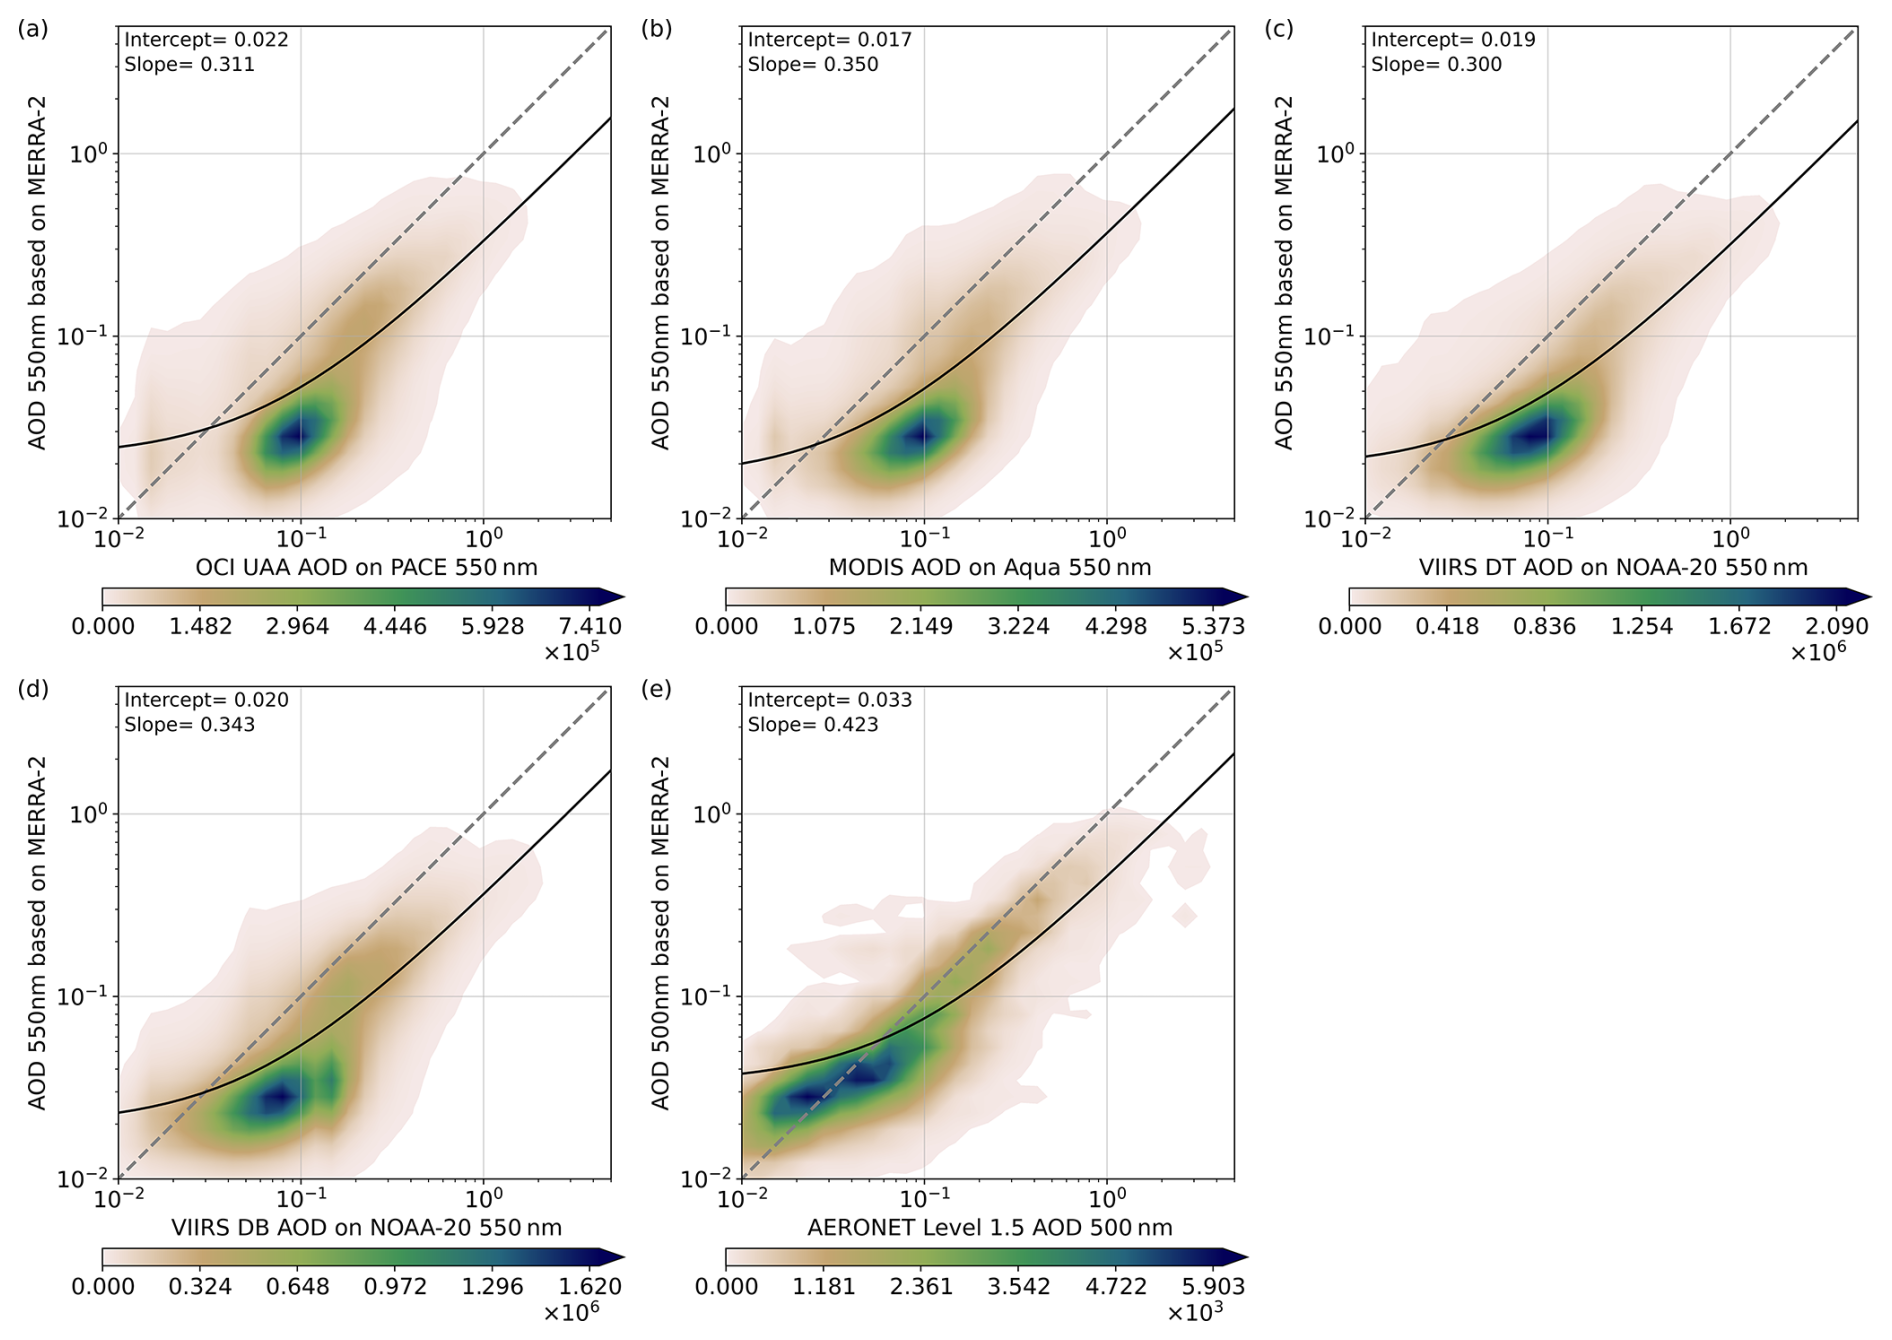
Figure 7Density distribution plots of AOD H(x) at 550 nm (500 nm for AERONET) on MERRA-2 reanalyses (y-axis) against AOD observation products (x-axis) from (a) OCI UAA on PACE, (b) MODIS C6.1 on Aqua, (c) VIIRS Dark Target on NOAA-20, (d) VIIRS Deep Blue on NOAA-20, and (e) AERONET Level 1.5. Axes are in the logarithmic scale.
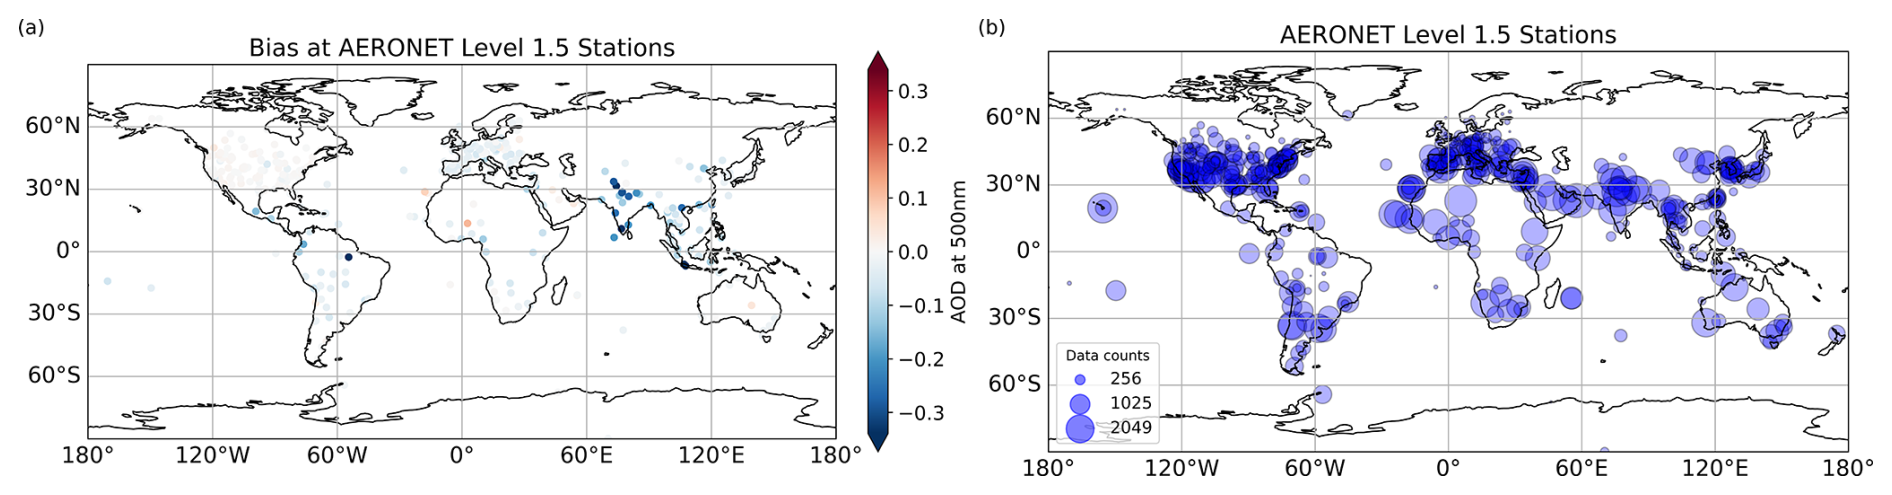
Figure 8(a) Mean bias and (b) data volume of AERONET Level 1.5 stations for November 2024.
An additional advantage of the IODA/UFO workflow is that metadata flags, such as land–water classification, are preserved throughout the JEDI procedure and retained in the output files, enabling categorized statistical analysis. This capability allows stratified statistics to be generated without the need for external file matching or pixel collocation. Table 2 summarizes bias, RMSE, and correlation (R2) for each dataset relative to MERRA-2, including separate land–water statistics for the satellite products. Among the seven satellite AOD retrieval products, MERRA-2 has better agreement with MODIS Aqua, and higher correlation with Deep Blue products on both NOAA-20 and S-NPP satellites. The agreement between the OCI UAA AOD from PACE mission and MERRA-2 H(x) is similar to other products given the UAA algorithm inherits both DT and DB algorithms. However, the mission provides other retrieval products, which can be further explored in future studies. These comparisons highlight differences in retrieval performance across surface types and underscore the complementary strengths of each dataset.
Table 2Summary table of Bias, RMSE, and R2 of AOD H(x) using MERRA-2 reanalysis against each AOD product. Numbers in parentheses are statistics for land and water, respectively. Separate statistics over land and water are not calculated for AERONET Level 1.5 AOD.
It is important to note that this section does not present a full scientific assessment of AOD products or reanalysis performance. Rather, it demonstrates the comprehensive capability of the JEDI system to integrate diverse aerosol datasets, generate consistent H(x) simulations using CRTM as the observation operator, and produce diagnostic statistics through a unified IODA framework. This functionality provides a powerful tool for routine evaluation and intercomparison of AOD products in both research and operational contexts.
This study demonstrates the capability of the JEDI framework to serve not only as a DA system but also as a unified and flexible platform for the evaluation of atmospheric composition observations and models. Leveraging JEDI's modular design, we used the already existing suite of observation operators to generate model equivalents of the observations, H(x), from both WRF-Chem forecasts and the MERRA-2 reanalysis. These H(x) quantities were then compared with a diverse set of ground-based and satellite observation products. The demonstrated comparisons include AirNow, Pandora, TEMPO, TROPOMI, MODIS, VIIRS, PACE, and AERONET and can be extended to much more observations products for not only atmospheric composition but also other application components of the earth system (weather, ocean, land surface).
Through case studies, we illustrated how the system can (1) evaluate WRF-Chem forecasts against high-resolution NO2 retrievals from TEMPO, TROPOMI, and Pandora, (2) assess surface PM2.5 and ozone WRF-Chem predictions relative to AirNow monitoring networks using EPA regulatory thresholds, and (3) intercompare multiple satellite AOD products against MERRA-2 reanalysis and AERONET. The examples highlight systematic differences between gridded model outputs and satellite observations, revealing retrieval biases that depend on region and surface type. Such examples also demonstrate the added value of complementary satellite products, such as TEMPO's hourly geostationary coverage versus TROPOMI's global polar-orbiting sampling, in characterizing temporal and spatial variability.
A central strength of this workflow lies in the use of the IODA data format and UFO observation operators, which are designed for data assimilation and therefore aim to perform with the best possible precision. While the UFO provides a model-agnostic framework through JEDI's standardized interfaces, its operators apply appropriate algorithmic and physical transformations and keep modularity and genericity. For instance, in atmospheric composition applications, UFO allows a choice of radiative transfer model and a choice of aerosol optical properties for AOD computations. Also, correct vertical integration and weighting function smoothing that is generic to most gas phase satellite nadir retrieval products is available. Such operators have been designed in a sophisticated and accurate manner to fulfil the modern data assimilation requirements of precision, genericity and built-in quality control filtering functionality. This paper demonstrates how to leverage this already existing capability within JEDI. In combination with METplus statistical tools, JEDI enables efficient generation of standard verification metrics, contingency tables, and stratified statistics based on observation metadata. This avoids the need for product-specific preprocessing and facilitates side-by-side evaluation across multiple instruments and models.
While our focus was on demonstrating system capability rather than delivering a comprehensive scientific assessment, the framework is readily extensible. Future developments include expanding observation conversion to the IODA format for additional trace gases such as HCHO and SO2, refining aerosol optical property representations in the CRTM AOD operator, and extending the workflow across diverse Earth system models interfaced with VIND and JEDI. Furthermore, the quantitative consideration of other useful information (e.g., observation error and bias correction) available in the JEDI framework in the model evaluation can be explored. By unifying data assimilation infrastructure with systematic evaluation, JEDI provides a robust foundation for advancing atmospheric composition research and enabling more effective use of rapidly growing satellite and ground-based observing systems in scientific and operational contexts. Looking ahead, JEDI also provides a powerful environment for testing the design and impact of observing systems through Observing System Experiments (OSEs) and Observing System Simulation Experiments (OSSEs). By enabling the generation of synthetic observations and evaluation of their impact, JEDI not only advances the assessment of existing observing systems but also opens new pathways for exploring and shaping future observing strategies.
The JEDI-ACE and related MERRA-2 data processing code has been made available on GitHub (https://github.com/weiwilliam/JEDI-ACE.git, last access: 22 July 2026). Users can follow the instruction to check out the commits for VIND and JEDI components. The sample input data and the output of H(x) IODA files and METplus statistics files have been made public available on Zenodo at https://doi.org/10.5281/zenodo.17058099 (Wei et al., 2025). The code for WRF-Chem v4.5.2 has been made publicly available through GitHub (https://github.com/wrf-model/WRF/releases/tag/v4.5.2, NSF National Center for Atmospheric Research Mesoscale & Microscale Meteorology, 2026).
Here we list the products used in this work: TEMPO NO2: https://doi.org/10.5067/IS-40e/TEMPO/NO2_L2.003 (Liu, 2026); TROPOMI NO2: https://doi.org/10.5270/S5P-9bnp8q8 (Copernicus Sentinel-5P, 2021); OCI UAA AOD on PACE: https://doi.org/10.5067/PACE/OCI/L2/AER_UAA/3.0 (NASA Ocean Biology Processing Group, 2025); MODIS AOD on Aqua: https://doi.org/10.5067/MODIS/MYD04_L2.061 (Levy et al., 2015b); MODIS AOD on Terra: https://doi.org/10.5067/MODIS/MOD04_L2.061 (Levy et al., 2015b); VIIRS DT AOD on Suomi-NPP: https://doi.org/10.5067/VIIRS/AERDT_L2_VIIRS_SNPP.002 (VIIRS Atmosphere Science Team, 2023a); VIIRS DT AOD on NOAA-20: https://doi.org/10.5067/VIIRS/AERDT_L2_VIIRS_NOAA20.002 (VIIRS Atmosphere Science Team, 2023b); VIIRS DB AOD on Suomi-NPP: https://doi.org/10.5067/VIIRS/AERDB_L2_VIIRS_SNPP.002 (VIIRS Atmosphere Science Team, 2023c); VIIRS DB AOD on NOAA-20: https://doi.org/10.5067/VIIRS/AERDB_L2_VIIRS_NOAA20.002 (VIIRS Atmosphere Science Team, 2023d). The doi is not available for data of AERONET, PANDORA, and AirNow, but they are publicly available. AERONET AOD data can be accessed through their API following the instructions on https://aeronet.gsfc.nasa.gov/print_web_data_help_v3_new.html (last access: 22 July 2026). PANDORA data can be accessed from http://data.pandonia-global-network.org/ (last access: 22 July 2026). The hourly PM2.5 and ozone data are accessible with AirNow API credentials on the webpage (https://docs.airnowapi.org/, last access: 22 July 2026). The v5.12.4 of MERRA-2 reanalysis data is publicly available on Goddard Earth Sciences (GES) Data and Information Services Center (DISC) (https://disc.gsfc.nasa.gov/, last access: 22 July 2026). The doi of the meteorological condition from M2I3NVASM is https://doi.org/10.5067/WWQSXQ8IVFW8 (Global Modeling and Assimilation Office (GMAO), 2015a). The doi for aerosol mixing ratios from M2I3NVAER is https://doi.org/10.5067/LTVB4GPCOTK2 (Global Modeling and Assimilation Office (GMAO), 2015b).
SW: writing – original draft, review & editing, methodology, investigation, formal analysis, data curation; JB: writing – original draft, review & editing, methodology; SH: writing – original draft, review & editing, conceptualization, project administration, investigation, formal analysis, funding acquisition; CD: writing – original draft, review & editing; BM: writing – review & editing; MA: writing – original draft, review & editing, data curation; CL: writing – review & editing, conceptualization, project administration, investigation, formal analysis, funding acquisition.
The contact author has declared that none of the authors has any competing interests.
Publisher's note: Copernicus Publications remains neutral with regard to jurisdictional claims made in the text, published maps, institutional affiliations, or any other geographical representation in this paper. The authors bear the ultimate responsibility for providing appropriate place names. Views expressed in the text are those of the authors and do not necessarily reflect the views of the publisher.
We would like to acknowledge high-performance computing support from the Derecho system (https://doi.org/10.5065/qx9a-pg09, Computational and Information Systems Laboratory, 2023) and the Casper system (https://ncar.pub/casper, last access: 22 July 2026) provided by the NSF National Center for Atmospheric Research (NCAR), sponsored by the National Science Foundation. This study made use of data from NASA's Plankton, Aerosol, Cloud, ocean Ecosystem (PACE) mission, distributed by the NASA Ocean Biology Distributed Active Archive Center (OB.DAAC). The AOD data from MODIS C6.1 and VIIRS DT and DB were acquired from the Level-1 and Atmosphere Archive & Distribution System (LAADS) Distributed Active Archive Center (DAAC), located in the Goddard Space Flight Center in Greenbelt, Maryland (https://ladsweb.nascom.nasa.gov/, last access: 22 July 2026). The data of Modern-Era Retrospective analysis for Research and Applications, Version 2 (MERRA-2), produced by the NASA Global Modeling and Assimilation Office (GMAO) is obtained from the NASA Goddard Earth Sciences Data and Information Services Center (GES DISC) (https://disc.gsfc.nasa.gov/, last access: 22 July 2026).
This study was jointly supported by the NOAA Science Collaboration Program (grant no. NA21OAR4310383), through the Joint Polar Satellite System (JPSS) Proving Ground and Risk Reduction Program, and by the NASA PACE Science and Applications Team (grant no. 80NSSC24K1786). This material is based upon work supported by the NSF National Center for Atmospheric Research, which is a major facility sponsored by the National Science Foundation under Cooperative Agreement No. 1852977.
This paper was edited by Guoqing Ge and reviewed by four anonymous referees.
Abdi-Oskouei, M., Barré, J., Wei, S.-W., Lu, S., Griffin, A., Gas, C. H., Hebert, F., Herbener, S., Lingerfelt, E., Parker, E., Sampson, C., Vahl, S., Diniz, F., Johnson, B., Dang, C., Tremolet, Y., Ruston, B., Shah, V., Knowland, E., Todling, R., Gelaro, R., Nowlan, C., Abad, G. G., Liu, X., McDonald, B., Waxman, E., Rollins, A., Zuraski, K., Peischl, J., Judd, L., Valin, L., Hanisco, T., Menetrier, B., Martin, C., Holdaway, D., Shlyaeva, A., Heinzeller, D., Pawson, S., and Auligne, T.: Capability demonstration of a JEDI-based system for TEMPO assimilation: system description and evaluation, ESS Open Archive [preprint], https://doi.org/10.22541/essoar.175767264.40932217/v1, 2025.
Baker, B. and Pan, L.: Overview of the Model and Observation Evaluation Toolkit (MONET) Version 1.0 for Evaluating Atmospheric Transport Models, Atmosphere, 8, 210, https://doi.org/10.3390/atmos8110210, 2017.
Bannister, R. N.: A review of operational methods of variational and ensemble-variational data assimilation, Q. J. Roy. Meteor. Soc., 143, 607–633, https://doi.org/10.1002/qj.2982, 2017.
Bocquet, M., Pires, C. A., and Wu, L.: Beyond Gaussian statistical modeling in geophysical data assimilation, Mon. Weather Rev., 138, 2997–3023, https://doi.org/10.1175/2010MWR3164.1, 2010.
Brotzge, J. A., Wang, J., Thorncroft, C. D., Joseph, E., Bain, N., Bassill, N., Farruggio, N., Freedman, J. M., Hemker, K., Jr., Johnston, D., Kane, E., McKim, S., Miller, S. D., Minder, J. R., Naple, P., Perez, S., Schwab, J. J., Schwab, M. J., and Sicker, J.: A Technical Overview of the New York State Mesonet Standard Network, J. Atmos. Ocean. Tech., 37, 1827–1845, https://doi.org/10.1175/JTECH-D-19-0220.1, 2020.
Brown, B., Jensen, T., Gotway, J. H., Bullock, R., Gilleland, E., Fowler, T., Newman, K., Adriaansen, D., Blank, L., Burek, T., Harrold, M., Hertneky, T., Kalb, C., Kucera, P., Nance, L., Opatz, J., Vigh, J., and Wolff, J.: The Model Evaluation Tools (MET): More than a decade of community-supported forecast verification, B. Am. Meteorol. Soc., 102, E782–E807, https://doi.org/10.1175/BAMS-D-19-0093.1, 2021.
Carrassi, A., Bocquet, M., Bertino, L., and Evensen, G.: Data assimilation in the geosciences: an overview of methods, issues, and perspectives, WIREs Clim. Change, 9, e535, https://doi.org/10.1002/wcc.535, 2018.
Chin, M., Ginoux, P., Kinne, S., Torres, O., Holben, B. N., Duncan, B. N., Martin, R. V., Logan, J. A., Higurashi, A., and Nakajima, T.: Tropospheric Aerosol Optical Thickness from the GOCART Model and Comparisons with Satellite and Sun Photometer Measurements, J. Atmos. Sci., 59, 461–483, https://doi.org/10.1175/1520-0469(2002)059<0461:TAOTFT>2.0.CO;2, 2002.
Colarco, P. R., Chin, M., Bian, H., Diehl, T., and Yu, H.: Multiyear simulation of global aerosol distributions in the NASA GEOS-4 model and comparisons with satellite and ground-based aerosol optical depth, J. Geophys. Res., 115, D14207, https://doi.org/10.1029/2009JD012820, 2010.
Colarco, P. R., Nowottnick, E. P., Randles, C. A., Yi, B., Yang, P., Kim, K.-M., Smith, J. A., and Bardeen, C. G.: Impact of radiatively interactive dust aerosols in the NASA GEOS-5 climate model: Sensitivity to dust particle shape and refractive index, J. Geophys. Res.-Atmos., 119, 753–786, https://doi.org/10.1002/2013JD020046, 2014.
Computational and Information Systems Laboratory: Derecho: HPE Cray EX System (University Community Computing), Boulder, CO: NSF National Center for Atmospheric Research, https://doi.org/10.5065/qx9a-pg09, 2023.
Copernicus Sentinel-5P: TROPOMI Level 2 Nitrogen Dioxide total column products, Version 02, European Space Agency [data set], https://doi.org/10.5270/S5P-9bnp8q8, 2021.
Courtier, P., Thépaut, J.-N., and Hollingsworth, A.: A strategy for operational implementation of 4D-Var, using an incremental approach, Q. J. Roy. Meteor. Soc., 120, 1367–1387, https://doi.org/10.1002/qj.49712051912, 1994.
Deconinck, W., Bauer, P., Diamantakis, M., Hamrud, M., Kühnlein, C., Maciel, P., Mengaldo, G., Quintino, T., Raoult, B., Smolarkiewicz, P. K., and Wedi, N. P.: Atlas: a library for numerical weather prediction and climate modelling, Comput. Phys. Commun., 220, 188–204, https://doi.org/10.1016/j.cpc.2017.07.006, 2017.
Emmons, L. K., Schwantes, R. H., Orlando, J. J., Tyndall, G., Kinnison, D., Lamarque, J.-F., Marsh, D., Mills, M. J., Tilmes, S., Bardeen, C., Buchholz, R. R., Conley, A., Gettelman, A., Garcia, R., Simpson, I., Blake, D. R., Meinardi, S., and Pétron, G.: The chemistry mechanism in the Community Earth System Model version 2 (CESM2), J. Adv. Model. Earth Sy., 12, e2019MS001882, https://doi.org/10.1029/2019MS001882, 2020.
Eskes, H., van Geffen, J., Boersma, F., Eichmann, K.-U., Apituley, A., Pedergnana, M., Sneep, M., Veefkind, J. P., and Loyola, D.: Sentinel-5 precursor/TROPOMI Level 2 Product User Manual – Nitrogen dioxide, KNMI, https://sentinels.copernicus.eu/documents/247904/2474726/Sentinel-5P-Level-2-Product-User-Manual-Nitrogen-Dioxide.pdf (last access: 15 August 2025), 2022.
Gelaro, R., McCarty, W., Suárez, M. J., Todling, R., Molod, A., Takacs, L., Randles, C. A., Darmenov, A., Bosilovich, M. G., Reichle, R., Wargan, K., Coy, L., Cullather, R., Draper, C., Akella, S., Buchard, V., Conaty, A., da Silva, A. M., Gu, W., Kim, G., Koster, R., Lucchesi, R., Merkova, D., Nielsen, J. E., Partyka, G., Pawson, S., Putman, W., Rienecker, M., Schubert, S. D., Sienkiewicz, M., and Zhao, B.: The Modern-Era Retrospective Analysis for Research and Applications, Version 2 (MERRA-2), J. Climate, 30, 5419–5454, https://doi.org/10.1175/JCLI-D-16-0758.1, 2017.
Gettelman, A., Mills, M. J., Kinnison, D. E., Garcia, R. R., Smith, A. K., Marsh, D. R., Tilmes, S., Vitt, F., Bardeen, C. G., Polvani, L., and Solomon, S.: The Whole Atmosphere Community Climate Model Version 6 (WACCM6), J. Geophys. Res.-Atmos., 124, 12388–12403, https://doi.org/10.1029/2019JD030943, 2019.
Giles, D. M., Sinyuk, A., Sorokin, M. G., Schafer, J. S., Smirnov, A., Slutsker, I., Eck, T. F., Holben, B. N., Lewis, J. R., Campbell, J. R., Welton, E. J., Korkin, S. V., and Lyapustin, A. I.: Advancements in the Aerosol Robotic Network (AERONET) Version 3 database – automated near-real-time quality control algorithm with improved cloud screening for Sun photometer aerosol optical depth (AOD) measurements, Atmos. Meas. Tech., 12, 169–209, https://doi.org/10.5194/amt-12-169-2019, 2019.
Global Modeling and Assimilation Office (GMAO): MERRA-2 inst3_3d_asm_Nv: 3d,3-Hourly,Instantaneous,Model-Level,Assimilation,Assimilated Meteorological Fields V5.12.4, Greenbelt, MD, USA, Goddard Earth Sciences Data and Information Services Center (GES DISC) [data set], https://doi.org/10.5067/WWQSXQ8IVFW8, 2015a.
Global Modeling and Assimilation Office (GMAO): MERRA-2 inst3_3d_aer_Nv: 3d,3-Hourly,Instantaneous,Model-Level,Assimilation,Aerosol Mixing Ratio V5.12.4, Greenbelt, MD, USA, Goddard Earth Sciences Data and Information Services Center (GES DISC) [data set], https://doi.org/10.5067/LTVB4GPCOTK2, 2015b.
Grell, G. A., Peckham, S. E., Schmitz, R., McKeen, S. A., Frost, G., Skamarock, W. C., and Eder, B.: Fully coupled “online” chemistry within the WRF model, Atmos. Environ., 39, 6957–6975, https://doi.org/10.1016/j.atmosenv.2005.04.027, 2005.
Guenther, A., Karl, T., Harley, P., Wiedinmyer, C., Palmer, P. I., and Geron, C.: Estimates of global terrestrial isoprene emissions using MEGAN (Model of Emissions of Gases and Aerosols from Nature), Atmos. Chem. Phys., 6, 3181–3210, https://doi.org/10.5194/acp-6-3181-2006, 2006.
Guerrette, J. J., Liu, Z., Snyder, C., Jung, B.-J., Schwartz, C. S., Ban, J., Vahl, S., Wu, Y., Baños, I. H., Yu, Y. G., Ha, S., Trémolet, Y., Auligné, T., Gas, C., Ménétrier, B., Shlyaeva, A., Miesch, M., Herbener, S., Liu, E., Holdaway, D., and Johnson, B. T.: Data assimilation for the Model for Prediction Across Scales – Atmosphere with the Joint Effort for Data assimilation Integration (JEDI-MPAS 2.0.0-beta): ensemble of 3D ensemble-variational (En-3DEnVar) assimilations, Geosci. Model Dev., 16, 7123–7142, https://doi.org/10.5194/gmd-16-7123-2023, 2023.
Ha, S., Guerrette, J. J., Hernández Baños, I., Skamarock, W. C., and Duda, M. G.: Incremental analysis update (IAU) in the Model for Prediction Across Scales coupled with the Joint Effort for Data assimilation Integration (MPAS–JEDI 2.0.0), Geosci. Model Dev., 17, 4199–4211, https://doi.org/10.5194/gmd-17-4199-2024, 2024.
Herman, J., Cede, A., Spinei, E., Mount, G., Tzortziou, M., and Abuhassan, N.: NO2 column amounts from ground-based Pandora and MFDOAS spectrometers using the direct-sun DOAS technique: intercomparisons and application to OMI validation, J. Geophys. Res., 114, D13307, https://doi.org/10.1029/2009JD011848, 2009.
Hsu, N. C., Jeong, M. J., Bettenhausen, C., Sayer, A. M., Hansell, R., Seftor, C. S., Huang, J., and Tsay, S. C.: Enhanced Deep Blue aerosol retrieval algorithm: the second generation, J. Geophys. Res.-Atmos., 118, 9296–9315, https://doi.org/10.1002/jgrd.50712, 2013.
Huang, B., Pagowski, M., Trahan, S., Martin, C. R., Tangborn, A., Kongdragunta, S., and Kleist, D. T.: JEDI-Based Three-Dimensional Ensemble-Variational Data Assimilation System for Global Aerosol Forecasting at NCEP, J. Adv. Model. Earth Sy., 15, e2022MS003232, https://doi.org/10.1029/2022MS003232, 2023.
Jensen, T., Halley Gotway, J., Harrold, M., Vigh, J., Row, M., Kalb, C., Fisher, H., Goodrich, L., Adriaansen, D., Win-Gildenmeister, M., McCabe, G., Prestopnik, J., Opatz, J., Frimel, J., Blank, L., and Arbetter, T.: The METplus Version 6.0.0 User's Guide, Developmental Testbed Center, https://github.com/dtcenter/METplus/releases (last access: 22 July 2026), 2024.
Jung, B.-J., Ménétrier, B., Snyder, C., Liu, Z., Guerrette, J. J., Ban, J., Baños, I. H., Yu, Y. G., and Skamarock, W. C.: Three-dimensional variational assimilation with a multivariate background error covariance for the Model for Prediction Across Scales – Atmosphere with the Joint Effort for Data assimilation Integration (JEDI-MPAS 2.0.0-beta), Geosci. Model Dev., 17, 3879–3895, https://doi.org/10.5194/gmd-17-3879-2024, 2024.
Kalnay, E.: Atmospheric Modeling, Data Assimilation and Predictability, Cambridge University Press, Cambridge, UK, 341 pp., ISBN 9780511802270, 2003.
Kleist, D. T., Parrish, D. F., Derber, J. C., Treadon, R., Wu, W., and Lord, S.: Introduction of the GSI into the NCEP Global Data Assimilation System, Weather Forecast., 24, 1691–1705, https://doi.org/10.1175/2009WAF2222201.1, 2009.
Lee, J., Hsu, N. C., Kim, W. V., Sayer, A. M., and Tsay, S. C.: VIIRS version 2 Deep Blue aerosol products, J. Geophys. Res.-Atmos., 129, e2023JD040082, https://doi.org/10.1029/2023JD040082, 2024.
Levy, R. C., Mattoo, S., Munchak, L. A., Remer, L. A., Sayer, A. M., Patadia, F., and Hsu, N. C.: The Collection 6 MODIS aerosol products over land and ocean, Atmos. Meas. Tech., 6, 2989–3034, https://doi.org/10.5194/amt-6-2989-2013, 2013.
Levy, R. C., Munchak, L. A., Mattoo, S., Patadia, F., Remer, L. A., and Holz, R. E.: Towards a long-term global aerosol optical depth record: applying a consistent aerosol retrieval algorithm to MODIS and VIIRS-observed reflectance, Atmos. Meas. Tech., 8, 4083–4110, https://doi.org/10.5194/amt-8-4083-2015, 2015a.
Levy, R., Hsu, C., et al.: MODIS Atmosphere L2 Aerosol Product, NASA MODIS Adaptive Processing System, Goddard Space Flight Center, USA [data set], https://doi.org/10.5067/MODIS/MOD04_L2.061, 2015b.
Levy, R. C., Mattoo, S., Sawyer, V., Kiliyanpilakkil, P., Shi, Y., Gupta, P., Remer, L., Kim, M., Zhou, Y., Kleidman, R., Remer, L. A., Tanré, D., and Kaufman, Y. J.: Algorithm for remote sensing of tropospheric aerosol over dark targets, NASA Goddard Space Flight Center, Greenbelt, MD, USA, https://darktarget.gsfc.nasa.gov/sites/default/files/users/user9/ATBD_DarkTarget_April3.pdf (last access: 9 September 2025), 2024.
Liu, X.: TEMPO NO2 tropospheric and stratospheric columns V03 (PROVISIONAL), NASA Langley Atmospheric Science Data Center Distributed Active Archive Center [data set], https://doi.org/10.5067/IS-40E/TEMPO/NO2_L2.003, 2026.
Liu, Z., Snyder, C., Guerrette, J. J., Jung, B.-J., Ban, J., Vahl, S., Wu, Y., Trémolet, Y., Auligné, T., Ménétrier, B., Shlyaeva, A., Herbener, S., Liu, E., Holdaway, D., and Johnson, B. T.: Data assimilation for the Model for Prediction Across Scales – Atmosphere with the Joint Effort for Data assimilation Integration (JEDI-MPAS 1.0.0): EnVar implementation and evaluation, Geosci. Model Dev., 15, 7859–7878, https://doi.org/10.5194/gmd-15-7859-2022, 2022.
Ménétrier, B., Piacentini, A., and Barré J.: benjaminmenetrier/vind: VIND release 1.0.1, Zenodo [code], https://doi.org/10.5281/zenodo.18156822, 2026.
NASA Ocean Biology Processing Group: PACE OCI Level-2 Regional Aerosol Optical Properties, Unified Aerosol Algorithm (UAA) Algorithm Data, version 3.1, NASA Ocean Biology Distributed Active Archive Center [data set], https://doi.org/10.5067/PACE/OCI/L2/AER_UAA/3.1, 2025.
Nowlan, C. R., Abad, G. G., Liu, X., Wang, H., and Chance, K.: TEMPO nitrogen dioxide retrieval algorithm theoretical basis document, NASA Algorithm Publication Tool, https://www.earthdata.nasa.gov/apt/documents/tempo-nitrogen-dioxide-retrieval/v1.0 (last access: 9 September 2025), 2025.
Nowlan, C. R., Liu, X., Leitch, J. W., Chance, K., González Abad, G., Liu, C., Zoogman, P., Cole, J., Delker, T., Good, W., Murcray, F., Ruppert, L., Soo, D., Follette-Cook, M. B., Janz, S. J., Kowalewski, M. G., Loughner, C. P., Pickering, K. E., Herman, J. R., Beaver, M. R., Long, R. W., Szykman, J. J., Judd, L. M., Kelley, P., Luke, W. T., Ren, X., and Al-Saadi, J. A.: Nitrogen dioxide observations from the Geostationary Trace gas and Aerosol Sensor Optimization (GeoTASO) airborne instrument: Retrieval algorithm and measurements during DISCOVER-AQ Texas 2013, Atmos. Meas. Tech., 9, 2647–2668, https://doi.org/10.5194/amt-9-2647-2016, 2016.
NSF National Center for Atmospheric Research Mesoscale & Microscale Meteorology: WRF v4.5.2, Github [code], https://github.com/wrf-model/WRF/releases#release-v4.5.2, last access: 22 July 2026.
Nystrom, R. G., Snyder, C., Liu, Z., Jung, B. J., Ban, J., and Banos, I. H.: A hybrid four-dimensional variational data assimilation system for the Model for Prediction Across Scales (MPAS-atmosphere): Leveraging the Joint Effort for Data assimilation Integration (JEDI), J. Adv. Model. Earth Sy., 17, e2025MS005183. https://doi.org/10.1029/2025MS005183, 2025
Park, J., Liu, C., and Xue, M.: Development and Testing of Ensemble-Variational Data Assimilation Capabilities for Radar Data within JEDI coupled with FV3-LAM Model, EGUsphere [preprint], https://doi.org/10.5194/egusphere-2025-5411, 2025.
Powers, J. G., Klemp, J. B., Skamarock, W. C., Davis, C. A., Dudhia, J., Gill, D. O., Coen, J. L., Gochis, D. J., Ahmadov, R., Peckham, S. E., Grell, G. A., Michalakes, J., Trahan, S., Benjamin, S. G., Alexander, C. R., Dimego, G. J., Wang, W., Schwartz, C. S., Romine, G. S., Liu, Z., Snyder, C., Chen, F., Barlage, M. J., Yu, W., and Duda, M. G.: The Weather Research and Forecasting Model: Overview, System Efforts, and Future Directions, B. Am. Meteorol. Soc., 98, 1717–1737, https://doi.org/10.1175/BAMS-D-15-00308.1, 2017.
Prestopnik, J., Soh, H., Goodrich, L., Brown, B., Bullock, R., Halley Gotway, J., Newman, K., Opatz, J., and Jensen, T.: The MET Version 12.1.1 User's Guide, Developmental Testbed Center, https://github.com/dtcenter/MET/releases (last access: 22 July 2026), 2025.
Randles, C. A., da Silva, A. M., Buchard, V., Colarco, P. R., Darmenov, A., Govindaraju, R., Smirnov, A., Holben, B., Ferrare, R., Hair, J., Shinozuka, Y., and Flynn, C. J.: The MERRA-2 Aerosol Reanalysis, 1980 Onward. Part I: System Description and Data Assimilation Evaluation, J. Climate, 30, 6823–6850, https://doi.org/10.1175/JCLI-D-16-0609.1, 2017.
Remer, L. A., Davis, A. B., Mattoo, S., Levy, R. C., Kalashnikova, O. V., Coddington, O., Chowdhary, J., Knobelspiesse, K., Xu, X., Ahmad, Z., Boss, E., Cairns, B., Dierssen, H. M., Diner, D. J., Franz, B., Frouin, R., Gao, B.-C., Ibrahim, A., Martins, J. V., Omar, A. H., Torres, O., Xu, F., and Zhai, P.-W.: Retrieving aerosol characteristics from the PACE mission, Part 1: Ocean Color Instrument, Front. Earth Sci., 7, 152, https://doi.org/10.3389/feart.2019.00152, 2019a.
Remer, L. A., Knobelspiesse, K., Zhai, P.-W., Xu, F., Kalashnikova, O. V., Chowdhary, J., Hasekamp, O., Dubovik, O., Wu, L., Ahmad, Z., Boss, E., Cairns, B., Coddington, O., Davis, A. B., Dierssen, H. M., Diner, D. J., Franz, B., Frouin, R., Gao, B.-C., Ibrahim, A., Levy, R. C., Martins, J. V., Omar, A. H., and Torres, O.: Retrieving aerosol characteristics from the PACE mission, Part 2: Multi-angle and polarimetry, Front. Environ. Sci., 7, 94, https://doi.org/10.3389/fenvs.2019.00094, 2019b.
Sawyer, V., Levy, R. C., Mattoo, S., Cureton, G., Shi, Y., and Remer, L. A.: Continuing the MODIS Dark Target aerosol time series with VIIRS, Remote Sens., 12, 308, https://doi.org/10.3390/rs12020308, 2020.
Shrestha, B., Brotzge, J. A., Wang, J., Bain, N., Thorncroft, C. D., Joseph, E., Freedman, J., and Perez, S.: Overview and Applications of the New York State Mesonet Profiler Network, J. Appl. Meteorol. Clim., 60, 1591–1611, https://doi.org/10.1175/JAMC-D-21-0104.1, 2021.
Skamarock, W., Klemp, J., Dudhia, J., Gill, D. O., Liu, Z., Berner, J., Wang, W., Powers, J. G., Duda, M. G., Barker, D., and Huang, X.-Y.: A description of the Advanced Research WRF model version 4.3, NCAR, https://doi.org/10.5065/1dfh-6p97, 2021.
Sun, T., Guerrette, J. J., Liu, Z., Ban, J., Jung, B.-J., Hernandez Banos, I., and Snyder, C.: All-sky AMSU-A radiance data assimilation using the gain-form of Local Ensemble Transform Kalman filter within MPAS-JEDI-2.1.0: implementation, tuning, and evaluation, Geosci. Model Dev., 18, 8569–8587, https://doi.org/10.5194/gmd-18-8569-2025, 2025.
Trémolet, Y. and Auligné, T.: The Joint Effort for Data Assimilation Integration (JEDI), JCSDA Q. Newsl., 66, 1–5, https://doi.org/10.25923/RB19-0Q26, 2020.
Veefkind, J., Aben, I., McMullan, K., Förster, H., De Vries, J., Otter, G., and Levelt, P.: TROPOMI on the ESA Sentinel-5 Precursor: a GMES mission for global observations of the atmospheric composition for climate, air quality and ozone layer applications, Remote Sens. Environ., 120, 70–83, https://doi.org/10.1016/j.rse.2011.09.027, 2012.
VIIRS Atmosphere Science Team, S. S. E. C.: VIIRS/SNPP Dark Target Aerosol L2 6-Min Swath 6 km, NASA Level 1 and Atmosphere Archive and Distribution System Distributed Active Archive Center [data set], https://doi.org/10.5067/VIIRS/AERDT_L2_VIIRS_SNPP.002, 2023a.
VIIRS Atmosphere Science Team, S. S. E. C.: VIIRS/NOAA20 Dark Target Aerosol 6-Min L2 Swath 6 km, NASA Level 1 and Atmosphere Archive and Distribution System Distributed Active Archive Center [data set], https://doi.org/10.5067/VIIRS/AERDT_L2_VIIRS_NOAA20.002, 2023b.
VIIRS Atmosphere Science Team, S. S. E. C.: VIIRS/SNPP Deep Blue Aerosol L2 6-Min Swath 6 km, NASA Level 1 and Atmosphere Archive and Distribution System Distributed Active Archive Center [data set], https://doi.org/10.5067/VIIRS/AERDB_L2_VIIRS_SNPP.002, 2023c.
VIIRS Atmosphere Science Team, S. S. E. C.: VIIRS/NOAA20 Deep Blue Aerosol L2 6-Min Swath 6 km, NASA Level 1 and Atmosphere Archive and Distribution System Distributed Active Archive Center [data set], https://doi.org/10.5067/VIIRS/AERDB_L2_VIIRS_NOAA20.002, 2023d.
Wang, H., Martin, C., Barré, J., Li, R., Weygandt, S., Huang, J., Tang, Y., Choi, H., Tangborn, A., Wang, K., Liu, H., and Lee, J.: PM2.5 assimilation within JEDI for NOAA's regional Air Quality Model (AQMv7): application to the September 2020 Western US wildfires, Geosci. Model Dev., 19, 2479–2495, https://doi.org/10.5194/gmd-19-2479-2026, 2026
Werdell, P. J., Behrenfeld, M. J., Bontempi, P. S., Boss, E., Cairns, B., Davis, G. T., Franz, B. A., Gliese, U. B., Gorman, E. T., Hasekamp, O., Knobelspiesse, K. D., Mannino, A., Martins, J. V., McClain, C. R., Meister, G., and Remer, L. A.: The Plankton, Aerosol, Cloud, Ocean Ecosystem (PACE) mission: status, science, advances, B. Am. Meteorol. Soc., 100, 1775–1794, https://doi.org/10.1175/BAMS-D-18-0056.1, 2019.
Wei, S.-W., Pagowski, M., da Silva, A., Lu, C.-H., and Huang, B.: The prototype NOAA Aerosol Reanalysis version 1.0: description of the modeling system and its evaluation, Geosci. Model Dev., 17, 795–813, https://doi.org/10.5194/gmd-17-795-2024, 2024.
Wei, S.-W., Barré, J., Ha, S., Lu, C.-H., Abdi-Oskouei, M., Ménétrier, B., and Dang, C.: Sample input and output data of “Leveraging JEDI for Atmospheric Composition: A unified framework for evaluating observations and model forecast”, Zenodo [data set], https://doi.org/10.5281/zenodo.17058099, 2025.
Wiedinmyer, C., Kimura, Y., McDonald-Buller, E. C., Emmons, L. K., Buchholz, R. R., Tang, W., Seto, K., Joseph, M. B., Barsanti, K. C., Carlton, A. G., and Yokelson, R.: The Fire Inventory from NCAR version 2.5: an updated global fire emissions model for climate and chemistry applications, Geosci. Model Dev., 16, 3873–3891, https://doi.org/10.5194/gmd-16-3873-2023, 2023.
Zoogman, P., Liu, X., Suleiman, R., Pennington, W., Flittner, D., Al-Saadi, J., and Chance, K.: Tropospheric emissions: Monitoring of pollution (TEMPO), J. Quant. Spectrosc. Ra., 186, 17–39, https://doi.org/10.1016/j.jqsrt.2016.05.008, 2017.