
the Creative Commons Attribution 4.0 License.
the Creative Commons Attribution 4.0 License.
 | 07 Sep 2026
Development and testing of ensemble-variational data assimilation capabilities for radar data within JEDI coupled with FV3-LAM model
Jun Park

Ming Xue
This study presents the first implementation and evaluation of radar reflectivity data assimilation capabilities within the ensemble three-dimensional variational (En3DVar) data assimilation (DA) system of the Joint Effort for Data assimilation Integration (JEDI) framework. Building on our earlier works that assimilated reflectivity in JEDI LETKF and in GSI En3DVar, this study focuses on the JEDI En3DVar algorithm when coupled with the FV3-LAM model using the Thompson microphysics scheme. The radar reflectivity observation operator is refined by modifying the snow and graupel reflectivity formulations to improve consistency with Thompson microphysics. The new operator notably improves reflectivity analyses at the upper levels and reduces root-mean-square innovations for both reflectivity and radial velocity during the DA cycles. A high-impact convective storm event is used to evaluate the new implementation. DA experiments are conducted using both the JEDI and GSI En3DVar systems, employing identical observation operators and similar configurations. The resulting analyses and short-range forecasts from the two systems are comparable, supporting the validity of the new implementation of JEDI En3DVar for reflectivity and radial velocity assimilation. Additional comparisons with real-time High-Resolution Rapid Refresh (HRRR) and experimental Rapid Refresh Forecast System (RRFS) forecasts are made. The JEDI-based experiment captures the storm structure and placement with accuracy similar to or better than the HRRR and RRFS forecasts. Improvements are especially evident in the depiction of convective cores and stratiform rainbands, where reflectivity intensity and coverage are better aligned with radar observations.
- Article
(6614 KB) - Full-text XML
- BibTeX
- EndNote


Accurate prediction of high-impact convective-scale weather events such as supercells, tornadoes, and heavy precipitation remains a critical challenge for both research and operational numerical weather prediction (NWP). High-resolution radar observations, particularly radar reflectivity and radial velocity, offer invaluable information on the internal structure and rapid evolution of convective storms. The assimilation of such radar observations into NWP models has been shown to significantly improve the quality of initial conditions, thereby enhancing short-range forecast skill (e.g., Sun and Crook, 1997; Schenkman et al., 2011; Snook et al., 2012; Sun et al., 2014; Kong et al., 2018; Tong et al., 2020; Labriola et al., 2021; Park et al., 2023; Gao et al., 2024).
Ensemble Kalman filter (EnKF; Evensen, 2003) and variational methods are two primary approaches for directly assimilating radar reflectivity. EnKF methods are relatively straightforward to implement and provide ensembles of initial condition perturbations for ensemble forecasting systems, while variational and ensemble–variational methods remain central to many operational regional forecasting systems. Both approaches typically assume Gaussian error statistics, and EnKF performance can be limited by finite ensemble size, leading to rank deficiency and under-dispersion (Houtekamer and Zhang, 2016). For variational and hybrid En3DVar methods, a major challenge in radar reflectivity assimilation arises from the strong nonlinearity of reflectivity observation operators, which requires the development of tangent-linear and adjoint models and can lead to convergence difficulties or instability during minimization (Sun and Crook, 1997; Liu et al., 2020). Although double-loop algorithms can partially mitigate linearization errors through iterative re-linearization (Courtier et al., 1994), these complexities have motivated alternative formulations. One such approach treats radar reflectivity as a state variable within pure En3DVar systems (Wang and Wang, 2017), thereby avoiding explicit use of nonlinear reflectivity operators, but relying entirely on ensemble-derived cross covariances and complicating the inclusion of static background error covariance.
Several studies have focused on improving direct reflectivity assimilation in variational frameworks. Liu et al. (2019) introduced temperature-dependent background error profiles for hydrometeor variables, while Liu et al. (2020) addressed minimization convergence issues through lower bounds on reflectivity and separate analysis passes for radial velocity and reflectivity. Chen et al. (2021) and Li et al. (2022) further reduced nonlinearity by applying power transforms to hydrometeor control variables. In Liu et al. (2022a), the reflectivity observation operator was reformulated to be consistent with the Thompson microphysics scheme and implemented in the Gridpoint Statistical Interpolation analysis system (GSI) En3DVar system, leading to improved analyses and short-range forecasts compared to single-moment-based operators. While Liu et al. (2022a) focused on formulation and implementation within GSI, the impacts of modifying the operator formulation and systematically comparing different operator treatments within the Joint Effort for Data assimilation Integration (JEDI; Trémolet and Auligné, 2020) framework were not examined.
The GSI data assimilation (DA) system is currently used in U.S. operational numerical weather prediction systems. Three methods for assimilating radar reflectivity have been developed and implemented in GSI: indirect assimilation through cloud analysis (e.g., Banos et al., 2022; Dowell et al., 2022), which is used operationally in the High-Resolution Rapid Refresh (HRRR) system, together with additional radar-based latent heating during a 1 h spin-up cycle (Dowell et al., 2022; Weygandt et al., 2022); direct method based on the reflectivity-state-variable approach (Wang and Wang, 2017), which has been adopted in the initial version of the Rapid Refresh Forecast System (RRFSv1; Banos et al., 2022; Carley et al., 2023); and a traditional variational approach that includes the reflectivity observation operator along with its tangent-linear and adjoint components in the cost function, which are formulated to be consistent with model microphysics (Liu et al., 2022a).
The JEDI is being developed as the next-generation DA system for NOAA's Unified Forecast System (UFS), with the goal of replacing the current GSI framework. JEDI is designed to be modular, extensible, and model-agnostic, enabling community-driven development and supporting both research and operational applications across coupled Earth system components. Recent progress has demonstrated the feasibility of assimilating radar observations within JEDI using variants of the EnKF method. Park et al. (2023) implemented radar DA in JEDI coupled with the FV3-LAM model (Lin, 2004) using the Local Ensemble Transform Kalman Filter (LETKF; Hunt et al., 2007) and the gain-form localization version of LETKF (LGETKF; Bishop et al., 2017), showing promising results in the analysis and short-range prediction of convective storms. However, Park et al. (2023) was limited to demonstrating reflectivity and radial velocity assimilation using the LETKF and LGETKF ensemble algorithms in JEDI. In contrast, the assimilation with En3DVar requires the implementation and testing of tangent-linear and adjoint components, which are highly desirable within JEDI. In fact, the core of the data assimilation systems in current NWS operational regional forecasting models is the hybrid En3DVar, although it is based on the GSI framework (Hu et al., 2017; Wu et al., 2017; Dowell et al., 2022). Therefore, the development of direct reflectivity assimilation capabilities within the JEDI variational framework is both desirable and timely.
This work addresses this gap by developing and implementing the tangent-linear and adjoint of the reflectivity operator in the JEDI variational system, enabling variational assimilation of radar reflectivity. Specifically, this study refines a radar reflectivity observation operator to improve its consistency with the double-moment Thompson microphysics scheme, which is used in the current operational HRRR and the next-generation RRFS. The refined operator is implemented in both the GSI and JEDI En3DVar systems, enabling direct variational assimilation of reflectivity in JEDI and facilitating a consistent comparison between the two systems. A systematic comparison between the original and modified operator formulations is conducted, and their impacts on hydrometeor analysis increments and short-range forecasts are evaluated using a high-impact severe weather event. The JEDI 3DEnVar forecasts are further compared with forecasts from the operational HRRR and RRFS, which use the alternative approaches discussed previously for radar reflectivity assimilation. The capabilities developed in this study have been incorporated into the official JEDI repository, and this paper serves as technical documentation to support further community evaluation and development.
The remainder of this paper is organized as follows. Section 2 describes the refinement of the reflectivity observation operator. Section 3 introduces the test case, and presents the forecast model and DA configurations, and the design of the DA experiments. Section 4 presents the results, including the evaluations of the refined operator, intercomparisons between the JEDI and GSI systems, and baseline forecast comparisons against independent operational HRRR and RRFS prototype runs from the 2022 Hazardous Weather Testbed Spring Forecast Experiment (NOAA, 2022). Section 5 summarizes the key findings and discusses their implications, along with potential directions for future work.
The radar reflectivity factor expressed in logarithmic units (dBZ) is defined as
where Ze is the equivalent reflectivity factor that contains contributions from various hydrometeor species. The Thompson microphysics scheme employs a double-moment formulation for rainwater that predicts the mixing ratios and total number concentrations. Therefore, Ze is computed from the mixing ratios of precipitating hydrometeors of rainwater (qr), snow (qs), and graupel (qg), along with the total number concentration of rainwater (Ntr), according to
The rainwater contribution to the equivalent reflectivity, Zer, is computed from the mixing ratio qr and the total number concentration Ntr (in m−3), which are explicitly predicted. Here, the equivalent reflectivity factor Ze is expressed in units of mm6 m−3, following Tong and Xue (2005). Assuming spherical raindrops and using the Rayleigh scattering approximation, Zer is calculated as
where ρ (in kg m−3) is the air density, and ρr (in kg m−3) is the density of rainwater. The factor 1018 arises from converting drop diameters from meters to millimeters in the Rayleigh-scattering expression.
In the Thompson microphysics, the snow particle size distribution is represented as a sum of an exponential and a gamma distribution, with parameters that depend on temperature and snow mixing ratio (Thompson et al., 2008). For graupel, the intercept parameter varies with graupel mixing ratio and temperature, and distinct densities are assumed above and below 0 °C (dry/wet states). These scheme-specific details yield piecewise and state-dependent formulations in WRF that are not well suited for constructing smooth, differentiable tangent-linear and adjoint operators required by En3DVar. Therefore, where closed-form mappings exist (e.g., rain and dry snow) we apply them directly, and for wet snow and temperature-dependent graupel we use compact least-squares power-law relations fit to reflectivity diagnosed from the Thompson scheme. This approach preserves consistency with microphysics while providing the smooth derivatives needed for stable variational minimization.
In this study, the contributions of snow and graupel to reflectivity are treated differently than in Liu et al. (2022a), which employed power-law approximations to the model-predicted mixing ratios using fitted curves directly derived from Thompson microphysics output. While parameterized relationships are still used here, a key improvement of the updated operator is the explicit incorporation of temperature-dependent melting effects, which distinguish between wet and dry states of hydrometeors by applying separate formulations above and below the freezing level.
For snow, reflectivity calculations are separated into wet and dry snow conditions based on air temperature. For the wet snow state (air temperature T > 0 °C), we developed a simplified power-law function based on the snow mixing ratio qs, expressed as
where ρ is the air density, and the empirically derived coefficients are and bwet=2.67. These values were obtained by curve fitting to simulated reflectivity data from the Thompson microphysics scheme under wet snow conditions.
For the dry snow state (air temperature T ≤ 0 °C), the radar reflectivity factor is computed following Thompson et al. (2008) and Field et al. (2005). It is given by
where a(T) and b(T) are temperature-dependent coefficient and exponent, respectively, in the power-law moment relation for dry snow derived by Field et al. (2005), and is a constant.
For graupel, the equivalent reflectivity factor Zeg is also separated into two regimes depending on air temperature. Following the Thompson microphysics scheme, different graupel densities are assumed for temperatures above and below freezing. Accordingly, we write Zeg as:
where ρg is the graupel density. Here A=15.25 and B=1.85 for T > 0 °C, while A=16.5 and B=2.3 for T ≤ 0 °C.
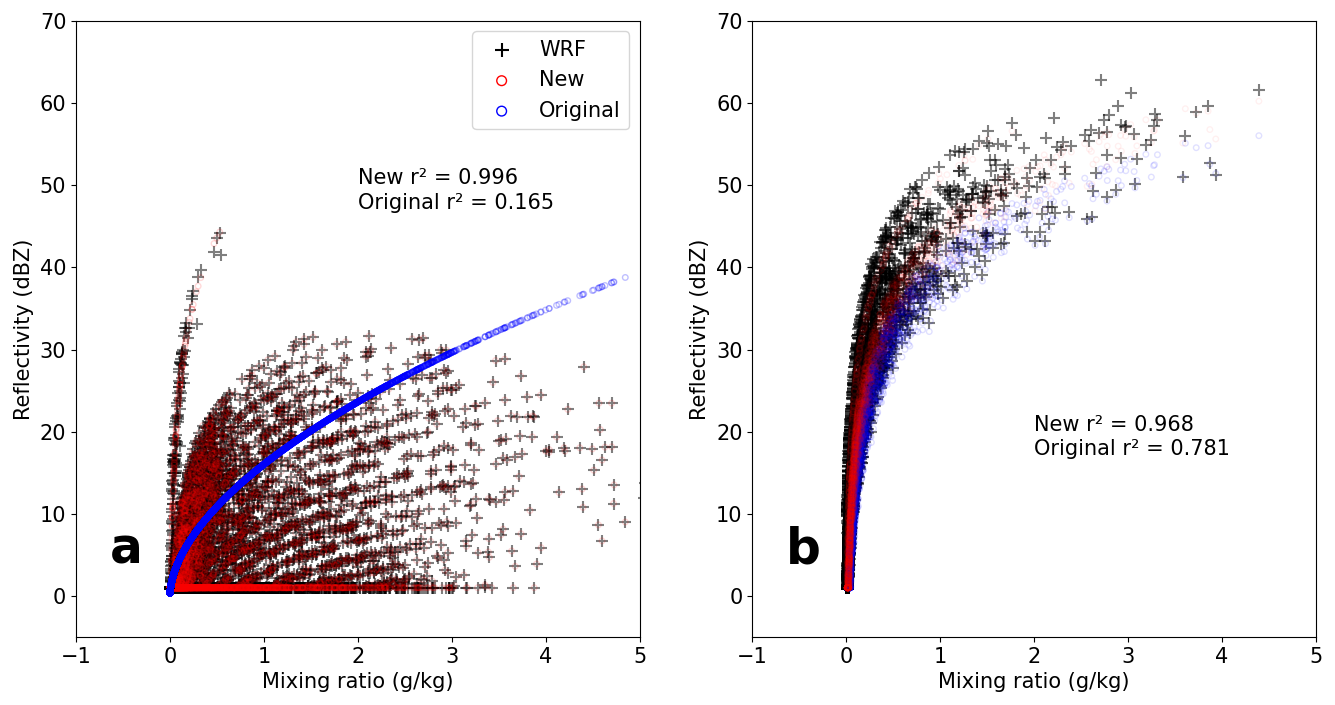
Figure 1Scatterplots comparing the fitted relationships between radar reflectivity (dBZ) and mixing ratio (g kg−1) for (a) snow and (b) graupel predicted using the Thompson microphysics scheme. Black dots show reflectivity values diagnosed directly from WRF model output. The red and blue circles indicate reflectivity computed using the updated and original observation operators, respectively. Coefficients of determination (r2) measure the agreement between each operator and the WRF-diagnosed reflectivity.
To assess the consistency of the reflectivity observation operator with the Thompson microphysics scheme, reflectivity values computed using the updated and original operators are compared against reflectivity diagnosed directly from WRF (v4.0) model output using the native Thompson microphysics reflectivity calculation (Fig. 1). The fitting dataset was derived from a 2 h WRF forecast snapshot valid at 20:00 UTC 20 May 2019, centered near 34.32° N, 98.01° W, and is independent of the 13 May 2022 derecho case analyzed in the main experiments. Because the fitted relationships represent the mapping between hydrometeor fields and reflectivity implied by the Thompson microphysics formulation, rather than the dynamics of a specific weather regime, the choice of fitting case should not materially affect the resulting operator.
For snow, the diagnosed reflectivity exhibits a large spread at a given mixing ratio, reflecting the complex treatment of snow microphysics in the Thompson scheme, including temperature-dependent behavior and transitions between dry and wet snow. The original operator shows poor agreement with the diagnosed values (r2=0.165), whereas the updated operator provides a much closer fit and improves the agreement substantially (r2=0.996).
For graupel, the diagnosed reflectivity also displays some spread due to state-dependent variations in particle density and intercept parameter. By explicitly incorporating these temperature- and density-dependent effects, the updated graupel formulation better captures the spread of diagnosed reflectivity and improves the agreement relative to the original operator (r2=0.968 versus 0.781). Overall, the updated relations provide compact power-law approximations to the Thompson microphysics while retaining its key physical dependencies and ensuring smooth behavior suitable for tangent-linear and adjoint implementations.
3.1 Case overview
Figure 2 shows the observed composite reflectivity from the Multi-Radar Multi-Sensor (MRMS; Smith et al., 2016) at 00:00 UTC 13 May 2022. The event is a robust derecho-producing convective system, characterized by a well-organized, north–south-oriented convective line with a pronounced bowing segment over the Upper Midwest. A negatively tilted upper-level trough over the Midwest, combined with a low-level jet under an omega block pattern, facilitated northward transport of moisture and instability (synoptic-scale figures are not shown for brevity). A surface low formed over the western Midwest with an associated southward-extending cold front and a warm front located in Minnesota.
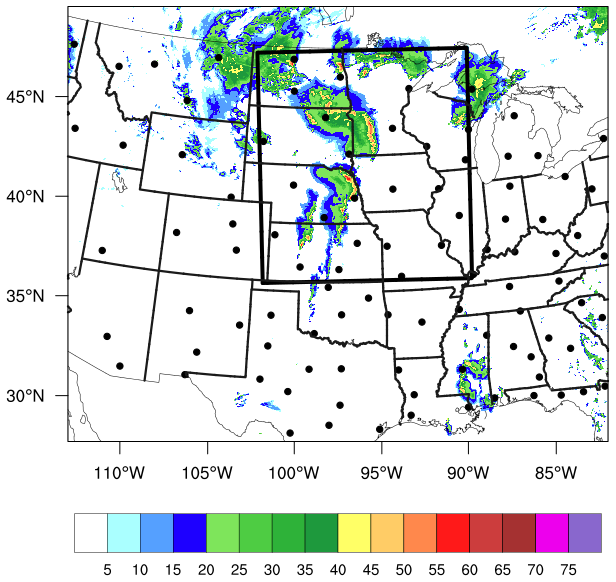
Figure 2MRMS composite reflectivity (dBZ) at 00:00 UTC 13 May 2022 over the FV3-LAM model domain. The bold black box marks the verification domain, and WSR-88D radar locations are indicated by black dots.
Severe weather events and observations were reported across the midwestern contiguous United States (CONUS) within the verification domain (black box in Fig. 2). For example, at 21:25 UTC 12 May, a Road Weather Information System weather station in Hutchinson County, South Dakota, recorded a wind gust of approximately 48 m s−1 (107 mph). Additionally, seven tornadoes in South Dakota and four in Minnesota were reported between 23:00 UTC 12 May and 00:00 UTC 13 May. Between 00:00 and 02:00 UTC 13 May 2022, the primary forecast period of interest in this study, 17 tornadoes and 128 severe wind reports were observed across the north-central CONUS and the Great Plains, according to reports from the Storm Prediction Center.
3.2 Experiment setup
3.2.1 Model configuration
The numerical experiments utilize the FV3-LAM configured with the RRFS_v1beta physics suite from the Common Community Physics Package (CCPP, Bernardet et al., 2024). The physics parameterizations include the Thompson microphysics scheme (Thompson et al., 2008) without aerosol coupling, the Mellor–Yamada–Nakanishi–Niino (MYNN) planetary boundary layer (PBL) scheme (Olson et al., 2019), the Rapid Radiative Transfer Model for GCMs (RRTMG) radiation scheme (Iacono et al., 2008), and the Noah-MP land surface model (Niu et al., 2011). The computational domain covers the midwestern United States, spanning 1050 × 850 horizontal grid points on an extended Schmidt gnomonic projection grid at approximately 3 km horizontal grid spacing (Fig. 2). In the vertical, a terrain-following hybrid sigma-pressure coordinate with 65 vertical layers is employed, with the model top located near 2 hPa, consistent with RRFS_v1beta.
3.2.2 Data assimilation system
The radar DA experiments are conducted using En3DVar algorithms implemented within the GSI and JEDI frameworks. In both systems, ensemble perturbations for constructing flow-dependent background error covariances in En3DVar are generated using a variant of EnKF: the ensemble square root filter (EnSRF; Whitaker and Hamill, 2002) in GSI and the LETKF (Hunt et al., 2007) in JEDI. These DA cycles are run in parallel with the En3DVar systems, and forecasts initialized from ensemble analyses in each cycle provide the perturbations for En3DVar. Details of the EnVar formulation implemented in JEDI can be found in Liu et al. (2022b); a brief formulation of the incremental En3DVar used in this study is provided in the appendix. Relaxation to prior spread (RTPS; Whitaker and Hamill, 2012) is applied with a coefficient of 0.99 to help maintain the ensemble spread. Ensemble localization is performed using a recursive filter in GSI En3DVar (Purser et al., 2003) and Background error on an Unstructured Mesh Package (BUMP; Ménétrier, 2020) in JEDI, with horizontal and vertical localization scales of 18 km and 0.7 ln (P), respectively.
As part of this study, the radar reflectivity observation operator previously implemented within GSI (Liu et al., 2022a) is first migrated into the Unified Forward Operator (UFO) module of JEDI. This operator follows the formulations introduced in Sect. 2 and includes both forward operators and their tangent linear and adjoint components. The implementation enables variational assimilation of reflectivity in JEDI, and these capabilities have been publicly released as part of the JEDI community codebase after testing described in this paper as well as additional testing were completed. The analysis variables updated by the DA include zonal wind, meridional wind, air temperature, specific humidity, layer pressure thickness, mixing ratio of rainwater, snow, graupel, cloud water, cloud ice, and number concentration of rainwater. To address nonlinearity in the reflectivity observation operator, power-transformed control variables are adopted for hydrometeor fields following Chen et al. (2021) and Li et al. (2022).
3.2.3 Radar observations
Radar reflectivity (Z) and radial velocity (Vr) observations are assimilated within a ±3 min window around each analysis time. Reflectivity data are prepared from the MRMS mosaic, and radial velocity data from 40 operational WSR-88D radars are used, after automated quality control processes that include noise removal, clutter suppression, despeckling, and velocity dealiasing (Brewster et al., 2005). Observation errors are assumed constant at 5 dBZ for reflectivity and 3 m s−1 for radial velocity. Reflectivity in clear-air regions in the MRMS data are set to 0 dBZ during assimilation, and radial velocity observations are used only where observed reflectivity exceeds 5 dBZ.
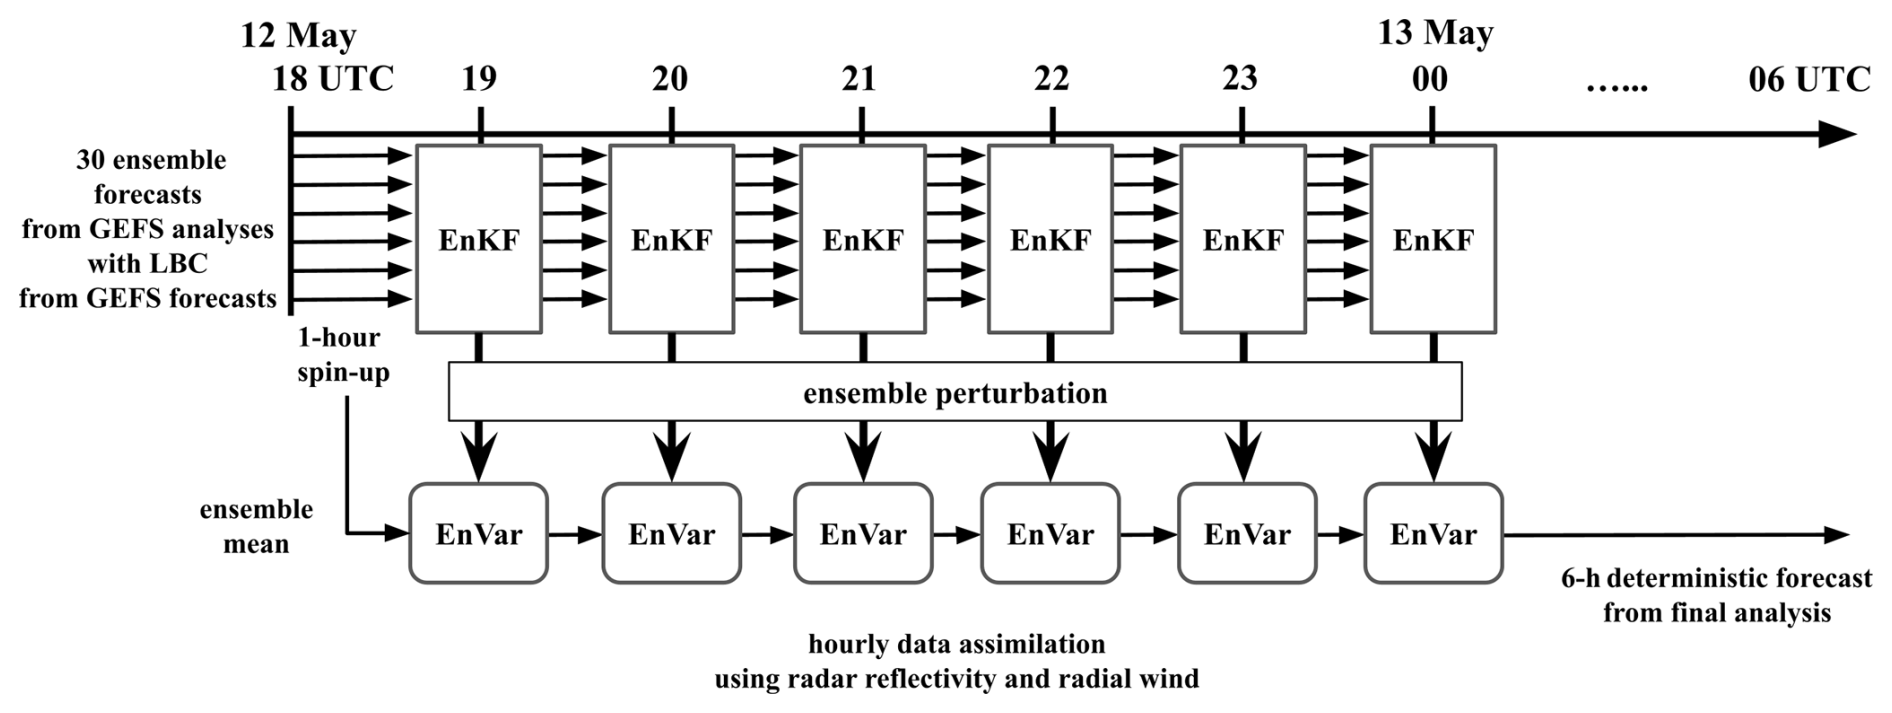
Figure 3Flow diagram of the radar data assimilation experiment. A 1 h model spin-up from GEFS ensemble initial conditions is followed by five hourly assimilation cycles between 19:00 UTC 12 May and 00:00 UTC 13 May 2022. Final analyses are used to launch 6 h ensemble forecasts.
3.2.4 Experiment design
The DA experiments consist of a 1 h model spin-up followed by five hourly assimilation cycles between 19:00 UTC 12 May and 00:00 UTC 13 May 2022 (Fig. 3). The initial ensemble is generated from a 30-member Global Ensemble Forecast System (GEFS; Zhou et al., 2022) analysis ensemble initialized at 18:00 UTC 12 May. Each member is integrated forward using FV3-LAM for one hour to provide the background for the subsequent assimilation cycle. Lateral boundary conditions are taken from 3-hourly GEFS ensemble forecasts initialized 18:00 UTC 12 May.
Four experiments are conducted: (1) NODA, a baseline run without data assimilation; (2) GSI-New, which assimilates radar reflectivity and radial velocity only using EnSRF-updated ensembles and a modified reflectivity operator in GSI En3DVar; (3) JEDI-Org, which assimilates radar observations only using LETKF-updated ensembles and the original reflectivity operator in JEDI En3DVar; and (4) JEDI-New, which is similar to JEDI-Org but uses the modified reflectivity operator. No conventional or surface observations are assimilated in any of the experiments. In the NODA experiment, the model is integrated freely over the same 6 h period without any data assimilation cycles, while the other experiments perform hourly radar data assimilation cycles. In all En3DVar experiments, no static background error covariance is included; thus, the algorithms are pure En3DVar rather than hybrid. For baseline comparison, forecasts from HRRR and RRFS Version 1 prototype 2 during the 2022 HWT Spring Forecast Experiment are also included. All experiments produce 6 h deterministic forecasts initialized from the final analyses at 00:00 UTC 13 May.
4.1 Impact of radar data assimilation on En3DVar analyses
Figure 4 shows the root-mean-square innovation (RMSI) and mean innovation diagnostics for assimilated radar reflectivity and radial velocity during DA cycles. Compared to the NODA baseline, all radar assimilation experiments substantially reduce RMSIs for both Z and Vr (Fig. 4a, c), with steady decreases in Z RMSI throughout the assimilation period (Fig. 4a). Notably, JEDI-New consistently shows improved performance over JEDI-Org, resulting in a reduction in RMSI of approximately 1.5 dBZ in the background and 3 dBZ in the analysis at the final cycle (Fig. 4a, b). This reduction highlights the impact of the updated reflectivity observation operator in JEDI. Mean innovations further confirm this improvement. The positive mean reflectivity innovations, defined as observation minus model equivalent, indicate that the simulated reflectivity is generally too weak and/or too limited in spatial coverage relative to the observations. Among the experiments, NODA exhibits the largest positive mean reflectivity innovation, whereas all radar-assimilation experiments substantially reduce its magnitude during the cycling period, although the mean innovations remain positive. JEDI-New consistently outperforms JEDI-Org, especially in the background forecasts of reflectivity (Fig. 4e, f).
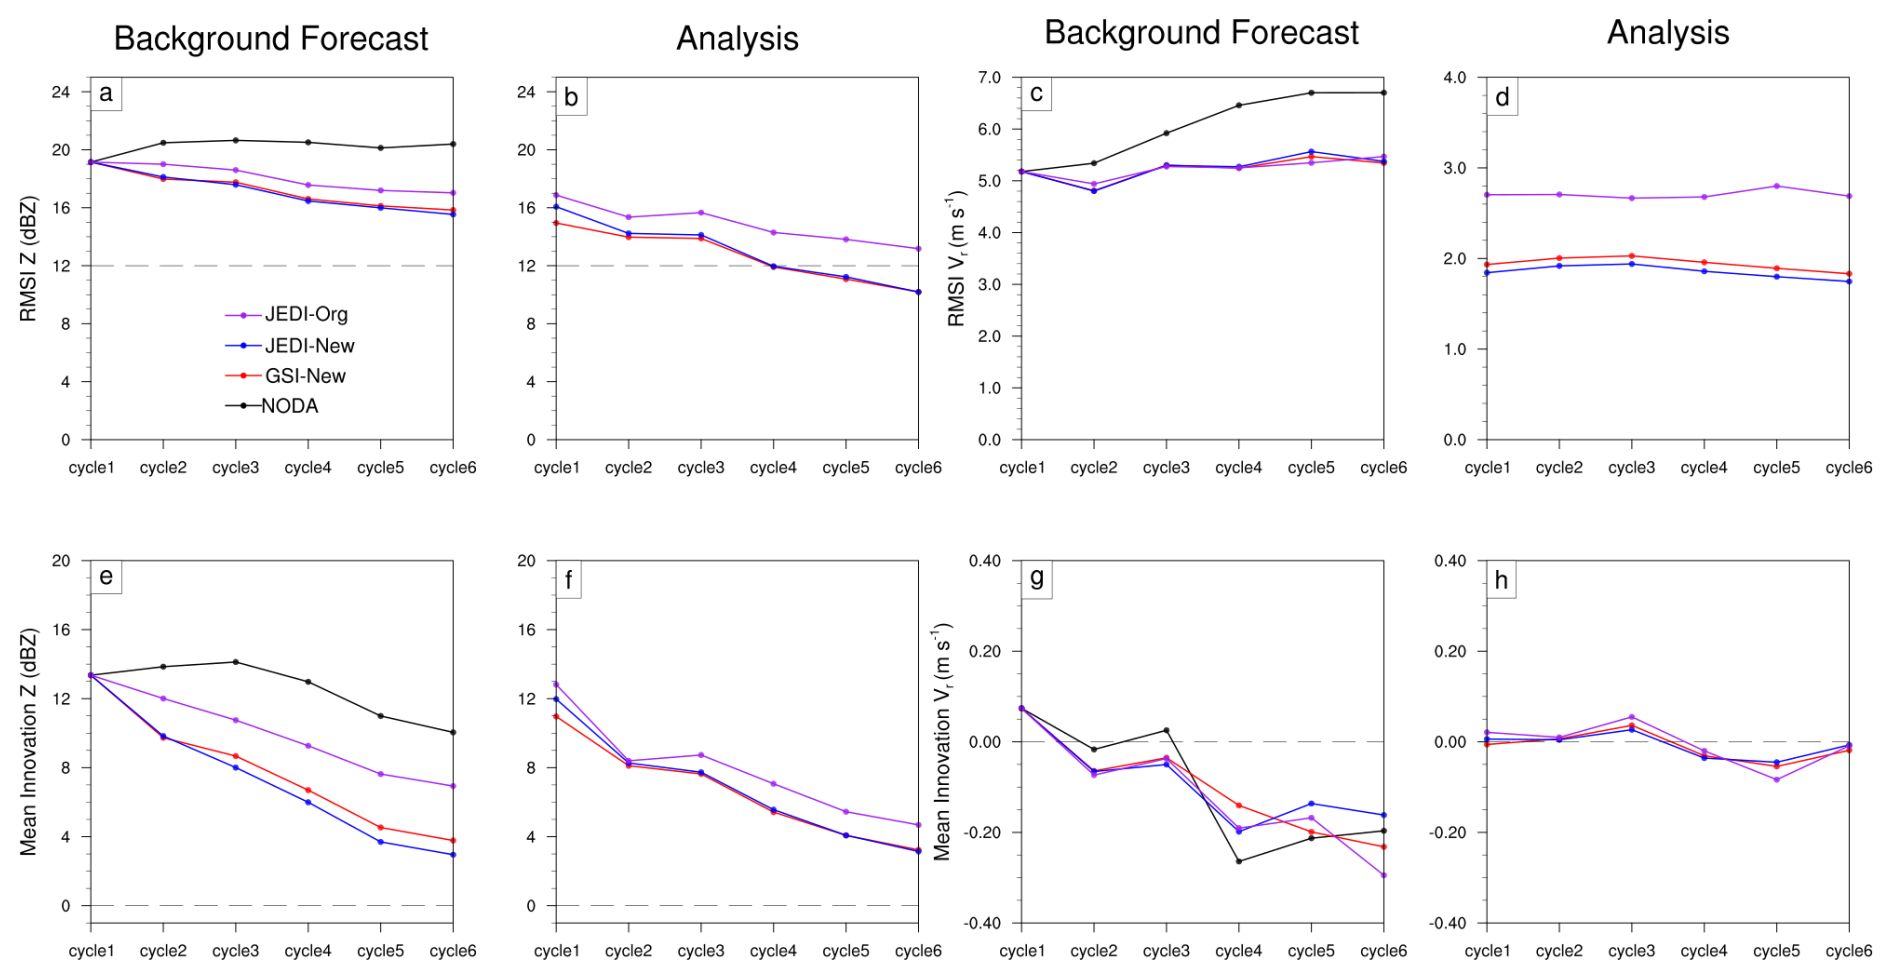
Figure 4The observation-space diagnostics from the backgrounds and analyses for the assimilated reflectivity and radial wind observations. For the Z diagnostics, they are calculated when observed Z or calculated H(x) is greater than or equal to 15 dBZ.
As an additional sensitivity check, a 15 min cycling experiment was conducted for JEDI-New over the same 19:00–00:00 UTC DA window (not shown). Although the reflectivity RMSIs do not decrease monotonically after the initial reduction, the analysis RMSI remains consistently lower than the corresponding background RMSI throughout the cycling period, indicating that the DA updates continue to improve the fit to observations and that no evidence of filter divergence is found.
For Vr, all DA experiments reduce the background RMSI relative to NODA (Fig. 4c), and their analysis RMSIs remain around 2.0 m s−1 (Fig. 4d). JEDI-Org exhibits noticeably larger RMSIs than JEDI-New and GSI-New throughout the cycling period (Fig. 4d). In contrast, the mean innovations of the three radar-assimilation experiments are nearly identical and remain close to zero (Fig. 4h). This result suggests that inaccuracies in the reflectivity analysis associated with the use of a less accurate observation operator can lead to degraded wind analyses through multivariate correlations in the variational update. Notably, JEDI-New and GSI-New produce nearly identical diagnostics throughout the assimilation period, despite differences in the ensemble DA methods and assimilation frameworks. These results indicate that JEDI-New can match the performance of GSI En3DVar when the same improved reflectivity observation operator is used. This similarity is also consistent with the broadly similar ensemble-based variational formulations used in GSI and JEDI. Since the reflectivity assimilation capabilities in GSI had been tested and reported in previous papers (Chen et al., 2021; Li et al., 2022; Liu et al., 2022a), the comparison serves to demonstrate the validity of our implementation within JEDI.
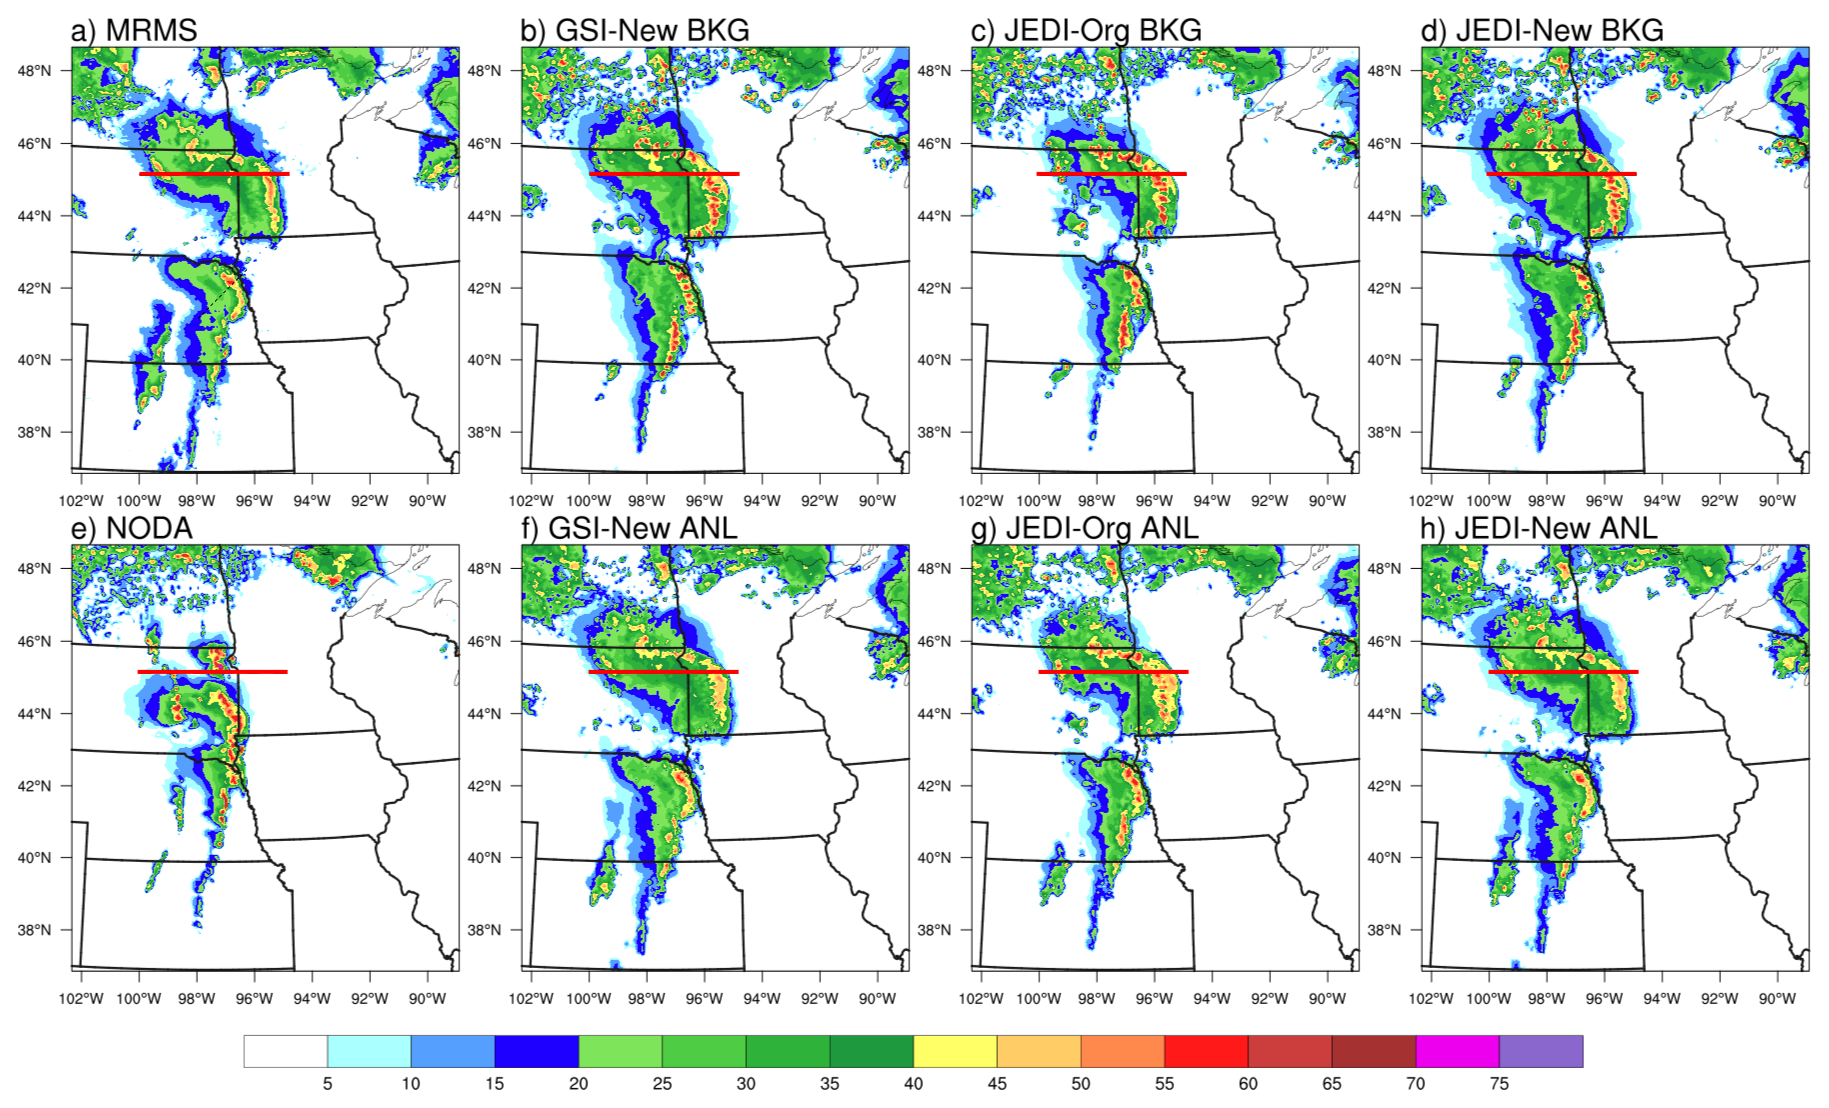
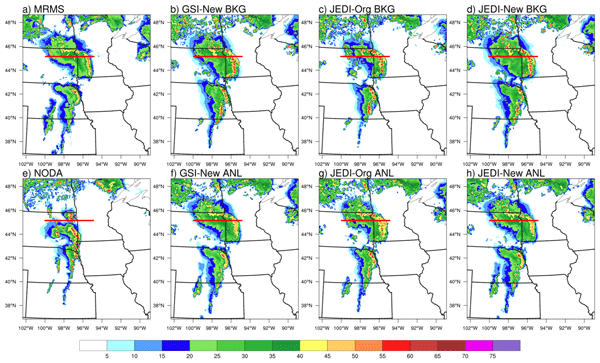
Figure 5The composite reflectivity at final analysis time (00:00 UTC on 13 May 2022) from (a) MRMS observations, (b) GSI-New background, (c) JEDI-Org background, (d) JEDI-New background, (e) NODA forecast, (f) GSI-New analysis, (g) JEDI-Org analysis, and (h) JEDI-New analysis. The red line in each panel indicates the location of the vertical cross sections shown in Figs. 6 and 7. Because no data assimilation is performed in NODA, no analysis field is available for that experiment.
Figure 5 compares composite reflectivity fields at the final analysis time (00:00 UTC 13 May 2022) among different DA experiments with the MRMS observations. Without radar DA, NODA (Fig. 5e) fails to reproduce the observed convective organization. In particular, it depicts a more connected linear convective system, rather than two linear systems with larger areas of stratiform precipitation as in the MRMS observations.
In contrast, the DA experiments substantially improve the representation of the convective system. The benefits of the updated reflectivity operator are clearly evident in the background fields. The impacts of the modified reflectivity operator on the background fields are illustrated in Fig. 5. Compared to JEDI-Org (Fig. 5c), JEDI-New (Fig. 5d) exhibits locally stronger reflectivity along portions of the leading convective line and a broader area of moderate reflectivity in the post-line region. In contrast, JEDI-Org shows weaker reflectivity coverage in the trailing stratiform or weak-echo region.
In the analysis fields, both GSI-New (Fig. 5f) and JEDI-New (Fig. 5h) produce well-organized convective structures that closely resemble the MRMS observation, successfully capturing the bowing segment in the north and a curved, localized reflectivity enhancement in the southern portion of the convective line. In contrast, the JEDI-Org analysis (Fig. 5g) shows less coherent storm organization, particularly in the southern segment, where the reflectivity enhancement is poorly represented.
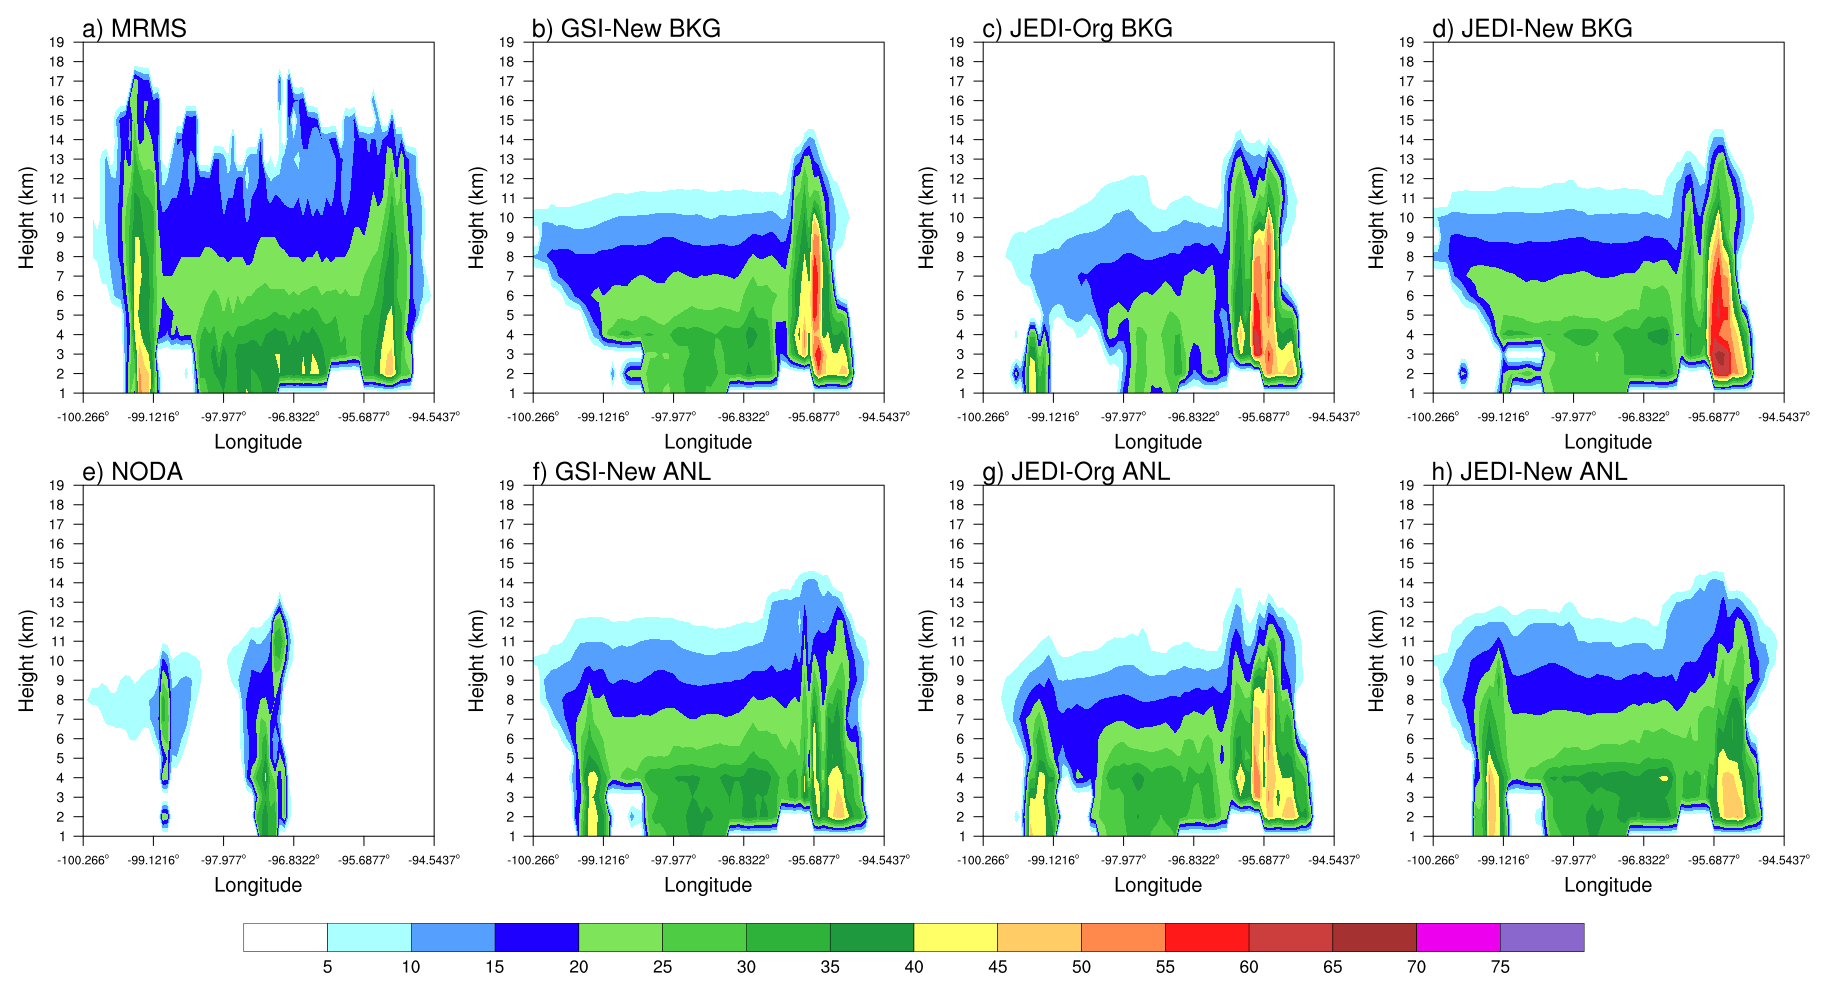
Figure 6Vertical cross sections of composite reflectivity at the final analysis time (00:00 UTC 13 May 2022) along the red line shown in Fig. 5, from (a) MRMS observations, (b) GSI-New background, (c) JEDI-Org background, (d) JEDI-New background, (e) NODA forecast, (f) GSI-New analysis, (g) JEDI-Org analysis, and (h) JEDI-New analysis.
Figure 6 shows vertical cross sections of composite reflectivity at the final analysis time (00:00 UTC 13 May 2022) along the red line in Fig. 5. The MRMS observation (Fig. 6a) displays a well-developed deep convective system, featuring two upright convective towers: an eastern tower near 95° W and a western one near 99° W. Both towers exhibit echo tops exceeding 14 km and strong reflectivity cores (≥ 50 dBZ) through the mid-levels. In contrast, the NODA analysis (Fig. 6e), which does not assimilate radar observations, shows a convective reflectivity structure that is less well aligned with the fixed cross section relative to MRMS, reflecting differences in the analyzed system position. As a result, the main convective core is located outside the cross-section domain shown in Fig. 5e, leading to the apparent absence of deep echoes in the vertical structure.
In the background fields, all DA experiments reproduce the main convective tower near 95° W but overestimate its midlevel reflectivity intensity. This bias is most evident in JEDI-New (Fig. 6d), where the eastern convective column exhibits stronger reflectivity (≥ 50 dBZ) from about 2 to 8 km. These overamplified cores are likely related to excessive graupel reflectivity, consistent with findings in Liu et al. (2022a) and Grim et al. (2024). Additionally, all three background fields slightly underpredict the top of the precipitation region, with the 5 dBZ echo top generally reaching only about 11–12 km, compared with about 12–13 km in MRMS. The western tower near 99° W that is evident in the MRMS cross section is not clearly reproduced in any of the background fields.
The analysis fields indicate that radar DA partially recovers the previously missing western convective feature. In JEDI-New (Fig. 6h), the western tower is more evident than in the background fields and the NODA experiment, although the tower is too short in all experiments compared to MRMS. GSI-New (Fig. 6f) and JEDI-Org (Fig. 6g) additionally underestimate its strength. In the eastern tower region near 95° W, GSI-New and JEDI-New also effectively reduce the midlevel overestimation seen in the background, but the resulting structure looks arguably better in JEDI-New compared to GSI-New. By contrast, JEDI-Org retains an overly strong midlevel core.
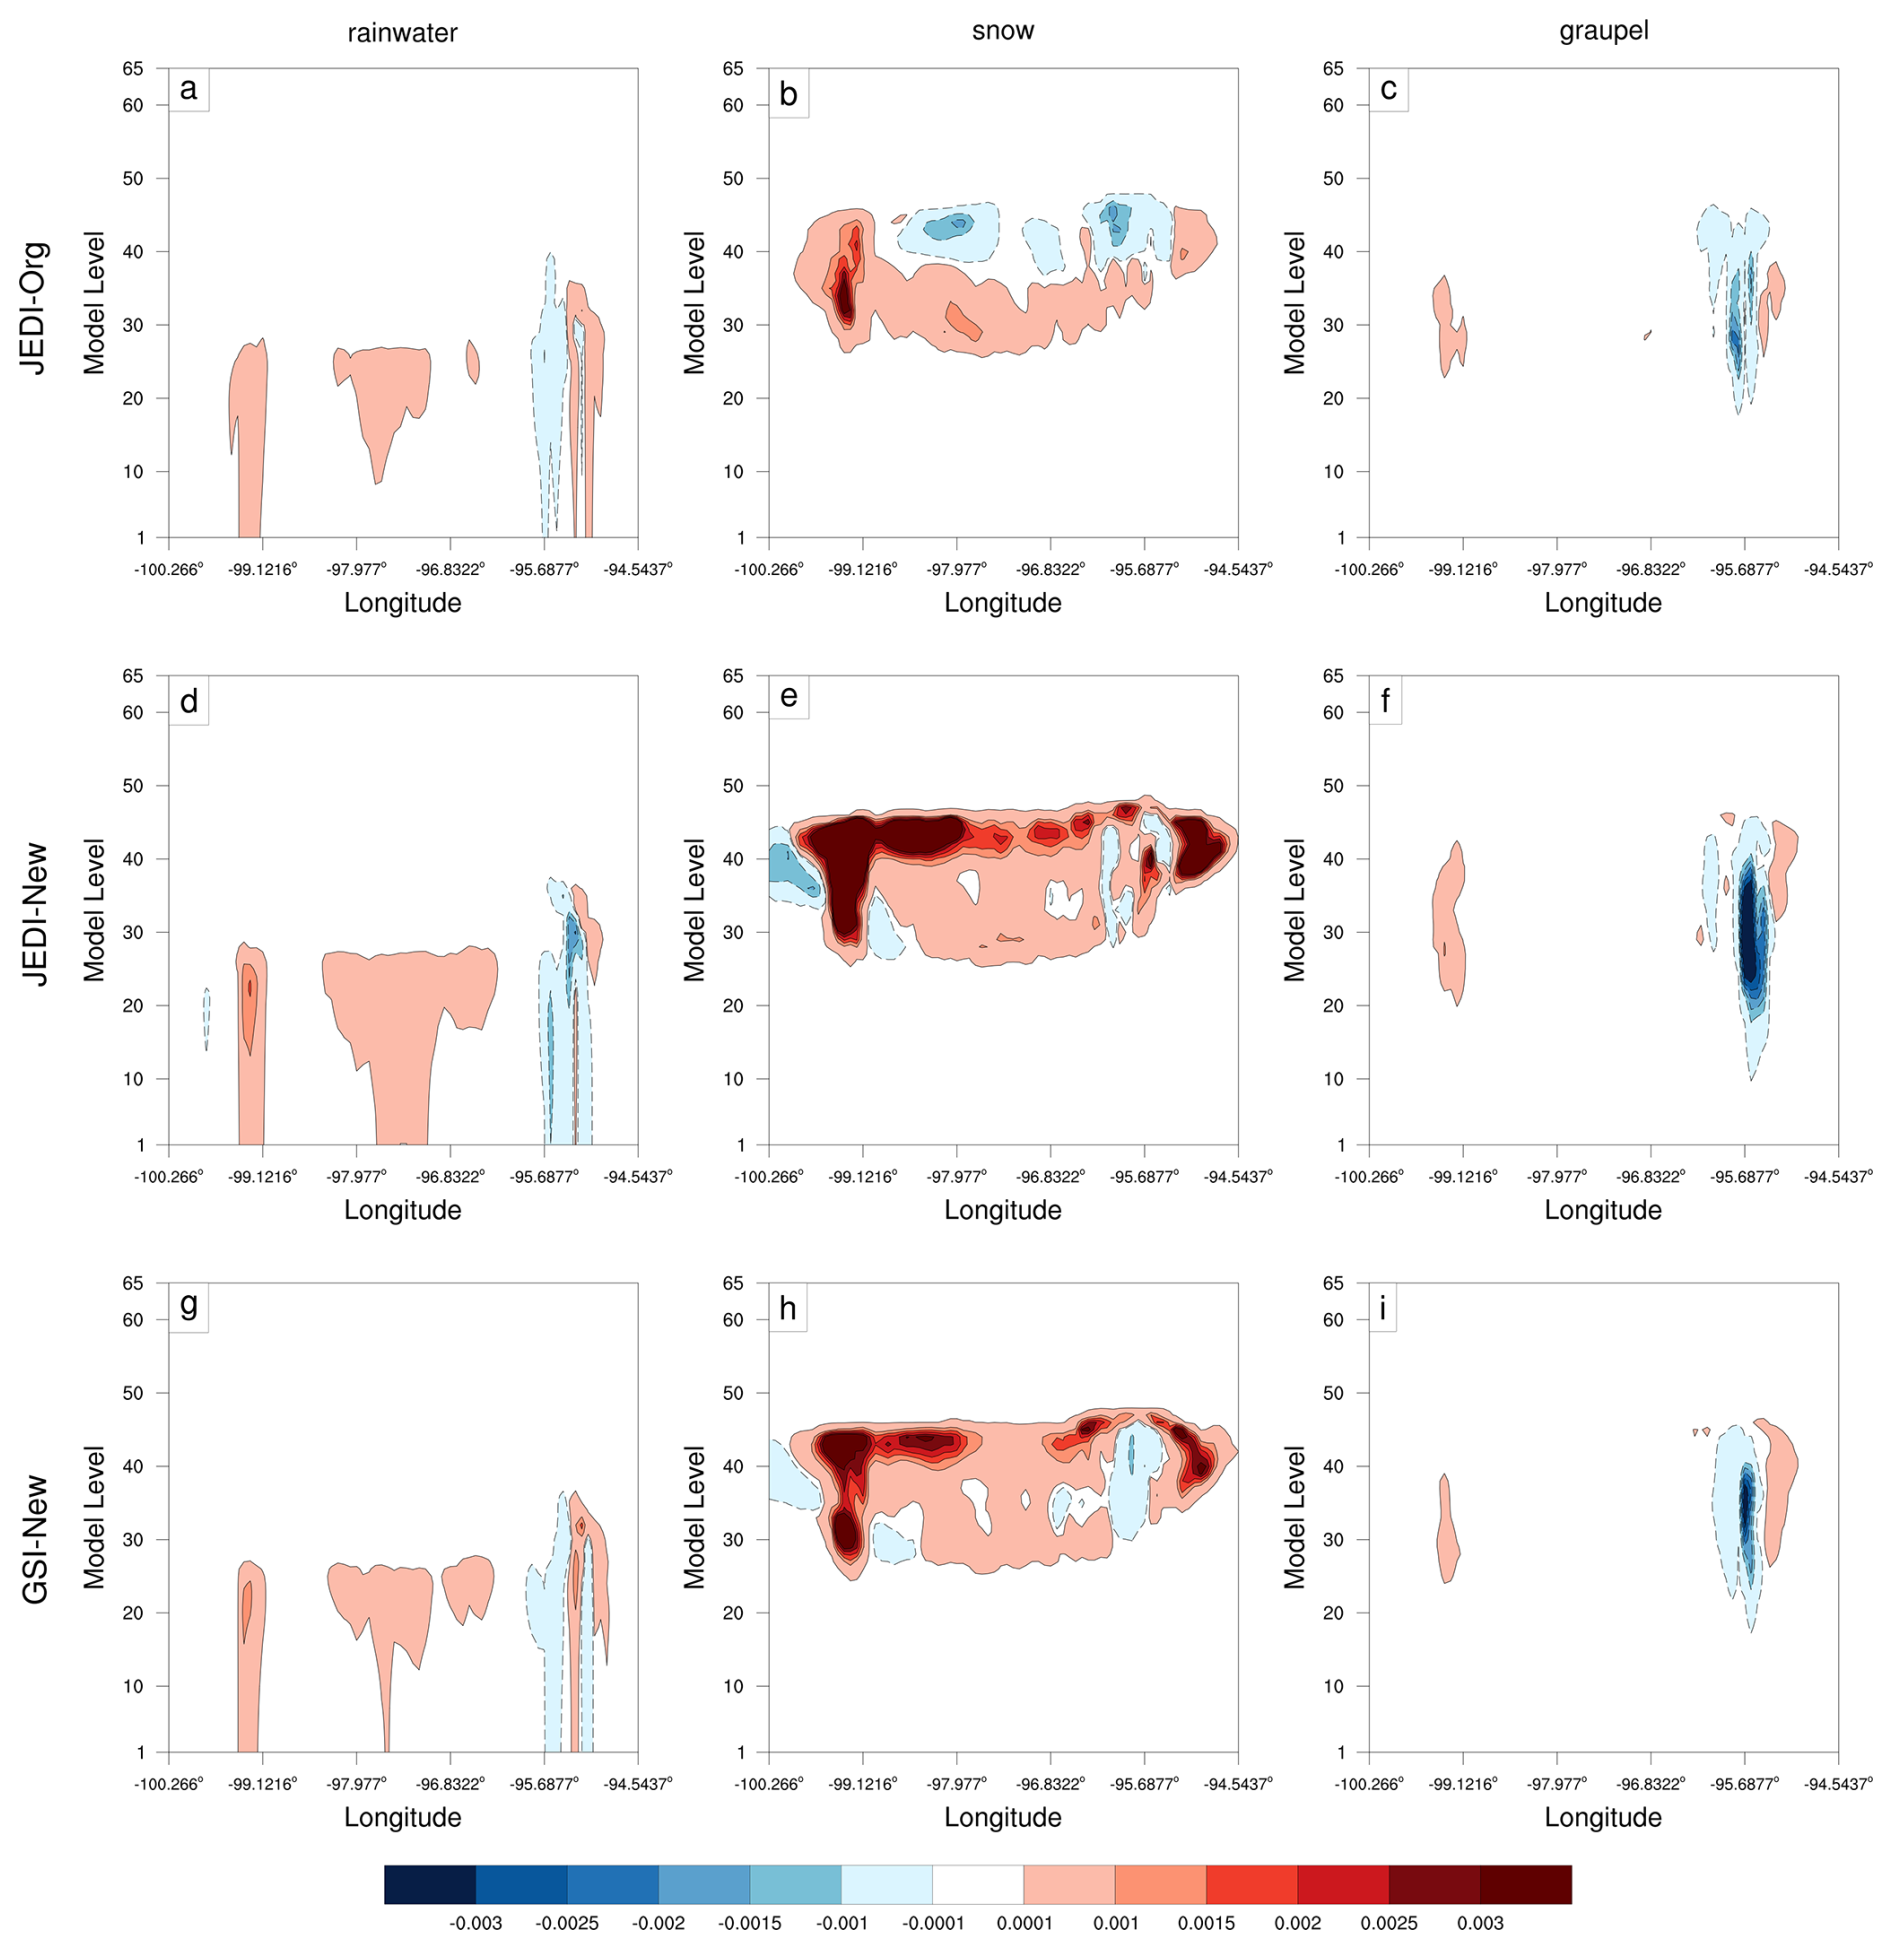
Figure 7The vertical cross sections along the line given in Fig. 5 of analysis increments (kg kg−1) for hydrometeor mixing ratios of rainwater, snow, and graupel at final analysis time (00:00 UTC on 13 May 2022). The three columns correspond to rainwater, snow, and graupel, respectively, and the three rows correspond to JEDI-Org, JEDI-New, and GSI-New, respectively.
To further understand the reflectivity differences noted in Fig. 6, we examine vertical cross sections of the analysis increments for rainwater, snow, and graupel mixing ratios shown in Fig. 7. As noted in Fig. 6, the background fields in all three DA experiments slightly underpredict the top of the precipitation region, while the analysis update increases the storm-top height and brings it closer to that shown in MRMS. Since radar reflectivity is a nonlinear function of multiple hydrometeor species, the hydrometeor analysis increments help explain both the changes in analyzed reflectivity structure and the increased vertical extent of the convective system.
Among the three hydrometeor species, snow shows the most prominent differences between JEDI-New and JEDI-Org. In the snow analysis increments (Fig. 7b, e, h), JEDI-Org (Fig. 7b) exhibits weak and spatially fragmented increments, suggesting relatively limited adjustments to the snow field. In contrast, JEDI-New (Fig. 7e) produces broad and coherent positive snow increments in the mid- to upper levels (∼ 4–12 km), especially over and between the eastern and western convective towers. The magnitude and coverage of these increments are comparable to those from GSI-New (Fig. 7h), which uses the updated Z operator. This similarity is consistent with both experiments using the same operator and broadly similar ensemble-based variational analysis formulations, allowing comparable hydrometeor adjustments when the background and observations provide similar information. The positive upper-level snow increments in JEDI-New are also consistent with the increased storm-top height seen in the analysis cross sections of Fig. 6, contributing to the improved vertical structure of reflectivity.
For graupel (Fig. 7c, f, i), all three DA experiments show negative increments collocated with the eastern convective tower. The negative graupel increments are weaker and more localized in JEDI-Org (Fig. 7c), whereas JEDI-New (Fig. 7f) and GSI-New (Fig. 7i) exhibit stronger and more spatially coherent negative increments centered in the midlevels of the eastern tower. This indicates a reduction in excessive background graupel, which likely contributes to the overly strong midlevel reflectivity in the background field. In contrast, the rainwater increments (Fig. 7a, d, g) are relatively weak and similar across all experiments, reflecting the fact that the treatment of rainwater is unchanged between the original and updated operators.
In the western tower, the positive rainwater increments are primarily confined below about 2–3 km, i.e., below the approximate freezing level, where the corresponding snow and graupel increments are negligible. These low-level positive rainwater increments therefore likely play an important role in rebuilding the missing western reflectivity tower, which was underrepresented in the background fields of all DA experiments. In the eastern tower, JEDI-New also produces non-negligible negative rainwater increments at approximately 3–5 km, in addition to the dominant negative graupel increments there. This indicates that JEDI-New is able to adjust rainwater as part of the correction to the overly strong background reflectivity, a feature that is much less evident in the other experiments. Thus, while differences among experiments still arise mainly from the handling of snow and graupel rather than from rainwater, the rainwater increments also play a non-negligible role in improving the analyzed reflectivity structure.
4.2 Impacts on forecasts
For qualitative assessment of forecast performance, the forecasts initialized from the final En3DVar analyses from GSI-New and JEDI-New are compared with those from the no-DA baseline experiment (NODA), and two reference forecasts representative of the current and potential future operational configurations, i.e., the HRRR version 4 (HRRRv4) and the RRFS version1 prototype 2 control run (RRFS p2 CNTL). As shown in Fig. 8, the NODA experiment fails to reproduce key convective features observed in the MRMS composite reflectivity. In the 1 h forecast, NODA largely misses the convective line over Minnesota (Fig. 8d). NODA also generally overpredicts the coverage of convection across Minnesota and Iowa at forecast hours 3 and 5 (Fig. 8e, f). In contrast, both the GSI and JEDI En3DVar DA experiments successfully capture the convective line in Minnesota at 1 h (Fig. 8g, j) and reproduce a trailing stratiform precipitation region behind the leading convective line. At later lead times, the En3DVar experiments maintain a better alignment of high-reflectivity structures over Kansas and Nebraska (Fig. 8h–i, k–l), although some degradation in intensity and coverage is evident compared to the 1 h forecasts.
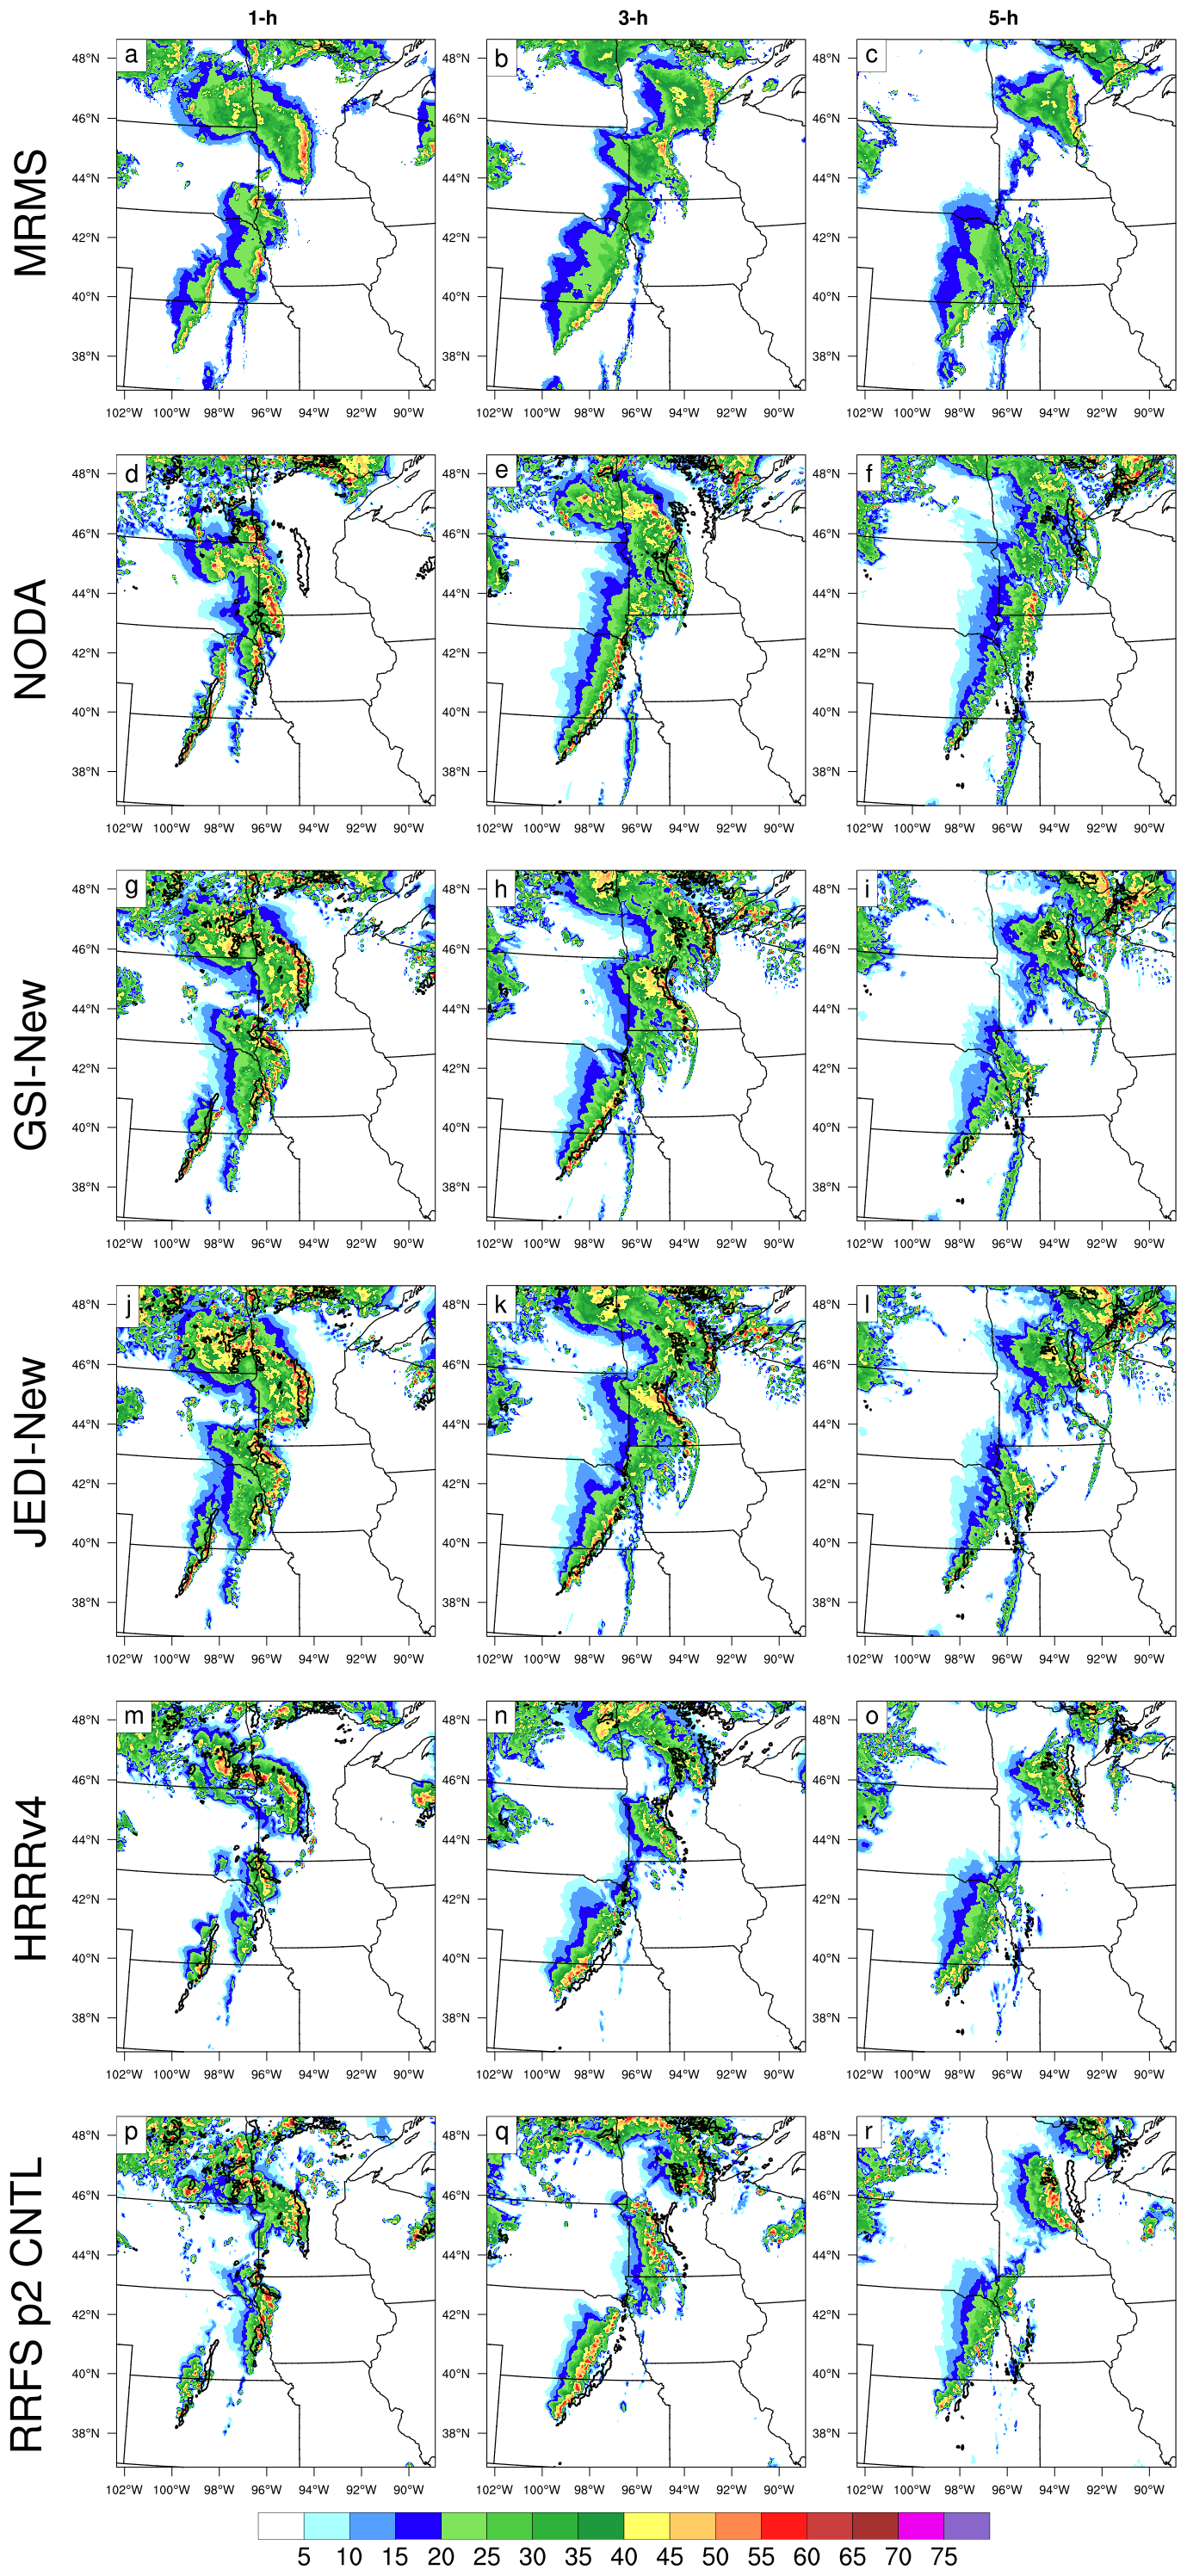
Figure 8Composite reflectivity forecasts and observations at 1, 3, and 5 h lead times, valid at 01:00, 03:00, and 05:00 UTC 13 May 2022, respectively. Rows show MRMS observations, NODA, GSI-New, JEDI-New, HRRRv4, and RRFS p2 CNTL, and columns show the 1, 3, and 5 h forecasts. In the forecast panels, the observed 40 dBZ composite reflectivity contour is overlaid in black.
The two reference forecasts, HRRRv4 and RRFS p2 CNTL, also capture the general structure of the observed convective systems, particularly the split into northern and southern convective segments. However, positional and structural differences are apparent upon closer inspection. The HRRRv4 forecast shows a weaker bow echo and a southeastward displacement of the Minnesota line as early as 1 h (Fig. 8m), with this error persisting through 5 h. Compared to HRRRv4, RRFS p2 CNTL better captures the structure of the northern convective line at 1 h, but tends to underpredict reflectivity intensity and spatial extent, especially in the southern segment at longer lead times. Additionally, both reference forecasts display smaller overall high-reflectivity coverage relative to those of En3DVar experiments. This difference is likely attributable to the use of cloud analysis for radar DA in HRRRv4 and the Z-state-variable approach in RRFS p2 CNTL, both of which differ from the direct reflectivity assimilation employed in the En3DVar experiments here. Nonetheless, spurious echo generation is evident in the En3DVar runs at later lead times, particularly over the northwestern portion of the domain (Fig. 8f, i, l), where weak, largely non-convective reflectivity appears that is not present in the MRMS observations. These differences may also reflect intrinsic model characteristics; composite reflectivity forecasts from FV3-LAM tend to be stronger than those from HRRRv4, which is based on the WRF model, consistent with findings in Grim et al. (2024). Overall, the results show the benefits of directly assimilating reflectivity and radial velocity in capturing key convective structures in the analysis and forecast while also highlighting certain sensitivities to model and assimilation methodologies.
Although radar reflectivity assimilation primarily constrains hydrometeor fields, the maintenance and evolution of convective systems also depend on adjustments to thermodynamic and kinematic variables such as temperature, water vapor, pressure, and wind. Since 2 m equivalent potential temperature θe and 10 m wind fields are only indirectly impacted by radar DA, the fields are partly the results of model response to the directly modified fields, through the DA cycles. We examine these fields in the final analyses to see if the DA is producing physically consistent near-surface analyses, in particular in the presentation of the cold pools.
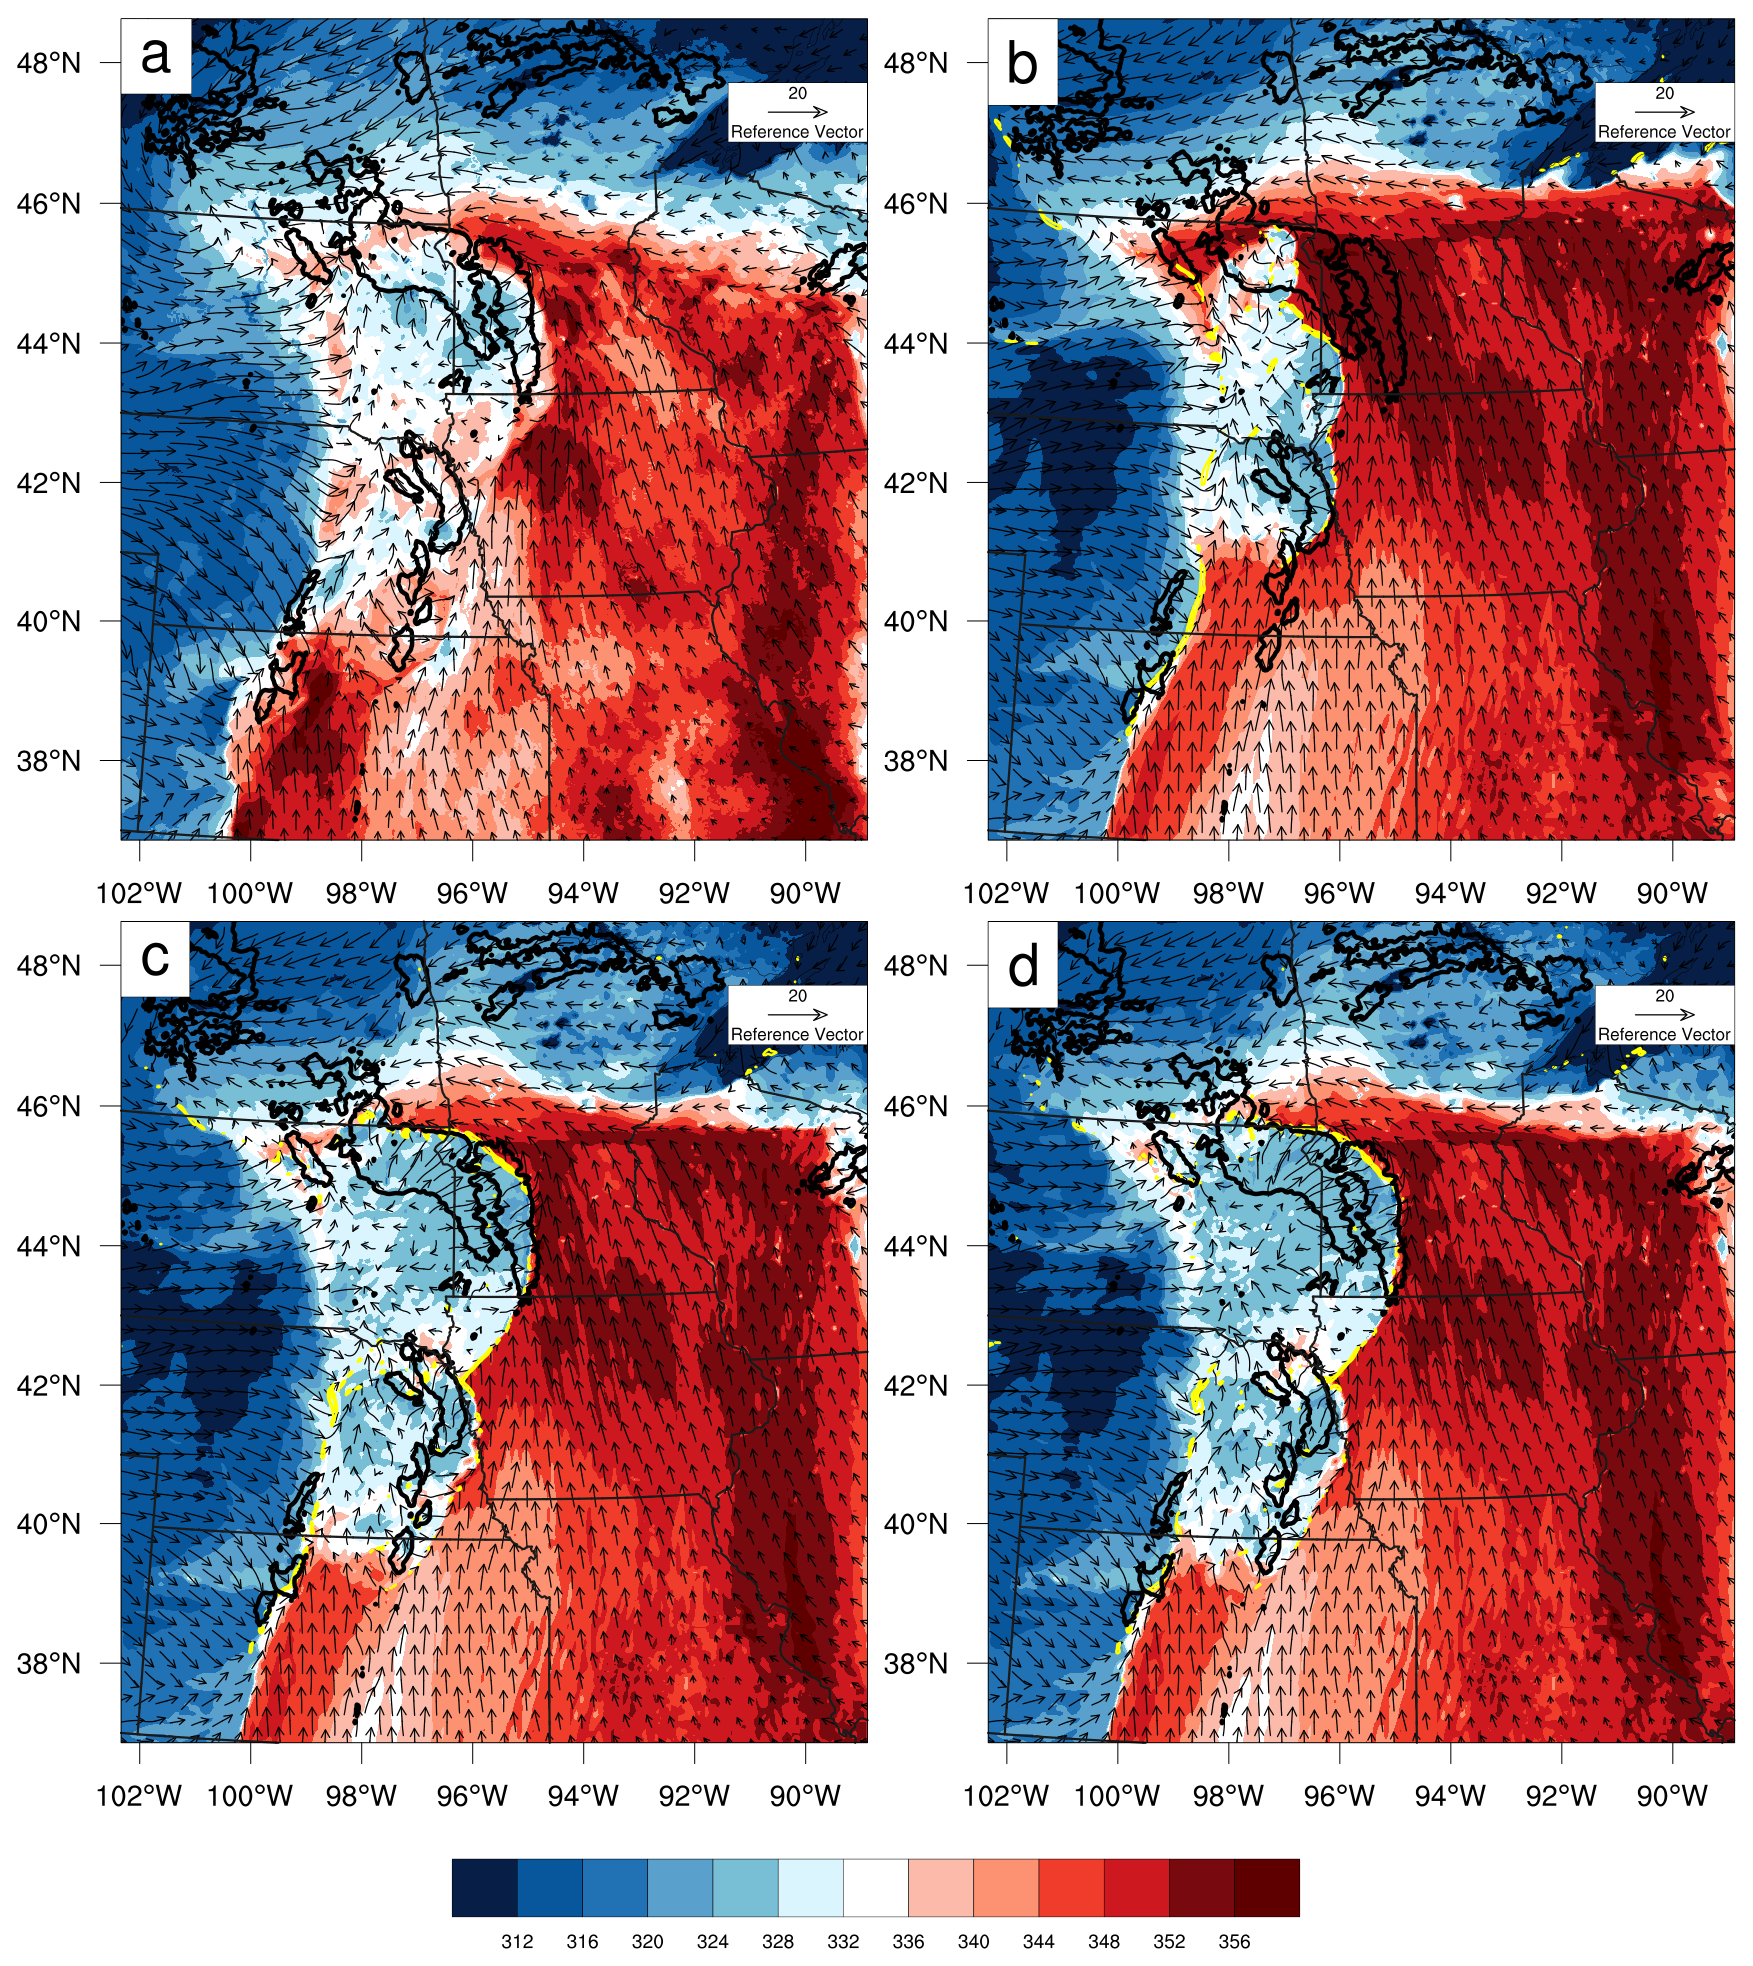
Figure 9Equivalent Potential Temperature (shaded; K) at 2 m and wind vectors at 10 m (m s−1) for (a) URMA, (b) NODA, (c) GSI-New, and (d) JEDI-New. Black contours denote areas where observed MRMS composite reflectivity exceeds 30 dBZ and are included in each panel as a common observational reference.
Figure 9 shows 2 m θe and 10 m wind fields from UnRestricted Mesoscale Analysis (URMA; NOAA, 2018) and the final analyses from the NODA, GSI-New, and JEDI-New experiments. Compared to URMA (Fig. 9a), NODA (Fig. 9b) exhibits a less expansive region of low-θe air associated with the cold pool, and its leading edge or gust-front zone remains closer to the South Dakota–Minnesota border. In contrast, both DA experiments (Fig. 9c, d) show broader low-θe coverage and a farther southward extension of the near-surface cold-pool boundary in better agreement with URMA. In the DA experiments, surface winds behind the gust front are stronger than in NODA, especially over northeastern South Dakota and southwestern Minnesota, and are more consistent with the analyzed near-surface pattern in URMA (Fig. 9c, d). These results indicate that radar DA can indirectly improve near-surface temperature, moisture, and wind analyses by improving the placement and structure of the convective system through the DA cycles.
The relatively low θe over northwest Nebraska and southern South Dakota in both NODA and the DA experiments is likely associated with the synoptic-scale frontal environment. This interpretation is consistent with the Weather Prediction Center surface analysis at 00:00 UTC, which depicts a cold front and an associated low-pressure system extending across the Dakotas, accompanied by westerly to northwesterly postfrontal flow. This suggests that the θe bias in this region is more closely related to errors in the large-scale air-mass structure, such as the frontal position or intensity, which are not directly constrained by radar DA.
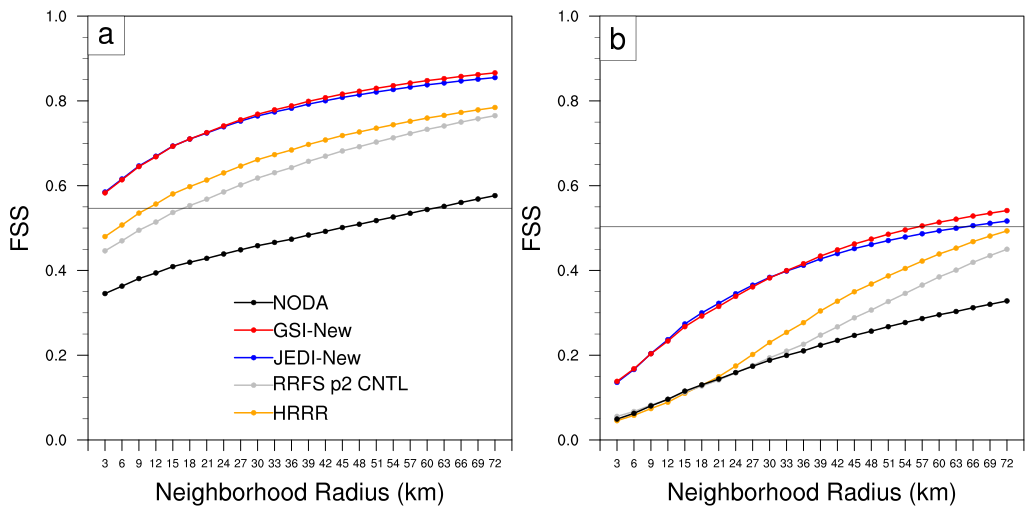
Figure 10Fractions skill scores (FSS) of hourly composite reflectivity averaged over a 6 h verification period, shown as a function of neighborhood radius (km) for reflectivity thresholds of (a) 25 dBZ and (b) 45 dBZ. Verification is performed against MRMS observations. Results are shown for HRRRv4 (orange), RRFS p2 CNTL (gray), JEDI-New (blue), GSI-New (red), and NODA (black). Thin horizontal line in each panel indicates the minimum skillful forecast threshold.
Figure 10 presents the fractions skill scores (FSS; Roberts and Lean, 2008) of forecast composite reflectivity, computed at hourly intervals and averaged over the 6 h of verification period, for the 25 and 45 dBZ thresholds. Both DA experiments consistently outperform HRRRv4, RRFS p2 CNTL, and NODA across all neighborhood radii up to 72 km. GSI-New achieves the minimum skillful threshold at a radius of 57 km for the 45 dBZ threshold, while JEDI-New reaches it at 66 km. For the 25 dBZ threshold, both DA experiments exceed the minimum skillful threshold at the smallest evaluated neighborhood radius (3 km), suggesting improved representation of convective-scale features in a neighborhood sense when averaged over the 6 h verification period. The NODA forecasts are non-skillful for all tested radii for the 45 dBZ and are only skillful at radii larger than 64 km for the 25 dBZ threshold.
The two reference forecasts also fail to reach the skillful threshold within the tested range of radii for the 45 dBZ threshold, though their FSSs are above those of NODA for radii above 21 km and the differences increase with neighborhood radius (Fig. 10b). The reduced difference in FSS between our DA experiments and the reference forecasts at larger radii may be partly due to reflectivity bias. As discussed in Mittermaier and Roberts (2010), models that underpredict high reflectivity can appear more skillful at large spatial scales because FSS emphasizes spatial agreement over intensity accuracy. This possible bias effect is also consistent with the precipitation performance diagrams discussed below.
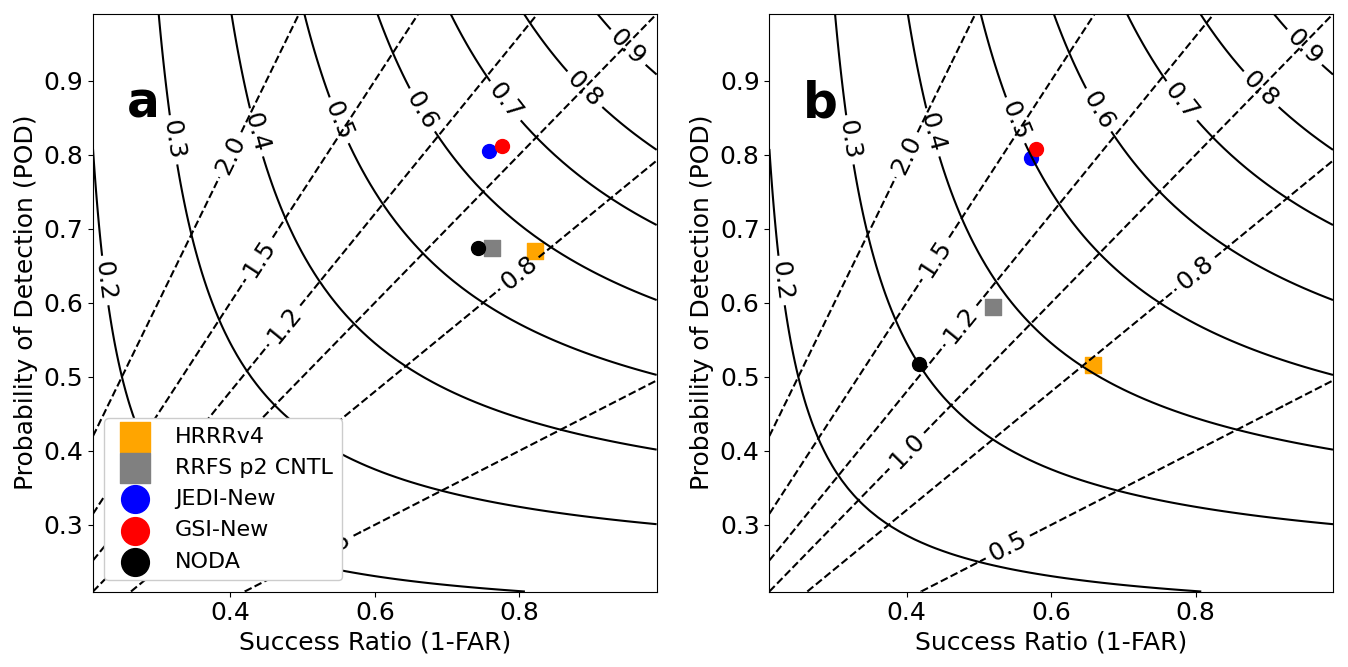
Figure 11Performance diagrams of hourly accumulated precipitation for (a) 1.016 mm and (b) 6.35 mm thresholds over the 6 h forecast period. HRRRv4 (orange square), RRFS p2 CNTL (gray square), JEDI-New (blue circle), GSI-New (red circle), and NODA (black circle) are verified against Stage-IV observation. Black dashed lines and solid contours denote bias and CSI, respectively.
Figure 11 presents performance diagrams for hourly accumulated precipitation again averaged over the 6 h forecast period, verified against the NCEP Stage IV quantitative precipitation estimates (Lin and Mitchell, 2005) at thresholds of 0.04 in. (≈ 1.0 mm) and 0.25 in. (≈ 6.4 mm). At the lower threshold (Fig. 11a), the GSI-New and JEDI-New experiments demonstrate the highest critical success index (CSI), both exceeding 0.6. GSI-New exhibits slightly better skill than JEDI-New, with a CSI above 0.65 and a small high bias of about 1.1. JEDI-New has a similar high bias, also close to 1.1, whereas HRRRv4, RRFS p2 CNTL, and NODA have low biases of about 0.8. HRRRv4 achieves a CSI of approximately 0.58, while RRFS p2 CNTL and NODA trail behind with CSI values near 0.55 and 0.52, respectively. The DA experiment forecasts demonstrate a favorable combination of detection rate and false alarm control, indicating improved representation of precipitation extent and location compared to other forecasts.
At the higher threshold of 6.35 mm (Fig. 11b), forecast skill decreases for all systems, but the relative ranking remains the same. Both DA experiments maintain CSI values near 0.5, while the reference forecasts drop to around 0.4, and NODA falls below 0.3. The DA experiments also display higher bias (∼ 1.4), suggesting more aggressive precipitation production, consistent with the more active reflectivity fields noted in Fig. 8. In contrast, HRRRv4 exhibits a low bias of ∼ 0.8, indicating a tendency to underpredict intense precipitation amounts, while RRFS p2 CNTL remains closer to unity. Because these forecast systems differ in both dynamical core and DA method, the present comparison does not allow us to disentangle their respective contributions to the bias differences. The tendency for FV3-LAM to overpredict precipitation and convective activity has been noted in both cool-season (Supinie et al., 2022) and warm-season ensemble forecasts during the NOAA HWT Spring Forecasting Experiment (Johnson et al., 2025).
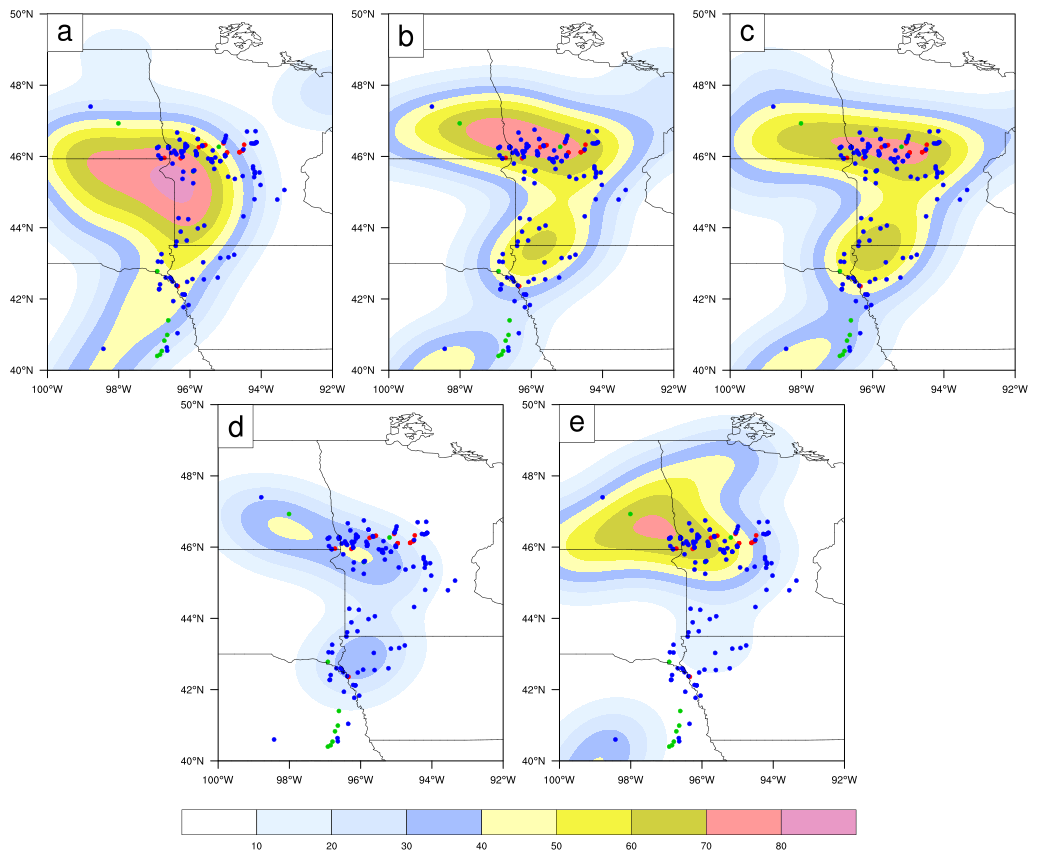
Figure 12Neighborhood probability (%; shaded) of 2 h maximum updraft helicity exceeding 75 m2 s−2 from 00:00 to 02:00 UTC on 13 May 2022 from the forecasts of (a) NODA, (b) GSI-New, (c) JEDI-New, (d) HRRRv4 and (e) RRFS p2 CNTL. The red, green, and blue dots denote the SPC reports of tornado, hail, and wind, respectively.
As described in Sect. 3, our test case involved multiple tornadoes. For convection-allowing predictions, updraft helicity (UH; Kain et al., 2008) is a widely used proxy for diagnosing meso-cyclonic rotation of strong updrafts associated with severe convection, including tornadoes and large hail (Sobash et al., 2011; Gallo et al., 2016). Figure 12 shows the neighborhood probability (NP) of 2 h maximum 2–5 km UH from 00:00 to 02:00 UTC 13 May 2022 that exceeds 75 m2 s−2, overlaid with Storm Prediction Center reports of tornadoes, hail, and strong winds. The NP fields are computed using a 42 km neighborhood and subsequently smoothed with an 81 km Gaussian filter (e.g., Tong et al., 2020; Park et al., 2023). Compared to NODA and the reference forecasts, both GSI-New and JEDI-New show better spatial alignment between the forecast probability maxima and the observed severe reports. GSI-New shows a well-defined swath of probabilities exceeding 50 % extending from northern Iowa into southern Minnesota, broadly collocated with numerous tornado and wind reports. JEDI-New exhibits a similar probability distribution, but with a slightly narrower core.
The reference forecasts demonstrate weaker performance. HRRRv4 exhibits a reasonably placed UH signal, but with substantially lower probabilities (peak NP ∼ 50 %), likely attributable to the use of the WRF model rather than FV3-LAM; the latter is known to produce higher UH values (Potvin et al., 2019). RRFS p2 CNTL generates a broader, westward-shifted UH swath centered over southeastern North Dakota, missing many of the observed reports across Iowa and southern Minnesota, including a peak-probability region in southeastern North Dakota associated with few severe reports and probabilities below 10 % in a cluster of hail and wind reports over eastern Nebraska. The NODA experiment broadly captures the spatial envelope of the observed severe weather reports, but the UH probabilities are too diffuse and exhibit a southwestward displacement relative to the report clusters, particularly over southwestern Minnesota. These results again demonstrate the positive impacts of directly assimilating radar reflectivity and radial velocity data, using the GSI- and JEDI-based En3DVar, in capturing the location and strength of rotating updrafts associated with severe weather events.
This study presents the first implementation and evaluation of direct radar reflectivity and radial velocity assimilation within the JEDI En3DVar system, using a microphysics-consistent observation operator for the Thompson double-moment scheme. A high-impact squall-line event that occurred over the Midwest on 13 May 2022 was selected as a test case to assess the performance of the JEDI En3DVar system, using the GSI counterpart and operational forecasts from HRRR and experimental RRFS as references/benchmarks.
The DA experiments assimilated radar observations over a 5 h window, starting from 1 h spin-up ensemble forecasts initialized at 18:00 UTC and assimilated data at hourly intervals using ensemble covariances generated by parallel ensemble-based DA systems. An updated radar reflectivity operator, consistent with the Thompson microphysics scheme, was used to directly assimilate reflectivity observations into both JEDI and GSI En3DVar systems. Compared to an original operator carried over from GSI En3DVar, the updated version substantially reduced root-mean-square innovations and biases for reflectivity in both the background forecast and analysis fields. These improvements stemmed from enhanced treatment of snow and graupel contributions, which led to more consistent hydrometeor adjustments during analysis. As demonstrated by Liu et al. (2022a), the physical consistency between the operator and forecast model is crucial for reducing spurious analysis increments and improving assimilation stability.
Forecasts initialized from JEDI and GSI En3DVar analyses using the updated reflectivity operator captured two primary mesoscale convective systems with comparable skill. Both systems produced more intense cold pools and better-defined surface wind structures by 00:00 UTC, which contributed to improved verification scores for reflectivity and precipitation forecasts over the first 6 h across multiple thresholds. Additionally, the JEDI-based forecasts showed greater spatial alignment between updraft helicity (UH ≥ 75 m2 s−2) and observed severe weather reports during the first two forecast hours. Despite differences in ensemble generation, localization strategy, and minimization procedures between the JEDI and GSI En3DVar systems, their analyses and short-range forecasts were similarly skillful, indicating that JEDI En3DVar is a viable alternative to the more extensively tested GSI En3DVar for radar DA.
When compared against operational forecasts from HRRR and experimental RRFS, which employed cloud analysis and a reflectivity-state-variable En3DVar approaches, respectively, both JEDI and GSI-based experiments demonstrated slightly improved quantitative forecast skill for reflectivity and precipitation. The probabilistic forecasts of UH also aligned more closely with observed severe weather locations, reinforcing the benefit of direct radar DA in convective-scale systems while demonstrating the implementation correctness of the radar DA capabilities in JEDI En3DVar.
Although the present results are encouraging, they are based on a single convective event and a limited cycling configuration. Broader evaluation using additional cases and extended cycling would be valuable to assess robustness across different storm types and to further characterize spin-up behavior of the innovation diagnostics and is left for future work.
While this study uses FV3-LAM, NOAA has initiated a transition toward the Model for Prediction Across Scales (MPAS) dynamical core for RRFS version 2 (Alexander et al., 2023). Similar tests that couple JEDI En3DVar with MPAS-based convective-scale forecasts will be an important next step.
In this study, both JEDI and GSI use an incremental En3DVar formulation. Following Liu et al. (2022b), the incremental cost function is written as
where δx is the analysis increment, , xb is the background state, xg is the first guess, is the innovation vector, H is the linearized observation operator, and B and R are the background and observation error covariance matrices, respectively.
The gradient of the cost function with respect to δx is
Setting the gradient to zero yields the linear system for the analysis increment:
In this study, no static background covariance is included, so the En3DVar configuration is a pure En3DVar, with the background error covariance represented by the localized ensemble covariance,
where Be is the ensemble covariance estimated from the ensemble perturbations and L denotes the localization matrix. The two systems differ mainly in the ensemble generation and localization implementation: GSI uses EnSRF perturbations together with recursive-filter localization, whereas JEDI uses LETKF perturbations and BUMP-based localization. More complete implementation details of the JEDI EnVar framework are given in Liu et al. (2022b).
The source code of JEDI–FV3 version 1.0.0 used in this study is available on Zenodo at https://doi.org/10.5281/zenodo.18272913 (Park and Liu, 2025). For reproducibility, the processed radar observations in IODA netCDF format and the YAML configuration files used in the JEDI EnVar experiments are available on Zenodo at https://doi.org/10.5281/zenodo.18272368 (Park and Liu, 2026). Global Ensemble Forecast System (GEFS) ensemble analyses and forecasts are available from the NOAA National Centers for Environmental Information (NCEI) at https://www.ncei.noaa.gov/products/weather-climate-models/global-ensemble-forecast (last access: 16 January 2026; NOAA, 2026). Reflectivity data from the NOAA Multi-Radar Multi-Sensor (MRMS) system are available from NOAA NCEI at https://mrms.nssl.noaa.gov/ (last access: 16 January 2026). NEXRAD Level II radial velocity data are available from the NOAA NCEI radar archive at https://www.ncei.noaa.gov/products/radar/next-generation-weather-radar (last access: 16 January 2026). These MRMS and NEXRAD datasets are also accessible via the NOAA Open Data Program, including through Amazon Web Services (AWS), at https://registry.opendata.aws/noaa-mrms-pds (last access: 2 September 2026) and https://registry.opendata.aws/noaa-nexrad/ (last access: 2 September 2026).
JP developed the data assimilation codes, conducted the experiments, performed the diagnostics and plotting, and led the manuscript writing. CL designed the overall study and experiments, analyzed the results, and contributed to the writing. MX contributed to the interpretation of the results and manuscript revision.
The contact author has declared that none of the authors has any competing interests.
Publisher's note: Copernicus Publications remains neutral with regard to jurisdictional claims made in the text, published maps, institutional affiliations, or any other geographical representation in this paper. The authors bear the ultimate responsibility for providing appropriate place names. Views expressed in the text are those of the authors and do not necessarily reflect the views of the publisher.
The authors acknowledge the Texas Advanced Computing Center (TACC) at the University of Texas at Austin for providing high-performance computing resources on the Stampede2 supercomputer through the NSF XSEDE and ACCESS programs.
This research has been supported by the National Oceanic and Atmospheric Administration (NOAA) through the Joint Technology Transfer Initiative (JTTI) program (grant no. NA21OAR4590171) and the Research-to-Operations (R2O) program (grant no. NA21OAR4320204).
This paper was edited by Guoqing Ge and reviewed by two anonymous referees.
Alexander, C. R., Carley, J. R., and Pyle, M. E.: The Rapid Refresh Forecast System: Looking Beyond the First Operational Version, in: Unified Forecast System Implementations and Future Capabilities Workshop (UIFCW 2023), Boulder, CO, USA, 25 July 2023, https://epic.noaa.gov/wp-content/uploads/2023/08/UIFCW-2023-Tue-9.-Alexander_UFS_UIFCW_2023_Final-2.pdf (last access: 10 November 2025), 2023.
Banos, I. H., Mayfield, W. D., Ge, G., Sapucci, L. F., Carley, J. R., and Nance, L.: Assessment of the data assimilation framework for the Rapid Refresh Forecast System v0.1 and impacts on forecasts of a convective storm case study, Geosci. Model Dev., 15, 6891–6917, https://doi.org/10.5194/gmd-15-6891-2022, 2022.
Bernardet, L., Bengtsson, L., Reinecke, P. A., Yang, F., Zhang, M., Hall, K., Doyle, J., Martini, M., Firl, G., and Xue, L.: Common Community Physics Package: Fostering collaborative development in physical parameterizations and suites, Bull. Am. Meteorol. Soc., 105, E1490–E1505, https://doi.org/10.1175/BAMS-D-23-0227.1, 2024.
Bishop, C. H., Whitaker, J. S., and Lei, L.: Gain form of the ensemble transform Kalman filter and its relevance to satellite data assimilation with model space ensemble covariance localization, Mon. Weather Rev., 145, 4575–4592, https://doi.org/10.1175/MWR-D-17-0102.1, 2017.
Brewster, K., Hu, M., Xue, M., and Gao, J.: Efficient assimilation of radar data at high resolution for short-range numerical weather prediction, in: World Weather Research Programme Symposium on Nowcasting and Very Short-Range Forecasting (WSN05), Toulouse, France, 5–9 September 2005, WMO, Symposium CD-ROM, Paper 3.06, https://twister.caps.ou.edu/papers/BrewsterWWRP_Nowcasting.pdf (last access: 2 September 2026), 2005.
Carley, J., Alexander, C., Wicker, L., Jablonowski, C., Clark, A., Nelson, J., Jirak, I., and Viner, K.: Mitigation efforts to address rapid refresh forecast system (RRFS) v1 dynamical core performance issues and recommendations for RRFS v2, NCEP Office Note 516, NOAA National Centers for Environmental Prediction, College Park, MD, USA, https://doi.org/10.25923/ccgj-7140, 2023.
Chen, L., Liu, C, Xue, M., Zhao, G., Kong, R., and Jung, Y.: Use of power transform mixing ratios as hydrometeor control variables for direct assimilation of radar reflectivity in GSI En3DVar and tests with five convective storm cases, Mon. Weather Rev., 149, 645–659, https://doi.org/10.1175/MWR-D-20-0149.1, 2021.
Courtier, P., Thépaut, J. N., and Hollingsworth, A.: A strategy for operational implementation of 4D‐Var, using an incremental approach, Q. J. Roy. Meteor. Soc., 120, 1367–1387, https://doi.org/10.1002/qj.49712051912, 1994.
Dowell, D. C., Alexander, C. R., James, E. P., Weygandt, S. S., Benjamin, S. G., Manikin, G. S., Blake, B. T., Brown, J. M., Olson, J. B., Hu, M., Smirnova, T. G., Ladwig, T., Kenyon, J. S., Ahmadov, R., Turner, D. D., Duda, J. D., and Alcott, T. I.: The High-Resolution Rapid Refresh (HRRR): An hourly updating convection-allowing forecast model. Part I: Motivation and system description, Weather Forecast., 37, 1371–1395, https://doi.org/10.1175/WAF-D-21-0151.1, 2022.
Evensen, G.: The ensemble Kalman filter: Theoretical formulation and practical implementation, Ocean Dynam., 53, 343–367, https://doi.org/10.1007/s10236-003-0036-9, 2003.
Field, P. R., Hogan, R. J., Brown, P. R. A., Illingworth, A. J., Choularton, T. W., and Cotton, R. J.: Parametrization of ice‐particle size distributions for mid‐latitude stratiform cloud, Q. J. Roy. Meteor. Soc., 131, 1997–2017, https://doi.org/10.1256/qj.04.134, 2005.
Gallo, B. T., Clark, A. J., and Dembek, S. R.: Forecasting tornadoes using convection-permitting ensembles, Weather Forecast., 31, 273–295, https://doi.org/10.1175/WAF-D-15-0134.1, 2016.
Gao, J., Heinselman, P. L., Xue, M., Wicker, L. J., Yussouf, N., Stensrud, D. J., and Droegemeier, K. K.: The numerical prediction of severe convective storms: Advances, challenges, and outlook, in: Elsevier Reference Collection in Earth Systems and Environmental Sciences, Elsevier, 1–22, https://doi.org/10.1016/B978-0-323-96026-7.00127-2, 2024.
Grim, J. A., Pinto, J. O., and Dowell, D. C.: Assessing RRFS versus HRRR in predicting widespread convective systems over the eastern CONUS, Weather Forecast., 39, 121–140, https://doi.org/10.1175/WAF-D-23-0112.1, 2024.
Houtekamer, P. L. and Zhang, F.: Review of the ensemble Kalman filter for atmospheric data assimilation, Mon. Weather Rev., 144, 4489–4532, https://doi.org/10.1175/MWR-D-15-0440.1, 2016.
Hu, M., Benjamin, S. G., Ladwig, T. T., Dowell, D. C., Weygandt, S. S., Alexander, C. R., and Whitaker, J. S.: GSI three-dimensional ensemble–variational hybrid data assimilation using a global ensemble for the regional Rapid Refresh model, Mon. Weather Rev., 145, 4205–4225, https://doi.org/10.1175/MWR-D-16-0418.1, 2017.
Hunt, B. R., Kostelich, E. J., and Szunyogh, I.: Efficient data assimilation for spatiotemporal chaos: A local ensemble transform Kalman filter, Physica D, 230, 112–126, https://doi.org/10.1016/j.physd.2006.11.008, 2007.
Iacono, M. J., Delamere, J. S., Mlawer, E. J., Shephard, M. W., Clough, S. A., and Collins, W. D.: Radiative forcing by long-lived greenhouse gases: Calculations with the AER radiative transfer models, J. Geophys. Res.-Atmos., 113, D13103, https://doi.org/10.1029/2008JD009944, 2008.
Johnson, M., Snook, N., Park, J., Xue, M., Brewster, K. A., Supinie, T., and Hu, X.: Severe weather verification of an FV3-LAM regional ensemble during the 2022 NOAA Hazardous Weather Testbed Spring Forecasting Experiment, Weather Forecast., 40, 577–592, https://doi.org/10.1175/WAF-D-24-0034.1, 2025.
Kain, J. S., Weiss, S. J., Bright, D. R., Baldwin, M. E., Levit, J. J., Carbin, G. W., Schwartz, C. S., Weisman, M. L., Droegemeier, K. K., Weber, D. B., and Thomas, K. W.: Some practical considerations regarding horizontal resolution in the first generation of operational convection-allowing NWP, Weather Forecast., 23, 931–952, https://doi.org/10.1175/WAF2007106.1, 2008.
Kong, R., Xue, M., and Liu, C.: Development of a hybrid En3DVar data assimilation system and comparisons with 3DVar and EnKF for radar data assimilation with observing system simulation experiments, Mon. Weather Rev., 146, 175–198, https://doi.org/10.1175/MWR-D-17-0164.1, 2018.
Labriola, J., Jung, Y., Liu, C., and Xue, M.: Evaluating forecast performance and sensitivity to the GSI EnKF data assimilation configuration for the 28–29 May 2017 mesoscale convective system case, Weather Forecast., 36, 127–146, https://doi.org/10.1175/WAF-D-20-0071.1, 2021.
Li, H., Liu, C., Xue, M., Park, J., Chen, L., Jung, Y., Kong, R., and Tong, C.-C.: Use of power-transform total number concentration as control variable for direct assimilation of radar reflectivity in GSI En3DVar and tests with six convective storms cases, Mon. Weather Rev., 150, 821–842, https://doi.org/10.1175/MWR-D-21-0041.1, 2022.
Lin, S.-J.: A “vertically Lagrangian” finite-volume dynamical core for global models, Mon. Weather Rev., 132, 2293–2307, https://doi.org/10.1175/1520-0493(2004)132<2293:AVLFDC>2.0.CO;2, 2004.
Lin, Y. and Mitchell, K. E.: The NCEP Stage II/IV hourly precipitation analyses: Development and applications, in: 19th Conf. on Hydrology, San Diego, CA, Amer. Meteor. Soc., 1.2, https://ams.confex.com/ams/Annual2005/techprogram/paper_83847.htm (last access: 25 September 2025), 2005.
Liu, C., Xue, M., and Kong, R.: Direct assimilation of radar reflectivity data using 3DVAR: Treatment of hydrometeor background errors and OSSE tests, Mon. Weather Rev., 147, 17–29, https://doi.org/10.1175/MWR-D-18-0033.1, 2019.
Liu, C., Xue, M., and Kong, R.: Direct variational assimilation of radar reflectivity and radial velocity data: Issues with nonlinear reflectivity operator and solutions, Mon. Weather Rev., 148, 1483–1502, https://doi.org/10.1175/MWR-D-19-0149.1, 2020.
Liu, C., Li, H., Xue, M., Jung, Y., Park, J., Chen, L., Kong, R., and Tong, C.: Use of a reflectivity operator based on double-moment Thompson microphysics for direct assimilation of radar reflectivity in GSI-based hybrid En3DVar, Mon. Weather Rev., 150, 907–926, https://doi.org/10.1175/MWR-D-21-0040.1, 2022a.
Liu, Z., Snyder, C., Guerrette, J. J., Jung, B.-J., Ban, J., Vahl, S., Wu, Y., Trémolet, Y., Auligné, T., Ménétrier, B., Shlyaeva, A., Herbener, S., Liu, E., Holdaway, D., and Johnson, B. T.: Data assimilation for the Model for Prediction Across Scales – Atmosphere with the Joint Effort for Data assimilation Integration (JEDI-MPAS 1.0.0): EnVar implementation and evaluation, Geosci. Model Dev., 15, 7859–7878, https://doi.org/10.5194/gmd-15-7859-2022, 2022b.
Ménétrier, B.: Normalized Interpolated Convolution from an Adaptive Subgrid (NICAS) documentation, GitHub, https://github.com/benjaminmenetrier/nicas_doc (last access: 25 September 2025), 2020.
Mittermaier, M. and Roberts, N.: Intercomparison of spatial forecast verification methods: Identifying skillful spatial scales using the Fractions Skill Score, Weather Forecast., 25, 343–354, https://doi.org/10.1175/2009WAF2222260.1, 2010.
Niu, G.-Y., Yang, Z.-L., Mitchell, K. E., Chen, F., Ek, M. B., Barlage, M., Kumar, A., Manning, K., Niyogi, D., Rosero, E., Tewari, M., and Xia, Y.: The community Noah land surface model with multiparameterization options (Noah-MP): 1. Model description and evaluation with local-scale measurements, J. Geophys. Res.-Atmos., 116, D12109, https://doi.org/10.1029/2010JD015139, 2011.
NOAA: V2.7 RTMA/URMA/RTMA-RU NCEP OD Science Brief, NOAA/NCEP Environmental Modeling Center, https://www.emc.ncep.noaa.gov/emc/docs/OD_Science_Brief_RTMA_v2.7.pdf (last access: 25 September 2025), 2018.
NOAA: 2022 Spring Forecasting Experiment, Hazardous Weather Testbed, National Severe Storms Laboratory, https://doi.org/10.25923/r70a-aw71, 2022.
NOAA: Global Ensemble Forecast System (GEFS), NOAA National Centers for Environmental Information (NCEI) [data set], https://www.ncei.noaa.gov/products/weather-climate-models/global-ensemble-forecast (last access: 16 January 2026), 2026.
Olson, J. B., Kenyon, J. S., Angevine, W., Brown, J. M., Pagowski, M., and Sušelj, K.: A description of the MYNN-EDMF scheme and the coupling to other components in WRF–ARW, NOAA Office of Oceanic and Atmospheric Research, https://repository.library.noaa.gov/view/noaa/19837 (last access: 25 September 2025), 2019.
Park, J. and Liu, C.: JEDI-FV3 v1.0.0 with radar data assimilation implementation (v1.0.0), Zenodo [code], https://doi.org/10.5281/zenodo.18272913, 2025.
Park, J. and Liu, C.: Processed radar observations and configuration files for JEDI-FV3 v1.0.0 (v1.0.0), Zenodo [data set], https://doi.org/10.5281/zenodo.18272368, 2026.
Park, J., Xue, M., and Liu, C.: Implementation and testing of radar data assimilation capabilities within the Joint Effort for Data assimilation Integration (JEDI) framework with ensemble transformation Kalman filter coupled with FV3-LAM model, Geophys. Res. Lett., 50, e2022GL102709, https://doi.org/10.1029/2022GL102709, 2023.
Potvin, C. K., Carley, J. R., Clark, A. J., Wicker, L. J., Skinner, P. S., Reinhart, A. E., Gallo, B. T., Kain, J. S., Romine, G. S., Aligo, E. A., Brewster, K. A., Dowell, D. C., Harris, L. M., Jirak, I. L., Kong, F., Supinie, T. A., Thomas, K. W., Wang, X., Wang, Y., and Xue, M.: Systematic comparison of convection-allowing models during the 2017 NOAA HWT Spring Forecasting Experiment, Weather Forecast., 34, 1395–1416, https://doi.org/10.1175/WAF-D-19-0056.1, 2019.
Purser, R. J., Wu, W.-S., Parrish, D. F., and Roberts, N. M.: Numerical aspects of the application of recursive filters to variational statistical analysis. Part I: Spatially homogeneous and isotropic Gaussian covariances, Mon. Weather Rev., 131, 1524–1535, https://doi.org/10.1175//1520-0493(2003)131<1524:NAOTAO>2.0.CO;2, 2003.
Roberts, N. M. and Lean, H. W.: Scale-selective verification of rainfall accumulations from high-resolution forecasts of convective events, Mon. Weather Rev., 136, 78–97, https://doi.org/10.1175/2007MWR2123.1, 2008.
Schenkman, A. D., Xue, M., Shapiro, A., Brewster, K., and Gao, J.: Impact of CASA Radar and Oklahoma Mesonet data assimilation on the analysis and prediction of tornadic mesovortices in an MCS, Mon. Weather Rev., 139, 3422–3445, https://doi.org/10.1175/MWR-D-10-05051.1, 2011.
Smith, T. M., Lakshmanan, V., Stumpf, G. J., Ortega, K. L., Hondl, K., Cooper, K., Calhoun, K. M., Kingfield, D. M., Manross, K. L., Toomey, R., and Brogden, J.: Multi-Radar Multi-Sensor (MRMS) severe weather and aviation products: Initial operating capabilities, Bull. Am. Meteorol. Soc., 97, 1617–1630, https://doi.org/10.1175/BAMS-D-14-00173.1, 2016.
Snook, N., Xue, M., and Jung, J.: Ensemble probabilistic forecasts of a tornadic mesoscale convective system from ensemble Kalman filter analyses using WSR-88D and CASA radar data, Mon. Weather Rev., 140, 2126–2146, https://doi.org/10.1175/MWR-D-11-00117.1, 2012.
Sobash, R. A., Kain, J. S., Bright, D. R., Dean, A. R., Coniglio, M. C., and Weiss, S. J.: Probabilistic forecast guidance for severe thunderstorms based on the identification of extreme phenomena in convection-allowing model forecasts, Weather Forecast., 26, 714–728, https://doi.org/10.1175/WAF-D-10-05046.1, 2011.
Sun, J. and Crook, N. A.: Dynamical and microphysical retrieval from Doppler radar observations using a cloud model and its adjoint. Part I: Model development and simulated data experiments, J. Atmos. Sci., 54, 1642–1661, https://doi.org/10.1175/1520-0469(1997)054<1642:DAMRFD>2.0.CO;2, 1997.
Sun, J., Xue, M., Wilson, J. W., Zawadzki, I., Onvlee-Hooimeyer, J., Ballard, S. P., Joe, P., Barker, D., Lee, P.-H., Golding, B., Xu, M., and Pinto, J.: Use of NWP for nowcasting precipitation: Recent progress and challenges, Bull. Am. Meteorol. Soc., 95, 409–426, https://doi.org/10.1175/BAMS-D-11-00263.1, 2014.
Supinie, T. A., Park, J., Snook, N., Hu, X., Brewster, K. A., and Xue, M.: Cool-season evaluation of FV3-LAM-based CONUS-scale forecasts with physics configurations of experimental RRFS ensembles, Mon. Weather Rev., 150, 2379–2398, https://doi.org/10.1175/MWR-D-21-0331.1, 2022.
Thompson, G., Field, P. R., Rasmussen, R. M., and Hall, W. D.: Explicit forecasts of winter precipitation using an improved bulk microphysics scheme. Part II: Implementation of a new snow parameterization, Mon. Weather Rev., 136, 5095–5115, https://doi.org/10.1175/2008MWR2387.1, 2008.
Tong, C.-C., Jung, Y., Xue, M., and Liu, C.: Direct assimilation of radar data within the National Weather Service operational GSI EnKF and hybrid En3DVar systems for the stand-alone regional FV3 model at a convection-allowing resolution, Geophys. Res. Lett., 47, e2020GL090179, https://doi.org/10.1029/2020GL090179, 2020.
Tong, M. and Xue, M.: Ensemble Kalman filter assimilation of Doppler radar data with a compressible nonhydrostatic model: OSS experiments, Mon. Weather Rev., 133, 1789–1807, https://doi.org/10.1175/MWR2898.1, 2005.
Trémolet, Y. and Auligné, T.: The Joint Effort for Data Assimilation Integration (JEDI), JCSDA Quarterly Newsletter, 66, 1–5, https://doi.org/10.25923/RB19-0Q26, 2020.
Wang, Y. and Wang, X.: Direct assimilation of radar reflectivity without tangent linear and adjoint of the nonlinear observation operator in the GSI-based EnVar system: Methodology and experiment with the 8 May 2003 Oklahoma City tornadic supercell, Mon. Weather Rev., 145, 1447–1471, https://doi.org/10.1175/MWR-D-16-0231.1, 2017.
Weygandt, S. S., Benjamin, S. G., Hu, M., Alexander, C. R., Smirnova, T. G., and James, E. P.: Radar reflectivity–based model initialization using specified latent heating (Radar-LHI) within a diabatic digital filter or pre-forecast integration, Weather Forecast., 37, 1419–1434, https://doi.org/10.1175/WAF-D-21-0142.1, 2022.
Whitaker, J. S. and Hamill, T. M.: Ensemble data assimilation without perturbed observations, Mon. Weather Rev., 130, 1913–1924, https://doi.org/10.1175/1520-0493(2002)130<1913:EDAWPO>2.0.CO;2, 2002.
Whitaker, J. S. and Hamill, T. M.: Evaluating methods to account for system errors in ensemble data assimilation, Mon. Weather Rev., 140, 3078–3089, https://doi.org/10.1175/MWR-D-11-00276.1, 2012.
Wu, W.-S., Parrish, D. F., Rogers, E., and Lin, Y.: Regional ensemble–variational data assimilation using global ensemble forecasts, Weather Forecast., 32, 83–96, https://doi.org/10.1175/WAF-D-16-0045.1, 2017.
Zhou, X., Zhu, Y., Hou, D., Fu, B., Li, W., Guan, H., Sinsky, E., Kolczynski, W., Xue, X., Luo, Y., Peng, J., Yang, B., Tallapragada, V., and Pegion, P.: The development of the NCEP Global Ensemble Forecast System version 12, Weather Forecast., 37, 1069–1084, https://doi.org/10.1175/WAF-D-21-0112.1, 2022.
- Abstract
- Introduction
- Reflectivity observation operator for Thompson microphysics
- Test case and experiment setup
- Results and discussions
- Summary and conclusions
- Appendix A: Brief formulation of the incremental En3DVar used in this study
- Code and data availability
- Author contributions
- Competing interests
- Disclaimer
- Acknowledgements
- Financial support
- Review statement
- References
- Abstract
- Introduction
- Reflectivity observation operator for Thompson microphysics
- Test case and experiment setup
- Results and discussions
- Summary and conclusions
- Appendix A: Brief formulation of the incremental En3DVar used in this study
- Code and data availability
- Author contributions
- Competing interests
- Disclaimer
- Acknowledgements
- Financial support
- Review statement
- References