
the Creative Commons Attribution 4.0 License.
the Creative Commons Attribution 4.0 License.
 | 02 Sep 2026
AD-MERGE 2.0: an integrated assessment of the Nexus among energy transitions, climate impacts, and adaptation responses
Kamyar Amirmoeini

Kelly de Bruin
Kirsten Everett
Hamed Kouchaki-Penchah
Pierre-Olivier Pineau
This paper presents AD-MERGE 2.0, an enhanced integrated assessment model that evaluates reactive (“flow”) and proactive (“stock”) adaptation strategies along with climate mitigation policies. The updated model extends AD-MERGE 1.0 through seven enhancements: (i) including a more recent base year, (ii) increased regional details, (iii) refined energy system modeling, (iv) inclusion of variable renewable energy, (v) direct air carbon capture and storage, (vi) recalibrated damage and adaptation estimates, and (vii) alignment with the latest Shared Socioeconomic Pathway (SSP2, version 3.0). Next, this study assesses five distinct scenarios using the enhanced AD-MERGE 2.0 framework: a Baseline (no mitigation or damage consideration) and two mitigation pathways, a Reference scenario (current policy-driven mitigation and climate damages), and an Announced Pledges scenario (emissions aligned with national commitments). Each of the mitigation scenarios is studied with and without optimal adaptation, an idealized assumption of perfect foresight used to establish theoretical benchmarks. Collective advancements incorporated in the model refine analytical precision in scenario analysis, thus facilitating a more extensive examination of regional heterogeneity, energy system dynamics, technological innovation, and economic vulnerabilities associated with climate impacts. The results underscore critical trade-offs and synergies between adaptation and mitigation strategies, highlighting regional heterogeneity in adaptation needs, residual damages, and mitigation-adaptation interactions, alongside the integration of clean energy technologies.
- Article
(4596 KB) - Full-text XML
-
Supplement
(452 KB) - BibTeX
- EndNote


Integrated Assessment Models (IAMs) are important tools for analyzing and understanding the complex relationships between energy systems, economic growth, and environmental sustainability. These models integrate data from various disciplines to explore the interactions between human and natural systems and evaluate the impacts of different policy decisions. IAMs facilitate the design of effective and sustainable policies by illustrating the long-term impacts of different emission pathways (Keppo et al., 2021; IPCC, 2022a). Since the Intergovernmental Panel on Climate Change (IPCC) Second Assessment Report (Weyant et al., 1995; IPCC, 1996), IAMs have played a critical role to quantifying the technological and economic impacts of decarbonization; thus, they served as key tools for Working Group III (WGIII) mitigation analyzes in AR5 and AR6 (IPCC, 2018, 2022a).
This paper presents the latest developments of MERGE, a Model for Estimating the Regional and Global Effects of greenhouse gas (GHG) reductions (Manne et al., 1995). It introduces AD-MERGE 2.0, a new version of MERGE-ETL (Bahn and Kypreos, 2003; Bahn et al., 2011) and AD-MERGE (Bahn et al., 2019). MERGE-ETL incorporates the dynamics of endogenous technological learning, and AD-MERGE further includes reactive and proactive adaptation to study the interplay of mitigation and adaptation measures. Building on the foundation laid out by its predecessors, AD-MERGE 2.0 introduces enhancements in the following seven areas: (i) base year update (from 2000 to 2015); (ii) regional disaggregation (from 9 to 15 regions); (iii) improved energy system modeling, with additional and updated natural resources categories, new conversion technologies, and feedback from direct air carbon capture and storage (DACCS) technologies; (iv) inclusion of variable renewable energy (VRE) dynamics; (v) inclusion of DACCS technologies; (vi) recalibration of damages and adaptation; and (vii) scenario alignment with the latest version of the second shared socioeconomic pathway (SSP2) version 3.0 (IIASA, 2024a).
The importance of regional disaggregation in IAMs is accentuated in the context of geopolitics, regional variability in energy resources, climate vulnerability, and impacts (Yalew et al., 2020). Ever-evolving geopolitics and the need for tailored mitigation strategies necessitate region-specific analysis within IAMs (Gazzotti et al., 2021; Wilson et al., 2021). Detailed regional analysis can capture distinct regional socioeconomic and environmental dynamics, facilitating targeted policy studies (Aryanpur et al., 2021; Keppo et al., 2021). Moreover, since the impacts of climate change vary across regions, improved regional disaggregation allows a more accurate analysis of these differences in climate impacts. Further, it facilitates the development of more effective adaptation strategies (Patt et al., 2010; Awais et al., 2024). In AD-MERGE 2.0, we have increased the number of regions from 9 to 15 to better capture regional differences in climate impacts, energy resources, and socio-economic conditions.
Moreover, to accurately reflect evolving energy systems, integrating a diverse spectrum of energy sources and technologies, from traditional to emerging alternatives, can improve the effectiveness of IAMs (Keppo et al., 2021; IPCC, 2022a). Rapid technological developments of emerging energy carriers and technologies pose challenges and opportunities for the energy system. Among these developments is the integration of hydrogen, a potentially low-emission fuel with high gravimetric energy density and versatility (IRENA, 2022; Edelenbosch et al., 2024; Lippkau et al., 2023). Hydrogen’s energy storage and transfer capabilities make it key to decarbonizing hard-to-abate sectors and meeting ambitious emission targets (Kouchaki-Penchah et al., 2024). Alongside hydrogen, advanced decarbonization solutions are being explored to increase the overall flexibility of the energy transition. DACCS captures and stores atmospheric CO2, improving negative emissions capacity. However, its high energy and water demands raise concerns about relying on it to delay near-term mitigation, which could lead to irreversible warming (Realmonte et al., 2019; Fuhrman et al., 2021; Carton et al., 2023). By explicitly incorporating emerging clean energy and carbon removal technologies, our model provides a more comprehensive evaluation of how innovation can shape decarbonization pathways within a dynamic and evolving energy landscape.
Along with the imperative to address climate change in recent years, we have seen a dramatic decline in the cost of renewable energy technologies, driven by policy support and technological advancements (IEA, 2020a; NREL, 2021). Thus, renewable energy sources have transitioned from policy-dependent options to market-competitive alternatives, often surpassing fossil fuels in the levelized cost of generation (Gong et al., 2023). The rise of VRE, characterized by its intermittent nature along with demand fluctuations, requires power systems to adapt to various operational challenges (Bianco et al., 2019; Parrado-Hernando et al., 2022). This highlights the need for IAMs to account for the growing complexity of energy systems and power system dynamics. Nevertheless, IAMs are designed for long-term trends; they often encounter significant challenges when it comes to capturing the short-term dynamics of the power sector. Although some IAMs improved temporal and spatial resolutions or added mechanisms to reflect system complexity (Carrara and Marangoni, 2017; Pietzcker et al., 2017; Ueckerdt et al., 2017; Gong et al., 2023), many still fall short in accurately capturing power system dynamics. This can significantly misrepresent transmission constraints, regional variability in renewable energy, and the flexibility needed to balance supply and demand (Aryanpur et al., 2021; Martínez-Gordón et al., 2021). In this paper, we contribute to addressing these modeling limitations by incorporating different power sector dynamics within AD-MERGE.
IAMs are essential for analyzing the economic impacts of climate change, but often face challenges in accurately representing adaptation measures, particularly at finer spatial resolutions, where adaptation is often overlooked or oversimplified. Although models like AD-RICE, AD-WITCH, and Ada-BaHaMA have explicitly incorporated adaptation as a policy variable (de Bruin et al., 2009a; Agrawala et al., 2011a; Bahn et al., 2012, 2015), given the fast pace at which impact studies have evolved, existing assessments of climate impacts and the costs and effectiveness of adaptation measures are mostly outdated. Despite the critical importance of adaptation, there has been limited progress over the past decade in developing reliable estimates for global adaptation costs (UNEP, 2023), leaving it inadequately integrated into current modeling and SSP frameworks (van Maanen et al., 2023). Addressing this shortcoming is essential to improve the accuracy of future projections, as inadequate adaptation modeling limits the ability to assess the full spectrum of climate impacts and the effectiveness of different policy responses. In this paper, we contribute by recalibrating the climate damage function and the associated adaptation costs and benefits within the AD-MERGE framework.
The evolution of IAMs has been marked by the incorporation of frameworks such as Representative Concentration Pathways (RCPs) (van Vuuren et al., 2011) and Shared Socioeconomic Pathways SSPs (Riahi et al., 2017). While SSPs outline potential trajectories for global societal, demographic, and economic development, RCPs specify alternative radiative forcing pathways that reflect different GHG concentration scenarios. The SSP-RCP frameworks (van Vuuren et al., 2014; Riahi et al., 2017) effectively complement each other by exploring climate and societal futures. This integrated approach allows for more comprehensive climate change-related studies (O'Neill et al., 2020). As a result, it improves our ability to envision and plan for the diverse impacts of societal and climatic transformations. For this paper, we have aligned the demographic and economic developments of AD-MERGE 2.0 with the latest iteration of the SSP version 3.0 scenarios (IIASA, 2024a).
The remainder of this paper is organized as follows. Section 2 describes AD-MERGE 2.0 framework and presents model improvements. Section 3 introduces the calibration process and outlines the scenarios studied. Section 4 analyzes different climate policies with AD-MERGE 2.0 and studies the interplay between adaptation and mitigation of climate change. Section 5 provides a discussion of our findings and presents our concluding remarks.
In this section, we present several key advancements within AD-MERGE 2.0. We begin by introducing the overall framework of the model, then describe the new regional disaggregation. We next present the expanded energy portfolio, which incorporates new explicit technologies and updated techno-economic parameters across a range of technologies, and finally outline the recalibration process for climate damages and adaptation costs.
2.1 AD-MERGE overall framework
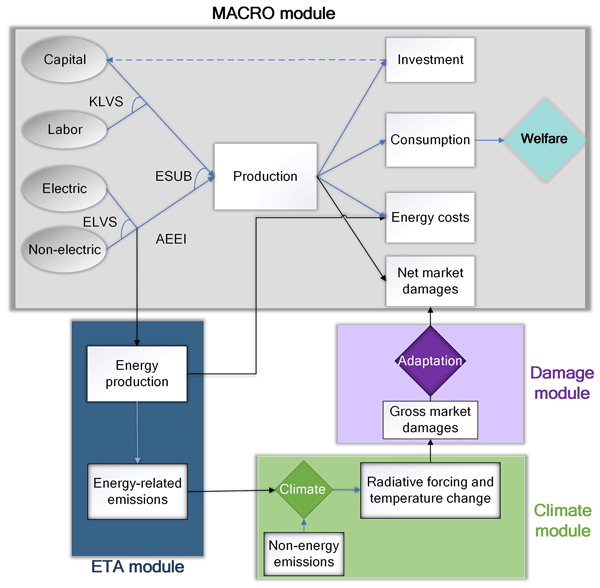
As depicted in Fig. 1, AD-MERGE comprises four modules: (i) the Energy Technology Assessment (ETA) module uses a bottom-up approach to model the energy supply sector, separating the production and associated GHG emissions of electric and non-electric energy. This module enables transitions among energy carriers and technologies. (ii) The Macroeconomic (MACRO) module applies a top-down approach to capture the interplay between the energy sector and the broader economy by modeling substitutions between value-added and energy aggregates. (iii) The Climate module represents the causal chain through which GHG emissions increase atmospheric GHG concentrations, alter the radiative forcing balance, and lead to changes in global mean surface temperature. In AD-MERGE, this reduced-form module is internally integrated within the model's optimization framework, allowing climate dynamics to evolve endogenously and enabling explicit feedbacks between climate outcomes, economic activity, energy-system decisions, and adaptation responses. Owing to the thermal inertia of the climate system, driven by a slower heat uptake of the oceans, actual temperature change lags behind potential temperature (Manne et al., 1995). Accordingly, the model distinguishes between potential temperature and actual temperature, with the latter adjusting gradually over time. (iv) The Damage module quantifies gross damages, which are economic losses due to temperature changes, assuming no adaptation. Through adaptation policies, these gross damages can be reduced to residual damages. In AD-MERGE, the original market damage function from the MERGE model is replaced with a new function that incorporates these residual damages as well as the costs of adaptation measures, representing net costs of climate change (Bahn et al., 2019). Reactive adaptation is modeled as immediate spending (i.e. a flow variable), and proactive adaptation is modeled as an investment in capital that provides protection (i.e. a stock variable). These strategies are integrated using a Constant Elasticity of Substitution (CES) function, reflecting the premise that reactive and proactive adaptations are imperfect substitutes. The formulation of the damage module is provided separately in Appendix D, while the formulations of the other modules are presented in the Supplement (Sects. S1–S3).
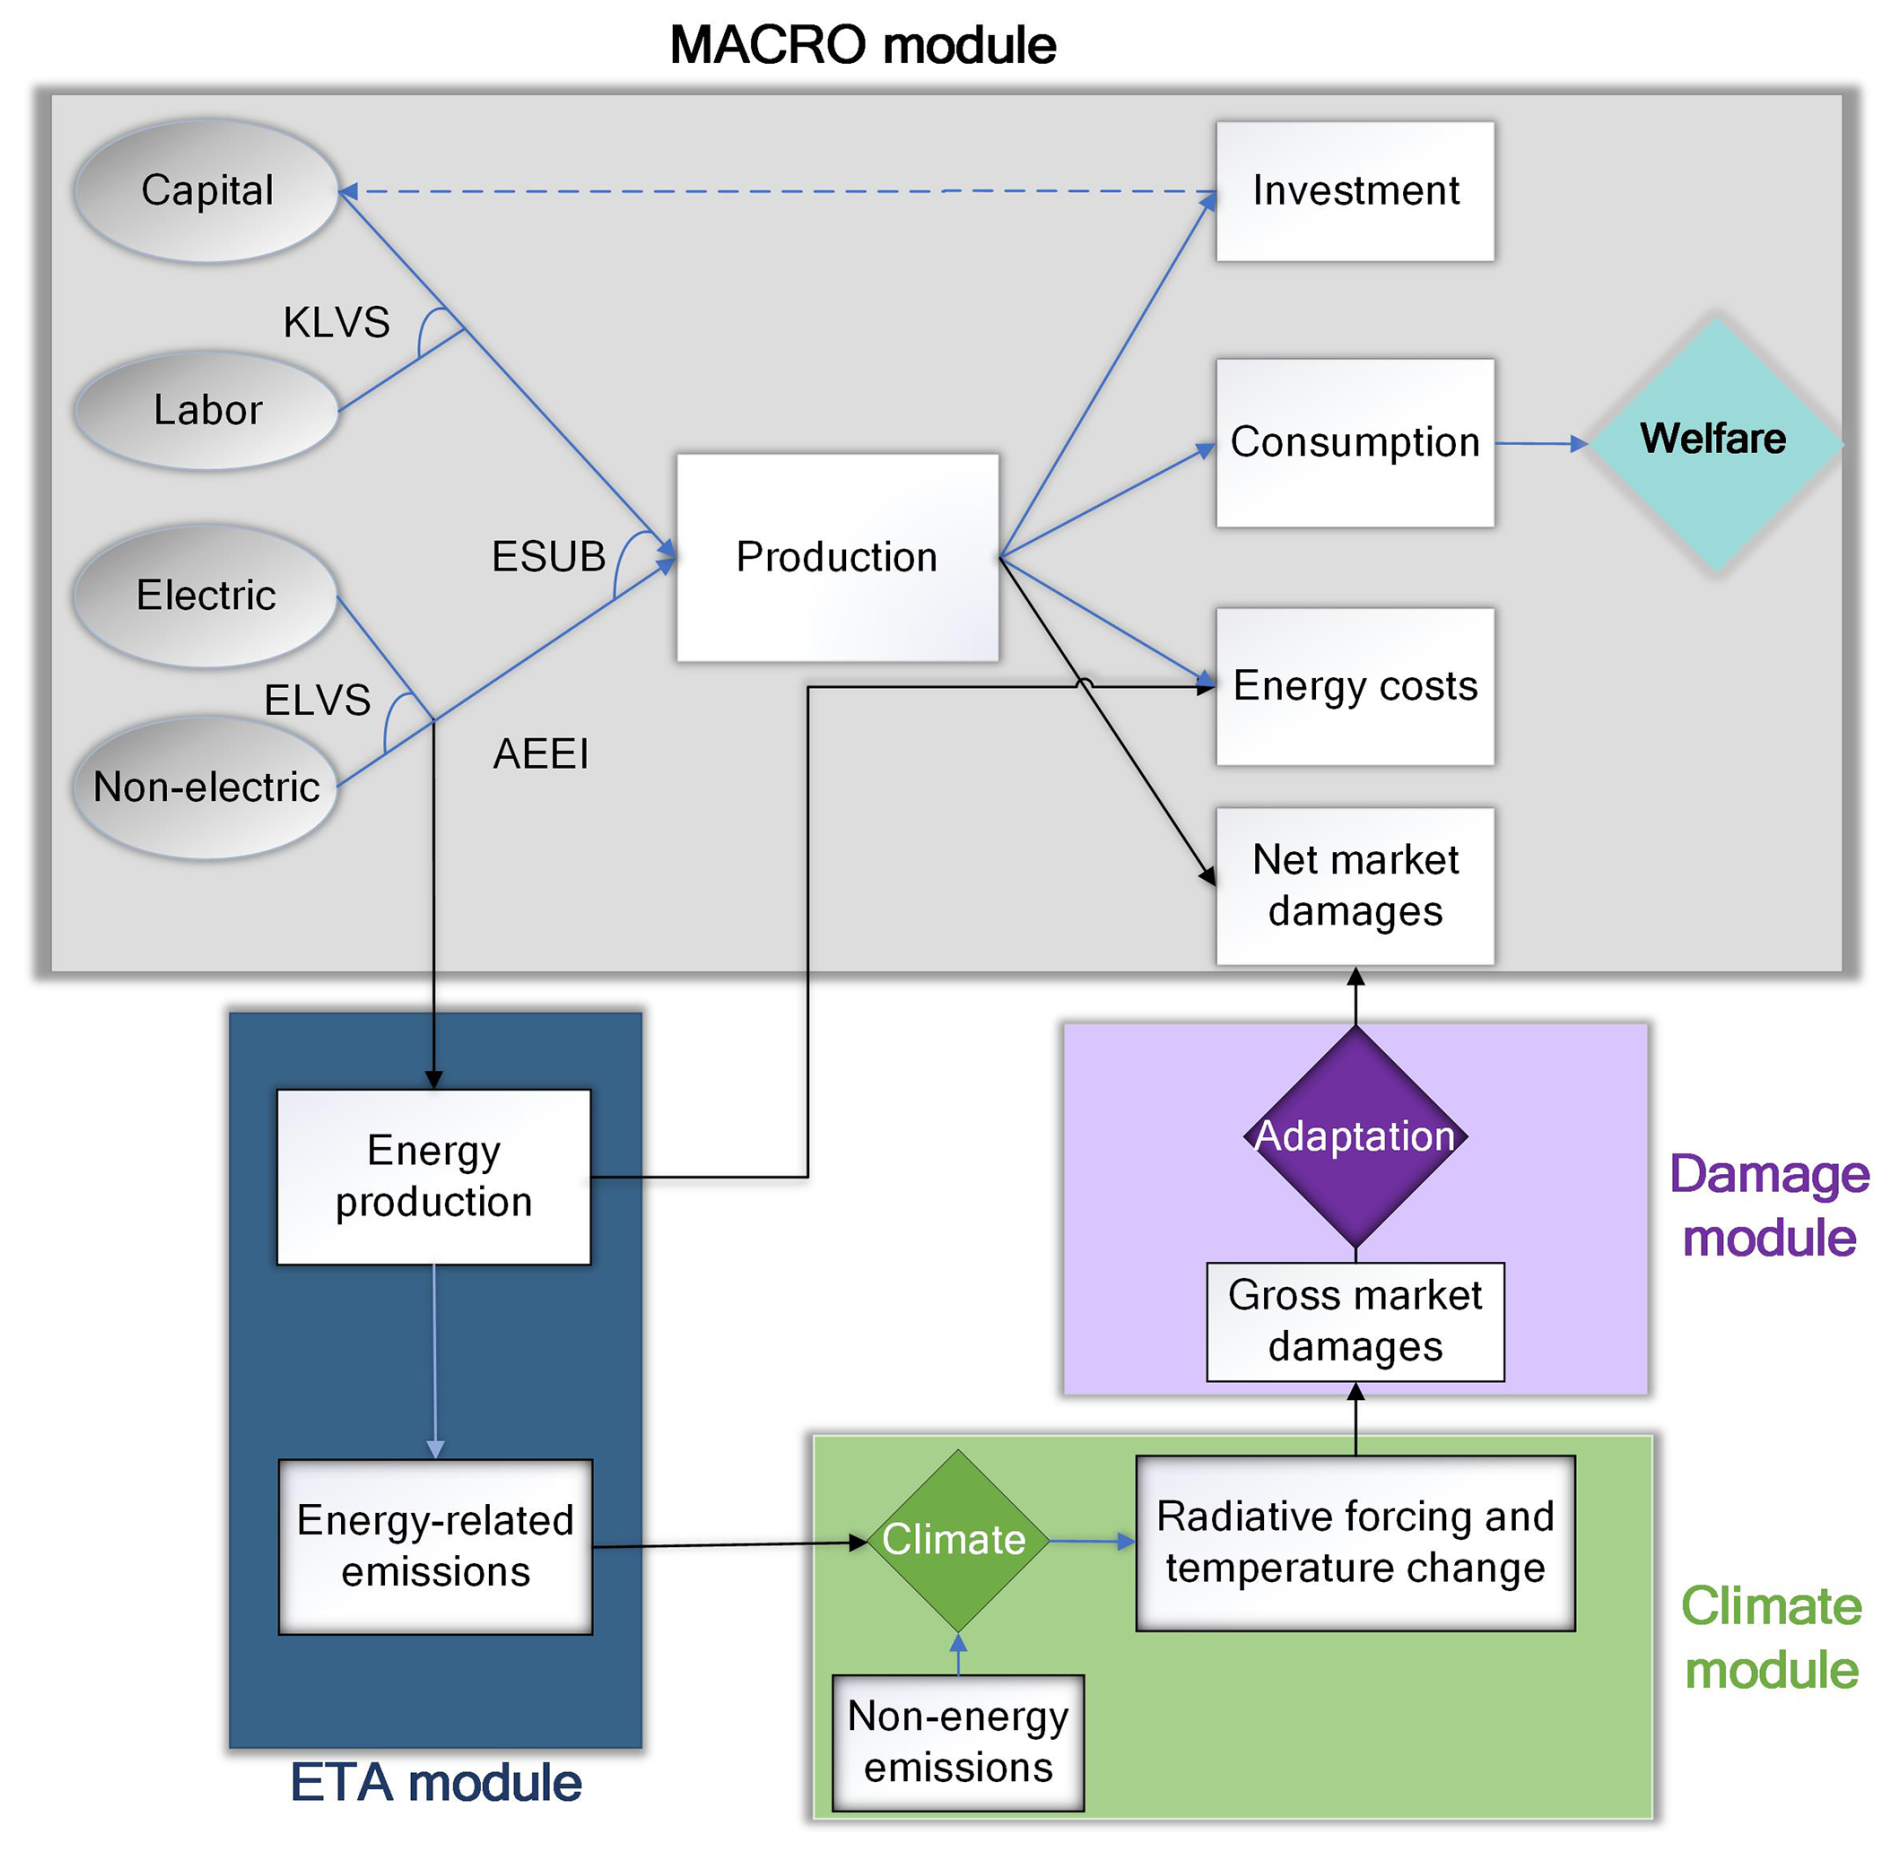
Figure 1Structure of AD-MERGE comprises four modules. In the Macro module, AEEI stands for autonomous energy efficiencies, whereas ELVS and KLVS are elasticities of substitution among production and factors.
AD-MERGE is formulated as a non-linear optimization problem, designed to optimize a global Negishi welfare function, which aggregates the discounted utility of consumption across regions (Negishi, 1960). The Negishi welfare function adjusts regional utility weights to equalize the marginal utility of income across regions, maximizing overall social welfare while accounting for regional differences (Stanton et al., 2014). The implementation of this welfare formulation in AD-MERGE 2.0, including the calculation and updating of regional Negishi weights, is described in Sect. S2. The Negishi objective provides the welfare aggregation structure used to solve the model, while regional distributional outcomes are examined separately. The economic structure of each region is represented using a Ramsey-Solow framework, which captures the dynamics of optimal long-term economic growth. AD-MERGE follows an intertemporal optimization problem under the assumption of perfect foresight, solving for all time periods simultaneously. The model ensures that supply and demand are balanced in each period through the pricing of traded goods, including energy commodities, and a numeraire, which represents all non-energy production.
Table 1 compares AD-MERGE 2.0 with selected IAMs and provides an overview of how AD-MERGE 2.0's mathematical formulation, climate and damage specifications, carbon dioxide removal (CDR), adaptation treatment, and regional coverage compare with those of other widely used IAMs. The table is not intended to provide an exhaustive taxonomy of IAMs, but rather to situate AD-MERGE 2.0 relative to established frameworks used in climate-policy assessment. An important comparison emphasizes whether existing models provide impact and adaptation representations that are suitable for incorporating adaptation explicitly, including corresponding estimates of gross damages, avoided damages, residual damages, and adaptation costs. Where relevant, the model versions or source references used for the comparison are specified. The information is synthesized from review studies on IAM capabilities, including Füssel (2010), Nikas et al. (2019), and Keppo et al. (2021), and from the Integrated Assessment Modeling Consortium database and model documentation (IAMC, 2024). It is further complemented by model-specific publications and documentation, including de Bruin et al. (2009a), Bahn et al. (2019), Calvin et al. (2019), Fujimori et al. (2017), Emmerling et al. (2016), Aaheim et al. (2018), Hilaire and Bertram (2020), Krey et al. (2020), Zhao et al. (2020), Baumstark et al. (2021), Morrow et al. (2023), Wei (2025), and the main methodological papers associated with each model.
de Bruin et al. (2026)de Bruin et al. (2009a)de Bruin et al. (2009a)Agrawala et al. (2011a, b)Anthoff and Tol (2014)Aaheim et al. (2012)Aaheim et al. (2012)Table 1Structural characteristics of AD-MERGE 2.0 compared with selected IAMs.
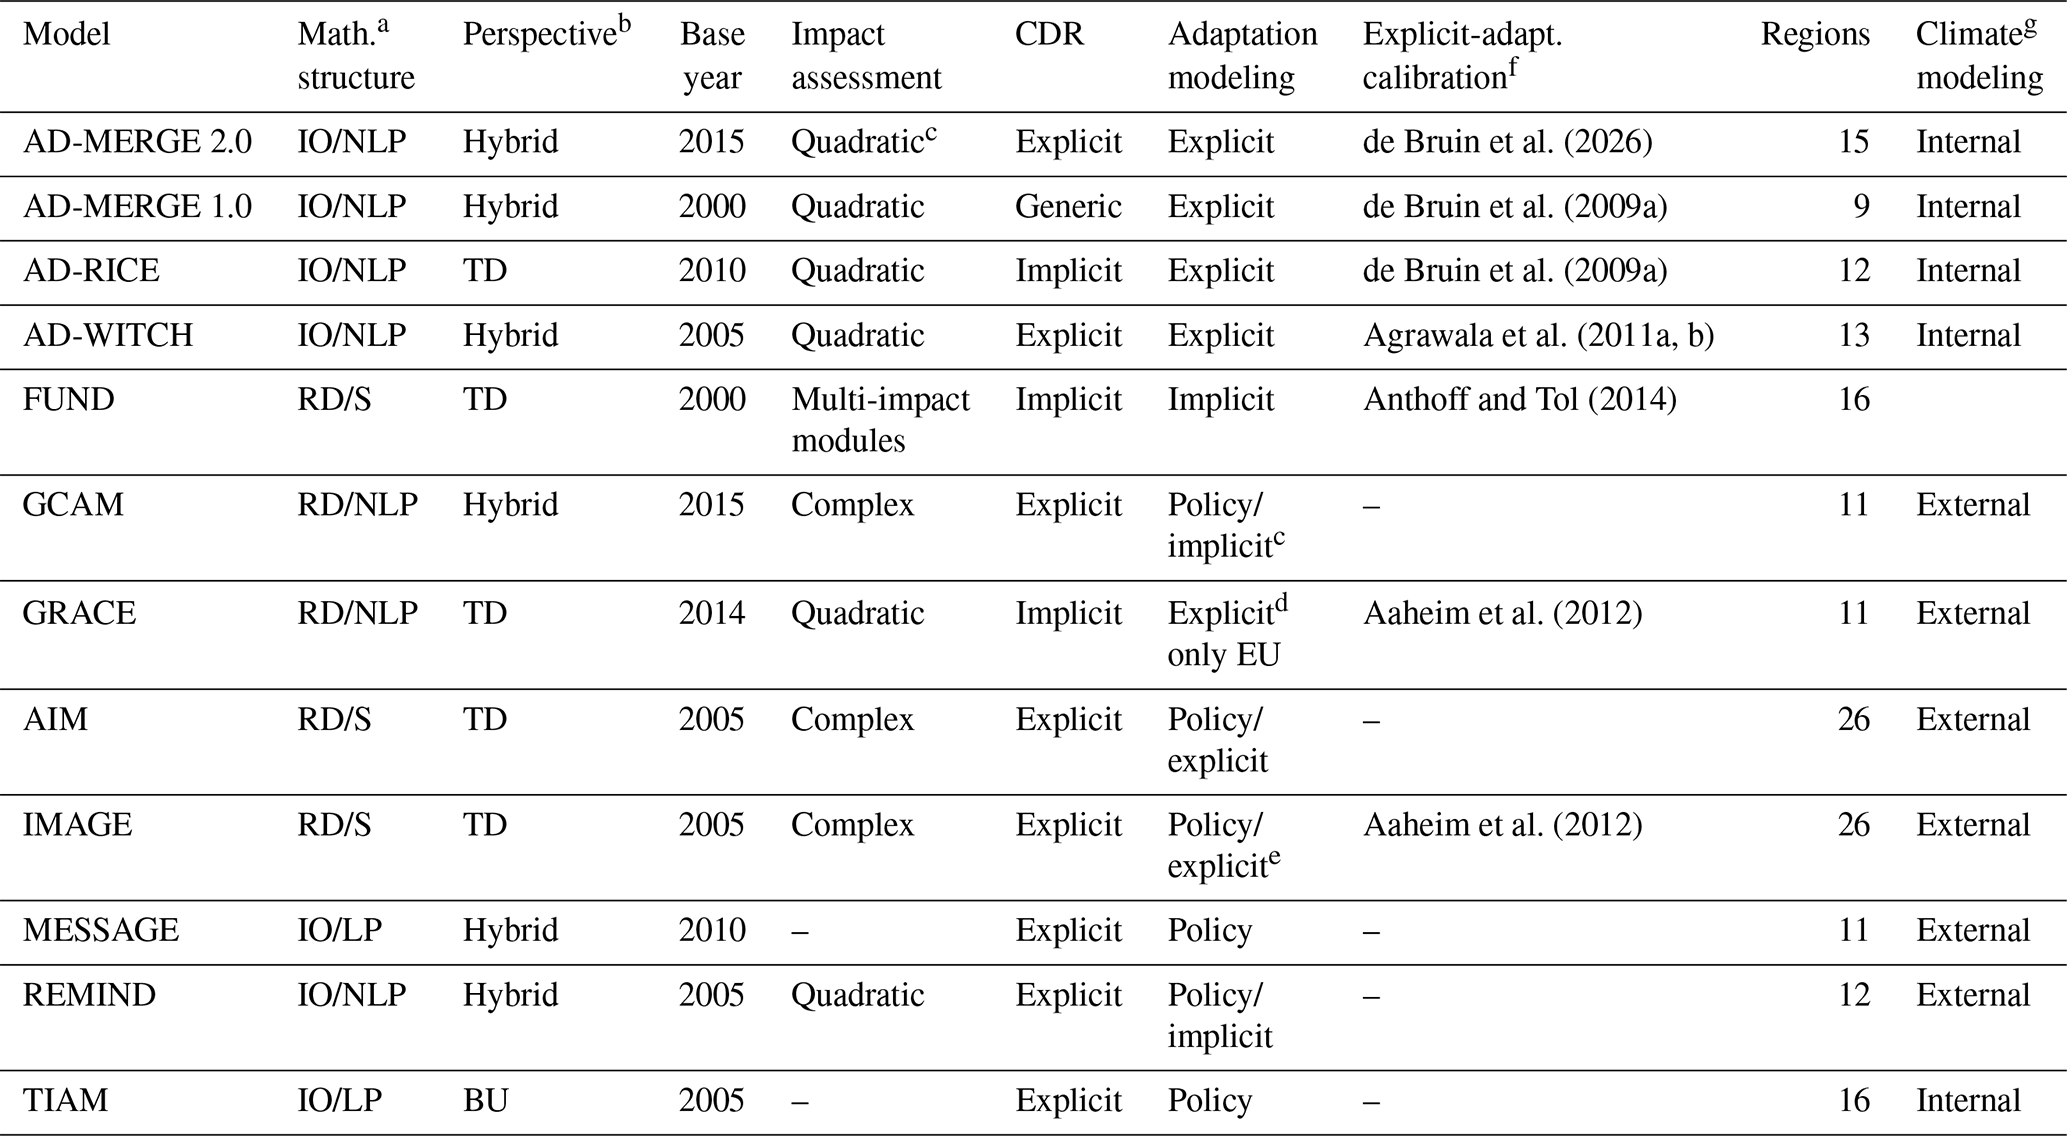
a, b Abbreviations: IO – intertemporal optimization; RD – recursive dynamic; (N)LP – (Non)linear programming; S – simulation; BU – Bottom-up; TD – Top-down; CDR – Carbon Dioxide Removal. c The damage function is characterized as a general nonlinear form, with a quadratic approximation used as shorthand. The only exception is ANZ, where only the nonlinear component is retained. d GRACE only accounts for adaptation in the European economies. e While the core IMAGE framework primarily simulates mitigation and physical impacts, coupling it with the AD-FAIR model enables the explicit accounting of regional adaptation costs, benefits, and residual damages. f Although some models have incorporated new climate impact estimates, adaptation parameters remain largely unrevised, except for sea level rise. g Comparison of climate-modeling approaches, showing the use of external models, often lacking feedbacks, versus internally integrated modules that explicitly capture climate–economy feedbacks.
2.2 Improved regional disaggregation
To achieve a more granular and region-specific representation of the socioeconomic dynamics, the initial nine regions of AD-MERGE have been divided into 15 regions (Fig. 2). The new regional disaggregation enhances AD-MERGE by capturing the diversity of development patterns, challenges, and opportunities across more regions. This improves the model's ability to study regional energy policies, resource management, and the assessment of impacts and adaptation strategies. Several factors, including insights from other IAMs, geographical considerations, political coalitions, and the availability of data have informed this development.
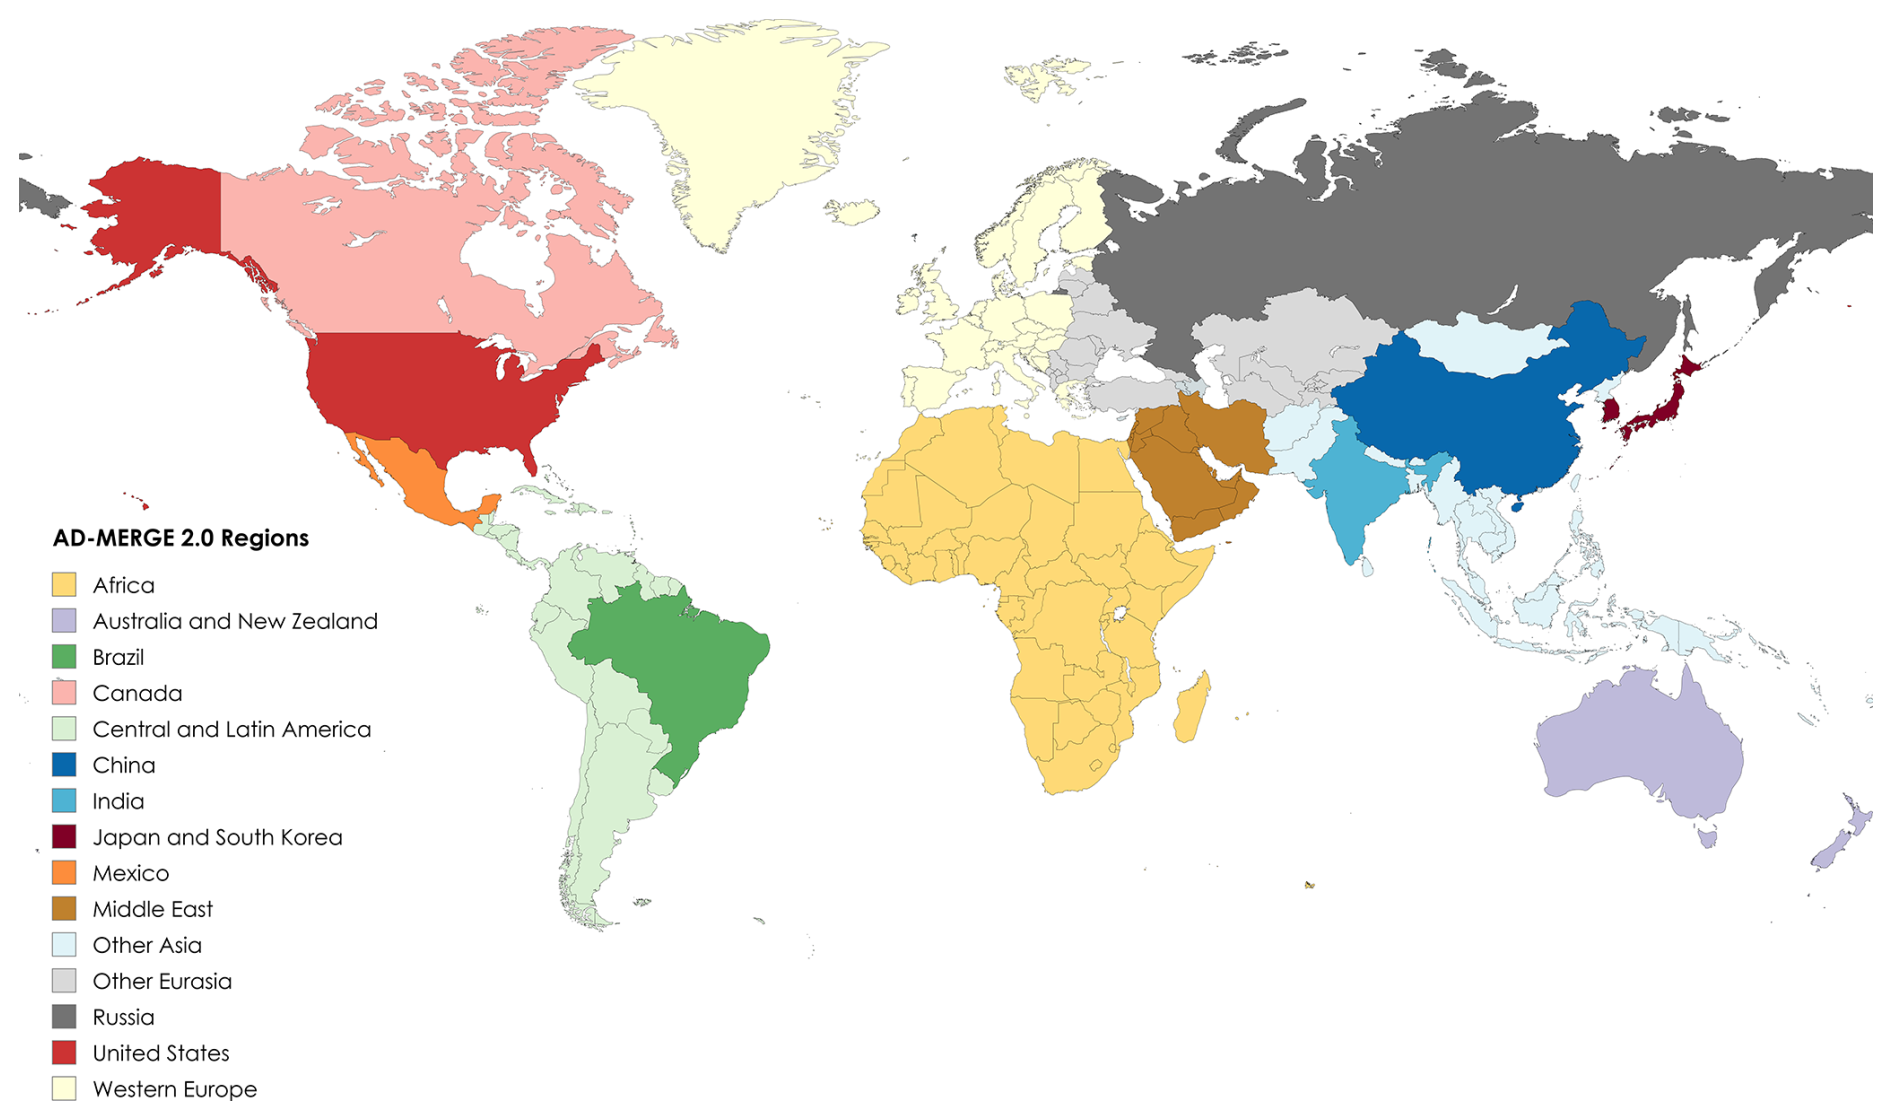
Figure 2AD-MERGE 2.0 new regional disaggregation that considers 15 regions of individual countries or groups of countries. Created using MapChart (https://www.mapchart.net/index.html, last access: 1 March 2026).
As part of this refined disaggregation, large countries such as Canada (CAN), Mexico (MEX), Brazil (BRA), and Russia (RUS) are now represented as standalone regions. This update complements the original AD-MERGE model, where major economies such as the United States (USA), China (CHN), and India (IND) were already treated as separate regions. Australia and New Zealand, previously aggregated with Canada in the “Canada, Australia, and New Zealand” region, are now represented as a separate region (ANZ), distinctively. Furthermore, previously grouped “Eastern Europe and the former Soviet Union” have been divided into two distinct regions, Russia and Eurasia (OEA). Finally, the “rest of the world group” is disaggregated into three distinct continental groups: Central and Latin America (CLA), Africa (AFR), and other Asian countries (OAS). Moreover, new regions such as Japan and South Korea (JSK) and the Middle East (MEA) have been introduced, while Western Europe (WEU) continues to be represented in the model. Table A1 presents the list of newly defined regions, their abbreviations, and descriptions of the countries included within each region.
2.3 Enhanced energy system modeling
The ETA module is critical in modeling the conversion of primary energy sources into secondary energy carriers through a variety of energy conversion technologies. In AD-MERGE, 20 distinct energy conversion technologies were incorporated within the model, each competing to provide various types of secondary energy. In AD-MERGE 2.0, these technologies have been extended to 36 distinct energy conversion technologies, including nine new power generation technologies and five new hydrogen generation technologies (as shown in Fig. 3).
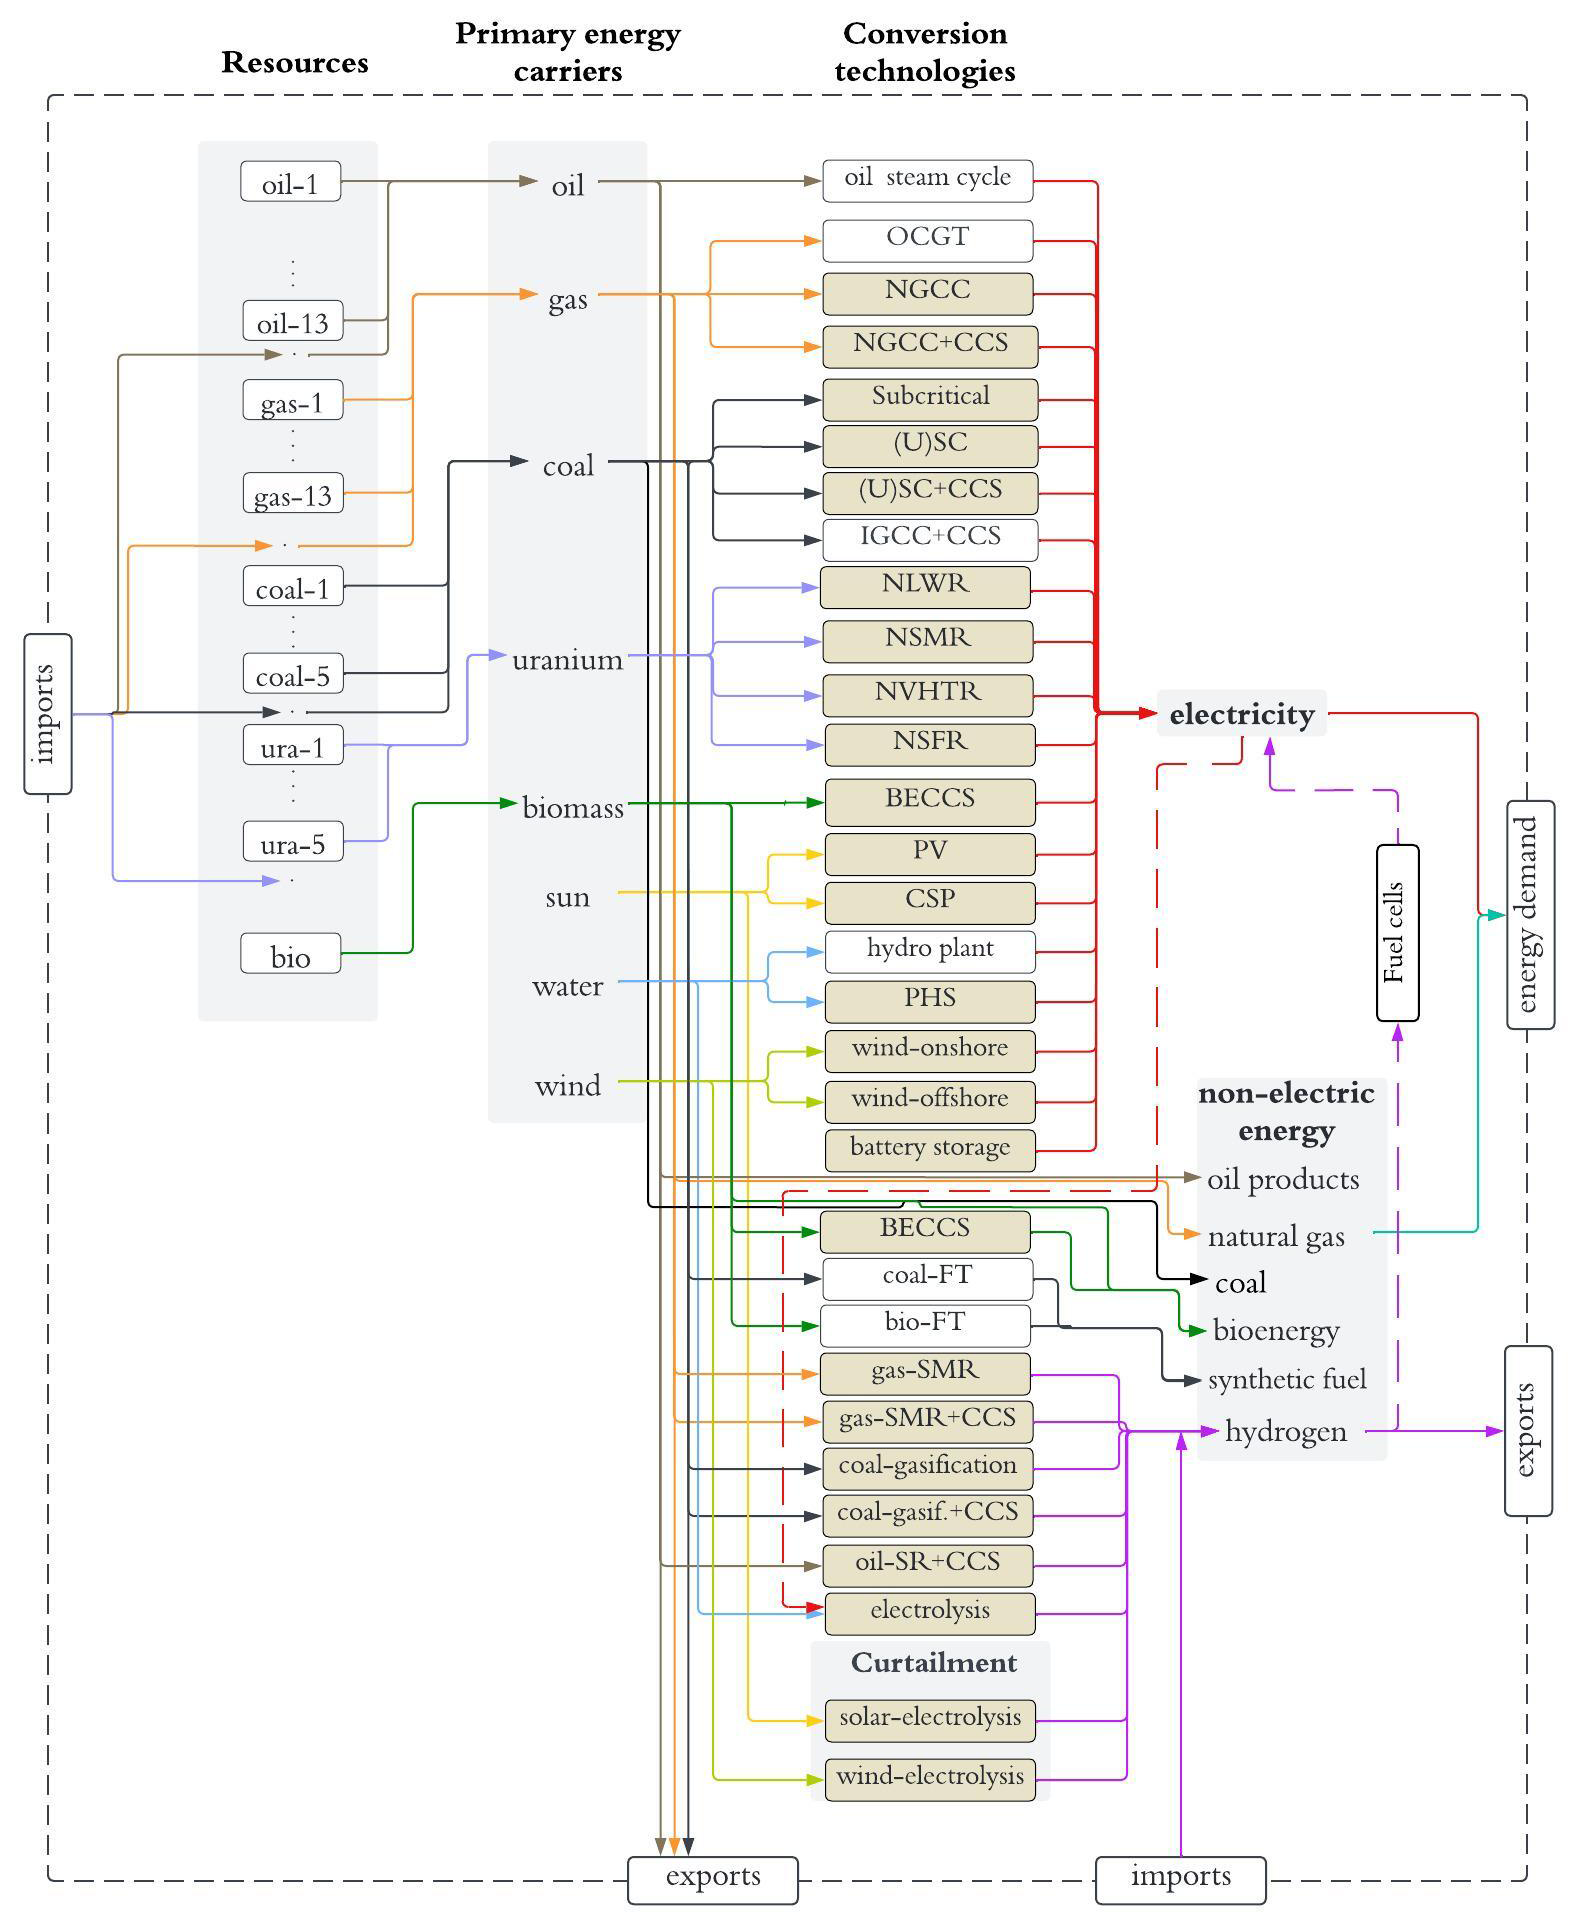
Figure 3Reference energy system for AD-MERGE 2.0. In this figure, key technologies are represented by the following acronyms: OCGT (Open Cycle Gas Turbine), NGCC (Natural Gas Combined Cycle), CCS (Carbon Capture and Sequestration), (U)SC ((Ultra) Supercritical), IGCC (Integrated Gasification Combined Cycle), NLWR (Conventional Light Water), NSMR (Small Modular units), NVHTR (Very High Temperature process heat), NSFR (advanced fast-spectrum design), BECSS (BioEnergy with CCS), PV (Photovoltaics), CSP (Concentrated Solar Power), PHS (Pumped Hydro Storage), FT (Fischer–Tropsch synthesis), SMR (Steam Methane Reforming), SR (Steam Reforming). New technologies are highlighted in oat color.
In earlier model versions, renewable technologies were grouped under broad categories of “advanced high-” and “low-cost” technologies, which included an aggregated representation of carbon-free options such as modern nuclear, biomass, wind, and solar. AD-MERGE 2.0 replaces these generic carbon-free technologies with specific technologies, including solar photovoltaics (PV), concentrated solar power (CSP), bioenergy with CCS (BECCS), onshore and offshore wind, and distinct nuclear technologies. Furthermore, AD-MERGE 2.0's power sector now features explicit fossil fuel technology options. Natural gas technologies are differentiated into combined-cycle and open-cycle gas turbines, with the option for combined-cycle to be paired with carbon capture and sequestration (CCS). Additionally, coal technologies now distinguish between subcritical, supercritical, and ultra-supercritical technologies, which can also be equipped with CCS. The model also includes battery storage and pumped hydro storage (PHS), considering short-term and seasonal storage derived from curtailment.
The new AD-MERGE 2.0 framework employs a granular approach to resource characterization, categorizing oil and gas into 13 extraction cost tiers, where categories 1 to 10 denote conventional sources, and 11 to 13 represent unconventional reserves. Coal is divided into five cost categories that include bituminous, sub-bituminous, and lignite extraction costs with a similar approach to Rochedo (2016). To ensure consistency between resource inputs and nuclear technologies electricity generation, the model tracks aggregated macro-level fuel resource consumption, thermal efficiency parameters, and associated long-term waste management requirements with a similar approach to Marcucci and Turton (2012). The energy reserves and resources estimates incorporate the latest data from IEA (2017) and BGR (2022).
2.3.1 Integration of hydrogen
Alternative hydrogen production technologies, with and without carbon capture and sequestration (CCS), utilizing diverse feedstocks such as natural gas, coal, and electricity, have been modeled in AD-MERGE 2.0 (see again Fig. 3). Techno-economic data, including levelized cost of hydrogen production, efficiency, and emission profiles for each technology, have been computed using the H2A tool (NREL, 2023). This has involved removing fuel costs from the calculations, as the model endogenously accounts for them. The model incorporates steam methane reforming of natural gas, a widely utilized process for hydrogen production without CCS (Lewis et al., 2022). Furthermore, the model now simulates steam methane reforming of natural gas with CCS, capturing 96 % of carbon as CO2 (Lewis et al., 2022). For coal-based hydrogen production, the model simulates the water shift reaction of syngas from coal gasification, including a version with CCS to capture 91 % of emitted CO2 (Lewis et al., 2022).
The model includes two types of electrolysis for hydrogen production; the first is a dedicated plant used exclusively for generating hydrogen. It incorporates electrolysis using a state-of-the-art polymer electrolyte membrane electrolyzer (DOE, 2020) to split water into hydrogen and oxygen, a critical process for leveraging electricity from renewable sources. The second option is a flexible electrolysis system, which uses surplus or curtailed electricity from VRE to produce hydrogen. The latter plant's operational capacity factor is dynamically determined by the extent of electricity curtailment, meaning that higher curtailment levels directly translate into increased power to hydrogen conversion. Information on hydrogen production capacities and consumption in each region in the base year has been gathered from various international and national reports, including the IEA's Global Hydrogen Reviews (International Energy Agency, 2022; IEA, 2023a), the IEA's World Energy Outlook (IEA, 2023b), the Hydrogen Council's Global Hydrogen Flows report (Hydrogen Council, 2022), and NRCan's Hydrogen Strategy for Canada (NRCan, 2020).
2.3.2 Modeling of VRE dynamics
AD-MERGE 2.0 now adopts a more practical approach for evaluating VRE technologies by explicitly Solar PV, offshore, and onshore wind. The solar energy variables are classified into seven classes and two distance ranges from the grid, capturing unique characteristics and variability of solar energy generation. This approach is implemented for both solar PV and CSP with battery storage. We derived the data on the maximum resource potentials in each region from Pietzcker et al. (2014). These supply curves account for full load hours and are divided into different classes for PV and CSP for different distances from the grid (near and far). Wind technologies are also divided into offshore and onshore, each classified into nine different classes. This classification is based on the estimated wind energy supply curves estimated by Eurek et al. (2017). We consider these curves to determine the regional resource potential considering: (i) capacity factor, (ii) distance from the grid (near, mid, and far), and (iii) sea depth for the offshore wind (shallow, transitional, and deep). This classification enables a granular evaluation of solar and wind installations, allowing for a detailed analysis of the energy output potential in different geographical locations. The cost and performance data for VRE technologies have been derived from NREL (2021), while the regional cost differences are based on IRENA (2023).
Beyond characterizing regional VRE potentials, a key challenge lies in accurately capturing how these technologies interact with the power system. Therefore, assessing the impact of VRE on power systems within IAMs poses significant challenges due to the mismatches in time and location between VRE supply and electricity demand. The complexity of power systems further complicates this, often resulting in a limited representation of integration costs and system feasibility within IAMs (Ueckerdt et al., 2015; Gong et al., 2023; Parrado-Hernando et al., 2022). Some of the essential adjustments include reliable reserve capacity, enhanced operational flexibility, VRE curtailment management, and expansion of the transmission and grid infrastructure (Pietzcker et al., 2017; IEA, 2020b). Despite the complexities, IAMs and energy system models often represent these integration costs through direct integration (Carrara and Marangoni, 2017), where the relevant dynamics and costs are embedded directly within the model structure and equations. Direct integration enhances model accuracy through improved temporal, technical and spatial aspects and incorporates equations that simulate these impacts. Another approach is soft-linking or coupling, which connects detailed energy system models with IAMs for improved power system analysis (Ueckerdt et al., 2017; Gong et al., 2023).
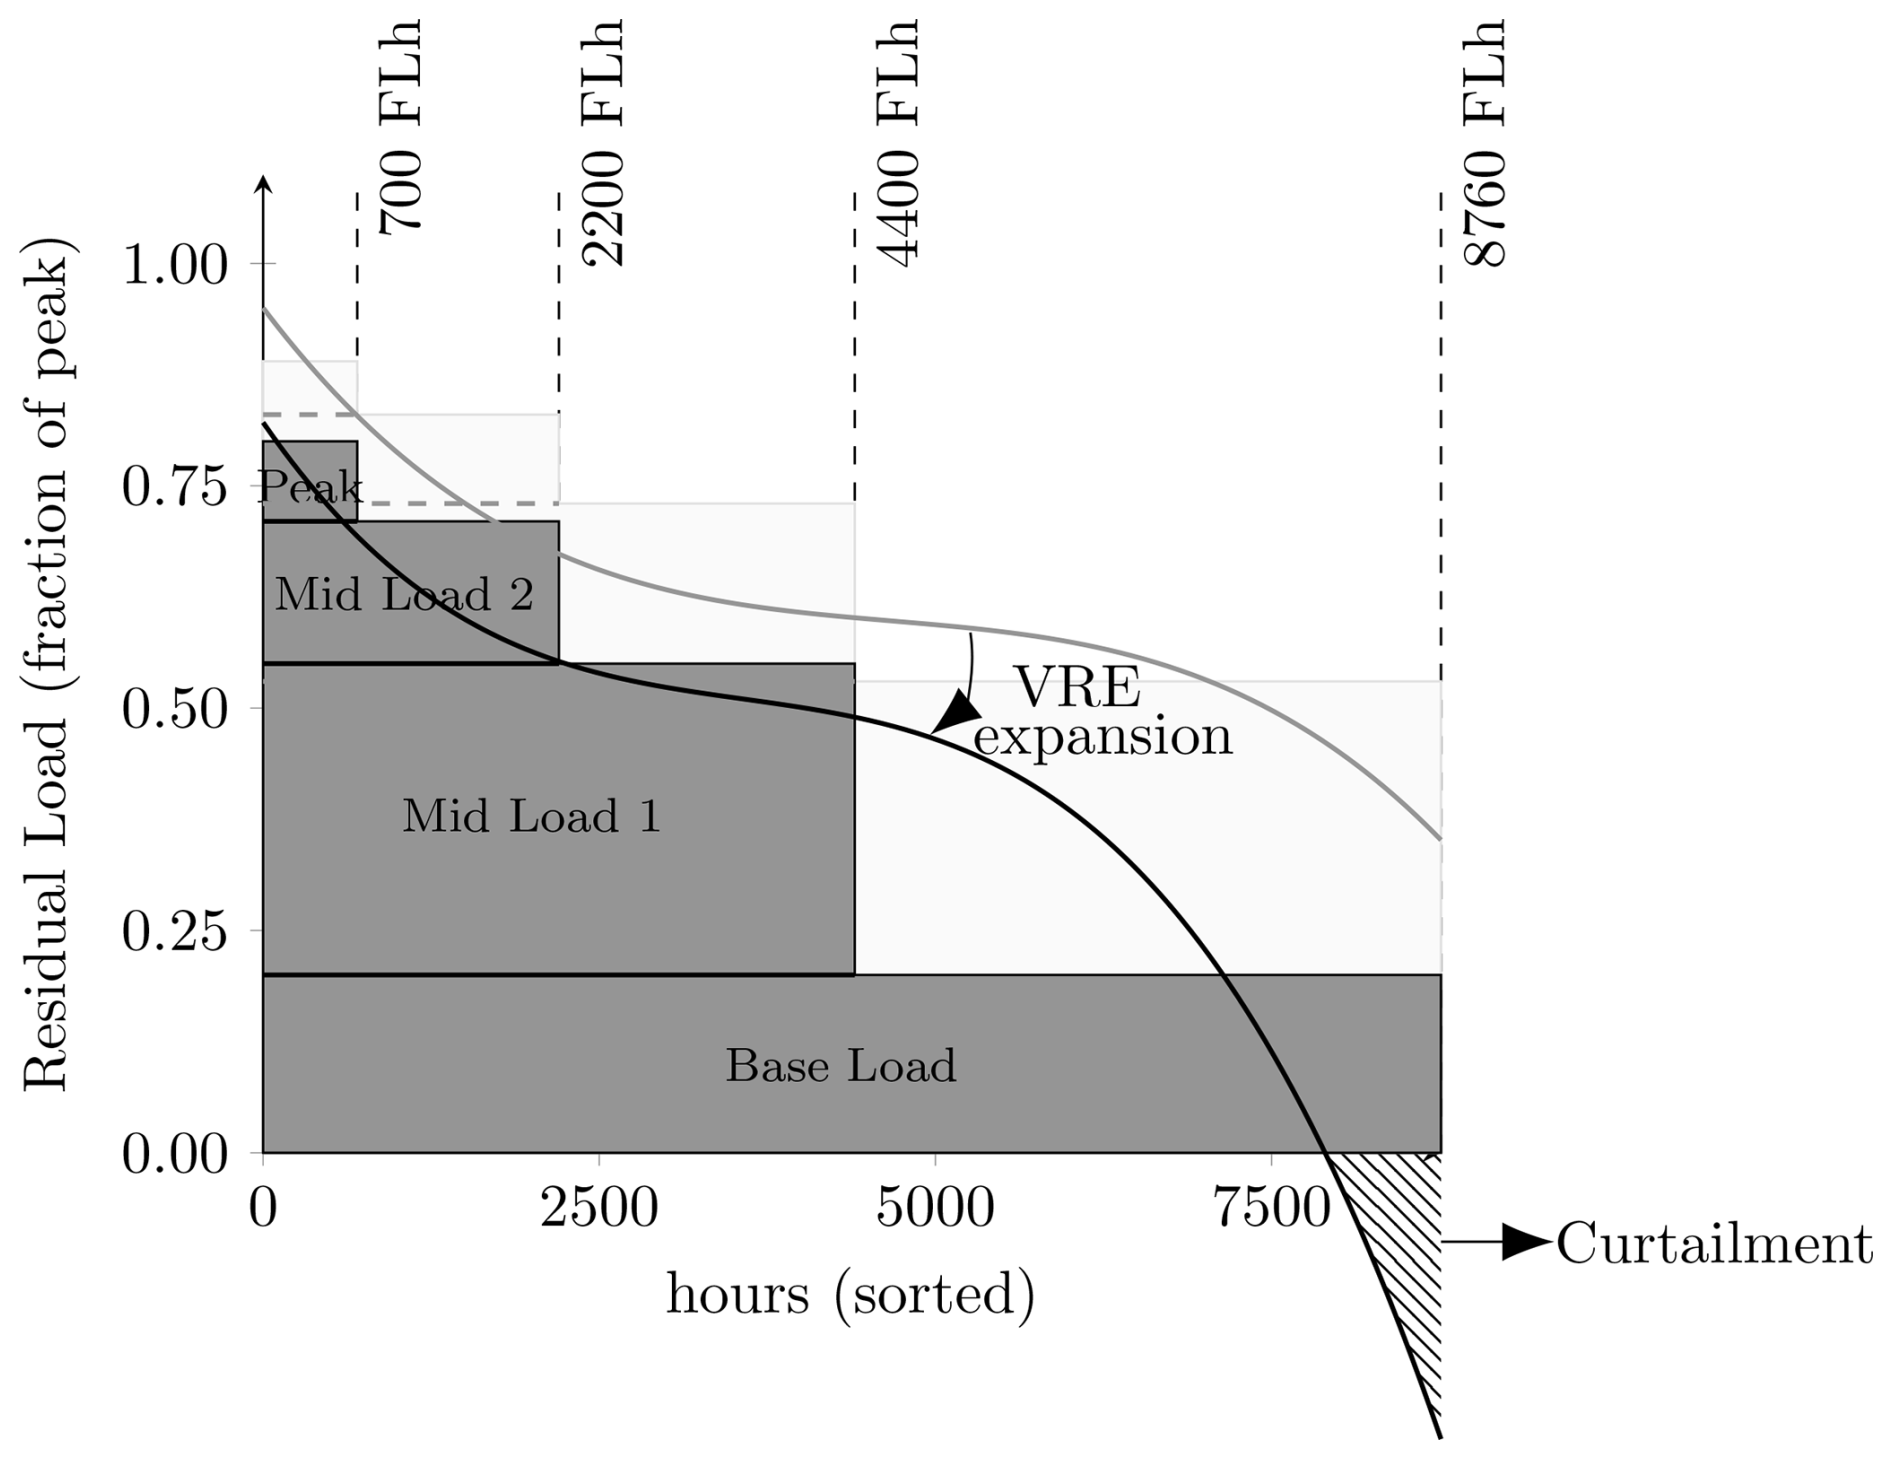
Figure 4The effect of variable renewable energy (VRE) expansion at about 10 % share to 50 % share in total annual load on the residual load duration curve (RLDC). This figure is adopted from Ueckerdt et al. (2017).
To address identified limitations, AD-MERGE 2.0 employs several mechanisms to directly integrate VRE into the power system. Drawing on the framework presented by Pietzcker et al. (2017), which identified 18 key dynamics and five broader categories for VRE integration in IAMs, our model incorporates 11 of these dynamics. Specific integrated features include flexibility constraints, a Residual Load Duration Curve (RLDC) method for finer temporal analysis, short-term and seasonal storage representation, and grid cost adjustments (see Fig. 4). These features are incorporated within all five broader categories: investment dynamics, power system operation, temporal matching of VRE and demand, storage, and grid. Together, these mechanisms enable AD-MERGE 2.0 to more accurately capture the operational and economic implications of integrating high shares of renewable energy.
-
Flexibility constraints are crucial for adapting electricity systems to fluctuating loads, as they allow for more efficient use of VRE generation and mitigate costs associated with curtailment, congestion, and load shedding (Sullivan et al., 2013; Joos and Staffell, 2018; Miri et al., 2022). However, IAMs with long time steps often overlook short-term flexibility needs, potentially overestimating VRE integration (Sullivan et al., 2013). Incorporating these constraints into IAMs is essential for accurately representing the challenges of integrating high shares of VRE into the energy system. For mathematical details, see Appendix B1.
-
Residual Load Duration Curve (RLDC) has been integrated into AD-MERGE 2.0 to better represent the temporal aspects of electricity generation and demand. RLDCs provide a reordered representation of the residual load, the demand remaining after accounting for VRE generation, highlighting the necessity for dispatchable power plants to fill these gaps (Ueckerdt et al., 2015). Following the RLDC parameterization approach of Ueckerdt et al. (2017), load bands are constructed to define peak load and estimate VRE curtailment levels (see Fig. 4). In addition, storage capacities and costs are also parameterized based on the regional VRE share. The RLDC and storage parameters are modeled using a third-order polynomial that accounts for the contributions of solar PV and wind energy to the overall load.
Curtailment in electricity systems occurs when excess electricity production surpasses demand or storage capacity. This issue is traditionally managed through the strategic operation of dispatchable power plants that can quickly adapt to fluctuations (Johnson et al., 2017). However, the increasing adoption of VRE complicates this process, as excess generation cannot be managed solely through system flexibility enhancements (Ueckerdt et al., 2017; McPherson et al., 2018). To address this, the model now incorporates short-term and seasonal storage solutions, such as electricity storage and conversion into hydrogen via electrolysis, to utilize surplus energy from curtailment.
In AD-MERGE 2.0, storage plays a critical role in mitigating curtailment and enhancing system flexibility. Short-term storage from curtailment contributes to system flexibility, while seasonal storage involves using surplus electricity to produce hydrogen, which can be used in different sectors or hydrogen turbines. The model also includes PHS and grid-scale battery storage, each offering distinct advantages such as scalability, low maintenance, and versatility. In 2021, PHS accounted for over 90 % of total global electricity storage (IEA, 2020b). PHS dominates global electricity storage when hydro reservoirs are excluded. Meanwhile, grid-scale battery storage is advancing rapidly (Schoenfisch and Dasgupta, 2023). This trend underscores the growing importance of both pumped hydro and battery storage in the energy sector to balance short-term fluctuations, stabilize the grid, and manage peak loads.
-
Grid cost adjustment in IAMs is essential to accurately reflect the economic and logistical challenges of integrating VRE into the power system. For the grid infrastructure, we assume the presence of a developed AC grid capable of efficiently distributing electricity across smaller spatial scales. The costs for this portion of the grid are assumed to depend on total electricity demand, independent of VRE deployment, and are considered as linear markups applied uniformly across all generation technologies as levelized costs, regardless of generation type.
The additional costs of integrating VRE into the grid are represented by accounting for transmission line expenses, which are calculated for each region and time period. As VRE penetration increases, the system requires enhanced interconnections to manage variability, reduce curtailment, and improve dispatchability (IEA, 2020b). Therefore, in addition to the expenses of VRE transmission due to the spatial distance between generation sites and grid infrastructure, adjustments to grid capital costs are also incorporated. Specifically, grid capital cost for VRE is adjusted based on their share in the energy mix, using an exponential function to reflect the non-linear impact of higher VRE integration on grid infrastructure costs based on Luderer et al. (2015). A detailed mathematical formulation is given in the Appendix B2.
2.4 Modeling of direct air carbon capture and storage
DACCS offers a promising approach to remove CO2 directly from ambient air and store it, which facilitates offsetting emissions from hard-to-abate sectors. In current IAMs, DACCS has been shown to contribute significantly to achieving mitigation pathways and building negative emissions portfolios (Fuhrman et al., 2019; Realmonte et al., 2019; Morrow et al., 2023; Motlaghzadeh et al., 2023). In our model, we represent two DACCS technologies: a liquid-scrubbing process (e.g., hydroxide–carbonate) and a solid‐sorbent process (e.g., temperature vacuum swing adsorption, TVSA), based on the latest literature and their technological readiness (Bouaboula et al., 2024). Each technology is characterized by the corresponding energy use, efficiency, and levelized costs over time, reflecting the assumed cost reductions. Appendix C provides the assumptions and parameter values. Our modeling framework endogenously selects between liquid and solid DAC technologies, representing their competition with other mitigation and removal options. Furthermore, the model integrates additional negative emissions strategies, such as BECCS and afforestation, to comprehensively evaluate pathways towards more stringent carbon targets. BECCS is represented within the energy system module using broad regional resource potential and techno-economic assumptions. However, AD-MERGE 2.0 does not include an explicit endogenous land-use framework that allocates land across competing uses such as food production, bioenergy crops, and forests. Accordingly, land-use change, land competition, and land availability are not modeled directly, and afforestation and bioenergy expansion are not linked through a shared land-allocation structure. CDR deployment should therefore be interpreted as conditional on aggregated regional potential assumptions rather than as a full assessment of land-use feasibility under explicit competing land demands.
2.5 Damage and adaptation modeling
AD-MERGE 2.0 builds on the stock and flow framework of de Bruin et al. (2009b) and Agrawala et al. (2012). The “optimal adaptation” serves as a theoretical benchmark rather than a policy forecast. As noted by the AR6 WGII report (IPCC, 2022b; UNEP, 2025), real-world adaptation is constrained by local institutional barriers and varying adaptive capacities. By modeling adaptation as an explicit capital stock, rather than a reduced-form percentage of GDP, our approach captures the opportunity costs and investment inertia inherent in climate resilience. This structural detail is essential for analyzing the energy-climate-adaptation nexus, as it reveals how adaptation investments may compete with the capital flows required for mitigation (Bastien-Olvera and Moore, 2021).
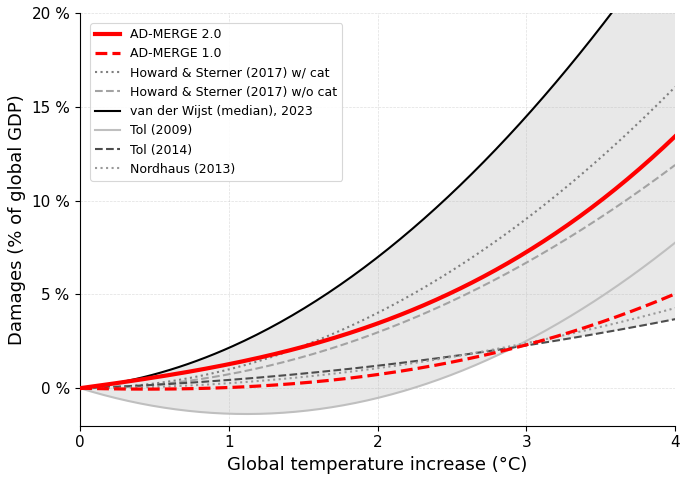
In AD-MERGE 2.0, the impacts of climate change and the costs and benefits of adaptation were calibrated across the 15 regions included in our analysis (detailed in de Bruin et al., 2026). It distinguishes between reactive and proactive adaptation. Reactive adaptation covers reaction to climate change stimuli, whose costs and benefits are confined to the current period and do not carry over; in our model, these measures are treated as flow variables reflecting decentralized, low-investment actions. Proactive adaptation, in contrast, involves large-scale anticipatory investments that incur upfront costs and generate a stock of adaptation whose benefits unfold over multiple future periods. The adaptation stock is modeled as a form of capital that depreciates over time and is treated as a regional public good, as its costs and benefits extend beyond individual decision-makers. Together, these two modeling approaches capture both immediate individual-level coping strategies and long-term collective resilience measures consistently across all 15 regions.
Existing damage assessments provide useful benchmarks for different parts of the calibration. Empirical macroeconomic studies such as Burke et al. (2015, 2018) and meta-analyses such as Howard and Sterner (2017) and Tol (2024) inform the broader comparison of aggregate damage-function severity, while sectorally disaggregated assessments such as COACCH damage function (Bosello et al., 2021) provide direct evidence for impact-specific damage calibration. However, these studies generally do not provide explicit adaptation-cost and effectiveness estimates; they are primarily used to benchmark climate damages, while adaptation calibration relies on more limited impact-specific evidence and model-specific assumptions. The objective here is to derive regionally aggregated damage and adaptation relationships that are consistent with the AD-MERGE 2.0 structure and suitable for calibrating both reactive and proactive adaptation, thereby allowing these adaptation responses to be represented explicitly as decision variables and studied jointly with mitigation and climate damages.
The gross damage and adaptation functions in AD-MERGE 2.0 are calibrated using the same functional form as in Bahn et al. (2019). This functional form and the calibration procedure are described in Appendix D. The assessment focuses on six climate impacts for which there are reliable regional data. These impacts are river flooding, total energy demand, coastal impacts, labor productivity, health, and tourism. The data sources used to quantify each impact are documented in de Bruin et al. (2026) and summarized in Table D1. For each impact in a specific region, a relationship was estimated over temperature and economic growth to allow more data points. Impacts in a specific region were then aggregated for different levels of temperature change and economic growth. Based on these observations, a regional damage curve was parameterized to reflect relationships between temperature change and economic losses as a percentage of GDP. Specifying losses as a percentage of GDP allows us to incorporate the effect of economic growth on total economic costs.
Figure 5 presents a comparative assessment of global damage functions, illustrating climate-induced economic losses as a percentage of GDP under a no-adaptation assumption. The revised damage curve in AD-MERGE 2.0 reflects the integration of recent estimates of sectoral and regional vulnerabilities, leading to a more pronounced increase in economic losses with rising temperatures. The updated curve exhibits mid- to high-end estimates from the literature, such as Howard and Sterner (2017), and projects a higher damage trajectory than the earlier AD-MERGE 1.0 version, which is closer to the more conservative projections of Nordhaus (2013). This upward shift in damage estimates suggests greater sensitivity of economic outcomes to warming, underscoring the importance of accounting for heterogeneous sectoral and regional impacts in integrated assessment modeling and of regularly updating damage estimates in IAMs. The corresponding regional damage functions (Appendix D, Fig. D1a).
When calibrating adaptation, we estimate the costs and benefits of each form of adaptation, namely stock (reactive) and flow (proactive) (see de Bruin et al., 2026). The costs are given as a percentage of GDP, whereas the benefits are given as a fraction of gross damages avoided. This is referred to as the level of adaptation and represents the difference between gross and residual damages. Then, optimal adaptation levels and concomitant adaptation costs are estimated for each impact for a specific region and adaptation type based on data or other literature. A maximum level of adaptation is also estimated, reflecting the point at which the adaptation cost function would become extremely high. An adaptation cost and benefits function over temperature is estimated per impact in a specific region. Adaptation costs and benefits are then aggregated over impacts for each region, and adaptation coefficients are calibrated to capture these estimates. Accordingly, the resulting optimal adaptation levels should be interpreted as benchmark outcomes within the model structure under idealized implementation assumptions, rather than as directly achievable policy targets.
3.1 Model calibration and validation
The IPCC uses the SSP, RCP and C1–C8 warming categories to describe potential socioeconomic futures and climate scenarios collectively. The SSPs outline distinct socio-economic futures that influence the drivers of GHG emissions and thereby the resulting radiative forcing levels (RCPs) used in climate scenarios. The RCPs describe the potential atmospheric concentrations of GHGs. In the AR6 framework, the temperature categories C1–C8 distinguish these scenarios based on their projected temperature outcomes by the end of the 21st century relative to the pre-industrial era (1850–1900). The AR6 scenario ensemble includes a diverse set of quantitative scenarios developed by different modeling groups, using various frameworks that incorporate these SSP, RCP, and C-category structures.
AD-MERGE 2.0 is calibrated using 2015 as the base year and aligns with the SSP version 3.0 demographic and economic projections from 2015 through 2100, ensuring consistency with the latest available SSP datasets (IIASA, 2024b). Specifically, the model integrates the most recent population projections from the SSP2 scenario provided by KC et al. (2024) and incorporates GDP trajectories based on estimates by Cuaresma (2017). The new calibration also involved revising key model parameters and adjusting variables, including base year values for primary and secondary energy production, existing production capacities, and total trade volumes, based on IEA (2023c). Emission-related variables, such as global warming potentials, cumulative emissions in the base year, energy and non-energy emissions, and radiative forcing, were updated using data from AR6 WGI report (Forster et al., 2021) and Synthesis Report (IPCC, 2023). In addition to hydrogen (see Sect. 2.3.1) and VRE (see Sect. 2.3.2), the technical parameters for other emerging technologies were revised based on IEA (2020a). To assess consistency, the AD-MERGE 2.0 Baseline scenario results were compared with the SSP2 scenario of the AR6 database (Byers et al., 2022), with a particular focus on warming levels categories C7–C8, as these categories correspond to our baseline emission and temperature trajectories.
Figure 6a presents total GHG emission projections. In AD-MERGE 1.0, which uses 2000 as a base year, the projected emissions are well below the observed emissions for 2015 and 2020 (see “Baseline 1.0” in the figure). Afterwards, emissions increase steadily to a level approaching an RCP8.5 scenario. The emissions estimates from the updated AD-MERGE 2.0 (see “Baseline 2.0” in the figure) are consistent with the observed emissions in 2015 and 2020 and follow the RCP7.0 scenario closely over time (see “SSP3-7.0” in the figure). In this figure, the warming categories C6-C7 (limit warming between 3 and 4 degrees) and C8 (exceed warming of 4°) are also provided for comparison. Non-energy-related emissions are treated exogenously in the model, with their trajectories calibrated to align with the warming level categories corresponding to each of our main scenarios, based on the representative scenarios in the AR6 WGIII report (IPCC, 2022a).
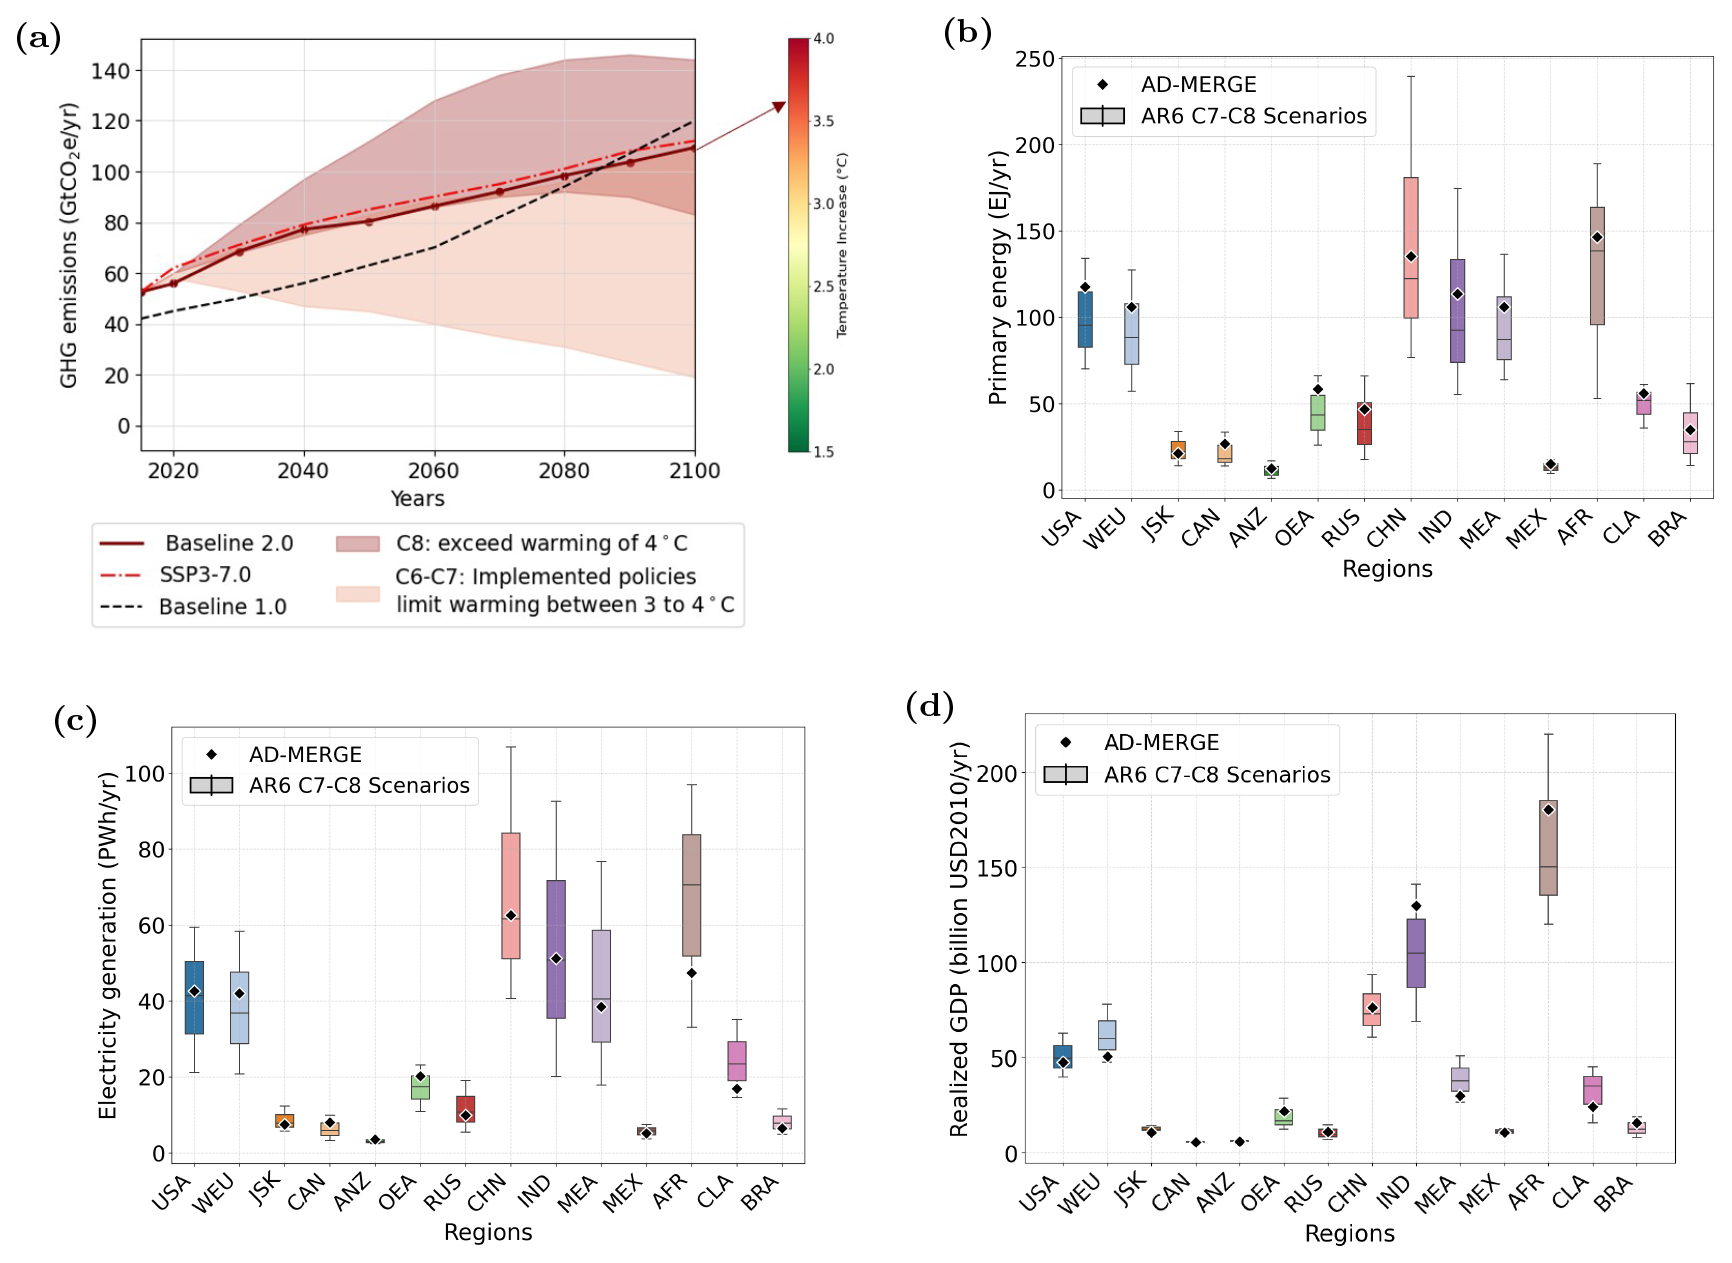
Figure 6(a) World total GHG emissions; (b) regional primary energy supply; (c) regional electricity generation; and (d) regional GDP. All results are presented for 2100 under the SSP2 C7–C8 scenarios and compared with AD-MERGE 2.0, represented by diamonds. In panel (a), Baseline 2.0 and Baseline 1.0 refer to the baseline scenarios of AD-MERGE 2.0 and AD-MERGE 1.0, respectively.
In Fig. 6b–d, AD‐MERGE 2.0 outputs, represented by data points, consistently fall within the interquartile ranges of the AR6 scenario ensemble for SSP2 categories C7 and C8. These categories were selected as a comparison benchmark since the AD-MERGE Baseline scenario aligns with this range of projected warming. The projections of primary energy supply (Fig. 6b) and electricity generation (Fig. 6c) closely track the median trends, reflecting the model’s ability to capture regional patterns of electrification, technological diffusion, and decarbonization efforts. In addition, GDP trajectories (Fig. 6d), shown in alignment with the interquartile ranges across regions, further support the consistency of the economic and demographic assumptions embedded in the model calibration. Additional base year and near-term validation of the main drivers of the model are provided in Appendix E.
3.2 Scenarios
We explore five main scenarios using AD-MERGE 2.0:
- Baseline
-
This scenario represents our calibration scenario. This scenario assumes the continuation of current global trends in energy use, GHG emissions, and economic development in the absence of additional climate policies. This scenario excludes climate damages from decision-making, providing a counterfactual framework to evaluate the effectiveness of climate policy interventions when such damages are considered.
- Reference without adaptation – REF-NA
-
This scenario represents a progression under existing policies and measures, drawing from the IEA's Stated Policy Scenario (STEPS) (IEA, 2023b). The IEA-STEPS outlines the expected progression of the energy system based on an analysis of the current policy framework. It includes a modest carbon pricing mechanism and additional measures designed to curb emissions. In REF-NA scenario, we implemented these measures to the extent allowed by the structural capabilities of our model. We applied the same carbon pricing to the specified regions and assumed comparable emission trajectories for the rest. Furthermore, we implement gross damages in this scenario and do not allow the use of adaptation. REF-NA benchmarks the effectiveness of current policies in tackling climate change and fostering energy transitions, evaluating their adequacy in achieving regional decarbonization targets.
- Reference with optimal adaptation – REF-OA
-
This scenario expands on the REF-NA scenario by incorporating both proactive and reactive adaptation strategies. Adaptation is optimized, assuming full knowledge of adaptation costs and benefits and future economic and gross damage projections. This scenario assesses the effectiveness of coordinated climate strategies by analyzing the combined impact of adaptation measures and moderate mitigation efforts, supporting the global transition to a more sustainable future.
- Announced pledges without adaptation – APS-NA
-
This scenario reflects the progression of the energy system under all publicly announced climate pledges and net-zero commitments, drawing from the IEA's Announced Pledges Scenario (APS) (IEA, 2023b). The IEA-APS outlines the trajectory of global and regional emissions if the stated commitments are met in full and on schedule. Accordingly, we adopt regional emission constraints that follow the IEA-APS pathways. In this scenario, the analysis includes the consideration of climate impacts in the absence of adaptation measures.
- Announced pledges with optimal adaptation – APS-OA
-
This scenario is an advancement of the APS-NA scenario, incorporating optimal adaptation strategies. Since APS-OA and APS-NA share identical mitigation assumptions, their energy system outcomes and emission trajectories coincide. Consequently, APS-OA is used to represent the APS scenarios when comparing energy system developments and emission pathways (Sect. 4.1 and 4.2), while APS-NA serves to illustrate the interaction between adaptation and mitigation (Sect. 4.3).
4.1 Emission trajectories and temperature change
The Baseline scenario of AD-MERGE 2.0 projects a persistent increase in total GHG emissions throughout the 21st century, with a notable increase until 2040, followed by a more moderate trend until 2100. This trajectory is consistent with the high-emission pathway of SSP3-7.0 and yields an estimated temperature increase of 3.6 °C by 2100 (see Fig. 7a). The Baseline scenario highlights the need for additional decarbonization measures and shows the deviation from effective carbon mitigation strategies. The REF-NA scenario depicts a continuous decline in emissions falling well below Baseline levels, leading to a potential temperature rise to 2.3 °C. Although this trend demonstrates that the inclusion of climate damages and current policies helps shift emissions toward lower trajectories, it underscores that additional efforts are still needed to limit the 2 °C goal set by the Paris Agreement (UNFCCC, 2015). The implementation of adaptation measures in the REF-OA scenario results in a reduction in climate-related damages. This, in turn, decreases the marginal benefits of mitigation, leading to a reduction in mitigation efforts and ultimately higher temperature increases that reach 2.4 °C by the end of the century. The APS-OA scenario, which replicates the IEA-APS emission trajectory for energy-related CO2 emissions, represents a more ambitious climate mitigation pathway. In this scenario, alignment with the announced policy targets results in an emission pathway that limits global warming to 2 °C by 2100. Our scenarios fall into the following AR6 temperature categories: Baseline is between C7–C8 categories, REF scenarios between C5–C6, and APS between C3–C4.
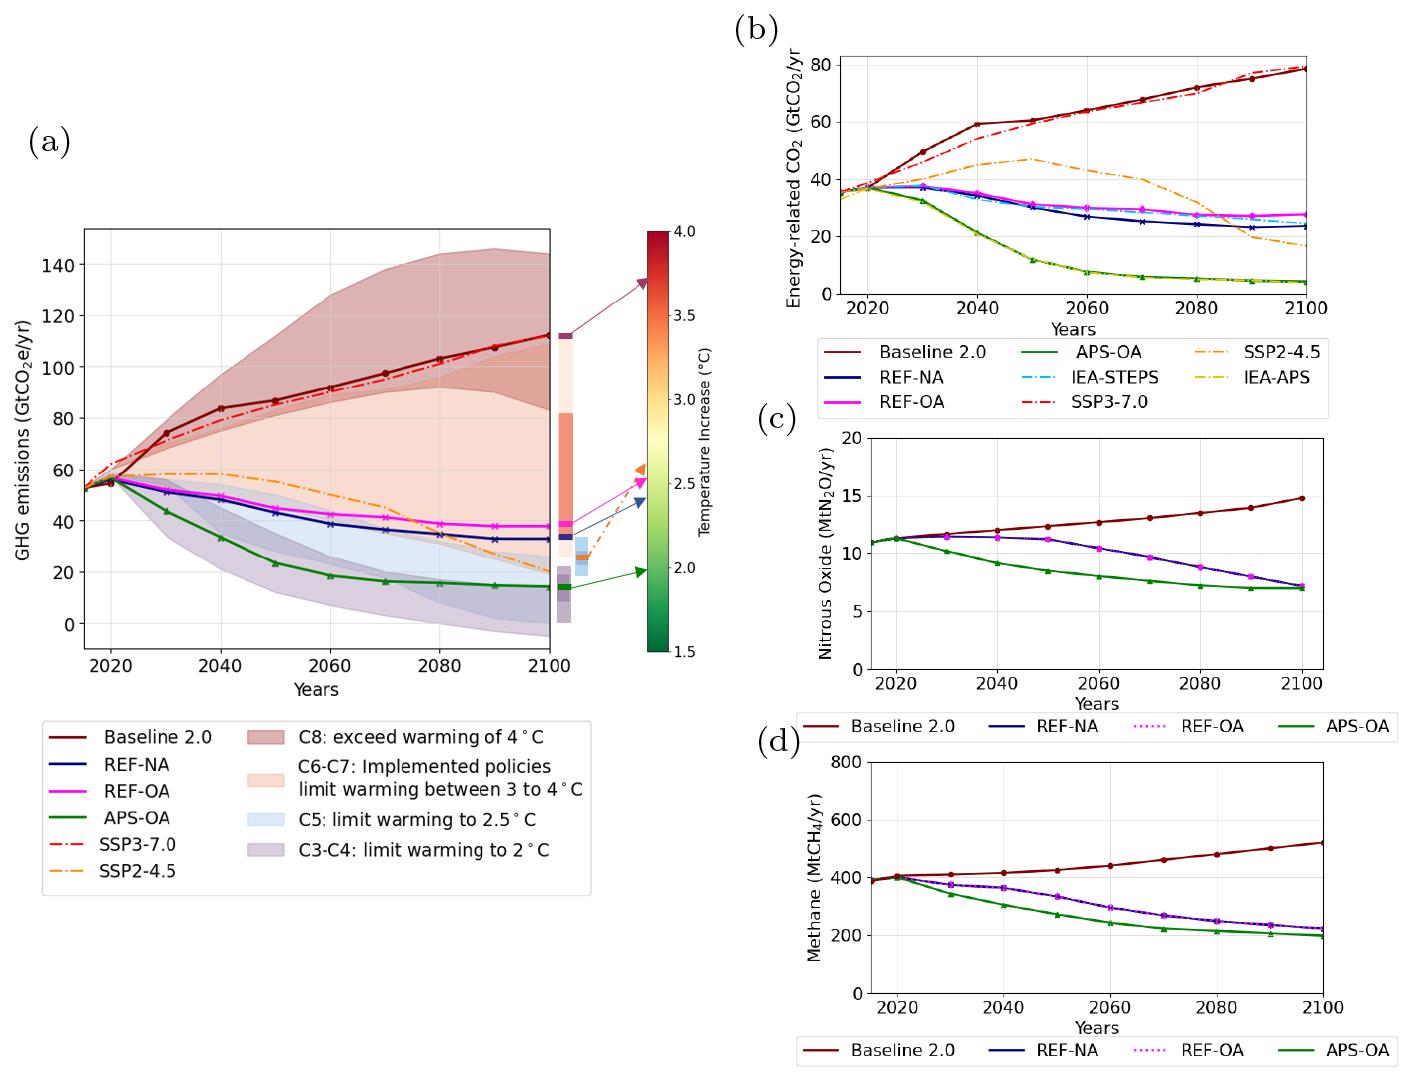
Figure 7Projected anthropogenic emissions of primary climate change drivers; (a) Total GHG emissions, (b) energy-related CO2 emissions, (c) total N2O emissions, and (d) total CH4 emissions comparison across various scenarios: AD-MERGE 2.0 (Baseline 2.0, REF-NA, REF-OA and APS-OA), two IPCC representative pathways (SSP2-4.5 and SSP3-7.0), and IEA scenarios (IEA-STEPS and IEA-APS). Shaded patterns represent the C8 to C3 warming levels based on IPCC (2022a) classifications, providing a comparative context for emission trajectories. The “Implemented policies” ranges show emissions pathways assuming policies implemented by the end of 2020 and pathways assuming implementation of NDCs before COP26. The gradient boxes show the 5th to 95th percentile of the projected warming levels in 2100. The figure also illustrates each scenario's warming levels relative to the period 1850–1900.
Figure 7b depicts the trajectories of energy-related CO2 emissions and allows comparison with IEA scenarios. As discussed in Section 3.1, AD-MERGE 2.0 Baseline is consistent with the SSP3-7.0, although the emissions are slightly higher in the short run. For the REF-NA scenario, energy-related CO2 emissions broadly follow the IEA-STEPS trajectory in the short run but fall below it in the long run, suggesting AD-MERGE responds more strongly to similar policy assumptions. Consistent with the pattern for total GHG emissions, the REF-OA scenario reduces energy-related emissions, but leaves them slightly higher than under REF-NA. Under APS-OA scenario, emissions further decline over the century, falling to less than 8 Gt CO2 per year by 2100. Non-CO2 GHG emissions under the Baseline 2.0 scenario continue to rise steadily throughout the century, as shown in Fig. 7c and d. In contrast, the REF-NA and APS-OA scenarios exhibit consistent downward trends in emissions of nitrous oxide (N2O) and methane (CH4) (see Fig. 7c and d) with the APS-OA scenario achieving the highest reductions over the century.
4.2 Energy system overview
Primary energy is defined as energy inputs to conversion and transformation processes, including fuels used for electricity generation, whereas final energy represents energy delivered to end-use sectors after accounting for conversion losses and energy-sector own use. Consistent with IPCC AR6 WGIII reporting conventions (IPCC, 2022a), we use the direct-equivalent method for non-combustible electricity sources, counting one unit of electricity from non-combustible sources as one unit of primary energy, rather than converting output to a fossil-fuel-equivalent input through an assumed efficiency. Considering these definitions, the energy supply projections (Fig. 8) show a significant shift in the global energy landscape under the decarbonization scenarios, REF-NA, REF-OA, and APS-OA, compared to the Baseline scenario. In the Baseline scenario, primary energy supply reaches 1221 EJ and final energy use reaches 875 EJ by 2100, whereas all alternative scenarios result in reduced levels of both metrics. The reduction is primarily driven by mitigation policies that increase production costs and the inclusion of climate damages, which both yield GDP losses, resulting in lower energy demands.
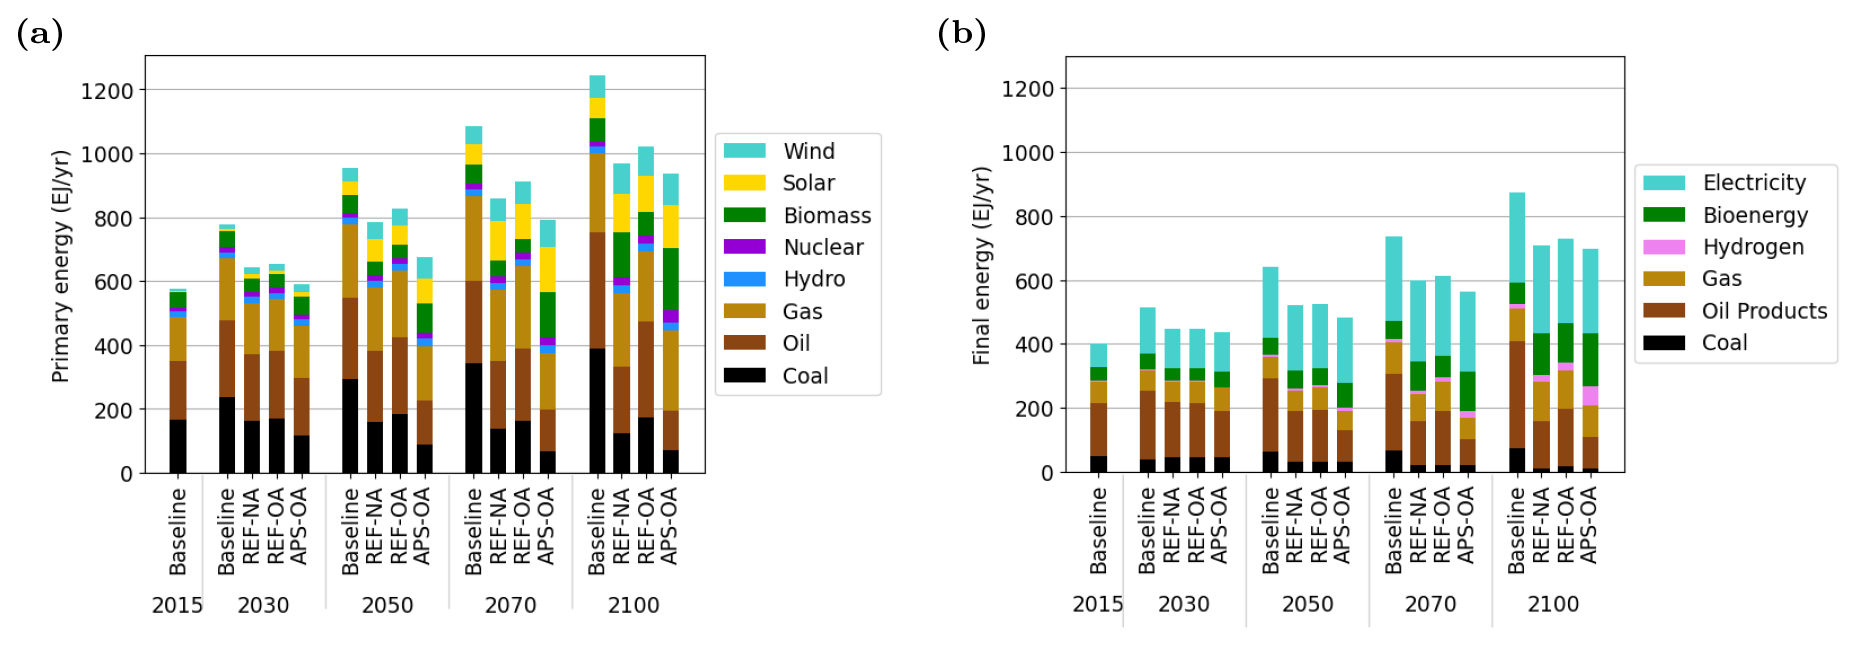
Figure 8(a) Primary energy supply mixes by sources and (b) final energy use by sources for all scenarios.
In the Baseline scenario, the global energy supply continues to grow steadily, with fossil fuels maintaining their predominance in the energy supply throughout the century. By 2100, fossil fuels will account for 75 % of the total primary energy supply, with coal leading at 28 %, closely followed by oil at 27 %. Renewable energy sources, such as wind, solar, and biomass, see only limited expansion, contributing just 15 % to the overall energy mix. In contrast, the REF-NA and REF-OA scenarios show a marked decline in coal and oil use, paired with a notable increase in renewable energy, 40 % and 32 % of the total energy supply, respectively. In the APS-OA scenario, this share increases further to 55 %, due to the stronger policy commitment to decarbonization.
Across all three decarbonization scenarios, final energy use undergoes a major transformation, marked by a decline in fossil fuel reliance and a growing role for electricity, hydrogen, and renewables. Electrification accelerates as the share of electricity in final energy rises from 29% in the Baseline to 38 % in REF-NA, 36 % in REF-OA, and 40 % in APS-OA, reflecting lower decarbonization costs in the power sector and rapid advances in renewable and storage technologies. Hydrogen also moves from a marginal role in the Baseline scenario, where it contributes just 2 % of final energy (mainly gray hydrogen), to a more central position in the policy scenarios, doubling to 5 % in REF-NA and REF-OA and reaching 9 % in APS-OA by 2100. This shift is driven by the scale-up of green hydrogen from renewables and blue hydrogen with CCS, enabling deeper decarbonization of hard-to-electrify sectors and expanding hydrogen’s role as a flexible energy carrier in a low-carbon future.
Bioenergy and carbon-removal technologies become increasingly important contributors to deep decarbonization in all policy scenarios. Throughout the century, the share of biomass in global final energy use rises from just 5 % in the Baseline to 14 % in REF-NA, 11 % in REF-OA, and 19 % in APS-OA by 2100. Most of the biomass is supplied via Fischer–Tropsch synthesis and bioenergy with carbon capture and storage. BECCS is absent in the Baseline, but by 2100 it accounts for roughly 72 % of bioenergy use in REF-NA, 66 % in REF-OA, and 78 % in APS-OA, positioning it as the dominant negative-emissions option in these pathways. The strong uptake of BECCS not only supplies low-carbon fuels and electricity but also delivers net removals that offset residual emissions from hard-to-abate sectors, enabling the tighter carbon budgets embodied in the policy scenarios. A detailed breakdown of regional BECCS deployment and feedstock sourcing is provided in Appendix F to illustrate the geographic concentration of bioenergy resources and capture potential.
4.2.1 Power generation mix
Figure 9a illustrates the projected power generation mix in different scenarios, offering insights into the evolving energy landscape. In the Baseline scenario, fossil fuels, especially coal and natural gas, continue to dominate the power generation mix, holding a 59 % share by 2100. Despite this continued reliance on fossil fuels, there is a noticeable presence of renewable energy sources, contributing a total of 34 % to the power generation mix. This indicates progress in the adoption of renewables, although it remains insufficient to shift the overall energy landscape away from fossil fuel dependency.
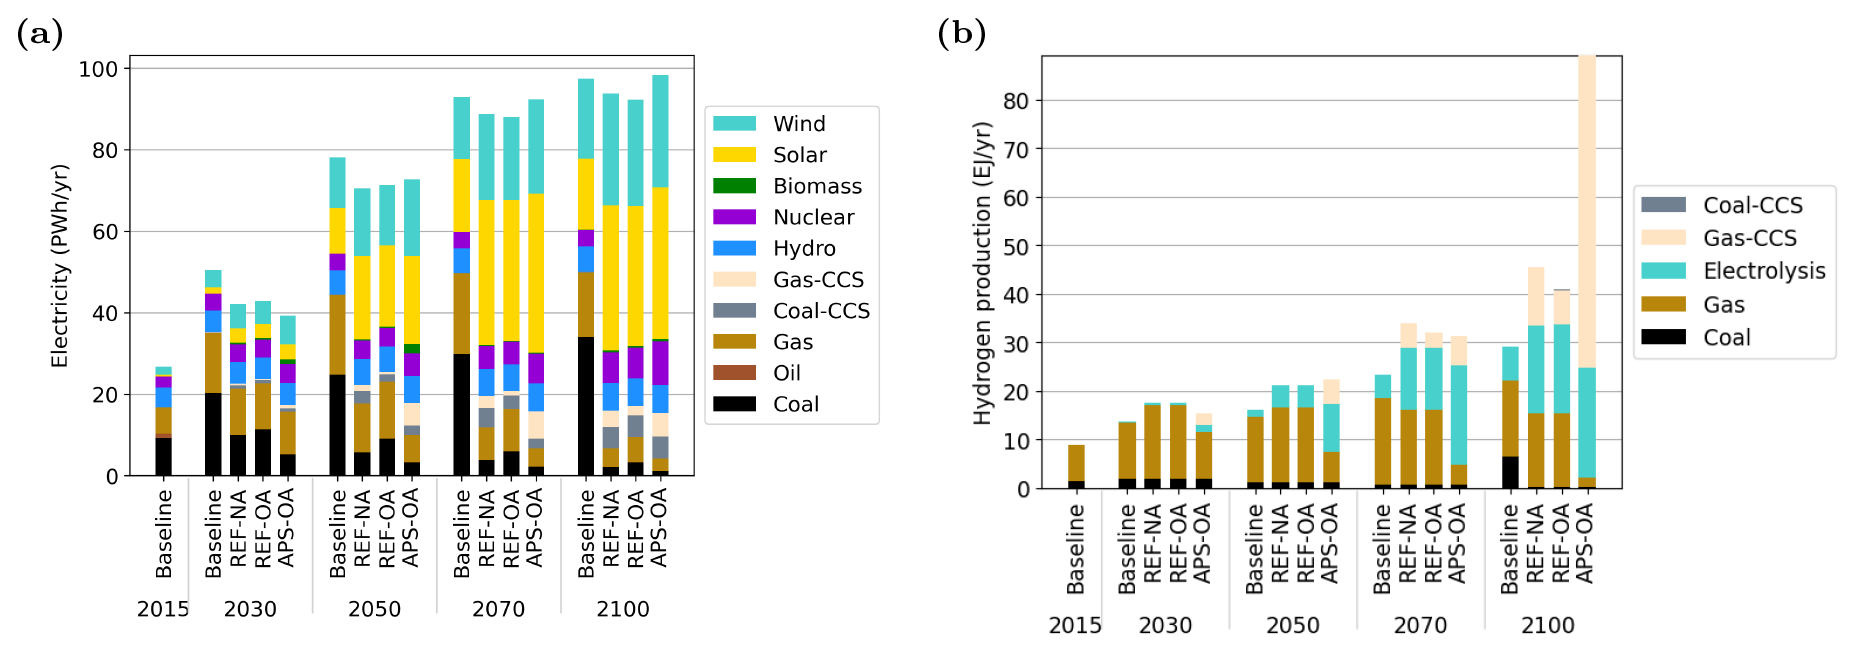
Figure 9(a) Electricity generation mixes and (b) hydrogen production mixes by technologies for all scenarios.
The REF-NA and REF-OA scenarios illustrate a considerable increase in the adoption of renewable energy sources, particularly wind and solar power. While all mitigation scenarios reduce coal use substantially, only APS-OA nearly eliminates unabated fossil fuel generation by the end of the century. In APS-OA, unabated fossil generation is nearly eliminated by 2100, while increased deployment of CCS provides transitional support. Nuclear and hydropower also expand steadily as reliable baseload providers that complement the growing share of VRE, with nuclear output increasing most notably in the APS-OA scenario. Additionally, the increased use of gas-CCS and coal-CCS technologies in decarbonization scenarios indicates a transition role for fossil fuels with carbon capture in reducing emissions. The resulting portfolio avoids over-reliance on any single technology, instead achieving decarbonization through a balanced mix of variable renewables, dispatchable low-carbon baseload, and carbon-captured fossil units.
4.2.2 Hydrogen production
The integration of green hydrogen technologies plays a growing role in long-term decarbonization pathways. As shown in Fig. 9b, there is a clear shift toward low-carbon hydrogen production across decarbonization scenarios. In the Baseline scenario, hydrogen is primarily produced from fossil fuels, mainly natural gas and coal, with electrolysis remaining negligible through 2030 and even 2050. This pattern persists in the REF-NA and REF-OA scenarios during the early and mid-century, reflecting delayed policy action and continued reliance on conventional hydrogen production methods. The dominance of gray hydrogen in these scenarios underscores the inertia in transitioning without strong policy signals or economic incentives.
The REF-NA and REF-OA scenarios demonstrate an increase in electrolysis-based hydrogen production in the second half of the century, suggesting that even under moderate climate objectives, technological advancements and cost reductions can lead to a gradual transition toward sustainable hydrogen. On the other hand, the APS-OA scenario demonstrates a faster and more decisive change. Beginning shortly after 2030, low-carbon hydrogen, produced through electrolysis (green hydrogen) and natural gas with carbon capture (blue hydrogen), gains a rapidly growing share. By 2050, over 60 % of the hydrogen supply is derived from these cleaner sources, and by 2100, hydrogen production is almost fully decarbonized. This transition is a product of more ambitious climate targets and reflects broader system-wide changes, including increased renewable penetration. These trends highlight the pivotal role of hydrogen as a flexible energy carrier and the need for early investment in enabling technologies such as renewable energy integration and carbon capture systems.
We compared our hydrogen production results with the temperature-categories benchmarks presented in Ghaboulian Zare et al. (2025), which provide the confidence intervals of hydrogen production derived from the AR6 scenario ensemble. Despite methodological differences, across all modeled scenarios, AD-MERGE 2.0 results remain within the corresponding AR6 confidence intervals for their respective temperature categories. This further indicates consistency with the broader literature. Notably, in the APS-OA scenario, hydrogen production reaches 87 EJ by 2100, which lies slightly above the multi-model mean reported for the C3–C4 warming category. This deviation suggests a more prominent role for hydrogen in our mitigation pathway, particularly under ambitious policy assumptions and enhanced technological deployment.
4.3 Climate change impact insights
Figure 10 illustrates the economic implications of global and regional climate change damages and adaptation options. Figure 10a compares global climate change costs, i.e., the sum of climate change damages and adaptation costs, as a percentage of global GDP from 2030 to 2100 under different scenarios. Costs in the Baseline scenario, given no adaptation, represent gross damages and increase significantly, reaching about 10 % of GDP by 2100, clearly highlighting the economic burden associated with climate inaction. Implementing mitigation targets lowers these impacts to about 6.0 % in REF-NA and 5.2 % in APS-NA, without any adaptation measures. In contrast, the REF-OA and APS-OA scenarios demonstrate the substantial potential for targeted mitigation and adaptation measures, significantly reducing climate change costs to less than 2 % of GDP by 2100. This trend underscores adaptation's pivotal role in minimizing climate-induced economic impacts.
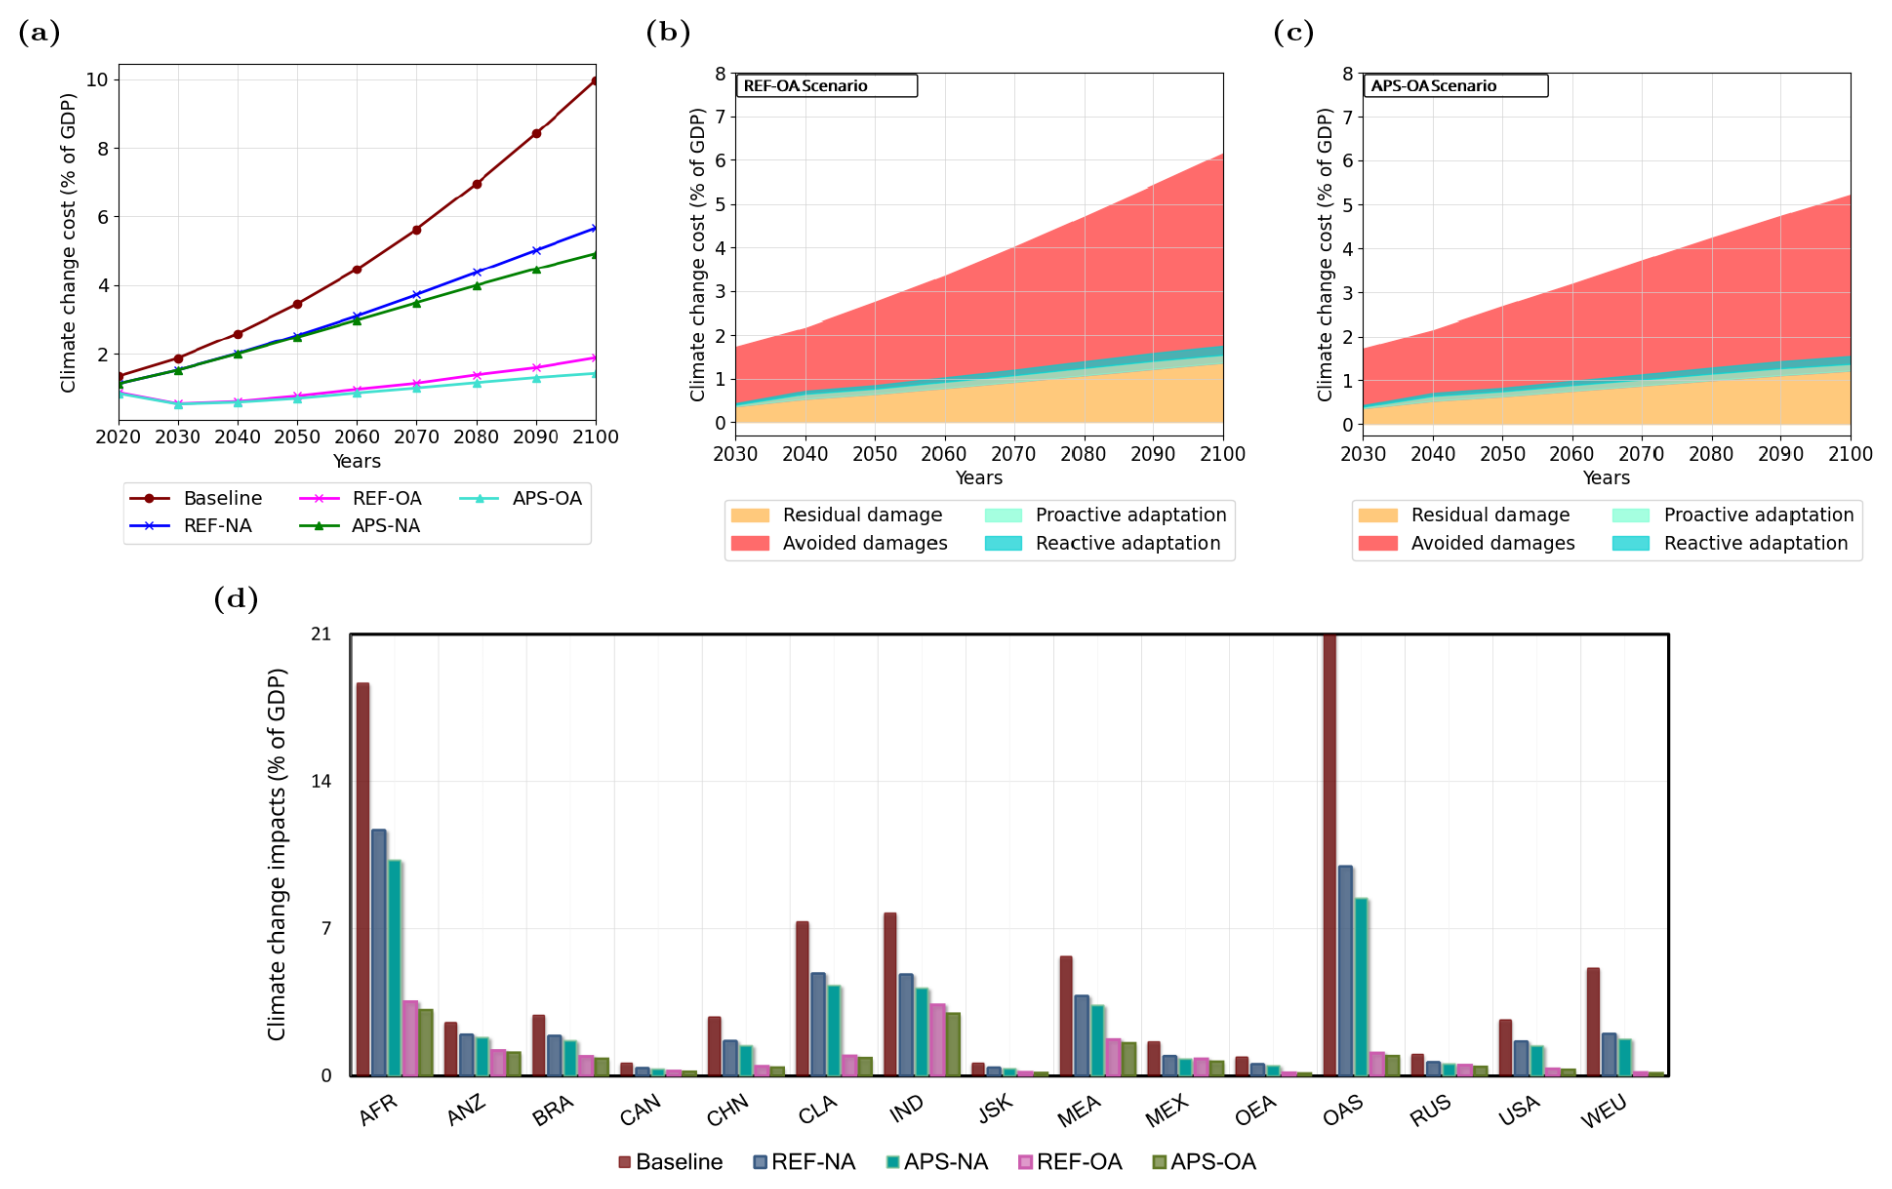
Figure 10(a) Global total climate change impacts; (b) impacts components in REF-OA and (c) APS-OA scenarios; and (d) regional climate impacts in 2100 as a percentage of GDP.
The divergence between the NA and OA scenarios by 2030 reflects their roles as bounding cases rather than near-term forecasts. NA represents a counterfactual no-adaptation pathway, while OA illustrates an idealized optimal-adaptation pathway. In the OA scenario, adaptation is deployed from 2020 onward at a model-implied cost-effective level for each impact category, whereas NA assumes zero protective adaptation. Early reductions in climate change impacts are driven by both reactive and proactive adaptation. Reactive measures can be scaled within a single model period. Proactive measures, such as investments in seawalls, irrigation infrastructure, and resilient energy and health systems, accumulate more gradually through depreciable investments, although they still yield benefits within a 10-year model period. Because these scenarios abstract from real-world policy and implementation frictions, their differences around 2030 should be interpreted as illustrative of the model's internal damage-adaptation dynamics. Notably, the costs of REF-OA and APS-OA diverge from 2060 at the global level. This global divergence leads to regional disparities, where the impacts and benefits of adaptation are more pronounced. A more detailed regional analysis would reveal greater variation and highlight areas where adaptation efforts are most effective (see Fig. 10d).
Figure 10b and c decomposes the total climate change costs into residual damages, adaptation costs (reactive and proactive), and avoided damages for the REF-OA and APS-OA scenarios, respectively. When comparing avoided damages (adaptation benefits) with adaptation costs, the high cost-effectiveness of adaptation is evident, where adaptation benefits outweigh costs threefold. On a global scale, proactive and reactive adaptation costs are initially dominated by higher investments in proactive measures, but over time they converge to similar magnitudes. Figure 10b and c also allows interpretation of the corresponding APS-NA and REF-NA scenarios. In the absence of adaptation, total climate-change costs would consist of the sum of residual damages and avoided damages shown here, since the avoided-damage component represents the damages prevented by optimal adaptation. Thus, APS-NA can be inferred from Fig. 10c as the level of climate-change costs that would prevail under the APS mitigation pathway without adaptation, while APS-OA shows how those gross damages are redistributed into residual damages, adaptation expenditures, and avoided damages once optimal adaptation is introduced. The same interpretation applies to REF-NA relative to REF-OA in Fig.10b. Therefore, comparing REF and APS scenarios further shows that stronger mitigation in the APS scenario lowers both the gross damages (in NA case) and the residual damages (in OA case).
The baseline climate impact analysis reveals a profound inequality in exposure, characterized by extreme impacts in the Global South and significant heterogeneity among developed economies. In particular, regional climate change impacts (damages and adaptation costs) as a share of GDP in Fig. 10d highlight that vulnerable regions such as Africa and Other Asia regions face disproportionately high climate-related damages, where their climate change costs exceed 18 %–21 % of GDP. In comparison, high-latitude regions of Russia and Canada experience low impacts. Other vulnerable regions are Central and Latin America and India, which experience significantly higher than average climate-related damages, particularly under the Baseline scenario. Western Europe and the Middle East experience a comparable rate of impacts. While mitigation alone (REF-NA) reduces the absolute ceiling of damages, it fails to alter this structural disparity.
The analysis underscores adaptation as a critical divergence point, although its effectiveness varies markedly between the 15 regions. Regions with high baseline vulnerability, such as Africa, Other Asia, and Central and Latin America, alongside those with high adaptive capacity like the USA, China, and Western Europe, experience the greatest relative gains from adaptation measures. This contrast highlights a significant disparity: while mitigation is universally beneficial, adaptation delivers disproportionately large benefits to vulnerable developing regions that have contributed the least to historic emissions. By disaggregating these regions, this study reveals inequalities that were previously masked in AD-MERGE 1.0, emphasizing the need for comprehensive policy frameworks that integrate both strategies to achieve a more equitable distribution of climate risk.
Overall, while mitigation policies under the REF-NA and APS-NA scenarios achieve a general reduction in impacts, the incorporation of adaptation measures provides a crucial additional layer of protection, significantly lowering residual damages. The cumulative benefit of combining these strategies is evident in all scenarios, yet distinct regional vulnerabilities persist. Even under the most ambitious combined strategy (APS-OA), Africa and India remain critically exposed, retaining residual damage exceeding 3 % of GDP, while the Middle East and Other Asia face impacts above 1.5 %. These findings demonstrate that, while combined strategies effectively minimize economic consequences globally, they do not fully eliminate high-risk exposure of the most vulnerable regions.
AD-MERGE 2.0 contributes to the integrated assessment modeling literature by improving the representations of energy system dynamics, mitigation strategies, and climate change impacts and adaptation within a consistent optimization framework. Relative to many widely used IAMs, which either emphasize detailed energy system transitions with limited impact feedbacks or focus on climate damages with simplified energy representations, AD-MERGE 2.0 offers a middle ground that explicitly links long-term economic growth, energy system transformation, climate dynamics, and adaptation responses under a unified welfare-maximizing structure. This integrated design allows the model to explore interactions and trade-offs that are difficult to capture in more specialized IAM architectures.
A feature of AD-MERGE 2.0, as in the original MERGE model (Manne et al., 1995), is the internal integration of a climate module within the optimization framework. GHG emissions, radiative forcing, and global mean temperature change are determined endogenously, allowing two-way feedbacks between the energy system, the macroeconomy, and climate outcomes. As a result, mitigation, adaptation, and energy investment decisions respond directly to climate-induced impacts and temperature evolution. Several IAMs rely on externally linked climate models, which often limit or omit feedbacks from climate outcomes back to economic decision-making, thereby constraining their ability to consistently capture dynamic mitigation–adaptation interactions (see Table 1). AD-MERGE 2.0 includes revised base year calibration and SSP consistency while maintaining the internally connected climate-economy structure. This recalibration corrects historical underestimations in AD-MERGE 1.0 and aligns emissions, demographic, climatic, and energy trajectories with observed trends and recent scenario ensembles.
The enhanced energy system representation further differentiates AD-MERGE 2.0 from more aggregated IAMs (like AD-DICE, AD-RICE, and FUND), positioning AD-MERGE 2.0 among the most detailed IAMs in terms of mitigation-option representation within models that explicitly incorporate adaptation. An important enhancement is the expanded representation of the energy system, now explicitly featuring VRE and its dynamics, electricity storage, and hydrogen production pathways. This updated representation replaces the generic energy system representation of previous versions, allowing for a more accurate analysis of system-wide mitigation dynamics. Moreover, the explicit inclusion of DACCS and BECCS, replacing the generic backstop removals of AD-MERGE 1.0, enables the model to generate feasible pathways for deep decarbonization scenarios such as APS and to analyze regional heterogeneity in carbon removal deployment across 15 geographic regions (see Appendix F). In contrast to IAMs that rely on generic backstop technologies or renewables (like AD-DICE, AD-RICE, FUND, AD-MERGE 1.0), AD-MERGE 2.0 incorporates operational considerations such as residual load duration curves, curtailment, flexibility constraints, and grid cost adjustments. While this representation remains stylized compared with detailed power-system models, it provides a more realistic depiction of the challenges associated with high shares of VRE than is typical in long-horizon IAMs.
Besides, although the structural representation of climate-change impacts and adaptation was already established in AD-MERGE 1.0, in AD-MERGE 2.0 we strengthen its empirical foundations by recalibrating sectoral damages and adaptation effectiveness across regions using the latest available estimates. This recalibration addresses a broader limitation of many IAMs, in which adaptation is either treated implicitly, modeled exogenously, or parameterized using outdated estimates. Also, it improves the relevance of region-specific damage projections and adaptation responses, particularly in highly vulnerable areas. As a result, AD-MERGE 2.0 provides a more robust basis for assessing climate-resilience pathways and the distributional consequences of combined climate strategies. Unlike IAMs that rely on external climate models or soft-linked impact models, AD-MERGE 2.0 embeds the climate and damage modules directly within the economic decision problem, enabling feedbacks from emissions to temperature, damages, and economic outcomes to influence optimal policy choices endogenously. This design is particularly important for analyzing mitigation–adaptation interactions, where feedback effects can materially alter incentives and long-term outcomes.
The results highlight the growing importance of VRE in the global energy transition. These sources can substantially reduce reliance on fossil fuels, but their successful integration requires significant investments in grid infrastructure and storage technologies to manage their intermittency. Furthermore, the integration of hydrogen as a key energy carrier in AD-MERGE 2.0 offers a promising avenue for deep decarbonization. Hydrogen production, particularly via renewable-powered electrolysis and natural gas combined with CCS, emerges in the model as a favorable option to further decarbonize the energy sector. Nonetheless, large-scale adoption of hydrogen will depend on continued reductions in renewable-energy costs and advances in efficient hydrogen storage and distribution infrastructure.
Results also highlight that carbon-removal technologies are important complements to mitigation and adaptation measures, although their contributions differ markedly across pathways. BECCS emerges as an important negative-emission option in REF scenarios and supplies up to three-quarters of all biomass use in the most ambitious APS-OA scenario. By contrast, DACCS appears only in APS-OA, reflecting its high capital, energy, and infrastructure requirements. Together, these findings underscore that sustained investment in sustainable biomass supply chains is critical for realizing BECCS at scale. Moreover, accelerating technological learning and cost reductions for DACCS remain essential if it is to provide a meaningful option for closing residual emission gaps in the second half of the century.
The findings of the REF-OA scenario indicate that integrating optimal adaptation strategies enhances climate resilience by reducing residual damages, which temporarily delays, but does not prevent, the transition to decarbonization. This delay, seen in the nearly two-decade gap in emissions reductions compared to the REF-NA scenario, reflects a clear crowd-out effect, where investment in adaptation reduces the immediate resources available for mitigation. However, even with optimal adaptation investments, residual damages remain high, highlighting that modest climate policies are inadequate to fully offset climate-related costs. Crucially, it is important to note that these results are obtained on the assumption of optimal adaptation, an idealized scenario in practice. Consequently, these findings should not be interpreted as a justification for postponing mitigation efforts.
The model's insights into regional disparities in climate change impacts, adaptation effectiveness, and energy transitions suggest that an optimal policy approach should carefully balance adaptation and mitigation strategies, tailored to the unique needs and capabilities of each region. For instance, countries like India and China demonstrate substantial benefits from mitigation efforts in reducing climate-related damages (e.g., comparing REF-NA to APS-NA). In contrast, highly vulnerable regions such as Africa and Other Asia, despite facing disproportionately high projected damages, exhibit substantial reductions in impacts through the implementation of optimal adaptation strategies (REF-OA and APS-OA). Consistently, the lowest climate impacts are observed in the combined ambitious mitigation and optimal adaptation scenario (APS-OA), highlighting the greater net benefit of an integrated strategy over focusing solely on mitigation.
These marked regional differences in climate impacts, adaptation effectiveness, and mitigation burdens should be interpreted as indicating broad differences in strategic emphasis across macro-regions rather than prescribing policy portfolios for individual countries within them. In this sense, the framework is most informative for comparative assessment of regional mitigation-adaptation trade-offs. At the same time, because adaptation is represented as an idealized regional aggregate under optimal implementation, these findings should be understood as stylized macro-regional insights, not as direct blueprints for local adaptation planning.
In conclusion, the enhancements made in AD-MERGE 2.0 provide a more nuanced understanding of the decarbonization pathways. The model’s insights into regional disparities, energy transition dynamics, and integration of adaptation and mitigation strategies highlight the need for an integrated approach to global climate policy. Beyond the illustrative scenario analysis presented here, the integrated welfare framework enables analysis of jointly optimal mitigation-adaptation pathways that balance mitigation expenditures, adaptation investments and spending, and residual damages under alternative objectives and constraints. The REF scenario applies an economy-wide carbon-price path that weighs marginal mitigation costs against the marginal benefits of avoided climate damages over time. The comparison between REF-NA and REF-OA allows us to study the interplay between adaptation and mitigation, demonstrating how the inclusion of adaptation options shifts the optimal carbon price and overall economic burden. A standalone analysis integrating joint mitigation and adaptation policies is a potential extension of this research and is intended for future work.
Although AD-MERGE 2.0 offers significant advancements, several areas require further improvement. AD-MERGE 2.0 only considers six climate change impact categories (namely, labor productivity, health, coastal flooding, river flooding, tourism, and energy consumption); however, in reality, many more impact categories exist, including agriculture and extreme weather events. As such, the climate change damage estimate is likely an underestimate of the true impacts. Another key limitation is the model's current economic sectoral granularity; despite providing a robust framework for analyzing energy transitions, its lack of granular representation hinders accurate assessment of individual sectors' climate contributions and impacts. Furthermore, AD-MERGE 2.0 can benefit from a more explicit representation of land-use dynamics and their interactions with energy systems and climate policies. In the current model, biomass availability for options such as BECCS is represented through broad regional resource potentials and techno-economic assumptions, rather than through an endogenous land-allocation framework. Consequently, land-use change, land availability, and competition across food, bioenergy, and forests are not modeled directly. Incorporating these dynamics would improve the assessment of biodiversity, food security, carbon sequestration, and the feasibility of biomass-based mitigation pathways. In this respect, IAMs such as GCAM and IMAGE explicitly represent land-use dynamics within the modeling framework (Kyle et al., 2011; Doelman et al., 2018), while MESSAGE and WITCH achieve this integration when linked to the GLOBIOM land-use model (Emmerling et al., 2016; Krey et al., 2020) or REMIND when linked to MAgPIE (Hilaire and Bertram, 2020). Together, these approaches enable a more comprehensive representation of cross-sectoral interactions between energy systems, land use, and climate.
Beyond these limitations, future work should present opportunities to further enrich the model's capacity for comprehensive climate solutions. Incorporating a broader range of CDR options would allow a more extensive exploration of global net-zero pathways and evaluation of removal technology trade-offs. Additionally, future research must explore the interdependencies of adaptation and mitigation and refine their modeling to achieve more effective and equitable climate action. While the current study explored optimal adaptation, future research is crucial to quantify adaptation gaps and limits and apply them regionally. In particular, richer formulations should account for suboptimal implementation, financing and institutional constraints, path dependency, and broader behavioral responses (van Maanen et al., 2023). Some of these dimensions are partly embedded in the empirical relationships used here, but they are not yet modeled as explicit dynamic drivers. Extending the macroeconomic structure to better capture sectoral and social adjustment and linking IAMs with more behaviorally rich or bottom-up simulation frameworks would also help represent broader forms of adaptation beyond the current reduced-form specification (Filatova et al., 2025).
The spatial disaggregation of AD-MERGE 2.0 categorizes countries into 15 distinct global regions. In this study, Table A1 details the assignment of countries, represented by their ISO codes, to the respective regions.
Population growth and economic trajectories are central determinants of future climate challenges, shaping both mitigation needs and adaptation capacity. Demographic and income pathways influence vulnerability: larger and less affluent populations are generally more exposed to climate risks and have fewer resources to cope with impacts (O'Neill et al., 2014). In AD-MERGE 2.0, socioeconomic inputs are based on SSP2 projections of population and GDP from 2015 to 2100 (Cuaresma, 2017; KC et al., 2024; IIASA, 2024b). Figure A1 presents the regional population and GDP trajectories used in the calibration.
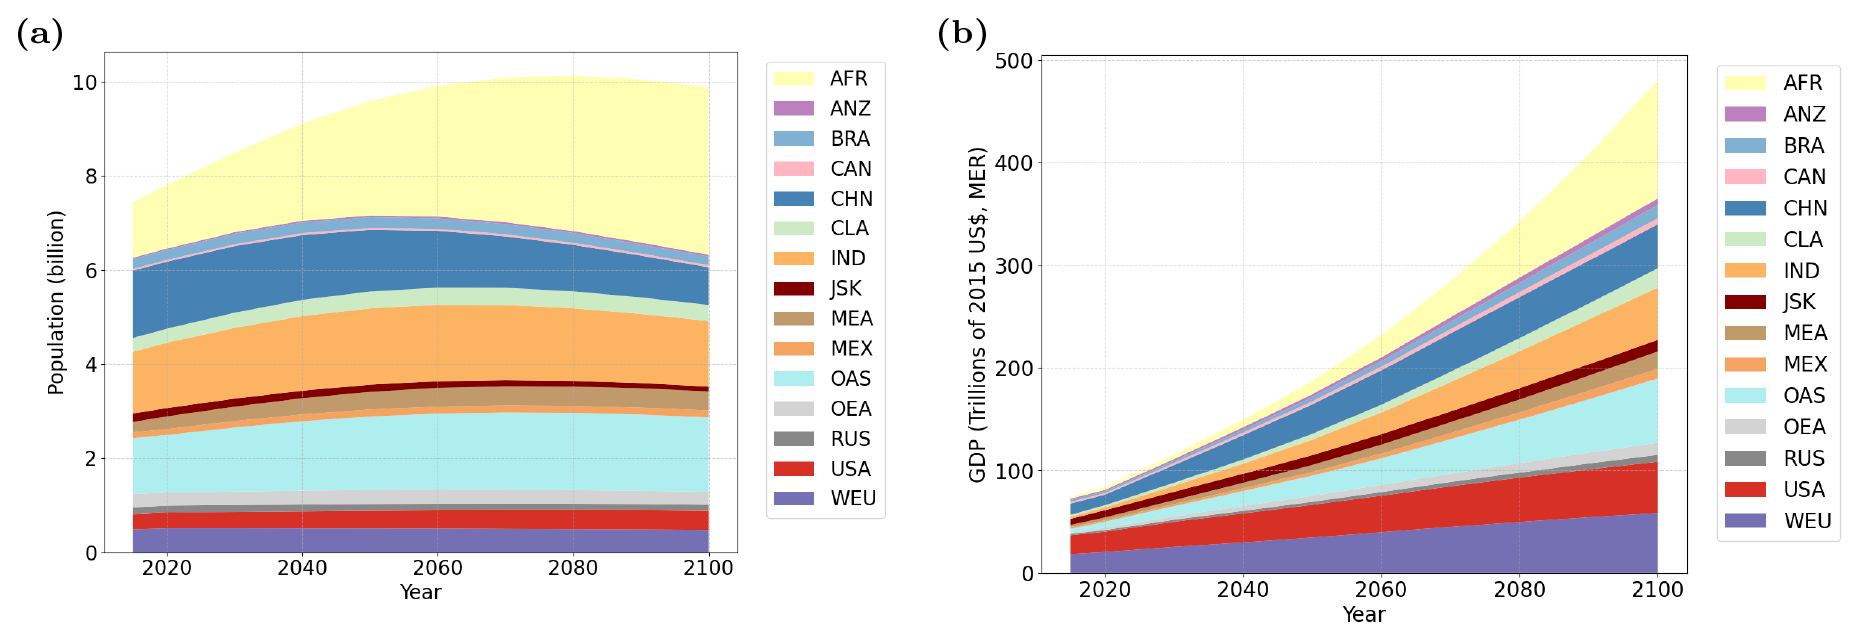
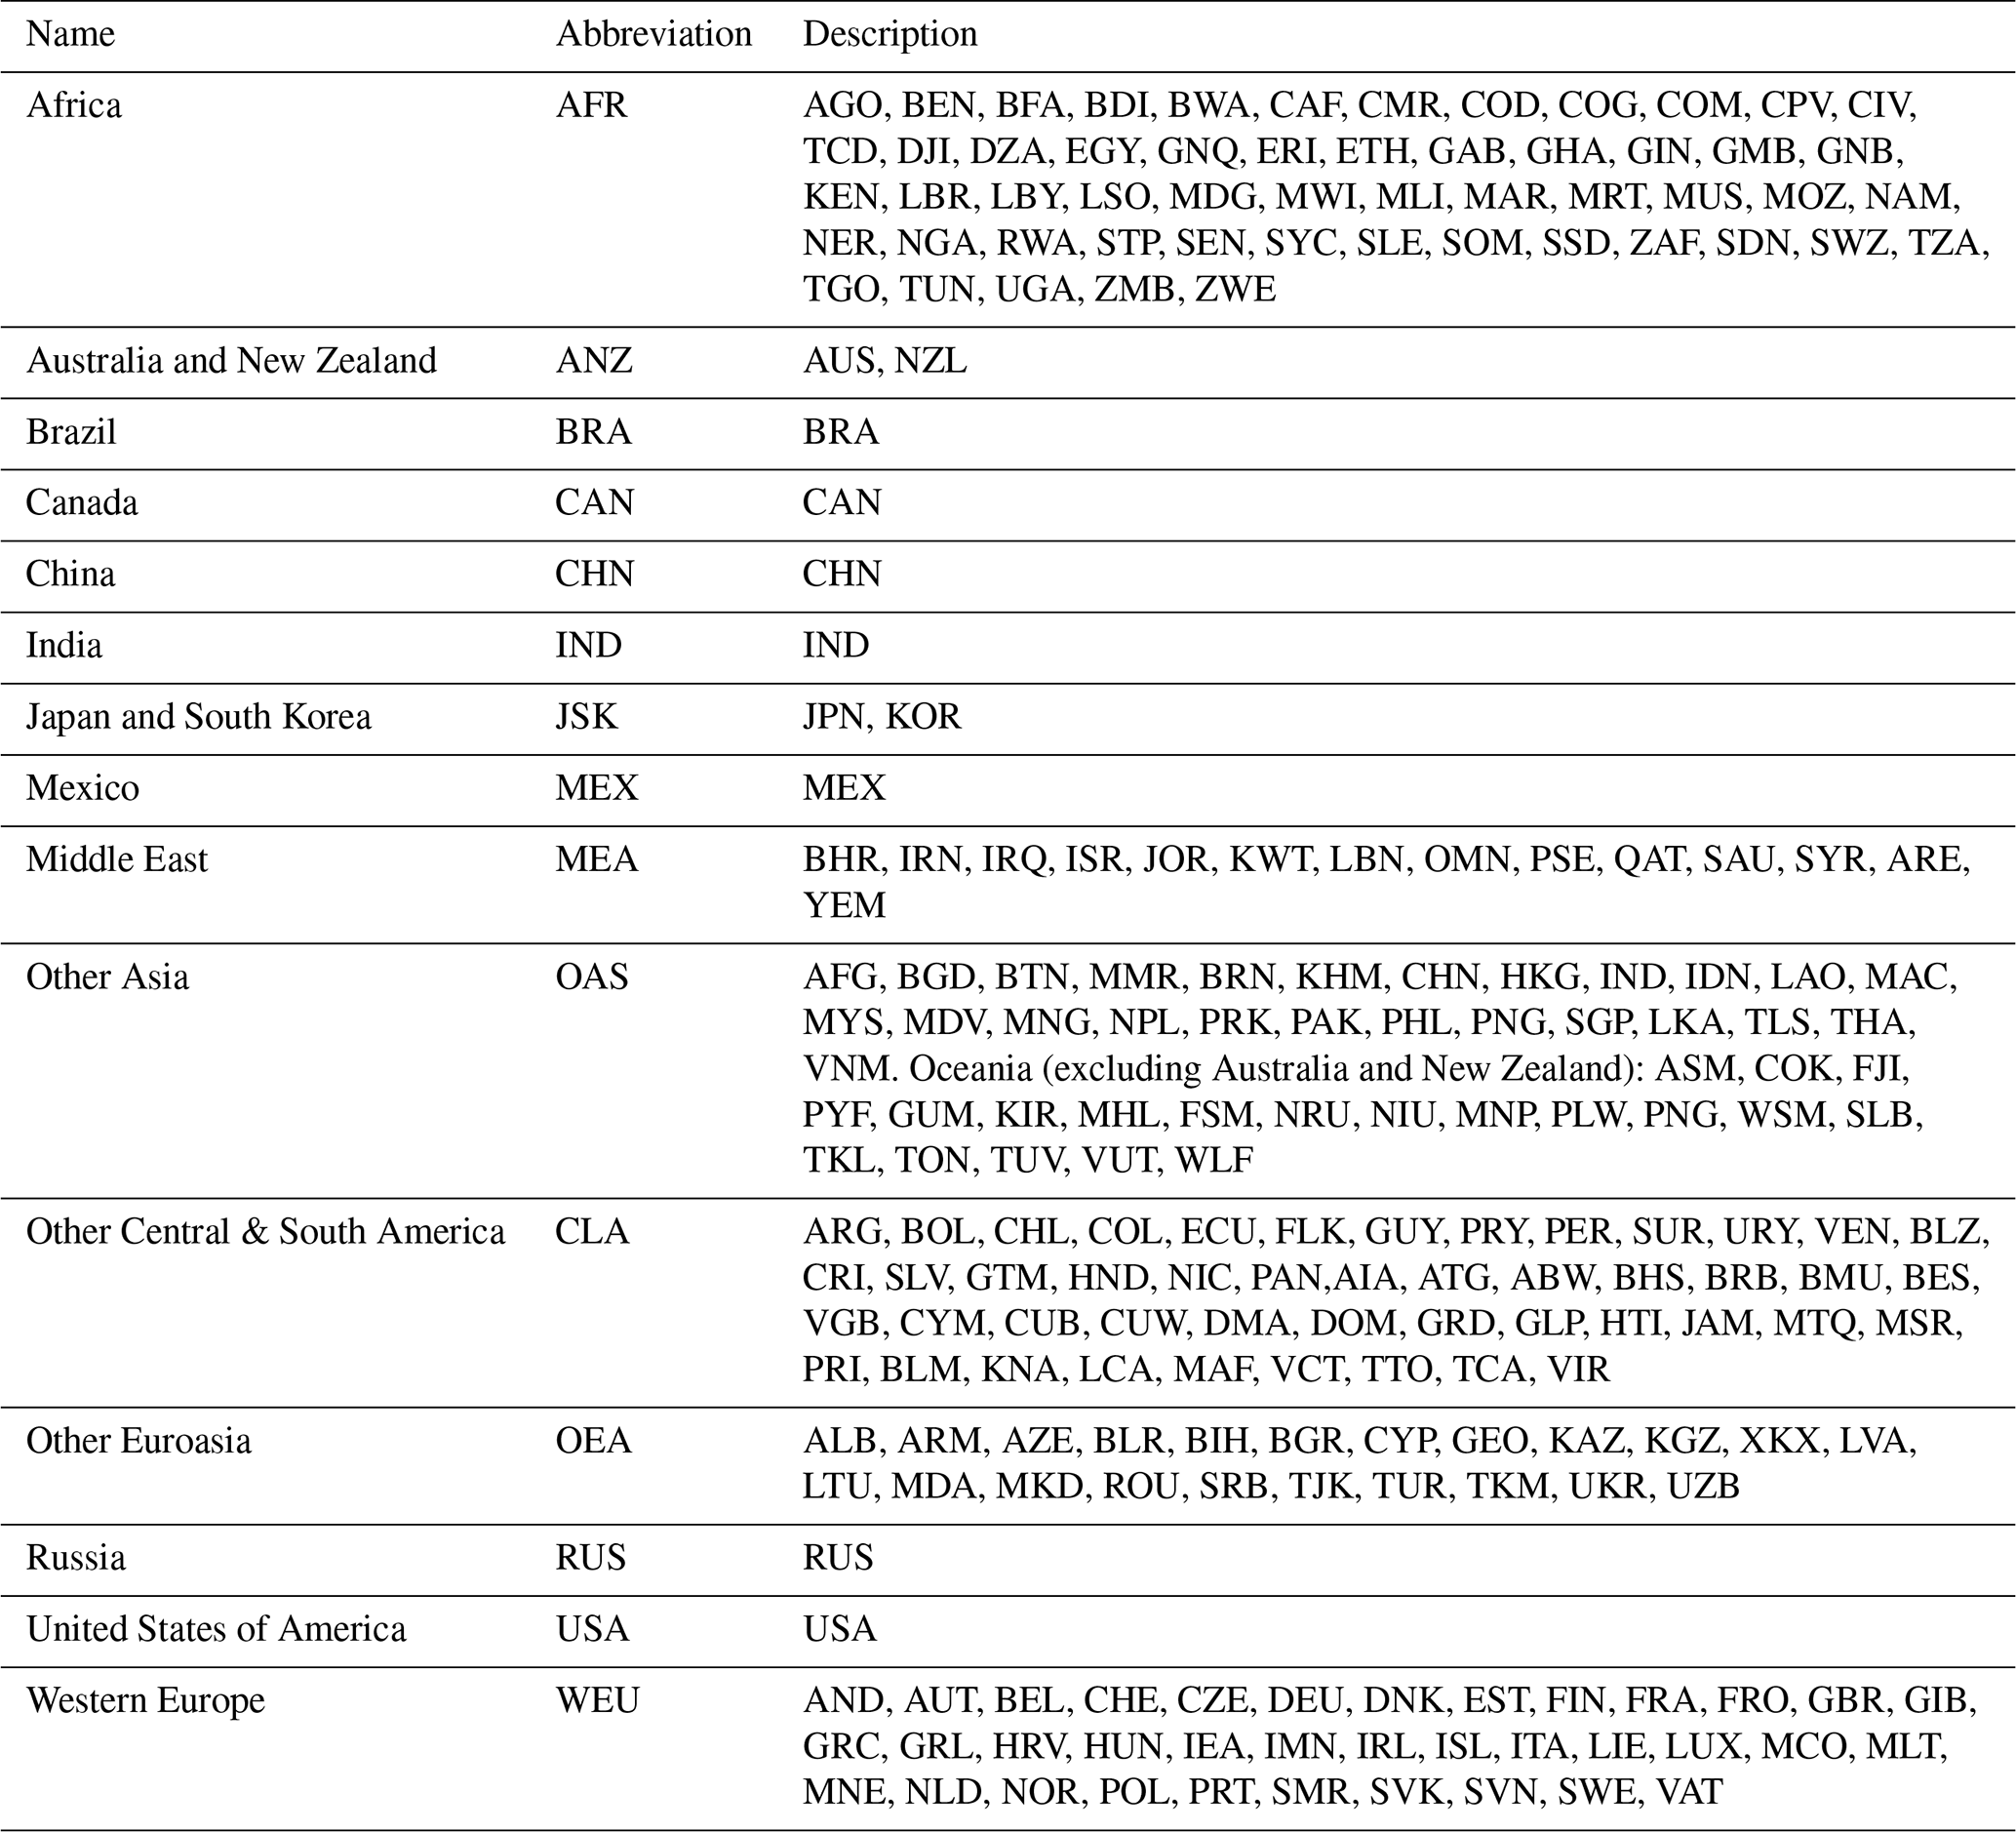
This section presents a selection of new equations introduced in the ETA (energy) module.
B1 Mathematical formulation of flexibility requirement
A new flexibility constraint ensures that the power system can accommodate fluctuating loads induced by high shares of VRE:
The term PE() denotes the power generation of technology et in time slice ts, time period tp, and region rg, while E(rg,tp) denotes the electricity demand. Equation (B1) ensures that the total electricity generated by all technologies, each weighted by its flexibility coefficient f(et), plus the system load weighted by the load coefficient f(load) to account for load uncertainty, remains non-negative. Each power technology is assigned a flexibility coefficient ranging from negative (indicating inflexibility) to positive (indicating flexibility), following Sullivan et al. (2013). Intermittent technologies, due to their variability, receive negative values, whereas technologies that cannot quickly adjust their output, such as nuclear and CSP, are assigned a value of zero. By contrast, more dispatchable technologies, including natural gas combined cycles and hydropower, receive positive values to reflect their ramping capability. Storage technologies also contribute to maintaining the system’s overall flexibility. This implicit representation of flexibility highlights the need for a balanced and adaptable power system under increasing penetration of VRE.
B2 Mathematical formulation of grid costs
A new equation (Eq. B2) represents the additional VRE-related grid costs, TGLvre(tp, rg), calculated for each time period tp and region rg. With increasing VRE penetration, the system requires additional grid integration to manage variability and improve dispatchability, leading to a rapid, non-linear increase in grid capital costs driven by transmission expansion needs and their impact on infrastructure.
The term KE represents the capital expenditures for transmission infrastructure required by VRE sources vre across time periods tp, time slices ts, regions rg, distances ds, and technology classes cl. These costs are scaled by the share of VRE in the regional energy mix for each time period, , capturing the non-linear impact on grid costs through an exponential factor β, following a similar approach to Luderer et al. (2015) and Carrara and Marangoni (2017). Equation (B2) also accounts for distance-related transmission expenses through Ct(vre,ds), which reflects the additional costs imposed by the spatial separation between the power sources and the grid for each technology and class. Parameter Cg denotes the average levelized cost of VRE transmission, based on Gorman et al. (2019).
Table C1 provides a general comparison between two DAC technologies. The liquid-scrubbing approach utilizes hydroxide-based solutions and relies on high-temperature calcination at ambient pressure, resulting in relatively higher energy requirements. In contrast, the solid sorbent approach employs amine-functionalized materials within a temperature–vacuum swing adsorption configuration, operating at lower temperatures under vacuum conditions and generally showing lower energy consumption (Bouaboula et al., 2024). These differences in operating conditions, energy profiles, and materials are essential for evaluating the overall feasibility and scalability of each DAC pathway. Consistent with the methodology of Grant et al. (2022), our study adopts a similar approach to estimating CO2 storage potential. This approach constrains annual CO2 storage to be less than the historical maximum level of oil and gas extraction within each region. The regional breakdown aligns with their approach, which also considers static volumetric estimates of CO2 storage capacity (Hendriks et al., 2004). Notably, while this study incorporated a levelized cost of CO2 transportation, future research must assess the more complex realities of the essential CO2 transport infrastructure, such as natural gas pipelines, liquefaction facilities, and high-speed rail analogs. These components introduce significant complexities that were not explicitly considered in detail here.
Table C1Comparison of energy and process conditions for DAC technologies based on Bouaboula et al. (2024).

This appendix summarizes how climate‐related economic damages and adaptation are represented and calibrated in AD-MERGE 2.0. The implementation follows the general structure of AD-MERGE 1.0 (Bahn et al., 2019), but all parameters are updated and recalibrated using new sectoral impact and adaptation information. Here, we present only the key functional forms and concentrate on the empirical calibration procedure.
D1 Damage data and calibration
Gross market damages are expressed as a share of regional output and depend on global mean temperature change. This specification allows for both a linear and nonlinear response to temperature. The damage function coefficients are determined from an impact assessment that covers six impact categories for which consistent regional data are available: river flooding, coastal impacts, total energy demand, labor productivity, health and tourism. The underlying data sources for these impact categories are summarized in Table D1. For each region, impact-specific estimates are then aggregated across the six impact categories for different combinations of Tt and GDP. This yields a set of observations for total gross damages as a fraction of regional output, which is used to calibrate the parameters α1,r, α2,r, and α3,r. The resulting regional damage curves are shown in Fig. D1a. These curves support the global damage comparison presented in Fig. 5 (see Sect. 2.5).
World Health Organization (2014)Institute for Health Metrics and Evaluation (2024)(Hamilton et al., 2005)The World Bank (2024)CIA (2024)Our World in Data (2024)World Resources Institute (2020)Climate Impact Lab and Human Development Report Office, UNDP (2022)International Labour Organization (2024)Climate Impact Lab and Human Development Report Office, UNDP (2022)(Diaz, 2016)Table D1Data sources and impacts considered for each impact category.
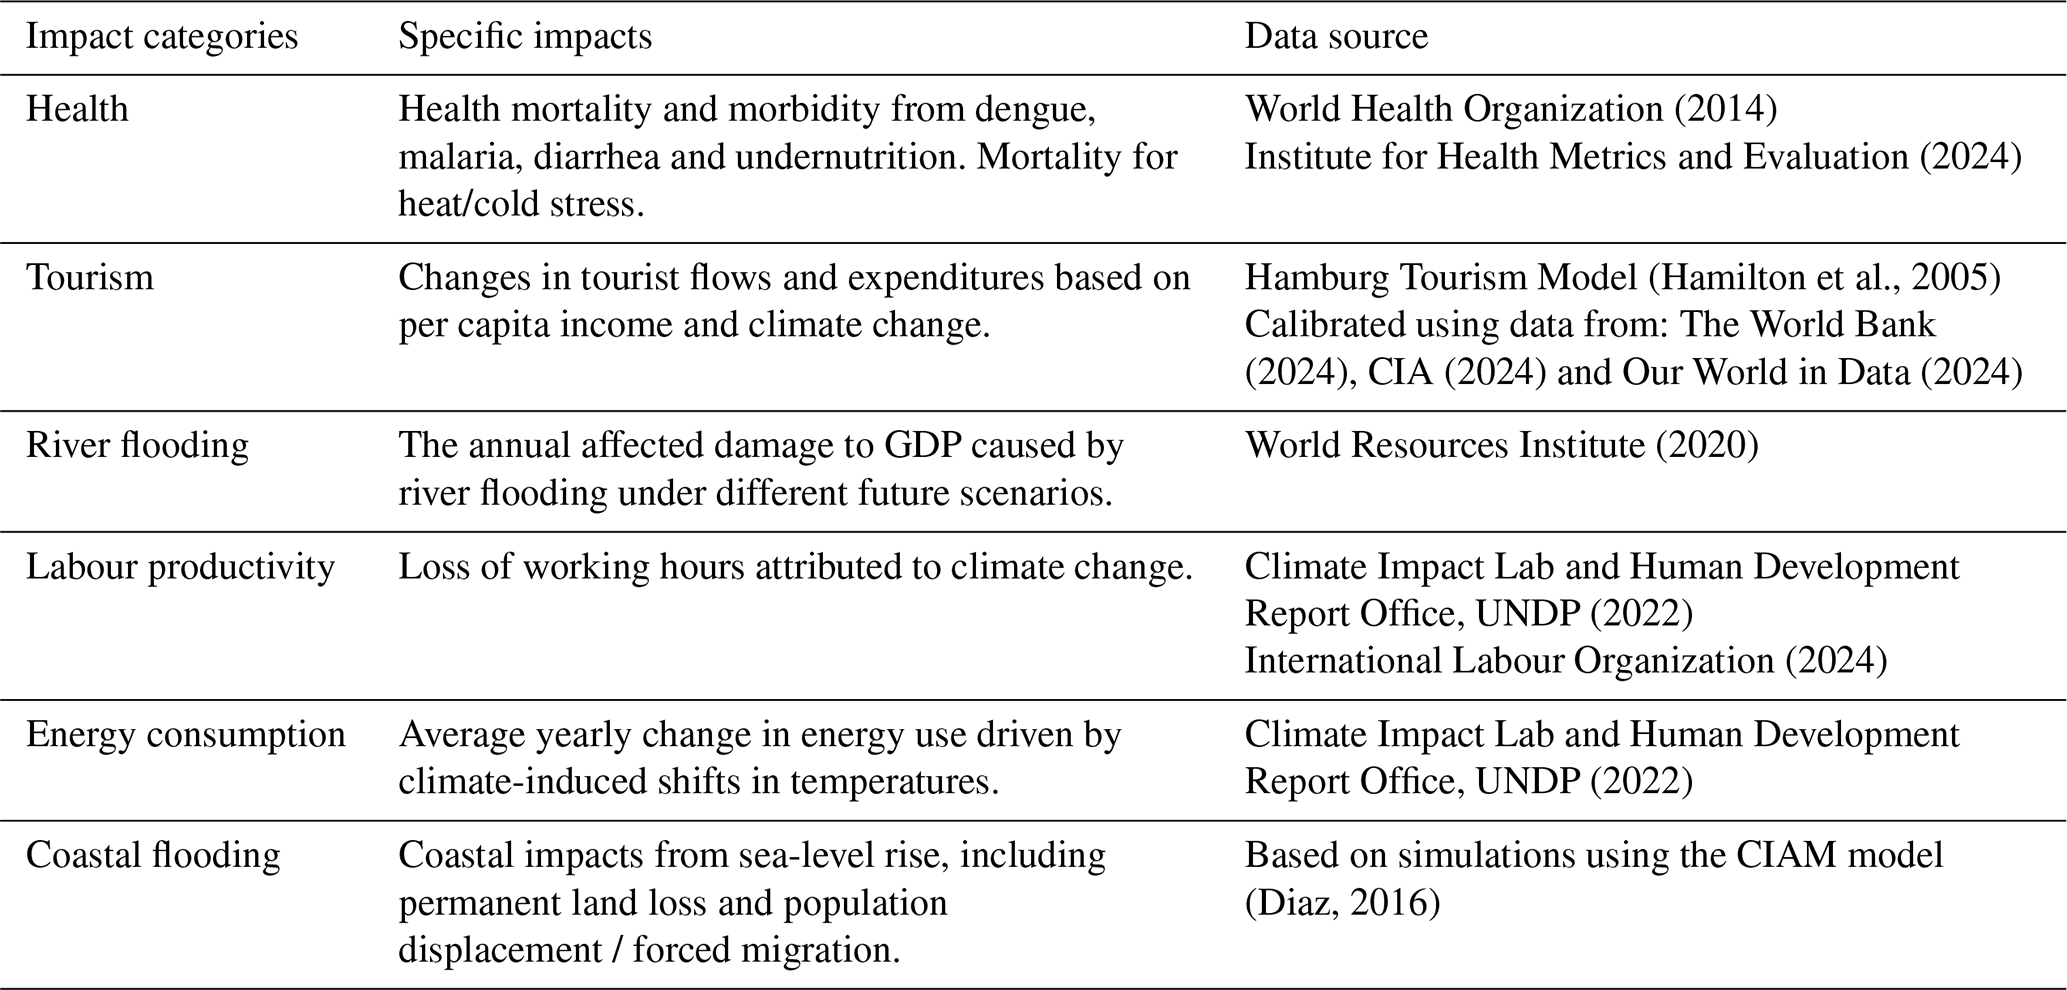
Let r index regions and t index time, and let Tt denote the global mean surface temperature increase relative to the pre-industrial period. The gross damages in region r at time t are given by:
The regional calibration parameters α1,r, …, α4,r are provided in Table D2.
Table D2Regional damage function parameters used in the model.
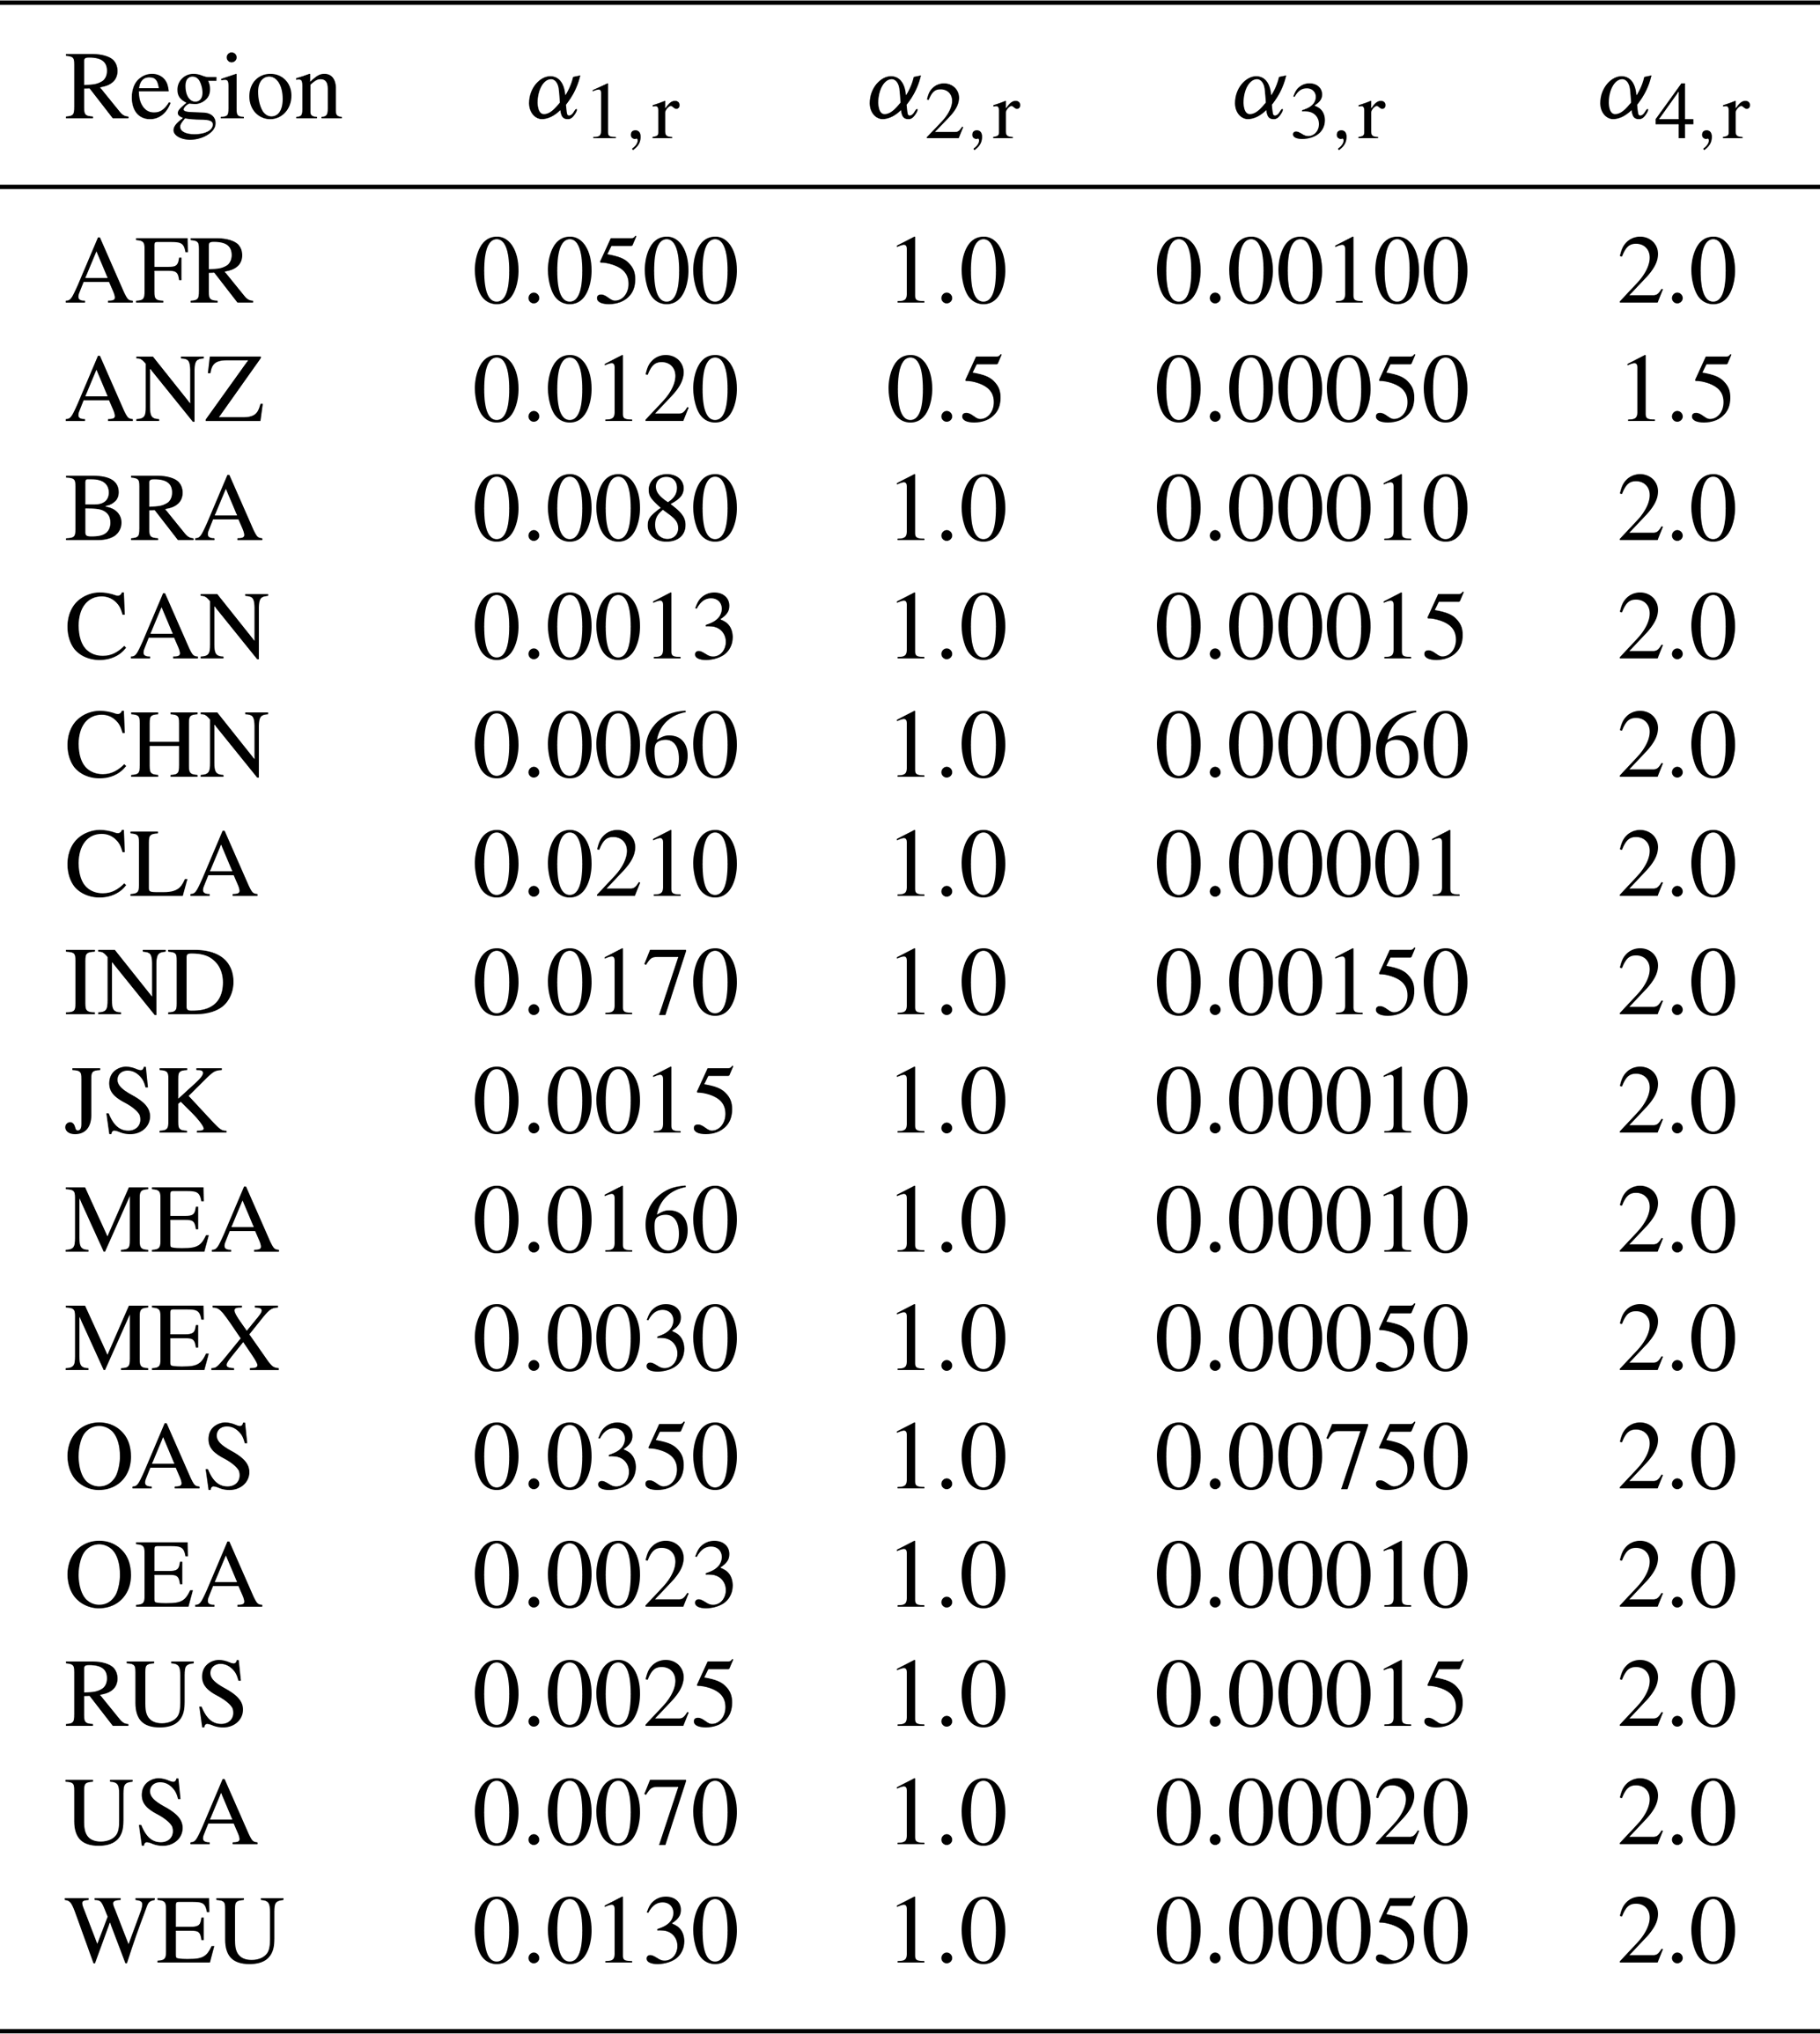
D2 Adaptation structure and calibration
Two types of adaptation are distinguished based on their differences in the flow of adaptation benefits over time. Flow (reactive) adaptation option, FADr,t, reflects expenditures on short-lived or operational measures whose impact is felt within the same period as their costs. Stock (proactive) adaptation, SADr,t, represents adaptation capital that is built up over time and provides protection services over future periods. These two types of adaptation reduce gross damages to residual damages, where the total adaptation/protection, PTr,t, is modeled by a constant elasticity of substitution (CES) function:
where σ is the elasticity of substitution between stock and flow adaptation, and β1,r, β2,r, and β3,r are calibration parameters. This CES structure governs the trade-off between reactive and proactive measures and allows us to explore how different assumptions about substitutability affect adaptation outcomes. Stock adaptation evolves through investment and depreciation, and total adaptation expenditures in a given period are the total of reactive spending and proactive investment in adaptation capital. From the total protection function, the adaptation / protection level is calculated. Residual damages, RDr,t, are then obtained by reducing gross damages by the achieved protection level as follows:
Total climate-related impacts are finally given by the sum of residual damages and adaptation expenditures.
Drawing on the data sources summarized in Table D1, complemented by insights from the broader adaptation literature, we construct temperature-dependent profiles for (i) the fraction of gross climate damages that can be feasibly avoided through adaptation and (ii) the associated adaptation expenditures, by impact category and region. For each region and impact category, we further identify the “optimal adaptation level” at which the sum of residual damages and adaptation expenditures is minimized.
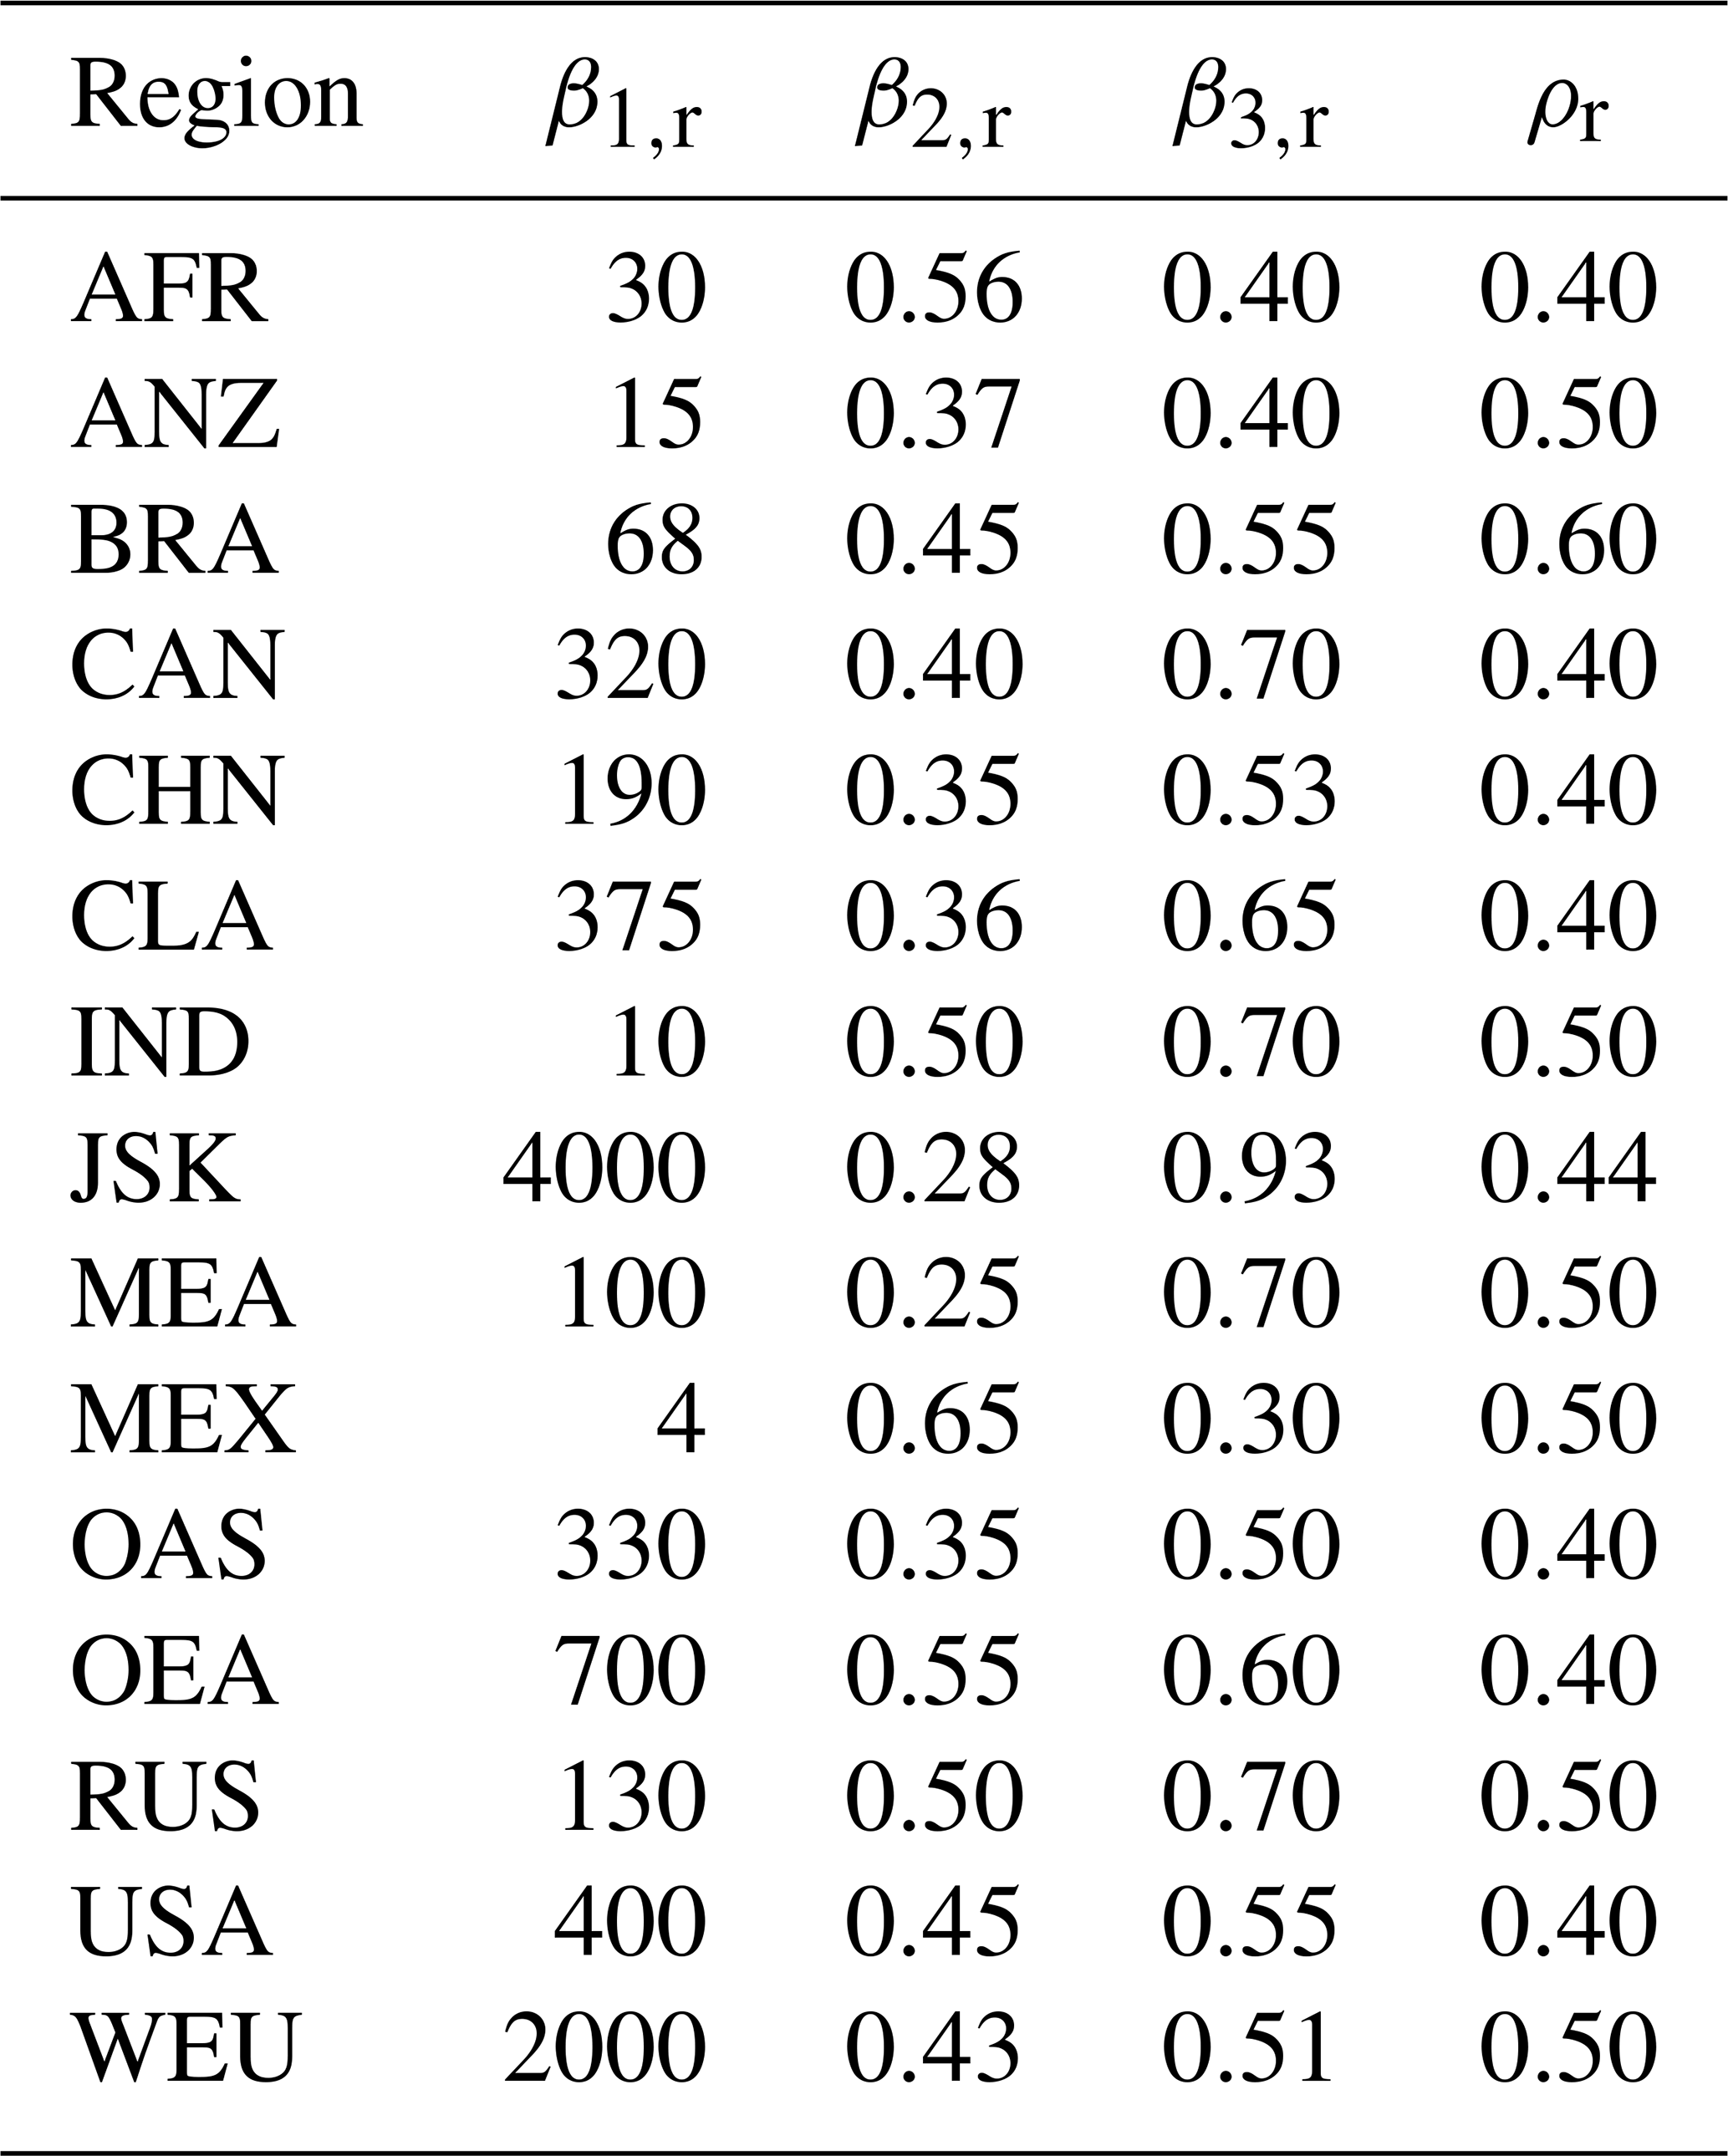
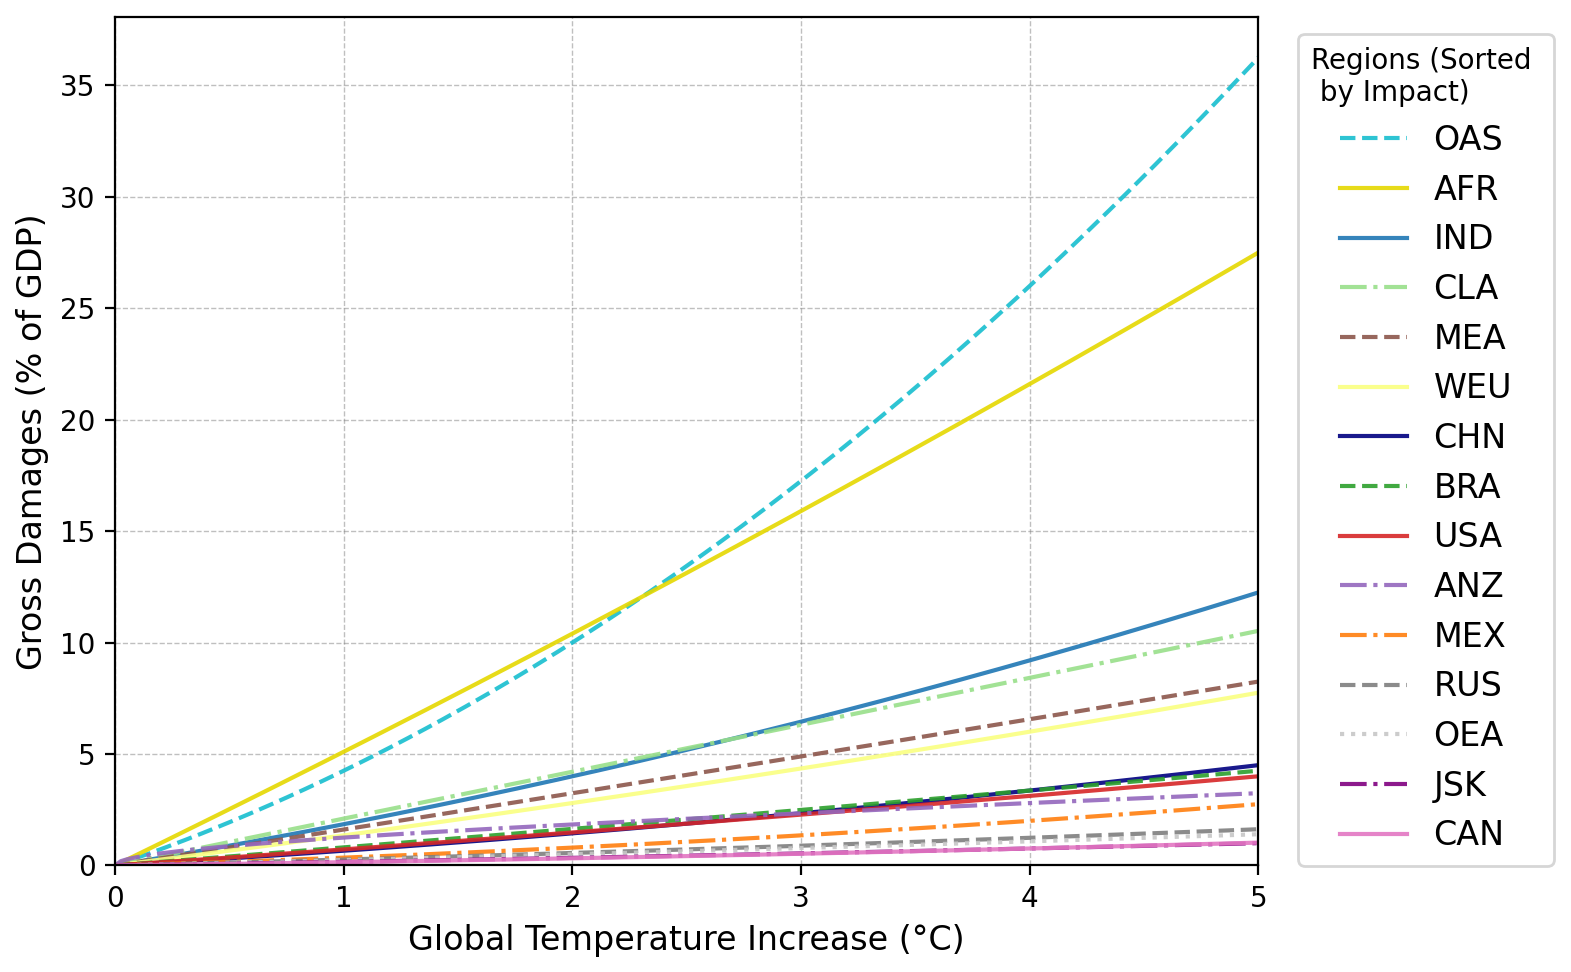
Our estimates of the modeled adaptation costs for 2035 have been compared to the UNEP (2025) Adaptation Gap Report’s modeled adaptation costs in 2035 and the adaptation finance needs. Both this article and UNEP (2025) estimate adaptation costs for each impact category and then sum them to obtain adaptation costs for each region. We both include the costs of adaptation to coastal flooding, river flooding, labor productivity, and health impacts. While we use the same model for river flooding impacts, we use different models for coastal flooding and different data for health and labor productivity impacts. We also consider the adaptation costs to tourism and energy demand impacts, whilst UNEP (2025) includes agriculture, infrastructure, fisheries, the marine environment, biodiversity and ecosystems, industry, and disaster risk reduction. The UNEP (2025) report also focuses solely on developing countries, and the composition of our MEA and Africa regions differs from theirs. Because of these differences, comparing exact values is less helpful than comparing regional rankings of adaptation costs from lowest to highest. Our ranking of regional modeled adaptation costs in 2035 is OEA < MEA < CLA < OAS < AFR, whilst the ranking of modeled adaptation costs for 2035 in UNEP (2025) is OEA < MEA < AFR < CLA < OAS. Nevertheless, UNEP (2025)’s ranking of adaptation finance needs is OEA < MEA < CLA < AFR < OAS. From this, we can see that our ranking of modeled adaptation costs is similar to the modeled costs of UNEP (2025) but more closely matches the UNEP (2025) ranking of adaptation finance needs. The exception is the ranking of OAS, but this is driven by the lack of agriculture, infrastructure, forestry, and ecosystem impacts and adaptation in our model. Based on this validation exercise, we can trust that the ranking of interregional differences in our paper broadly aligns with UNEP (2025). Here, we present only the key functional forms and concentrate on the empirical calibration procedure; for detailed information on this calibration, please see de Bruin et al. (2026).
The optimal protection and cost profiles are then aggregated to obtain regional benchmarks for (i) the share of gross damages avoided by adaptation, (ii) the decomposition of total climate-related costs into residual damages and adaptation expenditures, and (iii) the split between flow and stock adaptation at several temperature levels. These calibration targets are summarized in Fig. D1. The parameters governing the CES protection function are calibrated such that the simulated protection levels, residual damages, and adaptation expenditures reproduce the regional benchmarks over the calibration temperature range. These calibration targets are summarized in Fig. D2. The calibration parameters, (β1,r, β2,r, β3,r, σ), are provided in Table D3.
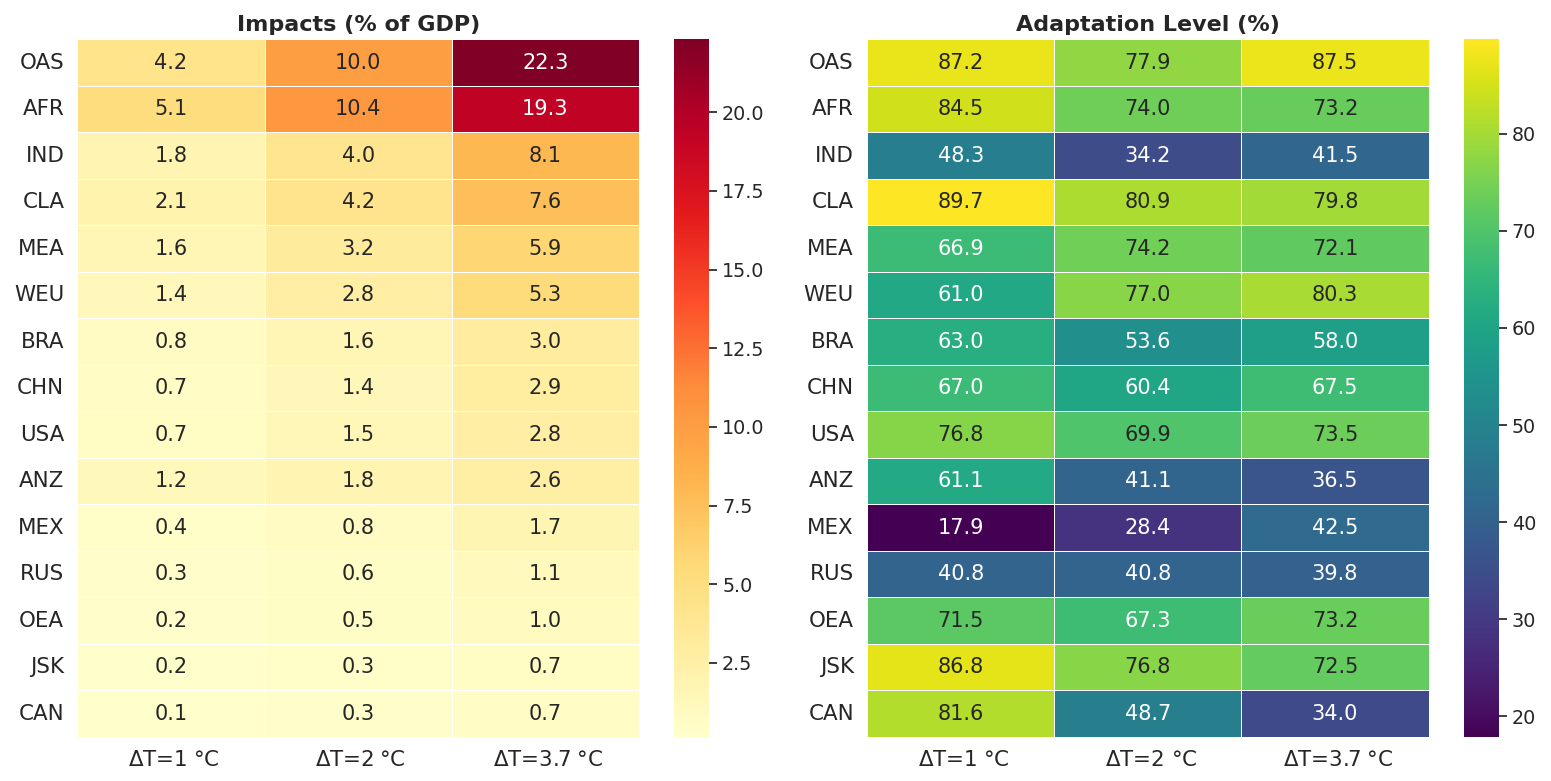
Figure D2Regional gross climate damages and percentage of gross damages avoided by adaptation at selected levels of global mean temperature change ΔT. All values are in percent.
In addition to the long-term consistency checks discussed in Sect. 3.1, we also evaluate whether the model reproduces observed or benchmark values in the base year and near-term period. This validation is particularly important because AD-MERGE 2.0's base year is 2015 and then projected forward through an intertemporal optimization framework. Therefore, the calibration must reproduce the main socioeconomic, energy-system, and emission conditions at the beginning of the simulation horizon before being used for long-term scenario analysis.
For population and GDP, AD-MERGE 2.0 follows the SSP2 version 3.0 socioeconomic assumptions used in the calibration. Population is treated as an exogenous trajectory, while GDP requires a distinction between potential GDP and realized GDP. The SSP2 GDP trajectory represents potential economic output and is used as the calibration benchmark for regional productivity and long-term growth assumptions. By contrast, realized GDP in the model is endogenous and can diverge from potential GDP because energy-system costs, mitigation efforts, and climate damages affect actual economic outcomes. In the base year and in 2020, realized GDP remains closely comparable to the SSP2 potential GDP trajectory shown in Fig. A1. Over time, however, the two measures gradually diverge as policy costs, damages, and adaptation responses affect realized production. Therefore, the projection of realized GDP are compared with AR6 scenario ensemble for SSP2 categories C7 and C8 (see Fig. 6d).
For energy variables, the base year calibration closely reproduces observed global energy use. In 2015, the global primary energy supply in AD-MERGE 2.0 is approximately 570 EJ, which is close to the observed value of about 571 EJ reported in IEA (2023b). Similarly, global final energy use is approximately 395 EJ, consistent with observed total final consumption in the same period. By 2020, the model remains close to observed global energy-system magnitudes, with primary energy supply around 580 EJ and final energy use around 395 EJ. This is closely aligned with the IEA energy balance value of 9384 Mtoe, equivalent to 393 EJ. In the IEA data, fossil fuels still dominate final energy use, with oil, coal, and natural gas together accounting for about 67 % of total final consumption. Electricity represents 18 %, while biomass accounts for 11 % (IEA, 2023b). These shares correspond to approximately 263 EJ of fossil final energy, 73 EJ of electricity, and 44 EJ of biomass in 2015 that are reproduced by the model.
For total anthropogenic GHG emissions, the updated calibration reproduces the observed near-term magnitude of global emissions. In 2015, AD-MERGE 2.0 total GHG emissions are around 55 Gt CO2 per year, consistent with historical estimates for the mid-2010s. By 2020, total GHG emissions remain close to the same order of magnitude, around 56 Gt CO2 per year, despite the temporary COVID-related reduction in fossil CO2 emissions. This near-term level is consistent with the Forster et al. (2021) AR6 assessment, which reports global net anthropogenic GHG emissions of 59±6.6 Gt CO2 per year in 2019. As shown in Fig. 6a, AD-MERGE 2.0 therefore corrects the lower near-term emissions in AD-MERGE 1.0 and provides a more realistic starting point for the Baseline trajectory. The same figure also places the long-term Baseline trajectory within the relevant high-warming scenario range, while Fig. 6b–d compare 2100 regional primary energy supply, electricity generation, and realized GDP with the SSP2 C7–C8 scenarios from the AR6 scenario ensemble (Byers et al., 2022). Therefore, the validation combines two checks: consistency with observed base year and near-term values, and consistency of long-term outcomes with comparable IIASA AR6 scenario ranges.
Overall, these comparisons indicate that AD-MERGE 2.0 is well aligned with observed or benchmark socioeconomic, energy, and emission conditions in the base year and near-term period. The purpose of this validation is not to reproduce a single external pathway exactly, but to ensure that the model starts from realistic historical conditions and evolves within the range of comparable long-term IAM scenarios.
The extent of global DACCS deployment is driven by the scale of residual CO2 emissions (see Fig. F1c) and the availability of suitable geological storage sites. On the other hand, BECCS deployment is more geographically distributed (see Fig. F1b), particularly notable in regions with high biomass availability. The global deployment of DACCS is projected to be led by China, the USA, and the Middle East, owing to their substantial remaining emissions and extensive geological storage capacities. India and Russia are also expected to scale up DACCS use in accordance with their respective emissions profiles. Distinct regional deployment patterns emerge among other regions observed: regions with high mitigation ambition, such as Western Europe, Canada, and Australia and New Zealand, demonstrate a greater reliance on DACCS for achieving deep decarbonization; however, regions with more limited commitments, Other Asia and Other Eurasia, make comparatively greater use of BECCS and deploy less DACCS. By integrating DACCS and BECCS into AD-MERGE 2.0, the model expands its negative emission portfolio, allowing a detailed analysis of how regions can fulfill national pledges and progress toward long-term net-zero objectives. The BECCS and DACCS deployment levels reported in this study should be interpreted in light of the model structure described in the methodology. In particular, BECCS deployment reflects the broad regional biomass/resource potential and techno-economic assumptions adopted in AD-MERGE 2.0. Accordingly, the reported BECCS trajectories should be interpreted as model-based mitigation outcomes within the current aggregated framework. DACCS is also not subject to direct land-use constraints, and its deployment remains conditional on assumed technology costs, energy-system integration, and overall mitigation requirements. The reported CDR levels should therefore be read as scenario outcomes conditional on the current model structure.
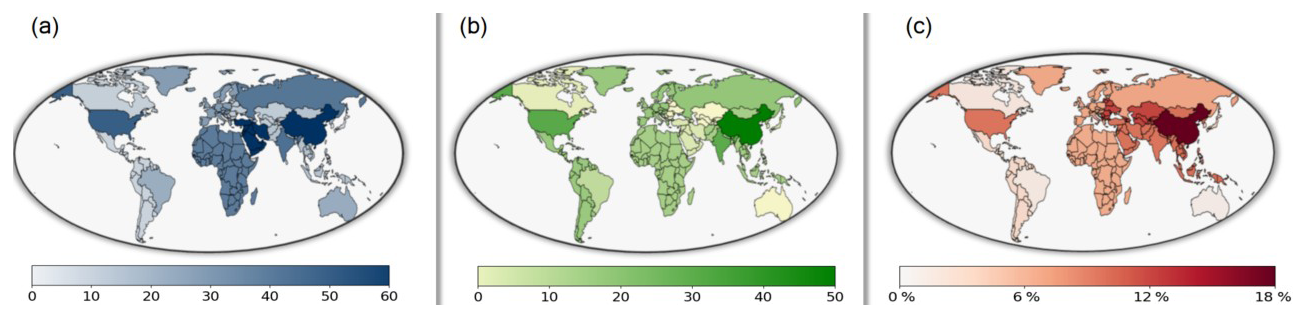
Figure F1Regional cumulative deployment of (a) direct air carbon capture and storage (DACCS) and (b) bioenergy with carbon capture and storage (BECCS), alongside (c) cumulative CO2 emissions under the Announced Pledges Scenario (APS) for each region from 2015 to 2100.
AD-MERGE 2.0 described in this paper is available on Zenodo (https://doi.org/10.5281/zenodo.20044090, Amirmoeini et al., 2026). All datasets embedded within the AD-MERGE 2.0 and scenario inputs are accessible via the model code download on Zenodo (https://doi.org/10.5281/zenodo.20044090, Amirmoeini et al., 2026) and GitHub (https://github.com/G-IAM/AD-MERGE-2.0).
The supplement related to this article is available online at https://doi.org/10.5194/gmd-19-8081-2026-supplement.
KA, OB, KDB, and POP contributed to the study conception and design. Material preparation, data collection, and analysis were performed by KA, KDB, and KE. KA developed the software and visualization. HKP assisted with the investigation. OB and POP provided supervision, funding acquisition, and resources. KA led the writing of the original draft preparation of the paper with contributions from KDB, OB, and HKP. All authors contributed to the review and editing of the manuscript.
The contact author has declared that none of the authors has any competing interests.
Publisher's note: Copernicus Publications remains neutral with regard to jurisdictional claims made in the text, published maps, institutional affiliations, or any other geographical representation in this paper. The authors bear the ultimate responsibility for providing appropriate place names. Views expressed in the text are those of the authors and do not necessarily reflect the views of the publisher.
The authors express their gratitude to Frédérik Lavictoire for developing and providing a customizable DataFrame plotter in Python, which enhanced the visualization of the GAMS results in Python. This tool, available on GitHub, can be accessed at Customizable Semi-Automatic Graphs in Python (https://github.com/fredlavic/Customizable-Semi-Automatic-Graphs-in-Python, last access: 5 May 2024). The authors acknowledge the use of OpenAI ChatGPT for language editing and proofreading; all scientific content and conclusions are the authors' own.
The authors would like to express their sincere gratitude for the financial support provided by the National Research Council Canada, Canada, under contract no. 1004188; and the Chair in Energy Sector Management at HEC Montréal.
This paper was edited by Dalei Hao and reviewed by Page Kyle and two anonymous referees.
Aaheim, A., Amundsen, H., Dokken, T., and Wei, T.: Impacts and adaptation to climate change in European economies, Global Environ. Change, 22, 959–968, https://doi.org/10.1016/j.gloenvcha.2012.06.005, 2012. a, b
Aaheim, H. A., Orlov, A., Wei, T., and Glomsrød, S.: GRACE model and applications, report no. 2018:01, CICERO Center for International Climate Research, Oslo, Norway, https://hdl.handle.net/11250/2480843 (last access: 12 May 2025), 2018. a
Agrawala, S., Bosello, F., Carraro, C., De Bruin, K., De Cian, E., Dellink, R., and Lanzi, E.: Plan or react? Analysis of adaptation costs and benefits using integrated assessment models, Clim. Change Econ., 2, 175–208, https://doi.org/10.1142/S2010007811000267, 2011a. a, b
Agrawala, S., Bosello, F., Carraro, C., De Cian, E., and Lanzi, E.: Adapting to climate change: costs, benefits, and modelling approaches, Int. Rev. Environ. Resour. Econ., 5, 245–284, https://doi.org/10.1561/101.00000043, 2011b. a
Agrawala, S., Matus Kramer, A., Prudent-Richard, G., Sainsbury, M., and Schreitter, V.: Incorporating climate change impacts and adaptation in environmental impact assessments: opportunities and challenges, Clim. Dev., 4, 26–39, https://doi.org/10.1080/17565529.2011.628791, 2012. a
Amirmoeini, K., Bahn, O., de Bruin, K., Everett, K., Kouchaki-Penchah, H., and Pineau, P.-O.: AD-MERGE 2.0 Integrated Assessment Model, Zenodo [code and data set], https://doi.org/10.5281/zenodo.20044090, 2026 (code also available at: https://github.com/G-IAM/AD-MERGE-2.0, last access: 5 May 2026). a, b
Anthoff, D. and Tol, R. S.: The climate framework for uncertainty, negotiation and distribution (FUND): Technical description, version 3.6, FUND Doc, https://www.fund-model.org/files/documentation/Fund-3-7-Scientific-Documentation.pdf (last access: 12 May 2025), 2014. a
Aryanpur, V., O'Gallachoir, B., Dai, H., Chen, W., and Glynn, J.: A review of spatial resolution and regionalisation in national-scale energy systems optimisation models, Energ. Strat. Rev., 37, 100702, https://doi.org/10.1016/j.esr.2021.100702, 2021. a, b
Awais, M., Vinca, A., Byers, E., Frank, S., Fricko, O., Boere, E., Burek, P., Poblete Cazenave, M., Kishimoto, P. N., Mastrucci, A., Satoh, Y., Palazzo, A., McPherson, M., Riahi, K., and Krey, V.: MESSAGEix-GLOBIOM nexus module: integrating water sector and climate impacts, Geosci. Model Dev., 17, 2447–2469, https://doi.org/10.5194/gmd-17-2447-2024, 2024. a
Bahn, O. and Kypreos, S.: Incorporating different endogenous learning formulations in MERGE, Int. J. Global Energ. Issu., 19, 333–358, https://doi.org/10.1504/IJGEI.2003.003199, 2003. a
Bahn, O., Edwards, N. R., Knutti, R., and Stocker, T. F.: Energy policies avoiding a tipping point in the climate system, Energy Policy, 39, 334–348, https://doi.org/10.1016/j.enpol.2010.10.002, 2011. a
Bahn, O., Chesney, M., and Gheyssens, J.: The effect of proactive adaptation on green investment, Environ. Sci. Policy, 18, 9–24, https://doi.org/10.1016/j.envsci.2011.10.010, 2012. a
Bahn, O., Chesney, M., Gheyssens, J., Knutti, R., and Pana, A. C.: Is there room for geoengineering in the optimal climate policy mix?, Environ. Sci. Policy, 48, 67–76, https://doi.org/10.1016/j.envsci.2014.12.014, 2015. a
Bahn, O., de Bruin, K., and Fertel, C.: Will adaptation delay the transition to clean energy systems? An analysis with AD-MERGE, Energy J., 40, https://doi.org/10.5547/01956574.40.4.obah, 2019. a, b, c, d, e
Bastien-Olvera, B. A. and Moore, F. C.: Use and non-use value of nature and the social cost of carbon, Nat. Sustain., 4, 101–108, https://doi.org/10.1038/s41893-020-00615-0, 2021. a
Baumstark, L., Bauer, N., Benke, F., Bertram, C., Bi, S., Gong, C. C., Dietrich, J. P., Dirnaichner, A., Giannousakis, A., Hilaire, J., Klein, D., Koch, J., Leimbach, M., Levesque, A., Madeddu, S., Malik, A., Merfort, A., Merfort, L., Odenweller, A., Pehl, M., Pietzcker, R. C., Piontek, F., Rauner, S., Rodrigues, R., Rottoli, M., Schreyer, F., Schultes, A., Soergel, B., Soergel, D., Strefler, J., Ueckerdt, F., Kriegler, E., and Luderer, G.: REMIND2.1: transformation and innovation dynamics of the energy-economic system within climate and sustainability limits, Geosci. Model Dev., 14, 6571–6603, https://doi.org/10.5194/gmd-14-6571-2021, 2021. a
BGR: Bundesanstalt für Geowissenschaften und Rohstoffe: BGR Energy Data 2021 – German and Global Energy Supplies, https://doi.org/10.25928/es-2023-tab-en, 2022. a
Bianco, V., Driha, O. M., and Sevilla-Jiménez, M.: Effects of renewables deployment in the Spanish electricity generation sector, Util. Policy, 56, 72–81, https://doi.org/10.1016/j.jup.2018.11.001, 2019. a
Bosello, F., Dasgupta, S., Parrado, R., Standardi, G., and van der Wijst, K.-I.: Revisiting the Concept of Damage Functions, Tech. rep., COACCH Project, deliverable D4.3, Macroeconomic Assessment of Policy Effectiveness, H2020 COACCH Project, Deliverable D4.3, https://www.coacch.eu/wp-content/uploads/2018/03/D4.3_revMAR2022.pdf (last access: 12 May 2025), 2021. a
Bouaboula, H., Chaouki, J., Belmabkhout, Y., and Zaabout, A.: Comparative review of Direct air capture technologies: From technical, commercial, economic, and environmental aspects, Chem. Eng. J., 484, 149411, https://doi.org/10.1016/j.cej.2024.149411, 2024. a, b, c
Burke, M., Hsiang, S. M., and Miguel, E.: Global non-linear effect of temperature on economic production, Nature, 527, 235–239, https://doi.org/10.1038/nature15725, 2015. a
Burke, M., Alampay Davis, W. M., and Diffenbaugh, N. S.: Large potential reduction in economic damages under UN mitigation targets, Nature, 557, 549–553, https://doi.org/10.1038/s41586-018-0071-9, 2018. a
Byers, E., Krey, V., Kriegler, E., Riahi, K., Schaeffer, R., Kikstra, J., Lamboll, R., Nicholls, Z., Sandstad, M., Smith, C., van der Wijst, K., Al-Khourdajie, A., Lecocq, F., Portugal-Pereira, J., Saheb, Y., Stromann, A., Winkler, H., Auer, C., Brutschin, E., Gidden, M., Hackstock, P., Harmsen, M., Huppmann, D., Kolp, P., Lepault, C., Lewis, J., Marangoni, G., Müller-Casseres, E., Skeie, R., Werning, M., Calvin, K., Forster, P., Guivarch, C., Hasegawa, T., Meinshausen, M., Peters, G., Rogelj, J., Samset, B., Steinberger, J., Tavoni, M., and van Vuuren, D.: AR6 Scenarios Database, Zenodo [data set], https://doi.org/10.5281/zenodo.5886911, 2022. a, b
Calvin, K., Patel, P., Clarke, L., Asrar, G., Bond-Lamberty, B., Cui, R. Y., Di Vittorio, A., Dorheim, K., Edmonds, J., Hartin, C., Hejazi, M., Horowitz, R., Iyer, G., Kyle, P., Kim, S., Link, R., McJeon, H., Smith, S. J., Snyder, A., Waldhoff, S., and Wise, M.: GCAM v5. 1: representing the linkages between energy, water, land, climate, and economic systems, Geosci. Model Dev., 12, 677–698, https://doi.org/10.5194/gmd-12-677-2019, 2019. a
Carrara, S. and Marangoni, G.: Including system integration of variable renewable energies in a constant elasticity of substitution framework: the case of the WITCH model, Energy Econ., 64, 612–626, https://doi.org/10.1016/j.eneco.2016.08.017, 2017. a, b, c
Carton, W., Hougaard, I.-M., Markusson, N., and Lund, J. F.: Is carbon removal delaying emission reductions?, Wiley Interdisciplin. Rev.: Clim. Change, 14, e826, https://doi.org/10.1002/wcc.826, 2023. a
CIA: Field Listing – Coasline from The World Factbook, https://www.cia.gov/the-world-factbook/field/coastline/ (last access: 17 June 2024), 2024. a
Climate Impact Lab and Human Development Report Office, UNDP: Human Climate Horizons. Compare Impacts, Tech. rep., https://horizons.hdr.undp.org/ (last access: 11 June 2024), 2022. a, b
Cuaresma, J. C.: Income projections for climate change research: A framework based on human capital dynamics, Global Environ. Change, 42, 226–236, https://doi.org/10.1016/j.gloenvcha.2015.02.012, 2017. a, b
de Bruin, K., Dellink, R., and Agrawala, S.: Economic aspects of adaptation to climate change: integrated assessment modelling of adaptation costs and benefits, OECD Environment Working Papers, No. 6, OECD Publishing, Paris, https://doi.org/10.1787/225282538105, 2009a. a, b, c, d
de Bruin, K., Everett, K., and Cassidy, D.: Developing data-driven damage and adaptation functions for Integrated Assessment Models: An application in AD-MERGE 2.0, ESRI Working Paper 838, ESRI, https://www.esri.ie/publications/developing-data-driven-damage-and-adaptation-functions-for-integrated -assessment (last access: 13 July 2026), 2026. a, b, c, d, e
de Bruin, K. C., Dellink, R. B., and Tol, R. S.: AD-DICE: an implementation of adaptation in the DICE model, Climatic Change, 95, 63–81, https://doi.org/10.1007/s10584-008-9535-5, 2009b. a
Diaz, D. B.: Estimating global damages from sea level rise with the Coastal Impact and Adaptation Model (CIAM), Climatic Change, 137, 143–156, 2016. a
DOE: DOE Hydrogen and Fuel Cells Program Record 19009: Hydrogen Production Cost from PEM Electrolysis, Tech. rep., https://www.hydrogen.energy.gov/docs/hydrogenprogramlibraries/pdfs/19009_h2_production_cost_pem_electrolysis_2019.pdf (last access: 4 April 2024), 2020. a
Doelman, J. C., Stehfest, E., Tabeau, A., van Meijl, H., Lassaletta, L., Gernaat, D. E., Hermans, K., Harmsen, M., Daioglou, V., Biemans, H., van der Sluis, S., and van Vuuren, D. P.: Exploring SSP land-use dynamics using the IMAGE model: Regional and gridded scenarios of land-use change and land-based climate change mitigation, Global Environ. Change, 48, 119–135, https://doi.org/10.1016/j.gloenvcha.2017.11.014, 2018. a
Edelenbosch, O. Y., Hof, A. F., van den Berg, M., de Boer, H. S., Chen, H.-H., Daioglou, V., Dekker, M. M., Doelman, J. C., den Elzen, M. G. J., Harmsen, M., Mikropoulos, S., van Sluisveld, M. A. E., Stehfest, E., Tagomori, I. S., van Zeist, W.-J., and van Vuuren, D. P.: Reducing sectoral hard to abate emissions to limit reliance of Carbon Dioxide Removal in 1.5 °C scenarios, Nat. Clim. Change, 14, 715–722, https://doi.org/10.1038/s41558-024-02025-y, 2024. a
Emmerling, J., Drouet, L., Reis, L. A., Bevione, M., Berger, L., Bosetti, V., Carrara, S., De Cian, E., D'Aertrycke, G. D. M., Longden, T., Malpede, M., Marangoni, G., Sferra, F., Tavoni, M., Witajewski-Baltvilks, J., and Havlik, P.: The WITCH 2016 model-documentation and implementation of the shared socioeconomic pathways, https://hdl.handle.net/10419/142316 (last access: 12 May 2025), 2016. a, b
Eurek, K., Sullivan, P., Gleason, M., Hettinger, D., Heimiller, D., and Lopez, A.: An improved global wind resource estimate for integrated assessment models, Energy Econ., 64, 552–567, https://doi.org/10.1016/j.eneco.2016.11.015, 2017. a
Filatova, T., Taberna, A., Chatzivasileiadis, T., and Cortés Arbués, I.: Private sector investments in climate change adaptation, Nat. Clim. Change, 15, 1249–1256, 2025. a
Forster, P., Storelvmo, T., Armour, K., Collins, W., Dufresne, J.-L., Frame, D., Lunt, D., Mauritsen, T., Palmer, M., Watanabe, M., Wild, M., and Zhang, H.: The Earth's energy budget, climate feedbacks, and climate sensitivity, in: Climate Chang 2021: The Physical Science Basis, Contribution of Working Group I to the Sixth Assessment Report of the Intergovernmental Panel on Climate Change, edited by: Masson-Delmotte, V., Zhai, P., Pirani, A., Connors, S. L., Péan, C., Berger, S., Caud, N., Chen, Y., Goldfarb, L., Gomis, M. I., Huang, M., Leitzell, K., Lonnoy, E., Matthews, J. B. R., Maycock, T. K., Waterfield, T., Yelekçi, O., Yu, R., and Zhou, B., Cambridge University Press, Cambridge, UK and New York, NY, USA, 923–1054, https://doi.org/10.1017/9781009157896.009, 2021. a, b
Fuhrman, J., McJeon, H., Doney, S. C., Shobe, W., and Clarens, A. F.: From zero to hero?: why integrated assessment modeling of negative emissions technologies is hard and how we can do better, Front. Clim., 1, 11, https://doi.org/10.3389/fclim.2019.00011, 2019. a
Fuhrman, J., Clarens, A., Calvin, K., Doney, S. C., Edmonds, J. A., O'Rourke, P., Patel, P., Pradhan, S., Shobe, W., and McJeon, H.: The role of direct air capture and negative emissions technologies in the shared socioeconomic pathways towards +1.5 °C and +2 °C futures, Environ. Res. Lett., 16, 114012, https://doi.org/10.1088/1748-9326/ac2db0, 2021. a
Fujimori, S., Masui, T., and Matsuoka, Y.: AIM/CGE V2.0 model formula, Post-2020 climate action: Global and Asian perspectives, edited by: Fujimori, S., Kainuma, M., and Masui, T., Springer, Singapore, 201–303, https://doi.org/10.1007/978-981-10-3869-3_12, 2017. a
Füssel, H.-M.: Modeling impacts and adaptation in global IAMs, Wiley Interdisciplin. Rev.: Clim. Change, 1, 288–303, https://doi.org/10.1002/wcc.40, 2010. a
Gazzotti, P., Emmerling, J., Marangoni, G., Castelletti, A., v. d. Wijst, K.-I., Hof, A., and Tavoni, M.: Persistent inequality in economically optimal climate policies, Nat. Commun., 12, 3421, https://doi.org/10.1038/s41467-021-23613-y, 2021. a
Ghaboulian Zare, S., Amirmoeini, K., Bahn, O., Baker, R. C., Mousseau, N., Neshat, N., Trépanier, M., and Wang, Q.: The role of hydrogen in integrated assessment models: A review of recent developments, Renew. Sustain. Energ. Rev., 215, 115544, https://doi.org/10.1016/j.rser.2025.115544, 2025. a
Gong, C. C., Ueckerdt, F., Pietzcker, R., Odenweller, A., Schill, W.-P., Kittel, M., and Luderer, G.: Bidirectional coupling of the long-term integrated assessment model REgional Model of INvestments and Development (REMIND) v3.0.0 with the hourly power sector model Dispatch and Investment Evaluation Tool with Endogenous Renewables (DIETER) v1.0.2, Geosci. Model Dev., 16, 4977–5033, https://doi.org/10.5194/gmd-16-4977-2023, 2023. a, b, c, d
Gorman, W., Mills, A., and Wiser, R.: Improving estimates of transmission capital costs for utility-scale wind and solar projects to inform renewable energy policy, Energy Policy, 135, 110994, https://doi.org/10.1016/j.enpol.2019.110994, 2019. a
Grant, N., Gambhir, A., Mittal, S., Greig, C., and Köberle, A. C.: Enhancing the realism of decarbonisation scenarios with practicable regional constraints on CO2 storage capacity, Int. J. Greenhouse Gas Control, 120, 103766, https://doi.org/10.1016/j.ijggc.2022.103766, 2022. a
Hamilton, J. M., Maddison, D. J., and Tol, R. S.: Effects of climate change on international tourism, Clim. Res., 29, 245–254, https://doi.org/10.3354/cr029245, 2005. a
Hendriks, C., Graus, W., and van Bergen, F.: Global carbon dioxide storage potential and costs, Ecofys, Utrecht, https://www.researchgate.net/publication/260095614 (last access: 30 September 2024), 2004. a
Hilaire, J. and Bertram, C.: The remind-magpie model and scenarios for transition risk analysis, A report, https://publications.pik-potsdam.de/rest/items/item_24665_4/component/file_24697/content (last access: 12 May 2025), 2020. a, b
Howard, P. H. and Sterner, T.: Few and not so far between: a meta-analysis of climate damage estimates, Environ. Resour. Econ., 68, 197–225, https://doi.org/10.1007/s10640-017-0166-z, 2017. a, b
Hydrogen Council: Global Hydrogen Flows: Hydrogen Trade as a Key Enabler for Efficient Decarbonization, Tech. rep., https://hydrogencouncil.com/en/global-hydrogen-flows/ (last access: 4 April 2024), 2022. a
IAMC: The common integrated assessment model (IAM) documentation, https://www.iamcdocumentation.eu/index.php/IAMC_wiki (last access: 12 December 2024), 2024. a
IEA: World Energy Outlook 2017, IEA, Paris, https://www.iea.org/reports/world-energy-outlook-2017 (last access: 10 November 2023), 2017. a
IEA: Projected Costs of Generating Electricity 2020, IEA, Paris, https://www.iea.org/reports/projected-costs-of-generating-electricity-2020 (last access: 10 November 2023), 2020a. a, b
IEA: Introduction to System Integration of Renewables, Paris, https://www.iea.org/reports/introduction-to-system-integration-of-renewables (last acess: November 2023), 2020b. a, b, c
IEA: Global Hydrogen Review 2023, Tech. Rep., International Energy Agency, Paris, https://www.iea.org/reports/global-hydrogen-review-2023 (last access: 14 April 2024), 2023a. a
IEA: World Energy Outlook 2023, IEA, Paris, https://www.iea.org/reports/world-energy-outlook-2023 (last access: 15 January 2025), 2023b. a, b, c, d, e
IEA: Energy Statistics Data Browser, https://www.iea.org/data-and-statistics/data-tools/energy-statistics-data-browser (last access: 12 April 2024), 2023c. a
IIASA: SSP Database (Shared Socioeconomic Pathways) – Version 3.2, https://data.ece.iiasa.ac.at/ssp (last access: 31 May 2024), 2024a. a, b, c
IIASA: SSP Scenario Explorer 3.0.1, https://data.ece.iiasa.ac.at/ssp/#/workspaces (last access: 1 April 2024), 2024b. a, b
Institute for Health Metrics and Evaluation: Global Burden of Disease Results, IHME, University of Washington, Seattle, https://vizhub.healthdata.org/gbd-results/ (last access: 13 June 2024), 2024. a
International Energy Agency: Global Hydrogen Review 2022, Tech. rep., International Energy Agency, Paris, https://www.iea.org/reports/global-hydrogen-review-2022 (last access: 1 September 2024), 2022. a
International Labour Organization: ILOSTAT Data Portal, https://ilostat.ilo.org/data/ (last access: 19 March 2024), 2024. a
IPCC: Climate Change 1995: Economic and Social Dimensions of Climate Change, in: Contribution of Working Group III to the Second Assessment Report of the Intergovernmental Panel on Climate Change, Cambridge University Press, Cambridge, UK and New York, NY, USA, ISBN 978-0-521-56854-8, 1996. a
IPCC: Annex I: Glossary, edited by: Matthews, J. B. R., in: Global Warming of 1.5 °C. An IPCC Special Report on the impacts of global warming of 1.5 °C above pre-industrial levels and related global greenhouse gas emission pathways, in the context of strengthening the global response to the threat of climate change, sustainable development, and efforts to eradicate poverty, edited by: Masson-Delmotte, V., Zhai, P., Pörtner, H.-O., Roberts, D., Skea, J., Shukla, P. R., Pirani, A., Moufouma-Okia, W., Péan, C., Pidcock, R., Connors, S., Matthews, J. B. R., Chen, Y., Zhou, X., Gomis, M. I., Lonnoy, E., Maycock, T., Tignor, M., and Waterfield, T., Cambridge University Press, Cambridge, UK and New York, NY, USA, 541–562, https://doi.org/10.1017/9781009157940.008., 2018. a
IPCC: Climate Change 2022: Mitigation of Climate Change, in: Contribution of Working Group III to the Sixth Assessment Report of the Intergovernmental Panel on Climate Change, Cambridge University Press, Cambridge, UK and New York, NY, USA, https://doi.org/10.1017/9781009157926, 2022a. a, b, c, d, e, f
IPCC: Climate Change 2022: Impacts, Adaptation and Vulnerability, in: Contribution of Working Group II to the Sixth Assessment Report of the Intergovernmental Panel on Climate Change, Cambridge University Press, Cambridge, UK and New York, NY, USA, https://doi.org/10.1017/9781009325844, 2022b. a
IPCC: Climate Change 2023: Synthesis Report, in: Contribution of Working Groups I, II and III to the Sixth Assessment Report of the Intergovernmental Panel on Climate Change, IPCC, Geneva, Switzerland, https://doi.org/10.59327/IPCC/AR6-9789291691647, 2023. a
IRENA: Geopolitics of the Energy Transformation: The Hydrogen Factor, Report, International Renewable Energy Agency, Abu Dhabi, https://www.irena.org//-/media/Files/IRENA/Agency/Publication/2022/Jan/IRENA_Geopolitics_Hydrogen_2022.pdf (last access: 12 April 2024), 2022. a
IRENA: Renewable power generation costs in 2022, International Renewable Energy Agency, Abu Dhabi, https://www.irena.org/-/media/Files/IRENA/Agency/Publication/2023/Aug/IRENA_Renewable_power_generation_costs_in_2022.pdf (last access: 5 April 2024), 2023. a
Johnson, N., Strubegger, M., McPherson, M., Parkinson, S. C., Krey, V., and Sullivan, P.: A reduced-form approach for representing the impacts of wind and solar PV deployment on the structure and operation of the electricity system, Energy Econ., 64, 651–664, https://doi.org/10.1016/j.eneco.2016.07.010, 2017. a
Joos, M. and Staffell, I.: Short-term integration costs of variable renewable energy: Wind curtailment and balancing in Britain and Germany, Renew. Sustain. Energ. Rev., 86, 45–65, https://doi.org/10.1016/j.rser.2018.01.009, 2018. a
KC, S., Moradhvaj, Potancokova, M., Adhikari, S., Yildiz, D., Mamolo, M., Sobotka, T., Zeman, K., Abel, G., Lutz, W., and Goujon, A.: Wittgenstein Center (WIC) Population and Human Capital Projections – 2023, Zenodo [data set], https://doi.org/10.5281/zenodo.10618931, 2024. a, b
Keppo, I., Butnar, I., Bauer, N., Caspani, M., Edelenbosch, O., Emmerling, J., Fragkos, P., Guivarch, C., Harmsen, M., Lefèvre, J., Le Gallic, T., Leimbach, M., McDowall, W., Mercure, J.-F., Schaeffer, R., Trutnevyte, E., and Wagner, F.: Exploring the possibility space: taking stock of the diverse capabilities and gaps in integrated assessment models, Environ. Res. Lett., 16, 053006, https://doi.org/10.1088/1748-9326/abe5d8, 2021. a, b, c, d
Kouchaki-Penchah, H., Bahn, O., Bashiri, H., Bedard, S., Bernier, E., Elliot, T., Hammache, A., Vaillancourt, K., and Levasseur, A.: The role of hydrogen in a net-zero emission economy under alternative policy scenarios, Int. J. Hydrog. Energ., 49, 173–187, https://doi.org/10.1016/j.ijhydene.2023.07.196, 2024. a
Krey, V., Havlik, P., Kishimoto, P. N., Fricko, O., Zilliacus, J., Gidden, M., Strubegger, M., Kartasasmita, G., Ermolieva, T., Forsell, N., Gusti, M., Johnson, N., Kikstra, J., Kindermann, G., Kolp, P., Lovat, F., McCollum, D. L., Min, J., Pachauri, S., Parkinson, S. C., Rao, S., Rogelj, J., Ünlü, G., Valin, H., Wagner, P., Zakeri, B., Obersteiner, M., and Riahi, K.: MESSAGEix-GLOBIOM documentation – 2020 release, Tech. rep., International Institute for Applied Systems Analysis (IIASA), Laxenburg, Austria, https://doi.org/10.22022/IACC/03-2021.17115, 2020. a, b
Kyle, G. P., Luckow, P., Calvin, K. V., Emanuel, W. R., Nathan, M., and Zhou, Y.: GCAM 3.0 agriculture and land use: data sources and methods, Tech. rep., PNNL – Pacific Northwest National Lab., Richland, WA, USA, https://doi.org/10.2172/1036082, 2011. a
Lewis, E., McNaul, S., Jamieson, M., Henriksen, M. S., Matthews, H. S., Walsh, L., Grove, J., Shultz, T., Skone, T. J., and Stevens, R.: Comparison of Commercial, State-of-the-Art, Fossil-Based Hydrogen Production Technologies, NETL, https://doi.org/10.2172/1862910, 2022. a, b, c
Lippkau, F., Franzmann, D., Addanki, T., Buchenberg, P., Heinrichs, H., Kuhn, P., Hamacher, T., and Blesl, M.: Global hydrogen and synfuel exchanges in an emission-free energy system, Energies, 16, 3277, https://doi.org/10.3390/en16073277, 2023. a
Luderer, G., Leimbach, M., Bauer, N., Kriegler, E., Baumstark, L., Bertram, C., Giannousakis, A., Hilaire, J., Klein, D., Levesque, A., Mouratiadou, I., Pehl, M., Pietzcker, R., Piontek, F., Roming, N., Schultes, A., Schwanitz, V. J., and Strefler, J.: Description of the REMIND model (Version 1.6), SSRN, https://doi.org/10.2139/ssrn.2697070, 2015. a, b
Manne, A., Mendelsohn, R., and Richels, R.: MERGE: A model for evaluating regional and global effects of GHG reduction policies, Energy Policy, 23, 17–34, https://doi.org/10.1016/0301-4215(95)90763-W, 1995. a, b, c
Marcucci, A. and Turton, H.: Swiss energy strategies under global climate change and nuclear policy uncertainty, Swiss J. Econ. Stat., 148, 317–345, https://doi.org/10.1007/BF03399369, 2012. a
Martínez-Gordón, R., Morales-España, G., Sijm, J., and Faaij, A.: A review of the role of spatial resolution in energy systems modelling: Lessons learned and applicability to the North Sea region, Renew. Sustain. Energ. Rev., 141, 110857, https://doi.org/10.1016/j.rser.2021.110857, 2021. a
McPherson, M., Johnson, N., and Strubegger, M.: The role of electricity storage and hydrogen technologies in enabling global low-carbon energy transitions, Appl.Energy, 216, 649–661, https://doi.org/10.1016/j.apenergy.2018.02.110, 2018. a
Miri, M., Saffari, M., Arjmand, R., and McPherson, M.: Integrated models in action: Analyzing flexibility in the Canadian power system toward a zero-emission future, Energy, 261, 125181, https://doi.org/10.1016/j.energy.2022.125181, 2022. a
Morrow, D. R., Apeaning, R., and Guard, G.: GCAM-CDR v1.0: enhancing the representation of carbon dioxide removal technologies and policies in an integrated assessment model, Geosci. Model Dev., 16, 1105–1118, https://doi.org/10.5194/gmd-16-1105-2023, 2023. a, b
Motlaghzadeh, K., Schweizer, V., Craik, N., and Moreno-Cruz, J.: Key uncertainties behind global projections of direct air capture deployment, Appl. Energy, 348, 121485, https://doi.org/10.1016/j.apenergy.2023.121485, 2023. a
Negishi, T.: Welfare economics and existence of an equilibrium for a competitive economy, Metroeconomica, 12, 92–97, https://doi.org/10.1111/j.1467-999X.1960.tb00275.x, 1960. a
Nikas, A., Doukas, H., and Papandreou, A.: A detailed overview and consistent classification of climate-economy models, in: Understanding risks and uncertainties in energy and climate policy, edited by: Doukas, H., Flamos, A., and Lieu, J., Springer, Cham, 1–54, https://doi.org/10.1007/978-3-030-03152-7_1, 2019. a
Nordhaus, W.: The climate casino: Risk, uncertainty, and economics for a warming world, Yale University Press, ISBN: 978-0-300-21264-8, 2013. a
NRCan: Hydrogen Strategy for Canada – Seizing the Opportunities for Hydrogen, https://natural-resources.canada.ca/climate-change-adapting-impacts-and-reducing-emissions/canadas-green-future/the-hydrogen-strategy/23080 (last access: 5 April 2024), 2020. a
NREL: 2021 Annual Technology Baseline, Tech. rep., National Renewable Energy Laboratory, Golden, CO, https://atb-archive.nlr.gov/ (last access: 25 November 2023), 2021. a, b
NREL: H2A: Hydrogen Analysis Production Models, https://www.nrel.gov/hydrogen/h2a-production-models.html (last access: April 2024), 2023. a
O'Neill, B. C., Kriegler, E., Riahi, K., Ebi, K. L., Hallegatte, S., Carter, T. R., Mathur, R., and Van Vuuren, D. P.: A new scenario framework for climate change research: the concept of shared socioeconomic pathways, Climatic Change, 122, 387–400, 2014. a
O'Neill, B. C., Carter, T. R., Ebi, K., Harrison, P. A., Kemp-Benedict, E., Kok, K., Kriegler, E., Preston, B. L., Riahi, K., Sillmann, J., van Ruijven, B. J., van Vuuren, D., Carlisle, D., Conde, C., Fuglestvedt, J., Green, C., Hasegawa, T., Leininger, J., Monteith, S., and Pichs-Madruga, R.: Achievements and needs for the climate change scenario framework, Nat. Clim. Change, 10, 1074–1084, https://doi.org/10.1038/s41558-020-00952-0, 2020. a
Our World in Data: Average monthly surface temperature, Jan 15, 2009 to Oct 15, 2024, Our World in Data, https://ourworldindata.org/tourism (last access: 17 June 2024), 2024. a
Parrado-Hernando, G., Herc, L., Pfeifer, A., Capellán-Perez, I., Bjelić, I. B., Duić, N., Frechoso-Escudero, F., González, L. J. M., and Gjorgievski, V. Z.: Capturing features of hourly-resolution energy models through statistical annual indicators, Renew. Energy, 197, 1192–1223, https://doi.org/10.1016/j.renene.2022.07.040, 2022. a, b
Patt, A. G., van Vuuren, D. P., Berkhout, F., Aaheim, A., Hof, A. F., Isaac, M., and Mechler, R.: Adaptation in integrated assessment modeling: where do we stand?, Climatic Change, 99, 383–402, https://doi.org/10.1007/s10584-009-9687-y, 2010. a
Pietzcker, R. C., Stetter, D., Manger, S., and Luderer, G.: Using the sun to decarbonize the power sector: The economic potential of photovoltaics and concentrating solar power, Appl. Energy, 135, 704–720, https://doi.org/10.1016/j.apenergy.2014.08.011, 2014. a
Pietzcker, R. C., Ueckerdt, F., Carrara, S., de Boer, H. S., Després, J., Fujimori, S., Johnson, N., Kitous, A., Scholz, Y., Sullivan, P., and Luderer, G.: System integration of wind and solar power in integrated assessment models: A cross-model evaluation of new approaches, Energy Econ., 64, 583–599, https://doi.org/10.1016/j.eneco.2016.11.018, 2017. a, b, c
Realmonte, G., Drouet, L., Gambhir, A., Glynn, J., Hawkes, A., Köberle, A. C., and Tavoni, M.: An inter-model assessment of the role of direct air capture in deep mitigation pathways, Nat. Commun., 10, 3277, https://doi.org/10.1038/s41467-019-10842-5, 2019. a, b
Riahi, K., van Vuuren, D. P., Kriegler, E., Edmonds, J., O'Neill, B. C., Fujimori, S., Bauer, N., Calvin, K., Dellink, R., Fricko, O., Lutz, W., Popp, A., Crespo Cuaresma, J., KC, S., Leimbach, M., Jiang, L., Kram, T., Rao, S., Emmerling, J., Ebi, K., Hasegawa, T., Havlik, P., Humpenöder, F., Da Silva, L. A., Smith, S., Stehfest, E., Bosetti, V., Eom, J., Gernaat, D., Masui, T., Rogelj, J., Strefler, J., Drouet, L., Krey, V., Luderer, G., Harmsen, M., Takahashi, K., Baumstark, L., Doelman, J. C., Kainuma, M., Klimont, Z., Marangoni, G., Lotze-Campen, H., Obersteiner, M., Tabeau, A., and Tavoni, M.: The Shared Socioeconomic Pathways and their energy, land use, and greenhouse gas emissions implications: An overview, Global Environ. Change, 42, 153–168, https://doi.org/10.1016/j.gloenvcha.2016.05.009, 2017. a, b
Rochedo, P. R. R.: Development of a global integrated energy model to evaluate the Brazilian role in climate change mitigation scenarios, DS Thesis, Universidade Federal do Rio de Janeiro, Brazil, https://www.ppe.ufrj.br/images/publica%C3%A7%C3%B5es/doutorado/Pedro_Rua_Rodriguez_Rochedo.pdf (last access: 17 March 2024), 2016. a
Schoenfisch, M. and Dasgupta, A.: Grid-scale Storage, https://www.iea.org/energy-system/electricity/grid-scale-storage (last access: 5 January 2024), 2023. a
Stanton, E. A., Ackerman, F., and Stanton, E. A.: Negishi Welfare Weights in Integrated Assessment Models: The Mathematics of Global Inequality, in: Anthem Environment and Sustainability, Anthem Frontiers of Global Political Economy, Anthem Press, 133–148, https://doi.org/10.1007/s10584-010-9967-6, 2014. a
Sullivan, P., Krey, V., and Riahi, K.: Impacts of considering electric sector variability and reliability in the MESSAGE model, Energy Strat. Rev., 1, 157–163, https://doi.org/10.1016/j.esr.2013.01.001, 2013. a, b, c
The World Bank: World Development Indicators, Tech. rep., The World Bank, Washington, D.C., https://databank.worldbank.org/reports.aspx?source=2&country=&series=AG.LND.TOTL.K2&period=# (last access: 20 June 2024), 2024. a
Tol, R. S.: A meta-analysis of the total economic impact of climate change, Energy Policy, 185, 113922, https://doi.org/10.1016/j.enpol.2023.113922, 2024. a
Ueckerdt, F., Brecha, R., Luderer, G., Sullivan, P., Schmid, E., Bauer, N., Böttger, D., and Pietzcker, R.: Representing power sector variability and the integration of variable renewables in long-term energy-economy models using residual load duration curves, Energy, 90, 1799–1814, https://doi.org/10.1016/j.energy.2015.07.006, 2015. a, b
Ueckerdt, F., Pietzcker, R., Scholz, Y., Stetter, D., Giannousakis, A., and Luderer, G.: Decarbonizing global power supply under region-specific consideration of challenges and options of integrating variable renewables in the REMIND model, Energy Econ., 64, 665–684, https://doi.org/10.1016/j.eneco.2016.05.012, 2017. a, b, c, d, e
UNEP: Adaptation Gap Report 2023: Underfinanced, Underprepared. Inadequate investment and planning on climate adaptation leaves world exposed, https://doi.org/10.59117/20.500.11822/43796, 2023. a
UNEP: Adaptation Gap Report 2025: Running on empty. The world is gearing up for climate resilience – without the money to get there, Tech. rep., United Nations Environment Programme, Nairobi, https://doi.org/10.59117/20.500.11822/48798, 2025. a, b, c, d, e, f, g, h, i, j
UNFCCC: Adoption of the Paris Agreement, Report No. FCCC/CP/2015/L.9/Rev.1, http://unfccc.int/resource/docs/2015/cop21/eng/l09r01.pdf (last access: 25 December 2023), 2015. a
van Maanen, N., Lissner, T., Harmsen, M., Piontek, F., Andrijevic, M., and van Vuuren, D. P.: Representation of adaptation in quantitative climate assessments, Nat. Clim. Change, 13, 309–311, https://doi.org/10.1016/j.apenergy.2018.02.110, 2023. a, b
van Vuuren, D. P., Edmonds, J., Kainuma, M., Riahi, K., Thomson, A., Hibbard, K., Hurtt, G. C., Kram, T., Krey, V., Lamarque, J.-F., Masui, T., Meinshausen, M., Nakicenovic, N., Smith, S. J., and Rose, S. K.: The representative concentration pathways: an overview, Climatic Change, 109, 5–31, https://doi.org/10.1007/s10584-011-0148-z, 2011. a
van Vuuren, D. P., Kriegler, E., O'Neill, B. C., Ebi, K. L., Riahi, K., Carter, T. R., Edmonds, J., Hallegatte, S., Kram, T., Mathur, R., and Winkler, H.: A new scenario framework for climate change research: scenario matrix architecture, Climatic Change, 122, 373–386, https://doi.org/10.1007/s10584-013-0906-1, 2014. a
Wei, T.: Estimation of Economy-Wide Rebound Effect: To What Extent Does the Aggregation of Regions and Sectors Matter?, SSRN [preprint], https://doi.org/10.2139/ssrn.5957195, 2025. a
Weyant, J., Davidson, O., Dowlatabadi, H., Edmonds, J., Grubb, M., Parson, E., Richels, R., Rotmans, J., Shukla, P., Tol, R., Cline, W., and Fankhauser, S.: Integrated assessment of climate change: an overview and comparison of approaches and results, Climate Change, 3, Cambridge University Press, Cambridge, UK and New York, NY, USA, 367–396, https://www.ipcc.ch/report/ar2/wg3/, August 2025, 1995. a
Wilson, C., Guivarch, C., Kriegler, E., Van Ruijven, B., Van Vuuren, D. P., Krey, V., Schwanitz, V. J., and Thompson, E. L.: Evaluating process-based integrated assessment models of climate change mitigation, Climatic Change, 166, 1–22, https://doi.org/10.1007/s10584-021-03099-9, 2021. a
World Health Organization: Quantitative risk assessment of the effects of climate change on selected causes of death, 2030s and 2050s, Geneva, Switzerland, https://iris.who.int/server/api/core/bitstreams/785da4b3-7797-44f5-a01b-eab29c3ac99b/content (last access: 25 February 2024), 2014. a
World Resources Institute: Aqueduct Floods Dataset, Tech. rep., World Resources Institute, https://www.wri.org/data/aqueduct-floods (last access: 7 July 2024), 2020. a
Yalew, S. G., van Vliet, M. T. H., Gernaat, D. E. H. J., Ludwig, F., Miara, A., Park, C., Byers, E., De Cian, E., Piontek, F., Iyer, G., Mouratiadou, I., Glynn, J., Hejazi, M., Dessens, O., Rochedo, P., Pietzcker, R., Schaeffer, R., Fujimori, S., Dasgupta, S., Mima, S., Santos da Silva, S. R., Chaturvedi, V., Vautard, R., and van Vuuren, D. P.: Impacts of climate change on energy systems in global and regional scenarios, Nat. Energy, 5, 794–802, https://doi.org/10.1038/s41560-020-0664-z, 2020. a
Zhao, Z.-J., Chen, X.-T., Liu, C.-Y., Yang, F., Tan, X., Zhao, Y., Huang, H., Wei, C., Shi, X.-L., Zhai, W., Guo, F., and van Ruijven, B. J.: Global climate damage in 2 °C and 1.5 °C scenarios based on BCC_SESM model in IAM framework, Adv. Clim. Change Res., 11, 261–272, 2020. a
- Abstract
- Introduction
- Methodology and model enhancements
- Model calibration and scenario development
- Results analysis
- Discussion and conclusion
- Appendix A: Spatial resolution
- Appendix B: Selected new model equations
- Appendix C: Direct air carbon capture and storage assumptions
- Appendix D: Calibration of climate impacts, damages, and adaptation
- Appendix E: Extended validation of the model
- Appendix F: Regional dynamics of carbon-removal technologies deployment
- Code and data availability
- Author contributions
- Competing interests
- Disclaimer
- Acknowledgements
- Financial support
- Review statement
- References
- Supplement
- Abstract
- Introduction
- Methodology and model enhancements
- Model calibration and scenario development
- Results analysis
- Discussion and conclusion
- Appendix A: Spatial resolution
- Appendix B: Selected new model equations
- Appendix C: Direct air carbon capture and storage assumptions
- Appendix D: Calibration of climate impacts, damages, and adaptation
- Appendix E: Extended validation of the model
- Appendix F: Regional dynamics of carbon-removal technologies deployment
- Code and data availability
- Author contributions
- Competing interests
- Disclaimer
- Acknowledgements
- Financial support
- Review statement
- References
- Supplement