
the Creative Commons Attribution 4.0 License.
the Creative Commons Attribution 4.0 License.
 | 30 Jul 2026
Spectral nudging impacts on precipitation downscaling in the Conformal Cubic Atmospheric Model, version CCAM-2504: insights from summer 2011
Marcus J. Thatcher
Phuong Loan Nguyen
Lisa V. Alexander
John L. McGregor
This study evaluates the impacts of spectral nudging on rainfall when dynamically downscaling with the Conformal Cubic Atmospheric Model (CCAM). The study focuses on the extreme 2010–2011 La Niña, in conjunction with the Madden–Julian Oscillation (MJO), across the CORDEX–Australasia domain at 12.5 km with CCAM nested in ERA-5 reanalysis. Sixteen simulations were performed, systematically varying nudging wavelength, vertical extent, frequency, and variable choice, and evaluated against GPM-IMERG precipitation and ERA5 reanalysis. Configurations at short nudging wavelengths (∼ 500–1500 km), with high-frequency updates (1 h), and including pressure, wind and temperature delivered the most robust performance. These setups reduced large-scale rainfall biases, improved spatial and temporal correlations, reproduced vertical structure and moisture convergence more realistically, and achieved the closest agreement with observed mean and extreme observed rainfall. In contrast, coarse-scale (3000 km), full-column constraints, or nudging limited to pressure or wind variables degraded performance, producing oversmoothed variability, misplaced convection, and unrealistic rainfall patterns. Overall, the results demonstrate that carefully tuned spectral nudging in CCAM preserves large-scale teleconnections associated with La Niña, MJO, and retains mesoscale variability while enhances the fidelity of both mean and extreme rainfall in this extreme 2010–2011 La Niña event. This study strengthens confidence in CCAM downscaling for CORDEX–Australasia, with implications extending to other CORDEX domains and applications.
- Article
(26977 KB) - Full-text XML
-
Supplement
(2240 KB) - BibTeX
- EndNote


The accurate assessment of regional climate variability and extremes is essential for supporting climate change adaptation and risk management efforts (IPCC, 2021). While general circulation models (GCMs) provide valuable insights into large-scale climate dynamics, their coarse resolution and simplified representation of regional processes limit their ability to capture local climate features, particularly extremes such as heavy rainfall events (Giorgi and Mearns, 1999; Nguyen et al., 2024). To overcome this limitation, regional climate models (RCMs) offer higher spatial resolution and a more detailed representation of topography and regional processes (Giorgi, 2019). Numerous studies have evaluated RCM performance over Australasia, demonstrating skill in reproducing regional climate features (Chapman et al., 2023; Howard et al., 2024; Schroeter et al., 2024; Narsey et al., 2025).
A central challenge for RCMs is ensuring that RCMs efficiently assimilate the relevant large-scale atmospheric circulation from the coarse-resolution model (e.g., forcing from the reanalysis or host GCMs) to the RCMs (von Storch et al., 2000; Feser and Barcikowska, 2012). Without constraints, model biases can grow within the regional domain, resulting in considerable discrepancies from the large-scale circulations (Miguez-Macho et al., 2004). To address this, spectral nudging was introduced to constrain the state of the regional atmosphere at large length scales in spectral space (von Storch et al., 2000; Kanamitsu and Kanamaru, 2007; Thatcher and McGregor, 2008; Huang et al., 2021). This approach allows RCMs to develop small-scale features superimposed on the large-scale atmospheric conditions from the reanalysis or GCMs. Studies have shown that spectral nudging improves mean and extreme precipitation (Wang and Kotamarthi, 2013; Omrani et al., 2015), tropical cyclone statistics (Choi and Lee, 2015; Jin et al., 2016) and low-level wind circulation (Tang et al., 2017). Spectral nudging has also been shown to outperform other techniques, such as grid nudging, particularly in simulating extreme rainfall and low-level circulation (Liu et al., 2012; Yang et al., 2019).
The effectiveness of spectral nudging depends critically on configuration choices such as wavelengths, update frequency, vertical level, and the variables being constrained (Alexandru et al., 2009; Omrani et al., 2015, Mai et al., 2020). These parameters regulate the interplay between large-scale constraint from the reanalysis or GCMs and internal RCMs adjustment that can pose a substantial impact of the simulated circulation and precipitation. Gómez and Miguez-Macho (2017) demonstrated that nudging with wavelengths around 1000 km yields optimal results as shorter wavelengths tend to suppress fine-scale variability whereas larger wavelengths may distort synoptic conditions (Spero et al., 2018). The update frequency influences the tracks and intensification of tropical cyclone (Feser and Barcikowska, 2012; Cha et al., 2011). Moisture nudging is a debated technique. Some research cautions against it due to thermodynamic inconsistencies where temperature, moisture, and dynamical fields are no longer physically aligned when the RCM is nudged toward the reanalysis such as ERA5 (Heikkila et al., 2010; Otte et al., 2012; Menut et al., 2024; Lai and Gan, 2025), while other studies suggest it can enhance precipitation simulation (Spero et al., 2014). In addition, biases in ERA5 moisture fields (Virman et al., 2021; Truong et al., 2022), particularly in regions with sparse observations, can introduce additional uncertainties, potentially limiting the effectiveness of moisture nudging in improving precipitation simulations. The selection of the vertical level for nudging, or the nudging profile, is largely empirical, as different choices can yield varying outcomes depending on the formulation (von Storch et al., 2000; Miguez-Macho et al., 2004; Hong and Chang, 2012; Tang et al., 2017). However, most of these investigations and their findings have been derived from limited-area RCMs such as Weather Research and Forecasting (WRF) and the Canadian RCM, where spectral nudging, typically based on fast Fourier transform (FFT), operates within a domain constrained by lateral boundary forcing. Furthermore, the conclusions drawn from these limited-area RCM studies vary depending on the model, study region, horizontal resolution, physical parameterisations, and spectral nudging configurations (Menut et al., 2024). In contrast, only a limited number of studies have explored spectral nudging in variable resolution and unstructured-grid global models, such as the Model for Prediction Across Scales (MPAS), the Conformal Cubic Atmospheric Model (CCAM). Thatcher and McGregor (2008) developed a scale-selective filter for the variable resolution (e.g., cube-based geometry) in CCAM that differs from conventional spectral downscaling approaches by employing convolution rather than spherical harmonic FFTs (their Eq. 11). They further demonstrated that a two-dimensional scale-selective filter can be efficiently approximated by a sequence of one-dimensional filters, reducing the computational cost from O(N4) to O(N3). Bullock et al. (2018) implemented analysis nudging, or four-dimensional data assimilation (FDDA), in MPAS-A on a 92–25 km variable-resolution mesh for January and July 2013 and highlighted the challenges associated with achieving spectral approximation on unstructured grids. Owing to their variable resolution and unstructured-grid geometries, the implementation of scale-selective nudging in variable resolution global models is inherently more complex than in conventional limited-area RCMs employing regular structured grids. These methodological differences may alter the balance between large-scale constraints and internally generated regional variability, implying that conclusions derived from traditional limited-area frameworks may not directly translate to variable resolution global models such as MPAS and CCAM. Nevertheless, systematic evaluations of nudging sensitivity in variable resolution atmospheric models remain comparatively limited. While the performance of RCMs, including CCAM, has been extensively evaluated and shown to add value to regional climate modeling in CORDEX CMIP6 (Liu et al., 2024; Ma et al., 2025; Chapman et al., 2024; Gibson et al., 2025), a critical gap remains in assessing how different spectral nudging configurations affect the performance of variable resolution models.
Building on these existing challenges, our study aims to evaluate the impacts of different spectral nudging configurations on rainfall when dynamically downscaling with the Conformal Cubic Atmospheric Model (CCAM) during the extreme 2010–2011 La Niña, in conjunction with the Madden–Julian Oscillation (MJO) and the Australian monsoon (Cai and van Rensch, 2012; Evans et al., 2012; Lisonbee and Ribbe 2021), across the CORDEX–Australasia domain. This 2010–2011 La Niña season serves as a stringent test of CCAM's performance, as it was among the strongest La Niña events in Australia's meteorological record, rivalling historical extremes (BoM, 2012) led to widespread flooding in many regions over Australia including Queensland, Victoria, New South Wales, and Western Australia (Ummenhofer et al., 2015). The season was also marked by increased tropical cyclone activity, notably severe tropical cyclone Carlos over Darwin (367.6 mm d−1) and Yasi over Queensland (471 mm d−1) (BoM, 2012). At the national level, the cost of recovery from natural disasters across Australia in 2010 and early 2011 was estimated to surpass AUD 12 billion in government expenditure (Table 25.1, Karoly and Boulter, 2013). In this study, we aim to:
-
Evaluate the ability of CCAM to reproduce large-scale circulation during the extreme 2010–2011 La Niña;
-
Quantify the influence of nudging parameter choices on the representation of mean and extreme rainfall; and
-
Identify parameter combinations that improve the fidelity of regional rainfall simulations over Australasia during the extreme event.
The paper is organized as follows: Sect. 2 outlines the data and methods; Sect. 3 describes study results; and Sect. 4 discusses the findings and conclusions.
2.1 ERA5 reanalysis
The ERA5 reanalysis, produced by the European Center for Medium-Range Weather Forecasts (ECMWF), is based on the global Numerical Weather Prediction (NWP) model Integrated Forecast System (IFS) version CY41R2 (Hersbach et al., 2020). The model provides hourly estimates of atmospheric variables, at a horizontal resolution of 31 km and 137 vertical levels from the surface to 0.01 hPa. The data is available on both surface (e.g., total precipitation) and 37 pressure levels (e.g., vertical winds). The variables used in this study are wind speed, temperature, specific humidity, and mean sea level pressure. In this study, ERA5 is preferred over higher-resolution datasets such as Atmospheric Regional Reanalysis for Australia version 2 (BARRA2) (Su et al., 2025) due to its global coverage, which is better suited for CCAM.
2.2 Observations
In this study, we evaluate simulated precipitation using the Integrated Multi-satellite Retrievals for the Global Precipitation Measurement (GPM) IMERG Final Run product (Version 07; Huffman et al., 2019), distributed by NASA Goddard Earth Sciences Data and Information Services Center (GES DISC). The level-3 IMERG fields provide 0.1° × 0.1° coverage from 60° S–60° N and merge estimates from a constellation of passive-microwave and infrared sensors, intercalibrated to monthly rain-gauge analyses; we use the daily accumulation (mm d−1). To benchmark observational uncertainty, particularly pronounced over the equatorial and data sparse regions (Alexander et al. 2025; Nguyen et al., 2022), we include two additional daily products: the Global Precipitation Climatology Project (GPCP) daily CDR v3.2 (Huffman et al., 2023) and the Climate Prediction Center morphing method (CMORPH) v1.0 CRT (Joyce et al., 2004; Xie et al., 2017). The GPCP v3.2 provides globally complete 0.5° × 0.5° analyses from June 2000 to present, blending low-orbit satellite microwave data, geosynchronous-orbit satellite infrared data, sounder-based estimates, and surface rain gauge observations. The CMORPH v1.0 CRT provides bias-corrected, reprocessed estimates on a 0.25° grid with native 30 min resolution aggregated to daily for 1998–2023. As a high-quality continental reference over Australia, we also use AGCD v1.0.0 daily rainfall, a 0.05° × 0.05° gridded gauge-based analysis derived from quality-controlled station data across mainland Australia and Tasmania (Jones et al., 2009). These datasets are selected for their demonstrated consistency in representing daily precipitation (Imran and Evans, 2025) and extremes (Alexander et al., 2020; Nguyen et al., 2020).
2.3 Model description
The climate model used for the study is Conformal Cubic Atmospheric Model (CCAM) (McGregor and Dix, 2008), developed by the Commonwealth Scientific and Industrial Research Organisation (CSIRO). CCAM is an open-source global stretched-grid non-hydrostatic numerical model, which has been extensively used for regional climate studies (Gibson et al., 2024; Liu et al., 2024; Narsey et al., 2025). CCAM can be operated with either a stretched grid or with a global quasi-uniform grid (Truong et al., 2025; Truong and Thatcher, 2025), driven by sea-surface temperatures (SSTs) and sea ice concentrations (Hoffmann et al., 2016; Zhang et al., 2024). This makes CCAM useful for regional climate simulations where errors arising from lateral boundary conditions can be avoided, although physical parameterisations must operate successfully over a range of spatial scales. The amount of stretching is described by a Schmidt factor where 1 indicates a quasi-uniform grid and values greater than 1 imply an increasing amount of grid stretching. CCAM includes parameterisations for radiation (Freidenreich and Ramaswamy, 1999; Schwarzkopf and Ramaswamy, 1999), convection (McGregor, 2003), gravity wave drags (Chouinard et al., 1986), and boundary layer turbulent mixing (Hurley, 2007). CCAM also includes the Community Atmosphere Biosphere Land Exchange (CABLE) land-surface scheme (Kowalczyk et al., 2006), the Urban Climate and Energy Model (UCLEM) parameterisation (Thatcher and Hurley, 2012) and a cloud microphysics scheme based on Rotstayn (1997). To constrain large-scale circulation, Thatcher and McGregor (2008) introduced a novel scale-selective filtering method (e.g., Gaussian filter rather than a simple cut-off) for CCAM, which differs from traditional spectral nudging that relies on Fourier-based methods. Instead of using spherical harmonic FFTs, their approach employs convolution filters on the model's native grid and a nudging wavelength can be larger than the high-resolution domain. They demonstrated that the 2D scale-selective filter could be approximated by a sequence of 1D filters, reducing computational complexity from O(N4) to O(N3), making it computationally efficient for large-scale global simulations like CCAM.
2.4 Model configuration
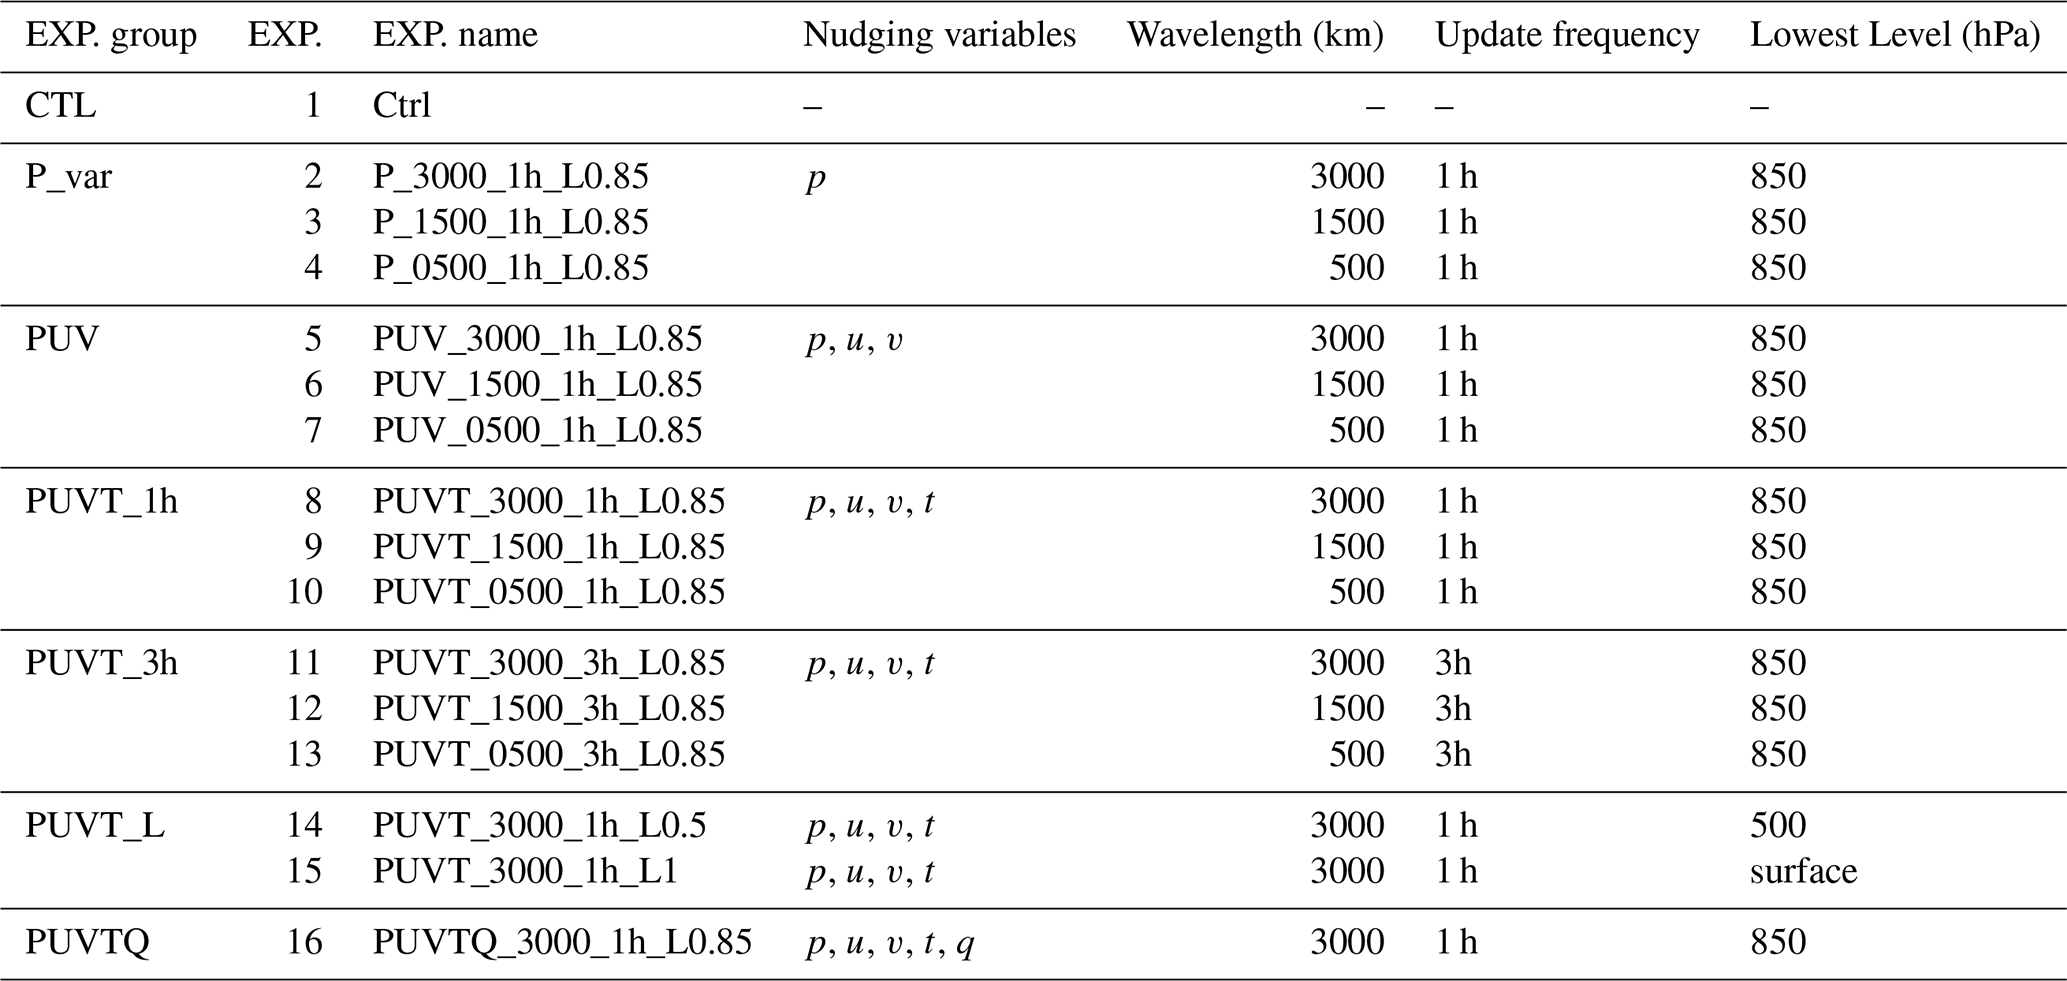
There are a limited number of studies exploring spectral nudging in variable resolution global models. Thatcher and McGregor (2008) applied spectral nudging to surface pressure, wind, and temperature in CCAM, finding that it reasonably reproduced downscaled predictions from National Centers for Environmental Prediction Global Forecast System (NCEP GFS) 0.58 analyses. More recently, Bullock et al. (2018) employed nudging in MPAS-A, emphasizing that further research is needed to determine the optimal nudging selection for temperature, humidity, and wind, as well as the most effective vertical levels for applying nudging. Building on the work of Thatcher and McGregor (2008) in variable resolution model (i.e., CCAM) and other related limited-area model findings (Menut et al., 2024), this study further investigates the impacts of spectral nudging on precipitation, with a total of 16 simulations conducted using CCAM. These simulations are grouped into seven categories, as summarized in Table 1. Each simulation differs based on four key nudging options: variables (pressure [p], zonal and meridional wind components [u] and [v], temperature [t], and specific humidity [q]), horizontal wavelength (in km), update frequency (in hours), and vertical level. Simulation names follow the format: [VARs]_[Wavelength]_[Frequency]_[Level], where “VARs” represents the nudged variables (e.g., PUVTQ), “Frequency” is the update interval (e.g., 1 h), “Level” indicates the vertical level at which the lowest model being nudged to the top of the atmosphere and “Wavelength” is the horizontal nudging wavelength (e.g., 3000 km).
To understand the impact of the spectral nudging, a definition of the filter length-scale is required. In Thatcher and McGregor (2008), the Gaussian filter is defined by Eq. (1):
Here ϵ is a constant that defines the filter length-scale and d is the distance from the centre of the Gaussian filter in radians.
Typically, CCAM defines the filter length-scale as a function of the Schmidt factor, S, that controls the amount of grid stretching. This is so that the filter length-scale automatically is reduced as the grid is increasingly stretched. Using the following expression (Eq. 2) approximately makes the filter length-scale the size of the high-resolution region on the stretched CCAM grid.
Note that CCAM will limit the maximum filter length-scale to a value that corresponds to S = 3.333. There are multiple ways to define the width of the Gaussian filter length-scale. Thatcher and McGregor (2008) used the Full-Width-at-Half-Maximum (FWHM) definition. For the CCAM grid configuration used in this paper, we obtain FWHM = 10.6 radians or approximately 2400 km in diameter. However, this is often unintuitive for users of the CCAM model. Hence an alternative definition that represents 99.7 % of the Gaussian is used where the diameter of the Gaussian filter is radians or approximately 3000 km for S = 3.333. For consistency with previous literatures, we will use the 99.7 % definition for the filter length scale (e.g., 3000, 1500, and 500 km) in the rest of this paper.
The “Ctrl” group serves as the baseline simulation with “no nudging”, initialized with ERA5 reanalysis data at 00:00 UTC on 1 November 2010, and allowed to evolve freely. This setup provides a reference for comparing the influence of nudging on model performance, with dynamics driven solely by initial conditions and internal processes. In the “P_var” group, three simulations (P_3000_1h_L0.85, P_1500_1h_L0.85, and P_0500_1h_L0.85) were conducted, where surface pressure was nudged above the PBL at wavelengths of 500, 1500, and 3000 km with a 1 h relaxation interval. Based on Truong et al. (2025), which showed that horizontal resolution differences in variable resolution models affect tropical cyclone intensity, pressure nudging was applied first to assess its influence on large-scale circulation. The “PUV” group extended the nudging to include both surface pressure and horizontal wind components, using the same wavelengths and relaxation interval as the “P_var” group. This configuration assesses the combined impact of nudging both wind and pressure, which is crucial for influencing large-scale dynamics (e.g., MJO, monsoonal flow) and convection (e.g., TC). In the “PUVT_1h” group, additional variables, including temperature, were nudged alongside pressure and wind, using the same wavelengths and relaxation interval as in the previous groups. This simulation evaluates the impact of thermal dynamics on heat and moisture fluxes, which influence convection and precipitation. The “PUVT_3h” group replicated the “PUVT_1h” setup but with a weaker nudging strength and a 3 h relaxation interval to assess the sensitivity of model performance to weaker nudging. Various studies have documented that nudging within the boundary layer can artificially suppress convection (Heikkila et al., 2010; Otte et al., 2012; Spero et al., 2014), potentially affecting tropical cyclones during our study period, the extreme 2010–2011 La Niña. In this study, we applied nudging at a fixed layer (e.g., 850 hPa) by default, rather than dynamically nudging to the top of the simulated boundary layer height, in order to save computational resources. We further conducted two additional sensitivity tests on pressure levels (i.e., ”PUVT_L”) with two setups: full-column nudging (L1), which applies nudging from the surface to the top of the atmosphere, and half-column nudging (L0.5), which limits nudging to the mid-to-upper atmosphere. Given the inconsistent results of moisture nudging in limited-area models (Menut et al., 2024, Spero et al., 2014), we conducted additional sensitivity test to assess whether moisture nudging would further improve or adversely affect our precipitation simulation (“PUVTQ”). All simulations were initialized using ERA5 reanalysis data at 00:00 UTC on 1 November 2010, and were run for a period of 5 months at a 12 km horizontal resolution and 54 vertical levels. A 1-month spin-up period was used to stabilize the model. The sea surface temperature (SST) evolution was driven from ERA5 reanalysis.
Table 1Summary of the 16 simulations conducted in this study. The simulations are grouped by nudging configuration to facilitate comparison.
We first evaluated model performance using bias maps, time-series correlation, standard deviation, root-mean-square-error (RMSE) and percentile-based metrics for extreme events, along with Taylor diagrams for spatial skill and quantile-quantile plots to assess extreme precipitation distributions. We followed Isphording et al. (2024)'s standard metrics benchmarking for regional climate models in estimating four fundamental characteristics (intensity, spatial distribution, seasonal cycle and changes over time) of rainfall over Australia. Here, we adopted the mean absolute percentage error (MAPE) and the spatial correlation coefficient (Scor) as other two metrics not being relevant given the short simulation that we are performing. The MAPE is defined following Eq. (3)
where n is the number of grid cells in the spatial domain. Scor quantifies pattern alignment, ranging from 0 (no match) to 1 (perfect match). In addition to precipitation-based metrics, we also examined the large-scale moisture transport by calculating the divergence of water vapor flux at 875 hPa. The water vapor flux divergence is defined following Eq. (4)
where q denotes the specific humidity, and u and v are the zonal and meridional wind components, respectively.
To facilitate our regional analysis, the CORDEX–Australasia domain is partitioned into three subregions (R2, R4, and R5), which represent distinct climatic and synoptic regimes: R2 (northwestern Australia), R4 (northeastern Australia), and R5 (southeastern Australia) (Fig. 1). These are also regions that were most affected by strong tropical cyclones and major flooding during the extreme 2010–2011 La Niña (Karoly and Boulter, 2013). We also include the Maritime Continent (MC) and the southwestern pacific as R1 and R3 to examine the mean and extreme precipitation over these convective (R1) and orographic (R3) regions; the R1 and R3 partially belong to the CORDEX–SEA domain. Finally, R6 is defined as the entire domain. This subregional framework provides a consistent basis for examining precipitation processes across a broad spectrum of climatic drivers, including tropical–extratropical interactions, the Madden–Julian Oscillation (MJO), El Niño–Southern Oscillation (ENSO) teleconnections, and the austral-summer monsoon during the anomalously wet spring and summer of 2010–2011.
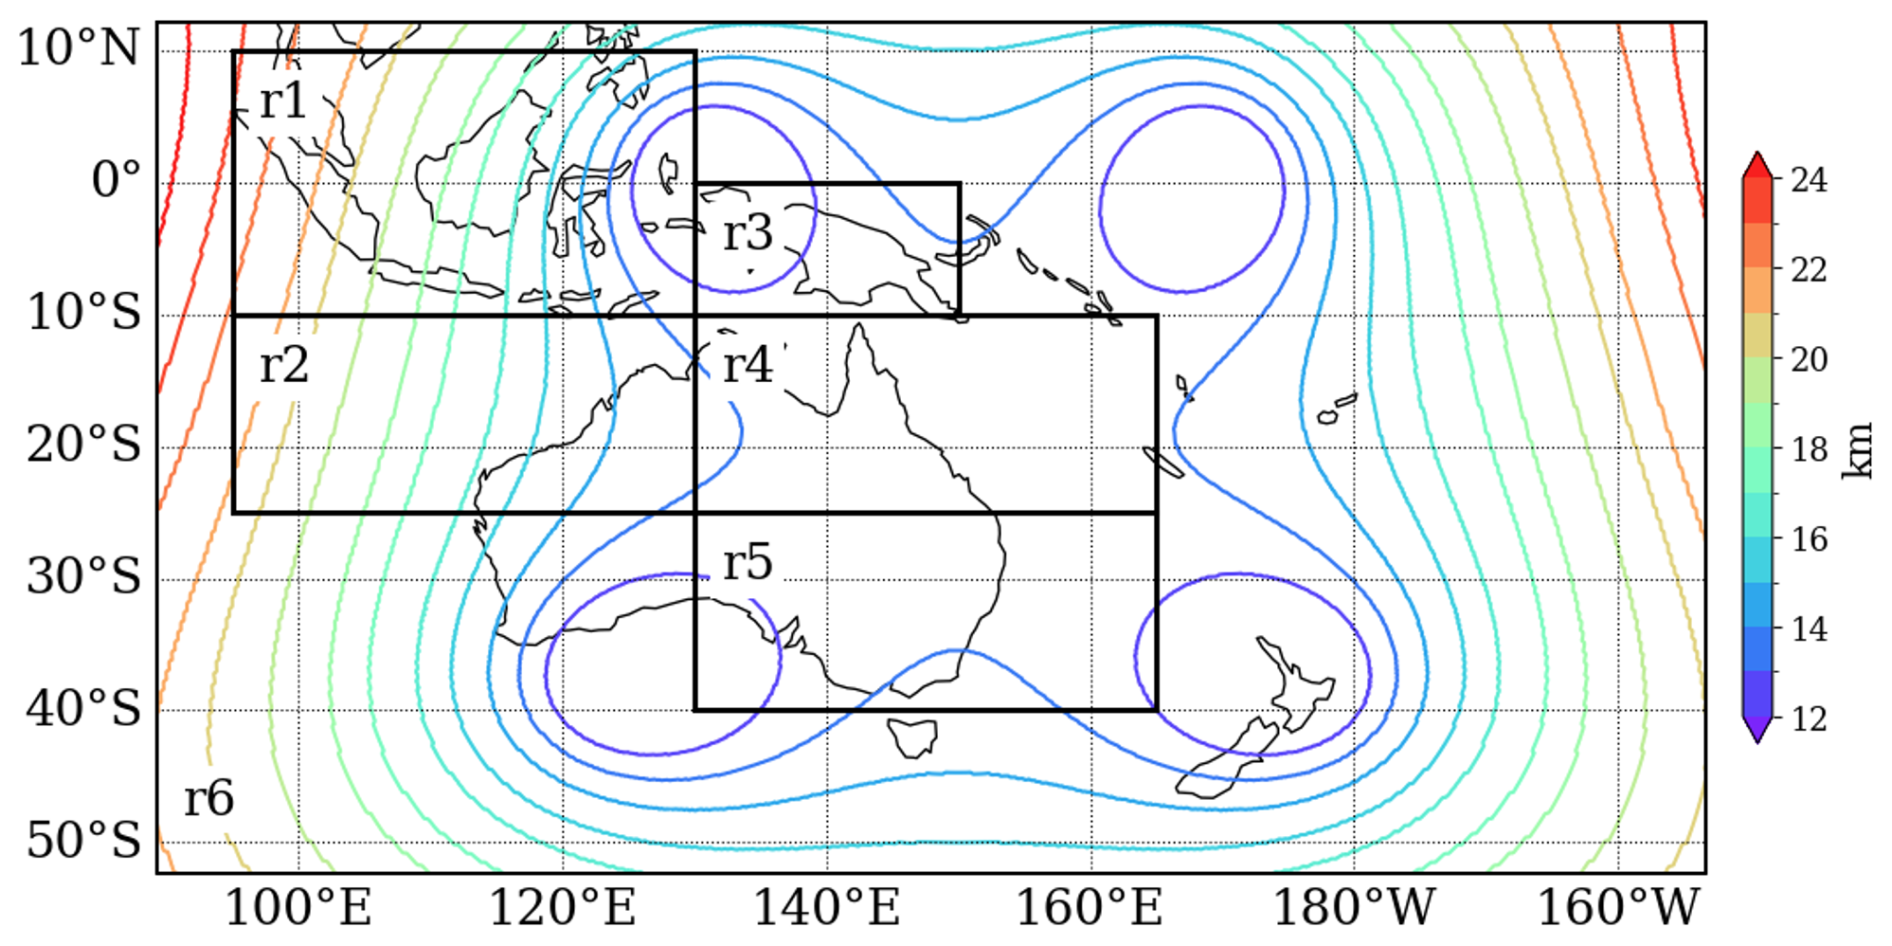
Figure 1CCAM simulation domain with grid resolution ranging from 12 to 25 km, shown in contour colours. The study domain is divided into six subregions, labelled R1 to R6, representing the Maritime Continent, northwest Australia, southwestern pacific, northeast Australia, southeast Australia, and the whole simulated domain (50° S–10° N, 90° E–150° W), respectively.
3.1 Mean precipitation
3.1.1 Spatial variability of precipitation
The averaged IMERG precipitation exceeded 25 mm d−1 over the MC and the western Pacific, with enhanced across northern and northeastern Australia (Fig. 2a). In contrast, central and southern Australia received less than 5 mm d−1. In general, IMERG, GPCP, and CMORPH exhibit similar spatial distributions (Fig. S1 in the Supplement) and timeseries (Fig. S2), capturing the broad rainfall patterns during the extreme 2010–2011 La Niña. The only notable difference is that IMERG tends to have slightly more intense precipitation, particularly in the tropical region (R1) and over the Gulf of Carpentaria (R4) compared to GPCP and CMORPH.
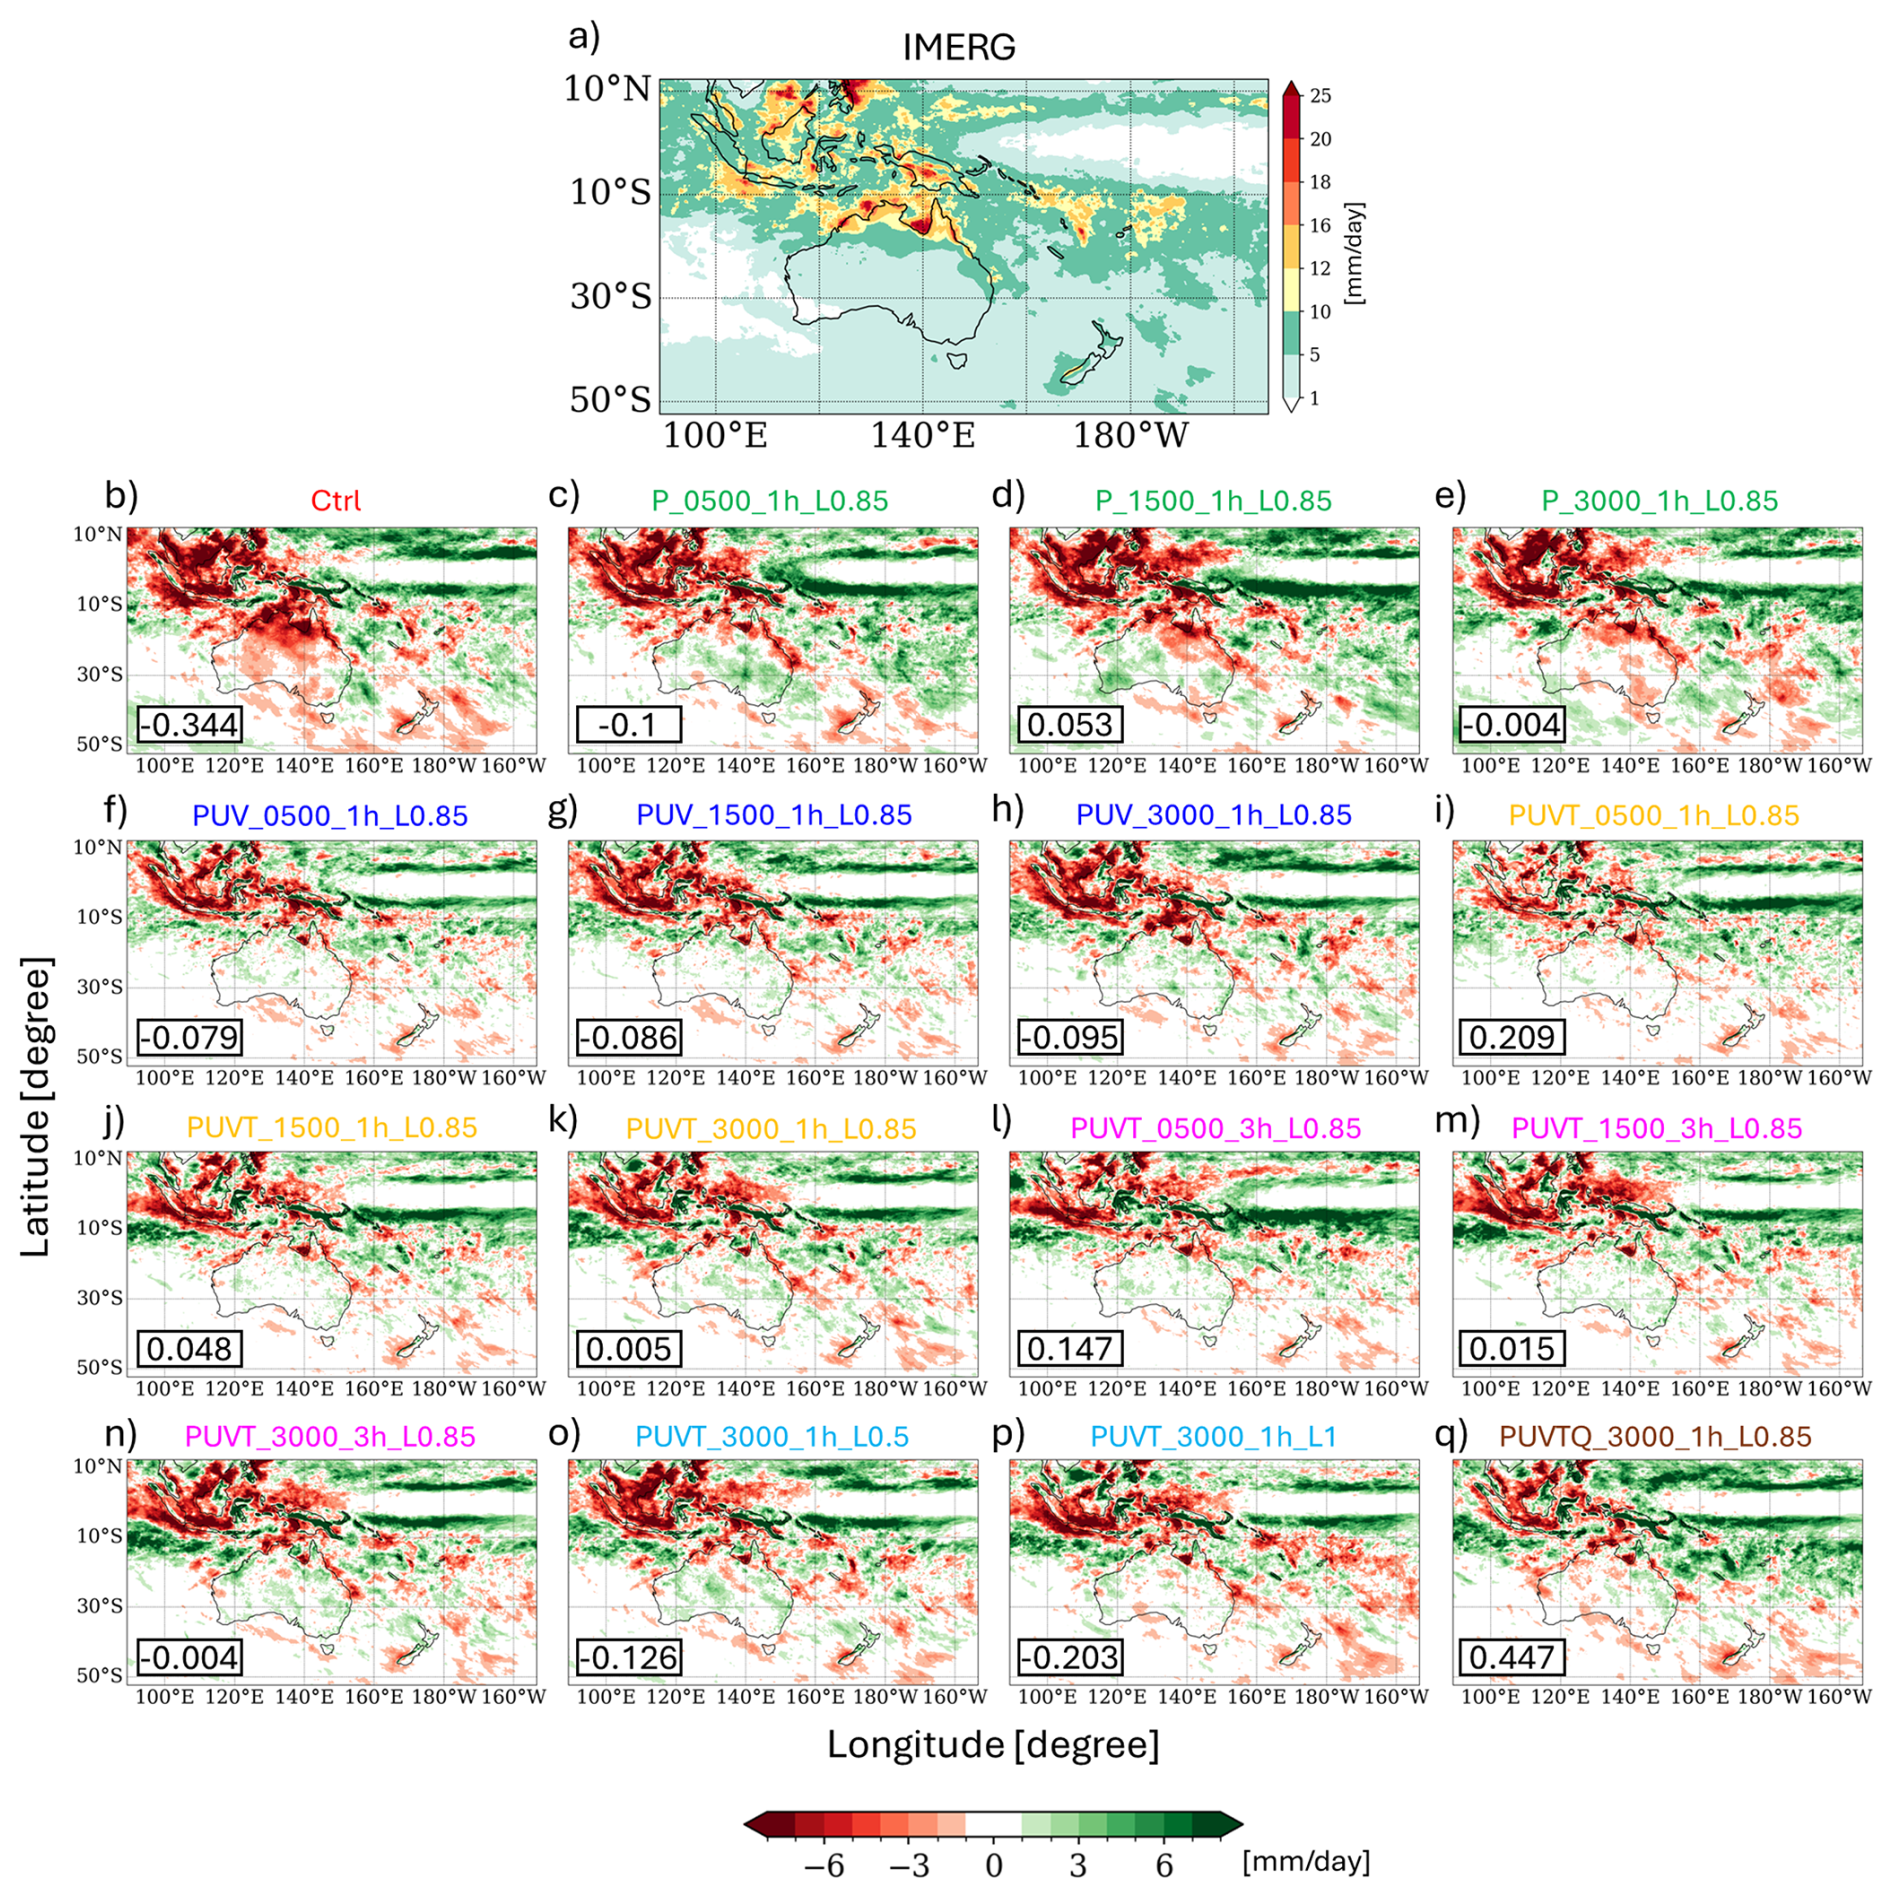
Figure 2(a) The averaged precipitation from December 2010 to March 2011 over the study domain (mm d−1) for IMERG; and (b–q) the bias relative to IMERG for each of the 16 simulations. Black box in the lower left indicates the domain averaged values. Different colours in the header of each panel indicate the grouped simulations in Table 1.
In the CCAM simulations, the Ctrl displays substantial regional biases relative to IMERG (Fig. 2b). A wet bias (green shading) dominates the equatorial western Pacific, suggesting an excessive convective activity north of Papua New Guinea, while a dry bias (red shading) prevails across northern and eastern Australia, the MC, indicating a systematic underestimation of tropical convection activities. Over Australia, the Ctrl shows strong dry biases (> 5 mm d−1) in the north and similar, though less pronounced, bias in the southeast, underscoring the challenges in reproducing observed precipitation (Fig. 2b). The time series of spatially averaged daily rainfall for IMERG and AGCD over Australia shows strong agreement (r= 0.94), with similar timing and intensity of rainfall events throughout the study period (Fig. S3). However, the spatial distribution of correlation and RMSE between AGCD and IMERG is low across much of Australia (Fig. S3b, c). This discrepancy arises because grid-point comparisons are sensitive to small spatial and timing differences, while spatial averaging suppresses small-scale variability and highlights large-scale signals such as the MJO, monsoonal circulation, and frontal systems, which both datasets capture more consistently (Fig. S3a). Most nudged simulations reduce these continental biases, with biases over Australia generally constrained within ±2 mm d−1 (Fig. 2c–q). Improvements are most pronounced in the eastern and southern subregions, where large dry biases in the Ctrl are substantially diminished. However, model performance remains limited in specific regions, such as the wet bias observed in the high-elevation areas of Papua New Guinea and the dry bias over the Gulf of Carpentaria. These biases coincide with significant observational uncertainties (Alexander et al., 2020), as the three precipitation products differ markedly in their representation of precipitation in region R3 and R4 (Fig. S1). These results suggest that while spectral nudging substantially improves rainfall representation over continental Australia, it is less effective in correcting tropical precipitation biases, which may be linked to convective parameterisation and/or the impacts of horizontal resolution.
Next, we assess the model performance over the six regions presented in Fig. 1 using Taylor diagrams of mean precipitation distribution (Fig. 3) to quantify spatial skill in terms of correlation (R), normalized standard deviation (nSD), and root-mean-square error (RMSE). The Ctrl shows very low correlations (R= 0.05–0.25), strongly underestimated variance across all domains (nSD ∼ 0.2–0.4), and RMSE consistently largest across all regions, underscoring its inability to reproduce the spatial-organized precipitation. In contrast, most nudged simulations achieved substantially higher skill, with R values of 0.80–0.95, nSD between 0.5 and 0.9, and markedly reduced RMSE (Figs. 3 and S4). Improvements were most pronounced over Australian continent (R2, R4, and R5), where several configurations reached R ≥ 0.9 and nSD close to 1, while performance was weaker in convective (R1) and orographic (R3) regions, where R remained somewhat lower (∼ 0.75–0.85) and RMSE larger. It is also worth mentioning that observational uncertainties are significant in estimating both mean precipitation and extremes in R1 and R3 (Nguyen et al., 2020; Alexander et al., 2020), which could explain the “weaker performance” observed in simulations over these regions.
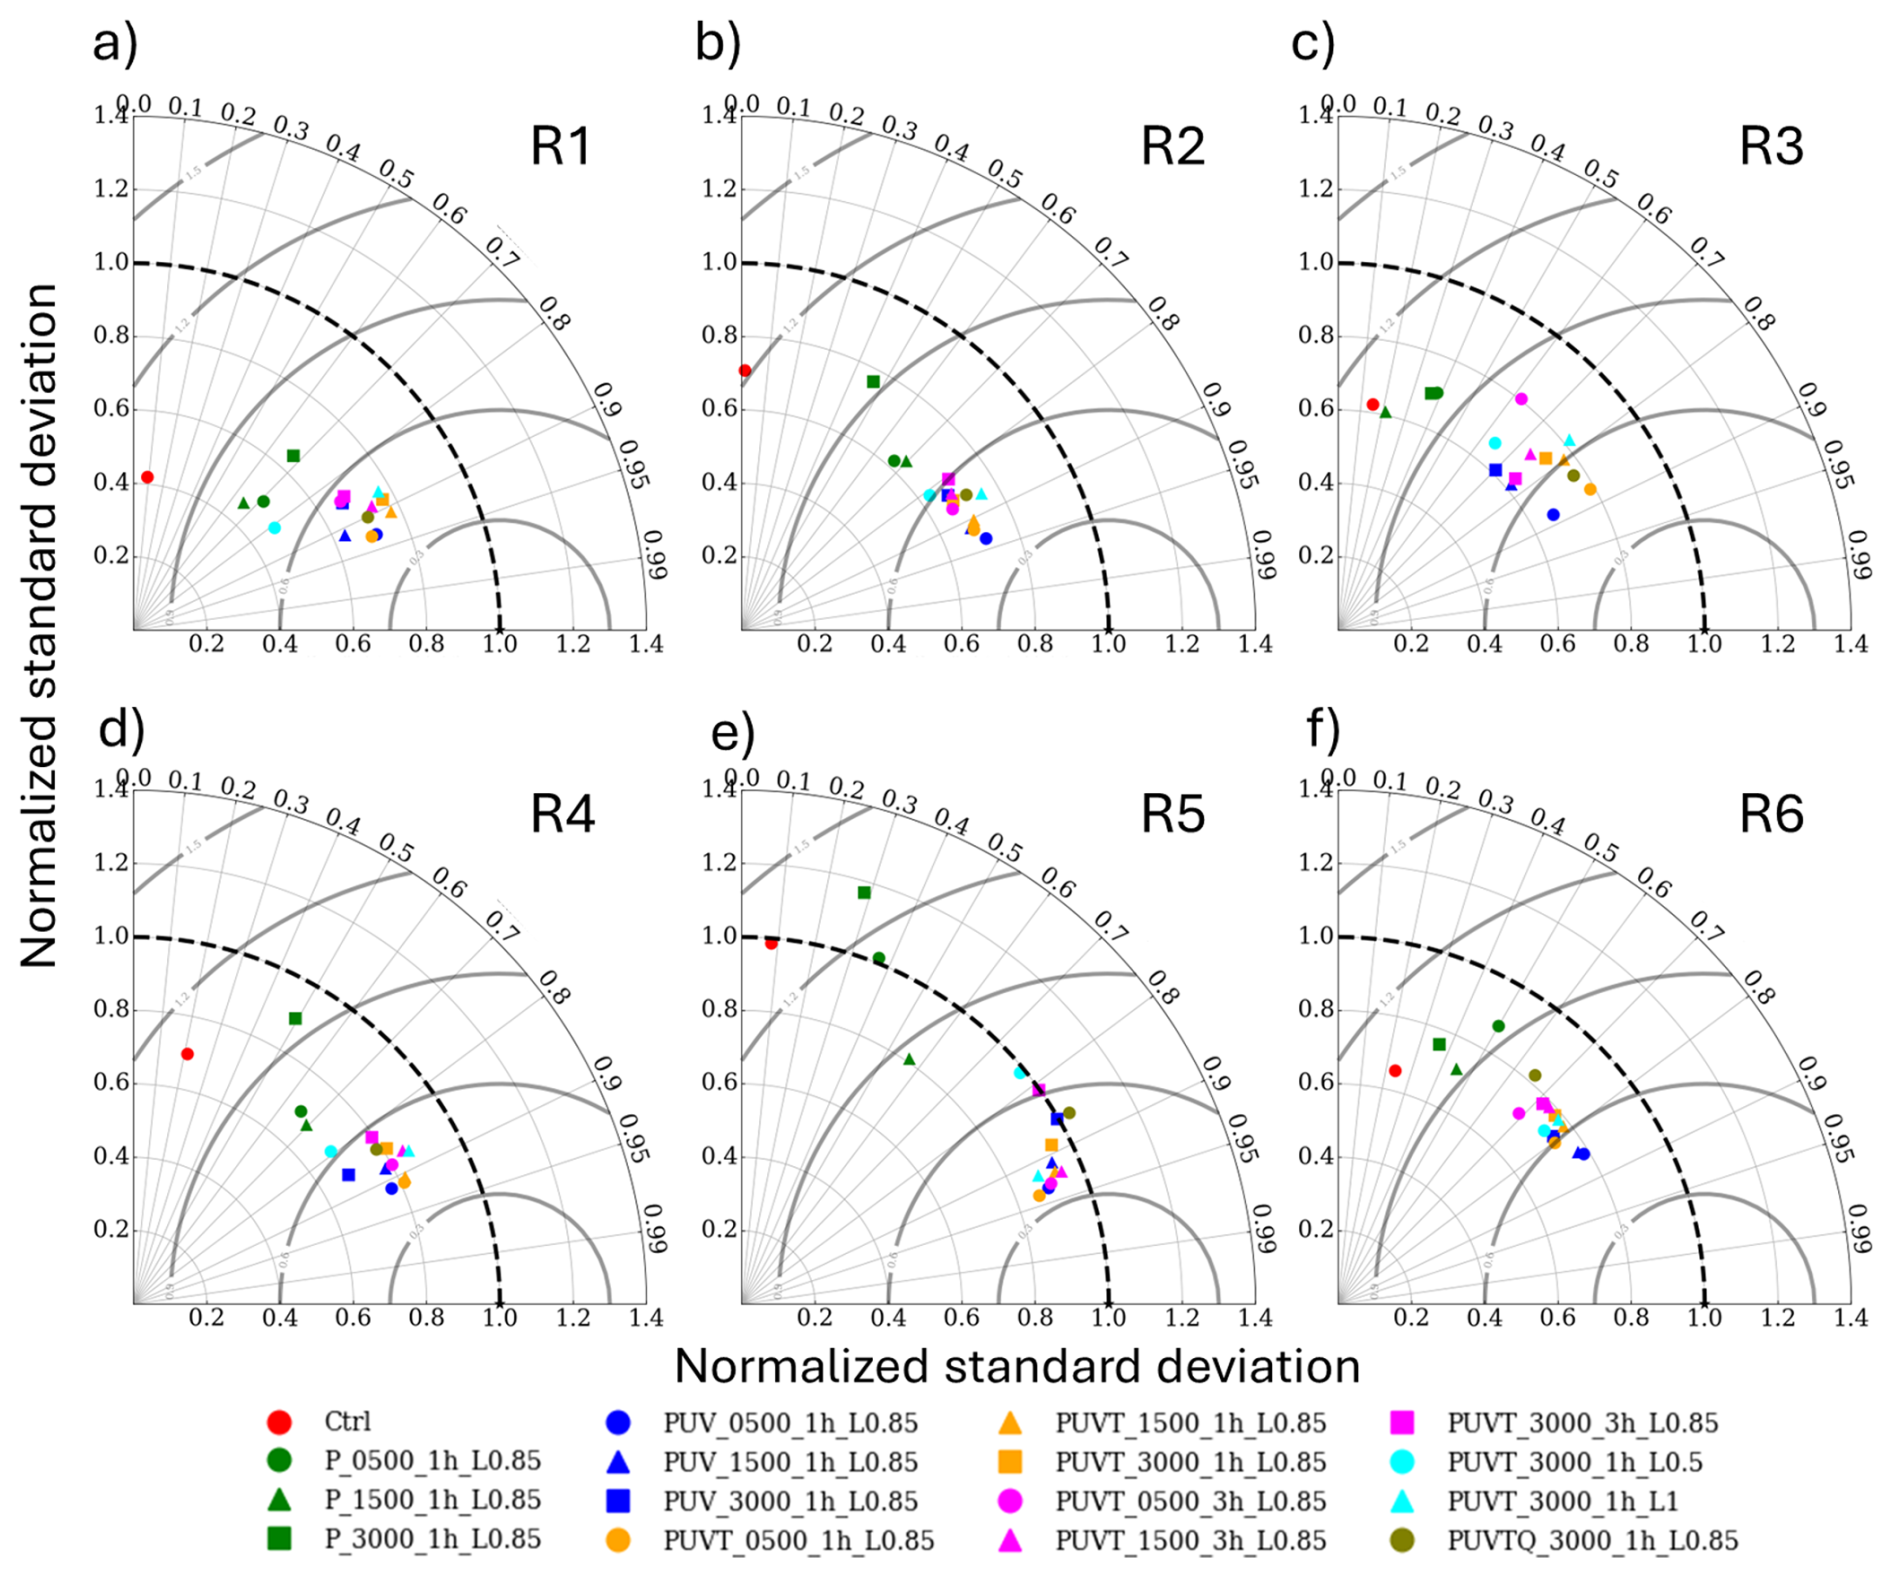
Figure 3Taylor diagrams of daily precipitation averaged from December 2010 to March 2011 for six subregions (R1–R6), comparing 16 CCAM simulations with IMERG. Radial axis (distance from origin) represents standard deviation of the simulated precipitation (normalized by the observed standard deviation, IMERG). Angular axis (angle from x-axis) represents correlation coefficient between models and IMERG. Solid gray concentric arcs represent the centered root-mean-square error (RMSE) between the models and IMERG [a distance from the reference point on x-axis at (1,0)]. Coloured markers denote simulation groups (legend).
Examining further into each nudged simulations indicate that P_var groups yields modest improvements over Australia. Furthermore, correlations remain weak in convective and orographic regions (e.g., R1, R3), rarely exceeding R= 0.6 and with relatively large RMSE. PUV groups performs better, especially in R4 and R5 where correlations approach 0.9 and RMSE is reduced, though tropical biases persist. The PUVT_1h and PUVT_3h groups produce the most balanced results, with R consistently ≥ 0.8–0.9, nSD less than 1, and lowest RMSE across regions, particularly for shorter wavelength, 1 h updates (500–1500 km, L0.85). By contrast, simulations with adding moisture (PUVTQ) or vertical levels (PUVT_L) exhibit inconsistent performance across regions, sometimes improving correlation but often at the cost of reduced variance. Collectively, these results align with previous discussion that shorter wavelength, frequent, multi-variable nudging (PUVT) offers better spatial representation of precipitation, whereas vertical nudging of either from surface or mid- to the top of the atmosphere lead to regionally biased outcomes. Our analysis of the Taylor diagram comparing CCAM simulations to GPCP produced results similar to those obtained with IMERG, reinforcing our previous conclusion without altering the overall findings (Fig. S5).
We examined the frequency distributions of daily precipitation across six subregions (Fig. 4) to evaluate model fidelity relative to IMERG. All simulations overestimate (dashed red box) light precipitation (5–15 mm d−1) and underestimate (dashed blue box) moderate events (15–30 mm d−1), with the largest discrepancies in R1 and R3 (Fig. 4a and c). R5 is the only region where light-rainfall biases are minimal. The frequency of extremes (> 40 mm d−1) is reasonably reproduced across all simulations. Improvements from nudging are most evident in R2 and R4 in all nudged simulations. In contrast, light rain excess remains persistent in R1 and R3, underscoring the difficulty of correcting convective and orographic rainfall biases even under optimized nudging configurations.
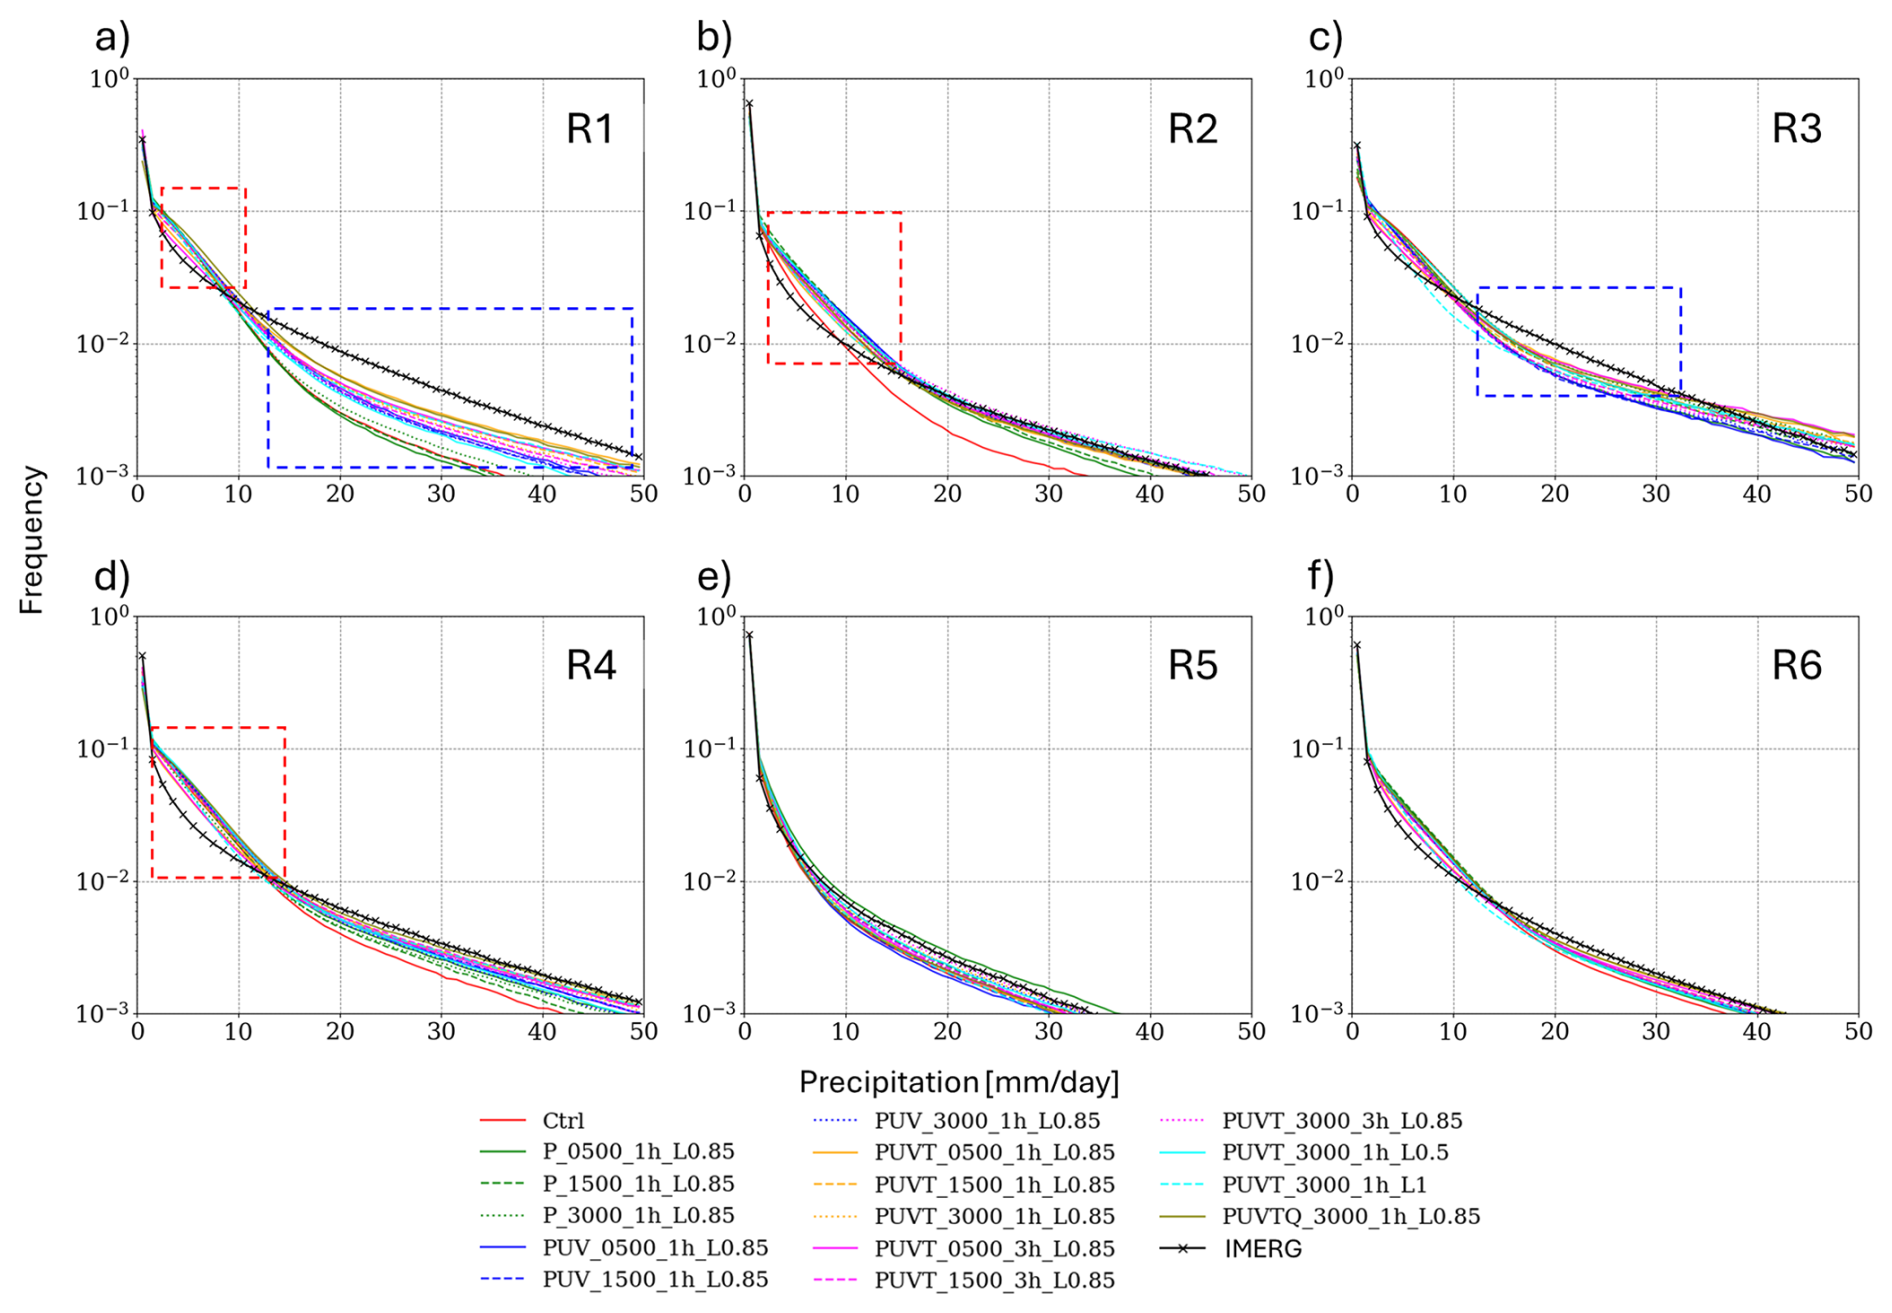
Figure 4Frequency of daily precipitation intensity for IMERG and 16 CCAM simulations averaged over each region from December 2010 to March 2011. The dashed red and blue boxes indicate regions where the model respectively overestimates and underestimates precipitation compared to IMERG
3.1.2 Temporal variance of precipitation
Across all regions, the Ctrl simulation persistently underestimates rainfall (e.g., ∼ 10 mm d−1 deficit in R4 on 25 December 2010) while occasionally exaggerating daily peaks (e.g., > 12 mm in R2 on 1 March 2011) (Fig. 5). It often fails to reproduce the timing of major events such as severe tropical cyclone Carlos over Darwin (15 February 2011, in Fig. 5b) and Yasi over Queensland (2 February 2011, in Fig. 5d). Nudged simulations substantially improve both timing and magnitude, reducing errors to ∼ 1–5 mm d−1. This is likely a result of nudging's ability to maintain large-scale atmospheric conditions, which allows the model to more accurately simulate the dynamics of tropical cyclones like Carlos and Yasi, thereby improving precipitation representation. Depending on nudging configurations, some runs (e.g., P_1500_ 1h_L0.85) slightly underestimate peak intensities by 1–2 mm d−1. The largest improvements occur in R1 and R4, where Ctrl underestimates of ∼ 10 mm d−1 are reduced to < 1.5 mm d−1 in the best-performing PUVT runs, consistent with Taylor diagrams (Fig. 3) showing correlations rising from ∼ 0.5 in the Ctrl to > 0.9 with nudging. The persistent underestimation in R1 through the entire timeseries may partly reflect its lower horizontal resolution (e.g., > 20 km, Fig. 1) relative to IMERG.
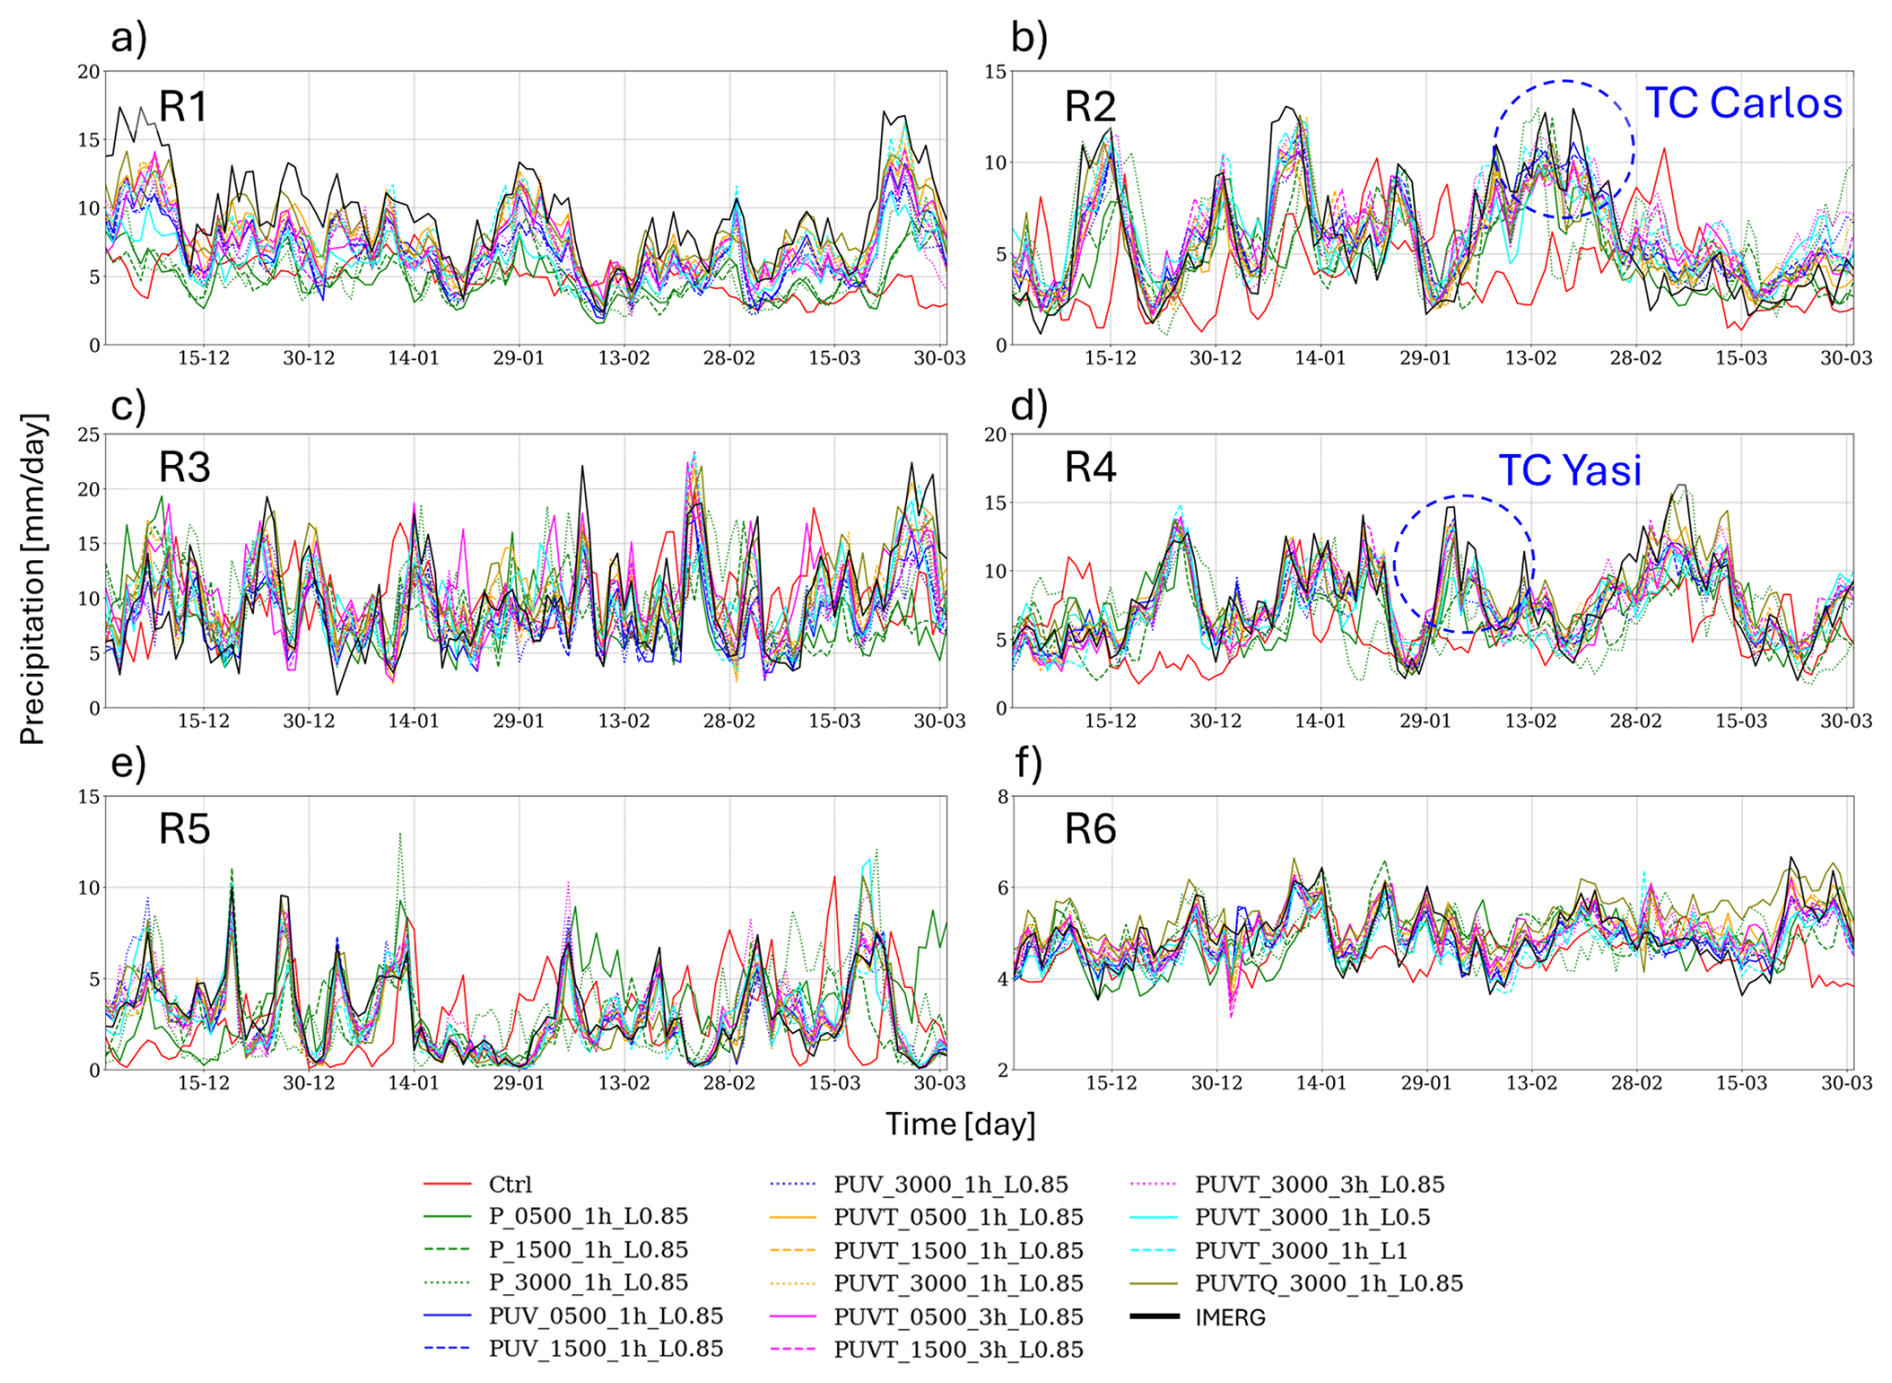
Figure 5Time series of spatially averaged daily rainfall (mm d−1) for IMERG and 16 CCAM simulations over the six from December 2010 to March 2011.
The best overall performance is delivered by the PUVT_1h group at 500–1500 km with short update intervals (1 h, L0.85), which closely track the IMERG time series in R1–R4, correcting peak errors of to < 1.5 mm d−1 while maintaining realistic phase alignment of major synoptic events. Moderate skill is achieved by the PUVT_3h group and PUV runs, which improve timing and magnitude in some regions but degrade performance in others. In contrast, adding moisture or applying mid- or full-column nudging does not provide clear benefits, and in some cases degrades performance. The poorest outcomes are seen in the Ctrl and P_var groups, which either sustain exaggerated peaks (> 15 mm d−1) or distort the temporal structure.
The Hovmöller diagram of zonally averaged daily precipitation (Fig. 6) highlights the dominant influence of the MJO on rainfall variability during December 2010–March 2011. IMERG indicates persistent convective maxima within ∼ 15° S–15° N, punctuated by two strong episodes in mid-January and early February 2011 with daily zonal means exceeding 25 mm d−1 (Fig. 6a). These surges coincide with active MJO phases over the MC and western Pacific (RMM phases 4–7) (Fig. S5), consistent with the enhanced precipitation in the regional time series (Fig. 5) for R1–R4. However, the Ctrl fails to reproduce the intensity and spatial coherence of these convective maxima (dashed red box, Fig. 6b). Precipitation within 15° S–15° N is markedly weaker, with zonal means rarely exceeding 10 mm d−1, and both major MJO surges are substantially underestimated. Convective regions appear fragmented and displaced, indicating the model's inability to capture the organized eastward propagation of MJO. South of 20° S, rainfall is sporadic and lacks the intensity and persistence evident in IMERG, consistent with the dry biases in the regional time series (Fig. 5). Collectively, these deficiencies demonstrate the Ctrl's limited skill in representing tropical intraseasonal variability and its teleconnections across the MC and Australasian domain.
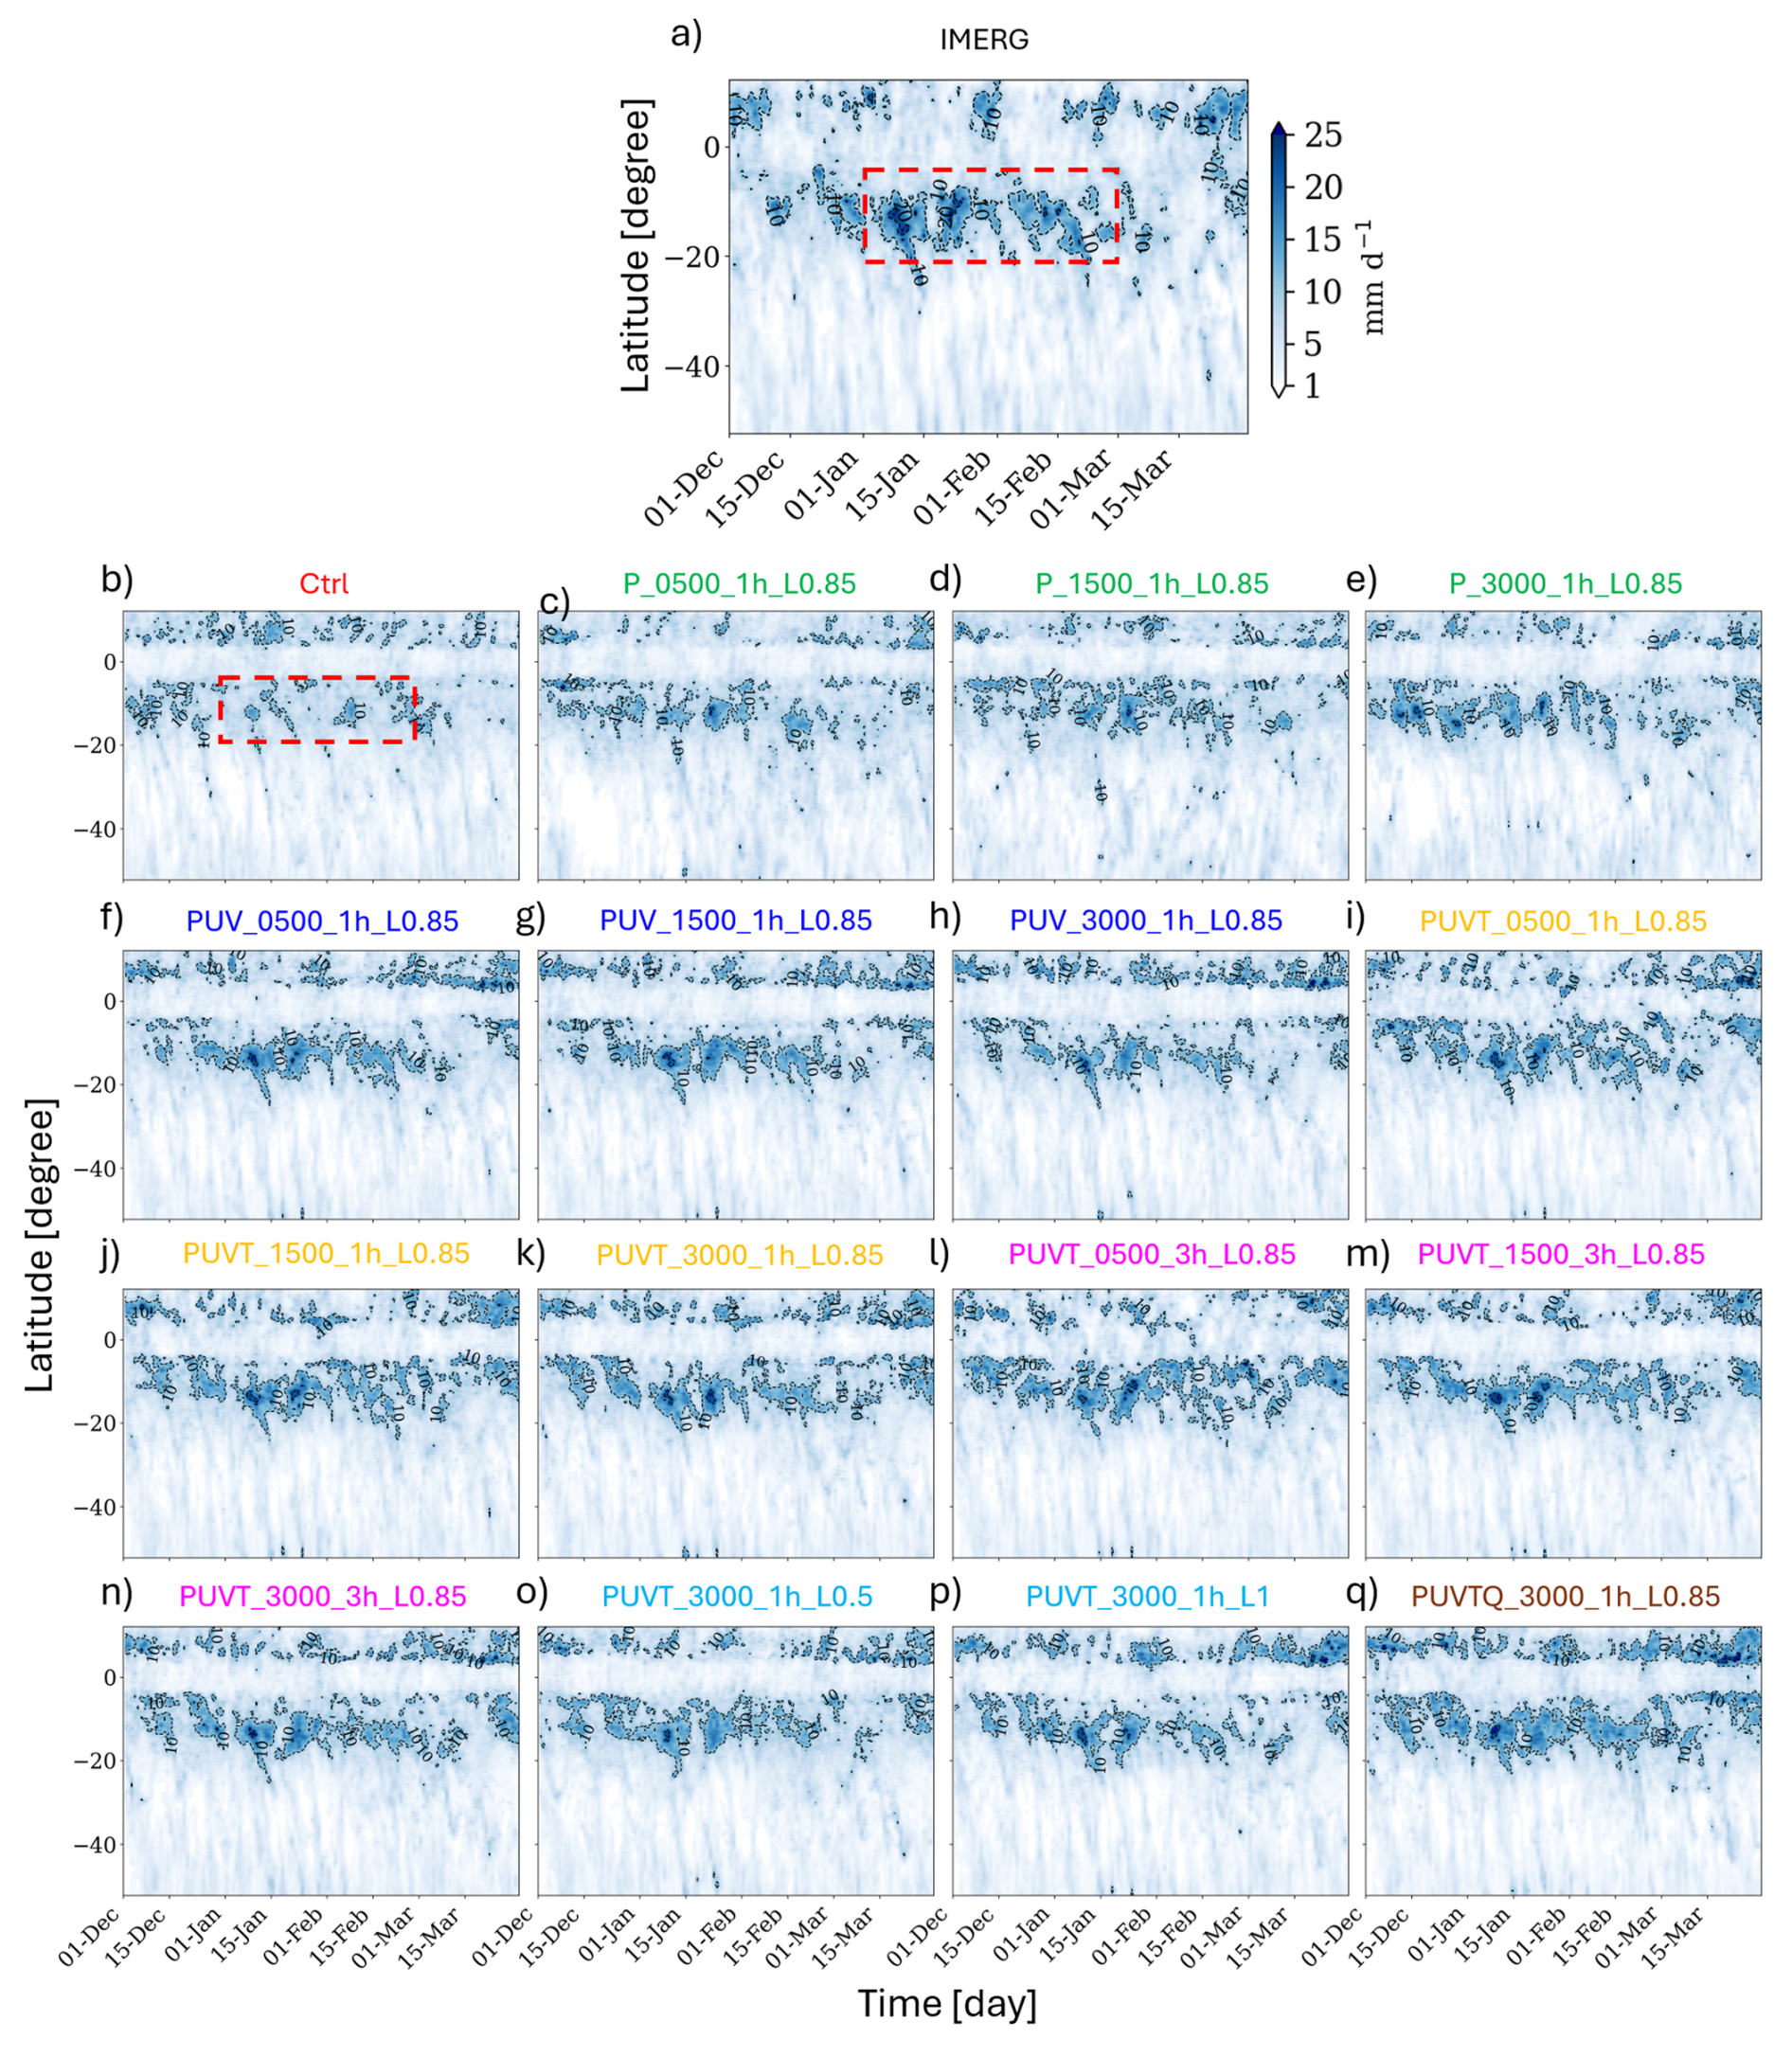
Figure 6Hovmöller diagram of zonally averaged daily precipitation (mm d−1) from the IMERG dataset for the period 1 December 2010 to 31 March 2011, averaged over 90° E to 170° E. Dash red box indicates the regions of MJO-related peak precipitation.
Nudged simulations markedly improve the zonal-mean representation of tropical precipitation compared to the Ctrl (Fig. 6c–q). Across most configurations, convective maxima within 15° S–15° N are intensified and better aligned with the MJO-related surges in mid-January and early February 2011, reducing the dry bias evident in the Ctrl. The PUVT_1h group at short wavelengths (e.g., 500–1500 km, Fig. 6) perform best, capturing both the magnitude and spatial coherence of the convective regions and closely tracking the eastward propagation of MJO. PUV and PUVT_3h runs also provide noticeable improvements in timing and magnitude, though their maxima are somewhat weaker than observed. Furthermore, configurations with mid-column nudging degrades model performance to represent MJO (Fig. 6o) whereas nudging from the surface to the top of the atmosphere does not add further benefit compared to other PUVT nudged simulations (Fig. 6p). The inclusion of specific humidity exaggerates light rainfall while failing to represent the organized MJO surges (Fig. 6q).
3.1.3 Low-level circulation and vertical correlation
The analysis of moisture flux divergence from ERA5 data (Fig. 7) reveals distinct spatial patterns during the 2010–2011 La Niña event. A prominent convergence zone (blue shading) is observed over northern and northwest Australia (Fig. 7a), closely aligned with the low-pressure system in this region (Fig. S7). Subtropical divergence (red shading) south of approximately 30° S reflects subsidence, associated with a high-pressure system to the south (Fig. S7), which likely contributes to suppressed rainfall over southern Australia, consistent with the observed decrease in precipitation shown in Fig. 1a. Low-level wind patterns indicate monsoonal winds from the tropics, driving moisture towards the Australian continent, a feature consistent with the active Australian monsoon during this period (e.g., BoM, 2012; Giles, 2012; Lisonbee and Ribbe, 2021). The convergence regions identified in Fig. 7a qualitatively correspond to high-precipitation areas, particularly over the Gulf of Carpentaria, west of Sumatra, New Guinea, the MC, and New Zealand (Fig. 1a). In contrast, the Ctrl exhibits a weaker and displaced low-pressure system over northwest Australia, resulting in diminished moisture convergence and an underestimation of precipitation in those regions such as the Gulf of Carpentaria, as seen in Fig. 1a. These discrepancies highlight the limitations of the Ctrl in accurately capturing monsoonal dynamics. In contrast, the nudged simulations significantly improve both the spatial structure and magnitude of moisture convergence, as well as the low-level circulation. The inclusion of pressure nudging (Fig. 7c) enhances the representation of low- and high-pressure systems over Australia, with the low-pressure system over northwest Australia becoming more defined and accurately positioned relative to the Ctrl. Wind nudging (u and v) in PUV (Fig. 7d) simulations enhances monsoonal wind flow towards Australia, improving moisture convergence in regions such as the Gulf of Carpentaria and New Guinea, and aligning moisture flux divergence more closely with observed precipitation patterns. This also improves MJO phase dynamics, ensuring the precipitation peak occurs in the correct location (Fig. 5f–h). Additionally, the inclusion of temperature nudging PUVT (Fig. 7e) further refines the MJO-related precipitation peak, reproducing it more comparable to IMERG (Fig. 5i–n). Quantitatively, the location and magnitude of convergence regions over northern Australia improve by ∼ 30 %–40 % compared to the Ctrl. Similar improvements in moisture transport and convergence in Fig. 7 are also observed at both lower (e.g., 900 hPa) and upper levels (e.g., 800 hPa). There is minimal difference between simulations where nudging is applied from 500 hPa (mid-troposphere to top of the atmosphere). However, moisture nudging introduced additional convergence regions emerge, particularly over northern Australia, leading to overestimated rainfall (Figs. 5f, 6q and Fig. 7g). This underperformance could be partly due to biases in ERA5 moisture fields, especially in regions with sparse observations, which introduce uncertainties and limit the effectiveness of nudging in improving precipitation simulations (Virman et al., 2021; Truong et al., 2022).
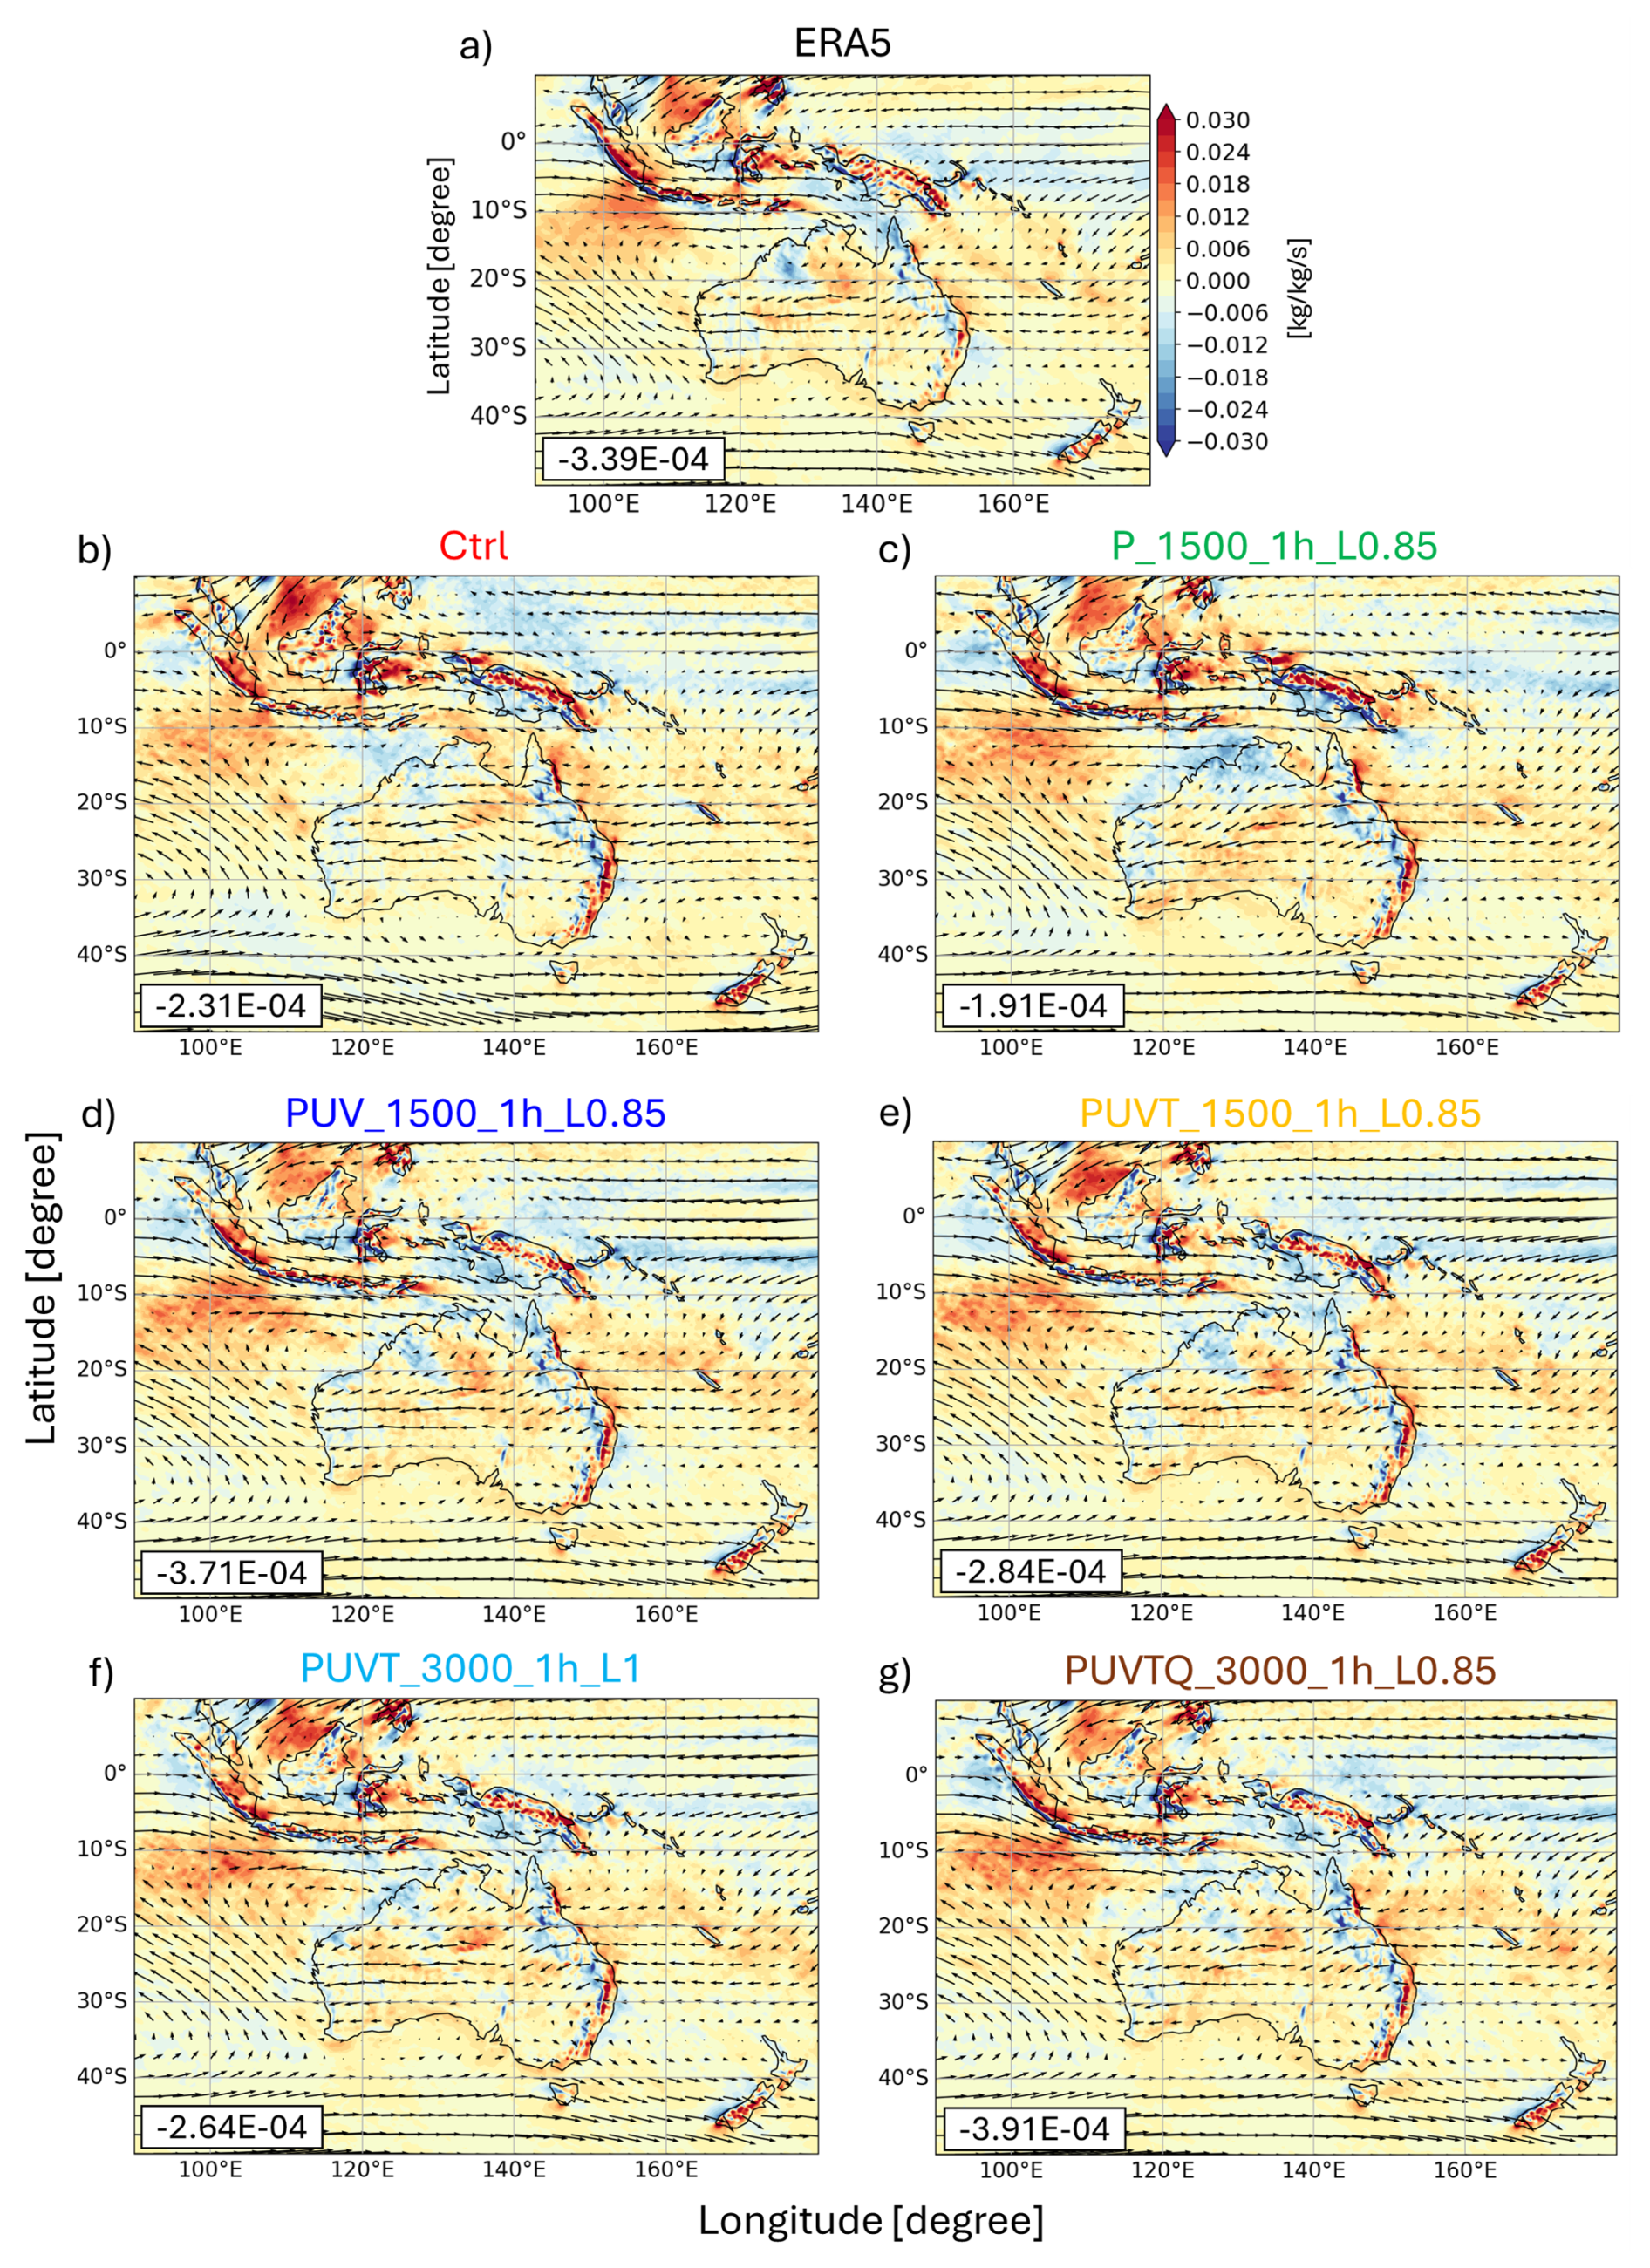
Figure 7The averaged wind fields (vectors) and water vapor flux divergence (colour shades; unit) from ERA5 at 875 hPa from December 2010 to March 2011 over study domain; (a) ERA5 and (b–q) the corresponding plot for the 16 CCAM simulations. Black boxes in the lower left of each panel indicate the domain averaged values.
Figure 8 presents vertical correlations of temperature (t), zonal wind (u), meridional wind (v), and specific humidity (q) between 16 CCAM simulations and ERA5 across the six subregions (R1–R6). The Ctrl run exhibits the weakest skill, with correlations frequently below 0.4 in the mid- to upper troposphere (400–200 hPa). Nudged simulations markedly improve vertical coherence, although the magnitude of improvement varies by configurations. For temperature, the PUVT_1h group, particularly, PUVT_0500_1h_L0.85 and PUVT_ 1500_ 1h_ L0.85 simulations achieve correlations exceeding 0.8, whereas mid-column nudging (PUVT_3000_1h_L0.5) degrades the simulated temperature skill and full-column nudging (PUVT_3000_1h_L1) offers no additional benefit, reinforcing the concept of constraining above the boundary layer while allowing near-surface fields to evolve freely. For winds, correlations in the Ctrl remain weak (< 0.5) throughout much of the troposphere, consistent with its poor representation of monsoon inflow and subtropical divergence (Fig. 7b). Nudged simulations, particularly PUV and PUVT at 500–1500 km, raise correlations to 0.7–0.9 across most levels, although values remain lower in the upper troposphere over R1 and R3. Specific humidity shows the greatest variability. In the Ctrl, correlations drop largely above 700 hPa (< 0.2 in R1–R3), while PUVT_0500_1h_L0.85 and PUVT_1500_1h_L0.85 improve to 0.6–0.8 in the mid-troposphere. Although nudging moisture (PUVTQ_3000_1h_L0.85) enhances the simulated specific humidity, the correlation does not differ significantly from other nudged simulations that do not include moisture nudging (Fig. 8). The correlation in specific humidity over region R3 between all models and ERA5 is lower at 900 hPa (Fig. 8), indicating spatial variability with regions both too dry and too wet, which reduces correlation (Fig. S8). At 975 hPa, the correlation is higher, indicating less variability, with the model's systematic bias (over- or underprediction) aligning with ERA5, despite differing magnitudes (Fig. S8). Regionally, R1 and R3 remain problematic even with nudging, as the vertical correlations for temperature and specific humidity in near the surface and aloft remain weaker, consistent with persistent rainfall biases (Figs. 2 and 4). By contrast, R4 and R5 show the largest improvement across all four variables (Fig. 8), aligning with improved magnitude and event timing of precipitation in Figs. 5–6. Domain-wide vertical correlation (R6, rightmost in Fig. 8) further suggests that nudged runs consistently outperforming the Ctrl across all variables.
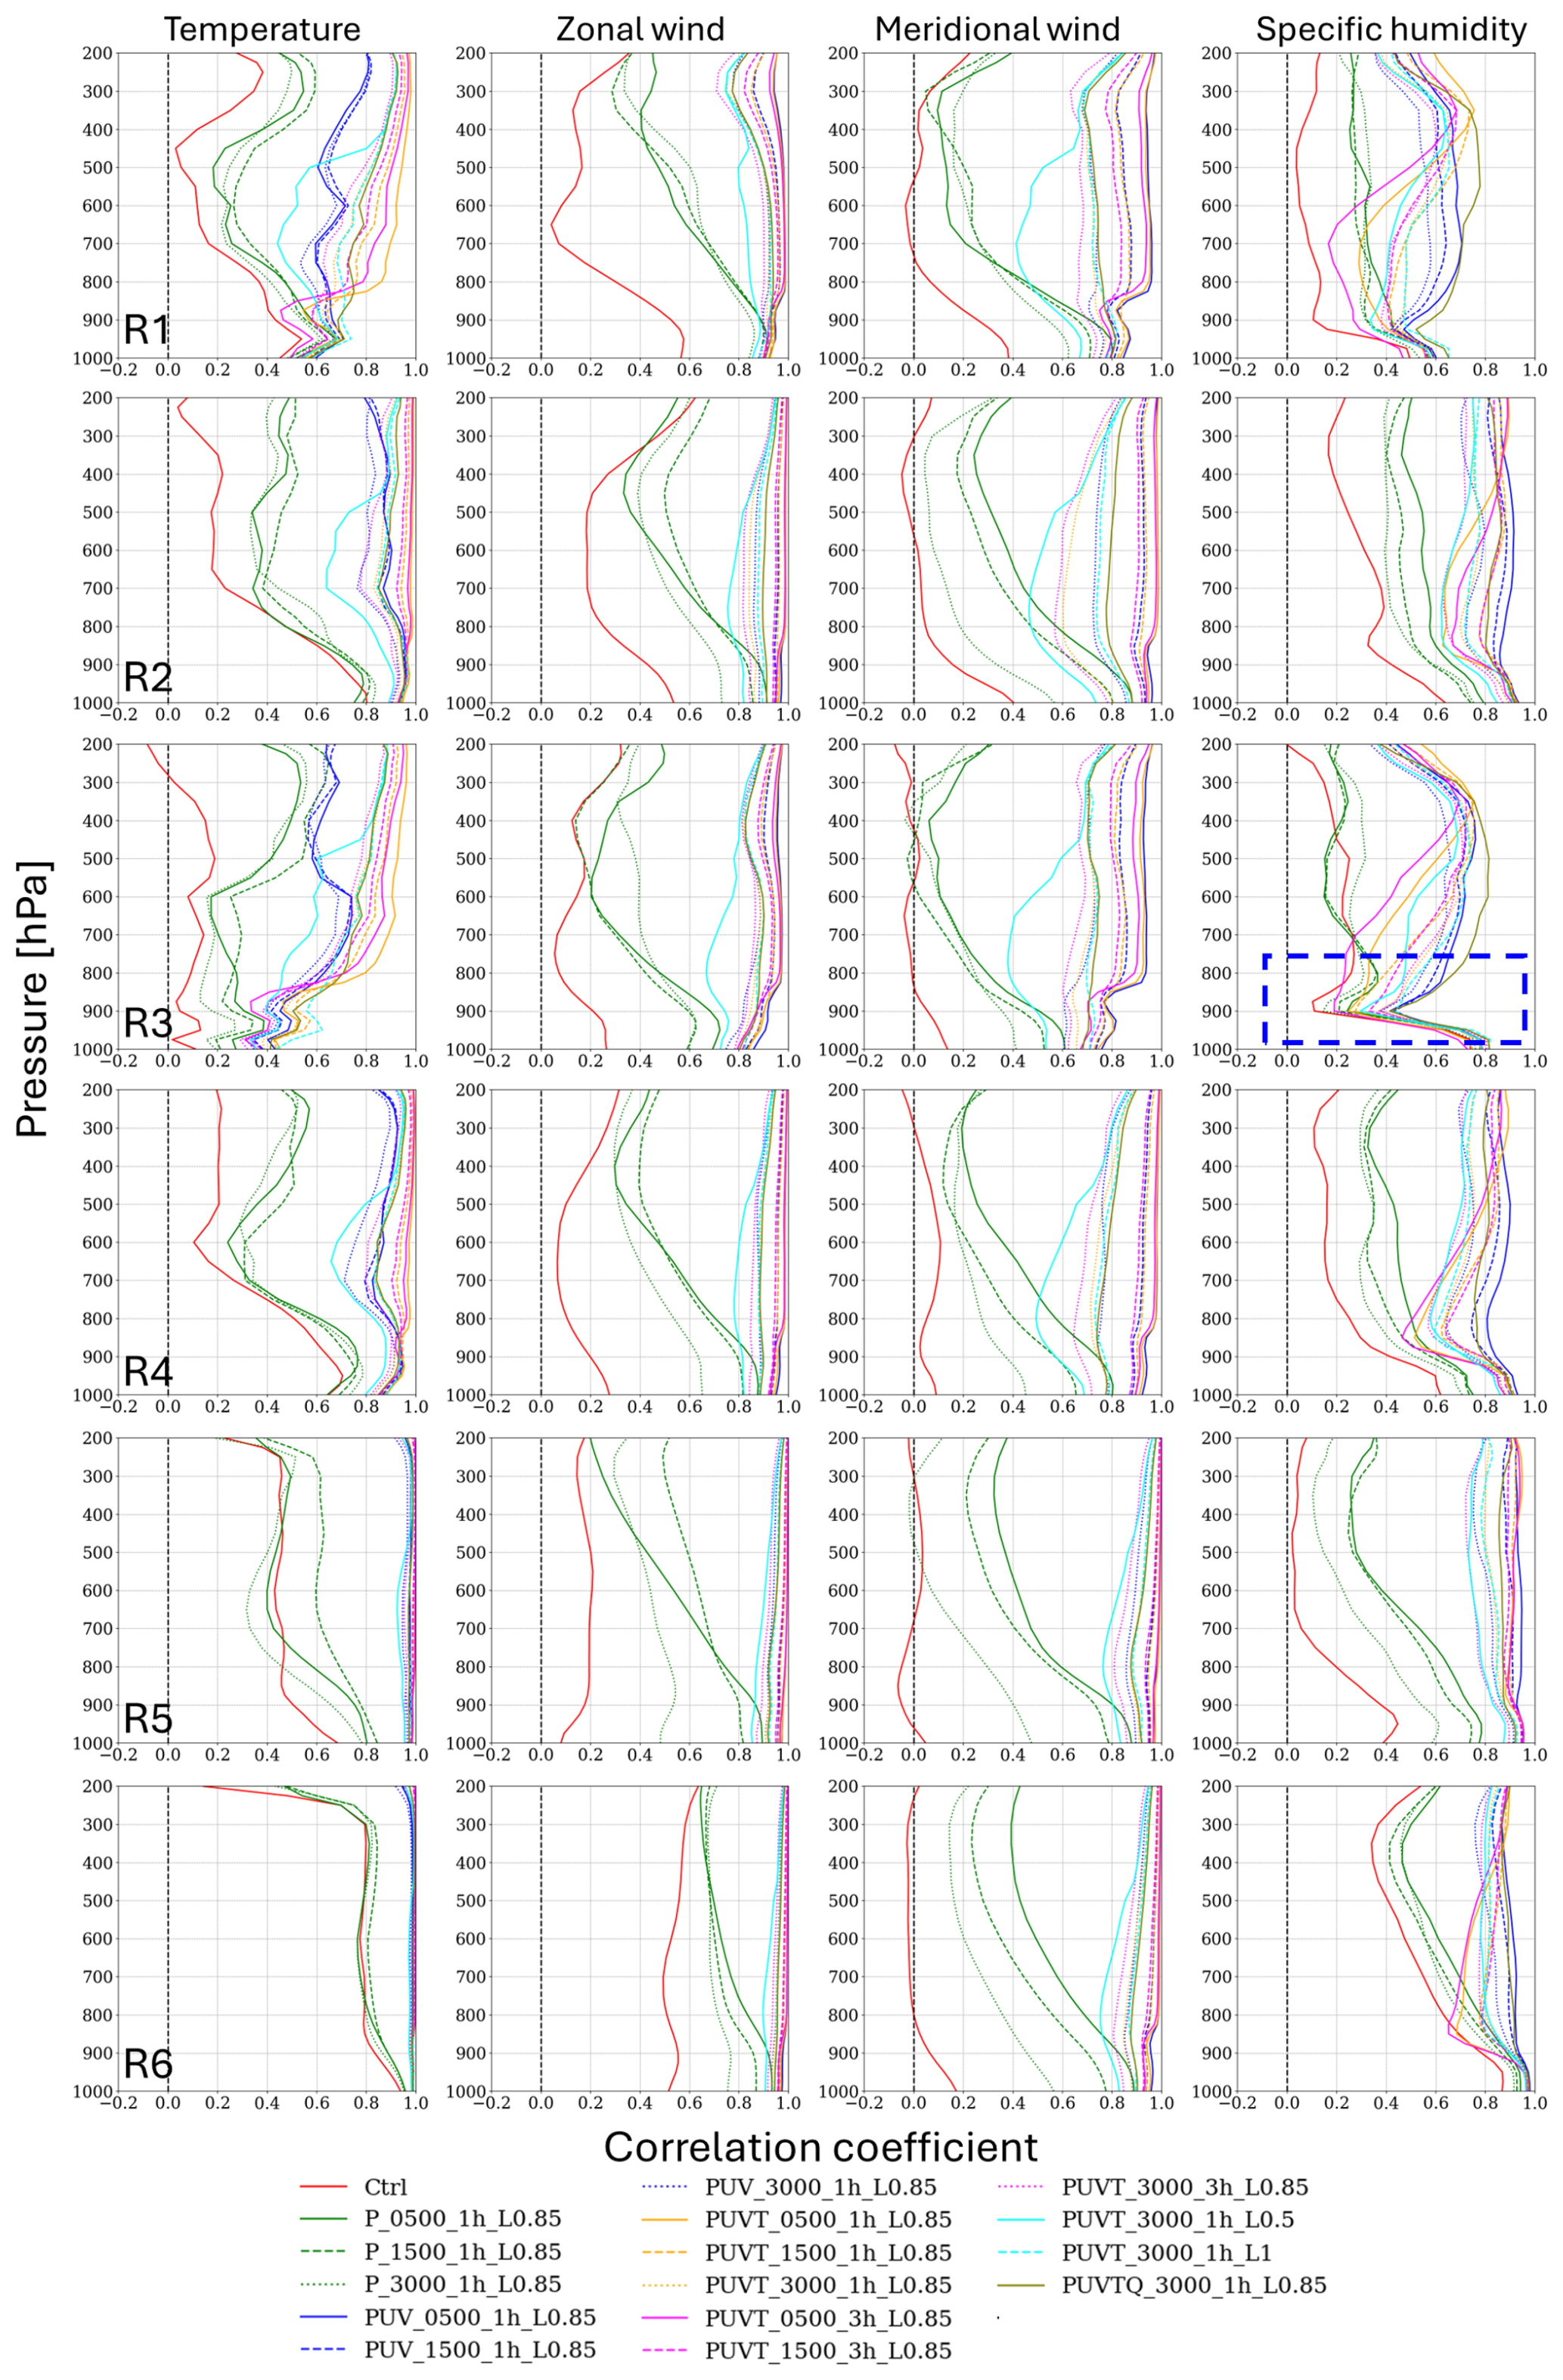
Figure 8Vertical profiles of the correlation coefficient for the spatial pattern of Temperature, u wind component, v wind component, specific humidity from top to bottom 16 CCAM simulations against ERA5 from December 2010 to March 2011 over 6 regions R1 to R6 from left to right.
3.2 Extreme precipitation
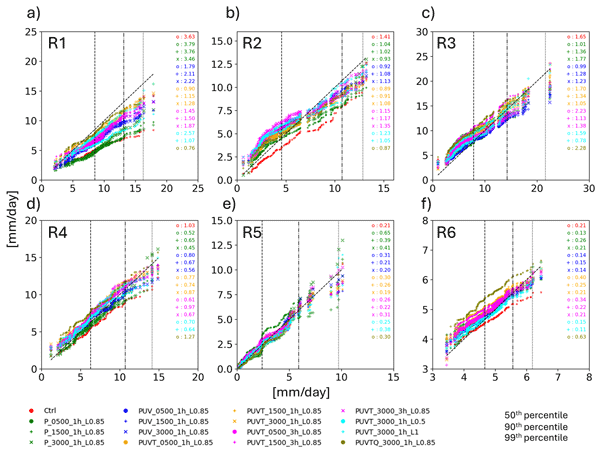
Figure 8 shows quantile–quantile (QQ) plots of daily regionally averaged precipitation against IMERG for the six subregions. The Ctrl shows the largest departures from the 1:1 line, systematically underestimating rainfall beyond the median (50th percentile) and failing to capture heavy rainfall above the 99th percentile in most regions, particularly R1, R2, R4, and whole domain, R6, consistent with its dry biases observed in Figs. 2 and 6. Nudged simulations substantially improves the precipitation distribution, with the best agreement achieved by PUVT_1h group (orange marker in Fig. 9). These configurations reduce mean biases to < 1 mm d−1 across all regions and closely follows IMERG up to the 90th percentile, while also reproducing the upper tail of the distribution (99th) more realistically, including the balance of extremes in R2–R5. It also stands out to be the best configuration for R1 region despite the coarse horizontal resolution. PUVT_3h group performs nearly as well, though with slightly scatter beyond the 90th percentile. It is interesting to note that the shorter wavelength (e.g., 500 and 1500 km) runs reduce biases substantially and follow IMERG closely through the 90th percentile, remaining stable without under- or overshooting. In contrast, longer-wavelength configurations (e.g., 3000 km) remain acceptable up to the 90th percentile but tend to under- or overshoot high-quantile rainfall thereafter, particularly in R3, R4, and R5, with normalized biases of ∼ 3–5 mm d−1. Moisture nudging (PUVTQ_3000_1h_L0.85) shows the largest biases, significantly increases rainfall above all percentiles (Fig. 9f). This is consistent with its degraded frequency distributions (Fig. 4f) and overestimation of zonally averaged daily precipitation (Fig. 6q). A persistent limitation across all simulations is the underestimation of the very highest extremes (above the 99.9th percentile) in R1 and R3, even in the best PUVT runs, reflecting unresolved convective and orographic processes. Overall, these diagnostics confirm that low-level, high-frequency PUVT nudging at intermediate wavelengths (500–1500 km, L0.85) provides the most balanced performance, reducing systematic biases across the distribution, from the median through the 90th percentile, while preserving realistic variability at higher quantiles whereas weaker (e.g., only pressure nudging) or over-constrained configurations (e.g., adding moisture) either fail to correct or exacerbate extremes.
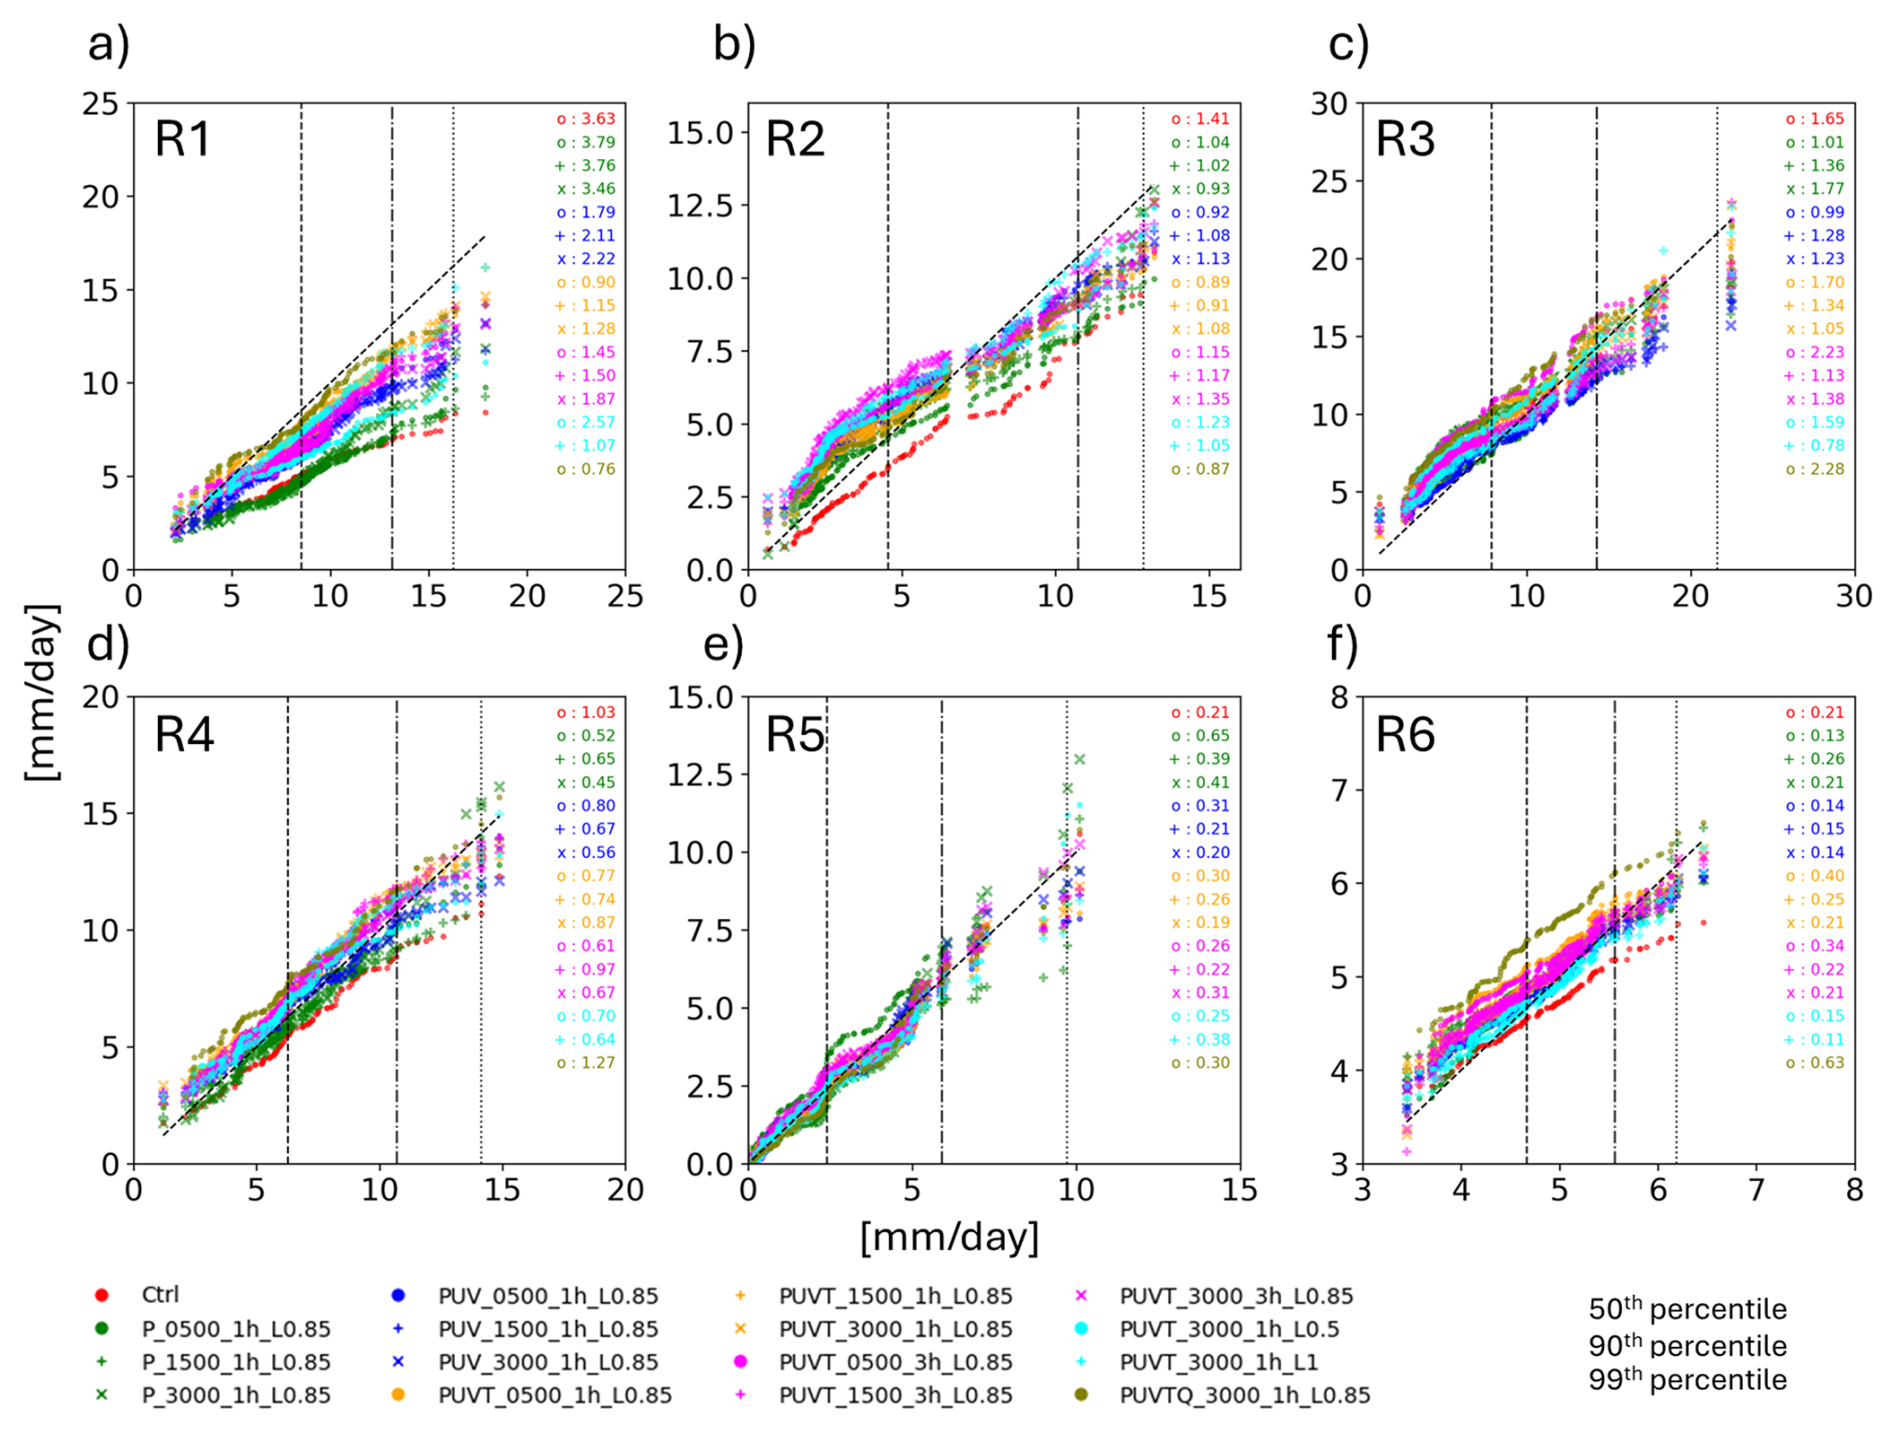
Figure 9Quantile–quantile plots of regionally averaged daily precipitation (mm d−1) against IMERG for six subregions. Coloured symbols denote different CCAM simulations (see legend). The dashed 1:1 line represents perfect agreement with observations. The numbers indicate the area formed by the 1:1 and model line. Numbers on the top right of each panel indicate the area between IMERG and CCAM in which the larger the number, the larger the difference between the two.
Figure 10 illustrates the bias of monthly maximum 1 d precipitation (Rx1day) from December 2010 to March 2011, comparing 16 CCAM simulations to IMERG. Although the study period is relatively short, it is considered representative due to the extreme wet conditions associated with the 2010–2011 La Niña event. It is noteworthy that Alexander et al. (2025) used a combination of in situ, satellite, and reanalysis data to evaluate precipitation extremes (Rx1day) over land from 2001 to 2015 and found significant variability among the products in estimating regional annual wettest days. For instance, IMERG over land tends to be wetter than the Asian Precipitation -Highly Resolved Observational Data Integration Towards Evaluation of Water Resources (APHRODITE; Yatagai et al., 2012) over Monsoon Asia. Nevertheless, IMERG is used as the “reference” to evaluate the Rx1day from CCAM simulations in our analysis.
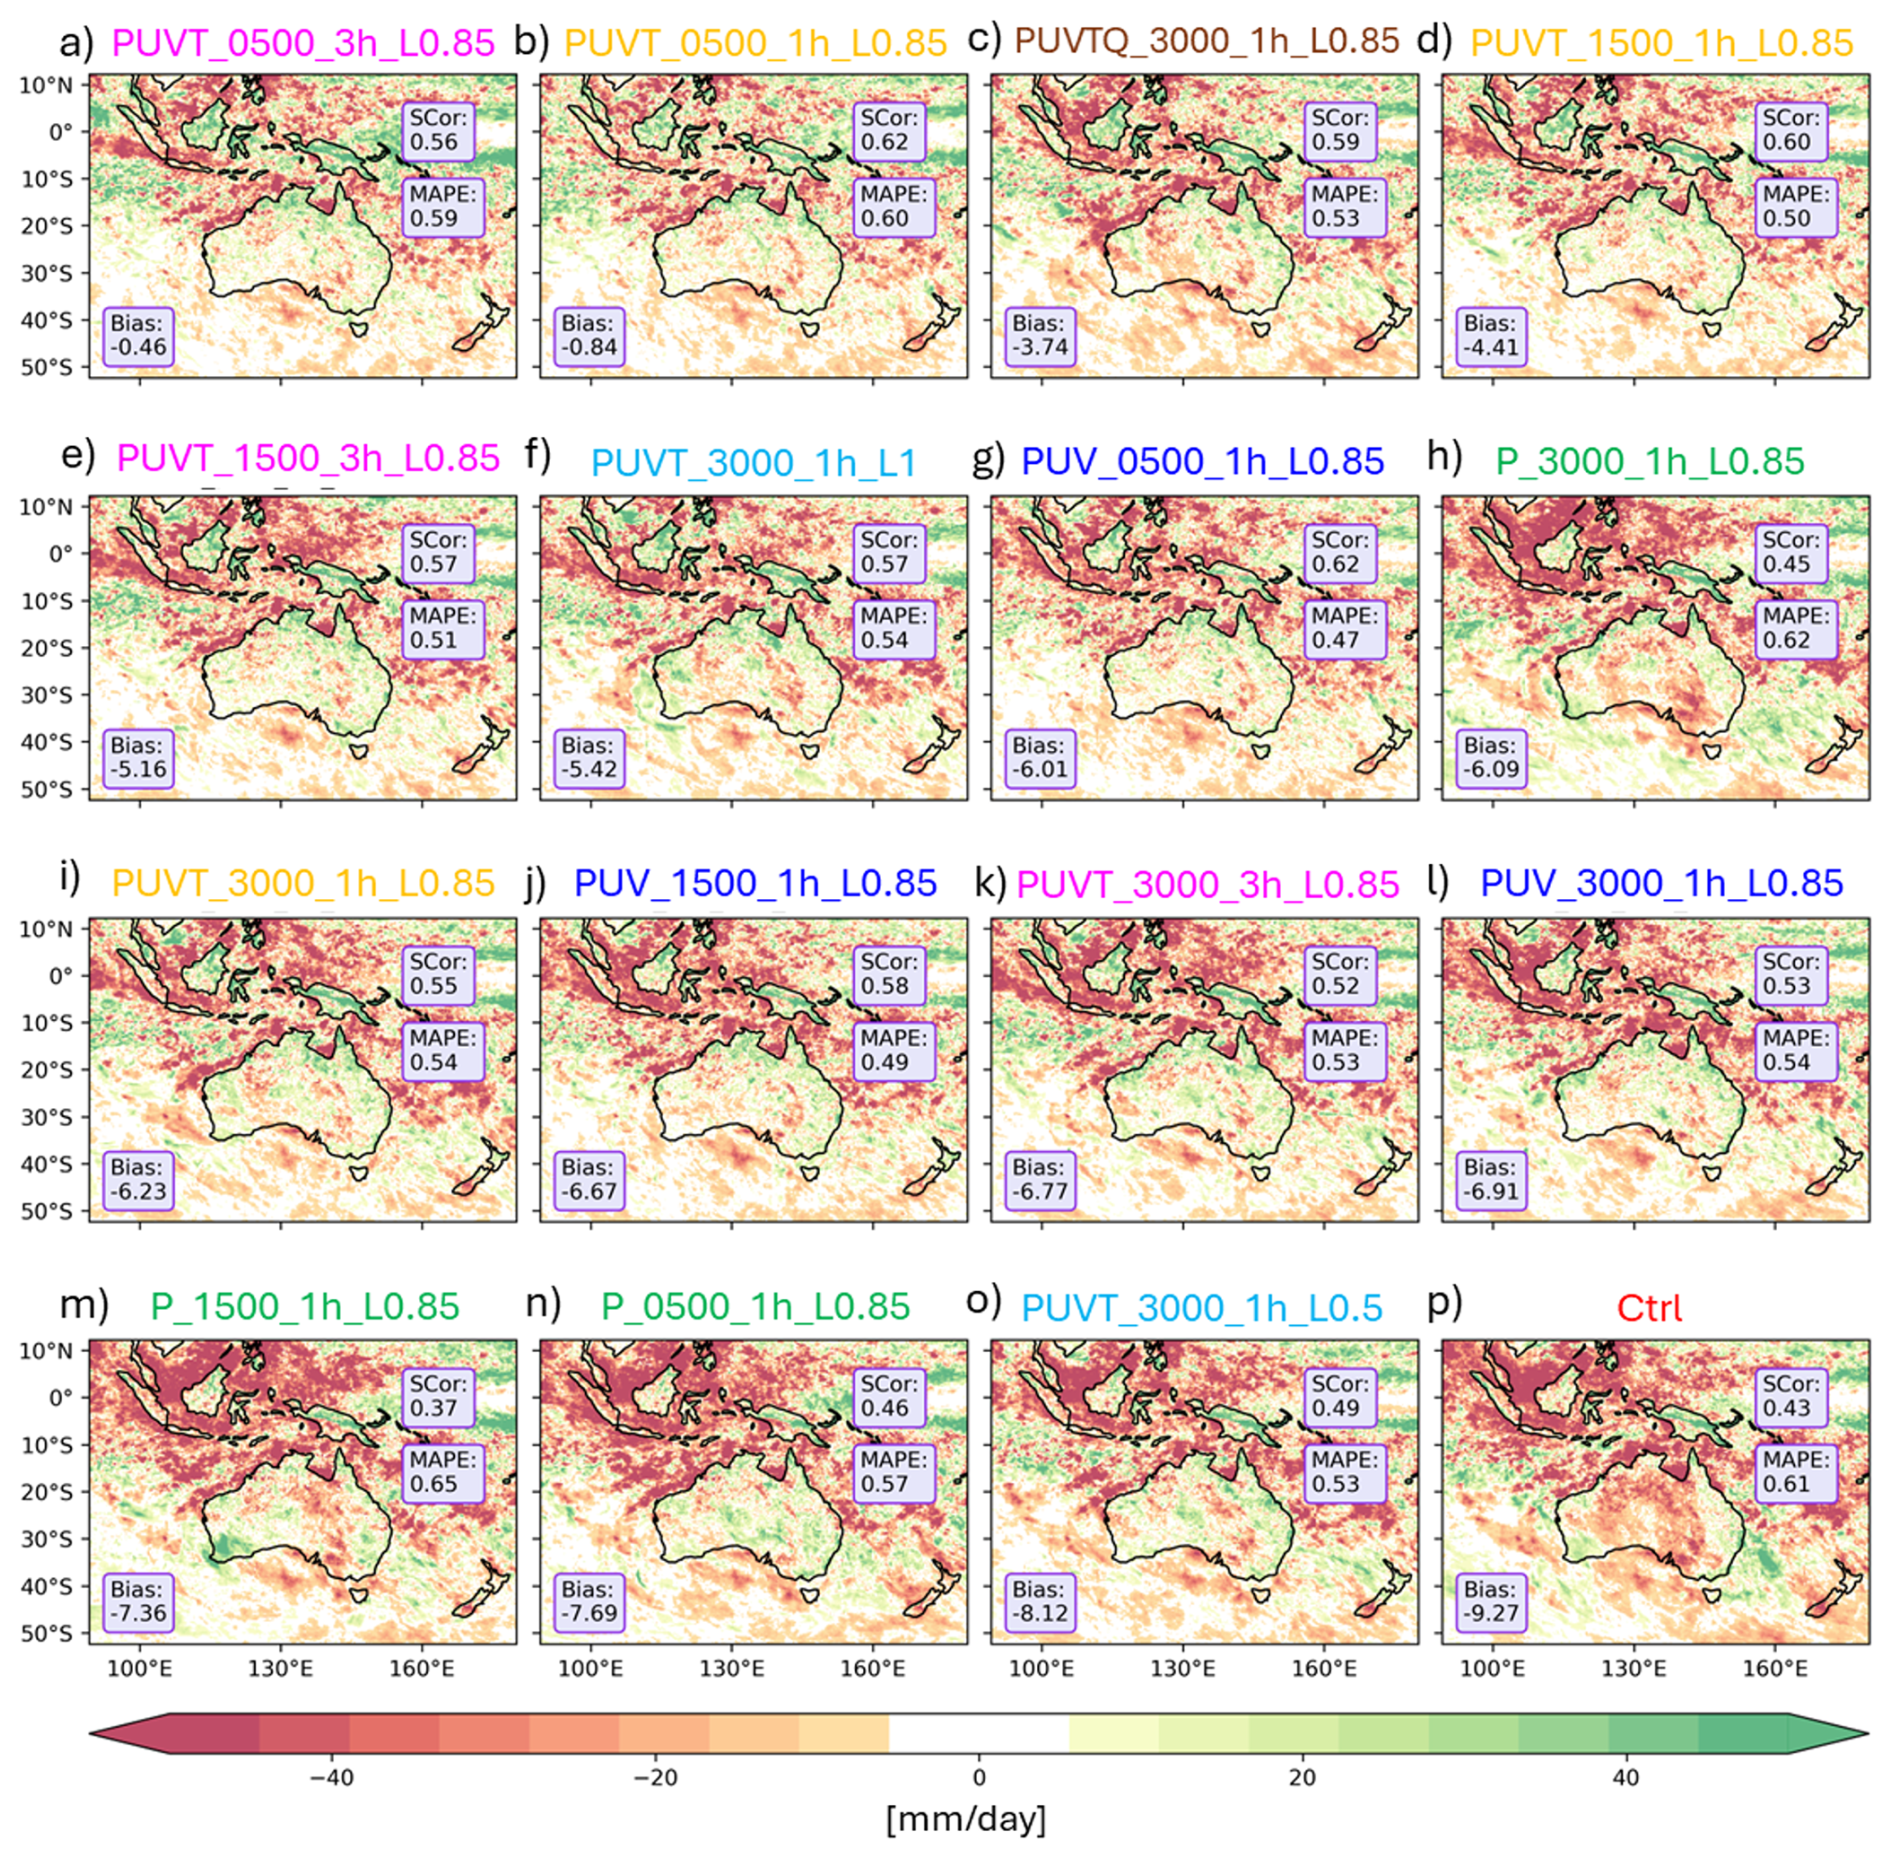
Figure 10Bias of monthly maximum 1 d precipitation (Rx1day; mm d−1) from December 2010 to March 2011 relative to IMERG. Each panel shows one CCAM spectral nudging simulation (see labels), with shading indicating spatial bias across the CORDEX–Australasia domain. Statistics included in each panel are the spatial correlation (SCor), mean absolute percentage error (MAPE), and domain-averaged bias. Panels (a–p) are ordered from the wettest to driest model configurations.
Figure 10 presents panels a to p arranged from the wettest to the driest simulations, where negative values (red) indicate dry biases (underestimation), and positive values (green) denote wet biases (overestimation) of extreme rainfall. The results reveal substantial variations in simulation performance. The Ctrl and P_var consistently fail to capture extreme rainfall, with Scor values ≤ 0.46, MAPEs ≥ 0.57, and significant underestimations (−7 to −9 mm d−1). PUV and PUVT group at longer wavelength (e.g., 3000 km), demonstrate reasonable skill but still suffer from large dry biases (> −6 mm d−1). In contrast, configurations at shorter wavelengths (e.g., PUVT_0500_1h_L0.85 with Scor = 0.62, MAPE = 0.60, Bias ) perform better, minimizing the dry bias over the sea of MC. However, they overestimate precipitation over land regions such as Borneo, Papua New Guinea, and northern Australia.
The overestimation over northern Australia is plausible, as IMERG tends to be drier than AGCD over the Australian continent (Alexander et al., 2025, Figs. 6 and S25). In contrast, the land regions of the MC require further validation against reliable in situ observations. Overall, these rankings reinforce that short-wavelength (500–1500 km), low-level nudging of pressure, winds and temperature provides the most reliable representation of extremes.
This study evaluated the sensitivity of Conformal Cubic Atmospheric Model (CCAM) regional climate simulations to different spectral nudging (SN) configurations during the extreme 2010–2011 La Niña event. Building on the work of Thatcher and McGregor (2008), who introduced the concept of scale-selective filtering for spectral nudging in CCAM, the assessment aimed to examine the model's ability to reproduce large-scale circulation and regional precipitation patterns, quantify the impact of nudging settings on mean and extreme rainfall, and identify reasonable configurations to enhance simulation during the extreme event.
Our evaluation demonstrates that spectral nudging has a decisive influence on the model's ability to reproduce both mean and extreme precipitation across Australasia. However, the effectiveness of nudging varies depending on the set of variables used, the selected wavelength, and the nudging update frequency. We found that shorter wavelength, high-frequency nudging of pressure, winds, and temperature, provides the best balance between maintaining large-scale fidelity and allowing for regional variability. This configuration consistently minimized rainfall biases (Figs. 2–4) and best captured the timing and intensity of major extreme precipitation events, such as severe tropical cyclone Cat 5–Carlos over Darwin and Yasi over Queensland, while also reproducing the MJO phase (Fig. 5). It further reproduced realistic moisture convergence into northern Australia, wind flow consistent with the monsoon and MJO-related precipitation peak locations (Fig. 6). Additionally, it aligned well with ERA5 vertical structures (Fig. 7) and produced accurate quantile distributions of extreme rainfall (Figs. 8–9). This result is consistent with previous studies (e.g., Thatcher and McGregor, 2008; Tang et al., 2017; Spero et al., 2018), which have highlighted the effectiveness of scale-selective nudging in constraining large-scale circulation while preserving mesoscale variability and extreme events.
The wavelength of the nudging plays a crucial role in determining model performance. By selecting a cut-off wavelength around 500–1500 km, we effectively nudged the synoptic scale of the model solution while still allowing for the development of finer-scale features. This range aligns with the findings of Gómez and Miguez-Macho (2017), who identified 1000 km as an optimal wavelength for nudging in their study. Additionally, the update frequency of 1 h for nudging aligns with previous studies (Liu et al., 2012; Otte et al., 2012), ensuring a high degree of consistency between the nudged model and the large-scale atmospheric fields. The vertical level at which nudging is applied also influences model skill. In this study, the best performance was achieved with nudging applied above 850 hPa, consistent with findings by Wang and Kotamarthi (2013) and von Storch et al. (2000). We found that adding moisture nudging degrades the model's representation of mean and extreme precipitation, consistent with previous studies that caution against its use due to potential thermodynamic inconsistencies (Heikkila et al., 2010; Liu et al., 2012) and/or potential biases in ERA5 moisture fields (Virman et al., 2021; Truong et al., 2022). Configurations with longer wavelengths (e.g., 3000 km) or infrequent nudging updates (e.g., 3 h) led to smoother rainfall fields, weaker extremes, and misaligned convergence zones (Figs. 3–6). This sensitivity mirrors previous studies that show overly strong or infrequent nudging degrades model performance by weakening large-scale forcing and impacting regional variability (Alexandru et al., 2009; Omrani et al., 2015). In summary, our study shows that applying spectral nudging on large-scale fields above the planetary boundary layer significantly improves the simulation of mean and extremes in CCAM over Australasia. The best-performing configurations, with moderate nudging wavelengths (∼ 500–1500 km), short relaxation times (∼ 1 h), and nudging of pressure, winds, and temperature (e.g., PUVT_0500_1h_L0.85 and PUVT_ 1500_ 1h_L0.85), provide the most accurate results during the study period. However, despite improvements, the model's physical parameterisation (e.g., cloud microphysics, convection schemes) would benefit from further improvements. Further advancements in precipitation simulations and extreme events will require ongoing refinement of these parameterizations, particularly for convection schemes and cloud microphysics, especially when running higher-resolution simulations (e.g., 4 km).
While spectral nudging significantly improves the simulation of large-scale circulation, the accurate representation of smaller-scale features such as extreme precipitation depends on the quality of the model's physical parameterisation. Our results indicate that the best configurations for capturing extreme events may still be limited by unresolved regional processes, particularly over the tropics, mountainous regions of Papua New Guinea and coastal areas over the northern Australia such as the Gulf of Carpentaria, where the model continues to underestimate extreme precipitation at the 99th percentile. This limitation is likely due to missing or inadequately represented regional physical processes that influence precipitation in complex environments. It is important to note, however, that both observational and reanalysis products exhibit similar deficiencies, adding uncertainty to our model performance evaluation. The 12 km resolution used in this study, while suitable for capturing mesoscale processes, may still miss finer-scale features like localized convection that substantially affect extreme rainfall. Higher resolutions (e.g., 4 km) could provide a more accurate representation of these processes. Additionally, the 4-month simulation period during the 2010–2011 La Niña event offers valuable insights, but the results are limited to this extreme event. The model's performance over different climate periods, particularly drier or less extreme seasons, may differ, suggesting that future research should include multi-year simulations, computational resources permitting, to assess variability and robustness across various climate conditions. The impact of GCM and reanalysis biases, which can propagate into the RCM simulation (Liu et al., 2024; Liang et al., 2008), remains another area for future research. Integrating bias correction techniques or multi-model ensembles could enhance the fidelity of RCM projections. This study contributes to the growing body of work on spectral nudging and its potential for enhancing regional climate simulations, particularly for applications in climate risk assessment and adaptation planning.
The CCAM model code used in this study, including the main CCAM code (version CCAM-2504), post-processing scripts, and running scripts, is archived at Zenodo: https://doi.org/10.5281/zenodo.19018138 (Truong, 2026a). The observational and reanalysis datasets used in this study (ERA5, GPCP, CMORPH, and IMERG precipitation data) is archived at Zenodo: https://doi.org/10.5281/zenodo.19077484 (Truong, 2026b). Original datasets remain available from their providers: ERA5 (Hersbach et al., 2023): https://doi.org/10.24381/cds.bd0915c6; GPCP (Huffman et al., 2022): https://doi.org/10.5067/MEASURES/GPCP/DATA305; CMORPH (Xie et al., 2019): https://doi.org/10.25921/w9va-q159; IMERG (Huffman et al., 2019): https://doi.org/10.5067/GPM/IMERGDF/DAY/06.
All figures presented in this manuscript were generated using Python scripts, which are publicly available at https://doi.org/10.5281/zenodo.18423589 (Truong, 2026c). All references of the datasets are listed in the in-text data citation references.
The supplement related to this article is available online at https://doi.org/10.5194/gmd-19-6991-2026-supplement.
ST designed the study, carried out the analysis, and wrote the initial manuscript draft. MJT, PLN, LVA, and JLM provided supervision and contributed to manuscript review and revisions.
The contact author has declared that none of the authors has any competing interests.
Publisher's note: Copernicus Publications remains neutral with regard to jurisdictional claims made in the text, published maps, institutional affiliations, or any other geographical representation in this paper. The authors bear the ultimate responsibility for providing appropriate place names. Views expressed in the text are those of the authors and do not necessarily reflect the views of the publisher.
We would also like to thank the CSIRO HPC (Petrichor) for the computational resources.
This work is supported by the Australian Climate Service. PLN and LVA are supported by Australian Research Council (ARC) under grant no. FT210100459. LVA is also supported by ARC grant no. CE230100012.
This paper was edited by Axel Lauer and reviewed by Ralph Trancoso and two anonymous referees.
Alexander, L. V., Bador, M., Roca, R., Contractor, S., Donat, M. G., and Nguyen, P. L.: Intercomparison of annual precipitation indices and extremes over global land areas from in situ, space-based and reanalysis products, Environ. Res. Lett., 15, 055002, https://doi.org/10.1088/1748-9326/ab79e2, 2020.
Alexander, L. V., Nguyen, P. L., Donat, M. G., Dunn, R. J. H., Tett, S., Zhang, X., Alves, L. M., Bador, M., Deng, X., Gibson, P. B., King, A., Lennard, C., Min, S., Roca, R., and Trewin, B.: Less Intense Daily Precipitation Maxima in Regional Compared to Global Gridded Products, J. Climate, 38, 7669–7693, https://doi.org/10.1175/JCLI-D-25-0222.1, 2025.
Alexandru, A., de Elía, R., Laprise, R., Separovic, L., and Biner, S.: Sensitivity study of regional climate model simulations to large-scale nudging parameters, Mon. Weather Rev., 137, 1666–1686, https://doi.org/10.1175/2008MWR2620.1, 2009.
BoM: Record-breaking La Niña events: An analysis of the La Niña life cycle and the impacts and significance of the 2010–11 and 2011–12 La Niña events in Australia, Bureau of Meteorology, Commonwealth of Australia, https://www.bom.gov.au/climate/enso/history/La-Nina-2010-12.pdf (last access: 27 July 2026), 2012
Bullock Jr., O. R., Foroutan, H., Gilliam, R. C., and Herwehe, J. A.: Adding four-dimensional data assimilation by analysis nudging to the Model for Prediction Across Scales – Atmosphere (version 4.0), Geosci. Model Dev., 11, 2897–2922, https://doi.org/10.5194/gmd-11-2897-2018, 2018.
Cai, W. and van Rensch, P.: The 2011 southeast Queensland extreme summer rainfall: A confirmation of a shift in the interdecadal Pacific oscillation?, Geophys. Res. Lett., 39, L08702, https://doi.org/10.1029/2011GL050820, 2012.
Cha, D. H., Jin, C. S., Lee, D. K., and Kuo, Y. H.: Impact of intermittent spectral nudging on regional climate simulation using WRF, J. Geophys. Res.-Atmos., 116, D10103, https://doi.org/10.1029/2010JD015069, 2011.
Chapman, S., Syktus, J., Trancoso, R., Thatcher, M., Toombs, N., Wong, K. K.-H., and Takbash, A.: Evaluation of dynamically downscaled CMIP6-CCAM models over Australia, Earth's Future, 11, e2023EF003548, https://doi.org/10.1029/2023EF003548, 2023.
Chapman, S., Syktus, J., Trancoso, R., Toombs, N., and Eccles, R.: Projected changes in mean climate and extremes from downscaled high-resolution CMIP6 simulations in Australia, Weather Clim. Extremes, 46, 100733, https://doi.org/10.1016/j.wace.2024.100733, 2024.
Choi, S. J. and Lee, D. K.: Impact of spectral nudging on the downscaling of tropical cyclones in regional climate simulations, Adv. Atmos. Sci., 33, 730–742, https://doi.org/10.1007/s00376-016-5061-y, 2015.
Chouinard, C., Béland, M., and McFarlane, N.: A Simple Gravity Wave Drag Parametrization for Use in Medium-Range Weather Forecast Models, Atmos.-Ocean, 24, 91–110, https://doi.org/10.1080/07055900.1986.9649242, 1986.
Evans, J. P., Boyer-Souchet, I., and Olson, R.: Local sea surface temperatures add to extreme precipitation in northeast Australia during La Niña, Geophys. Res. Lett., 39, L10803, https://doi.org/10.1029/2012GL052014, 2012.
Feser, F. and Barcikowska, M.: The influence of spectral nudging on typhoon formation in regional climate models, Environ. Res. Lett., 7, 014024, https://doi.org/10.1088/1748-9326/7/1/014024, 2012.
Freidenreich, S. M. and Ramaswamy, V.: A New Multiple-Band Solar Radiative Parameterization for General Circulation Models, J. Geophys. Res.-Atmos., 104, 31389–31409, https://doi.org/10.1029/1999JD900456,1999.
Gibson, P. B., Stuart, S., Sood, A., Stone, D., Rampal, N., Lewis, H., Broadbent, A., Thatcher, M., and Morgenstern, O.: Dynamical downscaling CMIP6 models over New Zealand: added value of climatology and extremes, Clim. Dyn., 62, 8255–8281, https://doi.org/10.1007/s00382-024-07337-5, 2024.
Gibson, P. B., Lewis, H., Campbell, I., Rampal, N., Fauchereau, N., and Harrington, L. J.: Downscaled climate projections of tropical and ex-tropical cyclones over the southwest Pacific, J. Geophys. Res.-Atmos., 130, e2025JD043833, https://doi.org/10.1029/2025JD043833, 2025.
Giles, B. D.: The Australian Summer 2010/2011, Weather, 67, 9–12, https://doi.org/10.1002/wea.860, 2012.
Giorgi, F.: Thirty years of regional climate modeling: Where are we and where are we going next?, J. Geophys. Res.-Atmos., 124, 5696–5723, https://doi.org/10.1029/2018JD030094, 2019.
Giorgi, F. and Mearns, L. O.: Introduction to special section: Regional climate modeling revisited, J. Geophys. Res.-Atmos., 104, 6335–6352, https://doi.org/10.1029/98JD02072, 1999.
Gómez, B. and Miguez-Macho, G.: The impact of wave number selection and spin-up time in spectral nudging, Q. J. Roy. Meteor. Soc., 143, 1772–1786, https://doi.org/10.1002/qj.3032, 2017.
Heikkila, U., Sandvik, A., and Sorteberg, A.: Dynamical downscaling of ERA-40 in complex terrain using the WRF regional climate model, Clim. Dyn., 37, 1551–1564, https://doi.org/10.1007/s00382-010-0928-6, 2010.
Hersbach, H., Bell, B., Berrisford, P., Hirahara, S., Horányi, A., Muñoz-Sabater, J., Nicolas, J., Peubey, C., Radu, R., Schepers, D., Simmons, A., Soci, C., Abdalla, S., Abellan, X., Balsamo, G., Bechtold, P., Biavati, G., Bidlot, J., Bonavita, M., De Chiara, G., Dahlgren, P., Dee, D., Diamantakis, M., Dragani, R., Flemming, J., Forbes, R., Fuentes, M., Geer, A., Haimberger, L., Healy, S., Hogan, R. J., Hólm, E., Janisková, M., Keeley, S., Laloyaux, P., Lopez, P., Lupu, C., Radnoti, G., de Rosnay, P., Rozum, I., Vamborg, F., Villaume, S., and Thépaut, J.-N.: The ERA5 global reanalysis, Q. J. Roy. Meteor. Soc., 146, 1999–2049, https://doi.org/10.1002/qj.3803, 2020.
Hersbach, H., Bell, B., Berrisford, P., Biavati, G., Horányi, A., Muñoz-Sabater, J., Nicolas, J., Peubey, C., Radu, R., Rozum, I., Schepers, D., Simmons, A., Soci, C., Dee, D., and Thépaut, J.-N.: ERA5 hourly data on pressure levels from 1940 to present, Copernicus Climate Change Service (C3S) Climate Data Store (CDS) [data set], https://doi.org/10.24381/cds.bd0915c6, 2023.
Hoffmann, P., Katzfey, J. J., McGregor, J. L., and Thatcher, M.: Bias and variance correction of sea surface temperatures used for dynamical downscaling, J. Geophys. Res.-Atmos., 121, 12877–12890, https://doi.org/10.1002/2016JD025383, 2016.
Hong, S. Y. and Chang, E. C.: Spectral nudging sensitivity simulations in a regional climate model, Asia-Pac. J. Atmos. Sci., 48, 345–355, https://doi.org/10.1007/s13143-012-0033-3, 2012.
Howard, E., Su, C.-H., Stassen, C., Naha, R., Ye, H., Pepler, A., Bell, S. S., Dowdy, A. J., Tucker, S. O., and Franklin, C.: Performance and process-based evaluation of the BARPA-R Australasian regional climate model version 1, Geosci. Model Dev., 17, 731–757, https://doi.org/10.5194/gmd-17-731-2024, 2024.
Huang, Z., Zhong, L., Ma, Y., and Fu, Y.: Development and evaluation of spectral nudging strategy for the simulation of summer precipitation over the Tibetan Plateau using WRF (v4.0), Geosci. Model Dev., 14, 2827–2841, https://doi.org/10.5194/gmd-14-2827-2021, 2021.
Huffman, G. J., Stocker, E. F., Bolvin, D. T., Nelkin, E. J., and Tan, J.: GPM IMERG Final Precipitation L3 1 day 0.1 degree × 0.1 degree V06, in: Goddard Earth Sciences Data and Information Services Center (GES DISC), edited by: Savtchenko, A. and Greenbelt, M. D., https://doi.org/10.5067/GPM/IMERGDF/DAY/06, 2019.
Huffman, G. J., Behrangi, A., Bolving, D. T., and Nelkin, E. J.: GPCP Version 3.2 Daily Precipitation Data Set, edited by: Huffman, G. J., Behrangi, A. Bolvin, D. T., and Nelkin, E. J., Greenbelt, Maryland, USA, Goddard Earth Sciences Data and Information Services Center (GES DISC) [data set], https://doi.org/10.5067/MEASURES/GPCP/DATA305, 2022.
Huffman, G. J., Adler, R. F., Behrangi, A., Bolvin, D. T., Nelkin, E. J., Gu, G., and Ehsani, M. R.: The New Version 3.2 Global Precipitation Climatology Project (GPCP) Monthly and Daily Precipitation Products, J. Climate, 36, 7635–7655, https://doi.org/10.1175/JCLI-D-23-0123.1, 2023.
Hurley, P.: Modelling Mean and Turbulence Fields in the Dry Convective Boundary Layer With the Eddy-Diffusivity/Mass-Flux Approach, Bound.-Layer Meteorol., 125, 525–536, https://doi.org/10.1007/s10546-007-9203-8, 2007.
Imran, H. M. and Evans, J. P.: Observational uncertainty in the added value of regional climate modelling over Australia, Clim. Dyn., 63, 73, https://doi.org/10.1007/s00382-024-07562-y, 2025.
IPCC: Climate Change 2021: The Physical Science Basis. Contribution of Working Group I to the Sixth Assessment Report of the Intergovernmental Panel on Climate Change, Cambridge University Press, Cambridge, United Kingdom, and New York, NY, USA, https://doi.org/10.1017/9781009157896, 2021.
Isphording, R. N., Alexander, L. V., Bador, M., Green, D., Evans, J. P., and Wales, S.: A standardized benchmarking framework to assess downscaled precipitation simulations, J. Climate, 37, 1089–1110, https://doi.org/10.1175/JCLI-D-23-0317.1, 2024.
Jin, C. S., Cha, D. H., Lee, D. K., Suh, M. S., Hong, S. Y., Kang, H. S., and Ho, C. H.: Evaluation of climatological tropical cyclone activity over the western North Pacific in the CORDEX-East Asia multi-RCM simulations, Clim. Dyn., 47, 765–778, https://doi.org/10.1007/s00382-015-2869-6, 2016.
Jones, D. A., Wang, W., and Fawcett, R.: High-quality spatial climate datasets for Australia, Aust. Meteor. Oceanogr. J., 58, 233–248, https://doi.org/10.22499/2.5804.003, 2009.
Joyce, R. J., Janowiak, J. E., Arkin, P. A., and Xie, P.: CMORPH: A method that produces global precipitation estimates from passive microwave and infrared data at high spatial and temporal resolution, J. Hydrometeor., 5, 487–503, https://doi.org/10.1175/1525-7541(2004)005<0487:CAMTPG>2.0.CO;2, 2004.
Kanamitsu, M. and Kanamaru, H.: Fifty-seven-Year California reanalysis downscaling at 10 km (CaRD10), Part I: System detail and validation with observations, J. Climate, 20, 5553–5571, https://doi.org/10.1175/2007JCLI1482.1, 2007.
Karoly, D. J. and Boulter, S.: Afterword: Floods, storms, fires and pestilence – disaster risk in Australia during 2010–2011, in: Natural Disasters and Adaptation to Climate Change, edited by: Boulter, S., Palutikof, J., Karoly, D. J., and Guitart, D., Cambridge University Press, Cambridge, 252–261, https://doi.org/10.1017/CBO9780511845710.031, 2013.
Kowalczyk, E. A., Wang, Y. P., and Law, R. M.: The CSIRO Atmospheric Biosphere Land Exchnage (CABLE) model for use in climate models and as an offline model, CSIRO Marine and Atmospheric Research Paper no. 13, http://www.cmar.csiro.au/e-print/open/kowalczykea_2006a.pdf (last access: 27 July 2026), 2006.
Lai, W. and Gan, J.: On spectral nudging and dynamics to improve representation of marine cloud and precipitation over the China Sea in summer, Theor. Appl. Climatol., 156, 444, https://doi.org/10.1007/s00704-025-05689-4, 2025.
Liang, X.-Z., Kunkel, K. E., Meehl, G. A., Jones, R. G., and Wang, J. X. L.: Regional climate models downscaling analysis of general circulation models present climate biases propagation into future change projections, Geophys. Res. Lett., 35, L08709, https://doi.org/10.1029/2007GL032849, 2008.
Lisonbee, J. and Ribbe, J.: Seasonal climate influences on the timing of the Australian monsoon onset, Weather Clim. Dynam., 2, 489–506, https://doi.org/10.5194/wcd-2-489-2021, 2021.
Liu, P., Tsimpidi, A. P., Hu, Y., Stone, B., Russell, A. G., and Nenes, A.: Differences between downscaling with spectral and grid nudging using WRF, Atmos. Chem. Phys., 12, 3601–3610, https://doi.org/10.5194/acp-12-3601-2012, 2012.
Liu, S., Zeman, C., and Schär, C.: Dynamical downscaling of climate simulations in the tropics, Geophys. Res. Lett., 51, e2023GL105733, https://doi.org/10.1029/2023GL105733, 2024.
Liu, Y. L., Alexander, L. V., Evans, J. P., and Thatcher, M.: Sensitivity of Australian rainfall to driving SST datasets in a variable-resolution global atmospheric model, J. Geophys. Res.-Atmos., 129, e2024JD040954, https://doi.org/10.1029/2024JD040954, 2024.
Ma, S., Trancoso, R., Syktus, J., Chapman, S., and Eccles, R.: Evaluating ERA5 downscaled simulations using CCAM: Large-scale circulation processes and teleconnections, J. Geophys. Res.-Atmos., 130, e2025JD043566, https://doi.org/10.1029/2025JD043566, 2025.
Mai, X., Qiu, X., Yang, Y., and Ma, Y.: Impacts of spectral nudging parameters on dynamical downscaling in summer over Mainland China, Front. Earth Sci., 8, https://doi.org/10.3389/feart.2020.574754, 2020.
McGregor, J. L.: A New Convection Scheme Using a Simple Closure, BMRC Research Report 93, Bureau of Meteorology Research Centre, Melbourne, 33–36, https://research.csiro.au/ccam/wp-content/uploads/sites/520/2024/01/1377337417.pdf (last access: 27 July 2026), 2003.
McGregor, J. L. and Dix, M. R.: An Updated Description of the Conformal-Cubic Atmospheric Model, in: High Resolution Numerical Modelling of the Atmosphere and Ocean, edited by: Hamilton, K. and Ohfuchi, W., Springer, https://doi.org/10.1007/978-0-387-49791-4_4, 2008.
Menut, L., Bessagnet, B., Cholakian, A., Siour, G., Mailler, S., and Pennel, R.: What is the relative impact of nudging and online coupling on meteorological variables, pollutant concentrations and aerosol optical properties?, Geosci. Model Dev., 17, 3645–3665, https://doi.org/10.5194/gmd-17-3645-2024, 2024.
Miguez-Macho, G., Stenchikov, G. L., and Robock, A.: Spectral nudging to eliminate the effects of domain position and geometry in regional climate model simulations, J. Geophys. Res., 109, D13104, https://doi.org/10.1029/2003JD004495, 2004.
Narsey, S., Grose, M., Delage, F., Tolhurst, G., Chung, C., Takbash, A., Boschat, G., King, M., Pepler, A., Thatcher, M., Ng, B., Truong, S., Su, C., Howard, E., Stassen, C., Black, M., Jones, D., Matear, R., Chapman, S., Syktus, J., Trancoso, R., Di Virgilio, G., Goyal, R., Kala, J., Round, V., and Evans, J. P.: Disentangling the uncertainties in regional projections for Australia, J. South. Hemisph. Earth Syst. Sci., 75, ES25015, https://doi.org/10.1071/ES25015, 2025.
Nguyen, P.-L., Bador, M., Alexander, L. V., Lane, T. P., and Funk, C. C.: On the Robustness of Annual Daily Precipitation Maxima Estimates Over Monsoon Asia, Front. Clim., 2, 578785, https://doi.org/10.3389/fclim.2020.578785, 2020.
Nguyen, P.-L., Bador, M., Alexander, L. V., Lane, T. P., and Ngo-Duc, T.: More intense daily precipitation in CORDEX-SEA regional climate models than their forcing global climate models over Southeast Asia, Int. J. Climatol., 42, 6537–6561, https://doi.org/10.1002/joc.7619, 2022.
Nguyen, P. L., Alexander, L. V., Thatcher, M. J., Truong, S. C. H., Isphording, R. N., and McGregor, J. L.: Selecting CMIP6 global climate models (GCMs) for Coordinated Regional Climate Downscaling Experiment (CORDEX) dynamical downscaling over Southeast Asia using a standardised benchmarking framework, Geosci. Model Dev., 17, 7285–7315, https://doi.org/10.5194/gmd-17-7285-2024, 2024.
Omrani, H., Drobinski, P., Dubos, T., and Turuncoglu, U.: Optimal nudging strategies in regional climate modeling: Investigation in a Big-Brother simulation over the Euro-Mediterranean region, Clim. Dyn., 44, 1559–1577, https://doi.org/10.1007/s00382-014-2453-5, 2015.
Otte, T. L., Nolte, C. G., Otte, M. J., and Bowden, J. H.: Does Nudging Squelch the Extremes in Regional Climate Modeling?, J. Climate, 25, 7046–7066, https://doi.org/10.1175/JCLI-D-12-00048.1, 2012.
Rotstayn, L. D.: A Physically Based Scheme for the Treatment of Stratiform Clouds and Precipitation in Large-Scale Models. I: Description and Evaluation of the Microphysical Processes, Q. J. Roy. Meteor. Soc., 123, 1227–1282, 1997.
Schroeter, B. J. E., Ng, B., Takbash, A., Rafter, T., and Thatcher, M.: A Comprehensive Evaluation of Mean and Extreme Climate for the Conformal Cubic Atmospheric Model (CCAM), J. Appl. Meteor. Climatol., 63, 997–1018, https://doi.org/10.1175/JAMC-D-24-0004.1, 2024.
Schwarzkopf, M. D. and Ramaswamy, V.: Radiative Effects of CH4, N2O, Halocarbons and the Foreign-Broadened H2O Continuum: A GCM Experiment, J. Geophys. Res.-Atmos., 104, 9467–9488, https://doi.org/10.1029/1999JD900003,1999.
Spero, T. L., Otte, M. J., Bowden, J. H., and Nolte, C. G.: Improving the representation of clouds, radiation, and precipitation using spectral nudging in the Weather Research and Forecasting model, J. Geophys. Res.-Atmos., 119, 11682–11694, https://doi.org/10.1002/2014JD022173, 2014.
Spero, T. L., Nolte, C. G., Bowden, J. H., and Mallard, M. S.: Sensitivity of WRF simulations to different spectral nudging techniques, J. Appl. Meteor. Climatol., 57, 1303–1320, https://doi.org/10.1175/JAMC-D-17-0360.1, 2018.
Su, C., Torrance, J., Rennie, S., Howard, E., Stassen, C., Warren, R., Smith, A., Dharssi, I., Pepler, A., Tian, S., Lipson, M., Steinle, P., Franklin, C., Le, T., Wang, C., Masoumi, S., and Le Marshall, J.: The Australian regional atmospheric reanalysis system, version 2 – BARRA2, J. South. Hemisph. Earth Syst. Sci., 75, ES25032, https://doi.org/10.1071/ES25032, 2025.
Tang, J., Wang, S., Niu, X., Hui, P., Zong, P., and Wang, X.: Impact of spectral nudging on regional climate simulation over CORDEX East Asia using WRF, Clim. Dyn., 48, 2339–2357, https://doi.org/10.1007/s00382-016-3208-2, 2017.
Thatcher, M. and Hurley, P.: Simulating Australian Urban Climate in a Mesoscale Atmospheric Numerical Model, Bound.-Layer Meteorol., 142, 149–175, https://doi.org/10.1007/s10546-011-9663-8, 2012.
Thatcher, M. and McGregor, J. L.: Using a scale-selective filter for dynamical downscaling with the conformal cubic atmospheric model, Mon. Weather Rev., 136, 4578–4596, https://doi.org/10.1175/2008MWR2599.1, 2008.
Truong, C. H. S.: Model code for “Spectral Nudging Impacts on Precipitation Downscaling in the Conformal Cubic Atmospheric Model, version CCAM-2504: Insights from Summer 2011”, Zenodo [code], https://doi.org/10.5281/zenodo.19018138, 2026a.
Truong, C. H. S.: Datasets for “Spectral Nudging Impacts on Precipitation Downscaling in the Conformal Cubic Atmospheric Model, version CCAM-2504: Insights from Summer 2011”, Zenodo [data set], https://doi.org/10.5281/zenodo.19077484, 2026b.
Truong, C. H. S.: Python code for “Spectral Nudging Impacts on Precipitation Downscaling in the Conformal Cubic Atmospheric Model, version CCAM-2504: Insights from Summer 2011”, Zenodo [code], https://doi.org/10.5281/zenodo.18423589, 2026c.
Truong, S. C. H. and Thatcher, M.: Evaluation of clouds in the conformal cubic atmospheric model using the CFMIP Observation Simulator Package, Int. J. Climatol., 45, e8846, https://doi.org/10.1002/joc.8846, 2025.
Truong, S. C. H., Huang, Y., Siems, S. T., Manton, M. J., and Lang, F.: Biases in the thermodynamic structure over the Southern Ocean in ERA5 and their radiative implications, Int. J. Climatol., 42, 7685–7702, https://doi.org/10.1002/joc.7672, 2022.
Truong, S. C. H., Ramsay, H. A., Rafter, T., and Thatcher, M. J.: Simulation of an intense tropical cyclone in the conformal cubic atmospheric model and its sensitivity to horizontal resolution, Weather Clim. Extremes, 47, 100744, https://doi.org/10.1016/j.wace.2025.100744, 2025.
Ummenhofer, C. C., Sen Gupta, A., England, M. H., Taschetto, A. S., Briggs, P. R., and Raupach, M. R.: How did ocean warming affect Australian rainfall extremes during the 2010–2011 La Niña event?, Geophys. Res. Lett., 42, 9942–9951, https://doi.org/10.1002/2015GL065948, 2015.
Virman, M., Bister, M., Räisänen, J., Sinclair, V. A., and Järvinen, H.: Radiosonde comparison of ERA5 and ERA-Interim reanalysis datasets over tropical oceans, Tellus A, 73, 1–7, https://doi.org/10.1080/16000870.2021.1929752, 2021.
von Storch, H., Langenberg, H., and Feser, F.: A spectral nudging technique for dynamical downscaling purposes, Mon. Weather Rev., 128, 3664–3673, https://doi.org/10.1175/1520-0493(2000)128<3664:ASNTFD>2.0.CO;2, 2000.
Wang, J. and Kotamarthi, V. R.: Assessment of dynamical downscaling in near-surface fields with different spectral nudging approaches using the nested regional climate model (NRCM), J. Appl. Meteor. Climatol., 52, 1576–1591, https://doi.org/10.1175/JAMC-D-12-0302.1, 2013.
Xie, P., Joyce, R., Wu, S., Yoo, S., Yarosh, Y., Sun, F., and Lin, R.: Reprocessed, Bias-Corrected CMORPH Global High-Resolution Precipitation Estimates from 1998, J. Hydrometeor., 18, 1617–1641, https://doi.org/10.1175/JHM-D-16-0168.1, 2017.
Xie, P., Joyce, R., Wu, S., Yoo, S., Yarosh, Y., Sun, F., and Lin, R.: NOAA Climate Data Record (CDR) of CPC Morphing Technique (CMORPH) High Resolution Global Precipitation Estimates, Version 1, NOAA National Centers for Environmental Information [data set], https://doi.org/10.25921/w9va-q159, 2019.
Yang, L., Wang, S., Tang, J., Niu, X., and Fu, C.: Impact of Nudging Parameters on Dynamical Downscaling over CORDEX East Asia Phase II Domain: The Case of Summer 2003, J. Appl. Meteor. Climatol., 58, 2755–2771, https://doi.org/10.1175/JAMC-D-19-0152.1, 2019.
Yatagai, A., Kamiguchi, K., Arakawa, O., Hamada, A., Yasutomi, N., and Kitoh, A.: APHRODITE: Constructing a Long-Term Daily Gridded Precipitation Dataset for Asia Based on a Dense Network of Rain Gauges, Bull. Am. Meteorol. Soc., 93, 1401–1415, https://doi.org/10.1175/BAMS-D-11-00122.1, 2012.
Zhang, H., Chapman, S., Trancoso, R., Toombs, N., and Syktus, J.: Assessing the impact of bias correction approaches on climate extremes and the climate change signal, Meteorol. Appl., 31, e2204, https://doi.org/10.1002/met.2204, 2024.