the Creative Commons Attribution 4.0 License.
the Creative Commons Attribution 4.0 License.
 | 02 Jul 2026
Implementing belowground controls on nutrient uptake in ELMv2-SPRUCE improves representation of a boreal peatland ecosystem
Daniel M. Ricciuto
Sören E. Weber
Verity G. Salmon
Xiaoying Shi
Xiaojuan Yang
Natalie A. Griffiths
Paul J. Hanson
Anthony P. Walker
Jonathan Stelling
Katherine Duchesneau
Camille E. Defrenne
Jeffrey M. Warren
Stephen D. Sebestyen
Kyle J. Pearson
Keith Oleheiser
Joshua M. Birkebak
Mark Guilliams
Misha B. Krassovski
Melanie A. Mayes
Peter E. Thornton
Boreal peatlands store 13 %–32 % of the global soil carbon (C) stock, a service dependent on plant-mycorrhizal fungi associations. In these nutrient poor systems, ectomycorrhizal and ericoid mycorrhizal fungi supply up to >80 % of the nutrient requirements of their plant hosts, partly with mined nitrogen (N) and phosphorus (P) from soil organic matter that are otherwise inaccessible to plants. Despite the ecological significance, mycorrhizal associations are only represented in a few land surface or ecosystem models. We modify the peatland branch of version 2 of the Energy Exascale Earth System Land Model (ELMv2-SPRUCE) to replace the default photosynthesis-driven inorganic N and P (NP) uptake process with a more realistic representation of the process via three pathways: (1) direct inorganic NP uptake by uncolonized fine roots, (2) indirect inorganic NP acquisition and (3) indirect NP acquisition from organic sources by mycorrhizal roots. We systematically evaluated the performance of the default and modified models with field observations from a whole ecosystem warming and carbon dioxide fertilization experimental site: Spruce and Peatland Responses Under Changing Environment (SPRUCE), in northern Minnesota, USA. The modified model reduces the underestimation of the growth response of shrubs in the default model to warming from 40 %–80 % to 17 %–35 % and reduces the overall relative absolute error on C fluxes from 1.61 to 1.54 in calibration. Improvements on modeled shrub growths and shrub-moss community net ecosystem exchanges are also seen in validation. The improved growth response of shrubs to warming is accompanied by several-fold increase in direct inorganic NP uptake and decrease in fungal colonization rate. The modified model simulates a smaller magnitude of transition of the ecosystem from C sink to C source under warming due to alleviation of plant nutrient limitation. Equifinality analysis shows the newly added parameters in the modified model can be constrained by the observed C fluxes. Sensitivity analysis shows the newly added parameters have stronger statistical interactions than the preexisting parameters in the default model. Overall, the modified model is an improvement over the default ELMv2-SPRUCE and will be a useful tool for understanding boreal peatland change.
- Article
(2341 KB) - Full-text XML
-
Supplement
(3694 KB) - BibTeX
- EndNote


This manuscript has been authored by UT-Battelle, LLC, under Contract No. DE-AC05-00OR22725 with the U.S. Department of Energy. The US Government retains and the publisher, by accepting the article for publication, acknowledges that the US Government retains a non-exclusive, paid-up, irrevocable, worldwide license to publish or reproduce the published form of this manuscript, or allow others to do so, for US Government purposes. The Department of Energy will provide public access to these results of federally sponsored research in accordance with the DOE Public Access Plan (http://energy.gov/downloads/doe-public-access-plan, last access: 14 November 2025).
Boreal peatlands store an estimated 234–546 Gt carbon (C), equal to 13 %–32 % of the global soil C stock (Friedlingstein et al., 2022; Loisel et al., 2017). The high C storage arises from slow decomposition rates driven by the cold, waterlogged, nutrient-limited, and acidic conditions of these ecosystems (Dise, 2009; Frolking et al., 2011; Salmon et al., 2021). Ongoing rapid warming in the northern high latitudes is expected to shift ecosystem C balance, but the magnitude of change remains highly uncertain due to poorly constrained temperature sensitivities of vegetation productivity and soil C decomposition (Ito et al., 2020). More accurate modeling of the mechanisms governing C cycling in boreal peatlands will improve our ability to project future changes in this ecosystem and its feedback to the Earth system.
Among the various biotic and abiotic mechanisms underlying boreal peatland C cycling, plant-mycorrhizal associations represent a key component owing to their central role in nutrient cycling (Shao et al., 2022, 2023b; Shi et al., 2015, 2021). Mycorrhizal fungi deliver nutrients to plants in exchange for carbon and have three broad classes: ectomycorrhizae (EcM), ericoid mycorrhizae (ErM), and arbuscular mycorrhizae (AM). Unlike AM, which are more common in low latitudes and only acquire inorganic nutrients, EcM and ErM can acquire nutrients from soil organic matter (SOM), making them suited to cold, nitrogen (N)-limited ecosystems with slow decomposition rates (Egerton-Warburton et al., 2013; Ward et al., 2022). One estimate suggests that EcM are associated with >75 % of the aboveground plant biomass in the non-permafrost boreal region and ∼ 50 % in the permafrost region; ErM, which selectively colonize ericaceous shrubs, are associated with ∼ 20 % aboveground plant biomass in the permafrost region (Soudzilovskaia et al., 2019). Plants associated with EcM transfer on average ∼ 13 % (0 %–50 % in range) of their net primary productivity (NPP) to fungal symbionts while plants associated with ErM transfer on average ∼ 3.5 % (0 %–14 % in range; Hawkins et al., 2023). The fraction of plant N supplied by EcM or ErM in return varies from <30 % to >80 %, depending on site and plant species, though less is known about the fraction of EcM- or ErM-supplied phosphorus (P; Hilman et al., 2024; Hobbie and Hobbie, 2006; Yin et al., 2022). Beyond nutrient supply, mycorrhizal fungi regulate SOM turnover by competing with free-living saprotrophs, transporting C away from the rhizosphere, and promoting soil aggregate formation and stabilization (Fernandez and Kennedy, 2016; Hawkins et al., 2023; Smith and Wan, 2019).
To date, only a limited number of land surface models – here defined as the land component of Earth system models – simulate mycorrhizal associations (Warren et al., 2015). They generally focus on AM and EcM associations and use the return-on-investment principle, where “return” refers to gains in growth or nutrient uptake, and “investment” refers to the C costs of acquiring nutrient through different pathways (Brzostek et al., 2014). For example, the Community Land Model (CLM) and Energy Exascale Earth System Land Model (ELM) have been linked with the Fixation and Uptake of Nitrogen (FUN) model (Braghiere et al., 2022; Brzostek et al., 2014; Shi et al., 2016). Plants minimize their C expenditure on N and P (NP) uptake by optimally allocating C to satisfy their NP demands among biological fixation, retranslocation, nonmycorrhizal passive and active uptake, EcM uptake, and AM uptake, each of which has a unique C cost function (Braghiere et al., 2022; Brzostek et al., 2014; Shi et al., 2016). Simulations of ELM-FUN suggest that the EcM and AM pathways together supply ∼ 75 % of plant N and ∼ 41 % of plant P globally, and account for ∼ 50 % of the NP uptake-related C costs, but neither ELM-FUN or CLM-FUN consider organic nutrient mining (Braghiere et al., 2022; Shi et al., 2016). The Symbiotic Nitrogen Acquisition by Plants (SNAP) model, which is linked to the Geophysical Fluid Dynamics Laboratory land model LM3 (GFDL-LM3), improves FUN by dynamically simulating fungal biomass, fungal organic nutrient mining, and the resulting C cost to the plants (Sulman et al., 2019). Simulations of GFDL-LM3-SNAP show that EcM-mining of organic N explains the stronger positive response to carbon dioxide (CO2) fertilization in EcM-dominated ecosystems than AM-dominated ecosystems (Sulman et al., 2019). Also, allowing plants to shift in N uptake pathways results in four times the terrestrial C sequestration relative to fixed N uptake pathways under a 100 ppm increase in atmospheric CO2 concentration (Sulman et al., 2019).
Terrestrial ecosystem models not coupled to Earth system models have represented mycorrhizal associations in more detail than the return-on-investment models described above. For example, the McGill Wetland Model (MWM) focuses on interactions among moss, ericaceous shrub, and ErM in peatland ecosystems and shows that the shrub-ErM association explain the increased shrub growth and decreased moss growth in a NP fertilization experiment (Shao et al., 2022, 2023b). The MWM explicitly models microbial and ErM biomass dynamics and ErM mining of organic nutrients. The MWM models the shrub-ErM interactions as “excess fluxes” in which (1) shrub transfers C to ErM when shrub C reserve exceeds a set fraction of its total stem and root C, (2) ErM fungi transfers NP to the shrub when the NP contents of the ErM exceed predefined fractions of the C content of the ErM (Shao et al., 2023b). Compared to return-on-investment, the excess flux mechanism may better describe EcM and ErM exchanges with the host plant, because the reciprocity of EcM and ErM are more strongly affected by environmental, developmental, and physiological factors than AM (Bunn et al., 2024; Garcia et al., 2015). The drawback is a large number of parameters. The CoupModel has been used to compare three representations of nutrient limitation: fixed limitation, implicit EcM, and explicit EcM across a climate and N-deposition gradient of EcM-dominated boreal forests (He et al., 2018). In the fixed limitation approach, plant growth is scaled down by a constant nutrient limitation factor throughout the year. The implicit approach omits the EcM intermediary, simulating plant acquisition of NP from organic sources as a function of soil organic nutrient content, plant demand, and optionally root distributions (He et al., 2018, 2021; Svensson et al., 2008). The explicit approach simulates EcM biomass dynamics and organic nutrient mining, with plant transfer of C to EcM determined by belowground allocation, and EcM transfer of NP to plant co-determined by plant demand and excess flux (He et al., 2018, 2021). The implicit and explicit approaches outperform the fixed N limitation approach, and both indicate declining plant dependence on organic N from the more N-limited northern Sweden to the less N-limited southern Sweden; yet the explicit parameterization is more difficult to constrain, and the implicit and explicit approaches differ in the simulated litter production, soil respiration, and the magnitude of the north-south trend (He et al., 2018).
The above reviewed modeling studies demonstrate that mycorrhizal associations are needed for more accurate simulation of nutrient limitation on productivity and the resulting feedback to Earth system and land surface models can benefit from testing alternative model structures than return-on-investment schemes and understanding the parameterization difficulty. We address this research gap by adding implicit representation of EcM and ErM associations into the NP uptake processes of a peatland branch of ELM, ELMv2-SPRUCE (Griffiths et al., 2017; Shi et al., 2015, 2021). AM is not added because it is not a key component of northern peatland ecosystems (Egerton-Warburton et al., 2013). We compare the original model, hereafter “ELM-OLD”, and the modified model, hereafter “ELM-MYCI” (for mycorrhizal-implicit), against observed C fluxes, pore water NP concentrations, resin-exchange-measured plant available NP, and peat C-N-P stocks from the Spruce and Peatland Responses Under Changing Environment experiment (SPRUCE; Griffiths et al., 2017; Griffiths and Sebestyen, 2016; Hanson et al., 2020a; Iversen et al., 2022; Salmon et al., 2021). SPRUCE is a whole ecosystem warming and CO2 fertilization experiment located in a boreal peatland ecosystem (Hanson et al., 2017). The site has EcM-associated trees (black spruce [Picea mariana] and tamarack [Larix laricina]) and various species of ErM-associated ericaceous shrubs, offering an array of interactions between plants, fungi, and soils under experimental treatments that have not been tested by the above-reviewed modeling studies. Warming at SPRUCE increased shrub productivity, decreased Sphagnum moss productivity, and increased resin-exchange nutrient availability (Hanson et al., 2020a, 2025; Iversen et al., 2022). A persistent issue in ELM-OLD has been the inability to reproduce the larger increase in shrub productivity relative to tree productivity under warming (Shi et al., 2021). Using ELM-MYCI, we test the hypothesis that the shrub responses can be explained by decreasing dependence on ErM in response to higher nutrients availability under warming, akin to the findings or suggestions of multiple previous studies (Defrenne et al., 2021; Duchesneau et al., 2024a; He et al., 2018; Shao et al., 2023b).
2.1 Site Description
The SPRUCE experimental site is within the S1 Bog of the United States Department of Agriculture Forest Service Marcell Experimental Forest, located in northern Minnesota, USA (47°30.476′ N, 93°27.162′ W, 418 m above mean sea level; Hanson et al., 2017, 2020a; Kolka et al., 2011; Salmon et al., 2021). The bog is an acidic, raised-dome ombrotrophic bog with nutrient inputs only from atmospheric deposition and nitrogen (N) fixation. The open forest canopy at the site is Picea mariana (Mill.) B.S.P. (black spruce) with occasional Larix laricina (Du Roi) K. Koch (eastern tamarack). The trees were harvested in strip cuts in 1969 and 1974 and the current canopy is mostly regenerated from the 1974 strip cut (Hanson et al., 2016a). The understory is dominated by ericaceous shrubs (Rhododendron groenlandicum [Oeder] Kron & Judd [Labrador tea], Chamaedaphne calyculata [L.] Moench. [leatherleaf], Vaccinium angustifolium Aiton [lowbush blueberry], Vaccinium oxycoccos L [bog cranberry], and Kalmia polifolia [bog laurel]) with a small biomass pool of forbs and sedges (Hanson et al., 2025). The bryophyte layer is dominated by Sphagnum spp. This vegetation community is represented by the following plant functional types (PFTs) in both ELM-OLD and ELM-MYCI: boreal evergreen needleleaf for black spruce, boreal deciduous needleleaf for tamarack, boreal deciduous shrub for the ericaceous shrubs, and Sphagnum moss. The forbs and sedges are not modeled but comprise less than 10 % understory cover according to pretreatment surveys (Iversen et al., 2017b).
The detailed whole ecosystem warming and CO2 fertilization experimental setup is reported elsewhere (Hanson et al., 2017). Briefly, the experiment has two unenclosed, ambient plots (ambient temperature, ambient CO2) and five pairs of enclosures that target five whole ecosystem warming levels (+0, +2.25, +4.5, +6.75, and +9 °C) above ambient temperatures crossed with ambient and elevated (+500 ppm) CO2. The belowground heating extends 3 m into the peat profile and began in June 2014. The aboveground warming began in August 2015. The CO2 fumigation began on 15 June 2016.
2.2 The default ELMv2-SPRUCE model (ELM-OLD)
ELM is the land component of the Energy Exascale Earth System Model (E3SM), which consists of atmosphere, land, ocean, sea ice, and land ice components (Burrows et al., 2020; Yang et al., 2019, 2023). ELM-OLD is currently branched off ELM version 2 with improved peatland processes, including hummock-hollow hydrological interactions (Shi et al., 2015) and the Sphagnum moss PFT (Shi et al., 2021). ELM-OLD has been used primarily for site-level simulations, in which we represent the bog as two interacting grid cells that represent a hummock soil column and a hollow soil column (Shi et al., 2015). Each soil column has multiple PFTs that compete for water and nutrients (Shi et al., 2021). Soil decomposition uses a first-order decay model with one coarse woody debris pool, three plant litter pools (labile, cellulose, lignin), and four SOM pools (Burrows et al., 2020; Oleson et al., 2013; Supplement, Sect. S1.1.3). Belowground nutrient competition among the PFTs and the soil decomposition process is simulated with the Relative Demand approach (Sect. S1.1.2; Fig. 1a). Plant photosynthesis creates potential NP uptake through the fixed C : N and C : P in the plant structural tissues (leaf, fine root, coarse root, stem). Soil decomposition creates potential NP immobilization due to the need for extra NP when C decomposes from an upstream pool that has higher C : N and C : P into a downstream pool that has lower C : N to C : P. The potential uptakes and immobilization are compared to the total available inorganic NP in soil, and scaled down by the same factor so that the total available inorganic NP is not exceeded (Burrows et al., 2020; Thornton and Rosenbloom, 2005). Due to this NP limitation, some photosynthesized C cannot become growth in the structural tissues; the extra C enters the nonstructural carbohydrates (NSC) pool as C reserve (Burrows et al., 2020).
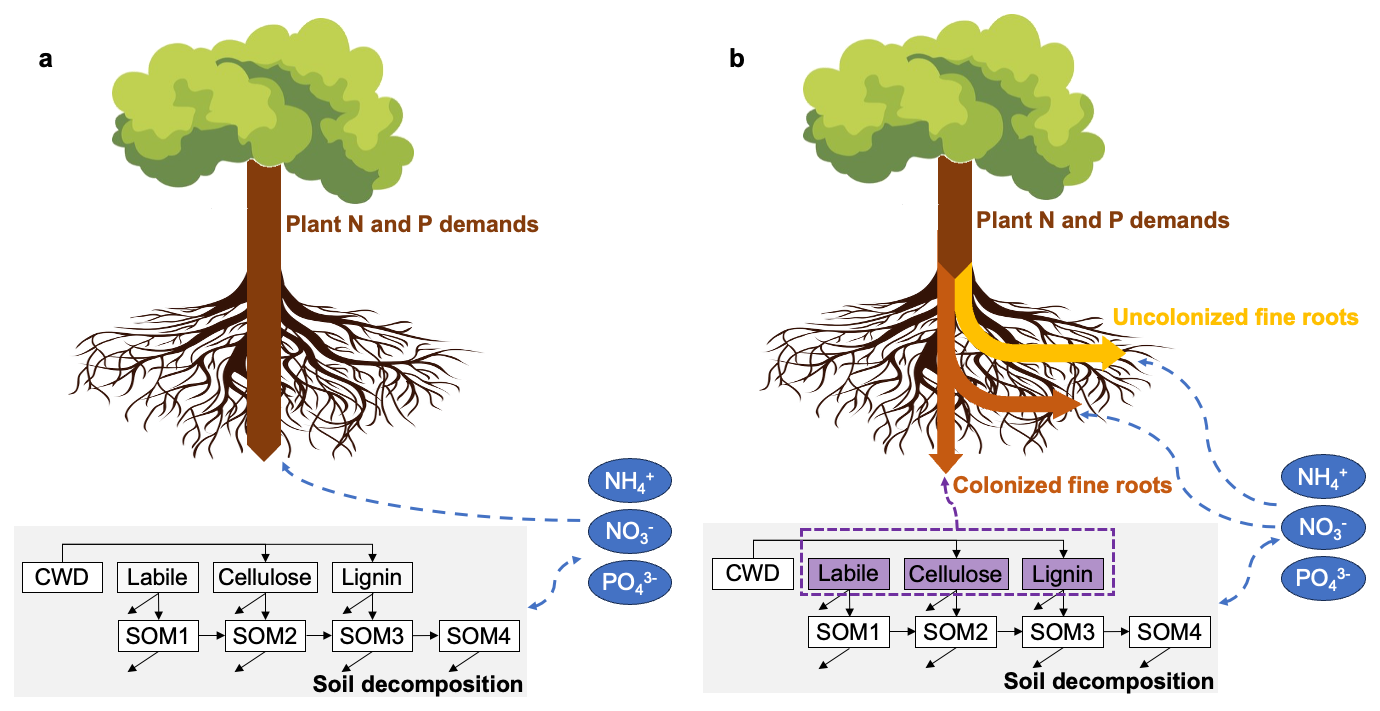
Figure 1Simplified illustration of the belowground nutrient competition between the vascular plant functional types and the soil decomposition processes in ELM-OLD (a) and ELM-MYCI (b). Boxed arrows indicate potential plant uptakes. Dashed arrows indicate directions of nutrients flow, with blue for mineral nutrients and purple for nutrients locked in organic forms. Solid arrows between the decomposition pools indicate direction of carbon flow, with unattached arrow heads meaning respirational losses. CWD – coarse woody debris.
2.3 The modified ELMv2-SPRUCE model (ELM-MYCI)
ELM-MYCI is designed to improve the process-realism of nutrient uptake for the three vascular PFTs (spruce, tamarack, shrubs) by considering the following three pathways: (1) direct inorganic nutrient uptake by uncolonized fine roots, PATHroot, (2) indirect inorganic nutrient acquisition by mycorrhizal roots, PATHmyc,inorg, and (3) indirect nutrient acquisition from organic sources by mycorrhizal roots, PATHmyc,org (Fig. 1b). The entire set of equations and detailed descriptions are provided in Sect. S1.1.4–S1.1.10. The major equations and assumptions are described here. Unless otherwise noted, the equations are only shown for N, and the equations for P can be obtained simply by replacing all N with P.
Like in ELM-OLD, ELM-MYCI still calculates the NP demand implied by photosynthesis, but decouples this demand from the potential NP take, which are determined through the three pathways. ELM-MYCI uses fungi-colonization fraction to idealize the fine root into a uncolonized part, which can only use PATHroot, and a colonized part, which can only use PATHmyc,inorg and PATHmyc,org. The colonization fraction of EcM for the two tree PFTs and ErM for the shrub PFT is a clipped linear function of annual average soil inorganic N (Eq. 1). The sensitivity to P is currently set to zero in Eq. (1), because observational constraints on this sensitivity are weak in past experimental studies (Bashian-Victoroff et al., 2025) and at the SPRUCE site (Sect. S1.1.5).
The potential inorganic NP uptake via PATHroot is dependent on uncolonized fine root surface area, soil inorganic NP concentrations, soil temperature, soil moisture, and the current NP-limitation level of the plant (Eq. 2). The fine root surface area, , is calculated from modelled fine root biomass, and observed fine root radius and density at the SPRUCE site (Eq. S32 in the Supplement). The dependence on soil inorganic NP concentrations, Fj(Nconc,i), follows the conventional Michaelis-Menten form (Eq. S22; Knox et al., 2024). The dependence on soil temperature, F(Tsoi,i), follows the conventional Q10 form (Eq. S13). The dependence on soil moisture, F(Θsoi,i), follows a previous unimodal function to let both dry and excessively wet soil inhibit nutrient uptake (Eq. S14; Frolking et al., 2002). The NP-limitation feedback term, F(FNlimit,j), is exactly one when the PFT is not NP-limited and decreases asymptotically to zero as soil inorganic NP become more abundant (Eq. S15; Fig. S3 in the Supplement). This term prevents numerical instability in the model and is somewhat supported by experimental observations (Glass et al., 2002).
The potential inorganic NP acquisition via PATHmyc,inorg is dependent on colonized fine root biomass, the same soil inorganic NP concentrations, soil temperature, and soil moisture multipliers as PATHroot, and NSC availability (Eq. 3). The NSC availability term reflects fungal dependence on C transfer from the host plant (Eq. S16; Bunn et al., 2024; He et al., 2018; Shao et al., 2023b). The potential NP acquisition from organic sources via PATHmyc,org is dependent on colonized fine root biomass, the same soil temperature and moisture multipliers as PATHroot and PATHmyc,inorg, and the same NSC availability term as PATHmyc,inorg (Eq. 4). PATHmyc,org does not include a Michaelis-Menten term for organic NP concentrations, because the peatland environment is rich in organic substrates. Also, the soil decomposition pools in ELM are rate-based rather than corresponding to actual chemical compounds and do not distinguish between solid and dissolved phases (Oleson et al., 2013), making it difficult to separate fungi-accessible from fungi-inaccessible fractions (Näsholm et al., 2009; Talbot and Treseder, 2010). The total potential mycorrhizal inorganic and organic NP acquisitions is capped by 50 % of net photosynthesis per time step, scaled by a constant C-cost factor (Eq. S25). The 50 % threshold was selected based on the maximum percentage of C allocated to mycorrhizal fungi in a previous meta-analysis (Hawkins et al., 2023). The cap, like the NSC availability term, reflects fungal dependence on C input from the host plants.
The potential rates of the three pathways are compared to soil inorganic and organic NP availability to determine actual rates. The potential inorganic NP uptake or acquisition from PATHroot, PATHmyc,inorg, and soil decomposition processes are scaled down by soil inorganic NP availability analogously to the default Relative Demand approach (Eq. S3, S4, S9, S11). The potential organic NP acquisition from PATHmyc,org per hourly time step is capped by 0.0001 of the total organic NP in the labile, cellulose, and lignin plant litter pools (Fig. 1; Eq. S19–S20). The 0.0001 multiplier is adopted from the upper bound in CoupModel (He et al., 2018), and is intentionally chosen to be a large number that prevents unrealistically large uptake rate rather than serving as a true upper bound on the fungi-accessible fraction of organic NP. The restriction to only access plant litter pools is again due to structural constraint in ELM's soil decomposition pools. The plant litter pools allow variable C : N and C : P ratios, but the SOM pools do not, so that mycorrhizal acquisition of N and P from the SOM pools will require considering how much C is lost as fungal respiration, which is beyond the scope of this project (Sect. S1.1.7). Finally, the actual rates are compared to the implied demand by photosynthesis to determine plant structural growth. The actual rate of PATHmyc,org is used to subtract NP from the three plant litter pools, distributing the acquisition proportional to the size of each pool.
-
i – soil layer index
-
j – PFT index
-
Mmyc,j – fraction of fine roots colonized by EcM (for the spruce and tamarack PFTs) or ErM (for the shrub PFT)
-
Nsoil,annavg – annual average soil inorganic N () content in the rooting zone, g N m−3
-
aj – intercept parameter
-
bj – slope parameter
-
– the potential inorganic N uptake rate via PATHroot, g N m−2 ground area s−1
-
– the potential inorganic N acquisition rate via PATHmyc,inorg, g N m−2 ground area s−1
-
– the potential N acquisition rate from organic sources via PATHmyc,org, g N m−2 ground area s−1
-
– the maximum inorganic N acquisition rate per unit uncolonized fine-root surface area, g N m−2 ground area s−1
-
– the maximum inorganic N acquisition rate per unit colonized fine-root biomass, g N g C−1 s−1
-
– the maximum organic N acquisition rate per unit colonized fine-root biomass, gN g C−1 s−1
-
– total fine root surface area in one soil layer, cm2 m−2 ground area
-
Cfroot,j – total fine root biomass in one soil layer, g C m−2 ground area
-
Fj(Nconc,i) – Michaelis-Menten multiplier of soil inorganic N concentration (Nconc,i, g N m−3 soil volume)
-
F(Tsoi,i) – Q10 multiplier of soil temperature (Tsoi,i, °C)
-
F(FNlimit,j) – a feedback factor to prevent infinite N uptake when inorganic N is abundant (FNlimit,j is the PFT's N-limitation level in the previous time step)
-
F(Cns,j) – degree of NSC saturation in the plant (Cns,j is the NSC biomass in the plant, g C m−2 ground area)
2.4 Simulation protocol
Following previously established protocols (Griffiths et al., 2017; Hanson et al., 2020a; Shi et al., 2021), we first conducted a single-grid simulation that consists of an accelerated spin-up of 207 years, a normal spin-up of 407 years, and an 1850–2014 transient simulation, and then branched the simulations into eleven treatments corresponding to one control simulation for unenclosed plot + five pairs of enclosures (Sect. 2.1) during 2015–2023. The control simulation only uses one of the two unenclosed plots, which is labeled plot 7 in the experiment (Hanson et al., 2020a), because it has a longer water table record, which is needed to force ELMv2-SPRUCE. The accelerated and normal spin-ups were driven by cyclic ambient meteorological forcing during 2015–2023, preindustrial CO2 concentration, preindustrial N deposition, and constant land cover. The transient simulation cyclically used the ambient meteorological forcing during 2015–2023, historically varying CO2 concentration and N deposition, and included the 1974 strip cut event where 99 % aboveground tree biomass was removed. The treatment simulations were forced by meteorological observations and water table depths in each plot during 2015–2023 (Hanson et al., 2016b, 2020b). The simulated water table depths in the two columns equilibrate with each other and observed water table depths (Shi et al., 2015). The atmospheric CO2 concentrations in the elevated CO2 plots were set to 500 ppm above ambient level starting from 15 March 2016. Within the grid, the hummock soil column was set to 64 % of the area and hollow 36 % (Graham et al., 2020). A limitation of this version of ELM is that we do not represent multiple canopy layers. Therefore, we must specify fractional coverages for each PFT that add to 100 % total. We started with the default assumption that each of the four PFT covers 25 % and then adjusted for the observed distribution of the two tree types. Within each soil column, the PFT fractions were: needleleaf evergreen boreal tree 36 % (for spruce), needleleaf deciduous boreal tree 14 % (for larch), broadleaf boreal deciduous shrub 25 % (for ericaceous shrubs), and Sphagnum moss 25 % in the pre-treatment simulations and fractionally adjusted using the annually observed fractional coverages in the treatment simulations (Table S8 in the Supplement). All the simulations used an hourly time step.
2.5 Model calibration data
For the parameter optimization experiments described in Sect. 2.7.1, we focused on the following annual C fluxes: (1) the aboveground NPP of the spruce trees (AGNPPspruce), (2) the aboveground NPP of the tamarack trees (AGNPPtamarack), (3) the aboveground NPP of the shrubs (AGNPPshrub), (4) the NPP of Sphagnum moss (NPPmoss), (5) the belowground NPP of total tree and shrub fine roots (BGNPPtreeshrub), (6) heterotrophic respiration (HR; Hanson et al., 2018a, b, 2020a; Norby et al., 2019). We additionally summed up (1–5) to obtain (7) an aggregated “NPP” term – note this is not true NPP because it does not contain coarse root production. There are some temporal mismatches across the datasets: BGNPPtreeshrub observations only span 2016–2017 (Malhotra et al., 2020b); the other observations span 2016–2021, but year 2020 was excluded due to the high uncertainty associated with the limited measurements taken during the COVID era (Hanson et al., 2020a; Norby and Childs, 2018). To facilitate concise comparison, we summarized each of those variables into two mean values and two temperature sensitivities, similar to a previous approach at the site (Hanson et al., 2020a). The mean values were calculated, respectively, over all the years in the ambient CO2 plots and over all the years in the elevated CO2 plots. The temperature sensitivities were calculated as the slope of least squares linear regression between each C-flux variable and observed mean annual 2 m air temperatures, respectively, over all the years in the ambient CO2 plots, and over all the years in the elevated CO2 plots. Those means and slopes were used in parameter optimization objective function (Eq. 5).
2.6 Model evaluation data
The datasets described in the following subsections were withheld from model calibration and used solely for evaluation.
2.6.1 Post-calibration annual C fluxes
We reserved the following annual C fluxes for post-calibration model evaluation: AGNPPspruce and AGNPPtamarack, available for year 2022 in the ten treatment enclosures; AGNPPshrub, available for year 2023 in all eleven plots; the growing season average NEE of the shrub-moss community (NEEshrubmoss, gC m−2 gs−1, “gs”), available for year 2023 in the ten treatment enclosures. The data sources of AGNPPspruce, AGNPPtamarack, and AGNPPshrub are the same as in Sect. 2.5. The growing season mean NEEshrubmoss was calculated from the average of gapfilled 15 min automated chamber measurements made on the shrub-moss community (Stelling et al., 2024). Growing season is defined as 1 May to 31 October, to match the observational period (27 April to 27 October 2023). The gapfilling method is adapted from previous work at the SPRUCE site (Walker et al., 2017) and is described in detail in Sect. S1.3. Note the automated chamber measurements and the gap-filling method used here are preliminary and were applied solely for the purposes of this study, pending availability of the full analysis of the automated chamber data (J. Stelling, personal communication, 2006). To obtain the modelled equivalence of NEEshrubmoss, we considered what component fluxes were included in the observed NEEshrubmoss. The chambers only enclosed shrubs and moss aboveground. Therefore, the chamber fluxes included aboveground shrub and moss GPP and respiration. The belowground collars of the chambers did not exclude tree roots. Therefore, the chamber fluxes included belowground soil HR, tree root respiration, shrub root respiration, and belowground moss respiration. Furthermore, because the chambers have small footprints, the sampled shrub and moss growths were often not representative of the average plot conditions. Therefore, we down-scaled the modelled plot-level shrub and moss GPP and respiration to the chamber-level using each PFT's ratio of measured aboveground biomass in the chamber (gC m−2) to the measured aboveground biomass in the corresponding plot (gC m−2, Table S8). We assumed the soil HR and tree root respiration components of the chamber fluxes correspond to plot-level averages due to lack of prior information. In summary, the modelled equivalence of NEEshrubmoss is calculated as (Plot-average HR + Plot-average tree root respiration + Scaled shrub autotrophic respiration + Scaled moss autotrophic respiration – Scaled shrub GPP – Scaled moss GPP).
2.6.2 Annual maximum leaf area index
To evaluate the simulated C biomass, we compared the models against the annual maximum leaf area index (LAI) of the two trees and shrub, measured using LICOR LAI 2200 device during 2015–2020 (McPartland et al., 2019). The annual C fluxes and LAI observations all have direct correspondence with modeled variables. AGNPPspruce and AGNPPtamarack have strong pre-treatment variation that impacts the interpretation of results (Hanson et al., 2025). Therefore, we fitted ordinary least squares linear regression models to remove the pre-treatment effect; because LAI is closely related to aboveground NPP, we used the same method to remove the pre-treatment variation in the LAI of the two tree species (Sect. S1.2). We did not compare the models against observed net C exchange or methane flux data because the net C exchange has small components of lateral outflow of organic C and dissolved inorganic C (Hanson et al., 2020a), which are not yet considered in ELMv2-SPRUCE, and the model cannot yet fully capture methane dynamics.
2.6.3 Porewater nutrient concentrations
For nutrient cycling, we evaluated the models against several forms of observations. The first of those was porewater ammonia (NH), nitrate (NO), and inorganic P (PO) concentrations, which characterize the pool of dissolved nutrients in soil. The porewater concentrations were measured roughly twice per month during the non-frozen months of 2015–2020 near the bottom of the rooting profile (30 cm) in the hollow (Griffiths et al., 2016). The pore water nutrient concentrations were measured on a per water volume basis (mg N L−1, mg P L−1), but ELM can only simulate nutrient concentrations on a per soil volume basis (gN m−3 soil, gP m−3 soil). Therefore, we divided the simulated NH, NO, and soluble P (as defined in Yang et al., 2019) concentrations by the simulated volumetric soil water content to bring them to the same unit as the observations. Because the sampling interval was irregular and relatively infrequent, and nutrient concentrations in water can exhibit sharp, episodic fluctuations (Basu et al., 2010), we chose not to interpolate the observations to annual level like the annual C fluxes (Hanson et al., 2018a, b, 2020a; Norby et al., 2019). Instead, we down sampled the model outputs to only include the dates on which pore water concentrations were measured, ensuring that both observed and modeled data reflect the same seasonality. For each enclosure, we then summarized the observed and down-sampled modeled porewater nutrient concentrations into two statistics: the mean value and the temporal linear trend, to facilitate concise comparison. Here, the temporal linear trend is defined as the slope of a least-squares regression between the modeled/observed values and the elapsed days since 1 January 2015. We chose enclosure-specific temporal trends, instead of cross-enclosure temperature sensitivity (as done in Sect. 2.5), because the former metric captures well the behavior of the data when plotted as a time series, whereas scatterplots between the observed porewater nutrient concentrations and the air temperature on the corresponding dates do not show clear correlation.
2.6.4 Resin-exchange plant available nutrients
The second form of nutrient cycling observations we used is resin-exchange NH and PO (Iversen et al., 2017a). Those values approximately represent plant-available nutrients but previous study suggests that in shallow soil layers (10 cm), competition with roots invalidates this interpretation (Iversen et al., 2017a, 2022). Therefore, we focus on the resin-exchange nutrients measured at 30 cm in both the hummock and hollow, and at 60 cm in the hollow during 2015–2018, at which depths few roots exist in the anaerobic peatland environment (Iversen et al., 2017a). The raw measurements were cumulative absorbed weights of NH or PO per resin capsule surface area during roughly monthly intervals; the values used in this study are the aggregated annual averages by the data collector (Iversen et al., 2017a). Following previous study, we compared the temperature sensitivities of the observed resin-exchange nutrients to the temperature sensitivities of the most comparable modeled variable, annual average net nutrient mineralization rates (NET_NMIN [gN m−3 s−1], NET_PMIN [gP m−3 s−1]) for a qualitative comparison (Iversen et al., 2022). To remove unit difference between the observed and modeled quantities, we divided the observed values and the modeled values, respectively, by the mean value of each during the observational period, separately for each nutrient species and soil depth. The resulting regression slopes against temperature represent relative (mean-scaled) changes per unit change in soil temperature. This normalization approach is commonly used in elasticity analysis for comparing effects across variables with different units (Sydsaeter and Hammond, 1995).
2.6.5 Pretreatment peat C, N, P stocks
The final observation of nutrient cycling we used for evaluation are pre-treatment vertical profiles of C, N, and P stocks in the peat (Griffiths et al., 2017; Salmon et al., 2021). The compared model variables are the summed C, N, and P contents of all four SOM pools (1, 2, 3, 4) in all the soil layers in the decomposition processes (Sect. S1.1.3; Oleson et al., 2013) in the control plot.
2.7 Sensitivity experiments
2.7.1 Parameter optimization
In both ELM-OLD and ELM-MYCI, the soil decomposition process uses column-level parameters that are shared between hummock and hollow. Vegetation processes like photosynthesis, respiration, and nutrients uptake/acquisition use PFT-specific parameters that are also shared between hummock and hollow. We used observed parameter values as much as possible in ELM-OLD (Table S2) and ELM-MYCI (Table S4). For those unobserved, we used either optimized values obtained from 4000-member ensemble simulations that are described below (Tables S3 and 1) or manually set default values (Tables S2 and S4) if a parameter has relatively minor influence on the quantities of interest in this study. All the parameter optimization simulations excluded moss parameters for the purpose of consistency – because moss is not modified in this study, the newly added parameters do not cover moss.
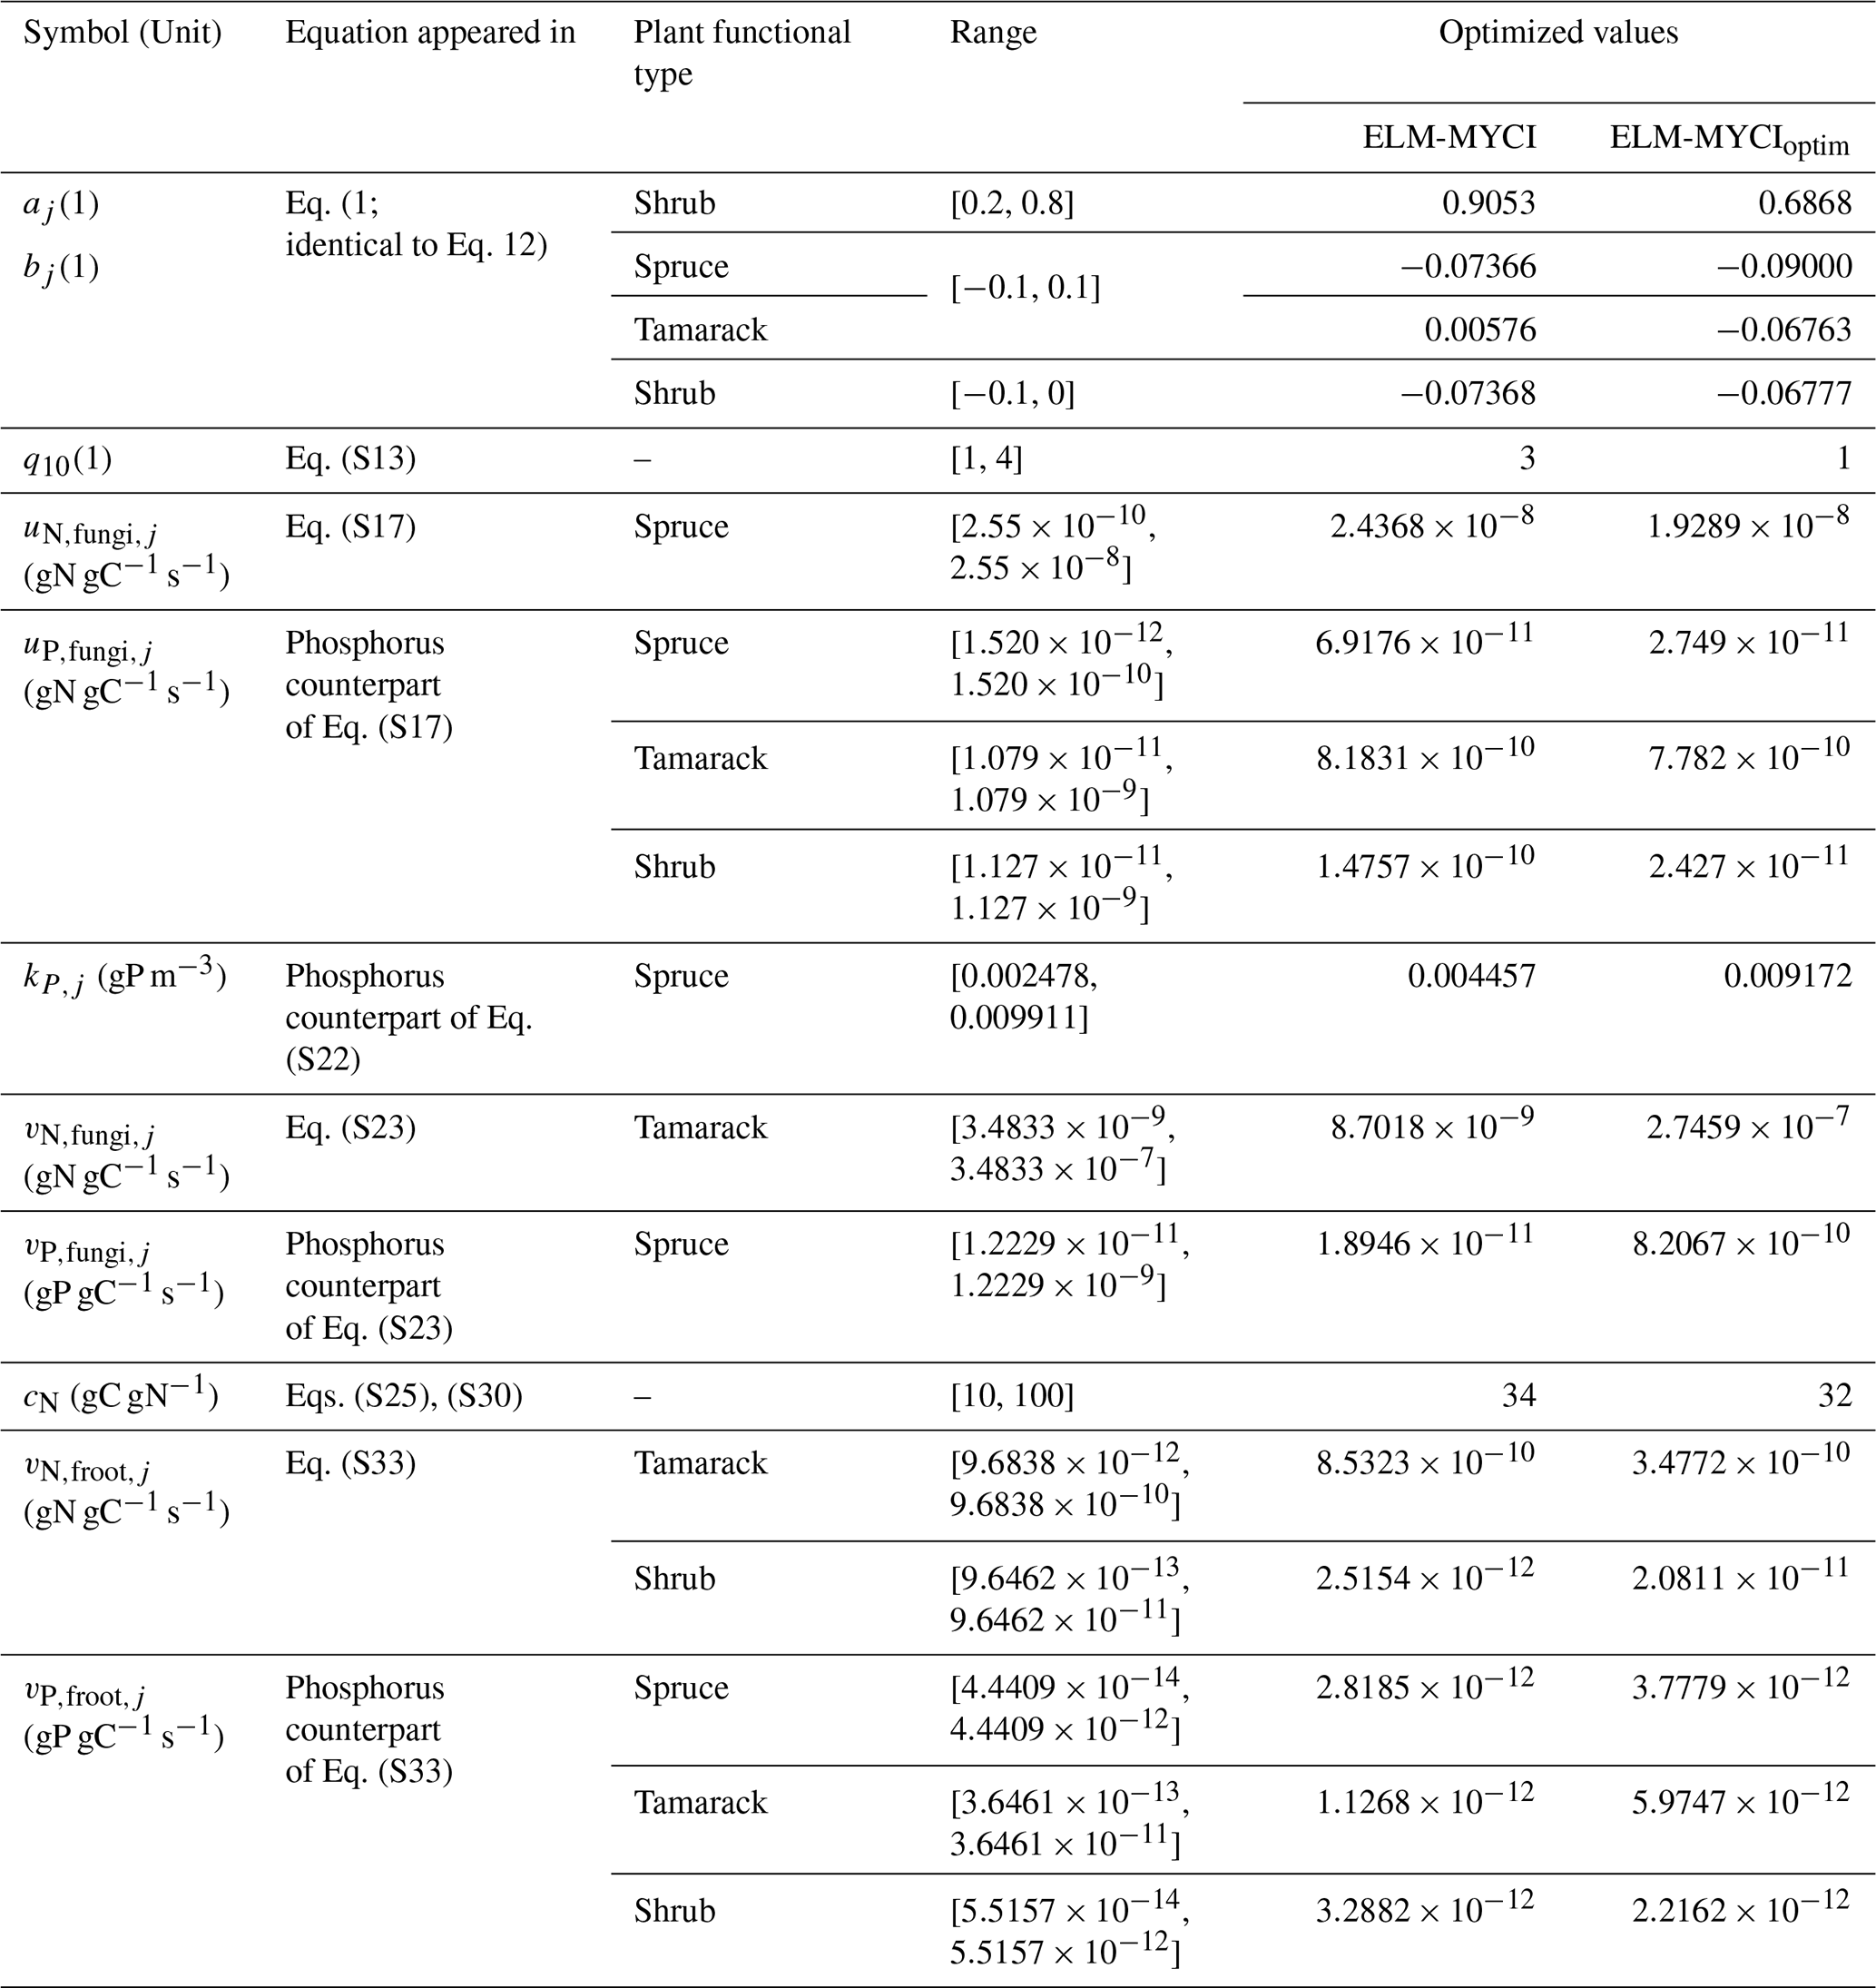
We selected eleven preexisting parameters in ELM-OLD to optimize based on previous sensitivity findings (Meng et al., 2021; Ricciuto et al., 2018). Those parameters affect photosynthesis, plant respiration, plant allocation, and soil decomposition processes (Table S3). For each parameter, we generated an equal number of uniform random samples between predetermined upper and lower bounds from previous studies (Griffiths et al., 2017; Meng et al., 2021; Ricciuto et al., 2018; Table S3). We then formed all possible combinations of these samples across the parameters to create a total of 4000 samples. We then ran the model with these 4000 parameter sets. Finally, we ranked these parameter sets by relative absolute error (RAE) and selected the sample with the lowest RAE as the optimized parameter values. The RAE formula is shown in Eq. (5) and considers the relative errors in mean and in temperature sensitivity of annual C fluxes:
where the subscripts sim means simulated, obs means observed, v is variable, c is the CO2 treatment (ambient or elevated), V is the set of variables compared, |V| is the number of variables, A is the mean magnitude of the variable across all the treatments and years, S is the linear regression slope of the variable against annual mean air temperature across all the treatments and years, U is the observational uncertainty in mean, Q is the observational uncertainty in slope. During calibration, the performance metric calculated on the annual C fluxes that are items 1–6 in Sect. 2.5, because those are directly comparable to model outputs. Other observations are either reserved for validation (Sect. 2.6.1–2.6.2), not directly comparable to model outputs (Sect. 2.6.3–2.6.4), or pretreatment (Sect. 2.6.5). We did not include the aggregate NPP (item 7) or annual maximum LAI because of strong overlap with items 1–6. The values were estimated from pre-treatment standard deviation across the enclosure locations (Hanson et al., 2020a, 2025) by assuming that the relative uncertainty stays the same, i.e. the ratio of pre-treatment standard deviation to pre-treatment mean is the same as the ratio of to . The values are the 1σ uncertainty in the linear regression slopes (DeGroot and Schervish, 2018). We chose normalization by uncertainty to ensure the BGNPPtreeshrub variable, which are based on ingrowth core samples that had limited spatial representativeness and only span two years, was not overemphasized compared to the other C fluxes, which have five-year estimates (Hanson et al., 2020a; Iversen et al., 2021b). The normalization additionally ensured that all the variables are unitless, making them intercomparable.
For ELM-MYCI, the total number of preexisting and newly added parameters resulted in an extremely large search space that cannot be covered by 4000 samples. Therefore, we focus on perturbing the most sensitive half (18) of the 37 newly added parameters (Table 1). The most sensitive half was predetermined using one-at-a-time (OAT) perturbation – for each parameter, we generated 50 uniform random samples per parameter between pre-defined upper and lower bounds (Tables S4, 1). The perturbation ranges were based on observations or previous studies when possible (Table S4). The range for q10 of mycorrhizal acquisitions was set wider than the range of q10_hr for HR (Table S3) to explore more values (Table 1). The ranges for the rate constants (, , ) always span exactly two orders of magnitudes, and were selected based on experimental measurements (Table S5) and similar rate constants in past modelling studies (He et al., 2021; Shao et al., 2023b; Wu and Blodau, 2013). The geometric centre of each range was a manually tuned value that produced acceptable performance at the site during preliminary simulations. The ranges for the half-saturation points () were set at approximately the modelled annual average soil inorganic NP levels at the SPRUCE site, because experimentally measured values (Table S6) were found to cause PFTs to die in test simulations. The ranges for the C-cost factor of mycorrhizal N acquisition (cN) were selected based on past observed exchange ratios for EcM (Bogar et al., 2022), assuming ErM has similar behaviour. We did not include the high-end of the observed exchange ratios (>100; Bogar et al., 2022) because those severely restricted mycorrhizal nutrient uptake in the modelling context, possibly due to the 50 % net photosynthesis cap.
We then calculated the standard deviations of and over all the random samples for each variable and CO2 treatment. This approach resulted in a 4th order tensor of 37 parameters × 6 variables × 2 CO2 treatments × 2 coefficients [mean or temperature response slope]. We converted the standard deviation tensor to a same-dimensioned rank tensor by ranking the standard deviations high-to-low across the parameters separately for each variable, CO2 treatment, and mean or slope. We show the ranks in Fig. S4, with the last three dimensions of the rank tensor compressed into the form of boxplots. The selected most sensitive parameters are those with lowest median ranks in Fig. S4 and are listed in Table S5. We then perturbed those most sensitive 18 parameters in a 4000-member ensemble simulation, calculated the RAE in the same way as done for ELM-OLD, and selected the sample with lowest RAE as the optimized set of parameters.
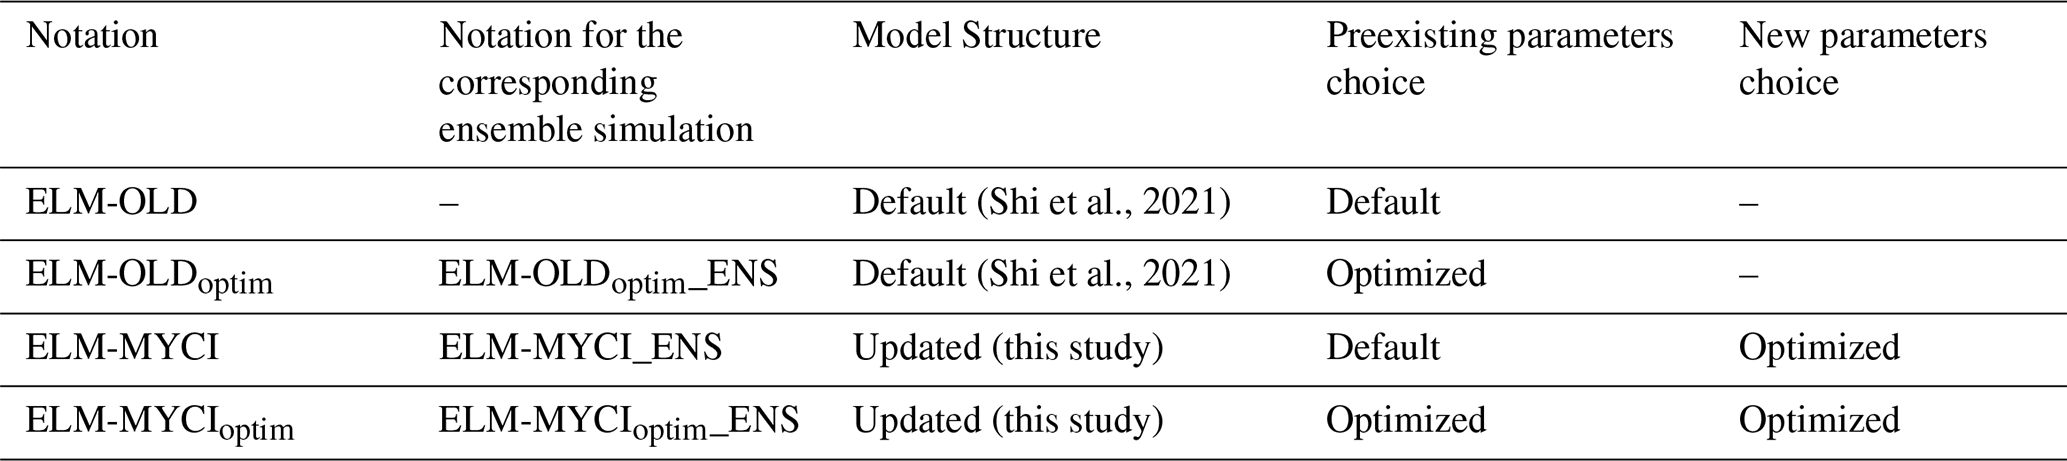
It is desirable to understand whether our structural change can improve ELM-OLD beyond the capability of parameter optimization. Therefore, we conducted two sets of 4000-member ensemble simulations for ELM-MYCI: one with the preexisting parameters fixed at default levels, and one with the preexisting parameters fixed at optimized levels. Table 2 lists the final four simulations compared in this study. Comparing ELM-OLDoptim to ELM-OLD gives the effect of parameter optimization. Comparing either ELM-MYCI to ELM-OLD, or ELM-MYCIoptim to ELM-OLDoptim, gives the effect of structural modification. Comparing ELM-MYCIoptim to ELM-OLD gives the combined effects of parameter optimization and structural modification.
Table 2Summary of parameter perturbation experiments and the optimal runs compared in this study.
2.7.2 Verification of parameter constraint
Equation (5) only uses C fluxes but the optimized new parameters are mainly relevant to NP. To examine whether the selected optimal parameter values are indeed from a constrained subregion of the search space by Eq. (5), or simply perform best by chance, we used a clustering metric. This metric, though not using a formal likelihood framework, is consistent with the equifinality concept, where parameters are considered identifiable if the high-likelihood parameter values are concentrated in a small region, and non-identifiable if broadly distributed across the parameter space (Raue et al., 2009). We first normalized all the sampled parameter values to between 0 and 1 using the predefined ranges (Tables S3 and S5). Then, we calculated the Euclidean distances between the normalized parameter values of two types of ensemble member pairs. The first type was all the pairs that can be formed between the best performing 1 % (i.e. 40) members. The second type was all the pairs formed between one value from the best performing 1 % members, and one value from the bottom 99 % (4000 − 40 = 3960) members. If the pairwise distances in the first group are systematically lower than the pairwise distances in the second group, it means the better-performing parameter sets are clustered, which we interpret as being constrained by Eq. (5).
2.7.3 Sobol's sensitivity analysis
While the OAT perturbation helps us to downsize the number of parameters to perturb, it offers limited insight into the full sensitivity of model outputs, because it omits potential interactions among parameters. Using the 4000-member ensembles, we therefore applied a previously established procedure on ELM to calculate Sobol's main-effect and total-effect indices between selected model outputs and all the perturbed parameters (Ricciuto et al., 2018). Sobol's sensitivity indices are based on variance decomposition, where the total variance in a model output is decomposed into fractions attributed to individual parameters and interactions among parameters (Saltelli et al., 2004). The main effect measures the relative fraction attributed to a parameter excluding all interactions. Due to the omission of interactions, the sum of main effects across all the parameters is less than 1. The total effect measures the relative fraction attributed to a parameter including itself and all higher-order interactions involving the parameter. Due to duplicated counting of interactions, the sum of total effects across all the parameters is greater than 1.
3.1 Comparison between model and observations
3.1.1 Model performance on C fluxes and leaf area index
On the calibration set of C fluxes, ELM-MYCIoptim best captures the mean and temperature sensitivity of the C fluxes (RAE = 1.54), followed by ELM-OLDoptim (RAE = 1.61), ELM-OLD (RAE = 1.80), and lastly ELM-MYCI (RAE = 1.82; Fig. 2). Also, ELM-MYCIoptim and ELM-OLDoptim have the fewest number of variables falling outside the ± one standard deviation observational uncertainty window (6 out of 28), followed by ELM-MYCI (8 out of 28), and lastly ELM-OLD (9 out of 28; the number of “×'s” of Fig. 2). Among the individual variables, the mean NPPmoss under elevated CO2, the temperature sensitivity of BGNPPTreeShrub under ambient and elevated CO2, and the temperature sensitivity of aggregate NPP under elevated CO2 are least well-captured, with all four model setups simulating outside the observational uncertainty (Fig. 2a, c, d). ELM-MYCI captures mean HR better than the other three model setups but performs worse on several other variables (mean AGNPPshrub, temperature sensitivity of AGNPPspruce under ambient CO2, mean NPPmoss under ambient CO2, and temperature sensitivity of NPPmoss under elevated CO2; Fig. 2). Consistent with our hypothesis (see end of Sect. 1), structural modification improves model performance in capturing the observed large positive response of shrub growth to warming. The temperature sensitivity of AGNPPshrub under ambient and elevated CO2 are outside the observational uncertainty in ELM-OLD (Fig. 2c). Using optimized preexisting parameters, ELM-OLDoptim simulates the temperature sensitivity of AGNPPshrub within the observational uncertainty range, but still underestimates it by ∼ 50 % under elevated CO2 (Fig. 2c). With structural modification on top of optimized preexisting parameters, ELM-MYCIoptim best captures the temperature sensitivity of AGNPPshrub, with only 17 %–35 % underestimation (Fig. 2c). Structural modifcation appears to negtatively influence the simulated mean AGNPPspruce, which is more severely underestimated in ELM-MYCI and ELM-MYCIoptim than in the other two model setups.
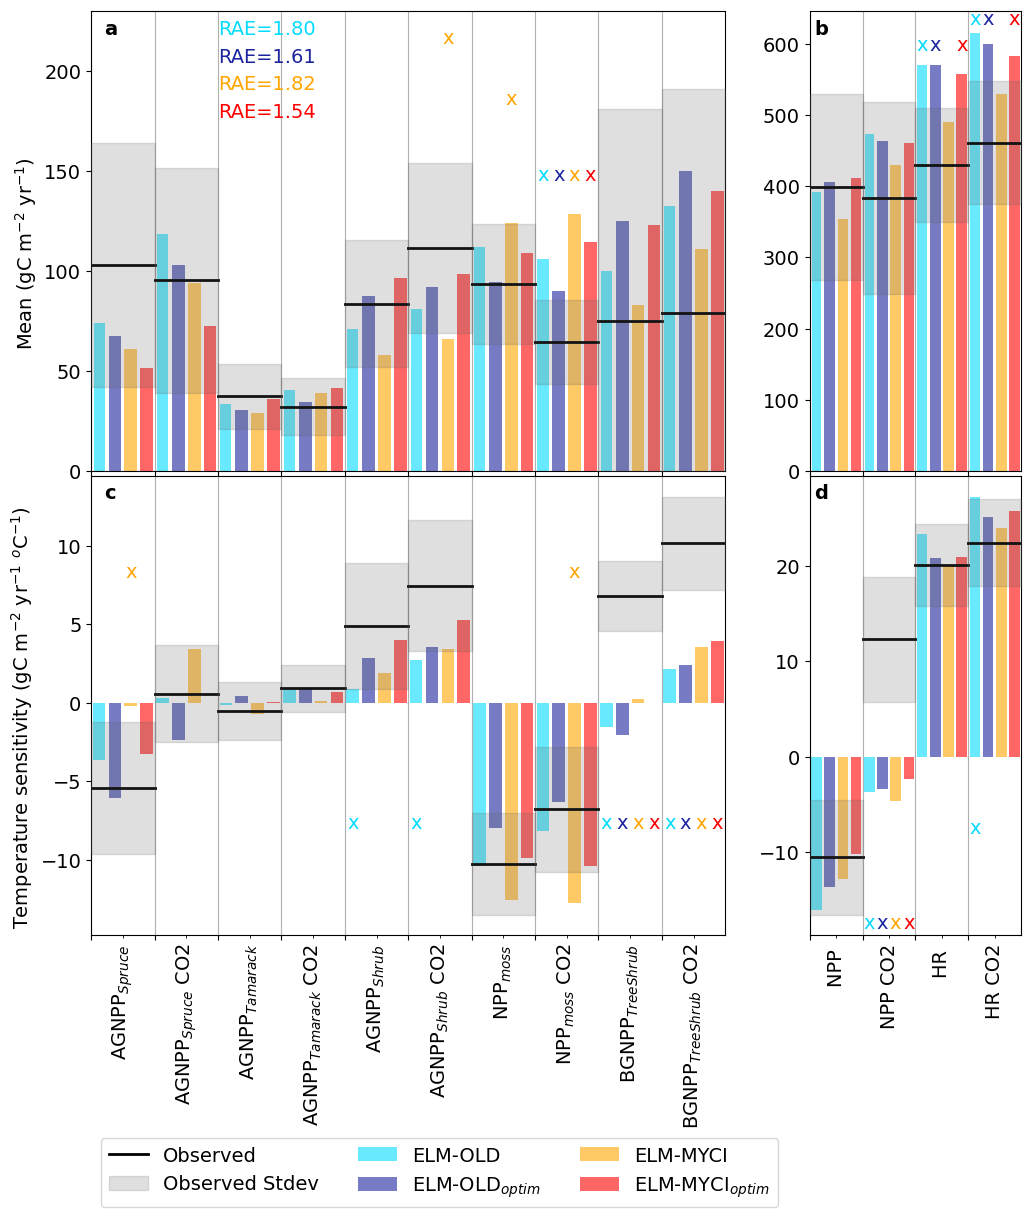
Figure 2Observed versus simulated mean C fluxes (, in Eq. 5) and temperature sensitivity of C fluxes (, in Eq. 5) on the calibration set (2015–2021). RAE is calculated from Eq. (5) for each model setup. The C fluxes names and calculation of the means and temperature sensitivities are explained in Sect. 2.5. The additional “NPP” term was summed up from C fluxes 1–6 in Sect. 2.5. to provide a measure of plot-level primary productivity, but should not be understood as standard NPP because it does not contain coarse root production. The suffix “CO2” means values for elevated CO2 enclosures and without this suffix means values for ambient CO2 enclosures. The observational uncertainty intervals are estimated as described in Sect. 2.7.1. The “×” on top of each bar indicates that the simulated value is outside the observed uncertainty interval.
The results of Fig. 2 show aggregated statistics for all the plots. To reveal more detailed causes of model biases, Fig. S7 shows the plot-wise observed and modelled annual time series of the calibration C fluxes. The interannual and inter-plot variabilities are much larger in the observations than all four model setups, especially in 2015, suggesting spatial variability in the real world remains a source of uncertainty in the model-observation comparison (Sect. S1.2). Increase in AGNPPshrub, decrease in NPPmoss, and increase in HR from the coldest to the warmest treatments are visually discernible in both the observations (Fig. S7c1, d1) and the simulations (Fig. S7c2–c5, d2–d5). Using root mean squared error (RMSE) as a metric on each individual C flux, one can see that ELM-MYCIoptim best captures AGNPPshrub (Fig. S7c2–c5) as well as the aggregate NPP (Fig. S7f2–f5), ELM-MYCI best captures HR (Fig. S7g2–g5), but the structural modifications did not result in clear improvements on AGNPPspruce or AGNPPtamarack (Fig. S7a1–b5). These are consistent with calibration-period performance evaluated on mean and temperature sensitivity (Fig. 2).
On the evaluation set of C fluxes, ELM-MYCIoptim has the best RAE (4.65), followed by ELM-OLDoptim (RAE = 5.03), ELM-MYCI (RAE = 7.22), and ELM-OLD (RAE = 7.31; Fig. 3). RMSE and RAE values calculated on the individual C fluxes show that ELM-MYCIoptim outperforms the other three model setups on AGNPPspruce, AGNPPshrub, and NEEshrubmoss, but not on AGNPPtamarack. This is consistent with the better performance of ELM-MYCIoptim on shrub than trees during the calibration period (Figs. 2, S7). None of the model setups correctly captures the positive temperature sensitivities of AGNPPspruce under both CO2 treatments and of AGNPPtamarack under the ambient CO2 treatment in 2022 (Fig. 3a, b). The high RAE on NEEshrubmoss likely arises from an underestimation of observational uncertainty for this variable, since it was estimated from the RMSE of the gapfilling algorithm (Figs. S4–S5), not considering pre-treatment spatial variability or uncertainty in the chamber- and plot-level biomass measurements used to harmonize model and observations (Sect. 2.6.1). Nonetheless, such bias does not affect the within-variable ranking across the model setups based on RAE or RMSE.
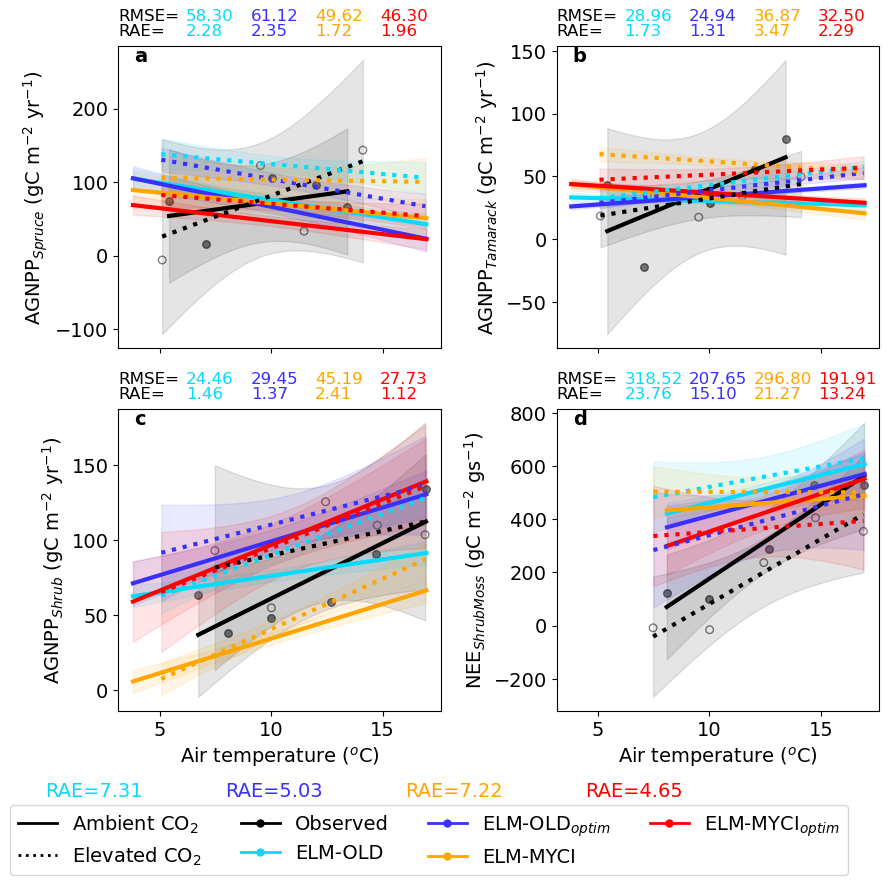
Figure 3Observed versus simulated annual C fluxes on the evaluation set (2022–2023), showing the magnitude and temperature sensitivity. The C fluxes names are explained in Sect. 2.6 and “gs” in the unit of NEEshrubmoss denotes growing season. For each subplot, linear regressions relate annual mean air temperature to the C flux, separately for the ambient CO2 treatment plots and the elevated CO2 treatment plots. Shaded regions indicate 95 % confidence bands of the regressions (DeGroot and Schervish, 2018). Scatter dots show the original data points only for the observational regressions; the simulated original data points are omitted for readability. Root mean squared errors (RMSE) were calculated between the simulated and observed annual C fluxes within each subplot. RAE were calculated from Eq. (5), for each C flux separately (subplot-level) and for all four compared C fluxes (figure-level). For RAE calculation, the uncertainty of AGNPPspruce, AGNPPtamarack, and AGNPPshrub are as documented in Sect. 2.7.1. The mean uncertainty of NEEshrubmoss was set equal to the combined RMSE of the gapfilling algorithm on all the observed data points (15.24 gC m−2 gs−1, combined from Figs. S4–S5). The temperature sensitivity uncertainty of NEEshrubmoss was equal to the standard deviation of regression slope like the other variables documented in Sect. 2.7.1.
In addition to C fluxes, we used annual maximum LAI, which is not a calibration variable, as a proxy to compare modelled C biomass to observed. Based on RMSE, ELM-MYCIoptim has lower overestimation in spruce LAI and lower underestimation in shrub LAI compared to the other three model setups, although higher overestimation in tamarack LAI (Fig. S8).
3.1.2 Model portrayal of soil nutrients
The observed resin-exchangeable nutrients increase by about two orders of magnitude with warming in all observed combinations of depth, nutrient, and hummock-hollow (Fig. 4). The net mineralization rates increase only by about one order of magnitude in ELM-OLD and ELM-OLDoptim. ELM-MYCI and ELM-MYCIoptim better capture the observed increases (yellow line in Fig. 4a, yellow and red lines in Fig. 4b, e, f, red line in Fig. 4c).
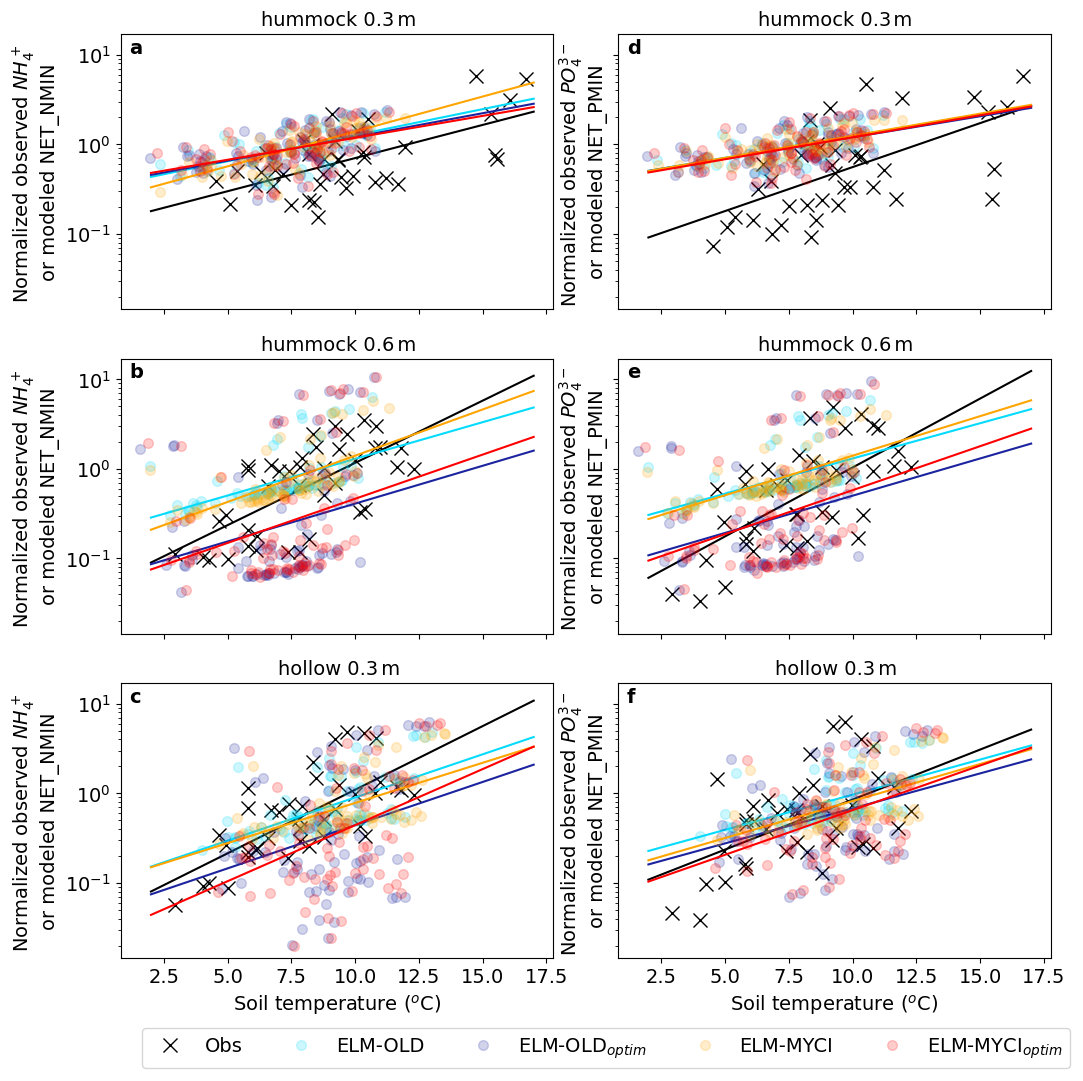
Figure 4Relationships between normalized plant-available nutrients and annual mean peat temperatures in the observations and models at different depths of hummock and hollow. The plant-available nutrients are represented by annual total resin-exchange nutrients (NH and PO in observation and annual mean net mineralization rates (NET_NMIN and NET_PMIN) in the model. Annual values across all the years, enclosures, and CO2 treatments are plotted together. The normalization procedure is reported in Sect. 2.6.4 and reconciles unit difference between observation and model. Lines are least-squares linear regression lines.
The modelled soil NH and soluble P concentrations, converted to per volume soil water basis to compare with observed porewater values, show mean levels that are ELM-MYCI > ELM-OLD > ELM-MYCIoptim > ELM-OLDoptim (Fig. S9a, c). The ELM-OLDoptim values are closest to observed NH values but still about one order of magnitude higher. The ELM-MYCI values are closest to observed soluble P values but more than one order of magnitude smaller. The observed NO mean concentrations are captured more accurately than NH or soluble P, with ELM-OLDoptim being closest to observations, followed by ELM-MYCIoptim, while ELM-OLD and ELM-MYCI remain within one order of magnitude of the observations (Fig. S9b). These large discrepancies call into question if these observed and simulated quantities are comparable, even after the units are nominally aligned. Like the mean concentrations, the observed and simulated trends differ substantially in magnitudes. ELM-OLD and ELM-MYCI better capture the observed qualitative transition from negative to positive trends NH towards the warmer enclosures than ELM-MYCIoptim; ELM-OLDoptim did not capture this transition for the ambient CO2 enclosures (Fig. S9d).
All the model setups overestimate the peat C and N stock in the shallow soil layers (0–30 cm; Fig. 5a, b). In the deeper layers (30–200 cm), ELM-OLD exhibits underestimation that is exacerbated in ELM-MYCI and remedied in ELM-OLDoptim and ELM-MYCIoptim (Fig. 5a, b). All model setups severely underestimate P stock below 30 cm (Fig. 5c). The total simulated soil organic C stock of all the soil layers is about 190 kg C m−2 by ELM-OLD, 240 kg C m−2 by ELM-OLDoptim, 140 kg C m−2 by ELM-MYCI, and 210 kg C m−2 by ELM-MYCIoptim. This places ELM-OLDoptim outside the observational uncertainty of the estimated 176 ± 40 kg C m−2 of the S1 bog (McFarlane et al., 2018), probably due to the overestimation in the shallow layers (Fig. 5a).
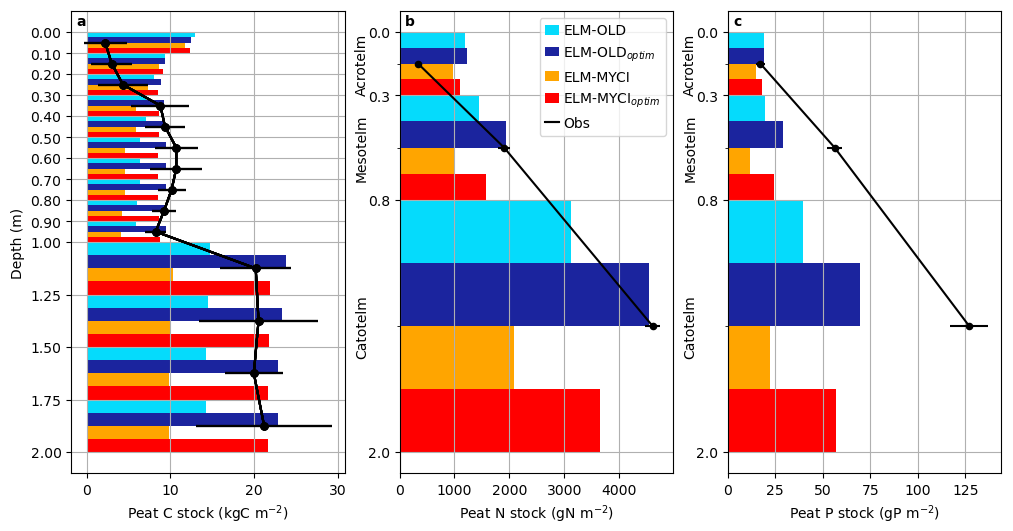
Figure 5Observed pre-treatment peat carbon, nitrogen, and phosphorus stocks and the modelled values in the ambient control plot. Error bars on the observations are the ± standard errors reported in the original studies (Griffiths et al., 2017; Salmon et al., 2021). The definitions of acrotelm, mesotelm, and catotelm are in Salmon et al. (2021).
3.2 Behaviour diagnostics of the modified model
3.2.1 Plant nutrient acquisition response to warming and soil inorganic nutrients levels
Simulation results from ELM-MYCI and ELM-MYCIoptim show that the total N acquisition from organic sources by PATHmyc,org across the three vascular PFTs are about 2.5 gN m−2 yr−1, and the total P acquisition by PATHmyc,org about 0.07 gP m−2 yr−1, in the unenclosed ambient plot (TAMB; Fig. 6). The PFT-total N acquisition by PATHmyc,org is mainly accounted by spruce (about 50 % of the total spruce N uptake, Fig. 6a) and shrub (30 %–50 % of the total shrub N uptake in TAMB, lower in the warmed enclosures, Fig. 6c). The total organic P acquisition mainly comes from tamarack (>50 % of the total tamarack P uptake; Fig. 6e). Those numbers and percentages are comparable to the coarse pretreatment estimates for the SPRUCE site, which suggests organic N sources account for about 30 % of total plants N acquisition (2.4 gN m−2 yr−1 out of 7.6 gN m−2 yr−1), and organic P sources account for a negligible fraction of total plants P acquisition (0.7 gP m−2 yr−1; Salmon et al., 2021).
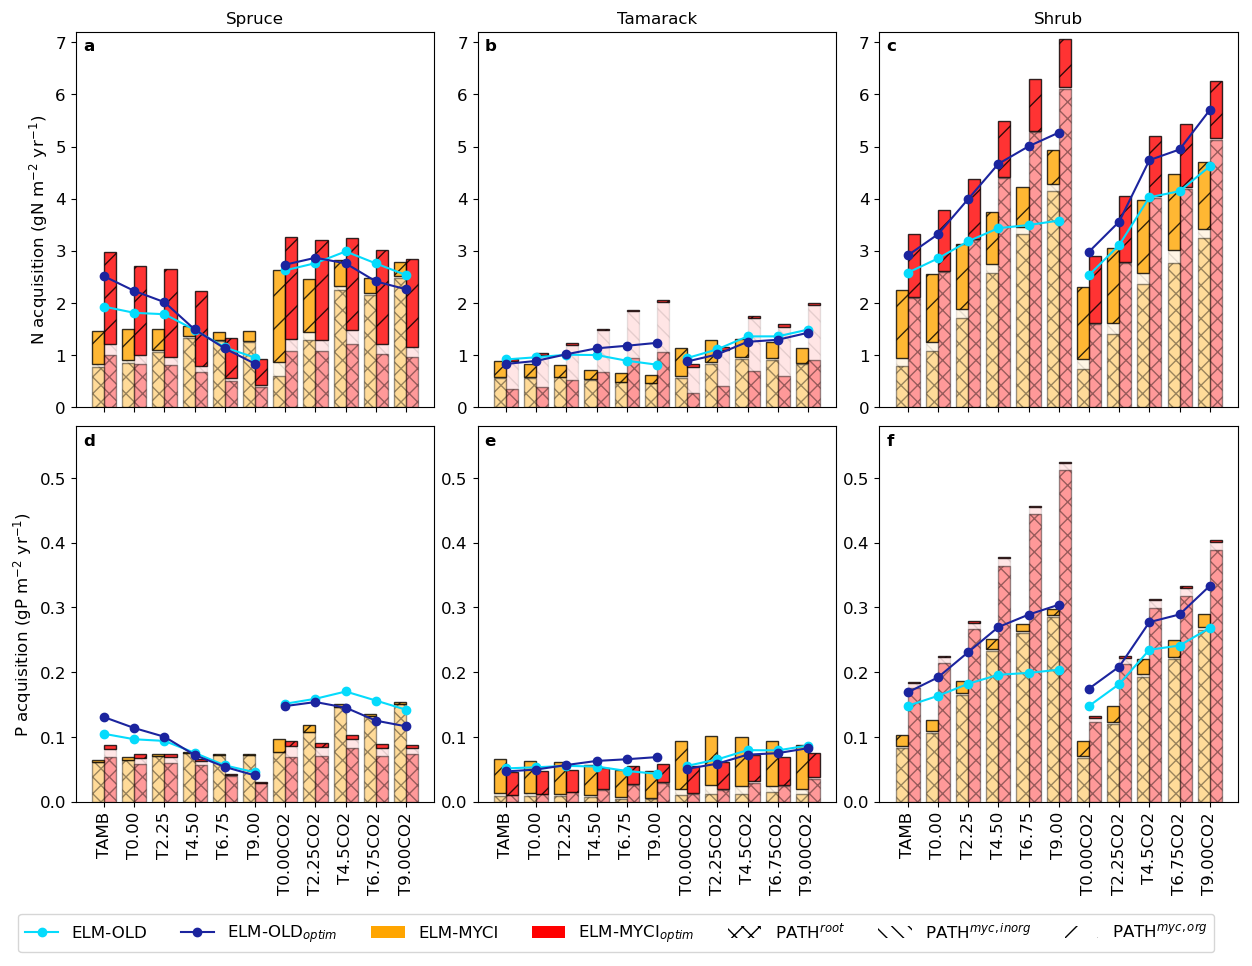
Figure 6Simulated annual mean nitrogen (N) and phosphorus (P) acquisition by the vascular PFTs in each treatment plot during 2015–2021. The acquisition is equal to inorganic nutrient uptake in ELM-OLD and ELM-OLDoptim, and equal to the sum of all three pathways (inorganic nutrient uptake by uncolonized fine roots [PATHroot], inorganic nutrient acquisition via mycorrhizal roots [PATHmyc,inorg], and nutrient acquisition from organic sources via mycorrhizal roots [PATHmyc,org]) in ELM-MYCI and ELM-MYCIoptim.
ELM-MYCI and ELM-MYCIoptim simulates higher total spruce N acquisition through all three pathways, and greater warming-induced increases in total tamarack and shrub NP acquisitions across all three pathways, than ELM-OLD and ELM-OLDoptim (Fig. 6). The low spruce P acquisition simulated by ELM-MYCIoptim, especially under elevated CO2, can explain the underestimation of AGNPPspruce by this model setup (Fig. 2a). The large increases in shrub NP acquisition are driven by PATHroot (Fig. 6c, f), consistent with declining fungal colonization rates and rising soil inorganic nutrients under warming (Figs. S9a–c, S10c).
In addition to changing the responses of plants nutrient acquisition to warming (Fig. 6), ELM-MYCI and ELM-MYCIoptim simulate more flexible responses of plants nutrient acquisition to soil inorganic nutrient contents (Fig. S11). In ELM-OLD and ELM-OLDoptim, the uptake always displays a logistic shape where they first increase with soil inorganic N or P and then plateaus. In ELM-MYCI and ELM-MYCIoptim, the total acquisition across all three pathways can show linear relationships (e.g. Fig. S11b, e, f, ELM-MYCIoptim) or logistic shapes that saturate at higher or lower levels (e.g. Fig. S11a, b, ELM-MYCI).
3.2.2 Net ecosystem exchange responses to warming
All model setups simulate a transition from C sink to C source, that is, negative to positive net ecosystem exchange (NEE), with warming (Fig. 7a). Except for the +0.00 °C elevated CO2 treatment, the C source strength is ELM-OLD > ELM-OLDoptim > ELM-MYCI > ELM-MYCIoptim. NEE is mainly driven by the balance between gross primary productivity (GPP), heterotrophic respiration (HR), and autotrophic respiration (AR), i.e. NEE ≈ − (GPP − AR − HR). All model setups simulate decreasing GPP with warming, especially in the ambient CO2 plots, while the sum of AR and HR remains relatively stable. The latter's apparent stability is due to cancellation between decreasing AR, consistent with the GPP change, and increasing HR under warming.
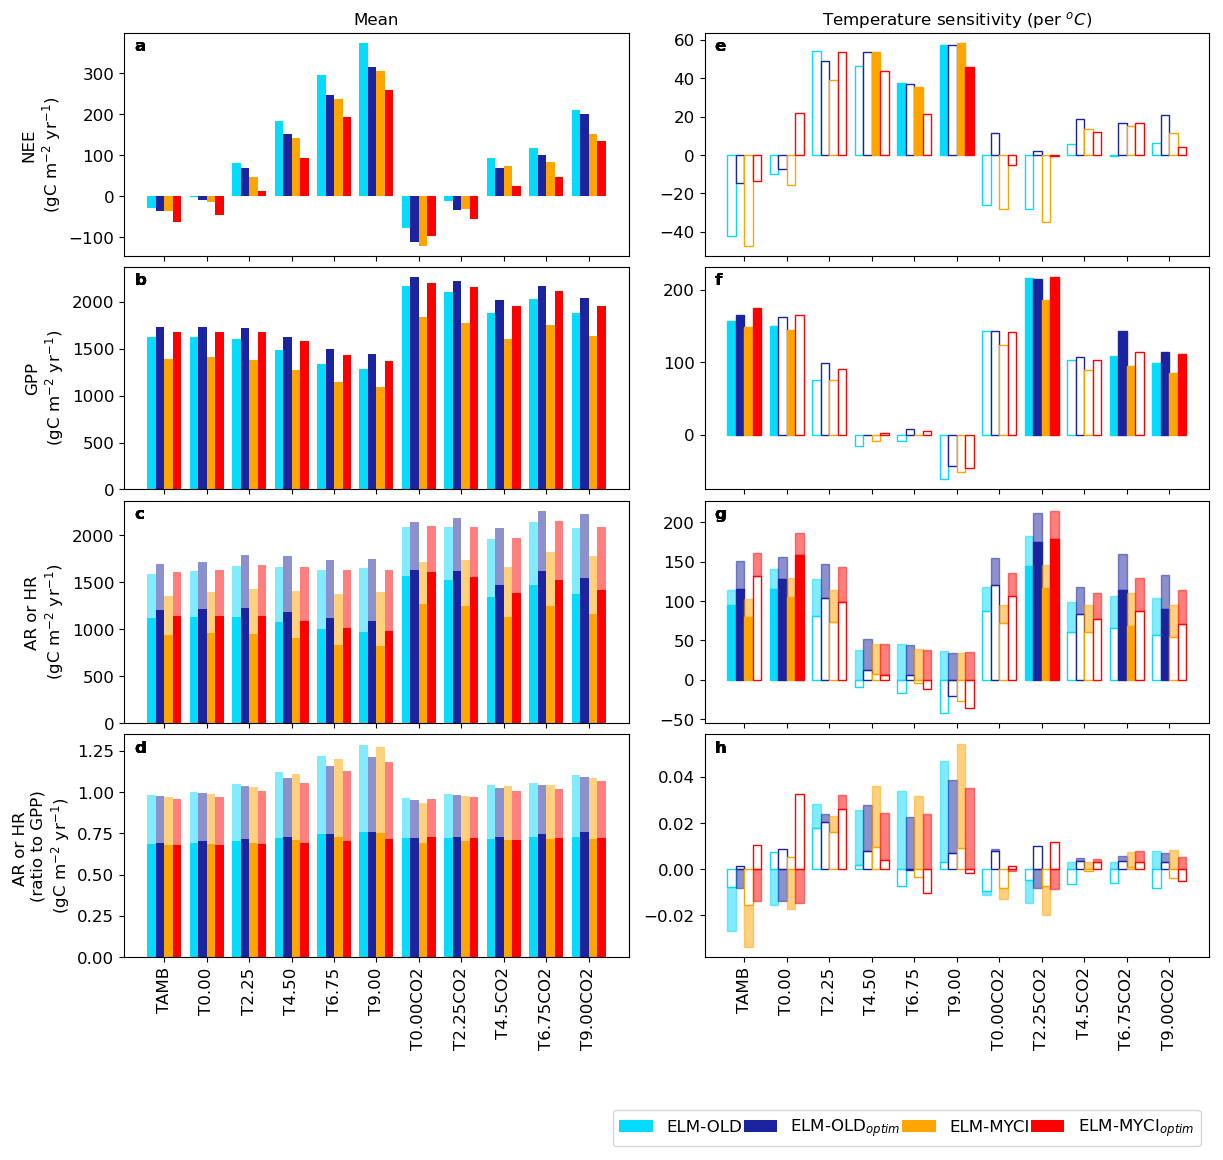
Figure 7Modelled plot-wise mean and temperature sensitivity of the net ecosystem exchange (NEE) and its balance terms: gross primary productivity (GPP), autotrophic respiration (AR), heterotrophic respiration (HR), and the ratios of AR and HR to GPP. The values for AR and HR are stacked, because the two add up to ecosystem respiration, with the darker shade being AR and the ligher shade being HR. The temperature sensitivities are calculated as linear regression slopes between the annual mean NEE, GPP, AR, HR, AR-to-GPP ratio, or HR-to-GPP ratio values against the annual mean air temperatures during 2015–2021 in each plot. The temperature sensitivities have solid bars when they are significantly different from zero at p≤0.05 (two-sided t-test), and otherwise hollow bars.
The low NEE of ELM-MYCIoptim is because it has the lowest fraction of GPP lost to AR, especially in the warmest enclosures, among all the model setups (Fig. 7c). Like ELM-MYCIoptim, ELM-MYCI has a low AR-to-GPP ratio, but its low NEE is likely driven by the low GPP per se (Fig. 7b, c). In contrast, ELM-OLDoptim has lower NEE than ELM-OLD is because of a high GPP (Fig. 7b) and a smaller fraction of GPP lost as HR (Fig. 7d). Structural modification has little effect on HR to GPP ratios (ELM-OLD vs. ELM-MYCI, ELM-OLDoptim vs. ELM-MYCIoptim; Fig. 7d). The temperature sensitivities of NEE, GPP, AR and HR are generally insignificant within individual enclosures, but exhibit consistent increasing, decreasing, or bell-shaped patterns across the enclosure warming levels in all the model setups (Fig. 7e–l).
3.2.3 Nutrient limitations on plant growth
The difference between structural modification and parameter optimization on AR-to-GPP ratios can be better understood by examining the individual components of AR (Fig. 7). In ELM, AR is the sum of excess, maintenance, and growth respiration (AR = XR + MR + GR). XR represents respiration loss due to nutrient limitation, and is calculated as an nonlinearly increasing function of the percentage of plant biomass existing as NSC (Sect. S1.1.2); MR represents respiration for maintaining regular plant metabolism and is approximately proportional to total living biomass; GR is a small and constant fraction of structural growth and therefore of low interest here (Oleson et al., 2013).
At grid level, the lower fraction of GPP lost as AR in the structurally modified model setups than their unmodified counterparts (Fig. 7c) is mainly driven by lower XR-to-GPP ratios, especially under warming (ELM-MYCIoptim vs. ELM-OLDoptim, ELM-MYCI vs. ELM-OLD; Fig. 8a). Interestingly, parameter optimization induces large decreases in the MR-to-GPP ratio that are offset by large increases in the XR-to-GPP ratio (ELM-OLD and ELM-MYCI vs. ELM-OLDoptim and ELM-MYCIoptim), resulting in small net changes (Fig. 8a). This “trade-off” between XR and MR can be explained by their implicit relationship. At a higher XR-to-GPP ratio, the higher nutrient limitation prevents GPP from being assimilated into structural growth, leading to lower biomass-to-GPP ratio and therefore lower MR-to-GPP ratio. By the same logic, lower XR-to-GPP ratio implies a higher biomass-to-GPP ratio, and therefore higher MR-to-GPP ratio.
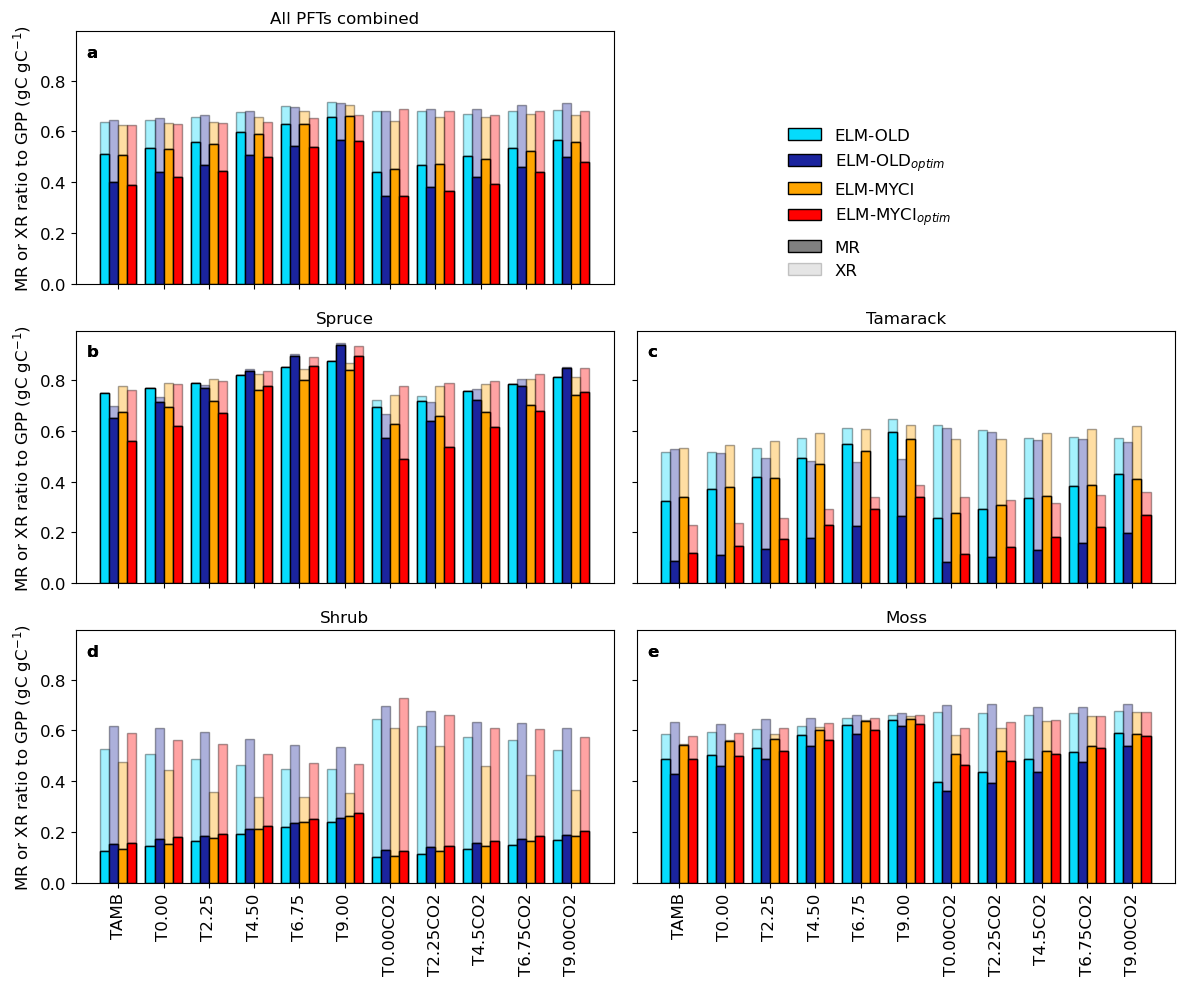
Figure 8Partitioning of excess respiration (XR) and maintenance respiration (MR) parts of autotrophic respiration relative to gross primary productivity (GPP) for all PFTs combined or individual PFTs. The ratios are calculated by dividing the 2015–2021 averages of the PFT-total or PFT-specific terms. XR contributions are stacked on top of MR contributions, so the total bar height reflect how much of the GPP flux is offset by total XR + MR.
Compared to the grid-level ratios, structural modification has strong effects on the ratios calculated between PFT-specific XR, MR, and GPP. For spruce, ELM-MYCI and ELM-MYCIoptim have much higher XR-to-GPP ratio and lower MR-to-GPP ratio than ELM-OLD and ELM-OLDoptim, especially in the colder enclosures (Fig. 8b), which indicates a XR-MR trade-off similar to observed at grid level. For tamarack, ELM-MYCIoptim has much lower XR-to-GPP ratio than ELM-OLDoptim in all the enclosures (Fig. 8c). For shrub, ELM-MYCI and ELM-MYCIoptim have much lower XR-to-GPP ratio than ELM-OLD and ELM-OLDoptim in the warmest enclosures (Fig. 8d). As such, spruce and shrub are likely the main drivers behind the more rapid decline of the grid-level XR-to-GPP ratio in the structurally modified models than ELM-OLD or ELM-OLDoptim (Fig. 8a). The weaker XR-MR trade-off in tamarack and shrub likely reflects the lower importance of MR in the two PFTs compared to spruce.
3.2.4 Nutrient limitations on heterotrophic respiration
Nutrient limitation of HR occurs in the default and modified models when the available soil inorganic N or P cannot satisfy the total demand of the plants and immobilization demand from soil litter and organic matter decomposition (Eq. S4, Sect. S1.1.3). The immobilization demand arises mainly in the decomposition step from plant litter to SOM (Oleson et al., 2013; Schimel and Bennett, 2004). The C : N and C : P in the plant litter pool depend on litter inputs and are usually higher than the C : N and C : P of the downstream SOM pools, which are fixed parameters (Oleson et al., 2013). As a result, the process immobilizes additional soil inorganic NP to meet the C : N and C : P of the SOM pools. Because ELM-MYCI and ELM-MYCIoptim allow plants to access the NP in plant litter pools via mycorrhizal roots (Sect. 2.2), the C : N and C : P the litter pools increase, resulting in greater immobilization demand per unit decomposition, which is proportional to HR. Consistent with this expectation, for each unit of HR, the corresponding actual immobilized inorganic N in ELM-MYCI and ELM-MYCIoptim are higher than in ELM-OLDoptim and ELM-OLD at the same level of HR (Fig. S12a). The same effect is not seen in P (Fig. S12b). Instead, ELM-OLDoptim exhibits considerably higher P-immobilization per unit HR than the other three model setups. All the model setups exhibit sensitivity to warming, which suggests P-limitation on HR is more affected by litter quality changes created by relative changes in primary productivity among the PFTs than N-limitation on HR (Fig. 2).
3.3 Parameter sensitivity analysis
3.3.1 Constraint of model parameters
The distance metric (Sect. 2.7.2) shows the top-performing 1 % parameter values are statistically significantly closer to each other (smaller distances) than to the remaining 99 % parameter values (larger distances) in all three ensemble simulations (Table 2, Fig. 9). The significant separation means the C fluxes can constrain the preexisting and newly added parameters. The distances are least well-separated for ELM-MYCI_ENS (Fig. 9b), which uses the same un-optimized parameters as ELM-OLD for the unchanged model processes. Those suboptimal parameter values may have caused biases that the new model processes cannot compensate for, leading to unstable optimized values in the new parameters in the ELM-MYCI_ENS simulations.
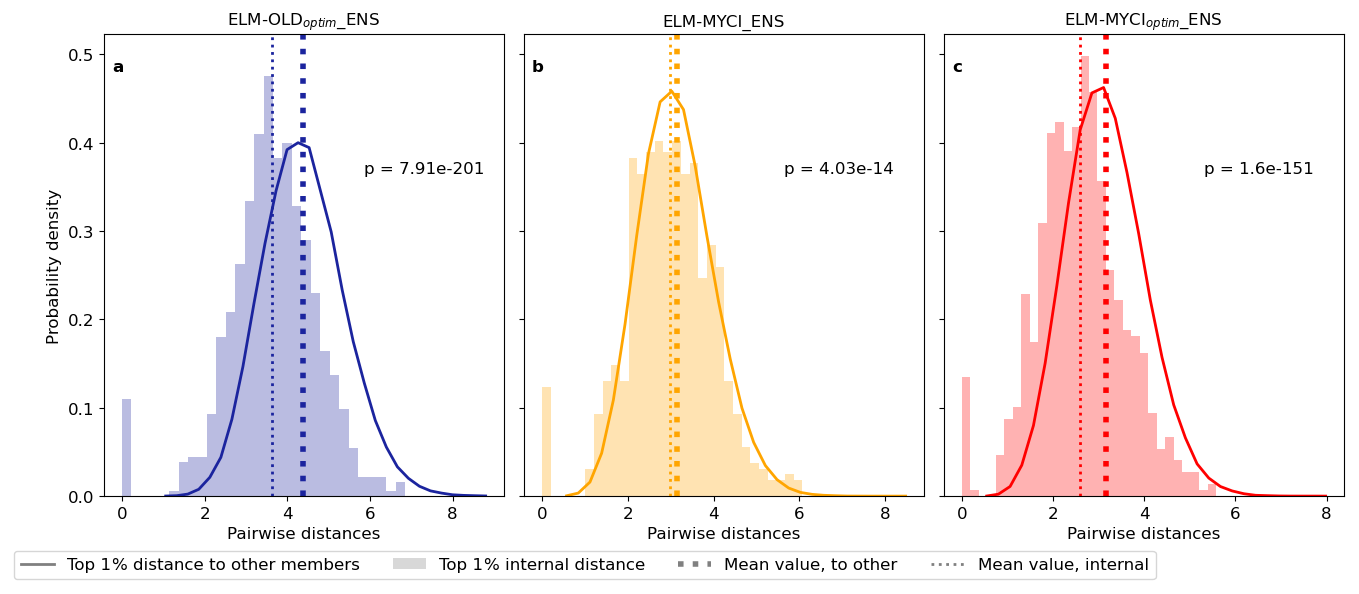
Figure 9Probability density distributions of the Euclidean distances between the parameter values of two groups of pairs of ensemble members: between the best-performing 1 % members (shaded bars), and between the best-performing 1 % members and the other 99 % members (solid line). Displayed probability densities are pooled from all pairs in each group. The p-values in each panel indicate whether the two groups are significantly different, using two-sided t-test for the mean values of two independent samples.
3.3.2 Sensitivity of model outputs to parameter values
We show the parameter sensitivities of ELM-MYCIoptim_ENS in the main text (Fig. 10), since the finding of Sect. 3.3.1 suggests this may be a more reliable perturbed parameter ensemble than ELM-MYCI_ENS (Fig. S11), and the sensitivities of preexisting parameters (Fig. S12) are similar to the well-reported findings of past studies (Meng et al., 2021; Ricciuto et al., 2018).
The relative sensitivity of model outputs to each parameter is approximately the same whether assessed using total effects or main effects (compare the rows in Fig. 10). The grid total GPP is sensitive to the parameters of all three vascular plants and grid-level parameters (topmost bar in each panel of Fig. 10). The grid total NEE and vegetation C (TOTVEGC) are most sensitive to spruce parameters, especially the sensitivity of fungal colonization rate to soil inorganic N (bj, Eq. S12) and maximum rate of inorganic N acquisition via mycorrhizal association (, Eq. S23). The grid total HR and total soil organic C (TOTSOMC) are most sensitive to shrub parameters, especially the maximum rate of N uptake via fine root (, Eq. S33). The C variables in any vascular PFT are mainly determined by the parameters specific to that PFT, especially the maximum uptake/acquisition rates of NP ( and for spruce (Eq. S17), for tamarack (Eq. S33), and for shrub (Eq. S33)). Moss C variables are sensitive to the parameters of all three vascular plants and grid-level parameters.
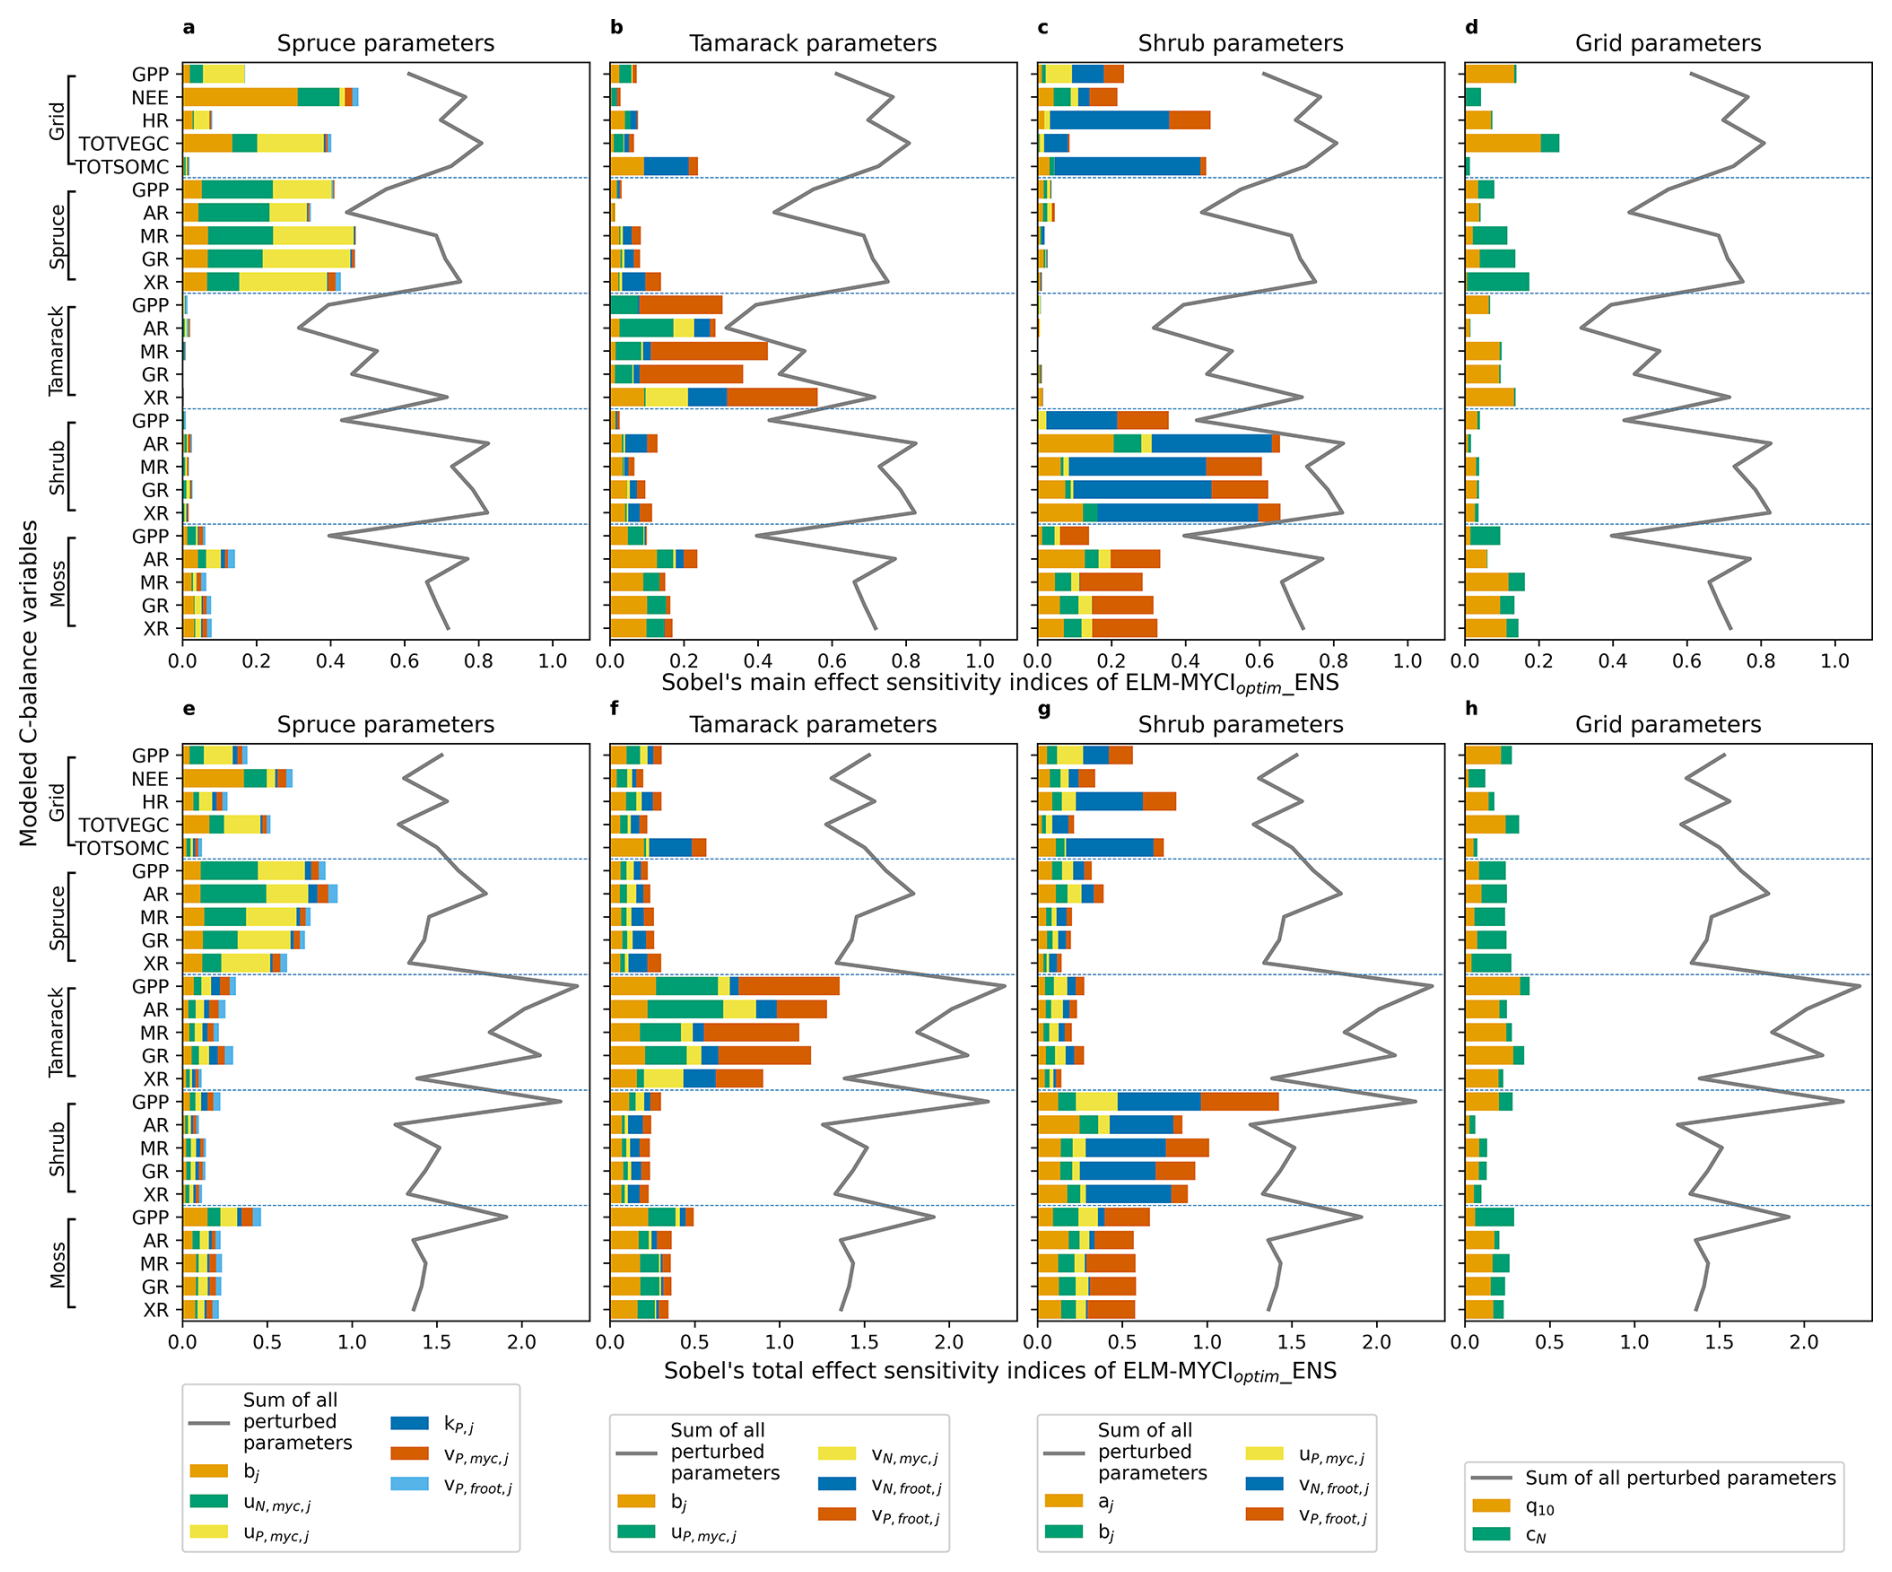
Figure 10Sobol's main-effect and total-effect sensitivity indices of selected C-balance variables to the newly added model parameters, calculated from ELM-MYCIoptim_ENS. For better display, the indices are partitioned into subpanels according to whether it is a PFT-specific or column-level parameter. Stacking the bars across the four panels in each row gives the sum of the main or total effects over all the perturbed parameters, which are also displayed as a grey line for reference in each panel. The C-balance variables in each panel are grouped according to whether it is a column-level, spruce, tamarack, shrub, or moss variable. Parameter definitions can be found in Table 1 and equations referred therein.
Compared to ELM-MYCIoptim_ENS, the sensitivities derived from ELM-MYCI_ENS are similar for tamarack and shrub parameters (Figs. 10b, c, f, g, S11b, c, f, g). For spruce parameters, the model outputs of ELM-MYCI_ENS are more sensitive to the fungal colonization rate to soil inorganic N (bj, Eq. S12 and Fig. S11a, e), whereas ELM-MYCIoptim_ENS are more sensitive to the maximum organic NP acquisition rates via mycorrhizal association ( and for spruce, (Eq. S17; Fig. 10a, e). Still, the two sets of parameters fulfil similar functions, with the former controlling all the nutrient uptake/acquisition pathways (see Mmyc,j in Eqs. S17, S23, and S33) and the latter only controlling the organic pathway (Eq. S17). For column level parameters, ELM-MYCI_ENS is mainly sensitive to the Q10 of NP acquisition rates (q10, Eq. S13) and has little sensitivity to the C cost of mycorrhizal nutrients acquisition to the plant (cN, Eqs. S25, S30) (Fig. S11d, h). ELM-MYCIoptim_ENS exhibits the same contrast, albeit less strongly (Fig. 10d, h).
Comparing between the newly added (Figs. 10, S11) and preexisting parameters (Fig. S12), one can see the newly added parameters exhibit more inter-PFT interactions. That is, the C variables of each PFT are even more strongly determined by the parameters specific to that PFT in ELM-OLDoptim_ENS (Fig. S12a, b, c, e, f, g) than in ELM-MYCIoptim_ENS (Fig. 10a, b, c, e, f, g) or ELM-MYCI_ENS (Fig. S11a, b, c, e, f, g). Additionally, the grid-level C variables are mainly responsive to spruce parameters in ELM-OLDoptim_ENS (Fig. S12a, e), compared to both spruce and shrub parameters in ELM-MYCIoptim_ENS (Fig. 10a, c, e, g) and ELM-MYCI_ENS (Fig. S11a, c, e, g). Moss C variables are more responsive to spruce parameters in ELM-OLDoptim_ENS (Fig. S12a, e), compared to shrub parameters in ELM-MYCIoptim_ENS (Fig. 10c, g) and ELM-MYCI_ENS (Fig. S11c, g). The main and total effects of ELM-OLDoptim_ENS are close to 1 when summed over all the parameters (Fig. S12 grey lines), while the main effects of ELM-MYCI_ENS and ELM-MYCIoptim-ENS are much smaller than 1 and the total effect much greater than 1 (Figs. 10, S11, grey lines). The larger difference between total and main effects in the modified models means the newly added parameters have stronger statistical interactions than the preexisting parameters in the default model.
4.1 Summary of evaluation performance and remaining gaps
We present a development of the ELMv2-SPRUCE model to replace the photosynthesis-driven, inorganic-only plant nutrient uptake with three pathways that consider influences from fine root biomass, fungi-colonization level, and plant access to organic nutrients through fungi-colonized roots (Sect. S1.1). Although EcM and ErM are only implicitly represented and simplifications are made in the treatment of the C cost of mycorrhizal acquisition and the organic NP sources (Sects. 2.2, S1.1.8 and S1.1.9), the modified model shows improved performance. Compared to parameter optimization only (ELM-OLDoptim), structural modification (ELM-MYCIoptim) leads to lower RAE and RMSE on vegetation C fluxes, especially in the shrub-moss community (Figs. 2, 3), improved LAI in two out of the three modified PFTs (Fig. S8), improved qualitative similarity to resin-exchange nutrients (Fig. 4), and similar performance on soil total C-N-P stocks (Fig. 5). Interestingly, structural modification imposed on unoptimized preexisting parameters (ELM-MYCI) does not improve RAE (Fig. 2) and the new parameters appear ill-constrained (Fig. 9b). These findings indicate the biases in ELM-OLD arise from both incorrect parameter values and inadequate process representation (Bastrikov et al., 2018). The strong performance of ELM-MYCIoptim, after optimizing newly-added parameters on top of pre-optimized preexisting parameters, supports stepwise calibration as a viable strategy for land surface models when the parameter search space is large (Ma et al., 2024).
One notable finding is that ELM-MYCIoptim captures the observed large positive warming response of AGNPPshrub better than the parameter-optimized default model (ELM-OLDoptim; Figs. 2b, 3c). This increasing growth is accompanied by rising NP uptake via PATHroot and unchanging NP acquisition from organic sources via PATHmyc,org (Fig. 6c), consistent with our initial hypothesis and previous finding at the Mer Bleue peatland site (Shao et al., 2023b) that declining dependence on ErM drives shrub growth under warming. Recent analysis of minirhizotron data at the SPRUCE site shows increasing specific root length for the shrubs with deeper water tables as a consequence of warming (Weber et al., 2025a, b). This shift towards more acquisitive fine root trait (Bergmann et al., 2020; Weber et al., 2025a, b) is not yet considered in the current study and might partially explain the remaining underestimation in the temperature sensitivity of AGNPPshrub. The simulated high importance of direct fine root uptake in shrubs at the SPRUCE site differs from the simulated > 90 % dependence on fungal-mined organic N for shrubs at Mer Bleue (Shao et al., 2023b). This wide range is comparable to past observations (Hilman et al., 2024; Hobbie and Hobbie, 2006; Yin et al., 2022) and might reflect inter-site difference, wherein SPRUCE is a more southern site with lower shrub fractional cover and higher porewater inorganic N compared to Mer Bleue (Kennedy et al., 2018; Shao et al., 2023b).
ELM-MYCIoptim more severely underestimates mean AGNPPspruce than the other model setups (Fig. 2a), likely because it simulates stronger P limitation on spruce (Fig. 6d). The stronger P limitation, in turn, may be because the modelled peat P stock and soil inorganic P levels are generally too low (Figs. 5c, S7c). With the enhanced shrub growth in ELM-MYCIoptim, the remaining inorganic P becomes insufficient to support spruce growth (Fig. 2a). All model setups underestimate mean AGNPPspruce in the ambient CO2 plots, fail to capture the reversal from negative to positive response to warming over time (Fig. 3a), and fail to capture the observed lack of response to elevated CO2 (Fig. 2a). Those biases might be related to seasonal variations and acclimation in spruce photosynthetic parameters (Dusenge et al., 2024; Jensen et al., 2019), gradual acclimation in tree respiration or hydraulics (Hanson et al., 2025), delayed response to elevated CO2 or increased C allocation belowground (e.g. to roots, mycorrhizal fungi, or exudates; Duchesneau et al., 2024a; Norby et al., 2010, 2024; Palmroth et al., 2006). Addressing them will require future process developments.
The severe underestimation of the temperature sensitivity of BGNPPtreeshrub in all model setups (Fig. 2b) may be due to high uncertainty in the ingrowth core observations or the presence of dynamic above-to-belowground allocation in response to warming (Drewniak, 2019; Rehschuh et al., 2022). Dynamic allocation is not yet in the model processes of ELM-OLD or ELM-MYCI. Note the ingrowth core observations used in Fig. 2 only span 2016–2017, while the other evaluation variables span 2016–2019 and 2021 (Hanson et al., 2020a). The uncertainty problem will be remedied as additional years of ingrowth core and minirhizotron observations are completed for the SPRUCE site. The initial ingrowth core observations do suggest the fine root biomass of the trees and shrub are more sensitive to warming than their aboveground NPP (compare the fine root biomass reported in Fig. S1 of Malhotra et al. (2020a) to the observed aboveground NPP values this paper Fig. S7).
The persistent bias in NPPmoss and its temperature sensitivity is unsurprising. ELMv2-SPRUCE cannot yet simulate the decline of moss growth with warming (Norby et al., 2019), instead depending on assigned observed fractional covers (Sect. 2.4). Missing processes may include shading from shrub, inaccurate photosynthesis-water relations, and microbial relationships (Carrell et al., 2019; Norby et al., 2019; Petro et al., 2023; Shi et al., 2021). The persistent bias in vertical distribution of peat C and N may be due to insufficient vertical mixing of the soil decomposition pools (Oleson et al., 2013). The persistent bias in HR and peat P stock might be due to inaccurate C : P in the SOM pools (Figs. 2b, 5), and the current lack of consideration of fungal respiration (Sect. S1.1.7). Because the HR-to-GPP ratio is remarkably invariant to our current structural modification (Fig. 7), focused parameter investigation and structural modification on the soil decomposition model may be needed to address the HR bias.
The discrepancy between observed and modelled porewater concentrations (Fig. S9) suggests the values are not directly comparable, which may be due to missing process representation of the adsorption of NH to inorganic and organic matter surfaces (Eick et al., 1999; Matschonat and Matzner, 1996), inaccurate partitioning between labile P and soluble P (Yang et al., 2023), and underestimation of peat P stock (Fig. 5). Better matches between the temperature sensitivities of normalized model NP mineralization and normalized resin-available NH and PO (Fig. 4) suggest the model is better at capturing relative changes in plant nutrient availability than absolute sizes.
4.2 Impact on ecosystem productivity
We found that parameter optimization reduces the strength of NEE increase under warming (Fig. 7a) via higher GPP and lower HR (Fig. 7b). The GPP effect is likely explained by the dominant control of the photosynthetic parameter “flnr” (fraction of leaf N in in Rubisco enzyme) on grid- and PFT-level C balances in ELM-OLDoptim_ENS, and the HR effect likely by the parameter “q10_hr” (Q10 for heterotrophic respiration; Fig. S14). Interestingly, the overall NEE balance is most strongly affected by the Q10 parameter of spruce MR (Fig. S14), despite this parameter having little effect on the other C-balance terms (Fig. S14) – this might be a case of emergent phenomena (Brient, 2020; Wang et al., 2022) and worth future modelling and empirical investigations.
Structural modification reduces the extent of NEE increases under warming (Fig. 7a) via lower AR (Fig. 7c), which is driven by decreases in XR with warming (Fig. 8a), especially in spruce and shrub (Fig. 8b, d). The XR-MR trade-off at grid-level and in spruce (Sect. 3.2.3) mitigates the XR-driven decreases in AR, demonstrating a case of nonlinear feedback. The greater declines in XR in ELM-MYCI and ELM-MYCIoptim compared to ELM-OLD and ELM-OLDoptim are directly due to declines in NSC (Sect. S1.1.2), which is in turn likely due to reduced nutrient limitation (Fig. 6a, c, d, f) under warming. Although NSC is additionally affected by the C cost of the mycorrhizal pathways (Sect. S1.1.8), the C cost should decrease with warming as the importance of the mycorrhizal pathways decline (Fig. 6a, c, d, f). Therefore, this mechanism cannot explain the simulated NSC decline with warming. The lower nutrient limitation under warming implies greater increase of plant carbon use efficiency (CUE), especially for the shrub PFT where most of AR is due to XR (Fig. 8d). This modelling result is consistent with empirical evidence that EcM-tree association is key to explaining the negative correlation between CUE and latitude in northern boreal regions (Mäkelä et al., 2022). This consistency supports the effectiveness of our implicit approach as a parameter-efficient framework. Biologically, the CUE-latitude correlation is driven by complex interactions between plant C flow to mycorrhizal colonization level, and nutrient availability (Mäkelä et al., 2022; Shao et al., 2023b).
In the structurally modified model setups, SOM decomposition becomes more N-limited because of the acquisition of N from plant litter pools via PATHmyc,org (Fig. S12, Sect. S1.1.9). Surprisingly, the higher N-immobilization per unit HR only corresponds to slightly lower mean HR in ELM-MYCI and ELM-MYCIoptim (Figs. 2b, d, 7d, h), meaning the lower availability of organic N in plant litter pools are offset by higher inorganic N uptake. This pattern suggests that decomposition suppression through nutrient competition – classically termed the Gadgil effect when mediated by EcM fungi (Fernandez and Kennedy, 2016) – may be limited in strength under our simulated conditions. Although our model does not explicitly represent fungal guild interactions, the modest reduction in decomposition is consistent with studies showing that such effects are highly context-dependent and often confounded by litter quality, niche partitioning among EcM, ErM, and saprotrophs, and priming processes (Fanin et al., 2022; Mielke, 2022; Shao et al., 2023a). P-limitation on immobilization appears to be controlled by more complex factors than N-limitation (Fig. S12b) and may be affected by current model bias in peat P stock (Fig. 5). Additionally, soil decomposition process in ELMv2-SPRUCE do not explicitly simulate microbial biomass and guilds, and therefore might misrepresent the partitioning of immobilization demand between the external nutrient uptake and the cycled nutrient between dead and live microbial biomass, which is especially important for P (Duchesneau et al., 2024a; Schmidt et al., 1997). Given this limitation in the ELMv2-SPRUCE soil decomposition model and current model limitation in treating organic NP sources (Sect. S1.1.9), the HR results should be interpreted with caution.
4.3 Limitations, Uncertainties, and Future directions
4.3.1 Limitations of the ELM-MYCI equations
In ELM-MYCI, the partitioning of plant nutrient demand between non-mycorrhizal and mycorrhizal pathways is a linear function of soil inorganic N concentration (Eq. 1). The focus on N is likely acceptable for northern boreal regions, where plant growth is N limited or co-limited by N and P, but extending the model into temperate or tropical regions will require considering P limitation (Du et al., 2020). A second question is whether the covariate, soil inorganic nutrient concentration (Eq. 1), is simplistic and should be replaced with plant nutrient status. Plant exudates and phytohormones play a large role in the early establishment of EcM and AM, making plant nutrient status a mechanistically defensible choice (Garcia et al., 2015), but this mechanism is much less established in ErM (Genre et al., 2020). EcM colonization may also respond to soil inorganic N directly, because assimilating inorganic N is more C-expensive than assimilating organic N (Garcia et al., 2015). Therefore, the relative appropriateness of the two covariates will be best determined via multi-site, multi-PFT simulations across N and P gradients. The current ELM-MYCI equations already have two terms related to plant nutrient status: the N-limitation and NSC availability multipliers (Eqs. 3–4). Therefore, to implicitly encode an effect on colonization rate, one can simply let the parameter value in the N-limitation multiplier (Eq. S15) differ between PATHroot and the two mycorrhizal pathways.
The current formulation for PATHmyc,org makes a few significant simplifications that do not conform to real world processes (Sect. 2.3). The restriction of mycorrhizal organic NP acquisition to plant litter pools may underestimate total mycorrhizal organic NP acquisition. This, in turn, could lead to underestimation of mineral NP limitation on HR and overestimation of the NP limitation on plant growth, contributing to the biases shown in Fig. 2. The acquisition rate does not vary with soil organic NP content or the recalcitrance of the accessed plant litter pools (Eq. 4), and the upper bound (0.0001 ⋅ total plant litter pool size per hourly time step) is more a sanity constraint rather than a realistic upper bound on fungi-accessible organic matter. This may result in underestimation of the changes in acquisition rates across environmental gradients. In reality, mycorrhizal nutrient acquisition involves two sequential steps: depolymerization followed by uptake of small organic molecules for N (Talbot and Treseder, 2010), and enzymatic hydrolysis and uptake of released phosphate for P (Plassard et al., 2011). Each step is describable by Michaelis-Menten kinetics (Näsholm et al., 2009; Plassard et al., 2011). In the organic matter-rich peatland environment, the first step would be much more limited by fungal enzyme availability than substrate availability, making a colonization-proportional formulation (Eq. 4) acceptable. Extending the model to mineral soil environments will require revisiting the formulation. Although the rate of the first step may be higher for labile than recalcitrant organic matter (Talbot and Treseder, 2010), current understanding of mycorrhizal enzyme activity is largely from a biochemical perspective, i.e. characterizing individual compounds, rather than from an ecological perspective, i.e. classifying numerous compounds into measurable fractions that significantly differ in rates (Lavallee et al., 2020; Oleson et al., 2013). Therefore, the current even distribution of organic NP acquisition across the plant litter pools, proportional only to pool sizes, serves as a starting point that can be refined as ecological-scale data become available. Modelling the second step in Michaelis-Menten form would require explicit representation of the turnover of mono- and oligomeric fractions of organic N pools, or of soluble P pools in microsites, which are beyond the scope of this study.
The total mycorrhizal acquisition of inorganic and organic NP is capped by 50 % of net photosynthesis per time step (Sect. 2.3). In the real world, belowground C allocation to mycorrhizal fungi peaks later in the growing season than aboveground photosynthesis (Högberg et al., 2010). Therefore, the current model formulation may underestimate mycorrhizal NP acquisition later in the growing season. In principle, this could lead to underestimated NP limitation on the heterotrophic microbes later in the growing season and overestimated NP limitation during leaf expansion in the following spring. The practical effect in the current ELMv2-SPRUCE, however, may be minor. The model also does not yet separate heterotrophic microbes and mycorrhizal fungi in soil decomposition. The model also uses fixed C : N : P ratios for plant structural tissues, and always evaluates nutrient limitation based on concurrent soil nutrient availability rather than nonstructural nutrient storage pool sizes.
4.3.2 Uncertainty of the ELM-MYCI parameters and potential constraints
The new equations in ELM-MYCI introduces a fairly large number of new parameters (in total 37 in Tables S4 and 1) compared to ELM-OLD. Although the annual C fluxes demonstrated ability to constrain these parameters (Fig. 9), the ability may have benefited from the temperature gradient, with implied inorganic nutrient gradient, across the SPRUCE treatments. Extending ELM-MYCI to other sites will therefore require more direct constraints.
The highest priority should be given to uptake rate constants (, , ) and half-saturation points () because of the high sensitivity of model outputs to these parameters (Sect. 3.3.2). Many experimental measurements of these parameter exist, but the data points are concentrated in temperate regions and crop species, and exhibit high cross-species uncertainty (Craig et al., 2025; Griffiths and York, 2020; Tables S5–S6). Therefore, these data points are likely useful for large-scale simulations, but less so for site-scale simulations involving only a few species or simulations targeting underrepresented ecosystems like peatlands. In those cases, total plant NP uptakes, estimated from paired NPP and whole-plant C : N and C : P measurements, provide a reasonable nutrient-centred constraint. The efficiency of the parameter search can be increased in future studies by constraining the search space with well-validated qualitative findings in experimental data – for example, mycorrhizal roots generally have higher rate constants for inorganic NP on a per unit fine root biomass basis than uncolonized roots (Craig et al., 2025; Plassard and Dell, 2010).
Other large sources of uncertainty in the modified model include the fungal colonization fractions (Fig. S10), relative contributions of different pathways to total plant NP acquisition (Fig. 8), and the transfer of plant C to mycorrhizal fungi (Sect. S1.1.8). EcM colonization is known to respond to large temperature, water, and nutrient gradients and covary with fine root traits (Ostonen et al., 2011, 2017; Xie et al., 2021). Stable isotope fractionation studies (δ15N, δ13C) provide the most direct constraint on mycorrhizal contribution to plant demand and plant C allocation to mycorrhizal fungi (Hawkins et al., 2023; Hilman et al., 2024; Hobbie and Hobbie, 2006; Yin et al., 2022). Observations of all these quantities vary between 0 %–100 % (Hawkins et al., 2023; Hilman et al., 2024; Hobbie and Hobbie, 2006; Ostonen et al., 2011, 2017; Xie et al., 2021; Yin et al., 2022) and root tip counts at SPRUCE corroborate the high uncertainty (Fig. S10). Therefore, multi-site model-data integration will be needed to capture the broad pattern and prevent overfitting.
Root morphology parameters come from measurements in this study (root diameter – rj and root tissue density – ρj in Table S5). These two traits belong to, respectively, the collaboration and conservation gradients in the root economics space, and both are correlated with other traits (Bergmann et al., 2020; Craig et al., 2025). Thinner roots tend to depend less on fungal partners and have higher uptake rate constants. Lower root density tends to be associated with higher root N content, turnover rates, uptake rate constants, yet higher half-saturation points. These qualitative understandings, along with global root trait observations from, e.g. the Fine-Root Ecology Databases (Iversen et al., 2021a), provide good constraints for ELM-MYCI in future multi-site or regional extensions.
4.3.3 Other potential future work
Several process developments in ELM are being carried out during the same time as this work, including division of fine root biomass into transport, absorption, and mycorrhizal pools (Wang et al., 2023), nutrient-responsive dynamic above-belowground allocation (Knox et al., 2024), and explicit microbial biomass pools and dissolved organic matter dynamics (Ricciuto et al., 2021). These developments can be merged with this work to relax many of the assumptions listed in Sect. 4.3.1 and improve the model results. Explicit simulation of fungal and heterotrophic microbial biomass will enable separating mycorrhizal fungal from non-mycorrhizal respiration and the modelling of fungal necromass, which has different decomposability from saprotrophic residues due to higher melanin content, particularly in ErM fungi (Fernandez et al., 2019). Other efforts of interest may include separating the behaviours of EcM and ErM, spruce photosynthesis and MR, Sphagnum growth, and considering direct plant uptake of small organic N molecules (Näsholm et al., 2009). Nonetheless, process-development should consider the limited constraint available from empirical observations (Fig. 9) and ensure the complexity is commensurate with our ability to check model accuracy and interpret cause and effect in model responses.
The modified ELMv2-SPRUCE has extended capabilities compared to the default model, e.g. fine tune nutrients competition relationships between PFTs using the maximum uptake/acquisition rates and half-saturation parameters (Tables S4–S5), assimilating nutrient uptake kinetics data, and testing the ecosystem impacts of changing fine root traits. Those improvements will enable new hypothesis testing and more accurate modelling of peatland C, N, and P cycling. It will also be interesting to compare the modified ELMv2-SPRUCE with other models that use similar fine root-based uptake rules (Knox et al., 2024; Zhu et al., 2019) and/or have mycorrhizal representations (He et al., 2018; Shao et al., 2023b; Sulman et al., 2019), and to test the performance of the model at multi-site to regional scale and its implications for carbon cycle feedbacks to the climate system.
We present a development on the ELMv2-SPRUCE model to replace default, photosynthesis-driven nutrient uptake processes with fine root and implicit mycorrhizal pathways, allowing more realistic processes like the access to organic nutrients by mycorrhizal roots and the dependence of plant nutrient uptake on fine root biomass, fungi colonization level, and environmental conditions. The modified ELMv2-SPRUCE model better captures the observed large increase in shrub growth under whole ecosystem warming than the default model, as well as overall measured C fluxes and resin-exchange nutrients response to warming. The modelled increase in shrub growth is accompanied by stable fungi-mediated nutrient acquisition from organic matter, and several fold increase in direct fine root inorganic uptake, supporting our initial hypothesis that the observed increase in shrub growth is driven by a shift from mycorrhizal outsourcing to direct fine root uptake strategy. Non-validated comparisons to the default model show the modified model simulates less nutrient limitation on plant growth under warming, resulting in weaker C-sink to C-source transition, and more flexible relationships between plant nutrient acquisition and soil inorganic nutrient concentrations. Outstanding model biases and caveats indicate needs to improve non-mycorrhizal processes for spruce and Sphagnum moss growth, and above-to-belowground allocation. Other future developments may add or refine representation fine root trait responses to warming, more realistic organic nutrient access, shifts in allocation, and mycorrhizal fungal biomass turnover. Overall, the new model is a useful tool for model-data integration, hypothesis testing in ecosystem carbon-nitrogen-phosphorus cycling, and investigating boreal peatland responses to environmental change.
The ELM-OLD and ELM-MYCI source codes used to conduct all simulations in this study are available at https://doi.org/10.5281/zenodo.17582789 (Wang and Ricciuto, 2025). The main branch of the E3SM model is at https://github.com/E3SM-Project/E3SM (last access: 26 June 2026) and https://doi.org/10.11578/E3SM/dc.20240930.1 (E3SM Project, 2024). ELM simulations must be conducted as land-only simulations in the E3SM framework, and the documentation for conducting such simulations are available at https://docs.e3sm.org/E3SM/ELM/user-guide (last access: 26 June 2026). All the accelerated spin-up simulations in this study used the ICB1850CNRDCTCBC compset. All the normal spin-up simulations in this study used the ICB20TRCNPRDCTCBC compset. All the transient and treatment simulations in this study used the ICB20TRCNPRDCTCBC compset. The analysis and plotting codes are available at https://doi.org/10.5281/zenodo.17584835 (Wang, 2026).
The list of input and evaluation data used by this study is as follows:
-
Environmental forcings: https://doi.org/10.3334/CDIAC/spruce.032 (Hanson et al., 2016b)
-
Water table depth: https://doi.org/10.25581/spruce.079/1608615 (Hanson et al., 2020b)
-
Carbon fluxes: https://doi.org/10.25581/spruce.052/1433837 (Hanson et al., 2018a), https://doi.org/10.25581/spruce.051/1433836 (Hanson et al., 2018b), https://doi.org/10.25581/spruce.077/1607860 (Malhotra et al., 2020b), https://doi.org/10.25581/spruce.049/1426474 (Norby and Childs, 2018), https://doi.org/10.25581/spruce.104/1922635 (Stelling et al., 2024)
-
Pore-water chemistry: https://doi.org/10.3334/CDIAC/spruce.028 (Griffiths et al., 2016)
-
Resin-exchange measurements: https://doi.org/10.3334/CDIAC/spruce.036 (Iversen et al., 2017a)
-
Ectomycorrhizal colonization of tree root tips: https://doi.org/10.25581/spruce.119/2476173 (Duchesneau et al., 2024b).
The supplement related to this article is available online at https://doi.org/10.5194/gmd-19-5827-2026-supplement.
Y.W., D.M.R., and J.M. co-conceived the research. Y.W. performed model development, simulations, and analysis. D.M.R. helped with model simulations and sensitivity analysis. S.E.W., V.S., X.Y., N.A.G., P.J.H., A.P.W., J.S., K.D., C.E.D., J.M.W., S.D.S., K.J.P., K.O., J.M.B., M.G., and M.B.K. provided observational data and helped with their correct usage and interpretation. J.M., D.M.R., P.H., M.A.M., and P.T. obtained funding. All authors contributed to results interpretation, manuscript writing, and editing.
The contact author has declared that none of the authors has any competing interests.
Publisher's note: Copernicus Publications remains neutral with regard to jurisdictional claims made in the text, published maps, institutional affiliations, or any other geographical representation in this paper. The authors bear the ultimate responsibility for providing appropriate place names. Views expressed in the text are those of the authors and do not necessarily reflect the views of the publisher.
This study was conducted as a part of the Oak Ridge National Laboratory (ORNL) Terrestrial Ecosystem Sciences Scientific Focus Area which is funded by the U.S. Department of Energy (DOE) Office of Biological and Environmental Research, Environmental Systems Science program. ORNL is managed by UT-Battelle, LLC, for the U.S. DOE under contract DE-AC05-1008 00OR22725. The simulations and data analysis were conducted using the cades-baseline supercomputer, which is part of the Oak Ridge Leadership Facility. The contributions of S.D.S. were funded by the U.S. Department of Agriculture Forest Service Northern Research Station. The corresponding authors thank Colleen M. Iversen for providing the resin-exchange dataset and for facilitating connections with some of the coauthors. ChatGPT was used to improve language.
This paper was edited by Christoph Müller and reviewed by two anonymous referees.
Bashian-Victoroff, C., Yanai, R. D., Horton, T. R., and Lamit, L. J.: Nitrogen and phosphorus additions affect fruiting of ectomycorrhizal fungi in a temperate hardwood forest, Fungal Ecol., 73, 101388, https://doi.org/10.1016/j.funeco.2024.101388, 2025.
Bastrikov, V., MacBean, N., Bacour, C., Santaren, D., Kuppel, S., and Peylin, P.: Land surface model parameter optimisation using in situ flux data: comparison of gradient-based versus random search algorithms (a case study using ORCHIDEE v1.9.5.2), Geosci. Model Dev., 11, 4739–4754, https://doi.org/10.5194/gmd-11-4739-2018, 2018.
Basu, N. B., Destouni, G., Jawitz, J. W., Thompson, S. E., Loukinova, N. V., Darracq, A., Zanardo, S., Yaeger, M., Sivapalan, M., Rinaldo, A., and Rao, P. S. C.: Nutrient loads exported from managed catchments reveal emergent biogeochemical stationarity, Geophys. Res. Lett., 37, https://doi.org/10.1029/2010GL045168, 2010.
Bergmann, J., Weigelt, A., van der Plas, F., Laughlin, D. C., Kuyper, T. W., Guerrero-Ramirez, N., Valverde-Barrantes, O. J., Bruelheide, H., Freschet, G. T., Iversen, C. M., Kattge, J., McCormack, M. L., Meier, I. C., Rillig, M. C., Roumet, C., Semchenko, M., Sweeney, C. J., van Ruijven, J., York, L. M., and Mommer, L.: The fungal collaboration gradient dominates the root economics space in plants, Sci. Adv., 6, eaba3756, https://doi.org/10.1126/sciadv.aba3756, 2020.
Bogar, L. M., Tavasieff, O. S., Raab, T. K., and Peay, K. G.: Does resource exchange in ectomycorrhizal symbiosis vary with competitive context and nitrogen addition?, New Phytol., 233, 1331–1344, https://doi.org/10.1111/nph.17871, 2022.
Braghiere, R. K., Fisher, J. B., Allen, K., Brzostek, E., Shi, M., Yang, X., Ricciuto, D. M., Fisher, R. A., Zhu, Q., and Phillips, R. P.: Modeling Global Carbon Costs of Plant Nitrogen and Phosphorus Acquisition, J. Adv. Model. Earth Sy., 14, e2022MS003204, https://doi.org/10.1029/2022MS003204, 2022.
Brient, F.: Reducing uncertainties in climate projections with emergent constraints: concepts, examples and prospects, Adv. Atmos. Sci., 37, 1–15, https://doi.org/10.1007/s00376-019-9140-8, 2020.
Brzostek, E. R., Fisher, J. B., and Phillips, R. P.: Modeling the carbon cost of plant nitrogen acquisition: Mycorrhizal trade-offs and multipath resistance uptake improve predictions of retranslocation, J. Geophys. Res.-Biogeo., 119, 1684–1697, https://doi.org/10.1002/2014JG002660, 2014.
Bunn, R. A., Corrêa, A., Joshi, J., Kaiser, C., Lekberg, Y., Prescott, C. E., Sala, A., and Karst, J.: What determines transfer of carbon from plants to mycorrhizal fungi?, New Phytol., 244, 1199–1215, https://doi.org/10.1111/nph.20145, 2024.
Burrows, S. M., Maltrud, M., Yang, X., Zhu, Q., Jeffery, N., Shi, X., Ricciuto, D., Wang, S., Bisht, G., Tang, J., Wolfe, J., Harrop, B. E., Singh, B., Brent, L., Baldwin, S., Zhou, T., Cameron-Smith, P., Keen, N., Collier, N., Xu, M., Hunke, E. C., Elliott, S. M., Turner, A. K., Li, H., Wang, H., Golaz, J. -C., Bond-Lamberty, B., Hoffman, F. M., Riley, W. J., Thornton, P. E., Calvin, K., and Leung, L. R.: The DOE E3SM v1.1 biogeochemistry configuration: Description and simulated ecosystem-climate responses to historical changes in forcing, J. Adv. Model. Earth Sy., 12, https://doi.org/10.1029/2019MS001766, 2020.
Carrell, A. A., Kolton, M., Glass, J. B., Pelletier, D. A., Warren, M. J., Kostka, J. E., Iversen, C. M., Hanson, P. J., and Weston, D. J.: Experimental warming alters the community composition, diversity, and N2 fixation activity of peat moss (Sphagnum fallax) microbiomes, Glob. Change Biol., 25, 2993–3004, https://doi.org/10.1111/gcb.14715, 2019.
Craig, M. E., Walker, A. P., Iversen, C. M., Knox, R. G., Yaffar, D., and York, L. M.: Tree root nutrient uptake kinetics vary with nutrient availability, environmental conditions, and root traits: a global analysis, New Phytol., 246, 2495–2505, https://doi.org/10.1111/nph.70140, 2025.
Defrenne, C. E., Childs, J., Fernandez, C. W., Taggart, M., Nettles, W. R., Allen, M. F., Hanson, P. J., and Iversen, C. M.: High-resolution minirhizotrons advance our understanding of root-fungal dynamics in an experimentally warmed peatland, Plants People Planet, 3, 640–652, https://doi.org/10.1002/ppp3.10172, 2021.
DeGroot, M. and Schervish, M.: Probability and statistics, 4th edn., Pearson, 912 pp., ISBN 0-13-499547-3, 2018.
Dise, N. B.: Peatland Response to Global Change, Science, 326, 810–811, https://doi.org/10.1126/science.1174268, 2009.
Drewniak, B. A.: Simulating dynamic roots in the Energy Exascale Earth System Land Model, J. Adv. Model. Earth Sy., 11, 338–359, https://doi.org/10.1029/2018MS001334, 2019.
Du, E., Terrer, C., Pellegrini, A. F. A., Ahlström, A., van Lissa, C. J., Zhao, X., Xia, N., Wu, X., and Jackson, R. B.: Global patterns of terrestrial nitrogen and phosphorus limitation, Nat. Geosci., 13, 221–226, https://doi.org/10.1038/s41561-019-0530-4, 2020.
Duchesneau, K., Defrenne, C. E., Petro, C., Malhotra, A., Moore, J. A. M., Childs, J., Hanson, P. J., Iversen, C. M., and Kostka, J. E.: Responses of vascular plant fine roots and associated microbial communities to whole-ecosystem warming and elevated CO2 in northern peatlands, New Phytol., 242, 1333–1347, https://doi.org/10.1111/nph.19690, 2024a.
Duchesneau, K., Defrenne, C., Petro, C., Malhotra, A., Moore, J., Childs, J., Hanson, P., Iversen, C., and Kostka, J.: SPRUCE root tip and ectomycorrhizal fungi colonization measurements from ingrowth cores, 2017, Oak Ridge National Laboratory, TES SFA, U.S. Department of Energy, Oak Ridge, Tennessee, U.S.A. [data set], https://doi.org/10.25581/spruce.119/2476173, 2024b.
Dusenge, M. E., Warren, J. M., Reich, P. B., Ward, E. J., Murphy, B. K., Stefanski, A., Bermudez, R., Cruz, M., McLennan, D. A., King, A. W., Montgomery, R. A., Hanson, P. J., and Way, D. A.: Photosynthetic capacity in middle-aged larch and spruce acclimates independently to experimental warming and elevated CO2, Plant Cell Environ., 47, 4886–4902, https://doi.org/10.1111/pce.15068, 2024.
E3SM Project: Energy Exascale Earth System Model (Version 3.0.1), DOE Code [computer software], https://doi.org/10.11578/E3SM/dc.20240930.1, 2024.
Egerton-Warburton, L. M., Querejeta, J. I., Allen, M. F., and Finkelman, S. L.: Mycorrhizal Fungi, in: Reference Module in Earth Systems and Environmental Sciences, Elsevier, B978012409548905226X, https://doi.org/10.1016/B978-0-12-409548-9.05226-X, 2013.
Eick, M. J., Brady, W. D., and Lynch, C. K.: Charge properties and nitrate adsorption of some acid southeastern soils, J. Environ. Qual., 28, 138–144, https://doi.org/10.2134/jeq1999.00472425002800010016x, 1999.
Fanin, N., Clemmensen, K. E., Lindahl, B. D., Farrell, M., Nilsson, M.-C., Gundale, M. J., Kardol, P., and Wardle, D. A.: Ericoid shrubs shape fungal communities and suppress organic matter decomposition in boreal forests, New Phytol., 236, 684–697, https://doi.org/10.1111/nph.18353, 2022.
Fernandez, C. W. and Kennedy, P. G.: Revisiting the “Gadgil effect”: do interguild fungal interactions control carbon cycling in forest soils?, New Phytol., 209, 1382–1394, https://doi.org/10.1111/nph.13648, 2016.
Fernandez, C. W., Heckman, K., Kolka, R., and Kennedy, P. G.: Melanin mitigates the accelerated decay of mycorrhizal necromass with peatland warming, Ecol. Lett., 22, 498–505, https://doi.org/10.1111/ele.13209, 2019.
Friedlingstein, P., O'Sullivan, M., Jones, M. W., Andrew, R. M., Gregor, L., Hauck, J., Le Quéré, C., Luijkx, I. T., Olsen, A., Peters, G. P., Peters, W., Pongratz, J., Schwingshackl, C., Sitch, S., Canadell, J. G., Ciais, P., Jackson, R. B., Alin, S. R., Alkama, R., Arneth, A., Arora, V. K., Bates, N. R., Becker, M., Bellouin, N., Bittig, H. C., Bopp, L., Chevallier, F., Chini, L. P., Cronin, M., Evans, W., Falk, S., Feely, R. A., Gasser, T., Gehlen, M., Gkritzalis, T., Gloege, L., Grassi, G., Gruber, N., Gürses, Ö., Harris, I., Hefner, M., Houghton, R. A., Hurtt, G. C., Iida, Y., Ilyina, T., Jain, A. K., Jersild, A., Kadono, K., Kato, E., Kennedy, D., Klein Goldewijk, K., Knauer, J., Korsbakken, J. I., Landschützer, P., Lefèvre, N., Lindsay, K., Liu, J., Liu, Z., Marland, G., Mayot, N., McGrath, M. J., Metzl, N., Monacci, N. M., Munro, D. R., Nakaoka, S.-I., Niwa, Y., O'Brien, K., Ono, T., Palmer, P. I., Pan, N., Pierrot, D., Pocock, K., Poulter, B., Resplandy, L., Robertson, E., Rödenbeck, C., Rodriguez, C., Rosan, T. M., Schwinger, J., Séférian, R., Shutler, J. D., Skjelvan, I., Steinhoff, T., Sun, Q., Sutton, A. J., Sweeney, C., Takao, S., Tanhua, T., Tans, P. P., Tian, X., Tian, H., Tilbrook, B., Tsujino, H., Tubiello, F., van der Werf, G. R., Walker, A. P., Wanninkhof, R., Whitehead, C., Willstrand Wranne, A., Wright, R., Yuan, W., Yue, C., Yue, X., Zaehle, S., Zeng, J., and Zheng, B.: Global Carbon Budget 2022, Earth Syst. Sci. Data, 14, 4811–4900, https://doi.org/10.5194/essd-14-4811-2022, 2022.
Frolking, S., Roulet, N. T., Moore, T. R., Lafleur, P. M., Bubier, J. L., and Crill, P. M.: Modeling seasonal to annual carbon balance of Mer Bleue Bog, Ontario, Canada, Glob. Biogeochem. Cy., 16, 4-1–4-21, https://doi.org/10.1029/2001GB001457, 2002.
Frolking, S., Talbot, J., Jones, M. C., Treat, C. C., Kauffman, J. B., Tuittila, E.-S., and Roulet, N.: Peatlands in the Earth's 21st century climate system, Environ. Rev., 19, 371–396, https://doi.org/10.1139/a11-014, 2011.
Garcia, K., Delaux, P.-M., Cope, K. R., and Ané, J.-M.: Molecular signals required for the establishment and maintenance of ectomycorrhizal symbioses, New Phytol., 208, 79–87, https://doi.org/10.1111/nph.13423, 2015.
Genre, A., Lanfranco, L., Perotto, S., and Bonfante, P.: Unique and common traits in mycorrhizal symbioses, Nat. Rev. Microbiol., 18, 649–660, https://doi.org/10.1038/s41579-020-0402-3, 2020.
Glass, A. D. M., Britto, D. T., Kaiser, B. N., Kinghorn, J. R., Kronzucker, H. J., Kumar, A., Okamoto, M., Rawat, S., Siddiqi, M. Y., Unkles, S. E., and Vidmar, J. J.: The regulation of nitrate and ammonium transport systems in plants, J. Exp. Bot., 53, 855–864, https://doi.org/10.1093/jexbot/53.370.855, 2002.
Graham, J. D., Glenn, N. F., Spaete, L. P., and Hanson, P. J.: Characterizing peatland microtopography using gradient and microform-based approaches, Ecosystems, 23, 1464–1480, https://doi.org/10.1007/s10021-020-00481-z, 2020.
Griffiths, M. and York, L. M.: Targeting Root Ion Uptake Kinetics to Increase Plant Productivity and Nutrient Use Efficiency, Plant Physiol., 182, 1854–1868, https://doi.org/10.1104/pp.19.01496, 2020.
Griffiths, N. A. and Sebestyen, S. D.: Dynamic vertical profiles of peat porewater chemistry in a northern peatland, Wetlands, 36, 1119–1130, https://doi.org/10.1007/s13157-016-0829-5, 2016.
Griffiths, N. A., Sebestyen, S. D., Oleheiser, K. C., Stelling, J. M., Pierce, C. E., Nater, E. A., Toner, B. M., and Kolka, R. K.: SPRUCE porewater chemistry data for experimental plots, beginning in 2013, version 4, Oak Ridge National Laboratory, TES SFA, US Department of Energy, Oak Ridge, Tennessee, U.S.A. [data set], https://doi.org/10.3334/CDIAC/spruce.028, 2016.
Griffiths, N. A., Hanson, P. J., Ricciuto, D. M., Iversen, C. M., Jensen, A. M., Malhotra, A., McFarlane, K. J., Norby, R. J., Sargsyan, K., Sebestyen, S. D., Shi, X., Walker, A. P., Ward, E. J., Warren, J. M., and Weston, D. J.: Temporal and spatial variation in peatland carbon cycling and implications for interpreting responses of an ecosystem-scale warming experiment, Soil Sci. Soc. Am. J., 81, 1668–1688, https://doi.org/10.2136/sssaj2016.12.0422, 2017.
Hanson, P. J., Gill, A. L., Xu, X., Phillips, J. R., Weston, D. J., Kolka, R. K., Riggs, J. S., and Hook, L. A.: Intermediate-scale community-level flux of CO2 and CH4 in a Minnesota peatland: putting the SPRUCE project in a global context, Biogeochemistry, 129, 255–272, https://doi.org/10.1007/s10533-016-0230-8, 2016a.
Hanson, P. J., Riggs, J. S., Nettles, W. R., Krassovski, M. B., and Hook, L. A.: SPRUCE whole ecosystems warming (WEW) environmental data beginning August 2015, Oak Ridge National Laboratory, TES SFA, U.S. Department of Energy, Oak Ridge, Tennessee, U.S.A. [data set], https://doi.org/10.3334/CDIAC/spruce.032, 2016b.
Hanson, P. J., Riggs, J. S., Nettles, W. R., Phillips, J. R., Krassovski, M. B., Hook, L. A., Gu, L., Richardson, A. D., Aubrecht, D. M., Ricciuto, D. M., Warren, J. M., and Barbier, C.: Attaining whole-ecosystem warming using air and deep-soil heating methods with an elevated CO2 atmosphere, Biogeosciences, 14, 861–883, https://doi.org/10.5194/bg-14-861-2017, 2017.
Hanson, P. J., Phillips, J. R., Brice, D. J., and Hook, L. A.: SPRUCE shrub-layer growth assessments in S1-bog plots and SPRUCE experimental plots beginning in 2010, Oak Ridge National Laboratory, TES SFA, U.S. Department of Energy, Oak Ridge, Tennessee, U.S.A. [data set], https://doi.org/10.25581/spruce.052/1433837, 2018a.
Hanson, P. J., Phillips, J. R., Wullschleger, S. D., Nettles, W. R., Warren, J. M., Ward, E. J., Graham, J. D., and Ruggles, T. A.: SPRUCE tree growth assessments of Picea and Larix in S1-bog plots and SPRUCE experimental plots beginning in 2011, Oak Ridge National Laboratory, TES SFA, U.S. Department of Energy, Oak Ridge, Tennessee, U.S.A. [data set], https://doi.org/10.25581/spruce.051/1433836, 2018b.
Hanson, P. J., Griffiths, N. A., Iversen, C. M., Norby, R. J., Sebestyen, S. D., Phillips, J. R., Chanton, J. P., Kolka, R. K., Malhotra, A., Oleheiser, K. C., Warren, J. M., Shi, X., Yang, X., Mao, J., and Ricciuto, D. M.: Rapid net carbon loss from a whole-ecosystem warmed peatland, AGU Adv., 1, https://doi.org/10.1029/2020AV000163, 2020a.
Hanson, P. J., Phillips, J. R., Nettles, W. R., Pearson, K. J., and Hook, L. A.: SPRUCE plot-level water table data assessments for absolute elevations and height with respect to mean hollows beginning in 2015, Oak Ridge National Laboratory, TES SFA, U.S. Department of Energy, Oak Ridge, Tennessee, U.S.A. [data set], https://doi.org/10.25581/spruce.079/1608615, 2020b.
Hanson, P. J., Griffiths, N. A., Salmon, V. G., Birkebak, J. M., Warren, J. M., Phillips, J. R., Guilliams, M. P., Oleheiser, K. C., Jones, M. W., Jones, N. J., Enterkine, J., Glenn, N. F., and Pearson, K. J.: Peatland plant community changes in annual production and composition through 8 years of warming manipulations under ambient and elevated CO2 atmospheres, J. Geophys. Res.-Biogeo., 130, e2024JG008511, https://doi.org/10.1029/2024JG008511, 2025.
Hawkins, H.-J., Cargill, R. I. M., Van Nuland, M. E., Hagen, S. C., Field, K. J., Sheldrake, M., Soudzilovskaia, N. A., and Kiers, E. T.: Mycorrhizal mycelium as a global carbon pool, Curr. Biol., 33, R560–R573, https://doi.org/10.1016/j.cub.2023.02.027, 2023.
He, H., Meyer, A., Jansson, P.-E., Svensson, M., Rütting, T., and Klemedtsson, L.: Simulating ectomycorrhiza in boreal forests: implementing ectomycorrhizal fungi model MYCOFON in CoupModel (v5), Geosci. Model Dev., 11, 725–751, https://doi.org/10.5194/gmd-11-725-2018, 2018.
He, H., Jansson, P.-E., and Gärdenäs, A. I.: CoupModel (v6.0): an ecosystem model for coupled phosphorus, nitrogen, and carbon dynamics – evaluated against empirical data from a climatic and fertility gradient in Sweden, Geosci. Model Dev., 14, 735–761, https://doi.org/10.5194/gmd-14-735-2021, 2021.
Hilman, B., Solly, E. F., Kuhlmann, I., Brunner, I., and Hagedorn, F.: Species-specific reliance of trees on ectomycorrhizal fungi for nitrogen supply at an alpine treeline, Fungal Ecol., 71, 101361, https://doi.org/10.1016/j.funeco.2024.101361, 2024.
Hobbie, J. E. and Hobbie, E. A.: 15N in Symbiotic Fungi and Plants Estimates Nitrogen and Carbon Flux Rates in Arctic Tundra, Ecology, 87, 816–822, https://doi.org/10.1890/0012-9658(2006)87[816:NISFAP]2.0.CO;2, 2006.
Högberg, M. N., Briones, M. J. I., Keel, S. G., Metcalfe, D. B., Campbell, C., Midwood, A. J., Thornton, B., Hurry, V., Linder, S., Näsholm, T., and Högberg, P.: Quantification of effects of season and nitrogen supply on tree below-ground carbon transfer to ectomycorrhizal fungi and other soil organisms in a boreal pine forest, New Phytol., 187, 485–493, https://doi.org/10.1111/j.1469-8137.2010.03274.x, 2010.
Ito, A., Reyer, C. P. O., Gädeke, A., Ciais, P., Chang, J., Chen, M., François, L., Forrest, M., Hickler, T., Ostberg, S., Shi, H., Thiery, W., and Tian, H.: Pronounced and unavoidable impacts of low-end global warming on northern high-latitude land ecosystems, Environ. Res. Lett., 15, 044006, https://doi.org/10.1088/1748-9326/ab702b, 2020.
Iversen, C. M., Latimer, J., Burnham, A., Brice, D. J., Childs, J., Vander Stel, H. M., Schwaner, G. W., and Weber, S. E.: SPRUCE plant-available nutrients assessed with ion-exchange resins in experimental plots, beginning in 2013, Oak Ridge National Laboratory, TES SFA, U.S. Department of Energy, Oak Ridge, Tennessee, U.S.A. [data set], https://doi.org/10.3334/CDIAC/spruce.036, 2017a.
Iversen, C. M., Garrett, A., Martin, A., Turetsky, M. R., Norby, R. J., Childs, J., and Ontl, T. A.: SPRUCE S1 Bog tree basal area and understory community composition assessed in the southern and northern ends of the S1 Bog, Carbon Dioxide Information Analysis Center, Oak Ridge National Laboratory, U.S. Department of Energy, Oak Ridge, Tennessee, U.S.A., https://doi.org/10.3334/CDIAC/spruce.024, 2017b.
Iversen, C. M., McCormack, M. L., Baer, J. K., Powell, A. S., Chen, W., Collins, C., Fan, Y., Fanin, N., Freschet, G. T., Guo, D., Hogan, J. A., Kou, L., Laughlin, D. C., Lavely, E., Liese, R., Lin, D., Meier, I. C., Montagnoli, A., Roumet, C., See, C. R., Soper, F., Terzaghi, M., Valverde-Barrantes, O. J., Wang, C., Wright, S. J., Wurzburger, N., and Zadworny, M.: Fine-Root Ecology Database (FRED): A Global Collection of Root Trait Data with Coincident Site, Vegetation, Edaphic, and Climatic Data, Version 3. Oak Ridge National Laboratory, TES SFA, U.S. Department of Energy, Oak Ridge, Tennessee, U.S.A., https://doi.org/10.25581/ornlsfa.014/1459186, 2021a.
Iversen, C. M., Brice, D. J., Childs, J., Vander Stel, H. M., and Salmon, V. G.: SPRUCE S1 bog production of newly-grown fine roots assessed using root ingrowth cores in 2013, Oak Ridge National Laboratory, TES SFA, U.S. Department of Energy, Oak Ridge, Tennessee, U.S.A., https://doi.org/10.25581/spruce.091/1782483, 2021b.
Iversen, C. M., Latimer, J., Brice, D. J., Childs, J., Vander Stel, H. M., Defrenne, C. E., Graham, J., Griffiths, N. A., Malhotra, A., Norby, R. J., Oleheiser, K. C., Phillips, J. R., Salmon, V. G., Sebestyen, S. D., Yang, X., and Hanson, P. J.: Whole-ecosystem warming increases plant-available nitrogen and phosphorus in an ombrotrophic bog, Ecosystems, https://doi.org/10.1007/s10021-022-00744-x, 2022.
Jensen, A. M., Warren, J. M., King, A. W., Ricciuto, D. M., Hanson, P. J., and Wullschleger, S. D.: Simulated projections of boreal forest peatland ecosystem productivity are sensitive to observed seasonality in leaf physiology, Tree Physiol., 39, 556–572, https://doi.org/10.1093/treephys/tpy140, 2019.
Kennedy, P. G., Mielke, L. A., and Nguyen, N. H.: Ecological responses to forest age, habitat, and host vary by mycorrhizal type in boreal peatlands, Mycorrhiza, 28, 315–328, https://doi.org/10.1007/s00572-018-0821-4, 2018.
Knox, R. G., Koven, C. D., Riley, W. J., Walker, A. P., Wright, S. J., Holm, J. A., Wei, X., Fisher, R. A., Zhu, Q., Tang, J., Ricciuto, D. M., Shuman, J. K., Yang, X., Kueppers, L. M., and Chambers, J. Q.: Nutrient dynamics in a coupled terrestrial biosphere and land model (ELM-FATES-CNP), J. Adv. Model. Earth Sy., 16, e2023MS003689, https://doi.org/10.1029/2023MS003689, 2024.
Kolka, R., Sebestyen, S., Verry, E. S., and Brooks, K. (Eds.): Peatland Biogeochemistry and Watershed Hydrology at the Marcell Experimental Forest, CRC Press, Boca Raton, FL, 512 pp., ISBN 9780429130007, 2011.
Lavallee, J. M., Soong, J. L., and Cotrufo, M. F.: Conceptualizing soil organic matter into particulate and mineral-associated forms to address global change in the 21st century, Glob. Change Biol., 26, 261–273, https://doi.org/10.1111/gcb.14859, 2020.
Loisel, J., Van Bellen, S., Pelletier, L., Talbot, J., Hugelius, G., Karran, D., Yu, Z., Nichols, J., and Holmquist, J.: Insights and issues with estimating northern peatland carbon stocks and fluxes since the Last Glacial Maximum, Earth-Sci. Rev., 165, 59–80, https://doi.org/10.1016/j.earscirev.2016.12.001, 2017.
Ma, R., Zhang, Y., Ciais, P., Xiao, J., Xu, Y., Goll, D., and Liang, S.: Stepwise calibration of age-dependent biomass in the Integrated Biosphere Simulator (IBIS) Model, J. Adv. Model. Earth Sy., 16, e2023MS004048, https://doi.org/10.1029/2023MS004048, 2024.
Mäkelä, A., Tian, X., Repo, A., Ilvesniemi, H., Marshall, J., Minunno, F., Näsholm, T., Schiestl-Aalto, P., and Lehtonen, A.: Do mycorrhizal symbionts drive latitudinal trends in photosynthetic carbon use efficiency and carbon sequestration in boreal forests?, Forest Ecol. Manag., 520, 120355, https://doi.org/10.1016/j.foreco.2022.120355, 2022.
Malhotra, A., Brice, D. J., Childs, J., Graham, J. D., Hobbie, E. A., Vander Stel, H., Feron, S. C., Hanson, P. J., and Iversen, C. M.: Peatland warming strongly increases fine-root growth, P. Natl. Acad. Sci. USA, 117, 17627–17634, https://doi.org/10.1073/pnas.2003361117, 2020a.
Malhotra, A., Brice, D. J., Childs, J., Vander Stel, H. M., Bellaire, S. E., Kraeske, E., Letourneau, S. M., Owens, L., Rasnake, L. M., and Iversen, C. M.: SPRUCE production and chemistry of newly-grown fine roots assessed using root ingrowth cores in SPRUCE experimental plots beginning in 2014, Oak Ridge National Laboratory, TES SFA, U.S. Department of Energy, Oak Ridge, Tennessee, U.S.A. [data set], https://doi.org/10.25581/spruce.077/1607860, 2020b.
Matschonat, G. and Matzner, E.: Soil chemical properties affecting NH sorption in forest soils, Z. Pflanz. Bodenkunde, 159, 505–511, https://doi.org/10.1002/jpln.1996.3581590514, 1996.
McFarlane, K. J., Hanson, P. J., Iversen, C. M., Phillips, J. R., and Brice, D. J.: Local spatial heterogeneity of Holocene carbon accumulation throughout the peat profile of an ombrotrophic northern Minnesota bog, Radiocarbon, 60, 941–962, https://doi.org/10.1017/RDC.2018.37, 2018.
McPartland, M. Y., Kane, E. S., Falkowski, M. J., Kolka, R., Turetsky, M. R., Palik, B., and Montgomery, R. A.: SPRUCE: LAI data from SPRUCE experimental plots, 2017-2019, Oak Ridge National Laboratory, TES SFA, U.S. Department of Energy, Oak Ridge, Tennessee, U.S.A., https://doi.org/10.25581/spruce.058/1491566, 2019.
Meng, L., Mao, J., Ricciuto, D. M., Shi, X., Richardson, A. D., Hanson, P. J., Warren, J. M., Zhou, Y., Li, X., Zhang, L., and Schädel, C.: Evaluation and modification of ELM seasonal deciduous phenology against observations in a southern boreal peatland forest, Agr. Forest Meteorol., 308–309, 108556, https://doi.org/10.1016/j.agrformet.2021.108556, 2021.
Mielke, L. A.: Mycorrhizal guild functions and conservational values in boreal forests, Swedish University of Agricultural Sciences, Uppsala, Sweden, 107 pp., https://doi.org/10.54612/a.75ms1inoet, 2022.
Näsholm, T., Kielland, K., and Ganeteg, U.: Uptake of organic nitrogen by plants, New Phytol., 182, 31–48, https://doi.org/10.1111/j.1469-8137.2008.02751.x, 2009.
Norby, R. J. and Childs, J.: SPRUCE: Sphagnum productivity and community composition in the SPRUCE experimental plots, Oak Ridge National Laboratory, TES SFA, U.S. Department of Energy, Oak Ridge, Tennessee, U.S.A. [data set], https://doi.org/10.25581/spruce.049/1426474, 2018.
Norby, R. J., Warren, J. M., Iversen, C. M., Medlyn, B. E., and McMurtrie, R. E.: CO2 enhancement of forest productivity constrained by limited nitrogen availability, P. Natl. Acad. Sci., 107, 19368–19373, https://doi.org/10.1073/pnas.1006463107, 2010.
Norby, R. J., Childs, J., Hanson, P. J., and Warren, J. M.: Rapid loss of an ecosystem engineer: Sphagnum decline in an experimentally warmed bog, Ecol. Evol., 9, 12571–12585, https://doi.org/10.1002/ece3.5722, 2019.
Norby, R. J., Loader, N. J., Mayoral, C., Ullah, S., Curioni, G., Smith, A. R., Reay, M. K., van Wijngaarden, K., Amjad, M. S., Brettle, D., Crockatt, M. E., Denny, G., Grzesik, R. T., Hamilton, R. L., Hart, K. M., Hartley, I. P., Jones, A. G., Kourmouli, A., Larsen, J. R., Shi, Z., Thomas, R. M., and MacKenzie, A. R.: Enhanced woody biomass production in a mature temperate forest under elevated CO2, Nat. Clim. Change, 14, 983–988, https://doi.org/10.1038/s41558-024-02090-3, 2024.
Oleson, K. W., Lawrence, D. M., Bonan, G. B., Drewniak, B., Huang, M., Levis, S., Li, F., Riley, W. J., Swenson, S. C., Thornton, P. E., Bozbiyik, A., Fisher, R., Heald, C. L., Kluzek, E., Lamarque, F., Lawrence, P. J., Leung, L. R., Muszala, S., Ricciuto, D. M., Sacks, W., Sun, Y., Tang, J., and Yang, Z.-L.: Technical Description of version 4.5 of the Community Land Model (CLM), National Center for Atmospheric Research, Boulder, CO, USA, https://doi.org/10.5065/D6RR1W7M, 2013.
Ostonen, I., Helmisaari, H., Borken, W., Tedersoo, L., Kukumägi, M., Bahram, M., Lindroos, A., Nöjd, P., Uri, V., Merilä, P., Asi, E., and Lõhmus, K.: Fine root foraging strategies in Norway spruce forests across a European climate gradient, Glob. Change Biol., 17, 3620–3632, https://doi.org/10.1111/j.1365-2486.2011.02501.x, 2011.
Ostonen, I., Truu, M., Helmisaari, H., Lukac, M., Borken, W., Vanguelova, E., Godbold, D. L., Lõhmus, K., Zang, U., Tedersoo, L., Preem, J., Rosenvald, K., Aosaar, J., Armolaitis, K., Frey, J., Kabral, N., Kukumägi, M., Leppälammi-Kujansuu, J., Lindroos, A., Merilä, P., Napa, Ü., Nöjd, P., Parts, K., Uri, V., Varik, M., and Truu, J.: Adaptive root foraging strategies along a boreal–temperate forest gradient, New Phytol., 215, 977–991, https://doi.org/10.1111/nph.14643, 2017.
Palmroth, S., Oren, R., McCarthy, H. R., Johnsen, K. H., Finzi, A. C., Butnor, J. R., Ryan, M. G., and Schlesinger, W. H.: Aboveground sink strength in forests controls the allocation of carbon below ground and its [CO2]-induced enhancement, P. Natl. Acad. Sci., 103, 19362–19367, https://doi.org/10.1073/pnas.0609492103, 2006.
Petro, C., Carrell, A. A., Wilson, R. M., Duchesneau, K., Noble-Kuchera, S., Song, T., Iversen, C. M., Childs, J., Schwaner, G., Chanton, J. P., Norby, R. J., Hanson, P. J., Glass, J. B., Weston, D. J., and Kostka, J. E.: Climate drivers alter nitrogen availability in surface peat and decouple N2 fixation from CH4 oxidation in the Sphagnum moss microbiome, Glob. Change Biol., 29, 3159–3176, https://doi.org/10.1111/gcb.16651, 2023.
Plassard, C. and Dell, B.: Phosphorus nutrition of mycorrhizal trees, Tree Physiol., 30, 1129–1139, https://doi.org/10.1093/treephys/tpq063, 2010.
Plassard, C., Louche, J., Ali, M. A., Duchemin, M., Legname, E., and Cloutier-Hurteau, B.: Diversity in phosphorus mobilisation and uptake in ectomycorrhizal fungi, Ann. For. Sci., 68, 33–43, https://doi.org/10.1007/s13595-010-0005-7, 2011.
Raue, A., Kreutz, C., Maiwald, T., Bachmann, J., Schilling, M., Klingmüller, U., and Timmer, J.: Structural and practical identifiability analysis of partially observed dynamical models by exploiting the profile likelihood, Bioinformatics, 25, 1923–1929, https://doi.org/10.1093/bioinformatics/btp358, 2009.
Rehschuh, R., Rehschuh, S., Gast, A., Jakab, A.-L., Lehmann, M. M., Saurer, M., Gessler, A., and Ruehr, N. K.: Tree allocation dynamics beyond heat and hot drought stress reveal changes in carbon storage, belowground translocation and growth, New Phytol., 233, 687–704, https://doi.org/10.1111/nph.17815, 2022.
Ricciuto, D., Sargsyan, K., and Thornton, P.: The impact of parametric uncertainties on biogeochemistry in the E3SM Land Model, J. Adv. Model. Earth Sy., 10, 297–319, https://doi.org/10.1002/2017MS000962, 2018.
Ricciuto, D. M., Xu, X., Shi, X., Wang, Y., Song, X., Schadt, C. W., Griffiths, N. A., Mao, J., Warren, J. M., Thornton, P. E., Chanton, J., Keller, J. K., Bridgham, S. D., Gutknecht, J., Sebestyen, S. D., Finzi, A., Kolka, R., and Hanson, P. J.: An integrative model for soil biogeochemistry and methane processes: I. model structure and sensitivity analysis, J. Geophys. Res.-Biogeo., 126, https://doi.org/10.1029/2019JG005468, 2021.
Salmon, V. G., Brice, D. J., Bridgham, S., Childs, J., Graham, J., Griffiths, N. A., Hofmockel, K., Iversen, C. M., Jicha, T. M., Kolka, R. K., Kostka, J. E., Malhotra, A., Norby, R. J., Phillips, J. R., Ricciuto, D., Schadt, C. W., Sebestyen, S. D., Shi, X., Walker, A. P., Warren, J. M., Weston, D. J., Yang, X., and Hanson, P. J.: Nitrogen and phosphorus cycling in an ombrotrophic peatland: a benchmark for assessing change, Plant Soil, 466, 649–674, https://doi.org/10.1007/s11104-021-05065-x, 2021.
Saltelli, A., Tarantola, S., Campolongo, F., and Ratto, M.: Sensitivity analysis in practice: a guide to assessing scientific models, John Wiley & Sons, ISBN 978-0-470-87093-8, 2004.
Schimel, J. P. and Bennett, J.: Nitrogen mineralization: Challenges of a changing paradigm, Ecology, 85, 591–602, https://doi.org/10.1890/03-8002, 2004.
Schmidt, I. K., Michelsen, A., and Jonasson, S.: Effects of labile soil carbon on nutrient partitioning between an arctic graminoid and microbes, Oecologia, 112, 557–565, https://doi.org/10.1007/s004420050345, 1997.
Shao, S., Wu, J., He, H., and Roulet, N.: Integrating McGill Wetland Model (MWM) with peat cohort tracking and microbial controls, Sci. Total Environ., 806, 151223, https://doi.org/10.1016/j.scitotenv.2021.151223, 2022.
Shao, S., Wurzburger, N., Sulman, B., and Hicks Pries, C.: Ectomycorrhizal effects on decomposition are highly dependent on fungal traits, climate, and litter properties: A model-based assessment, Soil Biol. Biochem., 184, 109073, https://doi.org/10.1016/j.soilbio.2023.109073, 2023a.
Shao, S., Wu, J., He, H., Moore, T. R., Bubier, J., Larmola, T., Juutinen, S., and Roulet, N. T.: Ericoid mycorrhizal fungi mediate the response of ombrotrophic peatlands to fertilization: a modeling study, New Phytol., 238, 80–95, https://doi.org/10.1111/nph.18555, 2023b.
Shi, M., Fisher, J. B., Brzostek, E. R., and Phillips, R. P.: Carbon cost of plant nitrogen acquisition: global carbon cycle impact from an improved plant nitrogen cycle in the Community Land Model, Glob. Change Biol., 22, 1299–1314, https://doi.org/10.1111/gcb.13131, 2016.
Shi, X., Thornton, P. E., Ricciuto, D. M., Hanson, P. J., Mao, J., Sebestyen, S. D., Griffiths, N. A., and Bisht, G.: Representing northern peatland microtopography and hydrology within the Community Land Model, Biogeosciences, 12, 6463–6477, https://doi.org/10.5194/bg-12-6463-2015, 2015.
Shi, X., Ricciuto, D. M., Thornton, P. E., Xu, X., Yuan, F., Norby, R. J., Walker, A. P., Warren, J. M., Mao, J., Hanson, P. J., Meng, L., Weston, D., and Griffiths, N. A.: Extending a land-surface model with Sphagnum moss to simulate responses of a northern temperate bog to whole ecosystem warming and elevated CO2, Biogeosciences, 18, 467–486, https://doi.org/10.5194/bg-18-467-2021, 2021.
Smith, G. R. and Wan, J.: Resource-ratio theory predicts mycorrhizal control of litter decomposition, New Phytol., 223, 1595–1606, https://doi.org/10.1111/nph.15884, 2019.
Soudzilovskaia, N. A., van Bodegom, P. M., Terrer, C., Zelfde, M. van't, McCallum, I., Luke McCormack, M., Fisher, J. B., Brundrett, M. C., de Sá, N. C., and Tedersoo, L.: Global mycorrhizal plant distribution linked to terrestrial carbon stocks, Nat. Commun., 10, 5077, https://doi.org/10.1038/s41467-019-13019-2, 2019.
Stelling, J. M., Mayes, M. A., Hanson, P. J., and Krassovski, M.: SPRUCE: Carbon dioxide and methane soil flux measurements at high temporal resolution, beginning in 2022, Oak Ridge National Laboratory, TES SFA, U.S. Department of Energy, Oak Ridge, Tennessee, USA [data set], https://doi.org/10.25581/spruce.104/1922635, 2024.
Sulman, B. N., Shevliakova, E., Brzostek, E. R., Kivlin, S. N., Malyshev, S., Menge, D. N. L., and Zhang, X.: Diverse mycorrhizal associations enhance terrestrial C storage in a global model, Glob. Biogeochem. Cy., 33, 501–523, https://doi.org/10.1029/2018GB005973, 2019.
Svensson, M., Jansson, P.-E., and Berggren Kleja, D.: Modelling soil C sequestration in spruce forest ecosystems along a Swedish transect based on current conditions, Biogeochemistry, 89, 95–119, https://doi.org/10.1007/s10533-007-9134-y, 2008.
Sydsaeter, K. and Hammond, P.: Mathematics for economic analysis, Prentice Hall, Englewood Cliffs, NJ, 173–175, ISBN 0-13-583600-X, 1995.
Talbot, J. M. and Treseder, K. K.: Controls over mycorrhizal uptake of organic nitrogen, Pedobiologia, 53, 169–179, https://doi.org/10.1016/j.pedobi.2009.12.001, 2010.
Thornton, P. E. and Rosenbloom, N. A.: Ecosystem model spin-up: Estimating steady state conditions in a coupled terrestrial carbon and nitrogen cycle model, Ecol. Model., 189, 25–48, https://doi.org/10.1016/j.ecolmodel.2005.04.008, 2005.
Walker, A. P., Carter, K. R., Gu, L., Hanson, P. J., Malhotra, A., Norby, R. J., Sebestyen, S. D., Wullschleger, S. D., and Weston, D. J.: Biophysical drivers of seasonal variability in Sphagnum gross primary production in a northern temperate bog, J. Geophys. Res.-Biogeo., 122, 1078–1097, https://doi.org/10.1002/2016JG003711, 2017.
Wang, B., McCormack, M. L., Ricciuto, D. M., Yang, X., and Iversen, C. M.: Embracing fine-root system complexity in terrestrial ecosystem modeling, Glob. Change Biol., 29, 2871–2885, https://doi.org/10.1111/gcb.16659, 2023.
Wang, Y.: Analysis code accompanying ELM-MYCI development and SPRUCE site simulations, Zenodo [code], https://doi.org/10.5281/zenodo.17584835, 2026.
Wang, Y. and Ricciuto, D. M.: ELM source code for SPRUCE site simulations using the default model structure and mycorrhizal-implicit model structure, Zenodo [code], https://doi.org/10.5281/zenodo.17582789, 2025.
Wang, Y., Mao, J., Hoffman, F. M., Bonfils, C. J. W., Douville, H., Jin, M., Thornton, P. E., Ricciuto, D. M., Shi, X., Chen, H., Wullschleger, S. D., Piao, S., and Dai, Y.: Quantification of human contribution to soil moisture–based terrestrial aridity, Nat. Commun., 13, 6848, https://doi.org/10.1038/s41467-022-34071-5, 2022.
Ward, E. B., Duguid, M. C., Kuebbing, S. E., Lendemer, J. C., and Bradford, M. A.: The functional role of ericoid mycorrhizal plants and fungi on carbon and nitrogen dynamics in forests, New Phytol., 235, 1701–1718, https://doi.org/10.1111/nph.18307, 2022.
Warren, J. M., Hanson, P. J., Iversen, C. M., Kumar, J., Walker, A. P., and Wullschleger, S. D.: Root structural and functional dynamics in terrestrial biosphere models – evaluation and recommendations, New Phytol., 205, 59–78, https://doi.org/10.1111/nph.13034, 2015.
Weber, S. E., Childs, J., Latimer, J., Salmon, V. G., and Iversen, C. M.: SPRUCE root production assessed with manual minirhizotrons resolved to plant functional type, 2015–2021, Oak Ridge National Laboratory, TES SFA, U.S. Department of Energy, Oak Ridge, TN, USA, https://doi.org/10.25581/spruce.127/2570059, 2025a.
Weber, S. E., Childs, J., Latimer, J., Hanson, P. J., Salmon, V. G., Schwaner, G., and Iversen, C. M.: Warming and elevated CO2 cause greater and deeper root growth by shrubs in a boreal bog, bioRxiv, https://doi.org/10.1101/2025.06.26.661811, 2025b.
Wu, Y. and Blodau, C.: PEATBOG: a biogeochemical model for analyzing coupled carbon and nitrogen dynamics in northern peatlands, Geosci. Model Dev., 6, 1173–1207, https://doi.org/10.5194/gmd-6-1173-2013, 2013.
Xie, L., Zhou, X., Liu, Q., Zhao, C., and Yin, C.: Inorganic nitrogen uptake rate of Picea asperata curtailed by fine root acclimation to water and nitrogen supply and further by ectomycorrhizae, Physiol. Plant., 173, 2130–2141, https://doi.org/10.1111/ppl.13562, 2021.
Yang, X., Ricciuto, D. M., Thornton, P. E., Shi, X., Xu, M., Hoffman, F., and Norby, R. J.: The effects of phosphorus cycle dynamics on carbon sources and sinks in the Amazon region: A modeling study using ELM V1, J. Geophys. Res.-Biogeo., 124, 3686–3698, https://doi.org/10.1029/2019JG005082, 2019.
Yang, X., Thornton, P., Ricciuto, D., Wang, Y., and Hoffman, F.: Global evaluation of terrestrial biogeochemistry in the Energy Exascale Earth System Model (E3SM) and the role of the phosphorus cycle in the historical terrestrial carbon balance, Biogeosciences, 20, 2813–2836, https://doi.org/10.5194/bg-20-2813-2023, 2023.
Yin, H., Adamczyk, B., Wang, Q., Zhu, B., Guo, W., Zhu, X., Liu, Q., and Zhang, Z.: How do nitrogen-limited alpine coniferous forests acquire nitrogen? A rhizosphere perspective, For. Ecosyst., 9, 100071, https://doi.org/10.1016/j.fecs.2022.100071, 2022.
Zhu, Q., Riley, W. J., Tang, J., Collier, N., Hoffman, F. M., Yang, X., and Bisht, G.: Representing nitrogen, phosphorus, and carbon interactions in the E3SM land model: Development and global benchmarking, J. Adv. Model. Earth Sy., 11, 2238–2258, https://doi.org/10.1029/2018MS001571, 2019.