the Creative Commons Attribution 4.0 License.
the Creative Commons Attribution 4.0 License.
 | 19 Jun 2026
An extension of the BROOK90 hydrological model for estimation of subdaily water and energy fluxes
Rico Kronenberg
Ivan Vorobevskii
Thi Thanh Luong
Uwe Spank
Dongkyun Kim
Matthias Mauder
We present an updated version of the BROOK90 hydrological model (B90), which integrates a closed energy and water balance on subdaily time scales. This updated version refines the time-discrete, physically based representations of soil evaporation, interception and transpiration, while also improving the simulation of snowmelt processes on vegetated surfaces. Additionally, the model includes the capability to simulate the sensible heat flux, thereby providing a comprehensive description of the energy balance in conjunction with the water balance for vegetated surfaces.
The model was validated using Integrated Carbon Observation System (ICOS) eddy-covariance measurements from a mature spruce forest at the Anchor Station Tharandt (DE-Tha) in Germany. The subdaily B90 model demonstrates a good agreement with observed 30 min latent and sensible heat fluxes for dry surfaces, while its performance is less accurate for wet surfaces.
Notably, this new version of B90 does not require recalibration; parameter sets from earlier versions remain applicable. The model is well-suited for sampling intervals from 8 h to 1 min, depending on the availability and resolution of the input forcing data. It can be effectively used for various purposes, such as validating flux measurements, gap-filling latent and sensible heat flux data, and performing plausibility checks. However, its primary application is in the study of subdaily water balance dynamics, including processes like dew formation, interception, and fog deposition, which are typically not captured in many other daily-scaled water balance models.
- Article
(4752 KB) - Full-text XML
- BibTeX
- EndNote


Hydrological modeling plays a crucial role in understanding and managing water resources, predicting hydrological responses to environmental changes, and addressing issues such as flood forecasting and water supply management. The BROOK90 (B90) lumped hydrological model, initially developed in 1978 and subsequently refined by Federer (Federer and Lash, 1978a, b; Federer et al., 2002, 2003), has gained widespread adoption within hydrological research communities due to its robust performance in simulating daily water balance processes. In addition to the original Fortran and Visual Basic implementations (Federer, 2002), the model has seen several adaptations, including forks such as LWF-BROOK90 (Hammel and Kennel, 2001; Schmidt-Walter et al., 2020) and an R-based version (Kronenberg and Oehlschlägel, 2019). A modified Shuttleworth-Wallace evapotranspiration model (Shuttleworth and Wallace, 1985) is incorporated into B90, making it a reliable tool for estimating the water balance of vegetated surfaces. Moreover, this model allows for the separate analysis of transpiration, interception, and evaporation processes at a daily time resolution. Applications of B90 include forest hydrology (Schwärzel et al., 2009), soil monitoring systems (Hohenbrink et al., 2024; Luong et al., 2023; Vorobevskii et al., 2024), and even flood forecasting (Luong et al., 2021). Although B90 was originally designed for small plot-scale simulations, it has been successfully applied to catchments exceeding 100 km2 (Ulker and Buyukyildiz, 2023; Vorobevskii et al., 2020).
Despite its success in accurately simulating atmosphere-plant-soil water fluxes at the point scale, the original B90 model operates at a daily output time step and does not close the energy balance, focusing solely on the water mass balance. This limitation restricts its ability to capture subdaily dynamics of hydrological processes. While Federer (2002) asserted that subdaily output time-steps would not be suitable for B90, we aim to demonstrate that this is not the case. Both mass and energy exchanges between the land surface and the atmosphere are critical processes that must be addressed for accurate water balance estimations in hydrological models operating on subdaily scales.
Recent advancements in meteorological forcing data, such as high-resolution micro-meteorological measurements (Pastorello et al., 2020) and reanalysis datasets like ERA5-Land (Muñoz-Sabater et al., 2021), offer new opportunities to incorporate additional features of hydro-meteorological processes into water balance estimation. For example, rainfall partitioning can be significantly influenced by antecedent soil moisture, which exhibits substantial temporal variation even on a subdaily scale (Taylor et al., 2012). Additionally, fog and dew processes, which can contribute notably to water inputs in specific ecosystems, are often neglected in daily models (Parlange et al., 1995; Wilson et al., 2000). Dew formation is a nocturnal process driven by radiative cooling, and neglecting the associated energy loss during the night can lead to underestimations of dew formation (Monteith, 1957; Jacobs et al., 1999, Körner et al., 2020). Similarly, fog deposition requires precise energy balance considerations to be accurately modeled (Calder, 1996; Gash et al., 1980). Furthermore, event-driven processes such as rain and snow interception, which affect both water and energy fluxes, necessitate a model capable of operating at subdaily time resolutions.
To overcome these limitations, we present an enhanced version of the BROOK90 model, incorporating a new algorithm that ensures closure of both the energy and water balances, enabling simulations and output at subdaily time scales. This development builds upon the established Shuttleworth-Wallace evaporation model and extends its application to subdaily processes. By partitioning evapotranspiration into transpiration, evaporation, and interception processes, the updated B90 model offers a more comprehensive and accurate representation of hydrological dynamics. This advancement is particularly important for applications in ecosystem management, agricultural planning, and water resource management, where understanding the detailed subdaily dynamics of water and energy fluxes is crucial.
Data from the Integrated Carbon Observation System (ICOS) Anchor Station Tharandt (DE-Tha) station in Saxony, Germany, collected during the 2023-2024 period at a 30 min temporal resolution (Bernhofer et al., 2024) were selected to demonstrate the performance and evaluate the subdaily B90 model (Fig. 1). This ICOS station's data has been extensively used in numerous studies and is recognized for its high quality (Moderow et al., 2021). The site is dominated by a 140-year-old spruce stand with an average canopy height of 30 m. The tower's footprint encompasses 87 % coniferous forest (72 % Picea abies) and 13 % deciduous forest (10 % Larix decidua). The forest has been under continuous management since 1811, involving planting, thinning, and liming practices. The typical root depth of the spruce trees ranges from 30 to 40 cm.
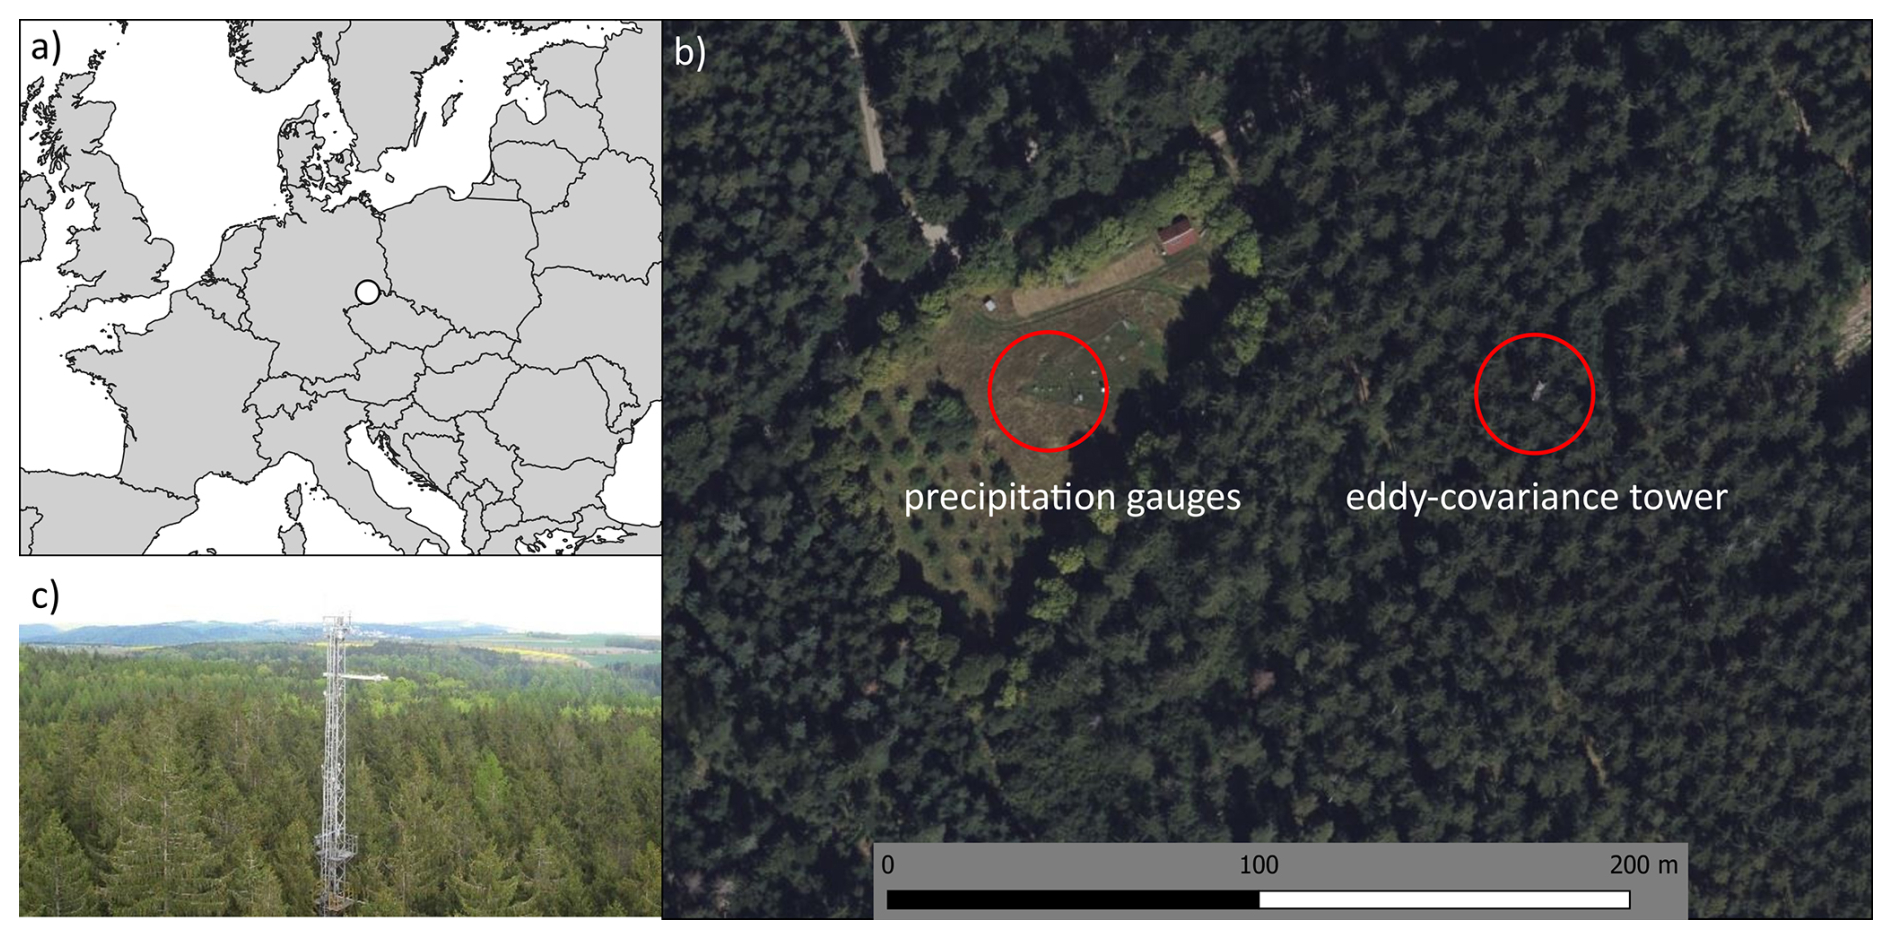
Figure 1Location of the ICOS DE-Tha station: (a) overview map, (b) satellite image (Bing Satellite © Microsoft, 2024) of the site with meteorological station and eddy-covariance tower, (c) photo of the eddy-covariance tower above the forest stand (© Chair of Meteorology, TU Dresden).
The site is characterized by silty Podzol soils with a relatively high stone content (10 %–20 %), derived from periglacial deposits of rhyolitic debris and loess, resulting in a highly heterogeneous composition. The eddy-covariance measurement system is installed atop a 42 m tower, equipped with ultrasonic anemometers and closed-enclosure gas analyzers, providing data at a frequency of 25 Hz. In addition, the site is outfitted with instruments to measure radiation components, air temperature and humidity, precipitation, and to conduct soil and biomass observations.
For the B90 model forcing, the following measurements were used as input: minimum and maximum air temperature, shortwave incoming radiation, precipitation, wind speed, relative humidity, and ground heat flux. Model validation was carried out using measured latent heat flux (λE) and sensible heat flux (H), with ICOS quality flag zero. The B90 model parameters for vegetation and soil were derived from Vorobevskii et al. (2022). The year 2023 was used as the spin-up period for the model and was not included in the evaluation phase.
Evapotranspiration in the B90 model is based on an enhanced version of the Shuttleworth-Wallace approach (Shuttleworth and Wallace, 1985). It is a dual-source model (Fig. 2), which explicitly differentiates between wet and dry surface conditions. Derived from the Penman-Monteith model (Allen et al., 1998), the Shuttleworth-Wallace model retains the three key equations of the Penman-Monteith framework – namely, the turbulent fluxes of latent heat (λE) and sensible heat (H), as well as the surface temperature (To). In this section, we present the newly implemented equations in subdaily B90 for the estimation of sensible heat flux (H).
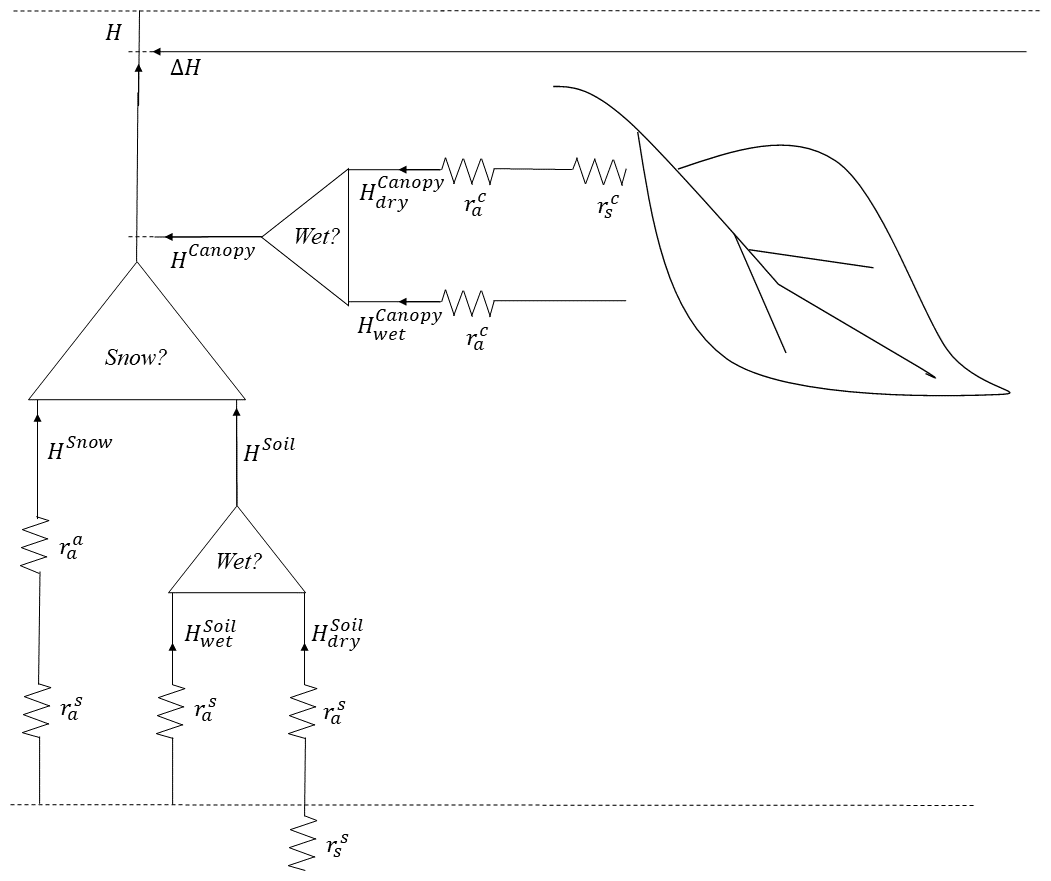
Figure 2Scheme of the minimal sensible heat flux adapted after Shuttleworth and Gurney (1990) in subdaily BROOK90.
The minimal sensible heat flux Hmin in the subdaily B90 model, as depicted in Fig. 2, represents the sum of five processes originating from two sources: the canopy and the soil. The canopy can be either dry or wetted by precipitation, but a distinction between fluxes from liquid and solid precipitation is not made for the canopy. Depending on the occurrence of a precipitation event or residual water from a prior event (i.e., interception), the leaf surface may be fully or partially covered by water.
Similarly, the soil can be covered by either rain or snow during a precipitation event. For the soil, the differentiation between rain and snow is critical, as snow forms its own storage when accumulated, whereas rain either infiltrates into the soil or runs off. Each of these five flux components contributes to the overall heat flux at screen height. Consequently, the minimal sensible heat flux Hmin is estimated according to Eq. (1):
where w is the portion of wetted surface in the canopy and on the ground. It is defined as the quotient between the actual intercepted rain (IRVP) and snow (ISVP) divided by the potential interception rate of the canopy (PINT). In case the quotient gets larger than one, it is reduced like shown in Eq. (2):
Equation (1) possess an additional trigger for snow s. In case of snow on the soil surface evaporation of this source is estimated and the snow on the ground trigger s is set to one, otherwise it is zero:
The sensible heat flux from snow pack on the ground is estimated according to:
where VPDSnow is the vapour pressure deficit above snow pack on the ground, ρ is the air density, γ is the psychrometer constant, is the atmosphere aerodynamic resistance, ground aerodynamic resistance, k is a multiplier to fix overestimation of snow evaporation introduced by Federer (2002).
The sensible heat flux from dry canopy is defined as:
where AE is the available energy at screen height, AESUBS is the part of energy reaching the ground, is the canopy aerodynamic resistance, is the canopy surface resistance after Shuttleworth and Gurney (1990) and Stewart (1988), Δ is the rate of change of saturation specific humidity with air temperature.
The sensible heat flux from wet canopy is defined as:
The sensible heat flux from dry soil is defined as:
where is the soil surface resistance after Shuttleworth and Wallace (1985).
The sensible heat flux from wet soil is defined as:
It is important to note that the calculation of the canopy surface resistance in B90 differs from the Jarvis (1976) model in that Federer (2002) defined the resulting transpiration term in B90 as “potential” transpiration, neglecting the dependency on soil water availability and CO2 concentration. As a result, B90 simulates the actual water supply rate, which is controlled by the water potential gradient and plant resistance.
It could be noticed that we have so far formulated only a minimal sensible heat flux Hmin. This requires some explanation. B90 was originally developed to represent the water balance, focusing primarily on the mass balance. Consequently, certain components of input energy were not explicitly considered, as energy components were not intended to be modeled outputs. The energy balance is not explicitly closed in the original B90 model. This is because B90, following the Shuttleworth-Wallace approach, estimates a potential latent heat flux, which is limited by the actual available water. Therefore, any portion of the potential latent heat flux that cannot be utilized disappears. This disappearance needs to be addressed in order to close the energy balance in B90. Since it is assumed that this energy is converted into sensible heat, we refer to this process as the redistribution of energy within the model.
We identified four processes in B90 that require such redistribution to conserve the energy balance. At each simulation time step, this redistribution portion ΔH begins with zero value. This occurs for two reasons: first, energy storage is not considered in the model, and second, not all of the identified processes contribute at every time step. The following four steps summarize the amount of redistributed energy ΔH for a single modeling time step:
-
Step 1. Redistributed energy from transpiration.
The main processes in B90 where energy might “disappear” is transpiration, where a “potential” transpiration rate is calculated but the actual amount is limited by the water availability in the soil. At each time step their difference is added to ΔH:
with estimated after Shuttleworth-Wallace and as actual water flux limited by the available water.
-
Step 2. Redistributed energy from snow pack on the ground.
The second process is evaporation from snow, where a “potential” evaporation rate is calculated, but the actual water vapour uptake is limited by the remaining water after melted runoff. Therefore, remaining parts of latent energy, which are not assigned to the latent heat flux need to be attributed to the sensible heat flux from the snowpack.
with as latent heat flux equivalent to Eq. (4) after Federer (2002) and as actual water flux limited by the available water.
-
Step 3. Redistributed energy from snow covered soil.
In case of a snow cover on the soil the estimated evaporation rates from dry and wet soil surfaces, as well as the sensible heat fluxes are set to zero, although energy is assigned to these processes at each time step. This energy is distributed into the overall sensible heat flux by:
with dry and wet soil evaporation , estimated after Shuttleworth-Wallace.
-
Step 4. Redistributed energy from dry soils on wetted by precipitation event.
In case ground evaporation is limited by the available soil water content and a precipitation event occurs at a simulation time step. The energy difference between potential soil evaporation and actual soil evaporation is redistributed to the sensible heat flux.
with dry soil evaporation after Shuttleworth-Wallace and as actual water flux limited by the available water.
There seems to be no general rule, which process contributes the largest amount of energy for redistribution. In our case study the transpiration process had the largest amount, but at other less vegetated sites or in colder climates also snow evaporation might possess more importance.
Based on the aforementioned equations the actual sensible heat flux H at a simulation time step is defined as:
By this redistribution approach the energy balance is closed in subdaily B90. Fortunately, all presented model extensions do not need any new parameters or their adjustments. Therefore, all parameters of the original B90 can be used and should be set according to natural site conditions.
For the technical implementation of the model upgrades mentioned above we took R-Version of the B90 model and upgraded it to a new “subdaily version” (Kronenberg and Vorobevskii 2025).
4.1 Two examples of subdaily water and energy balance component distributions after rainfall events
The updated version of the B90 model allows for the simulation of all water balance components, particularly evapotranspiration, under varying conditions (wet and dry) at subdaily time steps. All output variables previously available in the original B90 model are now also simulated at subdaily intervals. Additionally, new variables have been introduced to represent energy and turbulent fluxes. Here and throughout the manuscript, subdaily time steps refer to 30 min intervals, corresponding to the temporal resolution of the available observational data. As demonstrated in Fig. 3, the model estimates transpiration, evaporation from the ground, and evaporation from the interception storage. Moreover, the model is capable of simulating condensation on vegetative surfaces, along with the subsequent evaporation of intercepted condensed water.
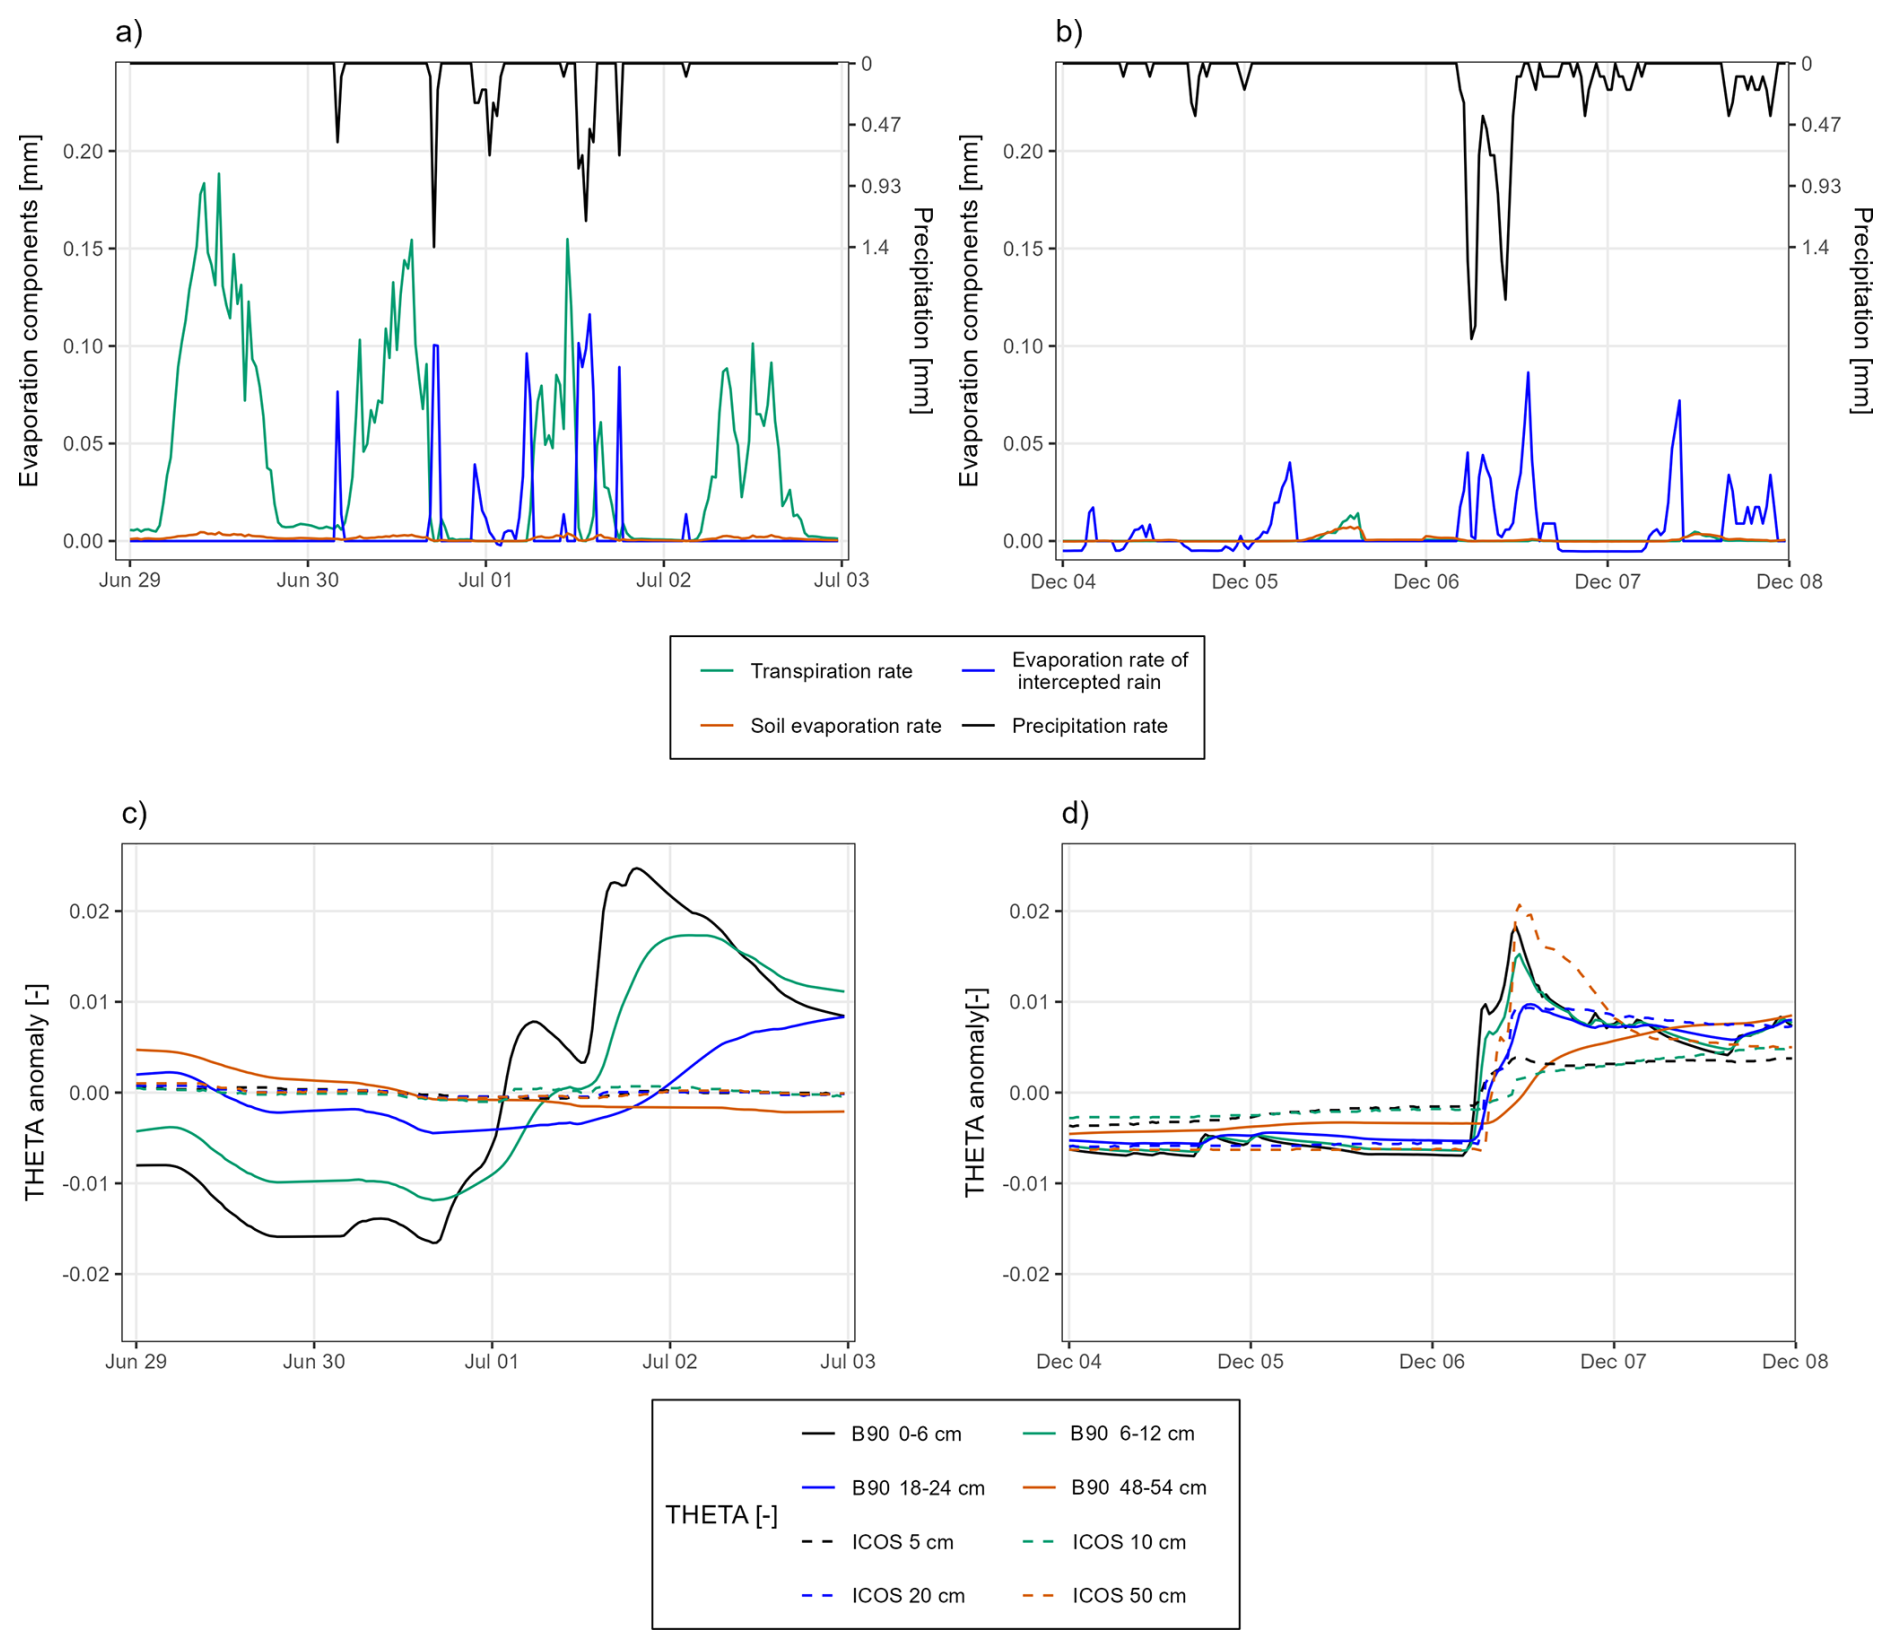
Figure 3Sample time-series of evaporation components estimated by subdaily B90 and soil water content (simulated and measured): (a) and (c) 29 June–2 July 2024 (9.6 mm on total), (b) and (d) 4–7 December 2024 (22.5 mm in total). Both examples are no snow events.
Figure 3a illustrates this process on the morning of 1 July, where the evaporation rate from intercepted rain becomes slightly negative. A more pronounced example of condensation is observed in Fig. 3b, around midnight on the 5 and 7 December. However, these examples raise additional points that warrant further discussion.
Figure 3c and d illustrate the theta anomaly, defined as the difference between the average θ values of the two or four preceding daily periods and the actual θ values observed in situ and estimated by the B90 model at different soil depths. The theta anomaly is used as a normalized measure to highlight soil water response to precipitation events, as absolute values may vary significantly across different conditions.
In Fig. 3c, the precipitation events of 9.6 mm in total on 30 June–2 July 2024 are shown, with the model capturing a clear response in the soil matrix. In contrast, the in situ measurements at various depths show almost no discernible reaction to the event. The model simulates a drying process for the pre-event soil moisture, yet this is not reflected in the observed data. Several factors may explain this discrepancy: first, an actual interception storage capacity could be larger than parameterized in the model, although this is unlikely due to relatively high sum of precipitation event in a given time interval; second, the presence of an unaccounted-for humus layer above the soil, which can possess a significant storage capacity (Floriancic et al., 2023); or third, the possibility that soil moisture sensors, particularly under dry conditions, exhibit delayed responses or fail to detect moisture changes due to preferential flow bypassing the sensors. These sensor-related issues are further highlighted in Fig. 3d for December with 22.5 mm rain event, where the soil's response to precipitation is shown to produce similar peaks at various depths, consistent with the model's simulation, indicating that the observed anomalies may be attributed to sensor limitations under specific conditions.
Additionally, the latent and sensible heat fluxes are now explicitly simulated in the subdaily B90 model. Exemplary results for the previously discussed events are shown in Fig. 4. A notable observation is that the modelled fluxes exhibit less temporal variability compared to the flux measurements. This is expected, as the observed fluxes are inherently more variable due to the high-frequency nature of the measurements, while the model outputs are influenced by less frequently measured meteorological variables. Furthermore, the model tends to underestimate low or negative fluxes, which can be identified as a general trend. This underestimation is primarily attributed to the systematic underestimation of negative net radiation (Rn) within the B90 model. An improvement in the estimation of longwave radiation within the model is anticipated to address this issue. On the positive side, the introduction of subdaily processes in the model allows for the simulation of condensation events, as well as the representation of oasis effects – where advective warm and dry air leads to negative sensible heat fluxes under specific atmospheric conditions. These effects are visible in Fig. 4b and d.
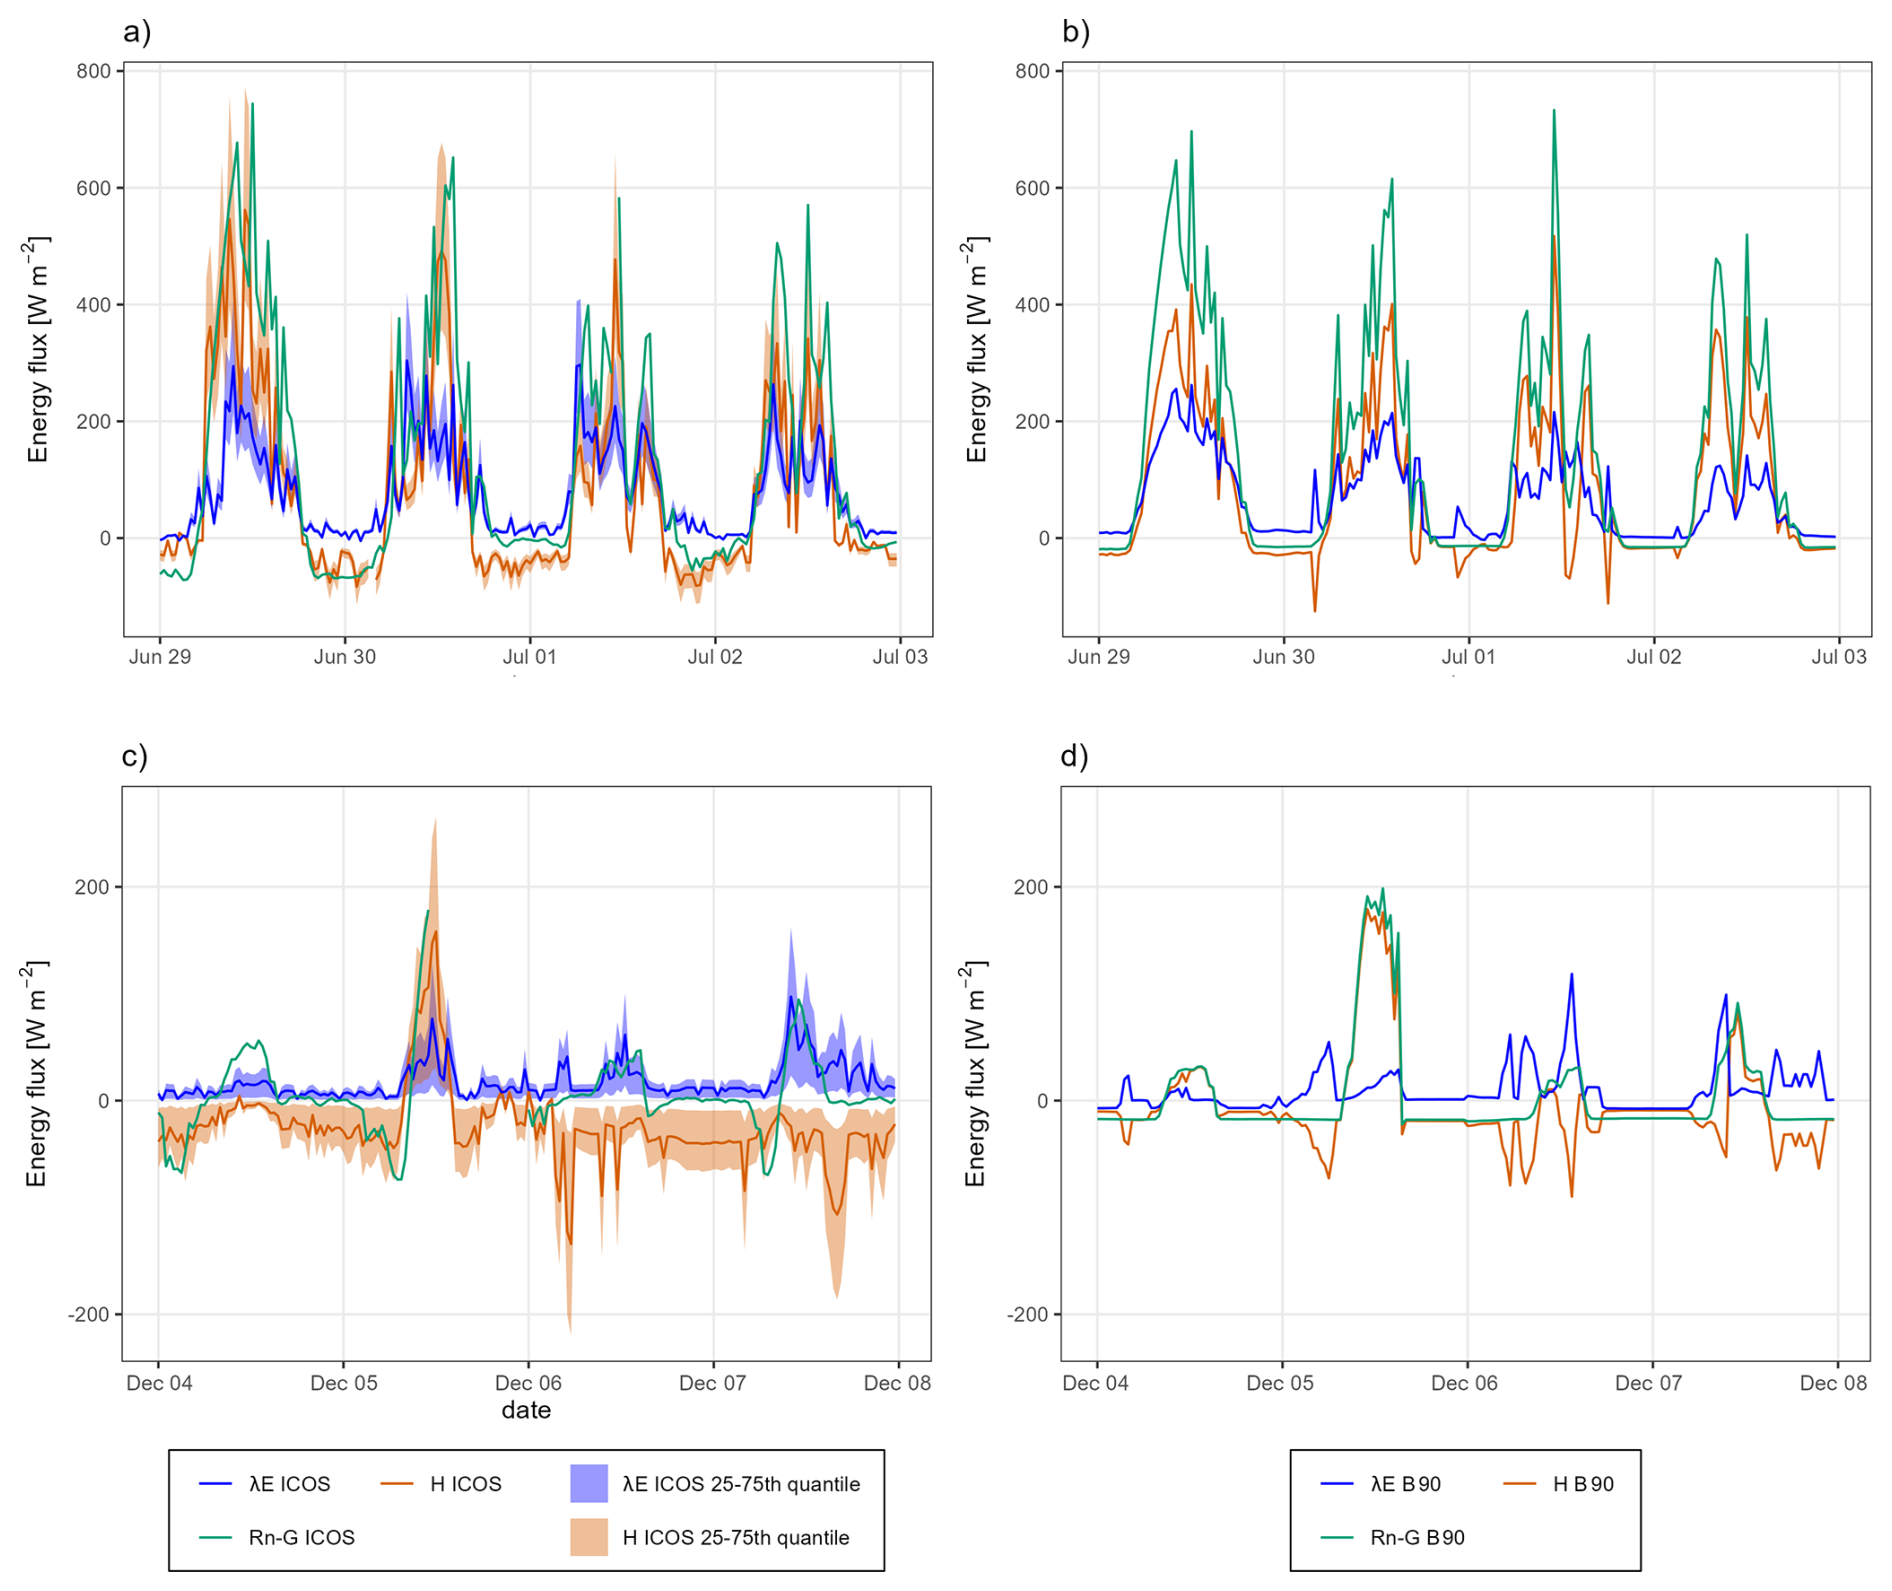
Figure 4Sample time-series of energy balance components measured at the ICOS DE-THA site (a and c) and estimated by subdaily B90 (b and d) for 29 June–2 July and 4–7 December 2024.
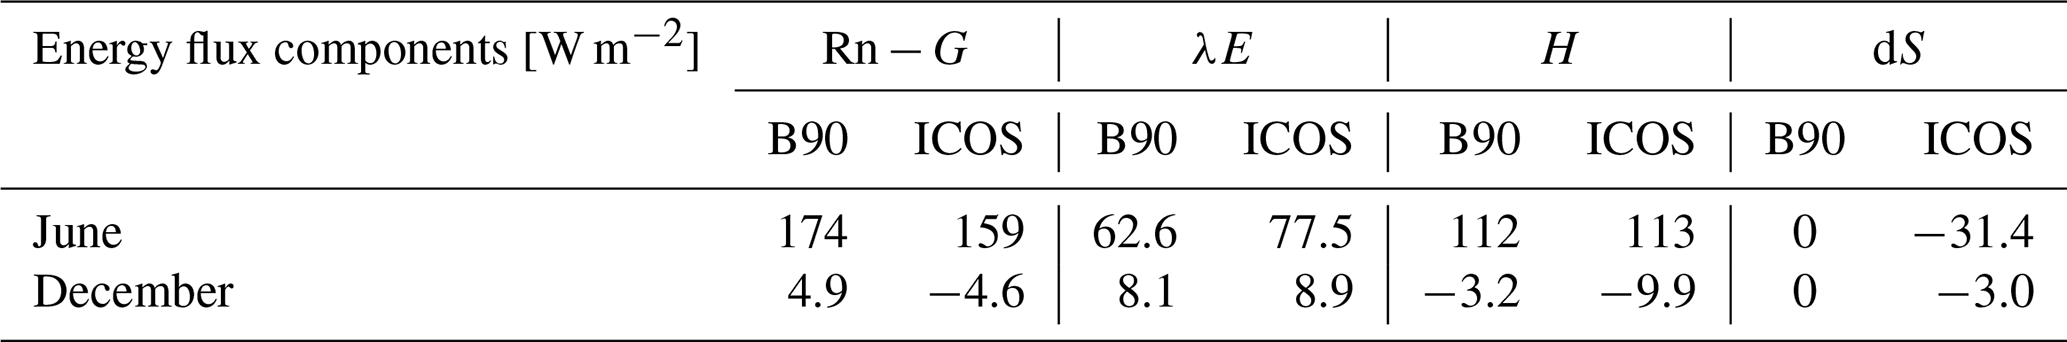
Table 1 summarizes the energy flux components for June and December 2024. The differences between observed and modeled turbulent fluxes are relatively small, indicating good agreement between the two datasets. In the B90 model, the change in energy storage is assumed to be zero, as no explicit heat storage is implemented. Consequently, the change in storage (ds) is zero at every simulation time step. In December, an underestimation of negative net radiation (Rn) is observed, with both the observed Rn −G and sensible heat flux (H) being lower than the model estimates. However, there is also an unexplained discrepancy, where the observed Rn −G is consistently lower than the modeled values. This issue will be addressed in further discussion.
Table 1Mean 30 min energy flux components for June and December 2024.
4.2 Validation of energy fluxes with ICOS measurements for 2024
The simulated fluxes were validated against ICOS observations flagged with the highest data quality (quality flag 0 – measured directly). Figure 5 displays all 30 min fluxes, differentiated by vegetation period (VP – April to October) and winter period (WP – November to March). Among the components, latent heat flux (λE) exhibits the weakest performance. This reflects both the inherent complexity of turbulent fluxes and the associated challenges in their accurate modelling and measurement. The observed λE data also contain notable variability, which may be partially attributable to measurement noise. Linear regression analysis for the vegetation period reveals that λE is underestimated by approximately 36 % in the subdaily B90 model, with an acceptable coefficient of determination (R2 = 0.59). Model performance further deteriorates during the winter period, characterized by weaker fluxes and similarly pronounced underestimation. Several factors likely contribute to the observed spread in λE:
-
the complexity of the underlying evapotranspiration processes,
-
the simplified nature of the B90 model, which relies on parameterized rather than turbulence-resolving approaches,
-
limitations of eddy covariance measurements under stable atmospheric conditions, and
-
uncertainties associated with the site-specific parameterization.
Model performance for λE could potentially be improved through a subdaily calibration of vegetation-related parameters tailored to the study site. In contrast, the modelled sensible heat flux (H) performs much better, showing a 32 % underestimation but a higher correlation with observations (R2 = 0.76) over 30 min intervals. This improved agreement likely reflects the relatively simpler dynamics governing H, which depend primarily on air temperature gradients and wind, in contrast to λE, which is additionally constrained by water availability and governed by energy partitioning processes within the model. When H and λE are plotted against the available measured energy (Rn −G), results are satisfactory, showing minimal energy underestimation and a high degree of explained variance. Moreover, the combined turbulent fluxes (H+ λE) from the B90 model exhibit good agreement with the corresponding ICOS observations, further supporting the model's capability to simulate total energy fluxes with reasonable accuracy.
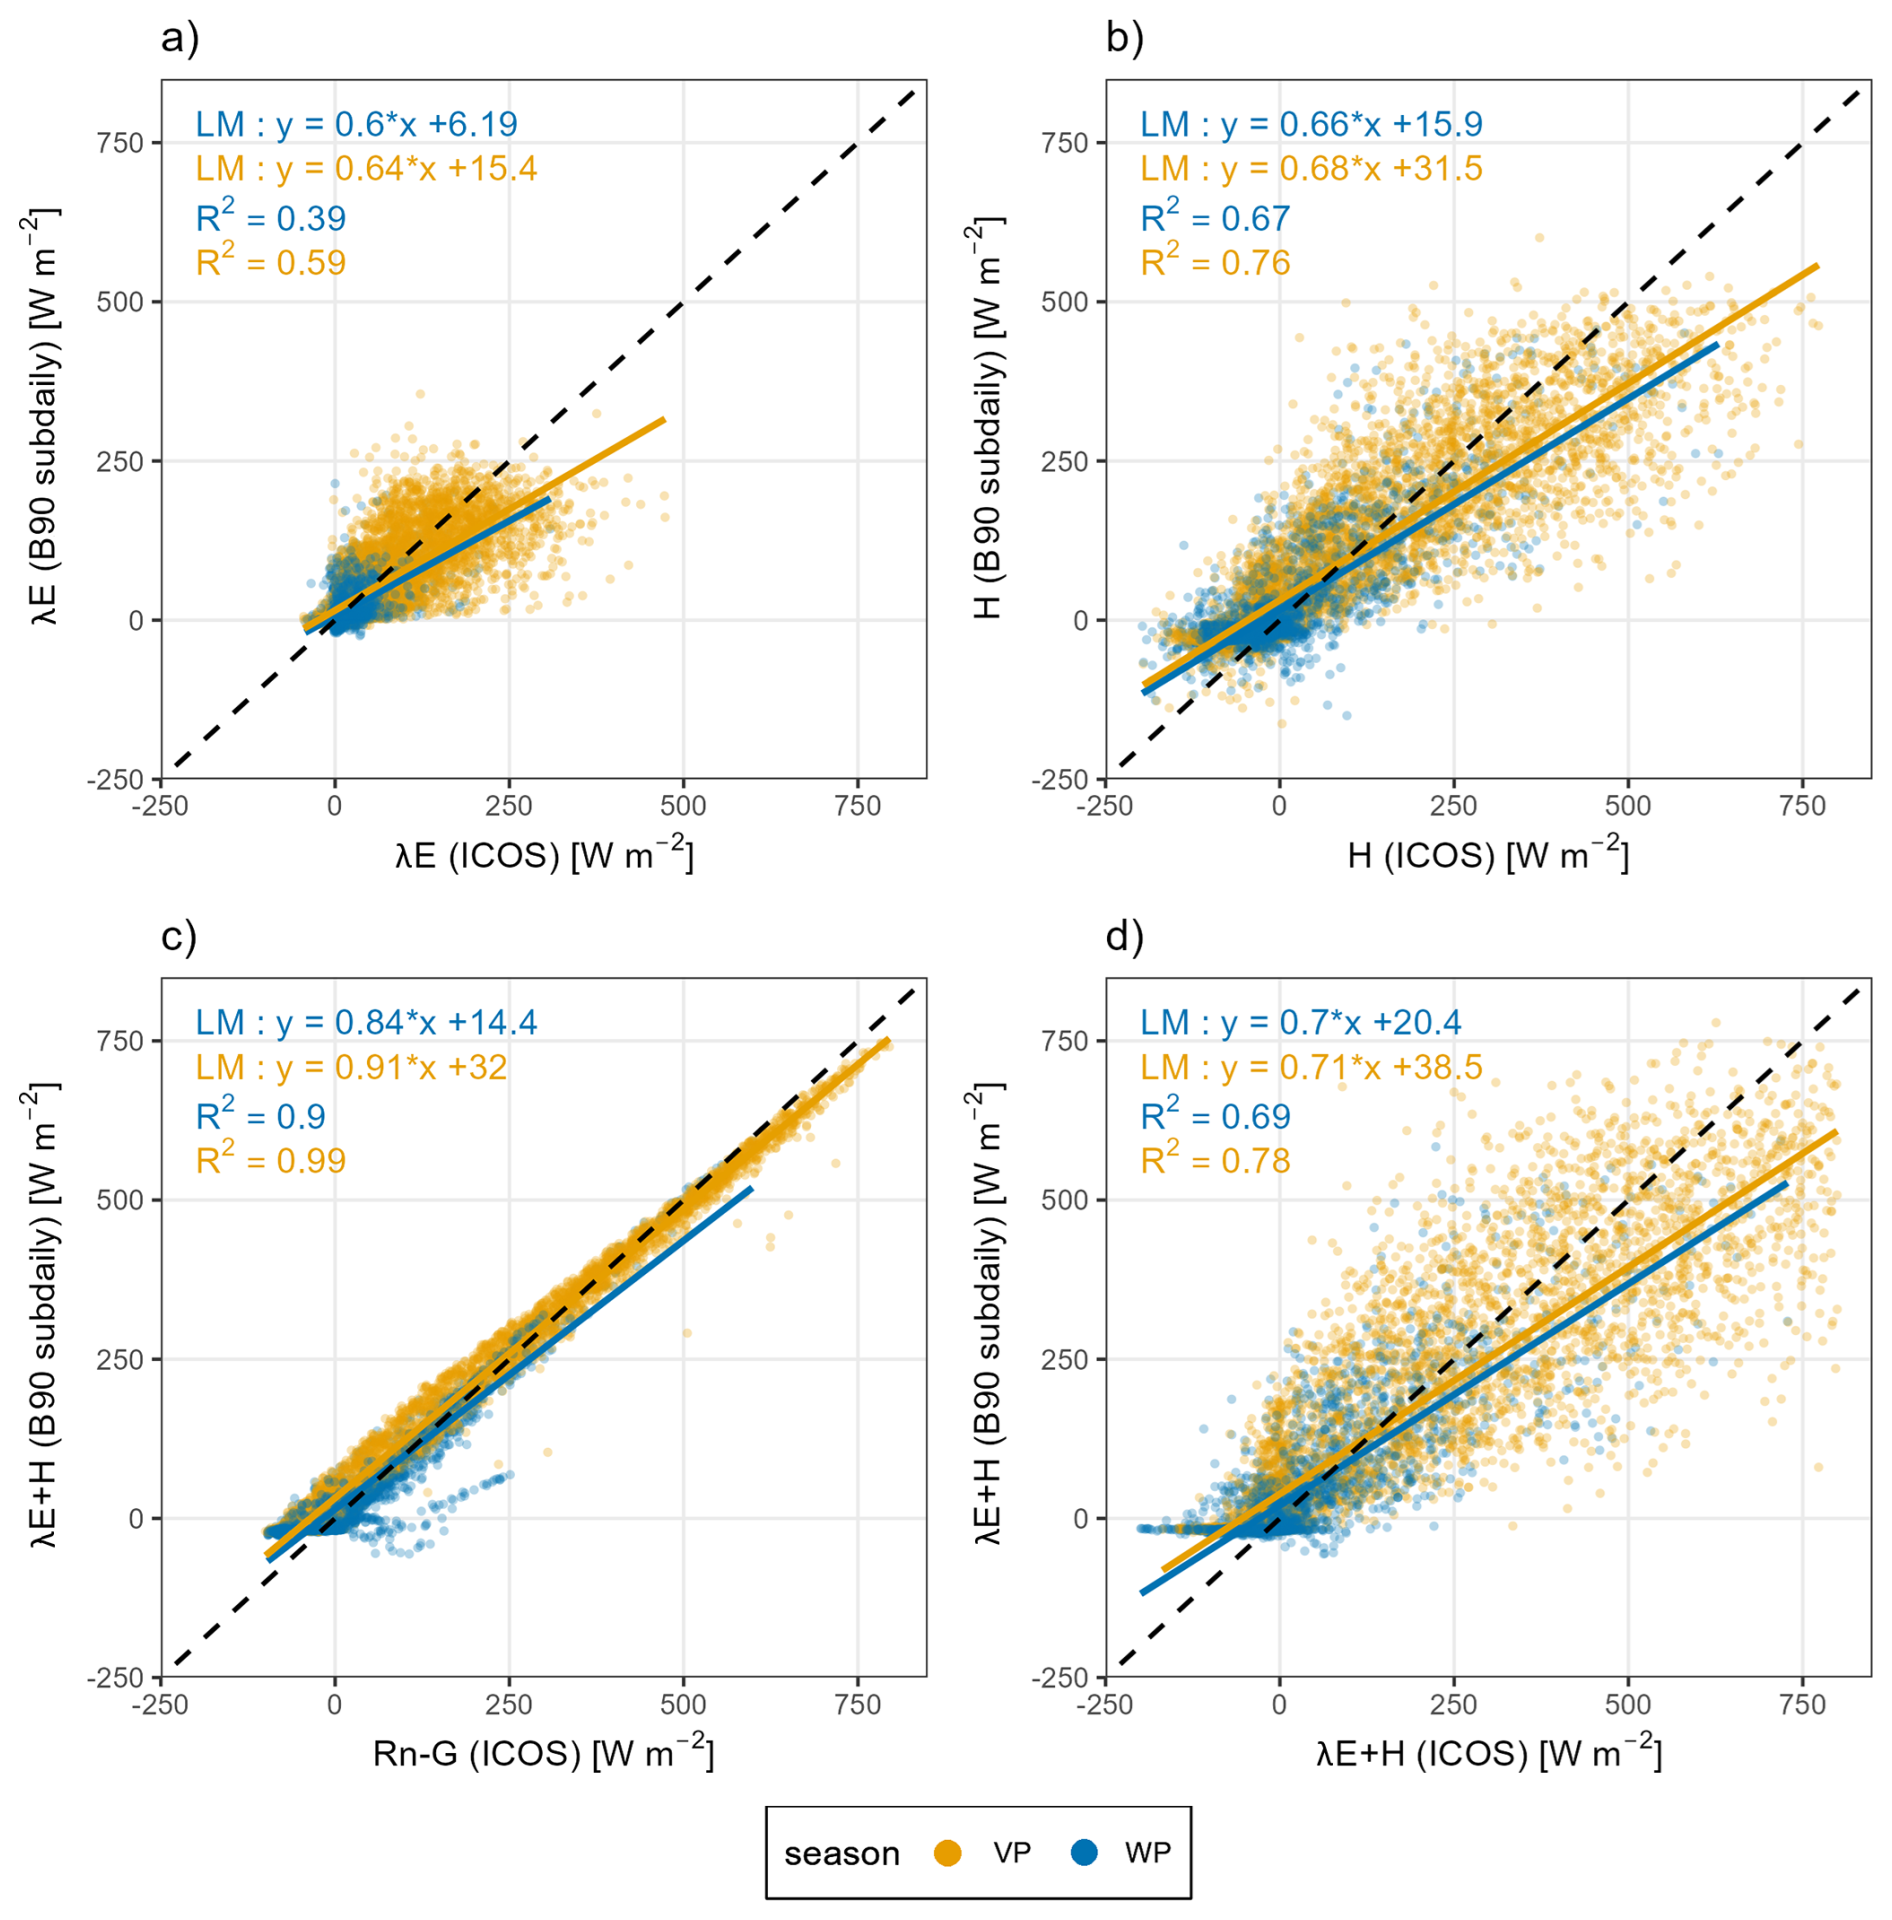
Figure 5Evaluation of 30 min-resolution energy fluxes from B90 model for year 2024 with eddy-covariance measurements (with quality flag “0” – observed): (a) latent heat, (b) sensible heat, (c) energy balance closure, (d) total energy flux.
Figure 6 and Table 2 presents the cumulative sensible (H) and latent heat fluxes (λE) simulated by the B90 model in comparison with the interquartile range (25th to 75th percentiles) of the processed ICOS observations. The modelled H aligns closely with the median (50th percentile) of the ICOS data, whereas lies within the interquartile range, specifically between the 25th and 50th percentiles of the observed data, indicating a systematic underestimation potentially attributable to the selected site-specific parameterization. The relatively large interquartile range (IQR) in Fig. 6 is expected and reflects the inherent variability of eddy-covariance measurements. High-frequency observations (25 Hz) show considerable variance due to strong winds at 40 m height and the large, heterogeneous tower footprint (up to ∼ 300 m). When fluxes are aggregated to 30 min intervals and cumulative values are calculated, this variability propagates over time, resulting in the observed wide IQR. During the initial quarter of the vegetation period, the cumulative energy fluxes for both H and λE show similar trends between model and observations. However, from that point onward, the model begins to increasingly underestimate λE, a trend that continues until the end of the year. In contrast, the underestimation of H diminishes with the onset of winter, likely due to the reduced role of vegetation-mediated processes in cooler months. The most notable discrepancy is the persistent underestimation of net radiation (Rn) in the ICOS dataset relative to the cumulative turbulent fluxes (Fig. 6c). We could not identify a clear explanation for this mismatch. Notably, the cumulative sum of available energy (Rn − G) from the ICOS data is approximately 18 % lower than both the observed and modelled cumulative turbulent fluxes. This discrepancy may reflect unaccounted energy storage components (keeping in mind that the time-series are discontinuous – only values with best quality flag are filtered, so we don't know if and when the storage gets emptied) within the canopy or soil, which are not explicitly considered in either the measurement gap-filling or the current model configuration.
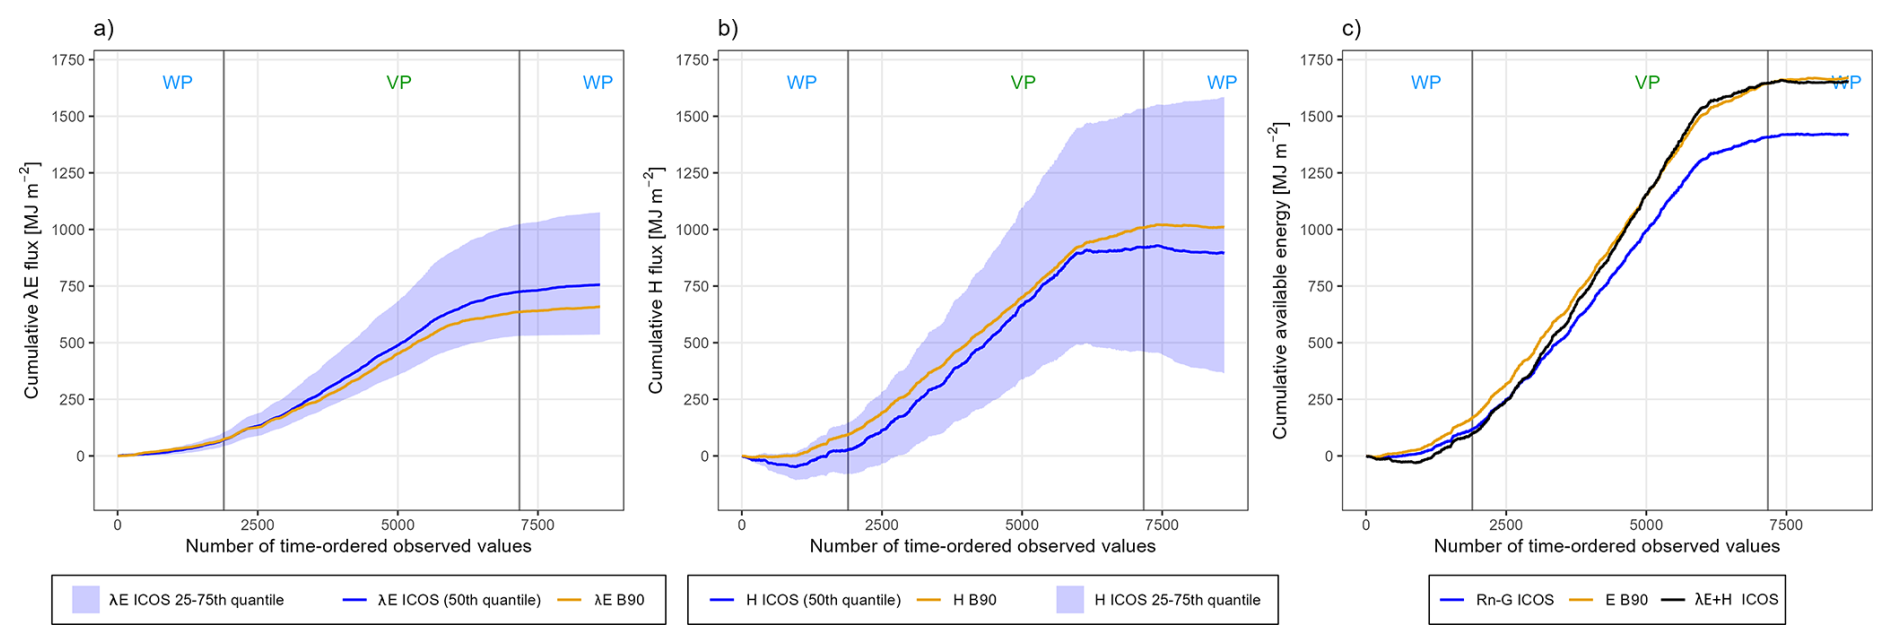
Figure 6Cumulated observed and modelled 30 min energy fluxes for the year 2024 with quality flag “0” (observed): (a) latent heat, (b) sensible heat, (c) total available energy.
Table 2Subdaily quantile errors between observed and simulated latent and sensible heat fluxes by month (2024) with quality flag “0” (observed).
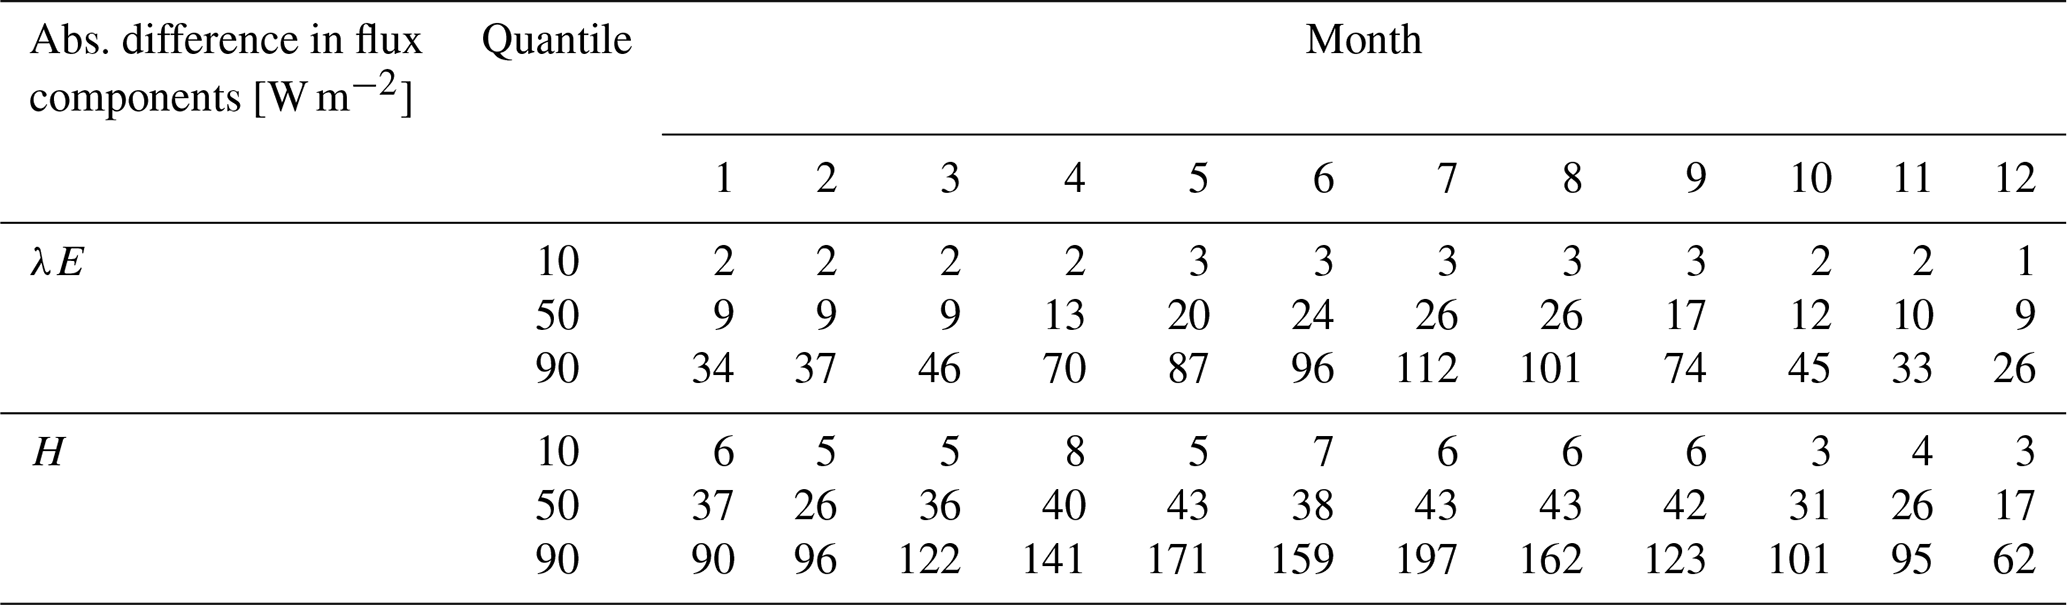
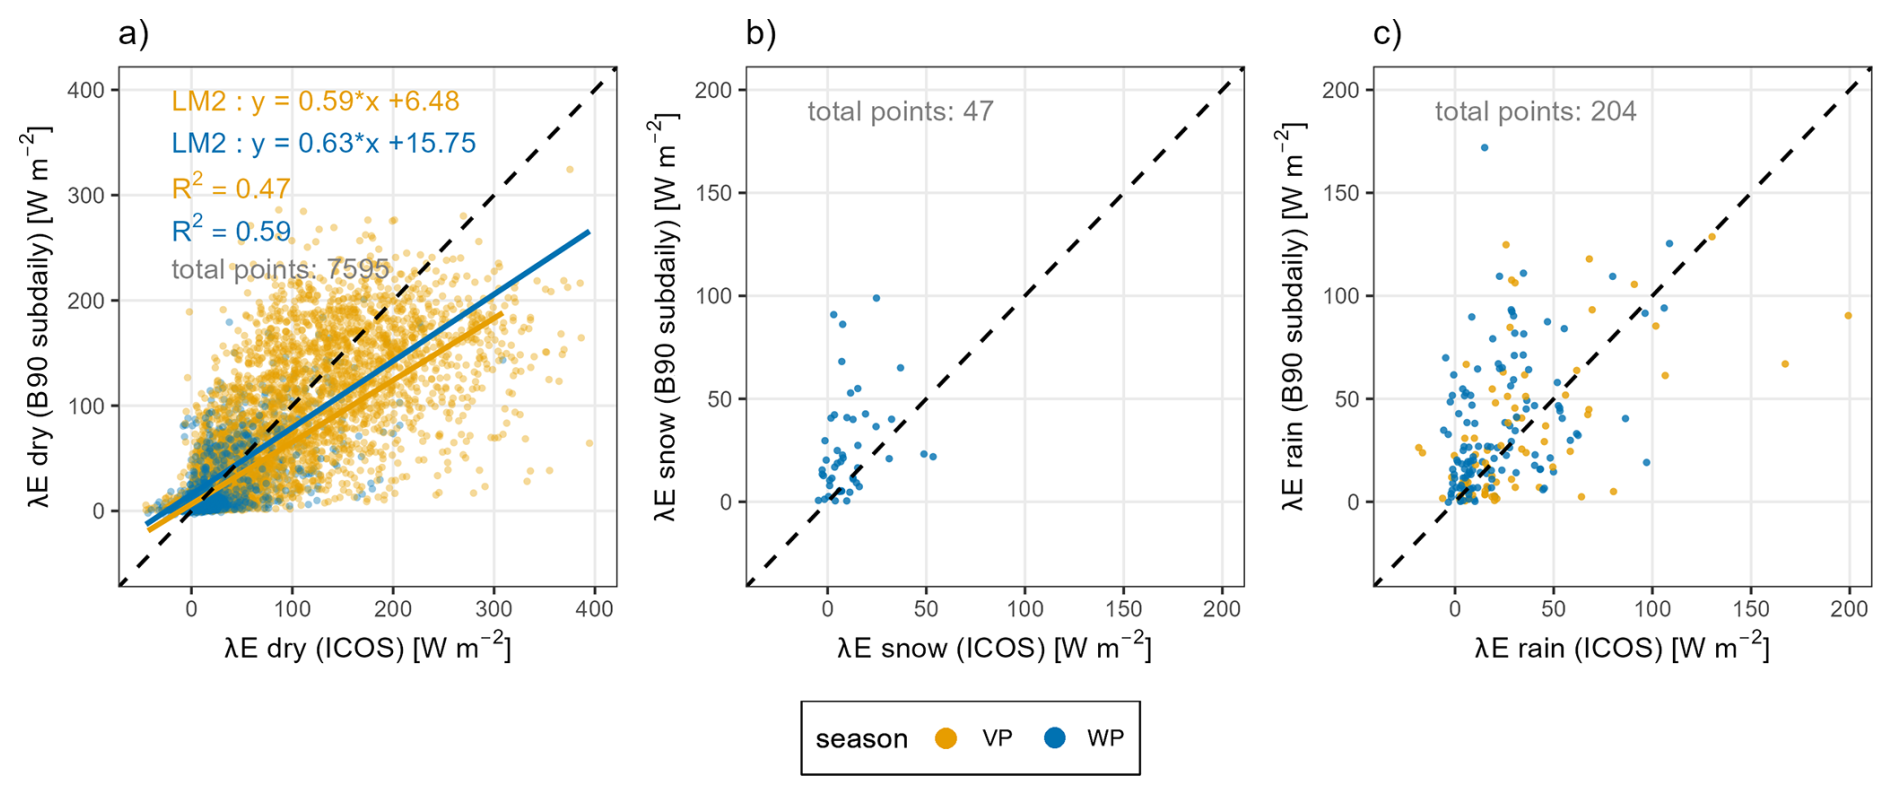
Figure 7Comparison of different weather conditions for 30 min-resolution latent heat flux: (a) dry weather (transpiration and soil/snow evaporation), (b) wet and snowy weather (snow interception), (c) wet and rainy weather (rain interception).
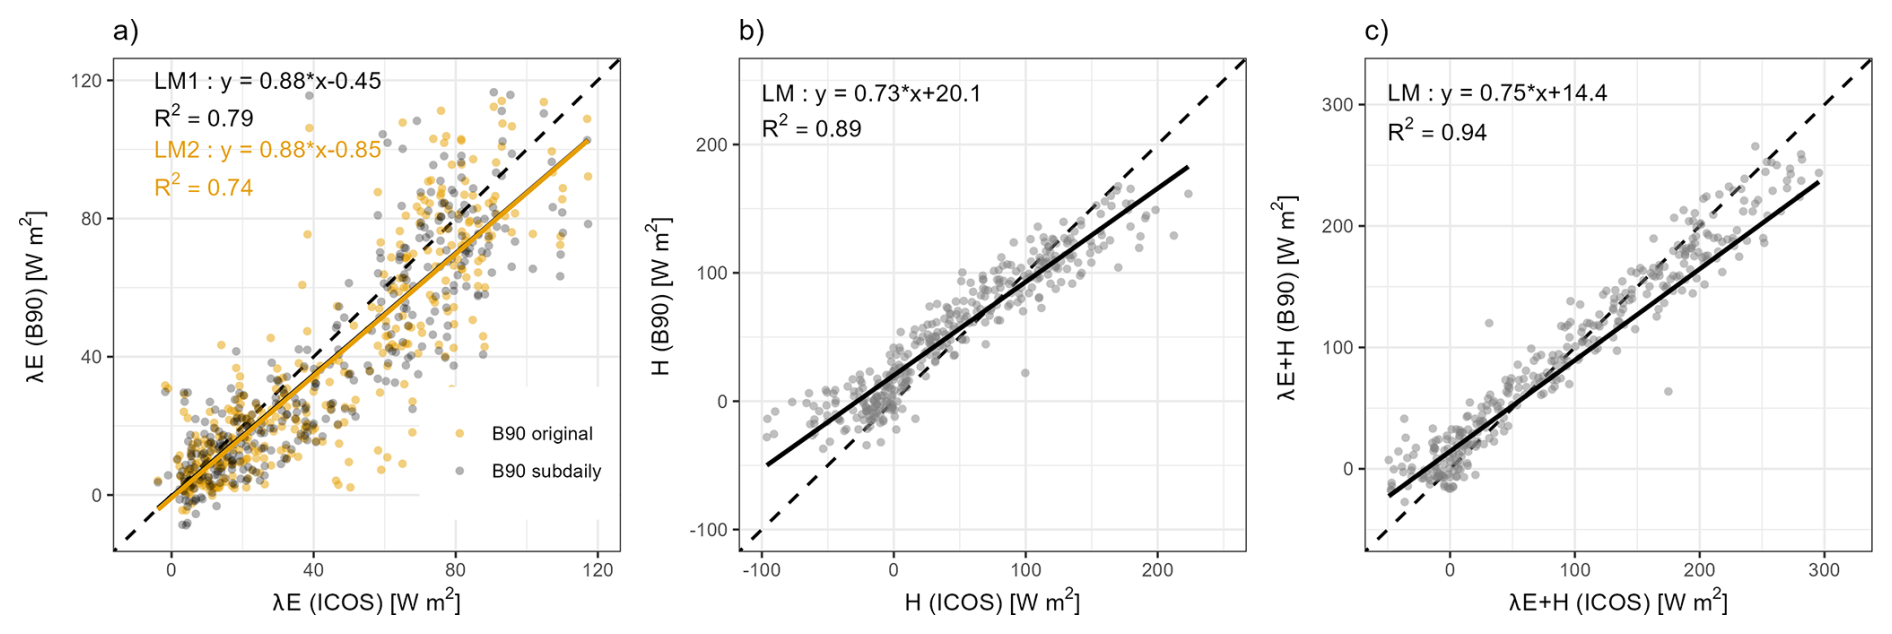
Figure 8Evaluation of daily energy fluxes from B90 model for the for year 2024 with eddy-covariance measurements: (a) latent heat, (b) sensible heat, (c) total energy flux.
In the B90 model framework, dry conditions are defined as time steps without precipitation, during which both the canopy and ground surfaces are free of water. In contrast, wet conditions refer to periods when water or snow is stored on the canopy or ground surfaces, but no precipitation is actively occurring. Our results indicate a clear difference in the model's performance in simulating latent heat flux (λE) under dry versus wet conditions. As illustrated in Fig. 7, model performance is highest under dry conditions. During these periods, λE is primarily driven by transpiration, suggesting that B90 effectively captures this component of the evapotranspiration process. The wider scatter observed in the data may be attributed to several factors, including the omission of CO2 effects on stomatal regulation, oversimplified or inaccurate temporal parameterization of the leaf area index (LAI), and the lack of representation of water storage in plant stems. In contrast, model performance under wet conditions – such as those associated with rain or snow – shows little to no correlation with observed latent heat fluxes from ICOS eddy covariance measurements. Precipitation type (rain or snow) was distinguished using an air temperature threshold. The poor agreement under these conditions may be due to limitations in the interception module of B90 and/or reduced measurement accuracy of eddy covariance systems during precipitation events. It is well documented that water-covered anemometer sensors and flux towers can introduce biases under such conditions. Further investigation into interception and throughfall processes, supported by targeted field observations, could help to elucidate these discrepancies and improve model representation.
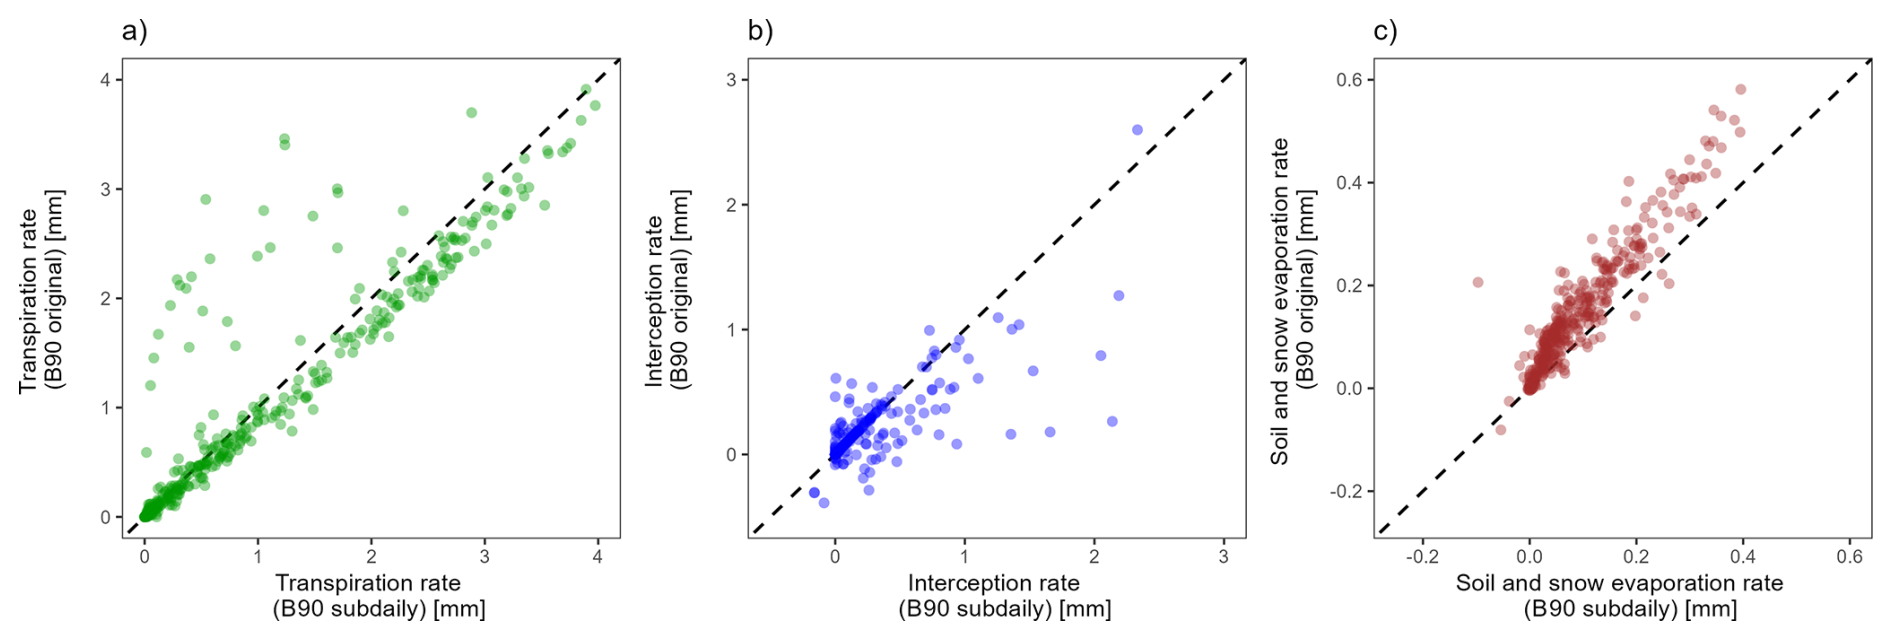
Figure 9Comparison of evaporation components between original daily and aggregated subdaily B90 models for the year 2024: (a) transpiration, (b) snow and rain interception, (c) evaporation from soil and snow.
The aggregation of 30 min simulation outputs to daily values yields highly satisfactory agreement with observations, as illustrated in Fig. 8. Among the energy flux components, latent heat flux (λE) exhibits the lowest performance, with a coefficient of determination (R2) of 0.79. In contrast, sensible heat flux (H) and the combined flux (λE + H) show stronger correlations with measured data, indicating a robust representation of the overall energy exchange. The systematic underestimation of simulated energy fluxes – particularly λE – may be attributable to the omission of energy storage terms within the canopy. Incorporating such storage processes in future model developments could enhance the accuracy of energy balance closure.
Additionally, we compared the 24 h aggregated latent heat flux (λE) values from the subdaily B90 simulations with the corresponding daily λE outputs from the original B90 model (Fig. 9). As shown in Fig. 9, the same parameter set was applied to both the original and subdaily B90 model configurations. This consistency indicates parameter stability across varying simulation time steps. Additional tests were conducted using a range of temporal resolutions (0.5, 1, 2, 3, 4, 6, 8, and 12 h). These tests revealed no significant improvement in model performance associated with a specific aggregation interval. However, model accuracy begins to degrade when subdaily B90 is applied with time steps exceeding 8 h, particularly when compared to the original daily B90 results. This decline is attributed to the inherent design of the original B90, which incorporates a fixed diurnal (day–night) partitioning of mass fluxes. Consequently, subdaily B90 simulations using a 12 h interval (e.g., split at midnight and midday) cannot adequately resolve diurnal dynamics and fail to capture the distinct day and night flux components.
Therefore, we recommend the application of the subdaily B90 model for simulation intervals of 8 h or less. This recommendation is based on the structure of the original model, which incorporates a day–night separation in the evapotranspiration process, resulting in improved performance at coarser temporal resolutions – particularly at daily (24 h) time steps. However, this does not imply that daily aggregates derived from subdaily B90 simulations are inferior. On the contrary, the model preserves the integrity of process-based simulations across temporal scales, ensuring that high-resolution outputs can be reliably aggregated to longer time steps without loss of data quality.
We presented an enhanced version of the BROOK90 hydrological model capable of simulating water and energy fluxes at subdaily temporal resolution for vegetated land surfaces. In addition to implementing subdaily time steps, we explicitly close the energy balance within the new B90 framework. Model validation for the selected study site demonstrates good agreement between eddy covariance measurements and simulated fluxes at 30 min intervals.
While the updated model shows promising results, several simplifications were necessary to avoid introducing additional parameters. Notably, processes such as energy and water storage within the canopy and soil, which are relevant at subhourly scales (i.e., Federer, 2002), are currently omitted. Their inclusion would require new parameters that have not yet been incorporated in this version.
Moreover, as turbulent exchange becomes increasingly important with finer temporal resolutions, it is essential to account for atmospheric stability in estimating aerodynamic resistances. This aspect is especially relevant for correctly simulating turbulent fluxes (Banerjee et al., 2017).
Despite these limitations, the subdaily implementation of B90 provides valuable opportunities to investigate long-term and climatological variations in water and energy balances at finer temporal scales. Unlike most hydrological models that operate on a daily basis, subdaily B90 enables the detailed study of high-frequency processes such as dew formation, interception, and fog deposition.
-
Eddy-covariance system – GA_CP-LI-COR LI-7200, SA-Gill,
-
HS-50, Grill R3-50, 42 m height,
-
Air temperature and relative humidity – RHTEMP-Vaisala HMP45, 40 m height,
-
Precipitation – Pluvio2 (OTT Hydromet), 1 m height,
-
Wind speed - SA-Gill HS-50, Grill R3-50, 42 m height,
-
Shortwave radiation – CNF4 (Kipp&Zonen), 37 m height,
-
Soil heat flux – SOIL_H-Hukseflux HFP01SC, 5 cm depth,
-
Soil moisture – SWCTEMP-Campbell CS65X, 2–50 cm depth.
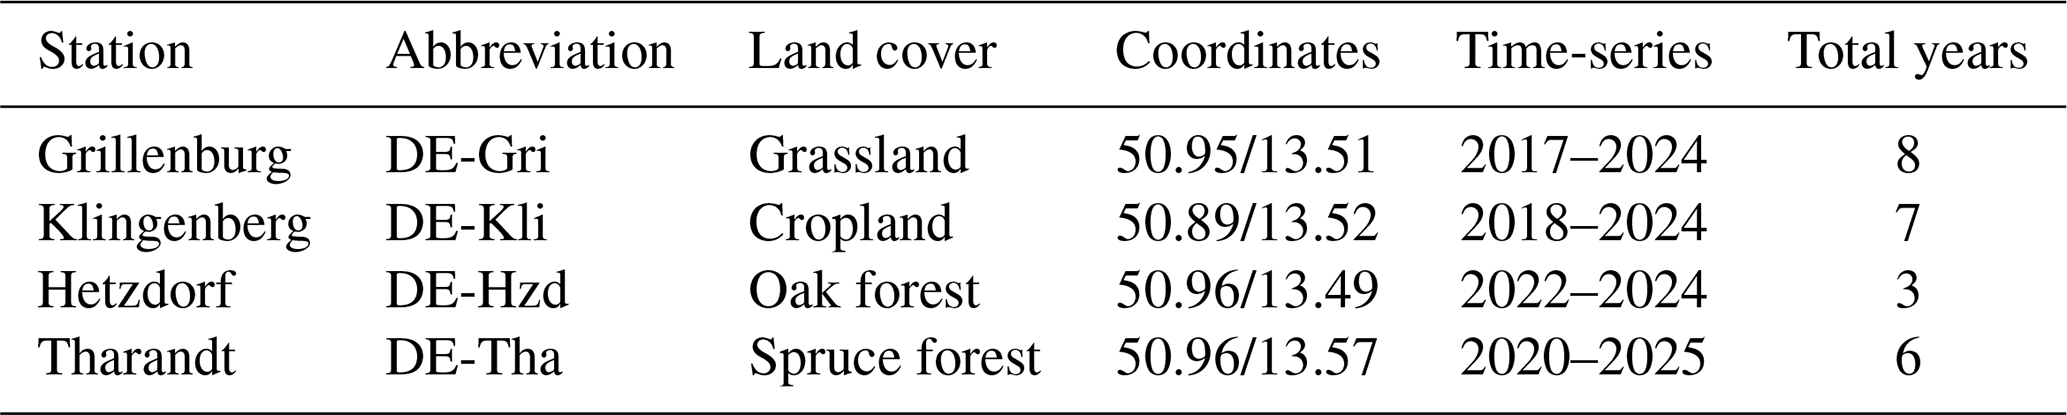
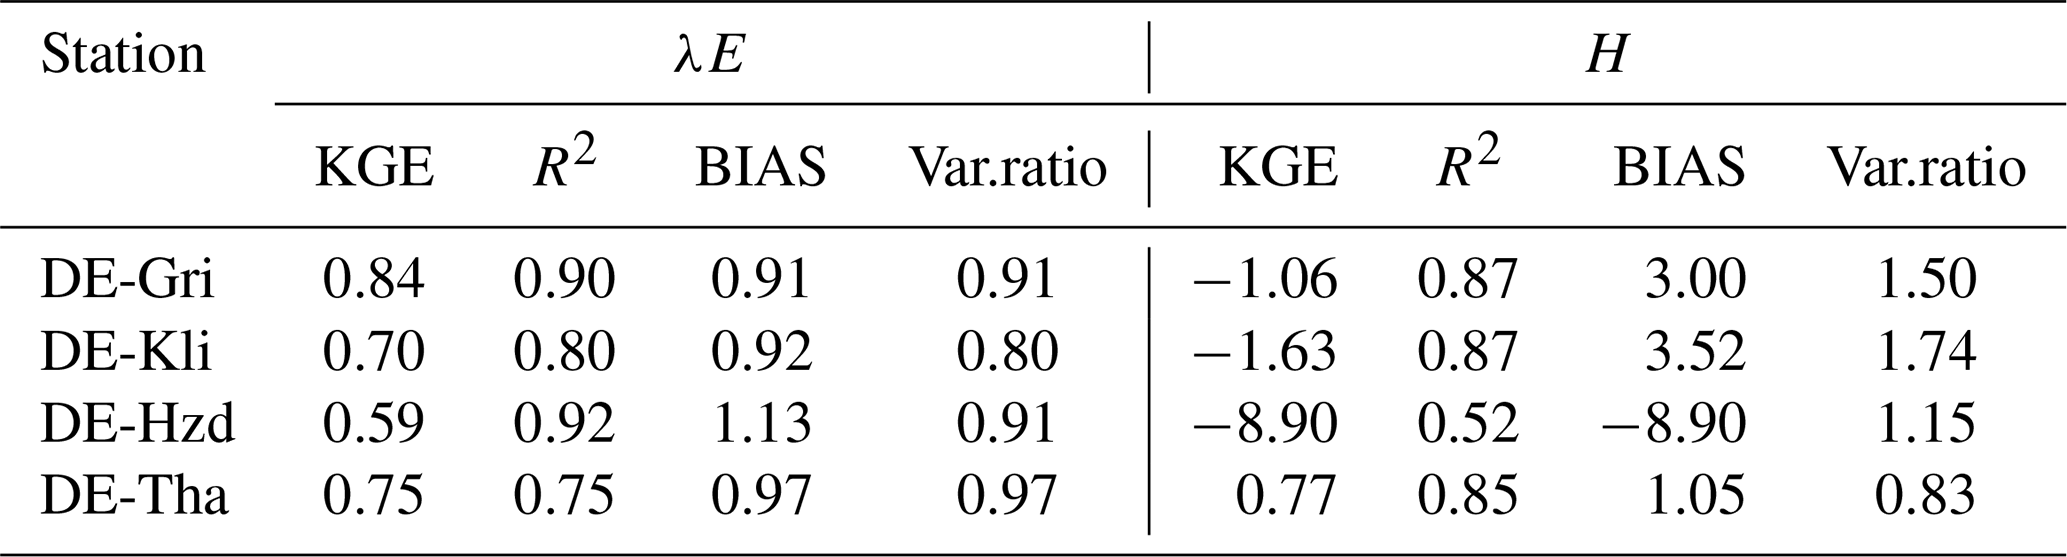
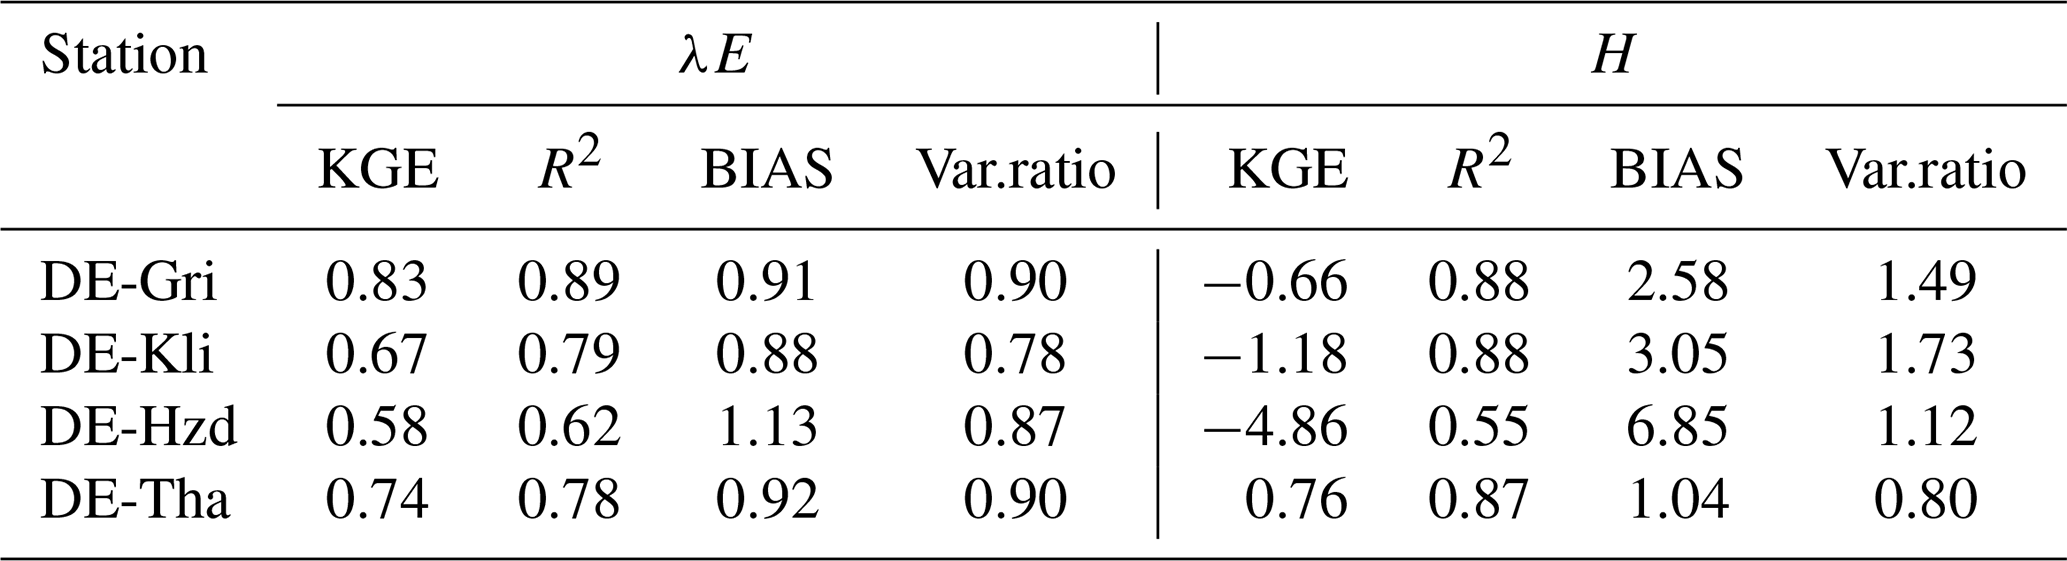
Here we present validation results of the subdaily BROOK90 model using additional ICOS-class eddy-covariance stations located in the vicinity of the DE-Tha station and representing different land-cover types. Table B1 summarizes the location, land cover, and available time period of each station used for the additional validation. The model parameterisation for these stations was adopted from Vorobevskii et al. (2022). The evaluation was based on the comparison of simulated and observed latent heat flux (λE) and sensible heat flux (H) for 30 min time-scale using the Kling–Gupta efficiency (KGE) metric and its components. A half-year model warm-up period was applied.
Table B2 presents the validation results using all available eddy-covariance observations. This comparison provides an overall assessment of model performance across the full available time series, including measured and gap-filled or lower-quality observations.
Table B3 presents the same validation metrics, but only for observations with quality flag 0, representing directly measured high-quality flux data. This stricter filtering allows the model performance to be assessed against the most reliable observational subset.
Table B1Summary of the ICOS eddy-covariance stations used for additional validation.
The open-source subdaily extension of BROOK90 model (Version 1.0) as well as sample data from Anchor DE-Tha ICOS station is available under the following permanent archive https://doi.org/10.5281/zenodo.15340747 (Kronenberg and Vorobevskii, 2025). The GitHub repository for the model with the latest updates is available at: https://github.com/hydrovorobey/Subdaily_BROOK90 (last access: 16 June 2026).
Conceptualization: RK; data curation: RK, IV; formal analysis: IV, RK; methodology: RK, IV; visualization: IV; writing – original draft preparation: RK, IV, TL; writing – review: US, DK, MM.
The contact author has declared that none of the authors has any competing interests.
Publisher's note: Copernicus Publications remains neutral with regard to jurisdictional claims made in the text, published maps, institutional affiliations, or any other geographical representation in this paper. The authors bear the ultimate responsibility for providing appropriate place names. Views expressed in the text are those of the authors and do not necessarily reflect the views of the publisher.
This research has been supported by the Deutscher Akademischer Austauschdienst (DAAD) (grant no. 57706800).
This paper was edited by Makoto Saito and reviewed by two anonymous referees.
Allen, R. G., Pereira, L. S., Raes, D., and Smith, M.: Crop evapotranspiration: guidelines for computing crop water requirements, FAO Irrigation and Drainage Paper 56, Food and Agriculture Organization of the United Nations, Rome, Italy, 300 pp., ISBN 92-5-104219-5, 1998.
Banerjee, T., De Roo, F., and Mauder, M.: Explaining the convector effect in canopy turbulence by means of large-eddy simulation, Hydrol. Earth Syst. Sci., 21, 2987–3000, https://doi.org/10.5194/hess-21-2987-2017, 2017.
Bernhofer, C., Eichelmann, U., Grünwald, T., Hehn, M., Mauder, M., Moderow, U., and Prasse, H.: ETC L2 ARCHIVE from Tharandt, 2019-12-31–2023-12-31, ICOS RI [data set], https://hdl.handle.net/11676/sK3B_d3_VIWH8ZJkScV9zGZ_ (last access: 10 June 2026), 2024.
Calder, I. R.: Dependence of rainfall interception on drop size: 1. Development of the two-layer stochastic model, J. Hydrol., 185, 363–378, https://doi.org/10.1016/0022-1694(95)02998-2, 1996.
Federer, C. A.: BROOK 90: A simulation model for evaporation, soil water, and streamflow, http://www.ecoshift.net/brook/b90doc.html (last access: 10 June 2026), 2002.
Federer, C. A. and Lash, D.: Simulated streamflow response to possible differences in transpiration among species of hardwood trees, Water Resour. Res., 14, 1089–1097, https://doi.org/10.1029/WR014i006p01089, 1978a.
Federer, C. A. and Lash, D.: BROOK: a hydrologic simulation model for eastern forests, Water Resources Research Center, University of New Hampshire, Durham, NH, USA, Research Report 19, 84 pp., https://scholars.unh.edu/cgi/viewcontent.cgi?article=1171&context=nh_wrrc_scholarship (last access: 16 June 2026), 1978b.
Federer, C. A., Vörösmarty, C., and Fekete, B.: Sensitivity of annual evaporation to soil and root properties in two models of contrasting complexity, J. Hydrometeorol., 4, 1276–1290, https://doi.org/10.1175/1525-7541(2003)004<1276:SOAETS>2.0.CO;2, 2003.
Floriancic, M. G., Allen, S. T., Meier, R., Truniger, L., Kirchner, J. W., and Molnar, P.: Potential for significant precipitation cycling by forest-floor litter and deadwood, Ecohydrology, 16, e2493, https://doi.org/10.1002/eco.2493, 2023.
Gash, J. H. C., Wright, I. R., and Lloyd, C. R.: Comparative estimates of interception loss from three coniferous forests in Great Britain, J. Hydrol., 48, 89–105, https://doi.org/10.1016/0022-1694(80)90068-2, 1980.
Hammel, K. and Kennel, M.: Charakterisierung und Analyse der Wasserverfügbarkeit und des Wasserhaushalts von Waldstandorten in Bayern mit dem Simulationsmodell BROOK90, Forstliche Forschungsberichte München, 185, 135 pp., 2001.
Hohenbrink, T., Schmidt-Walter, P., Hetkamp, G., Meesenburg, H., Köhler, M., Langer, G., Bien, S., Dominic, A. R., Schmidt, A., Natkhin, M., Kuhlmey, K., Stadelmann, C., and Frühauf, C.: Projekt TroWaK: Trockenheitsrisiken im Wald unter Klimawandel, Wasser- und Stoffhaushalt von Wäldern unter Stress, Göttingen, Germany, 24–26 April 2024, https://www.nw-fva.de/fileadmin/nwfva/news/aktuelles/pdf/2024_Poster_WuWTagung_Hohenbrink.pdf (last access: 16 June 2026), 2024.
Jacobs, A. F. G., Heusinkveld, B. G., and Berkowicz, S. M.: Dew deposition and drying in a desert system: a simple simulation model, J. Arid Environ., 42, 211–222, https://doi.org/10.1006/jare.1999.0523, 1999.
Jarvis, P. G.: The interpretation of the variations in leaf water potential and stomatal conductance found in canopies in the field, Philos. T. R. Soc. B, 273, 593–610, https://doi.org/10.1098/rstb.1976.0035, 1976.
Körner, P., Kalaß, D., Kronenberg, R., and Bernhofer, C.: REAL-Fog: a simple approach for calculating the fog in the atmosphere at ground level, Meteorol. Z., 29, 55–65, https://doi.org/10.1127/metz/2019/0976, 2020.
Kronenberg, R. and Oehlschlägel, L. M.: BROOK90 in R, GitHub [code], https://github.com/rkronen/Brook90_R (last access: 10 June 2026), 2019.
Kronenberg, R. and Vorobevskii, I.: Subdaily BROOK90 (V. 1.0): source code and sample data, Zenodo [code and data set], https://doi.org/10.5281/zenodo.15340747, 2025 (code also available at: https://github.com/hydrovorobey/Subdaily_BROOK90, last access: 16 June 2026).
Luong, T. T., Pöschmann, J., Kronenberg, R., and Bernhofer, C.: Rainfall threshold for flash flood warning based on model output of soil moisture: case study Wernersbach, Germany, Water, 13, 1061, https://doi.org/10.3390/w13081061, 2021.
Luong, T. T., Vorobevskii, I., Kronenberg, R., Jacob, F., Peters, A., Petzold, R., and Andreae, H.: Toward reliable model-based soil moisture estimates for forest managers, Meteorol. Z., 32, 143–164, https://doi.org/10.1127/metz/2023/1155, 2023.
Moderow, U., Grünwald, T., Queck, R., Spank, U., and Bernhofer, C.: Energy balance closure and advective fluxes at ADVEX sites, Theor. Appl. Climatol., 143, 761–779, https://doi.org/10.1007/s00704-020-03412-z, 2021.
Monteith, J. L.: Dew, Q. J. Roy. Meteor. Soc., 83, 322–341, https://doi.org/10.1002/qj.49708335706, 1957.
Muñoz-Sabater, J., Dutra, E., Agustí-Panareda, A., Albergel, C., Arduini, G., Balsamo, G., Boussetta, S., Choulga, M., Harrigan, S., Hersbach, H., Martens, B., Miralles, D. G., Piles, M., Rodríguez-Fernández, N. J., Zsoter, E., Buontempo, C., and Thépaut, J.-N.: ERA5-Land: a state-of-the-art global reanalysis dataset for land applications, Earth Syst. Sci. Data, 13, 4349–4383, https://doi.org/10.5194/essd-13-4349-2021, 2021.
Parlange, M. B., Eichinger, W. E., and Albertson, J. D.: Regional scale evaporation and the atmospheric boundary layer, Rev. Geophys., 33, 99–124, https://doi.org/10.1029/94RG03112, 1995.
Pastorello, G., Trotta, C., Canfora, E., Chu, H., Christianson, D., Cheah, Y.-W., Poindexter, C., Chen, J., Elbashandy, A., Humphrey, M., Isaac, P., Polidori, D., Reichstein, M., Ribeca, A., Van Ingen, C., Vuichard, N., Zhang, L., Amiro, B., Ammann, C., Arain, M. A., Ardö, J., Arkebauer, T., Arndt, S. K., Arriga, N., Aubinet, M., Aurela, M., Baldocchi, D., Barr, A., Beamesderfer, E., Marchesini, L. B., Bergeron, O., Beringer, J., Bernhofer, C., Berveiller, D., Billesbach, D., Black, T. A., Blanken, P. D., Bohrer, G., Boike, J., Bolstad, P. V., Bonal, D., Bonnefond, J.-M., Bowling, D. R., Bracho, R., Brodeur, J., Brümmer, C., Buchmann, N., Burban, B., Burns, S. P., Buysse, P., Cale, P., Cavagna, M., Cellier, P., Chen, S., Chini, I., Christensen, T. R., Cleverly, J., Collalti, A., Consalvo, C., Cook, B. D., Cook, D., Coursolle, C., Cremonese, E., Curtis, P. S., D'Andrea, E., Da Rocha, H., Dai, X., Davis, K. J., Cinti, B. D., Grandcourt, A. D., Ligne, A. D., De Oliveira, R. C., Delpierre, N., Desai, A. R., Di Bella, C. M., Tommasi, P. D., Dolman, H., Domingo, F., Dong, G., Dore, S., Duce, P., Dufrêne, E., Dunn, A., Dušek, J., Eamus, D., Eichelmann, U., ElKhidir, H. A. M., Eugster, W., Ewenz, C. M., Ewers, B., Famulari, D., Fares, S., Feigenwinter, I., Feitz, A., Fensholt, R., Filippa, G., Fischer, M., Frank, J., Galvagno, M., Gharun, M., Gianelle, D., Gielen, B., Gioli, B., Gitelson, A., Goded, I., Goeckede, M., Goldstein, A. H., Gough, C. M., Goulden, M. L., Graf, A., Griebel, A., Gruening, C., Grünwald, T., Hammerle, A., Han, S., Han, X., Hansen, B. U., Hanson, C., Hatakka, J., He, Y., Hehn, M., Heinesch, B., Hinko-Najera, N., Hörtnagl, L., Hutley, L., Ibrom, A., Ikawa, H., Jackowicz-Korczynski, M., Janouš, D., Jans, W., Jassal, R., Jiang, S., Kato, T., Khomik, M., Klatt, J., Knohl, A., Knox, S., Kobayashi, H., Koerber, G., Kolle, O., Kosugi, Y., Kotani, A., Kowalski, A., Kruijt, B., Kurbatova, J., Kutsch, W. L., Kwon, H., Launiainen, S., Laurila, T., Law, B. E., Leuning, R., Li, Y., Liddell, M., Limousin, J.-M., Lion, M., Liska, A. J., Lohila, A., López-Ballesteros, A., López-Blanco, E., Loubet, B., Loustau, D., Lucas-Moffat, A., Lüers, J., Ma, S., Macfarlane, C., Magliulo, V., Maier, R., Mammarella, I., Manca, G., Marcolla, B., Margolis, H. A., Marras, S., Massman, W., Mastepanov, M., Matamala, R., Matthes, J. H., Mazzenga, F., McCaughey, H., McHugh, I., McMillan, A. M. S., Merbold, L., Meyer, W., Meyers, T. P., Miller, S. D., Minerbi, S., Moderow, U., Monson, R. K., Montagnani, L., Moore, C. E., Moors, E., Moreaux, V., Moureaux, C., Munger, J. W., Nakai, T., Neirynck, J., Nesic, Z., Nicolini, G., Noormets, A., Northwood, M., Nosetto, M., Nouvellon, Y., Novick, K., Oechel, W., Olesen, J. E., Ourcival, J.-M., Papuga, S. A., Parmentier, F.-J., Paul-Limoges, E., Pavelka, M., Peichl, M., Pendall, E., Phillips, R. P., Pilegaard, K., Pirk, N., Posse, G., Powell, T., Prasse, H., Prober, S. M., Rambal, S., Rannik, Ü., Raz-Yaseef, N., Rebmann, C., Reed, D., Dios, V. R. D., Restrepo-Coupe, N., Reverter, B. R., Roland, M., Sabbatini, S., Sachs, T., Saleska, S. R., Sánchez-Cañete, E. P., Sanchez-Mejia, Z. M., Schmid, H. P., Schmidt, M., Schneider, K., Schrader, F., Schroder, I., Scott, R. L., Sedlák, P., Serrano-Ortíz, P., Shao, C., Shi, P., Shironya, I., Siebicke, L., Šigut, L., Silberstein, R., Sirca, C., Spano, D., Steinbrecher, R., Stevens, R. M., Sturtevant, C., Suyker, A., Tagesson, T., Takanashi, S., Tang, Y., Tapper, N., Thom, J., Tomassucci, M., Tuovinen, J.-P., Urbanski, S., Valentini, R., Van Der Molen, M., Van Gorsel, E., Van Huissteden, K., Varlagin, A., Verfaillie, J., Vesala, T., Vincke, C., Vitale, D., Vygodskaya, N., Walker, J. P., Walter-Shea, E., Wang, H., Weber, R., Westermann, S., Wille, C., Wofsy, S., Wohlfahrt, G., Wolf, S., Woodgate, W., Li, Y., Zampedri, R., Zhang, J., Zhou, G., Zona, D., Agarwal, D., Biraud, S., Torn, M., and Papale, D.: The FLUXNET2015 dataset and the ONEFlux processing pipeline for eddy covariance data, Sci. Data, 7, 225, https://doi.org/10.1038/s41597-020-0534-3, 2020.
Schmidt-Walter, P., Trotsiuk, V., Meusburger, K., and Zacios, M.: Advancing simulations of water fluxes, soil moisture and drought stress by using the LWF-Brook90 hydrological model in R, Agr. Forest Meteorol., 291, 108023, https://doi.org/10.1016/j.agrformet.2020.108023, 2020.
Schwärzel, K., Feger, K.-H., Häntzschel, J., Menzer, A., Spank, U., Clausnitzer, F., Köstner, B., and Bernhofer, C.: A novel approach in model-based mapping of soil water conditions at forest sites, Forest Ecol. Manag., 258, 2163–2174, https://doi.org/10.1016/j.foreco.2009.03.033, 2009.
Shuttleworth, W. J. and Gurney, R. J.: The theoretical relationship between foliage temperature and canopy resistance in sparse crops, Q. J. Roy. Meteor. Soc., 116, 497–519, https://doi.org/10.1002/qj.49711649213, 1990.
Shuttleworth, W. J. and Wallace, J. S.: Evaporation from sparse crops – an energy combination theory, Q. J. Roy. Meteor. Soc., 111, 839–855, https://doi.org/10.1002/qj.49711146910, 1985.
Stewart, J. B.: Modelling surface conductance of pine forest, Agr. Forest Meteorol., 43, 19–35, https://doi.org/10.1016/0168-1923(88)90003-2, 1988.
Taylor, C. M., de Jeu, R. A. M., Guichard, F., Harris, P. P., and Dorigo, W. A.: Afternoon rain more likely over drier soils, Nature, 489, 423–426, https://doi.org/10.1038/nature11377, 2012.
Ulker, M. C. and Buyukyildiz, M.: Evaluation of runoff simulation using the global BROOK90-R model for three sub-basins in Türkiye, Sustainability, 15, 5103, https://doi.org/10.3390/su15065103, 2023.
Vorobevskii, I., Kronenberg, R., and Bernhofer, C.: Global BROOK90 R package: an automatic framework to simulate the water balance at any location, Water, 12, 2037, https://doi.org/10.3390/w12072037, 2020.
Vorobevskii, I., Luong, T. T., Kronenberg, R., Grünwald, T., and Bernhofer, C.: Modelling evaporation with local, regional and global BROOK90 frameworks: importance of parameterization and forcing, Hydrol. Earth Syst. Sci., 26, 3177–3239, https://doi.org/10.5194/hess-26-3177-2022, 2022.
Vorobevskii, I., Luong, T. T., Kronenberg, R., and Petzold, R.: High-resolution operational soil moisture monitoring for forests in central Germany, Hydrol. Earth Syst. Sci., 28, 3567–3595, https://doi.org/10.5194/hess-28-3567-2024, 2024.
Wilson, K. B., Baldocchi, D. D., and Hanson, P. J.: Quantifying stomatal and non-stomatal limitations to carbon assimilation resulting from leaf aging and drought in mature deciduous tree species, Tree Physiol., 20, 787–797, https://doi.org/10.1093/treephys/20.12.787, 2000.
- Abstract
- Introduction and Motivation
- Location and eddy-covariance measurement data
- Extension of the model: energy balance components and closure
- Results and discussion
- Conclusions
- Appendix A: Description of the instruments and measured variables at the ICOS DE-Tha station used in this study
- Appendix B: Additional validation of the subdaily BROOK90 model using eddy covariance data from other stations
- Code and data availability
- Author contributions
- Competing interests
- Disclaimer
- Financial support
- Review statement
- References