the Creative Commons Attribution 4.0 License.
the Creative Commons Attribution 4.0 License.
 | 21 May 2026
Meta-modelling of carbon fluxes from crop and grassland multi-model outputs
Roland Hollós
Nándor Zrinyi
Zoltán Barcza
Gianni Bellocchi
Renáta Sándor
János Ruff
We evaluated five stacking-based meta-models – Multiple Linear Regression, Random Forest, XGBoost, and also Random Forest and XGBoost with environmental covariates (RF+ and XGB+, respectively) – against the multi-model median (MMM) and best individual process-based models for gross primary production (GPP), ecosystem respiration (RECO) and net ecosystem exchange (NEE) at two cropland and two grassland sites. We tested two validation strategies for GPP and RECO ( training/validation approach and the time-aware leave-one-year-out (LOYO) method), and three strategies for NEE (, complete LOYO and independent validation using the meta-model based RECO-GPP). All meta-models were associated with improved RMSE, bias and correlation. Based on the LOYO validation strategy, average correlation increase was ∼ 2 % for GPP (0.2 %–4.4 %), 9 % for RECO (5 %–13.6 %) and 8 % for NEE (0.5 %–12.5 %). In the case of the independent validation strategy correlation increase was ∼ 40 % for NEE (24.5 %–64 %). Bias was nearly eliminated except at one cropland site. Wilcoxon signed-rank tests confirmed that improvements were statistically significant for 72 % of model-site-variable combinations, with particularly robust results for grassland sites where all meta-models significantly outperformed MMM, while one cropland site with limited data showed no significant improvements. SHapley Additive exPlanations (SHAP) analysis of XGB+ showed that diverse individual models, not always the top performers, contributed most, and that temperature – especially for RECO in croplands and NEE in grasslands – was the dominant environmental driver, while precipitation had minor effects. These findings highlight the predictive and diagnostic advantages of meta-modeling approaches over MMM, with potential applications across agroecosystem, Earth system and environmental model ensembles.
- Article
(53245 KB) - Full-text XML
- BibTeX
- EndNote


Biogeochemical processes are central to agricultural planning, underpinning concepts such as “climate-smart agriculture”, “low-carbon agriculture” and “greenhouse gas-mitigating farming practices” within narratives/storylines (e.g. Thornton et al., 2018; Hou and Hou, 2019; Anuga et al., 2020). As governments and societies reshape economies, particularly in the context of decarbonisation (e.g. Sroufe and Watts, 2022), biogeochemical modelling has emerged as an essential tool to support agricultural policies (Bellocchi, 2023). These models simulate the complex interactions between agriculture and ecosystem services, such as C sequestration, biodiversity conservation and water quality regulation, thereby empowering policymakers to integrate ecosystem value into agricultural decision-making and land-use strategies (e.g. Lambin and Meyfroidt, 2011). Moreover, by simulating a wide variety of ecosystem processes, the models facilitate the assessment of agricultural emissions and mitigation strategies, forming a scientific basis for climate policy and agricultural resilience (Li et al., 2006; Valin et al., 2013; Sándor et al., 2018; Lembaid et al., 2021, 2022; Gascuel-Odoux et al., 2022).
Many state-of-the-art biogeochemical models have a long development history with some of them spanning 50 years (Hidy et al., 2022). Still, inherent uncertainties in model structures, parameterisations and assumptions pose challenges for reliable predictions under diverse environmental and management conditions (e.g. Riccio et al., 2007; Bellocchi et al., 2010; Therond et al., 2011; Harrison et al., 2012; Brilli et al., 2017; Bilotto et al., 2021). This calls for improved mathematical tools and innovative solutions to strengthen the trust in the models.
Ensemble modelling has gained prominence as a robust method to address these uncertainties in biogeochemical models (e.g. Challinor et al., 2013; Snow et al., 2014; Calanca et al., 2016; Jones et al., 2017; Knutti et al., 2019). Each model adopts unique assumptions about processes like soil nutrient cycling, photosynthesis, allocation and crop phenology, leading to significant variability in predictions under similar scenarios. Such structural uncertainties (e.g. divergent representations of water stress or heat tolerance), along with parameter uncertainty can lead to inconsistent predictions. Ensemble approaches mitigate these discrepancies by synthesising outputs from multiple models, compensating biases and highlighting consistent trends (e.g. Bassu et al., 2014; Rosenzweig et al., 2014; Kollas et al., 2015; Li et al., 2015b; Ruane et al., 2016, 2017; Sándor et al., 2017, 2020; Ehrhardt et al., 2018; Wallach et al., 2018). This increases the reliability of predictions and reduces the risks associated with over-reliance on individual models.
Although ensemble techniques are proven to improve modelling accuracy and increase the trust in biogeochemical models, problems still exist. For example, the ensemble models are hard to explain, and currently only the simplest methods (averaging or median calculation; Sándor et al., 2016) are the most widely used for ecosystem models. These simple model combination algorithms usually have many implicit presumptions that models often cannot meet (for example, equal variance and independence). In the field of machine learning (ML), which generates models directly from data, instead of following physical, biological and biogeochemical principles, much more developed techniques exist, which can be potentially exploited to improve the predictive power of the ensemble output. These “ML-based” techniques usually have less and more explicitly stated conditions (Scowen et al., 2021).
As an advanced, potentially promising approach, ML based meta-modelling extends the concept of ensemble technique by synthesising outputs even across multiple calibration scenarios. Recent advancements in ML offer innovative tools to refine data-intensive modelling in Earth sciences (e.g. Li et al., 2015a; Jackson et al., 2017; Reichstein et al., 2019; Bai et al., 2021; Chandel et al., 2024; Wang et al., 2024). By using ensemble learning – a subset of ML methods – predictive frameworks can integrate diverse model outputs with improved accuracy and interpretability (e.g. Hansen and Salamon, 1990; Opitz and Maclin, 1999; Dietterich, 2000; Hagedorn et al., 2005). Stacking, as a flexible ensemble learning technique, combines outputs from heterogeneous models into a meta-model, assigning weights to highlight their relative importance (e.g. Breiman, 1996; Van der Laan et al., 2007; Sagi and Rokach, 2018). This approach has potential for biogeochemical modelling, offering simplicity and adaptability with Multiple Linear Regression (e.g. Kutner et al., 2005), and enhanced prediction accuracy through decision-tree-based methods like Random Forest (e.g. Breiman, 2001a, b; Liaw and Wiener, 2002) and XGBoost (e.g. Chen and Guestrin, 2016).
The integration of diverse environmental drivers with sophisticated analytical methods is central to advancing predictive modelling in environmental science. For instance, Hengl et al. (2017) demonstrated that spatial predictions of soil properties improved significantly when large stacks of remote-sensing and environmental covariates were incorporated into ensemble machine-learning frameworks. This approach is further supported by research such as Luo et al. (2009), who found that high-frequency driver data reduces parameter equifinality in ecosystem data assimilation, and Pappas et al. (2014), who developed efficient methods for gap-filling hydrometeorological observations. More recently, Sándor et al. (2023) showed that analysing residual correlations among crop and grassland model ensembles can reveal structural model deficiencies and improve simulation of C-N fluxes when combined with ensemble averaging. Collectively, these studies highlight the substantial value of leveraging diverse variables, advanced techniques, and residual-based ensemble diagnostics to build more robust and accurate predictive models. Building on these advancements, the present study introduces a meta-modelling framework that integrates biogeochemical model outputs and environmental variables, guided by residual correlation insights, to address structural model error and enhance predictive performance.
This study aims to improve the predictive accuracy of biogeochemical flux calculations, particularly C fluxes, in diverse agricultural systems (crop rotations and grassland systems). Building on an already established multi-model framework, a novel methodology is used to develop a meta-model that balances scientific rigour and practical feasibility. The results of this meta-model are compared with the multi-model ensemble median and other meta-models to demonstrate the improvement, interpretability and reliability of ensemble predictions (where multi-model median is considered as the baseline). This dual focus aims to improve methodologies for sustainable crop and grassland management and to inform agricultural policy to better address the challenges of climate resilience and sustainability.
The novelty of this study lies in the interpretability of the multi-model system and its linkage with environmental factors to improve the performance of the method. Additionally, the application of multiple meta-modelling approaches provides an abstract framework for improved modelling exercises, further supported by SHapley Additive exPlanations (SHAP) to ensure interpretability.
2.1 Meta-modelling framework
The methods employed in this study arise from the contemporary landscape of crop and grassland modelling, specifically focusing on ensemble modelling. We adopt and extend the concept of meta-modelling by comparing it to the multi-model median (MMM) baseline estimator (e.g. Sándor et al., 2018).
While the term meta-modelling can be conveyed ambiguously, some clarification is needed. Widely used in mathematics, computer science and engineering, a meta-model is understood as a model of one or more models. Here, we define it as the use of model outputs from a multi-model ensemble – for two particular methods supplemented by environmental variables – as inputs to a higher-level statistical model. Unlike traditional surrogate models that approximate the structure of a process-based model, our meta-model approach complements, rather than replaces, process-based models by exploiting the information embedded in multiple model outputs. The enhanced predictive power and the resulting trust in model outcomes are particularly valuable for informing policy decisions. This method goes beyond Bayesian model averaging, non-democratic model selection and some machine learning based output combination techniques, allowing for more flexibility in capturing nonlinear relationships.
Here we adopt stacked generalization (called simply as stacking hereinafter), as an ensemble method wherein a meta-model integrates predictions generated by multiple base models. Thus, throughout the study, stacking refers to an ensemble learning technique in which the multi-model framework is used to construct a new estimation for the target variables. This method relies on the observation that diverse models inherently capture different aspects of real-world systems like the plant-soil system. Consequently, training a meta-model to optimally integrate these varied predictions allows stacking to leverage the individual strengths of the base models, ultimately leading to improved generalisation across various tasks focusing on the plant-soil systems.
Linear models are the most prevalent meta-models in ensemble learning, largely due to their simplicity, computational efficiency, and ease of interpretation. Their additive structure makes it straightforward to quantify the relative influence of individual models within an ensemble, which is particularly valuable for diagnostic purposes. Notably, a precursor to formal meta-modelling can be seen in the Granger–Ramanathan averaging method (Granger and Ramanathan, 1984; Nand et al., 2025), which introduced the idea of optimally weighting model outputs through constrained linear regression. This approach laid the foundation for modern stacking techniques by demonstrating how combining forecasts in a regression framework could systematically improve predictive accuracy.
However, when base models exhibit substantial structural differences and higher structural errors, the relationship between predicted and observed outcomes may no longer be well-approximated by a linear model. In such scenarios, simple linear approaches like the Granger–Ramanathan averaging may prove insufficient. Furthermore, the often-implicit assumption of conditional independence among base-model predictions in linear meta-modelling is frequently violated, rendering multiple linear regression a suboptimal choice.
To address this limitation, ensemble-based machine-learning meta-models offer a compelling alternative. These models can effectively capture complex, non-linear relationships and do not rely on the conditional independence of base model predictions. Random Forests, for example, have been among the earliest and most effective ensemble methods used as meta-models, particularly in contexts where linear approaches underperform.
While effective, Random Forests can be computationally demanding during both training and inference. They also tend to overfit the training data, potentially compromising generalization on independent data. XGBoost offers greater flexibility, often delivering superior predictive accuracy with generally lower computational requirements. However, XGBoost typically requires extensive hyperparameter tuning to achieve optimal performance.
A key limitation of all these approaches is their static nature: the functional relationship learned between the base-models' outputs and the target variable remains fixed. This static feature limits the long-term usability of meta-models, as evolving environmental conditions can shift the relevance of different structural components within the base-models. Consequently, the optimal meta-model may vary over time, necessitating continuous retraining to maintain accuracy, which represents a major drawback.
With advancements in machine learning, today we can significantly extend the approach described above. By incorporating differentiating environmental factors – such as temperature or precipitation – as additional features, the meta-model can learn not only the functional relationship between the base-model outputs and the measurements, but also how this relationship varies with environmental conditions.
This approach is only possible with flexible meta-models. Simpler models, such as generalized linear models, rely on assumptions like conditional independence and uncorrelated features – assumptions that are often violated when additional environmental factors are introduced. As a result, these simpler models may struggle to capture the conditional dependencies required for enhanced predictive performance.
Such an environment-aware meta-modelling framework (i.e. XGBoost or Random Forest with additional meteorological drivers) improves both predictive accuracy and interpretability by revealing the specific conditions under which different models succeed or fail. Examining these meta-models allow researchers and modellers to understand their model's limitations in varying contexts. This knowledge guides further model development and facilitates the selection of the most appropriate model for given circumstances, promoting valuable synergy between modelling approaches.
To establish a clear terminological framework, here we summarize the key components of the study. Base models are the individual process-based ecosystem models (e.g. DNDC or APSIM; Sándor et al., 2024) that generate the initial flux estimates. Baseline (MMM) is the Multi-Model Median, defined as the unweighted central tendency of the base model outputs and used as the benchmark for evaluating all subsequent meta-models. Stacking (Meta-Modelling framework) is the ensemble-learning framework in which the outputs of the base models serve as predictors for a second-level learner. Meta-models are ML algorithms that implement this stacking framework.
2.2 Source of the model ensemble
The model ensemble is based on data from international initiatives, primarily the Agricultural Model Intercomparison and Improvement Project (https://agmip.org, last access: 1 October 2025) and the Integrative Research Group of the Global Research Alliance on agricultural GHGs (https://globalresearchalliance.org/research/integrative, last access: 1 October 2025). These exercises have shown that ensembles of process-based biogeochemical models can reliably estimate agricultural productivity, as well as C and N emissions (and stocks) of agricultural systems (Ehrhardt et al., 2018; Sándor et al., 2018, 2020, 2024). These studies, mostly funded by national agencies, also contribute to the assessment of C storage potential (e.g. Farina et al., 2021), aligning with the “4 per mille Soils for Food Security and Climate” initiative established at the 2015 United Nations Climate Change Conference (COP21) by the French Ministry of Agriculture (https://www.4p1000.org, last access: 15 September 2025).
Here, we refer to a multi-model scheme, using daily model outputs as inputs for the meta-models. We are revisiting salient elements from previously published studies to build the framework for our meta-modelling analysis. Specifically, we delve into comparisons with the multi-model median from the study by Sándor et al. (2020) on C fluxes, which, in turn, was based on the protocol of Ehrhardt et al. (2018).
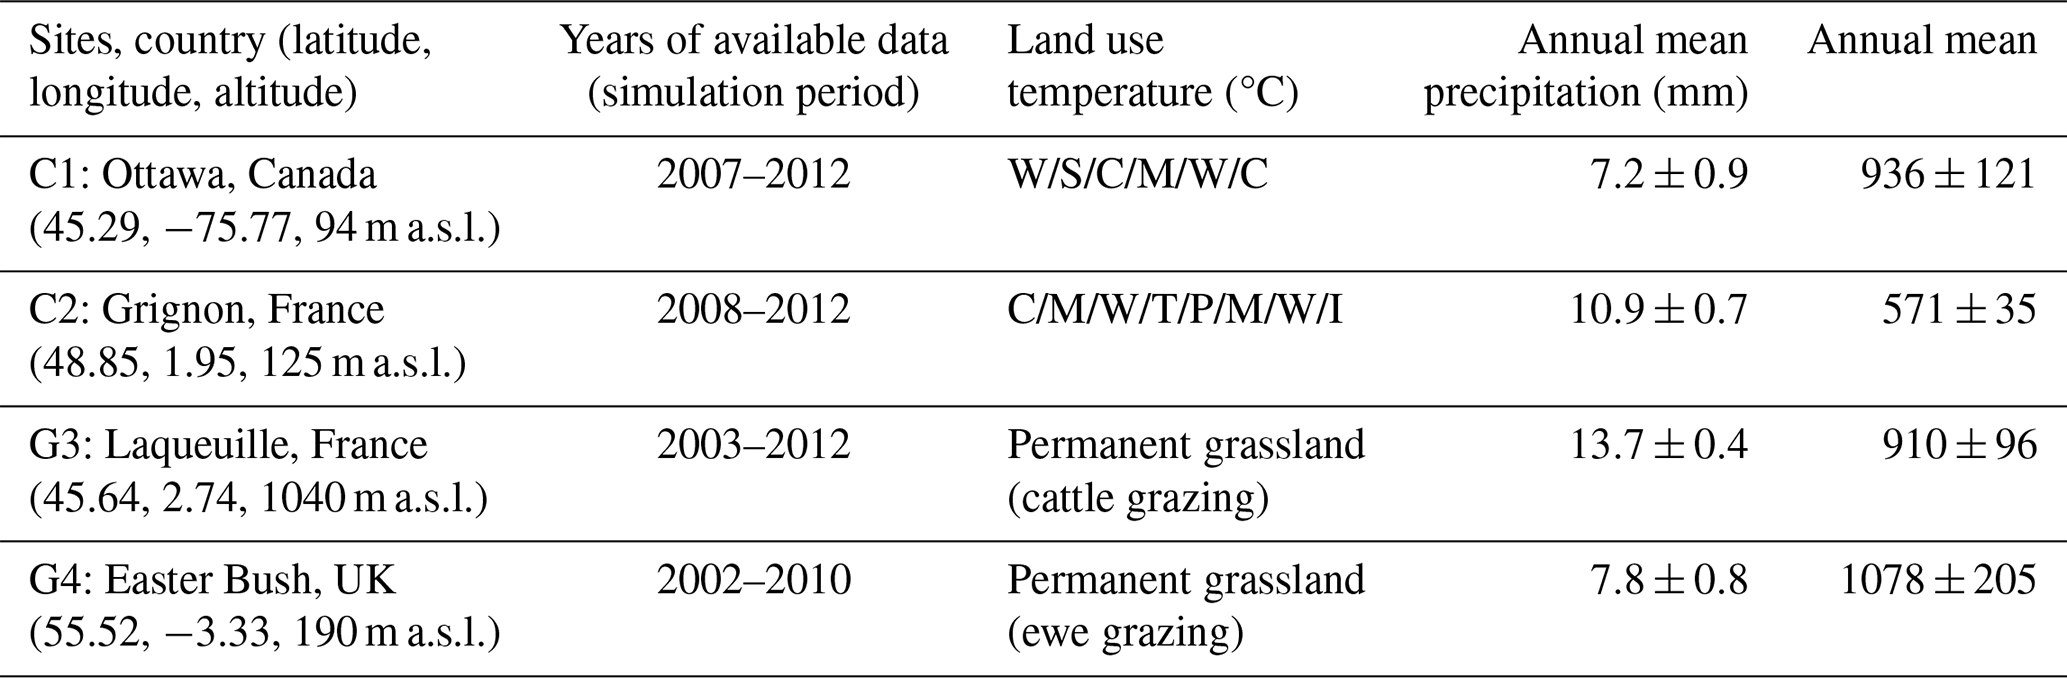
We used daily outputs from 23 crop and grassland simulation models/versions (Table 1; for details see Sándor et al., 2020, 2024). Model names (M01–M28) were anonymised for consistency, with M11 excluded due to missing C fluxes. These models were applied to four long-term field sites: two grazed grasslands (G3, G4) and two croplands (C1, C2) across the UK, France (two sites) and Canada (Table 2). The original Sándor et al. (2020) paper included one additional cropland site in India, but this site was excluded from the present study due to its relatively poor temporal coverage and because the observations were made using a different methodology, resulting in the absence of GPP and RECO estimates. All other sites relied on the eddy-covariance technique, ensuring methodological consistency.
Table 1C-flux outputs provided by different models (Sándor et al., 2024), denoted by symbols such as (present) and NA (not available). Models are marked as M01–M26, and they are kept anonymous as in the Sándor et al. (2020) study. In cropland sites, we had gross primary production (GPP) from six models, net ecosystem exchange (NEE) from seven models and ecosystem respiration (RECO) from 15 models. At grassland sites, we had GPP from 10 models, NEE from 10 models and RECO from 12 models.

Table 2Cropland and grassland sites, and temporal coverage of available data used for the analysis. Different crop rotations were used in the cropland sites, including cereals (spring and winter wheat (W), triticale (T), maize (M) and rice (R)), legumes (soybean (S)), rapeseeds (canola and mustard (C)), borages (phacelia, P) and fallow intercropping periods (I).
High quality data covering climate, soil, agricultural practices and C fluxes were gathered from Sándor et al. (2024). Observations at these sites include e measurements of net ecosystem CO2 exchange (NEE) data, further divided into two main fluxes (e.g. Reichstein et al., 2005; Raj et al., 2016): gross primary production (GPP), representing photosynthetic production from atmospheric CO2, and total ecosystem respiration (RECO), encompassing the total C respired by plants, soil organisms and, in the case of grasslands, grazing animals.
Initialisation and calibration procedures aligned models with vegetation, soil and atmospheric fluxes from the study sites, following the protocol described in Ehrhardt et al. (2018). This comprehensive exercise involved a multi-stage approach, granting modellers access to increasingly detailed data for running and evaluating their models, progressing from uncalibrated to fully calibrated simulations. In summary, the calibration included five ascending levels, incorporating additional data for refinement: blind test (S1), utilising only site specific weather and management data for the simulation periods; initialisation (S2), incorporating additional historical climate and management data, extending to years preceding simulation periods, along with regional productivity for initialisation purposes; partial calibration (S3), including biomass production and phenology data; intermediate calibration (S4), integrating soil temperature, soil water content and mineral N data; full calibration (S5), using N2O emissions, NEE, GPP, RECO and soil organic C and N data.
For the purposes of this study, emphasis was placed on the outputs from the partial calibration stage (S3) stage. S3 involves calibration using plant data exclusively, which enhances the practical implementability of models for end users and beneficiaries. This approach recognises the importance of ensuring models are not only scientifically robust but also practically useful. Its validity is supported by findings that additional calibration stages beyond S3 yielded only modest improvements (Sándor et al., 2023).
2.3 Meta-modelling approaches and validation strategies
The meta-model construction was done at the daily time resolution for GPP, RECO and NEE. Two main approaches were tested in this study for the meta-model construction. The first one focuses on the classic stacking ensemble method (referred here as CSEM), where the meta-models were constructed using multiple linear regression (MLR), random forest (RF) method, and XGBoost (XGB) using the model outputs described in Sect. 2.2. The second approach, that is introduced in this study as a novel method (the environment-aware meta-modelling method), uses the same stacking methods but extends the input dataset so that besides the individual, process-based model outputs, we use two additional environmental factors (daily mean temperature and precipitation) to predict the final outcome (i.e. the meta-model). This approach (i.e. inclusion of the meteorological drivers) is referred to here as extended generic stacking ensemble method (XGB+ and RF+). The inclusion of only temperature and precipitation is grounded in their central roles as primary climatic drivers of terrestrial C fluxes. Temperature governs essential biological processes such as photosynthesis and respiration (Lloyd and Taylor, 1994; Xu and Baldocchi, 2004), while precipitation affects soil moisture and plant water stress, both critical for GPP and RECO (Reichstein et al., 2005; Schwalm et al., 2010). Extensive research has shown that fluctuations in these two variables explain much of the interannual and seasonal variability in ecosystem C exchange (Jung et al., 2007; Beer et al., 2010). Moreover, temperature and precipitation are consistently measured across sites, widely available and commonly integrated into ecological and climate models. Their inclusion enhances predictive performance without adding complexity or compromising generalisability (e.g. Hijmans et al., 2005). Supporting this approach, Dormann et al. (2013) advocate for the use of core climatic variables over an excess of redundant predictors to maintain model robustness and transferability.
Two meta-model validation strategies were used in the study for both main approaches described above. First, all meta-models were constructed using 70 % of the observations for training, with the remaining 30 % used for validation. Additionally, we implemented the complete leave-one-year-out (LOYO) approach, in which the observations from a complete year were omitted during training and subsequently used for validation. All years were omitted consecutively, and the validation results based on the omitted years were averaged and provided the basis for the evaluation of the strategy. This alternative strategy was included since carbon-flux time series are autocorrelated, and time-aware validation methods like LOYO can provide additional insight into model applicability. The split (referred as hereinafter) evaluates within-regime reconstruction performance, while LOYO assesses the model's ability to generalize and extrapolate beyond the conditions represented in the training test. In the study the LOYO based methods are presented mainly given the fact that they are more generalizable. Statistical analysis is also provided for the split for comparability.
For the MLR method we used the lm function of base R. The RF method (randomForest package from CRAN; Liaw and Wiener, 2002) was used with 1000 trees. For each tree the number of predictors were 1/3 of the number of input data streams (GPP, RECO, NEE and meteorological drivers if applicable) to prevent overfitting. The subset of predictors was used randomly. The minimum size of the terminal nodes was five. Splitting the dataset into training and testing dataset was done randomly using the built-in random number generator of base R, without specifying a seed. For each site, the same site-specific random number sequence was used across all meta-model trainings, while sequences differed between sites due the varying lengths of their time series. The XGB method was implemented using the XGBoost package from CRAN (Chen and Guestrin, 2016). For hyperparameter optimization we used random search technique with 50 evaluations for XGBoost (the details of the procedure can be read in Appendix B). Figure 1 shows the overview of the stacking methods used in the study.
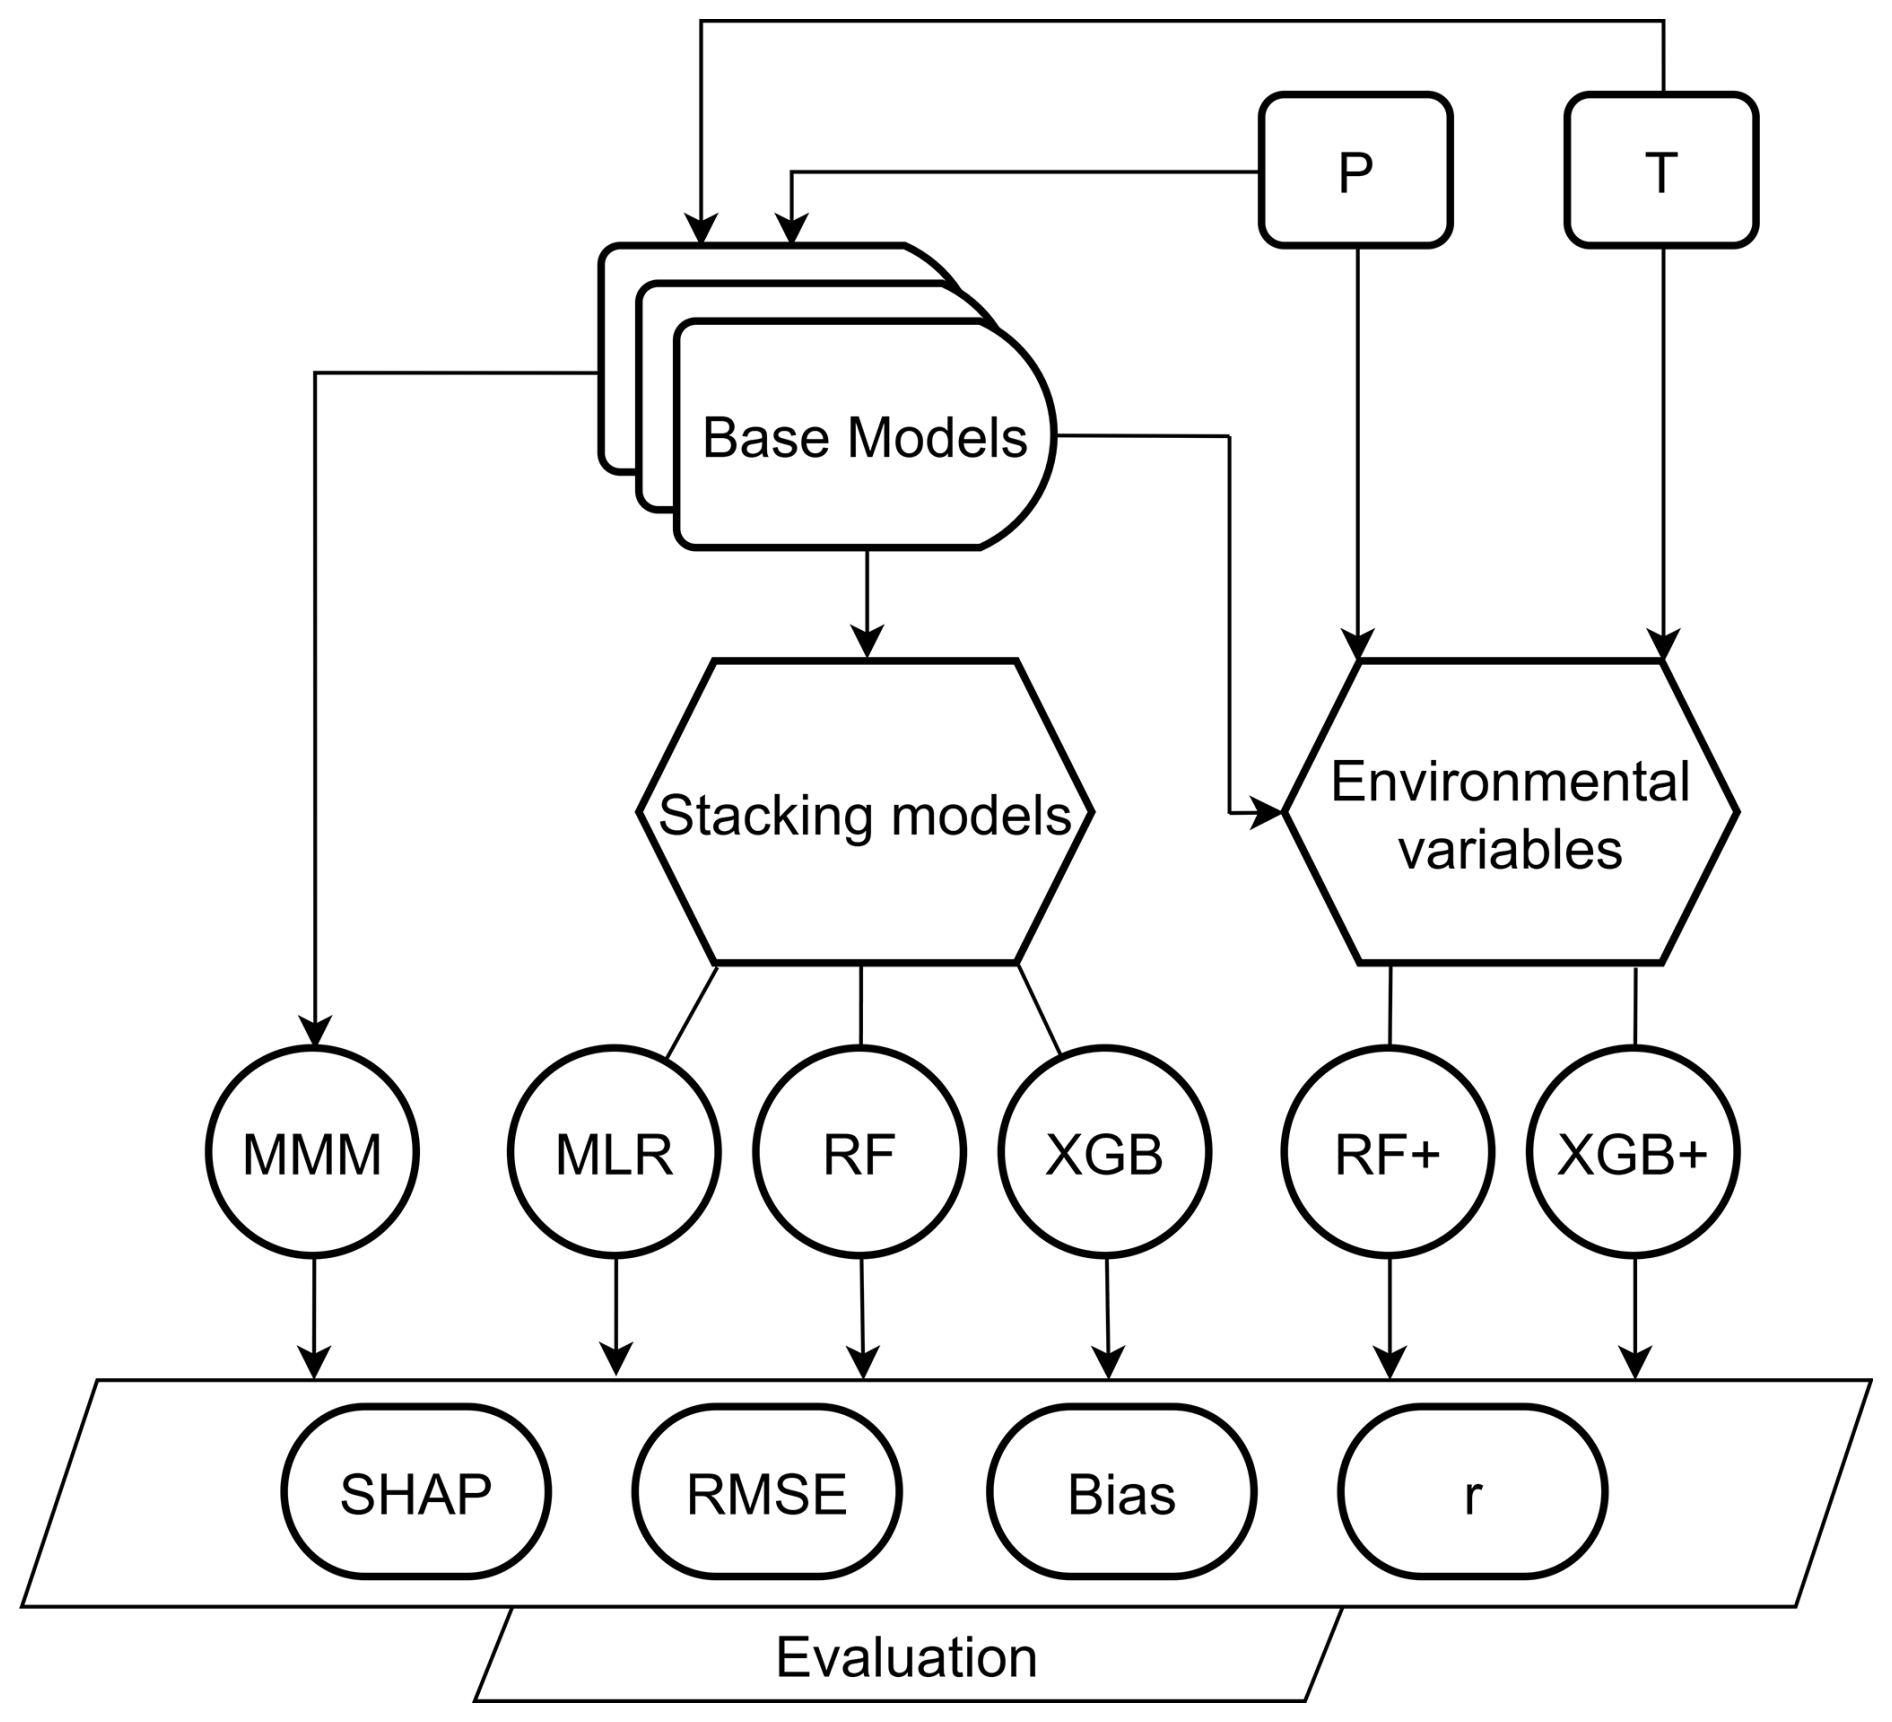
Figure 1Schematic illustration of the applied stacking ensemble learning methodology. The workflow combines outputs from multiple simulations (base models) with multi-model median (MMM) and stacking models (MLR, RF, XGB). The XGB+ and RF+ models are extended versions that incorporate additional input features: temperature (T) and precipitation (P). The performance of these models and the ensembles are evaluated using four metrics: SHAP (for interpretability), RMSE (root mean square error), Bias and the Pearson correlation coefficient (r). The final output is the site-level carbon flux, which is the same variable type as the initial model outputs.
For XGBoost+ feature contributions were quantified using SHAP values (Shapley, 1953; Lundberg and Lee, 2017). SHAP values are grounded in cooperative game theory, representing the expected marginal contribution of a feature across all possible feature coalitions. This formulation provides a theoretically consistent and locally accurate decomposition of model predictions, enabling a granular understanding of feature effects. In contrast to traditional importance measures such as the mean decrease in impurity (often referred to as the Gini importance; Breiman, 2001a, b), SHAP values address several critical limitations. The Gini metric, while computationally efficient, is known to exhibit biases toward features with a higher number of categories or greater variance (Strobl et al., 2007). Moreover, it does not provide insight into the directionality or context-dependent contribution of features to individual predictions. SHAP overcomes these limitations by providing additive, model-agnostic attributions that remain consistent across different models and capture complex, non-linear interactions between features (Lundberg et al., 2020). These properties make SHAP particularly well-suited for interpreting ensemble methods like RF and gradient-boosted decision trees, where feature interactions and non-linearities are prominent.
All evaluations were performed separately for each study site, and for the studied carbon fluxes (GPP, RECO, NEE). No cross-site meta-model was developed in this study, meaning that all training and validation were performed on a site-specific temporal basis. To assess how well models approximated site-level observations, we compared each meta-model and the MMM using three common performance metrics (Richter et al., 2012) across 26 site-stage-output combinations: the root mean square error (RMSE), the Pearson correlation coefficient (r), and the bias.
The results are organized according to the carbon flux type. First GPP is discussed, as it represents plant photosynthesis and is the most important driver of the plant production and yield. Most likely GPP is the process that is the simplest to simulate by process-based models. This is because the mechanism of photosynthesis is well-discovered, and practically it is separated from other autotrophic or heterotrophic processes (since this is the only flux that comes into the ecosystem). GPP is a relatively large flux (compared e.g. to NEE or net biome production), so model optimization is perhaps simpler and more interpretable. GPP can be biased for some cases due to improper representation of phenology, and lack of model optimization.
RECO follows the discussion that is typically harder to simulate than GPP. This is because RECO is the sum of autotrophic and heterotrophic respiration, where both components have their own intrinsic uncertainties. For example, heterotrophic respiration is typically problematic due to the complexity of the decomposition processes in the soil including the rhizosphere and the presence, complexity and activity of the microbial/fungal life forms. RECO can be erroneously simulated if one of the two major components is misrepresented (or even worse if, due to the compensation of errors, RECO looks good due to wrong reasons). Nevertheless, RECO is still a larger carbon flux, so its representation can be expected to be relatively well-adjusted.
Finally, we present NEE related results. This flux is probably the hardest to simulate, since it is the sensitive balance between RECO and GPP (by definition, NEE = RECO−GPP). Capturing the magnitude and variability of NEE requires the proper representation of plant phenology (start and end of season), and accurate representation of GPP and RECO. If the meta-model captures NEE with greater precision than the more traditional model ensembles, this represents a significant accomplishment.
As the meta-model-based NEE is not calculated as RECO−GPP but rather it is modelled independently from GPP and RECO (due to methodological reasons), this introduces inconsistency. To address this issue, we also calculated NEE using the meta-model-based GPP and RECO, thus providing consistent results. This independent calculation is used as another level of validation for the LOYO-based model construction. It is important to note that successful and unbiased simulation of NEE is a major step forward supporting e.g. atmospheric inversions or any other bottom-up carbon flux estimations.
To formally assess whether meta-models significantly outperformed the Multi-Model Median baseline, we conducted one-sided Wilcoxon signed-rank tests on paired daily squared residuals. For each site-variable-model combination, separate tests were performed for each Leave-One-Year-Out cross-validation fold, and p-values were aggregated using the median across test years to obtain a robust measure of typical performance. This approach avoids pseudoreplication that would arise from pooling all validation data together, while the median aggregation reduces sensitivity to occasional outlier years. The Wilcoxon test is particularly appropriate for this analysis as it makes no distributional assumptions about prediction errors, is robust to outliers and skewed distributions, and properly accounts for the paired nature of our comparisons (same observations predicted by different models). To address the multiple testing problem arising from testing 15 hypotheses per site (5 models × 3 variables), we applied the Benjamini-Hochberg procedure per site to control the false discovery rate at 5 %.
3.1 GPP
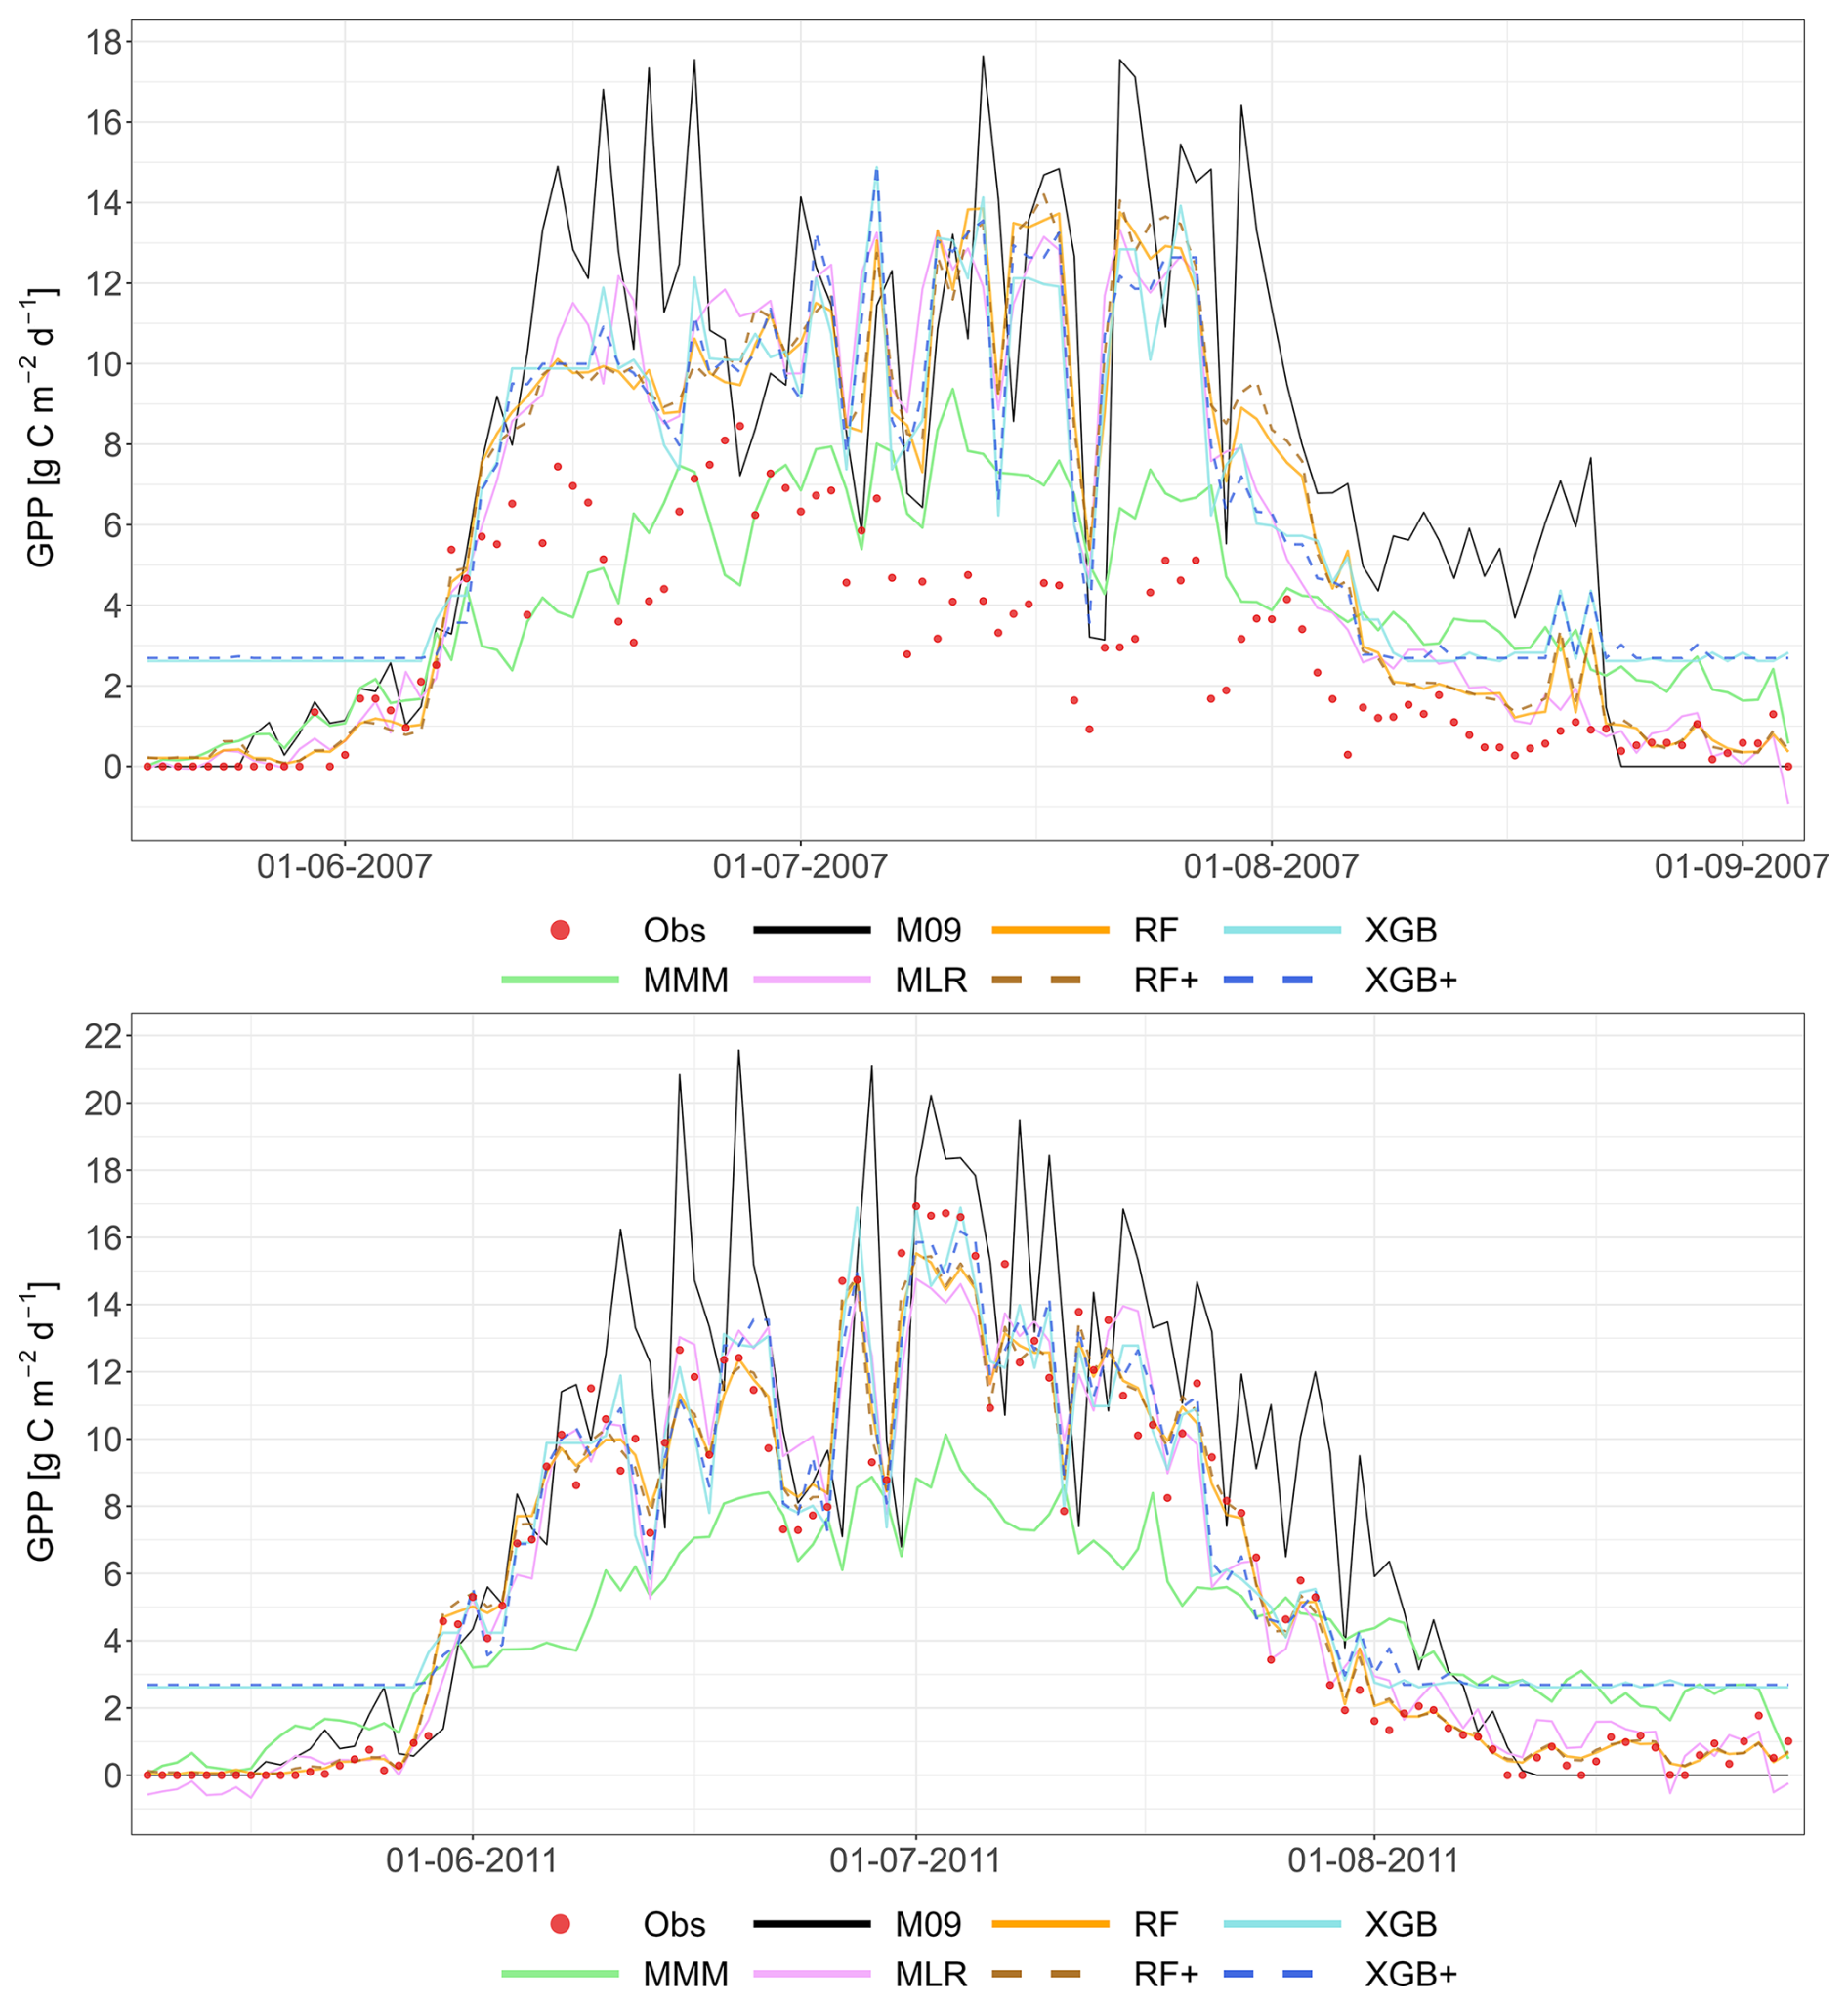
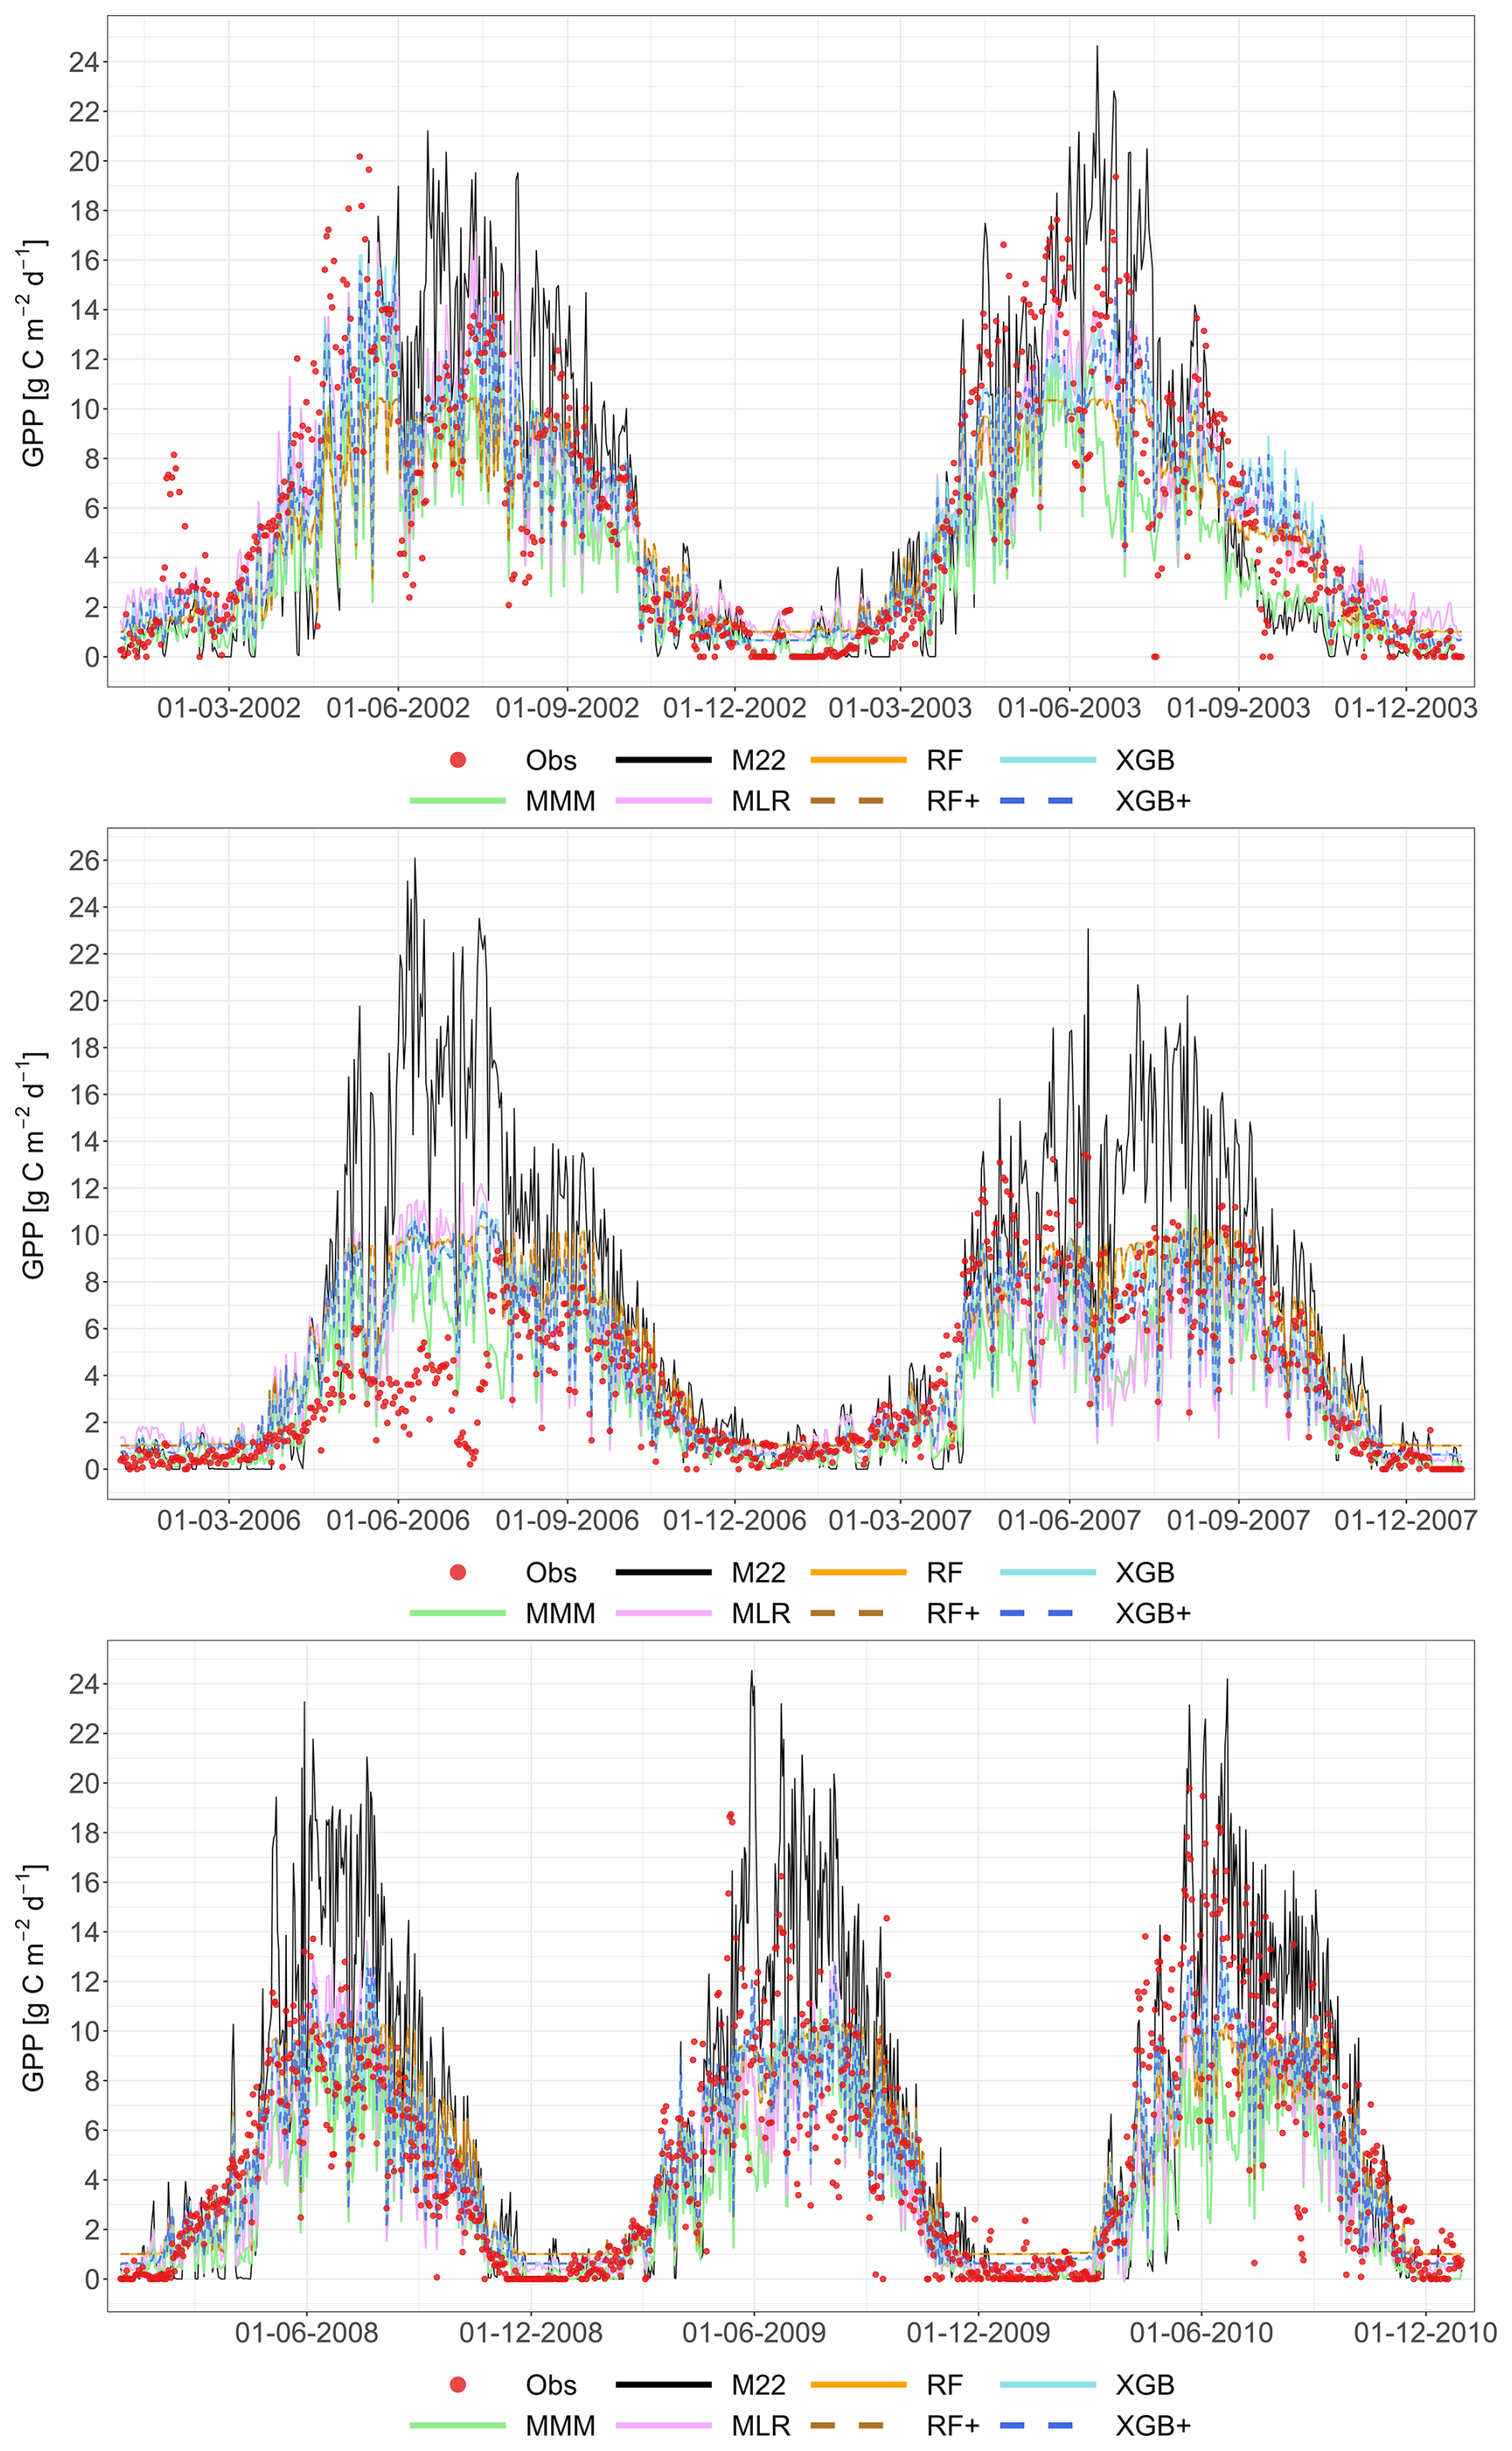
Figure 2 shows a representative example of the observed and simulated time series of GPP at the Grignon cropland site (C2) for the 2008–2009 growing seasons (maize and after that winter wheat), and for two consecutive years (2004–2005) at the Easter Bush permanent grassland site (G4). All meta-modelling approaches are plotted based on the LOYO validation strategy alongside the best-performing individual model (M01 for Grignon and M22 for Easter Bush). Appendix A contains the complete simulated dataset for all sites, and for all years, and also for the validation strategy.
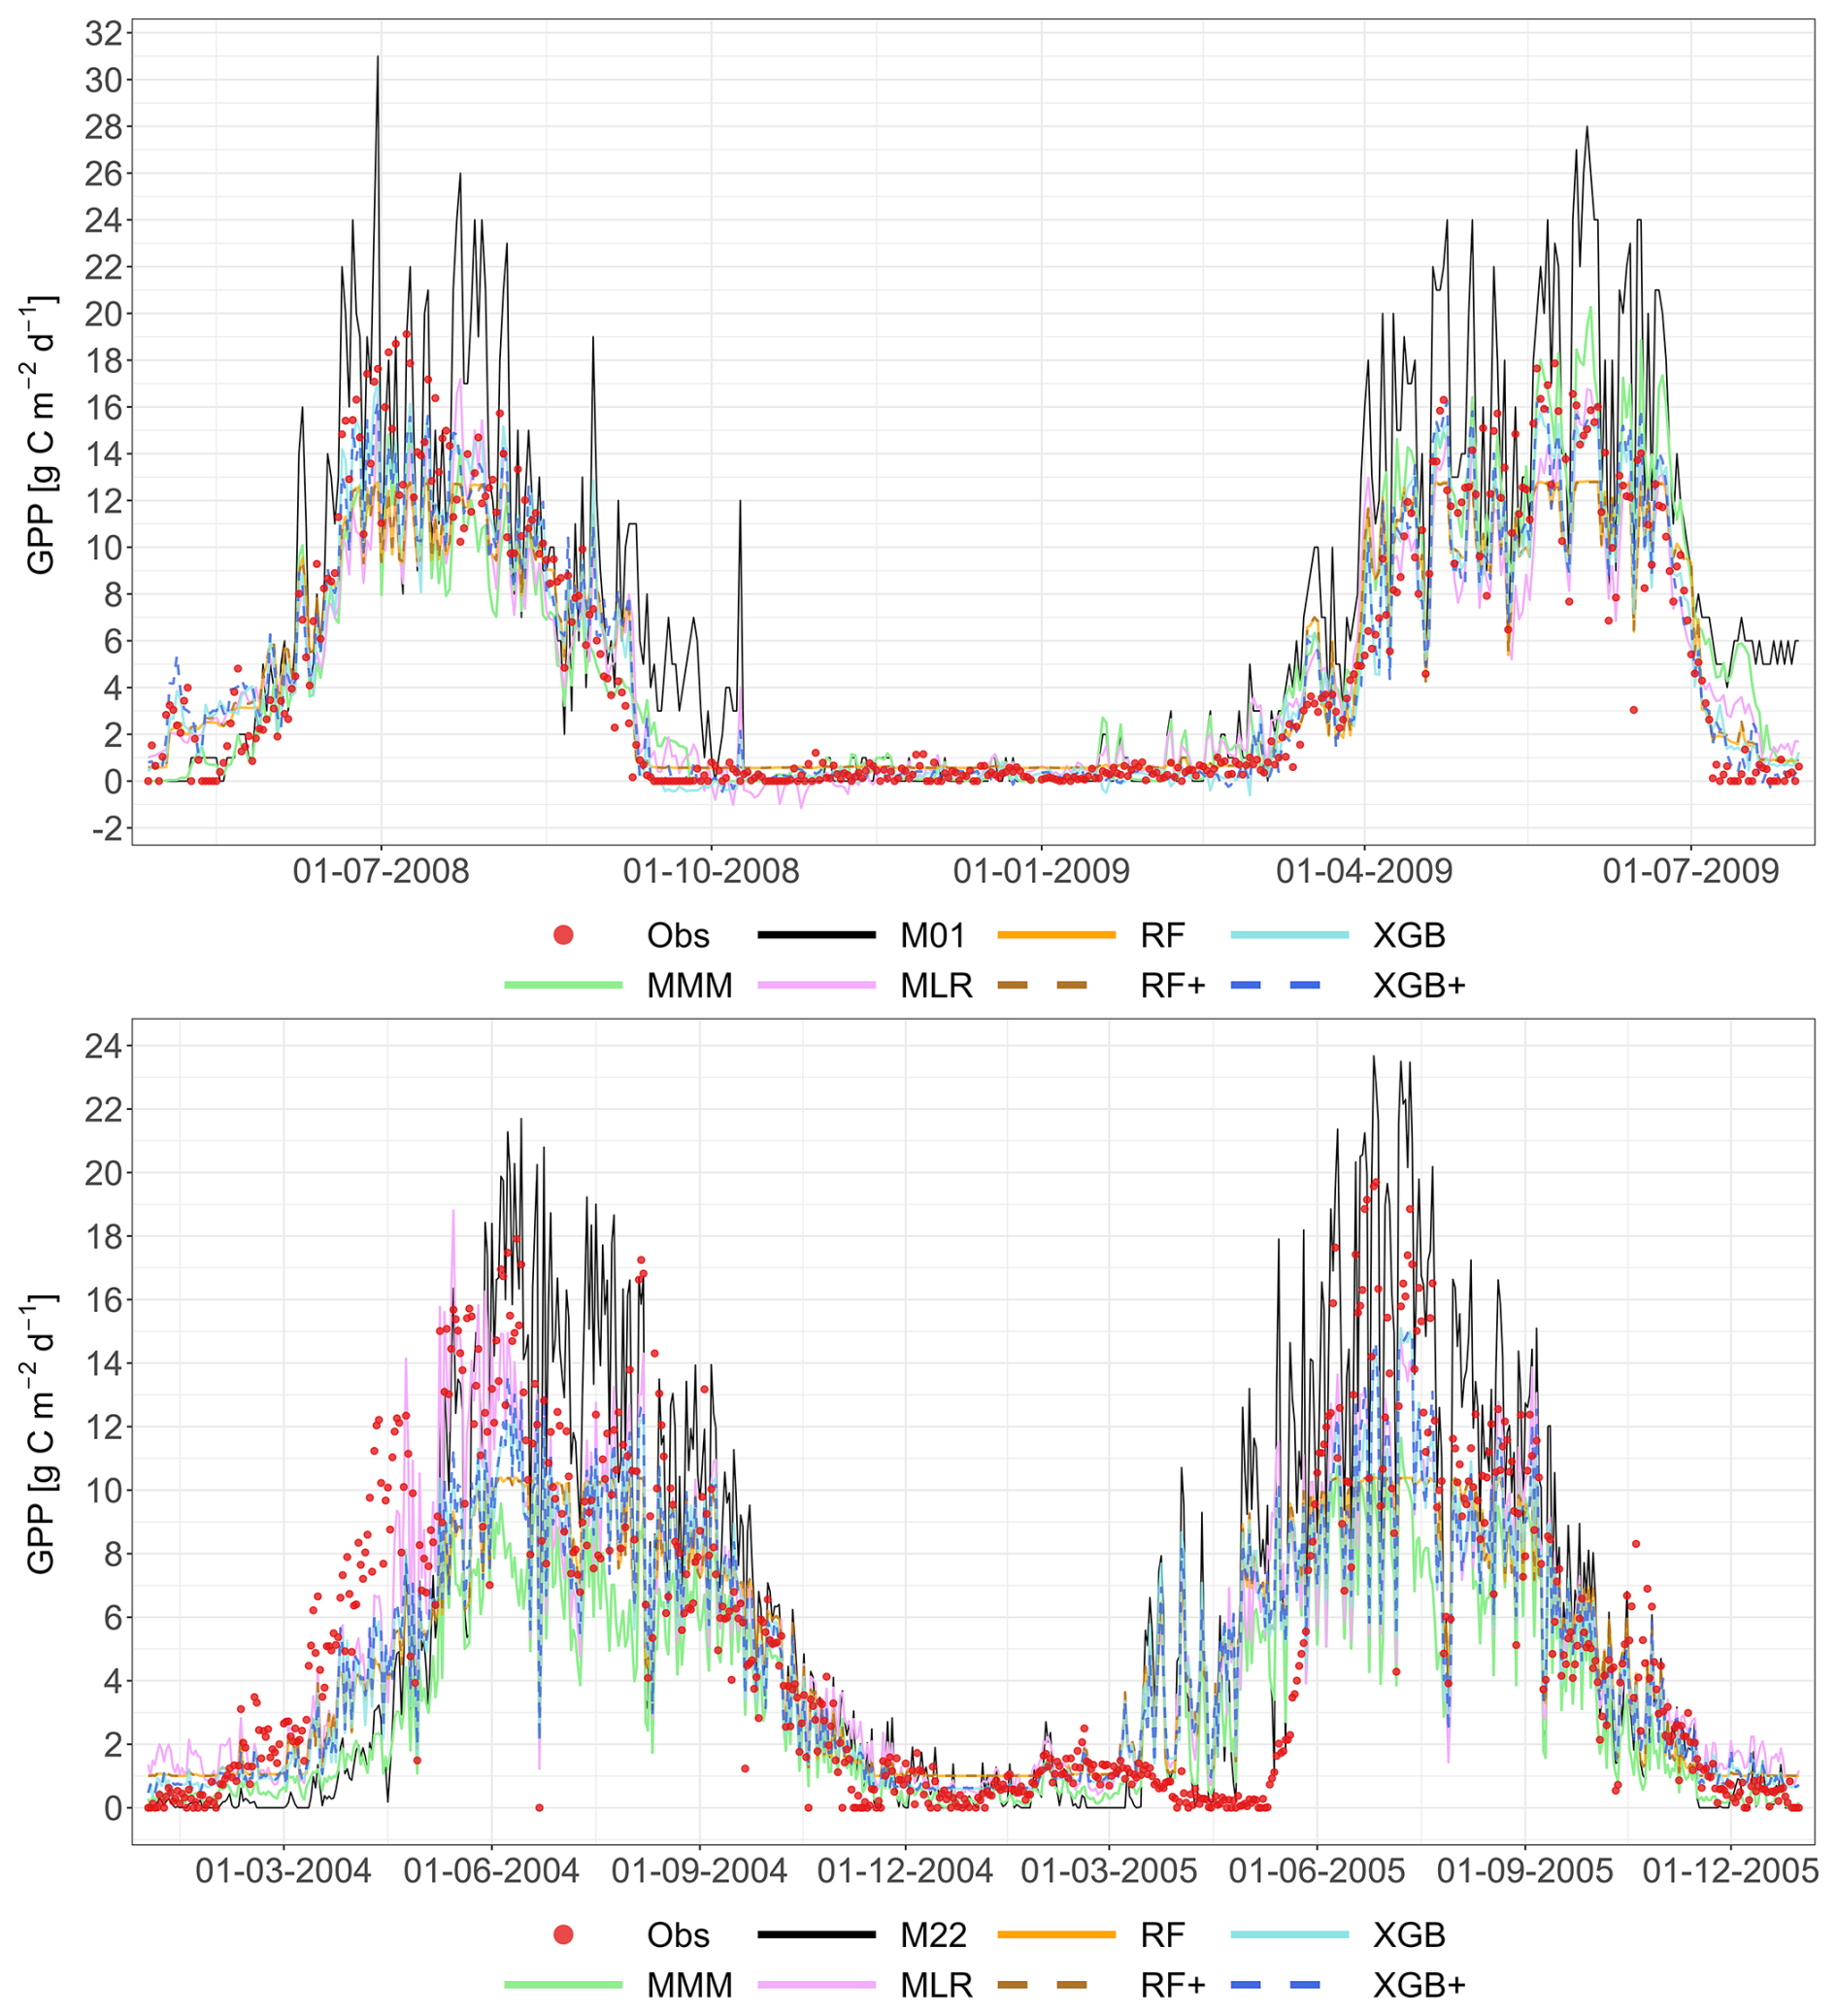
Figure 2Performance of the multi-model median (MMM, green), the constructed meta-models and the best-performing individual models for simulating GPP based on the LOYO strategy. The top panel shows results for the Grignon cropland site (C2), which includes maize and winter wheat. The bottom panel shows two years of data for the Easter Bush grassland site (G4). Observations are marked by red dots. The meta-models include Multiple Linear Regression (MLR, purple), Random Forest (RF, orange), XGBoost (XGB, light blue), Random Forest+ (RF+, hatched brown) and XGBoost+ (XGB+, hatched dark blue). The best-performing individual models (M01 at C2, M22 at G4) are shown in black. Dates are provided in the format of dd-mm-yyyy.
The plots indicate a relatively large scatter in model results compared to observations. Notably, the best-performing individual model for the cropland time series exhibited considerable biases, generally overestimating GPP. In contrast, all meta-model approaches indicate reduced bias. To provide objective quality indicators, further quantitative analysis was performed.
Figure 3 compares observed and modelled GPP for all four experimental sites and all meta-model construction methods used the LOYO strategy, including the MMM. The figure includes a scatterplot showing the performance of the best individual model, selected based on its RMSE score. RMSE was chosen as the primary selection metric because it correlates well with other performance metrics (Kobayashi and Salam, 2000; Robeson and Willmott, 2023). The figures were constructed using one validation year selected based on the performance of the XGB+ method.
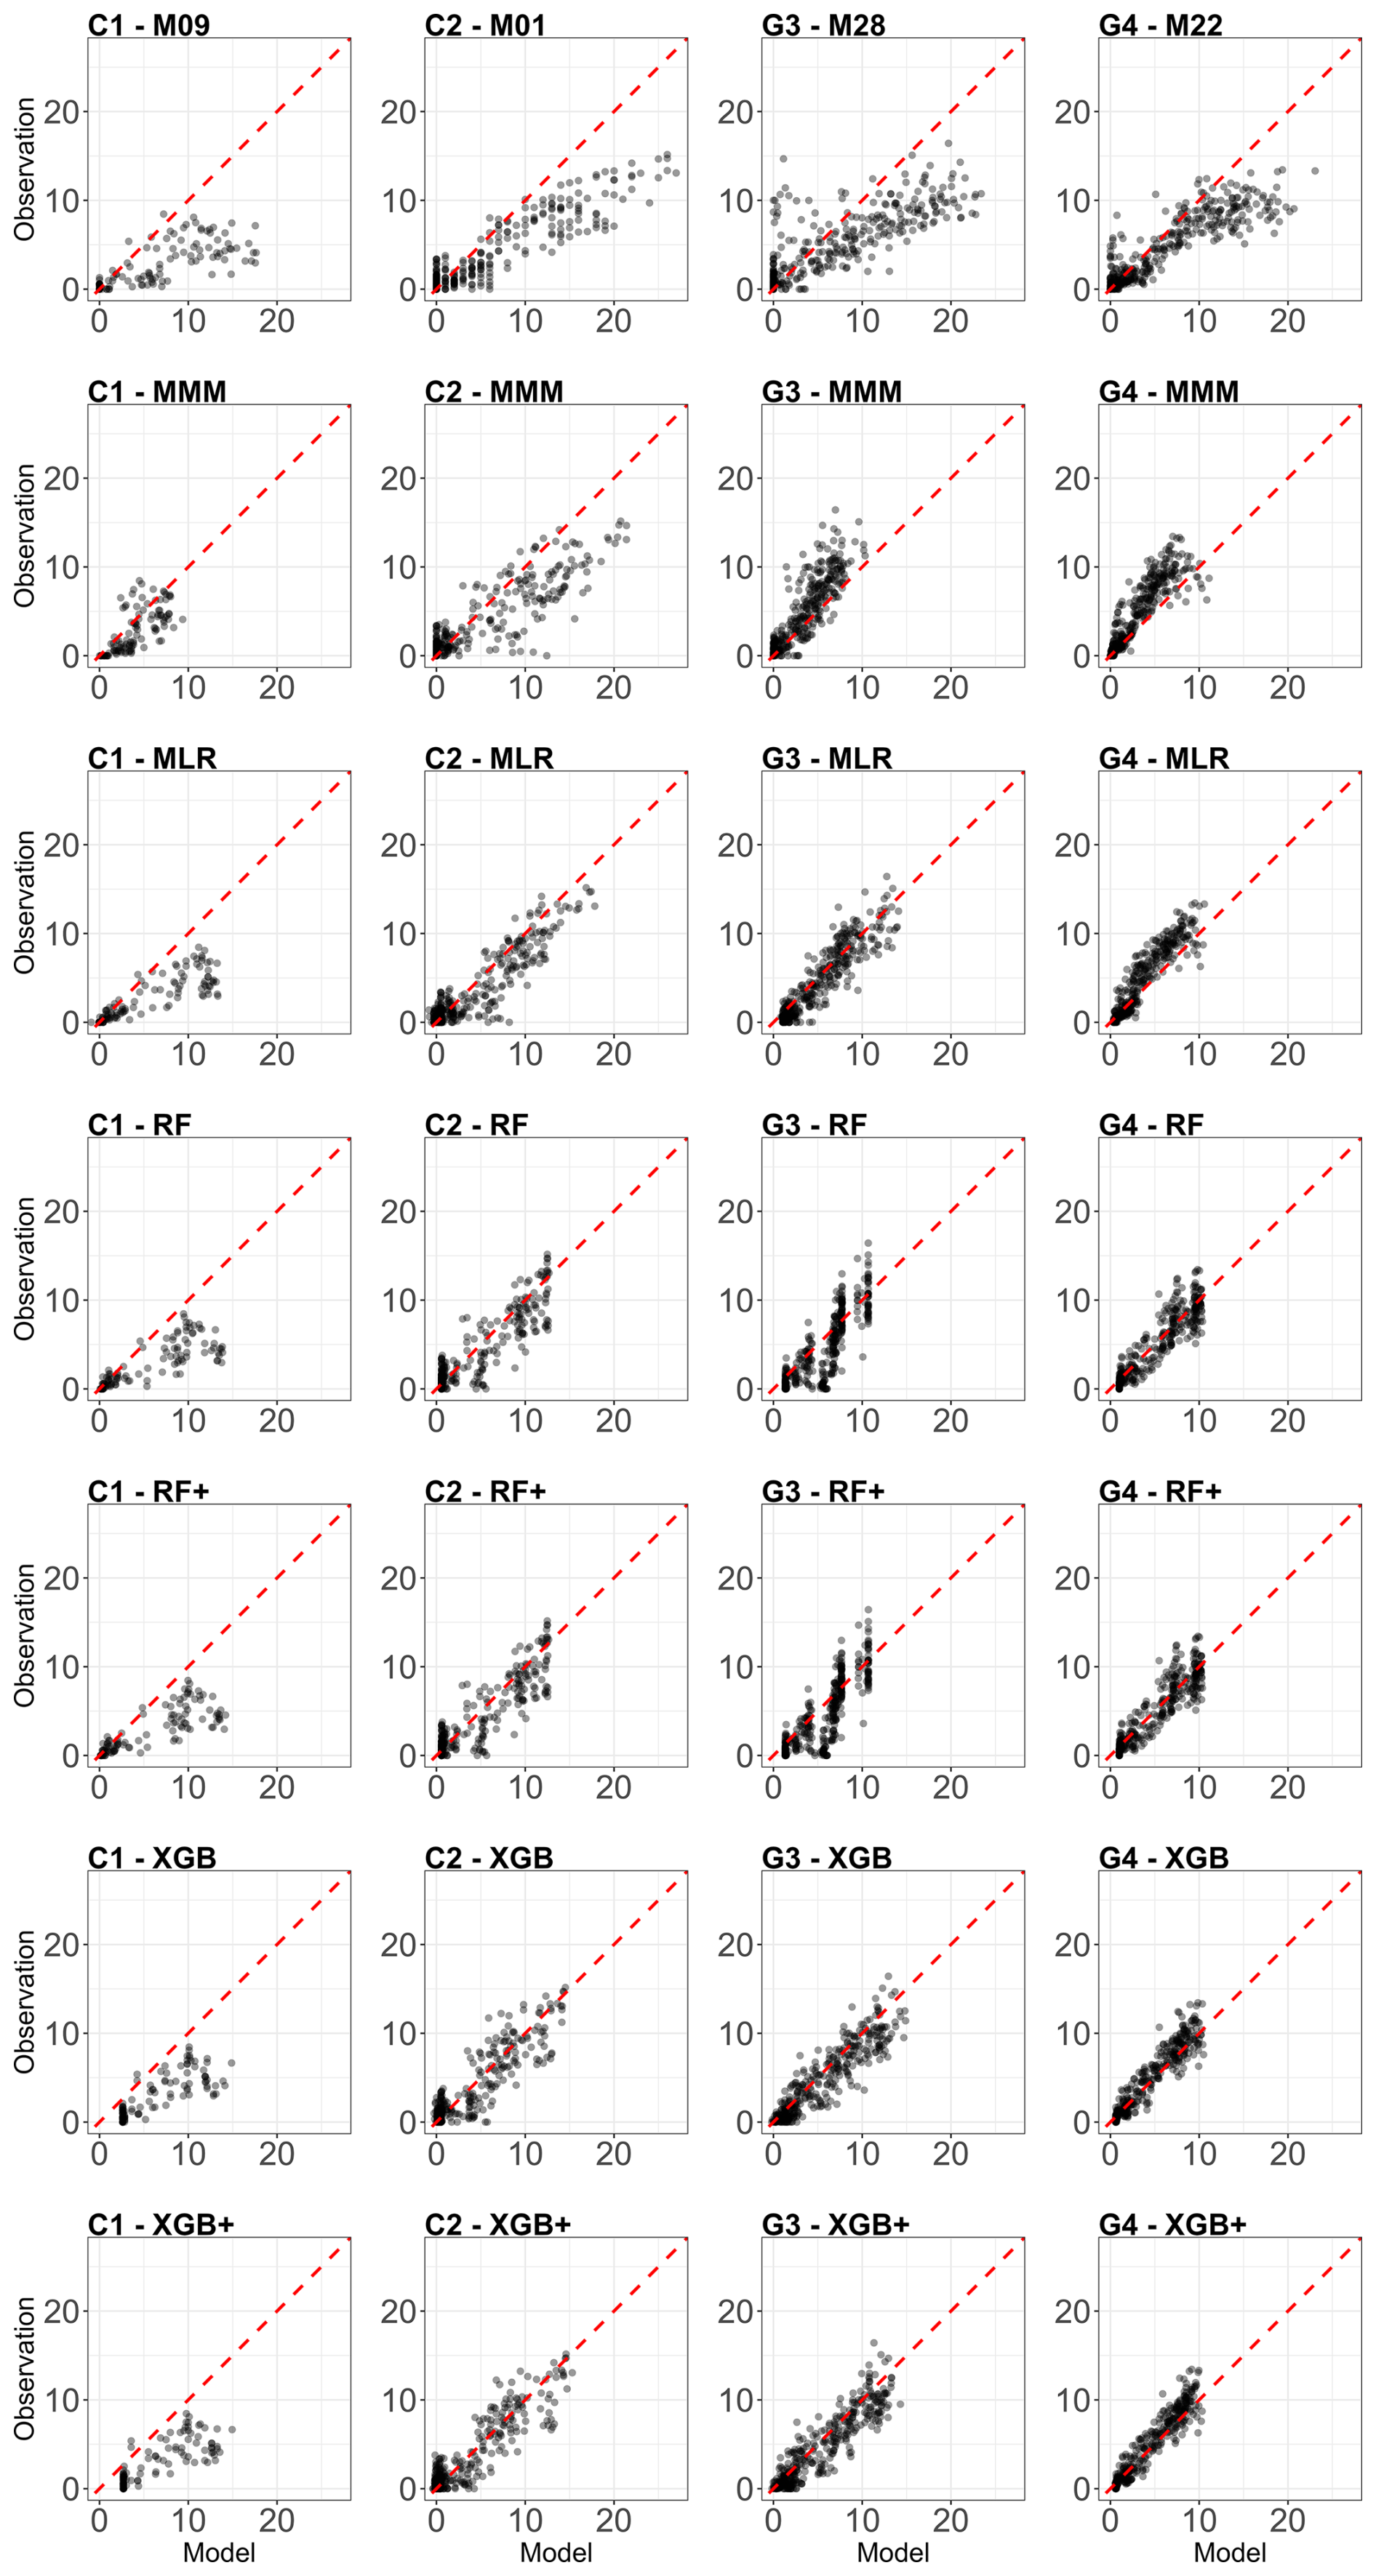
Figure 3Comparison of the best individual model, the constructed meta-models and the traditional Multi-Model Median with the observations for all sites (from left to right C1, C2, G3 and G4) and for the entire time series for GPP based on the LOYO strategy. From top to bottom: best individual model, MMM, MLR, RF, RF+, XGB and XGB+. All units are in g C m−2 d−1. Red dashed line represents the 1 : 1 relationship.
Figure 3 shows a gradual improvement in performance from top to bottom and tighter alignment of data points along the 1 : 1 line. For sites C1, C2 and G3, and to some extent for G4 as well, MMM already corrects much of the bias seen in the individual simulations.
At site C1, improvements across MLR, RF, RF+, XGB and XGB+ is associated with the restricted temporal coverage of the dataset (in LOYO strategy half of the dataset was retained). At the grassland sites G3 and G4, where longer time series was available providing a larger number of data points led to more pronounced improvement.
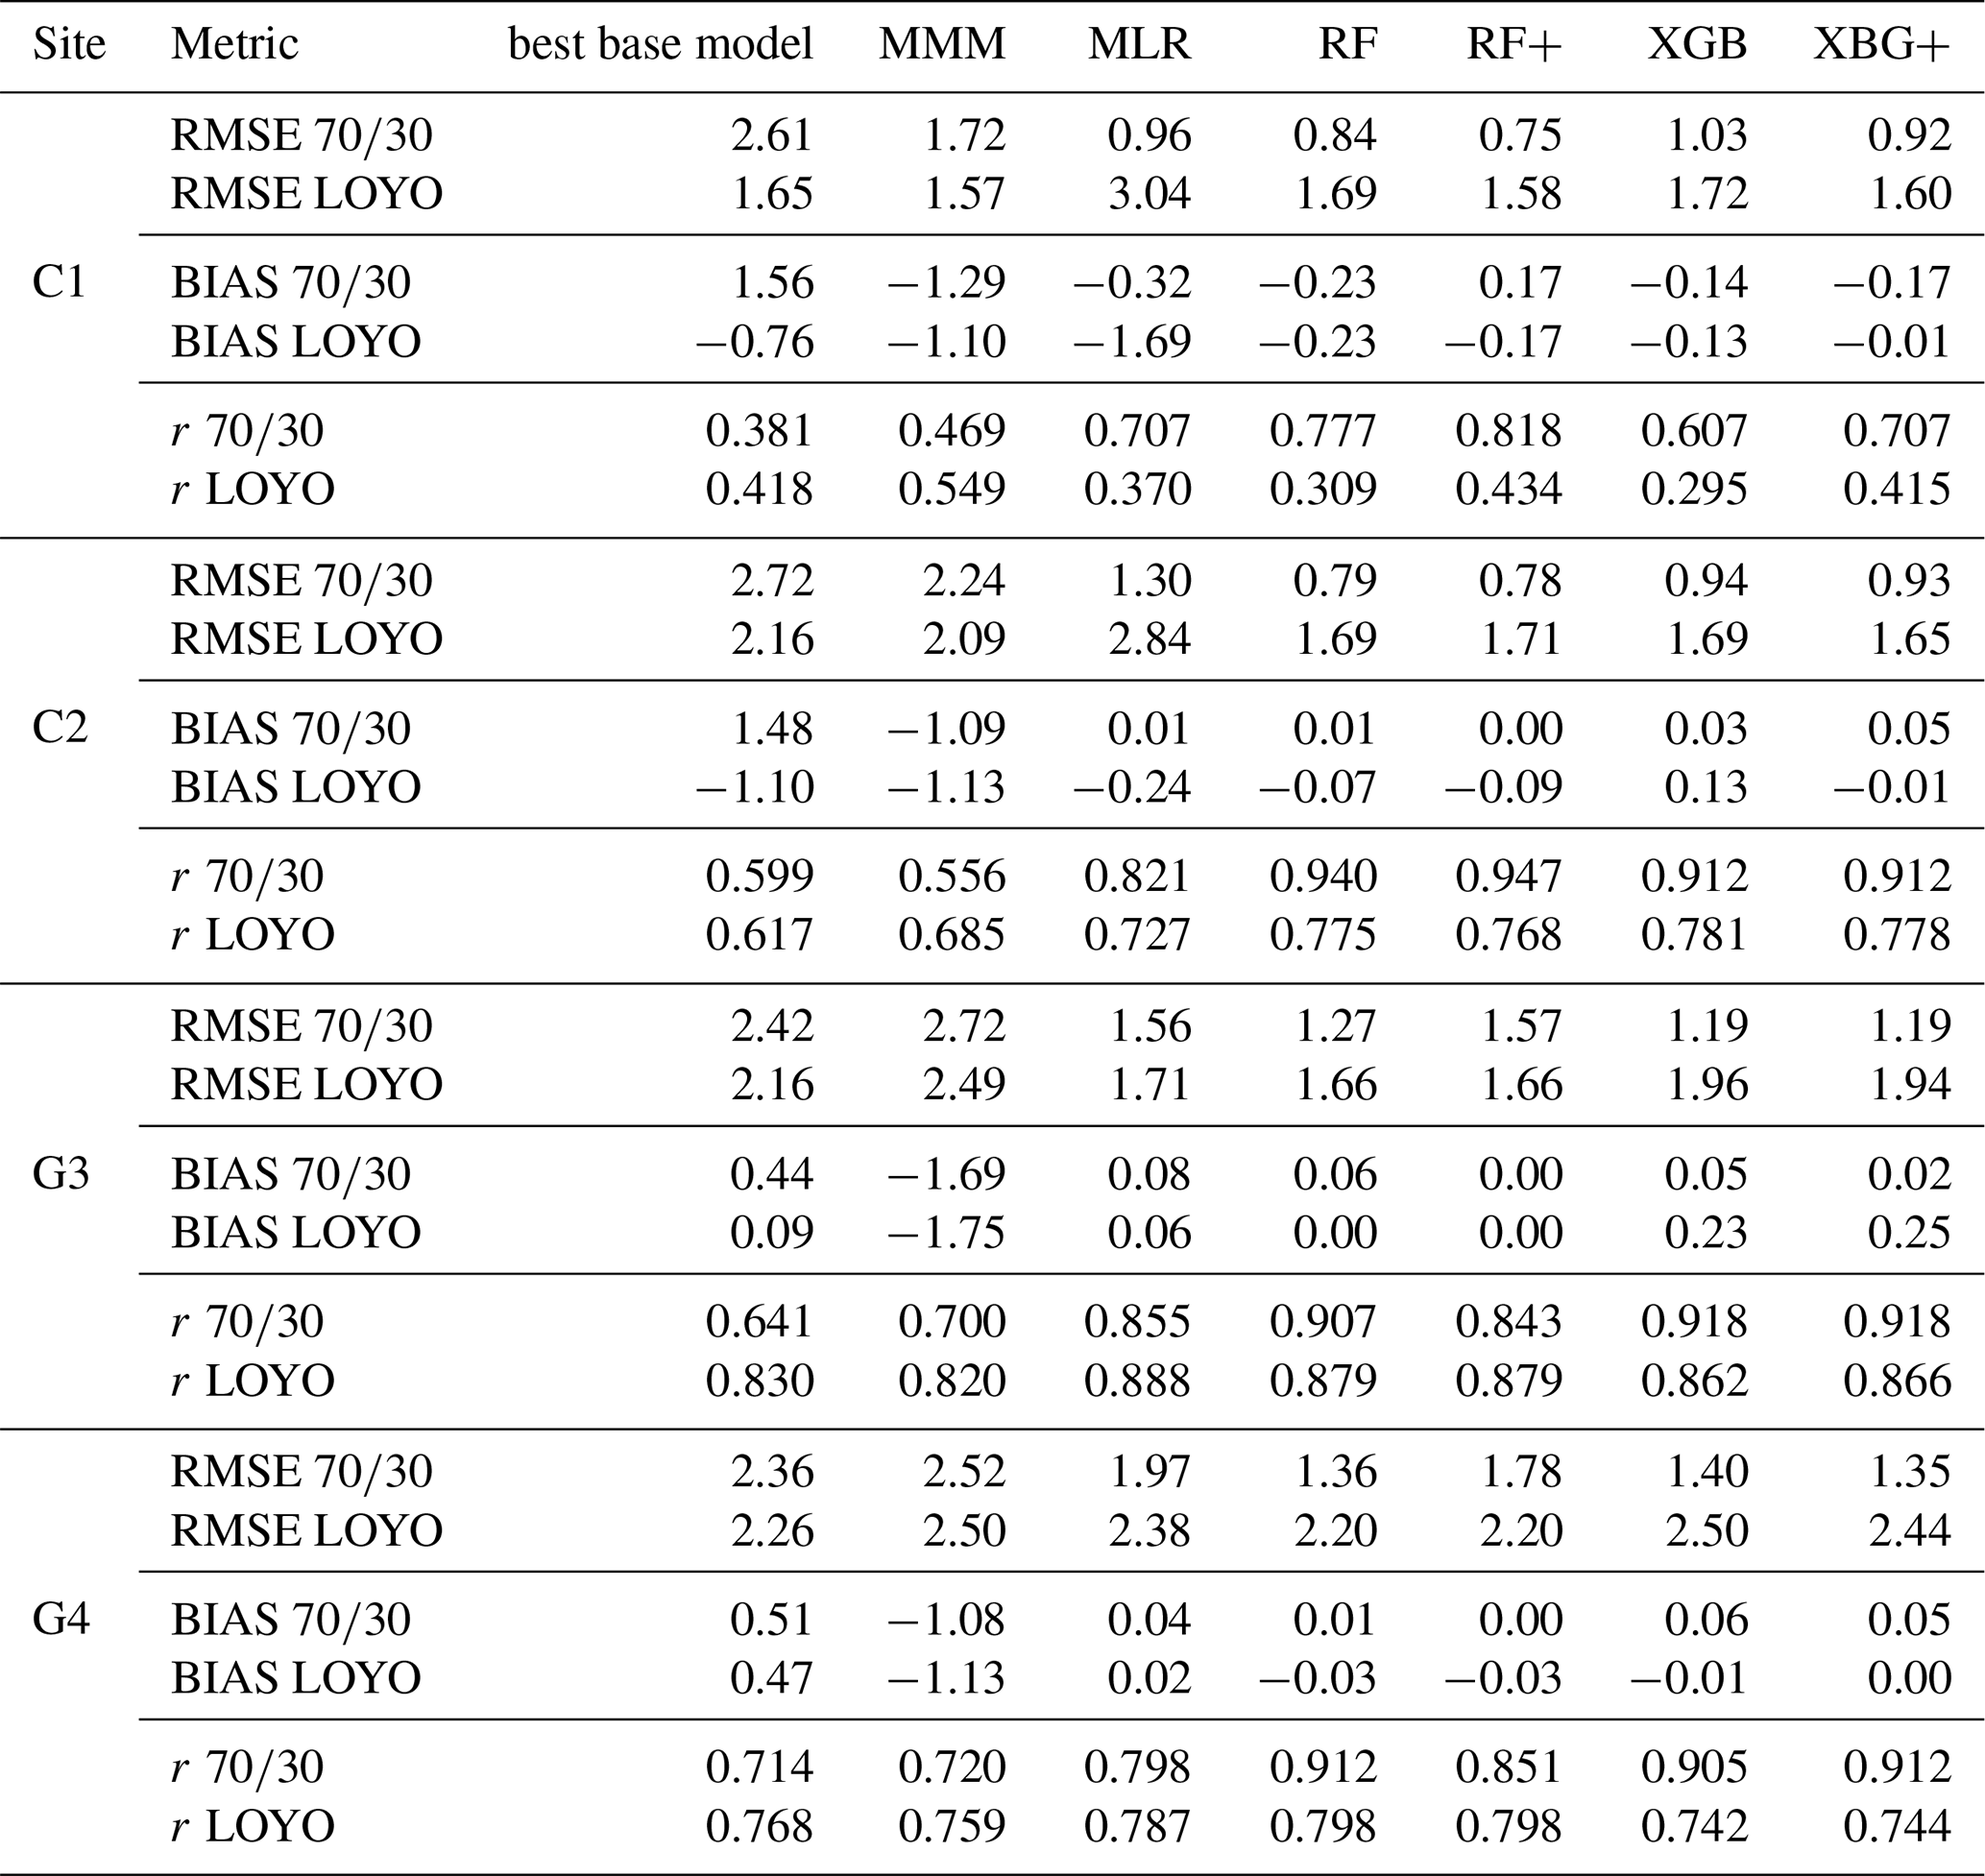
Table 3 presents statistical measures for all sites and modelling approaches evaluated, alongside the best-performing individual model, using data only from the validation subset.
Table 3Statistical evaluation of the best performing individual model, the multi-model median (MMM) and the applied meta-models (MLR, RF, RF+, XGB and XGB+) with respect to three performance metrics for GPP: root mean square error (RMSE), bias and Pearson's correlation coefficient (r). Only validation data were used for the calculation of the statistics. RMSE and BIAS are provided in g C m−2 d−1 units. The table present performance metrics for the and the LOYO strategy as well.
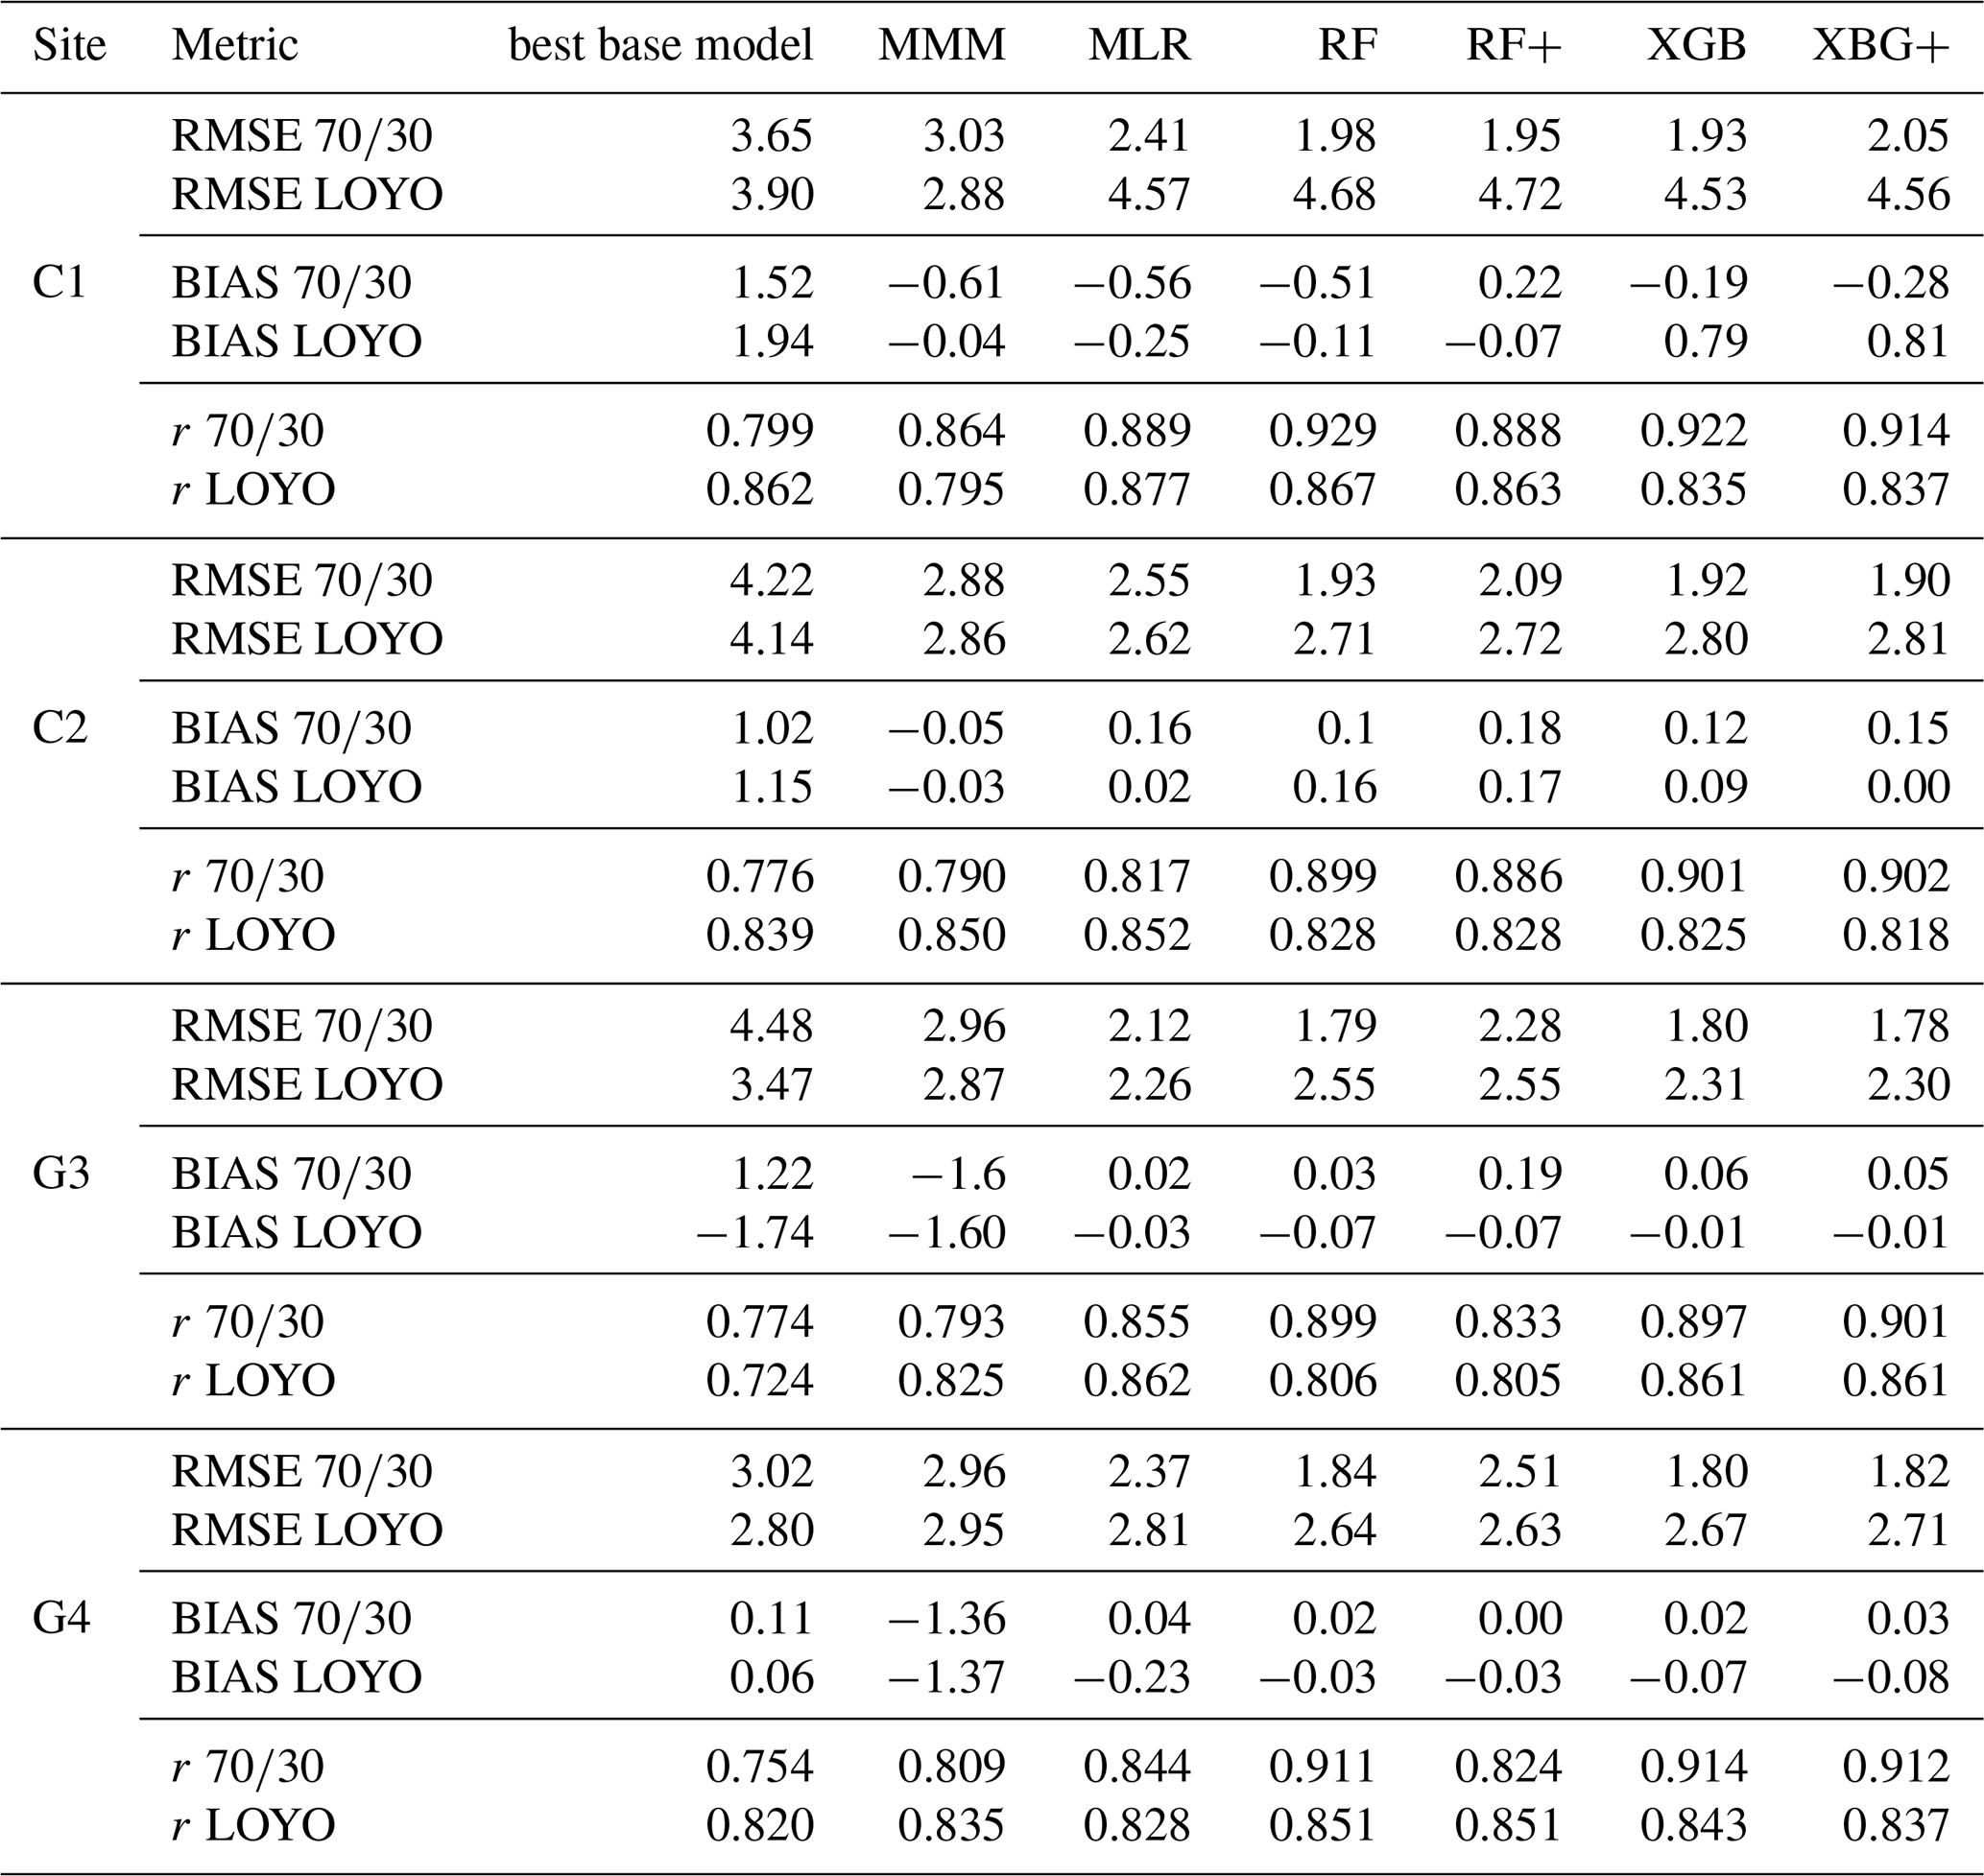
Table 3 highlights the improved performance of meta-models relative to both the best individual model and the MMM, which was previously published in Sándor et al. (2020). Notably, moving to more advanced meta-models results in reduction in both RMSE and absolute bias, which is more emphasized in case of the validation strategy. For the G4 site RMSE reduction was marginal for LOYO, while for C1 RMSE increased as we moved to more advanced methods (again, this is attributed to the limited validation data and differing crop types). For the two grassland sites, the meta-models provide almost bias-free estimations, while for the crop sites the bias remains low but does not approach zero. The correlation coefficient typically increased by a maximum of 0.11 for the best-performing meta-model compared with the MMM in case of within-regime validation ().
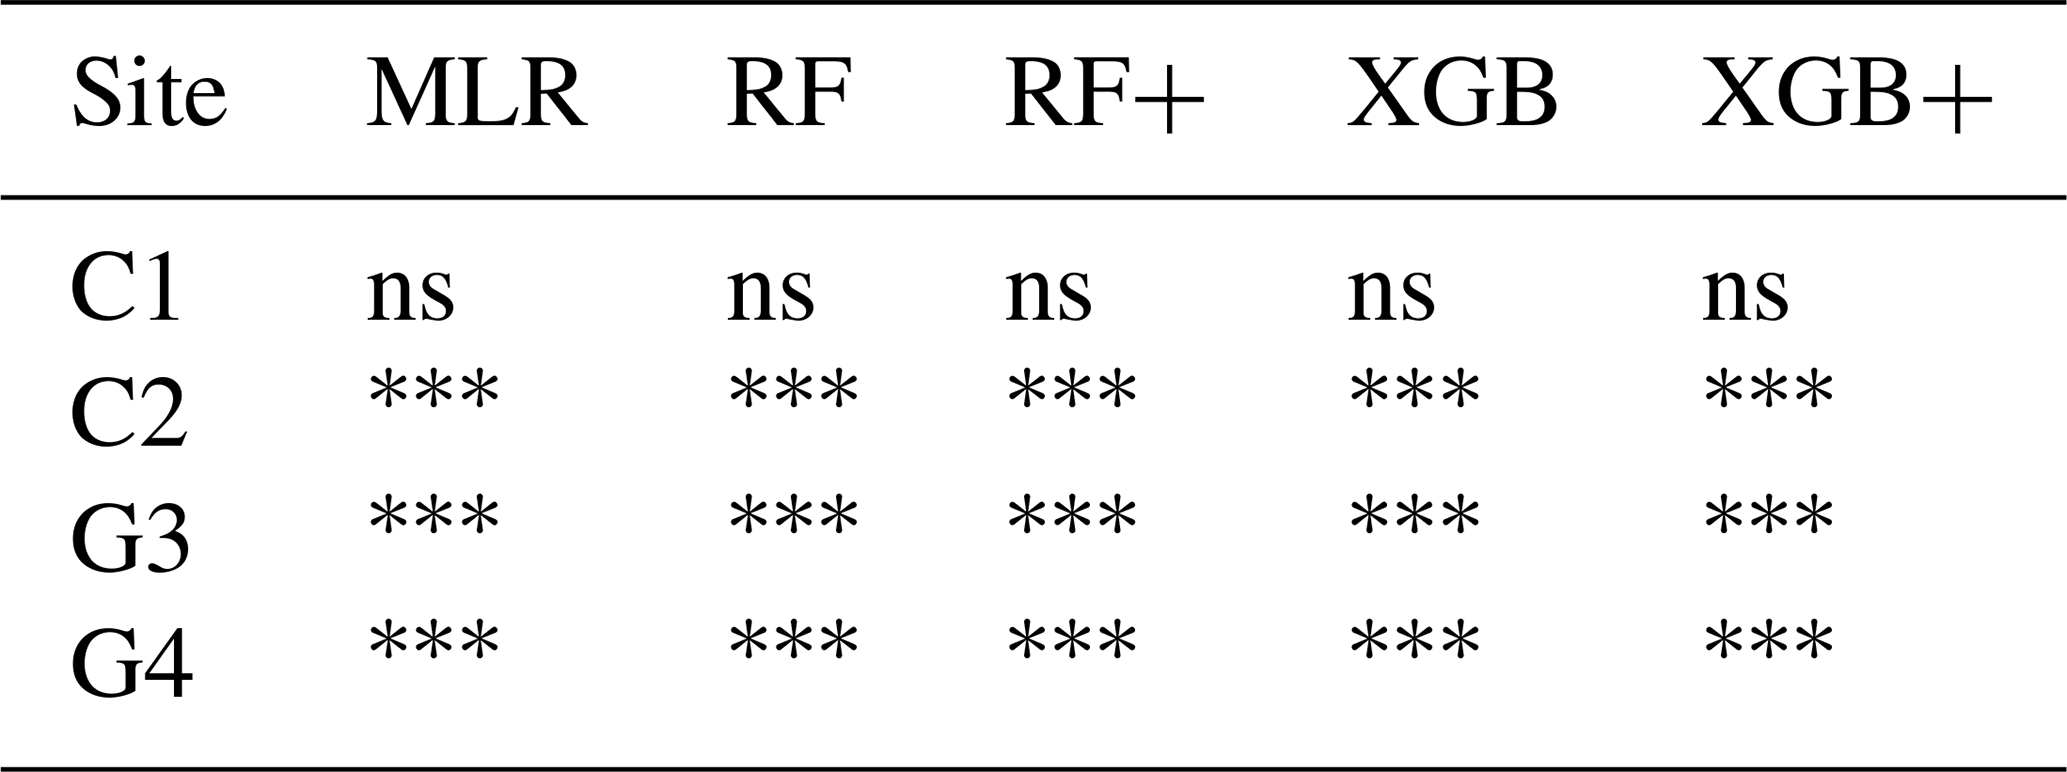
Wilcoxon signed-rank tests on daily prediction errors (Table 4) revealed strong and consistent improvements of meta-models over the Multi-Model Median baseline. For the grassland sites, all five meta-models performed significantly better than MMM for GPP, NEE, and RECO predictions. At cropland site C2, the tree-based models (RF, RF+, XGB, XGB+) showed significant improvements across all three variables, while MLR achieved significance only for RECO. At site C3, similar patterns emerged with tree-based models outperforming MMM for all variables. In contrast, site C1 showed no significant differences for any model-variable combination, likely due to high inter-annual variability with only two test years available. Overall, 43 out of 60 model-site-variable combinations demonstrated significantly better performance than MMM, with XGBoost-based models showing the most consistent improvements across sites and variables.
Table 4Statistical significance of meta-model performance compared to the Multi-Model Median (MMM) based on one-sided Wilcoxon signed-rank tests on daily prediction errors for GPP. The alternative hypothesis tested whether meta-models produce smaller squared residuals than MMM. Tests were performed separately for each Leave-One-Year-Out cross-validation fold, with p-values aggregated using the median across test years. The Benjamini-Hochberg procedure was applied per site to control the false discovery rate at 5 %. Significance levels: ; ; ; ns = not significant.
Given the novelty of the XGB+ method and its occasional better performance over all other approaches, here we analyse its functioning using SHAP values of the input data streams (individual models, plus temperature and precipitation) for both validation strategies. SHAP value analysis (Fig. 4) shows that certain models (e.g. M09, M01, M19 in case of LOYO, while M09, M19, M14 and M01 in case of at C1; M01, M19 and M14 using LOYO and as well at C2; M16, M24, M14 and M05 using LOYO and as well at G3; M16, M06, M22 in case of LOYO, while M22, M16 and M06 in case of at G4) dominate contributions to GPP prediction across sites. Temperature is also identified as a notable predictor (at C2 and G3 for both validation strategies). Precipitation consistently exhibits minimal impact on GPP prediction across all sites.
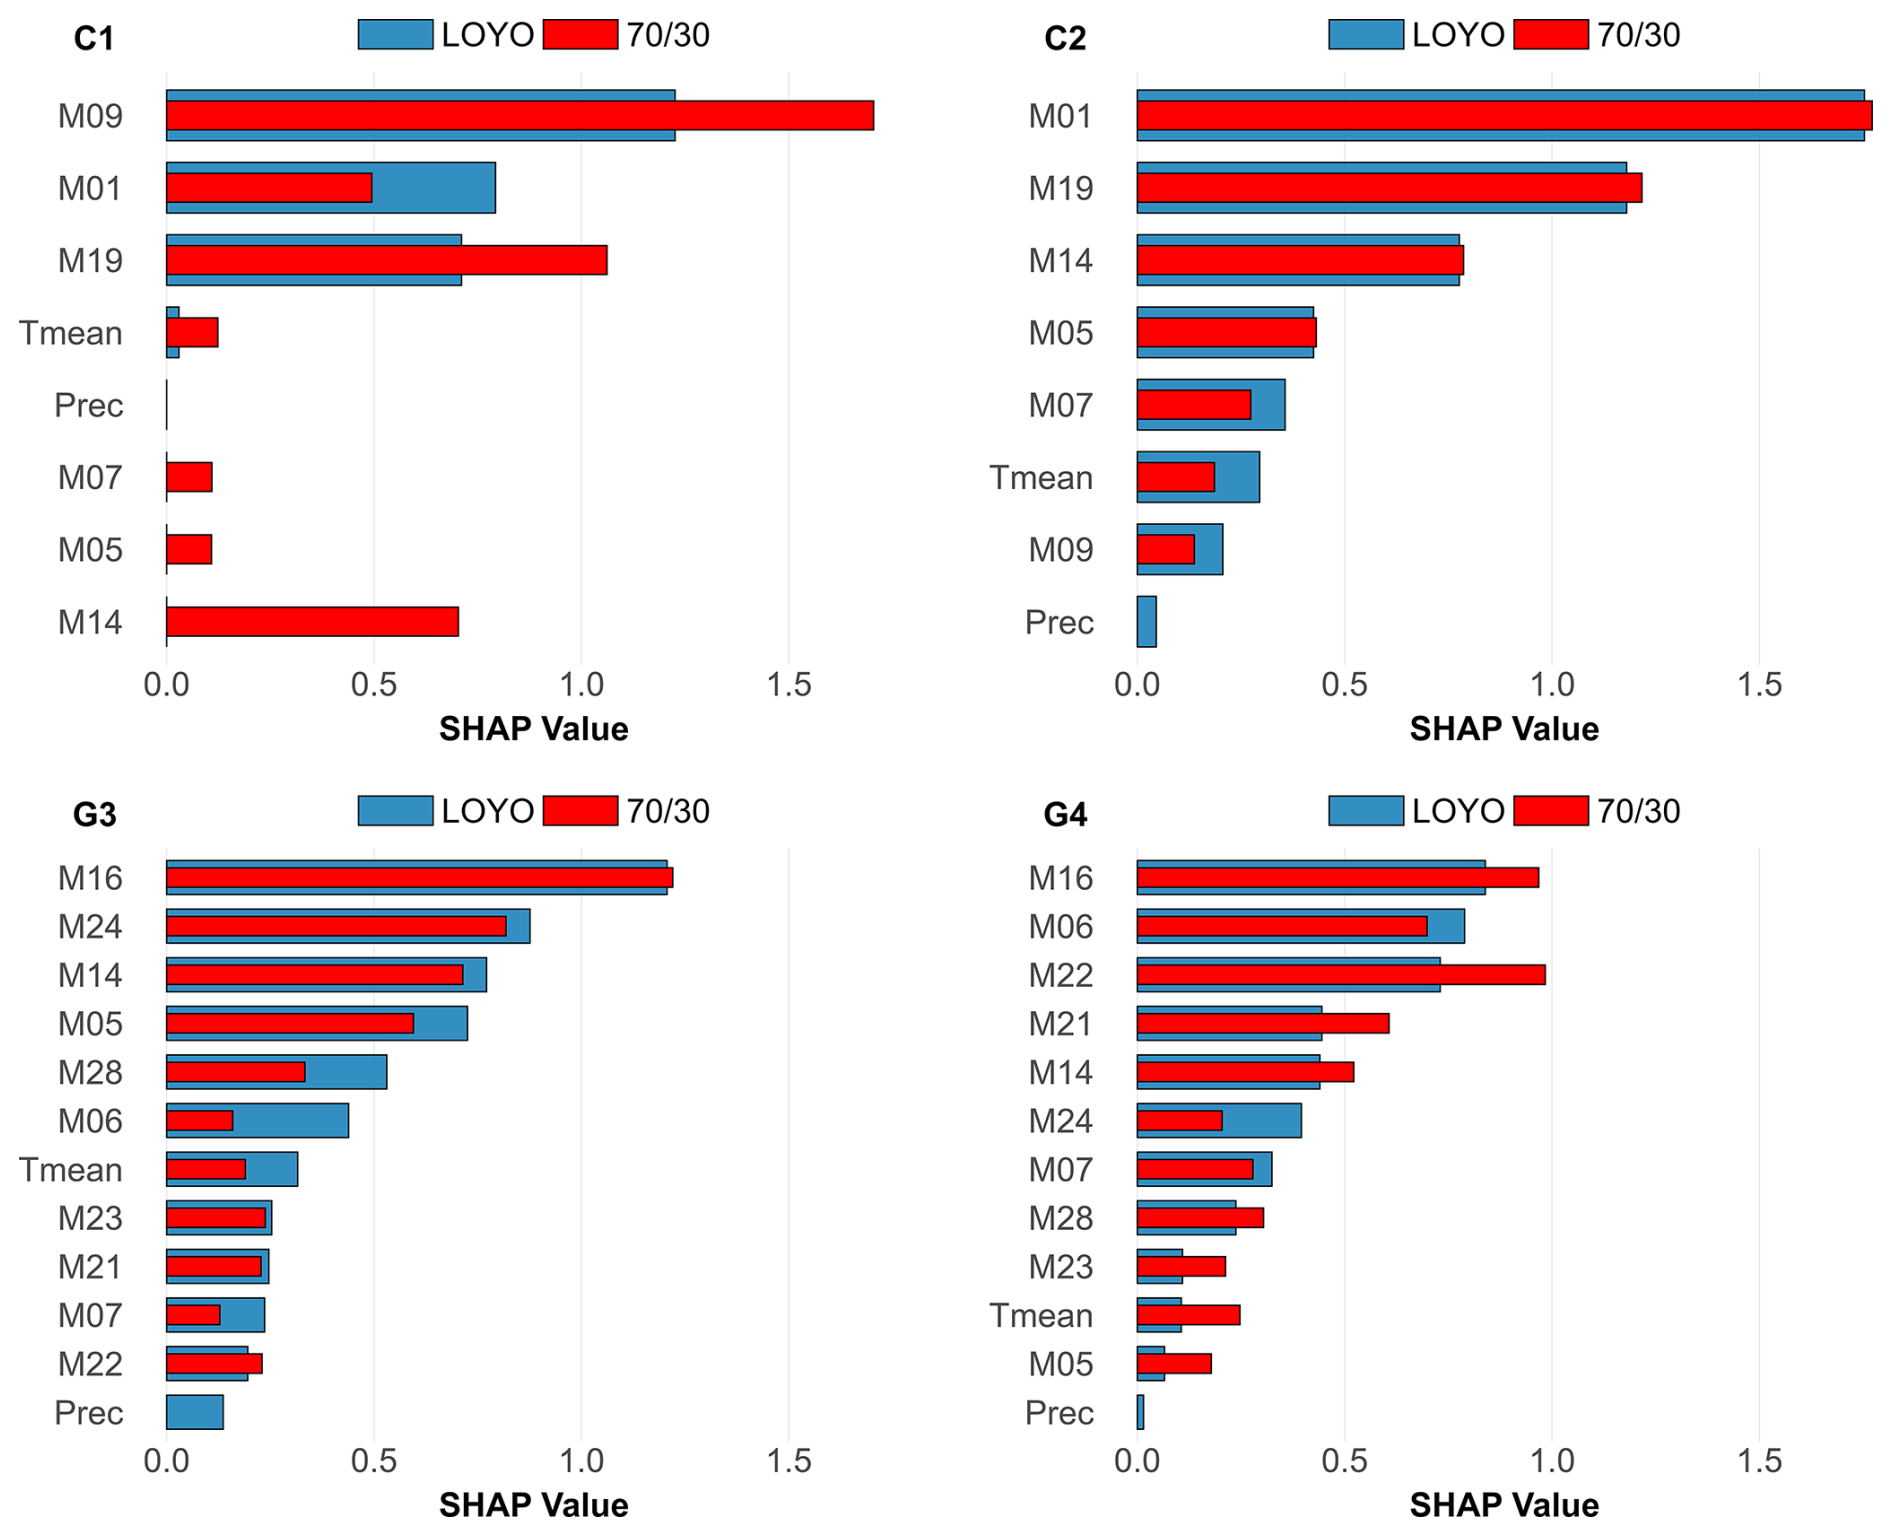
Figure 4The SHAP values of the XGB+ meta-model for GPP based on the strategy (red) and the LOYO strategy (blue). Larger values mean stronger contribution to the resulting GPP. Tmean stands for daily mean temperature, and Prec is daily precipitation.
3.2 RECO
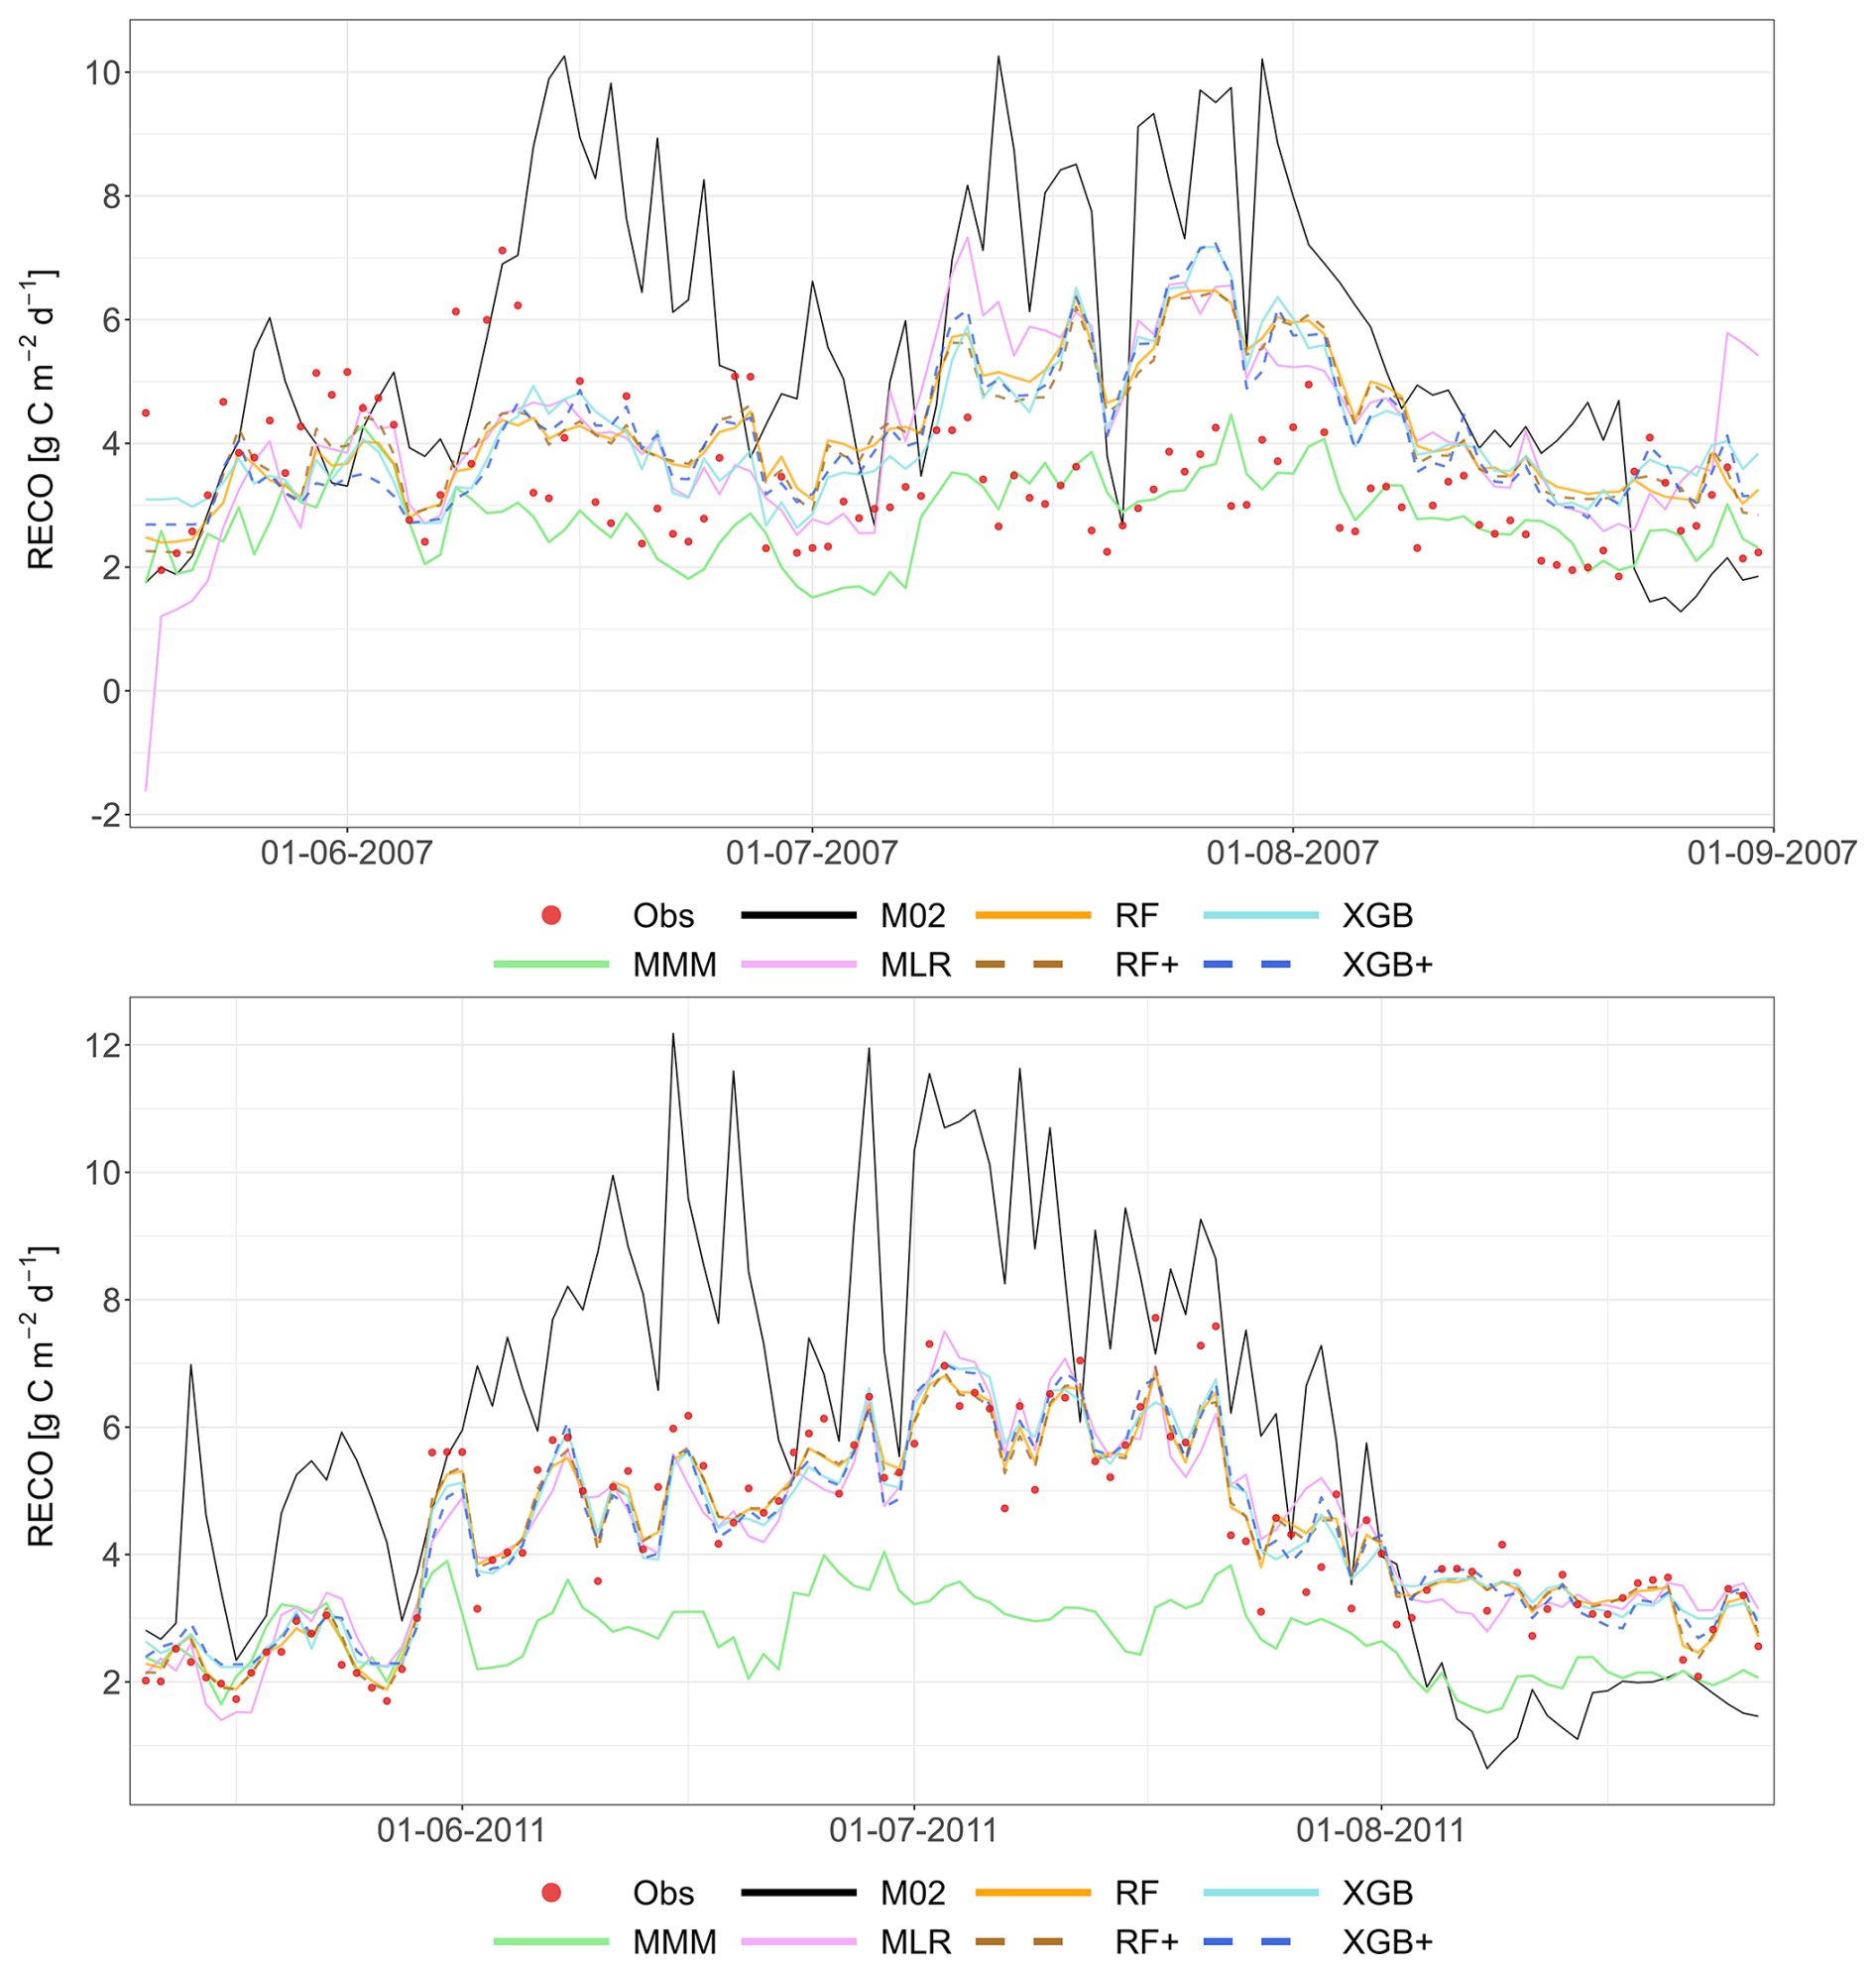
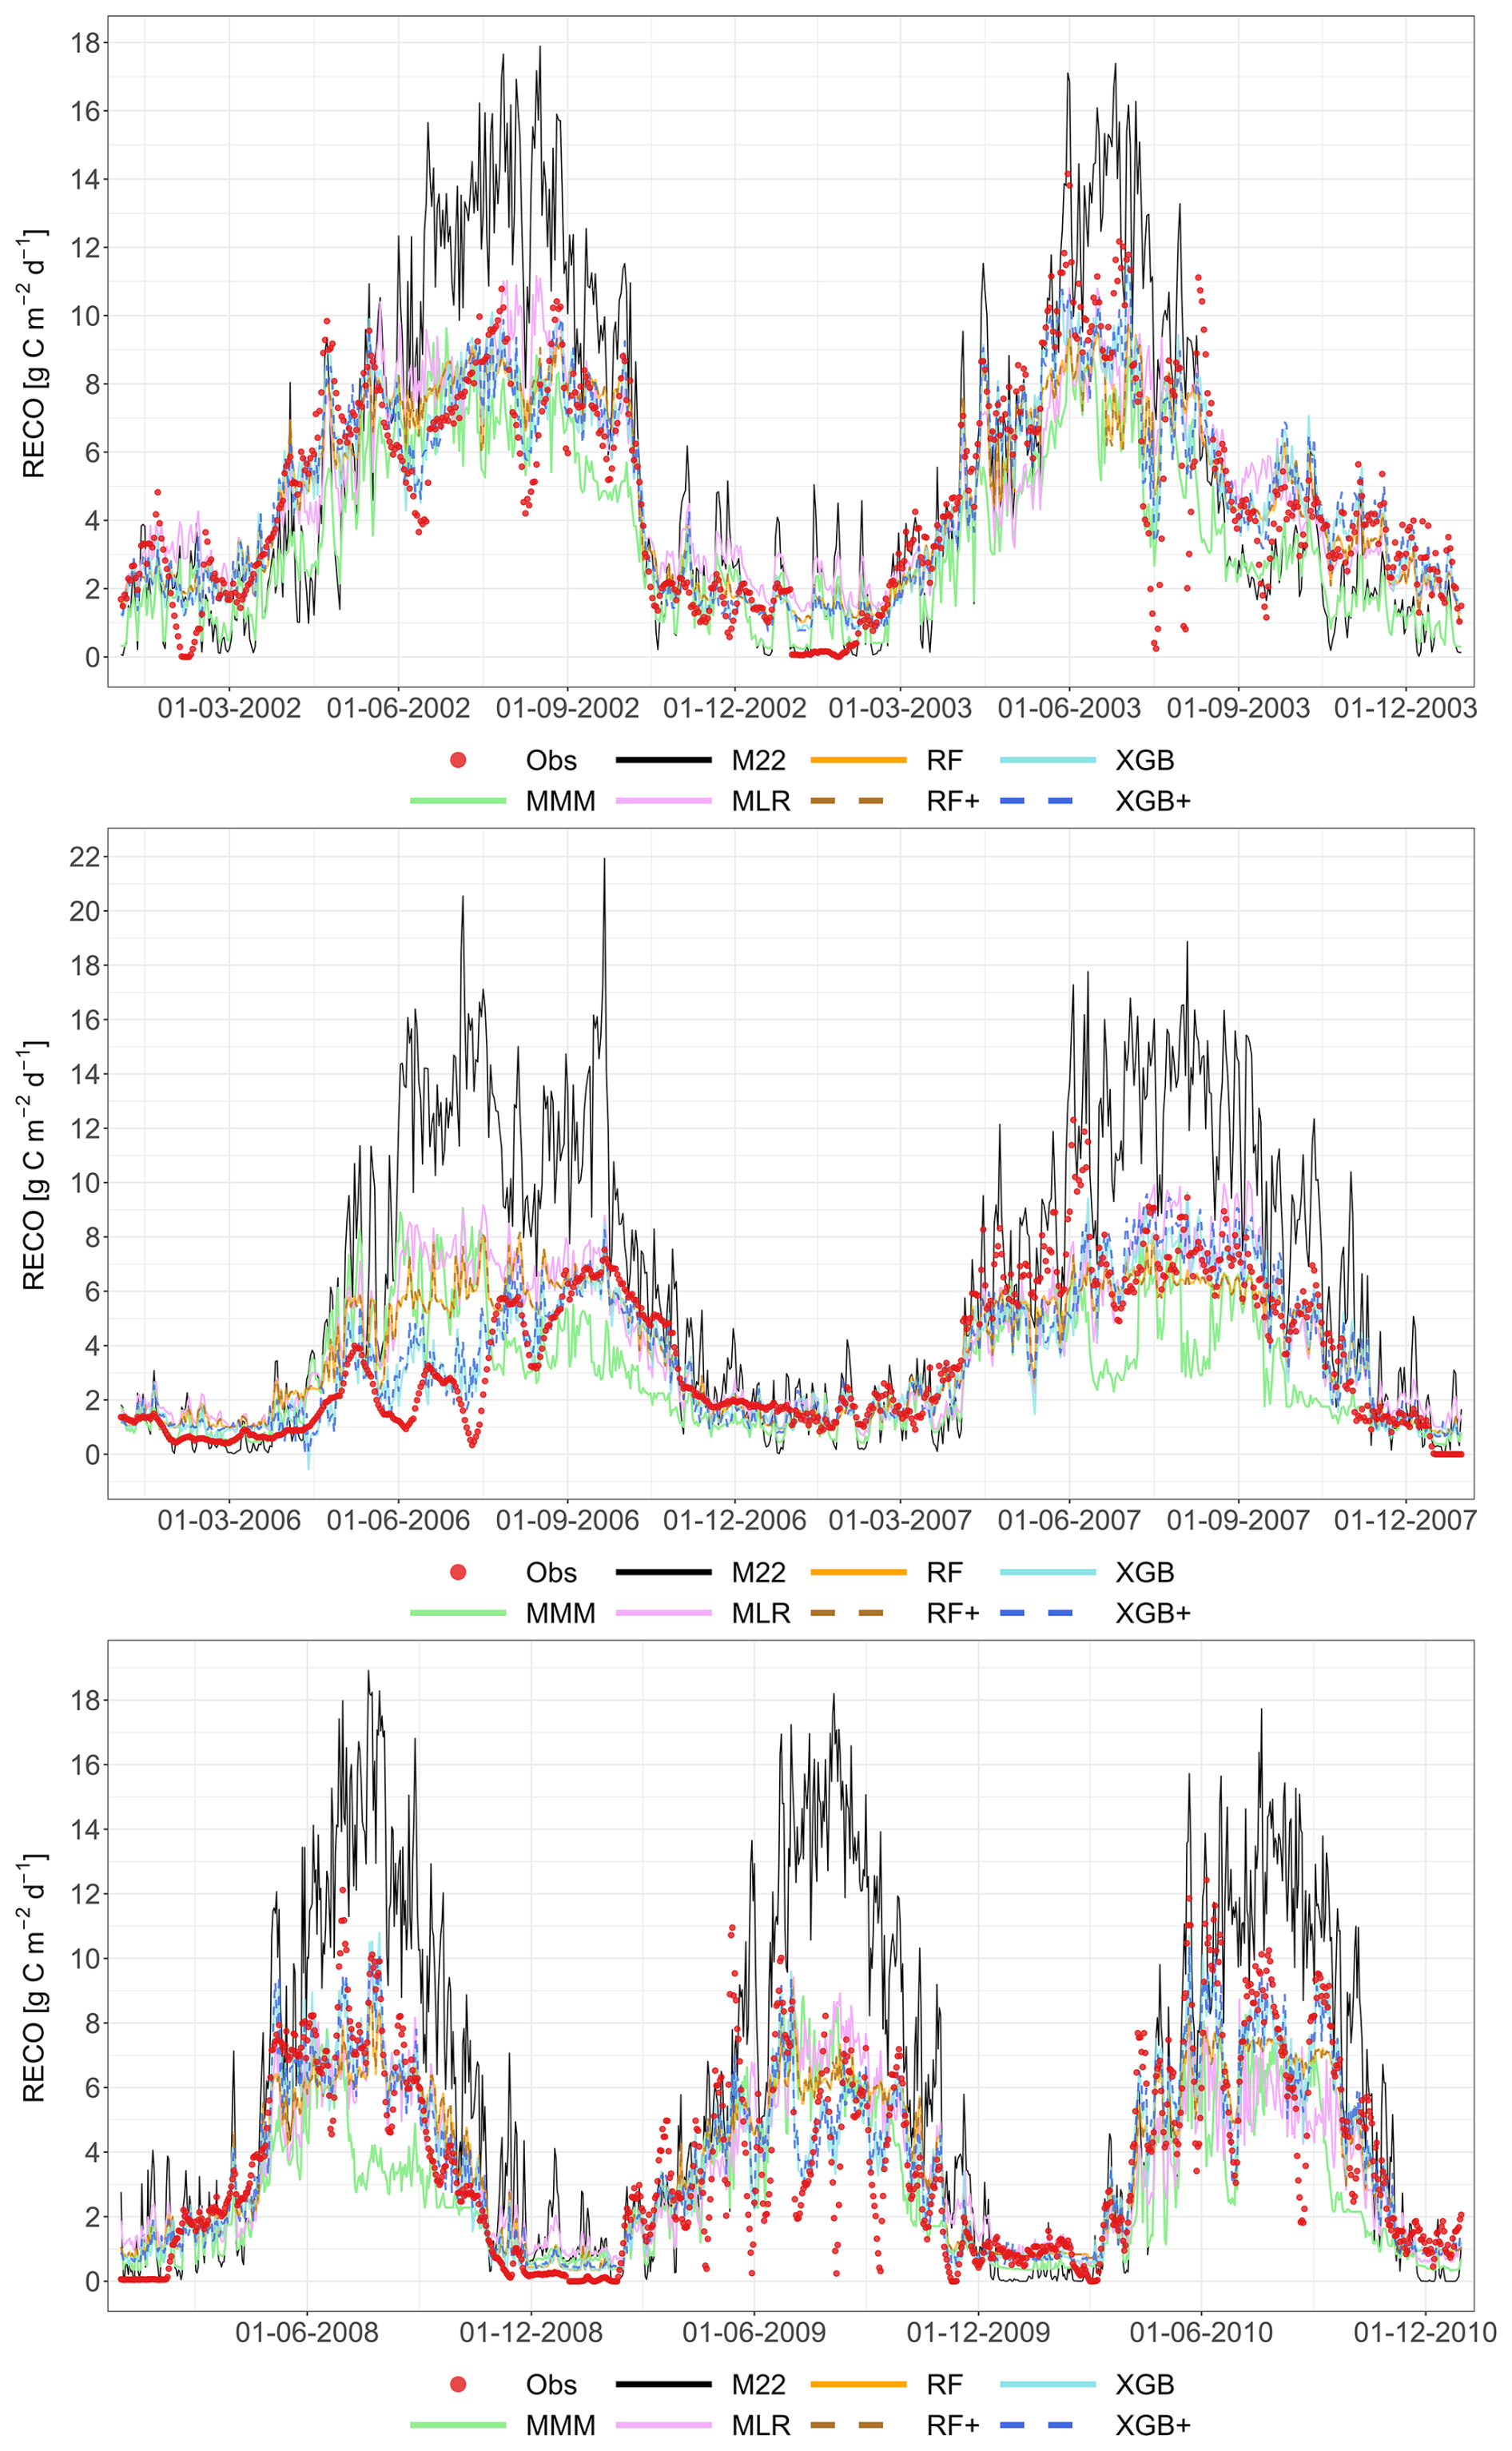
Figure 5 presents a two-year comparison of simulated and observed RECO for Grignon (C2) and Easter Bush (G4), again based on the LOYO strategy. The graphs display the results of the meta-models, the MMM and the best-performing individual models (M26 and M22). Appendix A contains the complete simulated dataset for all sites, and for all years, as well as for the strategy.
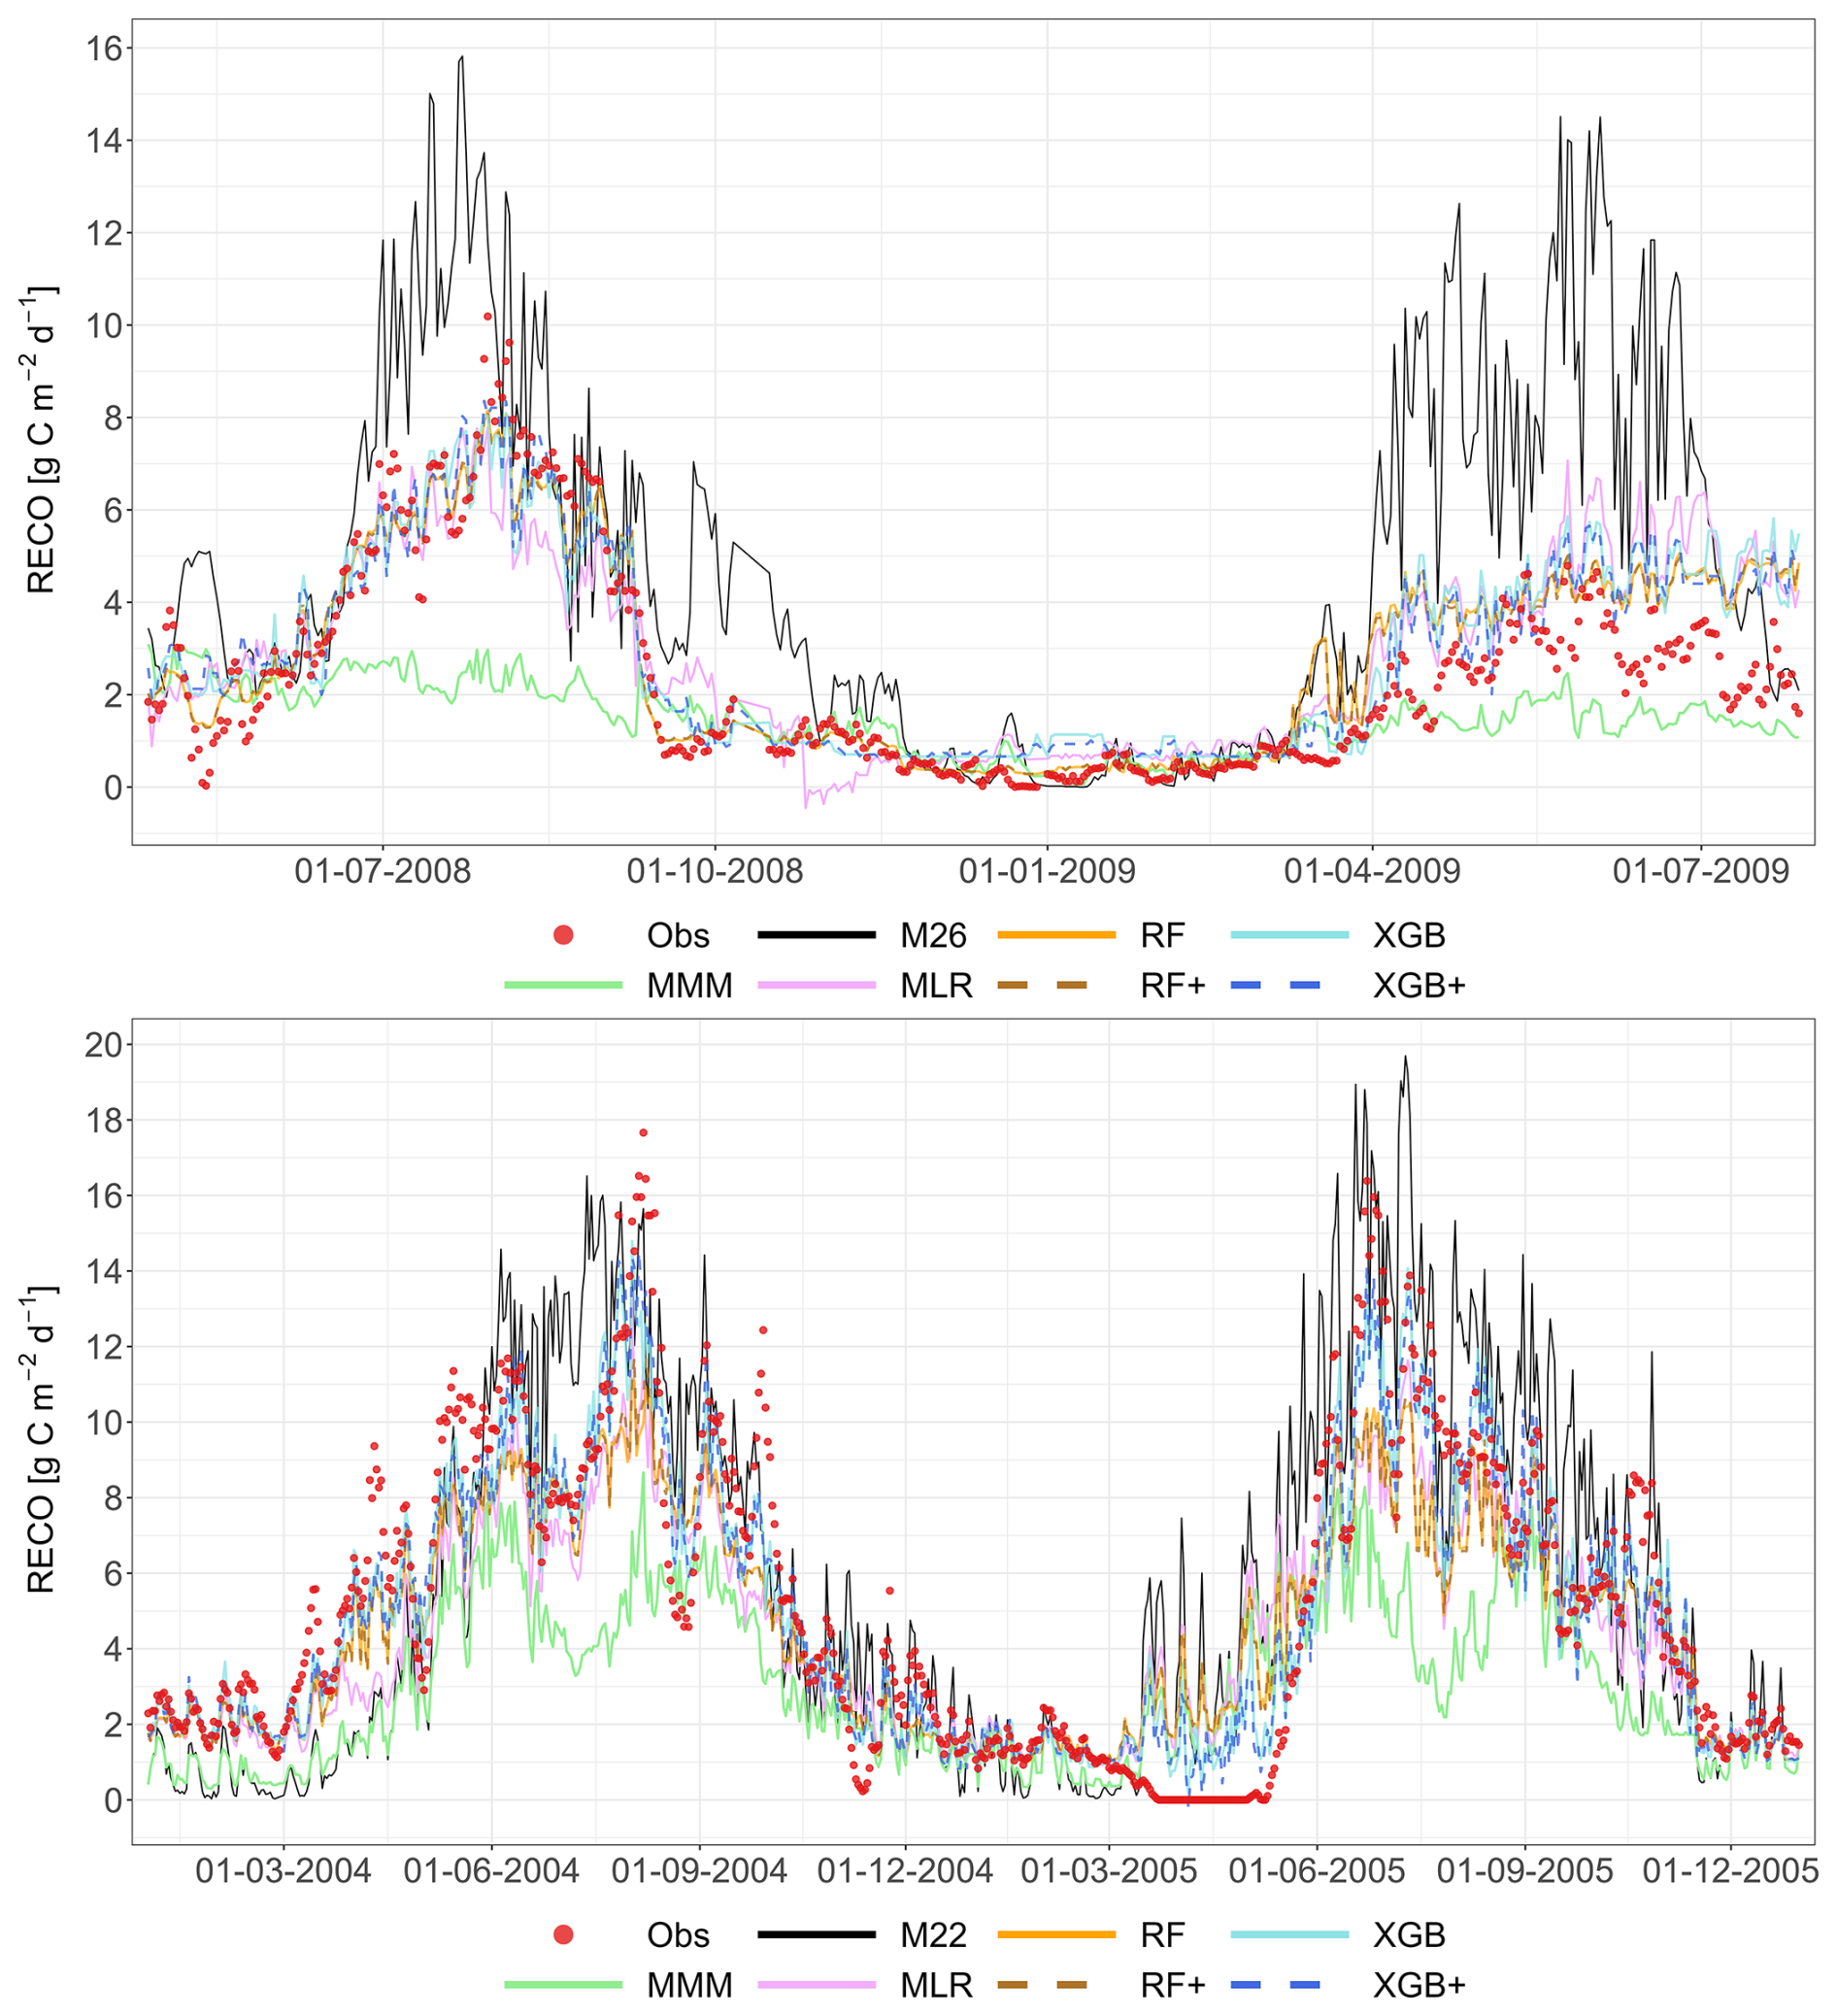
Figure 5Performance of the multi-model median (MMM, green), the constructed meta-models and the best-performing individual models for simulating RECO (LOYO strategy). The top panel shows results for the Grignon cropland site (C2), which includes maize and winter wheat. The bottom panel shows two years of data for the Easter Bush grassland site (G4). Observations are marked by red circles. The meta-models include Multiple Linear Regression (MLR, purple), Random Forest (RF, orange), XGBoost (XGB, light blue), Random Forest+ (RF+, hatched brown) and XGBoost+ (XGB+, hatched dark blue). The best-performing individual models (M01 at C2, M22 at G4) are shown in black. Dates are provided in the format of dd-mm-yyyy.
At both sites, the MMM consistently underestimates respiration. This bias is especially pronounced at G4, where the MMM produces sharp decline of RECO around June–July, resulting in a poor fit to the observations. In contrast, the meta-models and the best individual model successfully follow the positive peak of the measured values at this site. Regarding the individual models, the best-performing model at C2 (M26) overestimates both maize and winter wheat respiration. At G4, the best individual model (M22) greatly overestimates the maximum values for both years. This visual analysis suggests that the MMM does not clearly outperform M22 or M26.
A more quantitative analysis can be performed by inspecting Fig. 6, which presents scatterplots comparing simulated and observed RECO. The figures were constructed using one validation year selected based on the performance of the XGB+ method. The MLR consistently provides a “middle-ground” performance, with good performance at G4. The scatter plots in Fig. 6 distinctly illustrate that the MMM has a negative bias, which means that it consistently underestimates the observed RECO. This bias is eliminated even by the simplest meta-model (MLR), and as more sophisticated meta-model techniques are employed, the alignment with the 1 : 1 line becomes significantly better.
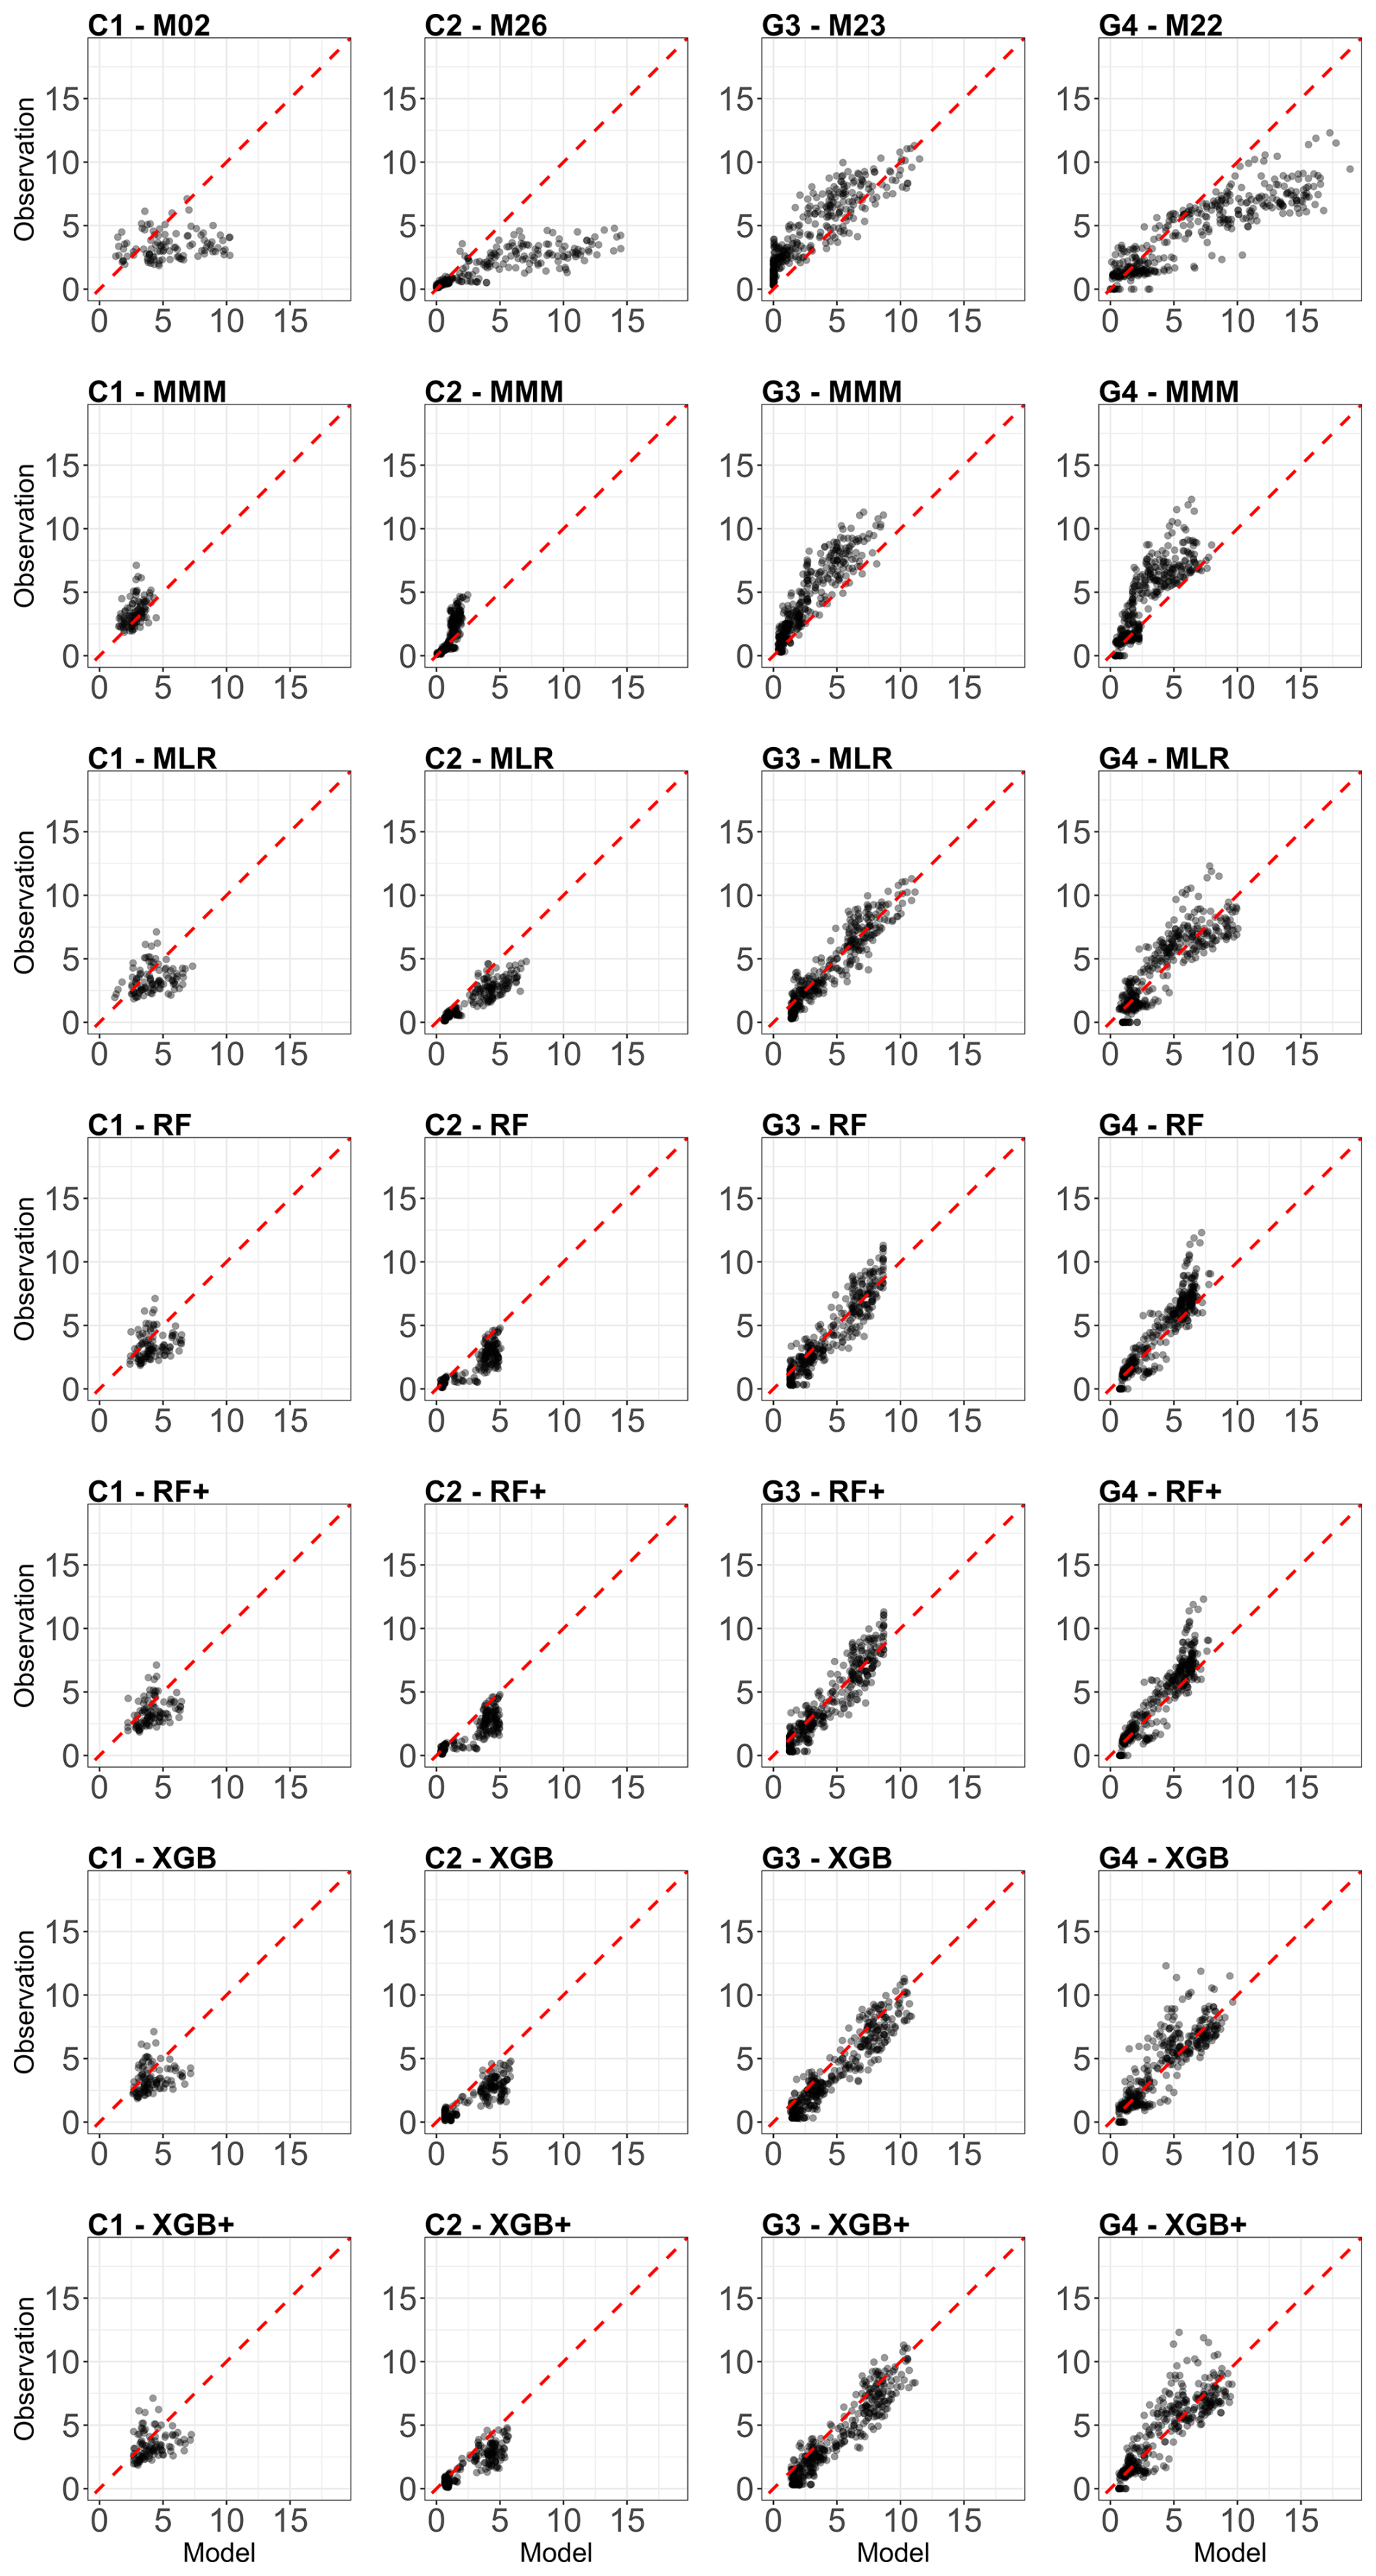
Figure 6Comparison of the best individual model, the multi-model median and the constructed meta-models with observations for RECO based on the LOYO approach. Each row represents a different model type, and columns correspond to the sites (from left to right: C1, C2, G3, and G4). The top row shows the best individual models with their identifiers (M13 at C1, M01 at C2, M22 at G3 and G4). The remaining rows show the MMM, MLR, RF, RF+, XGB and XGB+. All units are in g C m−2 d−1. The red dashed line represents the 1 : 1 relationship.
Table 5 provides statistics calculated based on the validation dataset both for and LOYO strategy. A comparison of the MMM and the best individual models reveals some key differences. At C1 the MMM exhibits lower RMSE values, indicating better accuracy. The correlation coefficient is higher than the best individual model at C1 (0.469 vs. 0.381 for , while 0.549 vs. 0.418 for LOYO) but slightly lower at C2. At the grassland sites (G3 and G4), the MMM shows slightly higher RMSE values but a better correlation coefficient than for the best individual models. The MMM at the C1 and C2 sites behaves differently compared to the other models. Overall, the meta-models demonstrate a distinct improvement over both the MMM and the best individual models (except for G4 with the LOYO strategy). Among the meta-models, RF, RF+, XGB and XGB+ are the top performers. At the grassland sites, the performance differences between RF, RF+, XGB, and XGB+ were small, with all three models demonstrating strong performance across all metrics under the LOYO strategy. Overall, correlation coefficients increased in a variable fashion (C2 was associated with the largest increase both under LOYO and , while the increase was marginal for the grassland sites. The meta-models typically show almost unbiased estimates, with the exception of site C1.
Table 5Statistical evaluation of the best-performing individual model, the multi-model median (MMM) and the applied meta-models (MLR, RF, RF+, XGB and XGB+) for RECO. Three performance metrics are used: root mean square error (RMSE), bias and Pearson's correlation coefficient (r). Only validation data were used for the calculation of the statistics. RMSE and BIAS are provided in g C m−2 d−1 units.
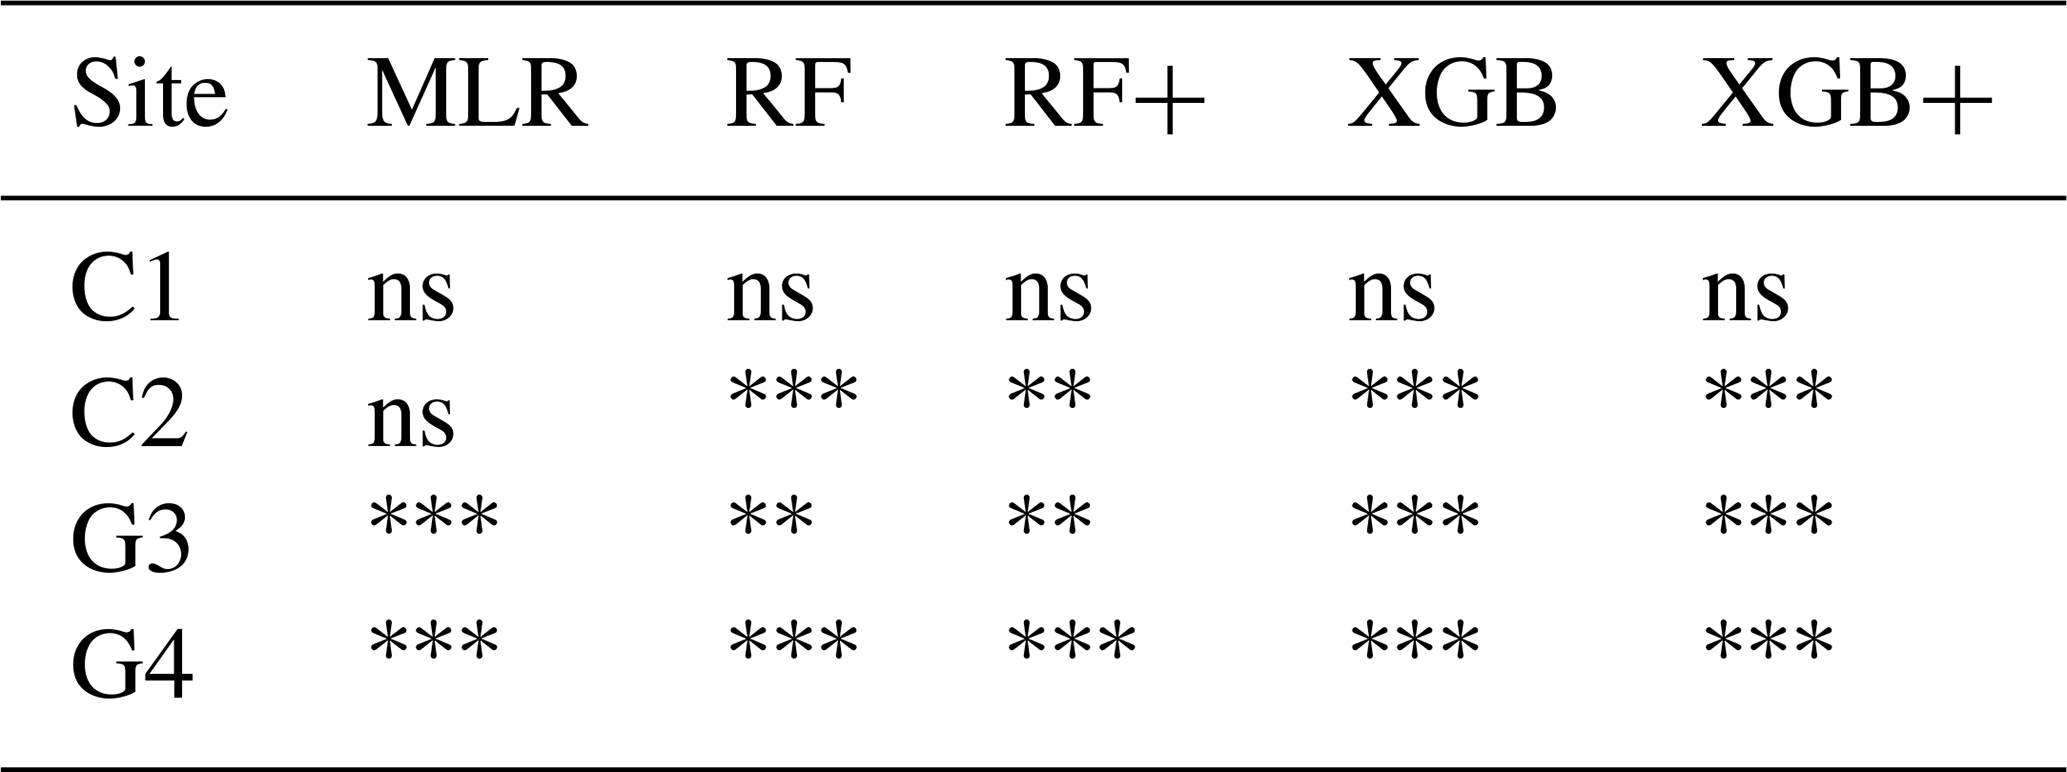
Wilcoxon signed-rank tests on daily prediction errors (Table 6) confirmed the performance improvements observed in the RMSE metrics. For RECO predictions, all five meta-models achieved statistical significance at both grassland sites (G3 and G4) and at cropland site C2. Site C1 showed no significant differences for any model. This pattern demonstrates that the RMSE improvements for RECO are statistically robust and not merely artifacts of random variation, particularly for the grassland ecosystems where all meta-modelling approaches consistently outperformed the baseline. Notably, in some cases a meta-model may show higher RMSE than MMM yet still demonstrate statistical significance in the Wilcoxon test (e.g., MLR at site C2: RMSE of 2.84 vs. MMM's 2.09, yet significant at p<0.001). This reflects the different aspects these metrics evaluate: RMSE is sensitive to outliers and can be inflated by poor performance in a single year, while the Wilcoxon test based on median p-values assesses whether the model typically performs better across most years, providing a more robust measure of consistent improvement.
Table 6Statistical significance of meta-model performance compared to the Multi-Model Median (MMM) based on one-sided Wilcoxon signed-rank tests on daily prediction errors for RECO. The alternative hypothesis tested whether meta-models produce smaller squared residuals than MMM. Tests were performed separately for each Leave-One-Year-Out cross-validation fold, with p-values aggregated using the median across test years. The Benjamini-Hochberg procedure was applied per site to control the false discovery rate at 5 %. Significance levels: ; ; ; ns = not significant.
SHAP values (Fig. 7) indicate that model outputs are the primary contributors of RECO predictions. Among environmental predictors, mean temperature emerges as an important contributor, especially at site C1, where its influence nearly matches top models M19 and M09 for , and it is the most important for LOYO. Precipitation influence on RECO is negligible across all sites.
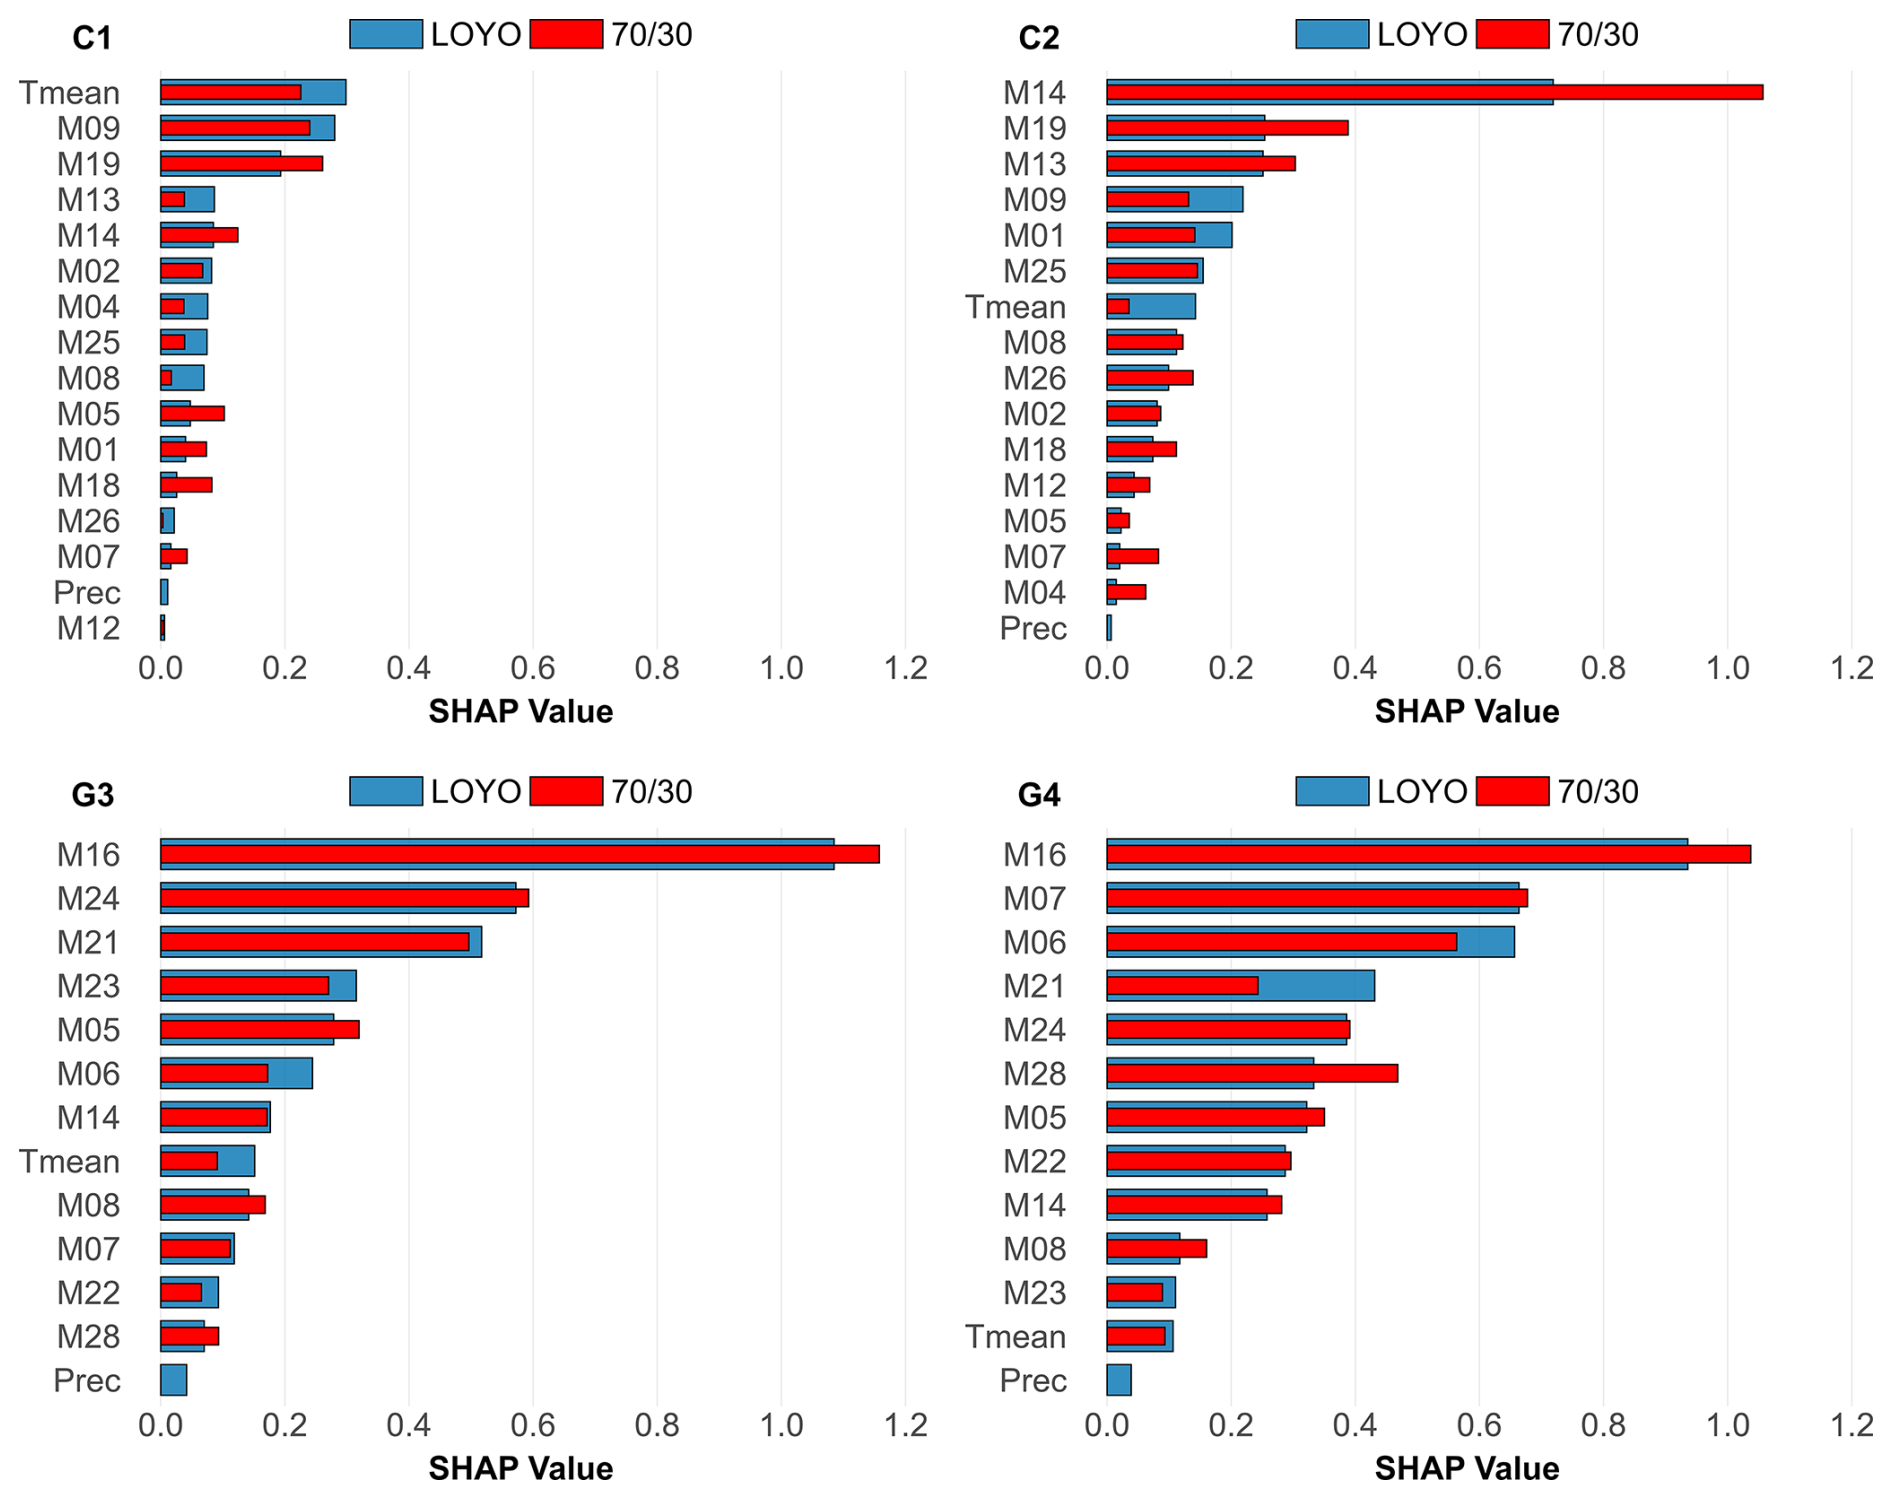
Figure 7The SHAP values of the XGB+ meta-model for RECO based on the strategy (red) and the LOYO strategy (blue). Larger values mean stronger contribution to the resulting RECO. Tmean stands for daily mean temperature, and Prec is daily precipitation.
3.3 NEE
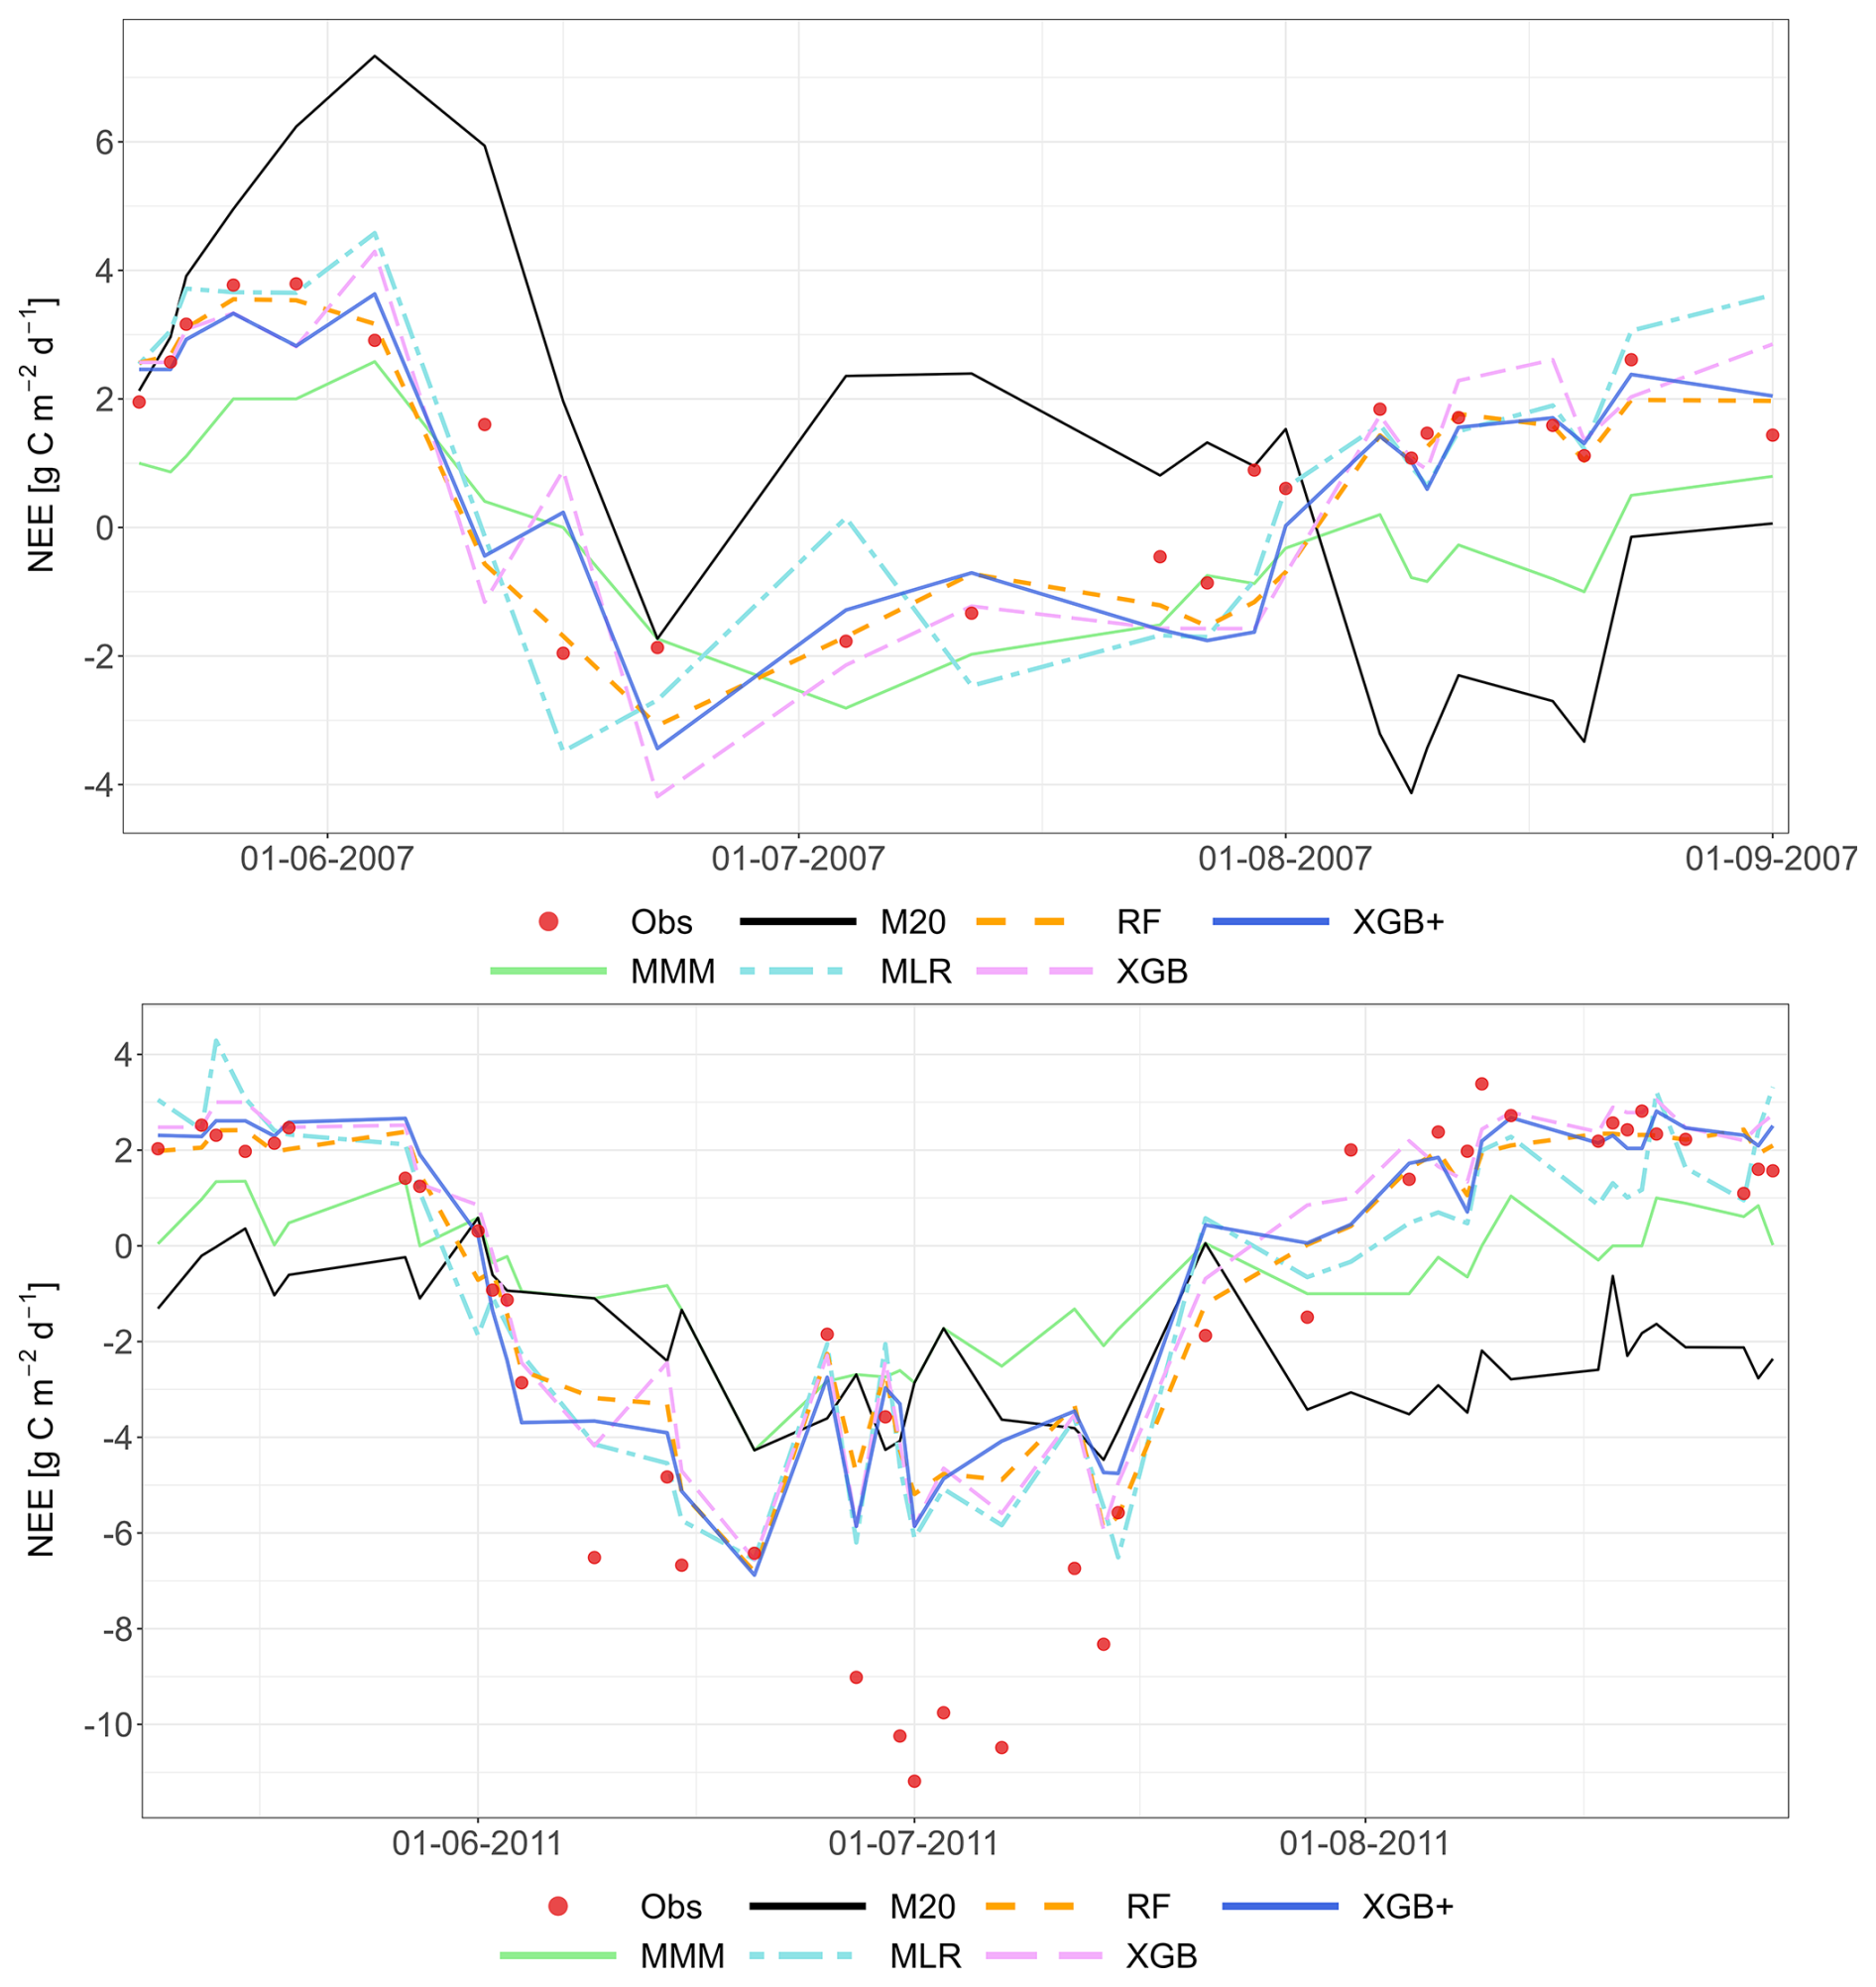
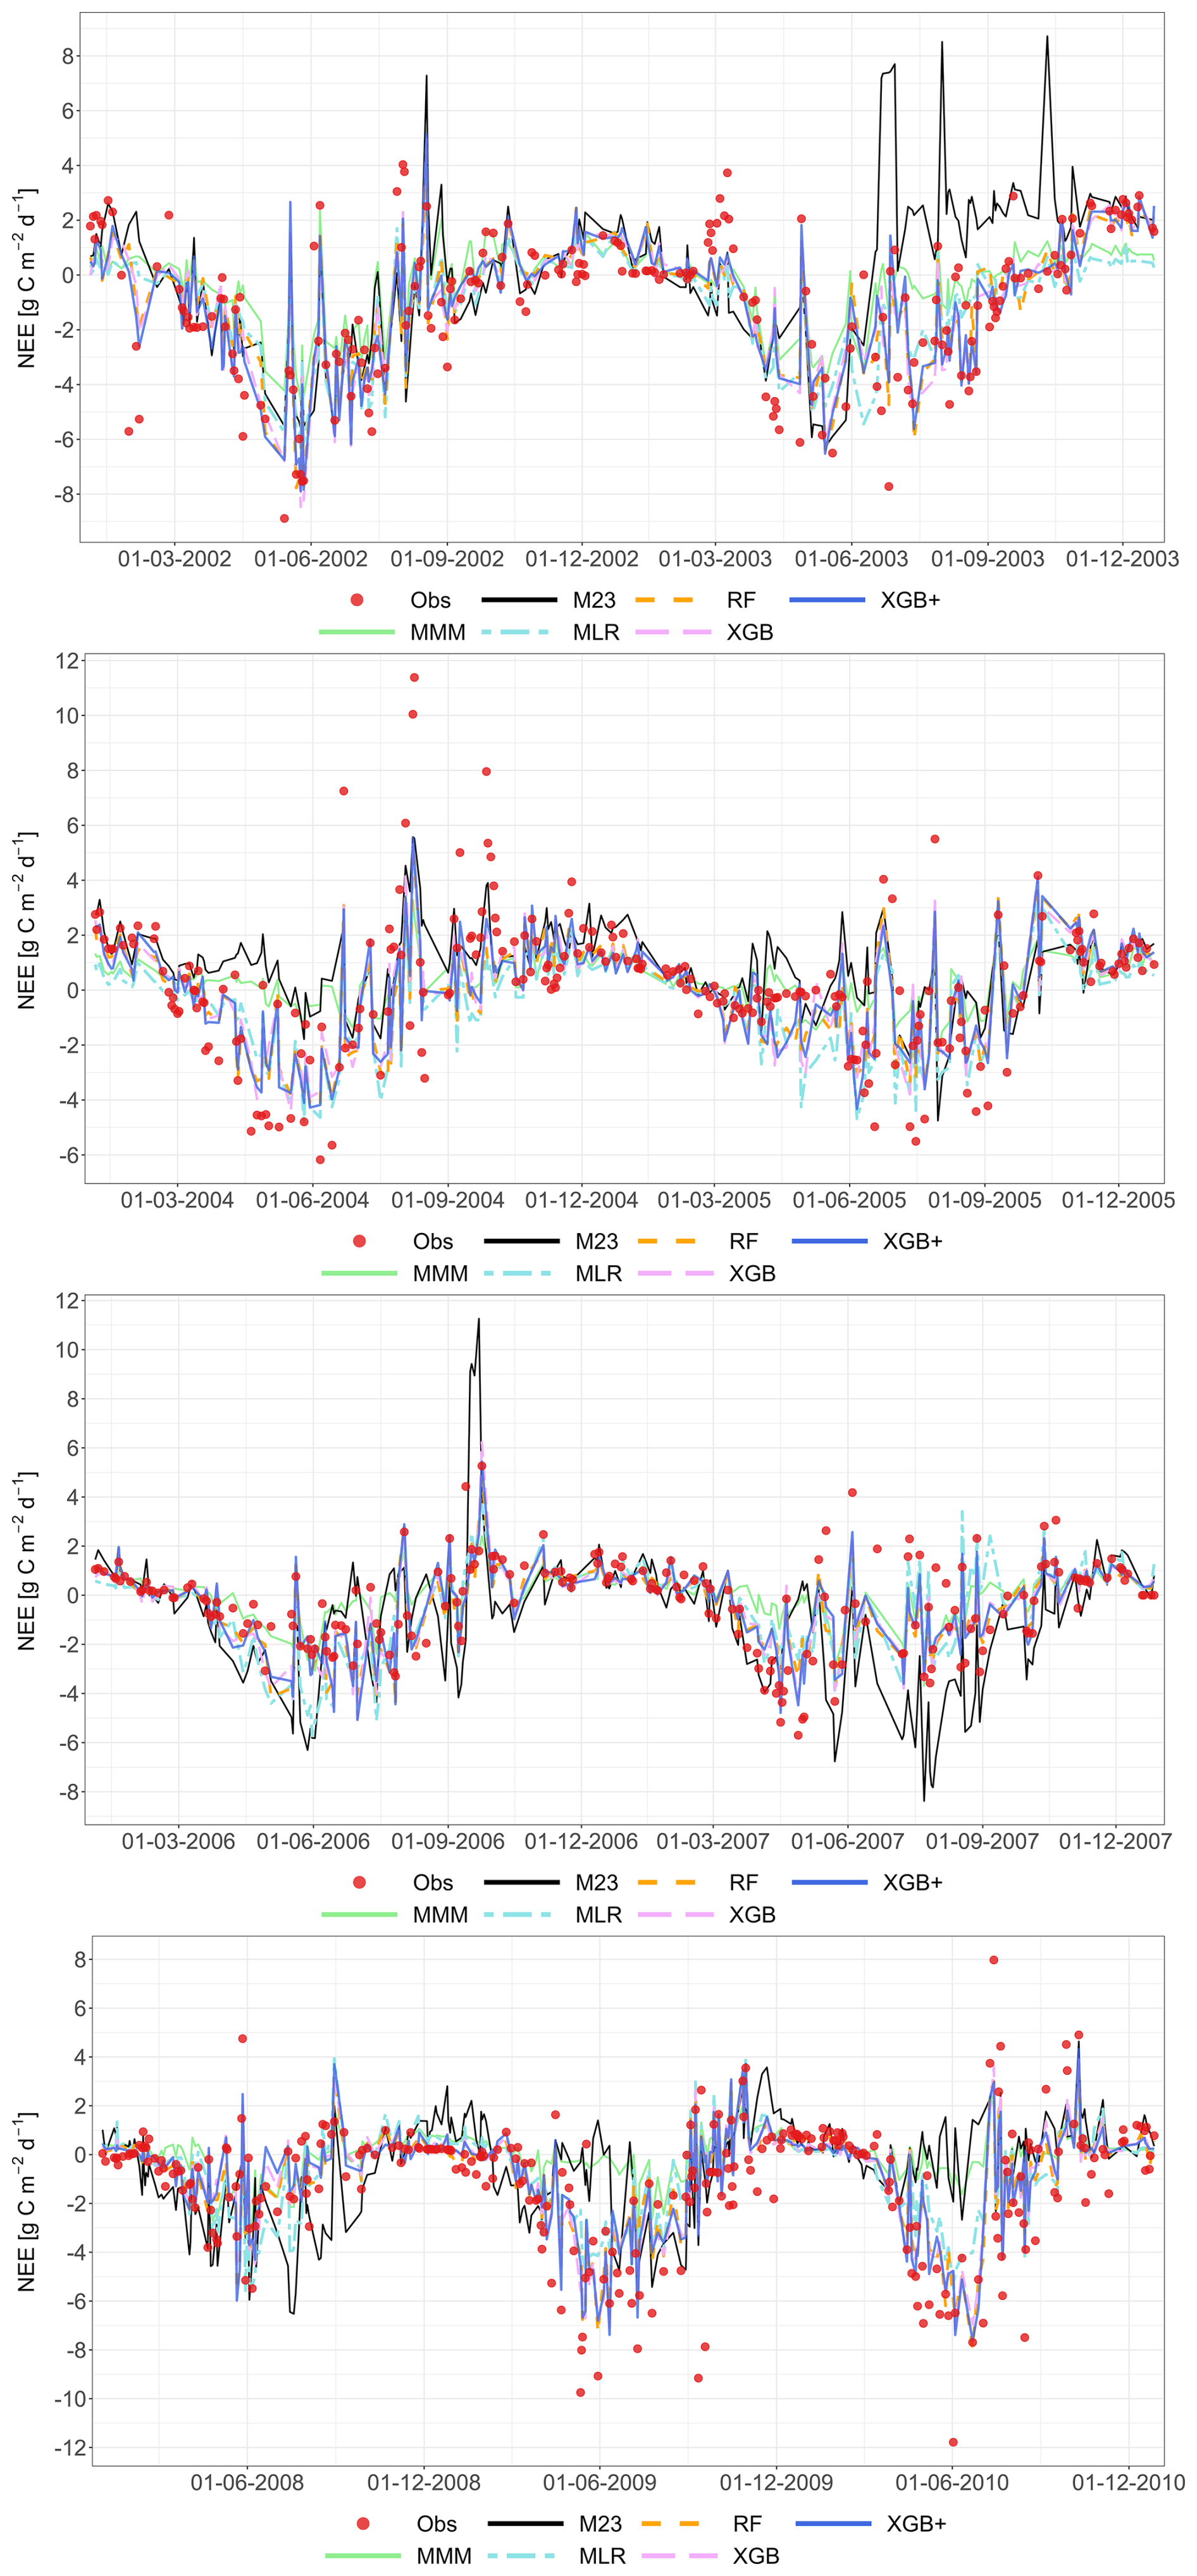
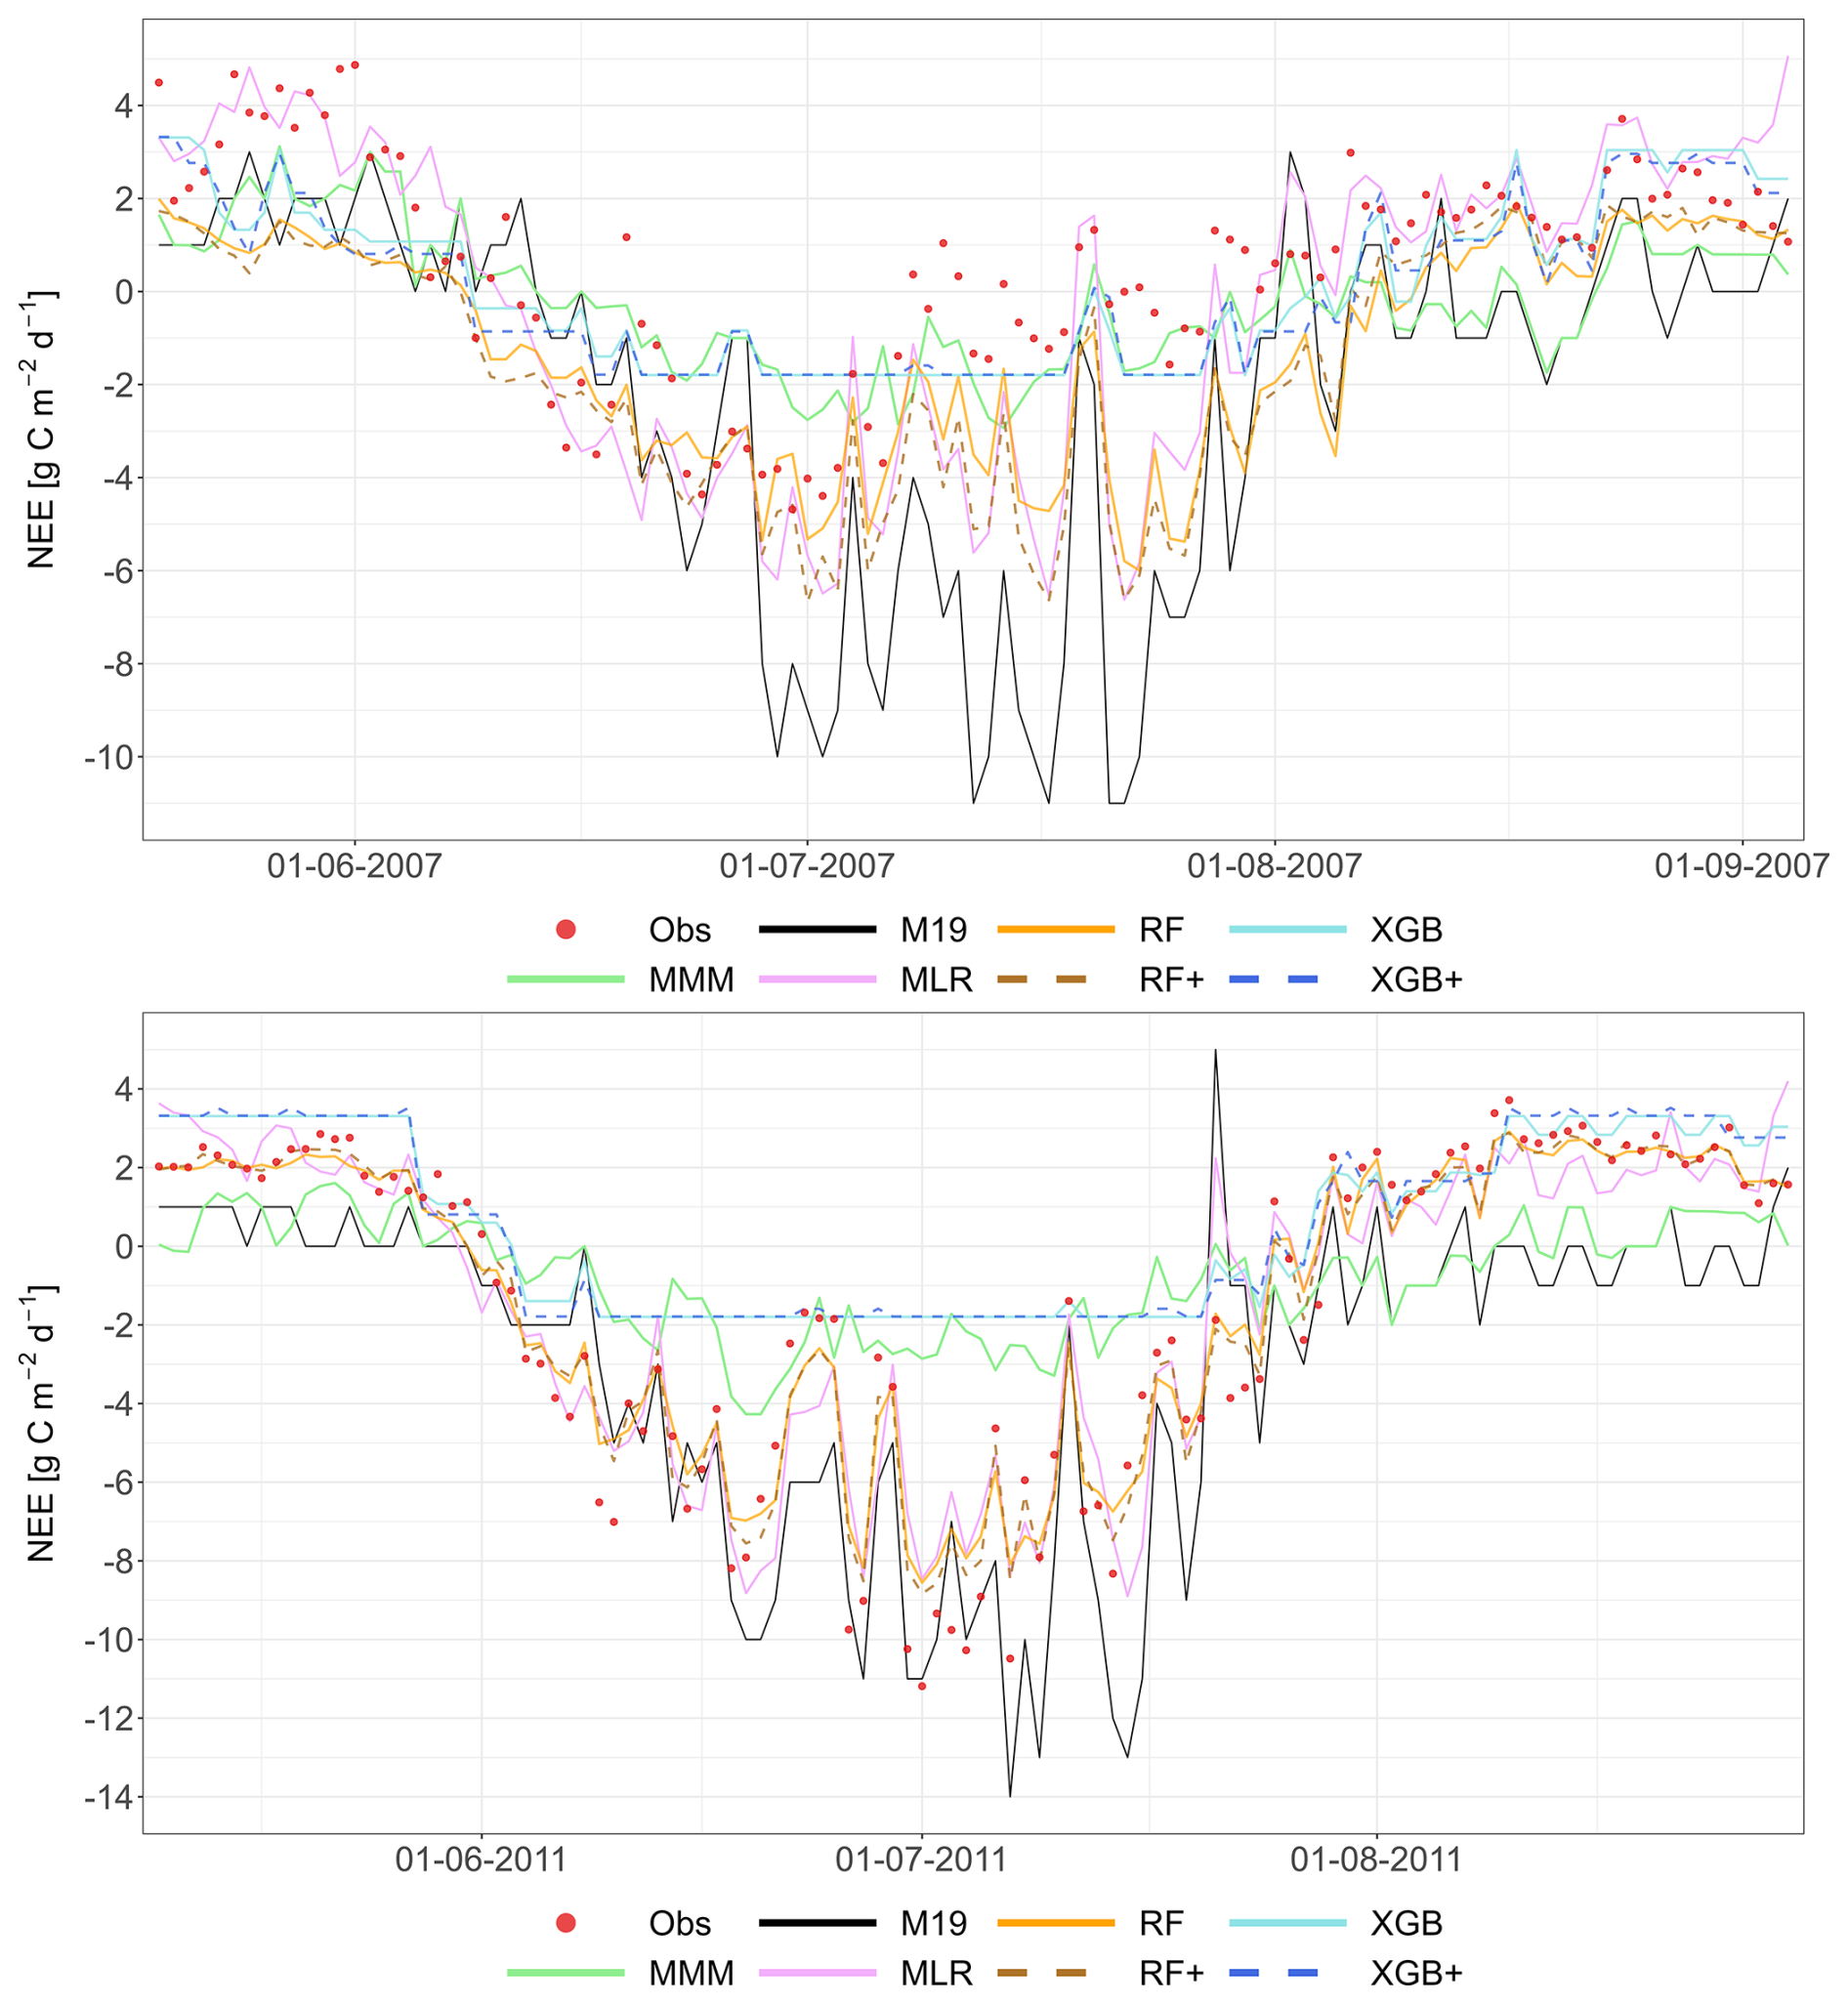
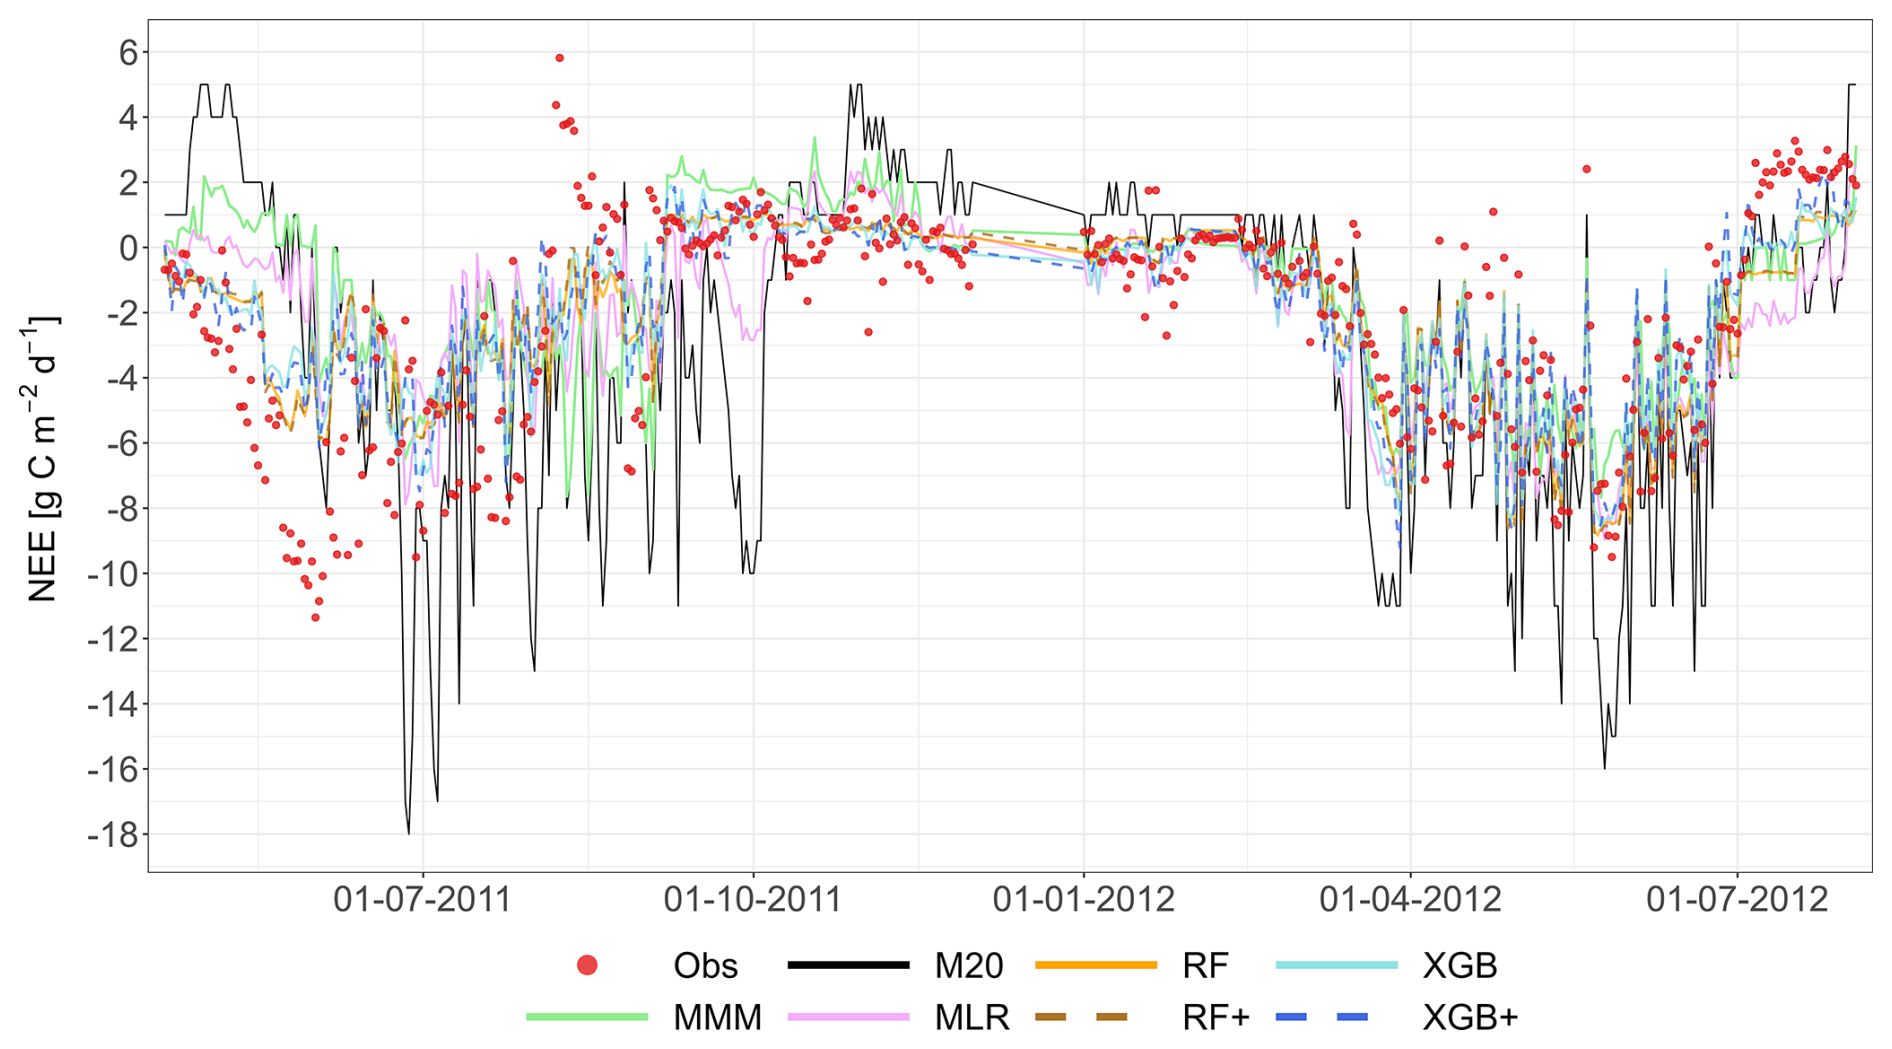
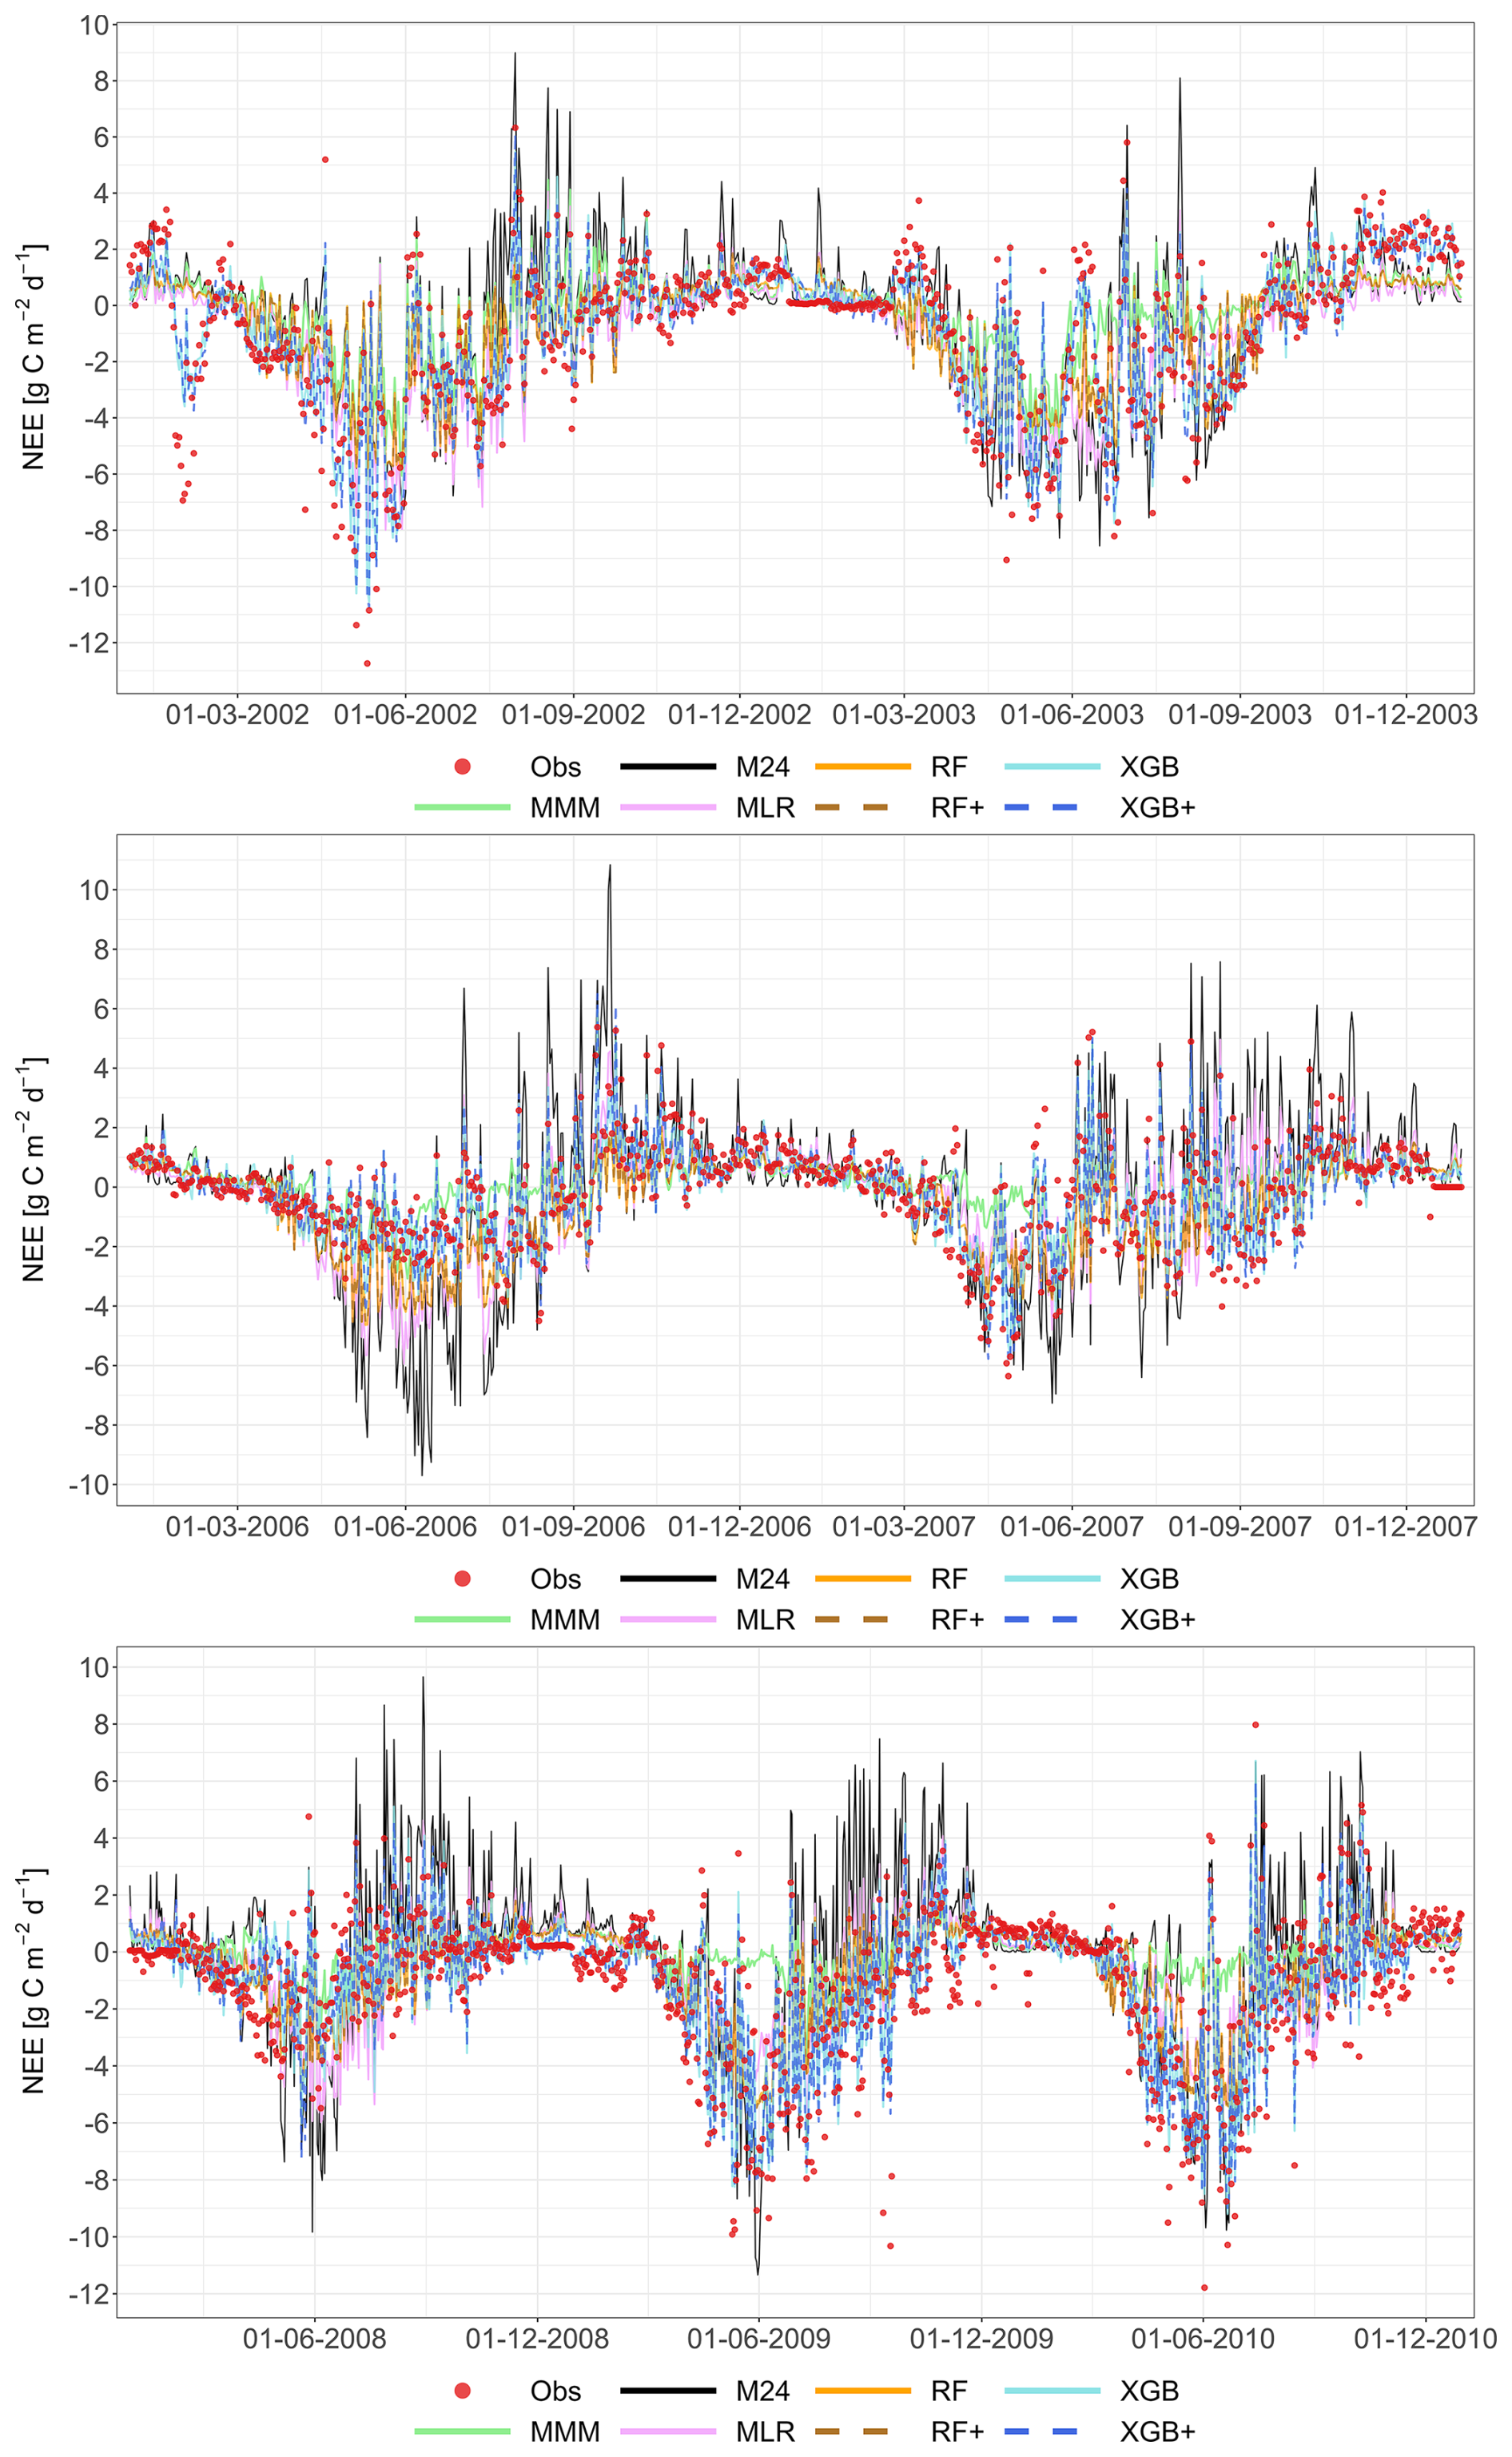
Figure 8 illustrates the simulated and observed NEE for Grignon (C2) and Easter Bush (G4) over two years based on the LOYO strategy. Appendix A contains the complete simulated dataset for all sites, and for all years, for the strategy as well.
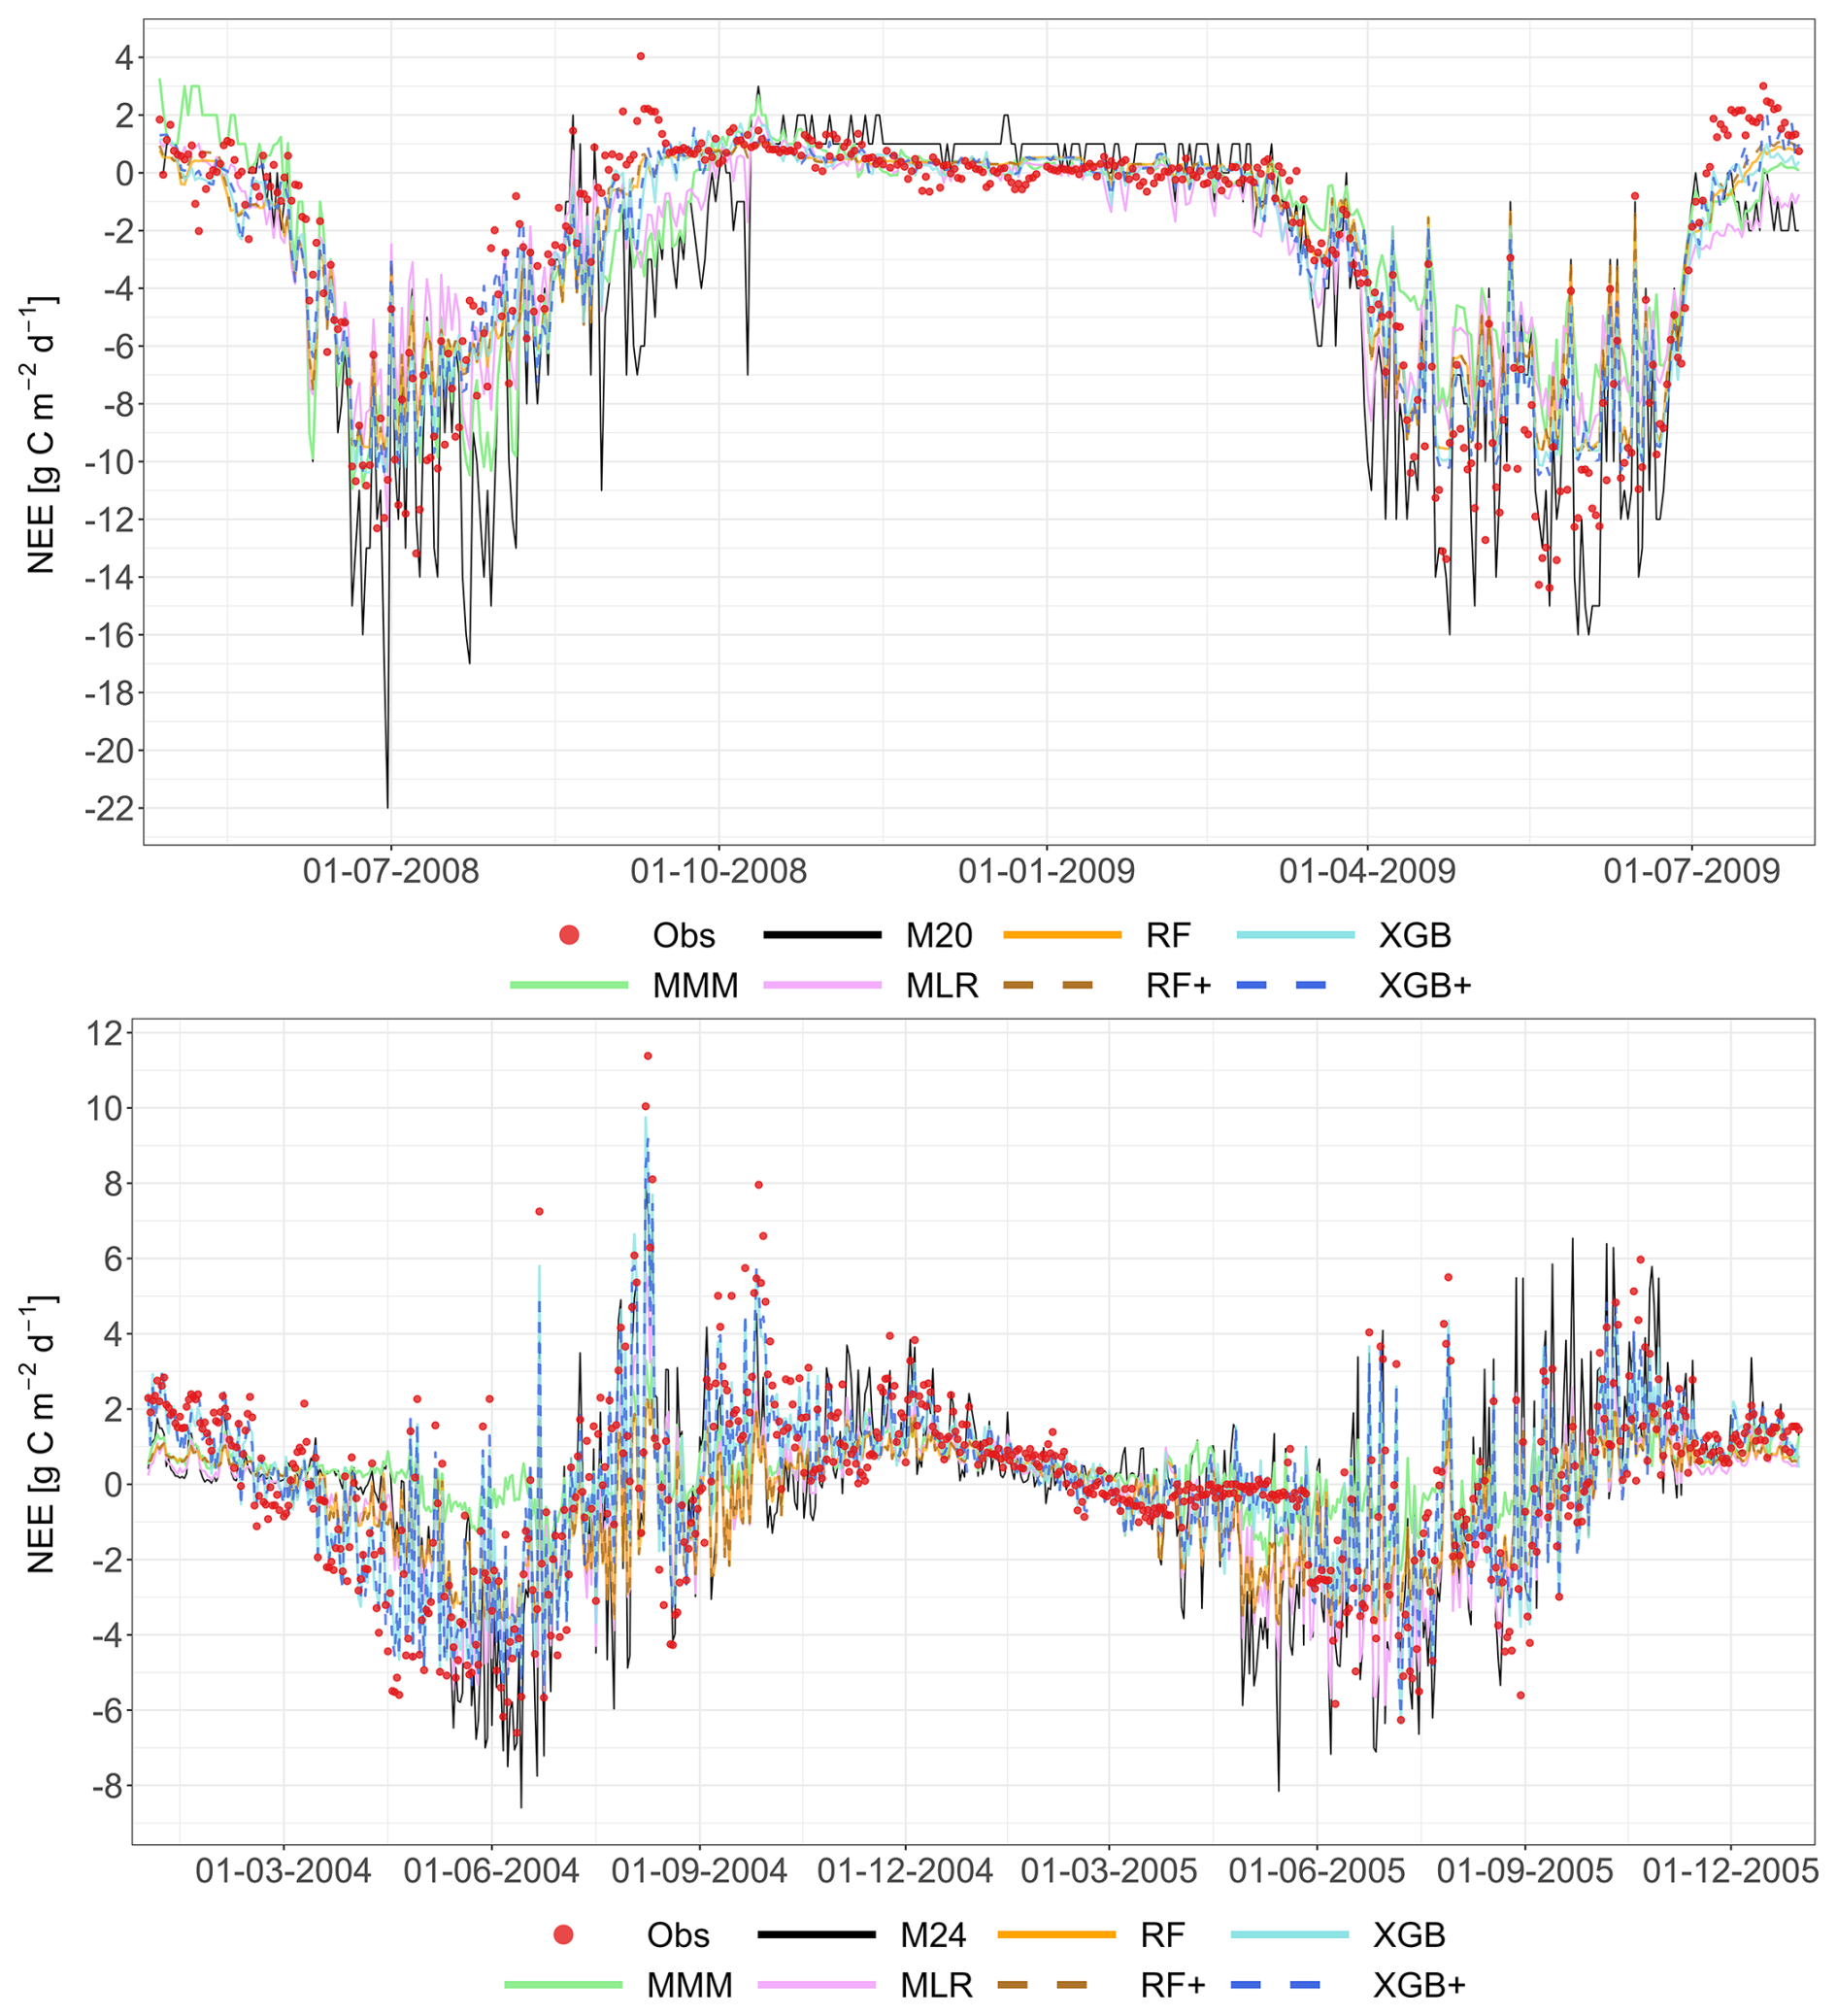
Figure 8Performance of the multi-model median (MMM, green), the constructed meta-models and the best-performing individual models for simulating NEE based on the LOYO strategy. The top panel shows results for the Grignon cropland site (C2), which includes maize and winter wheat. The bottom panel shows two years of data for the Easter Bush grassland site (G4). Observations are marked by red circles. The meta-models include Multiple Linear Regression (MLR, purple), Random Forest (RF, orange), XGBoost (XGB, light blue), Random Forest+ (RF+, hatched brown) and XGBoost+ (XGB+, hatched dark blue). The best-performing individual models (M20 at C2, M24 at G4) are shown in black. Dates are provided in the format of dd-mm-yyyy.
The MMM shows greater consistency with other meta-models at C2 compared to its performance for RECO in Fig. 5. For both sites, M20 (best model) tends to diverge most from the other models during observation peaks (this is emphasized for grasslands), whereas RF, RF+, XGB and XGB+ are consistently following a similar pattern, suggesting similar performance for C2.
To provide a more objective assessment, Fig. 9 presents scatterplots comparing the observations and the models. The figures were constructed using one validation year selected based on the performance of the XGB+ method. At the crop sites (C1 and C2), the meta-models, particularly RF, RF+, XGB and XGB+, show a strong linear relationship with the observed data, explaining a large portion of the variance.
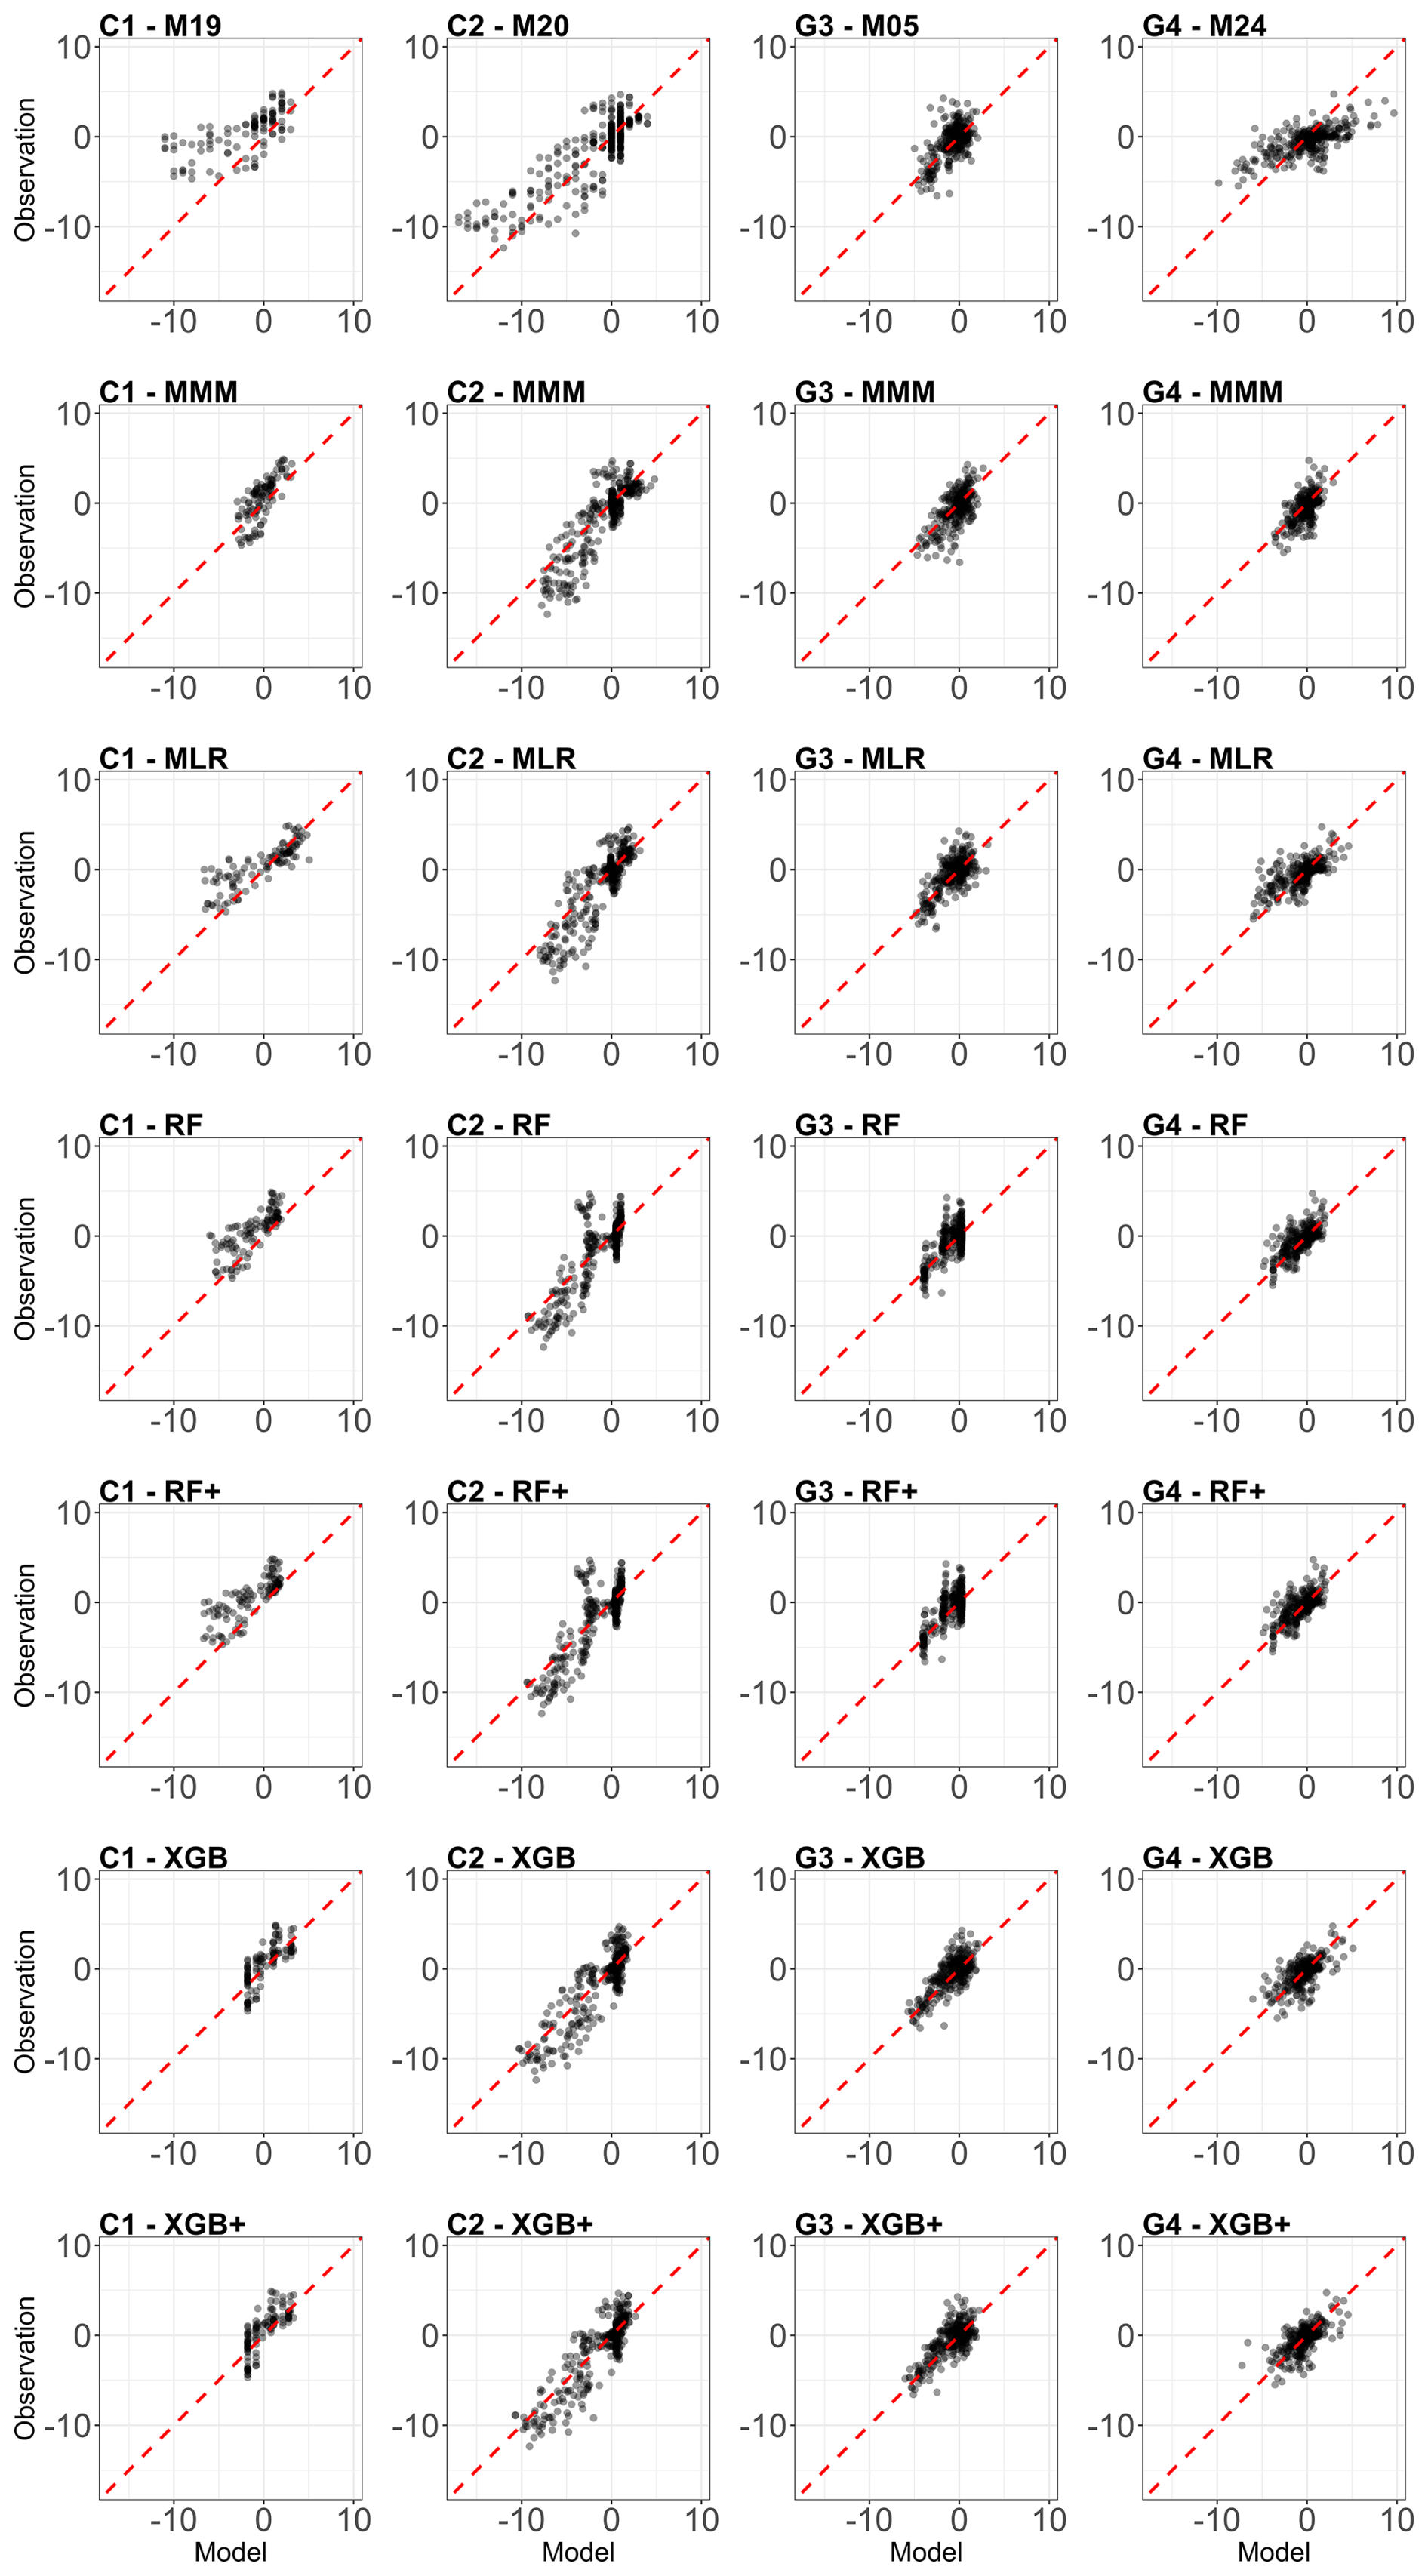
Figure 9Comparison of the best individual model, the multi-model median and the constructed meta-models with observations for NEE using the LOYO approach. Each row represents a different model type, and columns correspond to the sites (from left to right: C1, C2, G3, and G4). The top row shows the best individual models with their identifiers (M20 at C1, M19 at C2, M22 at G3, M23 at G4). The remaining rows show the MMM, MLR, RF, RF+, XGB and XGB+. All units are in g C m−2 d−1. The red dashed line represents the 1 : 1 relationship.
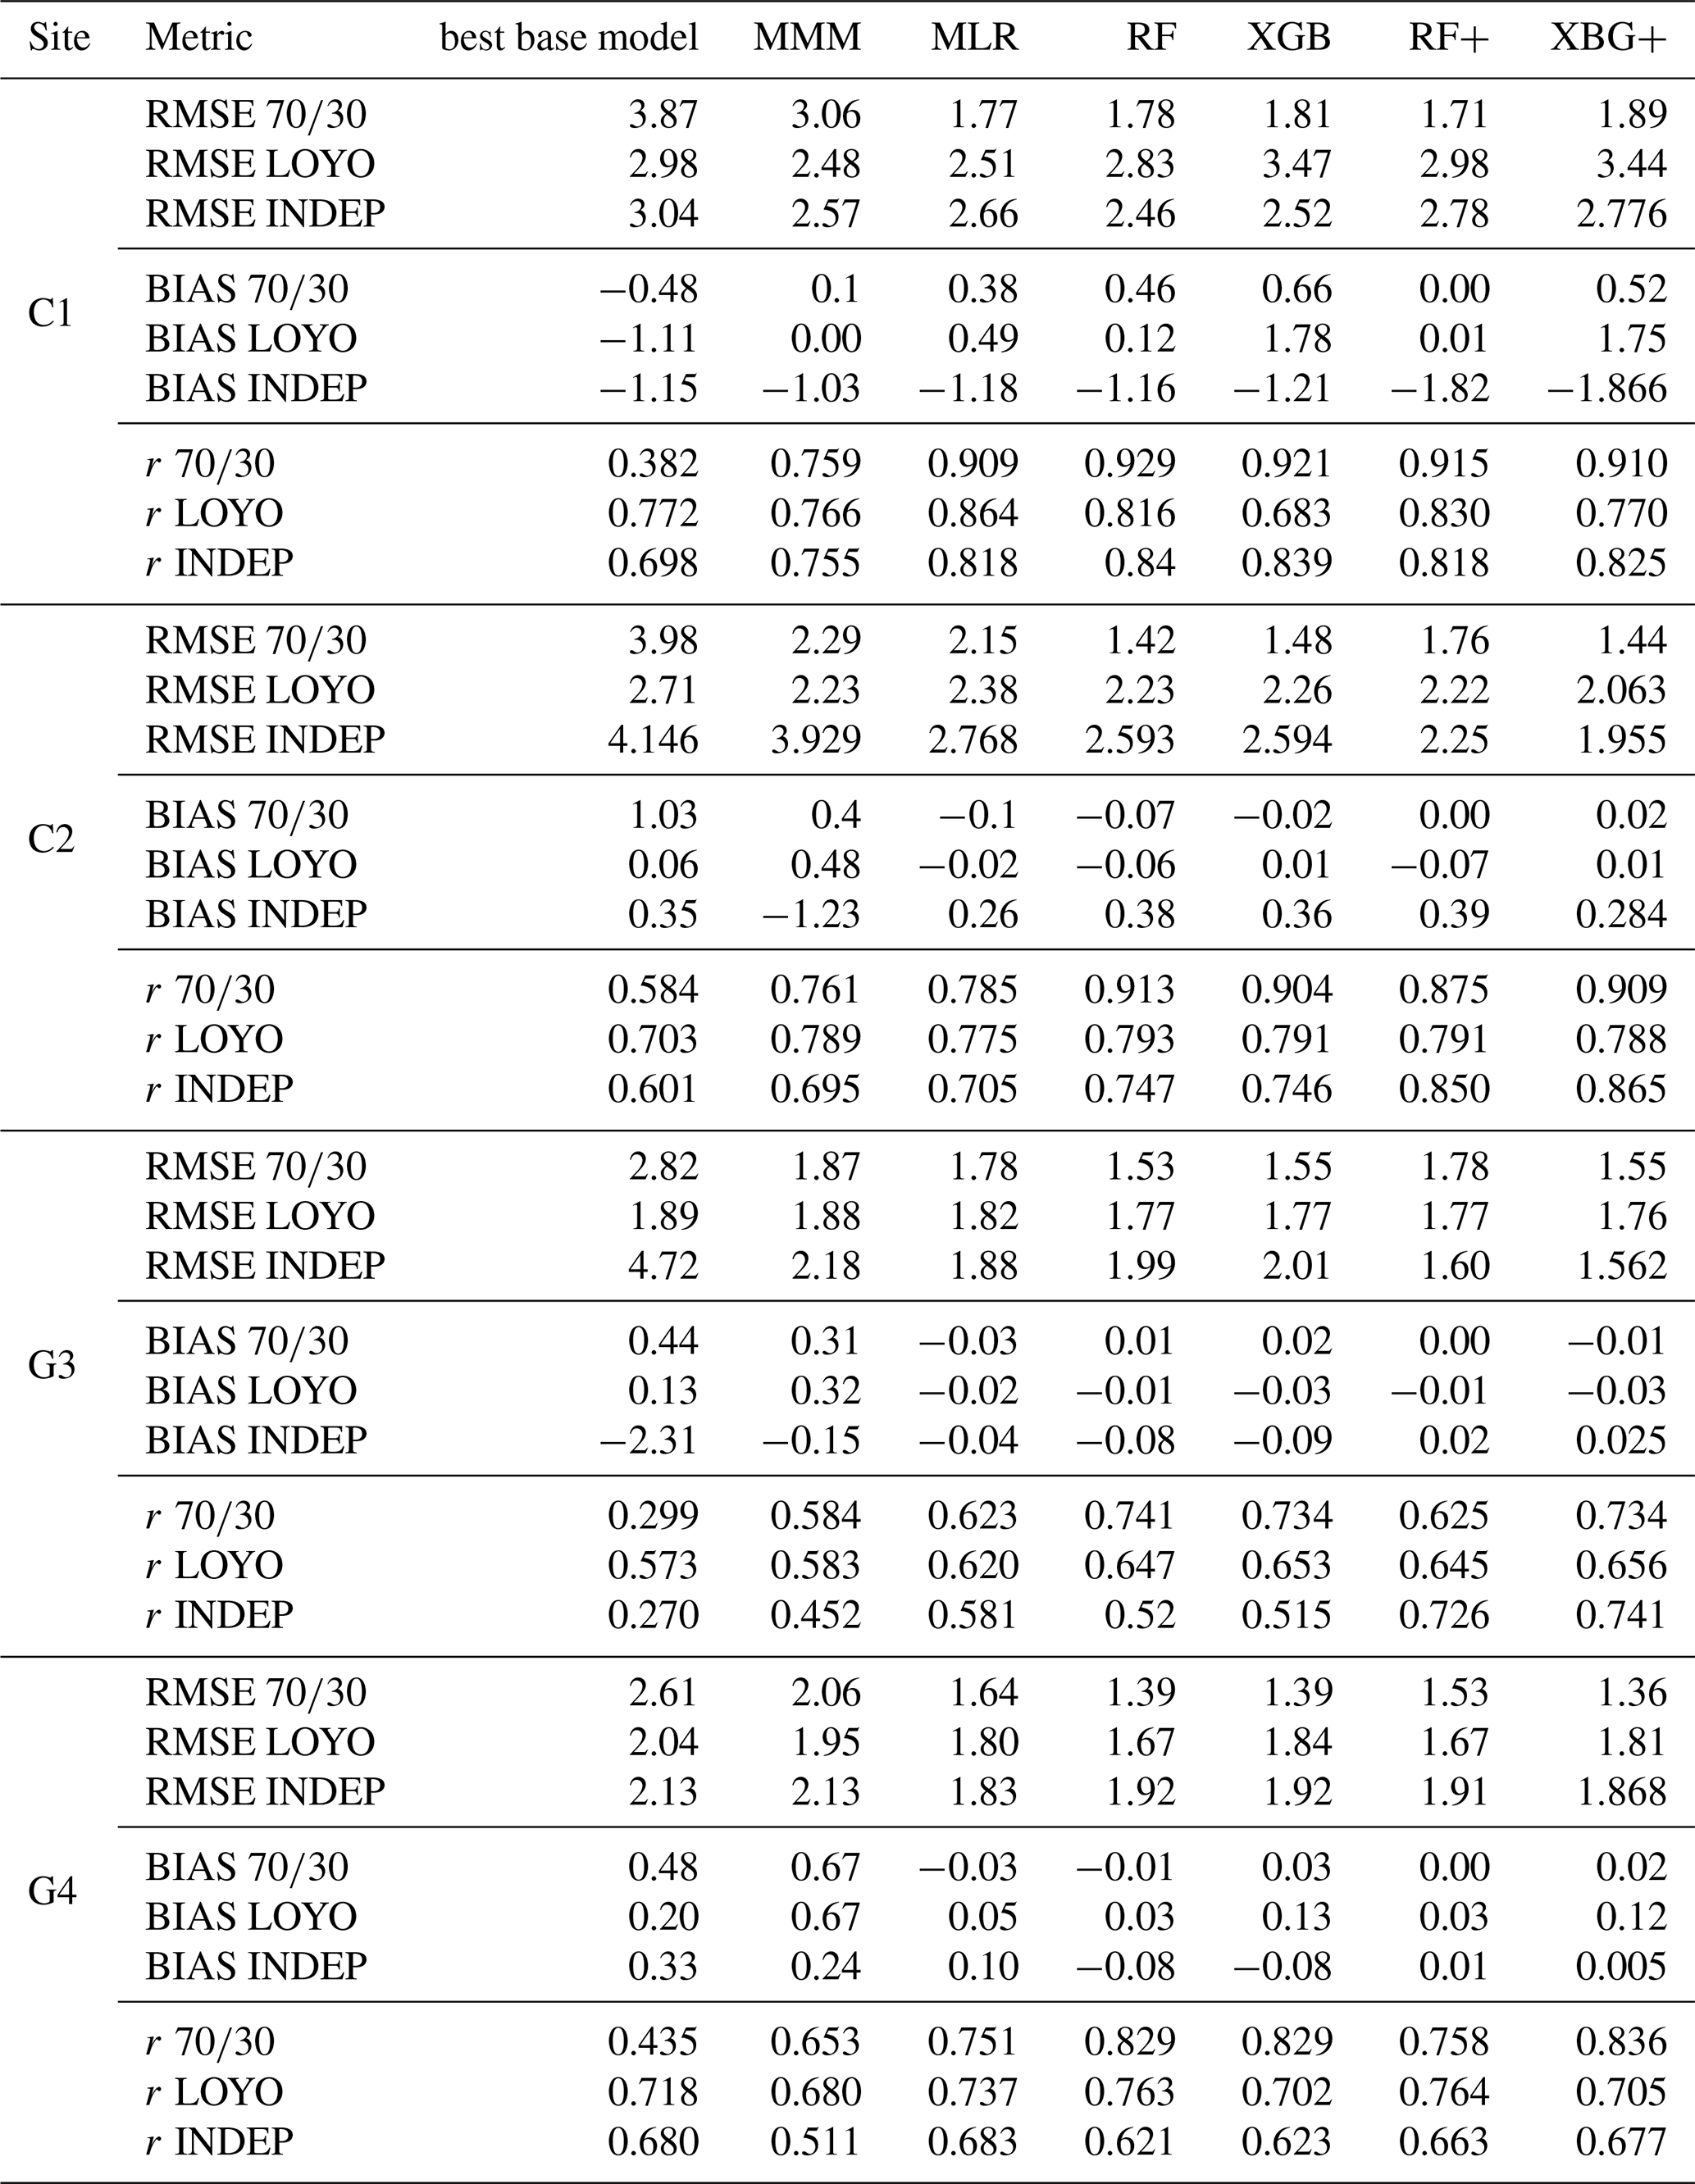
Table 7 shows statistics for all the models using three metrics based on the validation subset, for all three validation approaches (, LOYO, and the NEE estimation using meta-model based RECO-GPP, abbreviated here as INDEP). Across all the four sites, the RF, RF+, XGB and XGB+ values differ little from each other in all three metric for strategy. The MLR meta-model is on par with these four meta-models, except at C2, where its performance is worse across all three metrics, making it more comparable to the MMM for (but not for LOYO and INDEP). The best-performing individual models typically have poor statistics compared to all other models. Overall, the correlation coefficient increased in the range of 0.004–0.289 for the best-performing meta-model compared to MMM, with the most pronounced improvement observed at G3 using the INDEP strategy. Bias shows similarity to those presented for GPP and RECO, meaning that with the exception of C1 the meta-models provide results that are almost bias-free. At site C2, the INDEP approach for NEE achieves lower RMSE than direct LOYO (e.g., XGB+: 1.96 vs. 2.25) but introduces a small systematic bias (∼ 0.3–0.4 ), illustrating a precision-accuracy trade-off in physically consistent reconstruction. This trade-off suggests INDEP is preferable for applications prioritizing precision and physical consistency (e.g., gap-filling, carbon budgets), while direct stacking is better suited when unbiased estimates are essential (e.g., model validation, trend analysis).
Table 7Statistical evaluation of the best-performing individual model, the multi-model median (MMM) and the applied meta-models (MLR, RF, XGB and XGB+) for NEE, based on the three validation strategies (, LOYO and the RECO-GPP approach that is referred as INDEP). Three performance metrics are used: root mean square error (RMSE), bias and Pearson's correlation coefficient (r). Only validation data were used for the calculation of the statistics. RMSE and BIAS are provided in g C m−2 d−1 units.
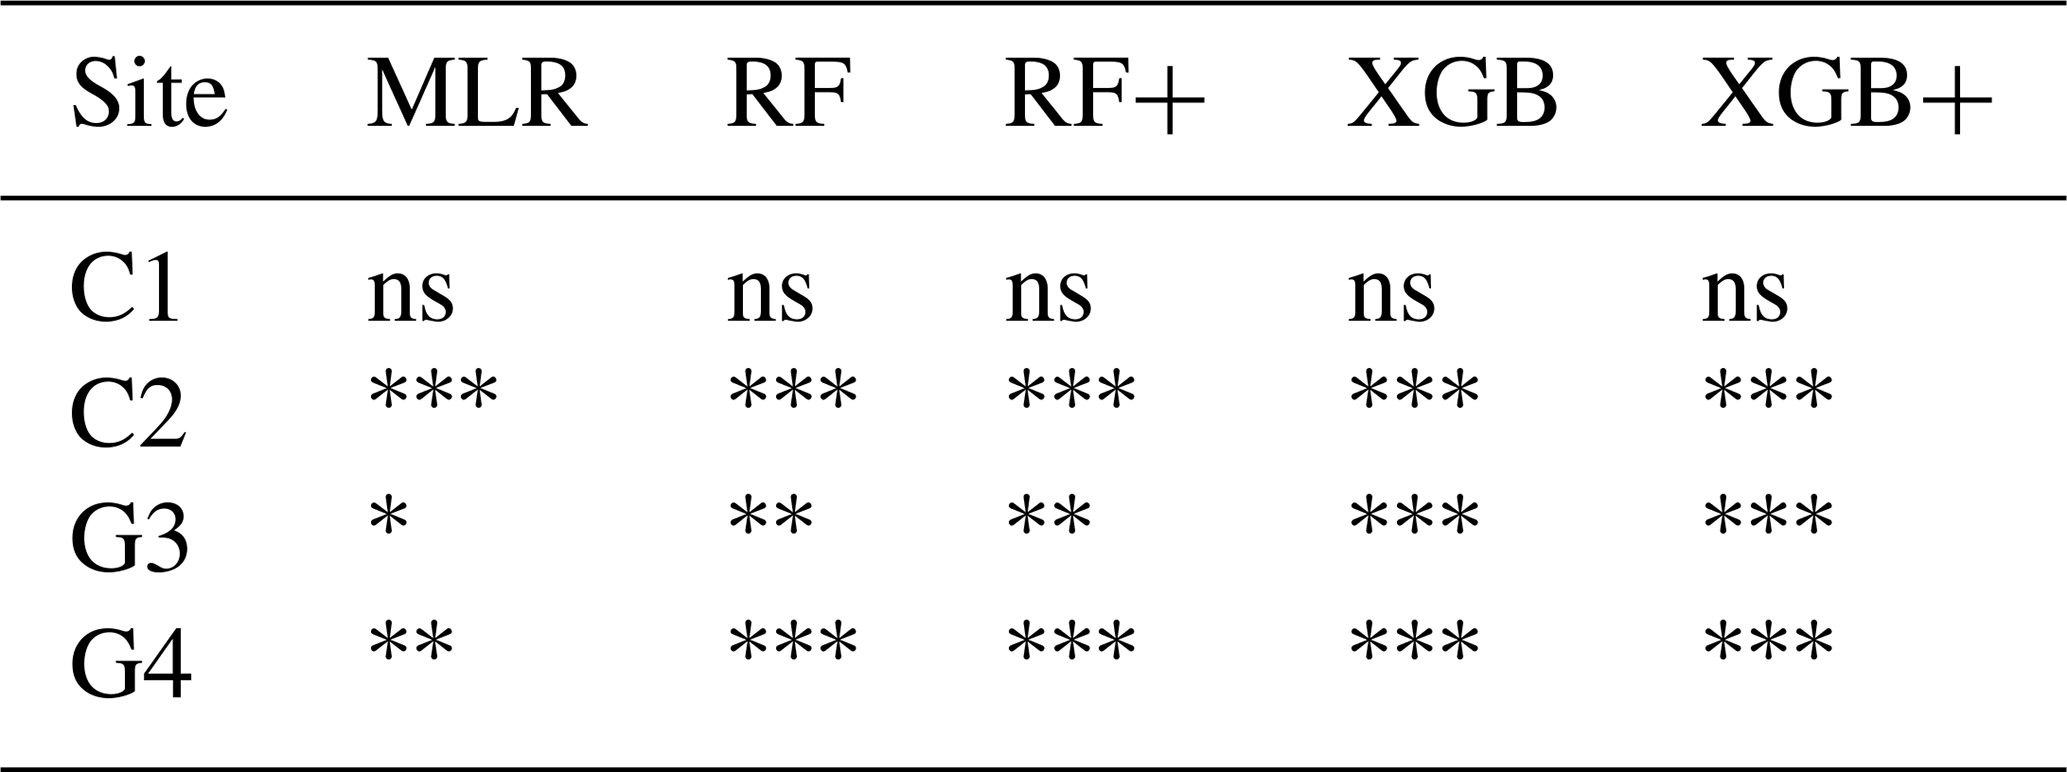
Wilcoxon signed-rank tests on daily prediction errors (Table 8) revealed significant improvements for NEE predictions at the grassland sites, where all five meta-models outperformed MMM at both G3 and G4. At cropland site C2, the four tree-based models showed significant improvements, while MLR did not achieve significance. Site C1 showed no significant differences for any model. The statistical testing confirms that meta-models provide robust improvements in NEE prediction quality, particularly for grassland ecosystems. As with RECO, some cases show statistical significance despite minimal RMSE differences (e.g., RF at site G3), reflecting the complementary nature of these metrics: the Wilcoxon test evaluates typical daily performance across years, while RMSE is more sensitive.
Table 8Statistical significance of meta-model performance compared to the Multi-Model Median (MMM) based on one-sided Wilcoxon signed-rank tests on daily prediction errors for NEE. The alternative hypothesis tested whether meta-models produce smaller squared residuals than MMM. Tests were performed separately for each Leave-One-Year-Out cross-validation fold, with p-values aggregated using the median across test years. The Benjamini-Hochberg procedure was applied per site to control the false discovery rate at 5 %. Significance levels: ; ; ; ns = not significant.
SHAP analysis presented in Fig. 10 reveals that a few key model outputs primarily determine NEE predictions for the XGB+ method, just like in the case of GPP and RECO. Meteorological variables, particularly temperature and precipitation, contribute modestly but importantly, with a stronger effect noted at grassland sites G3 and G4, with larger contribution in case of LOYO.
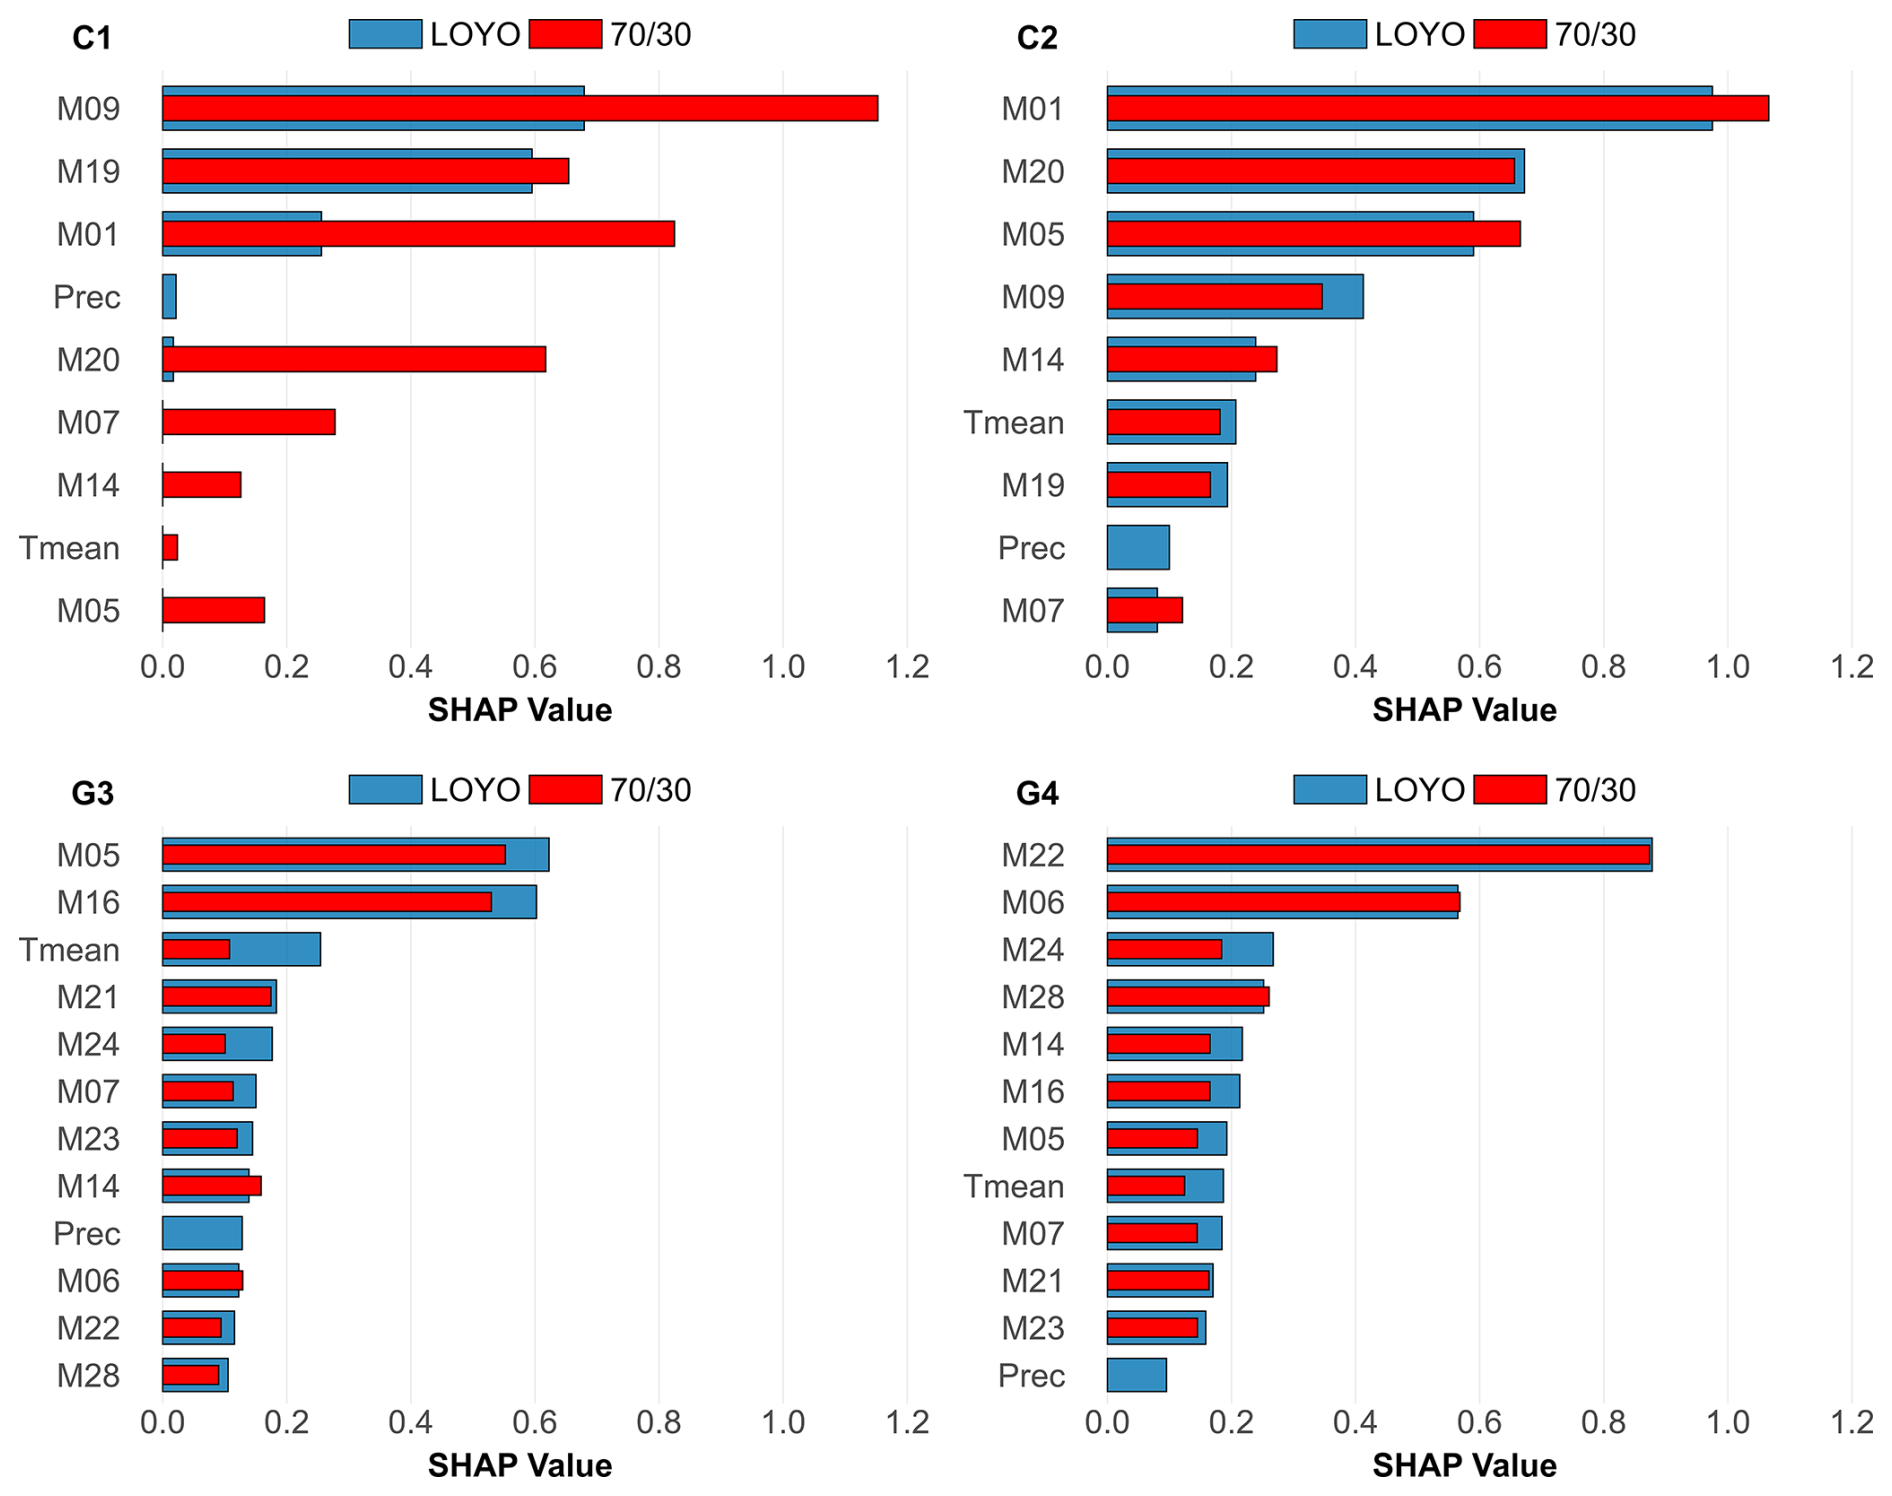
Figure 10The SHAP values of the XGB+ meta-model for NEE based on the strategy (red) and the LOYO strategy (blue). Larger values mean stronger contribution to the resulting NEE. Tmean stands for daily mean temperature, and Prec is daily precipitation.
4.1 Synthesis of the meta-model approaches
The stacking-based meta-models (MLR, RF, RF+, XGB, XGB+) consistently outperformed both the best individual process-based models and the traditional MMM for sites with sufficient data coverage. By combining ensemble learning with key environmental covariates, RF+ and XGB+ emerged as a good candidate as well, in some cases achieving lower errors and higher correlations than all other approaches. Thus, while the MMM retained its role as a robust benchmark, its predictive power was consistently surpassed by the stacking-based methods.
This aligns with findings from Shahhosseini et al. (2020, 2021), who demonstrated that ensemble learning approaches can surpass the performance of individual models for crop yield prediction, and with Zhang et al. (2022), who reported similar benefits of ensemble learning in winter wheat yield modelling. The added value of explicitly incorporating drivers such as temperature into the meta-modelling framework also supports the conclusions of Mathieu and Aires (2018), who emphasised that agro-climatic indices like temperature and precipitation can significantly enhance model accuracy. Our results go beyond these earlier studies by demonstrating that such improvements are really possible (even without incorporating meteorology) across multiple flux components (GPP, RECO, NEE) and agroecosystem types, including both croplands and grasslands.
Novelty of the study is the XGBoost and RF with environmental covariates (which means stacking with meteorological data) that represents a hybrid, regime-dependent integration framework rather than a purely statistical aggregation. This method seems to have potential that needs to be exploited in the future at sites with better temporal data coverage.
4.2 Cross-comparison of model contributions and environmental drivers for XGB+
Across all three fluxes (GPP, RECO, NEE), XGB+ also heavily relies on individual model outputs, confirming that the meta-model is successfully leveraging model consensus to improve predictive performance. However, the consistent appearance of temperature – particularly at the C1 site for RECO and at grassland sites for NEE – highlights that certain temperature-driven processes are not fully captured by the base models and need to be explicitly considered. Precipitation, while generally having less impact, may still play a role in certain site-specific cases (e.g. GPP at C1), suggesting localised interactions between water availability and C fluxes. Importantly, the climate characteristics of the study sites provide important context for interpreting these results. These locations lie within mid-latitude temperate zones with well-defined seasonality, and some (e.g. Ottawa) experience high continentality, marked by large annual temperature ranges and pronounced growing season transitions. In such climates, temperature becomes the primary constraint on biological activity during both dormancy and active periods, while precipitation is often more evenly distributed or limiting only during episodic droughts (Baldocchi, 2008; Koster et al., 2004; Sun et al., 2025). This climatic backdrop helps explain why temperature consistently emerges as a key predictor across sites and flux types, while precipitation plays a more site-specific and secondary role. These patterns align with broader findings from temperate ecosystems, where thermal constraints dominate respiration and photosynthesis processes, particularly outside of water-limited systems.
The dominant role of specific models in GPP predictions, supplemented by temperature's influence (Fig. 4), suggests that while ensemble model outputs capture much of the variability, temperature-dependent processes remain only partially resolved by the base models. This aligns with global studies such as Zhu et al. (2016) and Bellocchi et al. (2023), who identified temperature as a key driver of GPP dynamics, especially in temperate and high-latitude ecosystems. The minimal role of precipitation in GPP prediction indicates that water availability was not a limiting factor at the examined sites, consistent with ecosystem-specific findings reported by Reichstein et al. (2013), which showed temperature or radiation often dominate in temperate regions.
For RECO, the strong temperature effect (Fig. 7) corroborates well-established biological principles, such as the temperature sensitivity of respiration processes described by Lloyd and Taylor (1994). The negligible role of precipitation further suggests these sites are not subject to drought stress, echoing findings from Xu et al. (2025) who highlighted thermal thresholds as primary controls over ecosystem carbon fluxes.
NEE's XGB+ related sensitivity to meteorological variables at grassland sites (Fig. 10) confirms the known climate sensitivity of these systems (Baldocchi et al., 2018). The significant influence of temperature and soil water content on GPP and RECO in grasslands, as noted by Xia et al. (2024), explains the prominence of these variables in NEE predictions. These findings underscore the importance of climate drivers in modulating carbon fluxes beyond what model ensembles alone capture.
Figure 11 provides deeper insight into the functioning of XGB+ by ranking the influence of the top-performing process-based models (using SHAP values) for each flux and site. Several distinct patterns emerge. For RECO predictions, the influence of the highest-performing models was less prominent than for GPP, particularly at site G3 for both strategies. This indicates that, for RECO, the ensemble relied less on the best individual models. In contrast, for GPP, the top-performing models had a substantial impact for the crop sites, ranking first at both C1 and C2 for both the LOYO and strategy. This suggests that XGB+ leveraged structurally diverse yet individually strong models to enhance predictive accuracy. For grassland sites the influence of the best models remains strong, especially for the strategy. In case of NEE, the strategy exhibited moderate to low contributions from top-performing models – especially at grassland sites, pointing to a more balanced integration of individual models and ensemble diversity. This differs for the LOYO strategy where the top-performing individual models provide notable influence across all sites in the meta-model results.
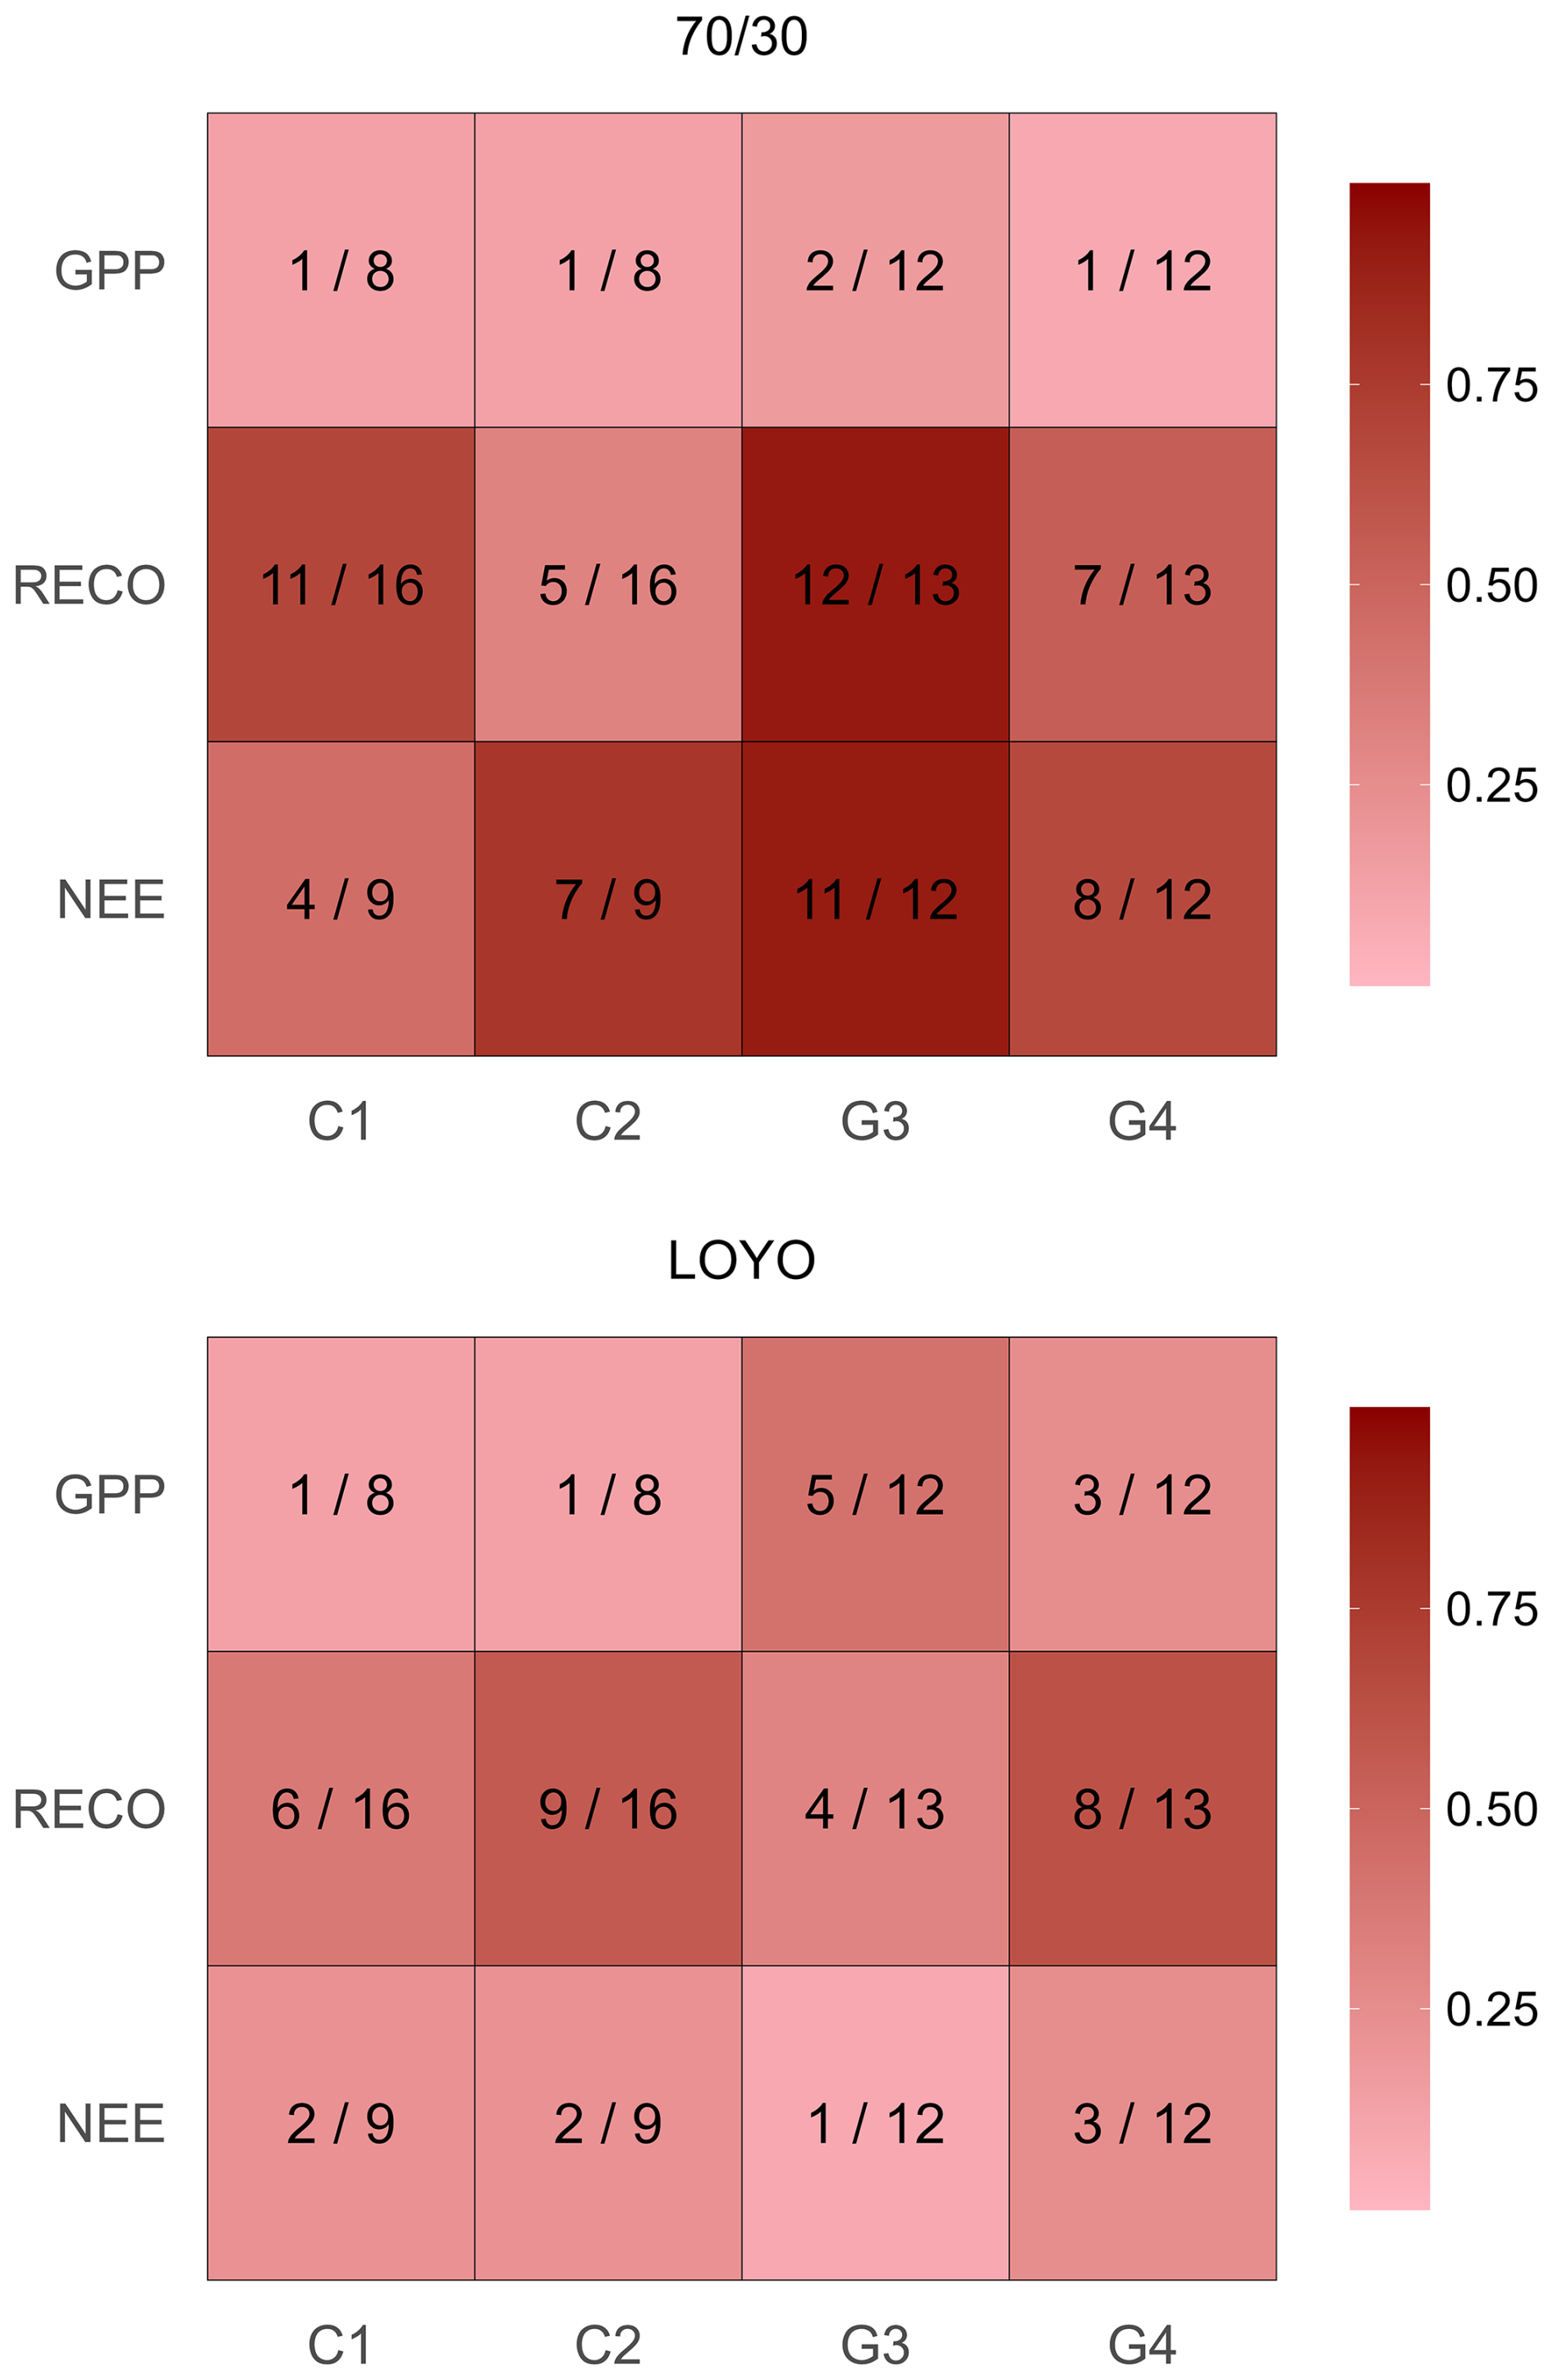
Figure 11Ranking of the top-performing individual models (selected based on RMSE) across each site and model output based on their contribution to the XGB+ model. The first number in each cell indicates the ranking for the best model among the other models according to the SHAP value, while the second number is the total number of models. Red shades are visual representations of the first number relative to the second indicating how important or negligible the best model's influence was.
These findings reinforce a key principle of ensemble learning: the models with the highest standalone accuracy are not always the most influential within the ensemble. By contributing unique and non-redundant information, even structurally weaker models can significantly improve an ensemble's predictive ability. This finding, based on SHAP analysis, is consistent with the principle of ensemble diversity highlighted by Chergui and Kechadi (2022), which posits that combining a variety of models with different strengths and weaknesses leads to more robust and accurate predictions. However, our SHAP analysis adds a novel layer of interpretability by quantifying the relative influence of top-performing versus structurally diverse models within the ensemble, providing diagnostic insights that go beyond earlier ensemble studies (Shahhosseini et al., 2020).
Gains in performance were more pronounced for croplands than for grasslands, especially for GPP and NEE. This aligns with previous research (Bansal et al., 2024; Nand et al., 2025) which found that management-intensive crop systems, like maize and winter wheat, benefit more from dynamic environmental and management data due to their seasonal and management-driven variability. For instance, Nand et al. (2025) demonstrated that weighted multi-model averaging, specifically the Granger-Ramanathan B method for actual evapotranspiration (ETa), reduced RRMSE by 4 %–8.5 % in croplands. The Granger-Ramanathan B method is a multi-model averaging approach that requires non-negative weights that sum to one, and it provides the closest match to measured values for daily ETa in maize simulations. Conversely, grasslands, characterised by more stable phenological cycles, show smaller improvements. Their flux variability is often more strongly influenced by biotic controls rather than environmental drivers alone (Reichstein et al., 2007; Stoy et al., 2013). This is because grasslands exhibit more stable, biologically mediated carbon fluxes, while the sharp seasonal transitions and management-driven dynamics of crop systems make them particularly responsive to external data.
Overall, the XGB+ meta-model achieved good predictive performance across diverse agro-environmental contexts, while also providing enhanced interpretability by quantifying the contributions of individual models and environmental drivers. These dual benefits – improved performance and diagnostic insight – position XGB+ as a powerful framework for advancing predictive modelling and guiding process-model refinement.
4.3 Implications and applications
The demonstrated improvements in predictive performance of stacking-based meta-models have direct implications for crop and grassland biogeochemical modelling. By consistently outperforming both the best-performing individual models and the MMM, these approaches provide a pathway for enhancing C-flux predictions across diverse agro-environmental contexts. This is particularly relevant for applications such as greenhouse gas inventorying, site-specific management planning, and scenario analysis under climate change, where reliability is critical.
Beyond performance gains, the interpretability of the meta-models offers valuable diagnostic insights for process modellers. The analysis of regression coefficients and feature contributions highlights the value of retaining structurally diverse models in ensembles, rather than limiting selection to the top-performing candidates. Moreover, identifying temperature as a dominant external contributor point to opportunities for refining process-based models, such as improving their representation of phenological and temperature response mechanisms. These insights can also inform calibration practices: by quantifying the relative influence of models and drivers, the meta-modelling framework can guide targeted recalibration and prioritisation of model improvement efforts. In this way, meta-model outputs can serve as both a predictive tool and a diagnostic instrument for iterative process model development.
Together, these findings have broader implications for how model ensembles should be constructed and applied. Our results highlight that the traditional practice of equal-weight multi-model averaging (like with the MMM) may not be sufficient for delivering credible predictions. As noted in Sect. 4.4, the approach depends on long, high-quality time series for training, which may limit application in some contexts. Consistent with the arguments of Mathieu and Aires (2018), Eyring et al. (2019), Shahhosseini et al. (2020) and Chergui and Kechadi (2022), who emphasised that structurally dependent and unevenly performing models require differentiated treatment, our findings demonstrate that stacking-based meta-models – combining adaptive weighting with key environmental drivers – consistently outperform both the best individual models and the MMM. This evidence calls for a paradigm shift in ensemble design: future model intercomparison and synthesis efforts should move toward performance-informed, diagnostic-driven weighting strategies that explicitly incorporate relevant covariates. Such approaches not only improve predictive accuracy but also generate actionable insights for refining underlying process-based models, ultimately accelerating progress toward more reliable and process-rich representations of agroecosystem C dynamics. This calls for coordinated action by the modelling community to adopt adaptive, performance-informed ensemble frameworks in future intercomparison efforts. Furthermore, our framework could be applied as a post-processing step to archived ensemble outputs from major multi-model initiatives (discussed in Sect. 5), maximising the value of existing model intercomparison investments without requiring new simulations.
4.4 Limitations and future research
While the proposed meta-modelling framework offers notable advantages, several limitations warrant acknowledgment.
The approach depends on sufficiently long and consistent time series for training and evaluation, which were not uniformly available across all sites and flux components, limiting generalisability in data-scarce regions (e.g. C1 site). This data dependence is highlighted in Sect. 4.3 as a key consideration for ensemble design.
While the results indicated that the models show high temporal fidelity, spatial extrapolation to unobserved sites was not the objective of this work. This needs further investigation in forthcoming studies.
Incorporating external covariates improves performance but increases complexity and introduces dependencies on auxiliary datasets that may not always be accessible or reliable. Our analysis also focused on a limited set of covariates (temperature and precipitation), leaving unexplored the potential benefits of integrating hydrological or soil-related variables. Residual analysis can potentially be used to identify site-specific environmental variables that could be included as additional covariates, of course considering the potential collinearity issues.
The interpretability of regression coefficients also comes with caveats: while they provide insight into model influence within the ensemble, they do not directly reveal mechanistic underpinnings, and the relationships captured remain largely empirical. Consequently, care must be taken when using these findings to inform process-level changes.
Future research should expand the set of environmental covariates to include soil moisture, global radiation, management practices, and hydrological variables, which are likely to improve representation of key drivers in both crops and grasslands. There is a great potential in including the same environmental variables in a more sophisticated way that can include average (or cumulative) conditions (like heat-sum) for longer time periods and also considering lagged effects using asynchronous climate data. Testing the framework across a broader range of management systems, crop types, and climatic zones would also help assess scalability and robustness. Moreover, integrating advanced interpretability tools (e.g., causal inference methods) could move beyond purely statistical associations toward more mechanistically grounded insights. Finally, co-developing meta-model frameworks with process-based modellers could establish a feedback loop in which ensemble diagnostics directly inform iterative improvements to individual models, accelerating convergence toward more reliable, process-rich representations.
International initiatives that foster collaborations between researchers working on agricultural and grassland models are creating new opportunities in the field of process-oriented modelling. By gathering outputs from several models with different representations of plant and soil processes and using standardised protocols, exploitation of the potential of the ensembles becomes possible. However, those multi-model ensemble techniques are still in their infancy, as typically simple multi-model means or medians are constructed as robust estimations that typically overperform the individual models. Some studies attempted to use more sophisticated methods like skill-based model selection and even machine learning, but the potential of the multi-model frameworks is still being explored. In this study, building on a previous multi-model exercise performed under the umbrella of international initiatives, new combinations of models are tested that we call meta-models.
The introduced meta-models significantly improved the accuracy of C-flux estimates in crop and grassland ecosystems compared to individual process-based models and traditional multi-model medians. Formal statistical testing confirmed that improvements were particularly robust for grassland sites, where all meta-models significantly outperformed the multi-model median across all variables, while cropland results were more variable, with one site showing no significant improvements due to limited data availability. By integrating structurally diverse models and incorporating key environmental variables – particularly temperature –, these meta-models deliver not only more reliable predictions but also diagnostic insights into the relative contributions of models and environmental drivers. This underscores the importance of maintaining model diversity in ensembles and highlights opportunities to refine process-based models, especially regarding temperature responses and phenological processes, while also demonstrating that meta-modelling effectiveness depends on sufficient training data, particularly in cropland systems with high inter-annual variability.
Perhaps the most important element of our modelling framework is the presentation of a method to goes beyond the static nature of meta-models. As the changing environmental conditions can alter the relevance of the base-models, the optimal meta-model may vary over time. Without the environmental variables, continuous retraining is needed to maintain accuracy. Our solution is a step forward for more reliable and scientifically sound projections under changing climate.
Performance gains were more pronounced for grasslands under LOYO validation than for croplands, likely reflecting the stronger influence of management interventions and crop rotations that violate LOYO's temporal stationarity assumptions. Nevertheless, the approach relies on long, high-quality datasets and auxiliary covariates, and its empirical nature limits direct mechanistic interpretation. Furthermore, it is important to note that the performance of the meta-modelling framework remains inherently bounded by ensemble-level systematic biases, particularly at data-limited sites such as C1. These limitations were detailed in Sect. 4.4.
Importantly, this framework opens the door to re-analyzing outputs from major multi-model initiatives like AgMIP (Agricultural Model Intercomparison and Improvement Project; https://agmip.org, last access: 15 September 2025) and MACSUR (Modelling European Agriculture with Climate Change for Food Security; https://www.faccejpi.net/posts/knowledge-hub-macsur, last access: 1 October 2025). Rather than requiring new simulations, archived ensemble datasets from these projects could be post-processed using stacking meta-models to enhance predictive skill and extract new diagnostic insights – maximising the value of past investments in large-scale model intercomparison. We strongly encourage international modelling communities to pilot such stacking-based re-analyses, which offer a low-cost, high-impact opportunity to unlock new insights and improve ensemble predictions.
While promising, this approach requires long, high-quality datasets and auxiliary inputs and remains empirical in nature, calling for caution when inferring mechanistic causation. Future research should expand the set of environmental drivers (e.g., soil and hydrological variables), test scalability across broader agroecosystems, and apply advanced interpretability tools. Collaborative development with process-based modellers could translate these statistical gains into mechanistic improvements, ultimately leading to a new generation of hybrid ensemble frameworks for agricultural and grassland biogeochemistry. We encourage the international modelling communities to pilot such stacking-based re-analyses, leveraging their rich archives to unlock new insights and improve ensemble predictions without additional simulation costs.
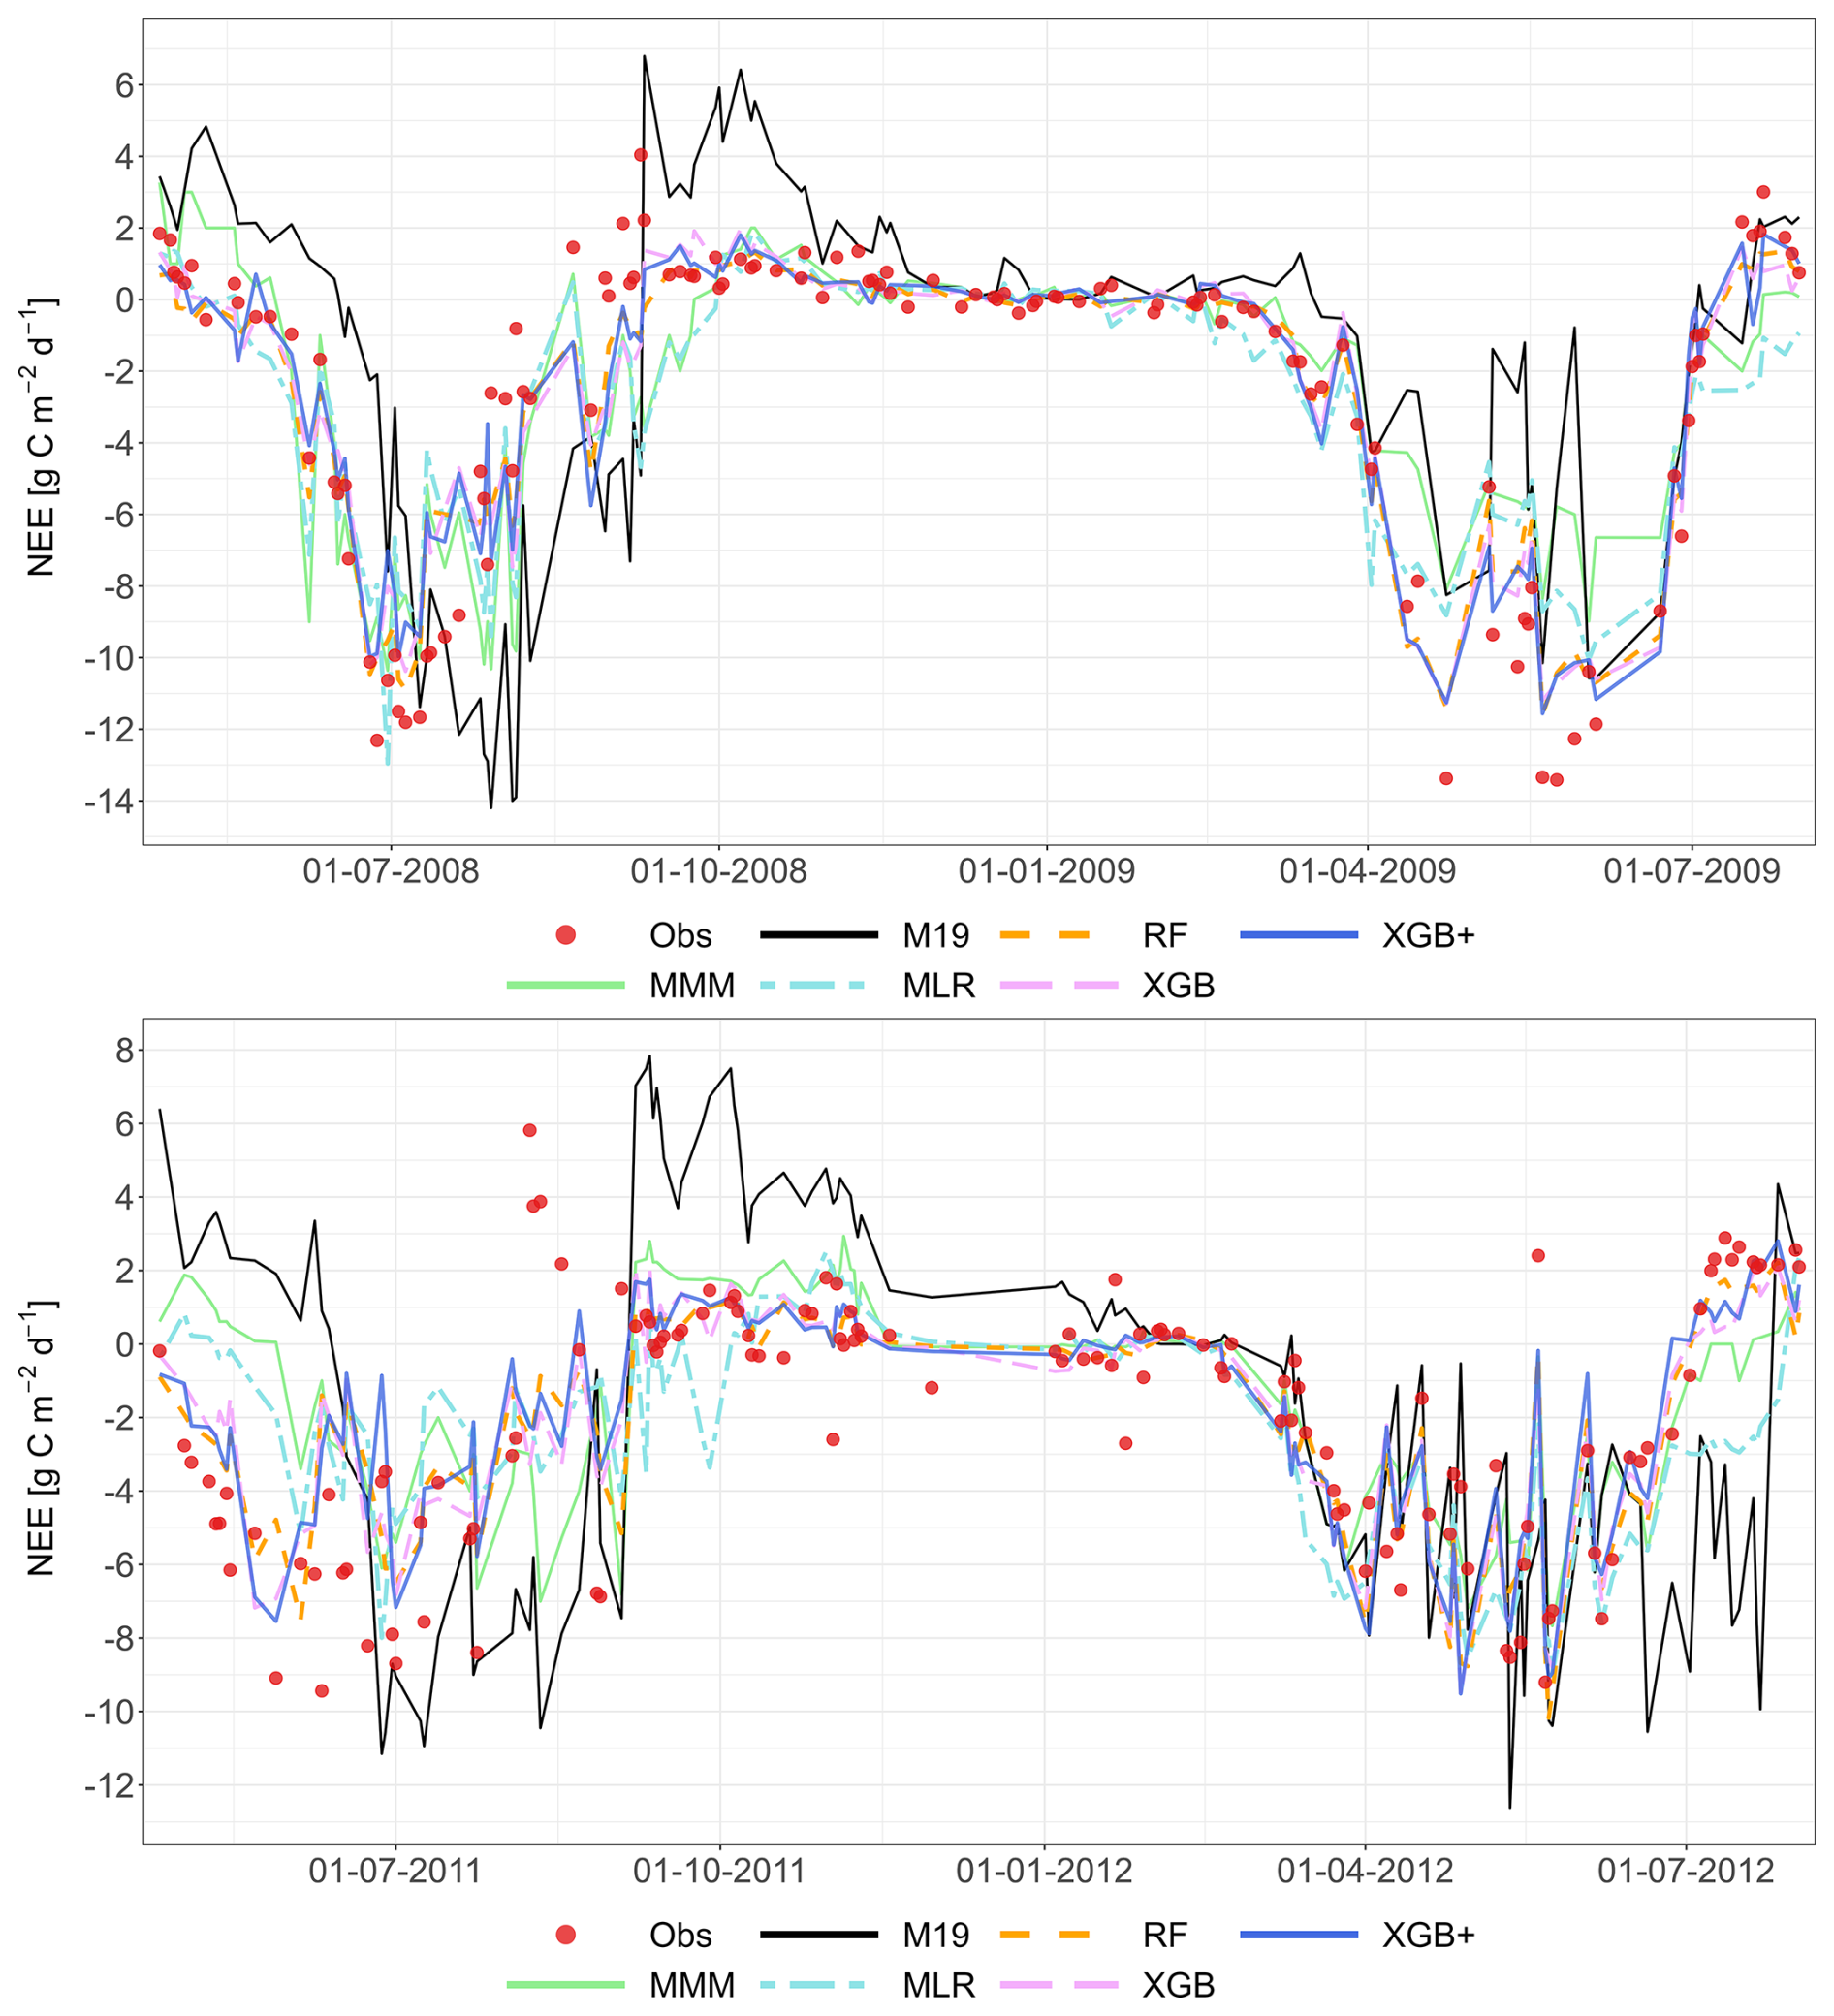
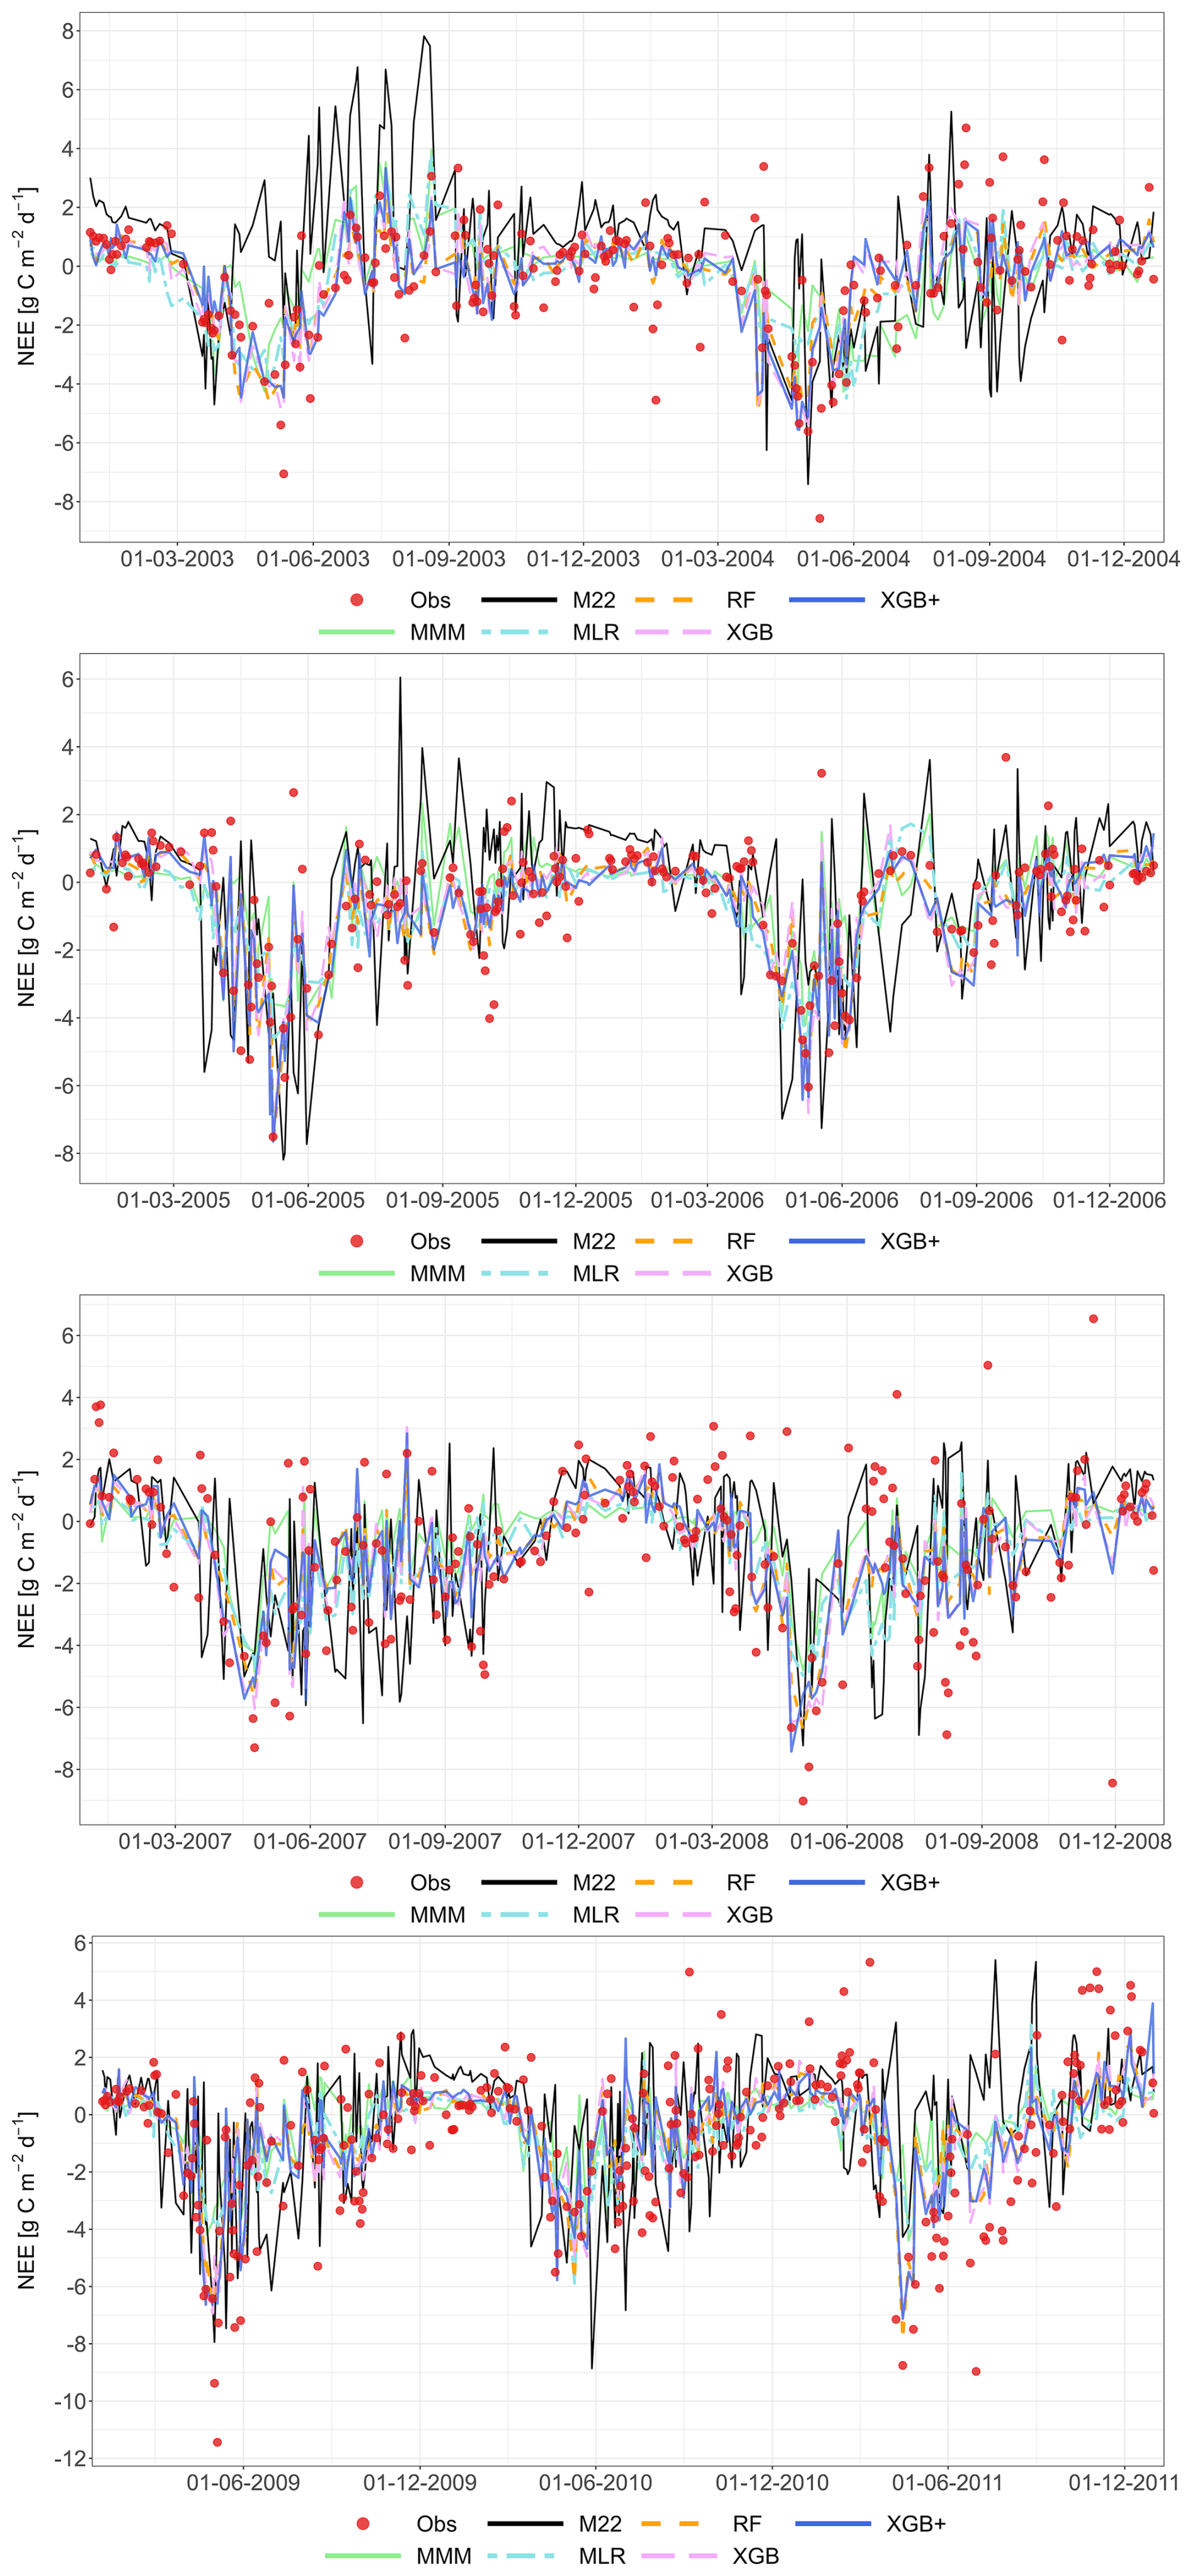
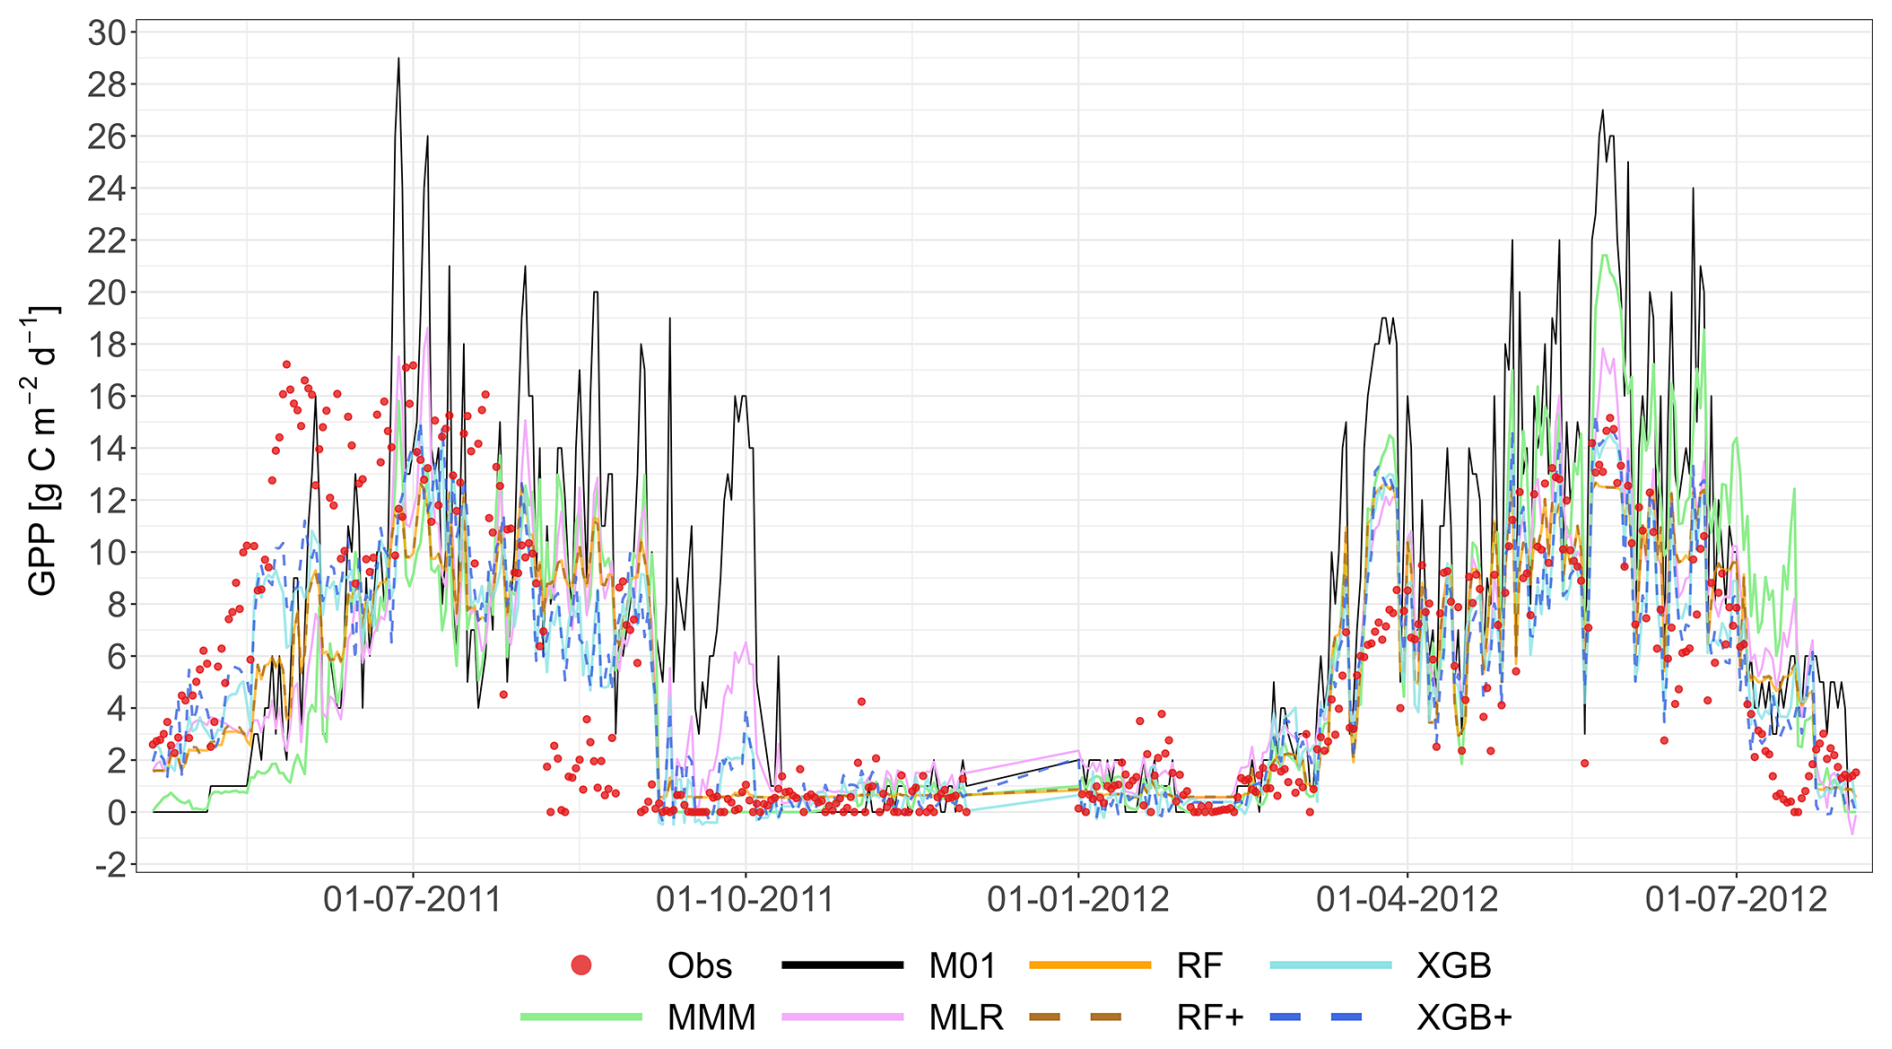
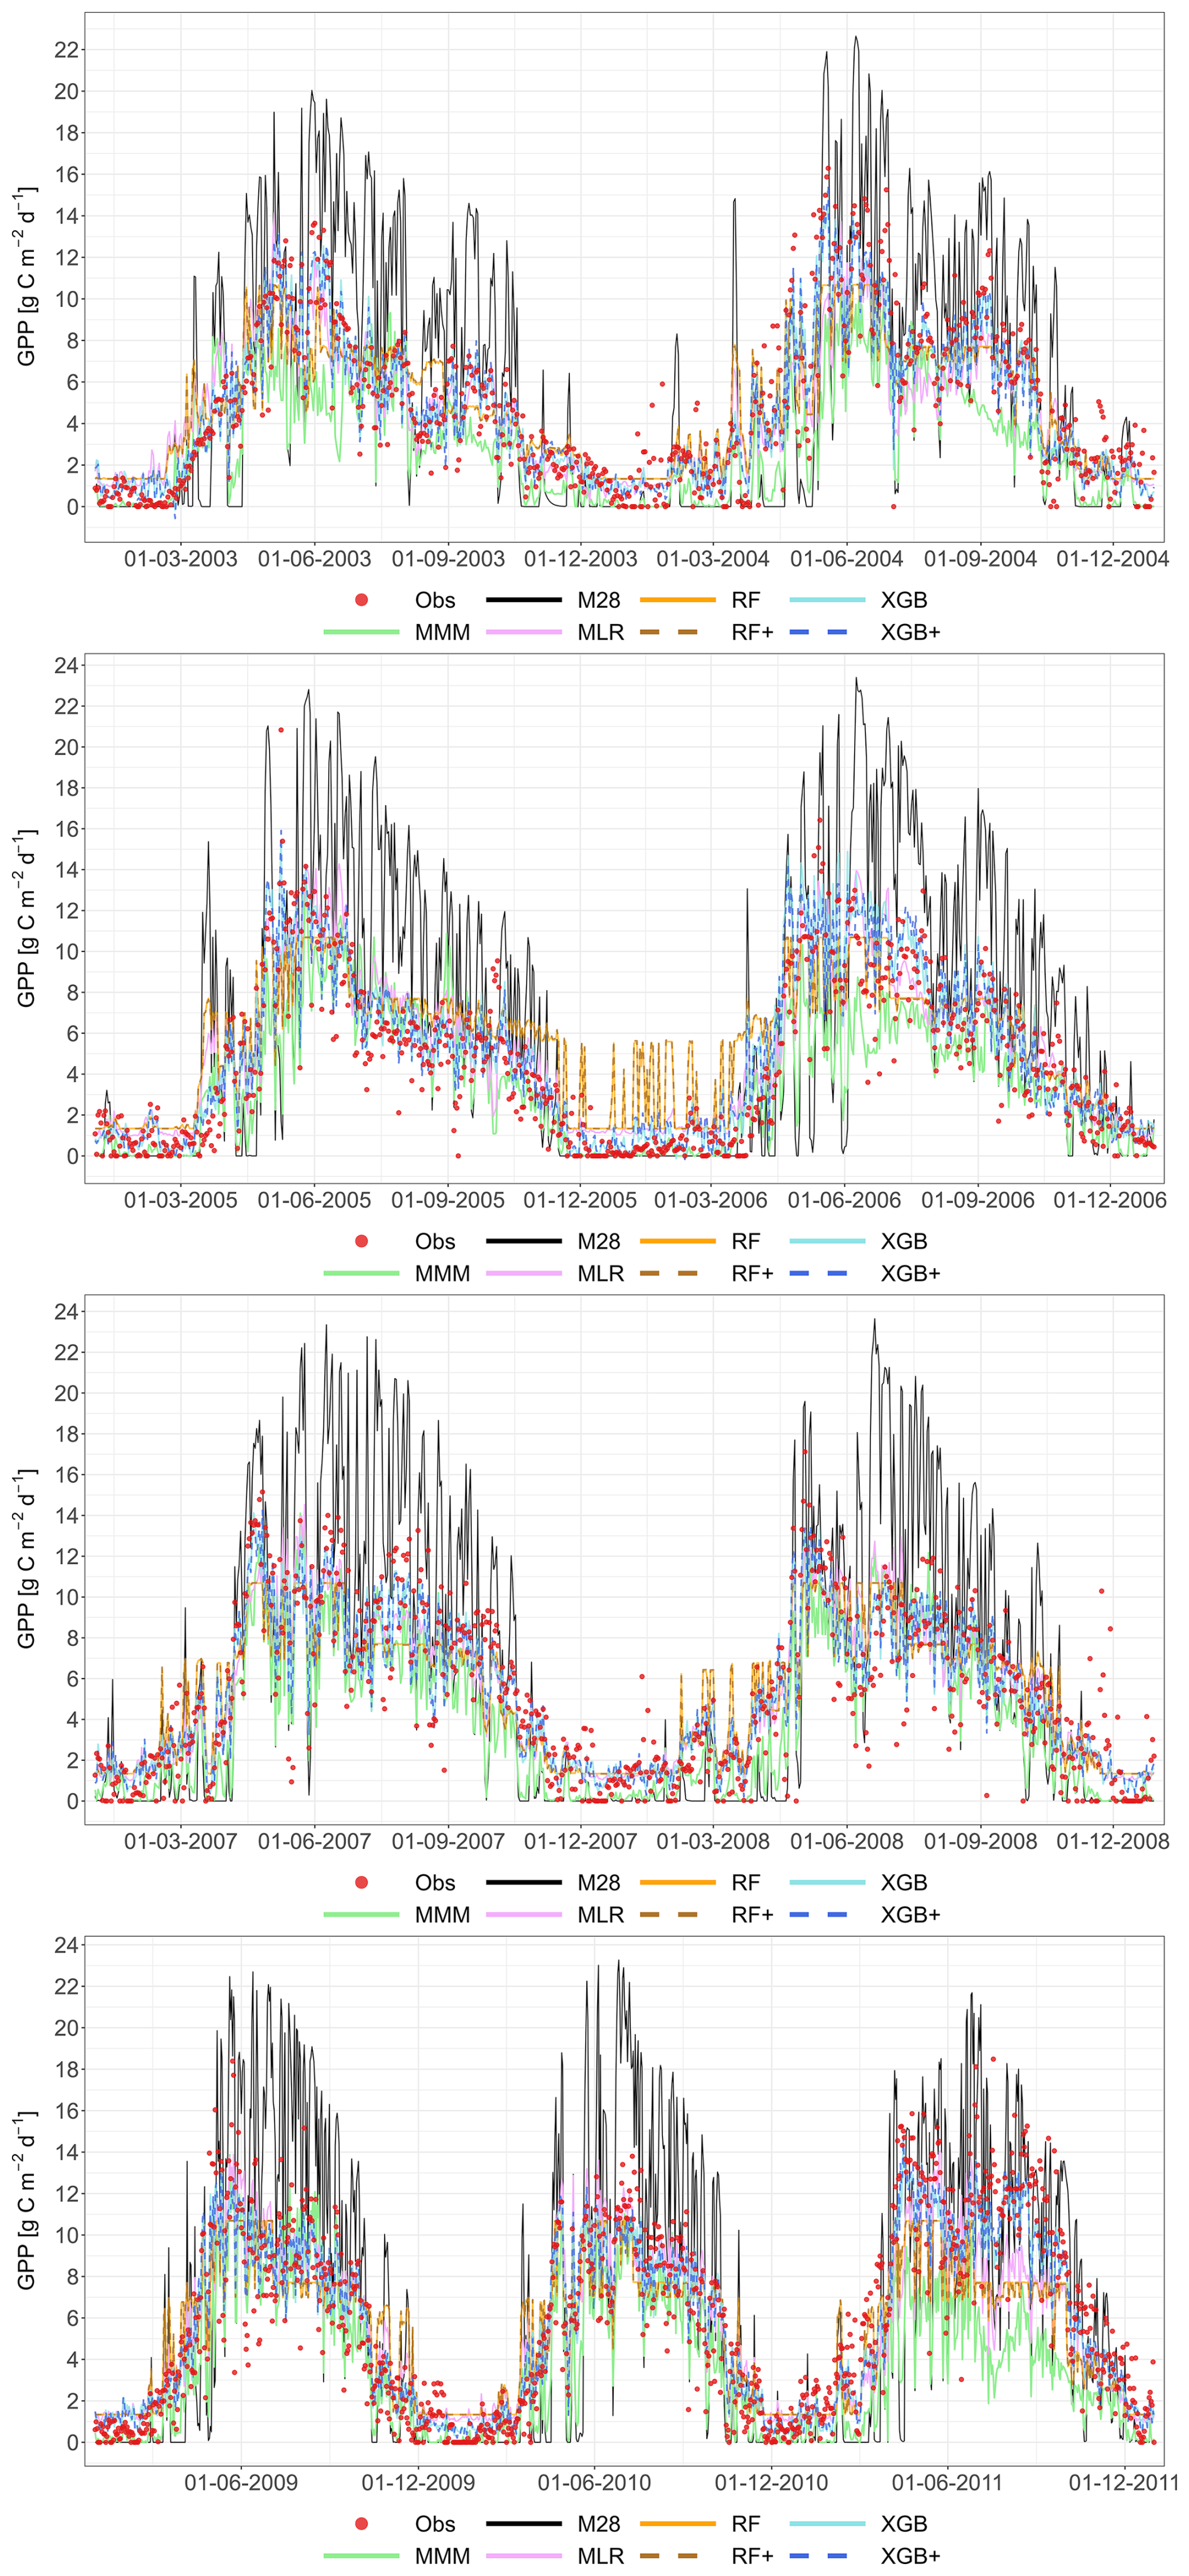
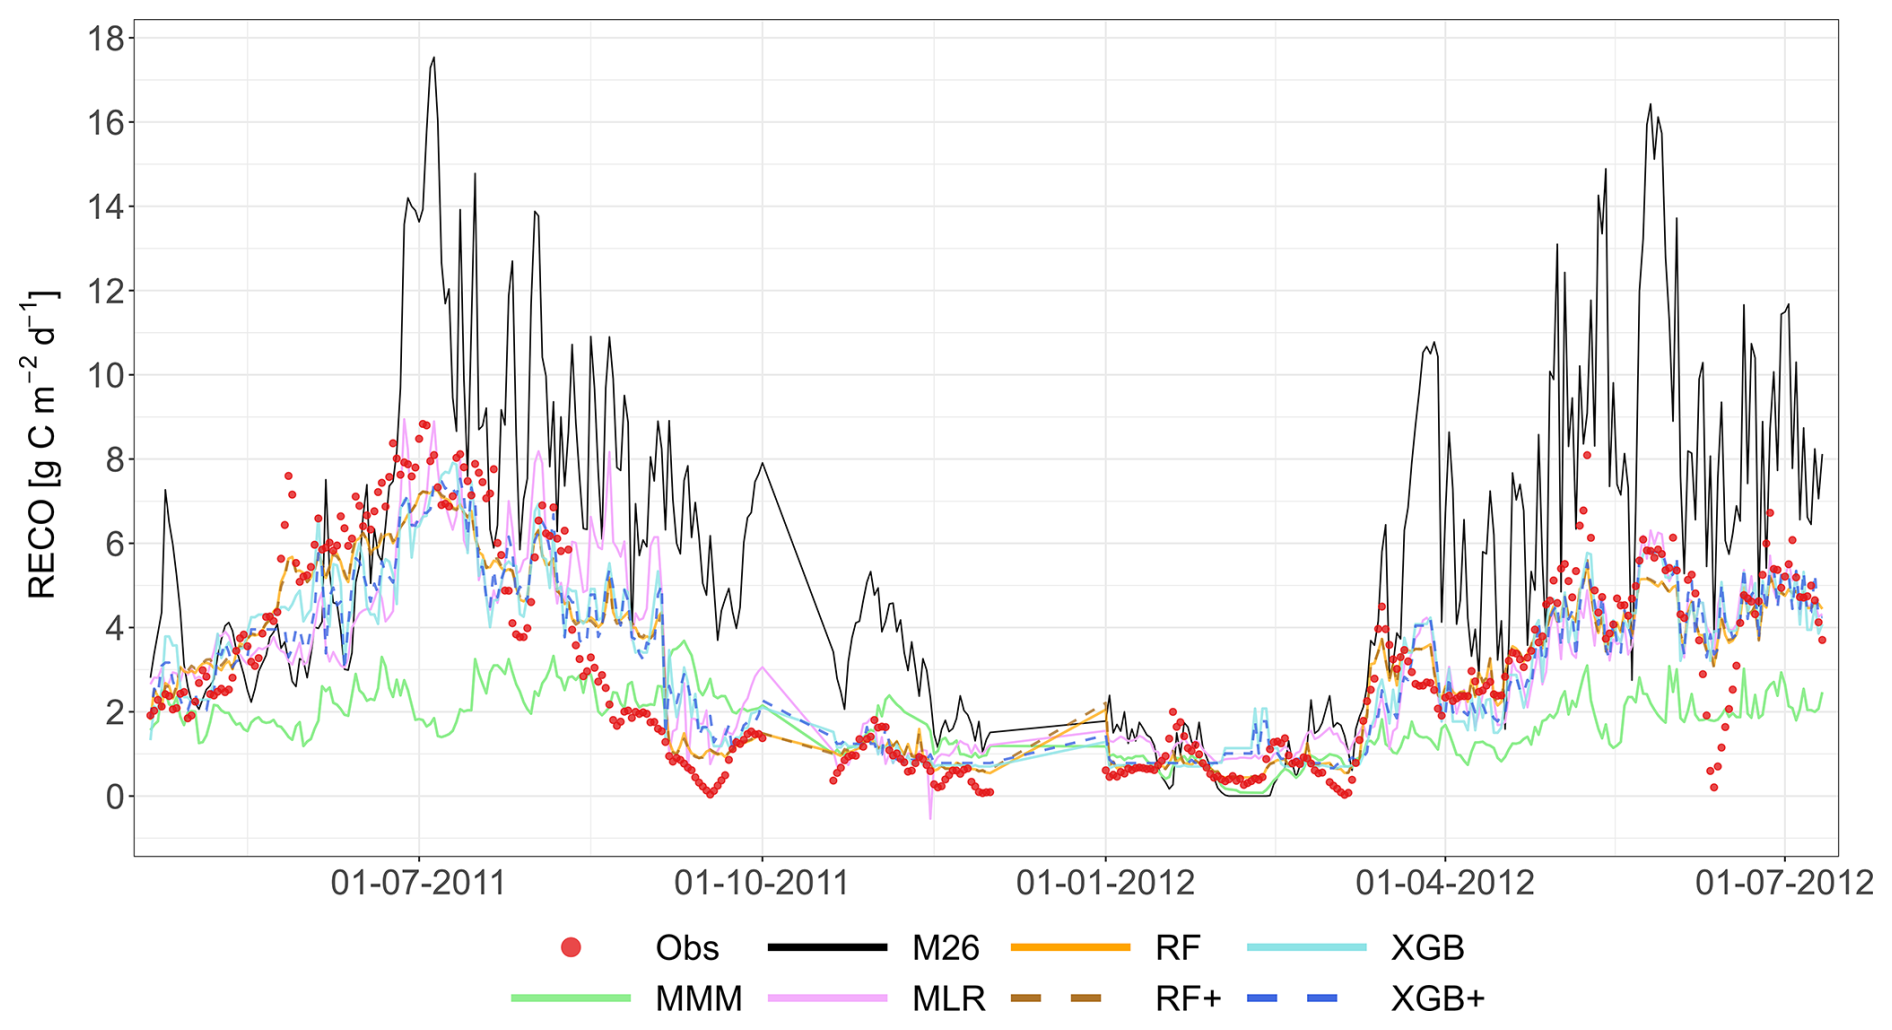
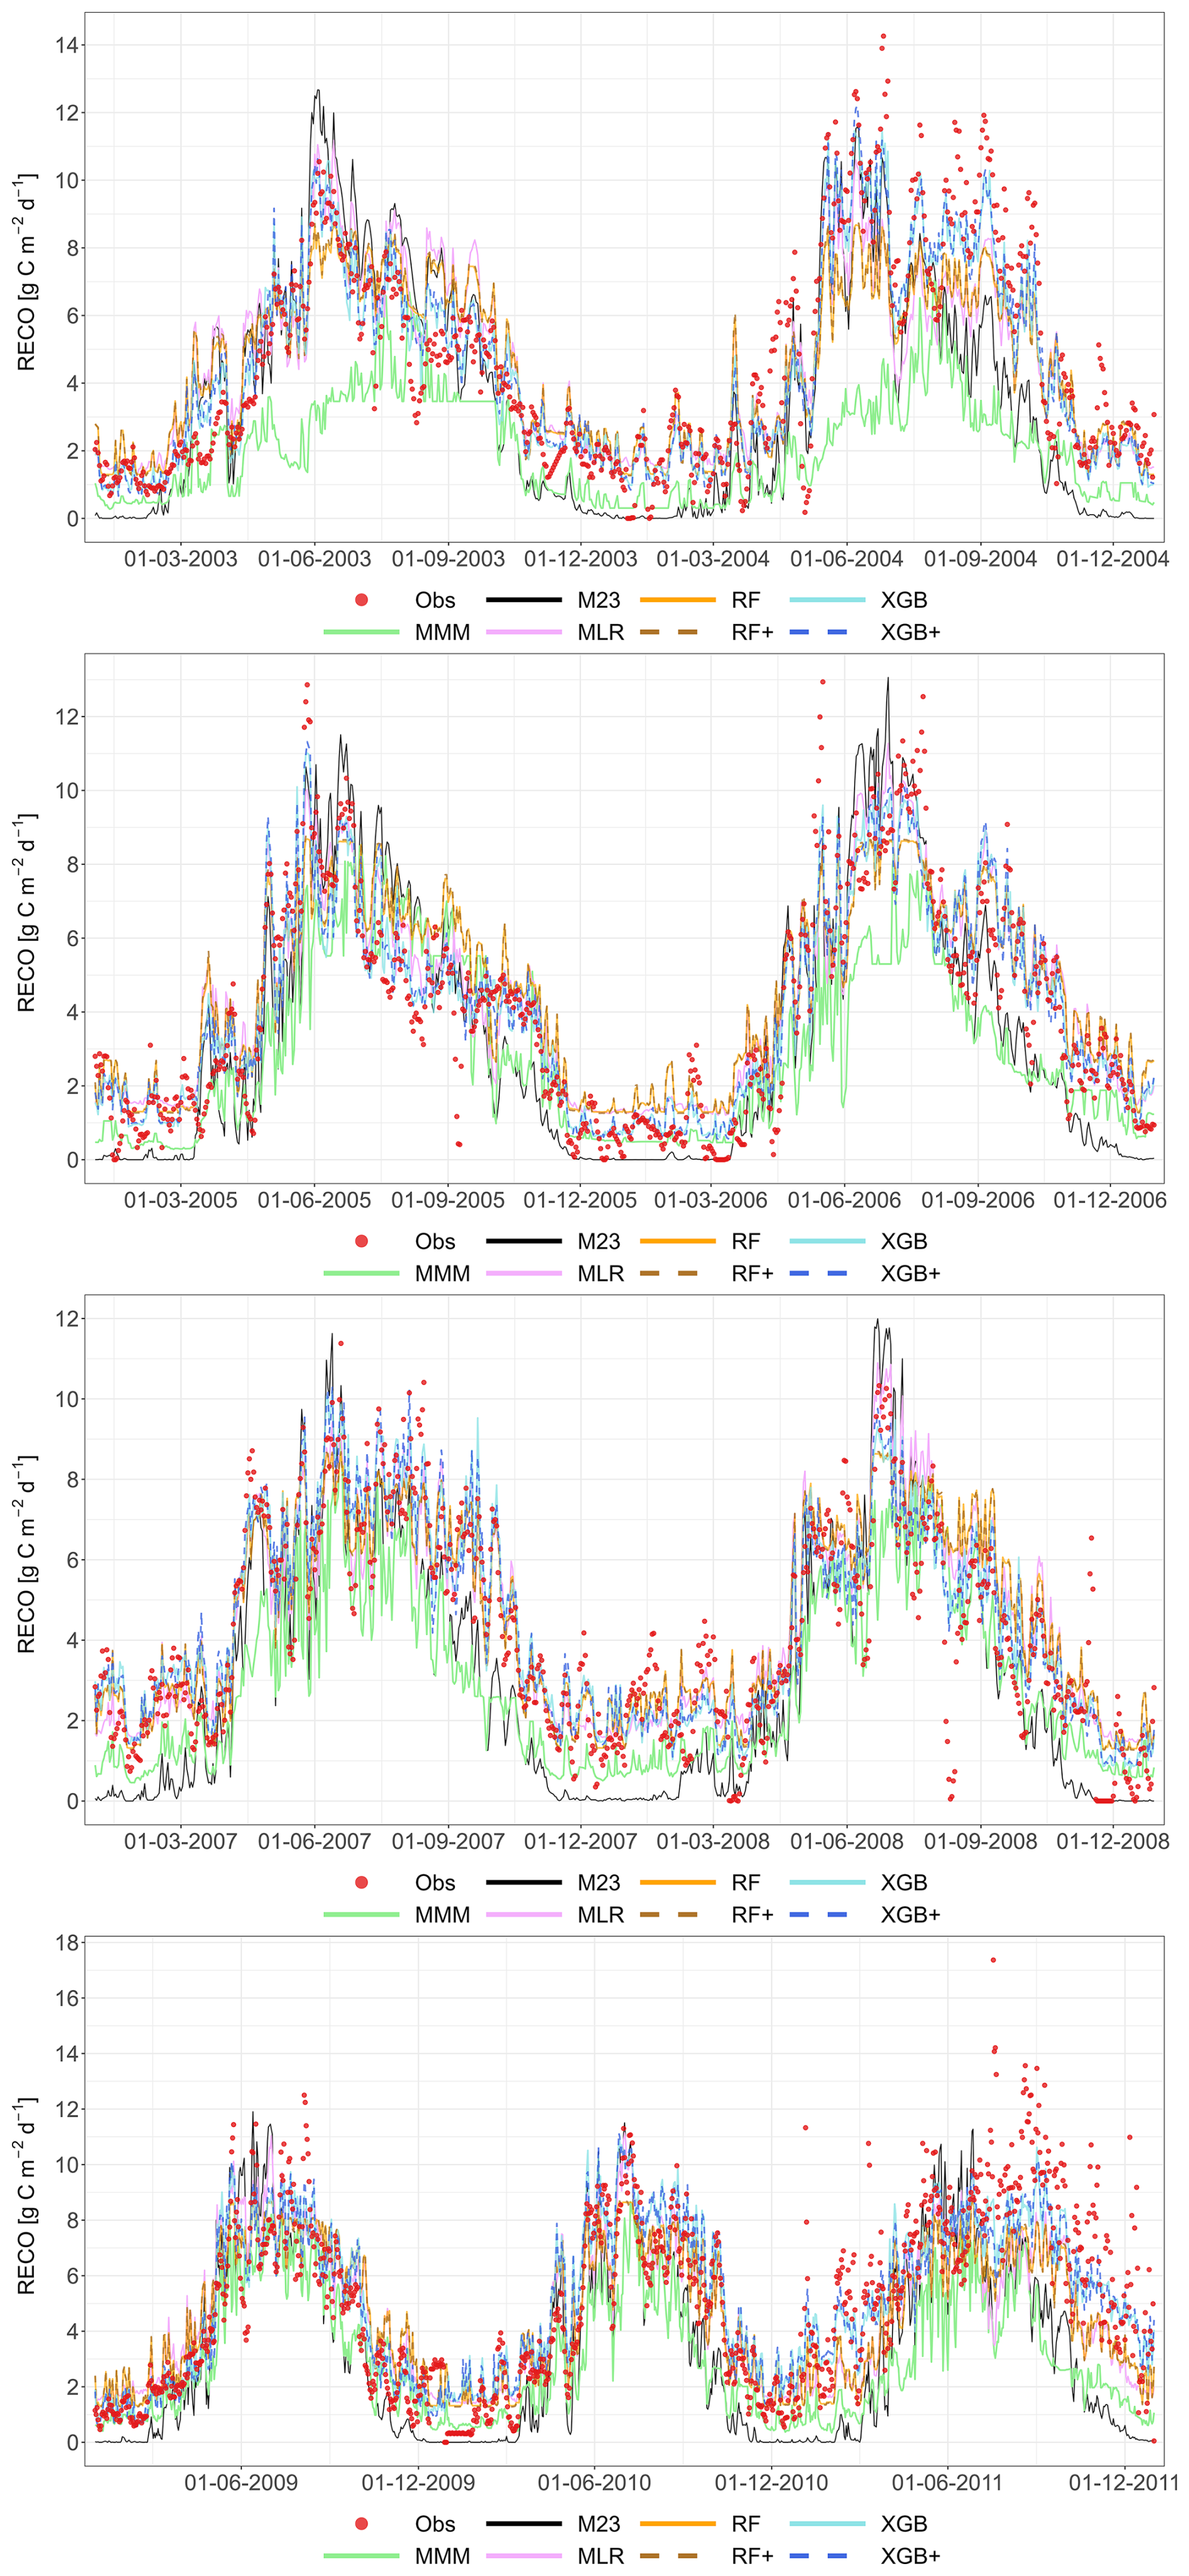
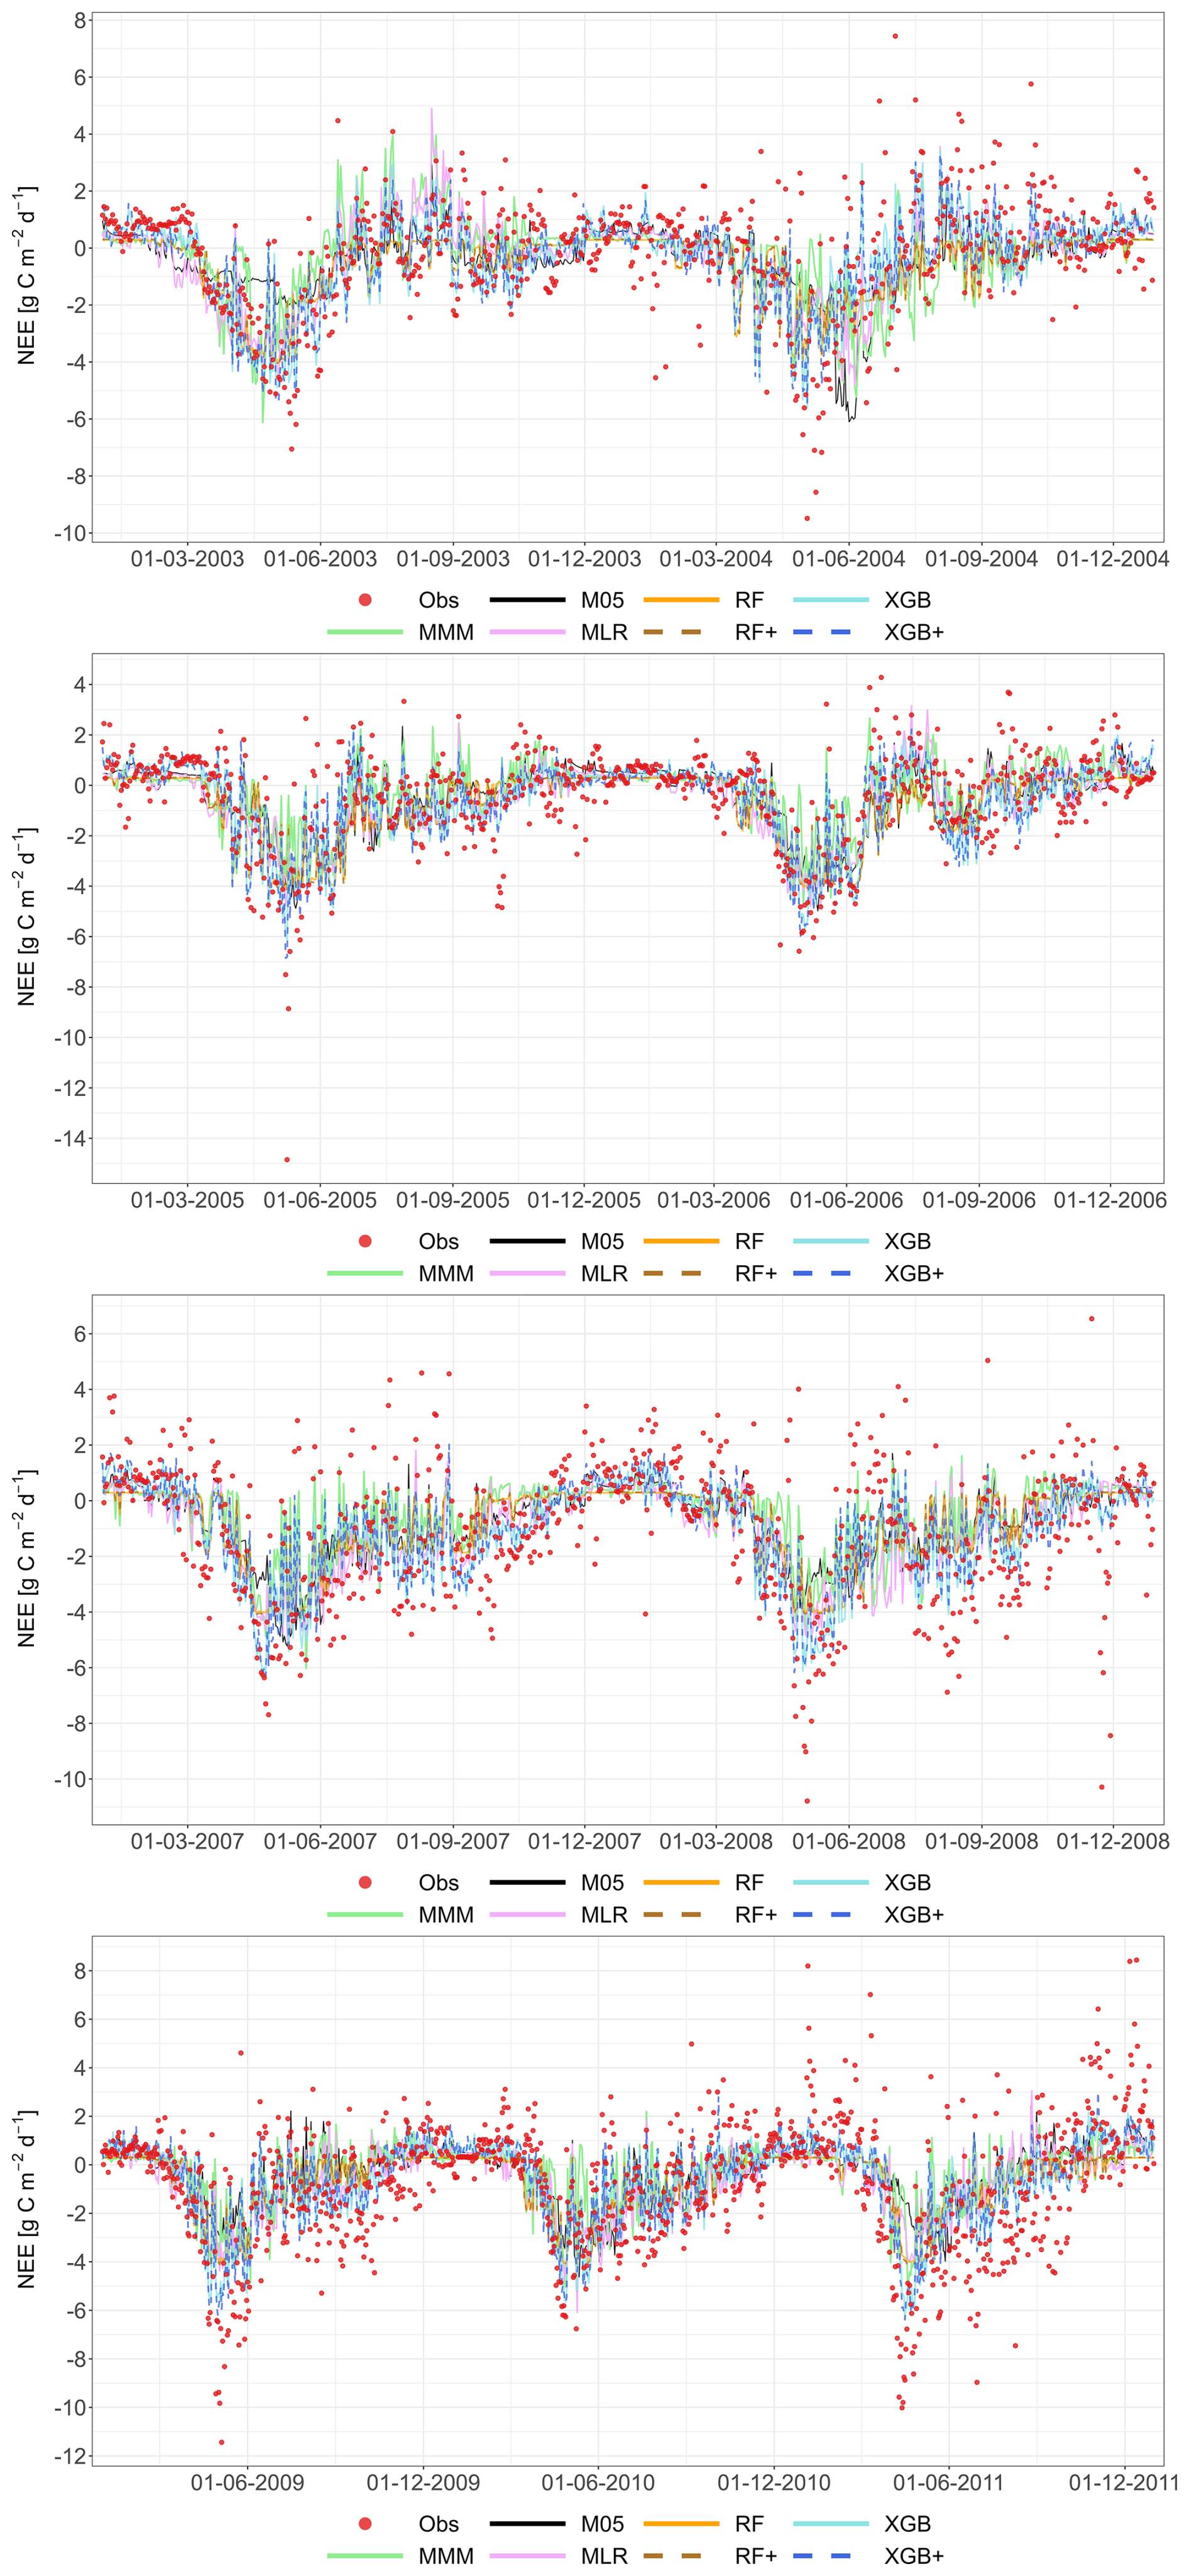
The following figures demonstrate the simulated fluxes of GPP, RECO and NEE for all sites and years included in the study, except those that are presented in the main text. Graphs are presented with a very short caption only containing: flux type, site name and type, covered years. See the main text for explanations.
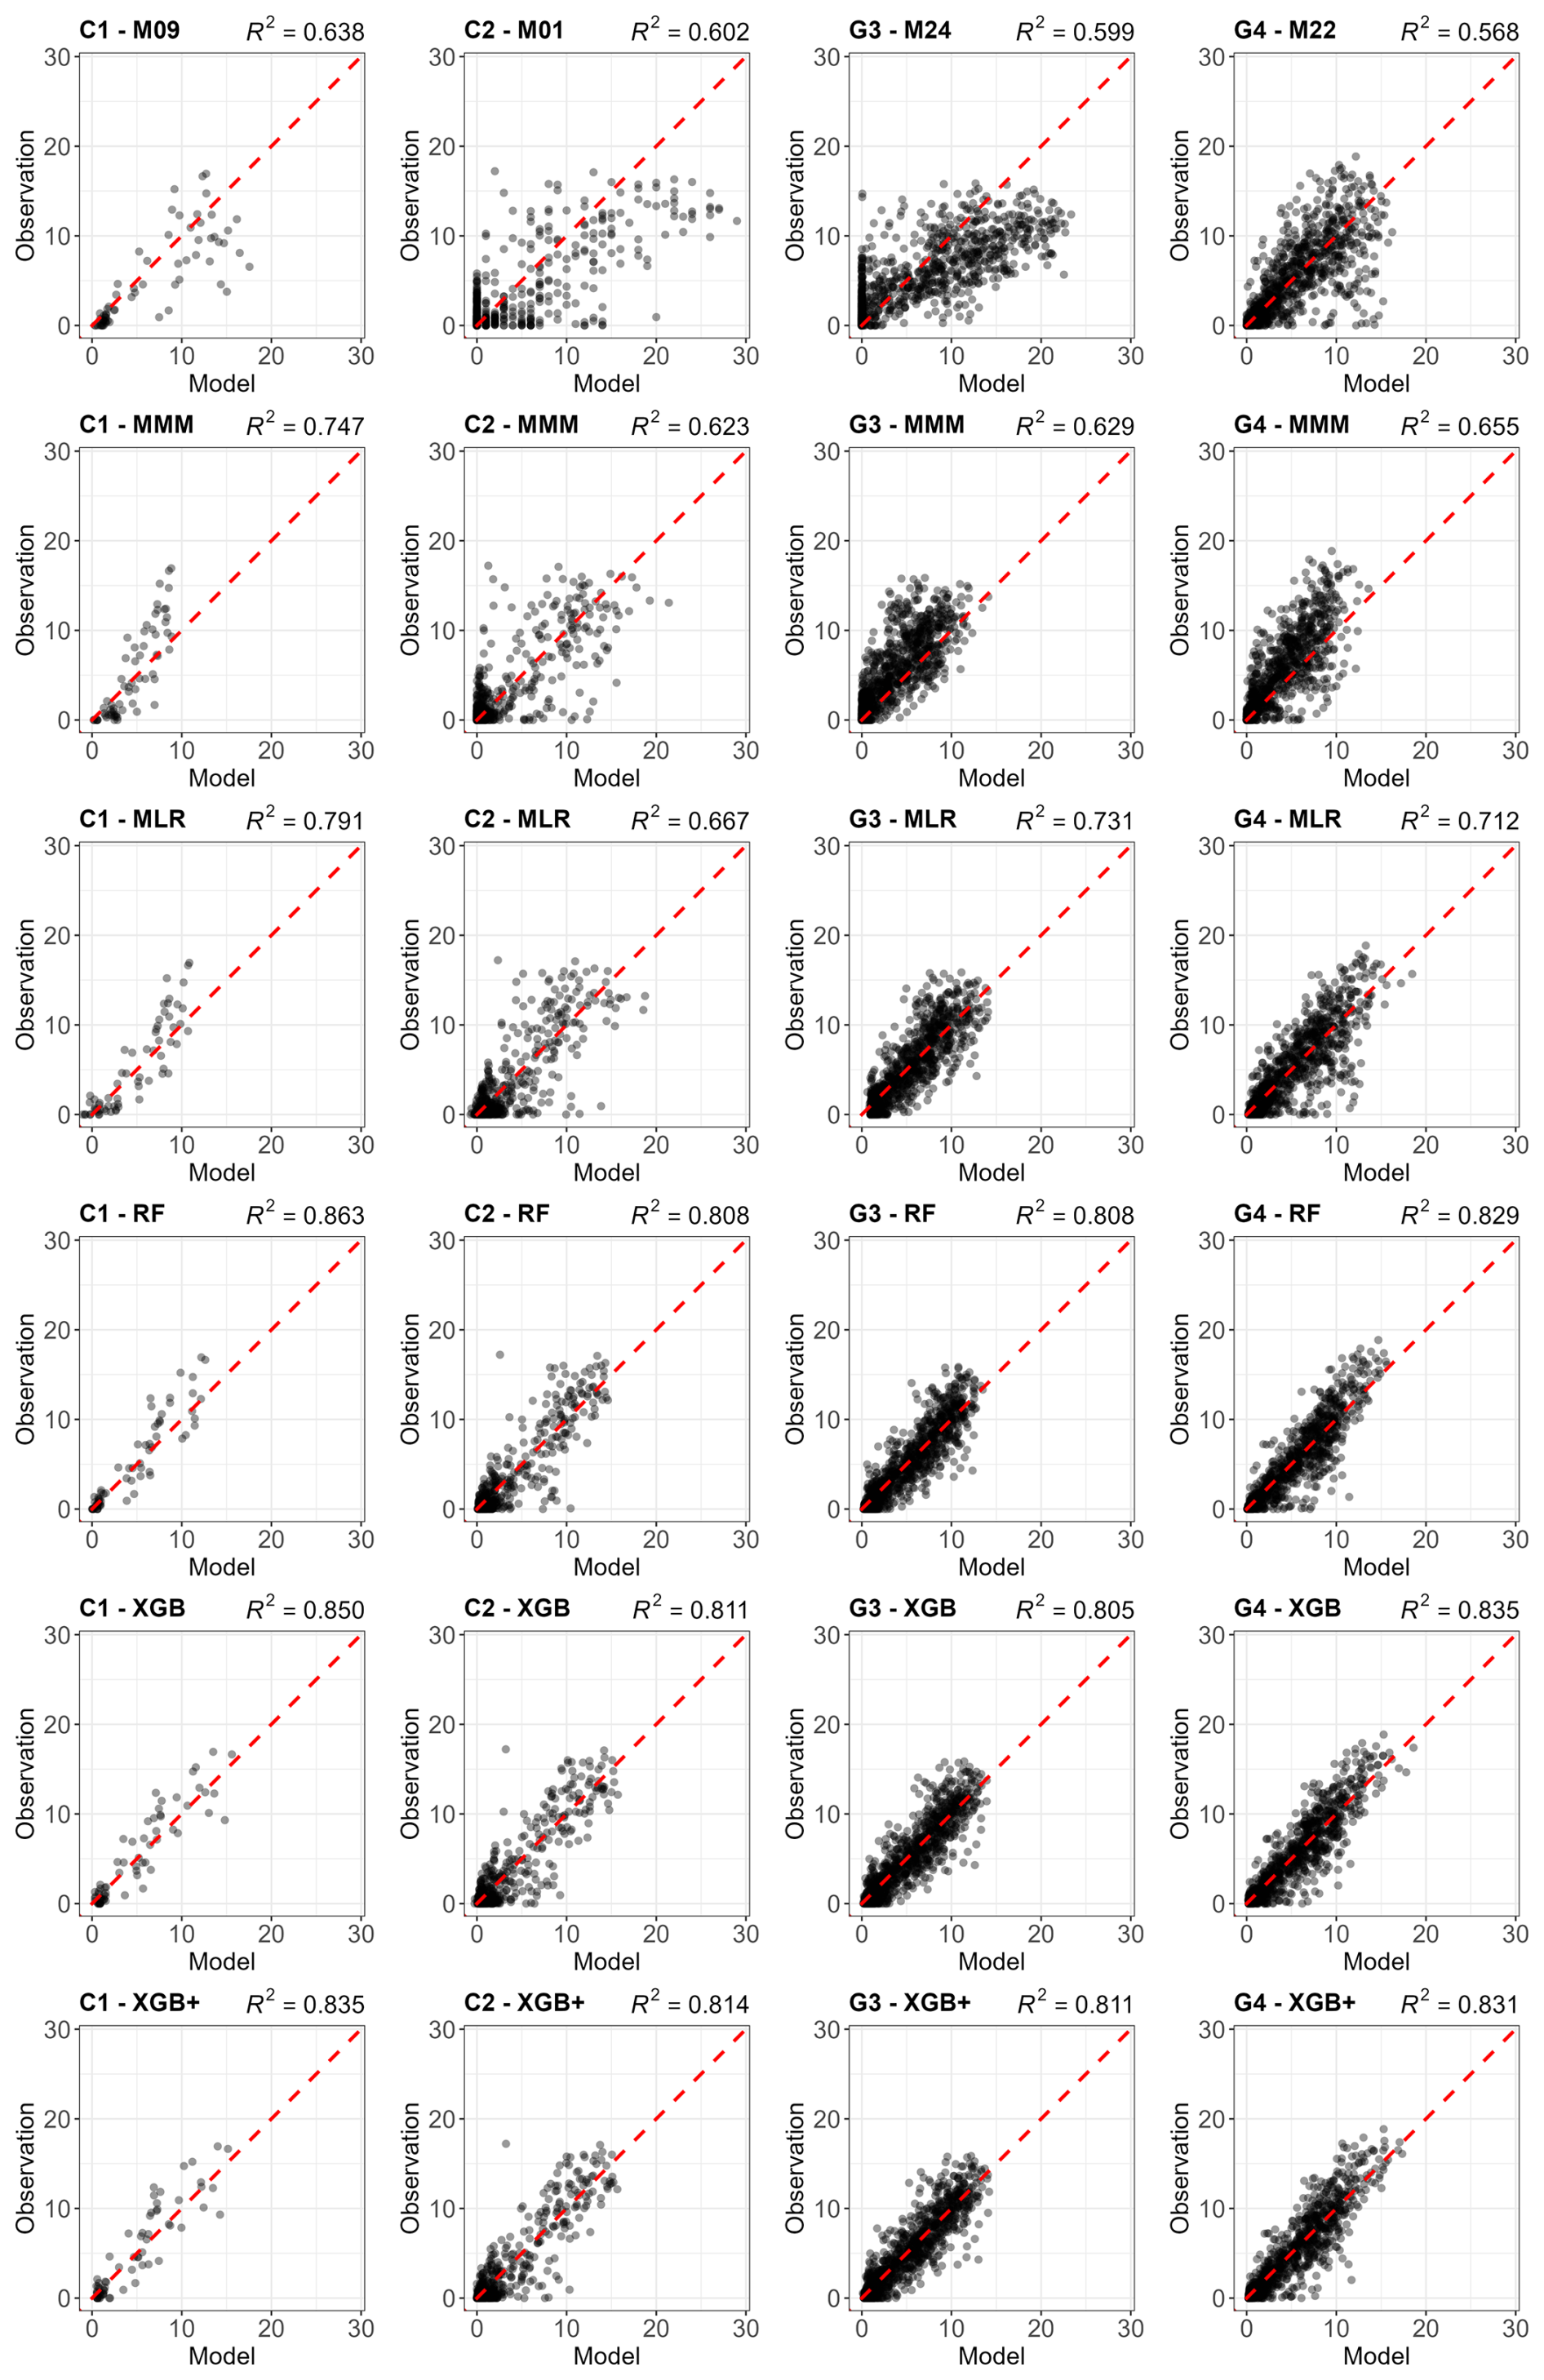
Figure A1Comparison of the best individual model, the constructed meta-models and the traditional Multi-Model Median with the observations for all sites (from left to right C1, C2, G3 and G4) and for the entire time series for GPP based on the approach. From top to bottom: best individual model with ID, MMM, MLR, RF, RF+, XGB and XGB+. All units are in g C m−2 d−1. Red dashed line represents the 1 : 1 relationship.
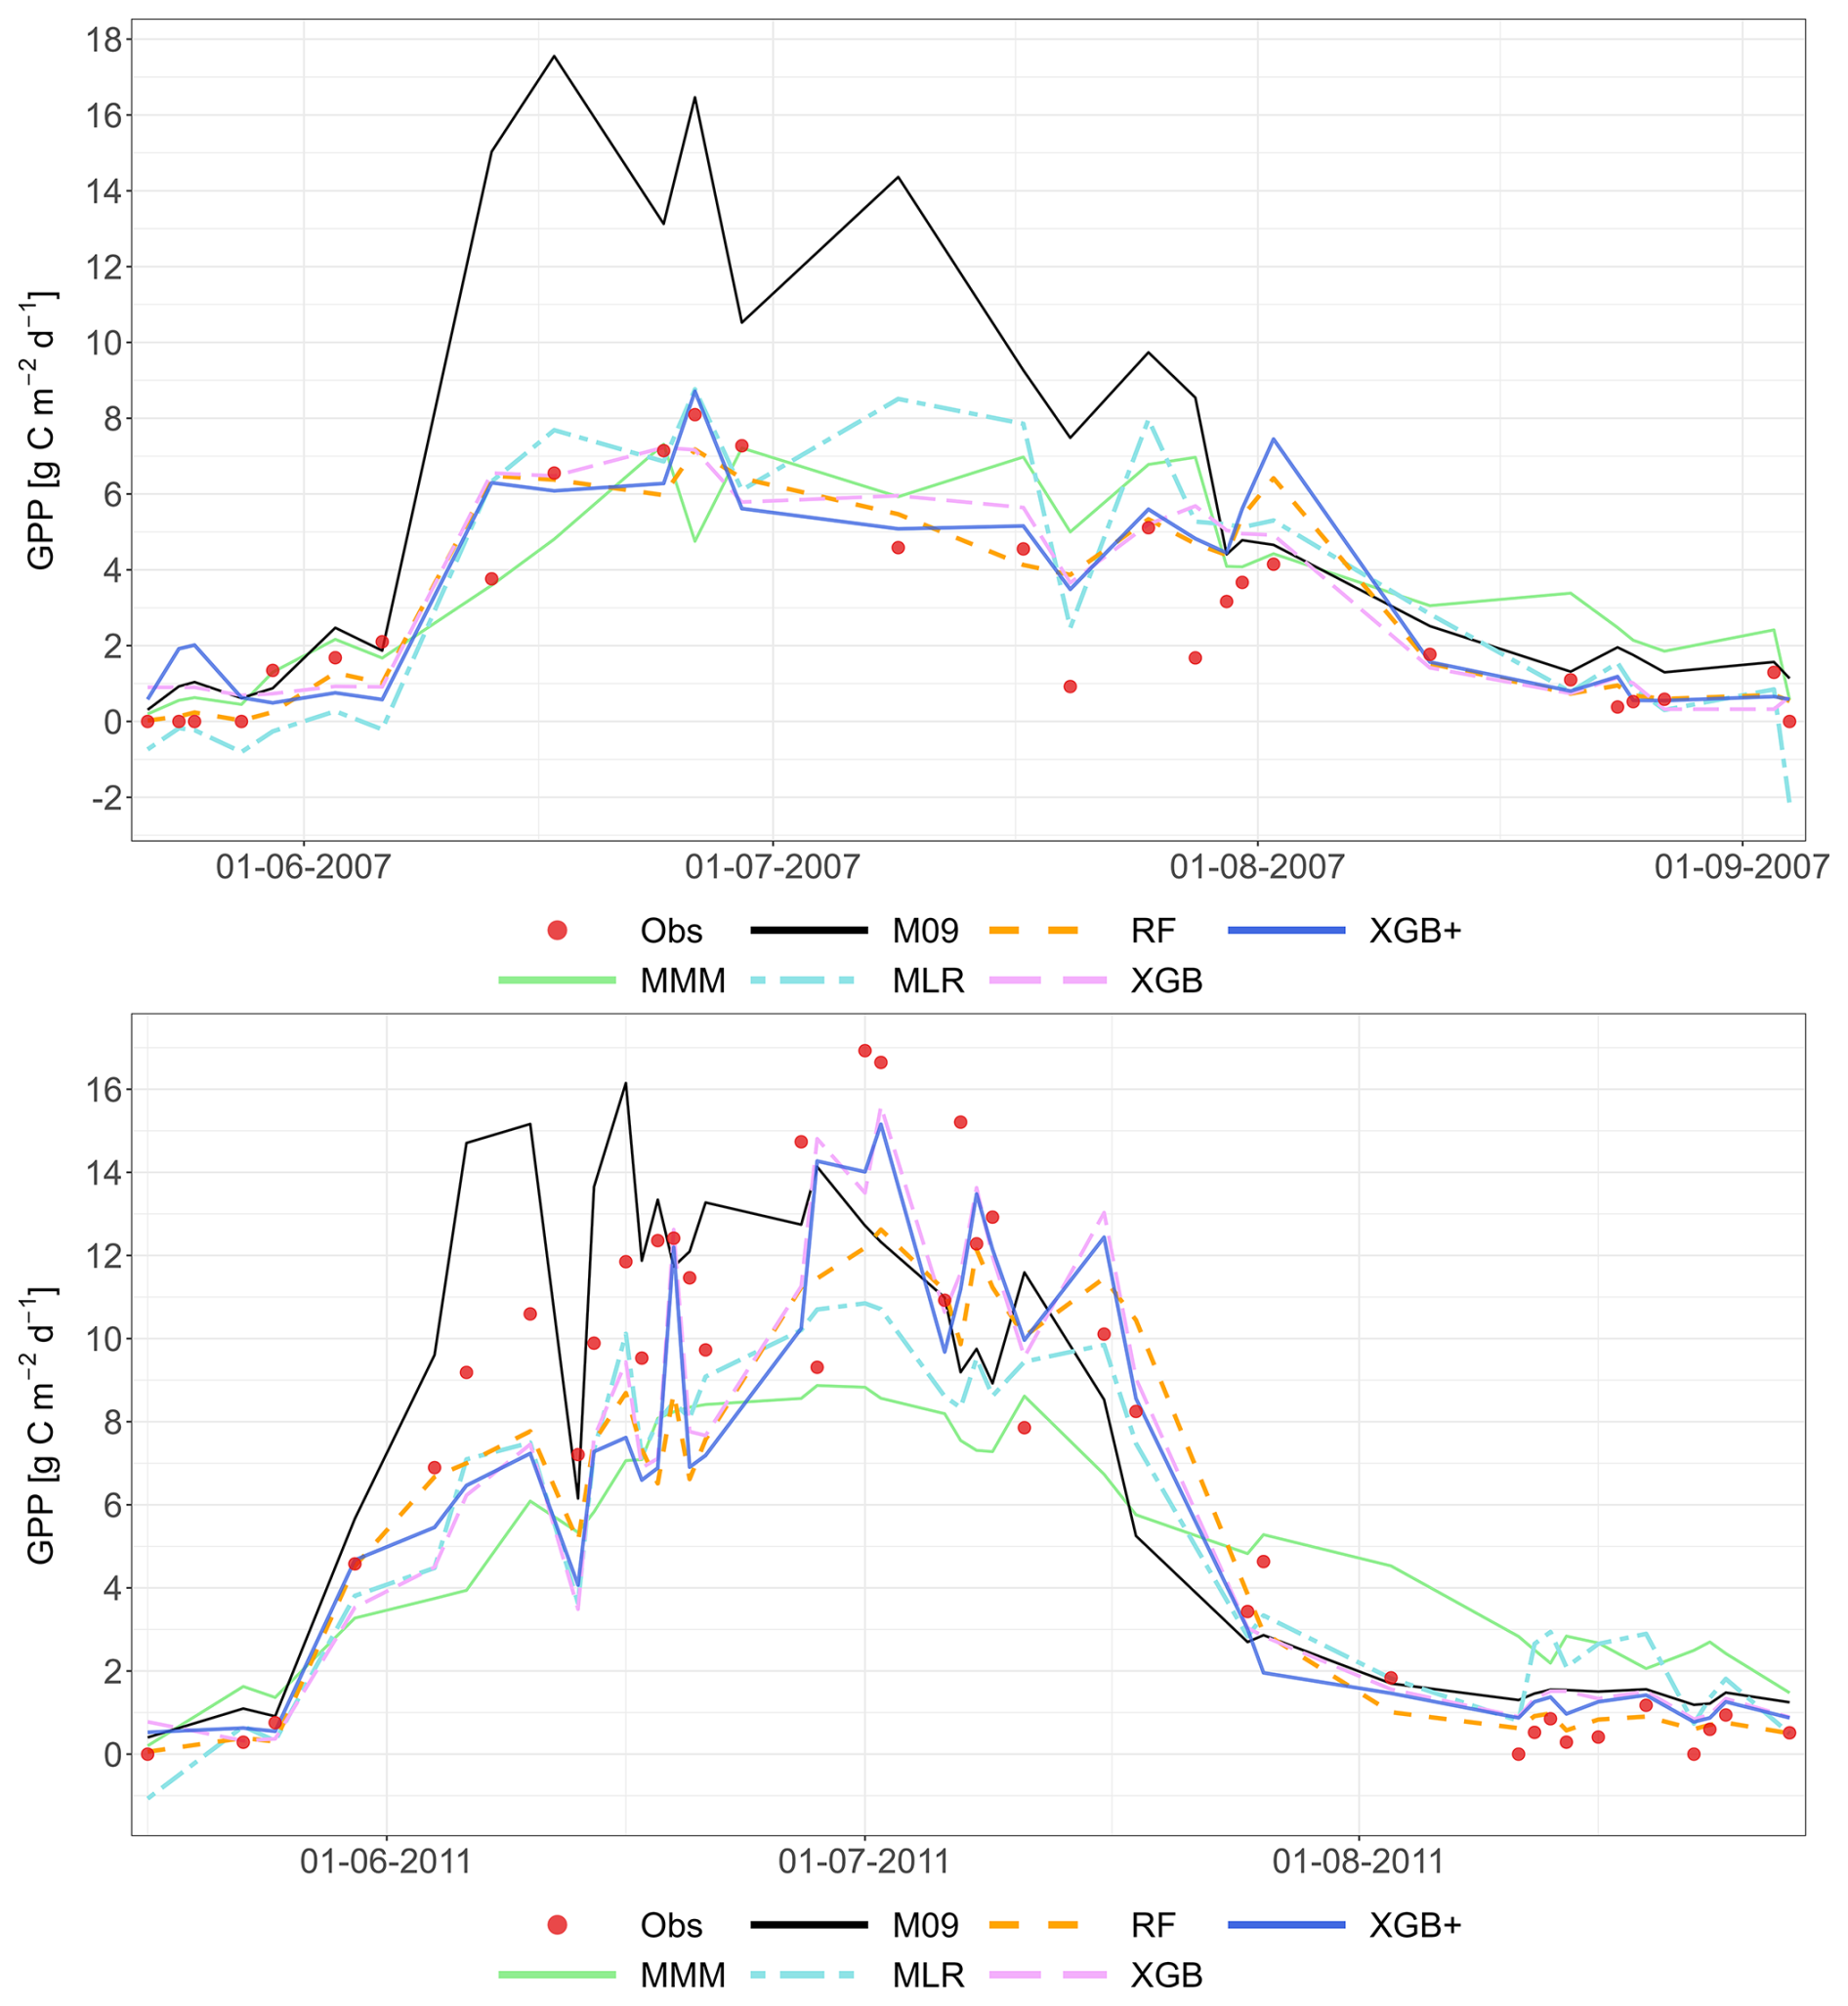
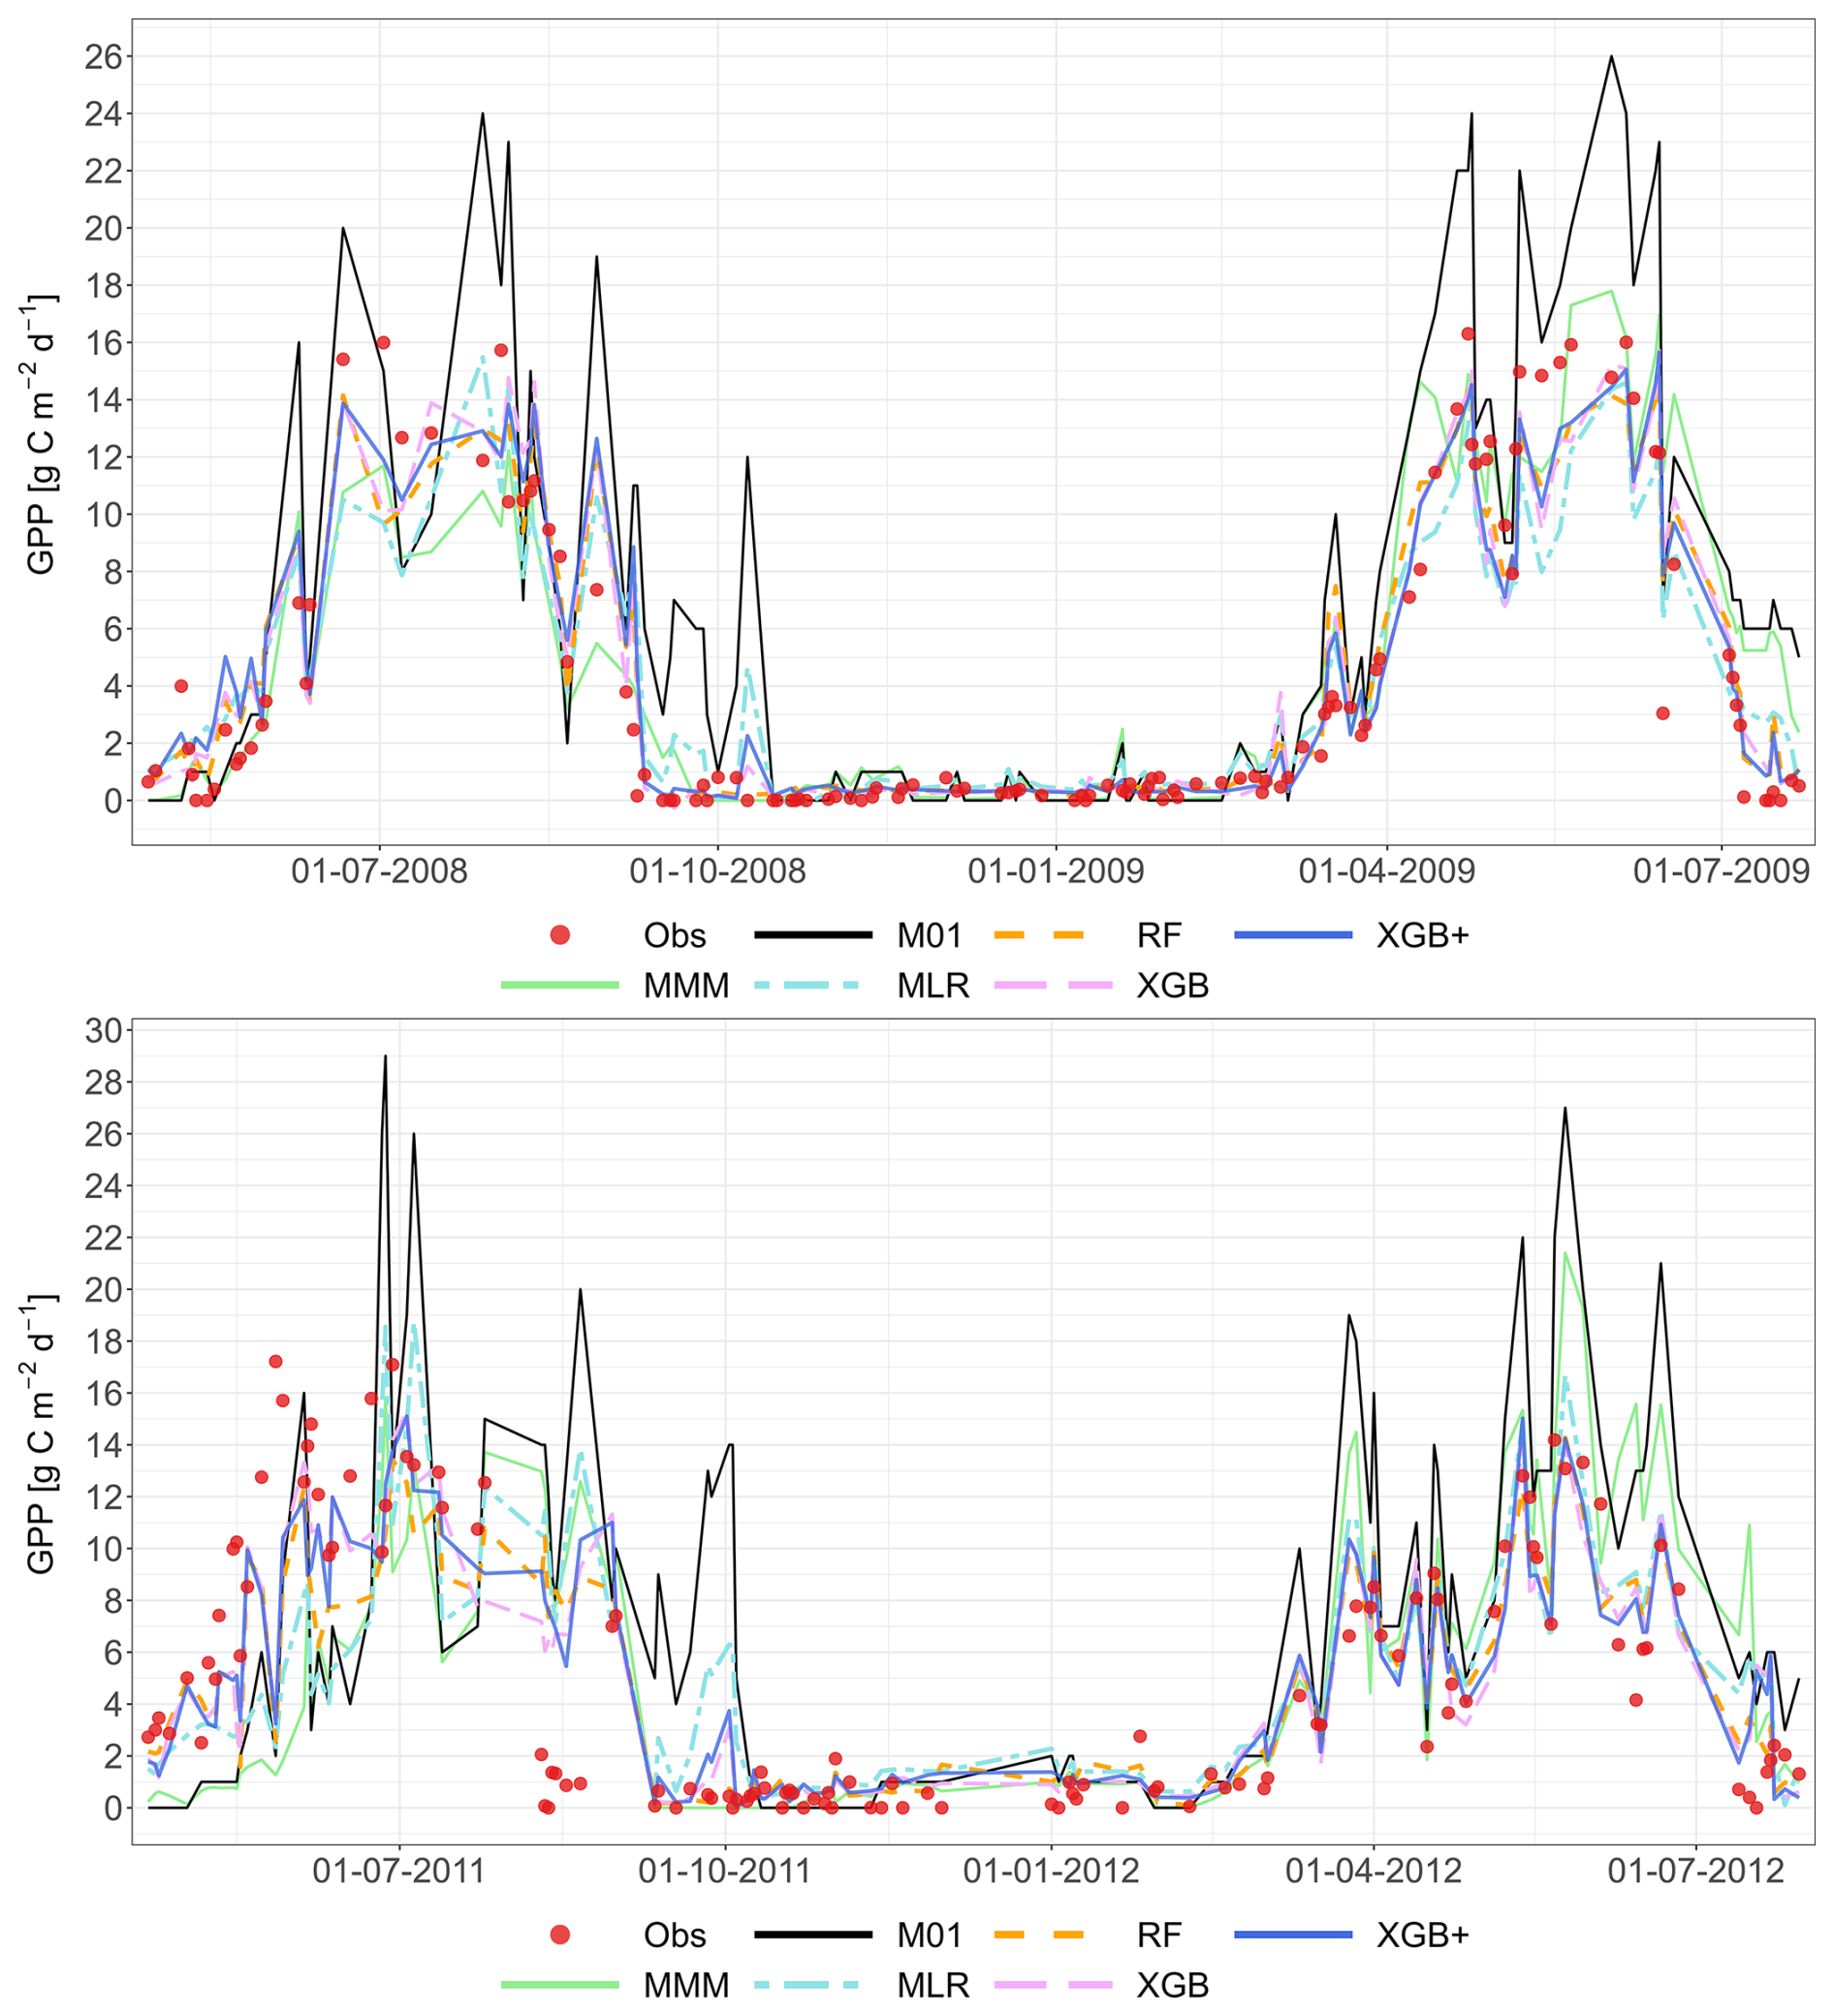
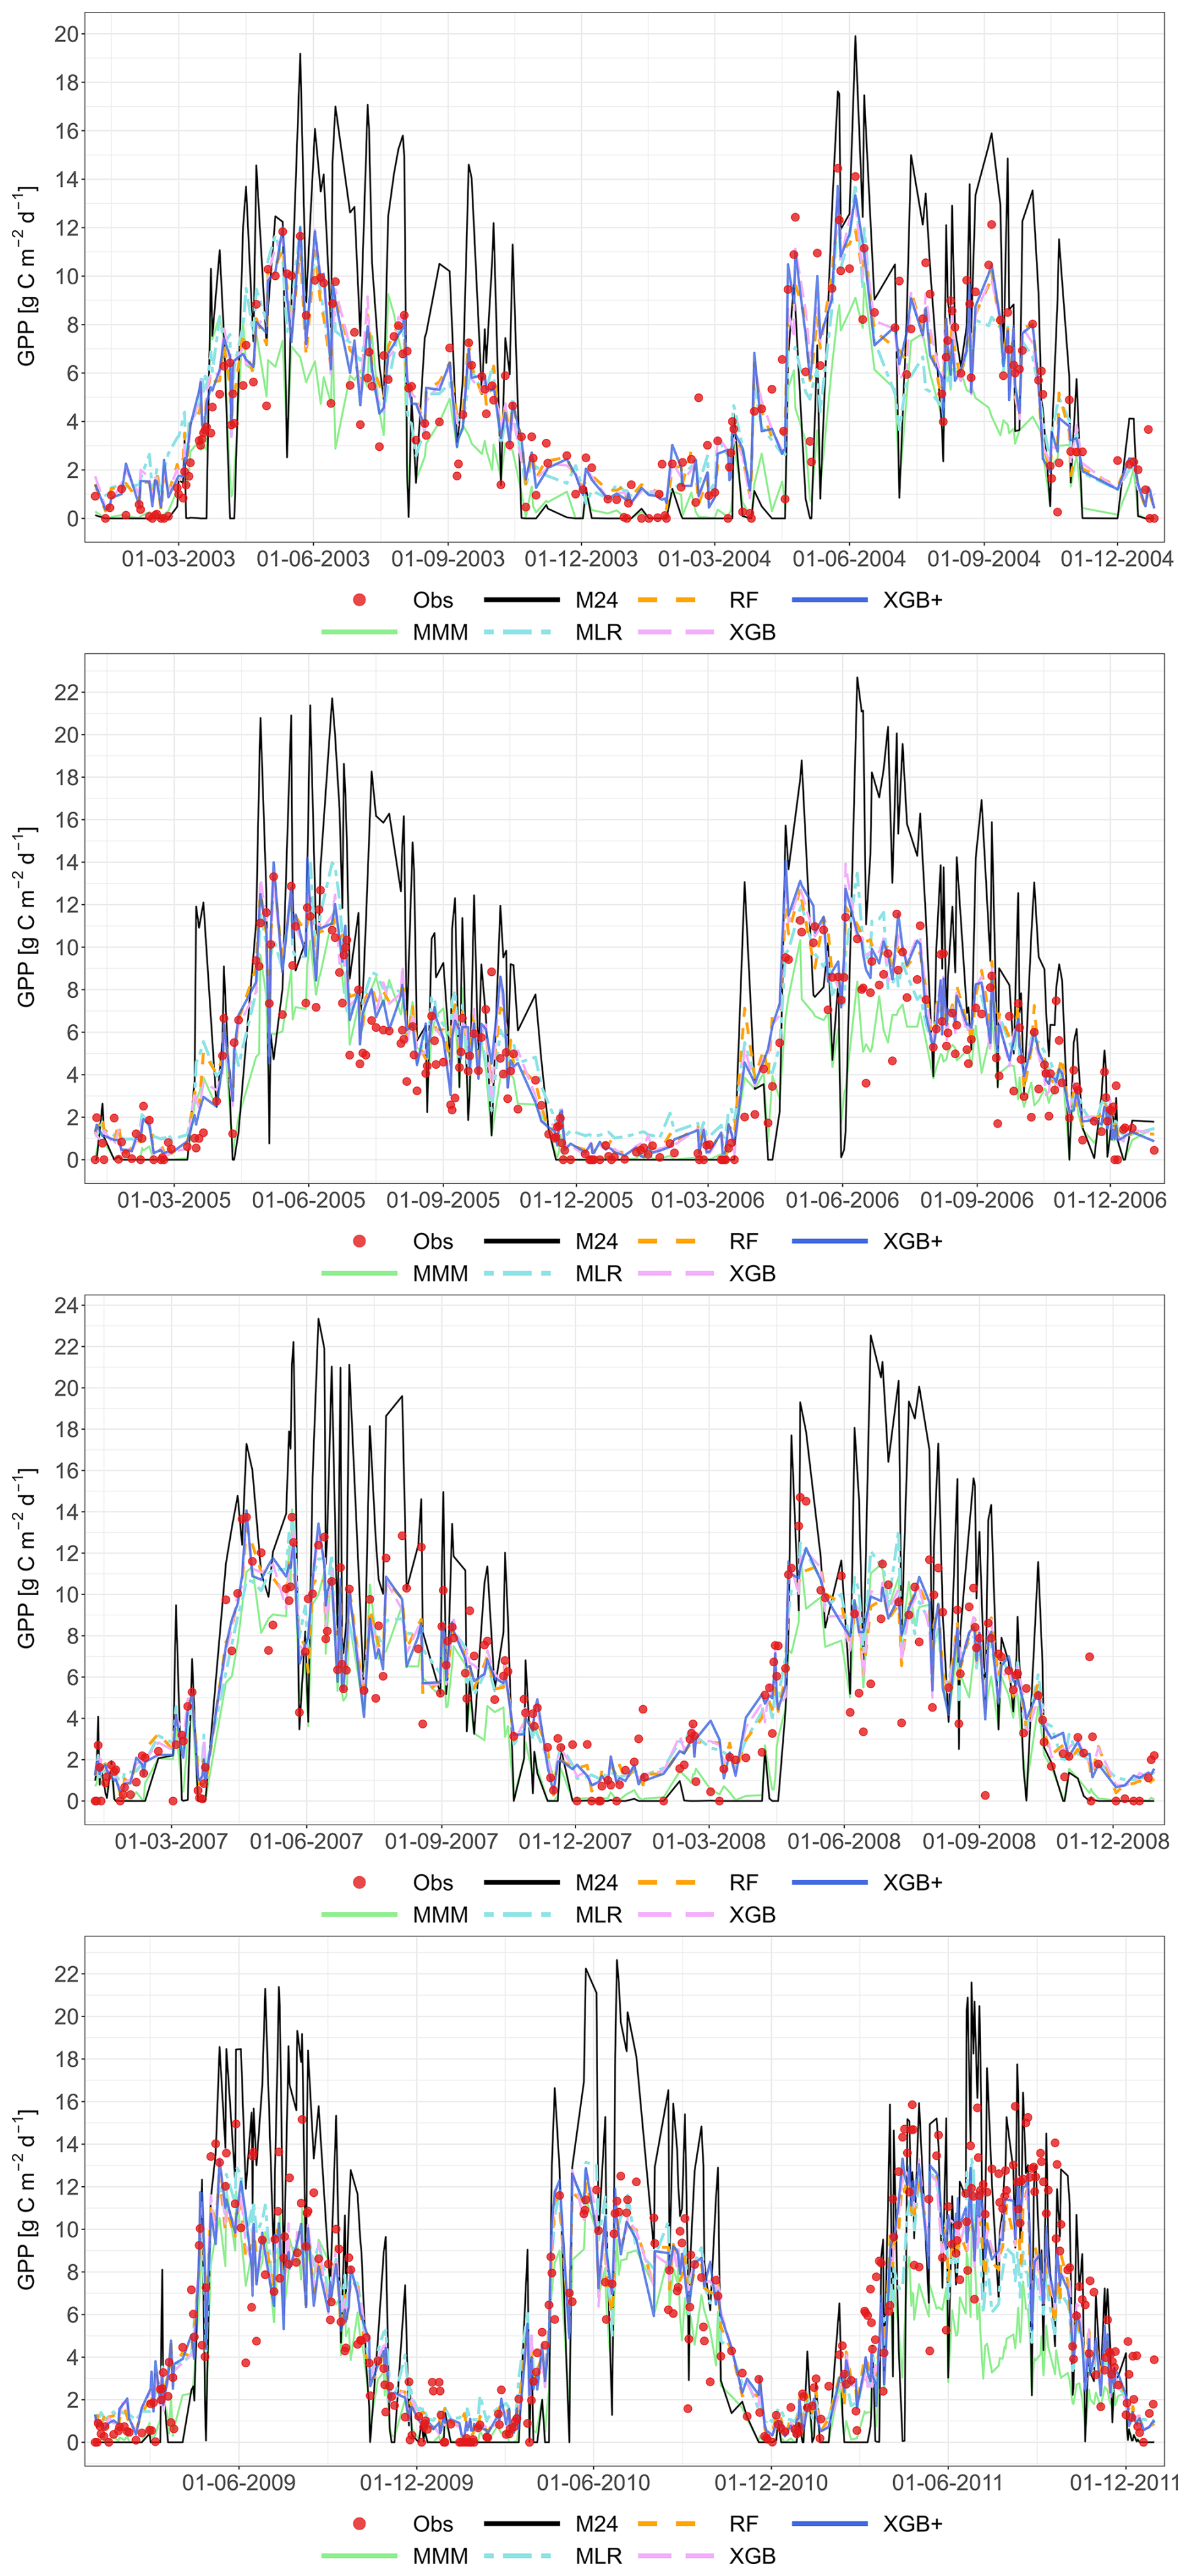
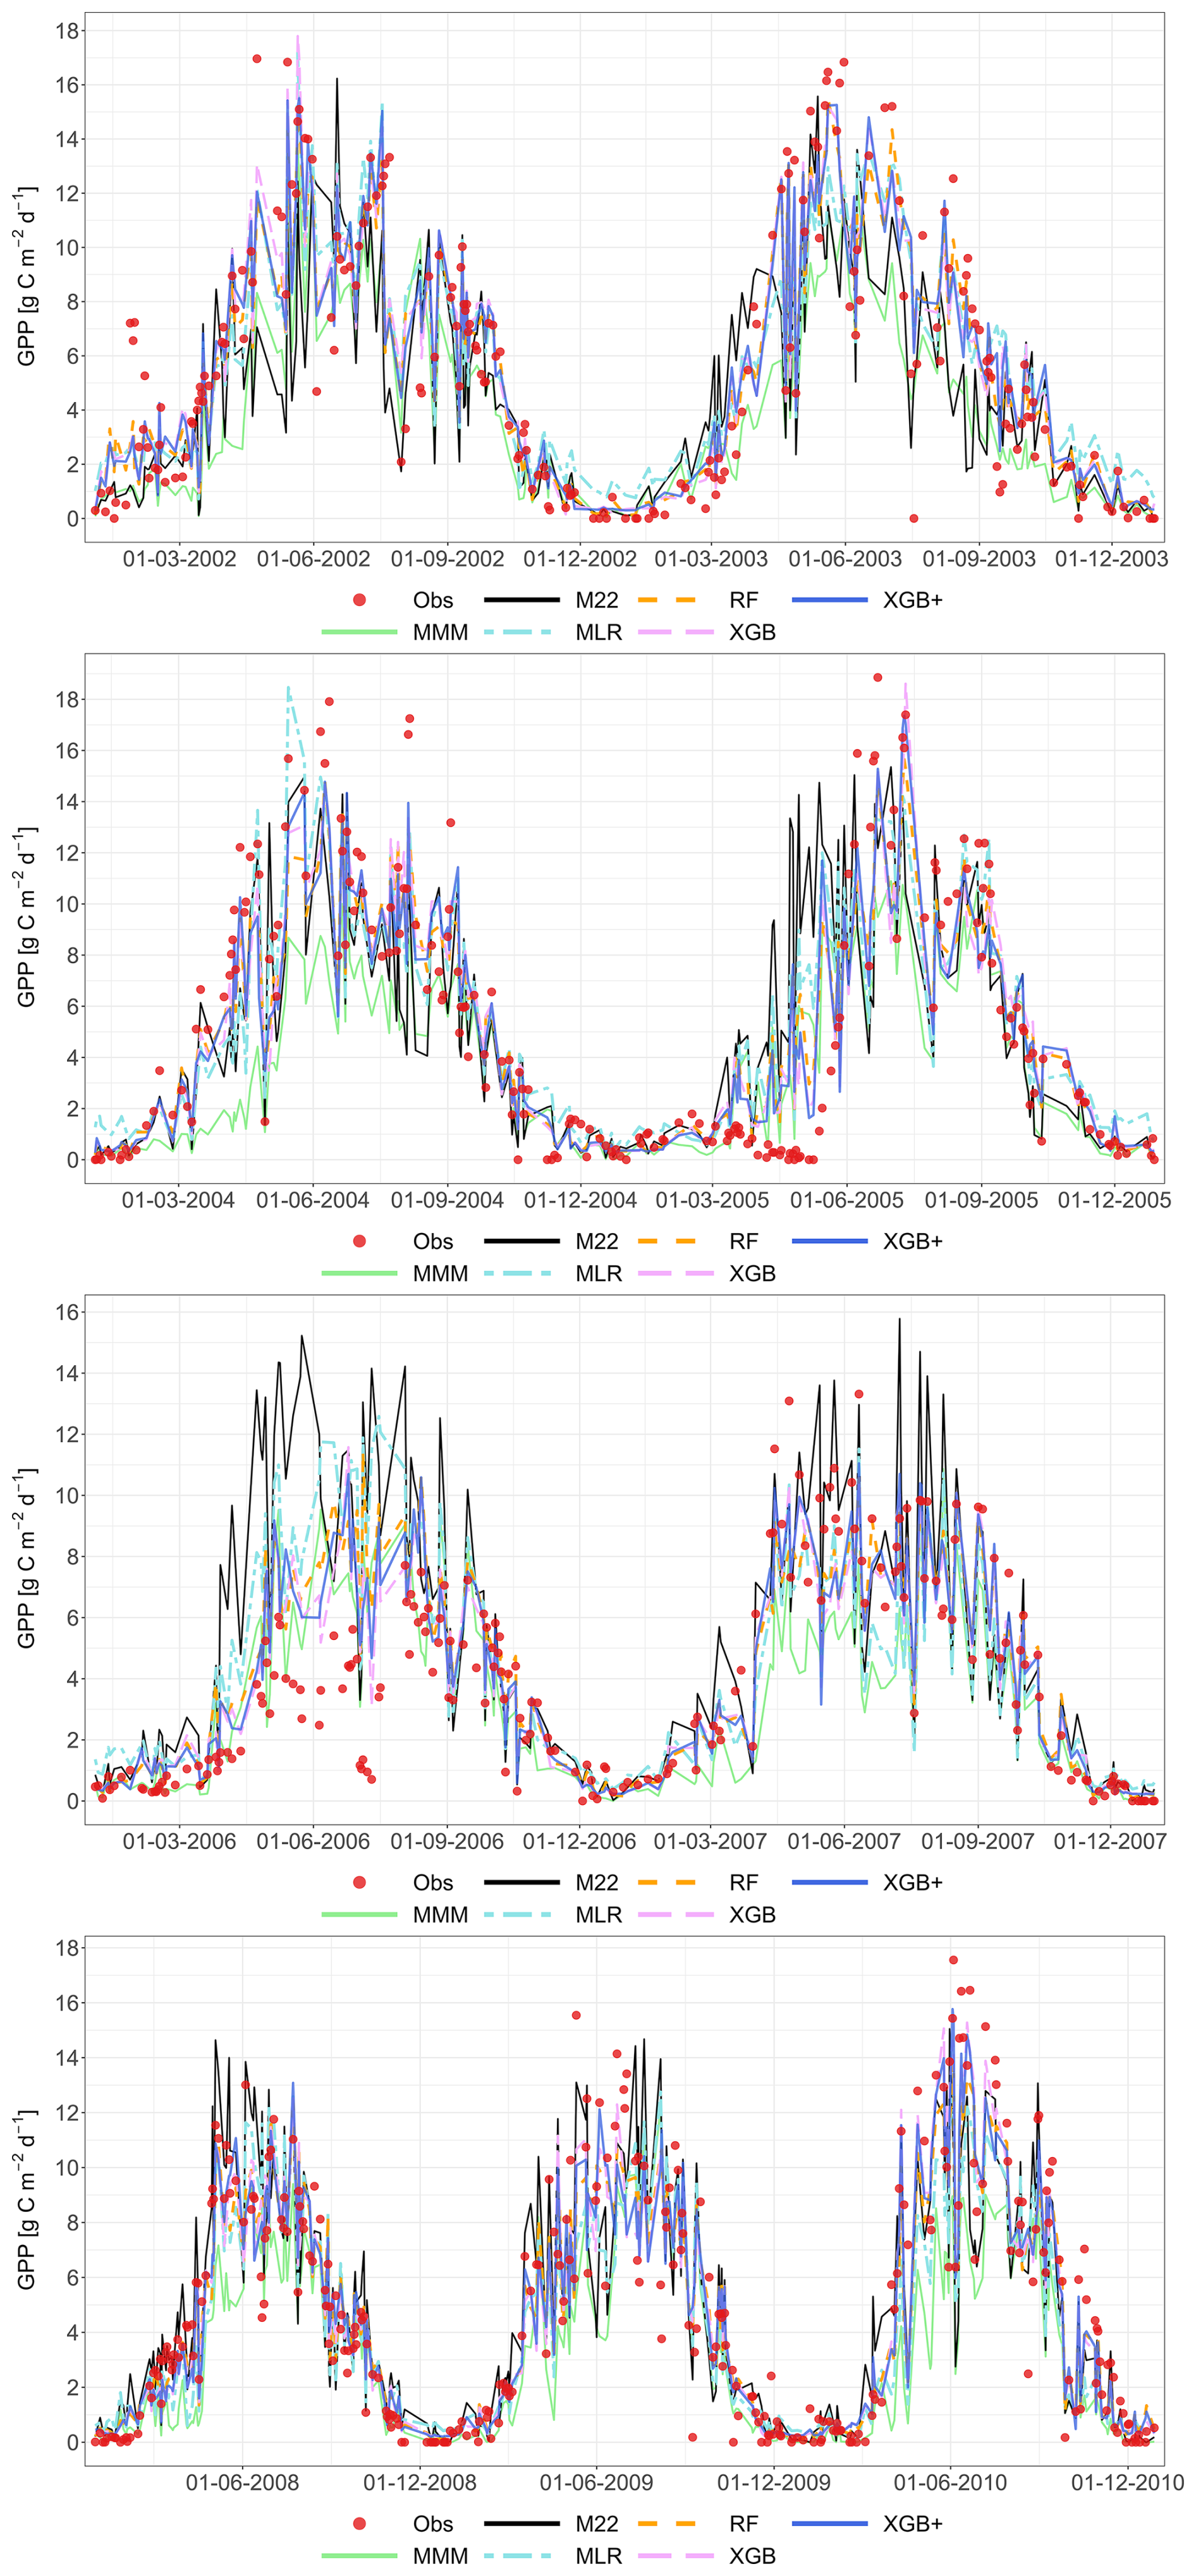
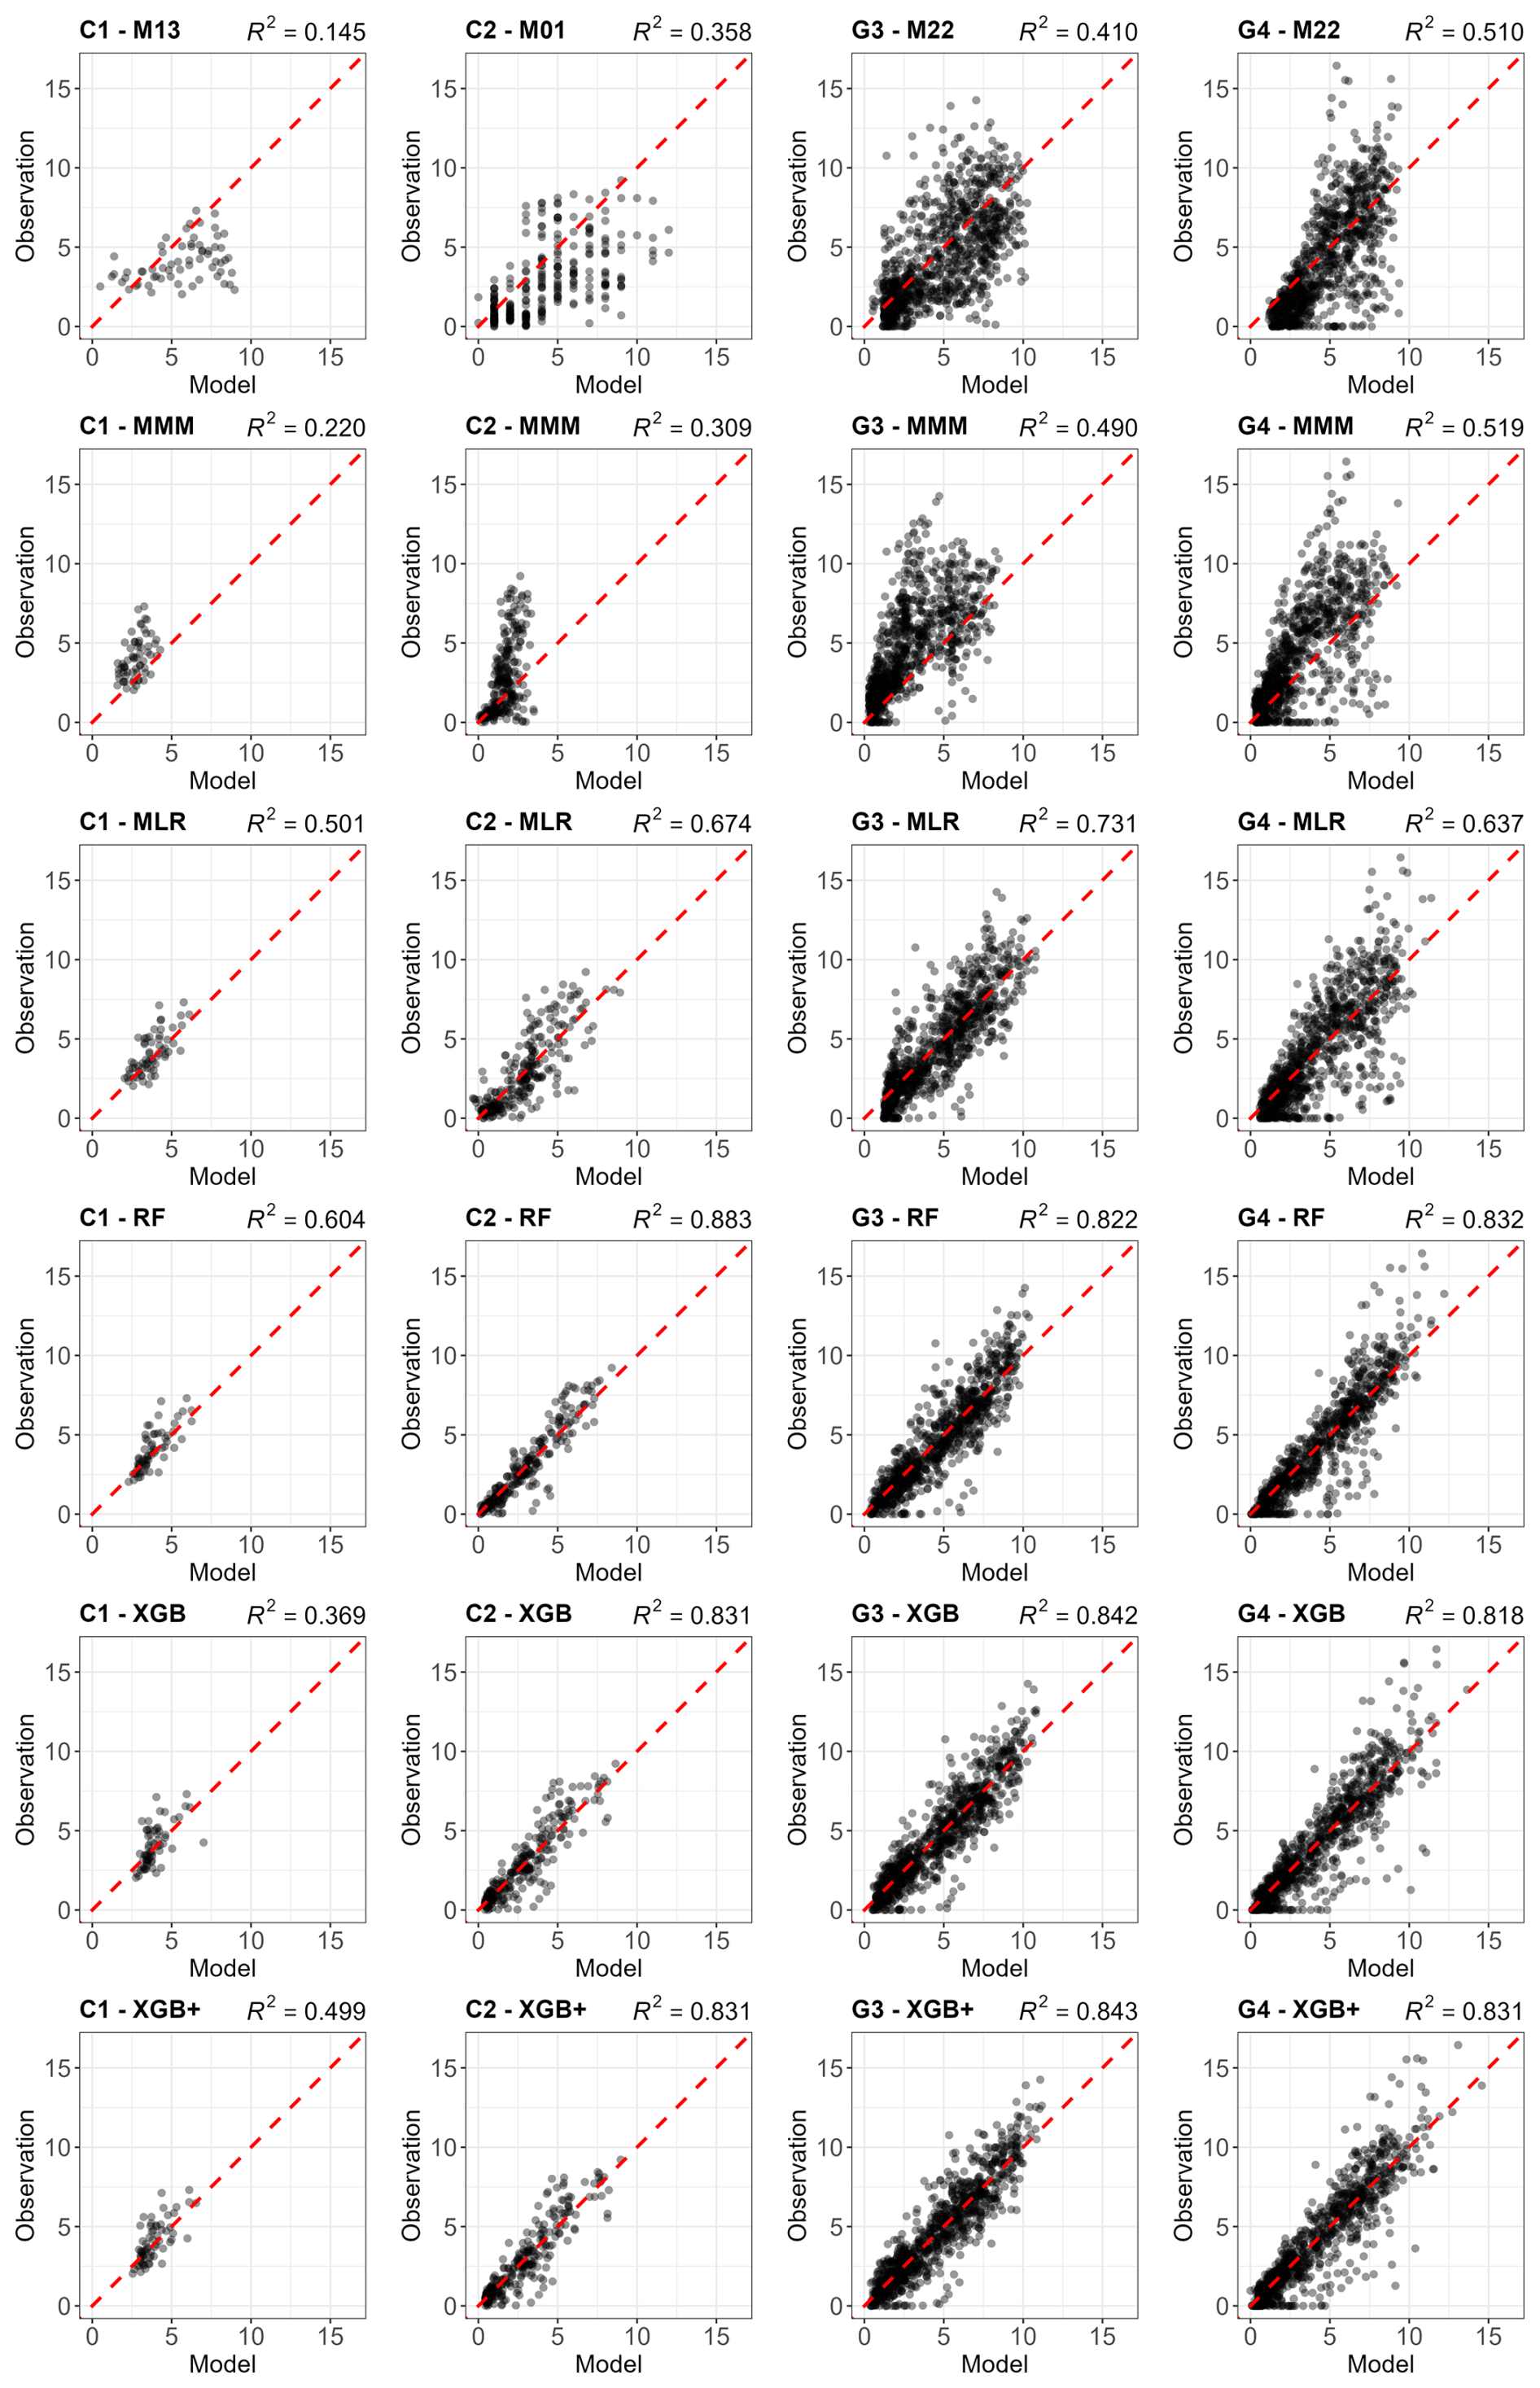
Figure A6Comparison of the best individual model, the multi-model median and the constructed meta-models with observations for RECO based on the approach. Each row represents a different model type, and columns correspond to the sites (from left to right: C1, C2, G3, and G4). The top row shows the best individual models with their identifiers (M13 at C1, M01 at C2, M22 at G3 and G4). The remaining rows show the MMM, MLR, RF, XGB and XGB+. All units are in g C m−2 d−1. The red dashed line represents the 1 : 1 relationship.
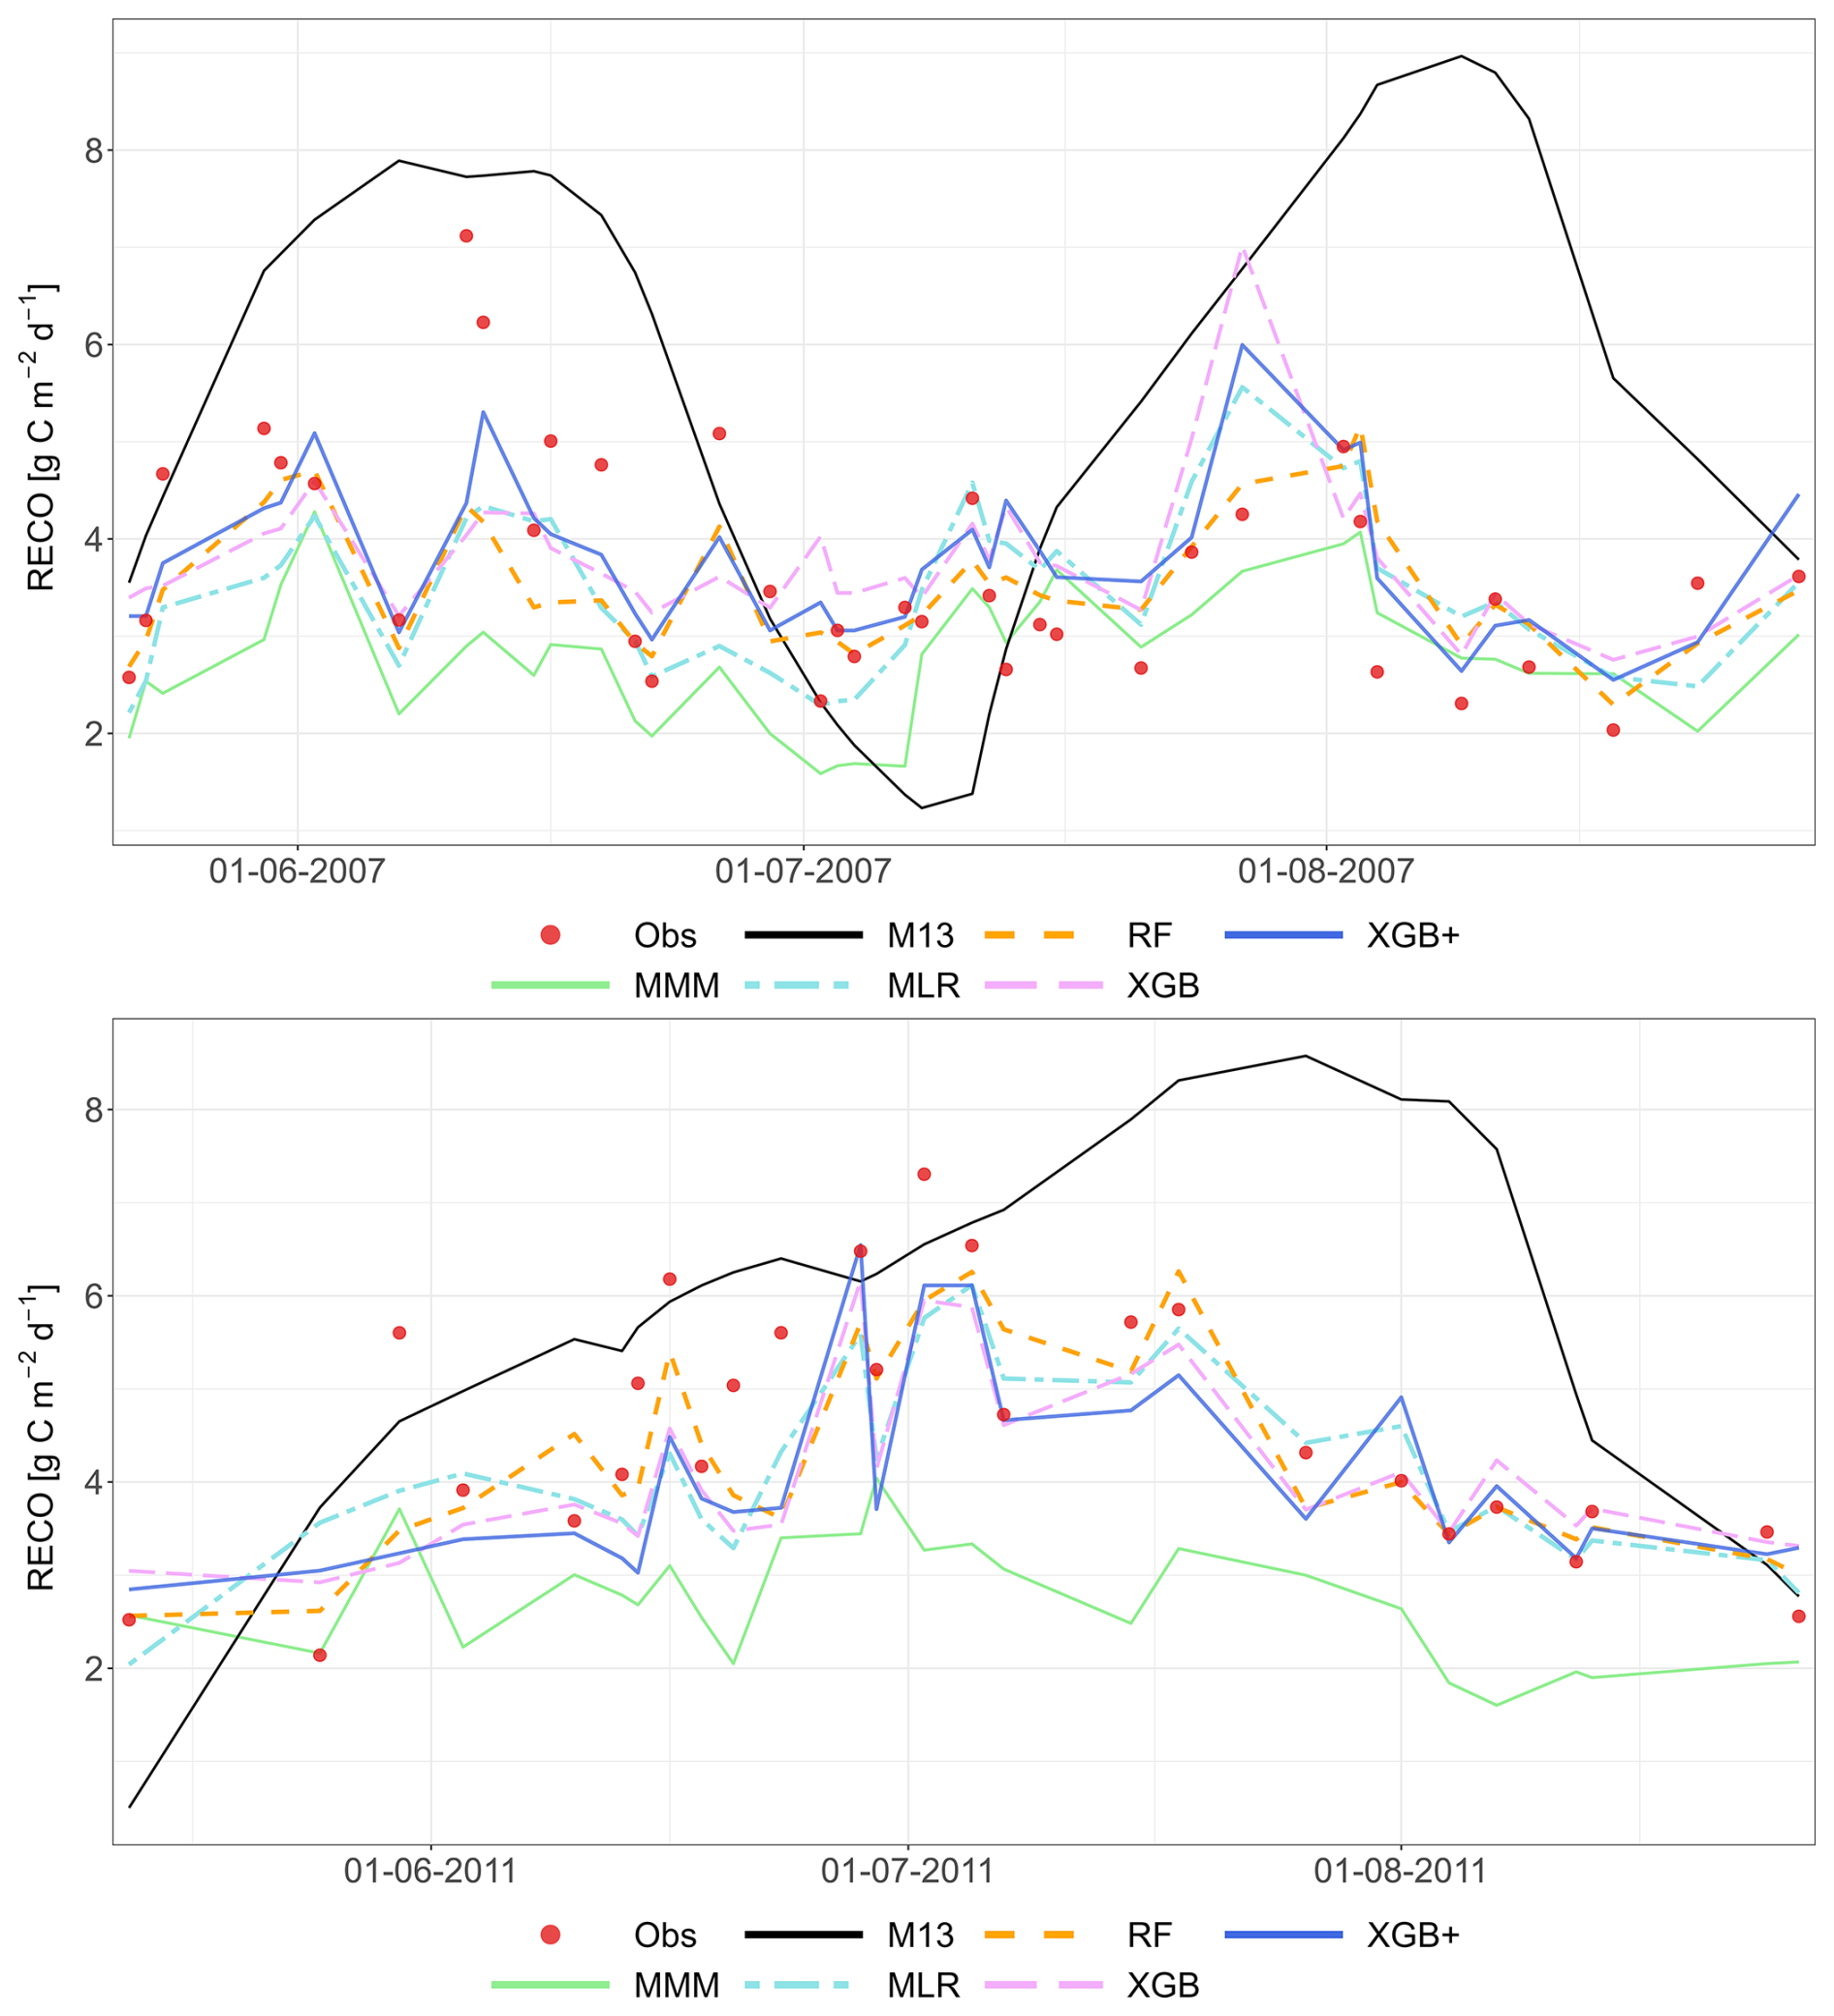
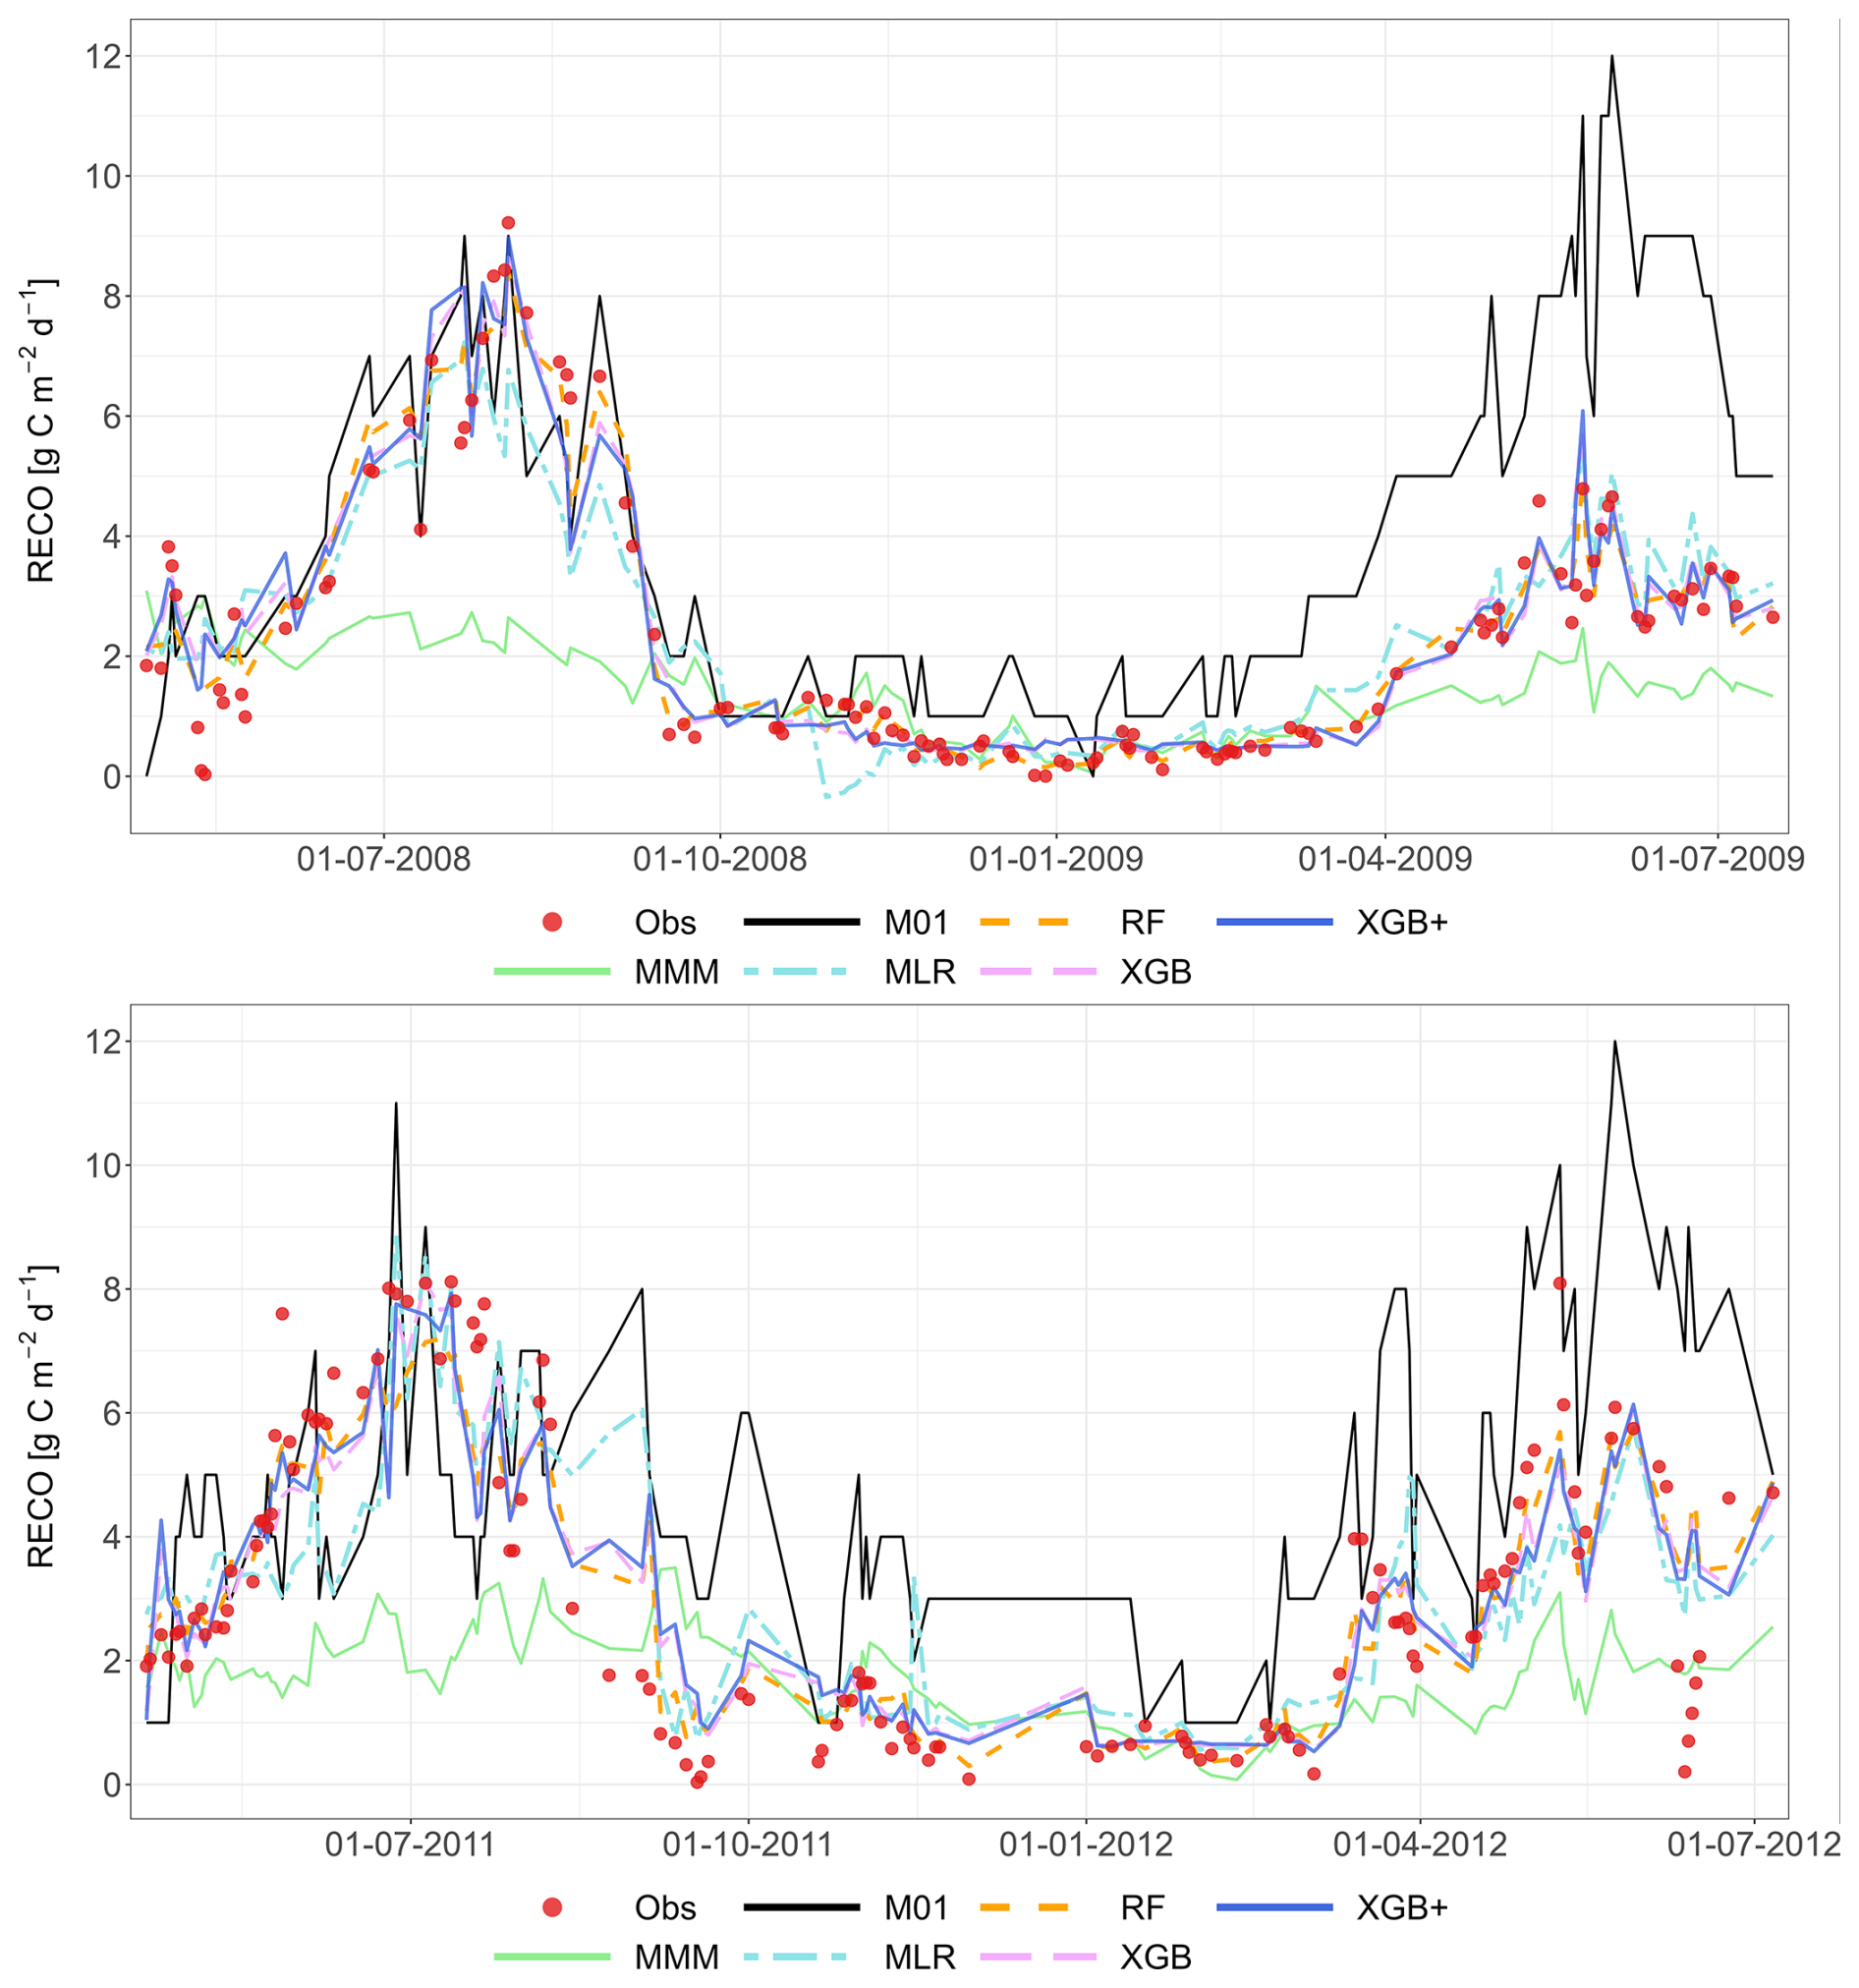
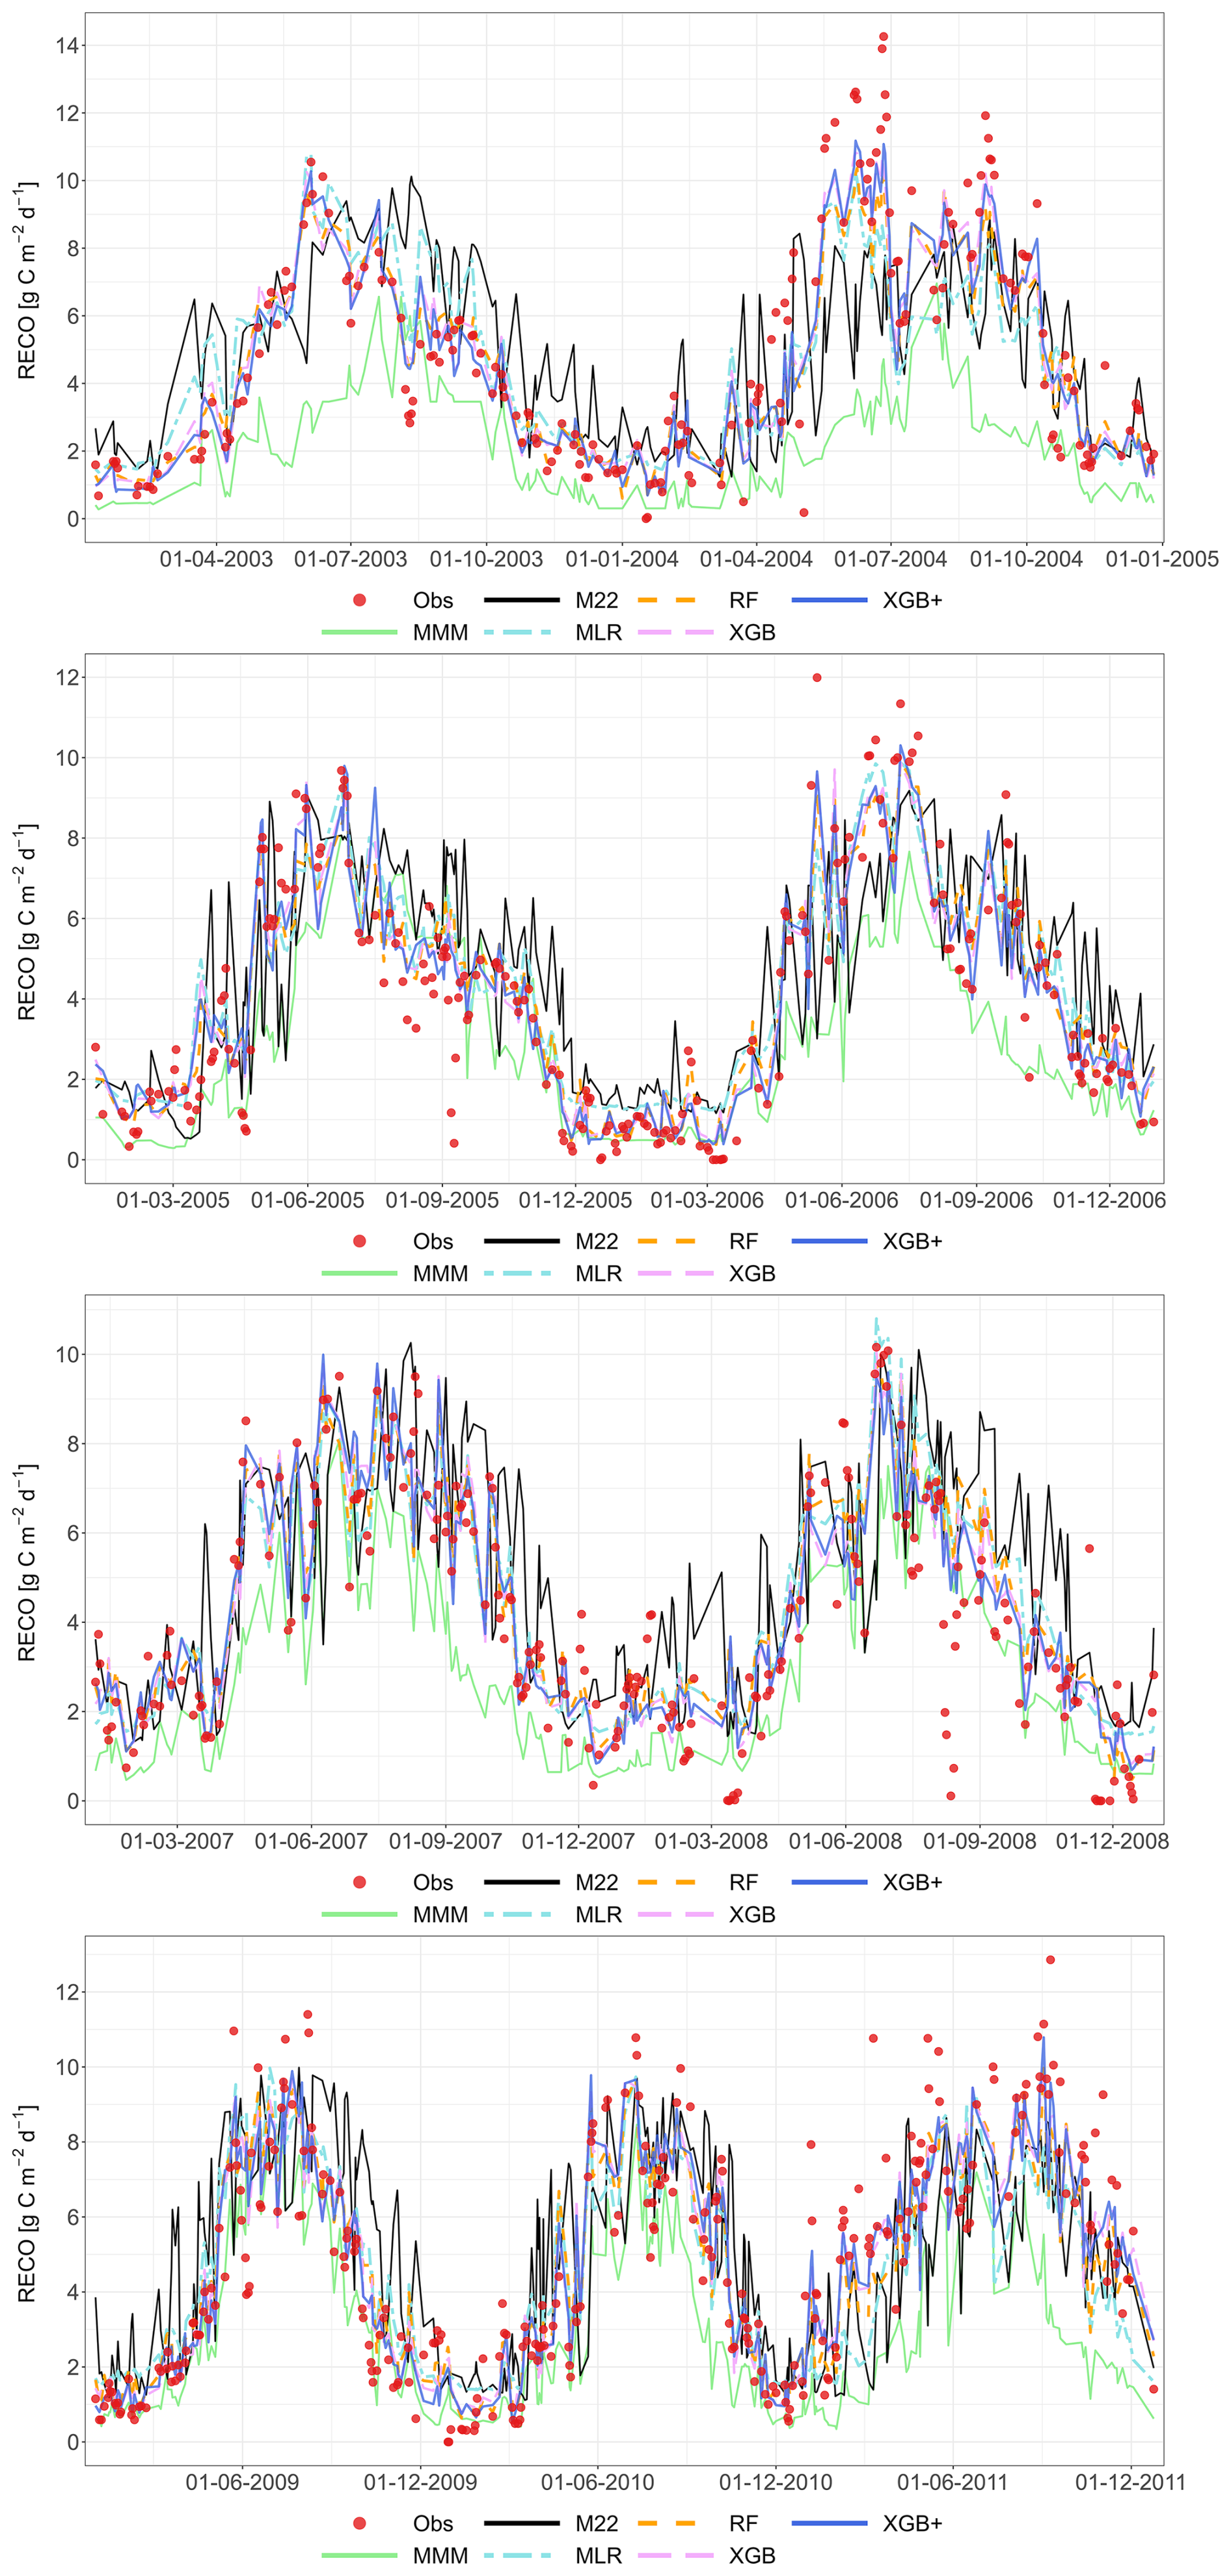
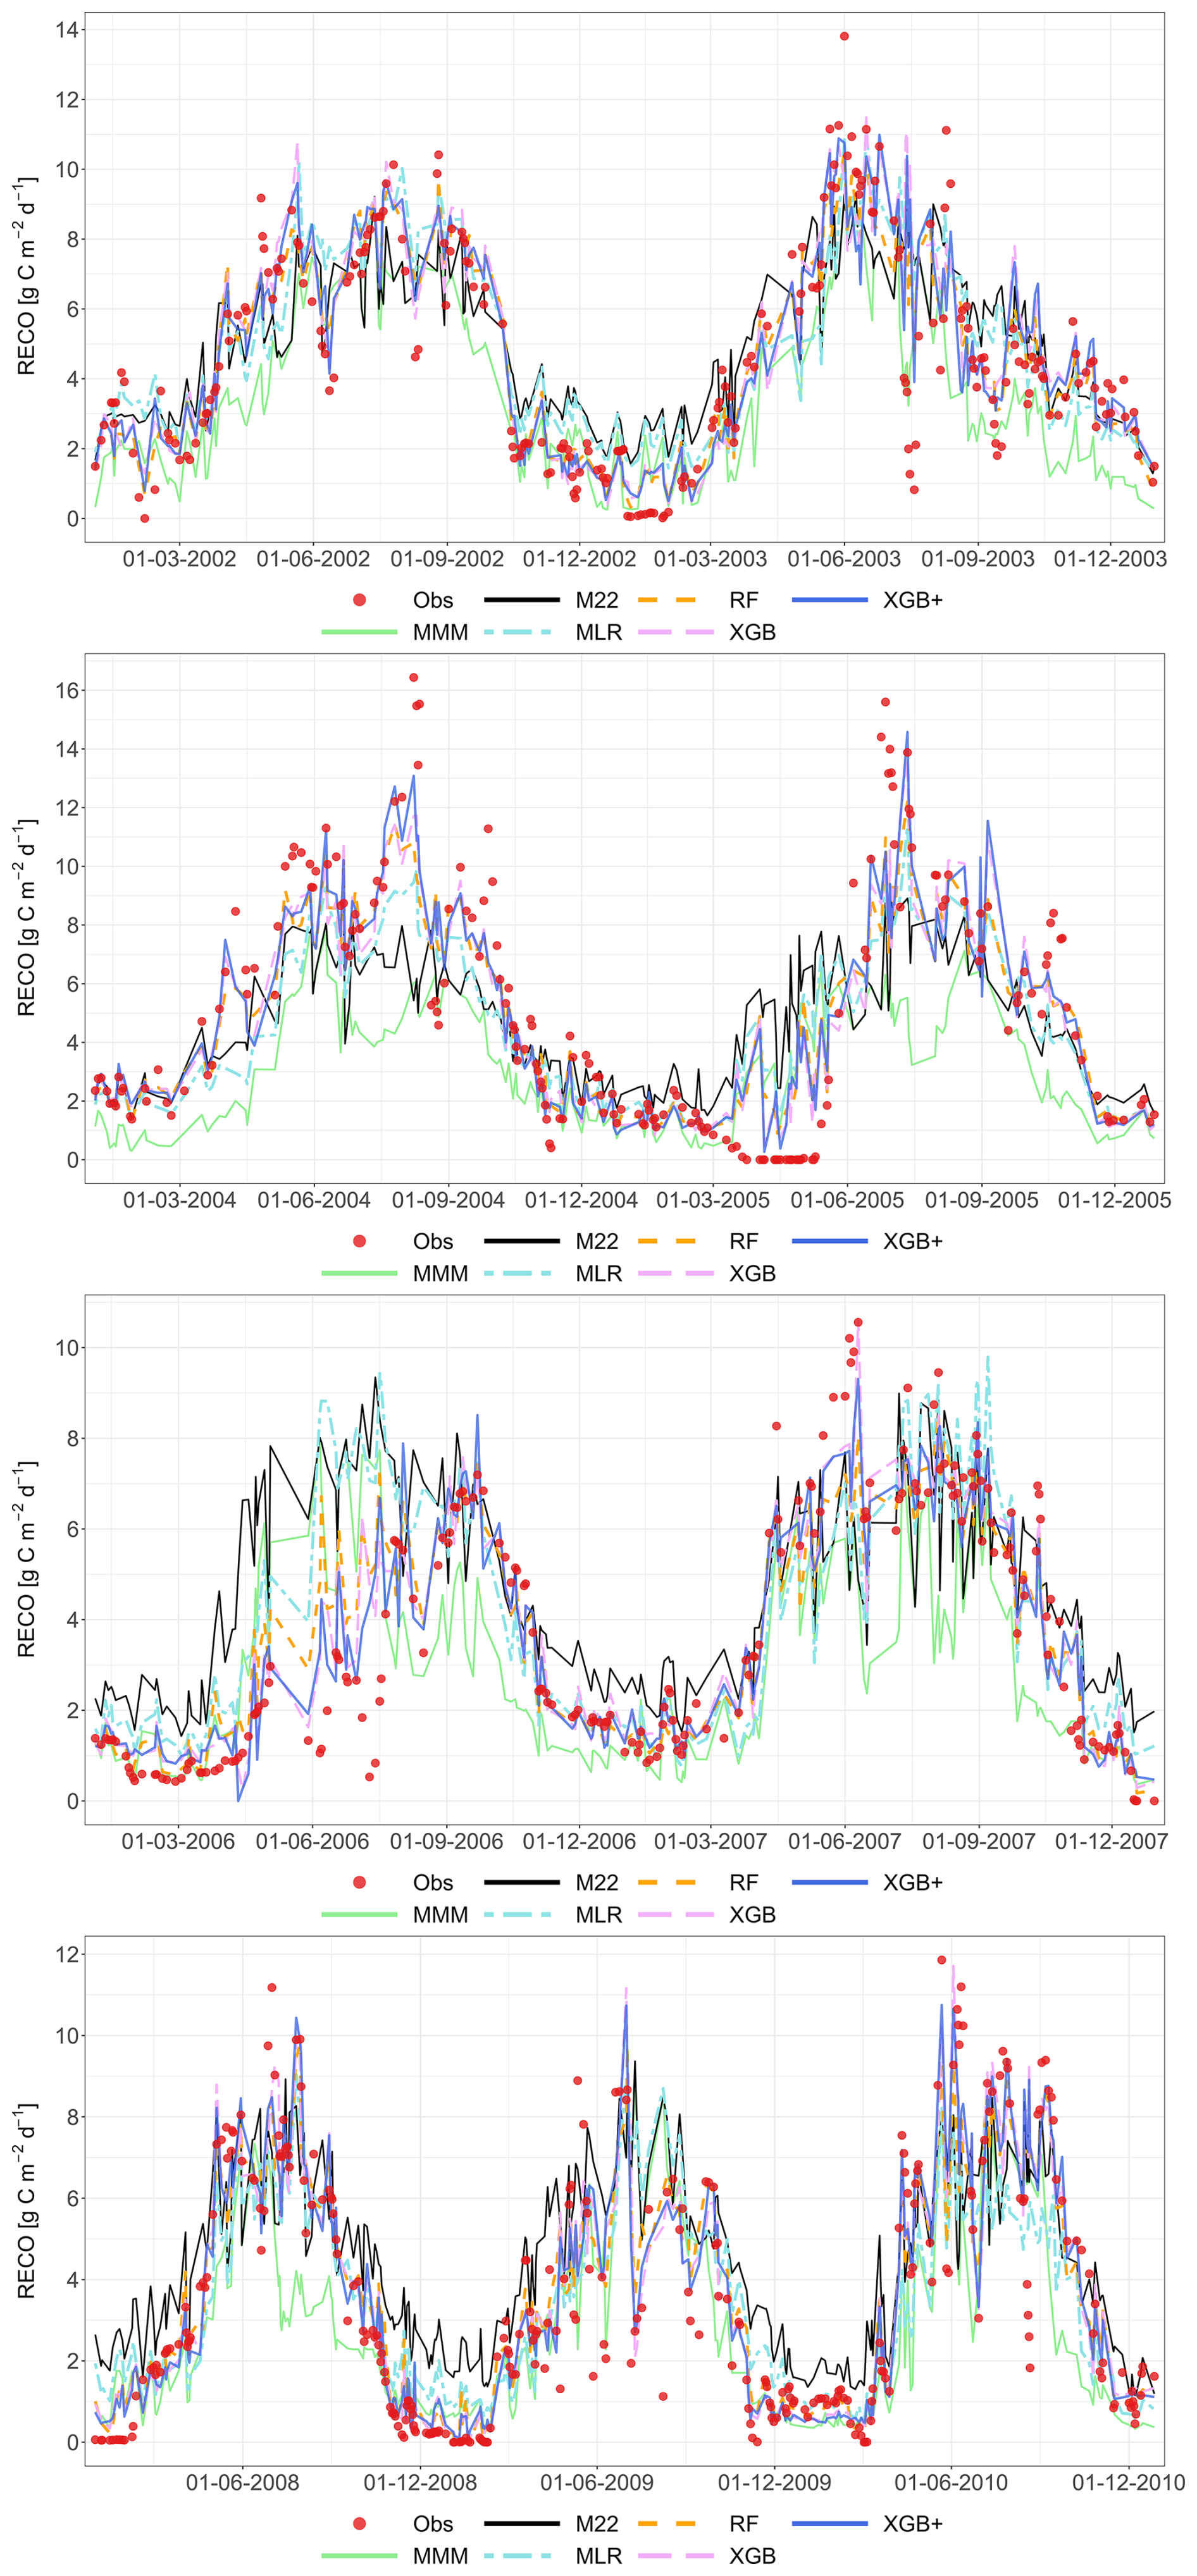
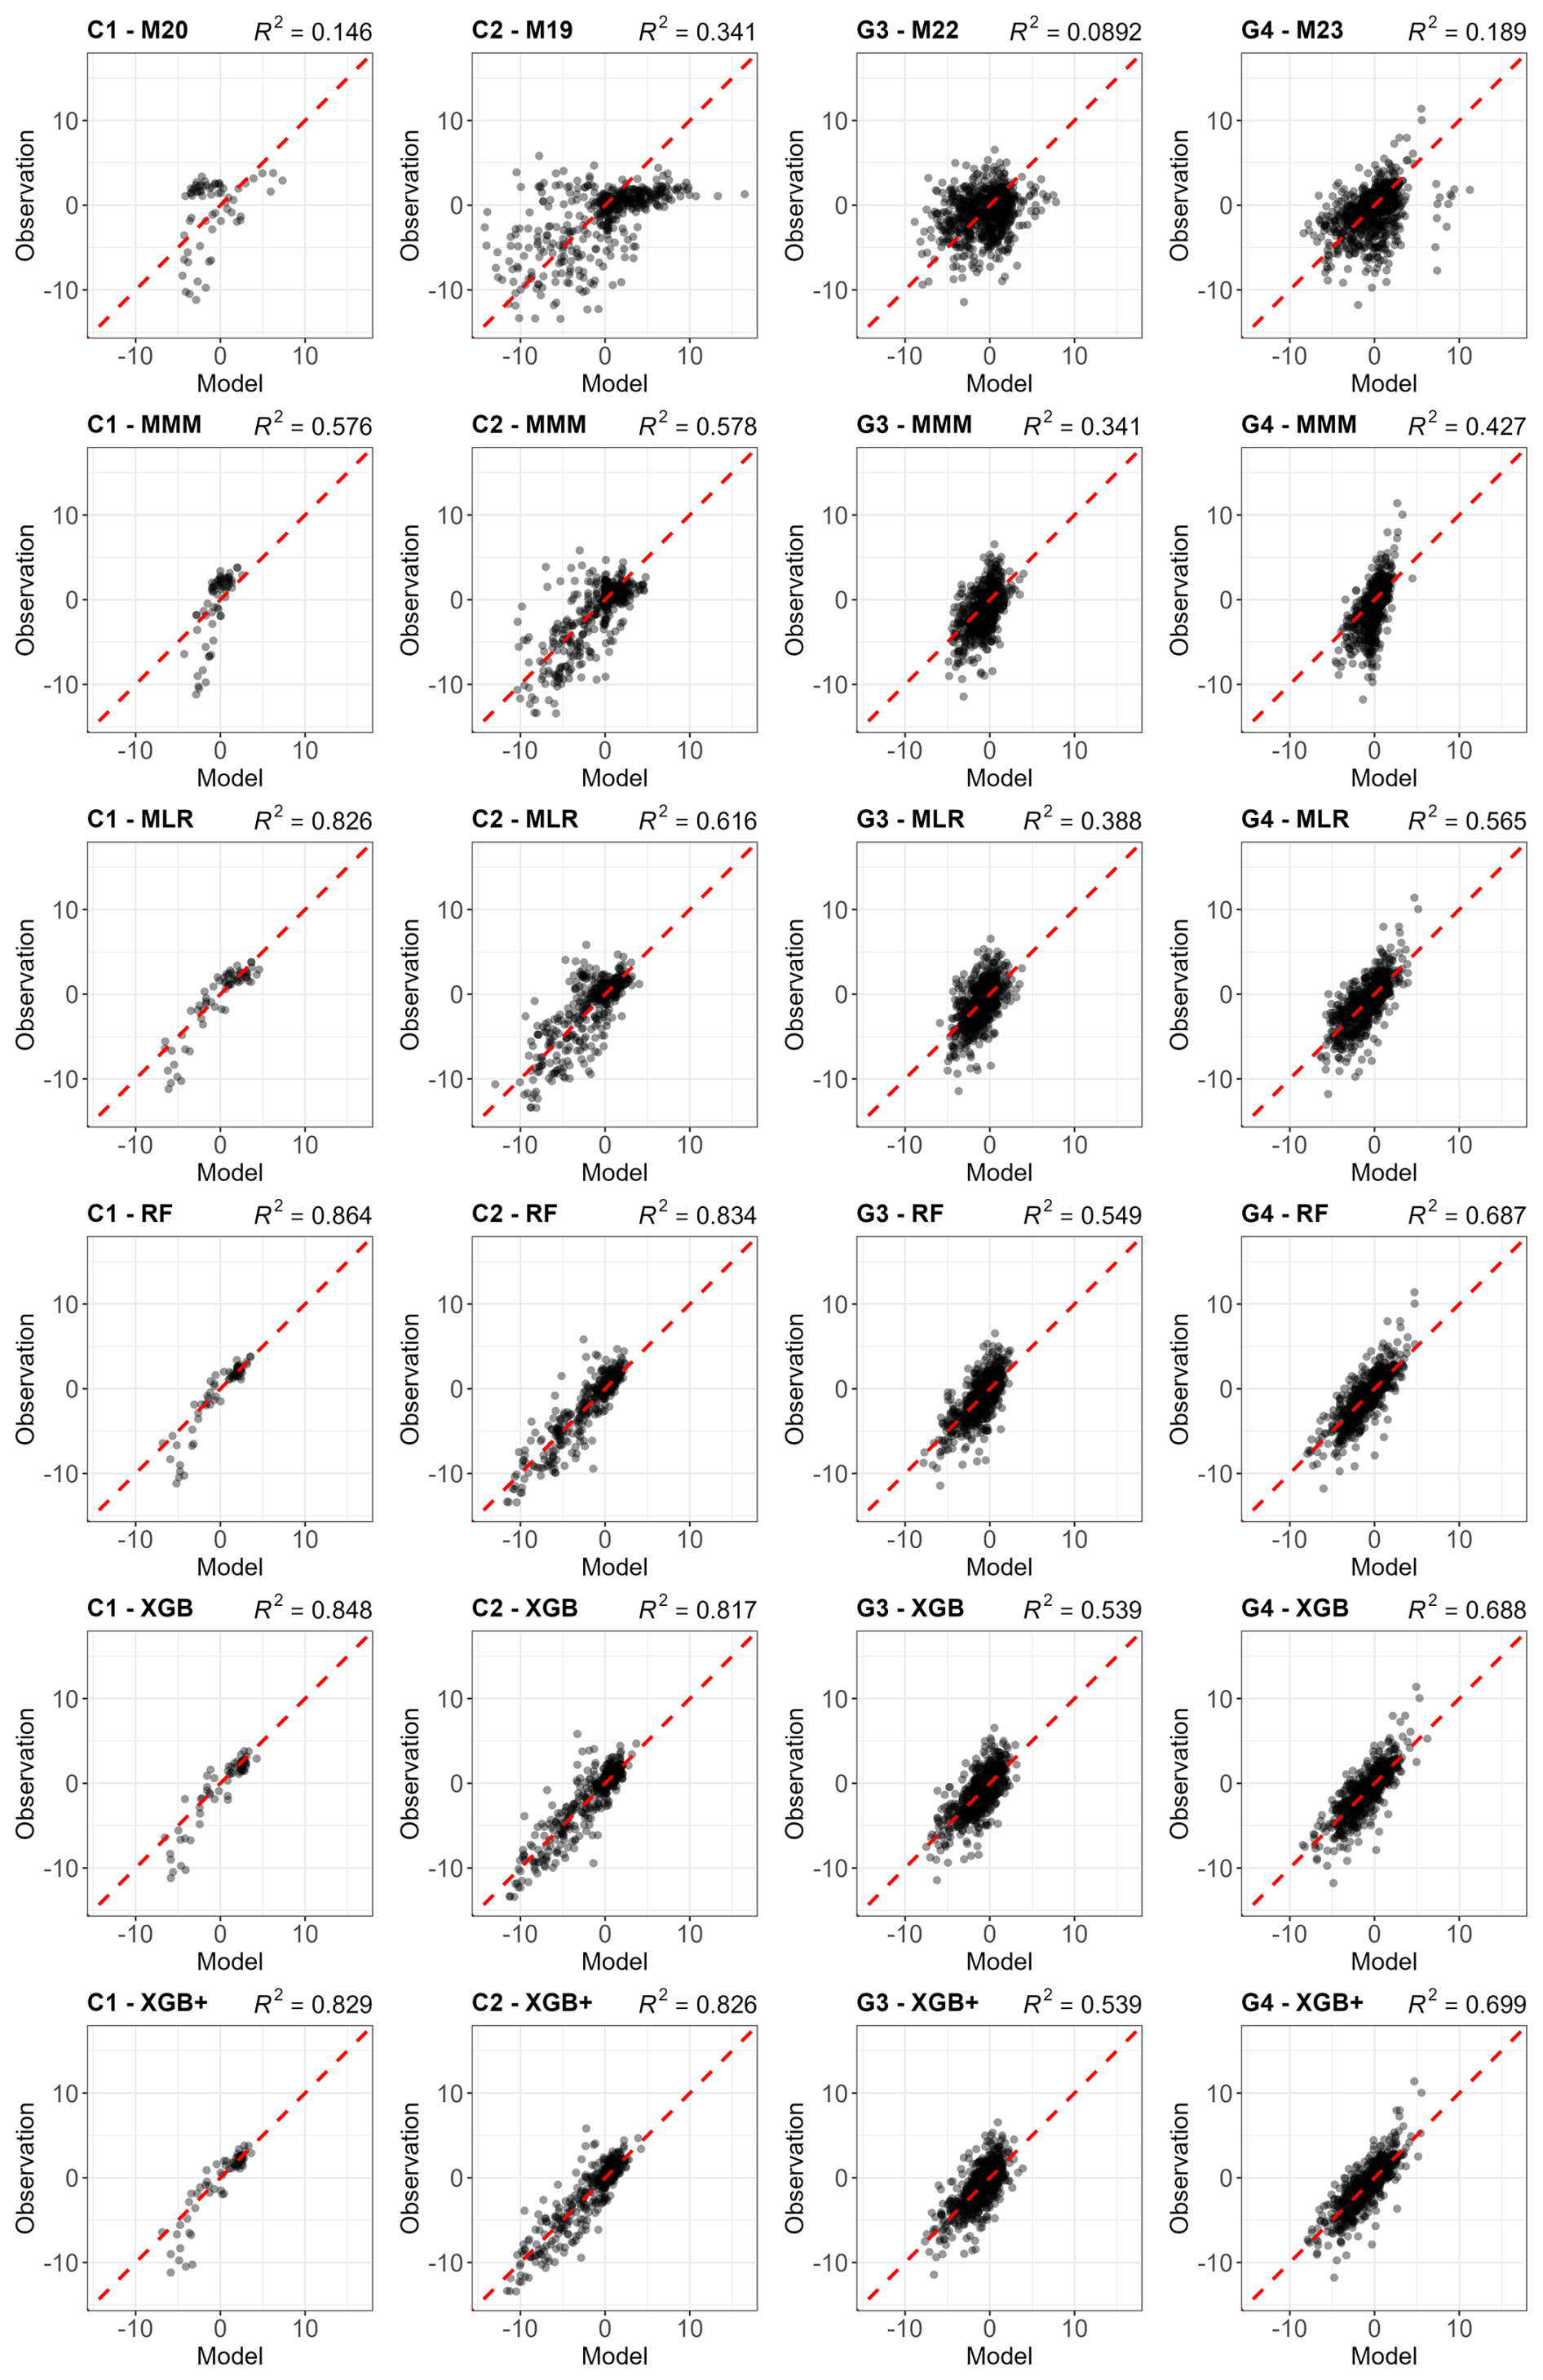
Figure A11Comparison of the best individual model, the multi-model median and the constructed meta-models with observations for NEE using the approach. Each row represents a different model type, and columns correspond to the sites (from left to right: C1, C2, G3, and G4). The top row shows the best individual models with their identifiers (M20 at C1, M19 at C2, M22 at G3, M23 at G4). The remaining rows show the MMM, MLR, RF, XGB and XGB+. All units are in g C m−2 d−1. The red dashed line represents the 1 : 1 relationship.
This appendix provides detailed information about the hyperparameter optimization procedure used for the XGBoost (XGB) and XGBoost-plus (XGB+) meta-models described in the main manuscript. Both model variants use identical hyperparameter ranges and optimization procedures, differing only in their input features: XGB uses only process-based model predictions, while XGB+ additionally incorporates meteorological variables.
B1 Optimization Methodology
Hyperparameter optimization was performed using random search with 50 evaluations per model. For each evaluation, seven hyperparameters were randomly sampled from predefined ranges (Table B1): learning rate (eta), maximum tree depth (max_depth), row and column sampling ratios (subsample and colsample_bytree), minimum child weight (min_child_weight), and L1 and L2 regularization terms (alpha and lambda).
Each parameter combination was evaluated using an internal 80/20 split of the training data, ensuring that test data were never used during hyperparameter selection. Models were trained for up to 1000 boosting rounds with early stopping: training terminated if validation RMSE did not improve for 20 consecutive rounds. The hyperparameter set achieving the lowest validation RMSE was selected, and the final model was retrained on the full training data using the optimal number of rounds determined during tuning.
This optimization procedure was performed independently for each combination of site (C1, C2, G3, G4), variable (GPP, NEE, RECO), and Leave-One-Year-Out cross-validation fold, resulting in 148 optimized models. The random search was parallelized across 15 CPU cores to improve computational efficiency.
Table B1Hyperparameter search ranges for XGBoost models.
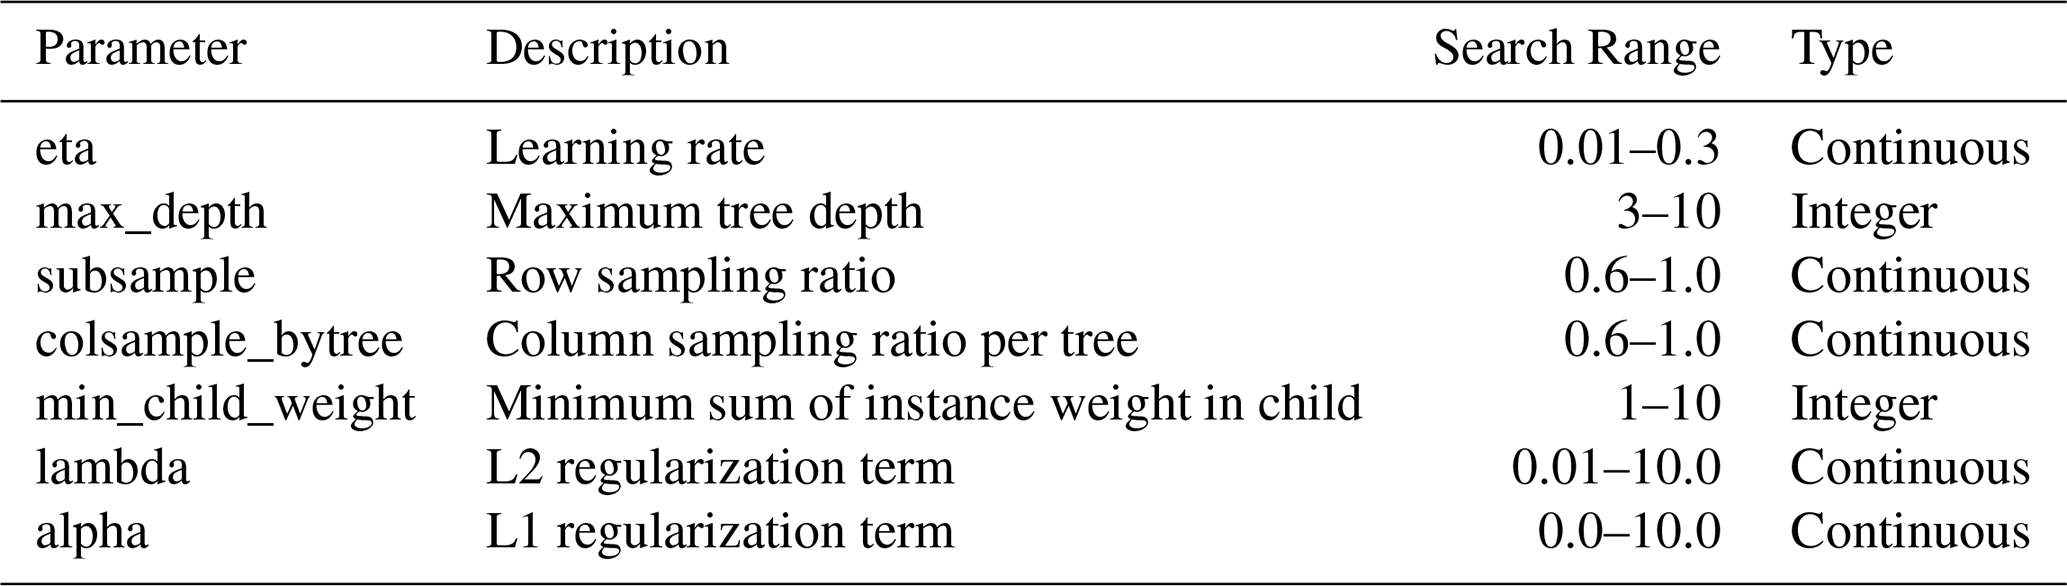
Note: All continuous parameters were sampled uniformly from the specified ranges; integer parameters were sampled uniformly from discrete values within the range.
B2 Selected Hyperparameter Values
Table B2 summarizes the hyperparameter values selected by the optimization process across all 148 trained models. The typical values (medians) generally fall in the middle of the search ranges, indicating effective exploration of the parameter space. Most models trained for the full 1000 rounds (typical value: 1500, after the internal tuning phase), suggesting that the early stopping criterion was rarely triggered and models benefited from extensive training.
Table B2Selected hyperparameter values across all XGB and XGB+ models.
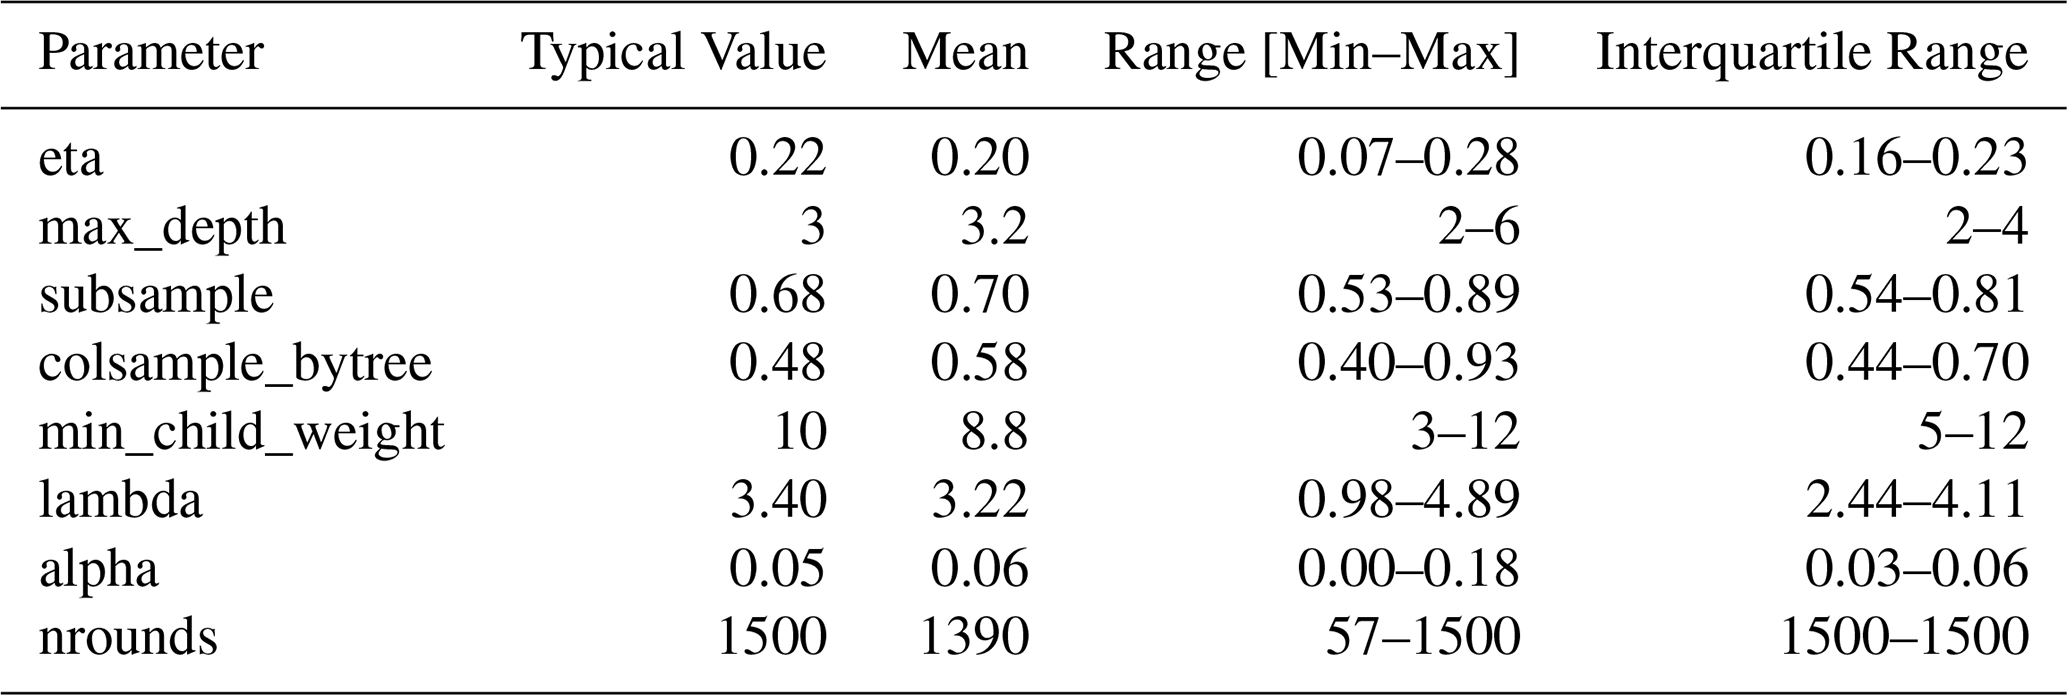
Note: Summary statistics based on 148 trained models: 4 sites × 3 variables (GPP, NEE, RECO) × 2–9 LOYO folds per site × 2 model types (XGB and XGB+). “Typical Value” represents the median across all models. The nrounds value is the actual number of boosting rounds used after early stopping (maximum was 1000).
B3 Variable-Specific Hyperparameter Patterns
Table B3 shows the selected hyperparameter values separately for each target variable. Notable differences emerge: GPP predictions favour shallower trees (typical depth =2) with higher column sampling (0.75), NEE uses intermediate complexity (depth =3), while RECO employs deeper trees (depth =5) with lower column sampling (0.43). These patterns suggest that the optimization procedure successfully adapted model complexity to the characteristics of each target variable.
Table B3Selected hyperparameter values by target variable.
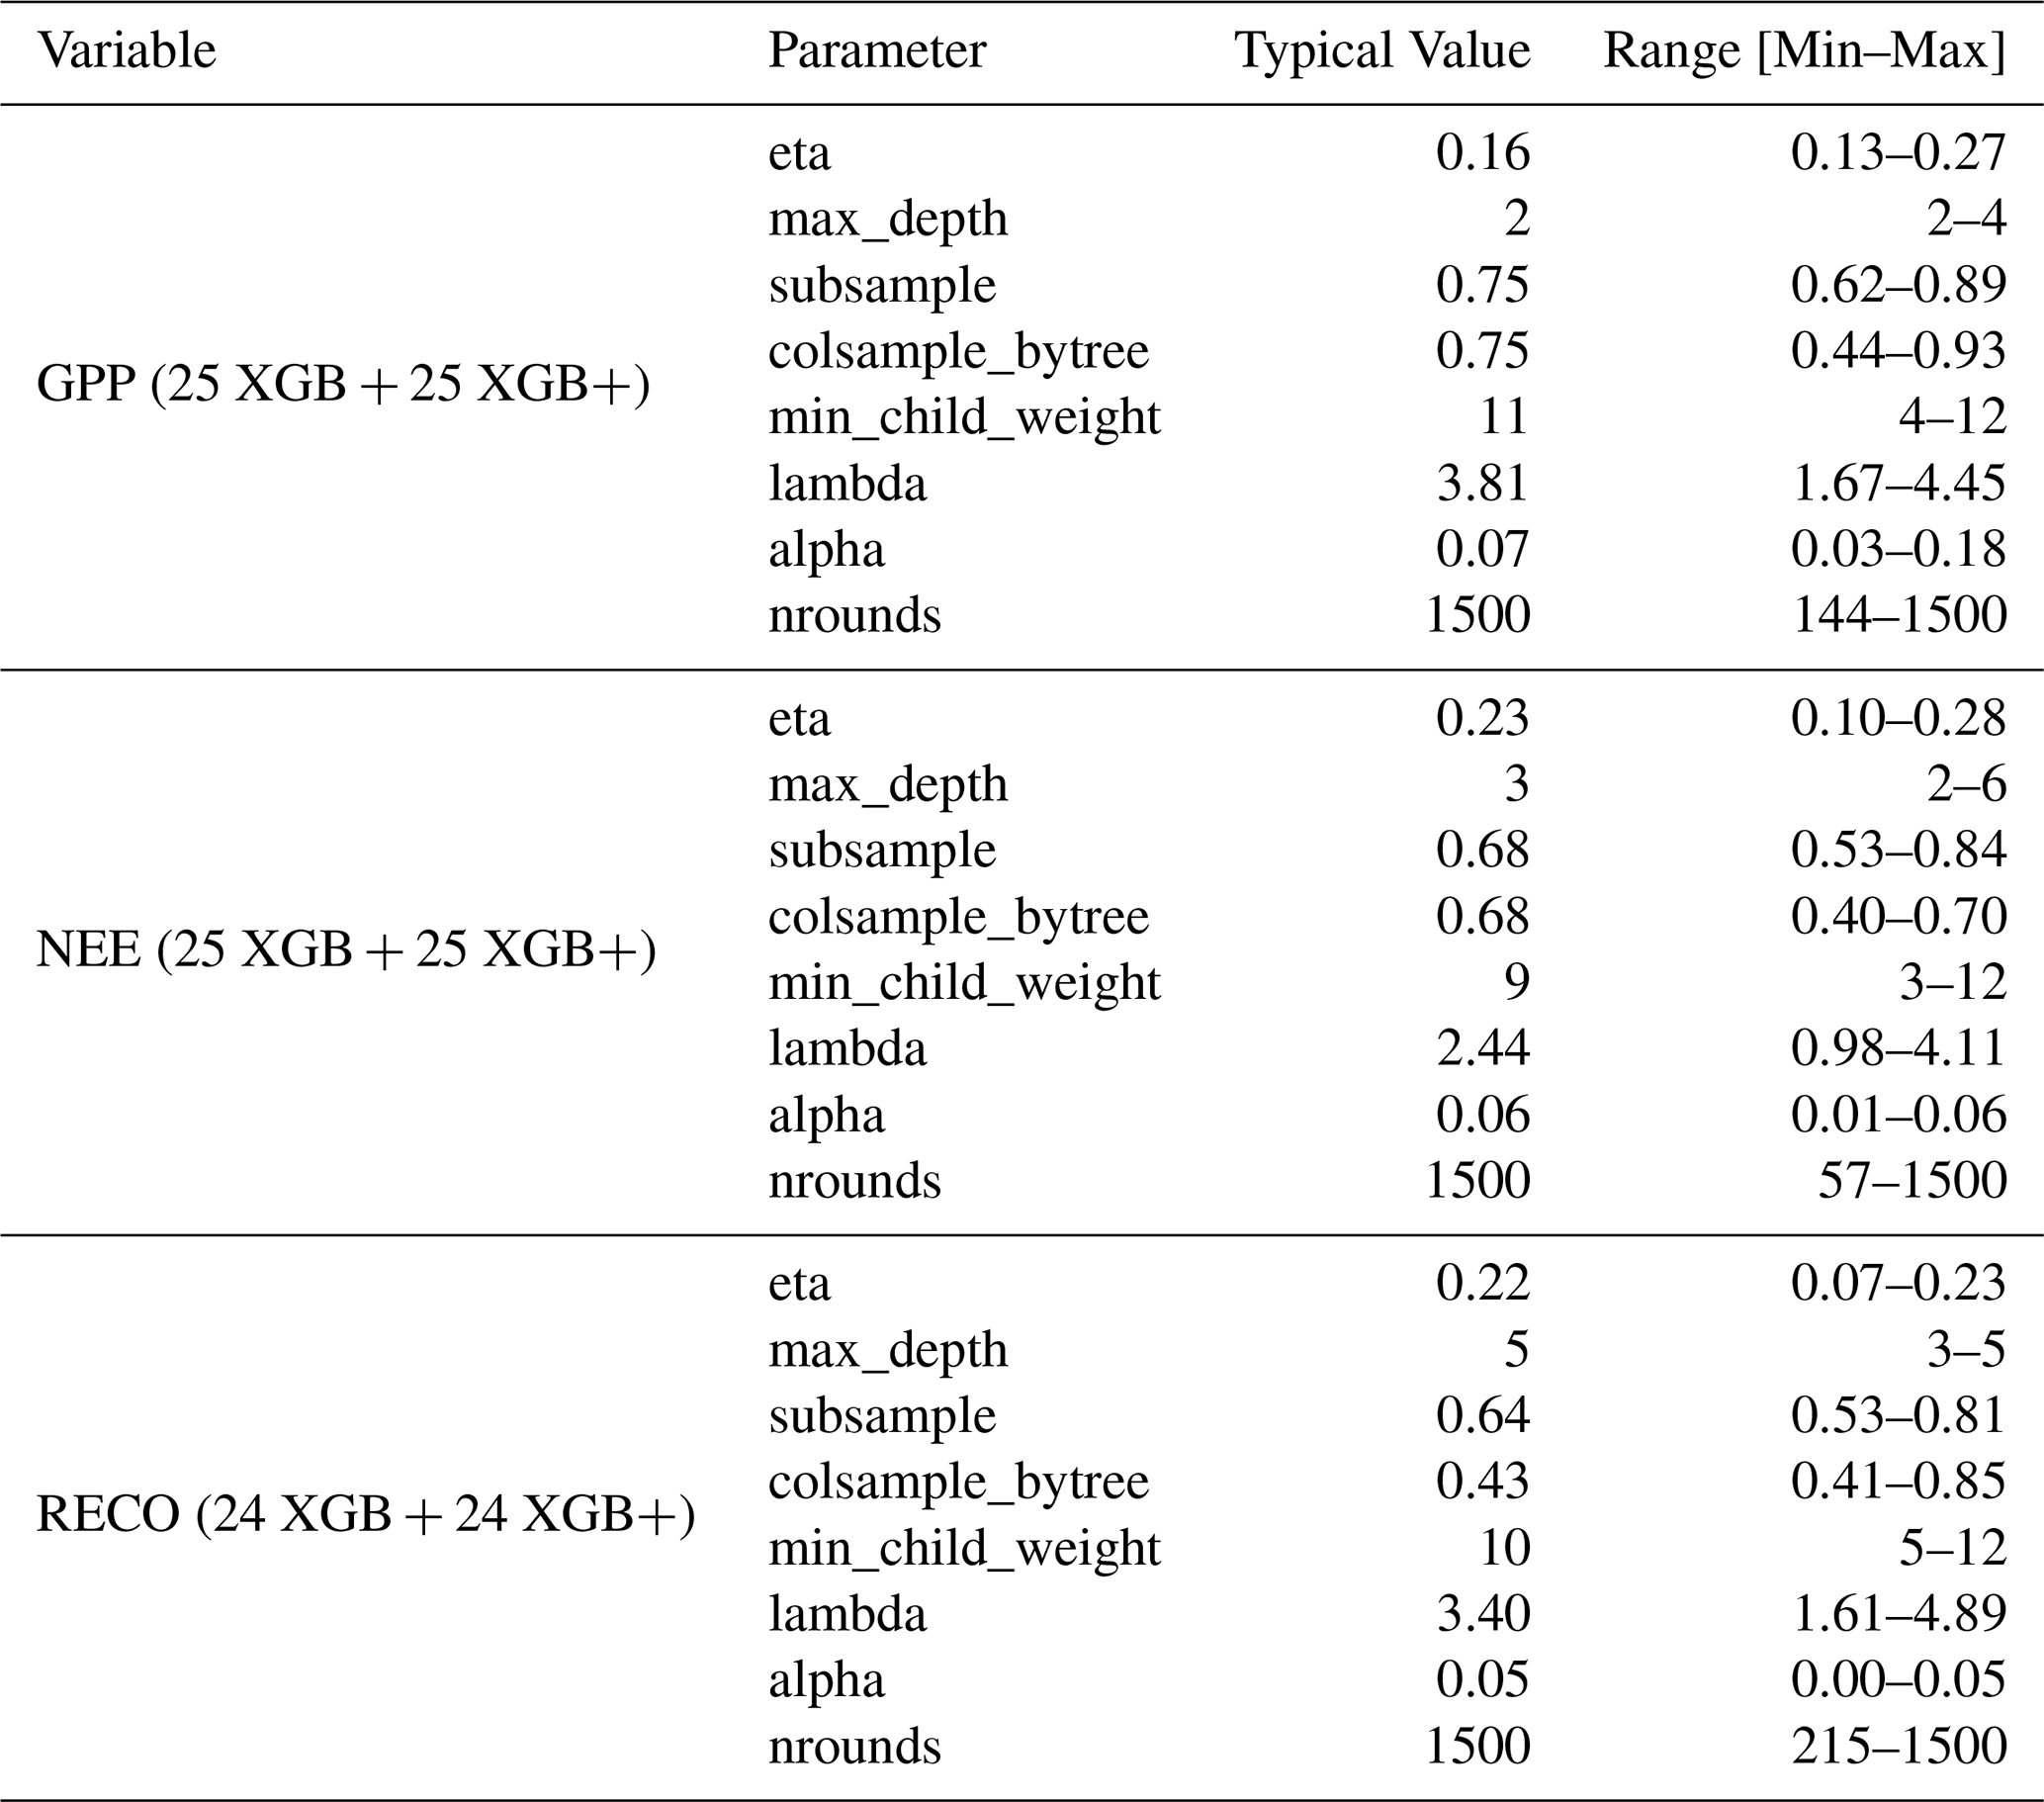
Note: Each site-variable-fold combination has 2 models (XGB and XGB+). Number of LOYO folds per site: C1 =2, C2 =5, G3 =9, G4 =9. Total expected: () × 3 variables × 2 models =150 models. The actual count of 148 models indicates 2 RECO models were not successfully trained.
B4 Fixed XGBoost Parameters
In addition to the optimized hyperparameters, several XGBoost parameters were held constant across all models (Table B4). These included the objective function (squared error regression), evaluation metric (RMSE), tree construction method (exact greedy algorithm), and early stopping criterion (20 rounds without improvement).
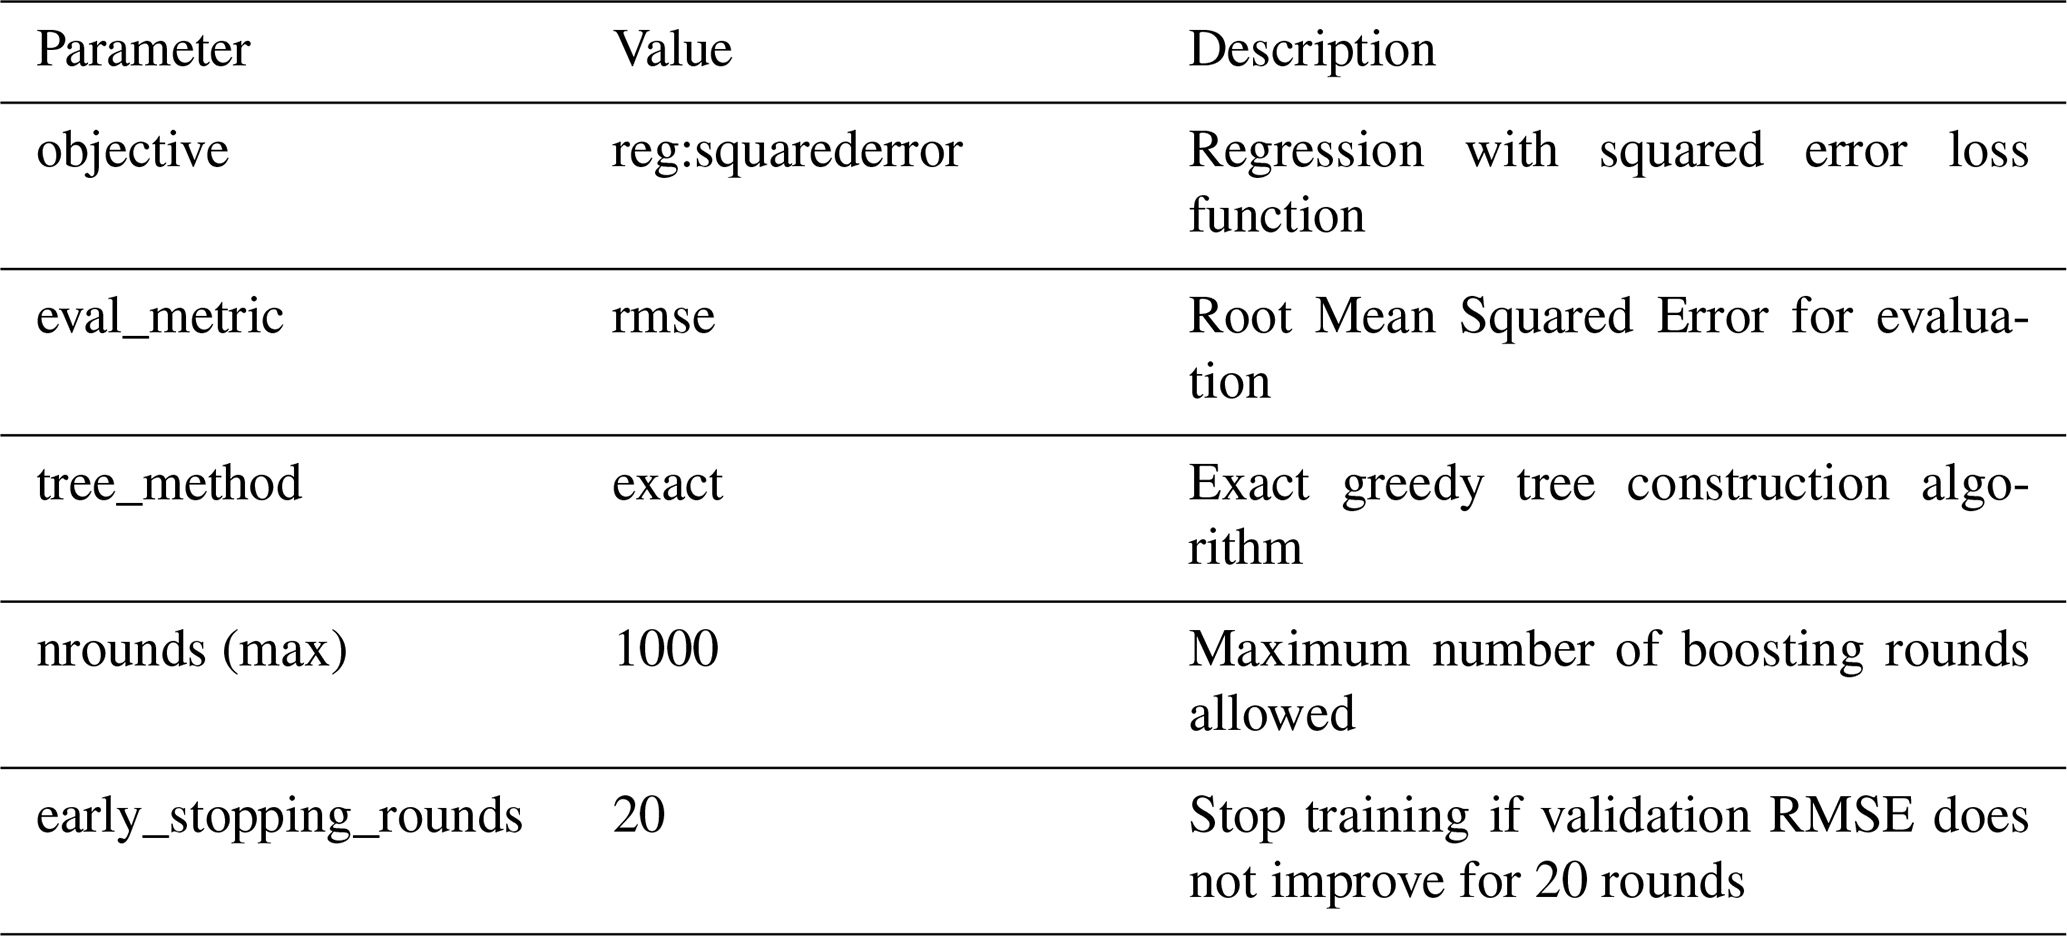
The exact versions of the R scripts used to produce the results presented in this paper are available from the GitHub repository: https://github.com/hollorol/metamodeling_of_c (last access: 1 October 2025; Hollós and Zrinyi, 2025) under the GPL-3 licence, also at Zenodo: https://doi.org/10.5281/zenodo.17849931. The input data used to produce the results presented in this paper is archived on the Harvard Dataverse repository (Bellocchi et al., 2025) under https://doi.org/10.7910/DVN/5TO4HE.
RH: Methodology, Conceptualization, Visualization, Writing (original and revised draft preparation). NZ: Software, Visualization, Writing (original and revised draft preparation). ZB: Methodology, Writing (original and revised draft preparation). GB: Methodology, Writing (original and revised draft preparation), Supervision. RS: Data curation, Validation. JR: Conceptualization, Formal analysis. NF: Funding acquisition, Resources, Project administration, Writing (original and revised draft preparation).
The contact author has declared that none of the authors has any competing interests.
Publisher's note: Copernicus Publications remains neutral with regard to jurisdictional claims made in the text, published maps, institutional affiliations, or any other geographical representation in this paper. The authors bear the ultimate responsibility for providing appropriate place names. Views expressed in the text are those of the authors and do not necessarily reflect the views of the publisher.
The present article was published under the auspices of the MACSUR (Modelling European Agriculture with Climate Change for Food Security) Science-Policy Knowledge Forum (MACSUR SciPol Pilot, June 2021–December 2022, and MACSUR SciPolNet, May 2024–April 2026), with the support of the INRAE metaprogramme “Climate change in agriculture and forests: Adaptation and mitigation” (CLIMAE) and INRAE's Public Policy-Support Directorate (DAPP). It falls within the thematic area of the French government IDEX-ISITE initiative (reference: 16-IDEX-0001; project CAP 20-25). This work has been partly implemented by the National Multidisciplinary Laboratory for Climate Change (RRF-2.3.1-21-2022-00014) project within the framework of Hungary's National Recovery and Resilience Plan supported by the Recovery and Resilience Facility of the European Union. This work was also supported by the National Research, Development and Innovation Office, Hungary (project ID: ADVANCED_24 150795). Also supported by the FK 131813 project, implemented with support provided by the National Research, Development and Innovation Fund of Hungary, financed under the FK_19 funding scheme. Also supported by the TKP2021-NVA-29 project of the Hungarian National Research, Development and Innovation Fund, with the support provided by the Ministry of Culture and Innovation of Hungary.
Also supported by the “Advanced methods of greenhouse gases emission reduction and sequestration in agriculture and forest landscape for climate change mitigation” (CZ.02.01.01/00/22_008/0004635) project. RS, RH and GB received mobility funding from the French-Hungarian bilateral partnership through the BALATON (N ° 44703TF)/TéT (2019-2.1.11-TÉT-2019-00031) programme. Support was also provided by the TKP2021-NKTA-06 project that has been implemented with the support provided by the Ministry of Innovation and Technology of Hungary from the National Research, Development and Innovation Fund, financed under the TKP2021-NKTA funding scheme. Also supported by the AI4Impact programme of the Hungarian Research Network (HUN-REN). The authors are grateful to Gergő Szabó for his support.
This research has been supported by the National Research, Development and Innovation Office, Hungary (project ID: ADVANCED_24 150795), the French-Hungarian bilateral partnership through the BALATON (grant no. 44703TF)/TéT (2019-2.1.11-TÉT-2019-00031) programme and the “Advanced methods of greenhouse gases emission reduction and sequestration in agriculture and forest landscape for climate change mitigation” (CZ.02.01.01/00/22_008/0004635) project.
This paper was edited by Yuanchao Fan and reviewed by two anonymous referees.
Anuga, S. W., Chirinda, N., Nukpezah, D., Ahenkan, A., Andrieu, N., and Gordon, C.: Towards low carbon agriculture: Systematic-narratives of climate-smart agriculture mitigation potential in Africa, Curr. Res. Environ. Sustain., 2, 100015, https://doi.org/10.1016/j.crsust.2020.100015, 2020.
Bai, Y., Zhang, S., Bhattarai, N., Mallick, K., Liu, Q., Tang, L., Im, J., Guo, L., and Zhang, J.: On the use of machine learning based ensemble approaches to improve evapotranspiration estimates from croplands across a wide environmental gradient, Agr. Forest Meteorol., 298–299, 108308, https://doi.org/10.1016/j.agrformet.2020.108308, 2021.
Baldocchi, D.: `Breathing' of the terrestrial biosphere: Lessons learned from a global network of carbon dioxide flux measurement systems, Aust. J. Bot., 56, 1–26, https://doi.org/10.1071/BT07151, 2008.
Baldocchi, D., Chu, H., and Reichstein, M.: Intercomparison of ten eddy covariance flux partitioning methods with a global dataset of CO2 fluxes, Agr. Forest Meteorol., 256–257, 223–233, https://doi.org/10.1016/j.agrformet.2017.05.015, 2018.
Bansal, Y., Lillis, D., and Kechadi, M. T.: A neural meta model for predicting winter wheat crop yield, Mach. Learn., 113, 3771–3788, https://doi.org/10.1007/s10994-023-06455-1, 2024.
Bassu, S., Brisson, N., Durand, J. L., Boote, K. J., Lizaso, J., Jones, J. W., Rosenzweig, C., Adam, M., Basso, B., Baron, C., Basso, B., Biernath, C., Boogaard, H., Conijn, S., Corbeels, M., Deryng, D., De Sanctis, G., Gayler, S., Grassini, P., Hatfield, J., Hoek, S., Izaurralde, C., Jongschaap, R., Kemanian, A. R., Kersebaum, K. C., Kim, S.-H., Kumar, N. S., Makowski, D., Müller, C., Nendel, C., Priesack, E., Pravia, M. V., Sau, F., Shcherbak, I., Tao, F., Teixeira, E., Timlin, D., and Waha, K.: How do various maize crop models vary in their responses to climate change factors?, Glob. Change Biol., 20, 2301–2320, https://doi.org/10.1111/gcb.12520, 2014.
Beer, C., Reichstein, M., Tomelleri, E., Ciais, P., Jung, M., Carvalhais, N., Rödenbeck, C., Arain, M. A., Baldocchi, D., Bonan, G. B., Bondeau, A., Cescatti, A., Lasslop, G., Lindroth, A., Lomas, M., Luyssaert, S., Margolis, H., Oleson, K. W., Roupsard, O., Veenendaal, E., Viovy, N., Williams, C., Woodward, F. I., and Papale, D.: Terrestrial gross carbon dioxide uptake: Global distribution and covariation with climate, Science, 329, 834–838, https://doi.org/10.1126/science.1184984, 2010.
Bellocchi, G.: MACSUR SciPol Policy brief 5: Assessing Emissions and Mitigation Practices in Agriculture, towards an effective use of models for policy, Zenodo [code], https://doi.org/10.5281/zenodo.8038881, 2023.
Bellocchi, G., Rivington, M., Donatelli, M., and Matthews, K.: Validation of biophysical models: issues and methodologies. A review, Agron. Sustain. Dev., 30, 109–113, https://doi.org/10.1051/agro/2009001, 2010.
Bellocchi, G., Barcza, Z., Hollós, R., Acutis, M., Bottyán, E., Doro, L., Hidy, D., Lellei-Kovács, E., Ma, S., Minet, J., Pacskó, V., Perego, A., Ruget, F., Seddaiu, G., Wu, L., and Sándor, R.: Sensitivity of simulated soil water content, evapotranspiration, gross primary production and biomass to climate change factors in Euro-Mediterranean grasslands, Agr. Forest Meteorol., 343, 109778, https://doi.org/10.1016/j.agrformet.2023.109778, 2023.
Bellocchi, G., Sándor, R., Ehrhardt, F., Grace, P., Snow, V., Recous, S., Smith, P., Soussana, J., Basso, B., Bhatia, A., Brilli, L., Doltra, J., Dorich, C. D., Doro, L., Fitton, N., Grant, B., Harrison, M. T., Kirschbaum, M. U. F., Klumpp, K., Laville, P., Léonard, J., Martin, R., Massad, R. S., Moore, A. D., Myrgiotis, V., Pattey, E., Rolinski, S., Sharp, J., Skiba, U., Smith, W., Wu, L., and Zhang, Q.: Experimental and simulated data for crop and grassland production and carbon-nitrogen fluxes, Harvard Dataverse [data set], https://doi.org/10.7910/dvn/5to4he, 2025.
Bilotto, F., Harrison, M. T., Migliorati, M. D. A., Christie, K. M., Rowlings, D. W., Grace, P. R., Smith, A. P., Rawnsley, R. P., Thorburn, P. J., and Eckard, R. J.: Can seasonal soil N mineralisation trends be leveraged to enhance pasture growth?, Sci. Total Environ., 772, 145031, https://doi.org/10.1016/j.scitotenv.2021.145031, 2021.
Breiman, L.: Stacked regressions, Mach. Learn., 24, 123–140, https://doi.org/10.1007/BF00058655, 1996.
Breiman, L.: Stacked regressions, Mach. Learn., 24, 49–64, https://doi.org/10.1007/BF00117832, 2001a.
Breiman, L.: Random forests, Mach. Learn., 45, 5–32, https://doi.org/10.1023/A:1010933404324, 2001b.
Brilli, L., Bechini, L., Bindi, M., Carozzi, M., Cavalli, D., Conant, R., Dorich, C. D., Doro, L., Ehrhardt, F., Farina, R., Ferrise, R., Fitton, N., Francaviglia, R., Grace, P., Iocola, I., Klumpp, K., Léonard, J., Martin, R., Massad, R. S., Recous, S., Seddaiu, G., Sharp, J., Smith, P., Smith, W. N., Soussana, J.-F., and Bellocchi, G.: Review and analysis of strengths and weaknesses of agro-ecosystem models for simulating C and N fluxes, Sci. Total Environ., 598, 445–470, https://doi.org/10.1016/j.scitotenv.2017.03.208, 2017.
Calanca, P., Deléglise, C., Martin, R., Carrère, P., and Mosimann, E.: Testing the ability of a simple grassland model to simulate the seasonal effects of drought on herbage growth, Field Crop. Res., 187, 12–23, https://doi.org/10.1016/j.fcr.2015.12.008, 2016.
Challinor, A. J., Smith, M. S., and Thornton, P.: Use of agro-climate ensembles for quantifying uncertainty and informing adaptation, Agric. Forest Meteorol., 170, 2–7, https://doi.org/10.1016/j.agrformet.2012.09.007, 2013.
Chandel, S., Kleber, M., Jahn, R., and Vogel, C.: Soil science-informed machine learning, Geoderma, 452, 117094, https://doi.org/10.1016/j.geoderma.2024.117094, 2024.
Chen, T. and Guestrin, C.: XGBoost: A scalable tree boosting system, in: KDD '16: Proceedings of the 22nd ACM SIGKDD International Conference on Knowledge Discovery and Data Mining, pp. 785–794, https://doi.org/10.1145/2939672.2939785, 2016.
Chergui, N. and Kechadi, M. T.: Data analytics for crop management: a big data view, J. Big Data, 9, 1–37, https://doi.org/10.1186/s40537-022-00668-2, 2022.
Dietterich, T. G.: Ensemble methods in machine learning, in: Multiple classifier systems, MCS 2000, Lecture Notes in Computer Science, vol 1857, Springer, Berlin, Heidelberg, https://doi.org/10.1007/3-540-45014-9_1, 2000.
Dormann, C. F., Elith, J., Bacher, S., Buchmann, C., Carl, G., Carré, G., Marquéz, J. R. G., Gruber, B., Lafourcade, B., Leitão, P. J., Münkemüller, T., McClean, C., Osborne, P. E., Reineking, B., Schröder, B., Skidmore, A. K., Zurell, D., and Lautenbach, S.: Collinearity: A review of methods to deal with it and a simulation study evaluating their performance, Ecography, 36, 27–46, https://doi.org/10.1111/j.1600-0587.2012.07348.x, 2013.
Ehrhardt, F., Soussana, J.-F., Bellocchi, G., Grace, P., McAuliffe, R., Recous, S., Sándor, R., Smith, P., Snow, V., Migliorati, M. D. A., Basso, B., Bhatia, A., Brilli, L., Doltra, J., Dorich, C. D., Doro, L., Fitton, N., Giacomini, S. J., Grant, B., Harrison, M. T., Jones, S. K., Kirschbaum, M. U. F., Klumpp, K., Laville, P., Léonard, J., Liebig, M., Lieffering, M., Martin, R., Massad, R. S., Meier, E., Merbold, L., Moore, A. D., Myrgiotis, V., Newton, P., Pattey, E., Rolinski, S., Sharp, J., Smith, W. N., Wu, L., and Zhang, Q.: Assessing uncertainties in crop and pasture ensemble model simulations of productivity and N2O emissions, Glob. Change Biol., 24, e603–e616, https://doi.org/10.1111/gcb.13965, 2018.
Eyring, V., Cox, P. M., Flato, G. M., Friedlingstein, P., Hall, A., Hawkins, E., Hewitt, H. T., Joshi, M., Klein, S. A., Knutti, R., Meehl, G. A., O'Neill, B. C., Piani, C., Raper, S. C. B., Riahi, K., Roeckner, E., Sanderson, B. M., and Wenzel, S.: Taking climate model evaluation to the next level, Nat. Clim. Change, 9, 102–110, https://doi.org/10.1038/s41558-018-0355-y, 2019.
Farina, R., Sándor, R., Abdalla, M., Álvaro-Fuentes, J., Bechini, L., Bolinder, M. A., Brilli, L., Chenu, C., Clivot, H., De Antoni Migliorati, M., Di Bene, C., Dorich, C. D., Ehrhardt, F., Ferchaud, F., Fitton, N., Francaviglia, R., Franko, U., Giltrap, D. L., Grant, B. B., Guenet, B., Harrison, M. T., Kirschbaum, M. U. F., Kuka, K., Kulmala, L., Liski, J., McGrath, M. J., Meier, E., Menichetti, L., Moyano, F., Nendel, C., Recous, S., Reibold, N., Shepherd, A., Smith, W. N., Smith, P., Soussana, J.-F., Stella, T., Taghizadeh-Toosi, A., Tsutskikh, E., and Bellocchi, G.: Ensemble modelling, uncertainty and robust predictions of organic carbon in long-term bare-fallow soils, Glob. Change Biol., 27, 904–928, https://doi.org/10.1111/gcb.15441, 2021.
Gascuel-Odoux, C., Lescourret, F., Dedieu, B., Detang-Dessendre, C., Faverdin, P., Hazard, L., Litrico-Chiarelli, I., Petit, S., Roques, L., Reboud, X., Tixier-Boichard, M., de Vries, H., and Caquet, T.: A research agenda for scaling up agroecology in European countries, Agron. Sustain. Dev., 42, 53, https://doi.org/10.1007/s13593-022-00786-4, 2022.
Granger, C. W. J. and Ramanathan, R.: Improved methods of combining forecasts, J. Forecasting, 3, 197–204, https://doi.org/10.1002/for.3980030207, 1984.
Hagedorn, R., Doblas-Reyes, F. J., and Palmer, T. N.: The rationale behind the success of multi-model ensembles in seasonal forecasting – I. Basic concept, Tellus A: Dynamic Meteorology and Oceanography, 57, 219–233, https://doi.org/10.1111/j.1600-0870.2005.00103.x, 2005.
Hansen, L. K. and Salamon, P.: Neural network ensembles, IEEE Transactions on Pattern Analysis and Machine Intelligence, 12, 993–1001, https://doi.org/10.1109/34.58871, 1990.
Harrison, M. T., Evans, J. R., and Moore, A. D.: Using a mathematical framework to examine physiological changes in winter wheat after livestock grazing: 1. Model derivation and coefficient calibration, Field Crop. Res., 136, 116–126, https://doi.org/10.1016/j.fcr.2012.06.015, 2012.
Hengl, T., Mendes de Jesus, J., Heuvelink, G. B., Ruiperez Gonzalez, M., Kilibarda, M., Blagotić, A., Shangguan, W., Wright, M. N., Geng, X., Bauer-Marschallinger, B., Guevara, M. A., Vargas, R., MacMillan R. A., Batjes, N. H., Leenars, J. G. B., Riberio, E., Wheeler, I., Mantel, S., and Kempen, B.: SoilGrids250m: Global gridded soil information based on machine learning, PLoS One, 12, e0169748, https://doi.org/10.1371/journal.pone.0169748, 2017.
Hidy, D., Barcza, Z., Hollós, R., Dobor, L., Ács, T., Zacháry, D., Filep, T., Pásztor, L., Incze, D., Dencső, M., Tóth, E., Katarína, M., Thornton, P., Running, S., and Fodor, N.: Soil-related developments of the Biome-BGCMuSo v6.2 terrestrial ecosystem model, Geosci. Model Dev., 15, 2157–2181, https://doi.org/10.5194/gmd-15-2157-2022, 2022.
Hijmans, R. J., Cameron, S. E., Parra, J. L., Jones, P. G., and Jarvis, A.: Very high-resolution interpolated climate surfaces for global land areas, Int. J. Climatol., 25, 1965–1978, https://doi.org/10.1002/joc.1276, 2005.
Hollós, R. and Zrinyi, N.: hollorol/metamodeling_of_c: Initial release, Zenodo [code], https://doi.org/10.5281/zenodo.17849931, 2025.
Hou, J. and Hou, B.: Farmers' adoption of low-carbon agriculture in China: An extended theory of the planned behavior model, Sustainability, 11, 1399, https://doi.org/10.3390/su11051399, 2019.
Jackson, R. B., Lajtha, K., Crow, S. E., Hugelius, G., Kramer, M. G., and Rhodes, C.: The ecology of soil carbon: pools, vulnerabilities, and biotic and abiotic controls, Annu. Rev. Ecol., Evol., S., 48, 419–445, https://doi.org/10.1146/annurev-ecolsys-112414-054234, 2017.
Jones, J. W., Antle, J. M., Basso, B. O., Boote, K. J., Conant, R. T., Foster, I., Godfray, H. C. J., Herrero, M., Howitt, R. E., Janssen, S., Keating, B. A., Muñoz-Carpena, R., Porter, C. H., Rosenzweig, C., and Wheeler, T. R.: Brief history of agricultural systems modelling, Agr. Syst., 155, 240–254, https://doi.org/10.1016/j.agsy.2016.05.014, 2017.
Jung, M., Vetter, M., Herold, M., Churkina, G., Reichstein, M., Zaehle, S., Ciais, P., Viovy, N., Bondeau, A., Chen, Y., Trusilova, K., Feser, F., and Heimann, M.: Uncertainties of modelling gross primary productivity over Europe: A systematic study on the effects of using different drivers and terrestrial biosphere models, Global Biogeochem. Cy., 21, GB4021, https://doi.org/10.1029/2006GB002915, 2007.
Knutti, R., Baumberger, C., and Hirsch Hadorn, G.: Uncertainty quantification using multiple models – prospects and challenges, in: Computer simulation validation: fundamental concepts, methodological frameworks, and philosophical perspectives, edited by: Beisbart, C. and Saam, N. J., Springer, Cham, pp. 835–855, https://doi.org/10.1007/978-3-319-70766-2_34, 2019.
Kobayashi, K. and Salam, M. U.: Comparing simulated and measured values using mean squared deviation and its components, Agron. J., 92, 345–352, https://doi.org/10.2134/agronj2000.922345x, 2000.
Kollas, C., Kersebaum, K. C., Nendel, C., Manevski, K., Müller, C., Palosuo, T., Armas-Herrera, C. M., Beaudoin, N., Bindi, M., Charfeddine, M., Conradt, T., Constantin, J., Eitzinger, J., Ewert, F., Ferrise, R., Gaiser, T., Garcia de Cortazar-Atauri, I., Giglio, L., Hlavinka, P., Hoffmann, H., Hoffmann, M. P., Launay, M., Manderscheid, R., Mary, B., Mirschel, W., Moriondo, M., Olesen, J. E., Öztürk, I., Pacholski, A., Ripoche-Wachter, D., Roggero, P. P., Roncossek, S., Rötter, R. P., Ruget, F., Sharif, B., Trnkam, M., Ventrella, D., Waha, K., Wegehenkel, M., Weigel, H.-J., and Wu, L.: Crop rotation modelling – A European model intercomparison, Eur. J. Agron., 70, 98–111, https://doi.org/10.1016/j.eja.2015.06.007, 2015.
Koster, R. D., Dirmeyer, P. A., Guo, Z., Bonan, G., Chan, E., Cox, P., Gordon, C. T., Kanae, S., Kowalczyk, E., Lawrence, D., Liu, P., Lu, C.-H., Malyshev, S., McAvaney, B., Mitchell, K., Mocko, D., Oki, T., Oleson, K., Pitman, A., Sud, Y. C., Taylor, C. M., Verseghy, D., Vasic, R., Xue, Y., and Yamada, T.: Regions of strong coupling between soil moisture and precipitation, Science, 305, 1138–1140, https://doi.org/10.1126/science.1100217, 2004.
Kutner, M. H., Nachtsheim, C. J., Neter, J., and Li, W.: Applied linear statistical models, 5th Edition, McGraw-Hill, Irwin, New York, ISBN-13: 978-0073108742, 2005.
Lambin, E. F. and Meyfroidt, P.: Global land use change, economic globalization, and the looming land scarcity, P. Natl. Acad. Sci., 108, 3465–3472, https://doi.org/10.1073/pnas.1100480108, 2011.
Lembaid, I., Moussadek, R., Mrabet, R., Doauik, A., and Bouhaouss, A.: Modeling the effects of farming management practices on soil organic carbon stock under two tillage practices in a semi-arid region, Morocco, Heliyon, 7, e05889, https://doi.org/10.1016/j.heliyon.2020.e05889, 2021.
Lembaid, I., Moussadek, R., Mrabet, R., and Bouhaouss, A.: Modeling soil organic carbon changes under alternative climatic scenarios and soil properties using DNDC model at a semi-arid Mediterranean environment, Climate, 10, 23, https://doi.org/10.3390/cli10020023, 2022.
Li, C., Farahbakhshazad, N., Jaynes, D. B., Dinnes, D. L., Salas, W., and McLaughlin, D.: Modeling nitrate leaching with a biogeochemical model modified based on observations in a row-crop field in Iowa, Ecol. Model., 196, 116–130, https://doi.org/10.1016/j.ecolmodel.2006.02.007, 2006.
Li, T., Cui, L., Kuhnert, M., McLaren, T. I., Pandey, R., Liu, H., Wang, W., Xu, Z., Xia, A., Dalal, R. C., and Dang, Y. P.: A comprehensive review of soil organic carbon estimates: Integrating remote sensing and machine learning technologies, J. Soil. Sediment., 24, 3556–3571, https://doi.org/10.1007/s11368-024-03913-8, 2015a.
Li, T., Hasegawa, T., Yin, X., Zhu, Y., Boote, K., Adam, M., Bregalgio, S., Buis, S., Confalonieri, R., Fumoto, T., Gaydon, D., Marcaida III, M., Nakagawa, H., Oriol, P., Ruane, A. C., Ruget, F., Balwinder-Singh, B., Singh, U., Tang, L., Tao, F., Wilkens, P., Yoshida, H., Zhang, Z., and Bouman, B.: Uncertainties in predicting rice yield by current crop models under a wide range of climatic conditions, Glob. Change Biol., 21, 1328–1341, https://doi.org/10.1111/gcb.12758, 2015b.
Liaw, A. and Wiener, M.: Classification and regression by randomForest, R News, 2, 18–22, http://CRAN.R-project.org/doc/Rnews (last access: 1 October 2025), 2002.
Lloyd, J. and Taylor, J. A.: On the temperature dependence of soil respiration, Funct. Ecol., 8, 315–323, https://doi.org/10.2307/2389824, 1994.
Lundberg, S. M. and Lee, S.-I.: A unified approach to interpreting model predictions, Proceedings of the 31st International Conference on Neural Information Processing Systems, Long Beach, 4–9 December, pp. 4766–4777, https://doi.org/10.48550/arXiv.1705.07874, 2017.
Lundberg, S. M., Erion, G., and Lee, S.-I.: Consistent individualized feature attribution for tree ensembles, arXiv [preprint], https://doi.org/10.48550/arXiv.1802.03888, 2020.
Luo, Y., Weng, E., Wu, X., Gao, C., Zhou, X., and Zhang, L.: Parameter identifiability, constraint, and equifinality in data assimilation with ecosystem models, Ecol. Appl., 19, 571–574, https://doi.org/10.1890/08-0561.1, 2009.
Mathieu, J. A. and Aires, F.: Assessment of the agro-climatic indices to improve crop yield forecasting, Agr. Forest Meteorol., 253–254, 15–30, https://doi.org/10.1016/j.agrformet.2018.01.031, 2018.
Nand, V., Qi, Z., Ma, L., Helmers, M. J., Madramootoo, C. A., Smith, W. N., Zhang, T., Weber, T. K. D., Pattey, E., Li, Z., Wang, J., Jin, V. L., Jiang, Q., Tenuta, M., Trout, T. J., Cheng, H., Harmel, R. D., Kimball, B. A., Thorp, K. R., Boote, K. J., Stockle, C., Suyker, A. E., Evett, S. R., Brauer, D. K., Coyle, G. G., Copeland, K. S., Marek, G. W., Colaizzi, P. D., Acutis, M., Alimagham, S. M., Archontoulis, S., Babacar, F., Barcza, Z., Basso, B., Bertuzzi, P., Constantin, J., De Antoni Migliorati, M., Dumont, B., Durand, J. L., Fodor, N., Gaiser, T., Garofalo, P., Gayler, S., Giglio, L., Grant, R., Guan, K., Hoogenboom, G., Kim, S. H., Kisekka, I., Lizaso, J., Masia, S., Meng, H., Mereu, V., Mukhtar, A., Perego, A., Peng, B., Priesack, E., Shelia, V., Snyder, R., Soltani, A., Spano, D., Srivastava, A., Thomson, A., Timlin, D., Trabucco, A., Webber, H., Willaume, M., Williams, K., van der Laan, M., Ventrella, D., Viswanathan, M., Xu, X., and Zhou, W.: Evaluation of multimodel averaging approaches for ensembling evapotranspiration and yield simulations from maize models, J. Hydrol., 661, 133631, https://doi.org/10.1016/j.jhydrol.2025.133631, 2025.
Opitz, D. and Maclin, R.: Popular ensemble methods: An empirical study, J. Artif. Intell. Res., 11, 169–198, https://doi.org/10.1613/jair.614, 1999.
Pappas, C., Papalexiou, S. M., and Koutsoyiannis, D.: A quick gapfilling of missing hydrometeorological data, J. Geophys. Res.-Atmos., 119, 9290–9300, https://doi.org/10.1002/2014JD021633, 2014.
Raj, R., Hamm, N. A. S., Tol, C. V. D., and Stein, A.: Uncertainty analysis of gross primary production partitioned from net ecosystem exchange measurements, Biogeosciences, 13, 1409–1422, https://doi.org/10.5194/bg-13-1409-2016, 2016.
Reichstein, M., Falge, E., Baldocchi, D., Papale, D., Aubinet, M., Berbigier, P., Bernhofer, C., Buchmann, N., Gilmanov, T., Granier, A., Grünwald, T., Havránková, K., Ilvesniemi, H., Janous, D., Knohl, A., Laurila, T., Lohila, A., Loustau, D., Matteucci, G., Meyers, T., Miglietta, F., Ourcival, J.-M., Pumpanen, J., Rambal, S., Rotenberg, E., Sanz, M., Tenhunen, J., Seufert, G., Vaccari, F., Vesala, T., Yakir, D., and Valentini, R.: On the separation of net ecosystem exchange into assimilation and ecosystem respiration: Review and improved algorithm, Glob. Change Biol., 11, 1424–1439, https://doi.org/10.1111/j.1365-2486.2005.001002.x, 2005.
Reichstein, M., Ciais, P., Papale, D., Valentini, R., Running, S., Viovy, N., Cramer, W., Granier, A., Ogée, J., Allard, V., Aubinet, M., Bernhofer, C., Buchmann, N., Carrara, A., Grünwald, T., Heimann, M., Heinesch, B., Knohl, A., Kutsch, W., Loustau, D., Manca, G., Matteucci, G., Miglietta, F., Ourcival, J. M., Pilegaard, K., Pumpanen, J., Rambal, S., Schaphoff, S., Seufert, G., Soussana, J.-F., Sanz, M.-J., Vesala, T., and Zhao, M.: Reduction of ecosystem productivity and respiration during the European summer 2003 climate anomaly: A joint flux tower, remote sensing and modelling analysis, Glob. Change Biol., 13, 634–651, https://doi.org/10.1111/j.1365-2486.2006.01224.x, 2007.
Reichstein, M., Bahn, M., Ciais, P., Frank, D., Mahecha, M. D., Seneviratne, S. I., Zscheischler, J., Beer, C., Buchmann, N., Frank, D. C., Papale, D., Rammig, A., Smith, P., Thonicke, K., van der Velde, M., Vicca, S., Walz, A., and Wattenbach, M.: Climate extremes and the carbon cycle, Nature, 500, 287–295, https://doi.org/10.1038/nature12350, 2013.
Reichstein, M., Camps-Valls, G., Stevens, B., Jung, M., Denzler, J., Carvalhais, N., and Prabhat: Deep learning and process understanding for data-driven Earth system science, Nature, 566, 195–204, https://doi.org/10.1038/s41586-019-0912-1, 2019.
Riccio, A., Giunta, G., and Galmarini, S.: Seeking for the rational basis of the Median Model: the optimal combination of multi-model ensemble results, Atmos. Chem. Phys., 7, 6085–6098, https://doi.org/10.5194/acp-7-6085-2007, 2007.
Richter, K., Atzberger, C., Hank, T. B., and Mauser, W.: Derivation of biophysical variables from Earth observation data: validation and statistical measures, J. Appl. Remote Sens., 6, 063557, https://doi.org/10.1117/1.JRS.6.063557, 2012.
Robeson, S. M. and Willmott, C. J.: Decomposition of the mean absolute error (MAE) into systematic and unsystematic components, PLoS ONE, 18, e0279774, https://doi.org/10.1371/journal.pone.0279774, 2023.
Rosenzweig, C., Elliott, J., Deryng, D., Ruane, A. C., Müller, C., Arneth, A., Boote, K. J., Folberth, C., Glotter, M., Khabarov, N., Neumann, K., Piontek, F., Pugh, T. A. M., Schmid, E., Stehfest, E., Yang, H., and Jones, J. W.: Assessing agricultural risks of climate change in the 21st century in a global gridded crop model intercomparison, P. Natl. Acad. Sci. USA, 111, 3268-3273, https://doi.org/10.1073/pnas.1222463110, 2014.
Ruane, A. C., Hudson, N. I., Asseng, S., Camarrano, D., Ewert, F., Martre, P., Boote, K. J., Thorburn, P. J., Aggarwal, P. K., Angulo, C., Basso, B., Bertuzzi, P., Biernath, C., Brisson, N., Challinor, A. J., Doltra, J., Gayler, S., Goldberg, R., Grant, R. F., Heng, L., Hooker, J., Hunt, L. A., Ingwersen, J., Izaurralde, R. C., Kersebaum, K. C., Kumar, S. N., Müller, C., Nendel, C., O'Leary, G., Olesen, J. E., Osborne, T. M., Palosuo, T., Priesack, E., Ripoche, D., Rötter, R. P., Semenov, M. A., Shcherbak, I., Steduto, P., Stöckle, C. O., Stratonovitch, P., Streck, T., Supit, I., Tao, F., Travasso, M., Waha, K., Wallach, D., White, J. W., and Wolf, J.: Multi-wheat-model ensemble responses to interannual climate variability, Environ. Modell. Softw., 81, 86–101, https://doi.org/10.1016/j.envsoft.2016.03.008, 2016.
Ruane, A. C., Rosenzweig, C., Asseng, S., Boote, K. J., Elliott, J., Ewert, F., Jones, J. W., Martre, P., McDermid, S. P., Müller, C., Snyder, A., and Thorburn, P. J.: An AgMIP framework for improved agricultural representation in integrated assessment models, Environ. Res. Lett., 12, 125003, https://doi.org/10.1088/1748-9326/aa8da6, 2017.
Sagi, O. and Rokach, L.: Ensemble learning: A survey, Wiley Interdisciplinary Reviews: Data Mining and Knowledge Discovery, 8, e1249, https://doi.org/10.1002/widm.1249, 2018.
Sándor, R., Ehrhardt, F., Basso, B., Bellocchi, G., Bhatia, A., Brilli, L., Migliorati, M. D., Doltra, J., Dorich, C., Doro, L., Fitton, N., Giacomini, S. J., Grace, P., Grant, B., Harrison, M. T., Jones, S., Kirschbaum, M. U. F., Klumpp, K., Laville, P., Léonard, J., Liebig, M., Lieffering, M., Martin, R., McAuliffe, R., Meier, E., Merbold, L., Moore, A., Myrgiotis, V., Newton, P., Pattey, E., Recous, S., Rolinski, S., Sharp, J., Massad, R. S., Smith, P., Smith, W., Snow, V., Wu, L., Zhang, Q., and Soussana, J.-F.: C and N models Intercomparison – benchmark and ensemble model estimates for grassland production, Adv. Anim. Biosci., 7, 245–247, https://doi.org/10.1017/S2040470016000297, 2016.
Sándor, R., Barcza, Z., Acutis, M., Doro, L., Hidy, D., Köchy, M., Minet, J., Lellei-Kovács, E., Ma, S., Perego, A., Rolinski, S., Ruget, F., Sanna, M., Seddaiu, G., Wu, L., and Bellocchi, G.: Multi-model simulation of soil temperature, soil water content and biomass in Euro-Mediterranean grasslands: Uncertainties and ensemble performance, Eur. J. Agron., 88, 22–40, https://doi.org/10.1016/j.eja.2016.06.006, 2017.
Sándor, R., Ehrhardt, F., Brilli, L., Carozzi, M., Recous, S., Smith, P., Snow, V., Soussana, J. F., Dorich, C. D., Fuchs, K., Fitton, N., Gongadze, K., Klumpp, K., Liebig, M., Martin, R., Merbold, L., Newton, P. C. D., Rees, R. M., Rolinski, S., and Bellocchi, G.: The use of biogeochemical models to evaluate mitigation of greenhouse gas emissions from managed grasslands, Sci. Tot. Environ., 15, 292–306, https://doi.org/10.1016/j.scitotenv.2018.06.020, 2018.
Sándor, R., Ehrhardt, F., Grace, P., Recous, S., Smith, P., Snow, V., Soussana, J.-F., Basso, B., Bhatia, A., Brilli, L., Doltra, J., Dorich, C. D., Doro, L., Fitton, N., Grant, B., Harrison, M. T., Kirschbaum, M. U. F., Klumpp, K., Laville, P., Léonard, J., Martin, R., Massad, R. S., Moore, A., Myrgiotis, V., Pattey, E., Rolinski, R., Sharp, J., Skiba, U., Smith, W., Wu, L., Zhang, Q., and Bellocchi, G.: Ensemble modelling of carbon fluxes in grasslands and croplands, Field Crop. Res., 252, 107791, https://doi.org/10.1016/j.fcr.2020.107791, 2020.
Sándor, R., Ehrhardt, F., Grace, P., Recous, S., Smith, P., Snow, V., Soussana, J.-F., Basso, B., Bhatia, A., Brilli, L., Doltra, J., Dorich, C. D., Doro, L., Fitton, N., Grant, B., Harrison, M. T., Skiba, U., Kirschbaum, M. U. F., Klumpp, K., Laville, P., Léonard, J., Martin, R., Massad, R. S., Moore, A., Myrgiotis, V., Pattey, E., Rolinski, R., Sharp, J., Smith, W., Wu, L., Zhang, Q., and Bellocchi, G.: Residual correlation and ensemble modelling to improve crop and grassland models, Environ. Modell. Softw., 161, 105625, https://doi.org/10.1016/j.envsoft.2023.105625, 2023.
Sándor, R., Ehrhardt, F., Grace, P., Recous, S., Smith, P., Snow, V., Soussana, J.-F., Basso, B., Bhatia, A., Brilli, L., Doltra, J., Dorich, C. D., Doro, L., Fitton, N., Grant, B., Harrison, M. T., Kirschbaum, M. U. F., Klumpp, K., Laville, P., Léonard, J., Martin, R., Massad, R. S., Moore, A., Myrgiotis, V., Pattey, E., Rolinski, R., Sharp, J., Skiba, U., Smith, W., Wu, L., Zhang, Q., and Bellocchi, G.: Experimental and simulated data for crop and grassland production and carbon-nitrogen fluxes, Open Data J. Agric. Res., 24, 22–27, https://odjar.org/article/view/18594, 2024.
Schwalm, C. R., Williams, C. A., Schaefer, K., Arneth, A., Bonal, D., Buchmann, N., Chen, J., Law, B. E., Lindroth, A., Luyssaert, S., Reichstein, M., and Richardson, A. D.: Assimilation exceeds respiration sensitivity to drought: A FLUXNET synthesis, Glob. Change Biol., 16, 657–670, https://doi.org/10.1111/j.1365-2486.2009.01991.x, 2010.
Scowen, M., Athanasiadis, I. N., Bullock, J. M., Eigenbrod, F., and Willcock, S.: The current and future uses of machine learning in ecosystem service research, Sci. Total Environ., 799, 149263, https://doi.org/10.1016/j.scitotenv.2021.14926, 2021.
Shahhosseini, M., Hu, G., and Archontoulis, S. V.: Forecasting corn yield with machine learning ensembles, Front. Plant Sci., 11, 1120, https://doi.org/10.3389/fpls.2020.01120, 2020.
Shahhosseini, M., Hu, G., Huber, I., and Archontoulis, S. V.: Coupling machine learning and crop modeling improves crop yield prediction in the US Corn Belt, Sci. Rep., 11, 1606, https://doi.org/10.1038/s41598-020-80820-1, 2021.
Shapley, L. S.: A value for n-person games, in: Contributions to the theory of games II, edited by: Kuhn, H. W. and Tucker, A. W., vol. 28, pp. 307–317, Princeton University Press, https://doi.org/10.1515/9781400881970-018, 1953.
Snow, V., Rotz, C. A., Moore, A. D., Martin-Clouaire, R., Johnson, I. R., Hutchings, N. J., and Eckard, R. J.: The challenges – and some solutions – to process-based modelling of grazed agricultural systems, Environ. Modell. Softw., 62, 420–436, https://doi.org/10.1016/j.envsoft.2014.03.009, 2014.
Sroufe, R. and Watts, A.: Pathways to agricultural decarbonization: Climate change obstacles and opportunities in the US, Resour. Conserv. Recy., 182, 106276, https://doi.org/10.1016/j.resconrec.2022.106276, 2022.
Stoy, P. C., Mauder, M., Foken, T., Marcolla, B., Boegh, E., Ibrom, A., Arain, M. A., Arneth, A., Aurela, M., Bernhofer, C., Cescatti, A., Dellwik, E., Duce, P., Gianelle, D., van Gorsel, E., Kiely, G., Knohl, A., Margolis, H., McCaughey, H., Merbold, L., Montagnani, L., Papale, D., Reichstein, M., Saunders, M., Serrano-Ortiz, P., Sottocornola, M., Spano, D., Vaccari, F., and Varlagin, A.: A data-driven analysis of energy balance closure across FLUXNET research sites: The role of landscape scale heterogeneity, Agr. Forest Meteorol., 171–172, 137–152, https://doi.org/10.1016/j.agrformet.2012.11.004, 2013.
Strobl, C., Boulesteix, A. L., Zeileis, A., and Hothorn, T.: Bias in random forest variable importance measures: Illustrations, sources and a solution, BMC Bioinformatics, 8, 25, https://doi.org/10.1186/1471-2105-8-25, 2007.
Sun, W., Zhou, S., Yu, B., Zhang, Y., Keenan, T. F., and Fu, B.: Soil moisture-atmosphere interactions drive terrestrial carbon-water trade-offs, Commun. Earth Environ., 6, 169, https://doi.org/10.1038/s43247-025-02145-z, 2025.
Therond, O., Hengsdijk, H., Casellas, E., Wallach, D., Adam, M., Belhouchette, H., Oomen, R., Russell, G., Ewert, F., Bergez, J.-E., Janssen, S., Wery, J., and van Ittersum, M. K.: Using a cropping system model at regional scale: low-data approaches for crop management information and model calibration, Agr. Ecosyst. Environ., 142, 85–94, https://doi.org/10.1016/j.agee.2010.05.007, 2011.
Thornton, P. K., Whitbread, A., Baedeker, T., Cairns, J., Claessens, L., Beethgen, W., Bunn, C., Friedmann, M., Giller, K. E., Herrero, M., Howden, M., Kilcline, K., Nangia, V., Ramirez-Villegas, J., Kumar, S., West, P. C., and Keating, B.: A framework for priority-setting in climate smart agriculture research, Agr. Syst., 167, 161–175, https://doi.org/10.1016/j.agsy.2018.09.009, 2018.
Valin, H., Havlík, P., Mosnier, A., Herrero, M., Schmid, E., and Obersteiner, M.: Agricultural productivity and greenhouse gas emissions: trade-offs or synergies between mitigation and food security?, Environ. Res. Lett., 8, 035019, https://doi.org/10.1088/1748-9326/8/3/035019, 2013.
Van der Laan, M. J., Polley, E. C., and Hubbard, A. E.: Super learner, Stat. Appl. Genet. Mo. B., 6, 25, https://doi.org/10.2202/1544-6115.1309, 2007.
Wallach, D., Martre, P., Liu, B., Asseng, S., Ewert, F., Thonburn, P. J., van Ittersum, M., Aggarwal, P. K., Ahmed, M., Basso, B., Biernath, C., Cammarano, D., Challinor, A. J., De Sanctis, G., Dumont, B., Rezaei, E. E., Fereres, E., Fitzgerald, G. J., Gao, Y., Garcia-Vila, M., Gayler, S., Girousse, C., Hoogenboom, G., Horan, H., Izaurralde, R. C., Jones, C. D., Kassie, B. T., Kersebaum, K. C., Klein, C., Koehler, A.-K., Maiorano, A., Minoli, S., Müller, C., Kumar, S. N., Nendel, C., O'Leary, G. J., Palosuo, T., Priesack, E., Ripoche, D., Rötten, R. P., Semenov, M. A., Stöckle, C., Stratonovitch, P., Streck, T., Supit, I., Fao, F., Wolf, J., and Zhang, Z.: Multi-model ensembles improve predictions of crop-environment-management interactions, Glob. Change Biol., 24, 5072–5083, https://doi.org/10.1111/gcb.14411, 2018.
Wang, Z., Liu, Z., and Huang, M.: NDVI joint process-based models drive a learning ensemble model for accurately estimating cropland net primary productivity (NPP), Front. Environ. Sci., 11, 1304400, https://doi.org/10.3389/fenvs.2023.1304400, 2024.
Xia, J., Chen, T., Zhang, K., Wang, Y., and Chen, G.: Impacts of climate extremes on carbon fluxes and their underlying mechanisms in a typical temperate grassland ecosystem, Sci. Total Environ., 907, 167755, https://doi.org/10.1016/j.scitotenv.2023.167755, 2024.
Xu, L. and Baldocchi, D. D.: Seasonal variation in carbon dioxide exchange over a Mediterranean annual grassland in California, Agr. Forest Meteorol., 123, 79–96, https://doi.org/10.1016/j.agrformet.2003.10.004, 2004.
Xu, X., Xu, J., Li, B., Li, J., and Nie, M.: Ecosystem carbon fluxes exhibit thermal response thresholds at which carbon–climate feedback changes, Global Ecol. Biogeogr., 34, e70030, https://doi.org/10.1111/geb.70030, 2025.
Zhang, J., Tian, H., Wang, P., Tansey, K., Zhang, S., and Li, H.: Improving wheat yield estimates using data augmentation models and remotely sensed biophysical indices within deep neural networks in the Guanzhong Plain, PR China, Comput. Electron. Agr., 192, 106616, https://doi.org/10.1016/j.compag.2021.106616, 2022.
Zhu, Z., Piao, S., Myneni, R. B., Huang, M., Zeng, Z., Canadell, J. G., Ciais, P., Sitch, S., Friedlingstein, P., Arneth, A., Cao, C., Cheng, L., Kato, E., Koven, C., Li, Y., Lian, X., Liu, Y., Liu, R., Mao, J., Pan, Y., Peng, S., Peñuelas, J., Poulter, B., Pugh, T. A. M., Stocker, B. D., Viovy, N., Wang, X., Wang, Y., Xiao, Z., Yang, H., Zaehle, S., and Zeng, N.: Greening of the Earth and its drivers, Nat. Clim. Change, 6, 791–795, https://doi.org/10.1038/nclimate3004, 2016.