the Creative Commons Attribution 4.0 License.
the Creative Commons Attribution 4.0 License.
 | 21 May 2026
Implementation of the ORACLE (v1.0) organic aerosol composition and evolution module into the EC-Earth3-AerChem model
Stylianos Kakavas
Alexandra P. Tsimpidi
Vlassis A. Karydis
Spyros N. Pandis
Simulating the composition and evolution of organic aerosol (OA) in Earth System Models (ESMs) presents significant challenges due to the high computational demands of detailed chemical mechanisms. The computationally efficient ORACLE module employs the volatility basis set framework and can simulate secondary organic aerosol (SOA) formation from a range of precursors, including volatile (VOCs), intermediate-volatility (IVOCs), semi-volatile (SVOCs), and low-volatility organic compounds (LVOCs). In this study, a lite configuration of the ORACLE v1.0 module (ORACLE-lite) is implemented into the TM5-MP global chemical transport model (CTM), which represents the chemistry-transport component of the EC-Earth3-AerChem ESM. SOA formation from anthropogenic VOCs is neglected to reduce the number of surrogate species and further improve computational efficiency. For the standalone TM5-MP simulation, the global annual mean surface total OA concentration using ORACLE-lite is approximately 1.1 µg m−3, representing a 25 % increase compared to the previous version of the model. The annual atmospheric OA burden also increases by 50 %, reaching 3.67 Tg. Corresponding predictions from EC-Earth3-AerChem are slightly higher, with a surface total OA concentration of 1.16 µg m−3 and an atmospheric burden of 3.83 Tg, representing increases of 30 % and 60 %, respectively, compared to the previous version of the model. Comparison of monthly measured PM2.5 OA concentrations from Europe and the US with the corresponding predictions shows that the models bias is reduced by approximately half in the standalone TM5-MP simulation and by a factor of three in EC-Earth3-AerChem when ORACLE-lite is implemented. These enhancements enable more accurate and computationally feasible assessments of the climate impacts of individual organic aerosol components in future ESM studies.
- Article
(3829 KB) - Full-text XML
-
Supplement
(2560 KB) - BibTeX
- EndNote


Atmospheric particulate matter (PM) not only affects air quality and human health but also has significant implications for the climate (Monks et al., 2009; Shrivastava et al., 2017; Zhang, 2020). Organic aerosol (OA) is a major component of PM contributing between 20 % and 90 % to the total aerosol mass (Kanakidou et al., 2005; Zhang et al., 2007; Tsimpidi et al., 2025). Since anthropogenic carbonaceous emissions are significant contributors to climate forcing and air pollution (IPCC, 2021), it is important to simulate the chemical composition and evolution of OA in Earth System Models (ESMs). This will reduce uncertainties related to aerosols and improve climate predictions.
Organic mass is categorized into primary (POA) and secondary organic aerosol (SOA) based on its formation mechanism. Particulate organic mass that is directly emitted into the atmosphere from various sources is referred to as POA. In contrast, SOA is produced in the atmosphere through the oxidation of gas-phase organic compounds. SOA is often the dominant component of OA (Zhang et al., 2007; Crippa et al., 2013; Hu et al., 2016; Nault et al., 2018). However, SOA concentrations are often underestimated in global climate and chemical transport models (Heald et al., 2005; Tsigaridis et al., 2014; Tsimpidi et al., 2016; Bergman et al., 2022). This is partially due to neglected processes in the models (Robinson et al., 2007), such as the evaporation of POA, the oxidation of the resulting vapors in the gas phase and their subsequent condensation into the particle phase, SOA formation from intermediate-volatility organic compounds (IVOCs) and the chemical aging of volatile organic compounds (VOCs). Many studies have shown that the photooxidation of emissions from fossil fuel combustion and biomass burning can lead to the formation of significant SOA concentrations (Kroll and Seinfeld, 2008; Grieshop et al., 2009; Hennigan et al., 2011; Tsimpidi et al., 2017; Ma et al., 2018; Lim et al., 2019; Fang et al., 2021), which is often not accounted for in many ESMs.
Climate models usually treat POA and SOA as non-volatile and non-reactive particles that are directly emitted into the atmosphere (Kanakidou et al., 2005; Tsimpidi et al., 2014; Pai et al., 2020). Donahue et al. (2006) introduced the volatility basis set (VBS) framework to capture the changes in OA volatility. This framework describes the partitioning of OA, assuming it is semi-volatile and photochemically reactive and that it is distributed across logarithmically spaced volatility bins. By using this approach, both the emissions of intermediate and semi-volatile primary aerosols, as well as SOA formation and its aging processes can be simulated. This approach has already been implemented in several regional and global chemical transport models (Tsimpidi et al., 2010; Jathar et al., 2011; Shrivastava et al., 2011; Bergström et al., 2012; Woody et al., 2016; Chen et al., 2019; Jiang et al., 2019) and in a few ESMs (Gao et al., 2024; Irfan et al., 2024). Many of these modeling studies have demonstrated improved predictions of OA concentrations by incorporating the VBS framework into their simulations. However, its implementation in large-scale models, such as ESMs, remains limited due to its high computational expense.
Tsimpidi et al. (2014) developed the ORACLE module, which is based on the VBS framework, and implemented it in the ECHAM/MESSy Atmospheric Chemistry (EMAC) model (Jöckel et al., 2006). Compared to a detailed VBS representation with explicit volatility bins, ORACLE reduces the computational cost by utilizing a small number of surrogate OA species by employing a novel lumping method. However, the 92 species used in the full configuration of the ORACLE module to describe OA and its volatility are still excessive for ESM simulations increasing significantly the computational cost. To address the computational constraints of ESMs, Tsimpidi et al. (2025) introduced a lite configuration of the ORACLE module (hereafter ORACLE-lite), further reducing the number of species used to describe OA and its volatility from 92 to 18. Although simplifications were made to reduce the computational cost, ORACLE-lite continues to effectively simulate the contributions of low volatility organic compounds (LVOCs), semi-volatile organic compounds (SVOCs), IVOCs, and VOCs to SOA formation (Tsimpidi and Karydis, 2026). ORACLE-lite is recommended for ESM simulations (Riipinen et al., 2026).
The aim of this study is to incorporate a computationally efficient OA volatility scheme based on ORACLE-lite into the chemistry-transport component of EC-Earth3-AerChem ESM to simulate OA concentrations, composition, and evolution. Section 2 provides an overview of the model, focusing mostly on the new implementations. In particular, we describe the version of the EC-Earth ESM used, the implemented OA volatility scheme, and the conducted simulations. In Sect. 3, we present the model-derived OA atmospheric concentrations and their evaluation with available observations. Finally, in Sect. 4, we discuss the impact of the VBS framework on the simulated OA atmospheric concentrations, and we summarize the global implications of explicitly representing POA emissions in a climate–chemistry model, along with the plans for future model development.
2.1 The EC-Earth3 Earth System Model
The EC-Earth3-AerChem configuration (EC-Earth3-AerChem version 3.5.0) of the EC-Earth3 (van Noije et al., 2021; Döscher et al., 2022) has been used for this work. EC-Earth3 contributed to Phase 6 of the Coupled Model Intercomparison Project (CMIP6; Eyring et al., 2016). Its atmospheric general circulation model (GCM) is based on cycle 36r4 of the Integrated Forecast System (IFS), from the European Centre for Medium-Range Weather Forecasts (ECMWF), which includes the H-TESSEL land surface model (Balsamo et al., 2009). The ocean model is version 3.6 of the Nucleus for European Modelling of the Ocean (NEMO; Rousset et al., 2015), with sea ice processes represented by the Louvain-la-Neuve sea ice model (LIM; Vancoppenolle et al., 2009; Rousset et al., 2015). The majority of information exchange and interpolation between modules is managed by the Ocean Atmosphere Sea Ice Soil coupler, version 3 (OASIS3; Craig et al., 2017). EC-Earth3-AerChem includes TM5-MP (Tracer Model 5, Massively Parallel version; Krol et al., 2005; Huijnen et al., 2010; van Noije et al., 2014; Williams et al., 2017) for the simulation of aerosols and atmospheric chemistry. TM5-MP can be also used as a standalone CTM driven by offline meteorological and surface fields from the ERA-Interim reanalysis, developed by the ECMWF (Dee et al., 2011). It simulates the atmospheric life cycle of air pollutants, including emissions, advection, convection, vertical diffusion, and removal by dry and wet deposition, as well as chemical and microphysical transformations. Gas-phase chemistry is described by mCB05, a modified version of the CB05 carbon bond mechanism (Yarwood et al., 2005; Williams et al., 2017). For the gas and particle equilibrium calculations of NH3/NH and HNO3/NO, the ISORROPIA-lite model is used (Kakavas et al., 2022) neglecting the effect of organic aerosol water on inorganic aerosol thermodynamics. The organic aerosol water contribution to the total aerosol water is calculated separately, based on Myriokefalitakis et al. (2022). To simulate the composition and evolution of OA the ORACLE-lite module (Tsimpidi et al., 2025; Tsimpidi and Karydis, 2026) is used.
The aerosol population and its evolution are treated by the modal two-moment aerosol model M7 (Vignati et al., 2004). M7 includes four water soluble modes (nucleation, Aitken, accumulation, and coarse) and three insoluble modes (Aitken, accumulation, and coarse). The dry radius size ranges for the aerosol modes are defined as follows: nucleation mode (rp<5 nm), Aitken mode ( nm), accumulation mode ( nm), and coarse mode (rp>500 nm). Particles within each mode are assumed to be internally mixed. Each mode follows a lognormal size distribution with a fixed geometric standard deviation. The M7 model tracks the evolution of both total particle number and the mass of each species within each mode. In this work, we incorporated both POA and SOA into the default soluble POA modes (Aitken, accumulation, and coarse) of the M7 model to track aerosol number distribution. The existing M7 species also include SOA formed from biogenic VOCs (Bergman et al., 2022), along with sulfate, black carbon, sea salt and dust. SOA contributes to the organic aerosol mass within the M7 model, so it affects aerosol growth and particle properties. As cloud droplet activation depends on aerosol size, number, and hygroscopicity, SOA indirectly influences cloud droplet activation in the model through changes in both the aerosol size distribution and composition. Additionally, TM5-MP simulates the concentrations of nitrate, ammonium, and methane sulfonic acid using a bulk aerosol approach.
The calculation of aerosol optical properties is based on Mie theory (van Noije et al., 2021). Extinction, single-scattering albedo, and asymmetry factor are derived for each mode using a pre-calculated lookup table. Spectral refractive indices for the different aerosol components are prescribed using input tables from three separate sources. For internally mixed aerosol modes, effective refractive indices are obtained using volume mixing rules derived from effective-medium theory. Organic aerosols, sulfate, sea salt, ammonium, nitrate, methane sulfonic acid, and water are treated as homogeneous mixtures using the Bruggeman mixing rule. In contrast, when black carbon, dust, or both are present, they are treated as inclusions embedded in a homogeneous host medium, and the Maxwell Garnett mixing rule is applied. More details about TM5-MP and EC-Earth3-AerChem can be found in van Noije et al. (2021) and Myriokefalitakis et al. (2022).
2.2 The ORACLE module
ORACLE (v1.0) uses fixed, logarithmically spaced saturation concentration bins and assumes bulk equilibrium between the gas and particle phases. The OA mass is then distributed among the size modes (Aitken soluble, accumulation soluble, and coarse soluble) following Pandis et al. (1993), using the dry radius of each size mode from the M7 model. After the bulk equilibrium simulation, the aerosol mass is partitioned across the size modes using a weighting approach that assumes a pseudo-ideal solution for the organic aerosol components. The fraction fi,k of total flux of species i between the gas and aerosol phases that condenses or evaporates from an aerosol mode k is given by:
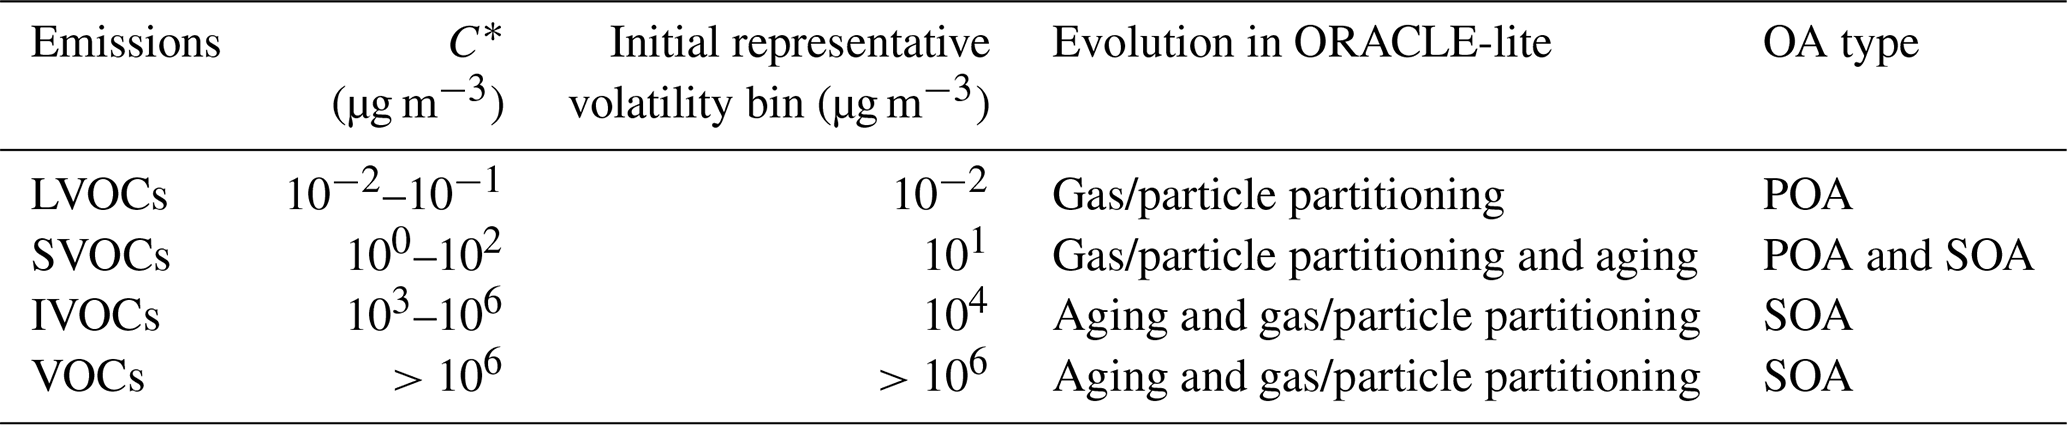
where Nk and dk are the number and the mean diameter of particles in mode k, respectively, and m is the total number of all aerosol modes. The parameter , where α is the aerosol accommodation coefficient and λ is the mean free path of air molecules. ORACLE simulates: (i) the partitioning of POA from LVOC emissions, (ii) the partitioning of POA from SVOC emissions and gas-phase oxidation of the remaining vapors, followed by their condensation into the particle phase to form SOA, and (iii) the gas-phase oxidation of IVOC and VOC emissions and the subsequent condensation of the oxidation products to form SOA. The volatility bins are defined by saturation concentration (C∗) ranges of 10−2 to 10−1 µg m−3 for LVOCs, 100 to 102 µg m−3 for SVOCs, 103 to 106 µg m−3 for IVOCs, and >106 µg m−3 for VOCs.
To further reduce computational expense, we implemented a lite configuration of the ORACLE module (hereafter ORACLE-lite) in the TM5-MP model, which represents the chemistry-transport component of the EC-Earth3-AerChem ESM by introducing a reduced set of surrogate species. This includes POA and primary organic gas (POG) for LVOC emissions, POA and POG for SVOC emissions, and POG for IVOC emissions, as well as SOA and secondary organic gas (SOG) formed through the oxidation of SVOC and IVOC emissions by hydroxyl radicals with a rate constant of cm3 molec.−1 s−1. In the present application, SVOCs and IVOCs undergo up to two generations of oxidation, with a 22.5 % mass increase in each generation. Assuming an initial ratio of 1.2 in ORACLE-lite, this leads to a final ratio of up to 1.8, which is within the observed range for oxygenated organic aerosol (: 1.8–2.4; Aiken et al., 2008). Note however, that the SOA formation from biogenic VOC emissions (isoprene and monoterpenes) is not treated within ORACLE-lite but is instead simulated, as described by Bergman et al. (2022). The oxidation of these compounds by ozone and hydroxyl radicals produces SVOCs and extremely low-volatility organic compounds (ELVOCs), which can condense on particles. Also, SOA formation from anthropogenic VOC emissions is neglected. ORACLE-lite was originally developed for use with the SAPRC family of gas-phase mechanisms. In contrast, EC-Earth3-AerChem employs a modified CB05 chemical mechanism, which uses a different lumping structure for anthropogenic VOCs than that assumed in ORACLE. As a result, the direct inclusion of anthropogenic SOA formation within the current ORACLE-lite framework is complex and requires additional development. This will be the topic of future work. As a result, the number of surrogate species used to represent OA and its volatility in ORACLE-lite was reduced from 18 to 9. An overview of the characteristics of the lite configuration of the ORACLE module used in this study is shown in Table 1.
Table 1Overview of the ORACLE-lite module characteristics, including volatility classification, evolution processes, and OA formation types for each emission class.
2.3 Simulations
In this study, present-day simulations were performed using atmosphere-only runs of EC-Earth3-AerChem (hereafter referred to as EC-Earth) for the years 2000–2010. In addition, standalone simulations with TM5-MP for the year 2005 driven by ERA-Interim (Dee et al., 2011) were performed. In the EC-Earth simulation, TM5-MP is coupled to the IFS atmospheric dynamics. Sea surface temperature and sea ice concentration fields were prescribed using input files provided through the AMIP interface (Taylor et al., 2000). Consequently, the atmospheric and chemistry modules follow the standard EC-Earth3-AerChem configuration used in CMIP6. The IFS component is configured with a horizontal resolution of T255 (approximately 80 km), 91 vertical levels extending up to 0.01 hPa, and a time step of 45 min. TM5-MP, in both its standalone and EC-Earth configurations, uses a horizontal resolution of 3° × 2° (longitude × latitude) and 34 vertical levels extending up to 0.1 hPa (∼ 60 km).
For this work, two types of simulations were performed for both TM5-MP and EC-Earth: (a) using the default OA representation and emissions, in which OA is treated as non-volatile, non-reactive and emitted exclusively as POA, and (b) incorporating the ORACLE-lite module with modified emissions (hereafter referred to as VBS).
In the VBS configuration, the emission factors used to distribute traditional POA emissions into LVOCs and SVOCs are based on the work of Tsimpidi et al. (2025). For fossil fuel combustion sources, emission factors of 0.09 and 0.71 are assigned to LVOCs and SVOCs, respectively. For biomass burning, the corresponding factors are 0.2 for LVOCs and 0.5 for SVOCs. These emissions are assigned to volatility bins with C∗ of 10−2 and 101 µg m−3 for LVOCs and SVOCs, respectively (Table 1). Please note that IVOCs exist almost exclusively in the gas-phase (Pandis et al., 2013) and are not fully accounted for in traditional emission inventories, despite their potentially substantial role in SOA formation. Previous studies estimate IVOCs emissions to range from 0.25 to 2.8 times those of traditional POA emissions (Schauer et al., 2002). In this study, we assume that IVOCs emissions are equal to 0.3 times the traditional POA emissions for biomass burning and 1.7 times for fossil fuel combustion sources, following the estimates of Tsimpidi et al. (2025). These emissions are assigned to the volatility bin with C∗ = 104 µg m−3. Overall, LVOCs and SVOCs are assumed to be initially emitted in the particle phase as POA, while IVOCs are emitted solely in the gas-phase.
2.4 Observations
To evaluate the impact of the VBS scheme on simulated aerosol concentrations, we compared the models results with monthly surface-level observations of PM2.5 OA concentrations during 2005. We used data from two freely available observational networks: the United States Interagency Monitoring of Protected Visual Environments (IMPROVE; https://views.cira.colostate.edu/fed/QueryWizard, last access: 2 June 2025, login required), which measures aerosols in remote areas of the United States and as a result is representative of rural conditions, and the European Monitoring and Evaluation Project (EMEP; https://ebas-data.nilu.no/Default.aspx, last access: 2 June 2025). For the IMPROVE network, we used monthly OA concentrations from 174 stations while for EMEP, data were available from only 4 stations for the simulated period. Please note that both IMPROVE and EMEP networks measure particulate organic carbon (OC) instead of total organic mass in the particles. To convert OC to organic mass, we applied a constant factor. For the IMPROVE network, the suggested factor equals to 1.8 (Pitchford et al., 2007). For EMEP, we followed the IMPROVE network recommendation and assumed a factor of 1.8 for EMEP stations to maintain consistency. The OC measurements at the Ispra (Italy) station of EMEP are systematically high (reaching up to 22 µg m−3 in winter), which strongly influences the multi-site monthly mean due to the limited number of available stations for 2005. For this reason, and to avoid the average being dominated by a single site, Ispra was excluded from the statistical analysis. Due to the limited availability of measurements in Europe during 2005, we also used monthly OA concentrations from EMEP during 2010, when data from 8 stations were available.
2.5 Models performance
To evaluate the models' performance, specific statistical metrics were calculated for both configurations of TM5-MP and EC-Earth simulations. These include mean bias (MB), mean absolute gross error (MAGE), normalized mean bias (NMB), normalized mean error (NME), and root-mean-square error (RMSE) defined as follows:
where Pi is the predicted OA concentration, Oi is the observed OA value at the same monthly averaged time, and N is the total number of measurements used for the comparison.
NME (in %) and MAGE (in µg m−3) measure the total difference between model predictions and observations, including both bias and scatter. In contrast, NMB (in %) and MB (in µg m−3) specifically reflect systematic errors. RMSE (in µg m−3) combines both the variability (scatter) and bias of the predictions into a single metric. Because NME and MAGE include bias effects, their values are typically equal to or greater than those of NMB and MB. When NME and NMB (or MAGE and MB) are similar in magnitude, most of the error is due to bias. However, if NME and MAGE are substantially larger than NMB and MB, this indicates that scatter also contributes significantly to the discrepancy between predictions and observations.
2.6 Emissions
The annual present-day emissions used in both online and offline simulations of EC-Earth with the VBS configuration are shown in Fig. 1. In the default OA configuration, particulate organic matter is emitted exclusively as POA (Fig. S1 in the Supplement; 52.4 Tg yr−1) and is assumed to have constant carbon content, expressed as the ratio of total OA mass to the mass of the carbon it contains. This ratio is used to convert POA emissions, typically expressed as organic carbon (OC) mass to OA mass. In this study, a ratio of 1.6 is applied across all POA sources based on previous works (Turpin and Lim, 2001; Reid et al., 2005; Aiken et al., 2008; van Noije et al., 2021). In the VBS configuration, emissions are distributed into three volatility bins based on the emission factors described in Sect. 2: LVOCs (7.6 Tg yr−1), SVOCs (31.8 Tg yr−1), and IVOCs (53.1 Tg yr−1) (see also Table 2). LVOCs and SVOCs represent POA emissions, which are lower in total than in the default OA configuration because a portion of the traditional organic mass emissions is reassigned to IVOCs. The emissions are higher in regions such as China, India, Bangladesh, southern Africa, and South America. Emissions from shipping are also present over oceanic regions.
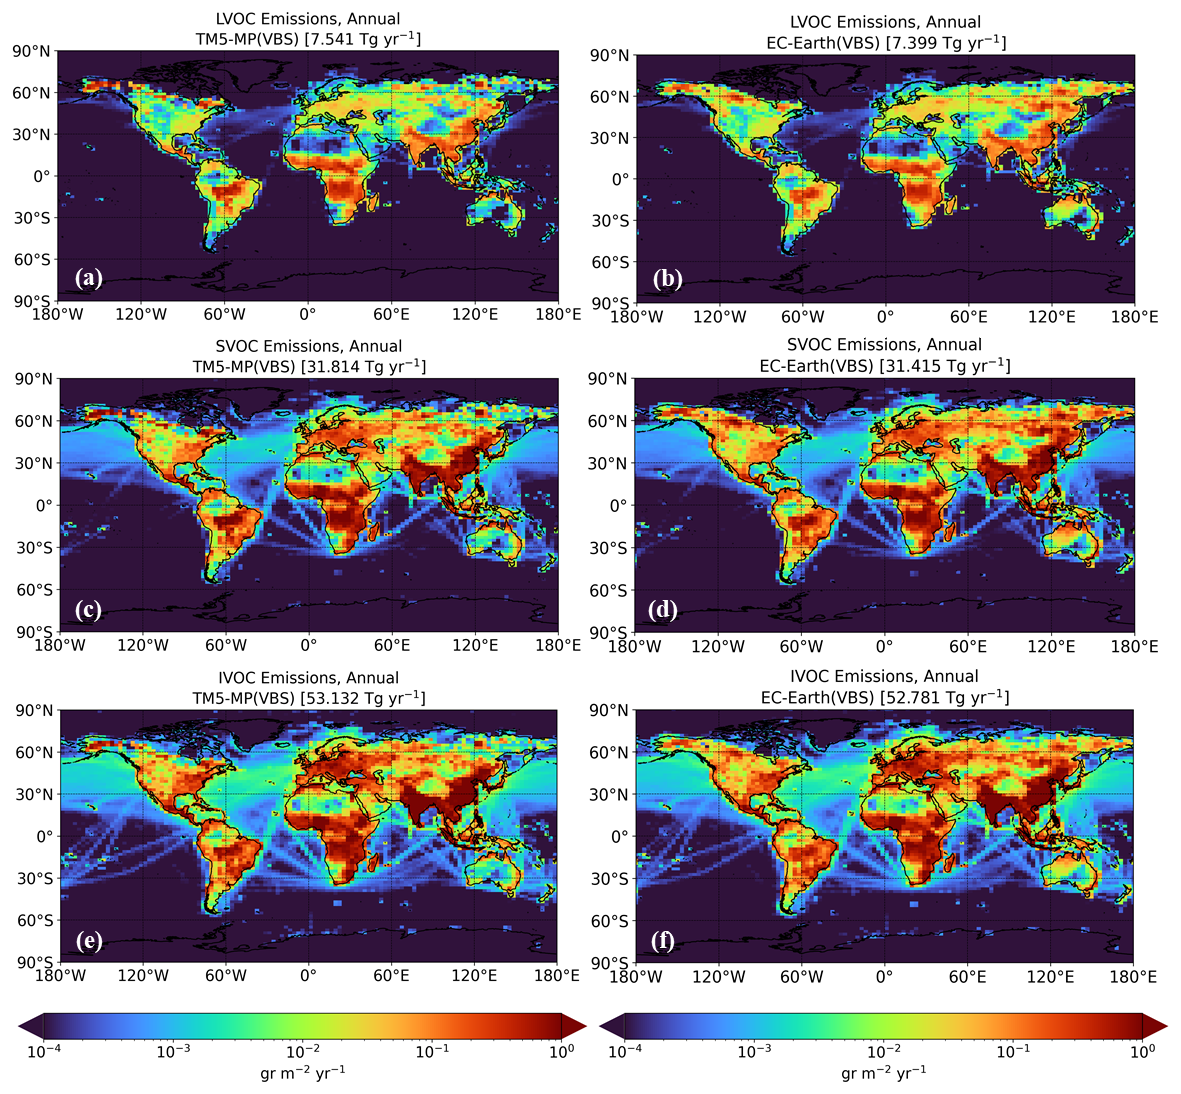
Figure 1Annual emissions (in g m−2 yr−1) applied in the simulations of TM5-MP during 2005 (left column) and EC-Earth during 2000–2010 (right column) for: (a, b) low volatile organic compounds (LVOCs), (c, d) semi-volatile organic compounds (SVOCs), and (e, f) intermediate volatile organic compounds (IVOCs).
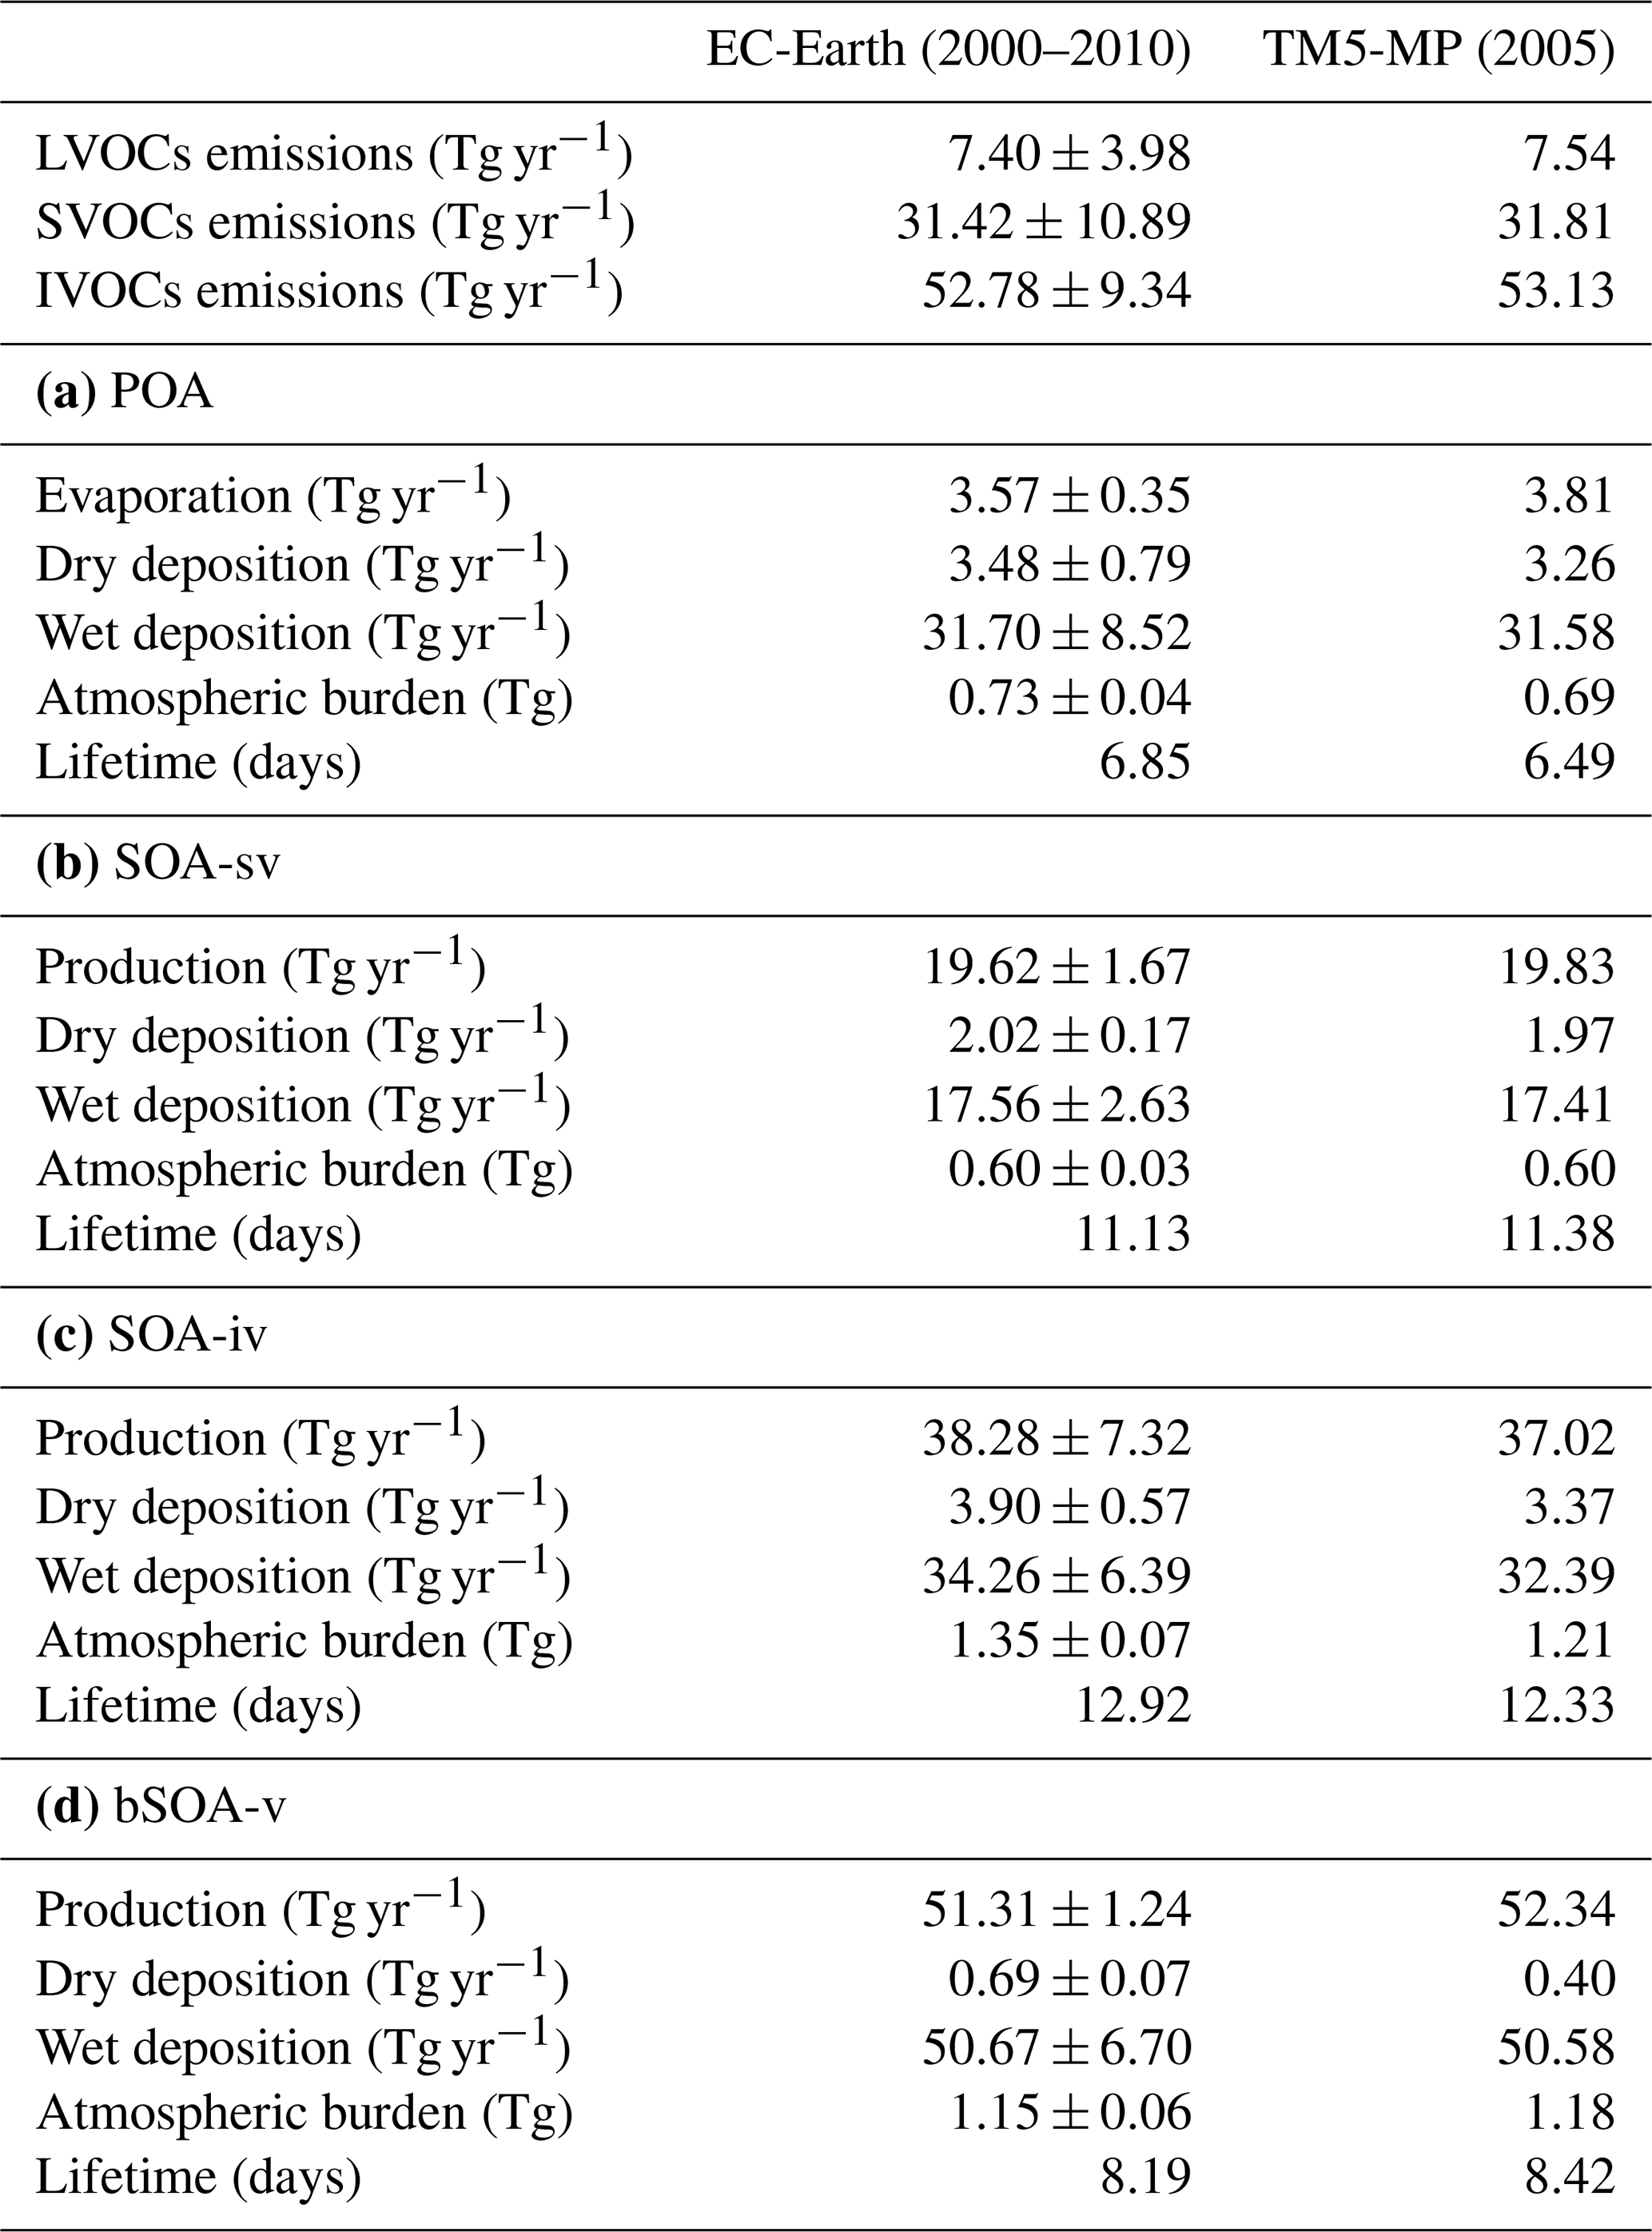
Table 2Global budgets, atmospheric burdens and lifetimes of (a) POA, (b) SOA-sv, (c) SOA-iv, (d) bSOA-v for EC-Earth during 2000–2010 and TM5-MP during 2005 with the VBS configuration.
3.1 Budget calculations
This section presents the global budgets, atmospheric burdens, and lifetimes of OA components from EC-Earth and standalone TM5-MP simulations during 2005 using the VBS configuration (Table 1). For completeness, SOA from biogenic VOCs (bSOA-v) is also included.
In the standalone TM5-MP simulation for 2005, SOA production from SVOCs (SOA-sv) and IVOCs (SOA-iv) is 19.83 and 37.02 Tg yr−1, respectively. The total annual SOA production is 109.19 Tg yr−1. This value falls within the range of 50–380 Tg yr−1 of Spracklen et al. (2011) and is close to their best estimate of 140 Tg yr−1. The relative contributions to the annual SOA production are 18.2 % from SVOCs, 33.9 % from IVOCs, and 47.9 % from biogenic VOCs. Anthropogenic SOA production is higher near source regions (Fig. 2), with hotspots in South America, southern Africa, India, Bangladesh, and China. Seasonally, the production of SOA-sv is higher in summer (Fig. S2), whereas SOA-iv production peaks in winter, especially over India, China, and Central Africa (Fig. S3). This seasonal trend will be discussed further in the next section.
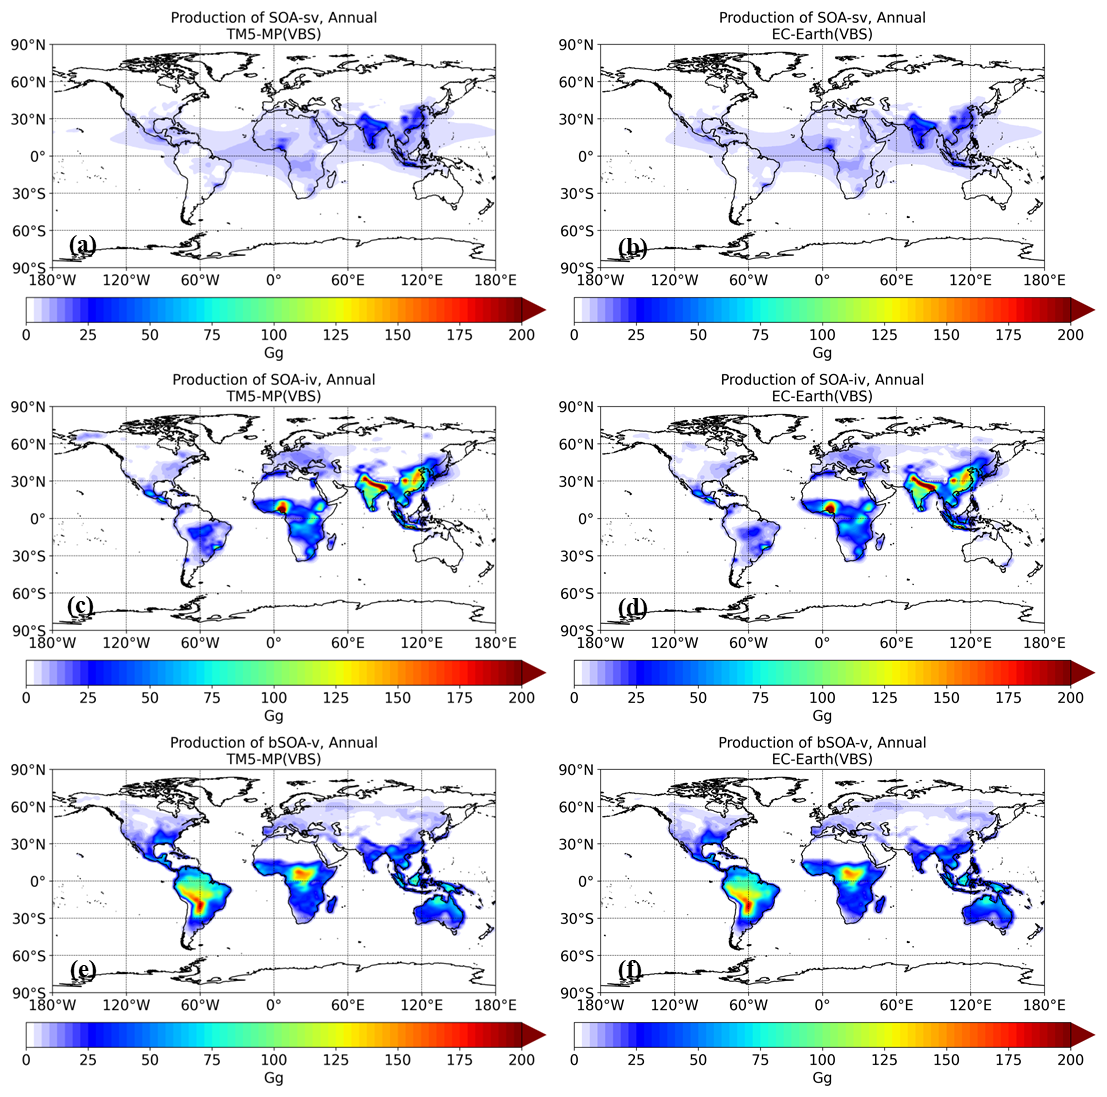
Figure 2Annual production of SOA (in Gg) as simulated using the VBS configuration of TM5-MP during 2005 (left column) and the corresponding EC-Earth predictions during 2000–2010 (right column) for: (a, b) SOA-sv, and (c, d) SOA-iv. For completeness, annual SOA production from biogenic VOCs (bSOA-v) in (e) and (f) is also shown.
In the EC-Earth simulation, the annual mean production for 2000–2010 of SOA-sv and SOA-iv is 19.62 ± 1.67 and 38.28 ± 7.32 Tg yr−1, respectively (Table 2; Fig. 2), with a total SOA production of 109.22 ± 10.23 Tg yr−1. The contributions to total SOA production are 18 % from SVOCs, 35 % from IVOCs, and 47 % from biogenic VOCs. Annual (Fig. S4) and seasonal (Figs. S5 and S6) SOA production indicate no significant differences between the TM5-MP and EC-Earth simulations during 2005. Minor discrepancies arise from differences in meteorology, which is predicted in EC-Earth but prescribed from reanalysis in the TM5-MP simulation.
The contributions to the annual atmospheric burden of total OA (3.67 Tg) in the standalone TM5-MP simulation are 18.7 % from POA, 16.4 % from SOA-sv, 32.9 % from SOA-iv, and 32 % from bSOA-v. Compared to the default simulation, in which SOA is produced only from biogenic VOCs and all anthropogenic OA is treated as POA, the annual atmospheric burden of total OA increased by approximately 50 % in the VBS simulation. In EC-Earth, the annual mean atmospheric burden using the VBS configuration is 60 % higher than in the default configuration, reaching 3.83 ± 0.21 Tg. The respective contributions are 19.3 % from POA, 15.9 % from SOA-sv, 34 % from SOA-iv, and 30.8 % from bSOA-v.
3.2 Atmospheric concentrations
The annual mean surface concentrations of POA, SOA-sv, SOA-iv, and bSOA-v in the standalone TM5-MP simulation with the VBS configuration are shown in Fig. 3. POA levels are higher than those of SOA-sv and SOA-iv especially in regions like India and China with higher LVOC and SVOC emissions. Our simulations indicate that the emitted POA undergoes evaporation and is subsequently oxidized by hydroxyl radicals in the gas phase, leading to the formation of SOA-sv through re-condensation. This is consistent with recent experimental studies especially for biomass burning emissions (e.g., Sengupta et al., 2020; Fang et al., 2021). Biomass burning emissions from residential heating are typically higher during winter, and the lower temperatures enhance partitioning to the particle phase, leading to increased POA concentrations, especially in regions such as China, Bangladesh, Central Africa and India (Fig. S7).
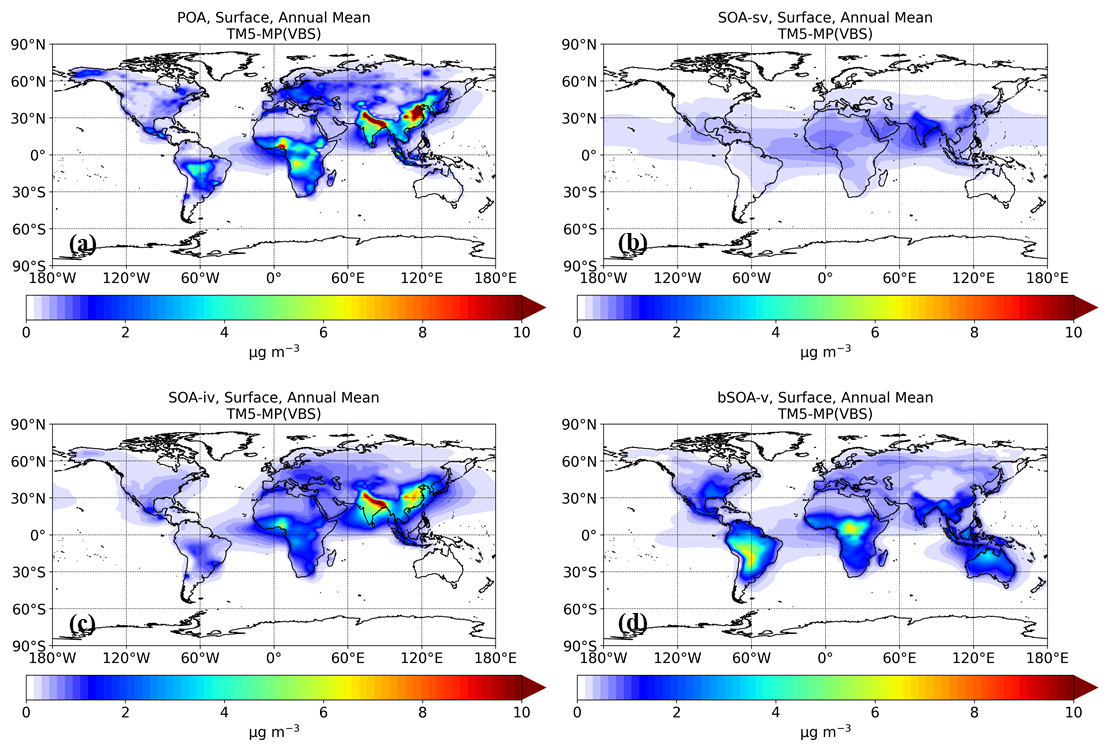
Figure 3Annual mean surface concentrations (in µg m−3) of: (a) POA, (b) SOA from SVOCs (SOA-sv), and (c) SOA from IVOCs (SOA-iv) as simulated using the VBS configuration of TM5-MP during 2005. For completeness, SOA concentrations from biogenic VOCs (bSOA-v) in (d) are also shown.
The annual mean concentrations of SOA-sv are lower than those of POA, as only a fraction of POA evaporates, undergoes photooxidation, and subsequently condenses into the particle phase. The oxidation of IVOCs, producing lower-volatility products, also contributes to SOA-sv formation. Please note that in ORACLE-lite, the volatility bin representing SOA-sv corresponds to a C∗ value of 10−2 µg m−3, indicating low volatility and a predominant presence in the particle phase. The higher SOA-sv concentrations predicted during summer compared to winter (Table S1; Fig. S8 in the Supplement) are due to the higher summer temperatures promoting POA evaporation, and the increased sunlight which enhances subsequent photooxidation and formation of SOA.
Higher annual mean concentrations of SOA-iv compared to SOA-sv are predicted, primarily due to the higher emissions of IVOCs (Table 1; Fig. 1) and the different formation mechanism. IVOCs can directly undergo oxidation by hydroxyl radicals, producing lower-volatility products that subsequently condense into the particle phase. Predicted SOA-iv concentrations are higher in winter than in summer (Table S1), particularly in regions such as China, India, Bangladesh, and Europe (Fig. S9). This is attributed to increased biomass burning emissions in these regions and lower temperatures, which enhance partitioning of the semi-volatile OA components into the particle phase. However, in regions such as South America and southern Africa, where major rainforests like the Amazon and Congo Basin are located, SOA-iv concentrations are higher during summer due to wildfires.
The annual mean surface concentrations of total OA in the standalone TM5-MP simulation with the VBS configuration are shown in Fig. 4. Higher concentrations are predicted in regions with higher precursor emissions, while as altitude increases the concentrations of OA decrease as expected, with higher concentrations between 15° S and 45° N (Fig. 4b). At higher altitudes, SOA concentrations are higher compared to POA, because organic gases can be efficiently transported upward and oxidized, leading to the formation of lower-volatility SOA (Fig. S10). Additionally, SOA formed at these altitudes tends to have a longer atmospheric lifetime, as it is less affected by wet and dry deposition processes (Tsimpidi et al., 2014).
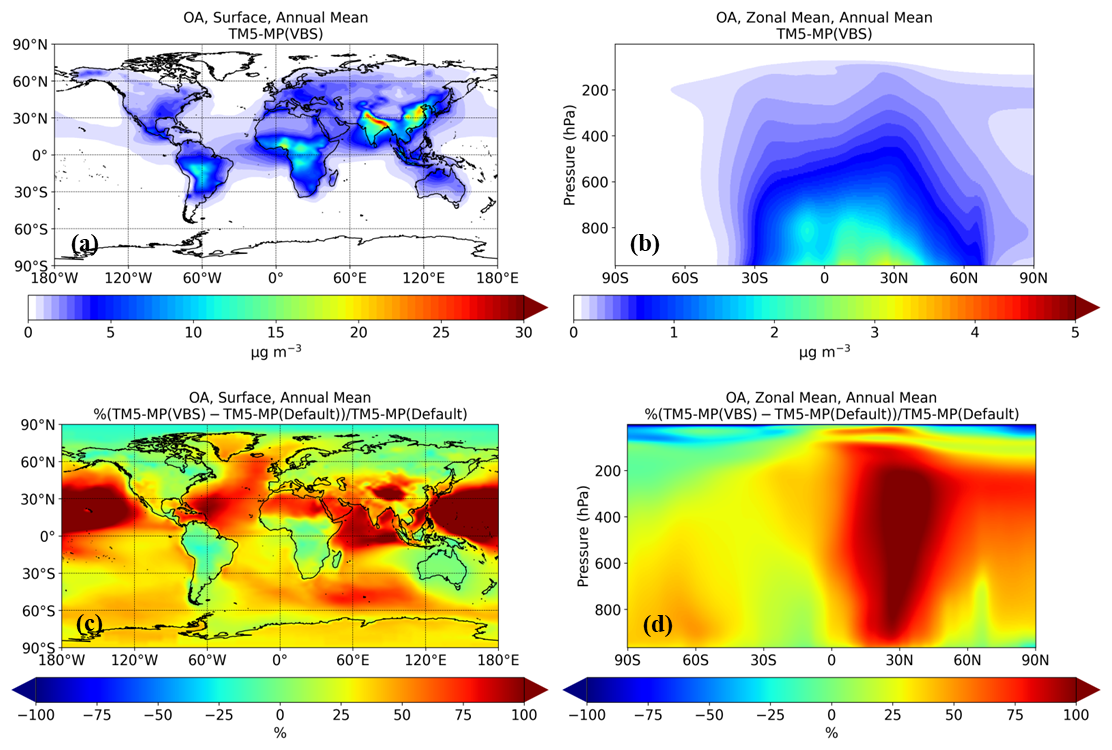
Figure 4Annual mean concentrations of total organic aerosol (in µg m−3): (a) surface concentrations, and (b) zonal values as simulated using the VBS configuration of TM5-MP during 2005. Panels (c) and (d) show the corresponding relative differences (in %) compared to the previous (default) model configuration. A positive change indicates that the VBS configuration predicts more than the default.
The VBS configuration predicts significantly higher annual mean total OA concentrations (by up to 100 %) compared to the default TM5-MP configuration, particularly in regions such as India, China, and northern Africa (Fig. 4c). Significant increases are also predicted over oceanic regions, including the Indian, Atlantic and Pacific Oceans. In addition to S/IVOC emissions from shipping (Fig. 1), this increase is largely driven by the long-range transport of IVOCs, which contributes to SOA-iv formation far from emission sources (Aiken et al., 2009; Hildebrandt et al., 2010). This is further supported by the higher increases in total OA concentrations predicted in these regions during winter compared to summer (Fig. S11), attributed to higher SOA-iv levels in the colder season (Fig. S9). At higher altitudes, the VBS configuration in general predicts higher OA concentrations than the default configuration, particularly between 0 and 45° N (Fig. 4d). However, in the uppermost levels of the model, the default configuration predicts higher OA concentrations. Nevertheless, in both simulations, these values are extremely low (below 0.001 µg m−3), rendering the absolute differences negligible.
The annual mean surface concentrations of POA and SOA in the EC-Earth simulation with the VBS configuration for 2000–2010 are shown in Fig. 5. Similar to the TM5-MP simulation, higher SOA concentrations than POA are predicted. With increasing altitude, SOA concentrations remain higher than POA because organic gases are efficiently transported upward and oxidized, producing lower-volatility SOA. However, compared to the TM5-MP simulation, there are some differences in the global distribution of the annual mean surface total OA for 2005 (Fig. S12). More specifically, in regions such as South America, Africa, India, and China, EC-Earth predicts higher total OA concentrations (up to 4 µg m−3) during 2005 due to the higher production of SOA-iv. There are also regions such as Europe in which TM5-MP predicts higher total OA concentrations than EC-Earth. At higher altitudes, TM5-MP in general predicts higher OA concentrations than EC-Earth, except in the region between 5° S and 10° N up to 600 hPa (Fig. S12). However, in all cases, the differences are lower than 0.5 µg m−3. These discrepancies stem from differences in meteorology since EC-Earth uses meteorology predicted by IFS, while TM5-MP relies on prescribed reanalysis data. More specifically, in these regions, either lower predicted temperatures or lower precipitation rates in EC-Earth affect OA concentrations through partitioning and deposition, respectively (Fig. S13).
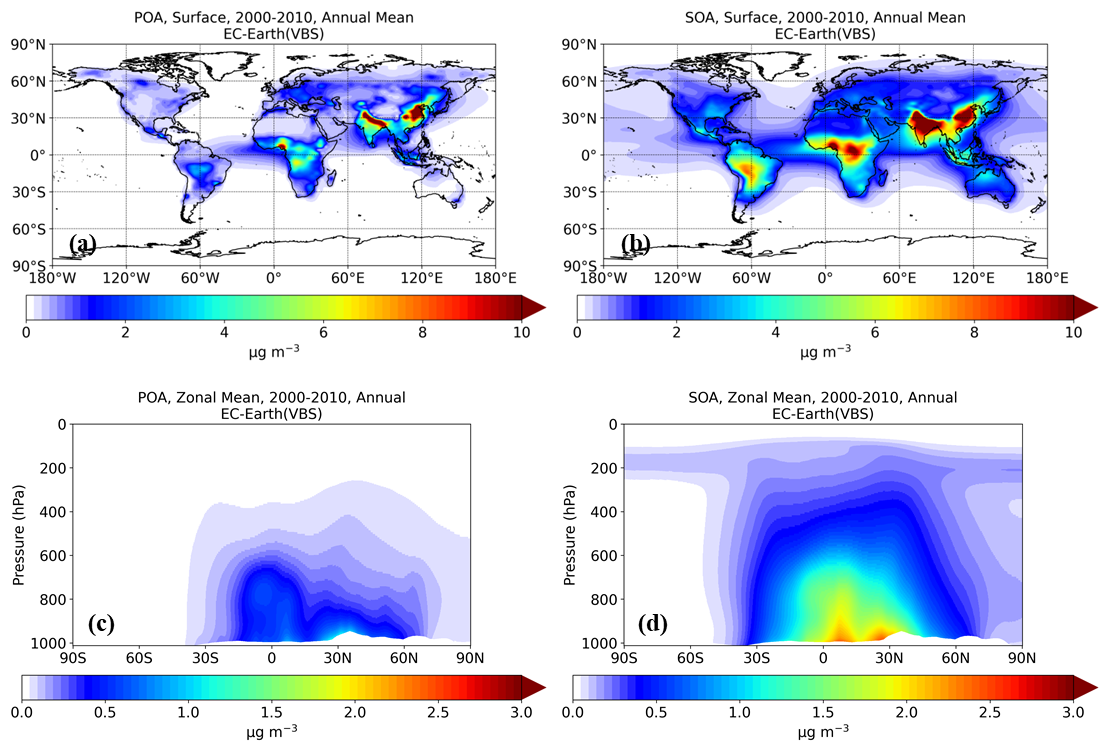
Figure 5Annual mean concentrations of POA and SOA (in µg m−3): (a, b) surface concentrations, and (c, d) zonal values as simulated using the VBS configuration of EC-Earth during 2000–2010.
Overall, higher concentrations of OA are predicted by both models in regions such as India, South America, southern Africa, and China, where precursor emission levels are higher. The annual global mean surface concentration of total OA in the TM5-MP simulation using the VBS configuration is 1.07 µg m−3, corresponding to an increase of 25 % relative to the default configuration. In EC-Earth, the corresponding annual global mean surface concentration is 1.16 µg m−3, representing an increase of 30 % relative to the default configuration. The contributions of individual OA components to the annual global mean surface concentration of OA are 29.9 % from POA, 13.1 % from SOA-sv, 29 % from biogenic SOA, and 28 % from SOA-iv. This highlights the substantial role of IVOCs in contributing to total OA, despite their omission from traditional emission inventories. Additionally, our simulations indicate that temperature influences the partitioning of oxidized IVOC products into the particle phase, with lower temperatures favoring this process. In contrast, oxidized SVOC products are treated as low-volatility compounds in the ORACLE-lite module and predominantly remain in the particle phase under typical atmospheric conditions.
3.3 Models evaluation
Figure 6 shows the comparison between predicted PM2.5 OA concentrations and corresponding measurements for both the TM5-MP and EC-Earth simulations during 2005. Each point on the scatterplot represents a monthly average value at a specific monitoring station. Compared to the default configuration, the VBS configuration of TM5-MP predicts higher OA concentrations at all stations, with model results generally falling closer to the 1 : 1 line. More specifically, in both TM5-MP simulations, OA concentrations are generally underpredicted at the examined stations, as indicated by negative MB and NMB values (Table 3). However, the VBS configuration reduces this underprediction by approximately half (MB = −0.28 µg m−3, NMB = −13.2 %) compared to the default configuration (MB = −0.57 µg m−3, NMB = −27.1 %). Additionally, both NME and RMSE values, which are relatively low in the default simulation (NME = 42 %, RMSE = 1.57 µg m−3), improve further in the VBS simulation (NME = 38.9 %, RMSE = 1.5 µg m−3), indicating reduced scatter. The same applies for MAGE, which decreased from 0.89 µg m−3 in the default simulation to 0.82 µg m−3 in the VBS simulation. The corresponding EC-Earth metrics for 2005 for both configurations are also shown in Table 3. EC-Earth also underpredicts OA concentrations at the examined stations. However, the VBS configuration of EC-Earth reduces the underprediction by approximately a factor of three (MB = −0.17 µg m−3, NMB = −8.1 %) compared to the default configuration (MB = −0.54 µg m−3, NMB = −25.7 %). Compared to the standalone TM5-MP simulation with the VBS configuration, MB and NMB are lower, whereas MAGE and NME are higher (MAGE = 0.94 µg m−3, NME = 44.5 %). This mainly indicates that the additional SOA-iv production in EC-Earth, resulting from differences in meteorological treatment, further reduces systematic errors but increases bias and scatter.
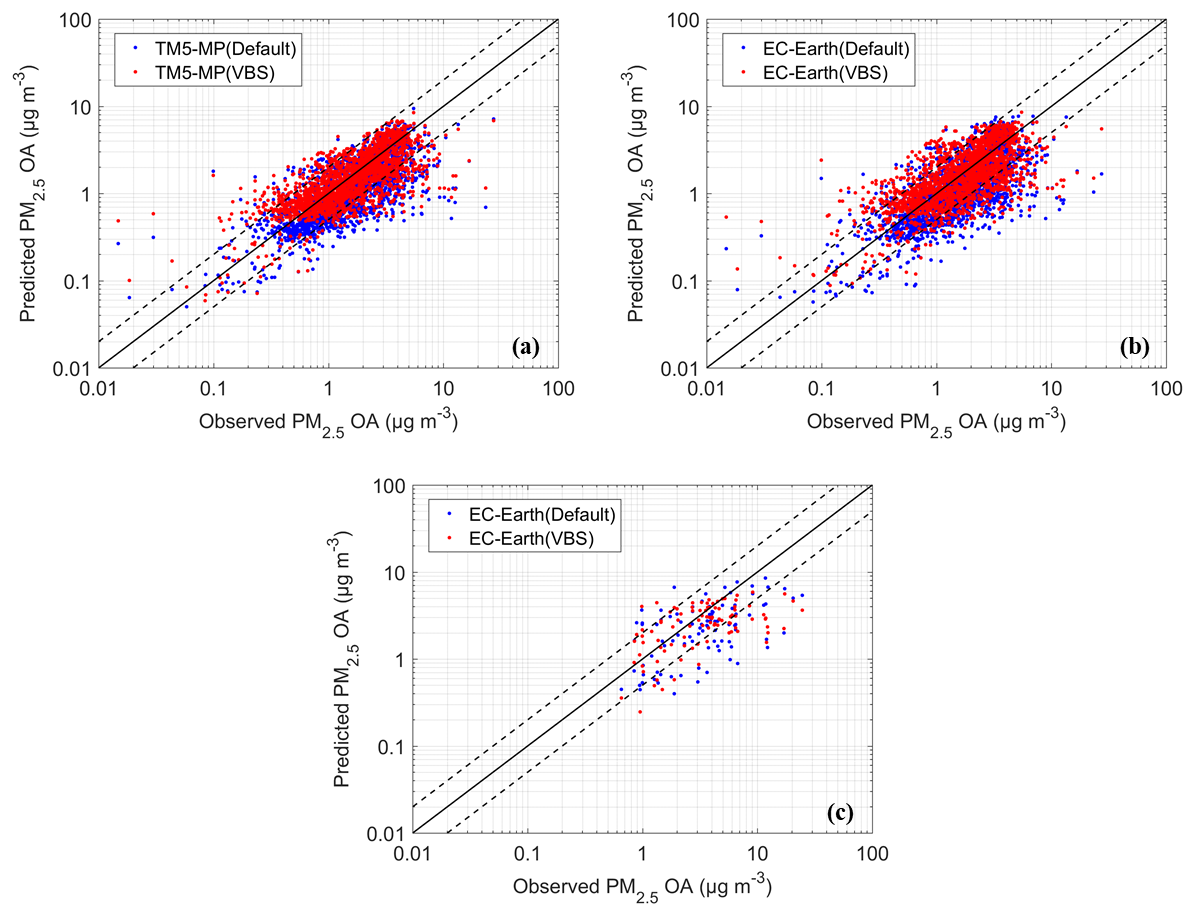
Figure 6Organic mass concentrations from simulations of: (a) TM5-MP during 2005, (b) EC-Earth during 2005, and (c) EC-Earth during 2010. Scatterplots of the first row compare predicted PM2.5 OA concentrations (in µg m−3) with observations from both the IMPROVE and EMEP monitoring networks, while the second row shows a single comparison only with EMEP. Models' results are shown for the default configuration (blue) and the VBS configuration (red). Each point represents a monthly average value at a monitoring site.
Table 3Evaluation metrics comparing monthly averaged predicted PM2.5 OA concentrations with IMPROVE and EMEP observations for the simulations of TM5-MP and EC-Earth.
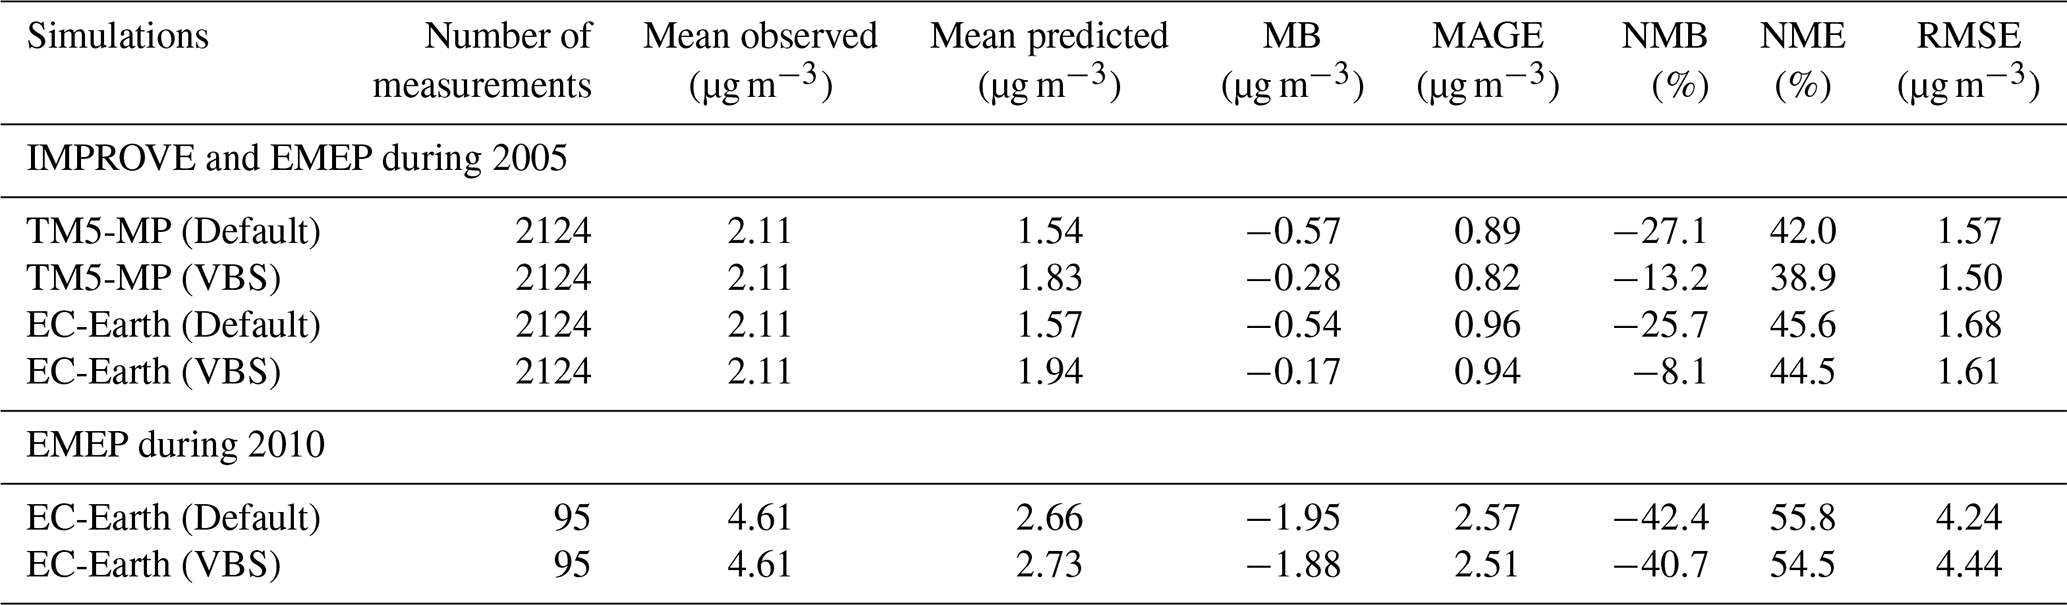
Figure 7 shows the annual cycle of monthly mean PM2.5 OA concentrations at EMEP and IMPROVE sites in the TM5-MP offline and EC-Earth simulations during 2005. For TM5-MP, the VBS configuration predicts higher concentrations throughout the year compared to the default configuration. However, PM2.5 OA is still underpredicted, particularly at European sites and during winter. The same applies for EC-Earth simulations. Because of the limited availability of European sites during 2005 (only 3 stations), EC-Earth online simulations were also evaluated for 2010, when data from 8 stations were available, providing a more robust evaluation of European predictions considering that the differences in predicted OA concentrations between online and offline (TM5-MP) simulations of EC-Earth are relatively small. The VBS configuration of EC-Earth slightly reduces the underprediction of OA concentrations in Europe (MB = −1.88 µg m−3, NMB = −40.7 %) compared to the default configuration (MB = −1.95 µg m−3, NMB = −42.4 %) but the bias remains substantial, especially during winter (Fig. 7e). This underestimation may result from the omission of oxidation of biomass burning emissions by NO3 radicals, as well as uncertainties in the biomass burning emissions themselves (Reddington et al., 2019; Hua et al., 2024).
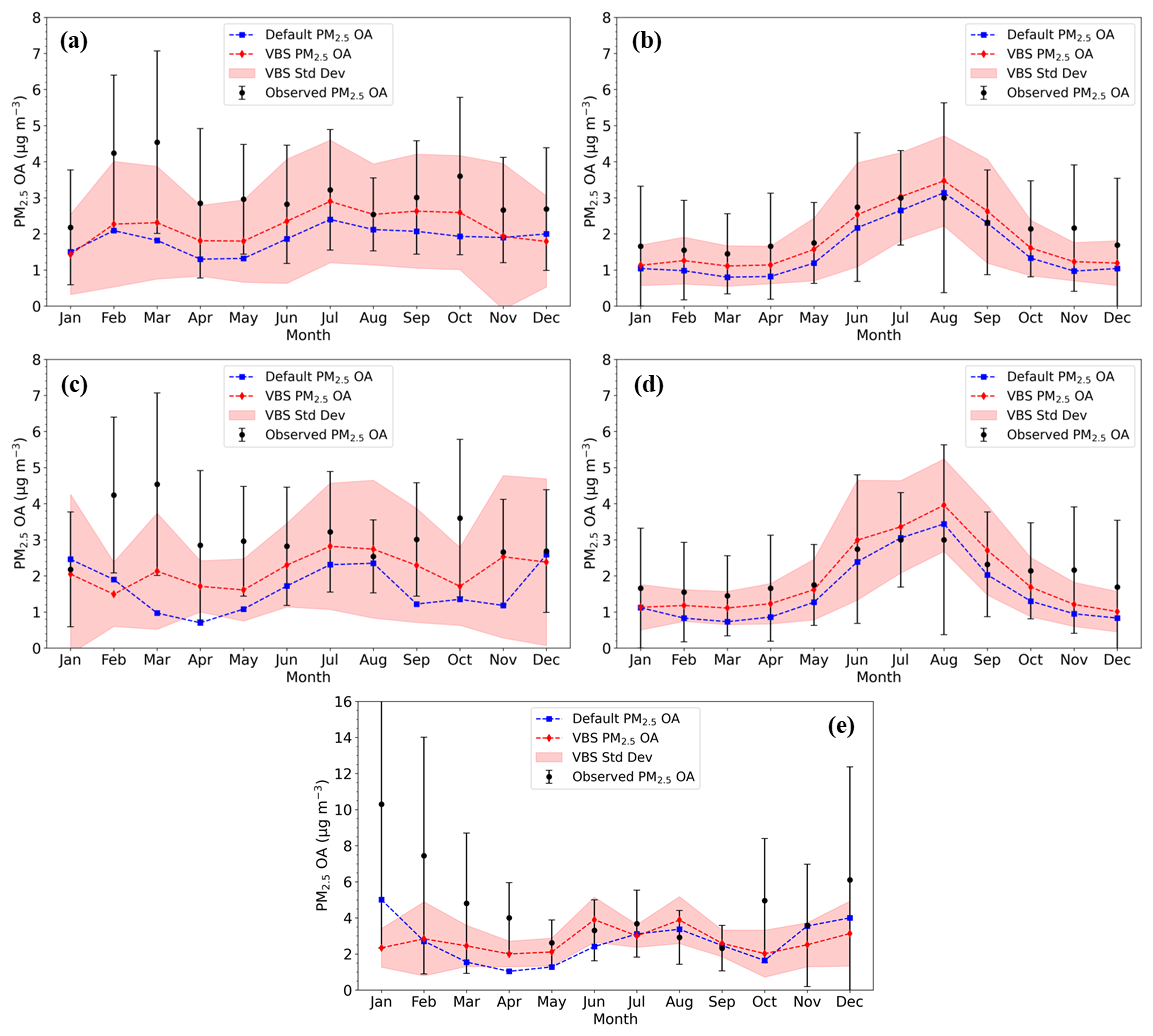
Figure 7Annual cycles of monthly mean PM2.5 OA concentrations. The top row shows results from the standalone TM5-MP simulations at: (a) EMEP sites and (b) IMPROVE sites during 2005; the middle row shows results from the EC-Earth simulation at: (c) EMEP sites and (d) IMPROVE sites during 2005; and (e) shows results from the EC-Earth simulation at EMEP sites during 2010. The red line represents the mean predicted by the VBS simulation, with red shading indicating the standard deviation. The blue line represents the mean predicted by the default simulation. Black dots show the observed mean values, with vertical lines showing the corresponding standard deviations.
Despite uncertainties in the emissions for fuel combustion and biomass burning, the predictions of OA concentrations using the VBS configuration show improved performance and are generally in good agreement with measurements. Please note that the formation of SOA from anthropogenic VOC emissions (to reduce computational cost) and from oxidation by NO3 radicals is neglected in the model, which may partially explain the remaining bias. The previous study of Tsimpidi et al. (2014) indicated that SOA from anthropogenic VOCs contributes only about 15 % to the global average surface OA concentration. Additionally, the absence of biogenic SOA formation in the models from sesquiterpenes may also contribute to the underprediction (Bergman et al., 2022; Dada et al., 2023).
We have implemented a lite configuration of the ORACLE module into the TM5-MP CTM, which represents the chemistry-transport component of the EC-Earth3-AerChem ESM. This version of the module applies the VBS framework to simulate SOA formation from LVOCs, SVOCs, and IVOCs.
The incorporation of ORACLE-lite reduced the bias of the OA predictions both in the offline and online simulations of EC-Earth3-AerChem. The models evaluation against monthly measured PM2.5 OA concentrations from Europe (EMEP) and US (IMPROVE) stations indicated that OA concentrations were generally underpredicted. However, the VBS configuration reduced NMB by nearly half in TM5-MP and a factor of three in EC-Earth and improved the overall agreement. There is a remaining NMB in both models (−13 % in TM5-MP and −8 % in EC-Earth) which can be explained by the absence of SOA formation from anthropogenic VOC emissions and sesquiterpenes or via oxidation by NO3 radicals, which can be subjects for future work. Compared to the traditional POA (default) configuration, the VBS implementation increased the global annual mean surface OA concentration in TM5-MP by 25 % to 1.07 µg m−3 and the atmospheric OA burden by 50 %, to 3.67 Tg. Corresponding predictions from EC-Earth were slightly higher, with a surface OA concentration of 1.16 µg m−3 and an atmospheric burden of 3.83 Tg, representing increases of 30 % and 60 %, respectively. These changes resulted primarily from the inclusion of SOA production from S/IVOCs and the treatment of gas-particle partitioning and chemical aging, processes absent in the default OA scheme.
Our results indicate that SOA is the dominant contributor to total OA surface concentrations and atmospheric burden, whereas POA contributes less than 30 % to both, highlighting the importance of including gas-phase oxidation and partitioning of OA in ESMs. Overall, the lite configuration of ORACLE module captures well the key processes driving OA formation and evolution, offering a more realistic simulation of OA concentrations without significantly increasing computational cost (approximately 8 %). This efficient and robust configuration supports future studies on the climatic impacts of OA within ESMs.
The EC-Earth3-AerChem code (version 3.5.0) is available to members of the EC-Earth consortium via the EC-Earth website (https://ec-earth.org/, last access: 12 November 2025). Model components developed at ECMWF, such as the IFS atmospheric model, are the intellectual property of ECMWF and its member states. Access to the EC-Earth3-AerChem version 3.5.0 source code can be requested through the EC-Earth website (http://www.ec-earth.org/, last access: 12 November 2025) and may be granted upon signing a software license agreement with ECMWF. Due to licensing restrictions, access is currently limited to European users. The post-processing scripts used for creating the main figures of the manuscript are available at Zenodo (https://doi.org/10.5281/zenodo.18255310; Kakavas, 2026a). The code developed in this study and all relevant features, including the ORACLE v1.0 module and ISORROPIA-lite as part of the EC-Earth, are archived with a restricted access doi (https://doi.org/10.5281/zenodo.19186090; Kakavas et al., 2026) and have already been incorporated into the official development branch of EC-Earth3, making them part of future released versions.
The data used for the model evaluation are from two freely available observational networks: the United States Interagency Monitoring of Protected Visual Environments (IMPROVE; https://views.cira.colostate.edu/fed/QueryWizard/, last access: 2 June 2025, login required) and the European Monitoring and Evaluation Project (EMEP; https://ebas-data.nilu.no/Default.aspx, last access: 2 June 2025). The monthly measurements of PM2.5 OA from EMEP and IMPROVE networks used in this study are available at: https://doi.org/10.5281/zenodo.19185962 (Kakavas, 2026b). The data produced in the study are available from the authors upon request.
The supplement related to this article is available online at https://doi.org/10.5194/gmd-19-4271-2026-supplement.
SK contributed to the implementation of the ORACLE-lite module into the model, conducted the CTM simulations, analyzed the results, and wrote the paper. SM designed the study, integrated the ORACLE-lite code into the model, conducted the ESM simulations, and also contributed to writing the paper. APT and VAK provided the ORACLE-lite code, supported its integration into the model, and contributed to manuscript preparation. SNP supervised the study and contributed to manuscript writing.
The contact author has declared that none of the authors has any competing interests.
Publisher's note: Copernicus Publications remains neutral with regard to jurisdictional claims made in the text, published maps, institutional affiliations, or any other geographical representation in this paper. The authors bear the ultimate responsibility for providing appropriate place names. Views expressed in the text are those of the authors and do not necessarily reflect the views of the publisher.
Computational time was granted from the National Infrastructures for Research and Technology S.A. (GRNET S.A.) in the National HPC facility – ARIS – under project ID 010003 (AEROSIM). Acknowledgement is made for the use of ECMWF's computing and archive facilities in this research (Special Project: EC-Earth Atmospheric Composition developments).
This work was supported by the REINFORCE research project, implemented in the framework of HFRI called “Basic Research Financing (Horizontal Support of all Sciences)” under the National Recovery and Resilience Plan “Greece 2.0” funded by the European Union – Next Generation EU (HFRI project no. 15155). We also acknowledge support by the project Atmospheric nanoparticles, air quality and human health (NANOSOMs) funded by the Hellenic Foundation for Research and Innovation (HFRI) (grant no. 11504).
This paper was edited by Cynthia Whaley and reviewed by two anonymous referees.
Aiken, A. C., DeCarlo, P. F., Kroll, J. H., Worsnop, D. R., Huffman, J. A., Docherty, K. S., Ulbrich, I. M., Mohr, C., Kimmel, J. R., Sueper, D., Sun, Y., Zhang, Q., Trimborn, A., Northway, M., Ziemann, P. J., Canagaratna, M. R., Onasch, T. B., Alfarra, M. R., Prevot, A. S. H., Dommen, J., Duplissy, J., Metzger, A., Baltensperger, U., and Jimenez, J. L.: O/C and OM/OC ratios of primary, secondary, and ambient organic aerosols with high-resolution time-of-flight aerosol mass spectrometry, Environ. Sci. Technol., 42, 4478–4485, https://doi.org/10.1021/es703009q, 2008.
Aiken, A. C., Salcedo, D., Cubison, M. J., Huffman, J. A., DeCarlo, P. F., Ulbrich, I. M., Docherty, K. S., Sueper, D., Kimmel, J. R., Worsnop, D. R., Trimborn, A., Northway, M., Stone, E. A., Schauer, J. J., Volkamer, R. M., Fortner, E., de Foy, B., Wang, J., Laskin, A., Shutthanandan, V., Zheng, J., Zhang, R., Gaffney, J., Marley, N. A., Paredes-Miranda, G., Arnott, W. P., Molina, L. T., Sosa, G., and Jimenez, J. L.: Mexico City aerosol analysis during MILAGRO using high resolution aerosol mass spectrometry at the urban supersite (T0) – Part 1: Fine particle composition and organic source apportionment, Atmos. Chem. Phys., 9, 6633–6653, https://doi.org/10.5194/acp-9-6633-2009, 2009.
Balsamo, G., Viterbo, P., Beijaars, A., van den Hurk, B., Hirschi, M., Betts, A. K., and Scipal, K.: A revised hydrology for the ECMWF model: Verification from field site to terrestrial water storage and impact in the integrated forecast system, J. Hydrometeorol., 10, 623–643, https://doi.org/10.1175/2008JHM1068.1, 2009.
Bergman, T., Makkonen, R., Schrödner, R., Swietlicki, E., Phillips, V. T. J., Le Sager, P., and van Noije, T.: Description and evaluation of a secondary organic aerosol and new particle formation scheme within TM5-MP v1.2, Geosci. Model Dev., 15, 683–713, https://doi.org/10.5194/gmd-15-683-2022, 2022.
Bergström, R., Denier van der Gon, H. A. C., Prévôt, A. S. H., Yttri, K. E., and Simpson, D.: Modelling of organic aerosols over Europe (2002–2007) using a volatility basis set (VBS) framework: application of different assumptions regarding the formation of secondary organic aerosol, Atmos. Chem. Phys., 12, 8499–8527, https://doi.org/10.5194/acp-12-8499-2012, 2012.
Chen, X., Yang, W., Wang, Z., Li, J., Hu, M., An, J., Wu, Q., Wang, Z., Chen, H., and Wei, Y.: Improving new particle formation simulation by coupling a volatility-basis set (VBS) organic aerosol module in NAQPMS+APM, Atmos. Environ., 204, 1–11, https://doi.org/10.1016/j.atmosenv.2019.01.053, 2019.
Craig, A., Valcke, S., and Coquart, L.: Development and performance of a new version of the OASIS coupler, OASIS3-MCT_3.0, Geosci. Model Dev., 10, 3297–3308, https://doi.org/10.5194/gmd-10-3297-2017, 2017.
Crippa, M., Canonaco, F., Slowik, J. G., El Haddad, I., DeCarlo, P. F., Mohr, C., Heringa, M. F., Chirico, R., Marchand, N., Temime-Roussel, B., Abidi, E., Poulain, L., Wiedensohler, A., Baltensperger, U., and Prévôt, A. S. H.: Primary and secondary organic aerosol origin by combined gas-particle phase source apportionment, Atmos. Chem. Phys., 13, 8411–8426, https://doi.org/10.5194/acp-13-8411-2013, 2013.
Dada, L., Stolzenburg, D., Simon, M., Fischer, L., Heinritzi, M., Wang, M., Xiao, M., Vogel, A. L., Ahonen, L., Amorim, A., Baalbaki, R., Baccarini, A., Baltensperger, U., Bianchi, F., Daellenbach, K. R., DeVivo, J., Dias, A., Dommen, J., Duplissy, J., Finkenzeller, H., Hansel, A., He, XC., Hofbauer, V., Hoyle, C. R., Kangasluoma, J., Kim, C., Kürten, A., Kvashnin, A., Mauldin, R., Makhmutov, V., Marten, R., Mentler, B., Nie, W., Petäjä, T., Quéléver, L. L. J., Saathoff, H., Tauber, C., Tome, A., Molteni, U., Volkamer, R., Wagner, R., Wagner, A. C., Wimmer, D., Winkler, P. M., Yan, C., Zha, Q., Rissanen, M., Gordon, H., Curtius, J., Worsnop, D. R., Lehtipalo, K., Donahue, N. M., Kirkby, J., El Haddad, I., and Kulmala, M.: Role of sesquiterpenes in biogenic new particle formation, Sci. Adv., 9, 36, https://doi.org/10.1126/sciadv.adi5297, 2023.
Dee, D. P., Uppala, S. M., Simmons, A. J., Berrisford, P., Poli, P., Kobayashi, S., Andrae, U., Balmaseda, M. A., Balsamo, G., Bauer, P., Bechtold, P., Beljaars, A. C. M., van de Berg, L., Bidlot, J., Bormann, N., Delsol, C., Dragani, R., Fuentes, M., Geer, A. J., Haimberger, L., Healy, S. B., Hersbach, H., Hólm, E. V., Isaksen, L., Kållberg, P., Köhler, M., Matricardi, M., McNally, A. P., Monge-Sanz, B. M., Morcrette, J.-J., Park, B.-K., Peubey, C., de Rosnay, P., Tavolato, C., Thépaut, J.-N., and Vitart, F.: The ERA-Interim reanalysis: configuration and performance of the data assimilation system, Q. J. Roy. Meteor. Soc., 137, 553–597, https://doi.org/10.1002/qj.828, 2011.
Donahue, N. M., Robinson, A. L., Stanier, C. O., and Pandis, S. N.: Coupled partitioning, dilution, and chemical aging of semivolatile organics, Environ. Sci. Technol., 40, 2635–2643, 2006.
Döscher, R., Acosta, M., Alessandri, A., Anthoni, P., Arsouze, T., Bergman, T., Bernardello, R., Boussetta, S., Caron, L.-P., Carver, G., Castrillo, M., Catalano, F., Cvijanovic, I., Davini, P., Dekker, E., Doblas-Reyes, F. J., Docquier, D., Echevarria, P., Fladrich, U., Fuentes-Franco, R., Gröger, M., v. Hardenberg, J., Hieronymus, J., Karami, M. P., Keskinen, J.-P., Koenigk, T., Makkonen, R., Massonnet, F., Ménégoz, M., Miller, P. A., Moreno-Chamarro, E., Nieradzik, L., van Noije, T., Nolan, P., O'Donnell, D., Ollinaho, P., van den Oord, G., Ortega, P., Prims, O. T., Ramos, A., Reerink, T., Rousset, C., Ruprich-Robert, Y., Le Sager, P., Schmith, T., Schrödner, R., Serva, F., Sicardi, V., Sloth Madsen, M., Smith, B., Tian, T., Tourigny, E., Uotila, P., Vancoppenolle, M., Wang, S., Wårlind, D., Willén, U., Wyser, K., Yang, S., Yepes-Arbós, X., and Zhang, Q.: The EC-Earth3 Earth system model for the Coupled Model Intercomparison Project 6, Geosci. Model Dev., 15, 2973–3020, https://doi.org/10.5194/gmd-15-2973-2022, 2022.
Eyring, V., Bony, S., Meehl, G. A., Senior, C. A., Stevens, B., Stouffer, R. J., and Taylor, K. E.: Overview of the Coupled Model Intercomparison Project Phase 6 (CMIP6) experimental design and organization, Geosci. Model Dev., 9, 1937–1958, https://doi.org/10.5194/gmd-9-1937-2016, 2016.
Fang, Z., Li, C., He, Q., Czech, H., Gröger, T., Zeng, J., Fang, H., Xiao, S., Pardo, M., Hartner, E., Meidan, D., Wang, X., Zimmermann, R., Laskin, A., and Rudich, Y.: Secondary organic aerosols produced from photochemical oxidation of secondarily evaporated biomass burning organic gases: Chemical composition, toxicity, optical properties, and climate effect, Environ. Int., 157, 106801, https://doi.org/10.1016/j.envint.2021.106801, 2021.
Gao, C. Y., Bauer, S. E., Tsigaridis, K., and Im, U.: Global influence of organic aerosol volatility on aerosol microphysical processes: Composition and number, J. Adv. Modeling Earth Sy., 16, e2023MS004185, https://doi.org/10.1029/2023MS004185, 2024.
Grieshop, A. P., Logue, J. M., Donahue, N. M., and Robinson, A. L.: Laboratory investigation of photochemical oxidation of organic aerosol from wood fires 1: measurement and simulation of organic aerosol evolution, Atmos. Chem. Phys., 9, 1263–1277, https://doi.org/10.5194/acp-9-1263-2009, 2009.
Heald, C. L., Jacob, D. J., Park, R. J., Russell, L. M., Huebert, B. J., Seinfeld, J. H., Liao, H., and Weber, R. J.: A large organic aerosol source in the free troposphere missing from current models, Geophys. Res. Lett., 32, L18809, https://doi.org/10.1029/2005gl023831, 2005.
Hennigan, C. J., Miracolo, M. A., Engelhart, G. J., May, A. A., Presto, A. A., Lee, T., Sullivan, A. P., McMeeking, G. R., Coe, H., Wold, C. E., Hao, W.-M., Gilman, J. B., Kuster, W. C., de Gouw, J., Schichtel, B. A., Collett Jr., J. L., Kreidenweis, S. M., and Robinson, A. L.: Chemical and physical transformations of organic aerosol from the photo-oxidation of open biomass burning emissions in an environmental chamber, Atmos. Chem. Phys., 11, 7669–7686, https://doi.org/10.5194/acp-11-7669-2011, 2011.
Hildebrandt, L., Engelhart, G. J., Mohr, C., Kostenidou, E., Lanz, V. A., Bougiatioti, A., DeCarlo, P. F., Prevot, A. S. H., Baltensperger, U., Mihalopoulos, N., Donahue, N. M., and Pandis, S. N.: Aged organic aerosol in the Eastern Mediterranean: the Finokalia Aerosol Measurement Experiment – 2008, Atmos. Chem. Phys., 10, 4167–4186, https://doi.org/10.5194/acp-10-4167-2010, 2010.
Hu, W., Hu, M., Hu, W., Jimenez, J. L., Yuan, B., Chen, W., Wang, M., Wu, Y., Chen, C., Wang, Z., Peng, J., Zeng, L., and Shao, M.: Chemical composition, sources and aging process of sub-micron aerosols in Beijing: contrast between summer and winter, J. Geophys. Res.-Atmos., 121, 1955–1977, https://doi.org/10.1002/2015JD024020, 2016.
Hua, W., Lou, S., Huang, X., Xue, L., Ding, K., Wang, Z., and Ding, A.: Diagnosing uncertainties in global biomass burning emission inventories and their impact on modeled air pollutants, Atmos. Chem. Phys., 24, 6787–6807, https://doi.org/10.5194/acp-24-6787-2024, 2024.
Huijnen, V., Williams, J., van Weele, M., van Noije, T., Krol, M., Dentener, F., Segers, A., Houweling, S., Peters, W., de Laat, J., Boersma, F., Bergamaschi, P., van Velthoven, P., Le Sager, P., Eskes, H., Alkemade, F., Scheele, R., Nédélec, P., and Pätz, H.-W.: The global chemistry transport model TM5: description and evaluation of the tropospheric chemistry version 3.0, Geosci. Model Dev., 3, 445–473, https://doi.org/10.5194/gmd-3-445-2010, 2010.
IPCC: Climate Change 2021: The Physical Science Basis. Working Group I Contribution to the Sixth Assessment Report of the Intergovernmental Panel on Climate Change, edited by: Masson-Delmotte, V., Zhai, P., Pirani, A., Connors, S. L., Péan, C., Berger, S., Caud, N., Chen, Y., Goldfarb, L., Gomis, M. I., Huang, M., Leitzell, K., Lonnoy, E., Matthews, J. B. R., Maycock, T. K., Waterfield, T., Yelekçi, O., Yu, R., and Zhou, B., Cambridge University Press, Cambridge, United Kingdom and New York, NY, USA, 2391 pp., https://doi.org/10.1017/9781009157896, 2021.
Irfan, M., Kühn, T., Yli-Juuti, T., Laakso, A., Holopainen, E., Worsnop, D. R., Virtanen, A., and Kokkola, H.: A model study investigating the sensitivity of aerosol forcing to the volatilities of semi-volatile organic compounds, Atmos. Chem. Phys., 24, 8489–8506, https://doi.org/10.5194/acp-24-8489-2024, 2024.
Jathar, S. H., Farina, S. C., Robinson, A. L., and Adams, P. J.: The influence of semi-volatile and reactive primary emissions on the abundance and properties of global organic aerosol, Atmos. Chem. Phys., 11, 7727–7746, https://doi.org/10.5194/acp-11-7727-2011, 2011.
Jiang, J., Aksoyoglu, S., El-Haddad, I., Ciarelli, G., Denier van der Gon, H. A. C., Canonaco, F., Gilardoni, S., Paglione, M., Minguillón, M. C., Favez, O., Zhang, Y., Marchand, N., Hao, L., Virtanen, A., Florou, K., O'Dowd, C., Ovadnevaite, J., Baltensperger, U., and Prévôt, A. S. H.: Sources of organic aerosols in Europe: a modeling study using CAMx with modified volatility basis set scheme, Atmos. Chem. Phys., 19, 15247–15270, https://doi.org/10.5194/acp-19-15247-2019, 2019.
Jöckel, P., Tost, H., Pozzer, A., Brühl, C., Buchholz, J., Ganzeveld, L., Hoor, P., Kerkweg, A., Lawrence, M. G., Sander, R., Steil, B., Stiller, G., Tanarhte, M., Taraborrelli, D., van Aardenne, J., and Lelieveld, J.: The atmospheric chemistry general circulation model ECHAM5/MESSy1: consistent simulation of ozone from the surface to the mesosphere, Atmos. Chem. Phys., 6, 5067–5104, https://doi.org/10.5194/acp-6-5067-2006, 2006.
Kakavas, S.: Post-process scripts, Zenodo [code], https://doi.org/10.5281/zenodo.18255310, 2026a.
Kakavas, S.: PM2.5 OA measurements from EMEP and IMPROVE networks for 2005, Zenodo [data set], https://doi.org/10.5281/zenodo.19185962, 2026b.
Kakavas, S., Pandis, S. N., and Nenes, A.: ISORROPIA-lite: A comprehensive atmospheric aerosol thermodynamics module for Earth System Models, Tellus B, 74, 1–23, 2022.
Kakavas, S., Myriokefalitakis, S., Tsimpidi, A., Karydis, V., and Pandis, S.: TM5MP-EC-Earth3, Zenodo [code], https://doi.org/10.5281/zenodo.19186090, 2026.
Kanakidou, M., Seinfeld, J. H., Pandis, S. N., Barnes, I., Dentener, F. J., Facchini, M. C., Van Dingenen, R., Ervens, B., Nenes, A., Nielsen, C. J., Swietlicki, E., Putaud, J. P., Balkanski, Y., Fuzzi, S., Horth, J., Moortgat, G. K., Winterhalter, R., Myhre, C. E. L., Tsigaridis, K., Vignati, E., Stephanou, E. G., and Wilson, J.: Organic aerosol and global climate modelling: a review, Atmos. Chem. Phys., 5, 1053–1123, https://doi.org/10.5194/acp-5-1053-2005, 2005.
Krol, M., Houweling, S., Bregman, B., van den Broek, M., Segers, A., van Velthoven, P., Peters, W., Dentener, F., and Bergamaschi, P.: The two-way nested global chemistry-transport zoom model TM5: algorithm and applications, Atmos. Chem. Phys., 5, 417–432, https://doi.org/10.5194/acp-5-417-2005, 2005.
Kroll, J. H. and Seinfeld, J. H.: Chemistry of secondary organic aerosol: Formation and evolution of low-volatility organics in the atmosphere, Atmos. Environ., 42, 3593–3624, 2008.
Lim, C. Y., Hagan, D. H., Coggon, M. M., Koss, A. R., Sekimoto, K., de Gouw, J., Warneke, C., Cappa, C. D., and Kroll, J. H.: Secondary organic aerosol formation from the laboratory oxidation of biomass burning emissions, Atmos. Chem. Phys., 19, 12797–12809, https://doi.org/10.5194/acp-19-12797-2019, 2019.
Ma, P., Zhang, P., Shu, J., Yang, B., and Zhang, H.: Characterization of secondary organic aerosol from photo-oxidation of gasoline exhaust and specific sources of major components, Environ. Pollut., 232, 65–72, https://doi.org/10.1016/j.envpol.2017.09.018, 2018.
Monks, P., Granier, C., Fuzzi, S., Stohl, A., Williams, M., Akimoto, H., Amann, M., Baklanov, A., Baltensperger, U., Bey, I., Blake, N., Blake, R., Carslaw, K., Cooper, O., Dentener, F., Fowler, D., Fragkou, E., Frost, G., Generoso, S., Ginoux, P., Grewe, V., Guenther, A., Hansson, H., Henne, S., Hjorth, J., Hofzumahaus, A., Huntrieser, H., Isaksen, I., Jenkin, M., Kaiser, J., Kanakidou, M., Klimont, Z., Kulmala, M., Laj, P., Lawrence, M., Lee, J., Liousse, C., Maione, M., McFiggans, G., Metzger, A., Mieville, A., Moussiopoulos, N., Orlando, J., O'Dowd, C., Palmer, P., Parrish, D., Petzold, A., Platt, U., Pöschl, U., Prévôt, A., Reeves, C., Reimann, S., Rudich, Y., Sellegri, K., Steinbrecher, R., Simpson, D., ten Brink, H., Theloke, J., van der Werf, G., Vautard, R., Vestreng, V., Vlachokostas, C., and von Glasow, R.: Atmospheric composition change – global and regional air quality, Atmos. Environ., 43, 5268–5350, https://doi.org/10.1016/j.atmosenv.2009.08.021, 2009.
Myriokefalitakis, S., Bergas-Massó, E., Gonçalves-Ageitos, M., Pérez García-Pando, C., van Noije, T., Le Sager, P., Ito, A., Athanasopoulou, E., Nenes, A., Kanakidou, M., Krol, M. C., and Gerasopoulos, E.: Multiphase processes in the EC-Earth model and their relevance to the atmospheric oxalate, sulfate, and iron cycles, Geosci. Model Dev., 15, 3079–3120, https://doi.org/10.5194/gmd-15-3079-2022, 2022.
Nault, B. A., Campuzano-Jost, P., Day, D. A., Schroder, J. C., Anderson, B., Beyersdorf, A. J., Blake, D. R., Brune, W. H., Choi, Y., Corr, C. A., de Gouw, J. A., Dibb, J., DiGangi, J. P., Diskin, G. S., Fried, A., Huey, L. G., Kim, M. J., Knote, C. J., Lamb, K. D., Lee, T., Park, T., Pusede, S. E., Scheuer, E., Thornhill, K. L., Woo, J.-H., and Jimenez, J. L.: Secondary organic aerosol production from local emissions dominates the organic aerosol budget over Seoul, South Korea, during KORUS-AQ, Atmos. Chem. Phys., 18, 17769–17800, https://doi.org/10.5194/acp-18-17769-2018, 2018.
Pai, S. J., Heald, C. L., Pierce, J. R., Farina, S. C., Marais, E. A., Jimenez, J. L., Campuzano-Jost, P., Nault, B. A., Middlebrook, A. M., Coe, H., Shilling, J. E., Bahreini, R., Dingle, J. H., and Vu, K.: An evaluation of global organic aerosol schemes using airborne observations, Atmos. Chem. Phys., 20, 2637–2665, https://doi.org/10.5194/acp-20-2637-2020, 2020.
Pandis, S. N., Wexler, A. S., and Seinfeld, J. H.: Secondary organic aerosol formation and transport. 2. Predicting the ambient secondary organic aerosol-size distribution, Atmos. Environ. A-Gen., 27, 2403–2416, 1993.
Pandis, S. N., Donahue, N. M., Murphy, B. N., Riipinen, I., Fountoukis, C., Karnezi, E., Patoulias, D., and Skyllakou, K.: Introductory lecture: atmospheric organic aerosols: insights from the combination of measurements and chemical transport models, Faraday Discuss., 165, 9–24, https://doi.org/10.1039/c3fd00108c, 2013.
Pitchford, M., Malm, W., Schichtel, B., Kumar, N., Lowenthal, D., and Hand, J.: Revised Algorithm for Estimating Light Extinction from IMPROVE Particle Speciation Data, J. Air Waste Manage., 57, 1326–1336, https://doi.org/10.3155/1047-3289.57.11.1326, 2007.
Reddington, C. L., Morgan, W. T., Darbyshire, E., Brito, J., Coe, H., Artaxo, P., Scott, C. E., Marsham, J., and Spracklen, D. V.: Biomass burning aerosol over the Amazon: analysis of aircraft, surface and satellite observations using a global aerosol model, Atmos. Chem. Phys., 19, 9125–9152, https://doi.org/10.5194/acp-19-9125-2019, 2019.
Reid, J. S., Koppmann, R., Eck, T. F., and Eleuterio, D. P.: A review of biomass burning emissions part II: intensive physical properties of biomass burning particles, Atmos. Chem. Phys., 5, 799–825, https://doi.org/10.5194/acp-5-799-2005, 2005.
Riipinen, I., Talvinen, S., Chassaing, A., Georgakaki P., Li, X., García-Pando, P. C., Bergman, T., Kommula, M. S., Proske, U., Gkouvousis, A., Tsimpidi, P. A., Chatziparaschos, M., Neuberger, A., Karydis, A. V., Calderón, M. S., Romakkaniemi, S., Partridge, G. D., Khadir, T., Dada, L., van Noije, T., Decesari, S., Seland, Ø., Zieger, P., Bender, F., Carlslaw, K., Cermak, J., Costa-Surós, M., Ageitos, M. G., Gramlich, Y., Haugvaldstad, W. O., Holopainen, E., Hoose, C., Jorba, O., Kakavas, S., Kanakidou, M., Kokkola, H., Krehci, R., Kühn, T., Kulmala, M., La Sager, P., Makkonen, R., Manavi, E. I. S., Mentel, F. T., Milousis, A., Myriokefalitakis, S., Nenes, A., Nieminen, T., Pandis, S. N., Patoulias, D., Petäjä, T., Quaas, J., Regayre, L., Scholz, M. C. S., Schulz, M., Skyllakou, K., Sousse, R., Stier, P., Thomas, M. A., Villinger, J. T., Virtanen, A., Wyser, K., and Ekman, M. L. A.: Treatment of Key Aerosol and Cloud Processes in Earth System Models – Recommendations from the FORCeS Project, Tellus B, 78, 1–66, https://doi.org/10.16993/tellusb.1883, 2026.
Robinson, A. L., Donahue, N. M., Shrivastava, M. K., Weitkamp, E. A., Sage, A. M., Grieshop, A. P., Lane, T. E., Pierce, J. R., and Pandis, S. N.: Rethinking organic aerosols: Semivolatile emissions and photochemical aging, Science, 315, 1259–1262, 2007.
Rousset, C., Vancoppenolle, M., Madec, G., Fichefet, T., Flavoni, S., Barthélemy, A., Benshila, R., Chanut, J., Levy, C., Masson, S., and Vivier, F.: The Louvain-La-Neuve sea ice model LIM3.6: global and regional capabilities, Geosci. Model Dev., 8, 2991–3005, https://doi.org/10.5194/gmd-8-2991-2015, 2015.
Schauer, J. J., Kleeman, M. J., Cass, G. R., and Simoneit, B. R. T.: Measurement of emissions from air pollution sources. 5. C1-C32 organic compounds from gasoline-powered motor vehicles, Environ. Sci. Technol., 36, 1169–1180, https://doi.org/10.1021/es0108077, 2002.
Sengupta, D., Samburova, V., Bhattarai, C., Watts, A. C., Moosmüller, H., and Khlystov, A. Y.: Polar semivolatile organic compounds in biomass-burning emissions and their chemical transformations during aging in an oxidation flow reactor, Atmos. Chem. Phys., 20, 8227–8250, https://doi.org/10.5194/acp-20-8227-2020, 2020.
Shrivastava, M., Fast, J., Easter, R., Gustafson Jr., W. I., Zaveri, R. A., Jimenez, J. L., Saide, P., and Hodzic, A.: Modeling organic aerosols in a megacity: comparison of simple and complex representations of the volatility basis set approach, Atmos. Chem. Phys., 11, 6639–6662, https://doi.org/10.5194/acp-11-6639-2011, 2011.
Shrivastava, M., Cappa, C. D., Fan, J., Goldstein, A. H., Guenther, A. B., Jimenez, J. L., Kuang, C., Laskin, A., Martin, S. T., Ng, N. L., Petaja, T., Pierce, J. R., Rasch, P. J., Roldin, P., Seinfeld, J. H., Shilling, J., Smith, J. N., Thornton, J. A., Volkamer, R., Wang, J., Worsnop, D. R., Zaveri, R. A., Zelenyuk, A., and Zhang, Q.: Recent advances in understanding secondary organic aerosol: implications for global climate forcing, Rev. Geophys., 55, 509–559, https://doi.org/10.1002/2016RG000540, 2017.
Spracklen, D. V., Jimenez, J. L., Carslaw, K. S., Worsnop, D. R., Evans, M. J., Mann, G. W., Zhang, Q., Canagaratna, M. R., Allan, J., Coe, H., McFiggans, G., Rap, A., and Forster, P.: Aerosol mass spectrometer constraint on the global secondary organic aerosol budget, Atmos. Chem. Phys., 11, 12109–12136, https://doi.org/10.5194/acp-11-12109-2011, 2011.
Taylor, K. E., Williamson, D., and Zwiers, F.: The sea surface temperature and sea ice concentration boundary conditions for AMIP II simulations, Progr. Clim. Model Diagnosis Intercomp., PCMDI Report No. 60, 1–24, https://pcmdi.llnl.gov/report/pdf/60.pdf?id=42 (last access: 14 May 2025), 2000.
Tsigaridis, K., Daskalakis, N., Kanakidou, M., Adams, P. J., Artaxo, P., Bahadur, R., Balkanski, Y., Bauer, S. E., Bellouin, N., Benedetti, A., Bergman, T., Berntsen, T. K., Beukes, J. P., Bian, H., Carslaw, K. S., Chin, M., Curci, G., Diehl, T., Easter, R. C., Ghan, S. J., Gong, S. L., Hodzic, A., Hoyle, C. R., Iversen, T., Jathar, S., Jimenez, J. L., Kaiser, J. W., Kirkevåg, A., Koch, D., Kokkola, H., Lee, Y. H., Lin, G., Liu, X., Luo, G., Ma, X., Mann, G. W., Mihalopoulos, N., Morcrette, J.-J., Müller, J.-F., Myhre, G., Myriokefalitakis, S., Ng, N. L., O'Donnell, D., Penner, J. E., Pozzoli, L., Pringle, K. J., Russell, L. M., Schulz, M., Sciare, J., Seland, Ø., Shindell, D. T., Sillman, S., Skeie, R. B., Spracklen, D., Stavrakou, T., Steenrod, S. D., Takemura, T., Tiitta, P., Tilmes, S., Tost, H., van Noije, T., van Zyl, P. G., von Salzen, K., Yu, F., Wang, Z., Wang, Z., Zaveri, R. A., Zhang, H., Zhang, K., Zhang, Q., and Zhang, X.: The AeroCom evaluation and intercomparison of organic aerosol in global models, Atmos. Chem. Phys., 14, 10845–10895, https://doi.org/10.5194/acp-14-10845-2014, 2014.
Tsimpidi, A. P. and Karydis, V. A.: ORACLE-lite (v3.0): A reduced-complexity module for simulating organic aerosol formation and evolution in long term chemistry-climate simulations, EGUsphere [preprint], https://doi.org/10.5194/egusphere-2026-1709, 2026.
Tsimpidi, A. P., Karydis, V. A., Zavala, M., Lei, W., Molina, L., Ulbrich, I. M., Jimenez, J. L., and Pandis, S. N.: Evaluation of the volatility basis-set approach for the simulation of organic aerosol formation in the Mexico City metropolitan area, Atmos. Chem. Phys., 10, 525–546, https://doi.org/10.5194/acp-10-525-2010, 2010.
Tsimpidi, A. P., Karydis, V. A., Pozzer, A., Pandis, S. N., and Lelieveld, J.: ORACLE (v1.0): module to simulate the organic aerosol composition and evolution in the atmosphere, Geosci. Model Dev., 7, 3153–3172, https://doi.org/10.5194/gmd-7-3153-2014, 2014.
Tsimpidi, A. P., Karydis, V. A., Pandis, S. N., and Lelieveld, J.: Global combustion sources of organic aerosols: model comparison with 84 AMS factor-analysis data sets, Atmos. Chem. Phys., 16, 8939–8962, https://doi.org/10.5194/acp-16-8939-2016, 2016.
Tsimpidi, A. P., Karydis, V. A., Pandis, S. N., and Lelieveld, J.: Global-scale combustion sources of organic aerosols: sensitivity to formation and removal mechanisms, Atmos. Chem. Phys., 17, 7345–7364, https://doi.org/10.5194/acp-17-7345-2017, 2017.
Tsimpidi, A. P., Scholz, S. M. C., Milousis, A., Mihalopoulos, N., and Karydis, V. A.: Aerosol composition trends during 2000–2020: in-depth insights from model predictions and multiple worldwide near-surface observation datasets, Atmos. Chem. Phys., 25, 10183–10213, https://doi.org/10.5194/acp-25-10183-2025, 2025.
Turpin, B. J. and Lim, H.-J.: Species contributions to PM2.5 mass concentrations: Revisiting common assumptions for estimating organic mass, Aerosol Sci. Tech., 35, 602–610, https://doi.org/10.1080/02786820119445, 2001.
Vancoppenolle, M., Fichefet, T., Goosse, H., Bouillon, S., Madec, G., and Maqueda, M. A. M.: Simulating the mass balance and salinity of Arctic and Antarctic sea ice. 1. Model description and validation, Ocean Model., 27, 33–53, https://doi.org/10.1016/j.ocemod.2008.10.005, 2009.
van Noije, T. P. C., Le Sager, P., Segers, A. J., van Velthoven, P. F. J., Krol, M. C., Hazeleger, W., Williams, A. G., and Chambers, S. D.: Simulation of tropospheric chemistry and aerosols with the climate model EC-Earth, Geosci. Model Dev., 7, 2435–2475, https://doi.org/10.5194/gmd-7-2435-2014, 2014.
van Noije, T., Bergman, T., Le Sager, P., O'Donnell, D., Makkonen, R., Gonçalves-Ageitos, M., Döscher, R., Fladrich, U., von Hardenberg, J., Keskinen, J.-P., Korhonen, H., Laakso, A., Myriokefalitakis, S., Ollinaho, P., Pérez García-Pando, C., Reerink, T., Schrödner, R., Wyser, K., and Yang, S.: EC-Earth3-AerChem: a global climate model with interactive aerosols and atmospheric chemistry participating in CMIP6 , Geosci. Model Dev., 14, 5637–5668, https://doi.org/10.5194/gmd-14-5637-2021, 2021.
Vignati, E., Wilson, J., and Stier, P.: M7: An efficient size-resolved aerosol microphysics module for large-scale aerosol transport models, J. Geophys. Res., 109, D22202, https://doi.org/10.1029/2003JD004485, 2004.
Williams, J. E., Boersma, K. F., Le Sager, P., and Verstraeten, W. W.: The high-resolution version of TM5-MP for optimized satellite retrievals: description and validation, Geosci. Model Dev., 10, 721–750, https://doi.org/10.5194/gmd-10-721-2017, 2017.
Woody, M. C., Baker, K. R., Hayes, P. L., Jimenez, J. L., Koo, B., and Pye, H. O. T.: Understanding sources of organic aerosol during CalNex-2010 using the CMAQ-VBS, Atmos. Chem. Phys., 16, 4081–4100, https://doi.org/10.5194/acp-16-4081-2016, 2016.
Yarwood, G., Rao, S., Yocke, M., and Whitten, G. Z.: Updates to the Carbon Bond Chemical Mechanism: CB05, Research Triangle Park, https://www.camx.com/Files/CB05_Final_Report_120805.pdf (last access: April 2025), 2005.
Zhang, B.: The effect of aerosols to climate change and society, J. Geosci. Environ. Protect., 8, 55, https://doi.org/10.4236/gep.2020.88006, 2020.
Zhang, Q., Jimenez, J. L., Canagaratna, M. R., Allan, J. D., Coe, H., Ulbrich, I., Alfarra, M. R., Takami, A., Middlebrook, A. M., Sun, Y. L., Dzepina, K., Dunlea, E., Docherty, K., DeCarlo, P. F., Salcedo, D., Onasch, T., Jayne, J. T., Miyoshi, T., Shimono, A., Hatakeyama, S., Takegawa, N., Kondo, Y., Schneider, J., Drewnick, F., Borrmann, S., Weimer, S., Demerjian, K., Williams, P., Bower, K., Bahreini, R., Cottrell, L., Griffin, R. J., Rautiainen, J., Sun, J. Y., Zhang, Y. M., and Worsnop, D. R.: Ubiquity and dominance of oxygenated species in organic aerosols in anthropogenically-influenced Northern Hemisphere midlatitudes, Geophys. Res. Lett., 34, L13801, https://doi.org/10.1029/2007GL029979, 2007.