the Creative Commons Attribution 4.0 License.
the Creative Commons Attribution 4.0 License.
 | 08 May 2026
Flood volume allocation method for flood hazard mapping using river model with levee scheme
Muhammad Hasnain Aslam
Yukiko Hirabayashi
Dai Yamazaki
Gang Zhao
Yuki Kita
Do Ngoc Khanh
A realistic flood risk assessment is important for rivers where the flood protection infrastructures are dictated by varying return periods. For rivers in Japan, design return periods for flood protection infrastructures range up to 200 years. Large-scale flood hazard mapping increasingly relies on global river models, but these models often lack explicit representation of flood protection levees. In this study, we extend the Global River Model (CaMa-Flood) by integrating levee parameters and applying frequency analysis to simulated flood volumes (the cumulative amount of water exceeding channel storage) and downscaling them to high resolution while explicitly accounting for topographic variability and levee protection.
Levees are represented through heights and fractions, with fractions derived from distance to the river centreline and heights refined by simulations. The method applies both to current simulations, using modelled flood volumes directly, and to future hazard assessment, where frequency analysis of annual maxima provides return-period volumes. These volumes are redistributed to high-resolution unit catchments using terrain data and physically constrained by storage availability.
The results show that integrating levee protection reduces simulated flood volumes, with 10 %–15 % reductions across most return periods in grids containing levees. This reduction reflects the confinement of floodwaters within levee-protected channels, which limits floodplain storage and lowers overbank volumes. At the unit catchment scale, flood extents are also reduced depending on levee fraction and topography. Levees effectively confined floodwaters during moderate (i.e., 10-year) to large (> 100-year) return-period flood events, while their influence diminished at extremes where overtopping or volume overestimation became prominent. Findings demonstrate that the levee-integrated downscaling approach captures spatial variability in protection effectiveness, offering a more realistic representation of flood hazard across diverse conditions. By combining hydraulic modelling, frequency analysis, and levee integration, this study provides a comprehensive framework for flood depth mapping, supporting improved resilience planning and basin management.
- Article
(8818 KB) - Full-text XML
-
Supplement
(2061 KB) - BibTeX
- EndNote


Flooding remains one of the most recurrent and damaging natural hazards worldwide, with severe socio-economic consequences, particularly in densely populated and low-lying regions. Global flood losses exceeded USD 1 trillion between 1980 and 2013 (Dottori et al., 2016), and nearly 290 million people were affected between 2000 and 2018 (Tellman et al., 2021). Flood impacts are expected to intensify under ongoing socio-economic change, climate change, and rapid urbanization (Dottori et al., 2016; Tellman et al., 2021). Hence, flood risk assessment is essential for disaster preparedness and climate adaptation.
Conventional flood hazard mapping is typically based on design precipitation events, where rainfall is first transformed into runoff, then routed to generate design discharges, and finally applied to hydraulic inundation models. Large-scale hydrological and hydraulic models are increasingly being adopted for regional to global flood hazard mapping due to their computational power, advances in remote sensing (Dottori et al., 2016), and the use of global hydrological datasets. A key focus has been integrating hydrological processes with floodplain dynamics to improve accuracy. For instance, Yamazaki et al. (2013) introduced a global river routing model that advanced flood hazard mapping beyond earlier approaches (Pappenberger et al., 2012). Hirabayashi et al. (2013) and Kimura et al. (2023) used this model to project future global flood risks under climate change using multi-model runoff inputs. Building on these developments, Kita and Yamazaki (2022) applied CaMa-Flood at a national scale in Japan, reproducing broad inundation patterns including backwater and bifurcation effects.
Beyond CaMa-Flood, several other global flood hazard and risk modelling frameworks have been developed that combine large-scale hydrology, river routing and inundation components to derive consistent flood hazard maps and associated risk indicators (Ward et al., 2015; Dottori et al., 2016). These systems have been used to identify global hotspots of river flood risk and to assess future changes under climate warming and socio-economic development. They demonstrate the value of physically based global flood models for international risk assessment and adaptation planning. However, these global river models often overestimate risk in regions with extensive flood protection, because levees are not explicitly represented, which plays a critical role in modifying floodplain dynamics.
The exclusion of levees in global river models is mainly due to limited levee datasets and the difficulty of integrating such structural controls into large-scale hydrodynamic frameworks. This limitation is particularly critical in high-income countries such as Japan, where levee infrastructure strongly shapes inundation dynamics. A large-scale levee dataset has recently been developed (e.g., Khanh et al., 2025; Zhao et al., 2025). Zhao et al. (2025) introduced a levee representation scheme within CaMa-Flood, enabling the inclusion of levee height and protected fractions in large-scale simulations.
Other issues to overcome in the development of hazard mapping include accounting for spatial variability in floodwater allocation in complex or urbanised floodplains during the downscaling process. Large-scale models typically simulate discharge at a coarser resolution to reduce computational cost and then downscale the calculated inundation extent using high-resolution topographic maps. For example, Kimura et al. (2023) enhanced CaMa-Flood-based downscaling by introducing a reverse-slope correction technique and conducting long-term ensemble flood simulations using General Circulation Model (GCM)-based runoff. Their lookup-based approach provided improved spatial consistency for future flood scenarios under climate change. However, this approach can oversimplify flood inundation dynamics by neglecting the spatial variability and cumulative volume of floodwaters in complex or urbanized floodplains where the presence of structural measures, such as flood protection levees, plays a critical role in shaping inundation patterns and may mislead the future return-period flood hazard assessment. In particular, downscaling becomes technically challenging when levees are present, since flood volumes must be redistributed across terrain while respecting levee-protected (outside or urban side) and unprotected (inside or river side) zones.
To address this gap, we develop a new downscaling method that explicitly incorporates levee protection when translating flood volumes to inundation depths. The study's main goal was to develop and implement a novel levee-integrated flood hazard mapping framework by: (a) Integrating flood protection levees into large-scale numerical simulations; (b) Incorporating levee information to delineate protected zones within each unit catchment (small, topology-preserving drainage polygons delineated from high-resolution river-network data), and (c) Downscaling coarse-resolution flood volume to high-resolution inundation depth maps by employing terrain-informed volumetric redistribution. Goals (a) and (b) adopt the levee schematization framework of Zhao et al. (2025) using the DEM-based levee dataset of Khanh et al. (2025) and serve as prerequisites for goal (c), which constitutes the primary contribution of this study.
We focus on Japan as a test case because it combines extensive levee infrastructure with hydrological and topographic datasets. Japan's flood protection design standards vary widely across basins, making it ideal for evaluating the influence of levees on flood hazard mapping under diverse conditions. Japan experiences numerous flood events annually, causing substantial damage to infrastructure and loss of human life, due to its steep terrain (Chan et al., 2022), dense population in the floodplain (Huang, 2014), and frequent exposure to typhoons and torrential rainfall (Ridwan et al., 2022). Accurate flood hazard mapping is thus critical for disaster preparedness, urban planning, and the development of effective flood mitigation strategies. Fan and Huang (2020) evaluated flood risk management considering multi-criteria GIS-based analysis, focusing on the Chikuma river basin in Japan. Their study highlighted the importance of spatial exposure and social vulnerability in assessing urban flood risk, but did not incorporate hydrodynamic modelling.
This study proposes a physically consistent, high-resolution flood hazard assessment to address the limitations of downscaling flood depths following outputs from the large-scale CaMa-Flood model. The overall analysis consists of: (1) hydrological simulations at 1 arcmin resolution using the Global Reach-Level A Priori Discharge Estimates dataset (GRADES; Yang et al., 2021) runoff forcing; (2) levee schematisation based on LiDAR-derived levee data; (3) frequency analysis on simulated annual maximum flood volumes extracted directly from the simulated daily floodplain storage time series by selecting the single largest flood storage value(details available in Sect. S1 in the Supplement) (4) derivation of depth–storage curves per unit catchment based on 1 arcsec terrain data; and (5) a hierarchical downscaling algorithm that allocates flood storage volumes to fine-scale pixels, respecting levee-protected and unprotected zones. The approach is validated using flood extent data from the 2019 Typhoon Hagibis for the Chikuma River in Japan.
The Chikuma River originates in the Japanese Alps and is the upper reach of the Shinano River accounting for 60 % of the whole watershed area of the Chikuma-Shinano river basin. It drains a predominantly mountainous catchment of about 7100 km2 and runs through Nagano and Niigata Prefectures (Huang, 2021). Along the study reach, the Chikuma-Shinano river flows through a narrow valley and an alluvial floodplain that hosts dense urban development. and agricultural land. Floods are primarily driven by intense rainfall associated with typhoons and frontal systems, Both river banks are protected by continuous levees over long distances. This makes the Chikuma basin a representative example of a levee-dominated fluvial floodplain where structural measures strongly influence inundation patterns.
2.1 Validation Data
Daily river discharge and water level data for validating simulated outputs are obtained from MLIT (Ministry of Land, Infrastructure, Transport and Tourism) for the period from 1980 to 2019, covering over 400 stream gauges across the entire river basins of Japan (MLIT, 2024). Additionally, we also gathered flood inundation extents from past events, i.e., Typhoon Hagibis, from the Geospatial Information Authority of Japan (GSI, 2019, 2025a) retrieved through “https://www.gsi.go.jp/BOUSAI/R1.taihuu19gou.html#11 (last access: 23 March 2025)” and National land numerical information – hazard maps obtained from https://disaportal.gsi.go.jp/hazardmap/maps/ (last access: 25 July 2025, GSI, 2025b).
2.2 Large-Scale Flood Modelling
This study utilises the Catchment-based Macro-scale Floodplain (CaMa-Flood) model by Yamazaki et al. (2011) using MERIT Hydro (Yamazaki et al., 2019) as a baseline topography to simulate flood dynamics across Japan. CaMa-Flood is a large-scale river routing and floodplain inundation model that solves a simplified shallow-water equations (The local inertial) on a catchment-based river network, with separate representation of river channel and floodplain storage and dynamic exchange between them (Yamazaki et al., 2011, 2013). It has been widely applied in global and national studies of flood hazard and climate-change impacts using various runoff products (e.g. Hirabayashi et al., 2013; Kimura et al., 2023; Kita and Yamazaki, 2022), which makes it a suitable hydrodynamic core for the present framework. To study the impacts of flood protection levees on river flood inundation dynamics, we adopted the method of Zhao et al. (2025) to schematize the levee in the Hydrodynamic Model.
The model was implemented at a spatial resolution of 1 arcmin (∼ 1.5 km) for longitudes between 123.0 and 148.0° E and latitudes from 24.0 to 46.0° N, covering the entire country of Japan. The input runoff forcing was derived from the GRADES dataset, which consists of bias-corrected runoff from the Variable Infiltration Capacity (VIC) land surface model calibrated against historical observations (Yang et al., 2021). Simulations were conducted from 1979 to 2019, encompassing a 41-year historical data period. Model simulation outputs are generated at a temporal resolution of 24 h. The simulations were conducted for scenarios with and without a flood protection levee to ascertain the levee's impacts on flood depths and inundation extents.
We confirmed the accuracy of the CaMa-Flood simulations using discharge and water level observations from over 400 stream gauges across Japan. The model demonstrated strong consistency with observed discharge magnitudes (R≈ 0.94 for mean and 0.80 for peak flow, Fig. S3) with most stations achieving satisfactory KGE and NSE values (Figs. S4–S6). The model captured water level fluctuations with moderate to high correlation (R between 0.45 and 0.75, Fig. S9). These results confirm that the model performs reliably at the national scale. Further statistical distributions and spatial evaluations are presented in Sect. S2.
2.3 Levee schematisation
In this study, we utilised a recently developed global levee dataset by Khanh et al. (2025), derived from high-resolution (10 m) LiDAR Digital Elevation Models (DEMs). The levee detection method utilised by Khanh et al. (2025) employs four terrain-based parameters – relative elevation, slope, aspect difference, and curvature – to identify levees from DEMs, capturing both artificial and natural embankments. Khanh et al. (2025) report that the resulting dataset achieves moderate to high precision and recall when validated against established levee databases (e.g. the U.S. National Levee Database) and performs well even in complex landscapes with mixed land use and narrow floodplains. In Japan, the mapped levees show a strong spatial correlation with urban and agricultural zones, consistent with the national flood protection infrastructure. This dataset was selected in this paper because it provides spatially consistent, DEM-based levee information at national to global scales, enabling uniform levee parameterization for large-scale modelling. Comparable national to regional-scale levee datasets with consistent spatial coverage are limited or not publicly available.
The original 10 m levee data were resampled to a 1 arcsec (∼ 30 m) resolution to align with our simulation framework. Using this resampled data, we estimated the mean levee distance (defined as the mean horizontal distance from the river centerline to the detected levee on either side) within each unit catchment (corresponding to the 1 arcmin simulation grid). While resampling from 10 to 30 m, a 30 m pixel is classified as a levee pixel if any 10 m pixels within the 30 m block are marked as levee. This resampling is acceptable as all levee segments recorded in Khanh et al. (2025) contain at least 10 pixels.
A Python script was adapted to work with 1 arcsec resolution terrain and river network data to determine each unit catchment's average levee distance. To incorporate levee protection into the flood hazard mapping framework, we adopted the levee parameterisation method proposed by Zhao et al. (2025), which defines two key parameters that are the levee unprotected fraction (levfrc) and the corresponding levee height (levhgt) for each unit catchment containing a physical levee feature. The levee fraction (levfrc) is calculated as the ratio of the area between the levees (based on the estimated mean levee distance from the river centerline; levdis, derived from the resampled Khanh et al. (2025) levee raster) to the total area of the unit catchment following Eq. (1). Physically, the levee fraction is the numerical representation of part of the unit catchment that lies inside the levees along the river. The detailed geometric definitions of the levee distance, fraction, and height parameters follow Zhao et al. (2025), while their conceptual roles in partitioning inside- and outside-levee storage are illustrated schematically in Sect. 2.4.1.
Here, rivlen is the river channel length parameter in the CaMa-Flood map (CaMa-Map). CaMa-Flood represents potentially complex geometry through unit-catchment sub-grid channel and floodplain parameters; therefore, Eq. (1) is consistent with the model formulation.
We employed an iterative approach based on flood depths derived from CaMa-Flood simulations to estimate levee heights. To determine levee heights, we used basin-specific design return periods compiled from official records maintained by national and prefectural river management authorities. Specifically, we collected river protection standards for nationally and prefecturally managed rivers (in total 189 rivers), by reviewing river maintenance plans and design standards documents published by the Ministry of Land, Infrastructure, Transport and Tourism (MLIT) and the relevant prefectural governments. We did not consider levees in small rivers where the river protection standard data are unavailable. River protection levels were categorized by return periods (e.g., 50-year, 100-year, 200-year), and one representative design return period was assigned to each river basin. In practice, a single official design return period is specified for each river basin in the management plans, and this value was adopted directly as the representative return period. These basin-specific design return periods were then mapped to the corresponding CaMa-Flood basins and used as target protection levels in the iterative estimation of levee heights. It should be noted that the assigned design return periods represent target protection standards rather than exact overtopping thresholds, as levees typically include freeboard as a safety margin. This distinction is not explicitly addressed in the present static levee representation. In addition, because municipal design standards represent long-term target conditions for river improvement, some river sections have not yet been fully completed. As a result, the model may overestimate the effective protection level in these sections.
Initially, the model was run without levee protection. Following Zhao et al. (2025), frequency analysis (Gumbel with L-moment) (Hosking, 2015) was directly applied to the simulated annual maximum river water depths to obtain return-period-based depth distributions. These results were then used to assign initial levee heights for each unit catchment by subtracting the corresponding channel depth from the target river water depth (e.g., for the 100-year return period). This initial levee height was incorporated into a new levee-protected simulation. In the second iteration, the model outputs with levee protection were again subjected to frequency analysis to extract updated depths. Based on these, the levee heights were recalculated, and simulations were repeated. This iterative cycle was repeated until the change in flood depth reduction between successive iterations fell below a convergence threshold of 1 %. The final iteration showed spatial changes mostly below 0.5 % (i.e., unit-catchment-wise percent differences in design-return-period flood depth between successive iterations), with one localized peak (maximum of difference in successive iterations) of 2.5 %, indicating that further adjustments would yield negligible improvements. Therefore, the levee heights were considered stable and finalised based on this iteration. Figure 1 illustrates the estimated levee fractions and levee heights for a reach of the Chikuma River.
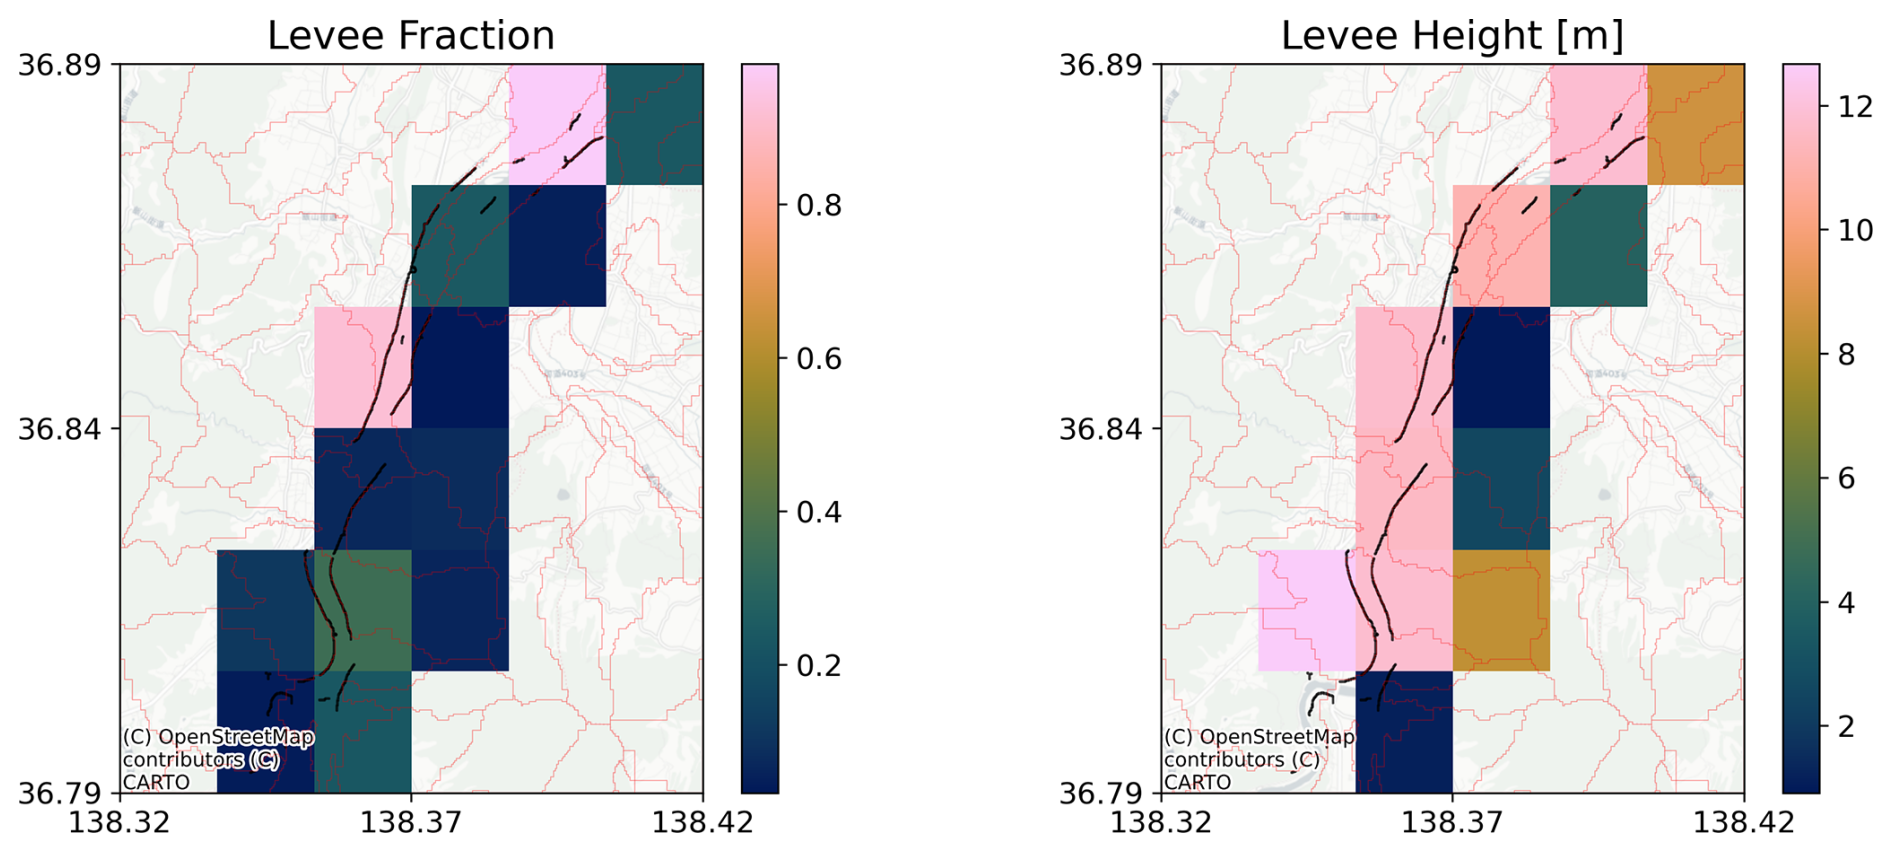
Figure 1Estimated Levee fraction (left panel) and Levee height (right panel) for the Chikuma river reach. Black lines represent LiDAR-based levee data, and red polygons are the unit catchment boundaries. Levee fractions and heights are assigned only to simulation grids (unit catchments) where physical levee features are detected. Unit catchments without detected levees are left unparameterized and are treated as natural in the CaMa-Flood simulation. © OpenStreetMap contributors © CARTO.
Note that this uniform assignment does not capture potential spatial variations in protection levels within individual basins. In cases where no levee was present in the levee inventory, those river segments were treated as having no levee protection, even if a design return period had been assigned for the broader basin. This ensures that only physically identified levee structures were considered in the model. It is to be noted that we estimated levee heights iteratively based on simulated flood depths and hence can be underestimated or overestimated than field data.
2.4 Downscaling Procedure
Previous downscaling methods in CaMa-Flood spread coarse-resolution flood depths to fine-resolution maps by assuming the water level is uniform across each unit catchment. While this assumption is reasonable in natural floodplains, it does not hold in levee-protected regions where riverside and landside areas can experience different water levels. As a result, the old method can misrepresent inundation depths and extents in such areas. Our new approach overcomes this by including levees in the downscaling, allowing water levels to vary correctly between levee protected and unprotected areas. Although this volumetric downscaling approach is introduced primarily to represent levee-controlled flooding, it is also beneficial in areas without levees, as it explicitly preserves flood volume and redistributes water consistently according to fine-scale topography.
The downscaling method proposed here generally converts coarse-resolution flood volumes into fine-resolution flood depths. This study tested its application by generating high-resolution flood hazard maps from coarse-resolution hydrodynamic model outputs. Specifically, we implemented a volumetric downscaling approach that transforms 1 arcmin storage data into 1 arcsec inundation depths. The method operates at the unit catchment level, preserving hydrological consistency while incorporating fine-scale terrain characteristics and levee protection features. For each return period, simulated flood storages with and without levees are determined from CaMa-Flood outputs.
A hierarchical storage allocation strategy was implemented to ensure a realistic flood volume distribution in levee-unprotected and levee-protected areas. The redistribution process follows a priority order that represents natural overtopping behaviour while maintaining volumetric consistency. The storage volume is initially allocated to the grid cells inside the levee that lie below the levee crest elevation, filling available storage up to the levee crest elevation). If the volume exceeds the maximum inside-levee capacity, the remaining volume is allocated to grid cells outside the levee, again only up to the levee crest height, utilising the corresponding outside-levee storage curve. If the combined inside and outside levee capacities are insufficient, the volume is distributed across the entire unit catchment, using the total storage curve that accounts for all available terrain.
The resulting water surface elevations are then used to calculate inundation depths by measuring the difference between the surface level and local terrain, ensuring a physical representation of flooding dynamics. This approach offers flexibility and maintains volumetric reliability, making it well-suited for national-scale flood hazard assessments that consider both natural and engineered landscapes.
2.4.1 Development of Depth-storage curves for unit catchments
To perform the volumetric downscaling of coarse-resolution flood volumes using high-resolution terrain data, we developed fine-scale, elevation-specific depth-storage relationships that explicitly capture the elevation variability within each unit catchment. These curves provide the foundation for redistributing flood storage across subgrid pixels and estimating inundation depths and extents. The depth–storage curve calculation is universal and can be applied wherever available elevation data. The approach becomes specific to CaMa-Flood when levee-integrated downscaling is performed, since the levee parameters used in the redistribution are consistent with those implemented in CaMa-Flood simulations.
High-resolution topographic data were used to extract the floodplain elevation differences (flddif; height of each pixel above the river channel) for all 1 arcsec grid cells within the unit catchment. These values were sorted in ascending order to represent an idealised terrain profile from low to high ground.
The cumulative flooded area at each elevation step was calculated by summing the areas of grid cells below that elevation, as shown in the schematic below (Fig. 2) and represented mathematically as Eq. (2).
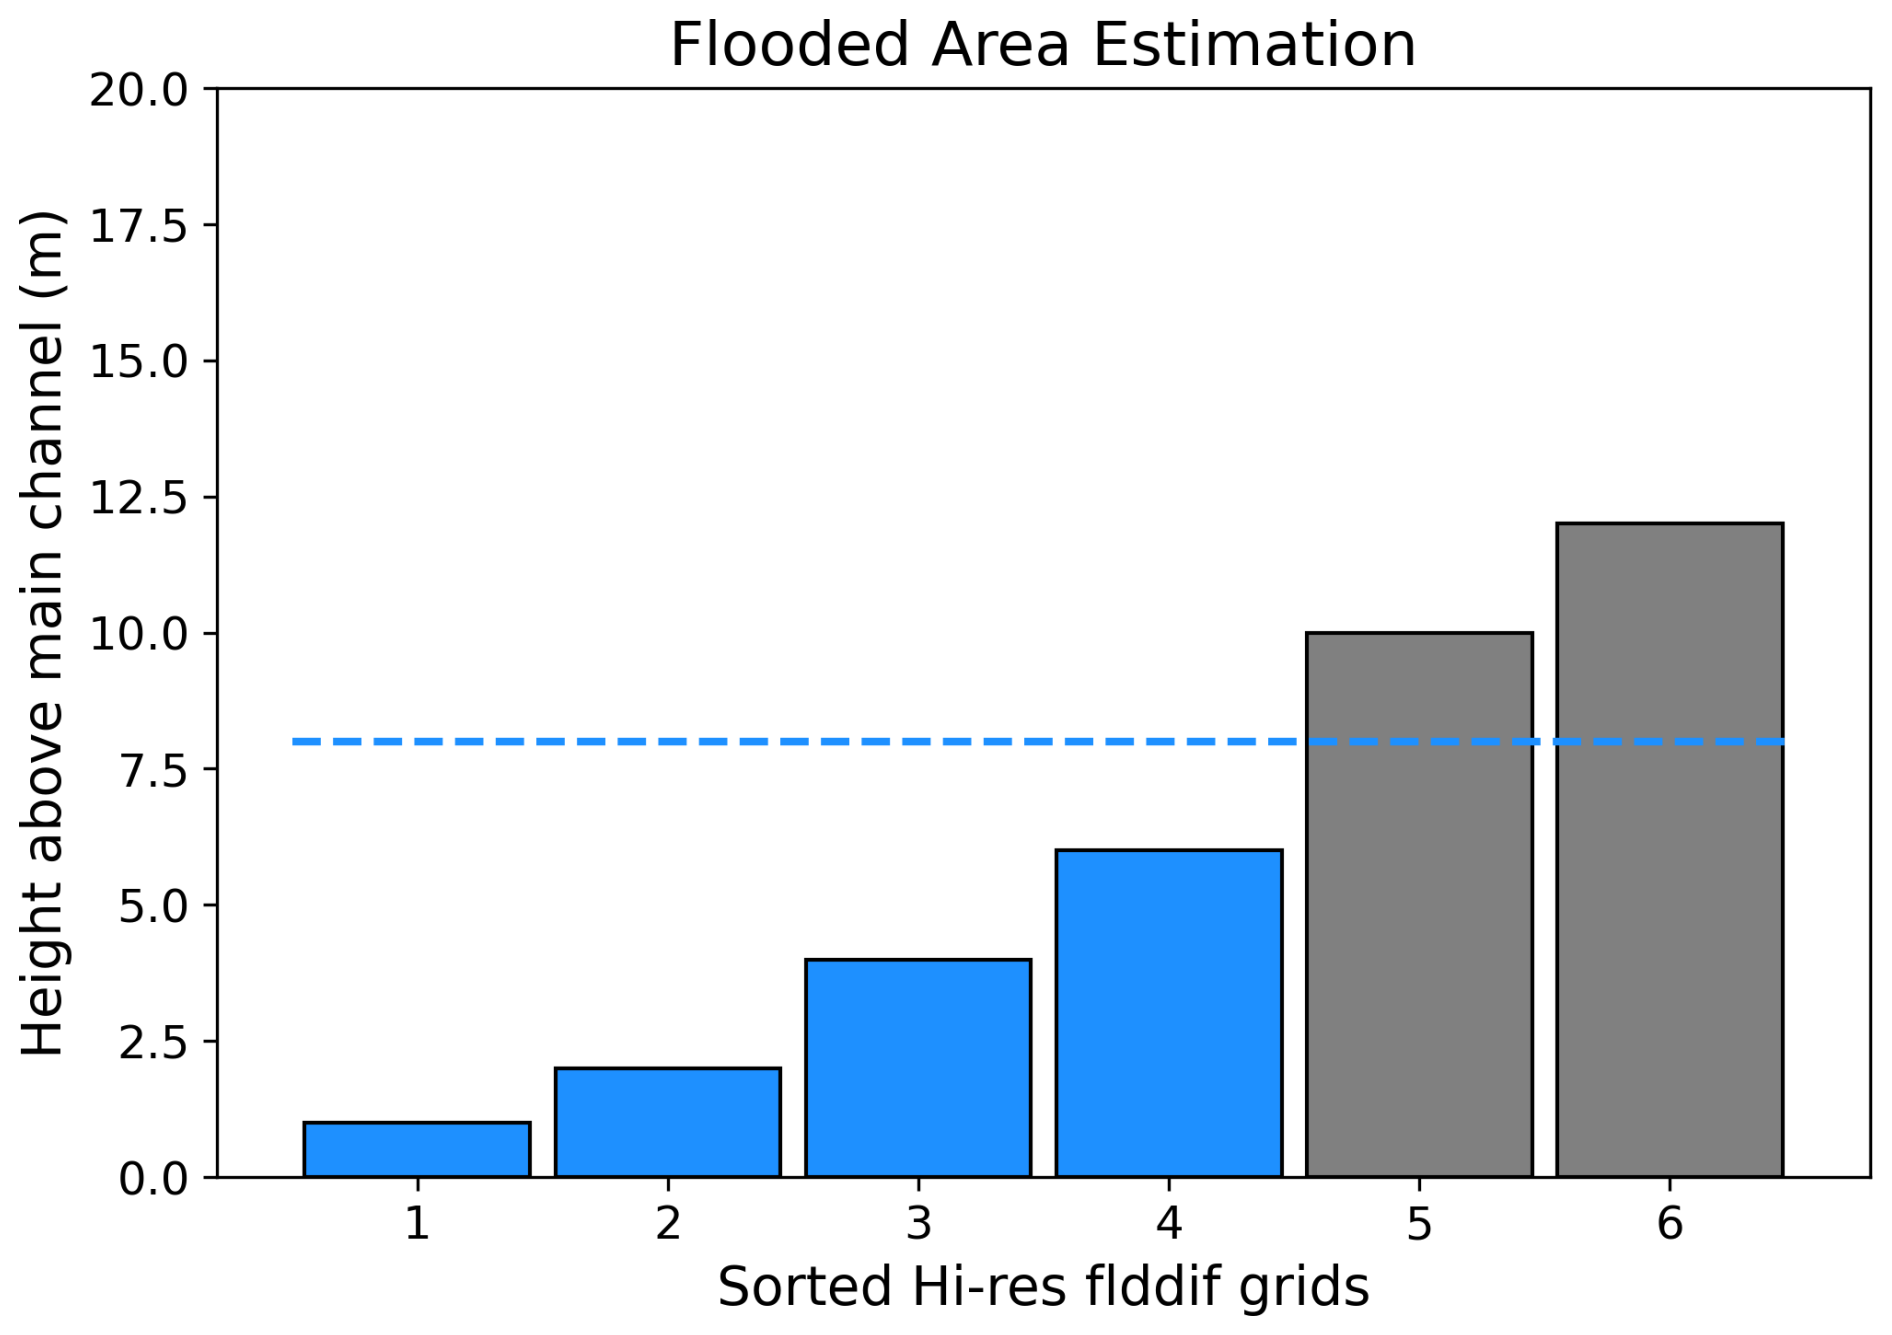
Figure 2Schematic of a unit catchment showing illustrative high-resolution grid cells sorted by elevation. The dashed line indicates an example of the water level hk used to compute the cumulative flooded area. flddif refers to the CaMa-Flood high-resolution map parameter that provides the height of each pixel above the river channel.
Once the cumulative flooded area is computed, the volume of water stored at each depth level is calculated using a trapezoidal method (Eq. 3). The vertical interval (Δh; ) corresponds to the difference in successive water surface levels at which cumulative flooded areas are computed. This interval is not constant but varies depending on the fine-scale terrain within each unit catchment, as it is derived from the discrete values representing elevation differences.
This effectively integrates the area under the curve defined by the flooded areas at different water levels, giving the volume at each level (Eq. 4).
V(h) is the volume of water stored at height h and A(h) is the floodplain area at height h′. Finally, the derived curve was interpolated to estimate the water surface elevation corresponding to any target volume.
To operationalise the hierarchical storage allocation described before, when levees are present, we partition each unit catchment into levee-unprotected (river-side; inside the levee) and protected (land-side; outside the levee) zones and derive zone-secific depth–storage curves. As illustrated in Fig. 3, separate storage curves were generated for these zones based on the levee fraction (levfrc) and levee height (levhgt), together with a total curve for the entire unit catchment (excluding channel storage). This ensures flood volume is realistically allocated beyond the unprotected areas when levee capacity is exceeded.
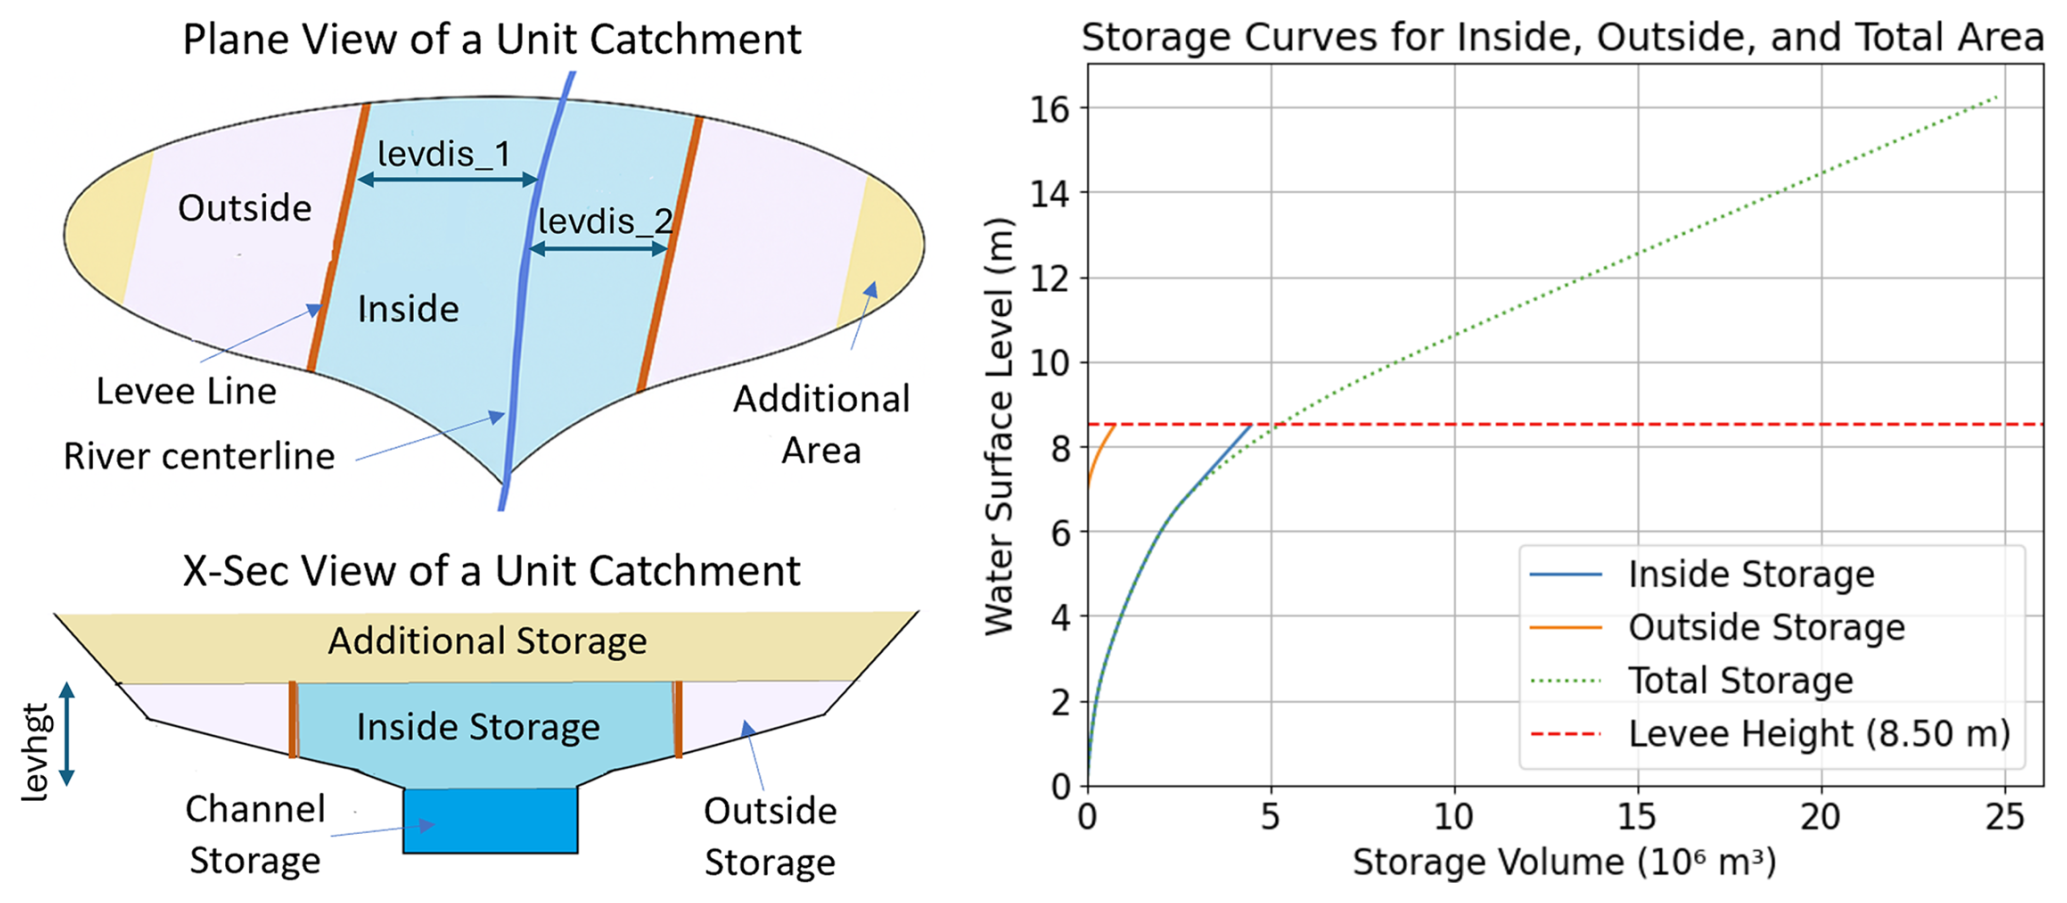
Figure 3Estimated depth-storage curves for a unit catchment that contains a levee. The outside storage curve is associated with a pink-shaded zone in the schematic. The inside storage curve corresponds to the light blue zone. The total storage curve is for the entire unit catchment, excluding channel storage. The vertical axis denotes the water surface level referenced to the river-side (inside-levee) floodplain. Outside storage becomes active only once the inside water level reaches the levee height.
It is important to note that when the total storage capacity of a unit catchment is smaller than the simulated or estimated flood volume, the excess volume is accommodated within the same unit catchment by raising the water depth vertically while keeping the inundated area fixed at its maximum extent.
2.4.2 Storage-curve–guided redistribution of Flood Volume
The model simulated flood volume in each 1 arcmin grid (representing unit catchment in a High-resolution map) is first adjusted by subtracting channel storage – estimated as the product of river length, width, and depth – to isolate overbank flood volume. All 1 arcsec pixels within each unit catchment are sorted by elevation and filled incrementally until the total overbank storage is allocated. This filling process is guided by the storage curves derived from high-resolution topography (Sect. 2.4.1), which interpolate the necessary water surface elevation for each catchment to match the target volume. In levee-protected scenarios, the redistribution is refined by dividing each catchment into zones inside (river side) and outside (land side) of levees using the levee fraction (levfrc) and predefined zone classifications (catmz100, a CaMa-Flood high resolution map parameter representing pixel-relative locations within unit catchment). Following Eqs. (5) and (6). Separate storage-depth curves are generated for both inside and outside levee areas.
The downscaling procedure explained above follows a decision-tree approach (Fig. 4), where each unit catchment is evaluated for the presence of levee protection before distributing flood volumes using appropriate storage-depth curves.
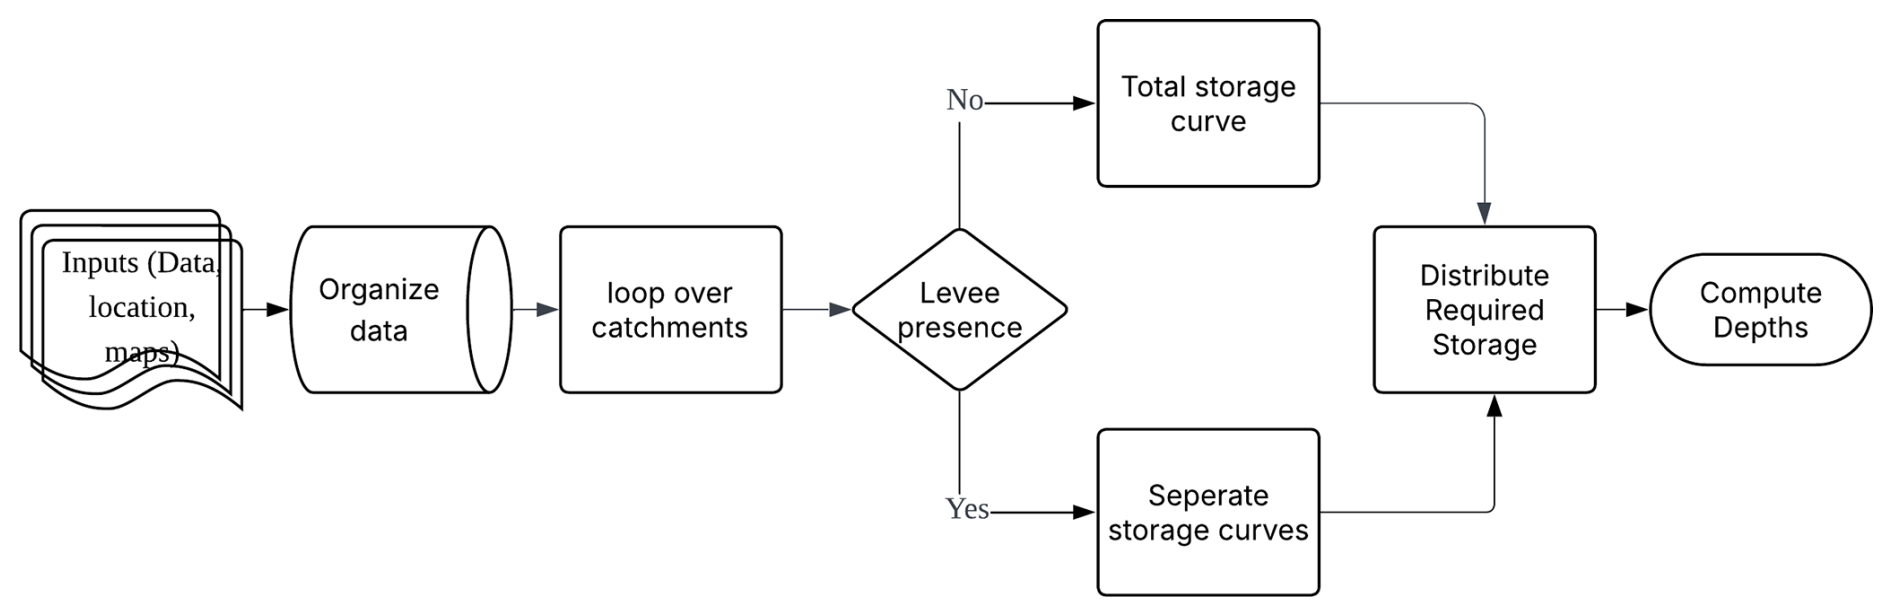
Figure 4Decision-tree schematic illustrating the levee-integrated flood volume-based downscaling procedure at the unit-catchment scale for scenarios with and without levee protection.
3.1 Flood Extents
3.1.1 Comparison with Historic Event
We compared modelled flood extents against observed inundation extent. To compare, flood extents, the river water body was excluded, and the similarity indices (IoU, ACC and FBI) were calculated for the floodplains only. The results highlight the benefits of incorporating levee effects into flood modelling, especially in areas where levees strongly influence flood inundation patterns (Fig. 5). The model successfully reproduces the general inundation patterns and the effects of levee confinement observed during the 2019 event in the Chikuma River basin. By redistributing coarse-resolution flood volumes over fine-scale topography while incorporating levee protection, the method closely reproduces the inundation extents and levee-controlled confinement effects observed during the 2019 event. The levee-integration shows notable improvements in replicating observed inundation patterns, primarily through improved recall and reduced bias rather than significant changes in total inundated area. The levees effectively contain flooding and capture ponding in topographically vulnerable zones for both upstream (b) and downstream (a) regions.
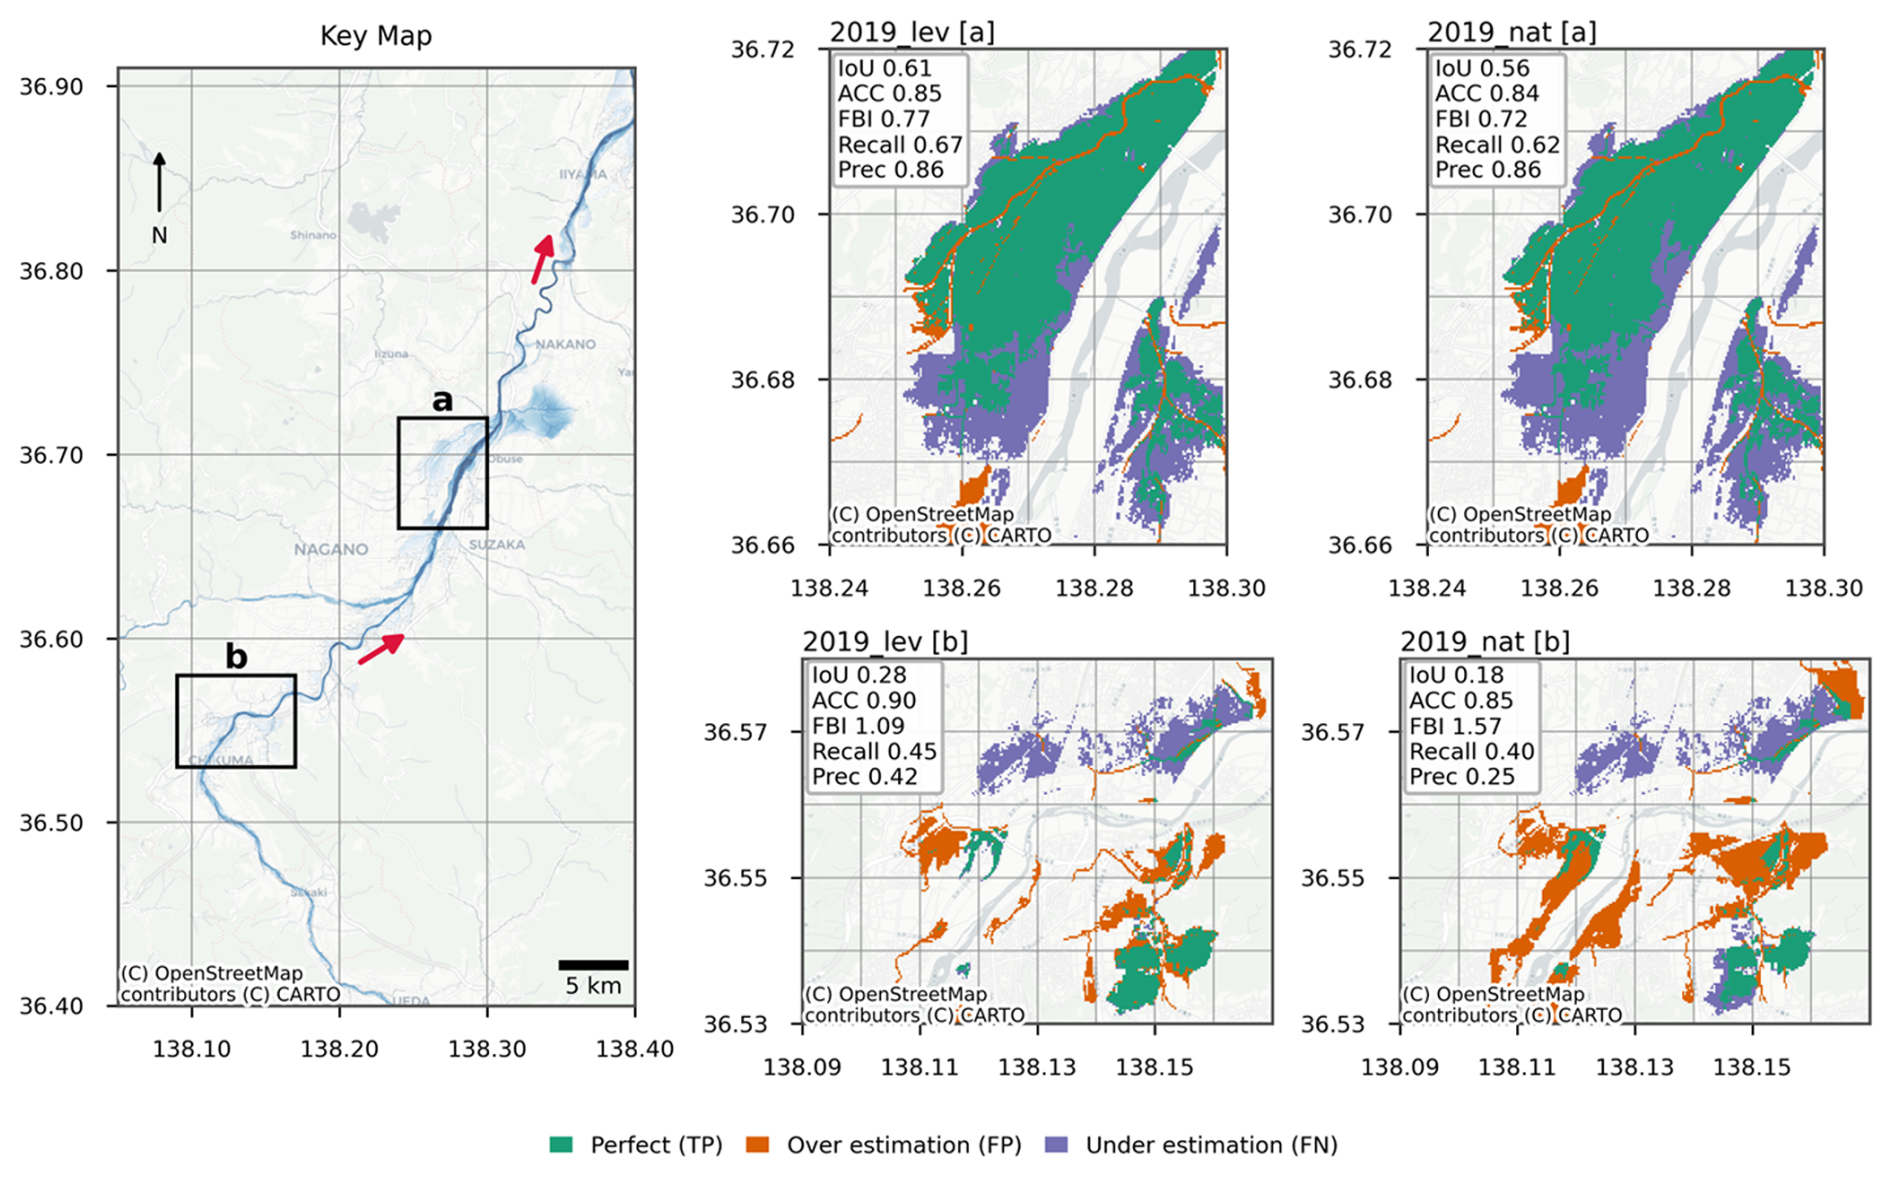
Figure 5Estimated Inundation Extents in the Chikuma River. Red arrows indicate the flow direction. Green is the area where simulated and observed inundations are perfectly matched. The modelled flood inundation under without-levee and levee-protected conditions in the Chikuma River basin is for two river sections: downstream of the Sai River confluence and upstream of the Sai River confluence. The left panel shows the overall reach with two zoom-in regions labelled (a) and (b) selected for detailed validation. The narrow strip of apparent overestimation in region (a) corresponds to the Asa River, a permanent water body that is masked in the observational dataset but retained in the simulated inundation maps. © OpenStreetMap contributors © CARTO.
In the downstream region (a), the simulation with levee information more closely matches the observed inundation, achieving a higher Intersection over Union (IoU = 0.61) and a more balanced Flood Bias Index (FBI = 0.77) than the without-levee scenario. Here, IoU measures the spatial overlap between simulated and observed inundation, and FBI quantifies the bias in the flooded area. In addition to IoU and FBI, recall and precision offer further insight into how the simulated flood extents differ from observations; recall represents the proportion of observed flooded cells correctly identified by the model, while precision indicates the proportion of simulated flooded cells that are observed. The levee-integrated simulation improves IoU (0.56 to 0.61) primarily through an increase in recall (0.62 to 0.67), while precision remains unchanged (0.86). This suggests that the levee-integrated model captures a larger portion of the observed flooded area without introducing additional false positives. The corresponding shift in FBI towards unity (0.72 to 0.77) further confirms a reduction in underestimation bias rather than an expansion of spurious inundation.
Conversely, in region (b), both scenarios show low agreement with observations, though the levee-integrated case performs better in terms of accuracy (which denotes the fraction of correctly classified grid cells). In contrast to region (a), region (b) presents a more complex challenge for accurate flood modelling. The northern part of the region (b) comprises dense urban settlements, where pluvial flooding due to heavy rainfall and urban drainage capacity can significantly contribute to observed inundation. However, the current modelling framework focuses solely on fluvial flooding from river overflow and does not account for surface water accumulation caused by urban drainage limitations. This likely explains the low agreement between simulated and observed flood extents in region (b), with low IoU values (0.27 for the levee-integrated case and 0.18 for the without-levee case) and high Flood Bias Indices. Nevertheless, levee integration leads to a pronounced reduction in overestimation, as reflected by a decrease in FBI from 1.57 to 1.09 and an improvement in precision from 0.25 to 0.42. This demonstrates that the levee-integrated simulation more effectively suppresses fluvial inundation in urbanised areas, even where overall similarity metrics remain limited by unmodelled processes. This consideration also applies to subsequent analyses, where levee effects primarily influence the spatial distribution and bias characteristics of flooding rather than producing uniformly significant changes in aggregate similarity indices.
Nevertheless, model performance remains sensitive to localized features and conditions. For instance, in the upstream region (b), the model underestimates inundation in urbanized zones along the left bank, likely due to the absence of pluvial flooding mechanisms and potential underestimation of flood volumes. In contrast, overestimations are observed downstream in low-lying areas along the right bank (see Fig. S13), possibly due to topographic limitations in the DEM and the exclusion of small-scale structures such as road embankments that act as barriers to flow. These discrepancies underscore the importance of high-resolution topography and the inclusion of urban hydrology in future model improvements. While the levee-integrated simulation slightly improves accuracy, it still overestimates flooding in areas where no substantial river overflow was recorded.
3.1.2 Comparison with City Hazard Maps
Figure 6 compares the 1000-year flood inundation extents estimated by our downscaling approach with the official city hazard maps of Nagano city (for region a in the keymap given in Fig. 5).
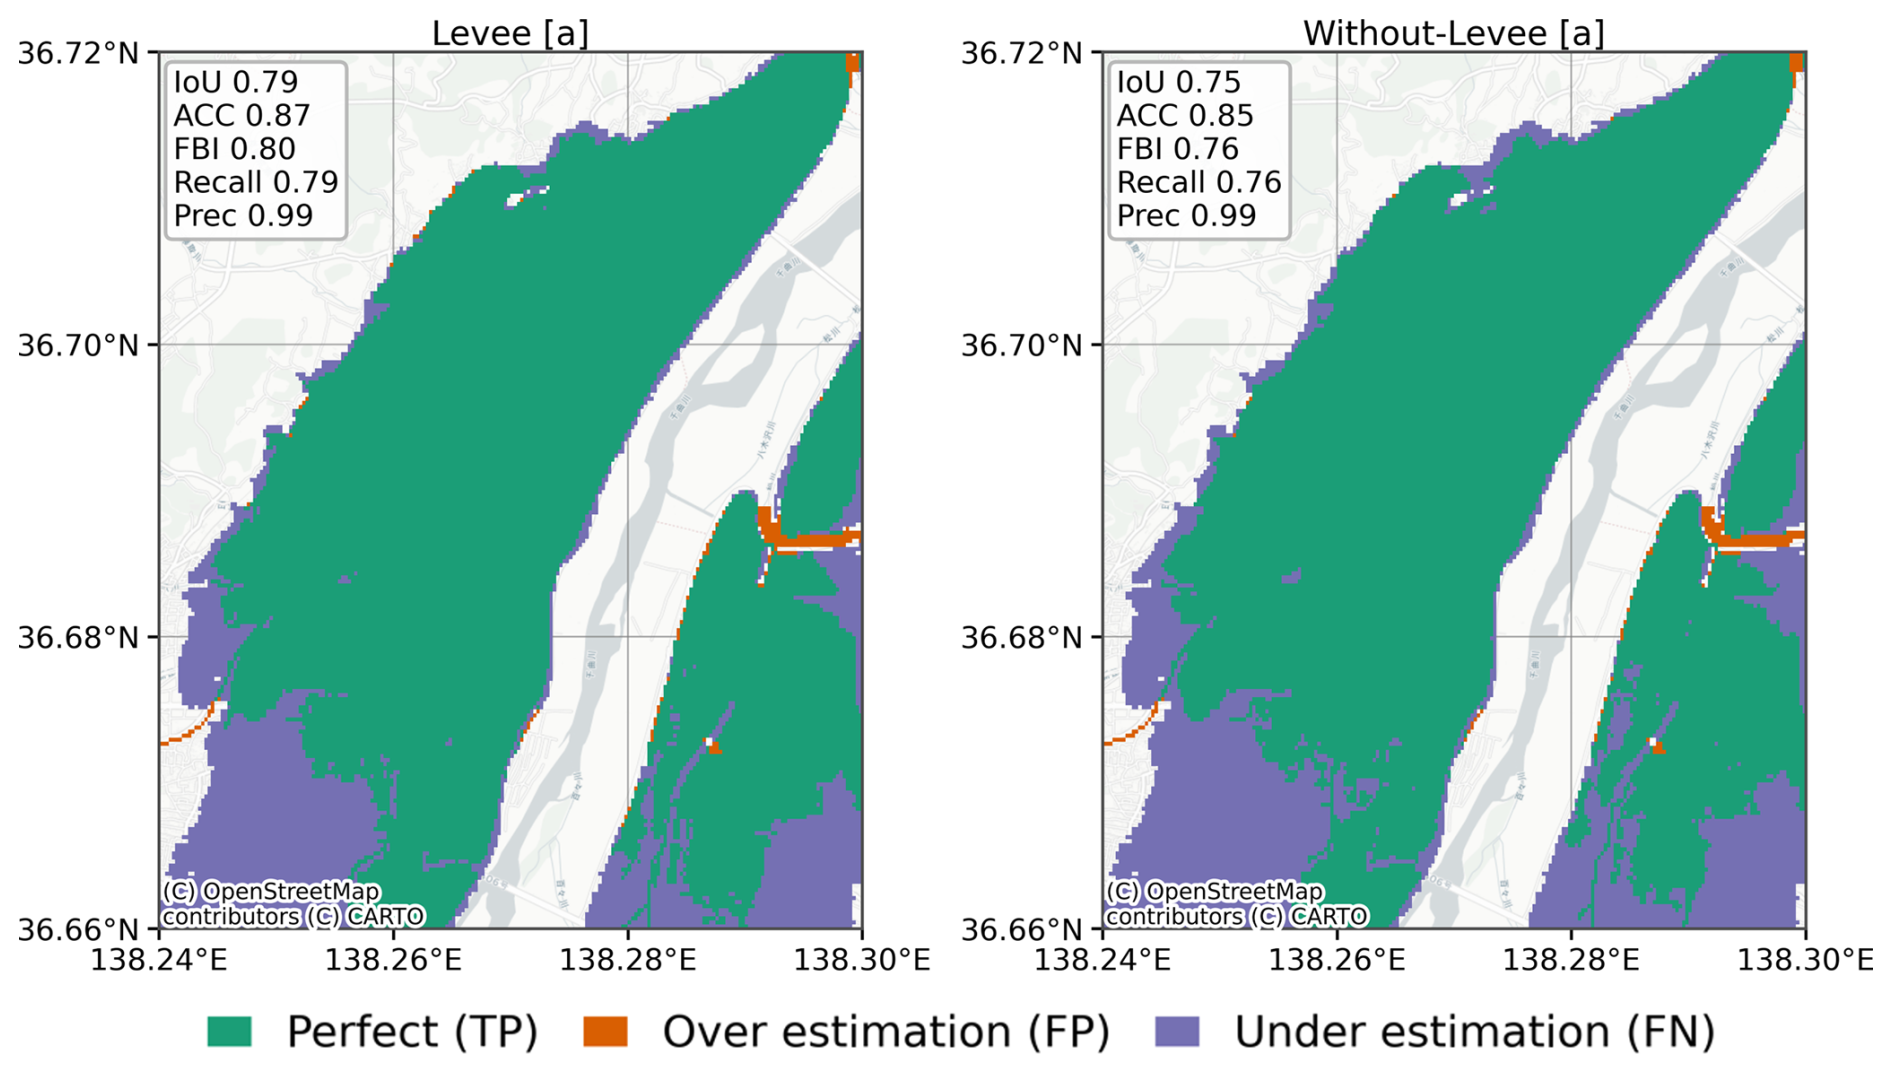
Figure 6Flood Hazard Maps of the Chikuma River reach for 1000-year RP compared with the Nagano city hazard map. Green is the area where simulated inundations and the city hazard map extent are perfectly matched. © OpenStreetMap contributors © CARTO.
City hazard maps were developed using maximum expected rainfall events (once in 1000 years) and included levee overtopping and breaching assumptions, showing more dispersed flood extents. Hence, these hazard maps are scenario-based reference products rather than direct observations of historical flood events.
In contrast, our method uses daily-averaged runoff inputs and represents levees as static barriers without dynamic overtopping or breaching, which may fail to capture short-duration peak flows and partly explains the underestimation of inundation extent for very high return periods. While this assumption is reasonable for floods within the design level of the Chikuma River (around 100-year), for more extreme events such as the 1000-year case the levees may no longer be effective, leading to an underestimation of floodplain inundation. Nevertheless, the proposed framework is flexible and can generate hazard maps for any return period, enabling comparison with observational or reference datasets whenever such data are available.
Similarity metrics and spatial agreement with city hazard maps should be interpreted with caution, as these maps are produced using design rainfall events that explicitly assume levee overtopping and breaching. Consequently, differences between the simulated inundation extents and official hazard maps reflect not only model performance but also fundamental differences in scenario assumptions. In this context, the levee-integrated results are expected to show closer agreement at return periods near the design standard (e.g., ∼ 100-year), while underestimating inundation for more extreme scenarios where dynamic levee failure is not represented. Therefore, moderate similarity scores do not necessarily indicate reduced physical realism, but rather highlight the distinction between static levee representation and breach-based hazard mapping approaches.
3.2 Effect of Levee Integration on Flood Inundation Depths
We further examine the impact of levee integration on flood inundation at a finer spatial scale. Our method calculated the total volume of flood water for each simulation grid (corresponding to a unit catchment of high-resolution maps) and then allocated the flood volume for higher resolution maps. With levee protection, flooding is significantly restricted across the two randomly selected unit catchments of CaMa-Flood in the case of the 2019 East Japan Typhoon event (Fig. 7). without-levee simulation results in widespread inundation across the unit catchments. With levee protection, flooding is significantly restricted. The reduction in flood inundation extent results from topographic patterns and the spatial distribution of integrated levee data.
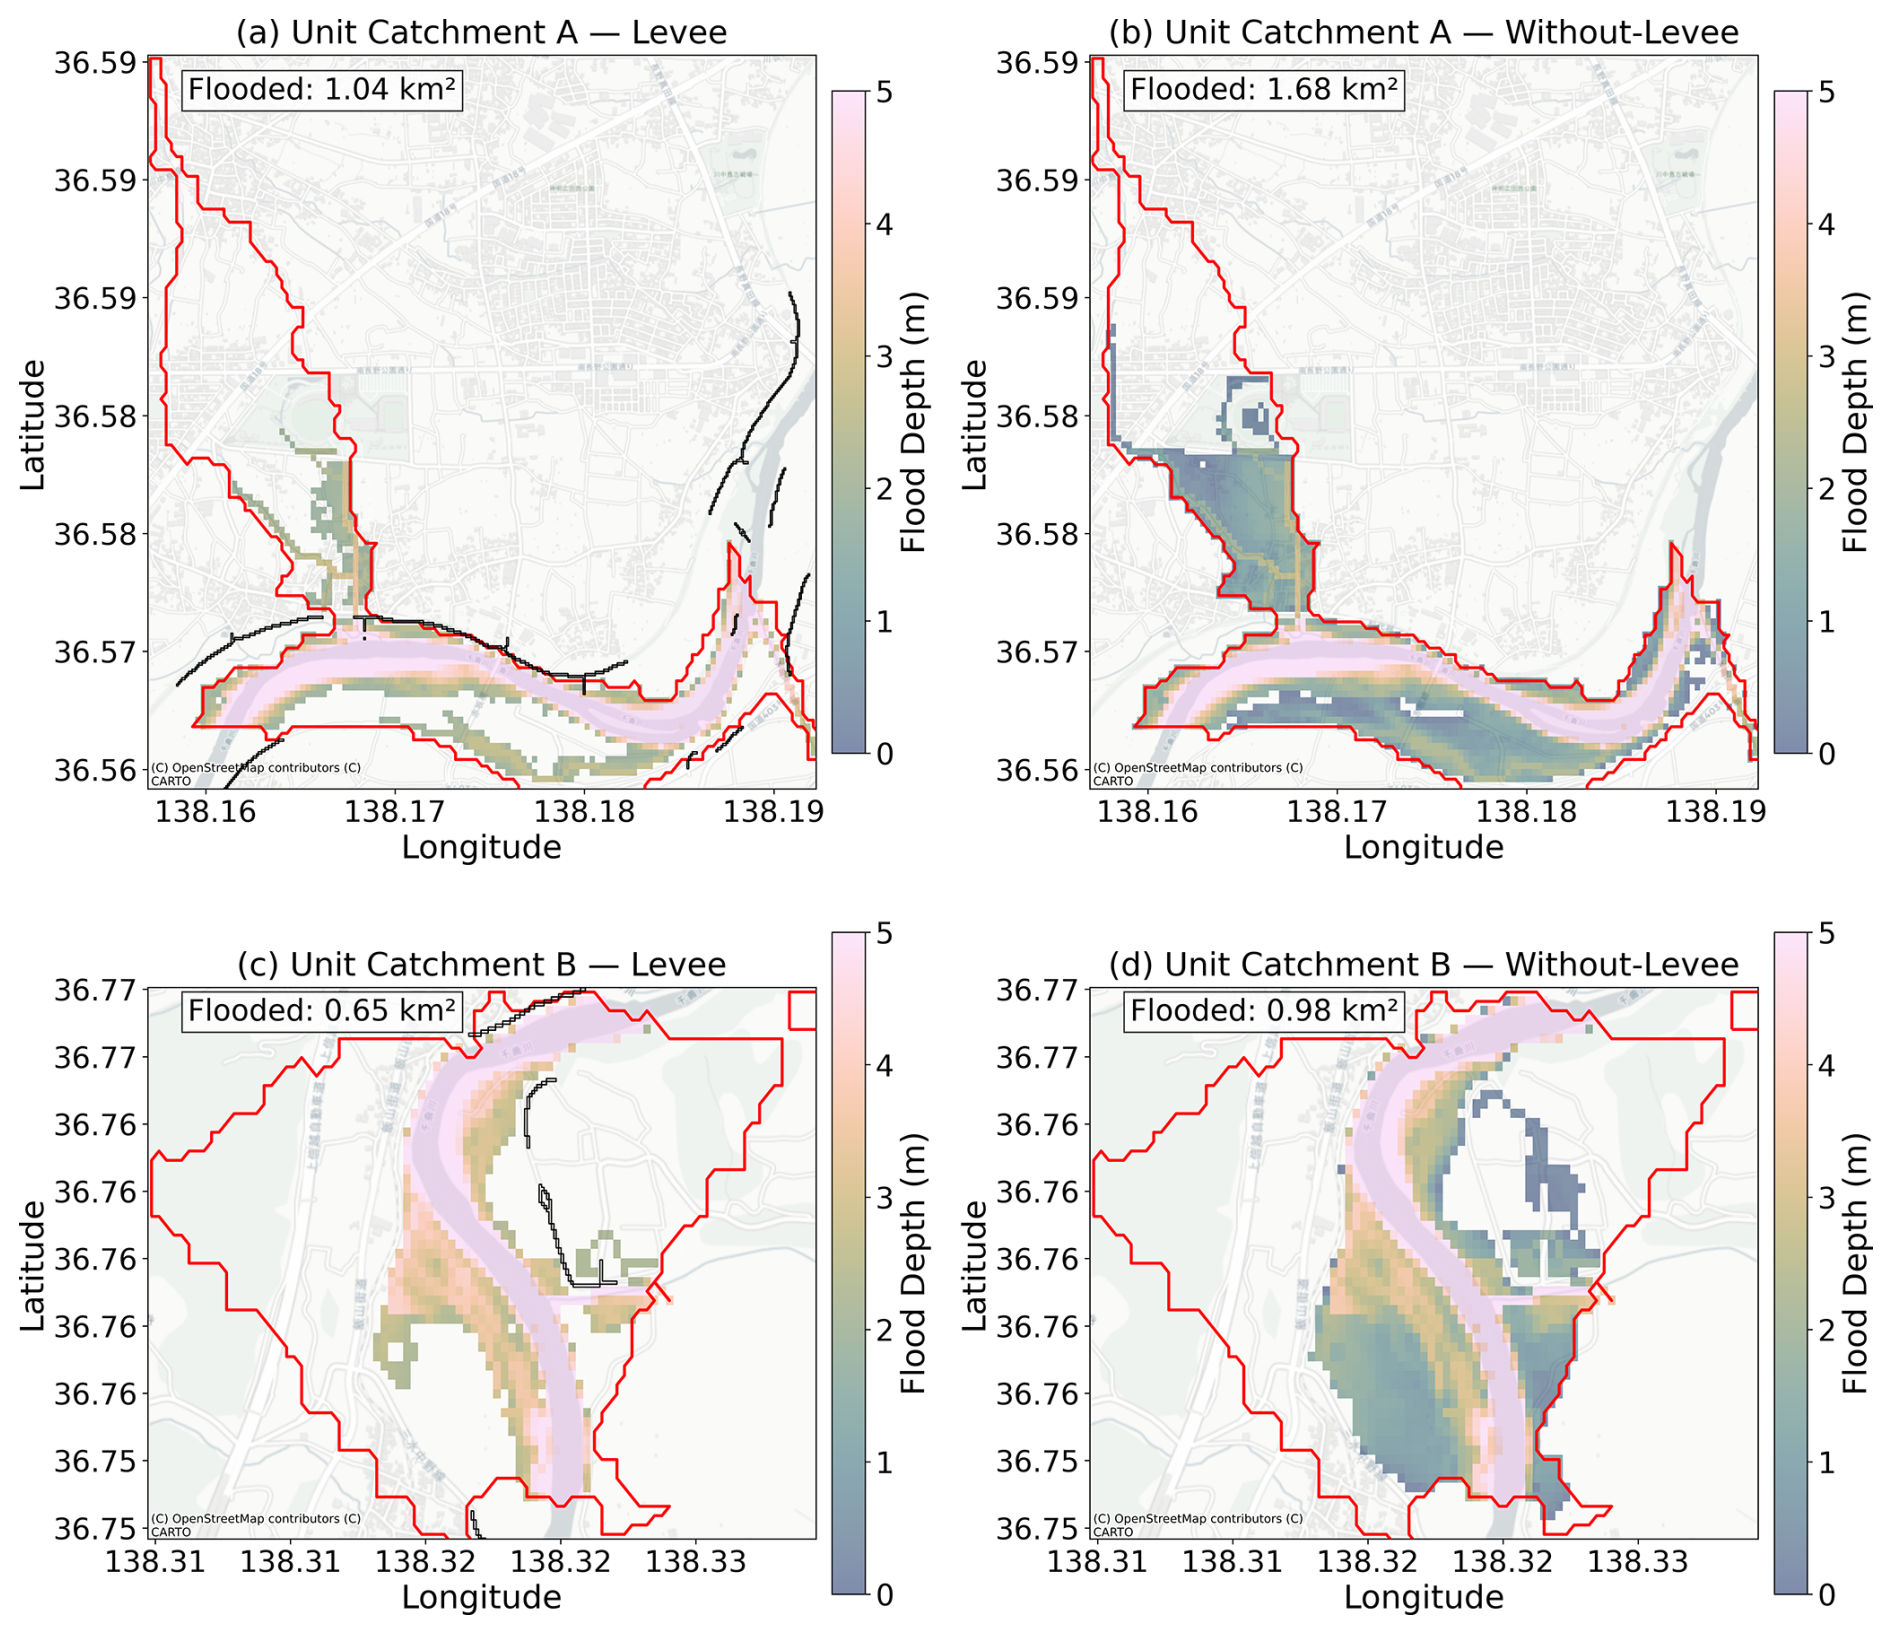
Figure 7Spatial distribution of simulated flood depths for without-levee (b, d) and with levee (a, c) scenarios during the 2019 East Japan Typhoon. Red outline is the unit catchment boundary, the black lines represent levee data, and inundation areas are inserted in text boxes at top left. © OpenStreetMap contributors © CARTO.
For the unit catchment A (which is upstream of the confluence with the Sai River and has an estimated levee fraction of 0.39) in Fig. 7, the flood extent without levee protection covered approximately 1.68 km2, reduced to 1.04 km2 with the inclusion of levee effects, reflecting a 38.1 % reduction in the inundated area. The spatial patterns indicate that levees well protect this area. The unit catchment B, downstream of the confluence (the bottom panels in Fig. 7), with an estimated levee fraction of 0.29, showed a somewhat similar effect of levee integration. Under the without-levee scenario (bottom-left), the inundated area was 0.98 km2, which also considerably reduced to 0.65 km2 in the levee scenario (bottom-right), resulting in a 33.7 % reduction. The significant reduction in flood extents indicates that the levee system in these catchments effectively confines floodwaters, underscoring their role in mitigating inundation across diverse settings.
Similar results are seen in the case of flood extent in different return periods. Figure 8 shows the simulated flood inundation depth maps for a downstream section of the Chikuma River, located approximately 14 km upstream of the confluence with the Sai River. The figure compares without-levee and levee-protected scenarios across multiple return periods (RPs). At lower RPs (5–50 years), the effect of levees is especially pronounced, with flood areas reduced by up to ∼ 50 %. Even under higher return periods (RP 500–1000 years), although less significant, levee protection continues to limit flood spread, demonstrating the effect of the levee parameterization on inundation extent under both moderate and extreme flood conditions. Since the design criteria for the Chikuma River is a 100-year return period flood (according to the National database from MLIT, for the reach under consideration), the levee effect becomes less pronounced for floods with a return period much higher than the design return period. Figures S10 and S11 illustrate the flood progression in the region 22 km downstream and 14 km downstream of the Sai River confluence, respectively, for without-levee and with levee cases, with percentage reduction presented in Fig. S12. Together with the representative results shown in Fig. 8, these examples in the Supplement underscore the spatial variability of levee effectiveness and highlight the importance of site-specific flood risk assessments when evaluating structural interventions.
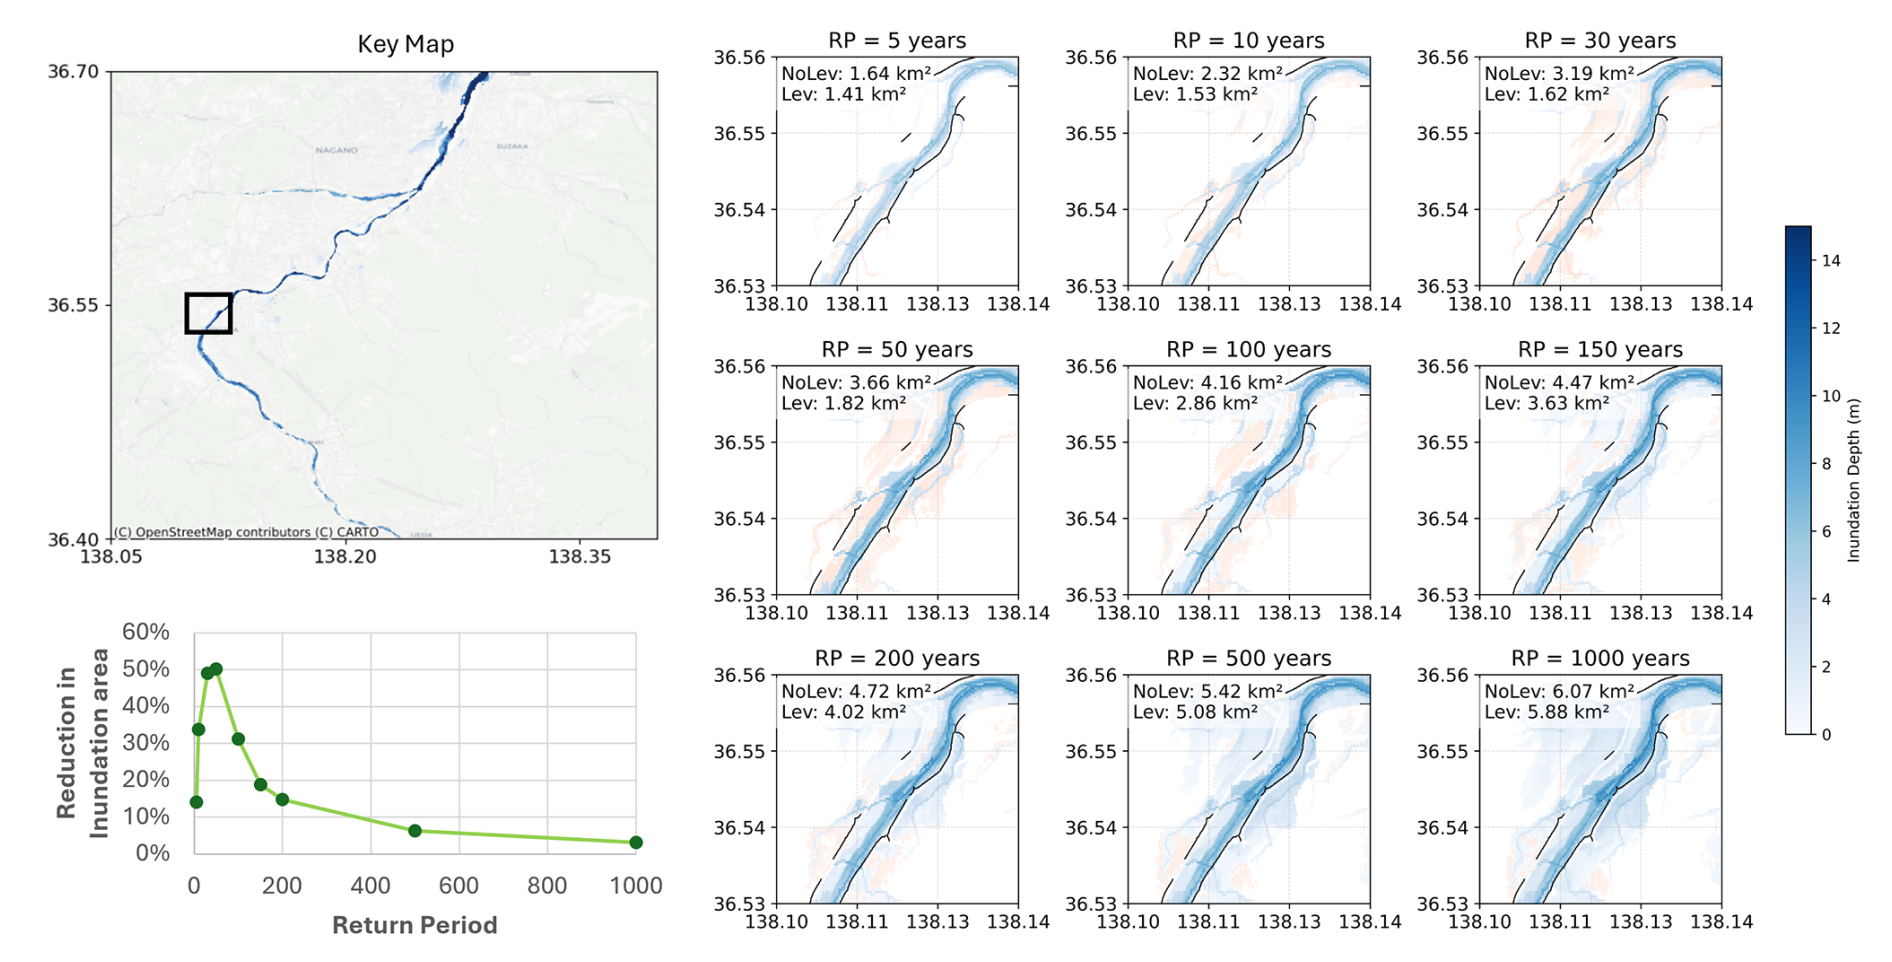
Figure 8Simulated Flood inundation depths for the Chikuma River across multiple RPs (∼ 14 km upstream of the Sai–Chikuma confluence) without levee (red) and with levee-protected (blue). Black lines represent levee data. A line graph (bottom left) shows the percentage reduction in the inundation area with the levee. © OpenStreetMap contributors © CARTO.
3.3 Flood Hazard Maps
We developed detailed future flood hazard maps and presented them for the Chikuma River. The flood hazard maps (with levee protection) created for return periods (RPs) of 10 and 100 years (Fig. 9) show a clear progression in inundation extent and severity across the Chikuma River basin. These maps, generated using high-resolution (1 s) downscaling of simulated flood depths, classify flood hazards according to Japanese flood depth thresholds and overlay them on detailed base maps for a realistic spatial context. The 10-year scenario, which reflects relatively frequent flood events, indicates that even common floods pose a significant threat to critical infrastructure and urban areas near the floodplain, especially downstream of the Sai–Chikuma confluence, where terrain and flow convergence increase water accumulation. Although Fig. 9 presents hazard maps derived using the best-fitting GEV distribution, the spatial patterns shown here represent one realization within a plausible range of outcomes arising from uncertainty in flood frequency estimation.
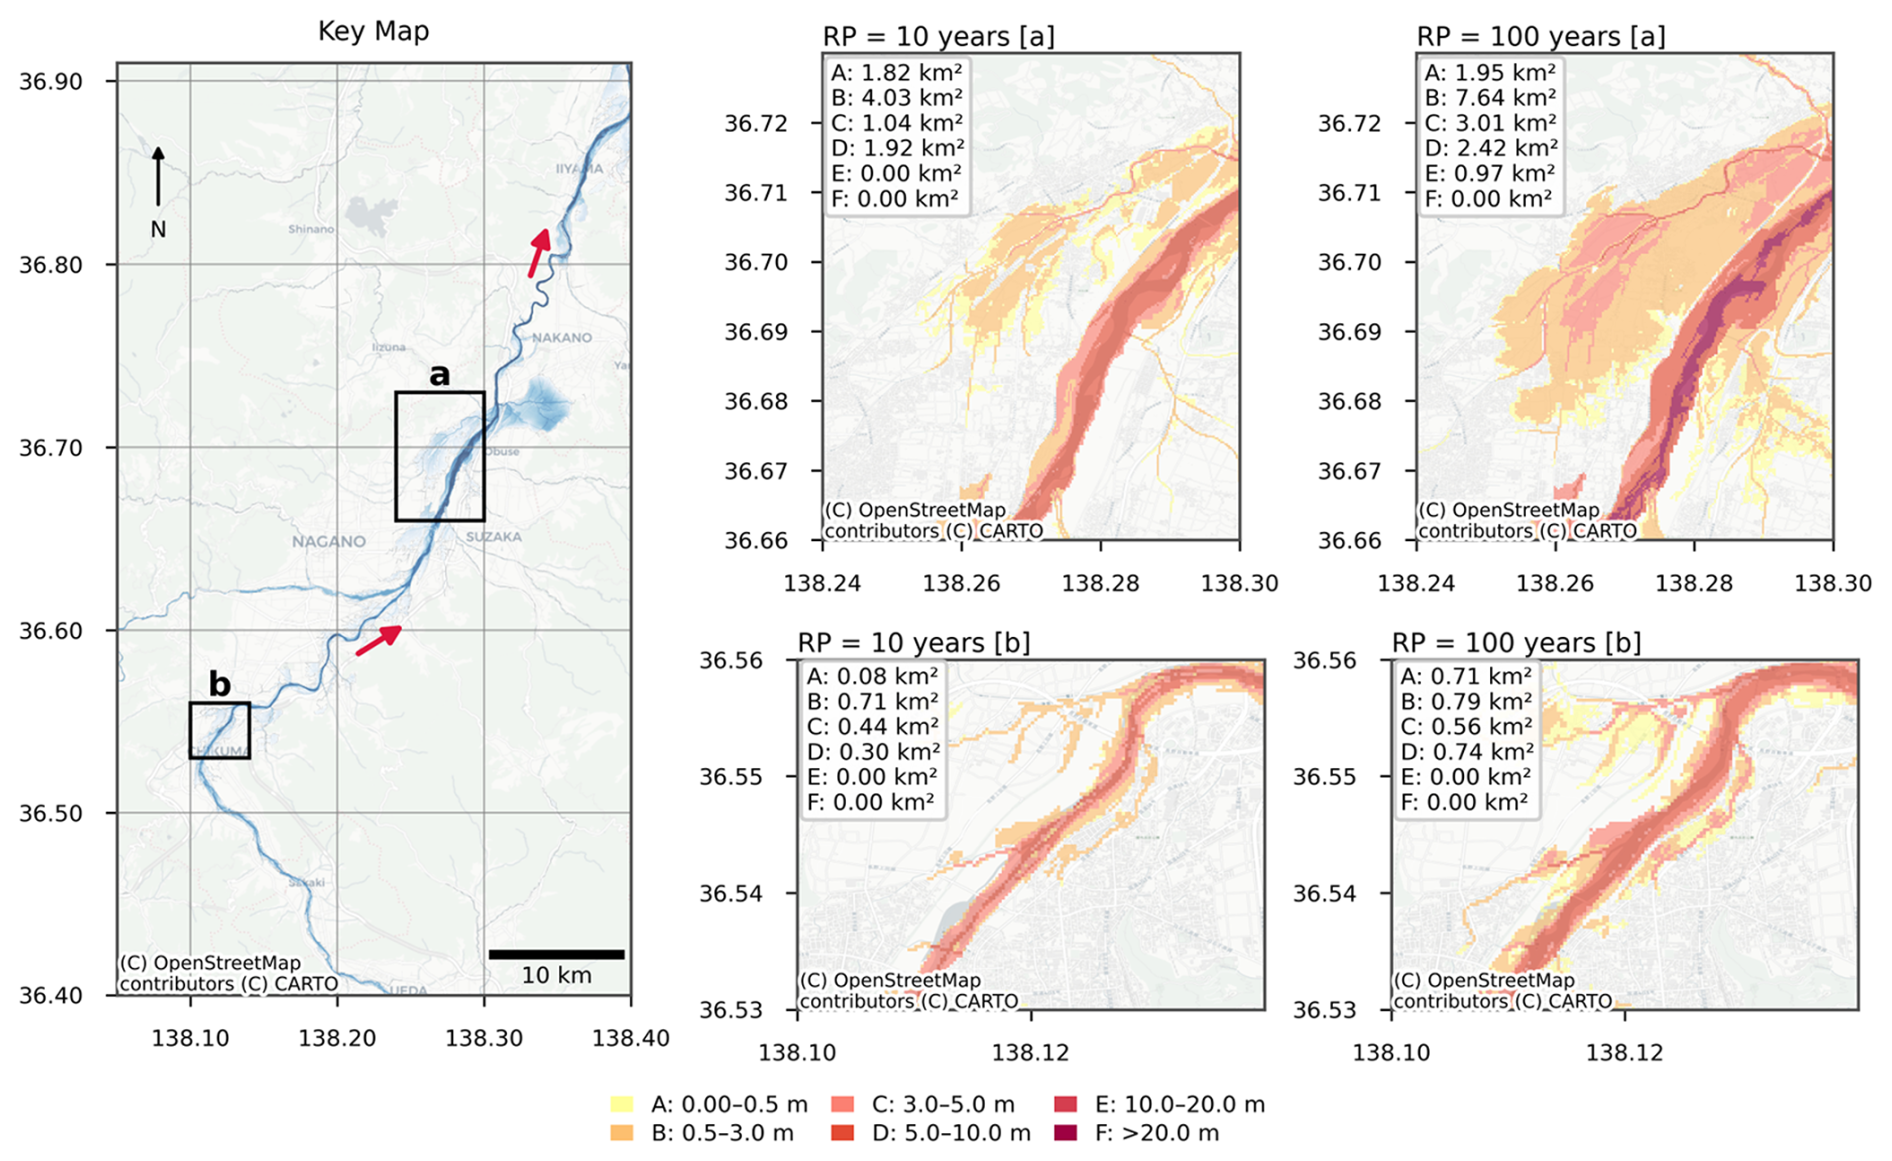
Figure 9Flood Hazard Maps for the Chikuma River for 10 and 100-year RPs with levee scenario (The inundation area of each Hazard class is written in each text box of subplots. The hazard classes are defined in legends at the bottom of the figure). © OpenStreetMap contributors © CARTO.
As the return period increases to 100 years, both the extent and depth of flooding increase notably. The hazard footprint broadens laterally across the floodplain corridor encroaching into areas with dense urban fabric visible in the background street map.. Flood hazard magnitude and spatial extents increase nonlinearly with the return period. Areas at risk of extreme-depth inundation increase dramatically beyond RP 100, while shallow and moderate flood classes (0.5–5 m) consistently dominate lower RPs. This pattern suggests the prioritisation of preparedness and infrastructure adaptation in these zones.
The sensitivity of the inundation extent shown in Fig. 9 to the choice of extreme-value distribution is further examined in Fig. S14. While the overall spatial patterns and relative severity between the 10- and 100-year scenarios remain robust, the total inundation area exhibits increasing variability at higher return periods due to differences in the upper tails of fitted distributions. This behaviour is consistent with previous findings that uncertainty associated with frequency-function selection primarily affects extreme events, whereas lower return periods are comparatively well constrained by the available record (Zhou et al., 2021). In this study, the GEV distribution was adopted based on its superior overall performance across Japan (Fig. S2), but the supplementary analysis (Fig. S14) highlights that locally comparable fits can lead to modest variations in hazard extent, which should be considered in site-specific risk assessments.
3.4 Overall Effect of Levee Integration on Flood Volume in Japan
Finally, we quantified the influence of levee integration on flood volume reduction, considering all the major rivers in Japan. Japan's “major rivers” include large Class-A river systems managed by the National Government and Class-B rivers, which are provincially managed, with extensive floodplain development and engineered flood protection, such as the Shinano–Chikuma (longest river in Japan), the Tone River system (Kanto Plain), and the Ishikari River system (Hokkaido), along with other long and high-discharge systems (e.g., Kitakami, Abukuma, Kiso, Mogami). These rivers typically originate in steep mountainous terrain and transition to wide alluvial plains, where population and assets concentrate and levees are continuous over long reaches. In this national-scale analysis, the aggregated reduction shown in Fig. 10 therefore reflects the combined effect of levee confinement across these major floodplain corridors, evaluated only in simulation grids where levees are present. We calculated total flood volume from gridded flood storage data for return periods (RPs) ranging from 5 to 1000 years.
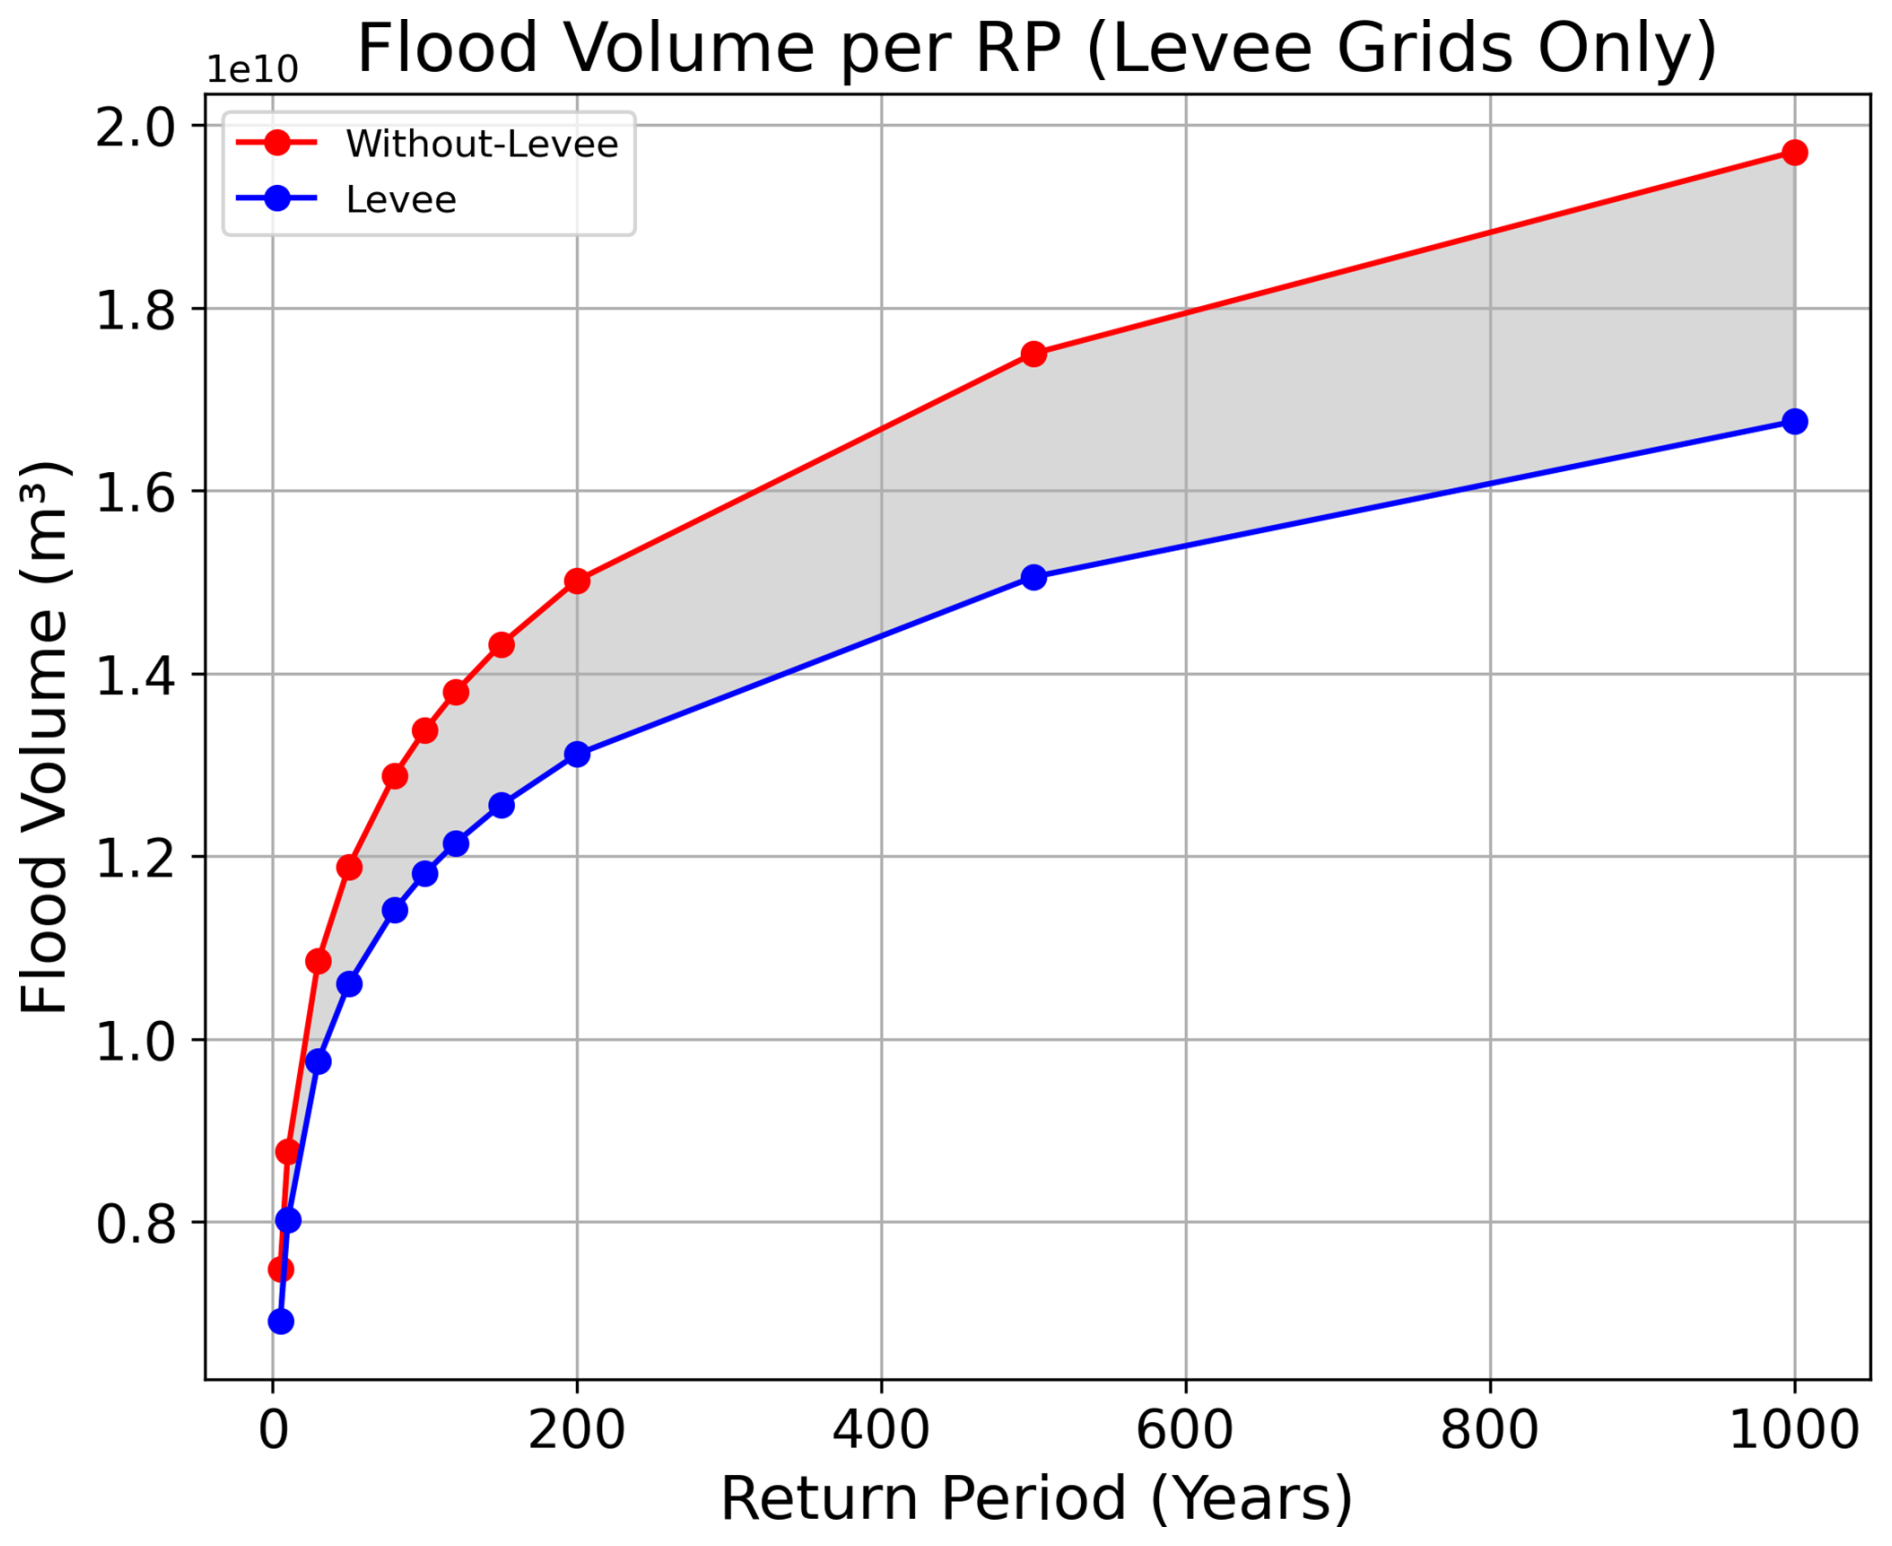
The analysis shows that, across all return periods, levee integration leads to a noticeable reduction in total flood volume within levee grids (Fig. 10, shaded area). At lower return periods (e.g., RP 10–100 years), the flood volume without levees significantly exceeds the levee scenario, with a distinct shaded area capturing the avoided volume. As the return period increases, the total flood volume grows in both cases.
The reduction remains between 10 % and 15 % across the range of return periods. This consistent reduction in simulated flood volume underscores the levee system's effectiveness in delaying and reducing floodwater accumulation within unprotected regions. While acknowledging that local water levels may increase due to flow confinement within narrower leveed corridors, even when total flood volume is reduced, and may influence inundation in adjacent non-levee grids, the analysis presented here focuses on volumetric responses within levee grids.
Several uncertainties influence both the magnitude and interpretation of the national-scale reduction shown in Fig. 10. First, uncertainties in levee detection and resampling can omit smaller structures or shift levee locations, which affect the estimated levee fraction (levfrc) and, in turn, the delineation of protected/unprotected zones. Second, levee height (levhgt) is estimated iteratively and the approach treats levees as static barriers, without dynamic overtopping, breaching, or failure, which can become important for extreme return periods. Third, the long-term simulations use daily runoff inputs and return-period volumes are derived from a finite sample length, both of which can affect the tail behavior of extremes. Finally, local floodplain controls such as road embankments, drainage infrastructure, and urban pluvial flooding are not represented, which can influence flood volume partitioning at fine scales. These uncertainties should be considered when interpreting the 10 %–15 % reduction shown in Fig. 10 as an aggregated, levee-grid-scale signal rather than a prediction of local protection performance.
It should be noted that the current implementation is explicitly designed for CaMa-Flood, as the downscaling relies on small unit catchments and levee parameters (i.e., levee fraction and levee height) that define protected and unprotected zones within each catchment; adapting the approach to other models would require an equivalent microscale or subbasin-based representation of levee confinement.
Many of the following limitations have already been discussed in the relevant Results and Discussion section and are summarised here to provide a consolidated overview and identify priorities for future development. Despite the improvements demonstrated by the proposed framework, several limitations remain. First, the levee dataset, although derived from high-resolution LiDAR DEMs, may overlook smaller flood control structures, leading to uncertainty in levee data and is subject to uncertainty in levee fraction estimation. Second, the frequency analysis used to estimate return-period flood volumes relies on limited sample lengths and may introduce increased uncertainty and potential over or underestimation at higher return periods due to extrapolation from limited sample lengths (e.g., Serinaldi and Kilsby, 2015; Zhou et al., 2021). Third, the framework does not dynamically cater for levee overtopping or breaching; levee influence is treated as a static height barrier. The levees along the Chikuma River may be vulnerable to overtopping and breaches during extreme floods (Ohtsuka et al., 2021); however, such failure scenarios are not explicitly represented in this study. Fourth, the input runoff data used in long-term simulations are daily averages, which may fail to capture short-duration peak flows, potentially underestimating flood magnitudes for certain return periods. Lastly, the current framework only addresses fluvial flooding from river overflow and does not account for pluvial flooding due to intense rainfall and limited urban drainage capacity. These limitations suggest that future work should incorporate breach modelling and high-resolution urban drainage integration.
Beyond individual components, uncertainties propagate through the modelling chain, from runoff forcing and large-scale hydrodynamic simulation to levee parameterisation, frequency analysis, and volumetric downscaling. Previous benchmarking studies using the same modelling framework have shown that bias in runoff forcing is the primary source of uncertainty, while other sources are relatively small in comparison (Zhou et al., 2021). While each source of uncertainty is discussed separately, their combined effect may influence both event-based validation results and long-term return-period estimates. In this study, the GEV distribution was adopted because it provided the best overall fit to historical data at the national scale (Fig. S2, Massey, 1951); however, the selection of the extreme-value distribution can affect the upper tail of flood-volume estimates. To address this, we conducted a targeted sensitivity analysis by evaluating alternative frequency distributions and propagating their effects through volumetric downscaling to inundation area estimates (Fig. S14). While this analysis demonstrates that the choice of fitting function introduces variability in extreme inundation extent, comprehensive quantification of uncertainty propagation across all components (e.g., runoff magnitude, levee fraction, levee height, and their interactions) would require a large ensemble of long-term simulations and is therefore beyond the scope of the present study. Accordingly, this work focuses on establishing and demonstrating the methodological framework, with broader multi-parameter sensitivity analyses identified as a priority for future research.
The applicability of the proposed framework is linked to the structure of the CaMa-Flood model. In CaMa-Flood, overbank flooding is represented as aggregated floodplain storage at the unit-catchment scale. As a result, the flood volume-based downscaling approach is most suitable for confined-to-moderately confined floodplains, where flood storage is primarily controlled by local topography and levee boundaries.
The volumetric downscaling approach applied in this study effectively captures the key characteristics of observed flooding. It enables the creation of high-resolution flood hazard maps from coarse-resolution flood volume data. The capacity to ascertain realistic flood behaviour at 1 arcsec resolution, despite starting from 1 arcmin model outputs, underscores the critical role of downscaling in bridging the gap between large-scale hydrodynamic simulations and the high-resolution requirements of flood hazard mapping. This affirms that volumetric-based downscaling and levee schematisation provide a robust framework for generating physically consistent, high-resolution flood hazard maps across complex river systems. Within the broader context of global flood hazard and risk modelling, our framework shows how coarse-resolution outputs from a global river model such as CaMa-Flood can be turned into high-resolution, levee-aware hazard maps. Unlike many existing global flood models, our method uses an explicit levee dataset and directly accounts for where levees redirect floodwater. Because the required inputs are increasingly available globally, the same workflow can be applied to other large, leveed river systems, making large-scale flood risk assessments more realistic. While the framework is demonstrated using CaMa-Flood, its conceptual basis (volume-based redistribution constrained by levee-defined protected zones) can be transferred to other large-scale river models that provide compatible micro-scale geometry and levee information.
The integration of levee parameters through levee height and levee fraction into the flood modelling enhances the accuracy of flood extent estimation in both protected and unprotected areas. Nationwide simulations show that levee integration leads to a consistent 10 %–15 % reduction in total flood volume across most return periods in levee-affected grids. At the unit catchment scale, reductions in inundated areas are even higher, depending on levee configuration and local topography. This implies that the model with a volumetric downscaling framework can effectively represent the spatial variability of flood protection and convey both attenuation and floodplain response under levee confinement.
The flood hazard maps generated for the Chikuma River basin reveal a clear progression in both inundation extent and severity with increasing return periods. While lower return periods (e.g., RP 10) already pose significant threats to urban areas and critical infrastructure, especially downstream of major confluences, the hazard footprint expands markedly by RP 100. By RP 100, the growth in flood extent becomes nonlinear, as reflected by the rapid expansion of higher-depth inundation classes. These patterns highlight the need for improved flood preparedness and infrastructure adaptation even under moderate flood scenarios and further stress the value of high-resolution, levee-aware mapping in informing such efforts.
Overall, the framework offers a practical and scalable approach to enhancing flood hazard mapping through the use of large-scale models. Future work may concentrate on incorporating dynamic levee failure and urban drainage features or components. The proposed framework supports integrated flood management and climate adaptation planning in levee-protected and vulnerable floodplain areas.
CaMa-Flood (https://doi.org/10.1029/2010WR009726, Yamazaki et al., 2011) is open-source; the exact version (v4.2) used for this study is archived at Zenodo (https://doi.org/10.5281/zenodo.11091435, Yamazaki et al., 2024). All scripts required to reproduce our results, including the return period storage calculators for without-levee and leveed scenarios, the levee-aware downscaling routine, configuration templates, conda environment, launcher scripts, and figure scripts, etc., are archived at Zenodo (https://doi.org/10.5281/zenodo.17231818, Aslam, 2025a). The archive contains a step-by-step user instructions (REPRODUCE.md) to recreate the environment and regenerate all figures. For convenience, a code only (without trial data) is also available at https://doi.org/10.5281/zenodo.17231022 (Aslam, 2025b).
Public and third-party datasets and access routes are as follows: GRADES hydrological forcing data (https://doi.org/10.1175/BAMS-D-20-0057.1, Yang et al., 2021), MERIT Hydro topography (https://doi.org/10.1029/2019WR024873, Yamazaki et al., 2019), the global levee dataset (https://doi.org/10.1029/2024GL114121, Khanh et al., 2025). City flood hazard/hazard maps, Flood inundation extents from 2019 Typhoon Hagibis and other data used for comparison and generating figures are provided in the Zenodo archive (https://doi.org/10.5281/zenodo.17231818, Aslam, 2025a), which includes detailed instructions (REPRODUCE.md) for environment setup, storage computation, downscaling, and figure reproduction. The Japan 1 arcsec river network and floodplain maps used here are restricted; access can be requested from Dai Yamazaki (Institute of Industrial Science, The University of Tokyo) via the project page https://global-hydrodynamics.github.io/CaMa-Flood/ (last access: 27 April 2026). Sample outputs generated using these high-resolution maps (for figure reproduction) are included in the Zenodo archive (https://doi.org/10.5281/zenodo.17231818, Aslam, 2025a).
The supplement related to this article is available online at https://doi.org/10.5194/gmd-19-3709-2026-supplement.
MHA conducted the CaMa-Flood simulations, developed the storage-based downscaling code, performed all data analysis, and led the writing of the manuscript. YH administered the research, provided continuous guidance throughout the project, and contributed to the critical review and editing of the manuscript. DY provided the CaMa-Flood model and high-resolution river network data used in the simulations. GZ and YK developed the levee scheme in CaMa-Flood and offered initial guidance on levee integration. DNK gave the levee dataset used to generate the levee parameters incorporated into the model and helped optimise the downscaling code.
The contact author has declared that none of the authors has any competing interests.
Publisher's note: Copernicus Publications remains neutral with regard to jurisdictional claims made in the text, published maps, institutional affiliations, or any other geographical representation in this paper. The authors bear the ultimate responsibility for providing appropriate place names. Views expressed in the text are those of the authors and do not necessarily reflect the views of the publisher.
Observed river discharge data were obtained from the Ministry of Land, Infrastructure, Transport and Tourism (MLIT), Japan. Mapping and visualization were primarily performed using Python libraries, with supplementary spatial processing conducted in QGIS. Base maps include OpenStreetMap data © OpenStreetMap contributors. Some of the figures were produced using the Scientific Colour Maps (Crameri, 2018). The authors also used ChatGPT (OpenAI) to improve the clarity and grammar of the manuscript text. The authors carefully reviewed and verified all AI-assisted edits to ensure accuracy and appropriateness.
This research was supported by the SOUHATSU project (grant no. JPMJFR215P) from the Ministry of Education, Culture, Sports, Science and Technology (MEXT), Japan and the LaRC-Flood project. Additional support was provided by the Japan Science and Technology Agency (JST) under the Moonshot R&D Program (grant no. JPMJMS2281).
This paper was edited by Lele Shu and reviewed by Jonathan Remo, Jacob Schewe, and one anonymous referee.
Aslam, M. H.: Levee-aware Downscaling (code and Trial Data), Zenodo [code, data set], https://doi.org/10.5281/zenodo.17231818, 2025a.
Aslam, M. H.: Levee-aware Downscaling (archive), Zenodo [code], https://doi.org/10.5281/zenodo.17231022, 2025b.
Chan, F. K. S., Yang, L. E., Mitchell, G., Wright, N., Guan, M., Lu, X., Wang, Z., Montz, B., and Adekola, O.: Comparison of sustainable flood risk management by four countries – the United Kingdom, the Netherlands, the United States, and Japan – and the implications for Asian coastal megacities, Nat. Hazards Earth Syst. Sci., 22, 2567–2588, https://doi.org/10.5194/nhess-22-2567-2022, 2022.
Crameri, F.: Scientific colour maps, Zenodo [code], https://doi.org/10.5281/zenodo.1243862, 2018.
Dottori, F., Salamon, P., Bianchi, A., Alfieri, L., Hirpa, F. A., and Feyen, L.: Development and evaluation of a framework for global flood hazard mapping, Adv. Water Resour., 94, 87–102, https://doi.org/10.1016/j.advwatres.2016.05.002, 2016.
Fan, J. and Huang, G.: Evaluation of flood risk management in Japan through a recent case, Sustainability, 12, 5357, https://doi.org/10.3390/su12135357, 2020.
Geospatial Information Authority of Japan (GSI): Flooded area polygon data from Typhoon Hagibis (2019), https://www1.gsi.go.jp/geowww/201910/shinsui/shinsui_rinkaku.zip (last access: 25 March 2025), 2019.
Geospatial Information Authority of Japan (GSI): Information on Typhoon Hagibis 2019, https://www.gsi.go.jp/BOUSAI/R1.taihuu19gou.html#11, last access: 23 March 2025a.
Geospatial Information Authority of Japan (GSI): National land numerical information – hazard maps, https://disaportal.gsi.go.jp/hazardmap/maps/, last access: 25 July 2025b.
Hirabayashi, Y., Mahendran, R., Koirala, S., Konoshima, L., Yamazaki, D., Watanabe, S., Kim, H., and Kanae, S.: Global flood risk under climate change, Nat. Clim. Change, 3, 816–821, https://doi.org/10.1038/nclimate1911, 2013.
Hosking, J. R. M.: L-moments: analysis and estimation of distributions using linear combinations of order statistics, J. R. Stat. Soc. B, 52, 105–124, https://doi.org/10.1002/9781118445112.stat00570.pub2, 2015.
Huang, G.: A Comparative Study on Flood Management in China and Japan, Water, 6, 2821–2829, https://doi.org/10.3390/w6092821, 2014.
Huang, G.: Are cities safer than before?, Front. Sustain. Cities, 3, 713300, https://doi.org/10.3389/frsc.2021.713300, 2021.
Khanh, D. N., Tsumura, Y., Sasaki, O., Shiraishi, K., Akimoto, D., Yamazaki, D., Zhao, G., and Hirabayashi, Y.: Mapping the world's river levees: A hyper-resolution levee database based on digital elevation models, Geophys. Res. Lett., 52, e2024GL114121, https://doi.org/10.1029/2024GL114121, 2025.
Kimura, Y., Hirabayashi, Y., Kita, Y., Zhou, X., and Yamazaki, D.: Methodology for constructing a flood-hazard map for a future climate, Hydrol. Earth Syst. Sci., 27, 1627–1644, https://doi.org/10.5194/hess-27-1627-2023, 2023.
Kita, Y. and Yamazaki, D.: Verification of the feasibility of using the global river flood model output as a hazard map for Japan, J. Jpn. Soc. Hydrol. Water Resour., 35, 267–278, https://doi.org/10.3178/jjshwr.35.1743, 2022 (in Japanese).
Massey, F. J.: The Kolmogorov–Smirnov test for goodness of fit, J. Am. Stat. Assoc., 46, 68–78, https://doi.org/10.1080/01621459.1951.10500769, 1951.
Ministry of Land, Infrastructure, Transport and Tourism (MLIT): Observed river discharge and water level data, https://www1.river.go.jp, last access: 25 October 2024.
Ohtsuka, S., Sato, Y., Yoshikawa, T., Sugii, T., Kodaka, T., and Maeda, K.: Levee damage and revetment erosion by the 2019 Typhoon Hagibis in the Chikuma River, Japan, Soils Found., 61, 1172–1188, https://doi.org/10.1016/j.sandf.2021.05.009, 2021.
Pappenberger, F., Dutra, E., Wetterhall, F., and Cloke, H. L.: Deriving global flood hazard maps of fluvial floods through a physical model cascade, Hydrol. Earth Syst. Sci., 16, 4143–4156, https://doi.org/10.5194/hess-16-4143-2012, 2012.
Ridwan, H., Homma, M., and Liu, W.: Flood hazards assessment and residential flood damage mapping in Hitoyoshi, Japan, J. Archit. Environ., 21, 171–186, 2022.
Serinaldi, F. and Kilsby, C. G.: Stationarity is undead: Uncertainty dominates the distribution of extremes, Adv. Water Resour., 77, 17–36, https://doi.org/10.1016/j.advwatres.2014.12.013, 2015.
Tellman, B., Sullivan, J. A., Kuhn, C., Kettner, A. J., Doyle, C. S., Brakenridge, G. R., Erickson, T. A., and Slayback, D. A.: Satellite imaging reveals increased proportion of population exposed to floods, Nature, 596, 80–86, https://doi.org/10.1038/s41586-021-03695-w, 2021.
Ward, P. J., Jongman, B., Salamon, P., Simpson, A., Bates, P. D., De Groeve, T., Muis, S., de Perez, E. C., Rudari, R., Trigg, M. A., and Winsemius, H. C.: Usefulness and limitations of global flood risk models, Nat. Clim. Change, 5, 712–715, https://doi.org/10.1038/nclimate2742, 2015.
Yamazaki, D., Kanae, S., Kim, H., and Oki, T.: A physically based description of floodplain inundation dynamics in a global river routing model, Water Resour. Res., 47, W04501, https://doi.org/10.1029/2010WR009726, 2011.
Yamazaki, D., de Almeida, G. A. M., and Bates, P. D.: Improving computational efficiency in global river models by implementing the local inertial flow equation and a vector-based river network map, Water Resour. Res., 49, 7221–7235, https://doi.org/10.1002/wrcr.20552, 2013.
Yamazaki, D., Ikeshima, D., Sosa, J., Bates, P. D., Allen, G. H., and Pavelsky, T. M.: MERIT Hydro: A high-resolution global hydrography map based on latest topography data set, Water Resour. Res., 55, 5053–5073, https://doi.org/10.1029/2019WR024873, 2019.
Yamazaki, D., Revel, M., Hatono, M., Hanazaki, R., Nitta, T., Zhou, X., Eilander, D., and Pilz. T.: global-hydrodynamics/CaMa-Flood_v4: CaMa v4.20 (v4.20), Zenodo [code], https://doi.org/10.5281/zenodo.11091435, 2024.
Yang, Y., Pan, M., Lin, P., Beck, H. E., Zeng, Z., Yamazaki, D., David, C. H., Lu, H., Yang, K., Hong, Y., and Wood, E. F.: Global reach-level 3-hourly river flood reanalysis (1980–2019), B. Am. Meteorol. Soc., 102, E2086–E2105, https://doi.org/10.1175/BAMS-D-20-0057.1 , 2021.
Zhao, G., Yamazaki, D., Tanaka, Y., Zhou, X., Li, S., Hu, Y., Hirabayashi, Y., Neal, J., and Bates, P.: Developing a levee module for global flood modelling with a reach-level parameterization approach, Water Resour. Res., 61, e2024WR039790, https://doi.org/10.1029/2024WR039790, 2025.
Zhou, X., Ma, W., Echizenya, W., and Yamazaki, D.: The uncertainty of flood frequency analyses in hydrodynamic model simulations, Nat. Hazards Earth Syst. Sci., 21, 1071–1085, https://doi.org/10.5194/nhess-21-1071-2021, 2021.