the Creative Commons Attribution 4.0 License.
the Creative Commons Attribution 4.0 License.
 | 05 May 2026
Incorporating observed fire severity in refined emissions estimates for boreal and temperate forest fires in the carbon budget model CBM-CFS3 v1.2
Dan K. Thompson
Ellen Whitman
Mark Hafer
Oleksandra Hararuk
Chelene Hanes
Vinicius Manvailer Goncalves
Ben Hudson
Among the many natural disturbances that affect Canada's boreal and temperate forest biomes, wildfire has the greatest impact on forest productivity, landscape structure, timber supply and greenhouse gas emissions. Fire severity represents the fate of biomass, by partitioning survival, consumption, and mortality without consumption. Currently, the impact of fire on carbon stocks in Canada's forest carbon accounting is limited to a single parametrization of fire severity that assumes only high severity fires, despite evidence of widespread mixed-severity fires. This paper describes a sub-model, termed FireDMs (Fire Disturbance Matrix: severity), of the National Forest Carbon Monitoring Accounting and Reporting System for Canada (NFCMARS). In this sub-model, field measurements of biomass consumption are related to satellite-derived burn severity maps and are interpreted from a fire physics and ecology perspective to derive estimates of the forest greenhouse gas emissions in the immediate aftermath of fires. The sub-model also quantifies fire-killed but uncombusted biomass as a set of distinct pools. Model outputs indicate total direct carbon emissions range from a 11 t C ha−1 in Boreal Shield West forests of Saskatchewan following low severity fire to over 60 t C ha−1 in Pacific Maritime forests of British Columbia under high severity fire. The existing approach to emissions in NFCMARS yields regional CO2-equivalent emissions that are typically 10 % to 25 % higher than this new method, owing to lower overall canopy consumption with mixed-severity fires, which is only partially offset by increased estimates of forest floor consumption in this new approach. Comparisons against directly observed fire plume emissions ratios as well as against annualized carbon emissions for Canada's 2023 fire season show good model agreement with observations.
- Article
(1671 KB) - Full-text XML
-
Supplement
(28879 KB) - BibTeX
- EndNote


© His Majesty the King in Right of Canada, as represented by the Minister of Natural Resources Canada, 2026.
Wildfire is on par with insects as the largest stand-replacing disturbance process in Canada's forest, impacting ∼1–3 M ha of Canada's 367 M ha forested area in a typical year (Hanes et al., 2019). In Canada's updated 54-year burned area record, 10 years have exceeded 4 Mha of burned area (or approximately 1 % of Canada's forest area) (Skakun et al., 2022). The 2023 fire season in Canada burned a remarkable 15 M ha owing to extreme drought, severe fire weather conditions, and a prolonged fire season length (Jain et al., 2024).
Managed northern forest areas, adjacent to communities, have shown the effects of local fire suppression leading to a stand-age bias towards older stands; though the effect is largely limited to a c. 25 km radius around these widely dispersed communities (Parisien et al., 2020). More southern boreal forest with extensive suppression activities has historically seen evidence of a reduction in observed vs. potential area burned (Cumming, 2005) though this effect has likely been erased given the increasing frequency of extreme burning conditions Wang et al. (2023) and corresponding record area burned (Jain et al., 2024).
Burned area in Canada is dominated by a relatively small number of very large fires, with 3 % of fires constituting 97 % of the burned area (Stocks et al., 2002). Lightning-caused fires account for approximately half of all ignitions and approximately 80 % of burned area, but no distinction is made between human and lightning ignition for forest sector GHG reporting purposes. Annual burned area mapping for GHG reporting in Canada is conducted using a composite of satellite and aerial mapping at 30 metre resolution (Hall et al., 2020); the relatively small number of large fires, and their slow vegetation regeneration (White et al., 2017) allows for reliable mapping using multispectral imagery such as Landsat within one year of the fire (Whitman et al., 2018).
Canada reports on GHG emission and removals from the forest sector in Canada's National GHG Inventory Report (NIR). Carbon stocks and stock changes are modelled using the Carbon Budget Model of the Canadian Forest Sector (CBM-CFS3) (Kurz et al., 2009) parameterized and driven by spatial and non-spatial data describing forest inventory, annual yield and disturbance (Stinson et al., 2011). Following international good practice guidance to focus on human-caused emissions in NIRs, Canada focuses emission reporting on managed forest lands, which make up approximately 225 M ha of Canada's 367 M ha total forest area. In CBM-CFS3, forest inventory is represented by spatially referenced stand lists representing large homogeneous stands that fall within spatial units (e.g. forest management areas) and broad regions called Reconciliation Units (RU) that are the intersection of ecozones with provincial/territorial boundaries (Kurz et al., 2002). Within CBM-CFS3 precisely mapped burned areas are summarized at the level of spatial units and applied randomly to stands within that unit.
Large wildfire burned area is not distributed equally across differing forest management regimes in Canada. Managed forest, where GHG emissions reporting is mandated, accounts for 23 % of the area burned between 1972 and 2024; these publicly-owned managed forest areas under long-term license to private timber companies forms 40 % of Canada's forest area (Stinson et al., 2019). Privately-owned forest constitutes 6 % of the forest area, but only 0.5 % of area burned. The large majority (c. 75 %) of the forest area burned in Canada occurs in a mix of formally protected areas, remote unmanaged forest, Indigenous reserve lands and other uses without large-scale harvesting. In these areas, detailed GHG reporting is required only in protected areas.
Years with larger burned areas will improve the representative nature of random stands being assigned fire disturbance within a year, as a wider variety of stand types will be selected. Furthermore, large, drought-driven fire years such as 2023 have been observed to burn at more equal rates across the diversity of local ecosite flammability (Parks et al., 2018; Whitman et al., 2024) and thus provides an ideal test case for assessing changes in emissions estimates for a spatially referenced system. Importantly, these years with very large area burned still show a similar natural range in variability of burn severity (Whitman et al., 2018).
CBM-CFS3 currently assesses fire impacts to carbon pools only as representing high-severity fire, which is the most common of the three severity classes (low, moderate, and high) used for assessing of burned forest in Canada (Hall et al., 2008) and the conterminous US (Eidenshink et al., 2007). Biomass consumption estimates in CBM-CFS3 are based on the assumption of 100 % crown consumption of conifer fuels, with additional biomass consumption following a spatially-referenced aggregated estimate at the RU-level of annualized drought conditions. Biomass consumption estimates for the remaining forest carbon pools are made via the Canadian Fire Behaviour Prediction System (FBP; Forestry Canada Fire Danger Group, 1992) based on the fire's start date fire weather conditions. Though the FBP is able to simulate fire behaviour along the entire intensity gradient from surface to crown fire, the lack of fire severity mapping and biomass consumption rates at different severity classes has constrained carbon modelling to the most common high severity class.
Quantification of the change in carbon stock in CBM-CFS3 is made via a “Disturbance Matrix” (hereafter referred to as a DM) which is a matrix of coefficients between 0 and 1, where rows are donor pools, and columns: receptor pools or gases that are generated by a fire. Atmospheric fluxes of CO2, CO, and CH4 are also tracked in the DM. Importantly, unlike emissions-only fire models commonly used in air quality modelling in Canada (Chen et al., 2019), DM definitions in CBM-CFS3 also track the transfer of live biomass to dead, but still uncombusted pools, such as the transfer from live stemwood pools (which are killed but not burned) to standing deadwood, also known as snags.
Although DMs may provide a more conservative estimate of C emissions due to not combusting all biomass instantaneously, it may overestimate the C emissions due to assuming uniform fire severity. In Canada's forests, a combination of climate, disturbance history, soils, and less frequently topographic variables determine leading tree species; at local scales (1–100 ha), tree species composition plays a major role in determining ecosystem susceptibility to fire (Bernier et al., 2016) where older, conifer-dominated forests burn at very high rates relative to adjacent deciduous or mixed stands. Large drought-driven fire years may increase burn rates in deciduous and mixed forest to levels similar to older conifer stands (Parks et al., 2014). However, even in more intense drought conditions, deciduous and mixed forest burn severity is still consistently lower than in most conifer forests – except xeric conifer forest which tend to be more fire resistant (Whitman et al., 2018). Thus, important local biases in fire activity and severity towards older and moderate to poorly-drained forests are not resolved in the spatially-referenced CBM-CFS3 when a uniform fire severity is applied.
To support recent advances in operational burn severity mapping for Canada (Whitman et al., 2020) alongside multi-decade reliable burned area records that provide certainty on fire growth start and end dates based on satellite hotspot detections (Guindon et al., 2014, 2020; Hall et al., 2020), this paper describes a local scale (30 m) method for defining a per-pixel proportional carbon stock change and emissions estimate via a locally calculated fire DM. In this document, we outline a new scheme for computing fire DM based on field observations aggregated up to a three severity-class paradigm (low, moderate, and high severity). These fire carbon flux models are built from a blend of aggregated field data linked to remotely sensed severity, as well as insights from fire physics and experimental fires. Key knowledge gaps are also highlighted, with interim solutions presented until further quantification can be done in field studies, such as from further wildfire observations, experimental fires, or prescribed fires.
Simplified fire DMs (i.e. a scalar reduction on 100 % mortality assumption across all DM components, constant severity across all fires) have been used in valuable scenario exercises using a spatially-explicit version of CBM-CFS3 for assessment of future fire and harvest scenarios (Smyth et al., 2022). Here, we provide a data-driven and regionally-adjusted framework that better reflects the ecological nuances of moderate and low-severity fire across Canada's diverse ecozones. This paper describes the technical development of a fire severity module for the CBM-CFS3 model, version 1.2, benchmarked against the existing fire approach in the NIR and against independent C emissions observation during Canada's record fire season in 2023.
2.1 Carbon modelling
2.1.1 CBM-CFS3 spatial units
Carbon reporting in Canada's forests is broken down by Reconciliation Unit (RU), which is the intersection of terrestrial ecozones and provincial/territorial boundaries, as shown in Fig. 1. Forest carbon stocks in Canada are influenced by species composition, age class distribution, natural disturbance history, human-influenced management regime and climatic variables, among other factors, which are well-represented by the RU framework supporting Canada's NIR. Due to the current spatial imprecision of certain key model data (e.g. deforestation rates), analysis finer than the RU-level tends to misrepresent regional-variation in emission estimates.
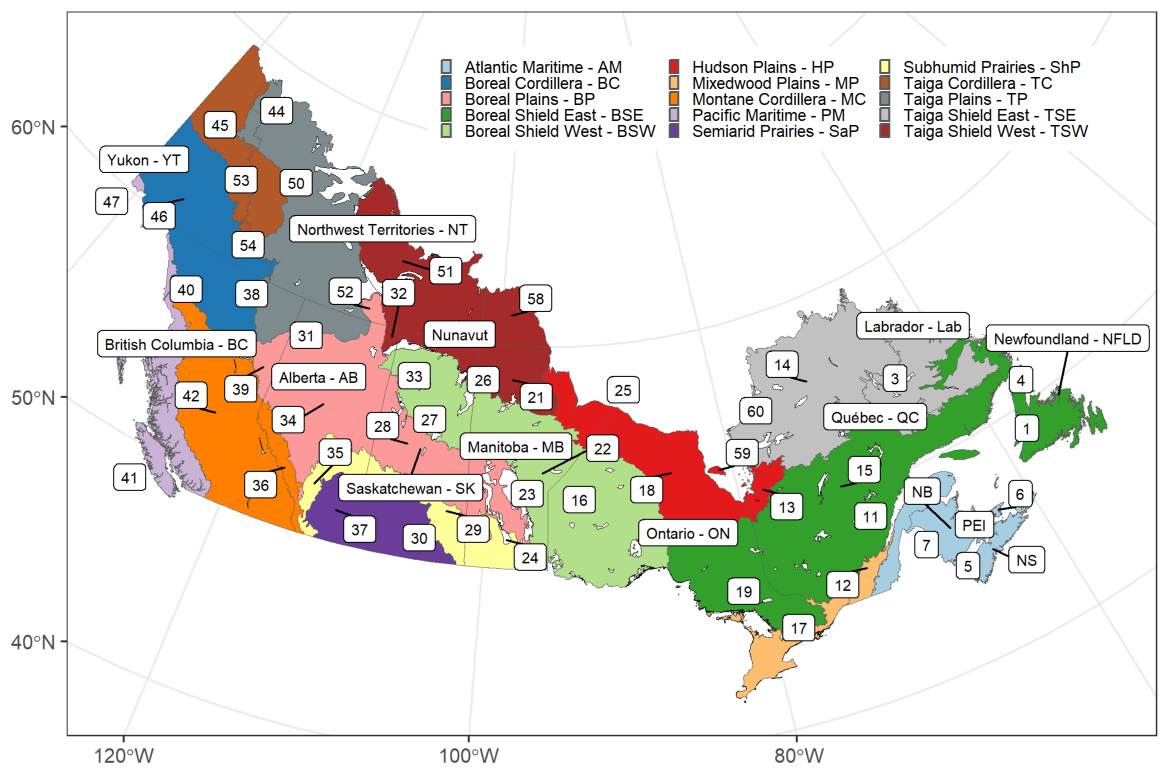
Figure 1Colours corresponds to ecozones, and labels to sub-national provinces and territories. The smaller provinces of New Brunswick (NB), Nova Scotia (NS), and Prince Edward Island (PEI) are not fully spelled out in the labels. Reconciliation Units (RUs) used in the CBM-CFS3 framework are all unique combinations of ecozones and provinces/territories. Biomass estimates used in this analysis are reported as averages at the RU scale. Numbers labelled correspond to RU identifiers used in the text.
2.1.2 Carbon pool description
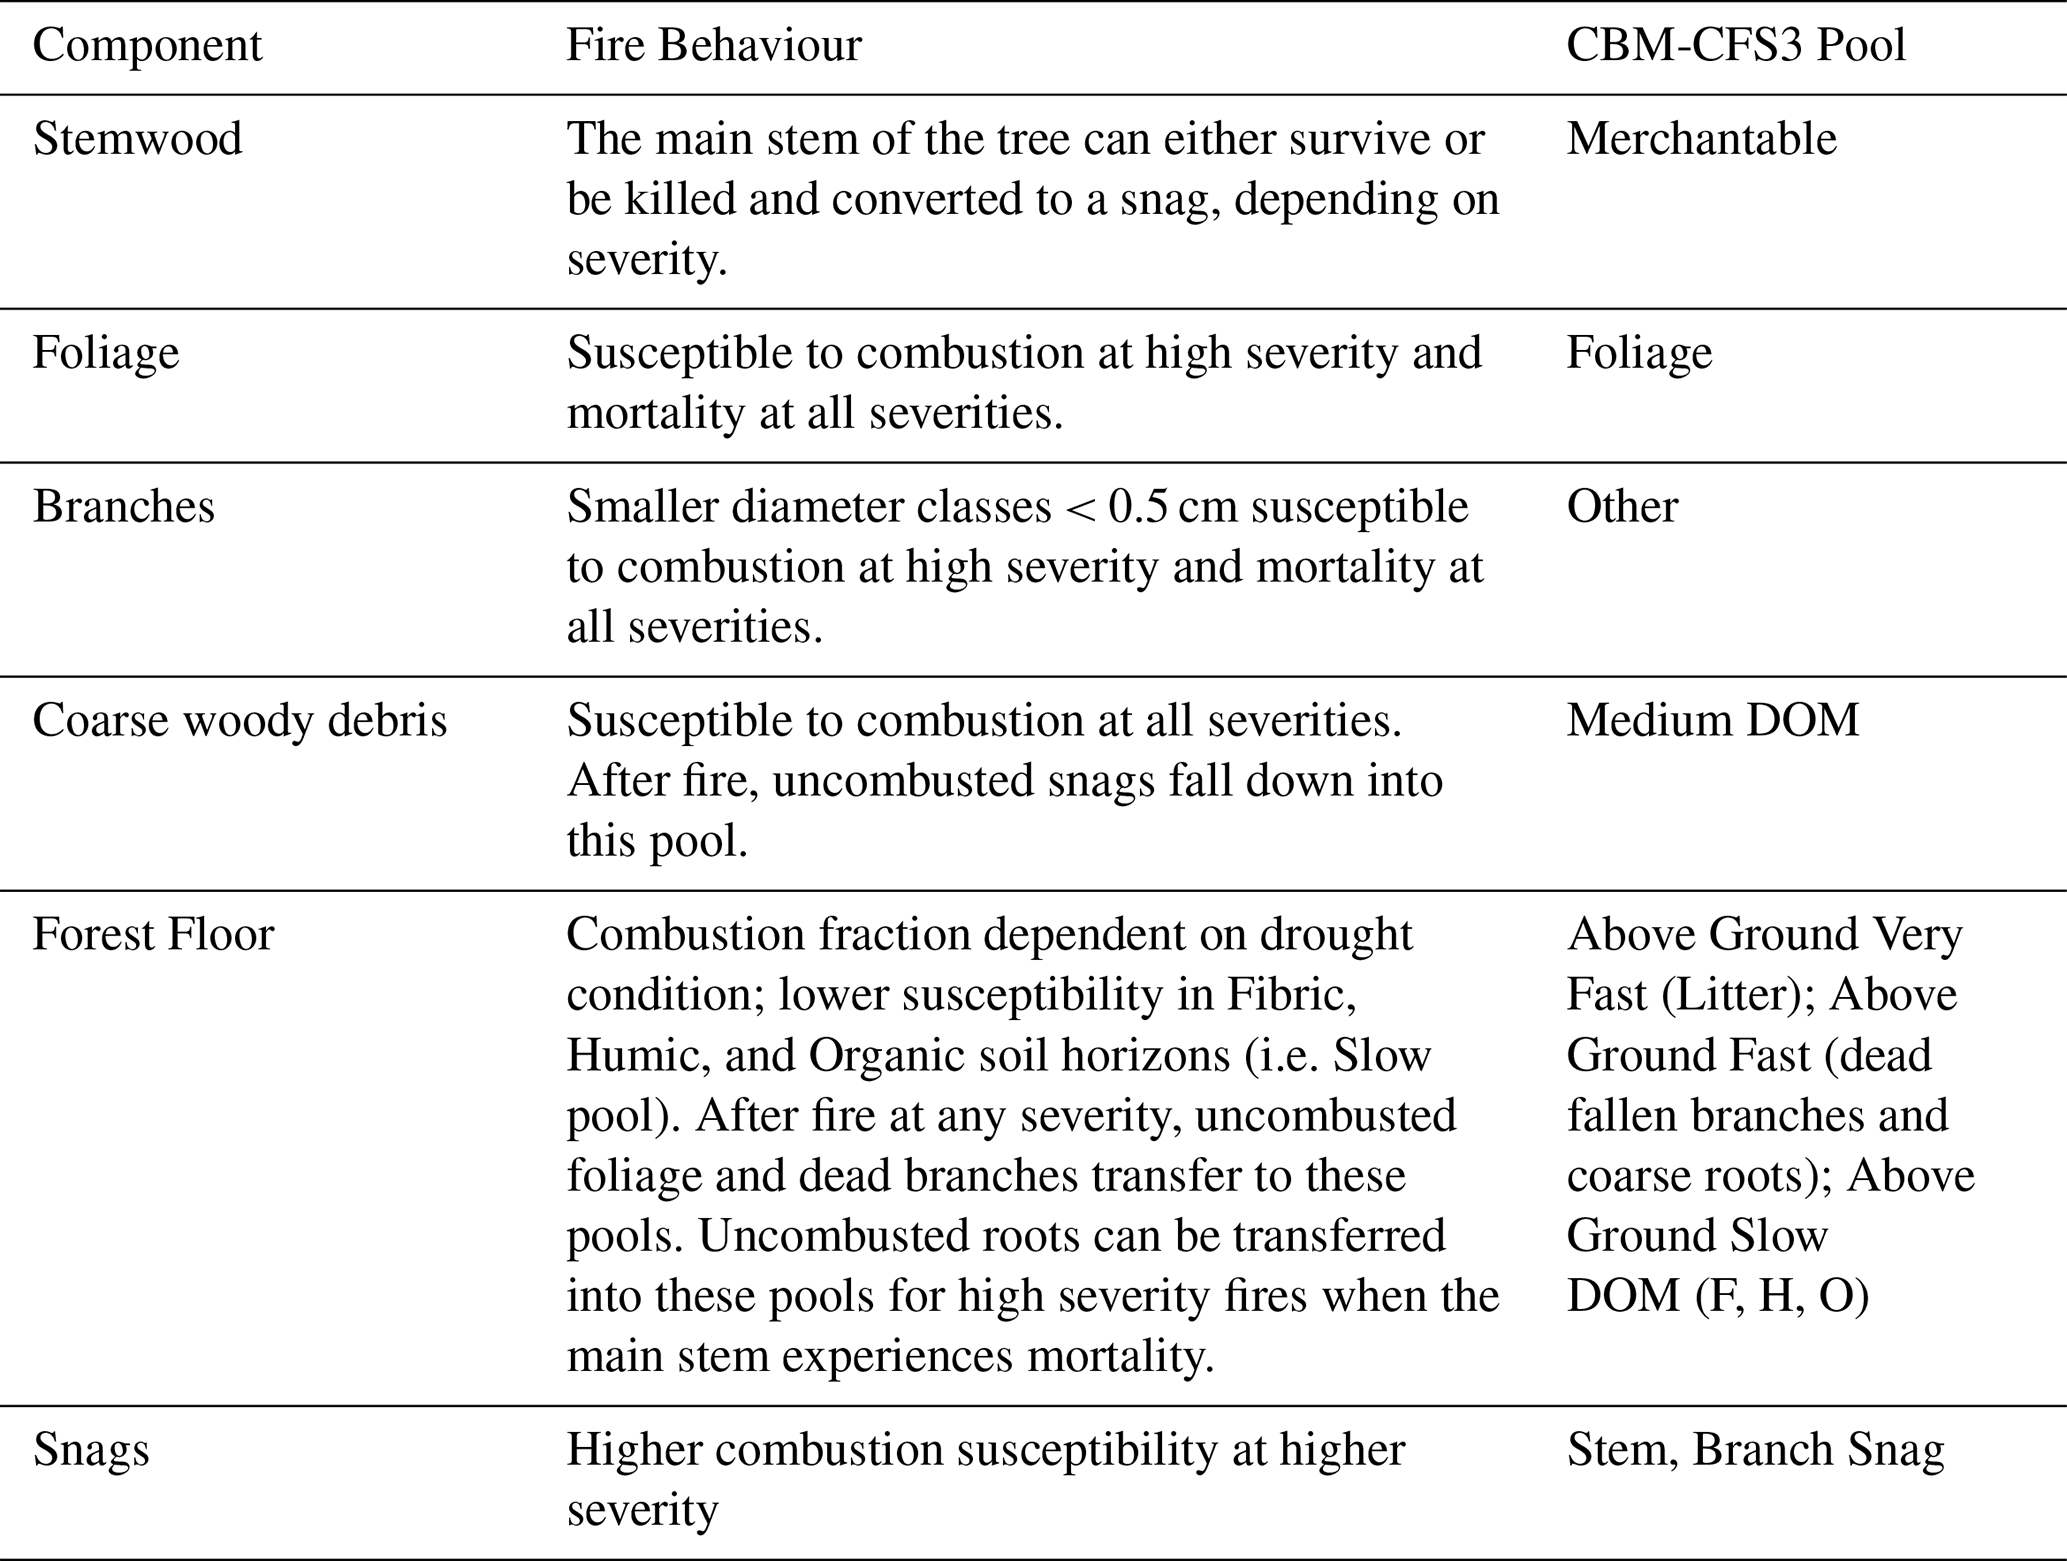
The carbon pools represented in CBM-CFS3 can be broadly categorized as live biomass, dead organic matter (DOM) and are described in detail in Kurz et al. (2009). Key components that interact most with wildfire are summarized in Table 1. Though designed for forest GHG reporting, the pool structure of CBM-CFS3 does distinguish between softwood (conifer) and hardwood (broadleaf) that also have large contrasts in both foliage flammability (Alexander, 2010) and ability to survive low to moderate intensity surface fires (Héon et al., 2014). Tree biomass pools are further divided into merchantable tree biomass pools (foliage, stemwood, branches), with separate hardwood and softwood pools for smaller, subcanopy trees. Representative pool values (in t C ha−1) per RU are produced and updated annually based on updated forest inventory and disturbance data. Pool size information by RU is provided in Table S1 of the Supplement. Upon the detection of a forest disturbance such as fire, pool C biomass (both dead and alive) can be transferred to other pools or the atmosphere (or remaining in the same pool) at proportions prescribed by a DM. Any live or dead biomass pools combusted immediately are tallied in the direct emissions sums reported here. Live biomass that is killed but not combusted by the fire is tracked, but experiences delayed decomposition on the order of years to decades, and therefore is not tallied within the direct emissions modelling shown below. See Appendix A for DM examples.
Table 1Key components of the CBM-CFS3 model relevant to summary fire behaviour and fuel consumption characteristics from the fire behaviour and fire ecology literature.
2.1.3 Definitions and assumptions of forest carbon budget after fire
To simplify the process of creating DMs as a distillation of the complexities of fire severity and combustion patterns, the following statements are proposed and maintained throughout:
-
Disturbance matrices are to be in terms of mortality, not survival. Mortality here is defined as tree death by the end of the calendar year of the fire's occurrence. Tree mortality in subsequent years is not modelled here.
-
Crown Fraction Burned (CFB) is a mass-based estimate of the portion of foliage consumed in the flaming passage of a fire, and is inclusive of merchantable and submerchantable trees, both broadleaf and needleleaf. Needles that are heat-killed but otherwise not consumed in the fire are not considered part of CFB, and are instead considered part of the foliage to litter biomass transfer.
-
The heat-killed but unconsumed fraction of the canopy is equal to (mortality minus CFB).
-
In submerchantable trees, mortality is equal to CFB.
-
In merchantable trees, CFB is less than or equal to mortality.
-
Snags are inclusive of both those killed by prior fire as well as those killed by all other causes.
Of these, Crown Fraction Burned (CFB) is an important concept used primarily in fire behaviour science but not carbon accounting nor fire ecology. CFB was introduced in the 1992 Fire Behaviour Prediction System documentation (Forestry Canada Fire Danger Group, 1992), and provides a simple continuous 0–100 ariable for only the consumption of foliage (which we assume here is inclusive of both conifer and broadleaf). For our purposes, CFB is the desirable metric as opposed to ordinal and less precise systems like Canopy Fire Severity Index (Kasischke et al., 2000) that allows the user to specify which pools of canopy biomass are consumed, but not the precise fraction of each given pool that is consumed.
2.1.4 Combustion gas emission ratios
Certain variables, like the partitioning of CO2 : CH4 : CO gas emissions, are constant throughout ecozones, but vary by flaming vs. smouldering combustion modes. The precise emissions ratios vary slightly between models and field studies, but for this initial algorithm assessment, we define these emissions ratios as being identical in the flaming phase to those used in Canada's operational wildfire smoke forecasting system, FireWork (Chen et al., 2019). Smouldering emissions factors used in this framework are taken as the arithmetic mean of smouldering and residual combustion phases from FireWork. Emissions ratios are provided in Table 2.
Table 2Emissions factors for flaming and smouldering used in this model, which are derived from Canada's operational air quality model (Chen et al., 2019). Values are the molar fraction of carbon in the unburned biomass and the emitted species, e.g. 87 % of C in biomass is converted to C as carbon dioxide in flaming combustion. NMOG = non-methane organic gases.
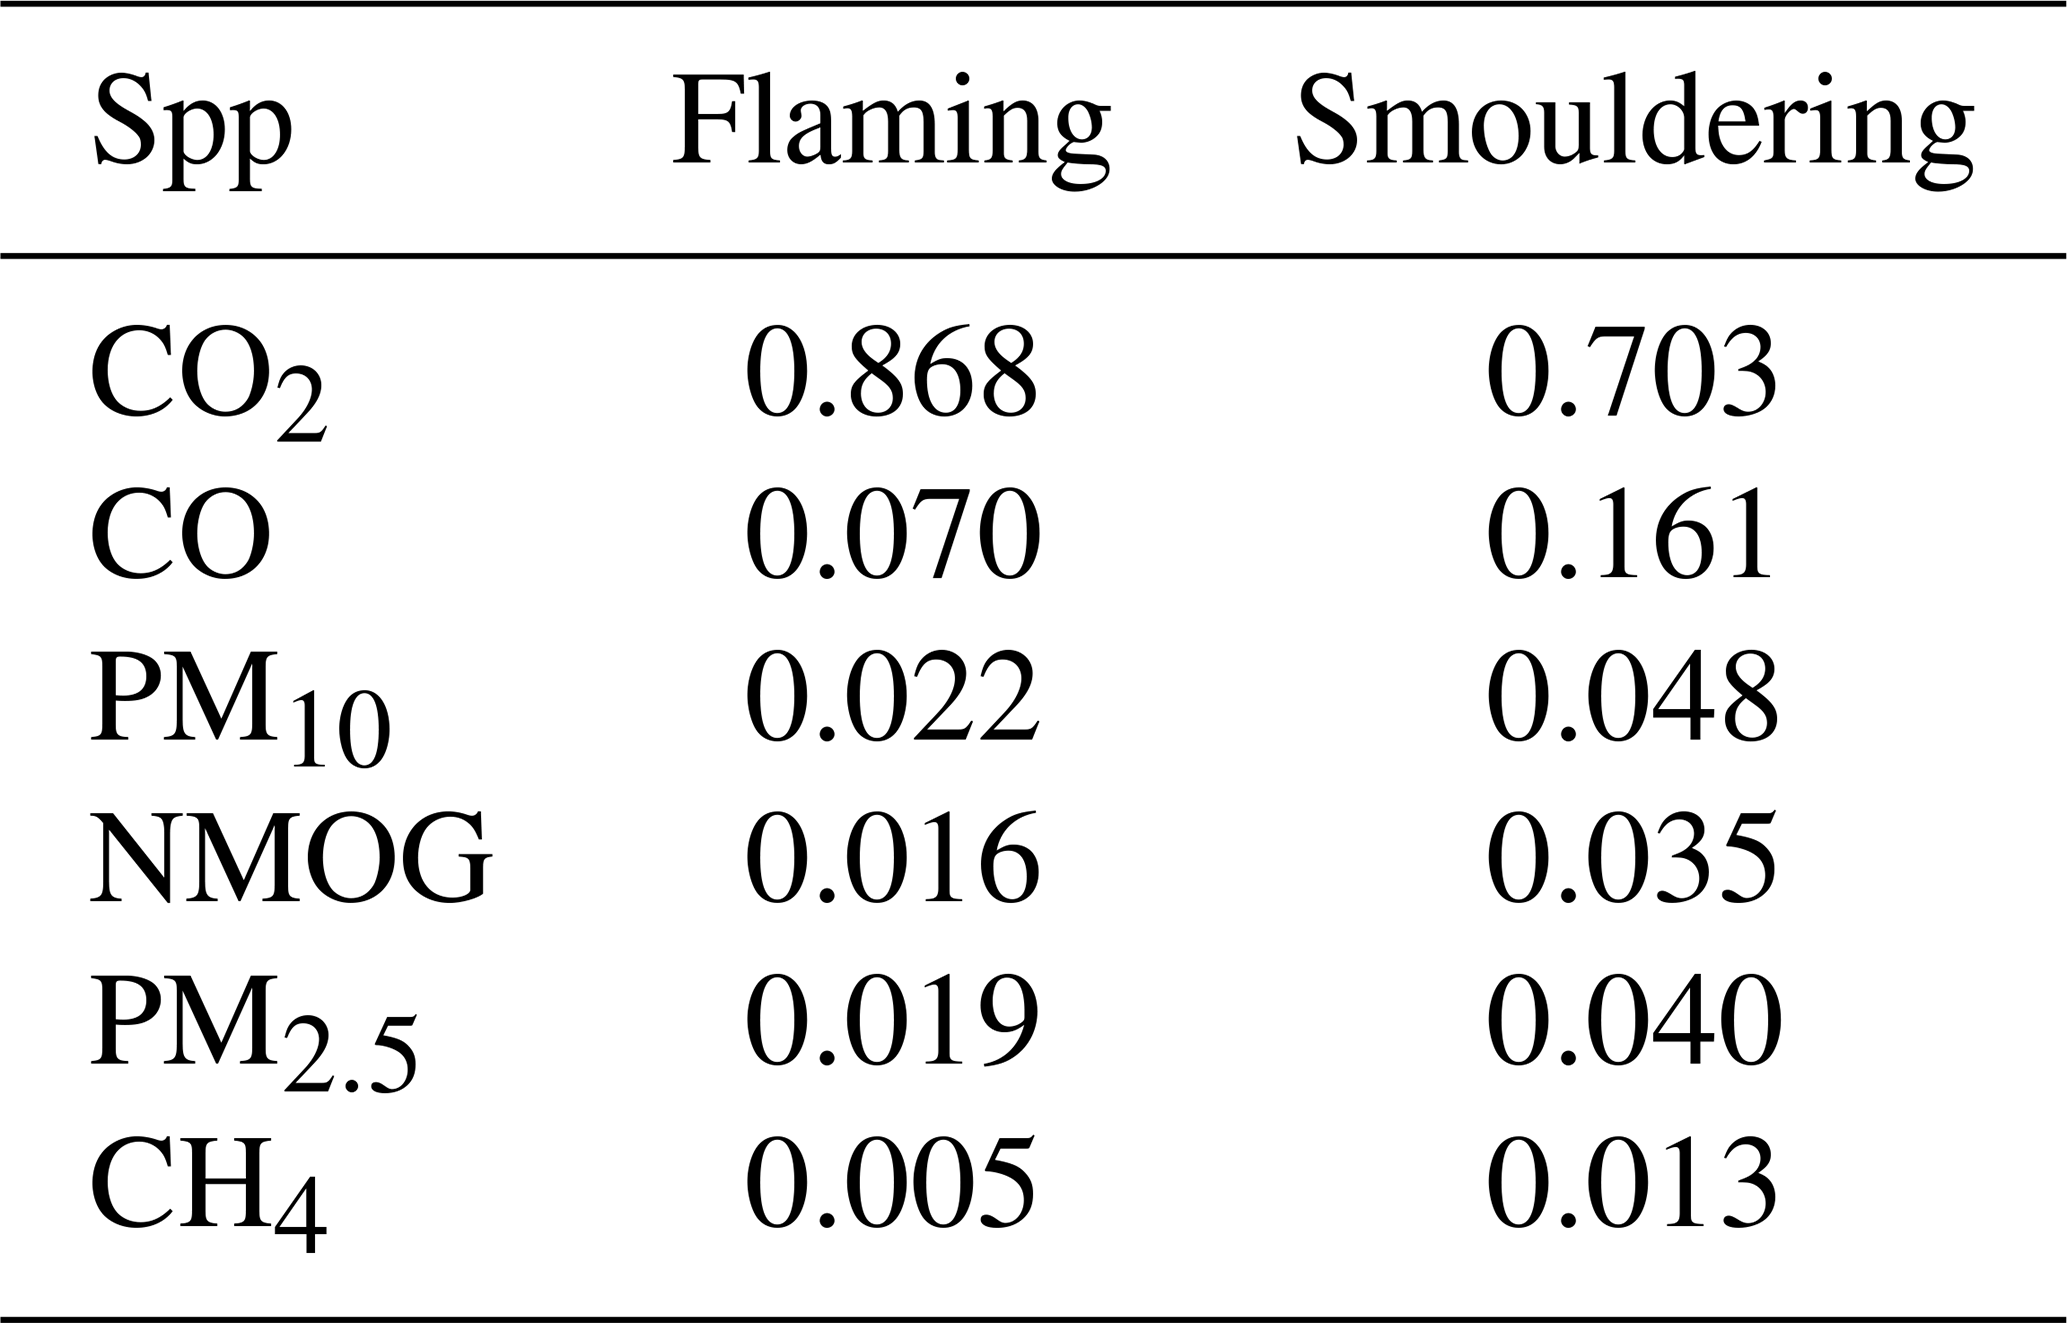
CO2 is responsible for 86.8 % of emissions in the flaming phase, but only 70.3 % of emissions in the smouldering phase, with a doubling of CO emissions and tripling of CH4 emissions (Table 2). With a Global Warming Potential of CO equal to 1.0 and CH4 of 28, the Global Warming Potential per unit of biomass consumption in the smouldering phase is 1.08 times higher in global warming potential compared to flaming, not including differential aerosol production and injection heights, however. With flaming and smouldering each contributing roughly equally to wildfire emissions, these distinct flaming and smouldering emissions ratios correspond well to prior emissions factors used in CBM-CFS3. Note that as currently described, the sum of CO2, CH4, and CO emissions from wildfires only represent approximately 95 % of the fire carbon mass emitted to the atmosphere, with 0.5 %–2.0 % of biomass emitted as particulate matter (e.g. PM2.5, but also PM1 and PM10 classes of particulates at 1 and 10 µm diameters, respectively), and an additional 3 % (Hayden et al., 2022) to as little as 1 % (Simon et al., 2010) composed of non-methane organic gases that have a large range in global warming potentials as compared to CH4.
2.1.5 Ground plot and remotely sensed fire severity data
Remotely sensed fire severity metrics (i.e. dNBR and related indices) are capable of determining if a specific location falls within a low, moderate, or high severity fire area (Hall et al., 2008) by utilizing the change in the red and shortwave infrared band ratios after a fire (Key and Benson, 2006). These remotely sensed fire severity classes can not alone inform estimates of fuel consumption down to specific biomass pools. Instead, this approach uses the change in biomass pools as measured at ground plots at varying satellite burn severity classes, using detailed and semi-standardized methods of burn severity ground plots with unburned controls (e.g. Cocke et al., 2005; Hall et al., 2008). Burn severity ground plot measurements are often aggregated into a single “Composite Burn Index” (CBI) with a weighting scheme originating in southwestern US forests (Key and Benson, 2006; Parks et al., 2019), which are classed into low, moderate, and high severity categories. Plot level measurements of individual forest biomass pools (e.g. conifer overstory mortality or canopy consumption) are recorded as part of the CBI methodology.
Individual burn severity plots were assigned a severity class based on ground observations, and an ecozone-level median biomass pool consumption fraction was computed for each severity class for each biomass pool. Field measurements of fire effects on individual ecosystem components (e.g. tree mortality, crown consumption, unburned surface litter area, etc.) taken as part of CBI plot measurements were aggregated to the plot-level severity class as determined by CBI. For instance, plot level data on tree mortality percentage was available across numerous plots within Canada's Boreal Plains ecozone; median values of tree mortality per severity class (low, moderate, high) were computed based the plot overall severity score as determined by CBI in order to compute ecozone-specific values. Field studies with data describing biomass consumption fractions for individual biomass pools were available from the northwestern boreal forest of Canada (French et al., 2020; Whitman et al., 2018). Smaller datasets with eastern Canadian and Alaska data were also available (Parks et al., 2019), as were data from the northwestern conterminous United States in ecozones that overlap with Canadian forests (Saberi et al., 2022). Detailed mortality and surface consumption data were not available for the Atlantic Maritime and Mixedwood Plains ecozones, so an estimate was made by subsetting data from Saberi et al. (2022) to a moderate basal area range (25–50 m2 ha−1) mature eastern mixedwood and conifer-dominated stands. For the Boreal Cordillera ecozone, data were similarly subset to only sites with stand heights < 15 m. Field data for large diameter mature hardwood trees was only available from Whitman et al. (2018) (primarily aspen, Populus tremuloides), and are used in all other ecozones without modification.
For ecozones without ground plot measurements, an adjacent and ecologically similar ecozone with observations was used. As such, Boreal Plains observations were used in the Prairies, Boreal Shield, and Hudson Plains Ecozones. Similarly, Taiga Shield West observations were used in the Taiga Shield East. The field survey data on biomass combustion and mortality rates as stratified by severity class, forms an improved data-driven and ecologically-informed approach to direct C emissions estimations from fire termed FireDMs (Fire Disturbance Matrix-severity).
2.2 Biomass consumption specifics
2.2.1 Overstory tree mortality and consumption
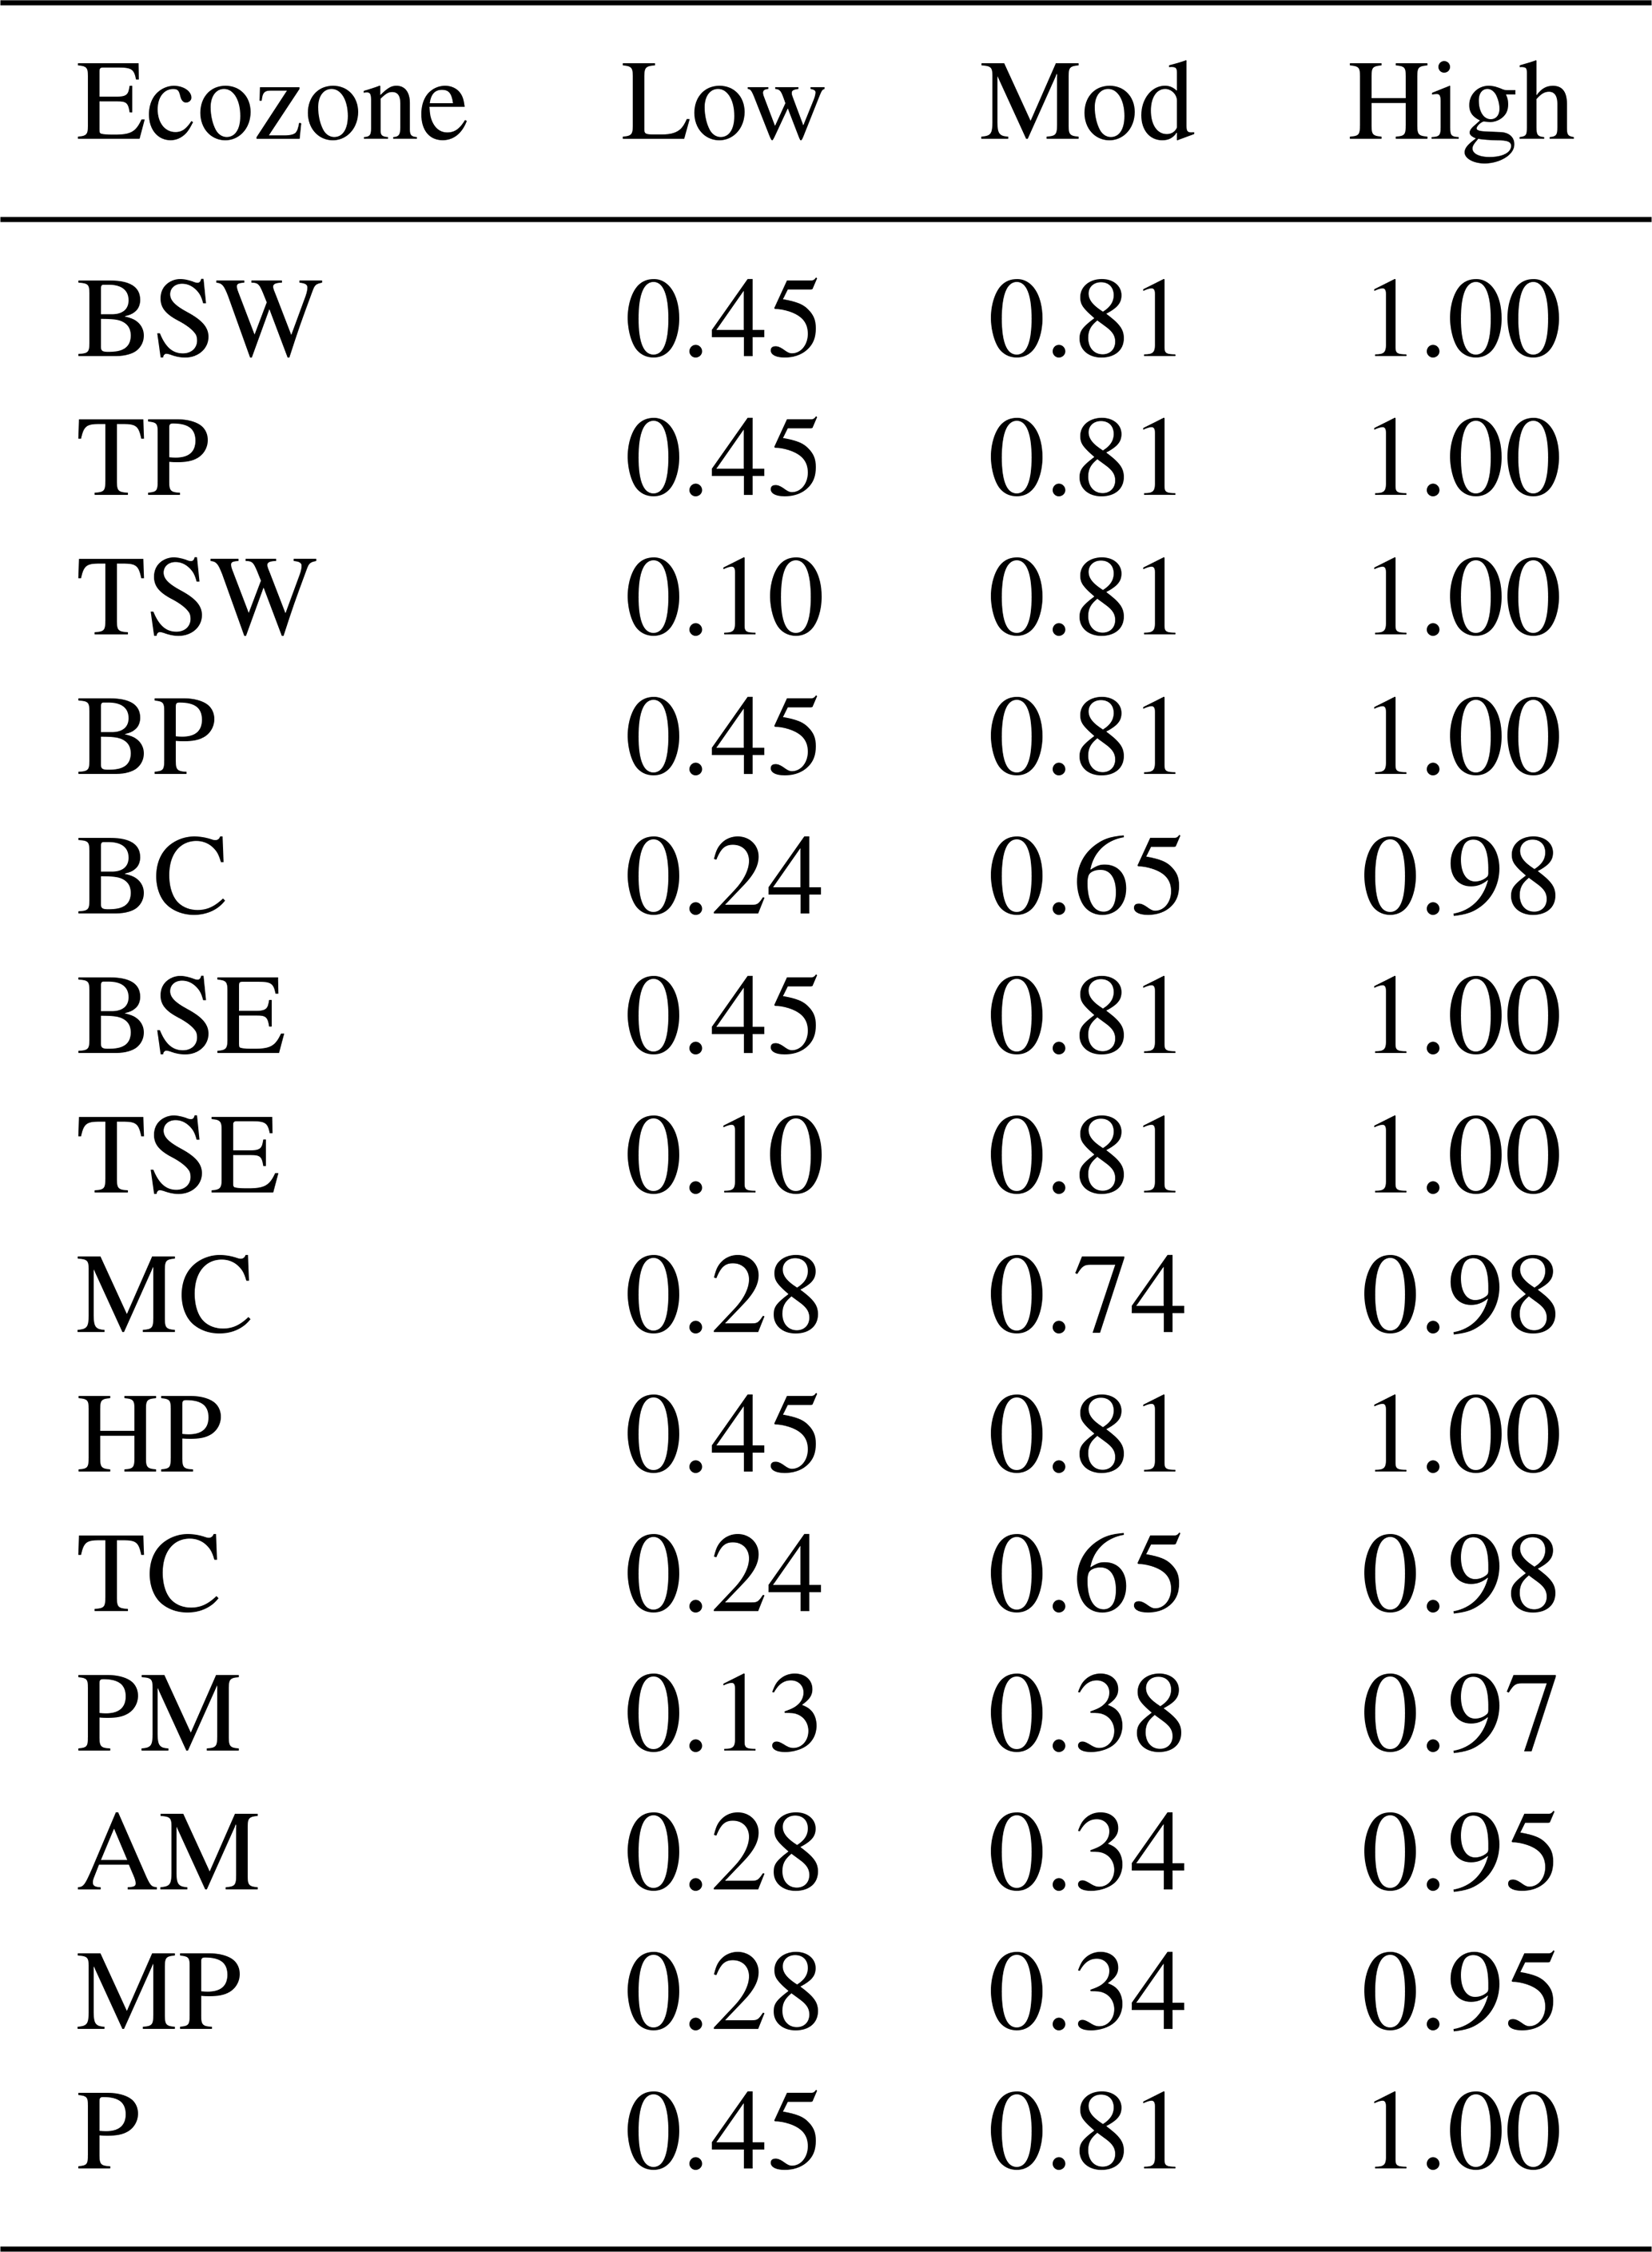
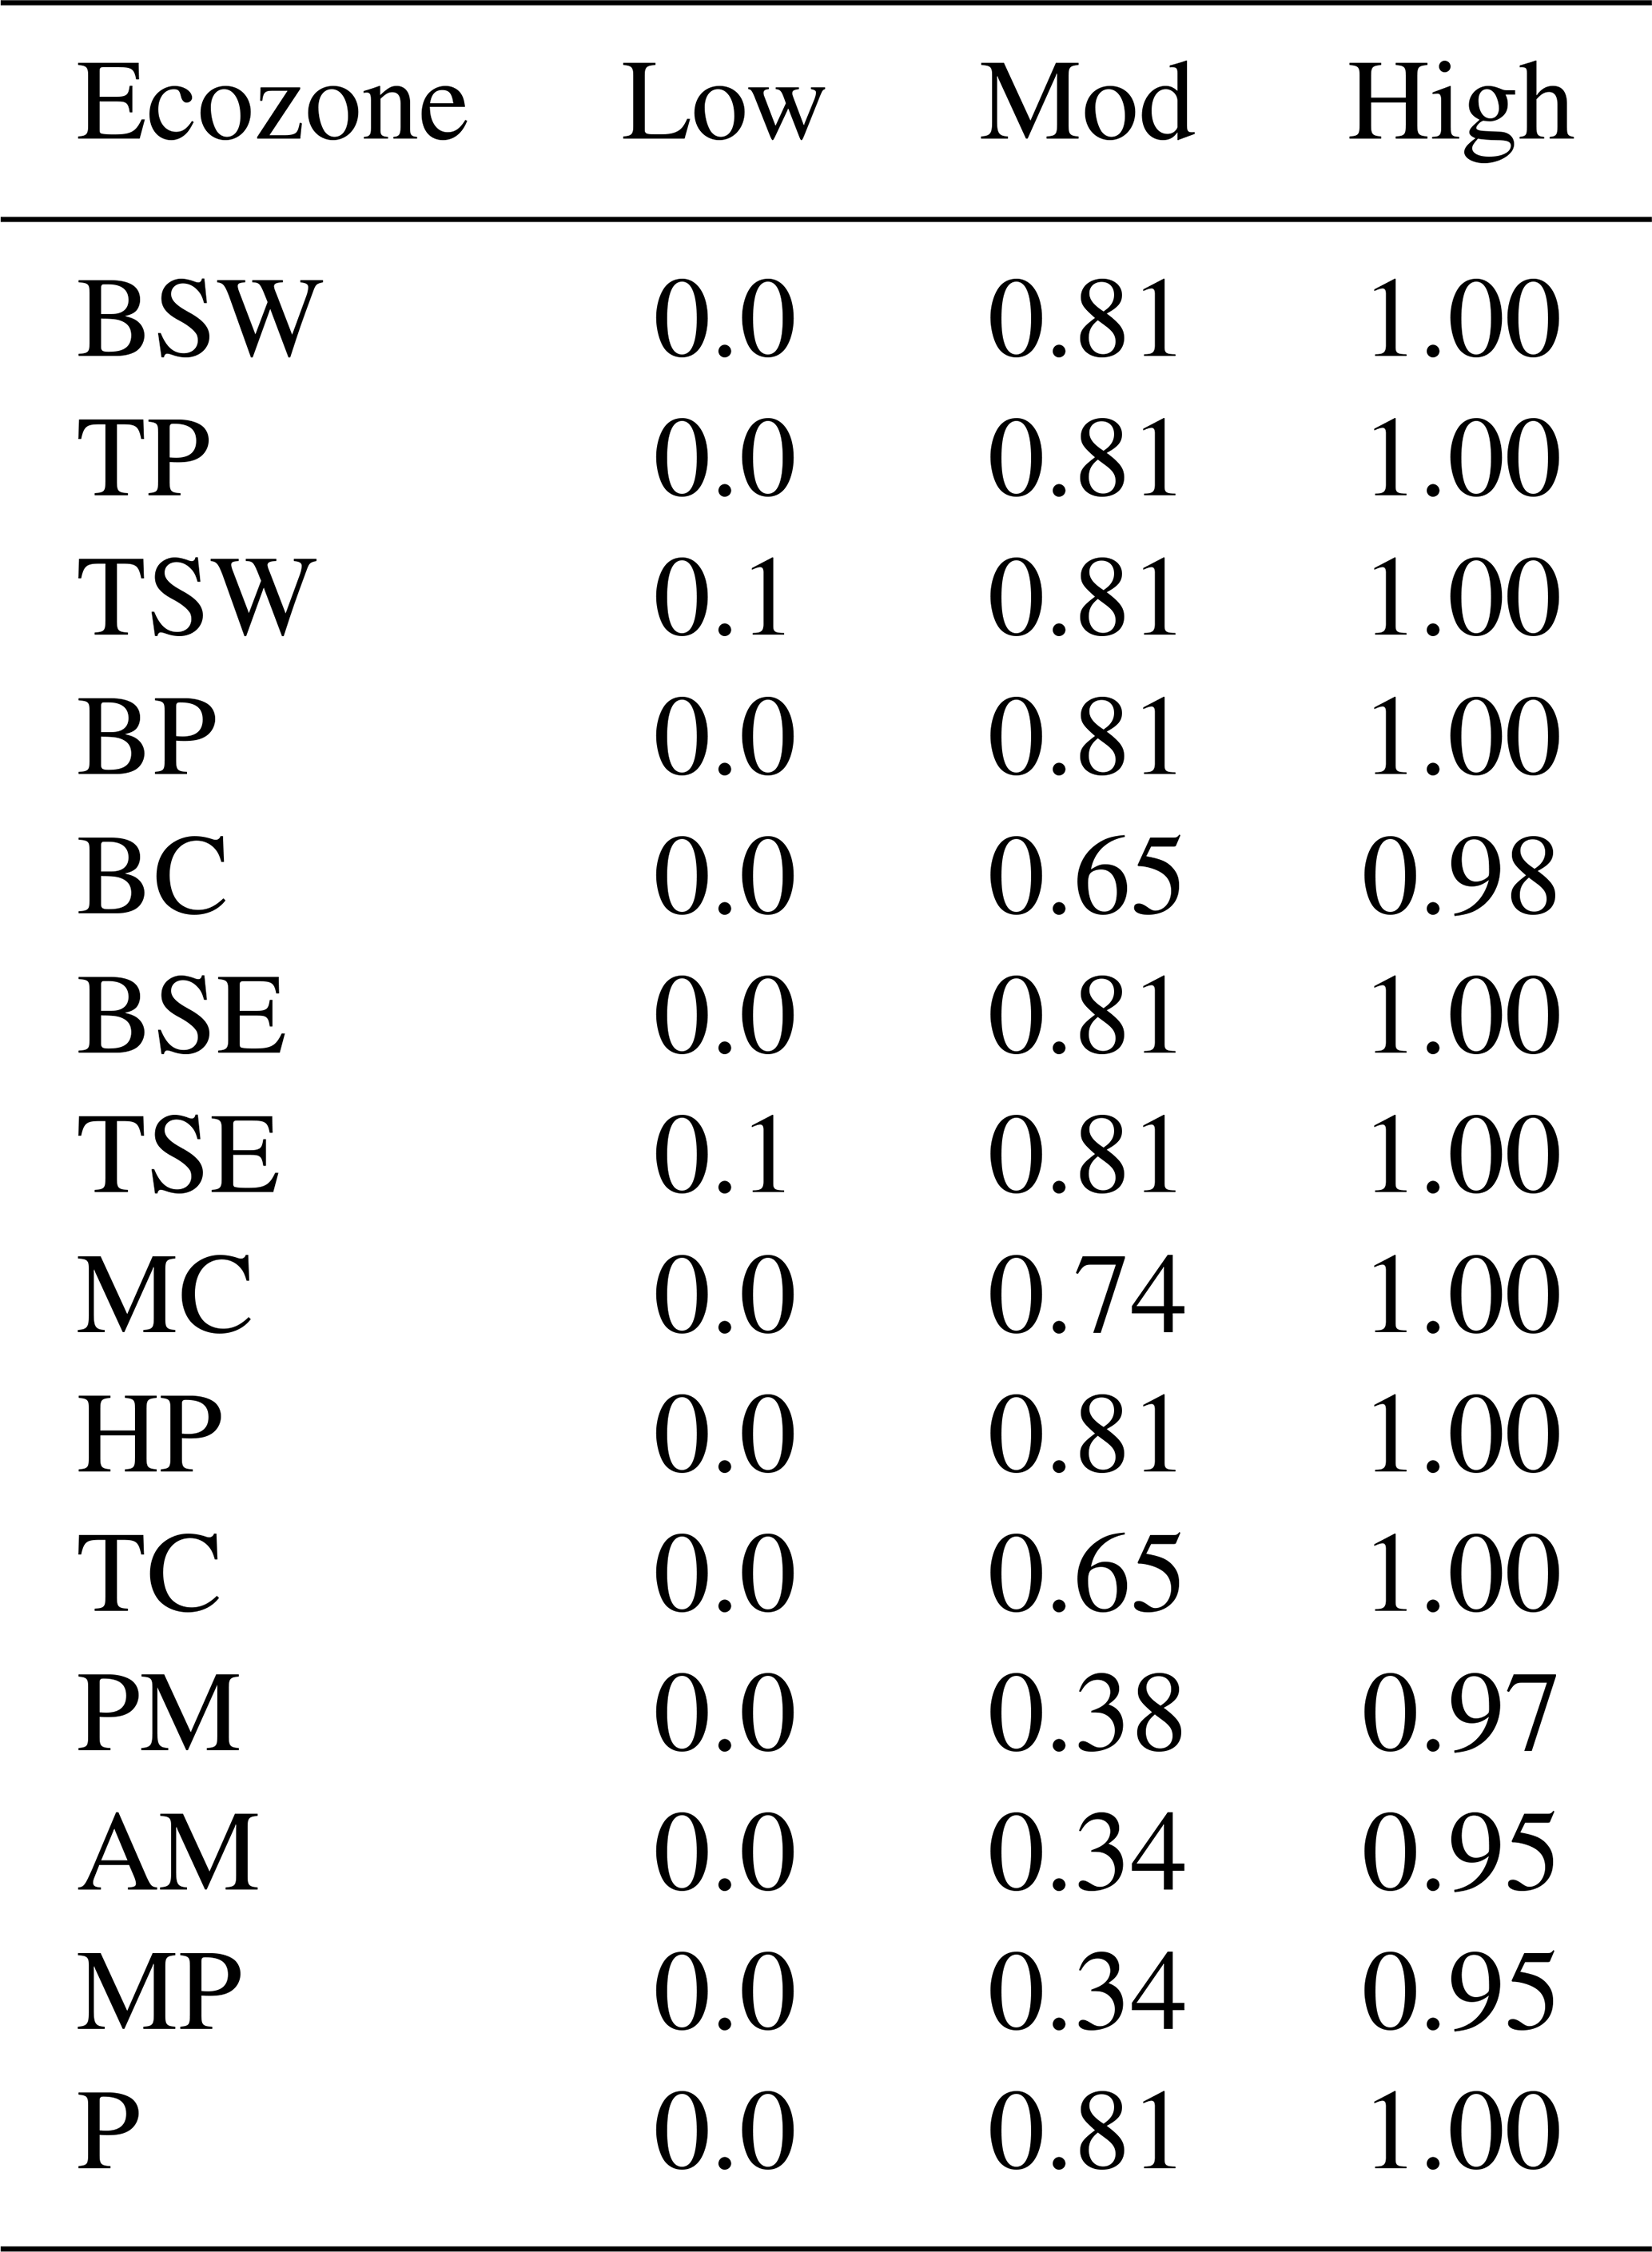
Numerous process-driven (Michaletz and Johnson, 2006) or empirical (Hood and Lutes, 2017) tree mortality models are available that show significant skill in predicting tree mortality based on fire behaviour (i.e. flame length, rate of spread). Since the driving data in this model is the mapped fire severity over the landscape scale, fire behaviour metrics such as flame length or scorching height of bark are not available as a continuous mapped product. Instead, softwood and hardwood overstory mortality is calculated per ecozone as a function of satellite-observed fire severity using the aggregated ground plot data (Table 3).
Table 3Softwood fractional mortality by ecozone, as derived from median values from field studies in BP, TSW, MC, and PM ecozones. See Sect. 2.1.5 for details.
And since large-diameter, live trees killed by fire do not experience significant live stemwood consumption (Talucci et al., 2025), the entirety of the live stemwood biomass pool that is killed is transferred to the snag pool. Note that the field data and disturbance modelling undertaken here only accounts for tree mortality within the calendar year of the fire, and delayed mortality of over one year has been documented in boreal low and moderate severity fires (Angers et al., 2011) where less than half of total mortality occurs after the year of the fire. Thus, the modelling here does not account for delayed mortality that may extend upwards of 5 years after fire.
Crown Fraction Burned (CFB) speaks to the fraction of the live canopy that is itself consumed in the flaming front. The alternate outcomes being survival of the foliage, or the mortality of the tree without canopy consumption, resulting in the dropping of foliage onto the forest floor. From the definitions stated earlier, the CFB must be lower than or equal to the mortality rate. Using field studies that show any partial crown consumption is likely sufficient to result in high rates if not complete mortality (Hood and Lutes, 2017), which is the case in Canadian trees, which are primarily species with thin bark. Due to the structure of CBM-CFS3, all high severity fires h 1.0, which is no more than a 5 % variance from observed values. Ecozone-specific CFB values from field studies of burn severity are summarized in Table 4.
Table 4Softwood crown fraction burned by ecozone, as derived from median values from field studies in each ecozone.
The consumption of live bark biomass is calculated in FireDMs, and consumption rates can be defined by severity class. At the moment, lacking robust field data on bark biomass consumption rates across ecozones and severity classes (which are a small portion of the overall biomass), the bark proportional consumption rate is set to 34 % of the overstory mortality rate (Santín et al., 2015).
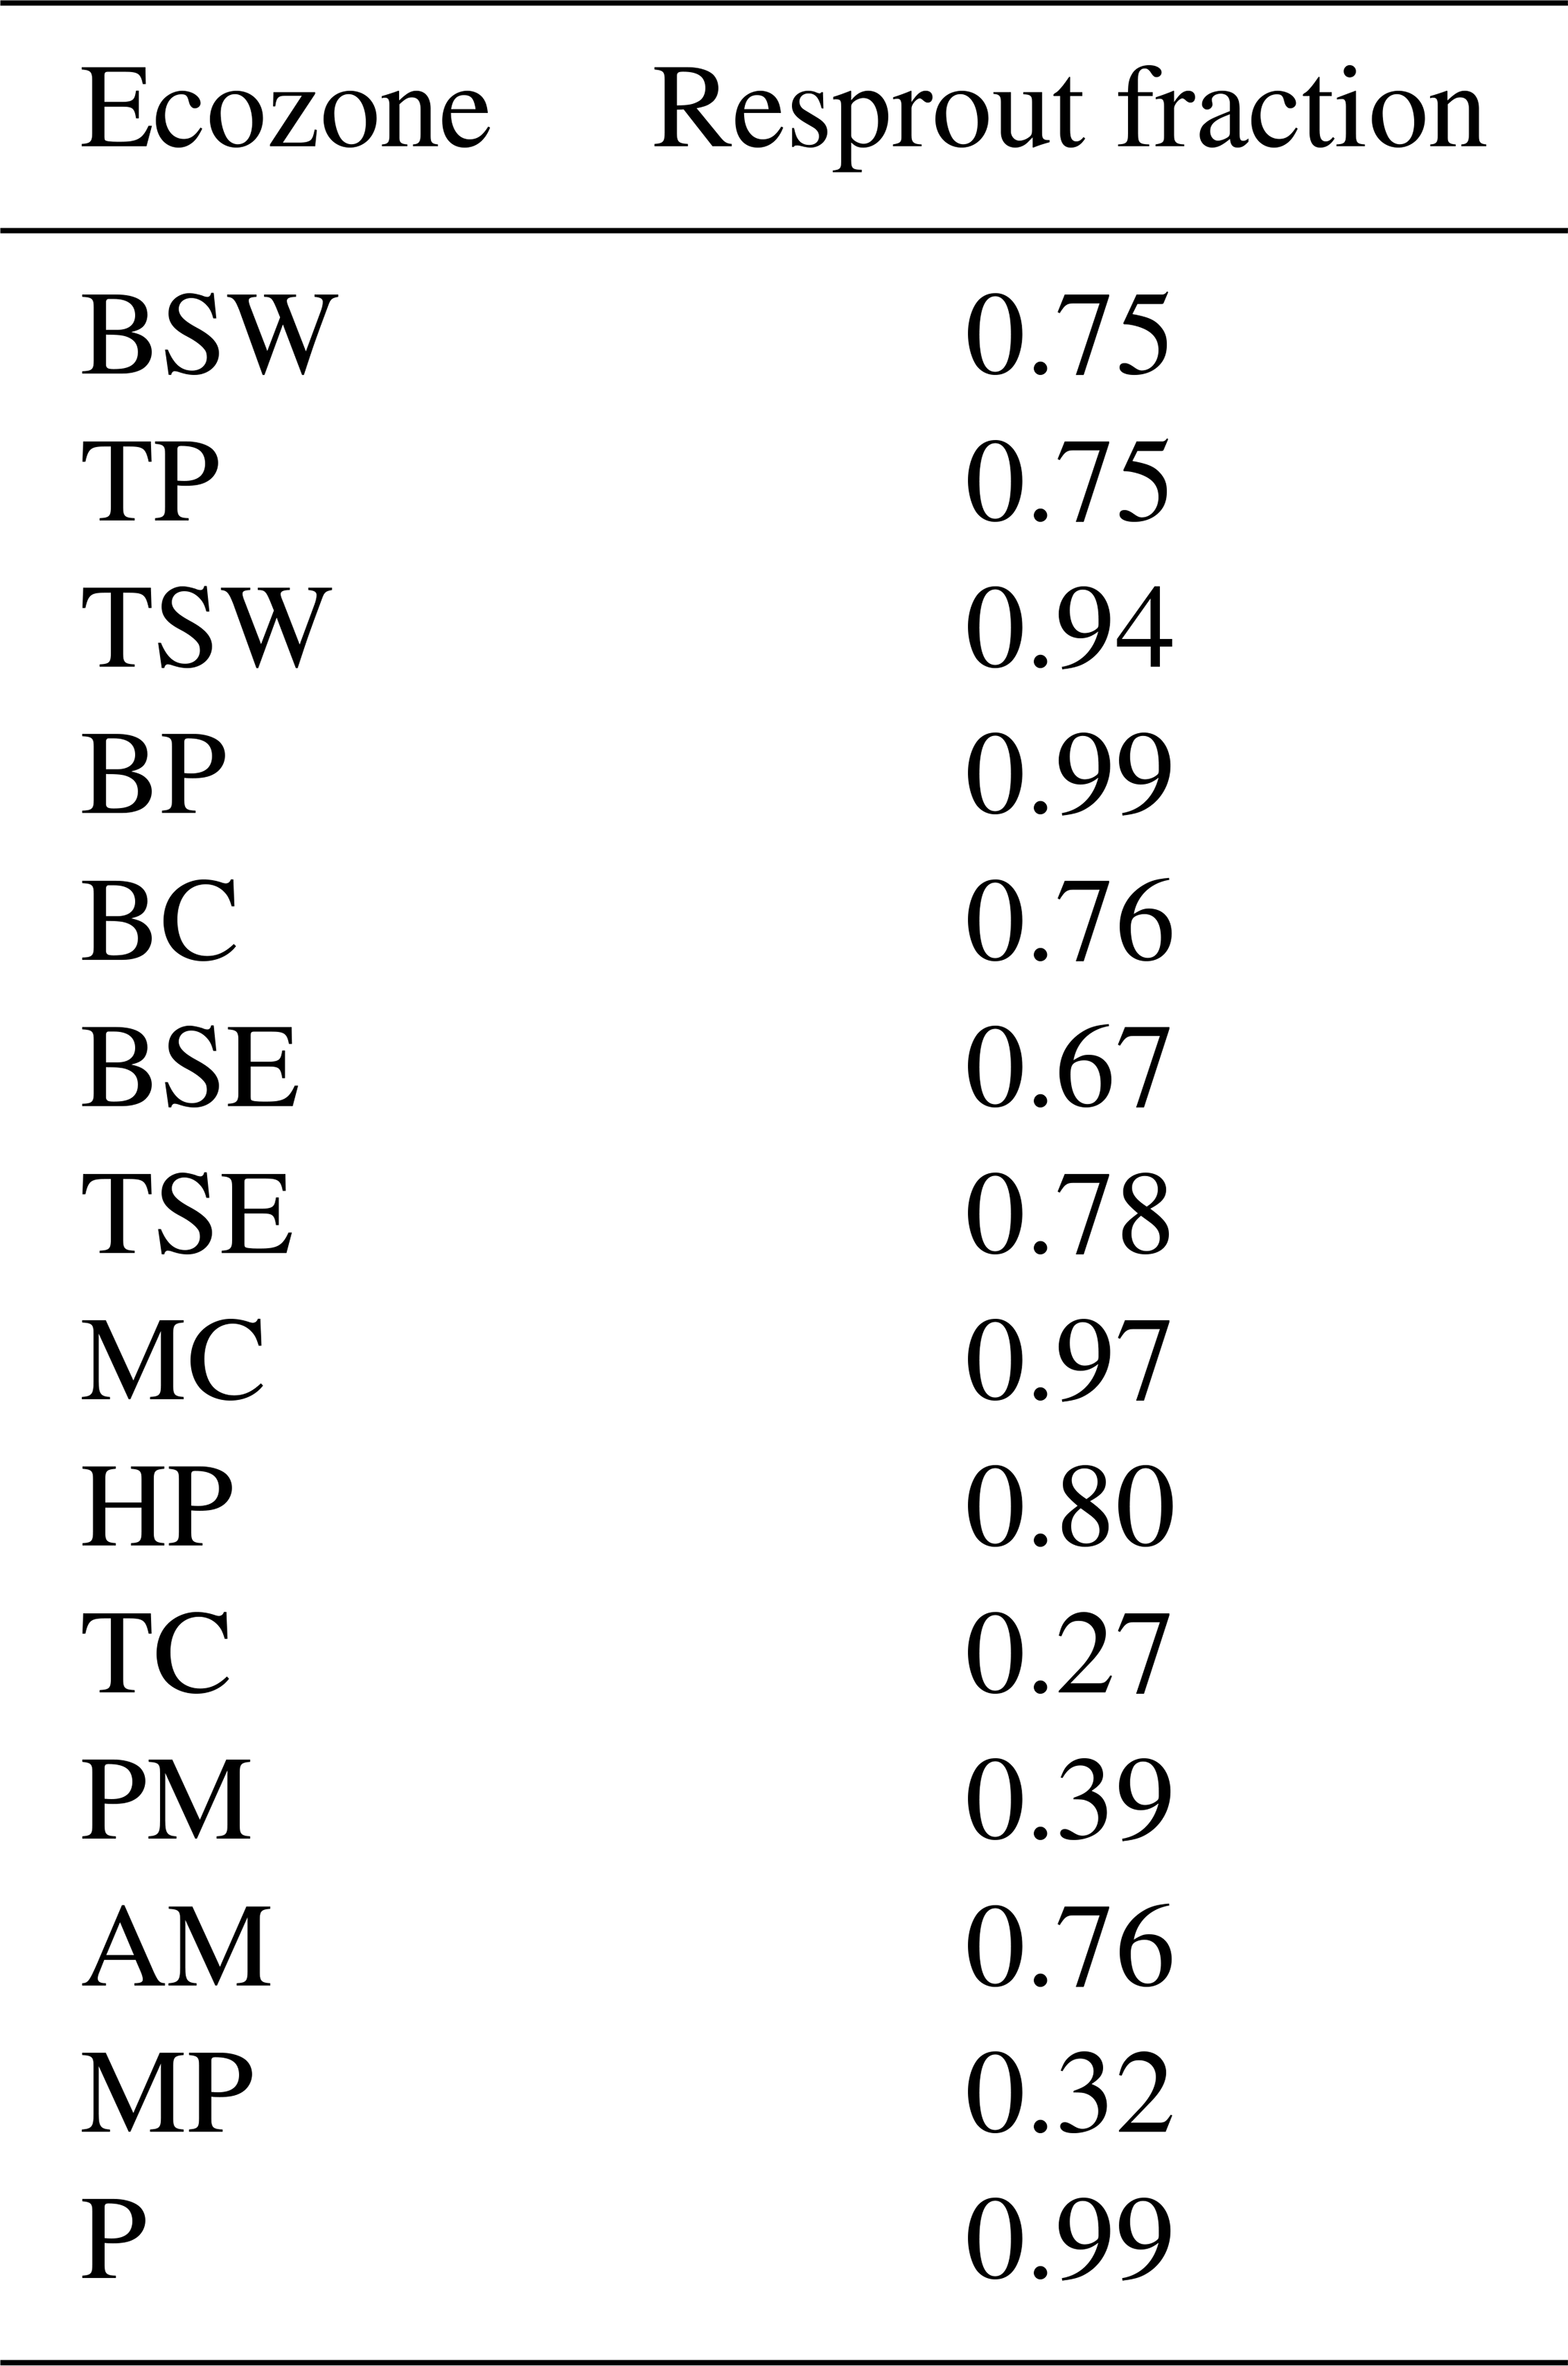
A major distinction is made between softwood and hardwood trees, where in Canada's boreal forests, a large fraction of hardwood trees (see Appendix B) are able to resprout even when the main stem has been killed by an intense forest fire (Brown and DeByle, 1987). Accordingly, the root mortality rates differ greatly between softwoods and hardwoods, with softwood root mortality equal precisely to stem mortality, while in resprouting hardwoods, little root mortality is observed even after intense fire (Pérez-Izquierdo et al., 2019). Though spatially explicit versions of CBM-CFS3 can resolve a species list down to the pixel level, currently an ecozone-level regional average composition of hardwood species with resprouting traits (“ReSproutFactor”) is used and is shown in Table 5.
Table 5Ecozone-level average fraction of hardwood overstory species that do not suffer extensive belowground biomass mortality after fire.
The fraction of fine roots contained within the combustible forest floor layers (the variable “Prop.Fine.Root.duff” in the model ) can be a close to or exceeding 50 % of the fine root biomass (Strong and La Roi, 1985); this fine root live biomass is assumed to burn alongside the organic soils, (Benscoter et al., 2011). Fine root allocation is between the organic soil (termed “aboveground” or AG in CBM-CFS3 vs. “belowground” or BG for mineral soils) is a parameter that can be ecozone level and is distinct for hardwoods (HW) vs. softwoods (SW). As a result, the calculation for softwood fine root consumption and stemwood mortality rate (HW.Mort, as observed from field plots) are as follows, using hardwood as an example:
In contrast, the larger diameter of the coarse root biomass pool prevents its consumption during any smouldering of the duff layer, and the mortality rate of coarse roots is simply proportional to that of the stemwood overall.
2.2.2 Understory tree mortality and consumption
Understory (or small diameter overstory) tree mortality is defined separately in the model in the “submerchantable” pool, but given the lack of data on diameter classes in the severity data, robust field data on differing mortality rates of smaller diameter trees is not available, and so the understory tree mortality rate is set equal to the overstory rate as defined in Table 3 above. Note that smaller trees with a top height less than 1.4 m are not considered in this pool, and instead are lumped into the “other” pool.
2.2.3 Litter layer area-wise consumption by severity class
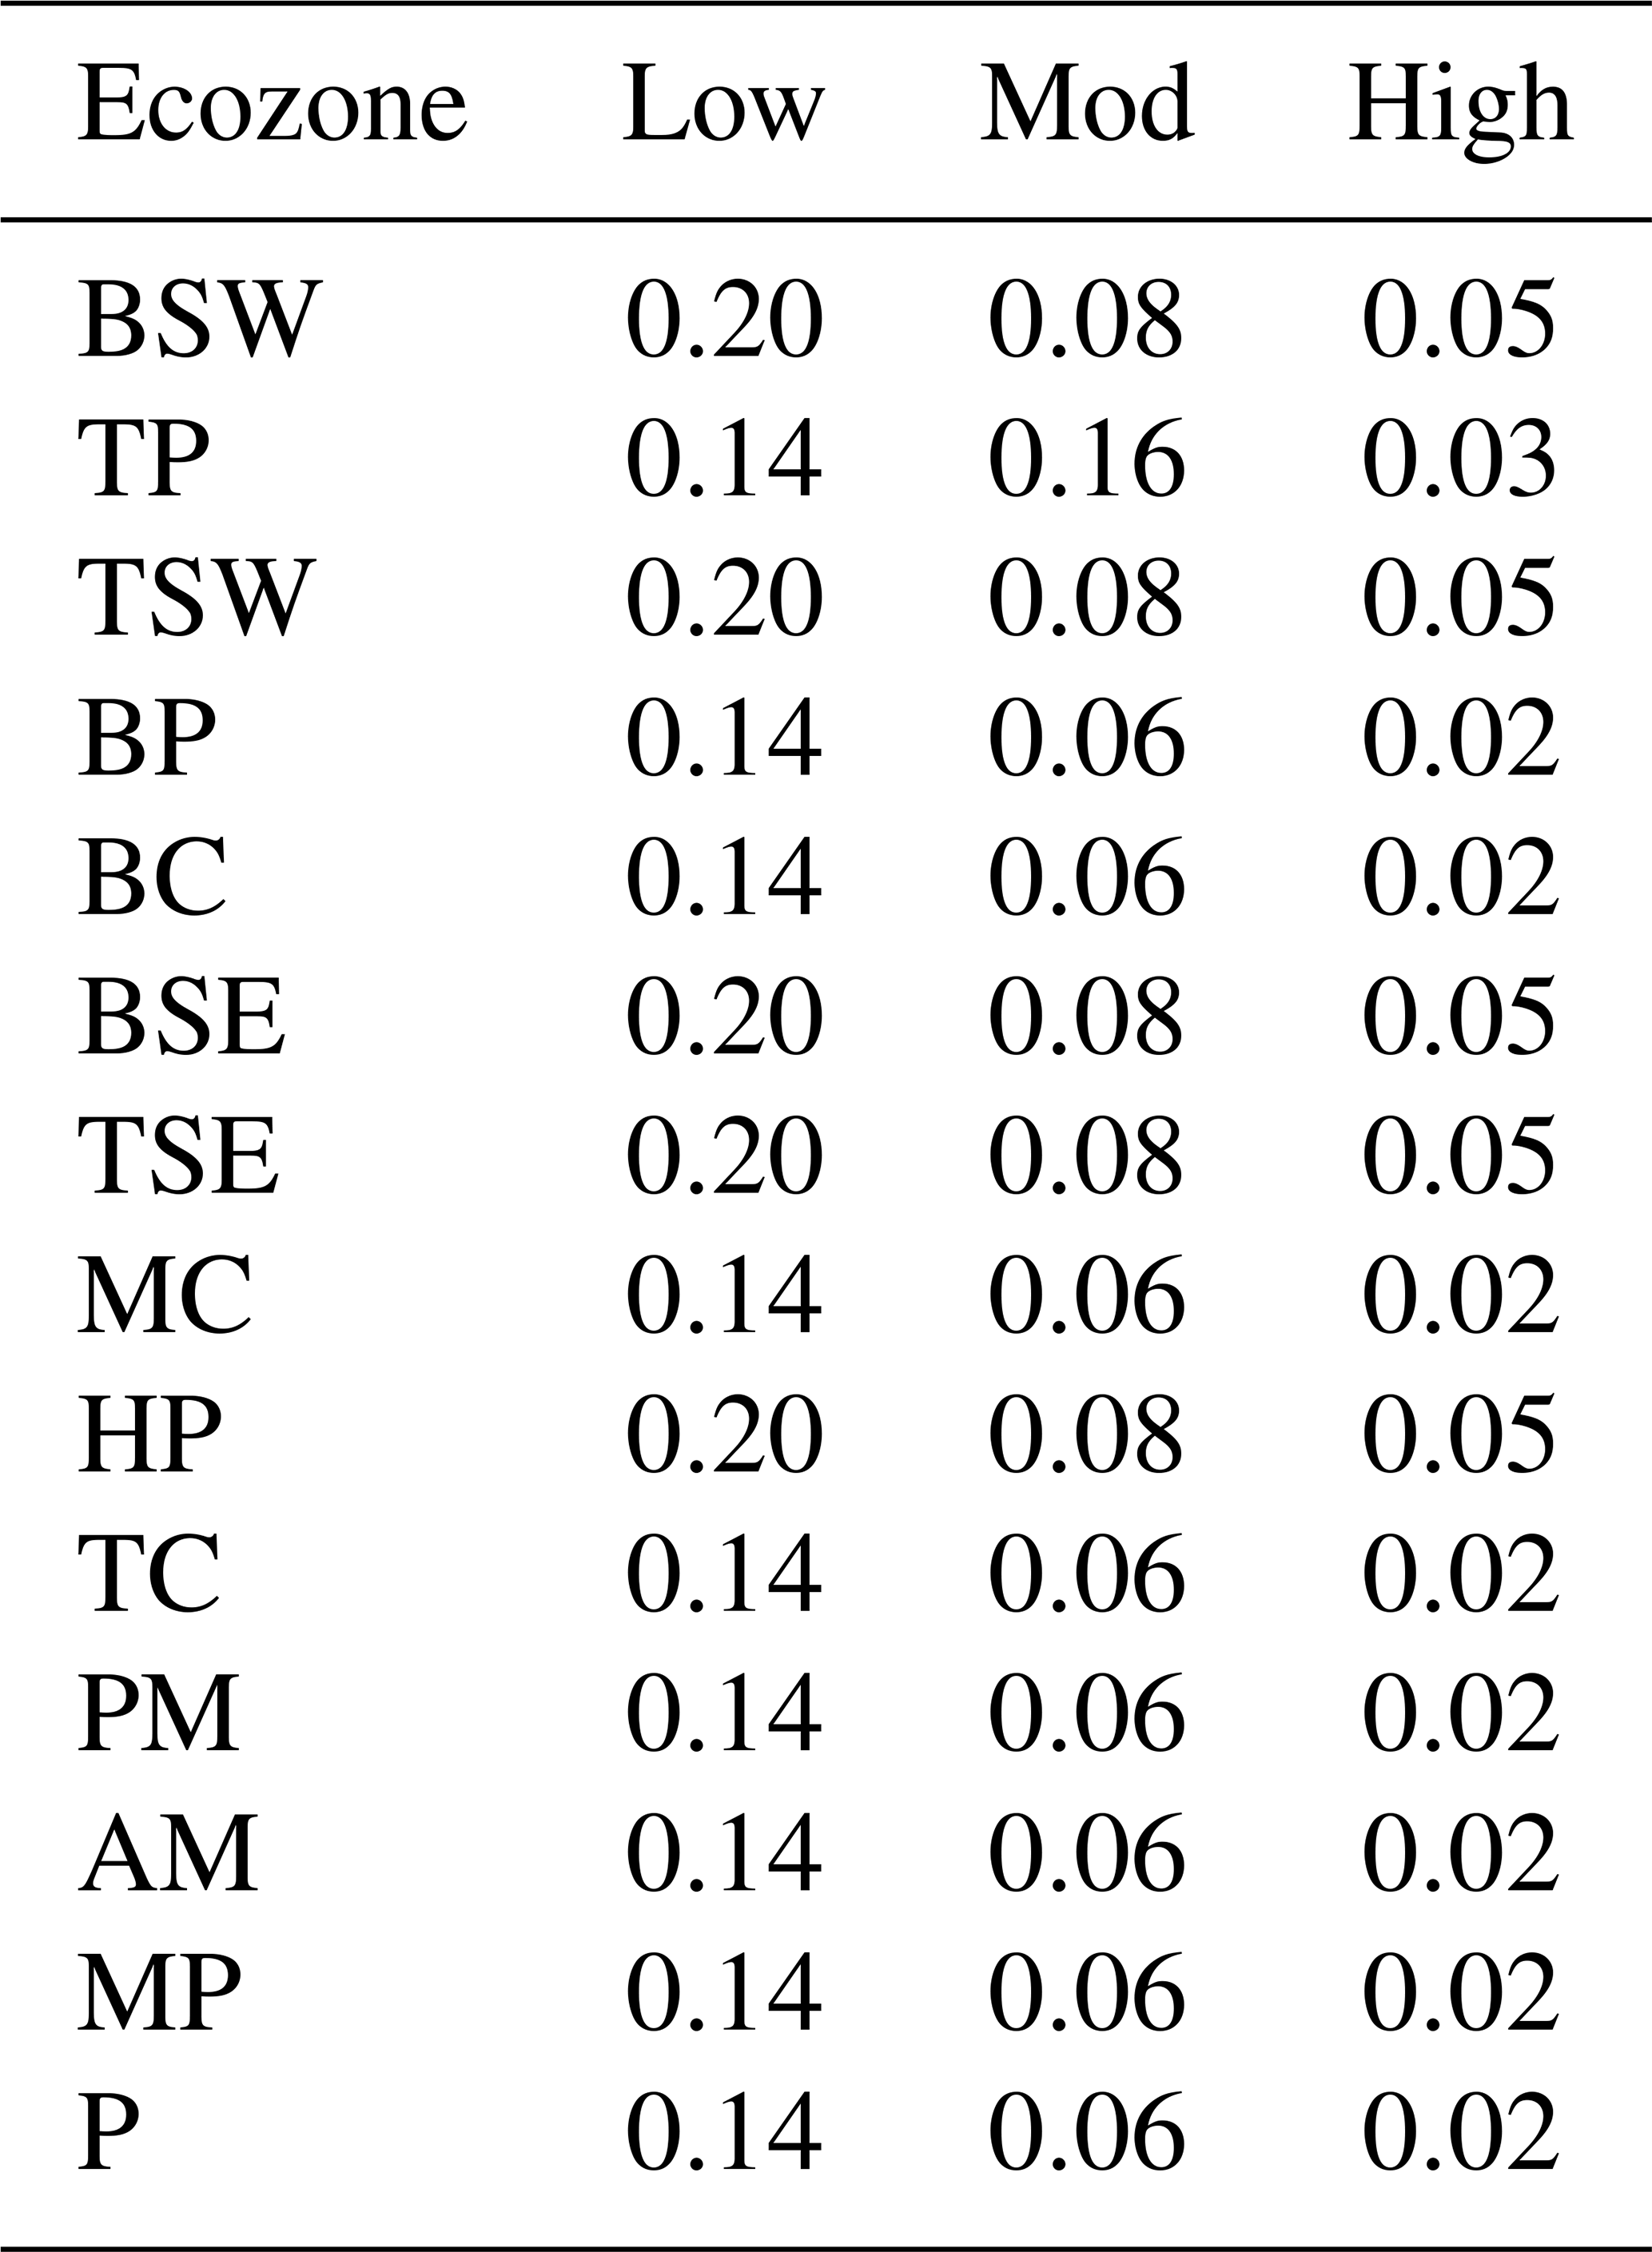
The litter layer forms the first biomass pool in which a spreading fire consumes fuel. In low-severity fires, the litter layer is consumed, but underlying duff material and live trees largely remain intact (Hessburg et al., 2019). In these low-severity patches, some areas of fully unburned forest floor are present, and are summarized from CBI plot data by severity class and ecozone in Table 6. Logically, since litter consumption is largely required for the ignition of the underlying duff layer, this unburned litter areas informs and constrains duff consumption.
Table 6Unburned litter area by ecozone and severity class. The majority of the data comes from studies in the Boreal Plains and Boreal Shield West, and so values are extrapolated from those two well-observed ecozones to all others. Ecozones are sorted in order from highest to lowest average annual burned area.
2.2.4 Snag and stump consumption
Dead standing trees and branches on average is a biomass pool smaller in size compared to organic soils in much of Canada's forest, but in areas of extensive insect-killed trees, recent fires, and blowdown, can be a substantial biomass pool. Compared to live stemwood of the same diameter, the low moisture content of snags and snag branches allows for much greater consumption during the passage of an intense flaming front (Stocks et al., 2004). The snag branch pool experiences almost complete combustion in high severity fires (Talucci and Krawchuk, 2019), and is highly correlated with CFB (de Groot et al., 2022). The largest dead wood pool is the standing dead stemwood pool, which remains at most approximately 50 % consumed; the consumption of standing snags pool is not quantified precisely in the severity plot data available. In the absence of extensive field data, snag consumption is estimated as:
And for snag branches, field observations (Talucci and Krawchuk, 2019; de Groot et al., 2022) reliably point to a higher rate of consumption for this smaller diameter dead biomass pool:
Stumps are tracked as part of the “Other” pool in CBM-CFS3. As they are typically in contact with the upper forest floor, they are assumed to be consumed at the same rate as coarse woody debris.
2.2.5 Woody debris consumption
Limited data is available on the fraction of woody debris consumption alongside fire severity measurements from wildfires. Coarse woody debris of overstory stems that makes up 60 %–80 % of woody debris biomass in Canada's boreal and temperate forests (Hanes et al., 2021), with its moisture and consumption patterns largely following the moisture regime of the Drought Code (McAlpine, 1995). In this modelling framework, the proportion of coarse (>7.5 cm diameter) and medium (>0.5 and <7.5 cm) woody debris consumption is estimated based on detailed measurements of consumption from experimental fires. Coarse woody debris (CWD) is responsible for approximately 50 %–75 % of the total woody debris load in most ecozones, and approximately 60 % of the total woody debris consumption. Ecozone-level CWD consumption rates are summarized in Table 7.
Table 7Coarse Woody debris consumption rates from pre/post measurements in experimental fires.
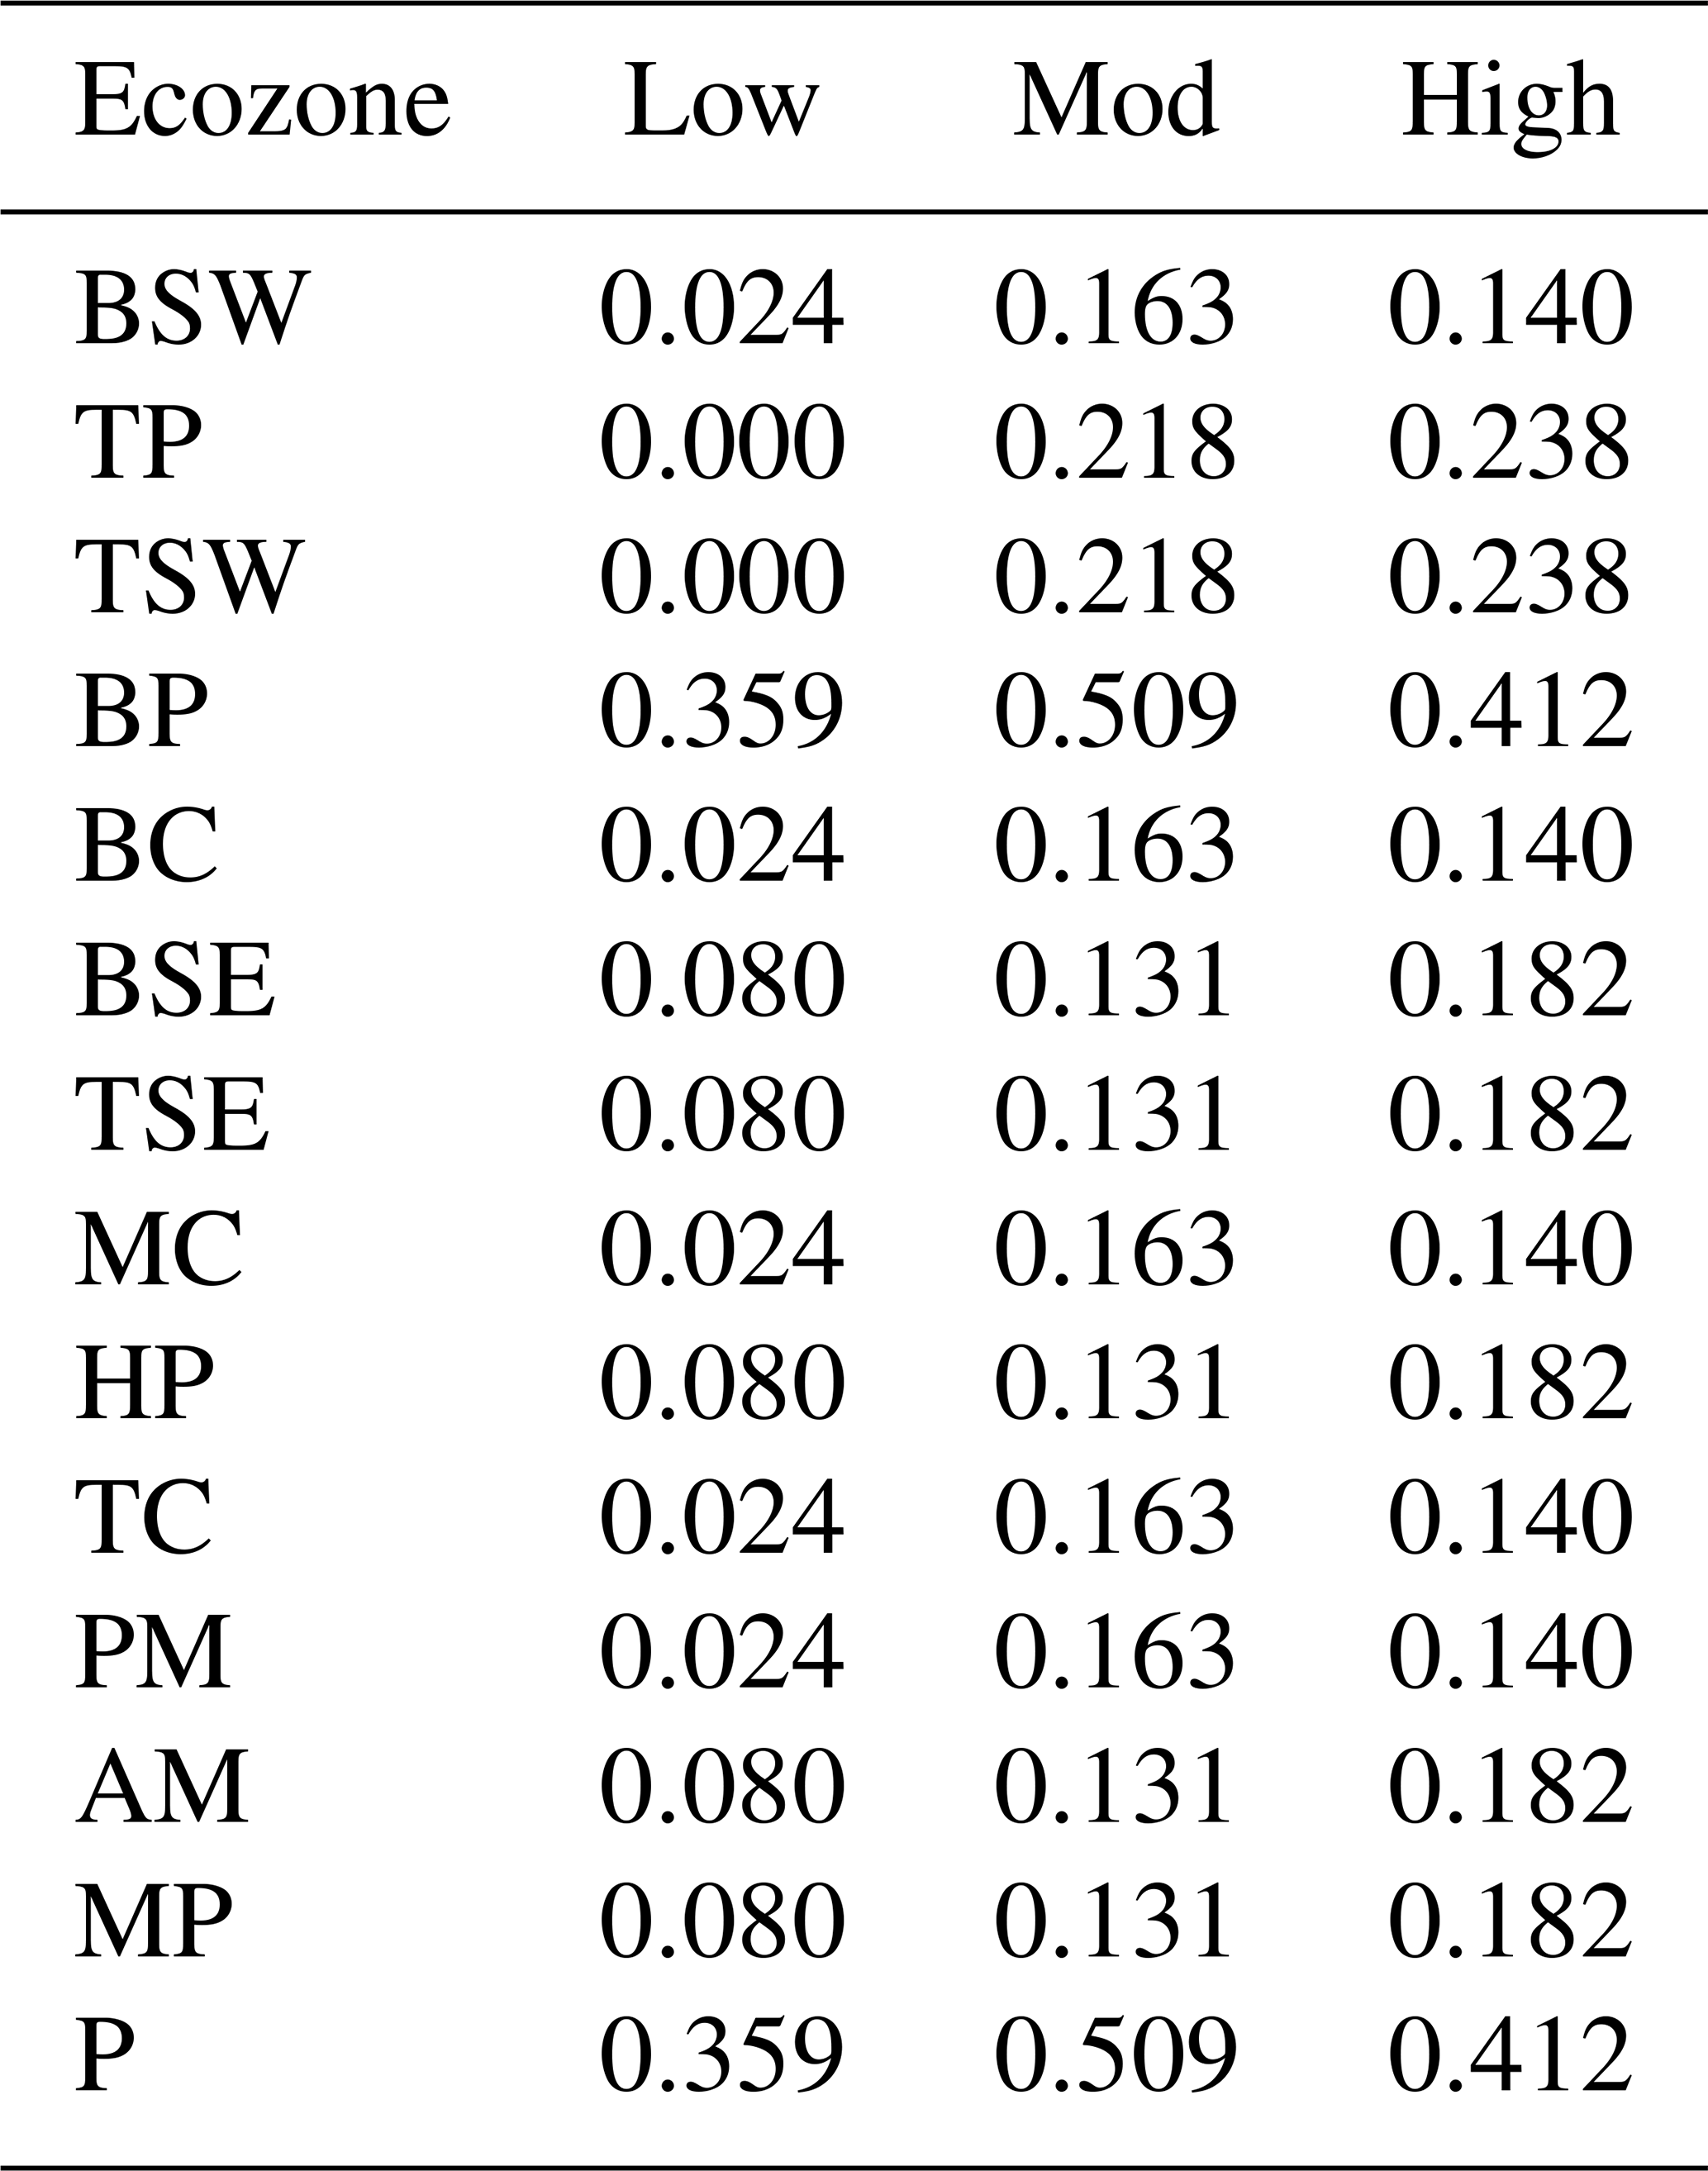
Note that where historical burn severity data from experimental fires is not available, the fire recorded fire classification types of surface, intermittent crowning, and active crown fire are used instead as proxies for low, moderate, and high severity fire, respectively. Fine woody debris < 0.5 cm in diameter is consumed at the exact same rate as the litter pool (see section above).
2.2.6 Forest floor consumption
Unlike canopy consumption metrics that are reliably estimated via burn severity remote sensing, the depth and magnitude of consumption in the forest floor is only weakly related to burn severity metrics, since increasing burn depth in organic soils typically yields little spectral response in remote sensing imagery (French et al., 2020). Furthermore, there is at times a temporal disconnect between consumption in the canopy and the forest floor, with lower-intensity surface fires with a flaming residence time of a minute or less (Wotton et al., 2011) without canopy involvement at times leading to deep smouldering occurring over hours to days afterwards (Huda et al., 2020; Huang and Rein, 2017). Consumption of fine fuels in the litter layer of the forest floor is nearly complete for any given surface fire intensity (Van Wagner, 1972), consumption of deeper organic soil horizons (F + H layers in upland forests and upper peat layers in wetlands) is more dependent on the interaction between moisture content of the soil organic layer and depth of the organic soil (Forestry Canada Fire Danger Group, 1992; Davies et al., 2016). While the moisture content of the soil organic layer is not directly observable nor parameterized in many numerical weather models (Hanes et al., 2023), it is well-estimated by simple water balance models within the Canadian Fire Weather Index System (Van Wagner, 1987), the Drought Code and Duff Moisture Code, as well as their composite, the Buildup Index. Given this lack of direct observability of forest floor consumption, this model uses fire weather and fuel loading as inputs to the forest floor consumption model, without consideration of the remotely sensed fire severity observations used in canopy consumption modelling. This approach mirrors many established and widely-used approaches in Canada such as CanFire (e.g. Smyth et al., 2026) as well as Consume (Ottmar et al., 1993) in the United States.
In the fire literature in Canada, the soil organic layer is sometimes termed the Forest Floor Fuel Load (FFFL) (Letang and de Groot, 2012) and is dominated by the equivalent organic soil Slow pool (Aboveground Slow Dead Organic Matter, or AGSlowDOM) in CBM-CFS3. Historically, attention has been paid to the absolute value of Forest Floor Fuel Consumption (FFFC) (Forestry Canada Fire Danger Group, 1992; de Groot et al., 2009); however in the case of carbon modelling, it is the relative fraction of consumption (FFFC/FFFL) that is of interest. Given the strong empirical evidence that the amount of organic soil present strongly influences the absolute and relative combustion rates (Walker et al., 2020b), modelling of forest floor consumption was conducted on field measurements of the relative fraction of organic soil consumption (Fig. C1). In this scheme, we utilize a composite of wildfire data from de Groot et al. (2009) alongside the ABoVE duff consumption data (Walker et al., 2020a), with an alternative modelling approach to compute the relative amount of consumption (scalar from 0 to 1) rather than directly modelling an absolute value in kg m−2 or cm as otherwise done in the literature. A logit transform is used on the scalar data to make it suitable for the fitted non-linear least-squares modelling:
where BUI is the Fire Weather Index System's Buildup Index, and AGSlow in the CBM-CFS3 (given in Mg C ha−1 in this equation), and also synonymous with the the Forest Floor Fuel Load (with ecozone averages given in Letang and de Groot, 2012 or site-level data where observed) (Figs. C2 and C3). Assuming an average carbon content of 50 %, CBM-CFS3 values in Mg C ha−1 are converted to fire behaviour units of kg of biomass per squared metre by dividing by 5 (Fig. C4).
While ultimately this scheme can be used on individual fires with estimated or measured fuel loading and specific BUI values, as an example, an ecozone-averaged fuel load and a multi-year average of BUI during active fire satellite detection can also be used to provide representative values to showcase the model framework. Specifically, a median BUI of detected fire hotspots in Canada from 2003–2021 (Barber et al., 2024) using the same data as the Canadian CFEEPS-FireWork wildfire air quality model of Chen et al. (2019) is presented in Table 8, along with proportional consumption values of the forest floor by ecozone.
Table 8Example fire weather, fuel loading, and duff consumption values per ecozone. Note that FFFL values are from the soil-specific Letang and de Groot (2012) compilation and not directly from the RU values provided in the National GHG Inventory Report. Median Buildup Index of burning is from Barber et al. (2024).
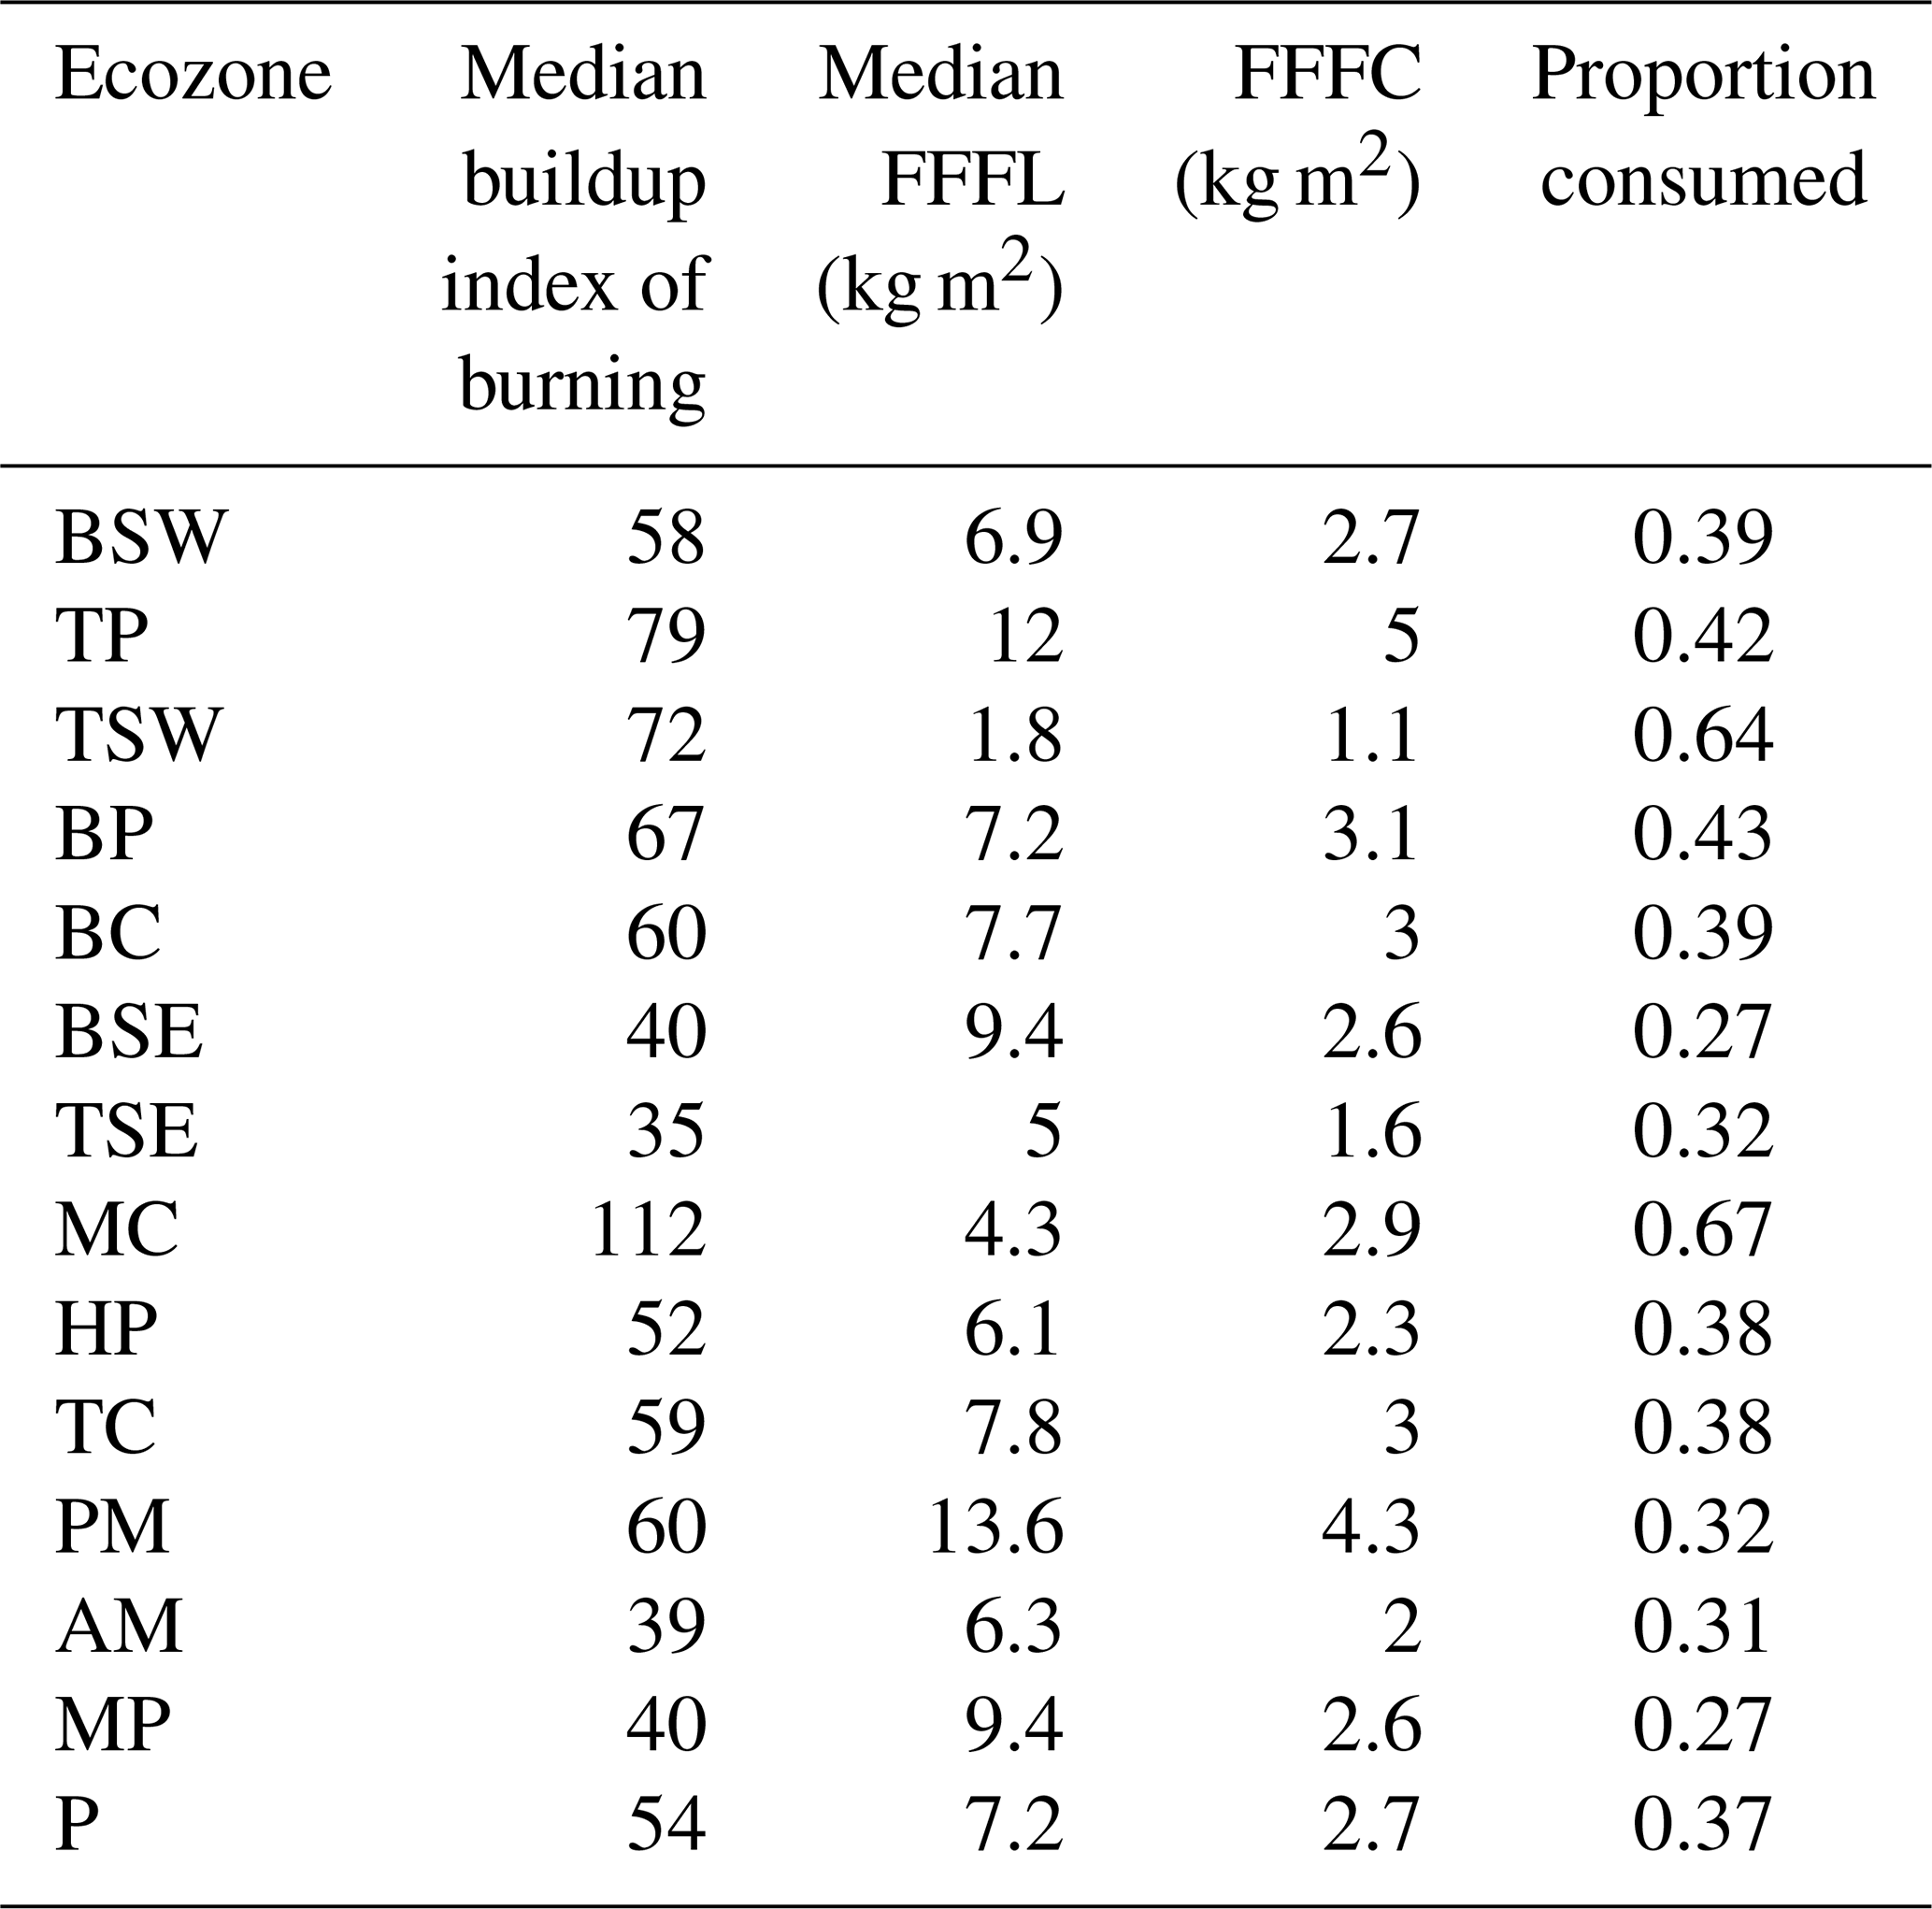
Note that the maximum upland Forest Floor Fuel Load is approximately 30 kg m−2 (150 Mg C ha−1) (Letang and de Groot, 2012); higher values are typically seen only in peat ecosystems, where the above scheme is still valid, as approximately 33 % of the data used to fit this model is for organic soil pool values over 30 kg m−2 (>150 Mg C ha−1). Fully 10 % of the data used in the FFFC model is for sites with over 60 kg m−2 of organic soil. Absolute consumption values are similar between deep forest floor organic layers and peatlands (Walker et al., 2020a), though relative consumption rates decline rapidly in deeper organic soil layers, as demonstrated in the model selected here. For Canadian peatlands, the CaMP model (Bona et al., 2020) is instead used in spatially explicit version of CBM-CFS3. Within CaMP, a separate peatland water model driven by Drought Code determines the thickness of the unsaturated peat layer, and an amount approximating 12 % of the thickness of the unsaturated peat is consumed as smouldering consumption. The peat-specific carbon pools and fire disturbance matrices are fully described in Bona et al. (2020); large peatland trees will still utilize the DM scheme described below. Since deeper forest organic soil and peat layers show approximately similar absolute consumption rates, for the purpose of this general model description no peatland-specific components of the fire DMs are required.
2.3 Source data for emissions comparisons
Direct wildfire C emissions from the proposed FireDMs scheme in CBM-CFS3 are compared to the FBP System model, which is observed biomass consumption rates from numerous experimental wildfires across Canada. The FBP System uses fixed fuel loads per fuel type, while FireDMs uses regional fuel loads, as represented by biomass pools defined per RU from forest inventory data.
Since FireDMs also distinguishes flaming vs. smouldering combustion, the Modified Combustion Efficiency is used to compare modelled vs. observed flaming to smouldering ratios:
where an MCE over 0.90 indicates a dominance of smouldering, and an MCE below 0.85 indicates a dominance of smouldering (Akagi et al., 2011). While MCE is often defined in volumetric gas concentration units (ppmv), in this study we compute MCE as an output of FireDMs on a molar basis. Calculations of MCE from FireDMs is compared to localized smoke plume observations of MCE for distinct periods during the ARCTAS airborne campaign (Hornbrook et al., 2011).
While not strictly a carbon emission from wildfire, N2O is tracked as part of the NIR process and is an important component of CO2-equivalent calculations. CO2-equivalent calculations here will use the CBM-CFS3 emission factor of 0.17 g kg−1 CO2 (0.09 g kg−1 biomass) to simplify comparisons of C emissions between NIR and FireDMs, recognizing that this N2O emissions factor is lower than widely cited emissions factors compilations (Binte Shahid et al., 2024; Andreae, 2019) between 0.20 and 0.24 g kg−1 of biomass.
2.4 Calculation of annual direct C emissions from fire
In an effort to compare model outputs (Tables A1–A5) against an independent, large-scale set of fire atmospheric emissions, fire direct atmospheric emissions from the record breaking Canadian 2023 fire season were computed using the above framework. The classified burn severity product from the National Burned Area Composite annual production was utilized (see Hall et al., 2020 for an algorithm description). In NBAC, an internal tracking value “NFIREID” is utilized, which is the final satellite-derived burned area polygon. Fire polygons are split across any subnational administrative boundaries (i.e. provinces and territories). Since carbon pool sizes vary across RU boundaries, this allows for a single NFIREID to be present across multiple RUs.
A total of 2199 ires as small as 0.09 ha (one 30 m by 30 m Landsat pixel) were mapped in NBAC for burn severity for a total of 14.60 M ha. Only fires over 100 ha were utilized as a lower limit of where meaningful per-fire estimates of the fraction of low, moderate, and high severity burned area was available. Including only fires 100 ha and larger reduced the total number of fires to 966 but the total area remained largely the same at 14.58 M ha. A total of 189 704 ha of post-fire salvage logging was also mapped in 2023 and is assigned to the moderate severity class after consultation with provincial land managers. The direct C emissions from fire shown here are not altered by the act of post-fire salvage logging. Additionally, the NBAC mapping process accounts for unburned islands (and areas with a mapped fire severity no different than unburned) which count towards the total fire area but do not have a disturbance matrix and direct C estimate applied.
All thermal detection hotspots from VIIRS that intersect the NBAC perimeter were extracted from the historical hotspot archive that supports the Canadian smoke emissions model CFFEPS-FireWork (Chen et al., 2019), which provide Fire Weather Index values for each hotspot, including BUI. A unique DM was then calculated for each fire using the median BUI per fire across all observed hotspots.
To compute total direct fire emissions per fire, a single estimate of the carbon pool size based on the RU of the centroid of the NBAC polygon was applied. Fires that cross provincial boundaries are mapped as discrete fires on either side of the boundary in NBAC, but no such division of fires was made across ecozone boundaries. While spatially explicit biomass maps are available for some aboveground components (Guindon et al., 2024) and some organic soil components (Hanes et al., 2022), the majority of the required pool sizes in CBM-CFS3 for the computation of the fire DMs are available only at the spatially referenced RU scale.
To calculate the sum total of estimate direct C emission from Canadian wildfires in 2023, severity maps were created for each fire using 2024 season satellite observations using an approach that produces severity class maps using both classified spectral indices (Whitman et al., 2020) with additional fire environment covariates to predict severity class at 30 m. A single representative area-weighted Buildup Index value from fire hotspots was computed for each fire. A set of DMs (composed of one DM per severity class) was then applied to Reconciliation Unit carbon stock values for the total fire area falling into low, moderate, and high severity classes. The same Buildup Index was used for all severity classes per fire event when computing the DM per fire event. Per-fire direct C emissions (i.e. CO2, CO, CH4, PM2.5, etc.) were then computed and summed by ecozone and nationally.
RU-level carbon stocks were extracted from the National Forest Carbon Monitoring Accounting and Reporting System (NFCMARS) CBM-CFS3 model results for the start of 2023. With the severe drought and extreme fire weather conditions of the 2023 fire season (Jain et al., 2024), patterns of burned area bias towards older conifer stands found in more typical fire seasons were instead replaced by unbiased burned area patterns that reflect the overall landscape composition (Boulanger et al., 2024). Thus, the 2023 Canadian fire season provides an ideal case to test regionally-averaged carbon stock estimates.
3.1 Direct fire carbon emissions as a function of fire severity and drought
Direct fire emissions per hectare by severity class and as a function of drought condition (BUI) are shown in Fig. 2. Direct fire emissions per hectare were greatest (using a constant BUI of 200 as a practical upper limit) in the Pacific Maritime ecozone of British Columbia, with 83 and 71 t C ha−1 released in high and moderate severity fires, respectively. This equates to 295 and 252 t CO2 eq ha−1 and an MCE of 0.90 to 0.89, respectively. The Pacific Maritime ecozone features some of the highest relative contributions of canopy fuels to carbon release, with 32 % of modelled emissions from the canopy, and 68 % from the surface (i.e. woody debris, litter, duff, roots etc). Next highest emissions were 65 t C ha−1 from high severity fire in the Boreal Shield East (BSE) of Labrador which features far lower merchantable volume but overall softwood foliage pools only 5 % smaller than the Pacific Maritime. Larger aboveground very fast DOM (i.e. litter) pools in the BSE of Labrador offset slightly smaller aboveground slow DOM (i.e. forest floor duff) pools as compared to the PM.
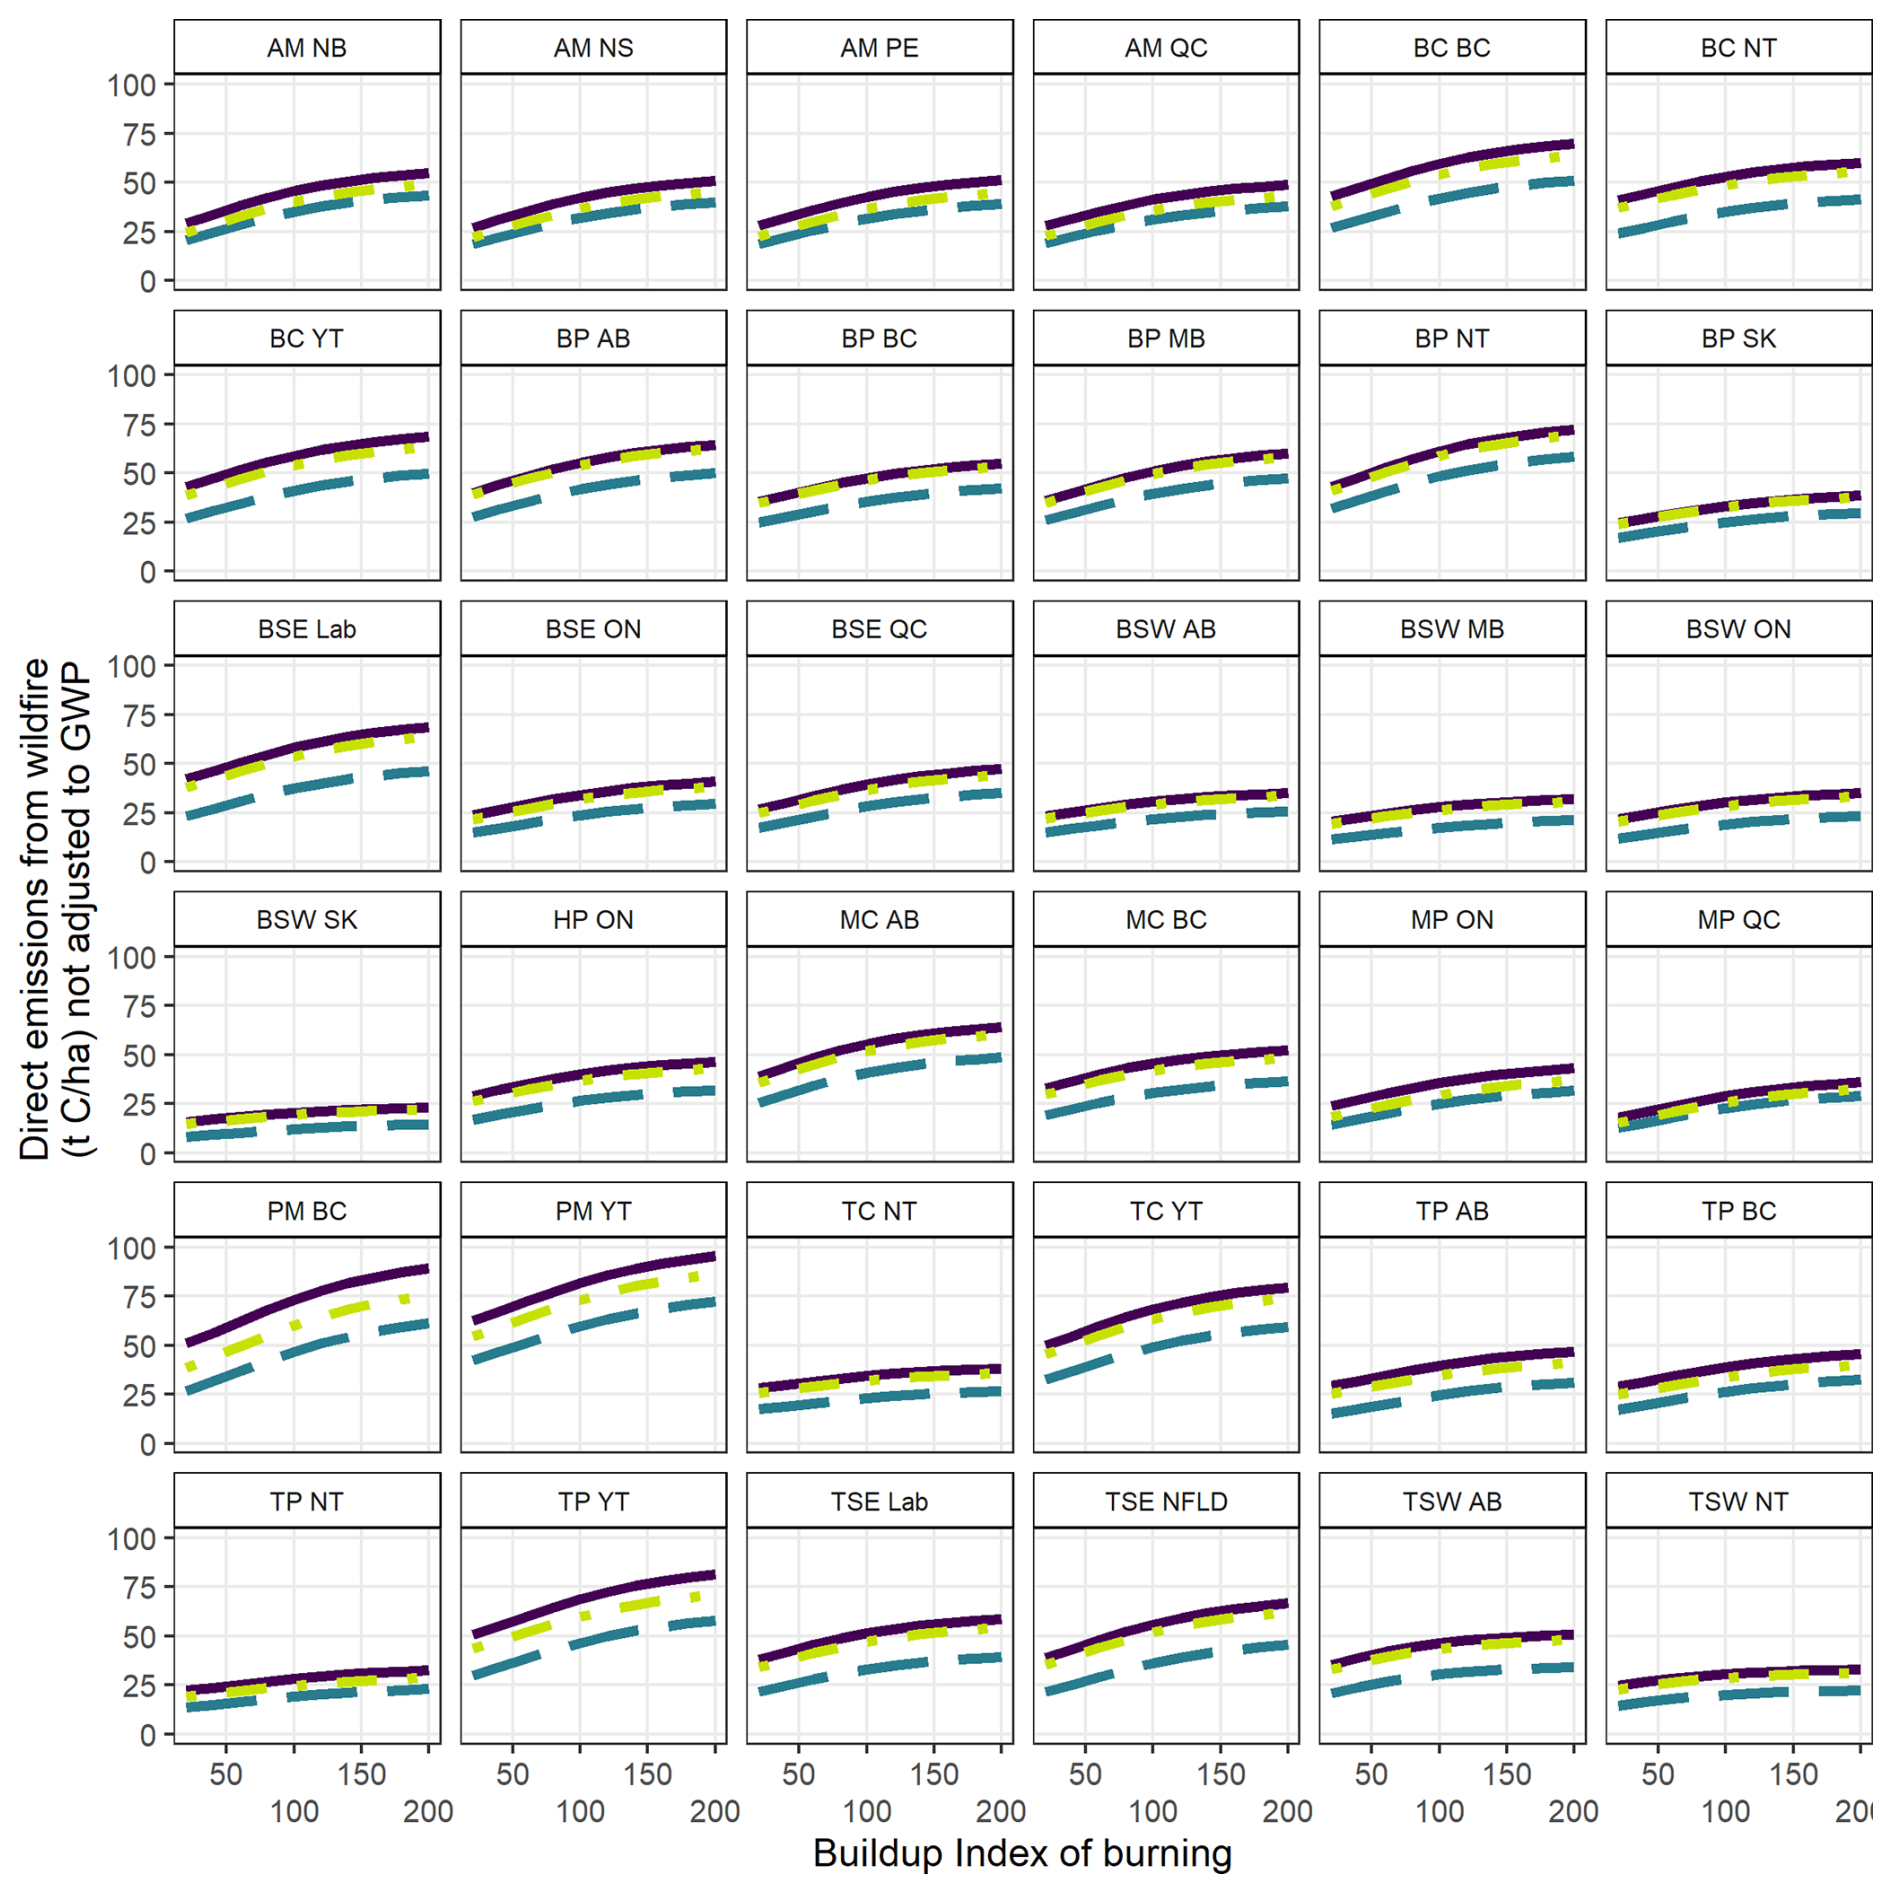
Figure 2Direct emissions by severity class: solid dark line = high severity, green dot-dash = moderate, blue dashed line = low severity. Labelled acronyms are RUs named as ecozone then administrative unit, so BC is both Boreal Cordillera and British Columba. Labrador is distinct from the island of Newfoundland for Reconciliation Units, so “Lab” and “NFLD” is used. Some small RUs without unique NIR biomass pool data are not shown in this figure but are computed still from adjacent RU from the same ecozone. Some RU with very small burned area are also not shown in this figure.
The lowest emissions per area were estimated to be in the Boreal Shield West of Saskatchewan, where total emissions of 16 and 22 t C ha−1 (56 and 76 t CO2 eq ha−1) for low and moderate severity fire at a BUI of 200 were 77 % in surface fuels. Despite much lower overall emissions, these low-emission fires still feature 77 %–79 % of the total emissions from surface fuels. The Taiga Shield West of the Northwest Territories also was modelled to have emissions of only 21.5 t C ha−1 under low-severity fire.
Across both low and high severity fires, the effect of drought was fairly consistent, the emissions from BUI 200 fires (i.e. very dry conditions) were higher than those of identical severity class but at a much lower BUI of 40. This lower BUI of 40 represents the practical lower limit of large spreading fires in forests in Canada. Variations in BUI can lead to up to 60 % enhancement in emissions as observed in Mixedwood Plains of Ontario and Quebec as well as the Atlantic Maritime of Nova Scotia and Prince Edward Island, but can as small as 10 %–13 % enhancement in emissions per hectare in colder northwestern boreal regions such as the Taiga Shield West of the Northwest Territories, BSW of Alberta, and Taiga Cordillera of the Northwest Territories. This patterns is consistent across both high and low severity fire, with the BUI enhancement of emissions as high as 63 % in low-severity fires, while the effect is only somewhat smaller in high severity fires at 54 %. Regions with the highest sensitivity to drought, in terms of GHG emissions, tend to be those with higher softwood (i.e. broadleaf) forest composition near 50 % (by volume) or more (i.e. Atlantic Maritime, Mixedwood Plains and also Boreal Plains of Manitoba). RUs with the highest aboveground slow DOM pools also showed similarly high drought sensitivity of ∼42 %. RUs with the lowest drought sensitivity tend to also be the RUs with the lowest overall emissions.
3.2 Comparison against existing fuel consumption models
The fire disturbance matrix approach is compared to the FBP System in Fig. 3. The FBP System is used widely in fire growth modelling as well as in Canada's national air quality model (Chen et al., 2019). The FBP fuel consumption values are based solely on experimental (i.e. controlled ignition) fires with fuel consumption measured within less than an hour of the passage of the flaming front, and therefore does not include the consumption from long-smouldering fuel beds such as organic soils and large-diameter woody debris. The FBP system emphasizes the prediction of fire intensity (i.e. flame length) and fire frontal spread rate, with no measurements of the complete fuel consumption. Fuel consumption values provided by the FBP system are dependent only on fuel type (related to leading tree species) and BUI, with no allowance for site-specific variations in fuel load (both canopy and surface fuel loads are fixed in the FBP). Given the need for safe experimental fire operations and the demand for firefighting resources, experimental fires in the FBP with fuel consumption data have a BUI of no more than 80 for the most common C-2 and C-3 fuels. A BUI of 80 exceeds the area-weighted BUI for most years except in the Montane Cordillera ecozone (see Fig. S1 in the Supplement), though the record-breaking 2023 fire season saw an area-weighted mean BUI for burning days of 109.
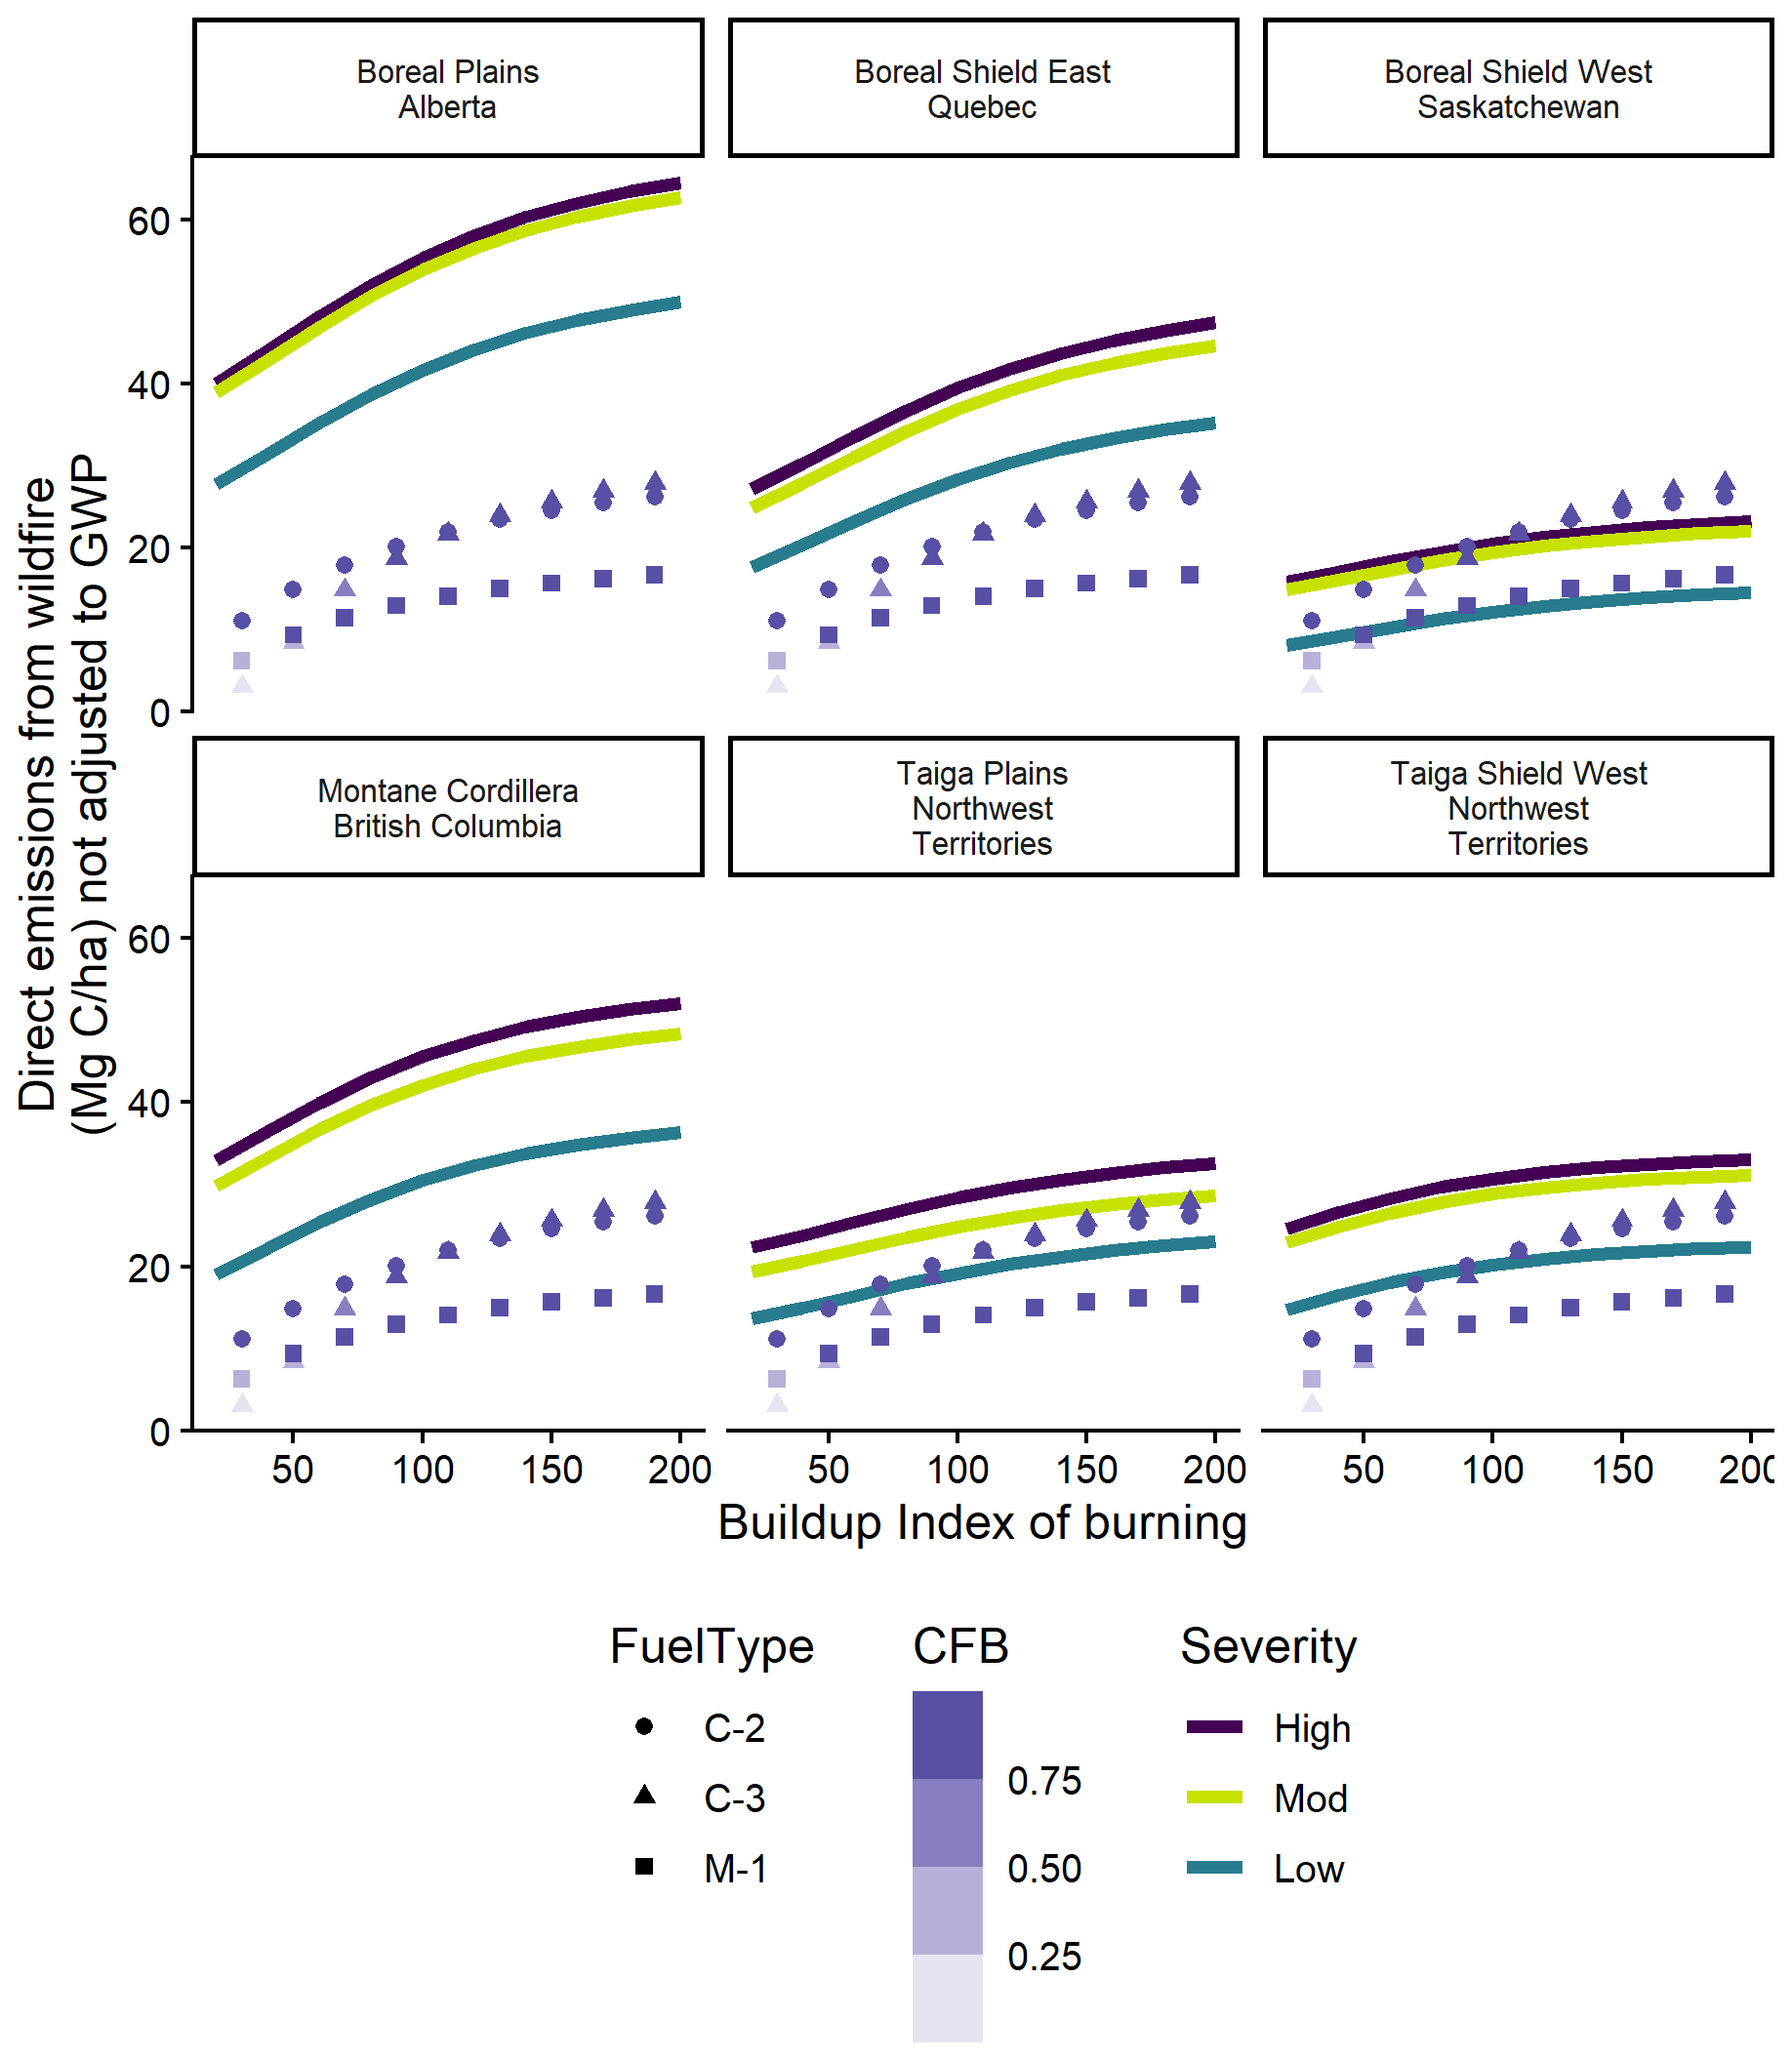
Figure 3Fire direct emissions by severity class using the FireDMs approach from this study (lines) as compared to Canadian Fire Behaviour Prediction (FBP) System outputs for Total Fuel Consumption, based on experimental fires of differing fuel types C-2 (boreal spruce), C-3 (Jack and lodgepole pine) as well as M-1 (leafless mixedwood 50 % conifer). An Initial Spread Index value of 14 is used in all FBP calculations. Points are colourized by Crown Fraction Burned (CFB).
The extrapolation of fuel consumption in the FBP beyond a BUI of 80, coupled with the lack of long-duration smouldering pools, likely accounts for the systematic lower estimates of fuel consumption in the FBP compared to this disturbance matrix approach shown above. For more southern forests such as the Montane Cordillera, Boreal Plains, or Boreal Shield East, larger canopy fuels and woody debris volumes likely contribute to the larger fuel consumption estimates in this approach compared to the FBP. For the Taiga ecozones, smaller canopy fuel and woody debris fuel loads as well as thin duff layers (i.e. AGSlow in the CBM-CFS3 nomenclature) also contribute to lower total fuel consumption that falls closer to observed FBP Values.
3.3 Comparison against observed direct fire emissions
3.3.1 Forest fire observations of CO and CO2 emissions ratios
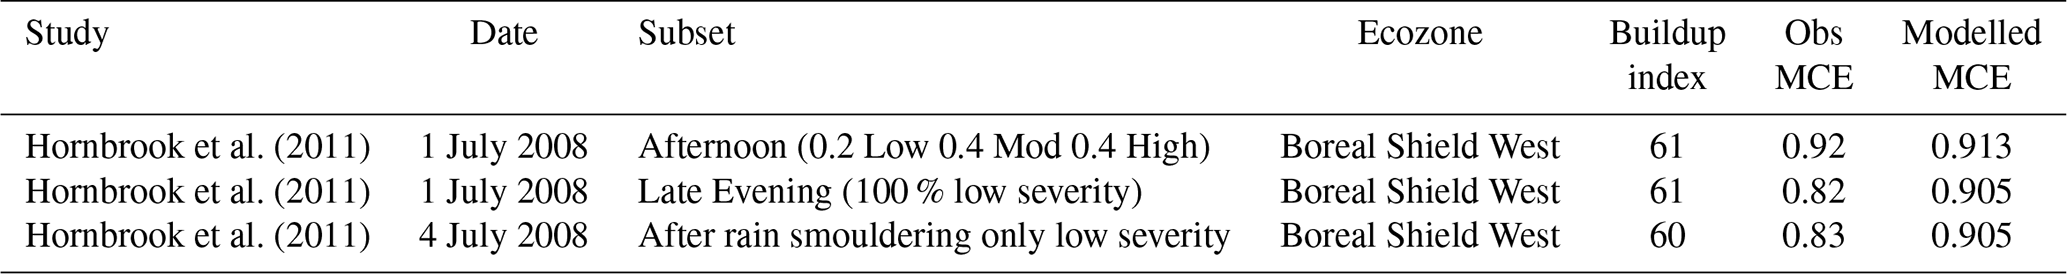
MCE observed by aircraft from Hornbrook et al. (2011) during the peak burn period (when the majority of fuel consumption and area burned occurs) largely corresponded with modelled values (Table 9). This suggests the model provides a fair representation of the balance of flaming and smouldering during large active wildfires. Subsequent smoke plume observations during periods of greatly reduced spread and intensity (late evening and after rain) showed a substantially reduced MCE of 0.82–0.83 that indicates a near lack of flaming combustion. Even when represented as 100 % low severity fire in the model, the modelled MCE only declines to 0.90, suggesting FireDMs does not adequately capture carbon emissions ratios during marginal smouldering conditions. Since the fire DM model is based on area burned, fire activity such as smouldering but with minimal actual area burned increased is going to show an MCE far lower than areas of low severity fire spread, which are typically still a low sub-canopy flaming front that features a mix of smouldering duff and woody debris alongside flaming consumption of litter (McRae et al., 1994, 2017). During the same ARCTAS campaign over a larger sample of 39 fires, Vay et al. (2011) observed a mean MCE of 0.89 for smoke plumes within 2 km of a large wildfire.
Hornbrook et al. (2011)Hornbrook et al. (2011)Hornbrook et al. (2011)Table 9Comparison of the Modified Combustion Efficiency (MCE) of airborne gas measurements of Canadian wildfires against modelled MCE.
3.4 2023 Canadian wildfire season direct emissions
A total of 502 Mt C was estimated to be released directly by fires in Canada in 2023. The area-weighted mean Buildup Index for all fires in Canada in 2023 was 109, representing severe but not uniformly exceptional drought conditions in Canada's northern forests. The area-weighted mean total C emissions per unit area was 34.41 t C ha−1, though 90 % of the emissions per unit area were between the 5th percentile of 14 t C ha−1 typical of the Taiga Plains ecozone under low drought conditions and the 95th percentile of 54 t C ha−1 typical of Pacific coastal forests.
Comparison of emissions totals against the NIR is only possible for spatial units (i.e. Reconciliation Units, provinces, or ecozones) where the entire RU is composed of managed forest. In British Columbia, across 2.2 M ha burned, these FireDMs estimates were consistently lower than NIR. This was driven by a lower average emissions in FireDMs for both the Taiga Plains with 1.3 M ha burned (125 t CO2 eq ha−1) and Montane Cordillera with 0.68 M ha burned (130 t CO2 eq ha−1) as compared to the NIR (161 and 189 t CO2 eq ha−1, respectively) (Table 10). For Alberta the 1.5 M ha of Boreal Plains ecozone burned showed close agreement (162 vs. 163) as well as in the Taiga Plains (130 vs. 144). The Taiga Plains fires of both Alberta and British Columbia were largely adjacent, and the FireDMs output was very similar (126 vs. 130) across nearly identical moderate and high severity fractions, but the NIR showed a larger contrast (144 vs. 161) that may originate from the underlying assumptions of the previous methods of calculating fire emissions in the NIR.
Table 10Comparison of per hectare emissions from this study against the 2025 National Inventory Report for the 2023 wildfire season in Canada. Rows are sorted by decreasing 2023 area burned. Note that for RUs with no managed forest area, the nearest forest inventory data available is used.
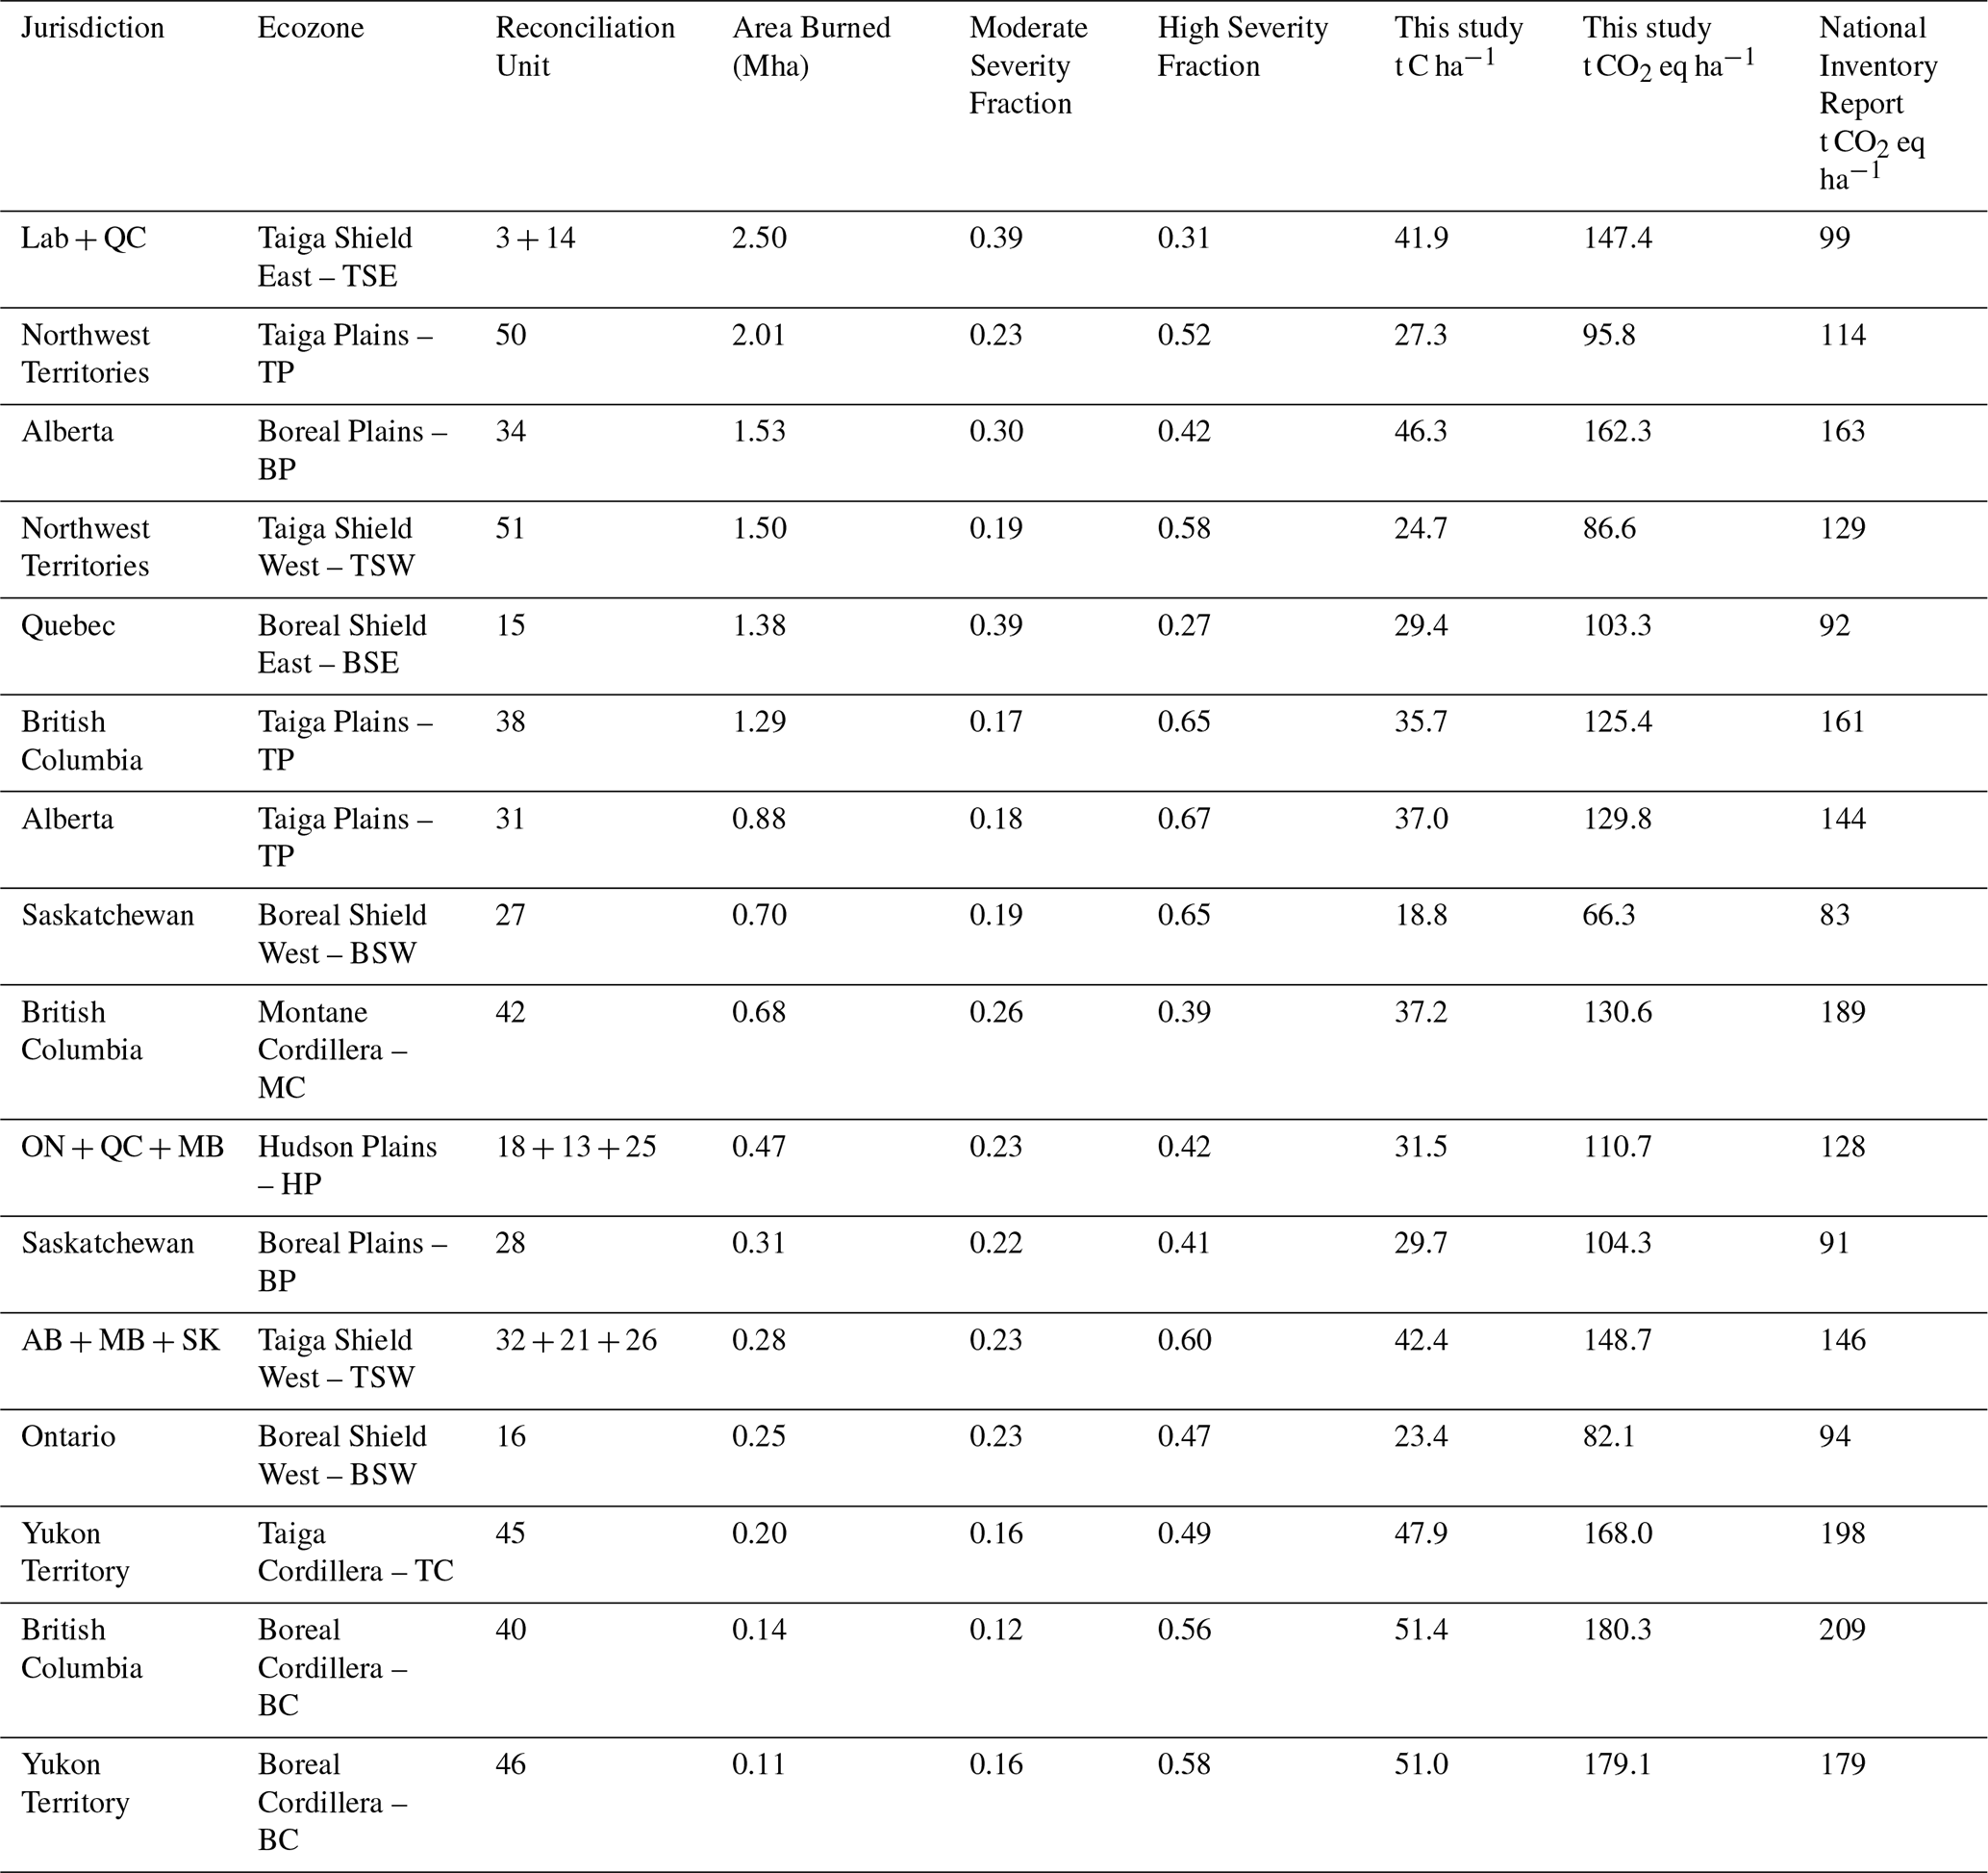
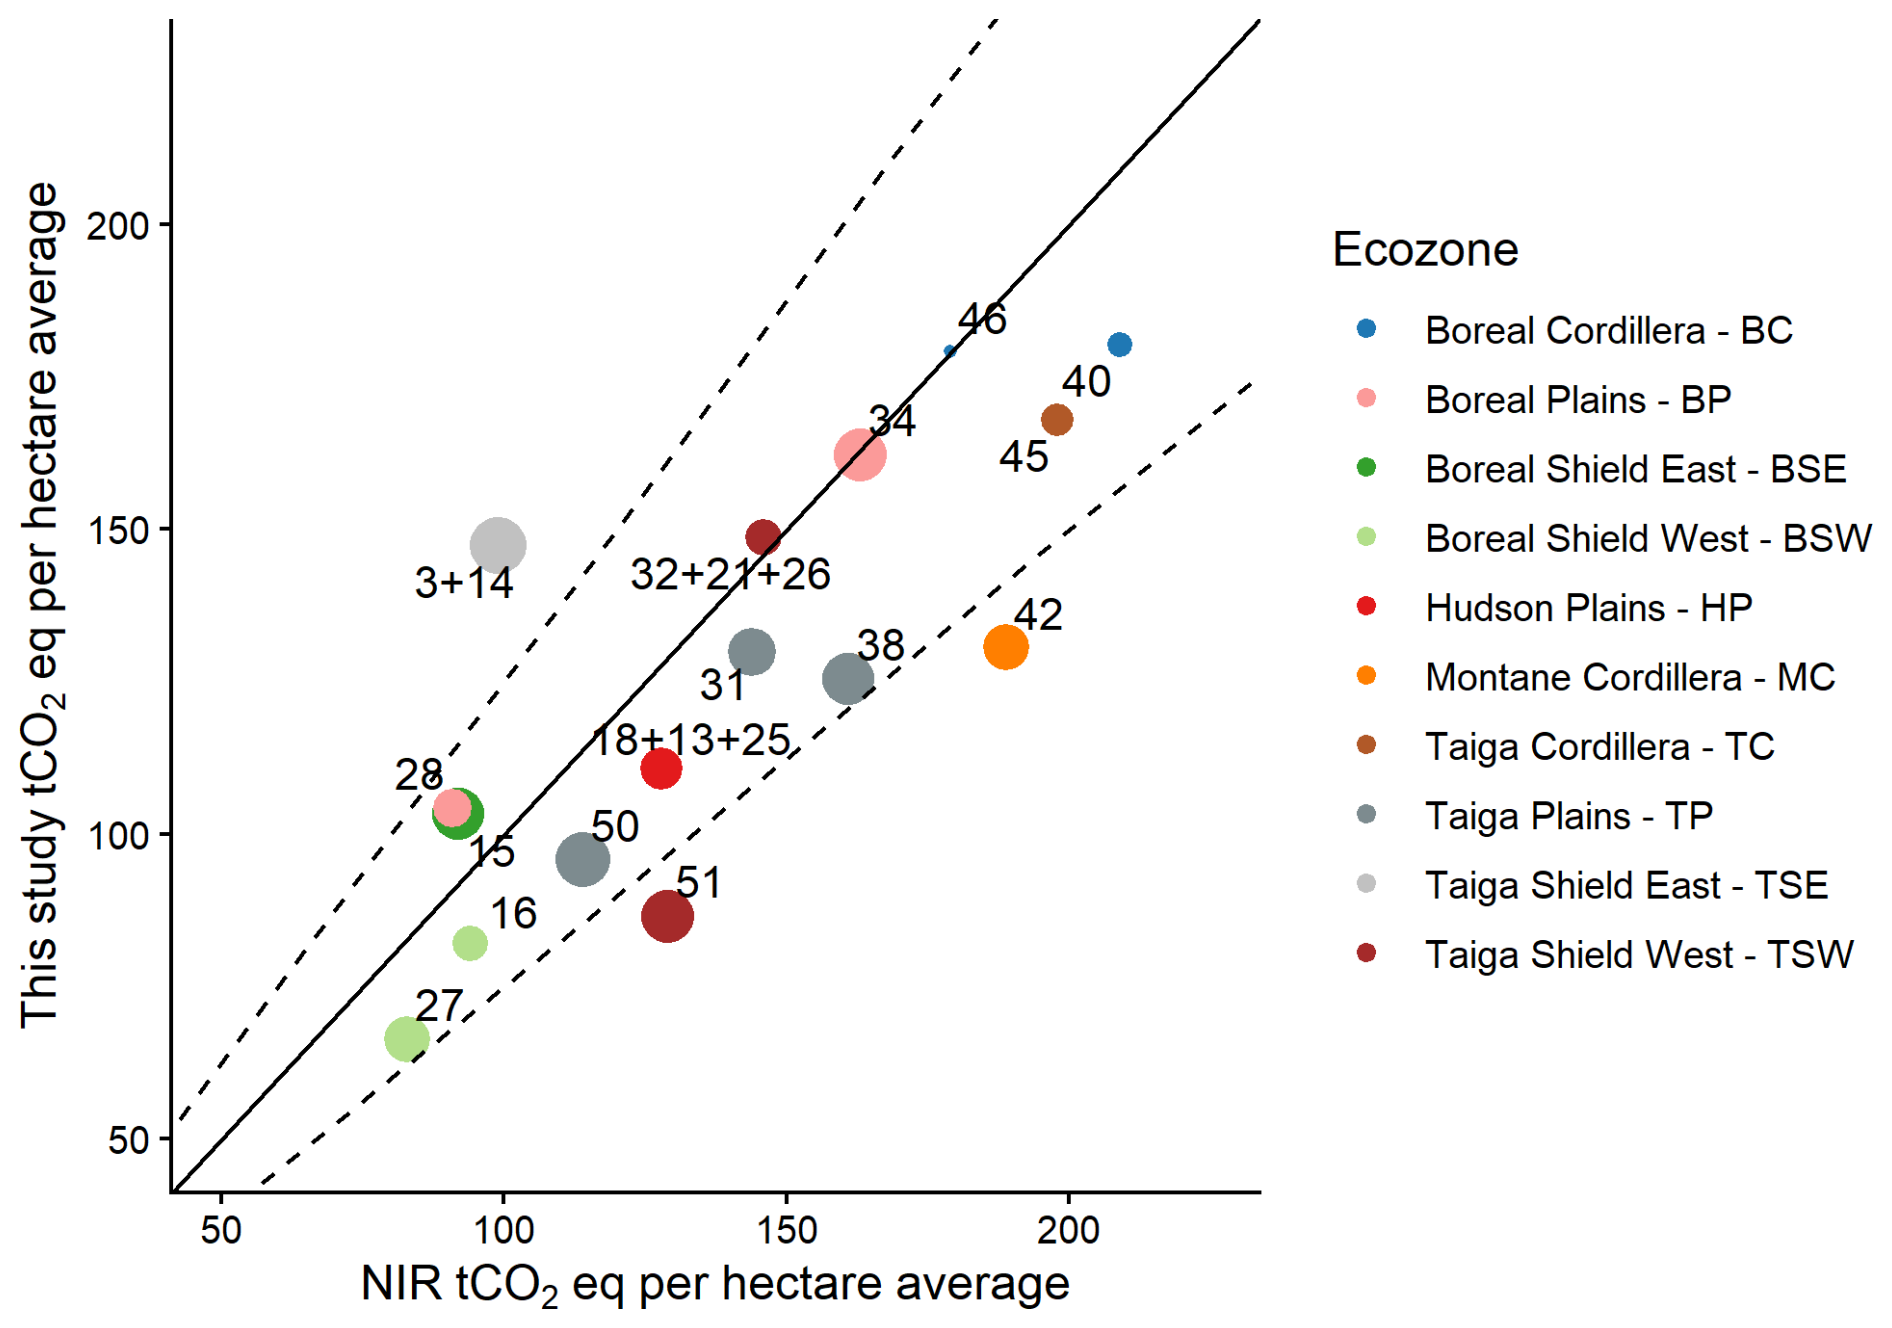
Figure 4Comparison of CO2 eq emissions per hectare between the FireDMs estimate and current methodology, the 2025 National Inventory Report for the 2023 wildfires. Dots are labelled by RU and coloured by ecozone (see Fig. 1), with dot size proportional to 2023 area burned. The solid line is the 1:1 reference line, and the dashed line represents 25 % deviation from a 1:1 relationship.
The RU with the largest burned area in 2023 was in the unmanaged forest of Quebec's Taiga Shield East, where NIR pool sizes from the adjacent jurisdiction of Labrador TSE were used in the FireDMs estimates, as no NIR pool sizes were available for Quebec's TSE ecozone RU, as there is no managed forest in that RU (the objective of the NIR being to report on GHG emissions in managed forest). Over this 2.5 M ha of burned area, the Quebec TSE FireDMs emissions estimates were substantially larger (147 t CO2 eq ha−1) compared to NIR (99 t CO2 eq ha−1, see Fig. 4). In the Quebec Boreal Shield East ecozone where NIR pools are available, the FireDMs were still larger than NIR, though the gap between the two was much smaller (103 vs. 92). Only the Manitoba Boreal Plains and Yukon Taiga Plains showed a similarly larger estimate in the FireDMs compared to NIR, with all other RUs showing a typically 10 %–30 % reduction in emissions in the FireDMs compared to the NIR. Overall, this new emissions estimate method will yield more representative fire emissions estimates that are sensitive to annual differences in drought condition and fire-specific patterns of severity. The small overall impact is likely due to larger soil organic layer emissions in the FireDMs being offset by lower canopy consumption in the low and moderate severity areas.
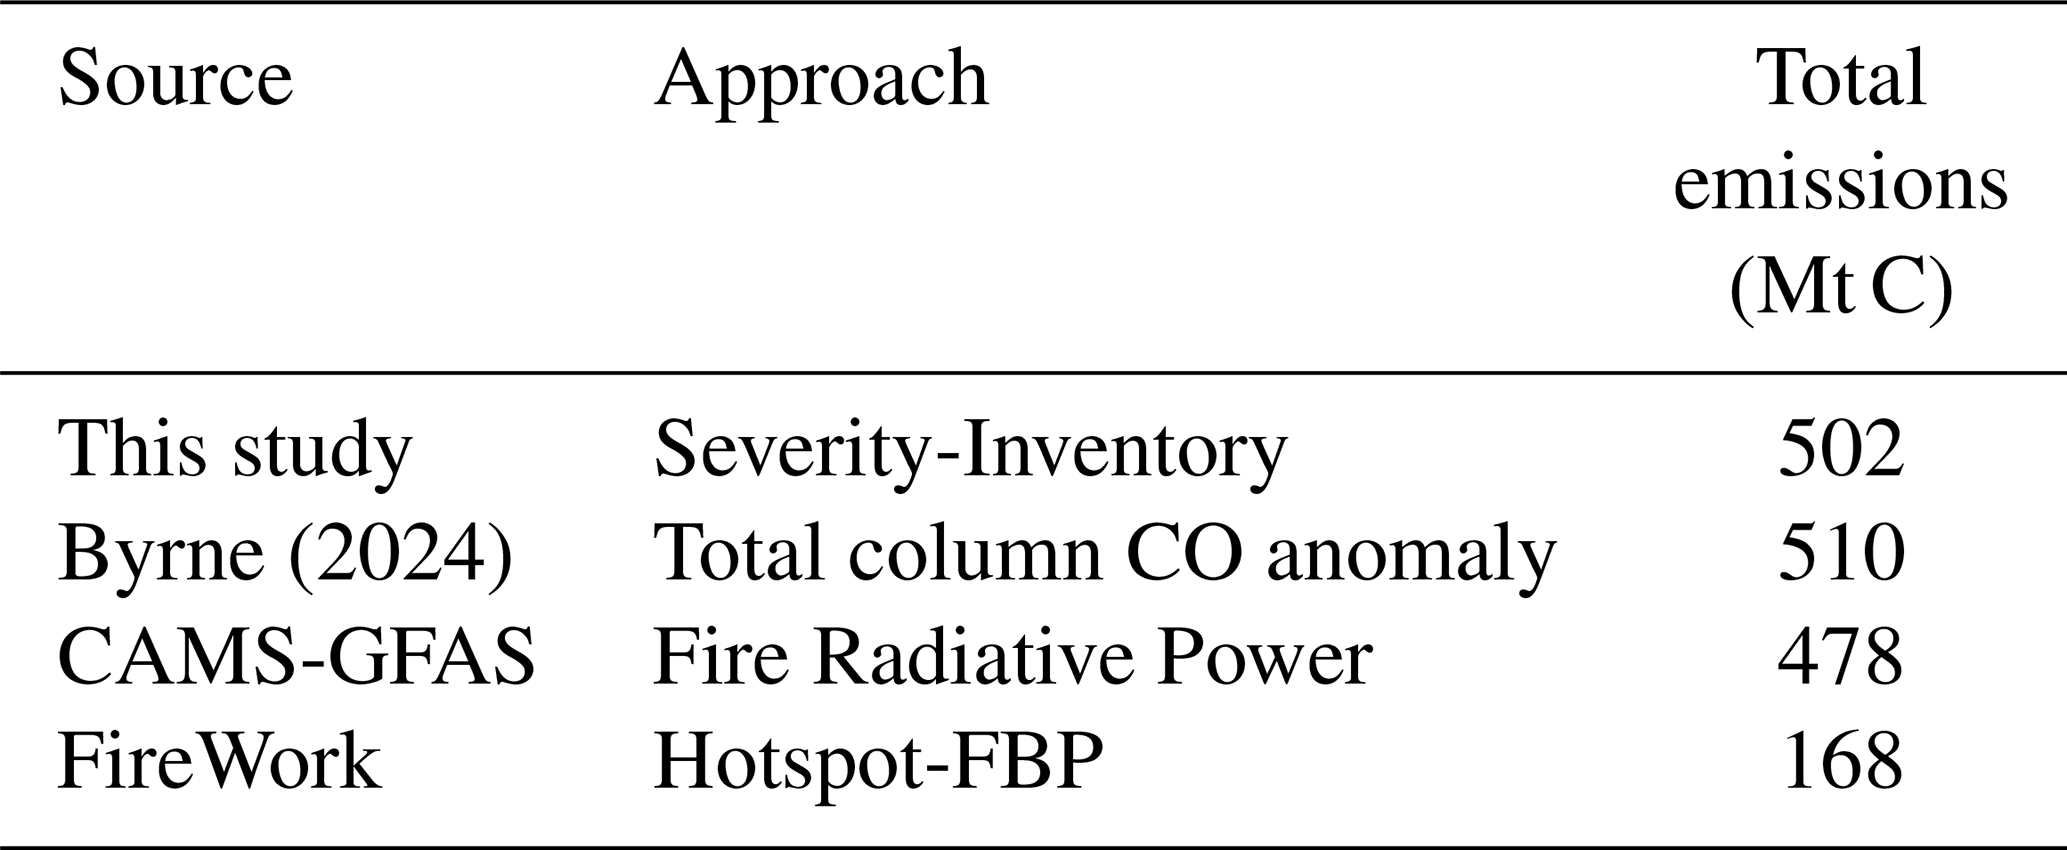
Byrne et al. (2024) used observed total atmospheric column excess CO and a range of MCE values to estimate total fire C emissions in Canada in 2023 of between 570–727 Mt C with a mean estimate of 647 Mt. The uncertainty in the estimate from Byrne et al. (2024) lies primarily in the uncertain CO2 : CO ratio (more commonly computed as the normalized ratio MCE) that was estimated to be between 7.8–10.8 g CO2 g−1 CO. Our bottom-up estimates that partition flaming vs. smouldering shows a lower CO2 : CO estimate of 6.1. This lower CO2 : CO ratio (i.e. more smouldering) if applied to the data from Byrne et al. (2024) would reduce their lower range of total C emissions to 510 Mt C, which is comparable to the 502 Mt C computed from this bottom-up approach (Table 11). Estimates of total carbon emissions based solely on the sum of observed Fire Radiative Power (FRP) from Copernicus-CAMS (GFASv1.2; Kaiser et al., 2012) was 478 Mt C (Jones et al., 2024). The operational air quality model for Canada produces wildfire smoke emissions estimates using the CFFEPS-FireWork framework (Chen et al., 2019) which utilizes active fire satellite detections coupled to biomass burning rates from the Canadian Forest Fire Danger Rating System which are known to underestimate total emissions from forest floor combustion (de Groot et al., 2009). As a result, the CFFEPS-FireWork total emissions in 2023 with their exceptional nation-wide moisture deficits (Jain et al., 2024) underestimate total emissions compared to other methods, with CFFEPS estimates of CO emissions only ∼40 % of satellite observed values (Griffin et al., 2024; Voshtani et al., 2025). Even after assimilating satellite CO and tower-based total carbon measurements, CFFEPS still retains 20 % understimating bias, likely attributable to an estimate of peak CO (i.e. smouldering) emissions that are lower than reality (Voshtani et al., 2025).
Table 11Comparison of total carbon emissions estimates for the Canadian 2023 fire season. Note that the Byrne et al. (2024) estimate shown here uses the emissions ratio for CO inferred from this study. See main text for details.
3.4.1 Relationship to other estimates
The forest floor emissions modelling scheme used here builds upon the CanFIRE model (de Groot et al., 2013) which incorporates a similar estimate of absolute forest floor emissions based on fuel type and various Fire Weather Index inputs (including but not limited to Buildup Index). While the CanFIRE model is also capable of estimating tree mortality, the premise of CanFIRE lies in the use of the FBP System to model fire intensity and a physiological-thermodynamic model of tree damage and mortality. CanFIRE is able to run entirely in scenario or forecast mode, i.e. no fire severity map is needed to run the model, unlike the focus here on a mechanism to estimate carbon fluxes and pools after fire severity is mapped. Ultimately, models like CanFIRE can be used for near-real time emissions estimates of direct and indirect fire carbon emissions (and also for prescribed fire planning and scenario testing), while this modelling framework is best used solely operational carbon accounting and reporting given its strong dependence on severity maps. While fire severity can be estimated empirically based on geospatial inputs without observation using multispectral satellite data such as Landsat, estimation using coupled fire behaviour and ecology models such as CanFIRE is a more direct approach. Under severe drought conditions and light winds, very large fires often create more wind and energy than is available in gradient winds as measured at nearby airports and fire weather observing stations (Clark et al., 1999). Thus, fire behaviour and fuel consumption models solely driven by wind inputs from distant meteorological stations can under-predict fire intensity and therefore likely fire severity. While fire-atmosphere models are available for research (Coen et al., 2018) and some forecasting and planning purposes (Linn et al., 2020), modelling resources are typically not made available for the extensive and largely unsuppressed fires in northern Canada. Fire severity mapping after the fact is able to account for high fire severity (Whitman et al., 2018) even when fire spread occurs under light winds more associated with lower fire intensity (Whitman et al., 2024).
While the fire DMs presented here are designed for use in NFCMARS for GHG estimation and reporting, their simplicity and similarity to many other forest carbon schema allows them to be used elsewhere such as in other forest dynamics (Brecka et al., 2020) and earth system models (Melton et al., 2020) that require estimates of Canadian forest carbon emissions from wildfire. Stenzel et al. (2019) showed that severity-informed fire C estimates (with snags) in the US are only 30 %–40 % as large as fixed or variable severity data using their LANDIS-type models. Large over-estimates of in-fire bole consumption in models were not observed to correspond to measurements in the field. In the model presented here, our estimates of snag consumption are based on simple but logical relationships with CFB, but more comprehensive data collection and field observations would be required to extend the accuracy of the snag consumption scheme.
3.4.2 Indirect fire emissions
While fire emissions within the year of the fire are majority of the GHG flux, enhanced post-fire decomposition of dead biomass persists for many years after a fire. The increase in post-fire tree mortality between the year of the fire and the year following the fire is as much as 30 % in low and moderate-severity stands (Angers et al., 2011). This extended mortality is not captured in year-of fire severity mapping but is likely better assessed using fire severity data captured the year following fire, as is operational practice in Canada. Similarly, the transition of fire-killed stems (snags) from upright to the forest floor woody debris takes between 5–8 years for 50 % of stems to fall (Angers et al., 2011) with stemfall rate highest in low-severity fire. Field observations show that initial assessments of fire severity are the primary predictors of snag fall (Angers et al., 2011) and decomposition (Boulanger et al., 2011) rates, meaning the mapped severity method used here provides a useful input for multi-year fire carbon modelling of the snag pool in CBM-CFS3. For organic soil pools, fire has been shown to suppress decomposition rates in upland soil pools where drier post-fire conditions are present (Holden et al., 2015), while in permafrost upland (O'Donnell et al., 2011) and peatland (Gibson et al., 2018, 2019) systems, fire has profound impacts on soil carbon pools by rapidly increasing thaw depths and subsequent decomposition rates. Currently in CBM-CFS3, decomposition rates are calibrated against field decomposition litterbag experiments (Trofymow et al., 2002) and annual climate metrics that do not take into account how disturbances such as fire (and fire of varying severity) modify decomposition rates in the absence of a change in climate.
3.4.3 Model gaps
Currently, FireDMs only accounts for regionally-averaged soil carbon stocks, meaning that RUs with high peatland areas will show higher organic soil slow pool size, but peatlands themselves are not spatially represented in the model. Instead, peatlands influence the reported Aboveground Slow pool size. Currently, fire disturbance in peatlands is performed by the CaMP model, which uses the closely related Drought Code fire weather metric to estimate peat layer consumption (Bona et al., 2020) and uses the overstory carbon schema of CBM-CFS3 to estimate overstory tree carbon pools and fluxes. Direct satellite monitoring of upland forest organic soil and peatland carbon loss via burn severity monitoring is possible but remains a challenge to implement with accuracy for monitoring purposes (Bourgeau-Chavez et al., 2020). Despite the large carbon stock (c. 500 Mg C ha−1 from Beilman et al., 2008), the mean C emissions per area in peatland due to fire (65 t C ha−1) as modelled by Bona et al. (2024) are comparable to regional emissions from peat-rich ecozones such as the Boreal and Taiga Plains under moderate to severe drought conditions. Indeed, it is under these moderate to severe drought conditions that peatlands burn more frequently (Turetsky et al., 2004; Thompson et al., 2019) and severely (Kuntzemann et al., 2023).
While Canadian wildfires shown an overall selection bias towards preferentially burning older conifer stands (Bernier et al., 2016), fuel selectivity against less flammable portions of the landscape decreases strongly under severe drought conditions (Parks et al., 2018). The severe drought conditions experienced in Canada in 2023 (Jain et al., 2024) are an ideal setting to compare an emissions model using spatially referenced biomass data against observed emissions. The 2023 fires were observed to largely burn boreal forest ecosystems at the same rate as their abundance on the landscape, owing to severe drought and fire weather conditions (Boulanger et al., 2024). Emissions model evaluation against individual fires or in years of less profound drought would be more likely to highlight the limitation of the regionally-averaged carbon pool (i.e. fuel load) values used here. Ultimately, the mapped severity used here is best paired with mapped carbon pools at a similar scale, such as the 1 ha forest carbon modelling for analysis and scenario testing used by Smyth et al. (2024). Future work will extend this fire disturbance algorithm to finer-scale carbon reporting using gridded data as it becomes available for annual reporting purposes.
Species-specific traits in trees with overlapping ranges, such as resprouting in aspen (Brown and DeByle, 1987) but not other broadleaves such as oak or maple, are not explicitly handled in this model. Instead, the relative abundance of trees with contrasting traits that influence ecological outcomes such as fire survival are lumped at the ecozone scale from the aggregation of the plot data. While ecozone-level contrasts in key considerations such as overstory mortality do strongly vary by ecozone (Table 5), the same DM (e.g. hardwood root mortality) is applied in adjacent stands at the same severity class despite the potential for strongly contrasting traits that are readily tied back to mapping at the stand level by leading species. Alternately, models such as CanFIRE can account for species-level contrasts in fire ecology traits, but compiling the relevant ecophysiological properties and traits for all tree species across the spectrum of fire intensity in Canada remains incomplete at this time.
Carbon emissions from wildfires in Canada represent a substantial pulse input of greenhouse gases to the atmosphere: the 2023 fire emissions in Canada were an input of approximately 502 Mt C. A modelling framework to extend the current fire and greenhouse gas reporting in Canada is presented. In contrast to the existing modelling system that utilizes a fixed fire severity (i.e. tree mortality) assumption, a field-calibrated satellite fire severity mapping process that follows mature and well-established scientific methods is used. Above-ground carbon pool changes (from live to dead and in situ as well as to the gas phase) rely on a robust field observation dataset that relates back to satellite metrics. Evaluation of the modelling presented above against fully independent airborne observations of CO : CO2 emissions ratios for boreal wildfires indicates the modelling of proportion of flaming vs. smouldering emissions are well-replicated by the model. With confidence in this modelled CO : CO2 ratio, the total fire CO emissions for the 2023 wildfire season in Canada (with a record 15 M ha burned) is broadly consistent with fire season estimates using satellite total column CO anomalies.
While this prototype carbon flux framework utilizes regionally-averaged carbon stock estimates, future systems deployment within Canada's carbon accounting system is likely to incorporate precisely mapped (30 m) carbon pools alongside the finely mapped fire severity products (30 m) used here. As both the spatial estimates of carbon stocks across Canada's forested ecosystems improves alongside additional field observations, it is anticipated that this modelling framework will increase in both accuracy and precision over time.
Note that the pool source is shown in rows, and the destination pool is shown in the columns.
Table A1Low severity Disturbance Matrix in BP. Note: only some biomass and atmospheric pools are shown.
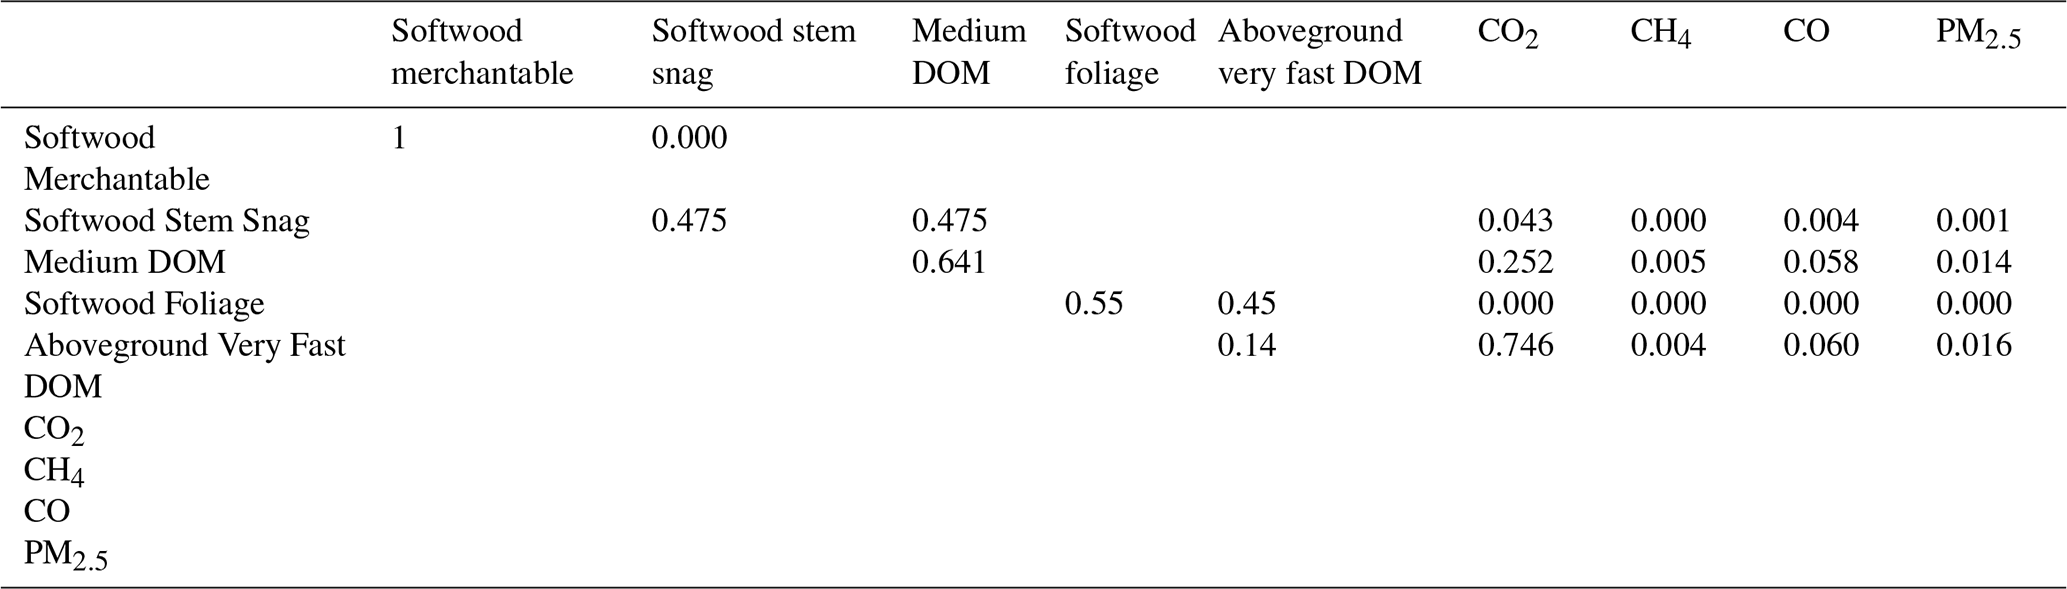
Table A2Mod severity Disturbance Matrix in BP. Note: only some biomass and atmospheric pools are shown.

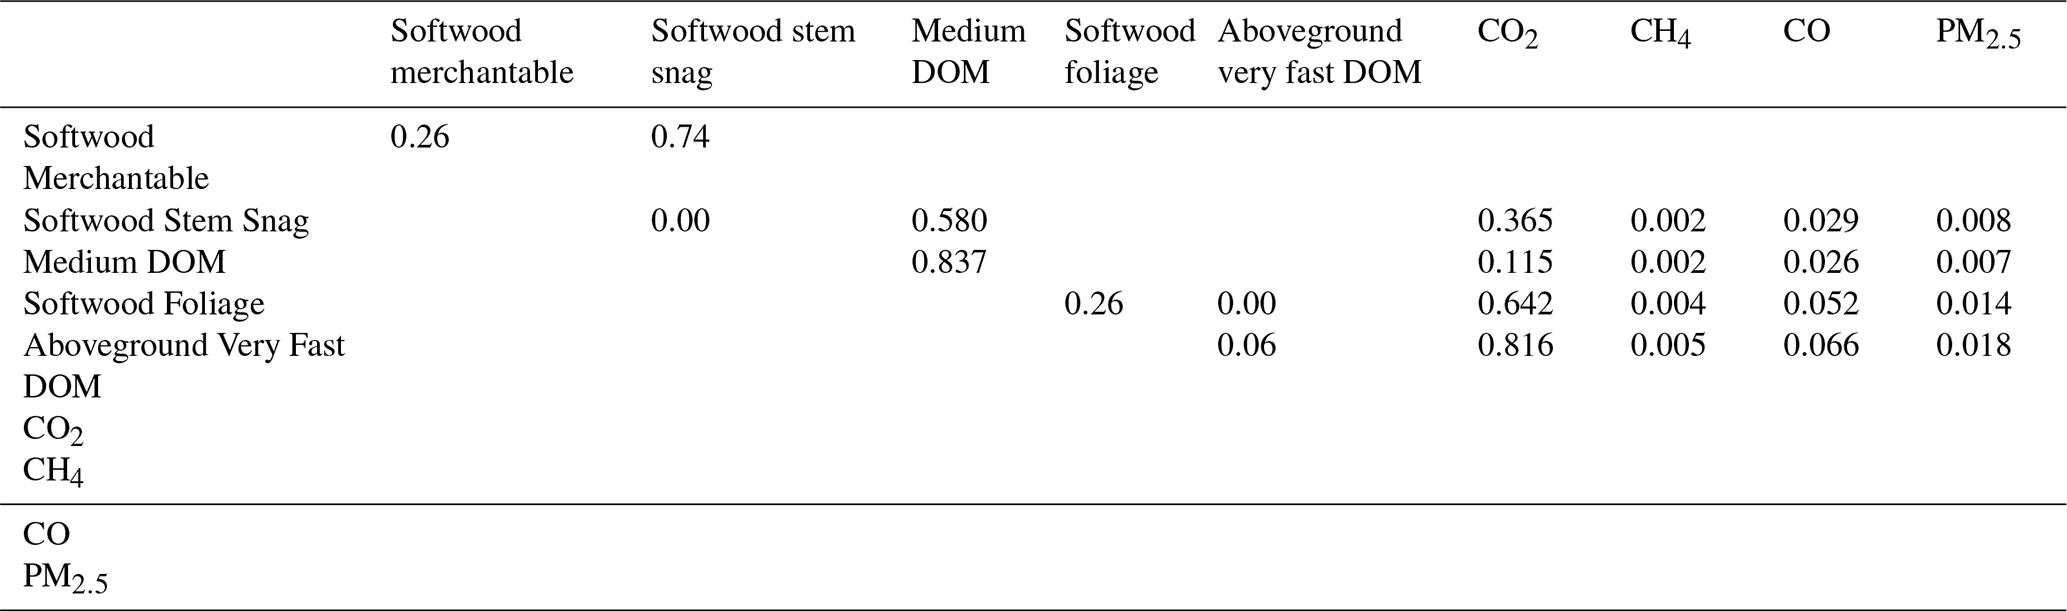
Table A3High severity Disturbance Matrix in BP. Note: only some biomass and atmospheric pools are shown.
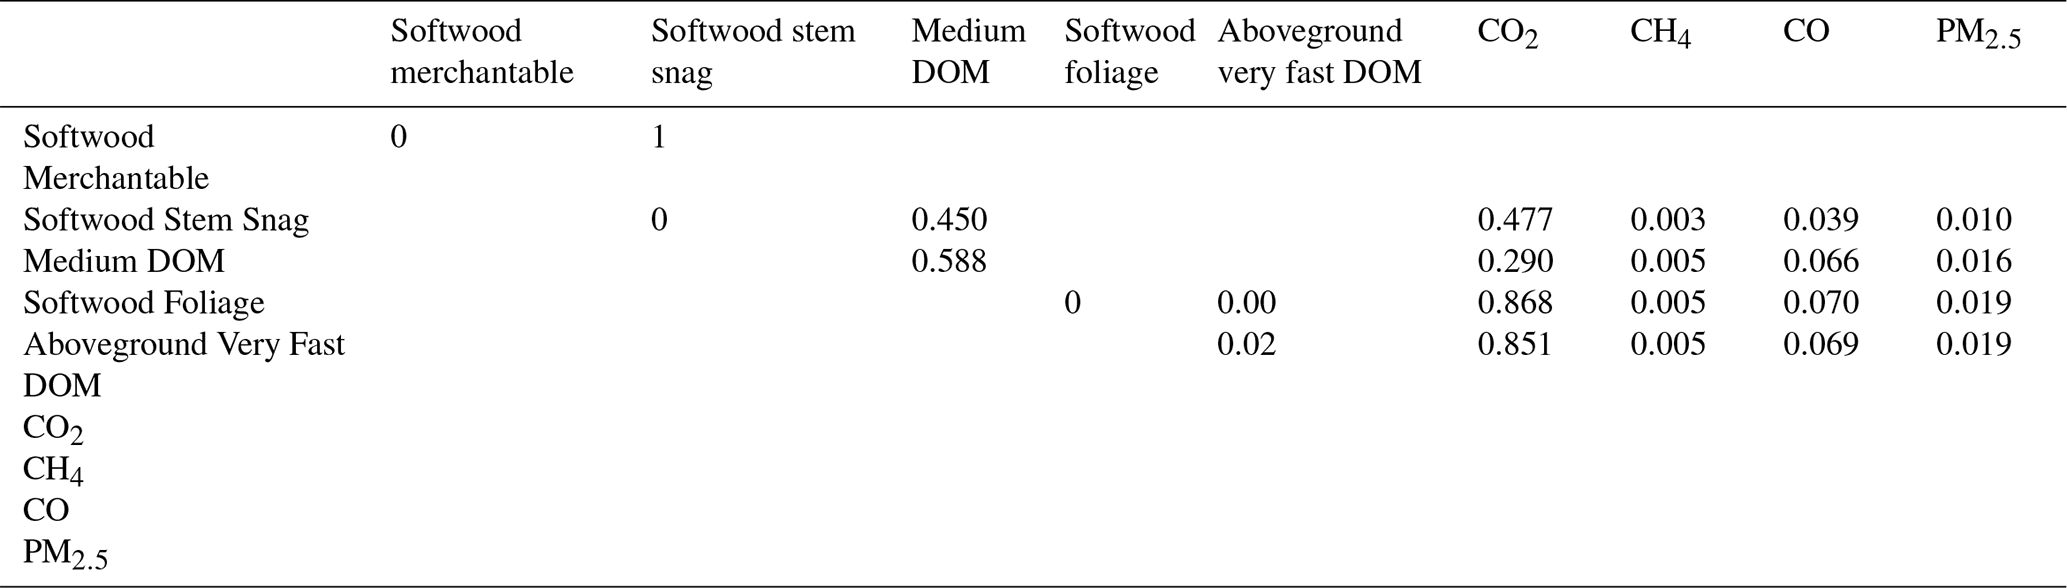
Table A4High severity Disturbance Matrix in TSW. Note: only some biomass and atmospheric pools are shown.
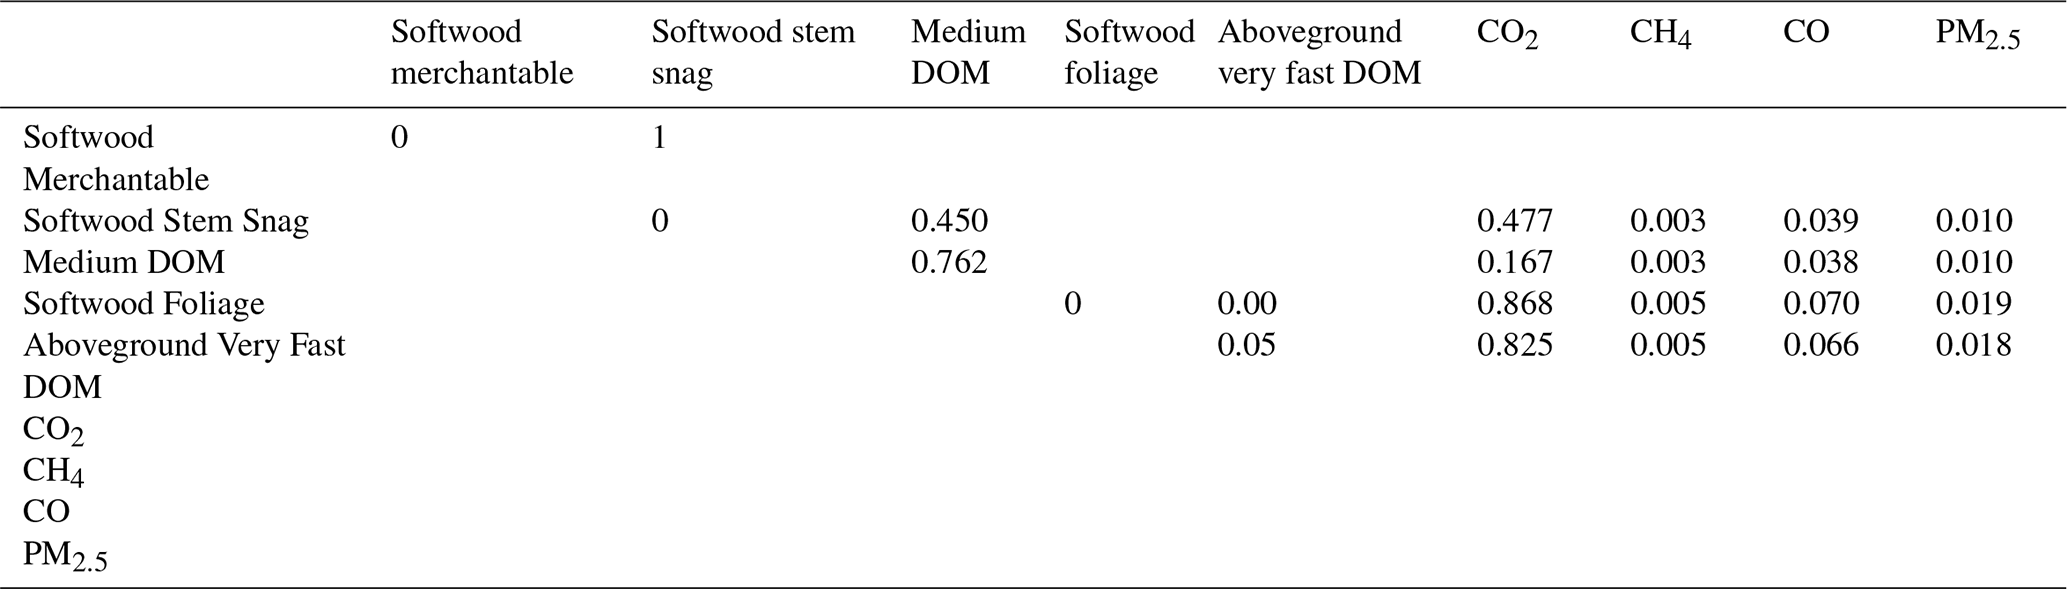
Table A5Mod severity Disturbance Matrix in MC. Note: only some biomass and atmospheric pools are shown.
Alnus spp. Arbutus men. Betula all. Betula pap. Betula pop. Fraxinus ame. Fraxinus nig. Fraxinus pen. Populus bal. Populus gra. Populus tre. Populus tri. Quercus spp. Salix spp.
For national annual estimates of forest organic soil layer consumption during wildfire, implementations that only utilize Canadian experimental fire data from the Fire Behaviour Prediction System will be limited to a maximum consumption value of 5 kg (biomass) m−2 of total surface fuel (woody debris, litter, and duff) of 5 kg m−2, or 25 Mg C ha−1, given the observation dataset and fitted model parameters. For the common “C-2” boreal spruce fuel type for instance, Surface Fuel Consumption, SFC (biomass units in kg m−2 not kg C) is modelled as:
This model form has the distinct advantage of SFC being 0.0 at a BUI of zero. The model parameters vary by fuel type (i.e. deciduous broadleaf fuels are limited to 1.5 kg m−2 of maximum SFC) but are fixed within a fuel type.
More recent observations and modelling from de Groot et al. (2009) extended the FBP data with an additional 128 observations from 7 additional wildfires, and the ABoVE project compiled over 1000 field observations of depth of burn and C stocks before and after wildfire in Canada and Alaska, over 600 of which are in North American Level II ecoregions also occurring in Canada (Walker et al., 2020a). de Groot et al. (2009) provides a concise and informative improvement on the FBP fuel consumption equations, where both a Fire Weather Index System component (in this case, Buildup Index) is used similarly to Buildup Index in the FBP, but importantly, the site-level organic soil layer fuel load is also accounted for, which allows for the greater absolute combustion in deeper organic soils that is moderated by the natural logarithm transformation:
where FFFC is Forest Floor Fuel Consumption (SFC minus surface woody debris) in kg (biomass) m−2 and FFFL is Forest Floor Fuel Load in kg m−2. The forest floor as defined here is inclusive of the litter and duff layers, live mosses and lichens. This model presented above fits well within the dataset and extends the observed maximum FFFC to nearly 10 kg m−2. The ABoVE synthesis of FFFL and FFFC (Walker et al., 2020a) expands upon a slightly smaller dataset used in a modelling summary also by Walker et al. (2020b), where structural equation modelling was used to explore drivers of FFFC but no concise and readily reproducible modelling is produced. The results of the SEM from Walker et al. (2020b) emphasized a greater role of FFFL over DC, though coarse reanalysis that lacked local fire agency weather stations was used. An analysis of just 2014 fires in the Northwest Territories by Walker et al. (2018a) showed that while the mean depth of burn across all black spruce stands was 6–10 cm, the driest (xeric) black spruce stands with the smallest FFFL showed upwards of 75 % soil organic consumption, while deeper organic soils in subhygric black spruce stands showed less than 25 % consumption.
To provide the largest possible dataset for FFFC and FFFL, the ABoVE synthesis was combined with wildfire data from de Groot et al. (2009) not otherwise found in the ABoVE synthesis. The ABoVE synthesis sites in the Alaska Boreal Interior ecoregion, which have equivalent Canadian ecozone were excluded due to the presence of continuous permafrost and deep organic soils, but Alaska Boreal Cordillera sites near the Yukon border were utilized. Experimental fire data from the FBP data was not used, as deeper combustion measurements resulting from hours and days of smouldering combustion captured in wildfire data are not available in experimental fires where extensive smouldering is not measured due to suppression.
For the purposes of improving national estimates of the fractional soil organic layer loss during wildfire, this framework emphasizes the proportional C stock loss (as with all CBM-CFS3 disturbance matrices) rather than the absolute value of combustion. In contrast to the modelling of absolute combustion value, any analysis of proportions is best conducted as logit- transformed data, where the logit transformation is:
which effectively transforms a data of proportions of [0, 1] to a Gaussian distribution with a range of approximately −5 to +5 (in this dataset), and a mode approximately at zero.
In the logit transformed space, saturation-type non-linear curve using the relevant FWI component was fitted in a non-linear least squares model, but an additive term of the natural-logarithm transformed forest floor fuel load (FFFL) (given as AGSlow pool in Mg C ha−1) was used as well. The non-linear least squares model fit was conducted using the Levenberg–Marquardt nonlinear least-squares algorithm found in MINPACK (Elzhov et al., 2023) R package, which supported bounded parameter constraints.
In the abstract, the model follows the form:
with fitted parameters as:
Note the “b” coefficient on the parameter associated with the forest floor fuel load (AGSlow) of −0.53, which results in larger organic layer fuel loads leading to smaller proportional consumption values, which follows the patterns shown by Walker et al. (2018b) for NWT fires of 2014.
The a parameter term that forms the exponent of e alongside the Buildup Index is related to the BUI value at which half of the maximum possible asymptotal consumption value is observed (for a given FFFL value). The NLS fitting was given a minimum value of −0.008 such that a 50 % consumption rate was modelled as occurring at or around a BUI value of 70 for typical upland spruce forest floor (FFFL of 8 kg m−2 or AGSlow of 40 t C ha−1) following the wildfire data of de Groot et al. (2009) as well as experimental fire observations in spruce forests from the FBP System. The other parameters were fit to the best possible value with no constraint.
For example, using a moderately thick ∼12 cm thick organic soil layer, the proportion of consumption as a function of Buildup Index is shown in Fig. C1:
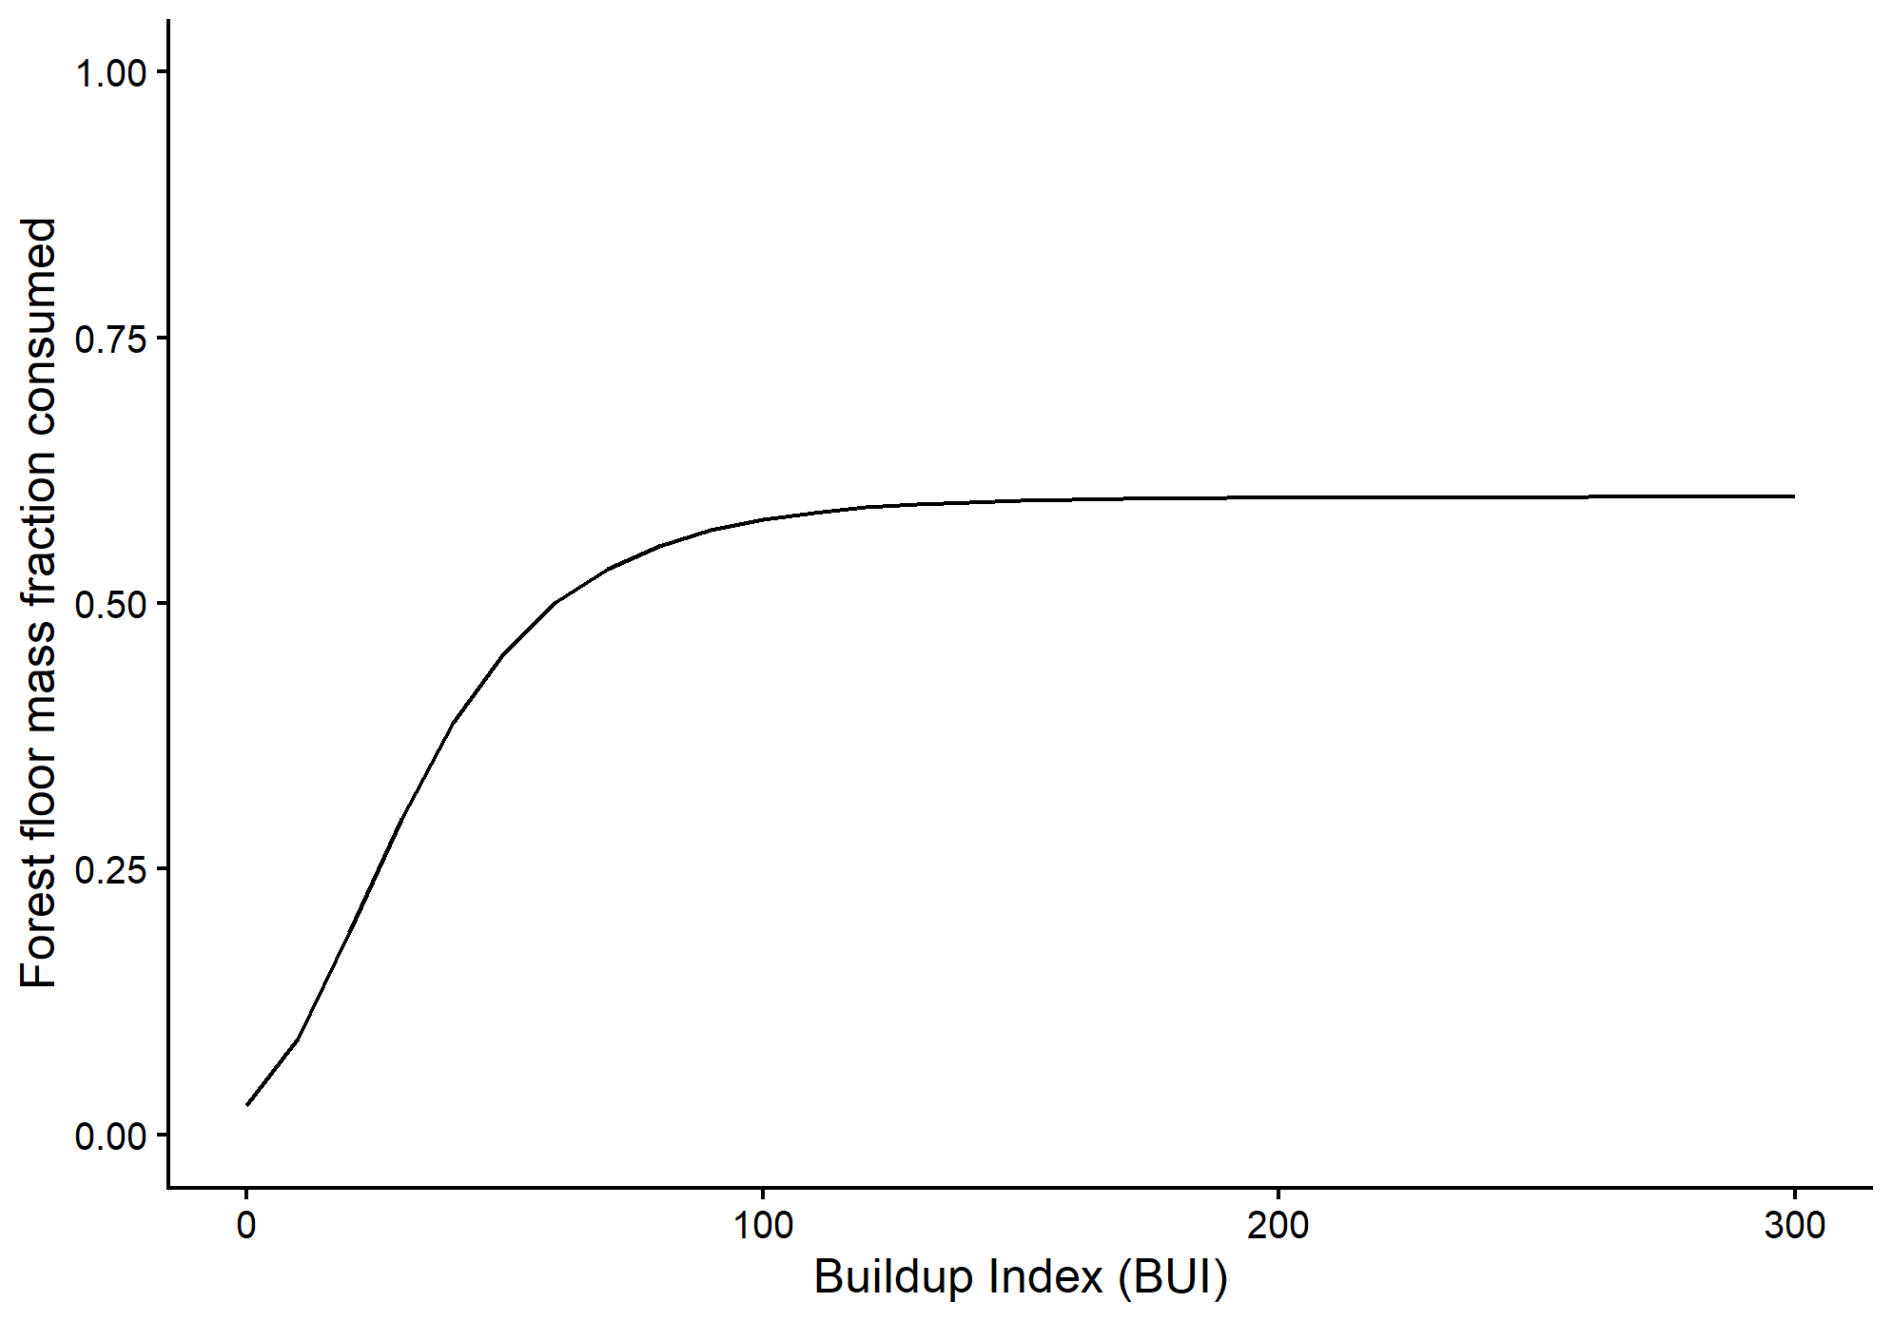
Figure C1Example of the forest floor consumption model for a duff layer (AGSlow) of 60 Mg C ha−1 (12 kg m−2).
With the parameter constrained NLS fitting, the proportional consumption model for the forest floor has a leave-one-out (conducted at the fire-level, not plot) cross validated r2 of 0.52 and a Mean Percent Error of 45 % (Fig. C2).
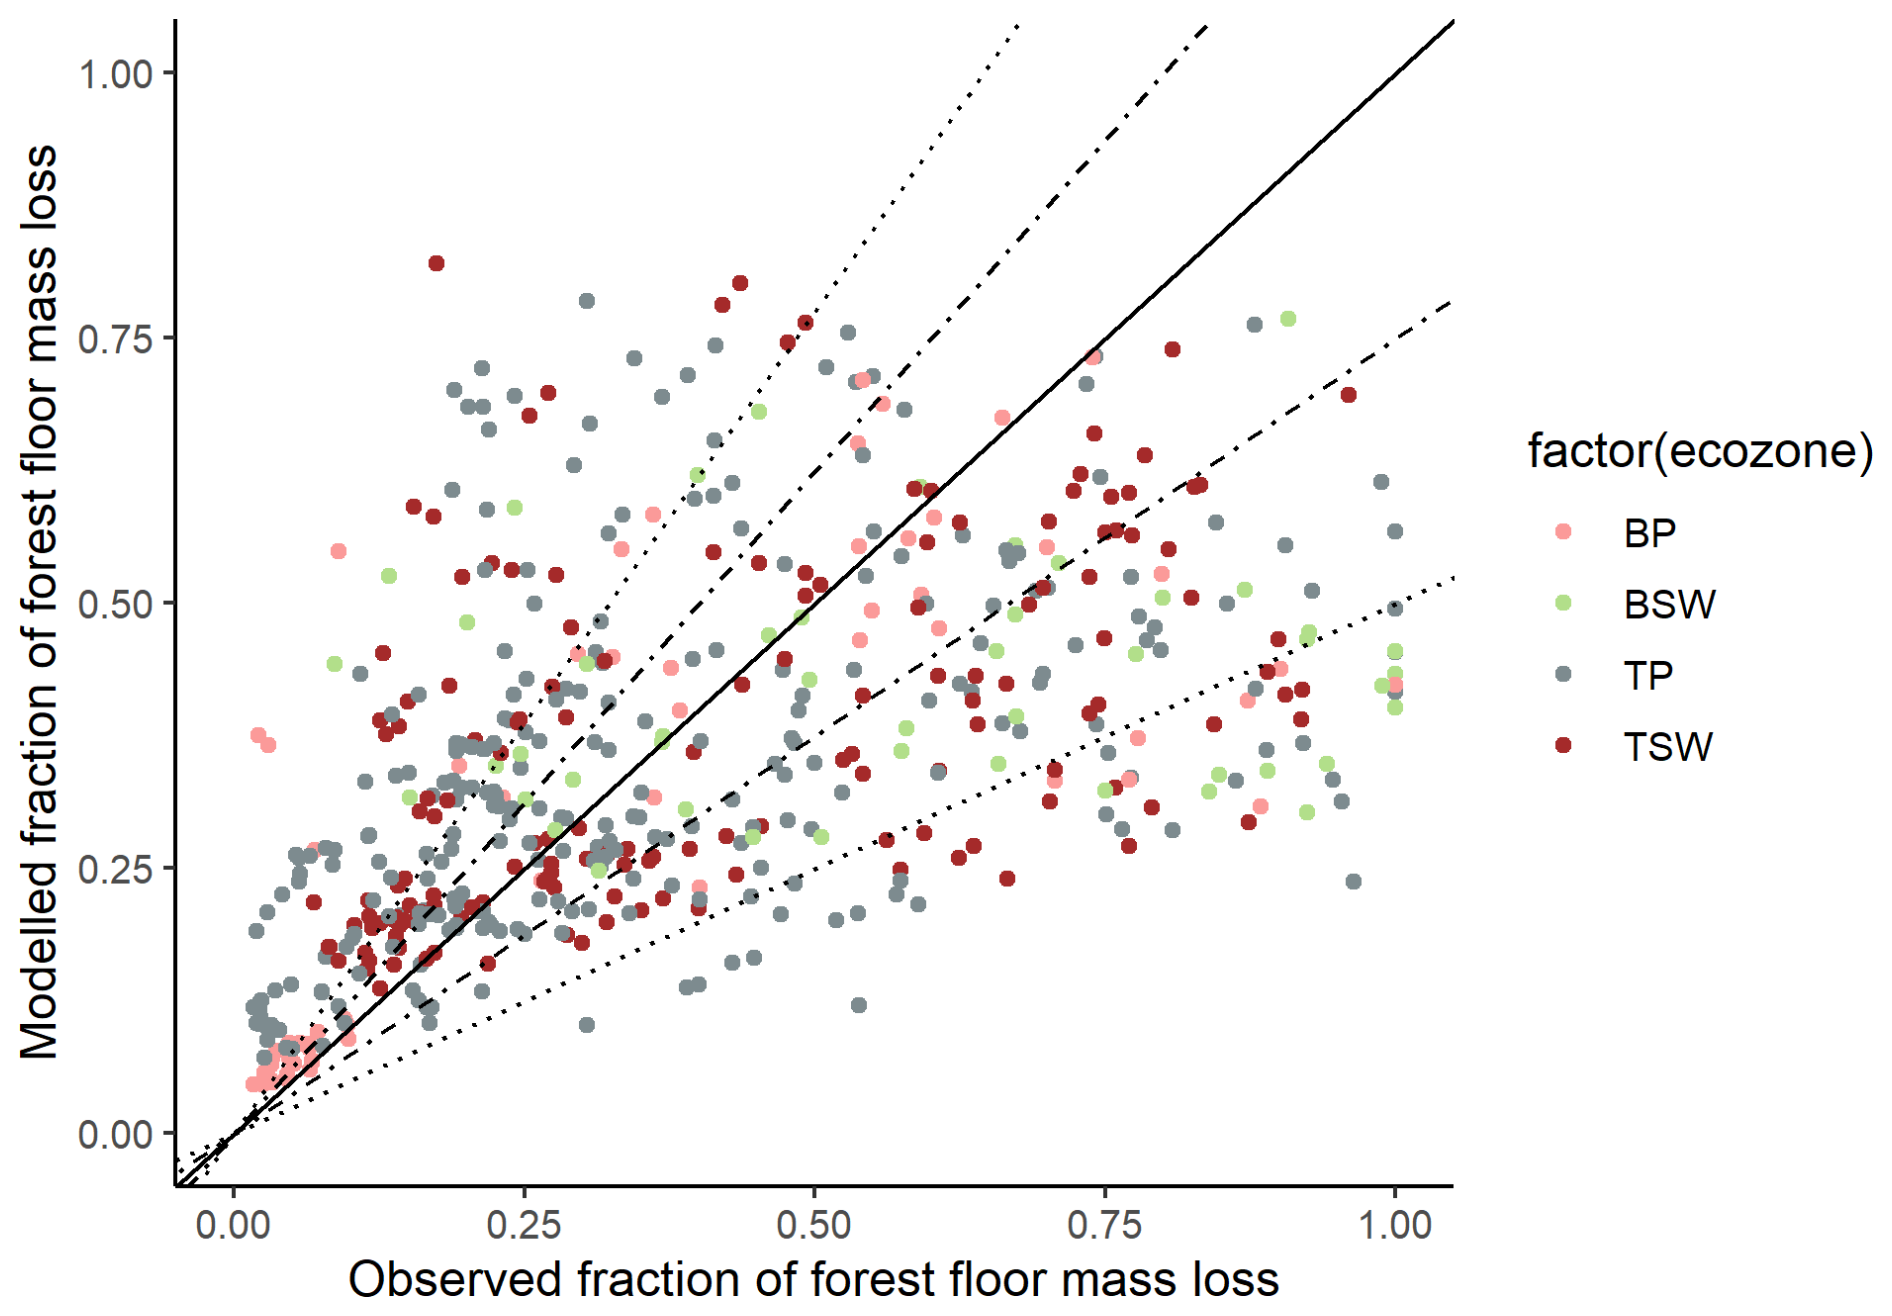
Figure C2Leave one out cross-validation of the forest floor consumption model. Where multiple measurements were conducted within a single fire, the entire fire was excluded from the training data used in the model training. The dotted lines represent an error of plus and minus 25 %.
Across the entire parameter space of Buildup Index and AGSlow pool size, the following isolines of proportional consumption in the model can be plotted (Figs. C3 and C4).
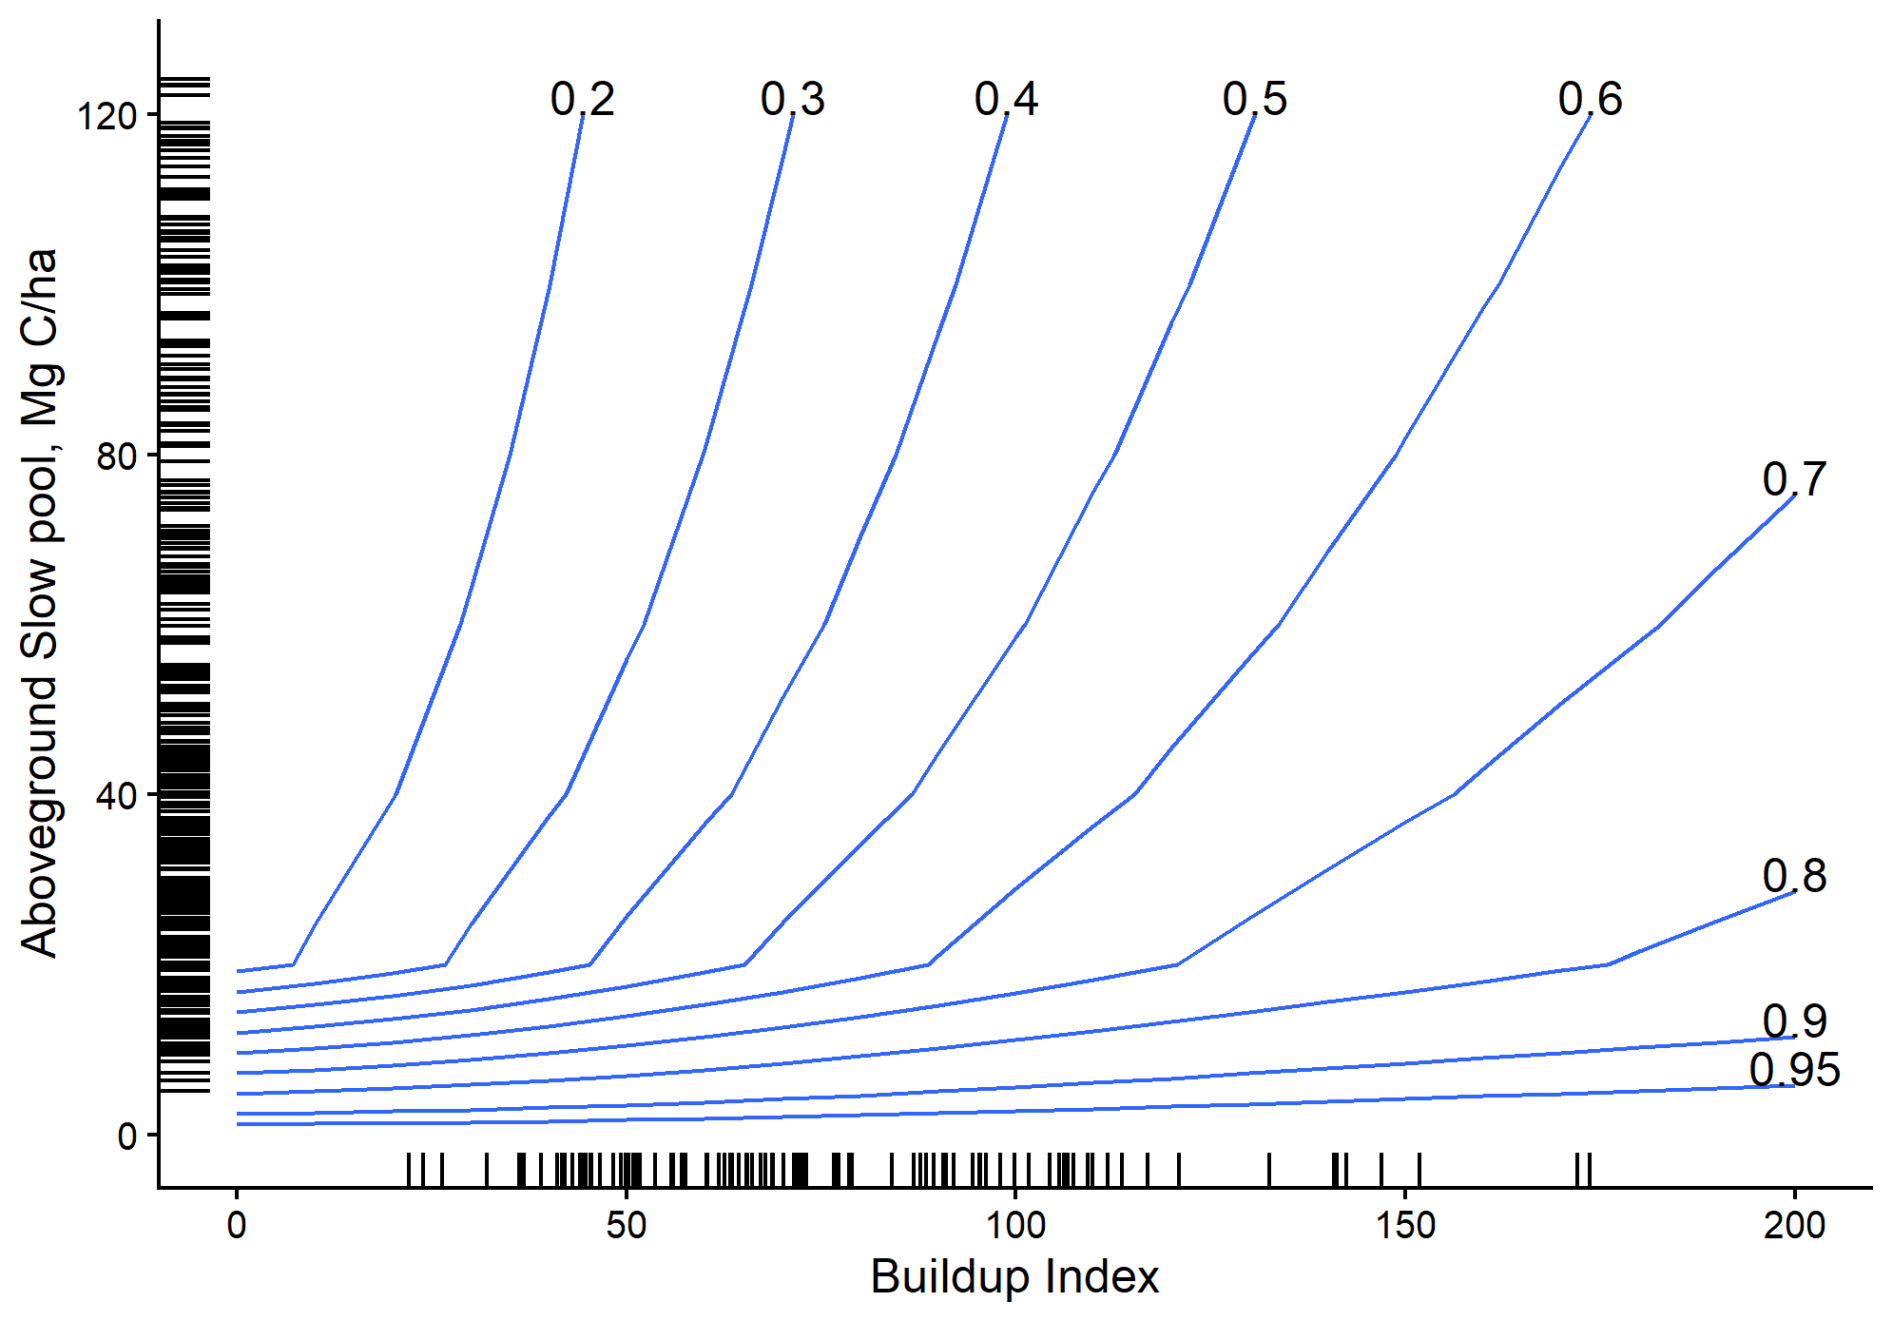
Figure C3Isoline contours of equal organic soil layer consumption fraction as a function of BUI and the organic soil layer carbon pool in Mg C ha−1. Field observations of burn from 547 field measurements across Canada from the Yukon–Alaska border to Manitoba. Rug plots at the axis margins show the marginal density of the data.
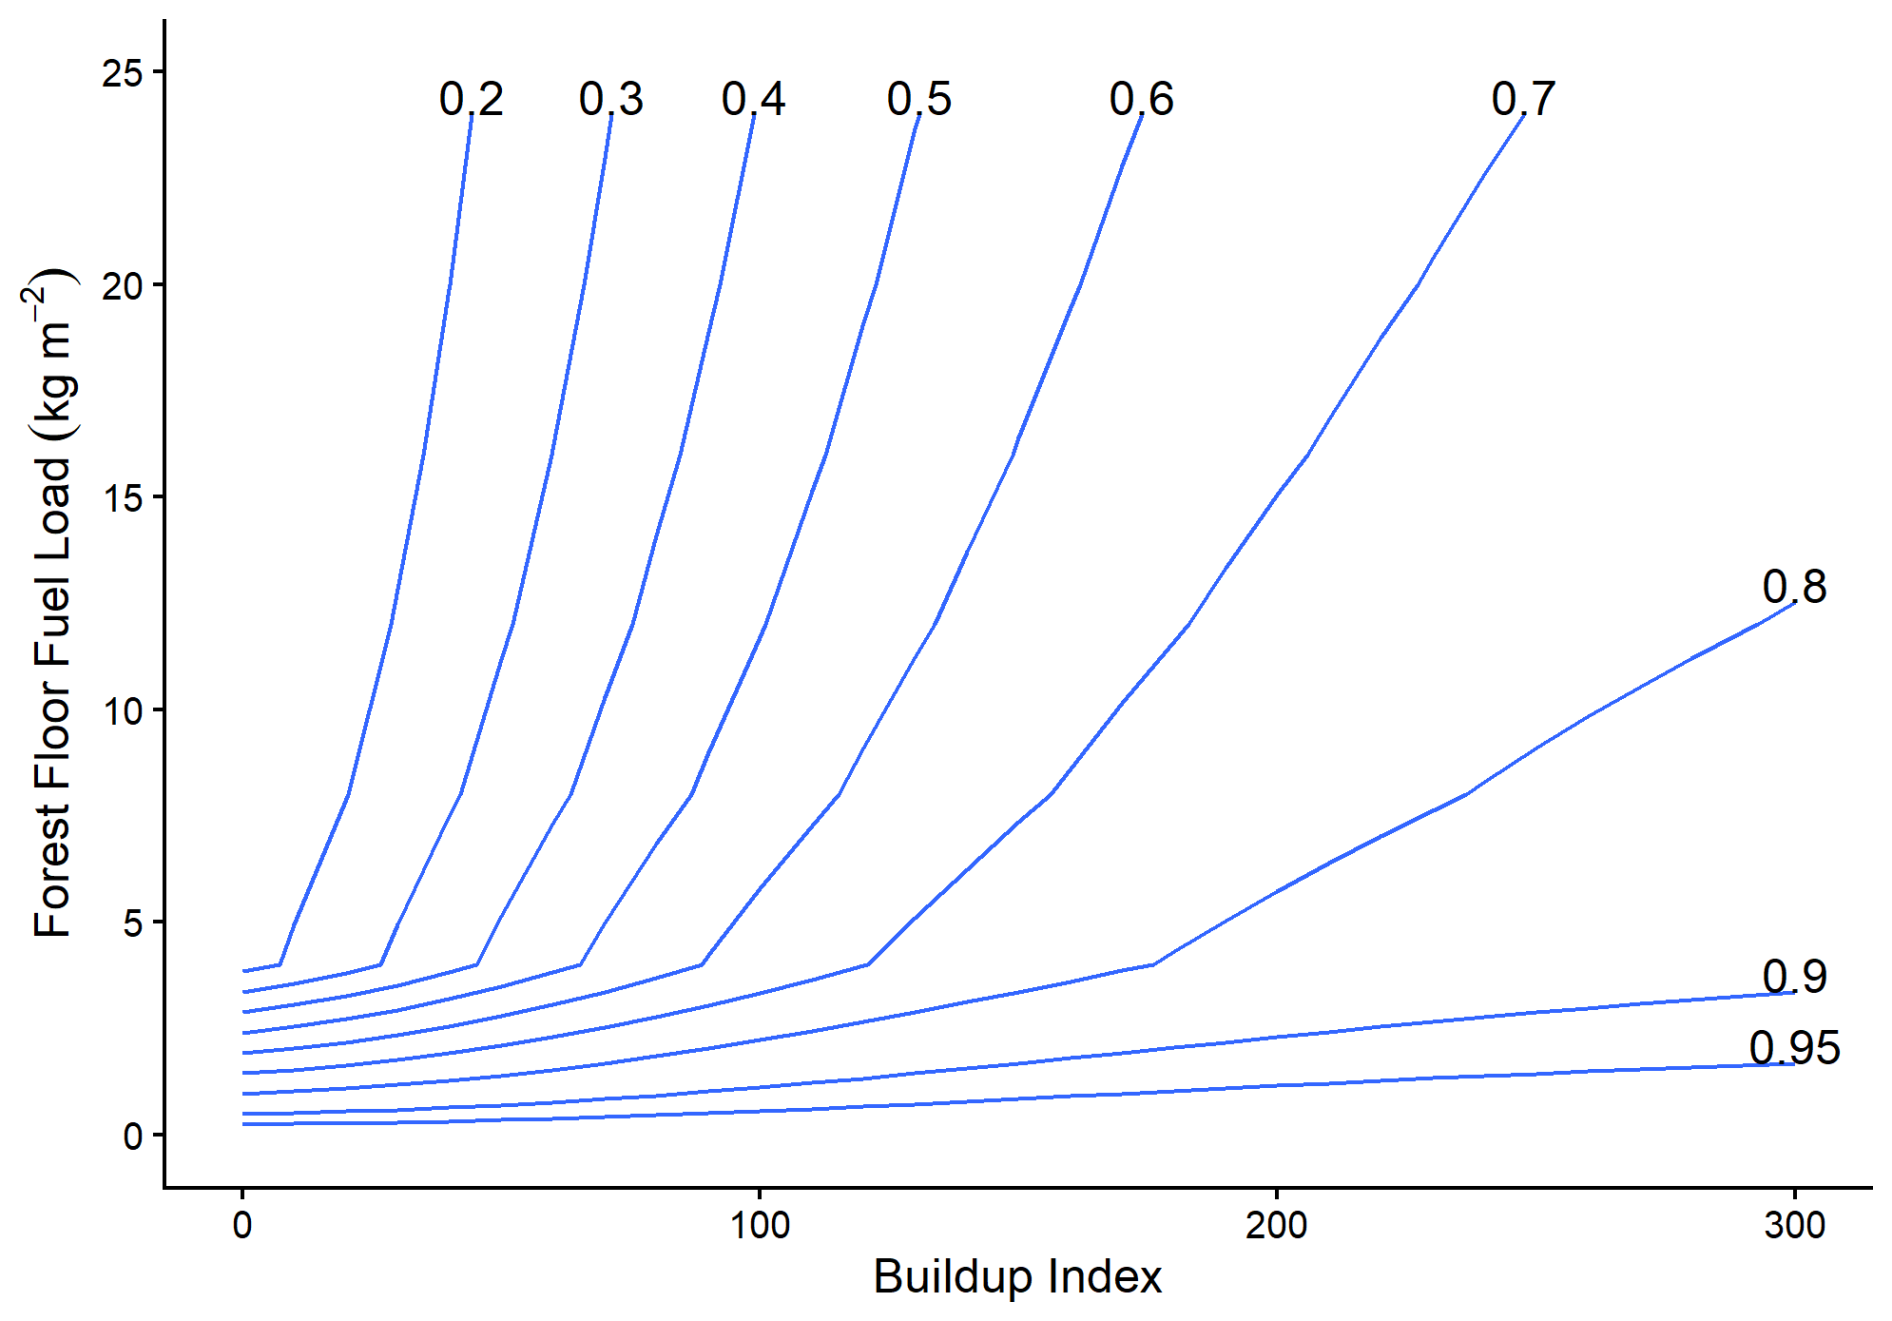
Figure C4Isoline contours of equal organic soil layer consumption fraction as a function of BUI and the organic soil layer Carbon pool in kg m−2. Field observations of burn from 547 field measurements across Canada from the Yukon–Alaska border to Manitoba.
This article was produced from a RMarkdown document with underlying data is available from the Zenodo repository https://doi.org/10.5281/zenodo.17517166 (Thompson and Whitman, 2026). The disturbance matrices were produced in accordance with standards associated with the CBM-CFS3 version 1.2 (July 2025), which is available for download (after user registration) at https://ca.nfis.org/index_eng.html (last access: 24 April 2026). CBM-CFS3 is not open source, and is not re-archived here due to licensing restrictions. Only the free and open source Thompson and Whitman (2026) is required to produce the figures and calculations in this document, and all relevant CBM-CFS3 data for comparison are provided as tabular data in the Thompson and Whitman (2026) repository without the need to run or install CBM-CFS3.
The supplement related to this article is available online at https://doi.org/10.5194/gmd-19-3617-2026-supplement.
DKT, EW, and BH conceived the initial framework. DKT wrote the algorithm. EW analyzed and compiled input data. HF, VMG, OH, CH, and BH assisted in model development and algorithm review. DKT, EW, and BH drafted the manuscript. All authors contributed manuscript revisions and approved of the final version.
The contact author has declared that none of the authors has any competing interests.
Publisher's note: Copernicus Publications remains neutral with regard to jurisdictional claims made in the text, published maps, institutional affiliations, or any other geographical representation in this paper. The authors bear the ultimate responsibility for providing appropriate place names. Views expressed in the text are those of the authors and do not necessarily reflect the views of the publisher.
The authors would like to thank Werner A. Kurz (retired) for initiating this project during his role as the head of Canada's forest carbon accounting team.
This paper was edited by Yilong Wang and reviewed by two anonymous referees.
Akagi, S. K., Yokelson, R. J., Wiedinmyer, C., Alvarado, M. J., Reid, J. S., Karl, T., Crounse, J. D., and Wennberg, P. O.: Emission factors for open and domestic biomass burning for use in atmospheric models, Atmos. Chem. Phys., 11, 4039–4072, https://doi.org/10.5194/acp-11-4039-2011, 2011. a
Alexander, M. E.: Surface fire spread potential in trembling aspen during summer in the Boreal Forest Region of Canada, Forest. Chronic., 86, 200–212, https://doi.org/10.5558/tfc86200-2, 2010. a
Andreae, M. O.: Emission of trace gases and aerosols from biomass burning – an updated assessment, Atmos. Chem. Phys., 19, 8523–8546, https://doi.org/10.5194/acp-19-8523-2019, 2019. a
Angers, V. A., Gauthier, S., Drapeau, P., Jayen, K., Bergeron, Y., Angers, V. A., Gauthier, S., Drapeau, P., Jayen, K., and Bergeron, Y.: Tree mortality and snag dynamics in North American boreal tree species after a wildfire: a long-term study, Int. J. Wildland Fire, 20, 751–763, https://doi.org/10.1071/WF10010, 2011. a, b, c, d
Barber, Q. E., Jain, P., Whitman, E., Thompson, D. K., Guindon, L., Parks, S. A., Wang, X., Hethcoat, M. G., and Parisien, M.-A.: The Canadian Fire Spread Dataset, Sci. Data, 11, 764, https://doi.org/10.1038/s41597-024-03436-4, 2024. a, b
Beilman, D. W., Vitt, D. H., Bhatti, J. S., and Forest, S.: Peat carbon stocks in the southern Mackenzie River Basin: uncertainties revealed in a high-resolution case study, Global Change Biol., 14, 1221–1232, https://doi.org/10.1111/j.1365-2486.2008.01565.x, 2008. a
Benscoter, B. W., Thompson, D. K., Waddington, J. M., Flannigan, M. D., Wotton, B. M., d. Groot, W. J., and Turetsky, M. R.: Interactive effects of vegetation, soil moisture and bulk density on depth of burning of thick organic soils, Int. J. Wildland Fire, 20, 418–429, https://doi.org/10.1071/WF08183, 2011. a
Bernier, P. Y., Gauthier, S., Jean, P.-O., Manka, F., Boulanger, Y., Beaudoin, A., and Guindon, L.: Mapping Local Effects of Forest Properties on Fire Risk across Canada, Forests, 7, 157, https://doi.org/10.3390/f7080157, 2016. a, b
Binte Shahid, S., Lacey, F. G., Wiedinmyer, C., Yokelson, R. J., and Barsanti, K. C.: NEIVAv1.0: Next-generation Emissions InVentory expansion of Akagi et al. (2011) version 1.0, Geosci. Model Dev., 17, 7679–7711, https://doi.org/10.5194/gmd-17-7679-2024, 2024. a
Bona, K. A., Shaw, C., Thompson, D. K., Hararuk, O., Webster, K., Zhang, G., Voicu, M., and Kurz, W. A.: The Canadian model for peatlands (CaMP): A peatland carbon model for national greenhouse gas reporting, Ecol. Model., 431, 109164, https://doi.org/10.1016/j.ecolmodel.2020.109164, 2020. a, b, c
Bona, K. A., Webster, K. L., Thompson, D. K., Hararuk, O., Zhang, G., and Kurz, W. A.: Using the Canadian Model for Peatlands (CaMP) to examine greenhouse gas emissions and carbon sink strength in Canada’s boreal and temperate peatlands, Ecol. Model., 490, 110633, https://doi.org/10.1016/j.ecolmodel.2024.110633, 2024. a
Boulanger, Y., Sirois, L., and Hébert, C.: Fire severity as a determinant factor of the decomposition rate of fire-killed black spruce in the northern boreal forest, Can. J. Forest Res., 41, 370–379, https://doi.org/10.1139/X10-218, 2011. a
Boulanger, Y., Arseneault, D., Bélisle, A. C., Bergeron, Y., Boucher, J., Boucher, Y., Danneyrolles, V., Erni, S., Gachon, P., Girardin, M. P., Grant, E., Grondin, P., Jetté, J.-P., Labadie, G., Leblond, M., Leduc, A., Puigdevall, J. P., St-Laurent, M.-H., Tremblay, J., and Waldron, K.: The 2023 wildfire season in Québec: an overview of extreme conditions, impacts, lessons learned and considerations for the future, Can. J. Forest Res., 55, https://doi.org/10.1139/cjfr-2023-0298, 2024. a, b
Bourgeau-Chavez, L. L., Grelik, S. L., Billmire, M., Jenkins, L. K., Kasischke, E. S., and Turetsky, M. R.: Mapping Boreal Peatland Fire Severity and Assessing their Potential Vulnerability to Early Season Wildland Fire, Front. Forests Global Change, 3, https://doi.org/10.3389/ffgc.2020.00020, 2020. a
Brecka, A. F. J., Boulanger, Y., Searle, E. B., Taylor, A. R., Price, D. T., Zhu, Y., Shahi, C., and Chen, H. Y. H.: Sustainability of Canada's forestry sector may be compromised by impending climate change, Forest Ecol. Manage., 474, 118352, https://doi.org/10.1016/j.foreco.2020.118352, 2020. a
Brown, J. K. and DeByle, N. V.: Fire damage, mortality, and suckering in aspen, Can. J. Forest Res., 17, 1100–1109, https://doi.org/10.1139/x87-168, 1987. a, b
Byrne, B., Liu, J., Bowman, K. W., Pascolini-Campbell, M., Chatterjee, A., Pandey, S., Miyazaki, K., van der Werf, G. R., Wunch, D., Wennberg, P. O., Roehl, C. M., and Sinha, S.: Carbon emissions from the 2023 Canadian wildfires, Nature, 633, 835–839, https://doi.org/10.1038/s41586-024-07878-z, 2024. a, b, c, d
Chen, J., Anderson, K., Pavlovic, R., Moran, M. D., Englefield, P., Thompson, D. K., Munoz-Alpizar, R., and Landry, H.: The FireWork v2.0 air quality forecast system with biomass burning emissions from the Canadian Forest Fire Emissions Prediction System v2.03, Geosci. Model Dev., 12, 3283–3310, https://doi.org/10.5194/gmd-12-3283-2019, 2019. a, b, c, d, e, f, g
Clark, T. L., Radke, L., Coen, J., and Middleton, D.: Analysis of Small-Scale Convective Dynamics in a Crown Fire Using Infrared Video Camera Imagery, J. Appl. Meteorol., 38, 1401–1420, https://doi.org/10.1175/1520-0450(1999)038<1401:AOSSCD>2.0.CO;2, 1999. a
Cocke, A. E., Fulé, P. Z., and Crouse, J. E.: Comparison of burn severity assessments using Differenced Normalized Burn Ratio and ground data, Int. J. Wildland Fire, 14, 189–198, https://doi.org/10.1071/WF04010, 2005. a
Coen, J. L., Schroeder, W., and Quayle, B.: The Generation and Forecast of Extreme Winds during the Origin and Progression of the 2017 Tubbs Fire, Atmosphere, 9, 462, https://doi.org/10.3390/atmos9120462, 2018. a
Cumming, S. G.: Effective fire suppression in boreal forests, Can. J. Forest Res., 35, 772–786, https://doi.org/10.1139/x04-174, 2005. a
Davies, G. M., Domènech, R., Gray, A., and Johnson, P. C. D.: Vegetation structure and fire weather influence variation in burn severity and fuel consumption during peatland wildfires, Biogeosciences, 13, 389–398, https://doi.org/10.5194/bg-13-389-2016, 2016. a
de Groot, W., Pritchard, J., and Lynham, T.: Forest floor fuel consumption and carbon emissions in Canadian boreal forest fires, Can. J. Forest Res., 39, 367–382, https://doi.org/10.1139/X08-192, 2009. a, b, c, d, e, f, g
de Groot, W., Flannigan, M. D., and Cantin, A. S.: Climate change impacts on future boreal fire regimes, Forest Ecol. Manage., 294, 35–44, https://doi.org/10.1016/j.foreco.2012.09.027, 2013. a
de Groot, W., Hanes, C. C., and Wang, Y.: Crown fuel consumption in Canadian boreal forest fires, Int. J. Wildland Fire, https://doi.org/10.1071/WF21049, 2022. a, b
Eidenshink, J., Schwind, B., Brewer, K., Zhu, Z.-L., Quayle, B., and Howard, S.: A Project for Monitoring Trends in Burn Severity, Fire Ecol., 3, 3–21, https://doi.org/10.4996/fireecology.0301003, 2007. a
Elzhov, T. V., Mullen, K. M., Spiess, A.-N., and Bolker, B.: minpack.lm: R Interface to the Levenberg-Marquardt Nonlinear Least-Squares Algorithm Found in MINPACK, Plus Support for Bounds, https://cran.r-project.org/web/packages/minpack.lm/index.html (last access: 24 April 2026), 2023. a
Forestry Canada Fire Danger Group: Development and structure of the Canadian Forest Fire Behavior Prediction System, vol. ST-X-3, Forestry Canada, ISBN 0-662-19812-3, https://ostrnrcan-dostrncan.canada.ca/handle/1845/235421 (last access: 24 April 2026), 1992. a, b, c, d
French, N. H. F., Graham, J., Whitman, E., and Bourgeau-Chavez, L. L.: Quantifying surface severity of the 2014 and 2015 fires in the Great Slave Lake area of Canada, Int. J. Wildland Fire, 29, 892–906, https://doi.org/10.1071/WF20008, 2020. a, b
Gibson, C. M., Chasmer, L. E., Thompson, D. K., Quinton, W. L., Flannigan, M. D., and Olefeldt, D.: Wildfire as a major driver of recent permafrost thaw in boreal peatlands, Nat. Commun., 9, 1–9, https://doi.org/10.1038/s41467-018-05457-1, 2018. a
Gibson, C. M., Estop-Aragonés, C., Flannigan, M., Thompson, D. K., and Olefeldt, D.: Increased deep soil respiration detected despite reduced overall respiration in permafrost peat plateaus following wildfire, Environ. Res. Lett., 14, 125001, https://doi.org/10.1088/1748-9326/ab4f8d, 2019. a
Griffin, D., Chen, J., Anderson, K., Makar, P., McLinden, C. A., Dammers, E., and Fogal, A.: Biomass burning CO emissions: exploring insights through TROPOMI-derived emissions and emission coefficients, Atmos. Chem. Phys., 24, 10159–10186, https://doi.org/10.5194/acp-24-10159-2024, 2024. a
Guindon, L., Bernier, P., Beaudoin, A., Pouliot, D., Villemaire, P., Hall, R., Latifovic, R., and St-Amant, R.: Annual mapping of large forest disturbances across Canada's forests using 250 m MODIS imagery from 2000 to 2011, Can. J. Forest Res., 44, 1545–1554, https://doi.org/10.1139/cjfr-2014-0229, 2014. a
Guindon, L., Gauthier, S., Manka, F., Parisien, M., Whitman, D. E., Bernier, P., Beaudoin, A., Villemaire, P., and Skakun, R.: Trends in wildfire burn severity across Canada, 1985 to 2015, Can. J. Forest Res., 51, https://doi.org/10.1139/cjfr-2020-0353, 2020. a
Guindon, L., Manka, F., Correia, D. L., Villemaire, P., Smiley, B., Bernier, P., Gauthier, S., Beaudoin, A., Boucher, J., and Boulanger, Y.: A new approach for Spatializing the CAnadian National Forest Inventory (SCANFI) using Landsat dense time series, Can. J. Forest Res., 54, https://doi.org/10.1139/cjfr-2023-0118, 2024. a
Hall, R. J., Freeburn, J. T., Groot, W. J. d., Pritchard, J. M., Lynham, T. J., and Landry, R.: Remote sensing of burn severity: experience from western Canada boreal fires, Int. J. Wildland Fire, 17, 476–489, https://doi.org/10.1071/WF08013, 2008. a, b, c
Hall, R. J., Skakun, R. S., Metsaranta, J. M., Landry, R., Fraser, R. H., Raymond, D., Gartrell, M., Decker, V., and Little, J.: Generating annual estimates of forest fire disturbance in Canada: the National Burned Area Composite, Int. J. Wildland Fire, 29, 878–891, https://doi.org/10.1071/WF19201, 2020. a, b, c
Hanes, C. C., Wang, X., Jain, P., Parisien, M.-A., Little, J. M., and Flannigan, M. D.: Fire-regime changes in Canada over the last half century, Can. J. Forest Res., 49, 256–269, https://doi.org/10.1139/cjfr-2018-0293, 2019. a
Hanes, C. C., Wang, X., and d. Groot, W. J.: Dead and down woody debris fuel loads in Canadian forests, Int. J. Wildland Fire, 30, 871–885, https://doi.org/10.1071/WF21023, 2021. a
Hanes, C. C., Wotton, M., Woolford, D. G., Martell, D. L., and Flannigan, M.: Mapping organic layer thickness and fuel load of the boreal forest in Alberta, Canada, Geoderma, 417, 115827, https://doi.org/10.1016/j.geoderma.2022.115827, 2022. a
Hanes, C. C., Wotton, M., Bourgeau-Chavez, L., Woolford, D. G., Bélair, S., Martell, D., and Flannigan, M. D.: Evaluation of new methods for drought estimation in the Canadian Forest Fire Danger Rating System, Int. J. Wildland Fire, 32, 836–853, https://doi.org/10.1071/WF22112, 2023. a
Hayden, K. L., Li, S.-M., Liggio, J., Wheeler, M. J., Wentzell, J. J. B., Leithead, A., Brickell, P., Mittermeier, R. L., Oldham, Z., Mihele, C. M., Staebler, R. M., Moussa, S. G., Darlington, A., Wolde, M., Thompson, D., Chen, J., Griffin, D., Eckert, E., Ditto, J. C., He, M., and Gentner, D. R.: Reconciling the total carbon budget for boreal forest wildfire emissions using airborne observations, Atmos. Chem. Phys., 22, 12493–12523, https://doi.org/10.5194/acp-22-12493-2022, 2022. a
Héon, J., Arseneault, D., and Parisien, M.-A.: Resistance of the boreal forest to high burn rates, P. Natl. Acad. Sci. USA, 111, 13888–13893, https://doi.org/10.1073/pnas.1409316111, 2014. a
Hessburg, P. F., Miller, C. L., Parks, S. A., Povak, N. A., Taylor, A. H., Higuera, P. E., Prichard, S. J., North, M. P., Collins, B. M., Hurteau, M. D., Larson, A. J., Allen, C. D., Stephens, S. L., Rivera-Huerta, H., Stevens-Rumann, C. S., Daniels, L. D., Gedalof, Z., Gray, R. W., Kane, V. R., Churchill, D. J., Hagmann, R. K., Spies, T. A., Cansler, C. A., Belote, R. T., Veblen, T. T., Battaglia, M. A., Hoffman, C., Skinner, C. N., Safford, H. D., and Salter, R. B.: Climate, Environment, and Disturbance History Govern Resilience of Western North American Forests, Front. Ecol. Evol., 7, https://doi.org/10.3389/fevo.2019.00239, 2019. a
Holden, S. R., Berhe, A. A., and Treseder, K. K.: Decreases in soil moisture and organic matter quality suppress microbial decomposition following a boreal forest fire, Soil Biol. Biochem., 87, 1–9, https://doi.org/10.1016/j.soilbio.2015.04.005, 2015. a
Hood, S. and Lutes, D.: Predicting Post-Fire Tree Mortality for 12 Western US Conifers Using the First Order Fire Effects Model (FOFEM), Fire Ecol., 13, 66–84, https://doi.org/10.4996/fireecology.130290243, 2017. a, b
Hornbrook, R. S., Blake, D. R., Diskin, G. S., Fried, A., Fuelberg, H. E., Meinardi, S., Mikoviny, T., Richter, D., Sachse, G. W., Vay, S. A., Walega, J., Weibring, P., Weinheimer, A. J., Wiedinmyer, C., Wisthaler, A., Hills, A., Riemer, D. D., and Apel, E. C.: Observations of nonmethane organic compounds during ARCTAS – Part 1: Biomass burning emissions and plume enhancements, Atmos. Chem. Phys., 11, 11103–11130, https://doi.org/10.5194/acp-11-11103-2011, 2011. a, b, c, d, e
Huang, X. and Rein, G.: Downward spread of smouldering peat fire: the role of moisture, density and oxygen supply, Int. J. Wildland Fire, 26, 907–918, https://doi.org/10.1071/WF16198, 2017. a
Huda, Q., Lyder, D., Collins, M., Schroeder, D., Thompson, D. K., Marshall, G., Leon, A. J., Hidalgo, K., and Hossain, M.: Study of Fuel-Smoke Dynamics in a Prescribed Fire of Boreal Black Spruce Forest through Field-Deployable Micro Sensor Systems, Fire, 3, 30, https://doi.org/10.3390/fire3030030, 2020. a
Jain, P., Barber, Q. E., Taylor, S. W., Whitman, E., Castellanos Acuna, D., Boulanger, Y., Chavardès, R. D., Chen, J., Englefield, P., Flannigan, M., Girardin, M. P., Hanes, C. C., Little, J., Morrison, K., Skakun, R. S., Thompson, D. K., Wang, X., and Parisien, M.-A.: Drivers and Impacts of the Record-Breaking 2023 Wildfire Season in Canada, Nat. Commun., 15, 6764, https://doi.org/10.1038/s41467-024-51154-7, 2024. a, b, c, d, e
Jones, M. W., Kelley, D. I., Burton, C. A., Di Giuseppe, F., Barbosa, M. L. F., Brambleby, E., Hartley, A. J., Lombardi, A., Mataveli, G., McNorton, J. R., Spuler, F. R., Wessel, J. B., Abatzoglou, J. T., Anderson, L. O., Andela, N., Archibald, S., Armenteras, D., Burke, E., Carmenta, R., Chuvieco, E., Clarke, H., Doerr, S. H., Fernandes, P. M., Giglio, L., Hamilton, D. S., Hantson, S., Harris, S., Jain, P., Kolden, C. A., Kurvits, T., Lampe, S., Meier, S., New, S., Parrington, M., Perron, M. M. G., Qu, Y., Ribeiro, N. S., Saharjo, B. H., San-Miguel-Ayanz, J., Shuman, J. K., Tanpipat, V., van der Werf, G. R., Veraverbeke, S., and Xanthopoulos, G.: State of Wildfires 2023–2024, Earth Syst. Sci. Data, 16, 3601–3685, https://doi.org/10.5194/essd-16-3601-2024, 2024. a
Kaiser, J. W., Heil, A., Andreae, M. O., Benedetti, A., Chubarova, N., Jones, L., Morcrette, J.-J., Razinger, M., Schultz, M. G., Suttie, M., and van der Werf, G. R.: Biomass burning emissions estimated with a global fire assimilation system based on observed fire radiative power, Biogeosciences, 9, 527–554, https://doi.org/10.5194/bg-9-527-2012, 2012. a
Kasischke, E. S., O'Neill, K. P., French, N. H. F., and Bourgeau-Chavez, L. L.: Controls on Patterns of Biomass Burning in Alaskan Boreal Forests, Springer, 173–196, ISBN 978-0-387-21629-4, https://doi.org/10.1007/978-0-387-21629-4_10, 2000. a
Key, C. H. and Benson, N. C.: Landscape Assessment (LA), in: FIREMON: Fire effects monitoring and inventory system, Gen. Tech. Rep. RMRS-GTR-164-CD, edited by: Lutes, D. C., Keane, R. E., Caratti, J. F., Key, C. H., Benson, N. C., Sutherland, S., and Gangi, L. J., Department of Agriculture, Forest Service, Rocky Mountain Research Station. Fort Collins, CO, USA, LA-1-55, 164, https://www.fs.usda.gov/treesearch/pubs/24066 (last access: 24 April 2026), 2006. a, b
Kuntzemann, C. E., Whitman, E., Stralberg, D., Parisien, M.-A., Thompson, D. K., and Nielsen, S. E.: Peatlands promote fire refugia in boreal forests of northern Alberta, Canada, Ecosphere, 14, e4510, https://doi.org/10.1002/ecs2.4510, 2023. a
Kurz, W. A., Apps, M., Banfield, E., and Stinson, G.: Forest carbon accounting at the operational scale, Forest. Chronic., 78, 672–679, https://doi.org/10.5558/tfc78672-5, 2002. a
Kurz, W. A., Dymond, C. C., White, T. M., Stinson, G., Shaw, C. H., Rampley, G. J., Smyth, C., Simpson, B. N., Neilson, E. T., Trofymow, J. A., Metsaranta, J., and Apps, M. J.: CBM-CFS3: A model of carbon-dynamics in forestry and land-use change implementing IPCC standards, Ecol. Model., 220, 480–504, https://doi.org/10.1016/j.ecolmodel.2008.10.018, 2009. a, b
Letang, D. and de Groot, W.: Forest floor depths and fuel loads in upland Canadian forests, Can. J. Forest Res., 42, 1551–1565, https://doi.org/10.1139/x2012-093, 2012. a, b, c, d
Linn, R. R., Goodrick, S. L., Brambilla, S., Brown, M. J., Middleton, R. S., O'Brien, J. J., and Hiers, J. K.: QUIC-fire: A fast-running simulation tool for prescribed fire planning, Environ. Model. Softw., 125, 104616, https://doi.org/10.1016/j.envsoft.2019.104616, 2020. a
McAlpine, R. S.: Testing the Effect of Fuel Consumption on Fire Spread Rate, Int. J. Wildland Fire, 5, 143–152, https://doi.org/10.1071/wf9950143, 1995. a
McRae, D. J., Lynham, T. J., and Frech, R. J.: Understory prescribed burning in red pine and white pine, Forest. Chronic., 70, 395–401, https://doi.org/10.5558/tfc70395-4, 1994. a
McRae, D. J., Stocks, B. J., Mason, J. A., Lynham, T. J., Blake, T. W., and Hanes, C. C.: Influence of ignition type on fire behavior in semi-mature jack pine, Information Report GLC-X-19, https://ostrnrcan-dostrncan.canada.ca/handle/1845/236967 (last access: 24 April 2026), 2017. a
Melton, J. R., Arora, V. K., Wisernig-Cojoc, E., Seiler, C., Fortier, M., Chan, E., and Teckentrup, L.: CLASSIC v1.0: the open-source community successor to the Canadian Land Surface Scheme (CLASS) and the Canadian Terrestrial Ecosystem Model (CTEM) – Part 1: Model framework and site-level performance, Geosci. Model Dev., 13, 2825–2850, https://doi.org/10.5194/gmd-13-2825-2020, 2020. a
Michaletz, S. T. and Johnson, E. A.: A heat transfer model of crown scorch in forest fires, Can. J. Forest Res., 36, 2839–2851, https://doi.org/10.1139/x06-158, 2006. a
O'Donnell, J. A., Harden, J. W., McGUIRE, A. D., Kanevskiy, M. Z., Jorgenson, M. T., and Xu, X.: The effect of fire and permafrost interactions on soil carbon accumulation in an upland black spruce ecosystem of interior Alaska: implications for post-thaw carbon loss, Global Change Biol., 17, 1461–1474, https://doi.org/10.1111/j.1365-2486.2010.02358.x, 2011. a
Ottmar, R. D., Burns, M. F., Hall, J. N., and Hanson, A. D.: CONSUME: users guide, Gen. Tech. Rep. PNW-GTR-304. US Department of Agriculture, Forest Service, Pacific Northwest Research Station, Portland, OR, 118 pp., https://doi.org/10.2737/PNW-GTR-304, 1993. a
Parisien, M.-A., Barber, Q. E., Hirsch, K. G., Stockdale, C. A., Erni, S., Wang, X., Arseneault, D., and Parks, S. A.: Fire deficit increases wildfire risk for many communities in the Canadian boreal forest, Nat. Commun., 11, 1–9, https://doi.org/10.1038/s41467-020-15961-y, 2020. a
Parks, S. A., Dillon, G. K., and Miller, C.: A New Metric for Quantifying Burn Severity: The Relativized Burn Ratio, Remote Sens., 6, 1827–1844, https://doi.org/10.3390/rs6031827, 2014. a
Parks, S. A., Parisien, M.-A., Miller, C., Holsinger, L. M., and Baggett, L. S.: Fine-scale spatial climate variation and drought mediate the likelihood of reburning, Ecol. Appl., 28, 573–586, https://doi.org/10.1002/eap.1671, 2018. a, b
Parks, S. A., Holsinger, L. M., Koontz, M. J., Collins, L., Whitman, E., Parisien, M.-A., Loehman, R. A., Barnes, J. L., Bourdon, J.-F., Boucher, J., Boucher, Y., Caprio, A. C., Collingwood, A., Hall, R. J., Park, J., Saperstein, L. B., Smetanka, C., Smith, R. J., and Soverel, N.: Giving Ecological Meaning to Satellite-Derived Fire Severity Metrics across North American Forests, Remote Sens., 11, 1735, https://doi.org/10.3390/rs11141735, 2019. a, b
Pérez-Izquierdo, L., Clemmensen, K. E., Strengbom, J., Nilsson, M.-C., and Lindahl, B.: Quantification of tree fine roots by real-time PCR, Plant Soil, 440, 593–600, https://doi.org/10.1007/s11104-019-04096-9, 2019. a
Saberi, S., Agne, M., Harvey, B. J., Saberi, S., Agne, M., and Harvey, B. J.: Do you CBI what I see? The relationship between the Composite Burn Index and quantitative field measures of burn severity varies across gradients of forest structure, Int. J. Wildland Fire, 31, 112–123, https://doi.org/10.1071/WF21062, 2022. a, b
Santín, C., Doerr, S. H., Preston, C. M., and González-Rodríguez, G.: Pyrogenic organic matter production from wildfires: a missing sink in the global carbon cycle, Global Change Biol., 21, 1621–1633, https://doi.org/10.1111/gcb.12800, 2015. a
Simon, H., Beck, L., Bhave, P. V., Divita, F., Hsu, Y., Luecken, D., Mobley, J. D., Pouliot, G. A., Reff, A., Sarwar, G., and Strum, M.: The development and uses of EPA's SPECIATE database, Atmos. Pollut. Res., 1, 196–206, https://doi.org/10.5094/APR.2010.026, 2010. a
Skakun, R., Castilla, G., Metsaranta, J., Whitman, E., Rodrigue, S., Little, J., Groenewegen, K., and Coyle, M.: Extending the National Burned Area Composite Time Series of Wildfires in Canada, Remote Sens., 14, 3050, https://doi.org/10.3390/rs14133050, 2022. a
Smyth, C., Xie, S., Zaborniak, T., Fellows, M., Phillips, C., and Kurz, W. A.: Development of a prototype modeling system to estimate the GHG mitigation potential of forest and wildfire management, Methods X, 101985, https://doi.org/10.1016/j.mex.2022.101985, 2022. a
Smyth, C., Fellows, M., Morken, S., and Magnan, M.: Development of national post-fire restoration system to assess net GHG impacts and salvage biomass availability, Methods X, 13, 102932, https://doi.org/10.1016/j.mex.2024.102932, 2024. a
Smyth, C., Fellows, M., and Cantin, A.: Forest wildfire emissions using the Canadian Fire Effects Model within the Generic Carbon Budget Model, Ecol. Model., 514, 111490, https://doi.org/10.1016/j.ecolmodel.2026.111490, 2026. a
Stenzel, J. E., Bartowitz, K. J., Hartman, M. D., Lutz, J. A., Kolden, C. A., Smith, A. M. S., Law, B. E., Swanson, M. E., Larson, A. J., Parton, W. J., and Hudiburg, T. W.: Fixing a snag in carbon emissions estimates from wildfires, Global Change Biol., 25, 3985–3994, https://doi.org/10.1111/gcb.14716, 2019. a
Stinson, G., Kurz, W. A., Smyth, C. E., Neilson, E. T., Dymond, C. C., Metsaranta, J. M., Boisvenue, C., Rampley, G. J., Li, Q., White, T. M., and Blain, D.: An inventory-based analysis of Canada's managed forest carbon dynamics, 1990 to 2008, Global Change Biol., 17, 2227–2244, https://doi.org/10.1111/j.1365-2486.2010.02369.x, 2011. a
Stinson, G., Thandi, G., Aitkin, D., Bailey, C., Boyd, J., Colley, M., Fraser, C., Gelhorn, L., Groenewegen, K., Hogg, A., Kapron, J., Leboeuf, A., Makar, M., Montigny, M., Pittman, B., Price, K., Salkeld, T., Smith, L., Viveiros, A., and Wilson, D.: A new approach for mapping forest management areas in Canada, Forest. Chronic., 95, 101–112, https://doi.org/10.5558/tfc2019-017, 2019. a
Stocks, B. J., Mason, J. A., Todd, J. B., Bosch, E. M., Wotton, B. M., Amiro, B. D., Flannigan, M. D., Hirsch, K. G., Logan, K. A., Martell, D. L., and Skinner, W. R.: Large forest fires in Canada, 1959–1997, J. Geophys. Res.-Atmos., 5–12, https://doi.org/10.1029/2001JD000484, 2002. a
Stocks, B. J., Alexander, M. E., Wotton, B. M., Stefner, C. N., Flannigan, M. D., Taylor, S. W., Lavoie, N., Mason, J. A., Hartley, G. R., Maffey, M. E., Dalrymple, G. N., Blake, T. W., Cruz, M. G., and Lanoville, R. A.: Crown fire behaviour in a northern jack pine-black spruce forest, Can. J. Forest Res., 34, 1548–1560, https://doi.org/10.1139/x04-054, 2004. a
Strong, W. L. and La Roi, G. H.: Root density-soil relationships in selected boreal forests of central Alberta, Canada, Forest Ecol. Manage., 12, 233–251, https://doi.org/10.1016/0378-1127(85)90093-3, 1985. a
Talucci, A. C. and Krawchuk, M. A.: Dead forests burning: the influence of beetle outbreaks on fire severity and legacy structure in sub-boreal forests, Ecosphere, 10, e02744, https://doi.org/10.1002/ecs2.2744, 2019. a, b
Talucci, A. C., Loranty, M. M., Holloway, J. E., Rogers, B. M., Alexander, H. D., Baillargeon, N., Baltzer, J. L., Berner, L. T., Breen, A., Brodt, L., Buma, B., Dean, J., Delcourt, C. J. F., Diaz, L. R., Dieleman, C. M., Douglas, T. A., Frost, G. V., Gaglioti, B. V., Hewitt, R. E., Hollingsworth, T., Jorgenson, M. T., Lara, M. J., Loehman, R. A., Mack, M. C., Manies, K. L., Minions, C., Natali, S. M., O'Donnell, J. A., Olefeldt, D., Paulson, A. K., Rocha, A. V., Saperstein, L. B., Shestakova, T. A., Sistla, S., Sizov, O., Soromotin, A., Turetsky, M. R., Veraverbeke, S., and Walvoord, M. A.: Permafrost–wildfire interactions: active layer thickness estimates for paired burned and unburned sites in northern high latitudes, Earth Syst. Sci. Data, 17, 2887–2909, https://doi.org/10.5194/essd-17-2887-2025, 2025. a
Thompson, D. K. and Whitman, E.: RMarkdown code and data supporting: Incorporating observed fire severity in refined emissions estimates for boreal and temperate forest fires in the carbon budget model CBM-CFS3, Zenodo [code and data set], https://doi.org/10.5281/zenodo.17517166, 2026. a, b, c
Thompson, D. K., Simpson, B. N., Whitman, E., Barber, Q. E., and Parisien, M.-A.: Peatland Hydrological Dynamics as A Driver of Landscape Connectivity and Fire Activity in the Boreal Plain of Canada, Forests, 10, 534, https://doi.org/10.3390/f10070534, 2019. a
Trofymow, J. A., Moore, T. R., Titus, B., Prescott, C., Morrison, I., Siltanen, M., Smith, S., Fyles, J., Wein, R., Camiré, C., Duschene, L., Kozak, L., Kranabetter, M., and Visser, S.: Rates of litter decomposition over 6 years in Canadian forests: influence of litter quality and climate, Can. J. Forest Res., 32, 789–804, https://doi.org/10.1139/x01-117, 2002. a
Turetsky, M. R., Amiro, B. D., Bosch, E., and Bhatti, J. S.: Historical burn area in western Canadian peatlands and its relationship to fire weather indices, Global Biogeochem. Cy., 18, https://doi.org/10.1029/2004GB002222, 2004. a
Van Wagner, C. E.: Duff Consumption by Fire in Eastern Pine Stands, Can. J. Forest Res., 2, 34–39, https://doi.org/10.1139/x72-006, 1972. a
Van Wagner, C. E.: Development and structure of the Canadian Forest Fire Weather Index System, Canadian Forestry Service, ISBN 978-0-662-15198-2, https://ostrnrcan-dostrncan.canada.ca/handle/1845/228434 (last access: 24 April 2026), 1987. a
Vay, S. A., Choi, Y., Vadrevu, K. P., Blake, D. R., Tyler, S. C., Wisthaler, A., Hecobian, A., Kondo, Y., Diskin, G. S., Sachse, G. W., Woo, J.-H., Weinheimer, A. J., Burkhart, J. F., Stohl, A., and Wennberg, P. O.: Patterns of CO2 and radiocarbon across high northern latitudes during International Polar Year 2008, J. Geophys. Res.-Atmos., 116, https://doi.org/10.1029/2011JD015643, 2011. a
Voshtani, S., Jones, D. B. A., Wunch, D., Pendergrass, D. C., Wennberg, P. O., Pollard, D. F., Morino, I., Ohyama, H., Deutscher, N. M., Hase, F., Sussmann, R., Weidmann, D., Kivi, R., García, O., Té, Y., Chen, J., Anderson, K., Stevens, R., Kondragunta, S., Zhu, A., Worthy, D., Racki, S., McKain, K., Makarova, M. V., Jones, N., Mahieu, E., Cadena-Caicedo, A., Cristofanelli, P., Labuschagne, C., Kozlova, E., Seitz, T., Steinbacher, M., Mahdi, R., and Murata, I.: Quantifying CO emissions from boreal wildfires by assimilating TROPOMI and TCCON observations, Atmos. Chem. Phys., 25, 15527–15565, https://doi.org/10.5194/acp-25-15527-2025, 2025. a, b
Walker, X. J., Baltzer, J. L., Cumming, S. G., Day, N. J., Johnstone, J. F., Rogers, B. M., Solvik, K., Turetsky, M. R., and Mack, M. C.: Soil organic layer combustion in boreal black spruce and jack pine stands of the Northwest Territories, Canada, Int. J. Wildland Fire, 27, 125, https://doi.org/10.1071/WF17095, 2018a. a
Walker, X. J., Rogers, B. M., Baltzer, J. L., Cumming, S. G., Day, N. J., Goetz, S. J., Johnstone, J. F., Schuur, E. A. G., Turetsky, M. R., and Mack, M. C.: Cross-scale controls on carbon emissions from boreal forest megafires, Global Change Biol., 24, 4251–4265, https://doi.org/10.1111/gcb.14287, 2018b. a
Walker, X. J., Baltzer, J. L., Bourgeau-Chavez, L. L., Day, N. J., De Groot, W., Dieleman, C., Hoy, E. E., Johnstone, J. F., Kane, E. S., Parisien, M. A., Potter, S., Rogers, B. M., Turetsky, M. R., Veraverbeke, S., Whitman, E., and Mack, M. C.: ABoVE: Synthesis of Burned and Unburned Forest Site Data, AK and Canada, 1983–2016, ORNL DAAC, https://doi.org/10.3334/ORNLDAAC/1744, 2020a. a, b, c, d
Walker, X. J., Rogers, B. M., Veraverbeke, S., Johnstone, J. F., Baltzer, J. L., Barrett, K., Bourgeau-Chavez, L., Day, N. J., de Groot, W. J., Dieleman, C. M., Goetz, S., Hoy, E., Jenkins, L. K., Kane, E. S., Parisien, M.-A., Potter, S., Schuur, E. a. G., Turetsky, M., Whitman, E., and Mack, M. C.: Fuel availability not fire weather controls boreal wildfire severity and carbon emissions, Nat. Clim. Change, 1–7, https://doi.org/10.1038/s41558-020-00920-8, 2020b. a, b, c
Wang, X., Oliver, J., Swystun, T., Hanes, C. C., Erni, S., and Flannigan, M. D.: Critical fire weather conditions during active fire spread days in Canada, Sci. Total Environ., 161831, https://doi.org/10.1016/j.scitotenv.2023.161831, 2023. a
White, J. C., Wulder, M. A., Hermosilla, T., Coops, N. C., and Hobart, G. W.: A nationwide annual characterization of 25years of forest disturbance and recovery for Canada using Landsat time series, Remote Sens. Environ., 194, 303–321, https://doi.org/10.1016/j.rse.2017.03.035, 2017. a
Whitman, E., Parisien, M.-A., Thompson, D. K., Hall, R. J., Skakun, R. S., and Flannigan, M. D.: Variability and drivers of burn severity in the northwestern Canadian boreal forest, Ecosphere, 9, e02128, https://doi.org/10.1002/ecs2.2128, 2018. a, b, c, d, e, f
Whitman, E., Parisien, M.-A., Holsinger, L. M., Park, J., and Parks, S. A.: A method for creating a burn severity atlas: an example from Alberta, Canada, Int. J. Wildland Fire, https://doi.org/10.1071/WF19177, 2020. a, b
Whitman, E., Barber, Q. E., Jain, P., Parks, S. A., Guindon, L., Thompson, D. K., and Parisien, M.-A.: A modest increase in fire weather overcomes resistance to fire spread in recently burned boreal forests, Global Change Biol., 30, e17363, https://doi.org/10.1111/gcb.17363, 2024. a, b
Wotton, B. M., Gould, J. S., McCaw, W. L., Cheney, N. P., and Taylor, S. W.: Flame temperature and residence time of fires in dry eucalypt forest, Int. J. Wildland Fire, 21, 270–281, https://doi.org/10.1071/WF10127, 2011. a
- Abstract
- Copyright statement
- Introduction
- Methods
- Results and discussion
- Conclusions
- Appendix A: Disturbance matrix examples
- Appendix B: List of resprouting hardwoods of Canada
- Appendix C: Modelling of soil organic layer consumption
- Code and data availability
- Author contributions
- Competing interests
- Disclaimer
- Acknowledgements
- Review statement
- References
- Supplement