the Creative Commons Attribution 4.0 License.
the Creative Commons Attribution 4.0 License.
 | 07 Apr 2026
DEEP-SEAM: an explainable semi-supervised deep learning framework for mineral prospectivity mapping
Zijing Luo
Ehsan Farahbakhsh
Stephen Hore
R. Dietmar Müller
The global transition to clean energy is sharply increasing demand for rare earth elements (REEs), yet discovery rates are declining, especially in areas concealed by younger cover. Deep learning (DL) offers new opportunities for mineral prospectivity mapping (MPM), but its application is challenged by sparse labelled mineral occurrences, strong class imbalance, and limited model transparency. To address these issues, we present DEEP-SEAM, an explainable semi-supervised DL framework that integrates geological, geophysical, geochemical, remote sensing, and topographic datasets to predict REE prospectivity in the northern Curnamona Province, South Australia. The framework employs the Deviation Network (DevNet), a semi-supervised anomaly detection model that learns from a small number of known REE occurrences together with abundant unlabelled samples. DEEP-SEAM produces highly accurate predictions: the top 2 % of the mapped area contains 86 % of known REE deposits, and nearly all known occurrences fall within the highest-prospectivity zones. These areas show strong spatial association with felsic granites, major faults, and Mesoproterozoic metasedimentary sequences – features consistent with established REE mineral system models. To improve interpretability, we apply SHapley Additive exPlanations (SHAP), which highlight radiometric signatures, magnetic pseudo-gravity attributes, hydrothermal alteration indicators, and key geochemical principal components as the most influential predictors. These insights align with independent geological evidence, strengthening confidence in the predictive outcomes. DEEP-SEAM provides a transparent, scalable, and data-efficient approach for delineating REE prospectivity in complex and partially covered terranes, offering a valuable tool for reducing exploration risk and guiding future targeting efforts.
- Article
(12351 KB) - Full-text XML
- BibTeX
- EndNote


Rare earth elements (REEs) comprise the lanthanides, ranging from lanthanum (La) to lutetium (Lu), and typically include yttrium (Y) and scandium (Sc) due to their similar chemical properties (Connelly et al., 2005). REEs are crucial in modern industries and indispensable components of defence systems, green technologies, and electronic applications (Dushyantha et al., 2020). For instance, rare earth alloys and permanent magnets are extensively used in renewable energy technologies, including electric vehicles, energy storage systems, solar panels, and wind turbines (Zhou et al., 2016). The growing demand for REEs will continue to be driven by advancements in both traditional applications and emerging technologies (Alonso et al., 2012; Dushyantha et al., 2020; Goodenough et al., 2018). Currently, the majority of global REE supply is derived from primary resources (Goodenough et al., 2018). REE deposits occur in a wide variety of major rock types across diverse geological settings worldwide, including igneous (e.g., carbonatite deposit), metamorphic, and sedimentary (e.g., weathering profiles, residual deposits, and placers) host rocks (Smith et al., 2016). The concentration and distribution of REEs in these deposits are influenced by various geological processes, ranging from deep magmatic activity to surface weathering (Jaireth et al., 2014; Smith et al., 2016). The interaction of different geological processes and complex formation mechanisms further complicates the exploration of REE deposits. Moreover, overburden layers introduce additional difficulties (Cheng, 2012). Overburden may dilute or alter signals that reflect mineralisation, and masking effects can reduce the accuracy of geological data, thereby further increasing the challenges of exploration (Cheng, 2012; Xiong et al., 2018).
Creating low-cost mineral prospectivity maps through quantitative analysis of existing geoscientific data is essential for delineating potential mineralisation, guiding target prioritization and exploration deployment, enhancing exploration efficiency, and minimizing unnecessary expenditure (Zhao and Chen, 2021). Mineral prospectivity mapping (MPM) is a computer-supported workflow that integrates multiple criteria across several stages to estimate where the target-type mineral deposits are likely to occur within a defined area (Singer, 1993; Zuo et al., 2021). MPM involves integrating information from various geoscientific datasets, including geological mapping, geochemical surveys, geophysical measurements, and satellite-based remote sensing (Brown et al., 2000; Zuo, 2020). Specific features and anomalies within these datasets reflect key mineralisation processes and mineral systems components, enabling the recognition of complex spatial distribution patterns of geological features associated with mineral deposits (Carranza, 2009; McCuaig and Hronsky, 2014). By employing data-driven, knowledge-driven, or hybrid models, the intrinsic relationships between these features and mineral deposits can be revealed, leading to the generation of mineral prospectivity maps (Zuo, 2020). In recent years, machine learning (ML) techniques have emerged as powerful tools in MPM workflows, enabling efficient integration of geographical information from different sources to address mineral prediction challenges, optimise exploration processes, enhance success rates, and reduce costs (Chen and Wu, 2017; Farahbakhsh et al., 2023; Rodriguez-Galiano et al., 2015; Singer and Kouda, 1996; Zuo and Carranza, 2011).
Traditional ML techniques are limited in processing raw natural data and typically rely on manually engineered processors to convert raw observations into suitable internal representations or model-ready feature vectors (LeCun et al., 2015). Deep learning (DL), a subfield of ML, offers an end-to-end approach that employs multiple non-linear layers to automatically learn hierarchical feature representations, excelling at uncovering complex structures in high-dimensional data (Bergen et al., 2019; LeCun et al., 2015; Nguyen et al., 2019). By leveraging abstraction, DL effectively captures nonlinear relationships between multi-source exploration data and mineralisation probability (Sun et al., 2020; Zuo and Xu, 2023; Zuo et al., 2023). A common challenge in applying DL to MPM is insufficient positive samples (known mineral occurrences) combined with the significant variability of mineralisation processes across geological periods, regions, and environments (Cheng, 2007; Granek and Haber, 2015). Data limitations can cause supervised DL models to favor majority classes while overlooking rare but critical mineralisation signals (Farahbakhsh et al., 2023; Leevy et al., 2018; Li et al., 2021; Yang et al., 2022). Conversely, unsupervised DL models circumvent the challenge of acquiring large-scale labelled samples and have been widely applied in MPM as a promising solution to these limitations (Xiong et al., 2018; Zuo et al., 2022). However, these unsupervised DL models are designed to learn feature representations for downstream anomaly detection rather than directly optimising anomaly scores, leading to suboptimal detection performance (Pang et al., 2019; Gao et al., 2021). More critically, unsupervised models lack guidance from prior knowledge of actual mineral deposit spatial distributions, rendering them prone to misidentifying noise or irrelevant areas as anomalies (Pang et al., 2023; Luo et al., 2024).
In addition, although DL models have demonstrated excellent performance in MPM, their complexity and “black-box” nature make it difficult to interpret the model's predictions (Mou et al., 2023; Zuo et al., 2023). In the field of mineral prediction, which is characterised by high risks and substantial economic value, the issue of transparency is of particular concern. Decision-making in MPM requires not only accurate predictions but also a comprehensive understanding of how these predictions are derived (Hronsky and Kreuzer, 2019). This involves addressing questions such as, “What factors drive the model's predictions?”. Such insights enable geologists and experts from related fields to integrate their knowledge, validate the credibility of the predictions, and ultimately help mitigate exploration risks. Thus, improving the interpretability of DL models has become a key focus in research on mineral resource prediction (Sun et al., 2024). Current efforts toward interpretable DL in MPM can be broadly grouped into two streams: (1) knowledge-data integrated geological constraint approaches, and (2) post-hoc model-agnostic interpretation techniques (Luo et al., 2023). Zuo and his team have developed a series of interpretable MPM DL models (termed Zuo's models) that deeply integrate DL with mineral systems theory, emphasising two core mechanisms: knowledge embedment, which incorporates geological domain knowledge throughout data collection and model design, and knowledge discovery, which leverages DL's powerful nonlinear modelling capacity to uncover hidden metallogenic mechanisms and patterns that refine ore deposit theory. Through this bidirectional interaction, Zuo's models achieve organic integration of data-driven learning capacity with geological prior knowledge (Yang et al., 2024; Zuo et al., 2023, 2024, 2025; Zuo, 2025). Post-hoc techniques preserve the original DL model architecture while employing interpretability algorithms to infer the prediction mechanisms. For instance, Mou et al. (2025) utilised the Partial Dependence Plot (PDP) method to quantify the marginal effects of one or more selected prospecting variables on model-predicted mineral prospectivity, thereby elucidating the predictive reasoning of the model.
To address these challenges, this study presents DEEP-SEAM v1.0, an interpretable semi-supervised DL framework for MPM that integrates the advantages of both supervised and unsupervised paradigms while employing post-hoc model-agnostic interpretation techniques to elucidate prediction logic. This framework aims to overcome challenges associated with imbalanced positive-negative sample distributions, inadequate reflection of potential mineralisation information, and insufficient model interpretability. Building on the foundational work of Luo et al (2024), this study integrates multi-source exploration data to address the inherent limitations of previous research that focused exclusively on single-source geochemical data. Targeting REE mineralisation in the northern part of the Curnamona Province in South Australia, this study utilises a sizeable open-access exploration dataset to generate heterogeneous evidential layers reflecting target mineralisation, including geological, geophysical, remote sensing, and geochemical data layers. A detailed MPM workflow is established, wherein appropriate preprocessing methods are applied to different data types. Given the data sparsity challenge in MPM, this study employs the deviation network (DevNet; Pang et al., 2019) for predictive modelling. As a semi-supervised anomaly detection approach, DevNet requires only minimal labelled positive samples alongside abundant unlabelled data for effective training, whilst demonstrating strong robustness to uncertainty within unlabelled datasets. These characteristics align closely with typical geological exploration constraints: known mineral deposits are scarce, yet extensive unlabelled regions may harbour potential mineralisation targets. Accordingly, the framework leverages DevNet to capture complex associations between multi-source evidence layers and the spatial distribution of mineralisation. SHapley Additive exPlanations (SHAP) are employed to interpret model predictions, which are validated against geological prior knowledge to achieve efficient and reliable delineation of prospective mineralisation areas.
The Curnamona Province is a large, near-circular geological terrane located in the northeastern part of South Australia (Preiss, 2000). It extends eastward from the Olary region, crossing into New South Wales (Newton et al., 2003). The province comprises metamorphosed sedimentary and igneous rocks from the Paleoproterozoic to Mesoproterozoic eras and is a region of significant mineral potential (Rutherford et al., 2007). It hosts numerous medium- to large-scale hard rock mineral systems, making it one of South Australia's most important base and precious metal-bearing geological formations (Robertson et al., 1998). Among these, the world-class Broken Hill lead-zinc-silver-gold deposit located in New South Wales is the most renowned, along with significant copper-gold (molybdenum), uranium-REE, tin-tungsten, and silver-lead deposits (Robertson et al., 1998). Much of the Curnamona Province is overlain by younger Cambrian to Cenozoic sedimentary rocks, particularly in the central region (Williams et al., 2009). The geological evolution of the province has recorded several significant tectonic, magmatic, and metamorphic events, primarily during the Paleoproterozoic and Mesoproterozoic periods. These events have shaped the region's complex geological architecture and endowed it with substantial mineral resource potential.
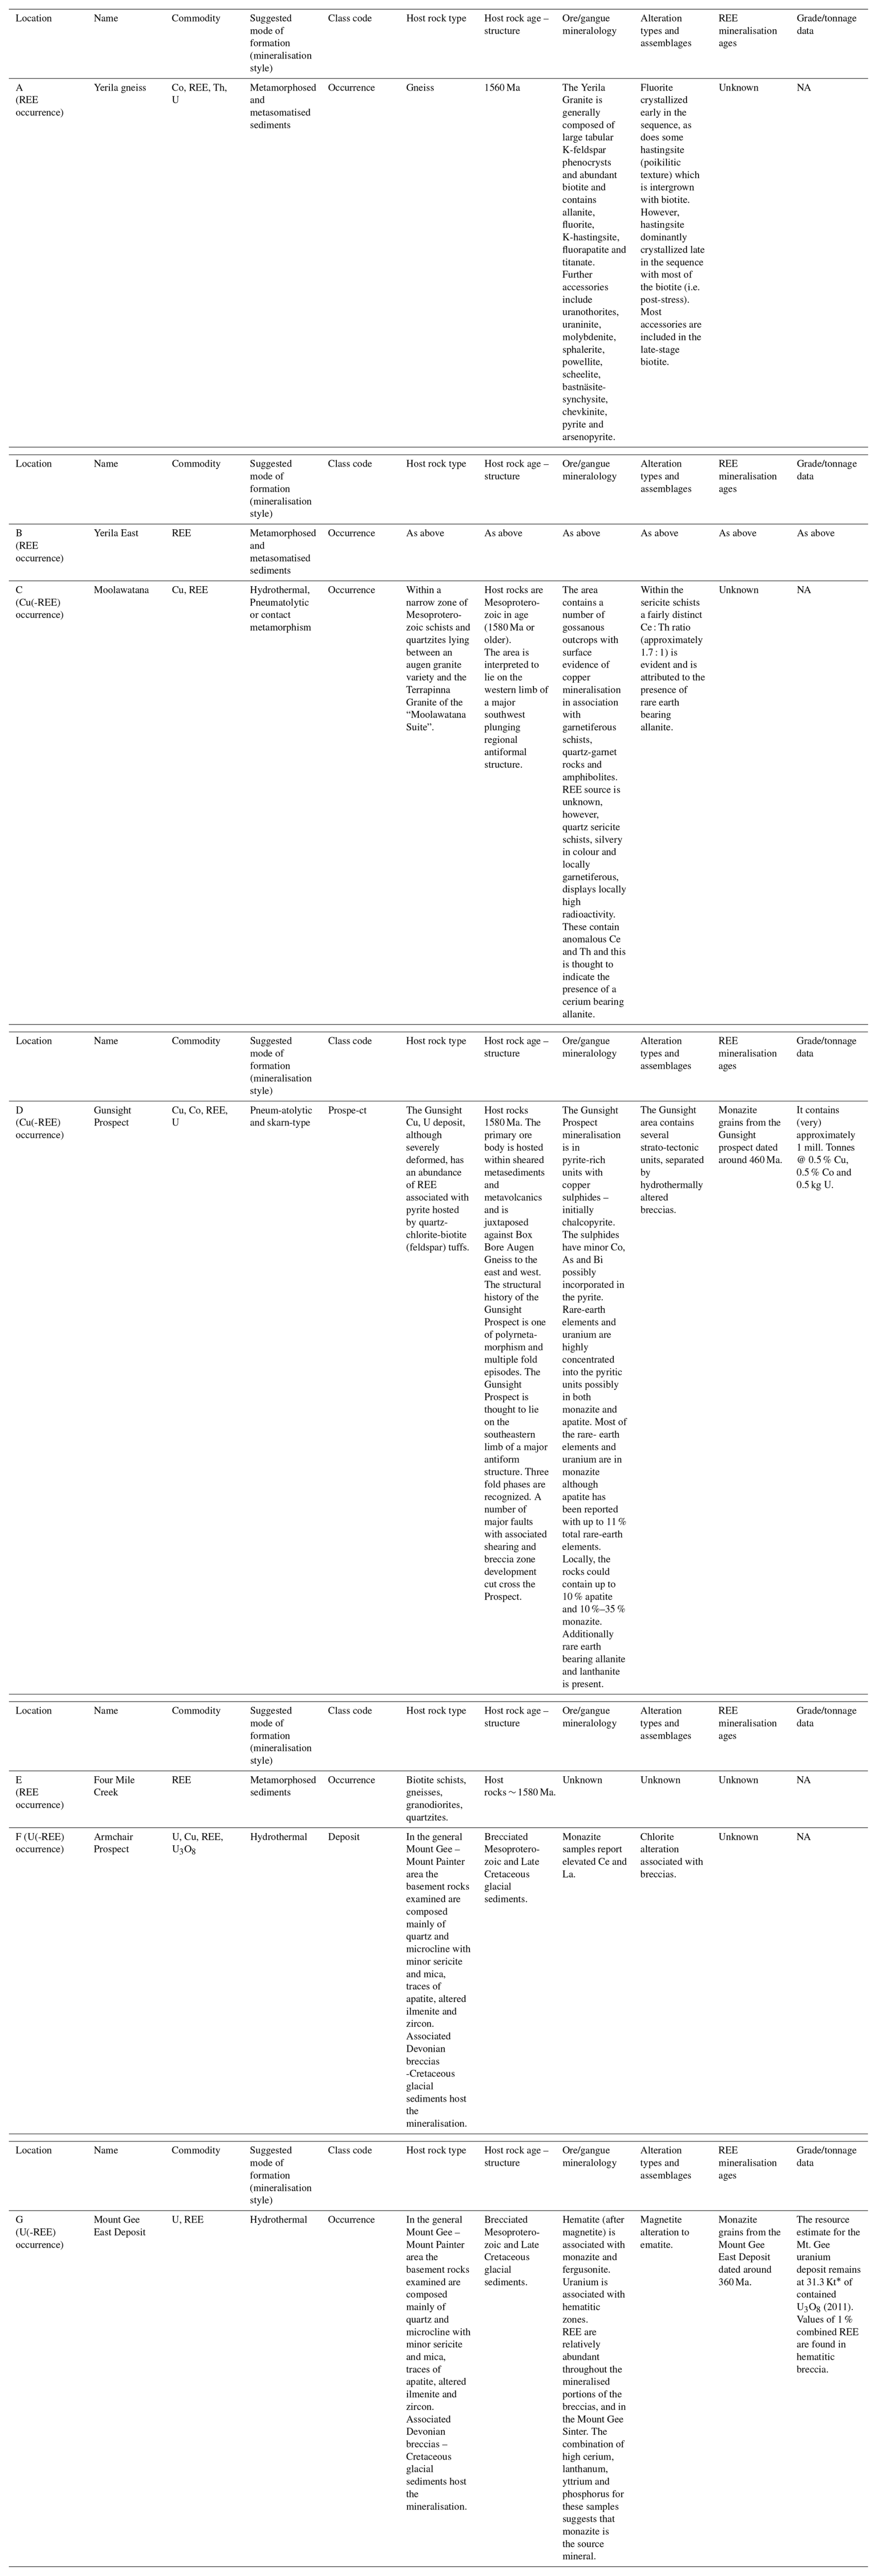
The REE deposits (Table 1) in the study area are located within the predominantly Mesoproterozoic Mount Painter and Mount Babbage inliers of the Moolawatana Domain located in the north-western Curnamona Province (Fig. 1). The most recent geology map presentation for the study area is the Mount Painter region by Hore (2015). Although having limited research, the REE deposits are considered to be primarily of skarn type but may equally include either hydrothermal, metamorphic or metasomatic origins. For example, previous studies have demonstrated that the Palaeozoic to Early Cretaceous Radium Ridge Breccia (with a Mesoproterozoic precursor), within the southern Mount Painter Inlier, contain significant REE mineralisation represented by 360 Ma monazites of hydrothermal origin (Alley and Hore, 2022; Elburg et al., 2013; Drexel and Major, 1990; Hore et al., 2020a, b; Robertson et al., 1998). Additionally, mid-Paleozoic localised high-grade metamorphism affected older rocks along the central eastern flank of the Mount Painter Inlier, generating monazite-rich biotite schists that exhibit remarkable REE enrichment and localised mobilization (Robertson et al., 1998). Another area of significant REE mineralisation is hosted in the metasomatised Mesoproterozoic Yerila Granite (“gneiss”) of the Mount Babbage Inlier (Wülser, 2009). There are also several smaller isolated pockets of REE-rich lithologies scattered throughout the inliers whose origins require further investigation.
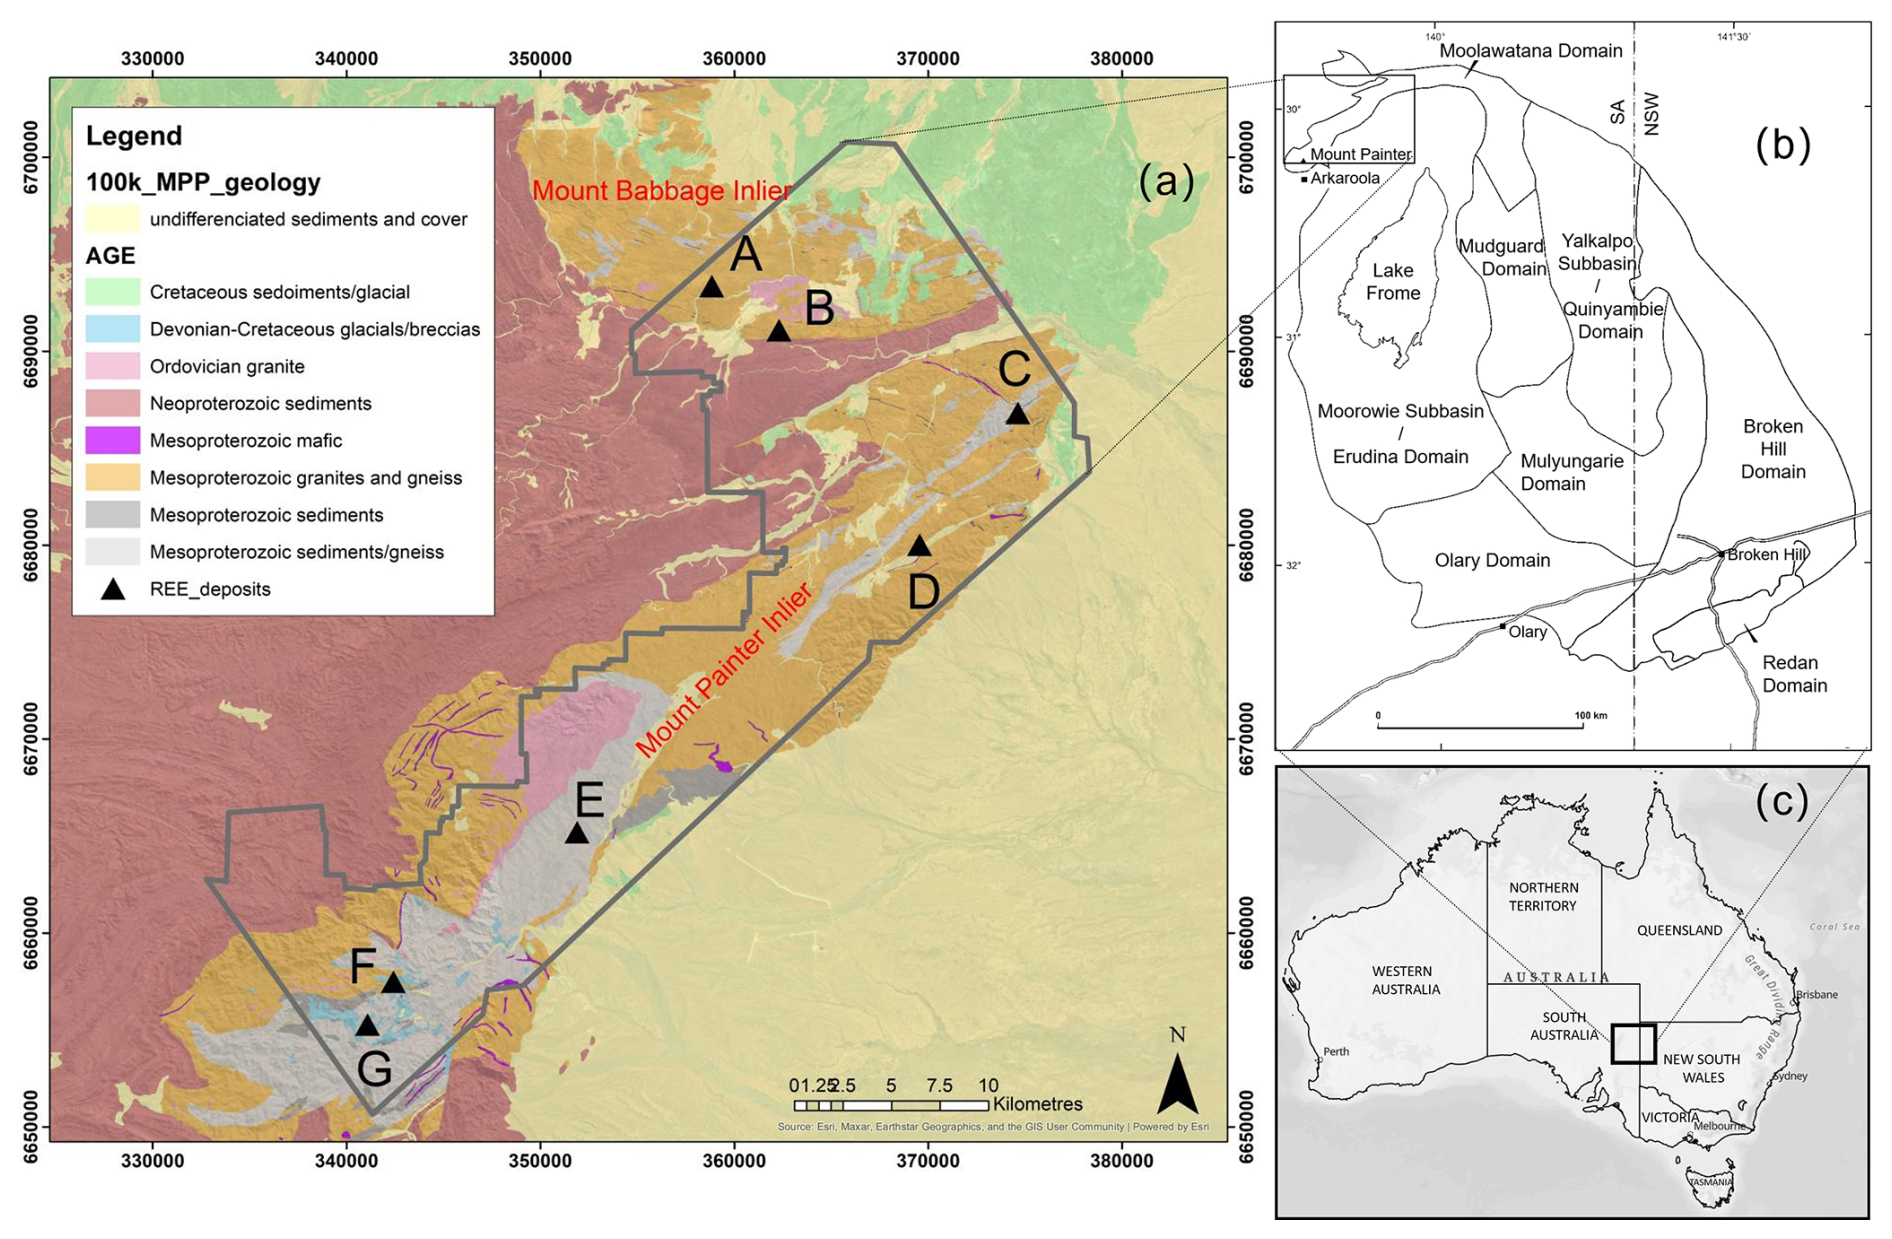
Figure 1(a) Simplified stratigraphic map and REE mineral deposits in the Mount Painter and Mount Babbage inliers of the north-western Curnamona Province; (b) geographic location of the study area, after Jagodzinski and Fricke (2010); (c) outline map of Australia with state borders.
Table 1Overview of REE mineral occurrence characteristics (includes data from Drexel and Major, 1990; Edgecombe, 1998; Hore et al., 2020a; McPhee et al., 1982; Teale, 1995; Whitehead, 1976; Zivak, 2024).
The Mount Painter region also contains substantial primary and secondary uranium resources (Bogacz, 2006; Elburg et al., 2013; Robertson et al., 1998; Wülser et al., 2011), with mineralisation likely originating from uranium-, thorium-, and REE-rich granitic bodies, meta-volcanics and meta-sediments located within the inliers (Robertson et al., 1998). Also, the region holds potential for stratiform and volcanic-associated base metal mineralisation, including Cu, Sn and W, hosted within metamorphosed Meso- to Neo-Proterozoic sedimentary and volcanic rock units (Hore et al., 2020b; Robertson et al., 1998; Sheard et al., 1992). Many of the Mount Painter region granites are extremely enriched in heat producing elements (U, Th, K), making this region notable for the significant heat generated by radiogenic decay of these elements. These High Heat Producing Granites (HHPG) serve as heat sources for hydrothermal circulation and have initiated convective sub-surface fluid migration, establishing a region of high geothermal gradient metamorphism (Kovacs, 2005; Neumann et al., 2000; Sandiford et al., 2002). The region has experienced a prolonged history of granitic intrusions and consequential localized radiogenic heating, spanning from the early Mesoproterozoic through the Delamerian Orogeny to the Late Palaeozoic. The Mesoproterozoic appears to have been particularly favourable for REE mineralisation, primarily attributed to: the generation of REE-enriched magmas and relatively stable tectonic environments that enhanced the preservation potential of formed deposits. The close spatial association and genetic relationship between Mesoproterozoic stratigraphic units and known mineral occurrences further substantiate the critical significance of this geological period for regional REE mineralisation. This extended geological history has led to multiple phases and pulses of magmatic and hydrothermal activity. Mineralisation processes have been driven by two primary mechanisms: (1) initial stages involving the introduction of felsic magmatism, including direct fluid activity and heat originating from magmatic processes, and (2) subsequent stages driven by ongoing radiogenic heat generation from the uranium- and thorium-rich granites and the associated mobilisation of hydrothermal fluids (Hoatson et al., 2011). Throughout these processes, structural controls played a crucial role in ore formation, with fracture systems serving as primary conduits for mineralising fluids and magmas. These coupled magmatic and radiogenic heating processes have initiated extensive sodic, potassic, and chloritic alteration of the granites, locally transforming initial lithologies into gneisses and schists. The sustained hydrothermal activity has facilitated the formation of diverse mineral deposit types, including hydrothermal vein-type, breccia-hosted, and skarn-type deposits containing Au, Cu, U, Sn, and REEs, with REE mineralisation being particularly associated with both the initial felsic magmatic events and the long-term radiogenic heating effects of the HHPG.
3.1 Data layers and features
Study data are sourced from the South Australian Resources Information Gateway (https://map.sarig.sa.gov.au, last access: 27 March 2026). By analysing the geological setting and mineralisation type, we select geological, geophysical (magnetic, gravity, radiometric), remote sensing, and geochemical data, along with a digital elevation model. This multidimensional data integration reflects geological processes associated with mineralisation from various perspectives.
3.1.1 Geological data layers
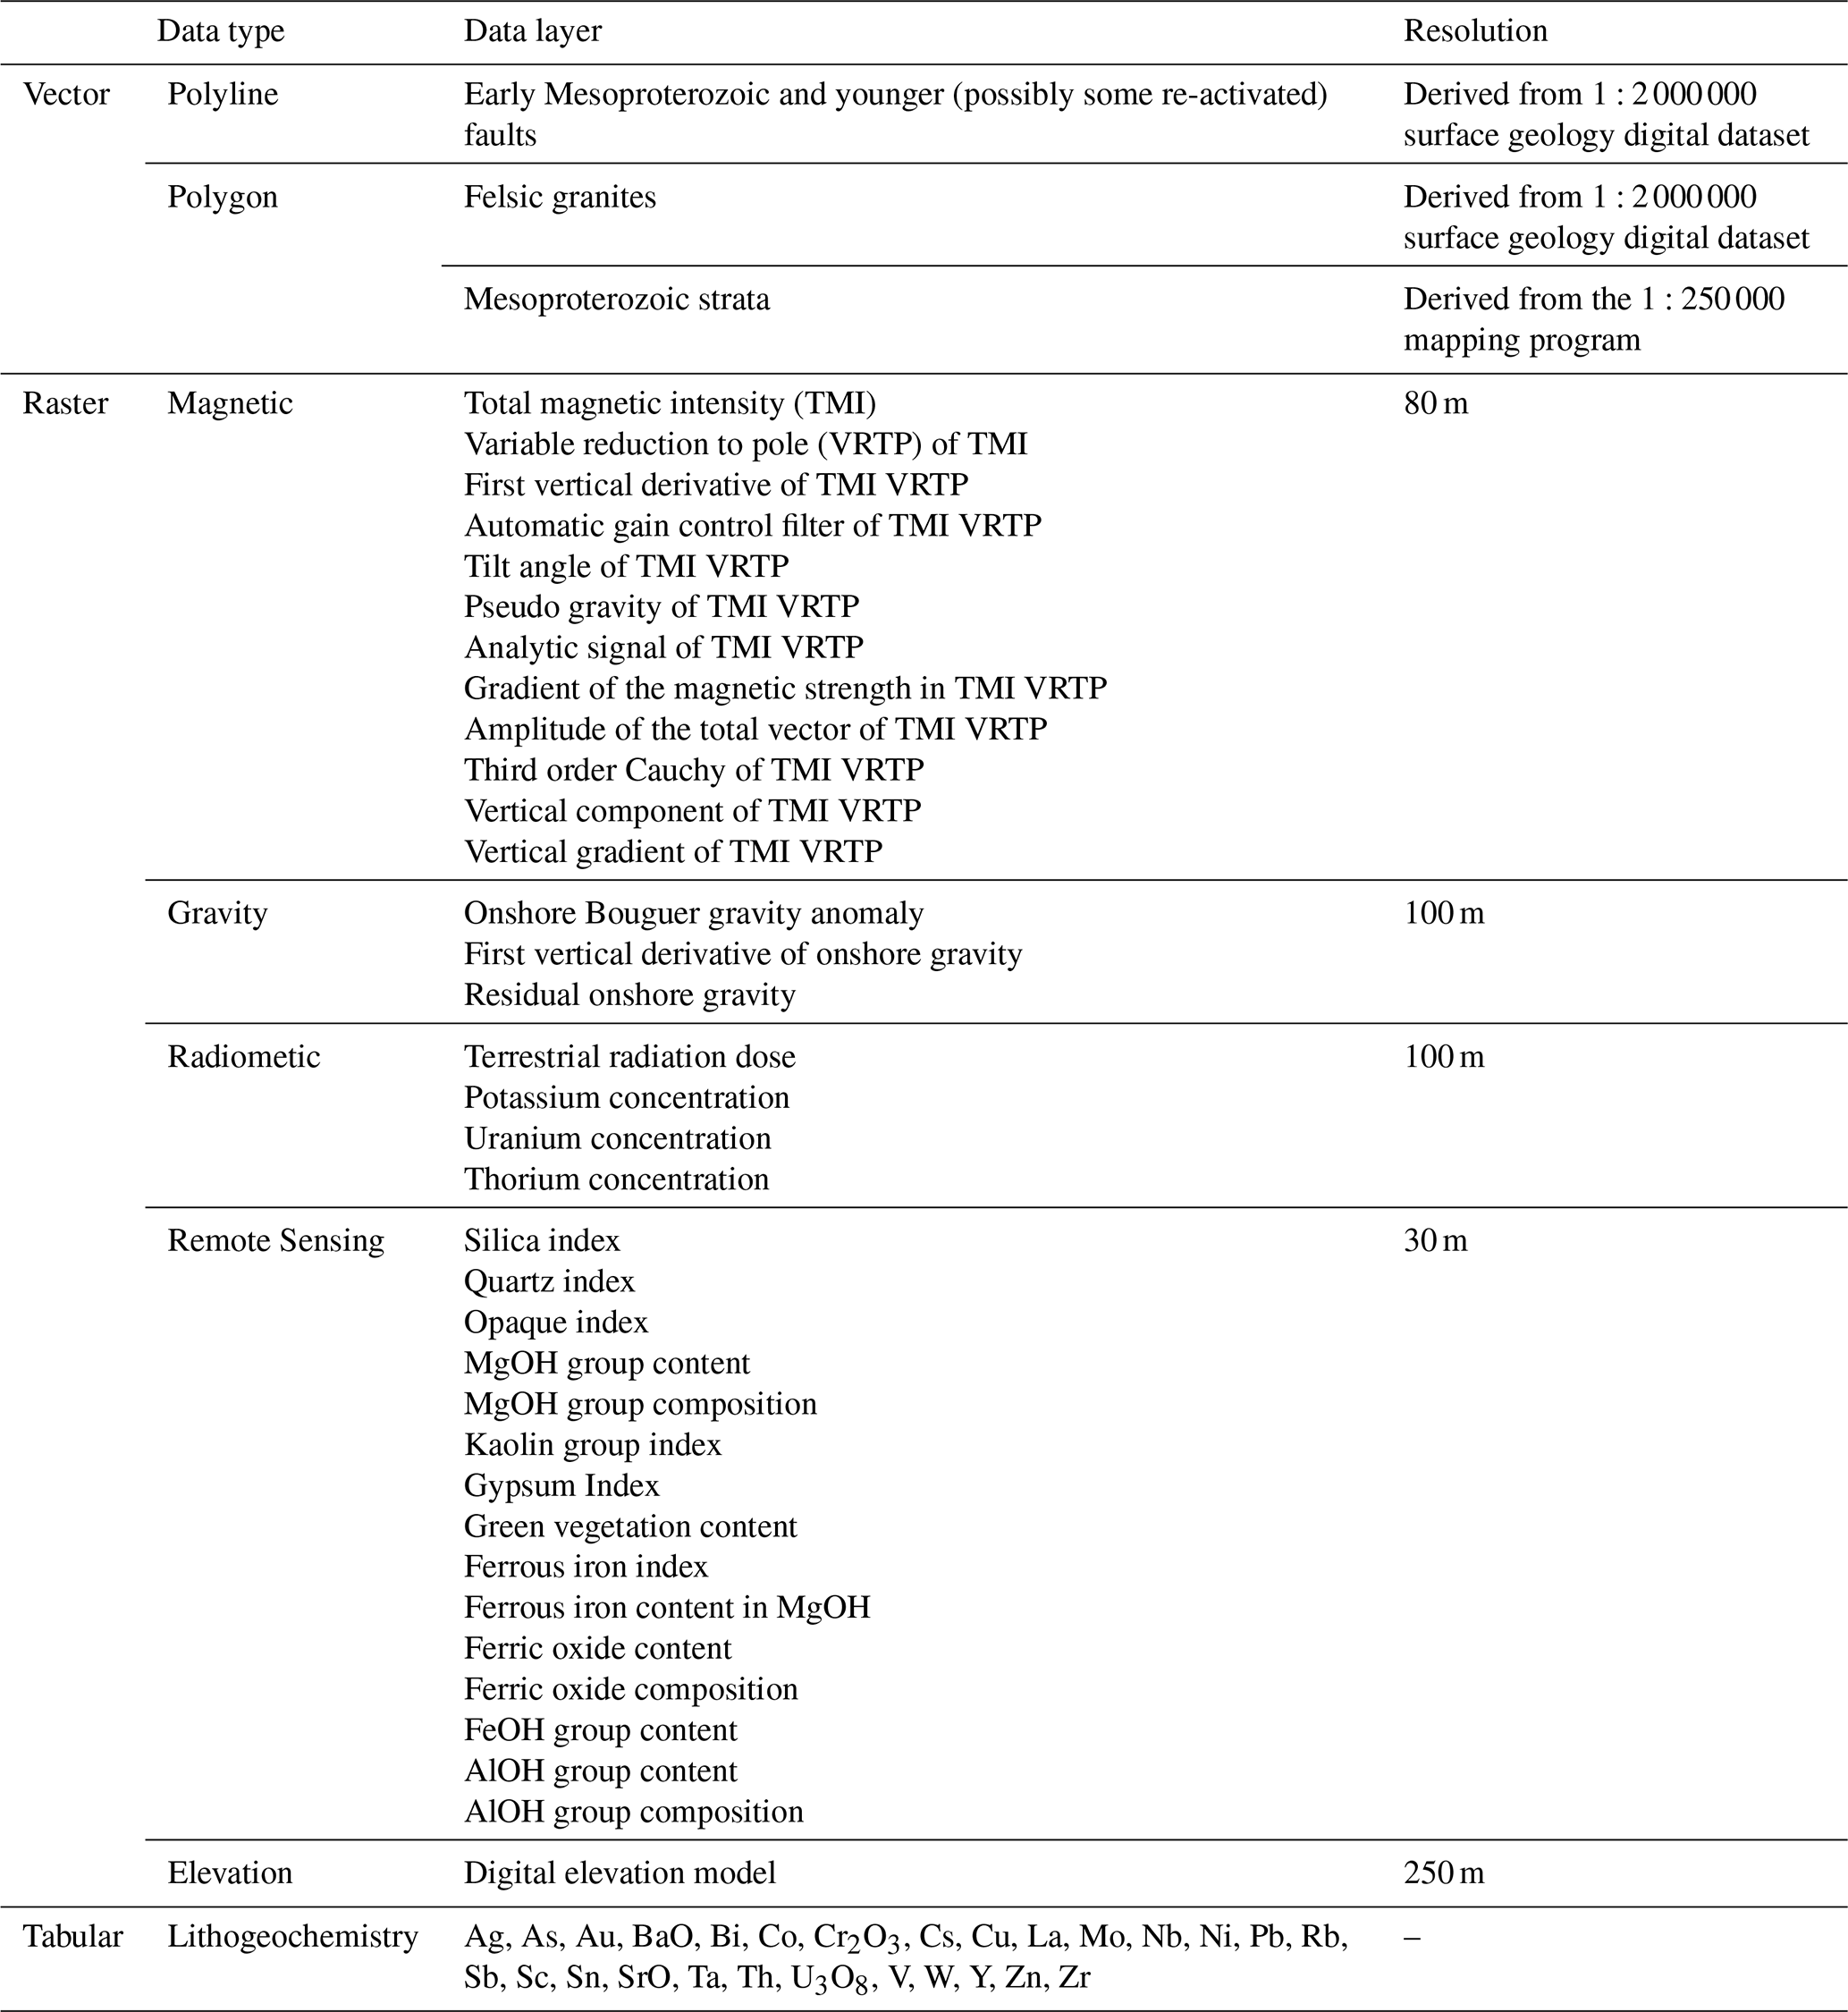
The geological data layers (Table 2), including faults, granitic rocks, and stratigraphic information closely related to mineralisation, provide critical insights into mineralisation processes, vein distribution, fluid migration, and REE enrichment. Existing research indicates that the REE spatial patterns and elemental concentrations within deposits are largely controlled by the interplay of rock-forming processes (Dushyantha et al., 2020; Jaireth et al., 2014). Faults systems act as conduits for hydrothermal fluid migration and mineral precipitation (Curewitz and Karson, 1997). REE mineralisation associated with skarns is primarily formed from fluids derived from granitoid magmas, and understanding the distribution of granitic rocks aids in REE deposit exploration (Robertson et al., 1998). Australia's REE mineralisation formation was especially active during the Mesoproterozoic era (Spandler et al., 2020), with known REE occurrences in the study area showing a close spatial coupling with Mesoproterozoic strata.
Table 2List of key data layers used for generating features in this study.
3.1.2 Geophysical data layers
The Earth's magnetic field exhibits spatial variations that can be recorded in aeromagnetic surveys. Magnetic measurements highlight the differences in magnetisation levels within near-surface rocks, aiding geological mapping and the interpretation of concealed bedrock structures (Sharma, 1987). Intrusive igneous bodies, particularly carbonatite-alkalic intrusions, alkaline intrusions, and pegmatites, serve as significant sources of heat, materials, and fluids for REE mineralisation (Long et al., 2012). Magnetic survey techniques are regarded as exceptionally efficacious geophysical methodologies for identifying carbonatite-alkalic intrusive bodies, which commonly produce strong positive magnetic anomalies with circular to near-circular, crescent-shaped, or ring-like geometries (Simandl and Paradis, 2018; Thomas et al., 2016). Magnetic responses to REE mineralisation can be highly variable and depend on the nature of host rocks. White (2005) interprets the Yerila Granite (Table 1) in the study area not as a true granite (although parts of the protolith may have been deformed granite) but as a metasomatic allanite-rich rock, where the highest REE enrichment (Th, U, Zr, Y, and REEs) occurs in calcsilicate rocks that exhibit relatively distinct magnetic signatures compared to surrounding lithologies. The magnetic data (Table 2) utilised in this study include total magnetic intensity, processed using various methods (see Table 2 for details) to enhance the accuracy, resolution, and interpretability of the analysis. The total magnetic intensity grid is generated from aeromagnetic survey data with a resolution of 80 m. The acquired aeromagnetic data represent a merger of high-ranked grids with low-ranked grids and base grids. This approach ensures that geological information corresponding to different depths is effectively preserved in the final compiled map (for further details, see Reed and Keeping, 2025a).
Gravity surveys rely on subtle variations in the gravitational field, which are related to differences in the density of subsurface materials (Reynolds, 2011). Alkaline igneous rock systems, such as carbonatites, are often significant parental rocks for skarn-type REE deposits (Goodenough et al., 2021). Gravity surveys are typically employed to study alkaline igneous rock systems, as these rocks generally exhibit high-density characteristics and can be associated with positive gravity anomalies and pronounce density contrasts compared to surrounding rocks (Drenth, 2014). The gravity data (Table 2) for the study area were subjected to Bouguer anomaly correction. Additionally, the dataset includes vertically derived gravity gradient data processed using first vertical derivatives and residual gravity data obtained by subtracting a 1000 m upward-continued grid. All the gravity data are gridded at a resolution of 100 m. Although the gravity data used in this study have been processed into a regular metre grid, the effective resolution is primarily controlled by survey line spacing. Line spacing across the study area varies from 4000 to 8000 m, resulting in spatial variations in the sensitivity of the data to shallow versus deep geological structures (for further details, see Katona, 2017).
Radiometric measurement data play a critical role in REE mineral exploration, as they effectively display, interpret, and help understand underground geological structures and rock characteristics, particularly for rock types that exhibit significant radiation anomalies (Bustillo Revuelta, 2018). Radiometric surveys yield estimates of K, U, and Th concentrations using gamma-ray spectrometric analysis. A widespread positive correlation is observed between REEs and radioactive elements in many known REE deposits (Thomas et al., 2016). This positive correlation primarily arises from the similar geochemical behaviours of U, Th, and REEs, leading to the enrichment of these radioactive elements in REE minerals such as bastnäsite, monazite, thorite, fluorocarbonate cerium, and zircon (Walters and Lusty, 2011). A compelling example of this relationship is demonstrated at REE Location D (Fig. 1), which represents a Cu-U-REE mineral system associated with hydrothermal fluid flow during the Ordovician (Zivak, 2024). The mineralisation is hosted within multiply deformed, pyrite-rich metasedimentary and metavolcanic rocks, where REEs and uranium are highly concentrated, predominantly in monazite and, to a lesser extent, in apatite (which locally contains up to 11 % total REEs). Critically, both the radioactive elements and REEs were co-transported by hydrothermal fluids sourced from granitoid rocks along the eastern extremity of the Paralana Fault (Marshall, 1979). This genetic link between U–Th–K and REE enrichment provides a robust basis for using radiometric data as a proxy for REE prospectivity. The radiometric data (Table 2) utilised in this study include grids of K (in % K), U (in equivalent ppm), and Th (in equivalent ppm), with these concentrations generated by merging data recorded from various airborne radiometric surveys. Additionally, the database includes ground dose estimates derived from the linear combination of K, Th, and U grids. The radiometric data were processed following a similar approach to the aeromagnetic data, merging grids of multiple resolution levels to preserve geological information at different scales (for further details, see Reed and Keeping, 2025b).
3.1.3 Remote sensing data layers
The distribution of REEs in igneous and metamorphic rocks is significantly influenced by hydrothermal alteration and mineralisation processes (Lottermoser, 1992). The study of altered rocks is considered an effective tool for analysing the properties of mineralising fluids, conditions of mineralisation, and the evolution of hydrothermal alteration (Bedini, 2011). Remote sensing is an important method for mineral prospecting, utilising hyperspectral and multispectral data to detect hydrothermally altered minerals with diagnostic spectral absorption characteristics (Pour and Hashim, 2011). Metasomatism plays a crucial geochemical role in the concentration of REEs, U, and Th, often producing diagnostic mineralogical assemblages detectable through remote sensing (Khoshnoodi et al., 2016). For example, Location A (Fig. 1), defined by the Yerila Granite, demonstrates intense metasomatic enrichment that can be captured by remote sensing data. The Yerila Granite (∼1560 Ma, Moolawatana Suite) is geochemically unique, with extremely high REE contents and exceptional radioactivity, making it possibly the most radioactive granite in Australia (White, 2005; Sheard, 2009). This enrichment is attributed to metasomatic processes that produced diagnostic REE-bearing minerals including allanite, monazite, yttrotitanite, and zircon, accompanied by K-feldspar alteration and fluorite mineralisation (White, 2005). These metasomatic assemblages and associated alteration minerals exhibit distinct spectral signatures in the visible-near infrared (VNIR) and shortwave infrared (SWIR) regions. Therefore, remote sensing products can be used to explore the potential associations between the distribution of metasomatic rocks and the occurrence of REE mineralisation. The suite of ASTER geoscience products (Table 2) used in this study provides fundamental information about the dominant mineral components of the rocks and soils in the study area.
3.1.4 Digital elevation model
Digital elevation models (DEMs) are digital representations of Earth's topography, created using topographic elevation data, effectively representing surface morphology in a numerical array format (Guth et al., 2021). By integrating elevation data with other exploration datasets, a more comprehensive understanding can be gained of how various geological processes and environmental conditions influence mineralisation. For example, the high immediately to the west of REE Location G (Fig. 1), which is centred on Radium Ridge, demonstrates a clear relationship between topography and mineralisation. Radium Ridge is a prominent topographic feature extending approximately 3 km in an east-west direction, characterised by steep slopes on its southern flank and gentler gradients on the northern side (Sullivan et al., 1945). The steepest sections of the ridge result from differential weathering resistance of a silicified zone, which hosts small hydrothermal Fe-rich U and REE prospects along the ridge crest (Sullivan et al., 1945). This exemplifies how DEM data can capture the topographic expressions that result from structurally-controlled mineralisation and lithological contrasts caused by differential weathering and silicification processes, thereby serving as an indirect indicator of potential mineralised zones. The DEM (Table 2) for the study area is based on a 9-second latitude and longitude grid and uses the Geocentric Datum of Australia 1994 coordinate system, with each grid cell representing the approximate elevation at its centre. The elevation errors in the DEM are closely related to terrain complexity: in low-relief areas, the standard error does not exceed 10 m, while in complex highland regions, the standard error can reach approximately 60 m.
3.1.5 Geochemical data
Lithogeochemical data can reveal “in situ” geochemical processes related to the underlying geology (Grunsky and de Caritat, 2019). By analysing variations and characteristics of the geochemical composition of rocks, particularly the distribution and enrichment of REEs, as well as potential rock types and hydrothermal influences, important insights for locating REE deposits can be obtained. The geochemical data (Table 2) used in this study encompasses 27 elemental variables, including trace elements, REEs, and major oxide components, which provide crucial information for identifying potential REE mineralisation zones.
This study incorporates vector, raster, and tabular data layers. The geological data layers are in vector format, comprising polylines and polygons. To effectively characterise the controlling influence of geological features such as Early Mesoproterozoic faults, felsic granites, and mesoproterozoic strata on mineralisation, these features are assigned values based on their spatial distribution. Grids covering the study area are first generated, and the distance from each grid point to the nearest geological feature boundary is calculated. The distance data are then normalised and inverted, so that the value assignment adheres to the “distance–weight” principle, the closer to the geological feature, the higher the assigned value; conversely, the farther away, the lower the value. The value range is defined from 0 to 1. This linear scaling and distance inversion approach is adopted to avoid imposing a priori assumptions about spatial decay patterns, whilst implementing the proximity principle whereby mineralisation potential increases with proximity to known geological controls. The raster data comprises geophysical and remote sensing layers, as well as a DEM. The following steps are carried out to extract a series of features from these layers for various point sets, including known mineral occurrences and randomly selected samples. First, statistical features for each target point are extracted by calculating the mean and standard deviation of raster values within a circular buffer zone with approximately an 1 km radius around each point (all buffer zone sizes in this study are determined through systematic optimisation involving iterative model training and performance evaluation). These statistics reflect the central tendency and dispersion of the area surrounding the target point. Second, texture features for each target point are computed using a square window of approximately one km side length around each point, based on the calculation of the dissimilarity and correlation of the grey-level co-occurrence matrix (GLCM). This approach characterises the spatial variability within the area surrounding each point. We extract elevation gradients in east-west and north-south directions from the DEM data. We then calculate the mean gradient values within a buffer zone of approximately one km radius around each point to reflect the terrain variation trends. Consequently, higher-dimensional raster features are generated for each point.
To address potential issues arising from feature redundancy and multicollinearity in downstream data mining and analysis, we calculate the Spearman correlation (Hauke and Kossowski, 2011) between the raster features. By comparing different correlation thresholds, removing features with correlations above the threshold, and evaluating the effect of the selected features on model performance, we determined 0.65 to be the optimal threshold. The lithogeochemical data are in tabular format, and to address issues associated with censored data, outliers, and missing values, we employ the Limit Replacement Method (VanTrump and Miesch, 1977), Tukey's boxplot method (Tukey, 1977), and the Random Forest algorithm (Breiman, 2001) for appropriate data processing (Luo et al., 2024). The detailed procedure can be found in Luo et al. (2024). Based on the location of each point, geochemical samples within approximately 1.5 km are extracted. The inverse square of the distance is used as a weight to calculate a weighted average of the geochemical concentrations of these samples, generating the corresponding elemental concentration for each point. In cases where corresponding geochemical samples are unavailable, the median value of the elements is adopted as the elemental value for the point. To address spurious correlations between variables in geochemical data caused by the closure effect, the Isometric Log-Ratio (ILR) transformation (Egozcue et al., 2003) is applied to “open” the geochemical composition data. Subsequently, Robust Principal Component Analysis (RPCA) (Filzmoser et al., 2009) is utilised to extract geochemical information related to geological processes while reducing the effects of noise and outliers. Nevertheless, a limitation of the ILR transformation is that the transformed components lose their direct relationship to the initial input variables. To enable interpretation of the resulting scores and loadings from the RPCA on ILR-transformed data, spatial transformations are employed to back-transform the principal component (PC) scores, facilitating the interpretation of relationships between each PC and the elements (Filzmoser et al., 2009) (Fig. A1). The back-transformed PC scores are then used as geochemical features.
3.2 Semi-supervised deep learning framework
Semi-supervised learning represents an intermediate paradigm between supervised and unsupervised learning approaches, leveraging the combination of limited labelled data and abundant unlabelled samples to drive model training (Ruff et al., 2019). This methodology enables enhanced predictive accuracy while simultaneously reducing annotation costs. This paradigm is particularly well-suited for anomaly detection (AD) tasks: under conditions where anomalous samples are extremely scarce while normal samples are relatively abundant, semi-supervised anomaly detection aims to identify observations that significantly deviate from the joint distribution of normal data and construct decision boundaries capable of effectively distinguishing between anomalous and normal patterns (Ruff et al., 2019; Zhang et al., 2018). Studies have demonstrated that with as little as 1 % labelled anomalies, appropriate semi-supervised methods can achieve effective performance (Pang et al., 2019). Mineral deposits can be conceptualised as rare “geological anomalies” formed through the coupling of multiple geological processes (Cheng and Zhao, 2011). Ore-forming processes are typically accompanied by a series of geological anomalous phenomena and products (e.g., structural, lithological, mineralogical, and fluid-related), which are manifested in multi-source datasets including geological, geophysical, geochemical, and remote sensing data (Zhao, 2002). MPM enables the extraction of mineralisation-related anomalous information from these multi-source exploration datasets, thereby providing target area guidance for subsequent exploration deployment. However, some early semi-supervised AD methods implicitly assume “anomaly homogeneity” (i.e., anomalous samples are mutually similar; Liu et al., 2002, 2003), which often fails to hold in complex geological settings characterised by diverse mineralisation types and varying ore-forming mechanisms. Pang et al. (2019) proposed a semi-supervised neural architecture, known as DevNet, which directly optimises anomaly scores through an end-to-end network. This method leverages a few labelled outliers as prior information to accommodate anomalies exhibiting different abnormal behaviours. The approach has demonstrated excellent performance in fields such as network security intrusion detection, gear pitting fault detection, and geochemical anomaly identification (Alper et al., 2023; Luo et al., 2024; Zheng et al., 2024).
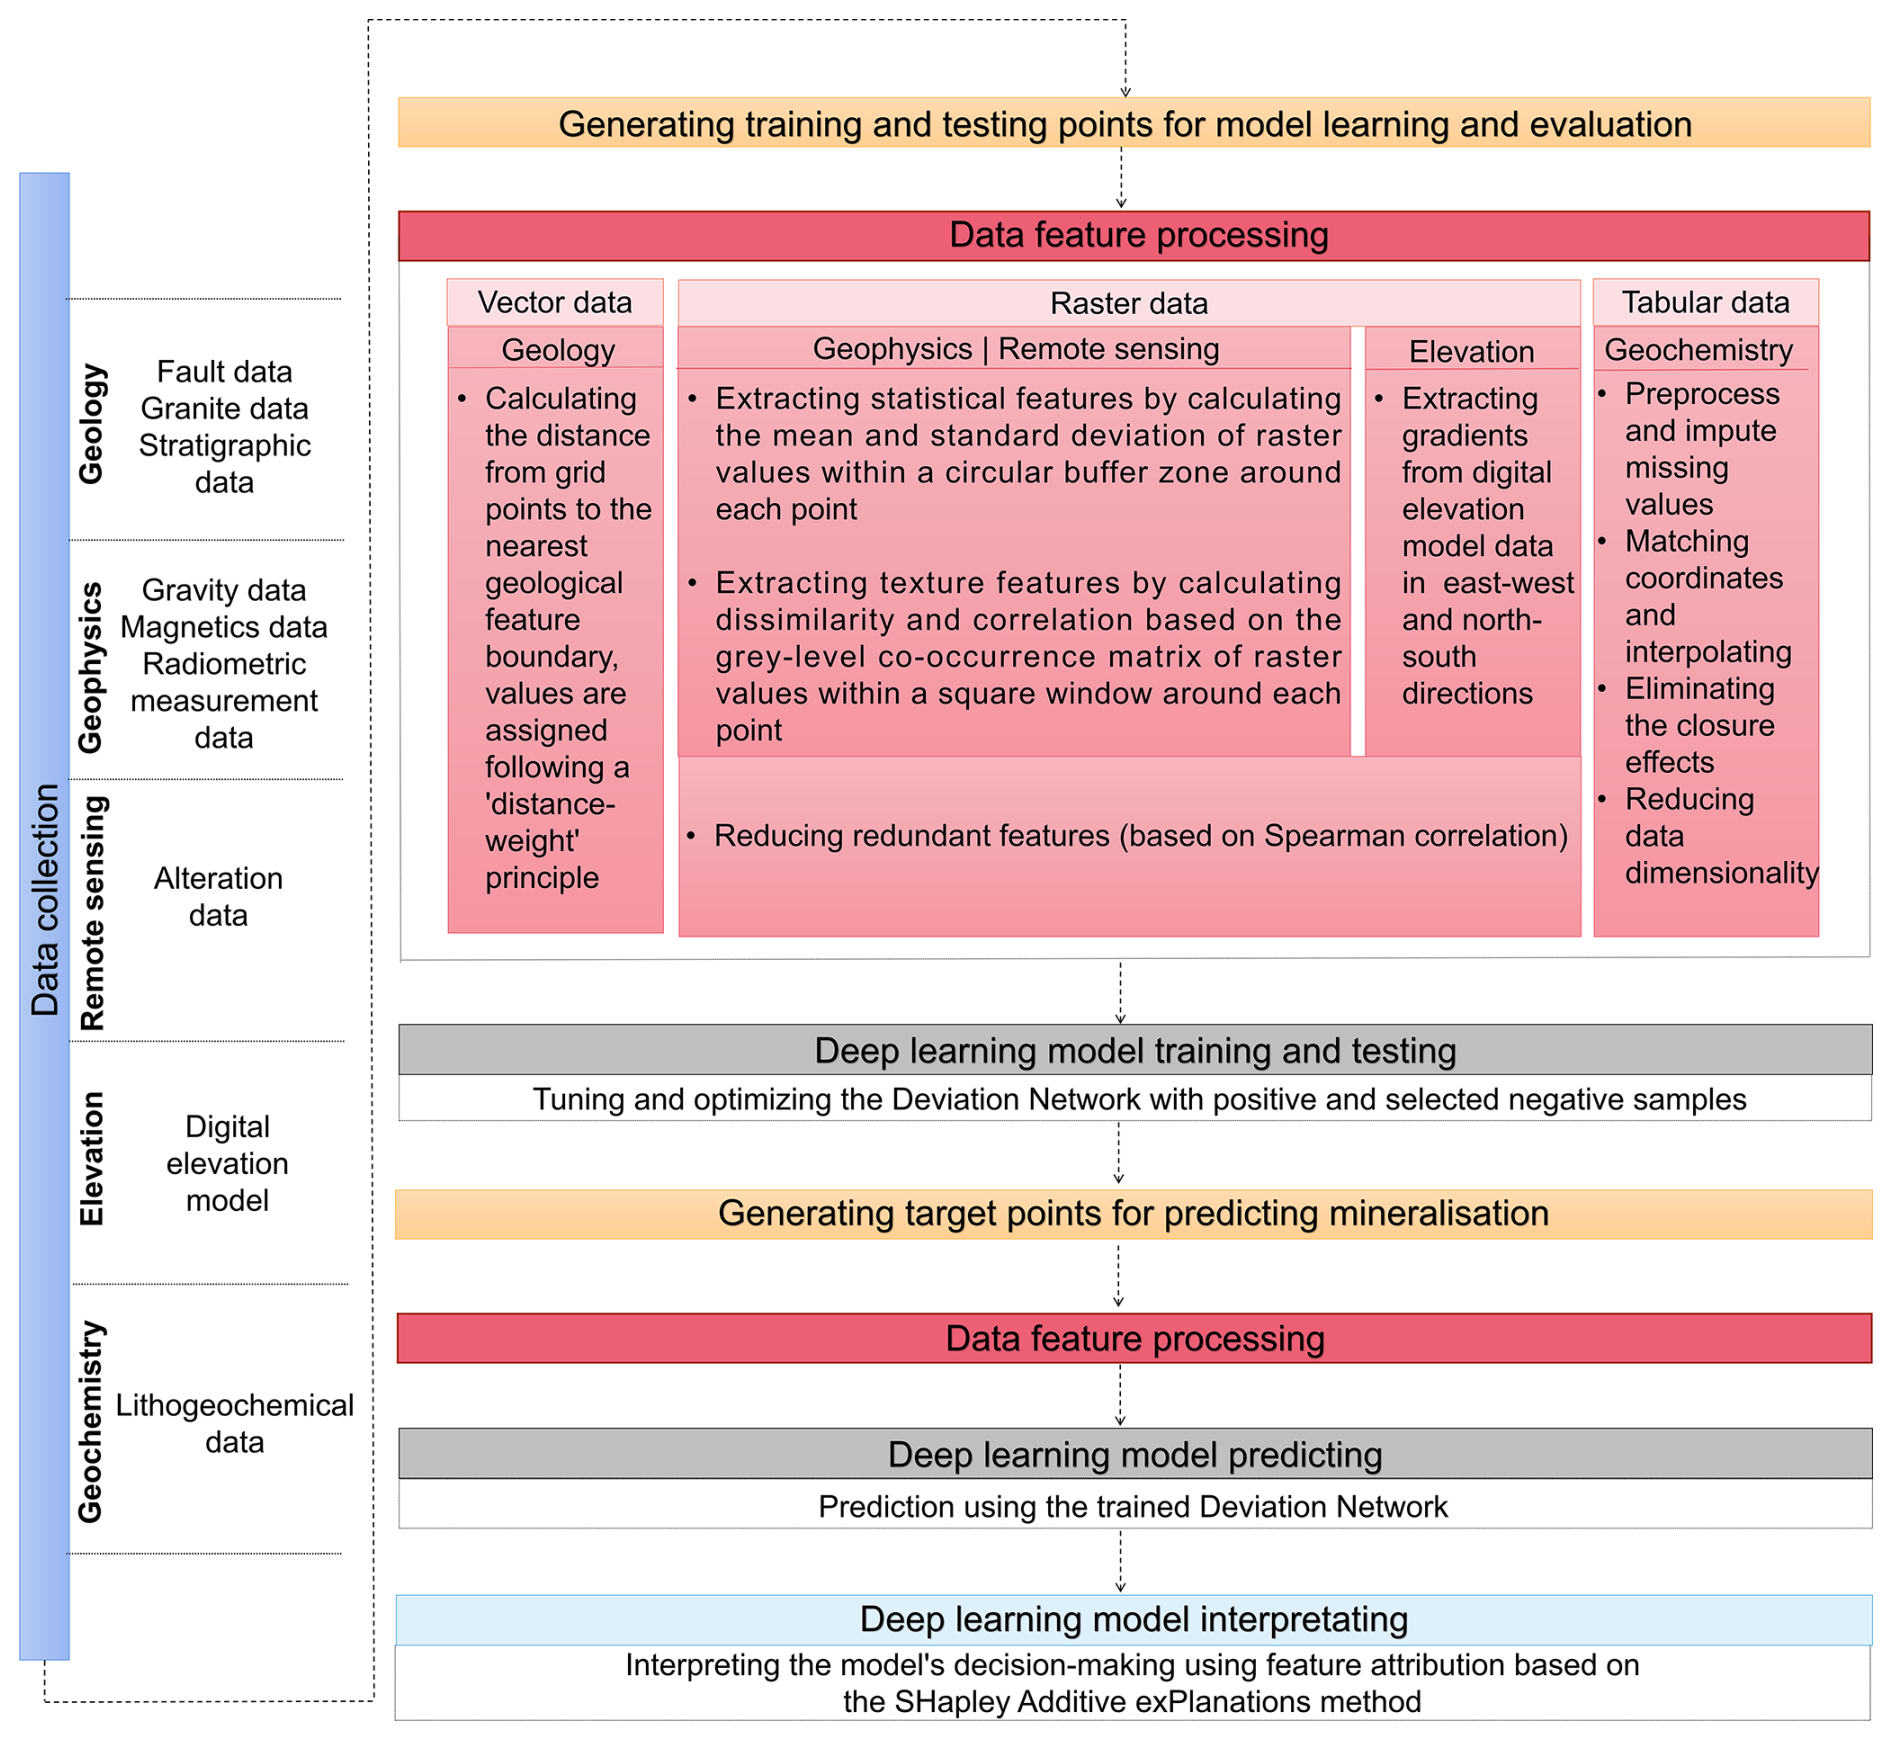
The DL-based framework developed in this study, DEEP-SEAM (Fig. 2), encompasses data cleaning and preprocessing, redundancy filtering, and noise reduction for multi-source exploration datasets, followed by deep data mining to identify potentially favourable mineralisation areas within the study area. Additionally, the framework employs a post-hoc interpretability technique to analyse the contributions of different exploration data features to account for the obtained mineralisation probabilities. This study provides corresponding processing solutions for each key step and produces reliable and credible results for mineral prospectivity delineation. First, data quality has a significant impact on the performance of DL models. Therefore, this study collects multi-source exploration data and processes it effectively to reflect geological processes and subsurface geological structures associated with mineralisation. Based on this, a set of random samples is created in the study area and prepared for division into training and test sets. From the random sample set, those located over 5 km from known mineral occurrences are selected as negative samples, following established practices in mineral prospectivity modeling (Carranza et al., 2008; Nykänen et al., 2015; Zuo and Carranza, 2011). This distance threshold ensures that negative samples are collected from areas unlikely to be influenced by known mineralization processes, while maintaining sufficient spatial coverage for model training. 70 % of the negative and positive samples are randomly chosen to form the training set. The remaining 30 % of the samples constituted the testing set. Subsequently, a DevNet, a cutting-edge semi-supervised DL approach, is utilised to learn from the training data. It is important to note that the DevNet used in the framework can function effectively under significant class imbalance between positive and negative samples. Moreover, the selection of negative samples is not highly sensitive; even if the chosen negative samples contain potential positive samples, the model still performs well, as it learns the general patterns of the negative sample set. The model's performance is evaluated using the testing set to determine the optimal DL model structure. Then, a set of regular samples is generated within the study area to create a prediction set, and the trained DL model is employed to generate a mineral prospectivity map for the prediction set. This framework is able to effectively identify prospectivity areas associated with mineralisation under the guidance of limited positive samples, while avoiding false targets generated by statistical noise or interfering geological processes. This study combines a feature attribution method to analyse the internal mechanisms of model predictions, thereby overcoming the shortcomings of DL approaches regarding interpretability and the resultant credibility issues of predictive outcomes. This analysis is further integrated with existing geological knowledge for a comprehensive evaluation, thereby enhancing the reliability of the predictions.
3.2.1 Deviation network
DevNet, proposed by Pang et al. (2019), employs a Gaussian prior and utilises a Z-score-based deviation loss function to facilitate direct anomaly scores optimisation through an end-to-end neural anomaly score learner (Fig. 3). DevNet comprises three primary modules, including an anomaly scoring network, a reference score generator, and a deviation loss.
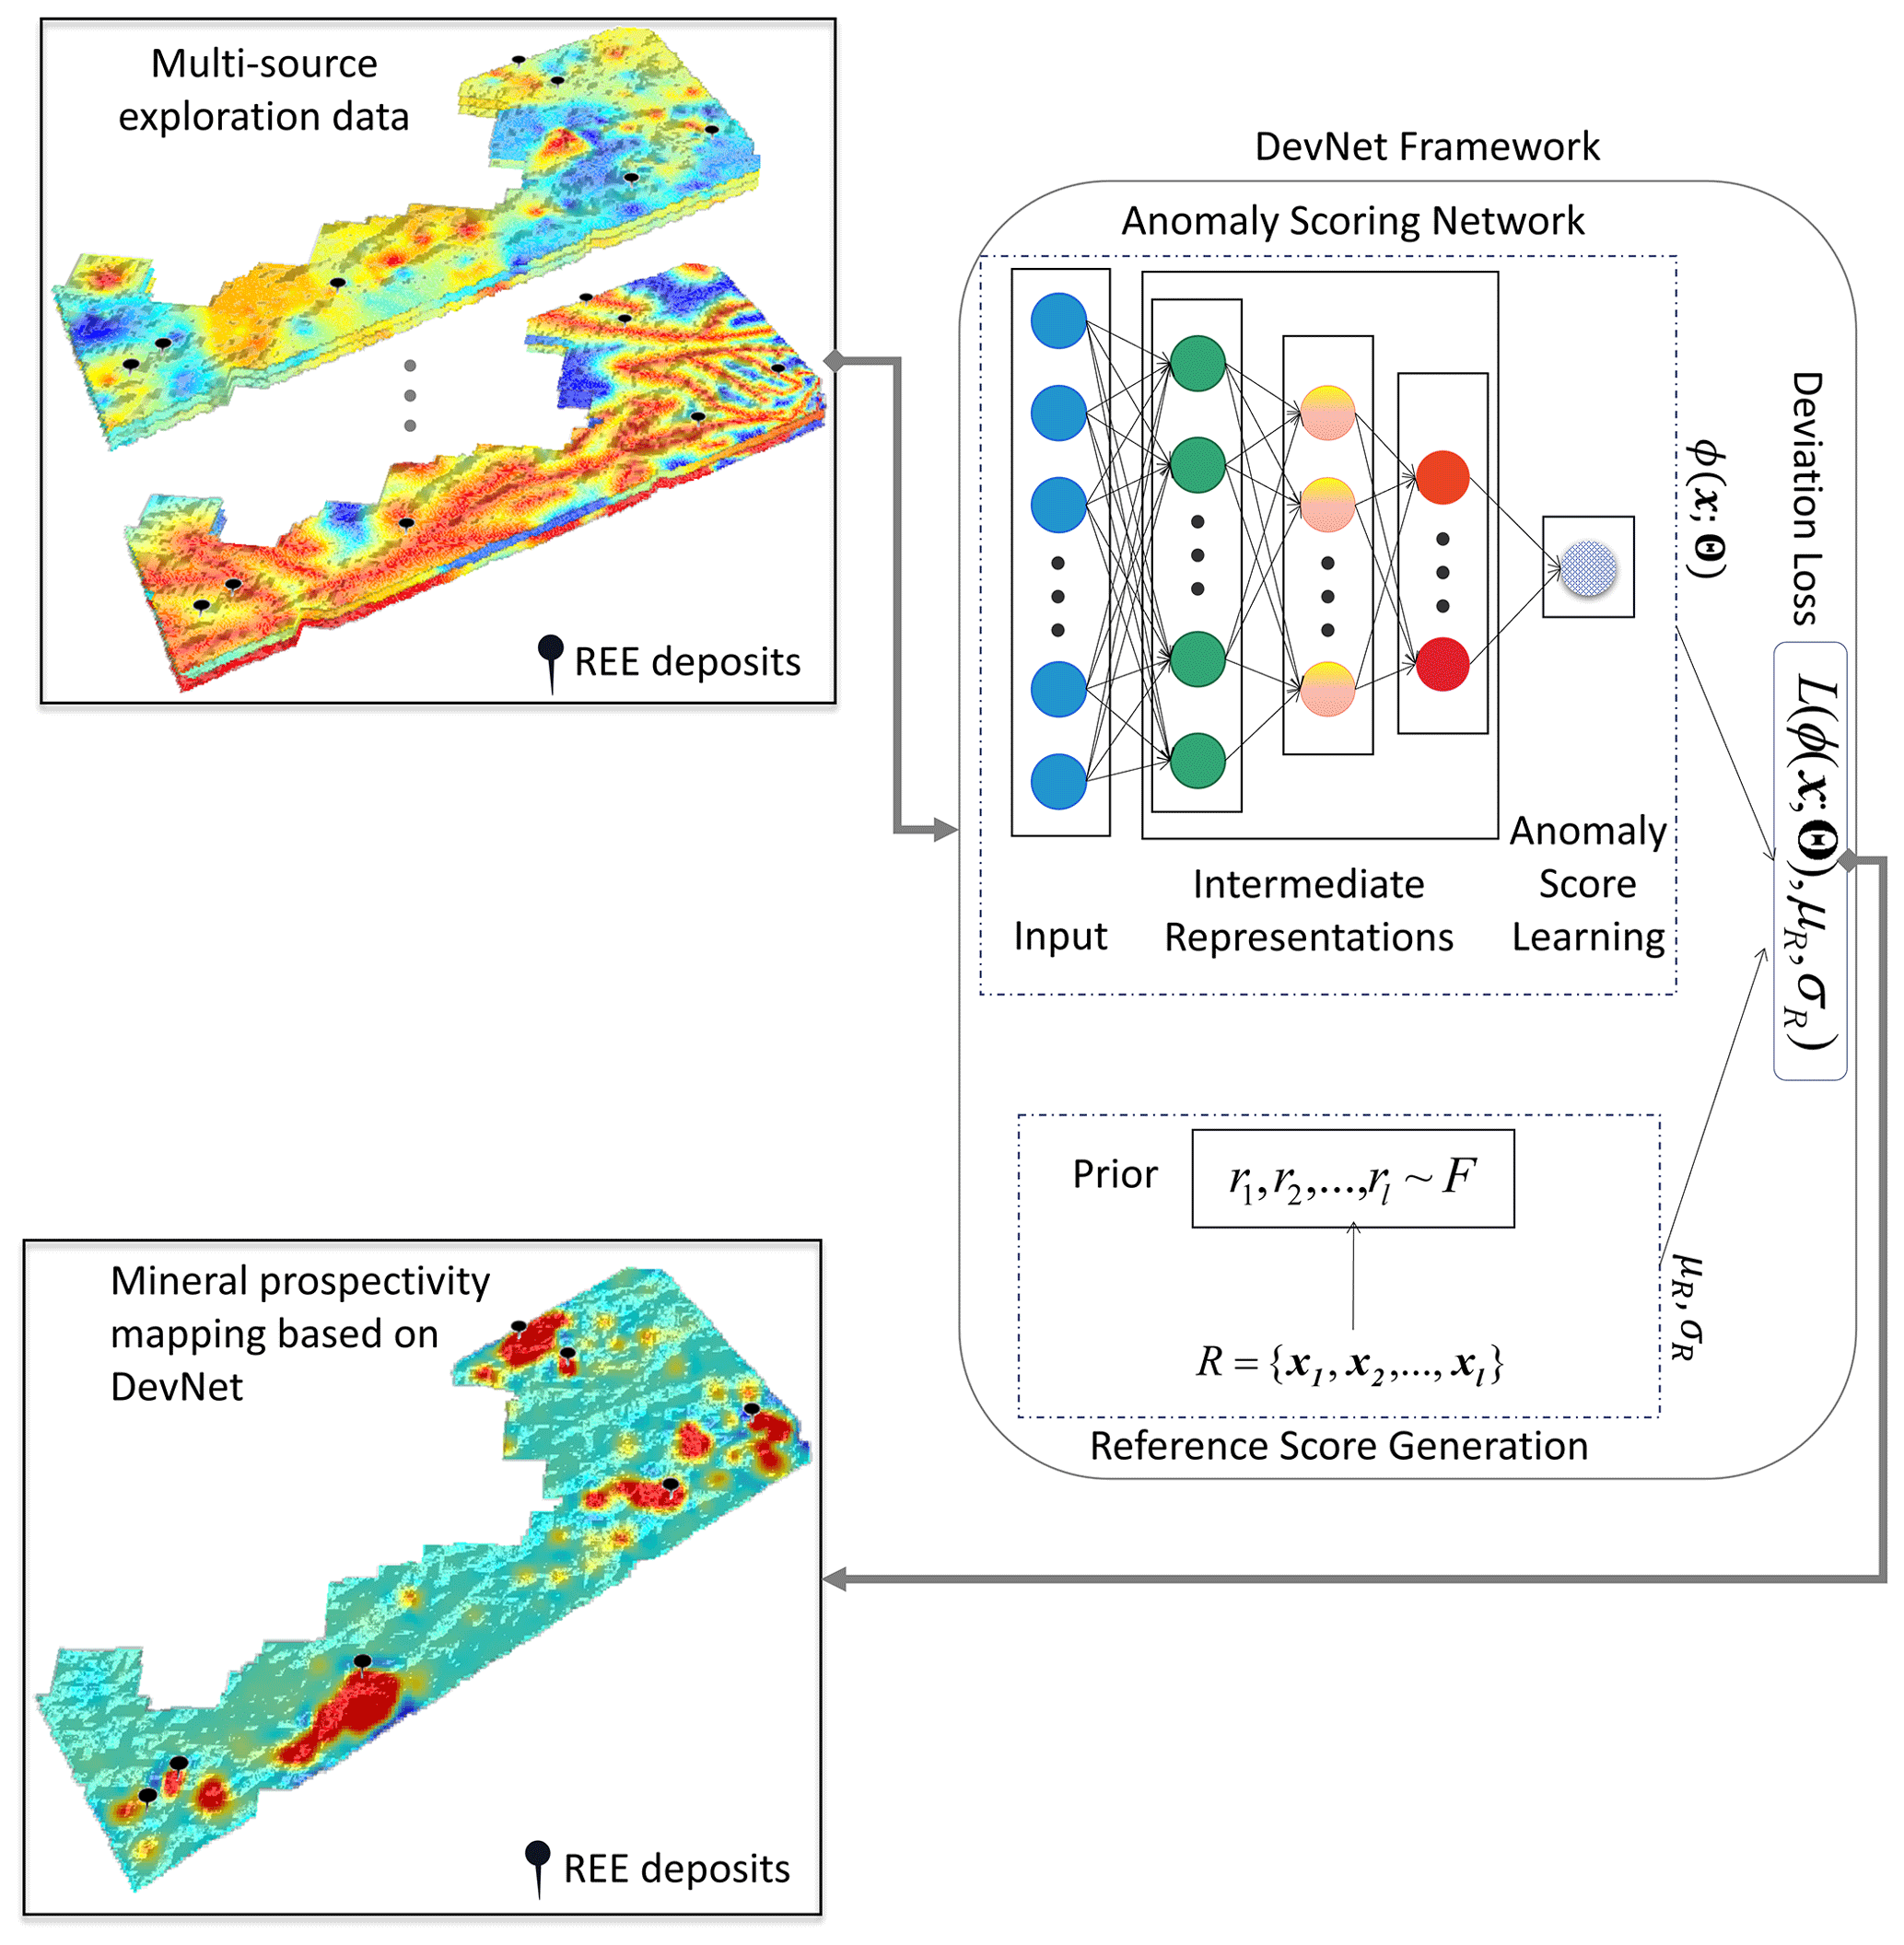
Figure 3Architecture of the DevNet for probability score calculation.
DevNet differs from the traditional two-step AD methods based on reconstruction error. DevNet establishes a nonlinear functional relationship between the input data and anomaly measurements through an end-to-end anomaly scoring module. Consider a dataset , xi∈RD, where represents the unlabeled data, and with M≪N denotes a small dataset of positive samples, which provides prior knowledge of anomaly patterns for model training. In this study, we utilise a feature representation learner ,where the dot (•) represents the input to the function, which is constructed with multiple hidden layers to map the input data x into an intermediate representation space Q∈RL (Eq. 1), where L denotes the dimensionality of the space Q resides in. Subsequently, we employ the developed anomaly score learner to compute anomaly values from the derived intermediate feature representation (Eq. 2). Combining the above components, the complete anomaly scoring module is then formulated as shown in Eq. (3).
where q∈Q
where Θs={wo}, wo is a weight matrice, is a bias term,
DevNet integrates a specialized a module designated as a reference score generator, architected to support anomaly scores ϕ(x;Θ) learning processes, and to compute a scalar value referred to as the reference score μR∈R. The reference score represents the average anomaly scores across a randomly chosen subsets of negative samples R. Two primary strategies exist for producing μR: data-driven and prior-driven methods. In this study, we adopt the prior-driven approach with μR computed according to the Gaussian prior probability.
where each ri is derived from N(μ,σ2) and corresponds to the anomaly score of a randomly selected negative sample. The Gaussian prior-based scores μR are used to optimise the anomaly scoring network ϕ(x;Θ). The deviation is specified as a Z-score as follows:
where σR indicates the standard deviation of the prior-based anomaly score set. The calculated deviation is subsequently incorporated into the contrastive loss to formulate the deviation loss:
We assign y=1 for a positive (anomalous) sample x, and y=0 for a negative (normal) sample, while a corresponds to the Z-score confidence interval parameter. Notably, all REE mineralisation points (occurrences, prospects, and deposits) in the study area are treated equally as positive samples (y=1), allowing the model to learn from the complete range of mineralisation signatures.
3.2.2 Post-hoc interpretability
Additive feature attribution methods represent a significant category within the field of explainable DL. These methods explain individual predictions of DL models by representing the model output as a sum of contributions from individual input features. The SHAP framework (Lundberg and Lee, 2017), a classical additive feature attribution approach, integrates previous explanation methods such as local interpretable model-agnostic explanations (LIME; Ribeiro et al., 2016) and DL important features (DeepLIFT; Shrikumar et al., 2017), while incorporating Shapley values originating from game theory, thus providing both local and global perspectives for model interpretation (Fig. 4). Furthermore, compared to the aforementioned methods, SHAP is recognised for possessing three ideal properties: local accuracy – where the explainer exactly matches the original model output when approximating it for a specific input; missingness – where features absent from the original input must have no contribution; and consistency – where if the model is revised to increase the influence of a particular feature, the attribution assigned to that feature must not decrease, regardless of other features. These three properties ensure the reliability of the explanations.

Figure 4Illustration of SHAP-based interpretation of model predictions via feature contributions.
The Shapley value represents an equitable distribution mechanism for apportioning benefits among participants according to their individual contributions, originating from economist Lloyd Shapley's foundational work. This allocation principle can be mathematically expressed as:
where S corresponds to a feature subset within the input space. K indicates the set of all inputs. E[f(x)|xs] refers to the expected value of the function on subset S. Consider a training dataset used to train a predictive model f(x) (specifically a DevNet in this study). This model aims to establish a mapping as accurately as possible between the response value y and the input training data x. SHAP provides an interpretable model g(x) to reveal the impact of input features on the model's output.
where x′ denotes the simplified input, serving as a function that transform x′ to the original x, and ϕ0=f(hx(0)) represents the model output with all simplified inputs toggled off. Several versions of SHAP, such as DeepSHAP, Kernel SHAP, LinearSHAP, and TreeSHAP, have been proposed to cater to specific categories of ML models. In this study, we adopted Kernel SHAP. Kernel SHAP integrates linear LIME and constructs an interpretable local model by utilising a small background dataset derived from the data, approximating the original model f. This approach enhances the sample efficiency and accuracy of SHAP value estimations without relying on specific model types.
3.2.3 Implementation
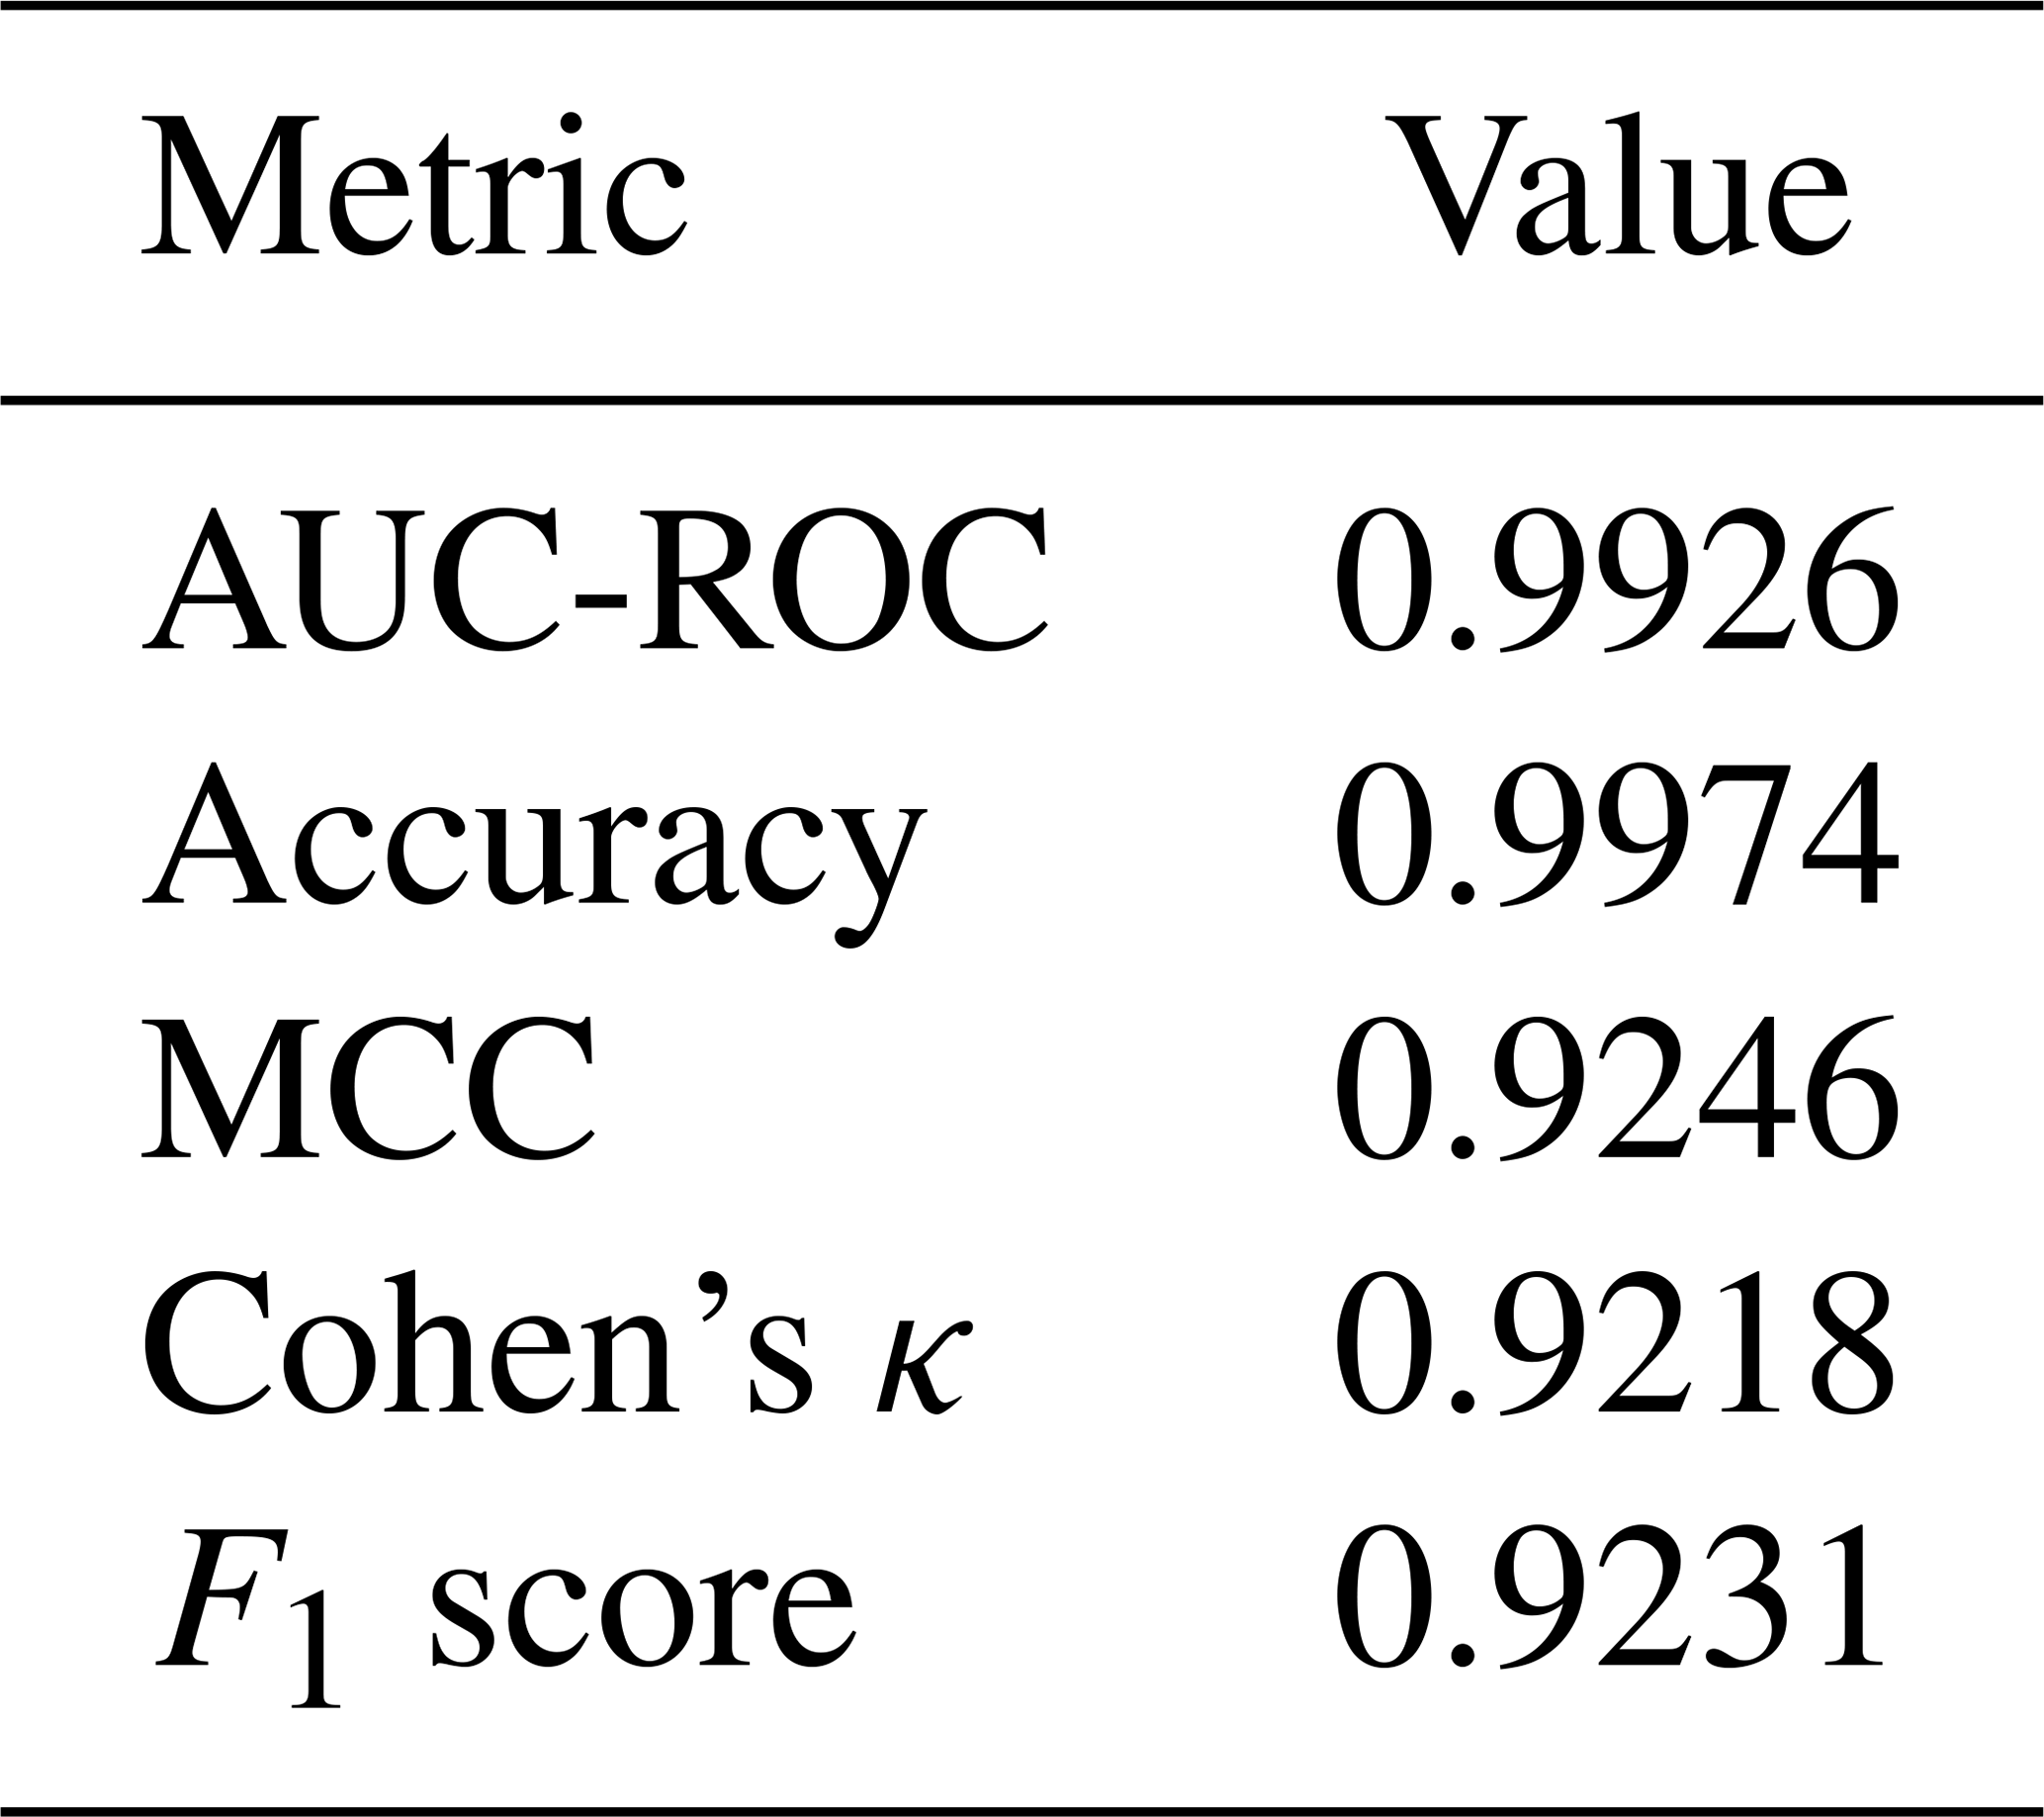
The processing steps of this study include multi-source exploration data preprocessing, feature generation, building a DL model, and interpreting the model, primarily relying on the Python programming language. Additionally, the R programming language is utilised for the ILR transformation and RPCA of the geochemical data. Notably, the construction of DevNet significantly impacts the quality of the mineral prospectivity map. Hyperparameter tuning is conducted to identify the optimal settings, with the goal of improving the performance of the DL model. The architecture and hyperparameter settings of the DevNet model are determined through trial-and-error, with iterative refinement based on performance evaluation across different configurations on the testing set. Model performance is assessed using the receiver operating characteristic (ROC) curve (Fawcett, 2006), Cohen's κ coefficient (Cohen, 1960), the Matthews correlation coefficient (MCC; Baldi et al., 2000), and the F1 score (Van Rijsbergen, 1974). These metrics provide a comprehensive assessment of the model's predictive performance, particularly under class imbalance and potential chance agreement. The ROC curve is a common technique for evaluating classification models, it is a two-dimensional plot where the y axis represents the true positive rate (TPR) and the x axis represents the false positive rate (FPR). The model's classification performance is typically quantified by the area under the curve (AUC). The AUC ranges from 0 to 1, summarising the overall performance of the classification model into a single statistical metric. An AUC measurement of 0.5 reflects performance equivalent to random classification, while an AUC value approaching 1 indicates superior classification performance. Cohen's κ Coefficient is a statistical measure of agreement between categorical outcomes, adjusted for the possibility of random chance. This metric effectively reflects the difference between the classifier and random guessing, making it particularly important in evaluating multi-class or imbalanced datasets. MCC is another robust metric that addresses class imbalance issues. MCC is a symmetrical measure, meaning that its value remains unchanged when positive and negative class labels are swapped. The MCC ranges from −1 to 1, where −1 indicates completely incorrect classification (i.e., the model predicts all positive samples as negative and all negative samples as positive), 1 indicates perfect classification, and values near 0 suggest predictions close to random guessing. The calculation of these three metrics relies on the confusion matrix derived from the model's predictions versus the actual labels. Thus, the classification threshold plays a critical role in model evaluation. The threshold determines the point at which the model's predicted probabilities are converted into binary labels (i.e., positive or negative). In this study, the classification threshold is determined by evaluating multiple thresholds and selecting the one that maximises the F1 score.
Consequently, the architecture of the determined DevNet model comprises an input layer, two hidden layers, and an output layer, with the number of neurons being 57, 24, 12, and 1, respectively, and the weights and biases shown in Fig. B1. The hidden layers use the ReLU activation function to introduce non-linearity, enhancing the network's ability to learn complex features. The output layer employs a linear activation function to generate continuous probability scores. The optimisation algorithm used for the model is Nadam, with the initial learning rate set at 0.005. Each batch comprises 128 samples during training, with each epoch consists of 5 batches. A total of 500 epochs are used for model training.
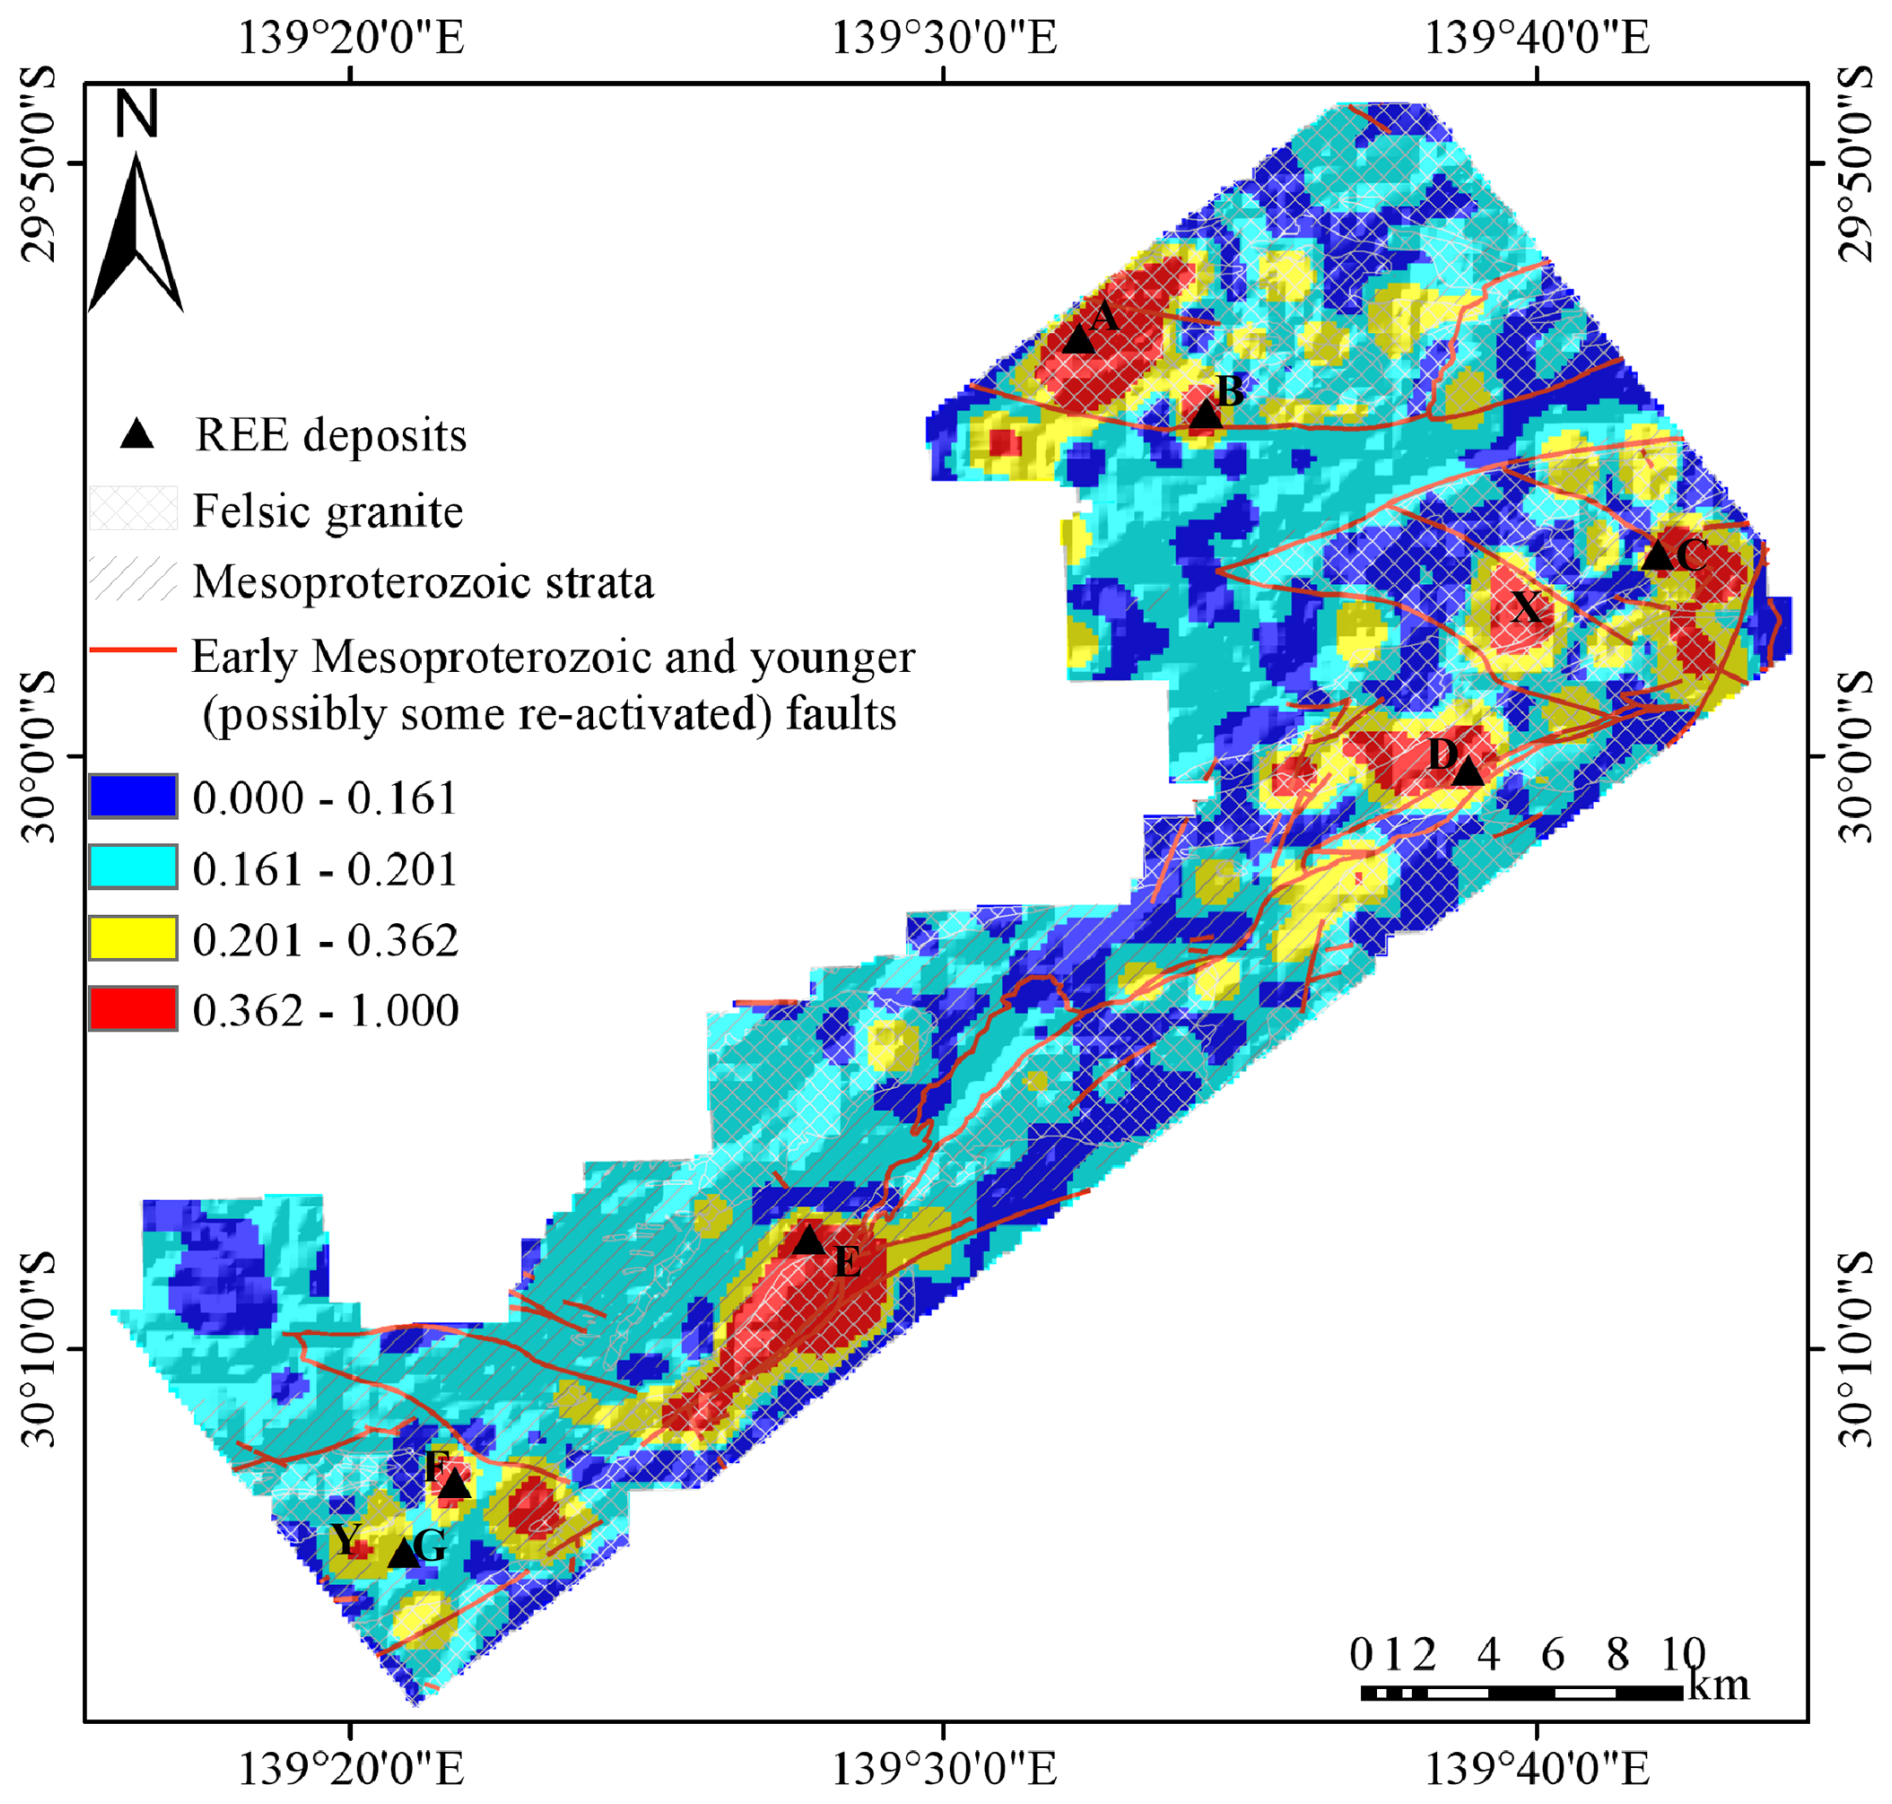
Figure 5Prospectivity map showing the spatial distribution of predicted values for REE deposits generated by DevNet in the north-western Curnamona Province.
This study integrates multi-source exploration data and transforms them into a mineral prospectivity map utilising a semi-supervised DL model. Additionally, it provides interpretability for understanding the model's prediction process. Geological, geophysical, geochemical, remote sensing and DEM data layers are used to construct 57 features for each spatial location (hereinafter referred to as “samples”). Feature values at each location are extracted from the multi-source data layers through spatial querying. The mineralisation probability is obtained by normalizing the anomaly scores output (the original value of the model output) by DevNet. Table 3 presents the performance evaluation results of DevNet based on various metrics, using all positive and negative samples from the randomly selected sample set. Based on the definitions of the aforementioned evaluation metrics, the AUC, Cohen's κ, and MCC values presented in the table exceed the random baseline, demonstrating that DevNet maintains discriminative and ranking capabilities for mineralised versus non-mineralised samples even under conditions of severe class imbalance. Figure 5 shows the mineralisation probability prediction results based on the trained DevNet model for the regularly sampled prediction dataset. The geometrical Interval method divides the predicted probabilities into four intervals, with nearly all REE deposits located within or near the red high-probability area. The exception being Location G – Mount Gee East – which, however, represents an extensive subsurface U and REE deposit. The high immediately to the west – Location Y – highlights a number of small hydrothermal Fe-rich U and REE prospects. Additionally, the high prospectivity areas identified by the proposed framework, excluding known mineral occurrences, are subjected to further analysis (Fig. 5). Based on comprehensive review of historical exploration company reports, location X comprises a metamorphosed volcano-sedimentary sequence with radioactive metasediments subdivided into (a) allanite-bearing calc-silicates and (b) allanite-biotite schists and granitic gneisses, likely derived from tuffaceous protoliths. Allanite serves as the principal REE- and U-bearing phase (Teale, 1981). Grab samples display anomalous concentrations of Ce (up to 4600 ppm), Th (3600 ppm), Nb (900 ppm), U (600 ppm), W (180 ppm), and Sn (170 ppm) (Brewer, 1980). The area extending southwest of location E, known as the Paralana Plateau, represents another prospective target successfully delineated by the proposed framework. Historical exploration by Exoil N. L. around 1970 identified multiple sub-vertical monazite-bearing schist lenses ranging from 7 to 17 m in thickness and 30 to 170 m in length (Exoil, 1970). The indicated resource exceeds 5 million tonnes of schist with monazite grades of 5 %–6 %. As monazite is a principal REE-bearing mineral (with some containing 50 %–70 % total rare earth oxides), this represents REE mineralisation potential. The anomaly southeast of location F is located on a silicified ridge of Mesoproterozoic rocks near the East Painter Uranium Workings, and this area is characterised by uranium mineralisation associated with anomalous REE and Cu concentrations (Teale, 1993; Robertson et al., 2006). The spatial and geological association suggests potential for REE mineralisation, warranting field investigation to validate the model prediction. Taken together, the aggregate performance metrics and the spatial analysis of the prospectivity maps suggest that the parameter-optimised DL model, DevNet, characterises the complex associations between multivariate features and mineralisation probability, thereby enabling the use of available geoscience data to estimate mineral potential in underexplored areas.
Additionally, these red high-potential areas are largely located within the distribution range of felsic granite. Granite bodies are typically considered key heat sources for hydrothermal circulation associated with mineralisation, and their hydrothermal activity is closely related to the mineralisation processes (Hoatson et al., 2011). Notably, the yellow medium-potential and red high-potential areas are distributed in regions characterised by fault development and probable fault reactivation within the granitic and metasedimentary Mesoproterozoic strata, which aligns with the REE mineralisation models utilising fluid pathways at varying time intervals within the study area. Success rate curves are highly effective in revealing the model's predictive performance. The success rate curve (Xu et al., 2020) is employed to evaluate the consistency between the anomaly probability scores derived from predictive samples and known mineral occurrences. This curve is generated by displaying the proportion of accurately identified deposits along the ordinate versus the proportion of the study area designated as prospective along the abscissa. Success rate analysis indicates that the top 2 % of the study area contains 86 % of the known mineral deposits, and 30 % of the area delineates all the REE deposits (Fig. 6). This performance represents an improvement over previous unsupervised DL approaches (e.g., Luo et al., 2023), demonstrating that DevNet can effectively reduce the search space for high-potential metallogenic targets. The model-defined prospective areas not only closely match the spatial distribution of known mineral occurrences but also align with existing geological knowledge, demonstrating significant spatial correlations with fault zones, felsic granite bodies, and Mesoproterozoic metasedimentary strata.
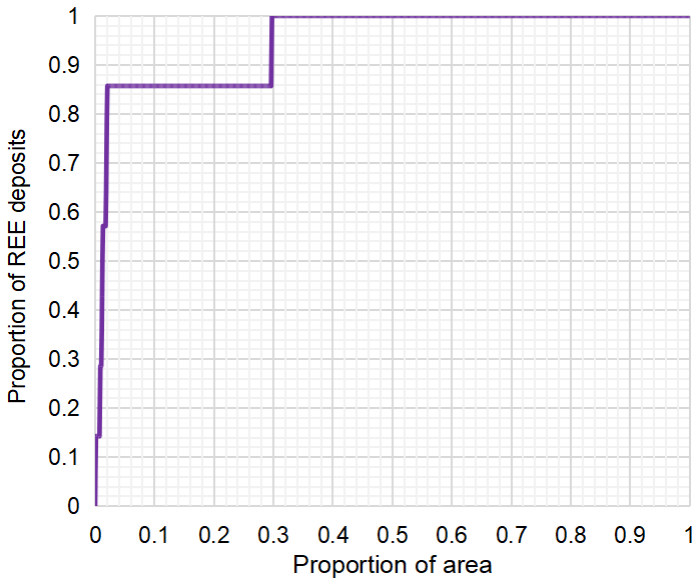
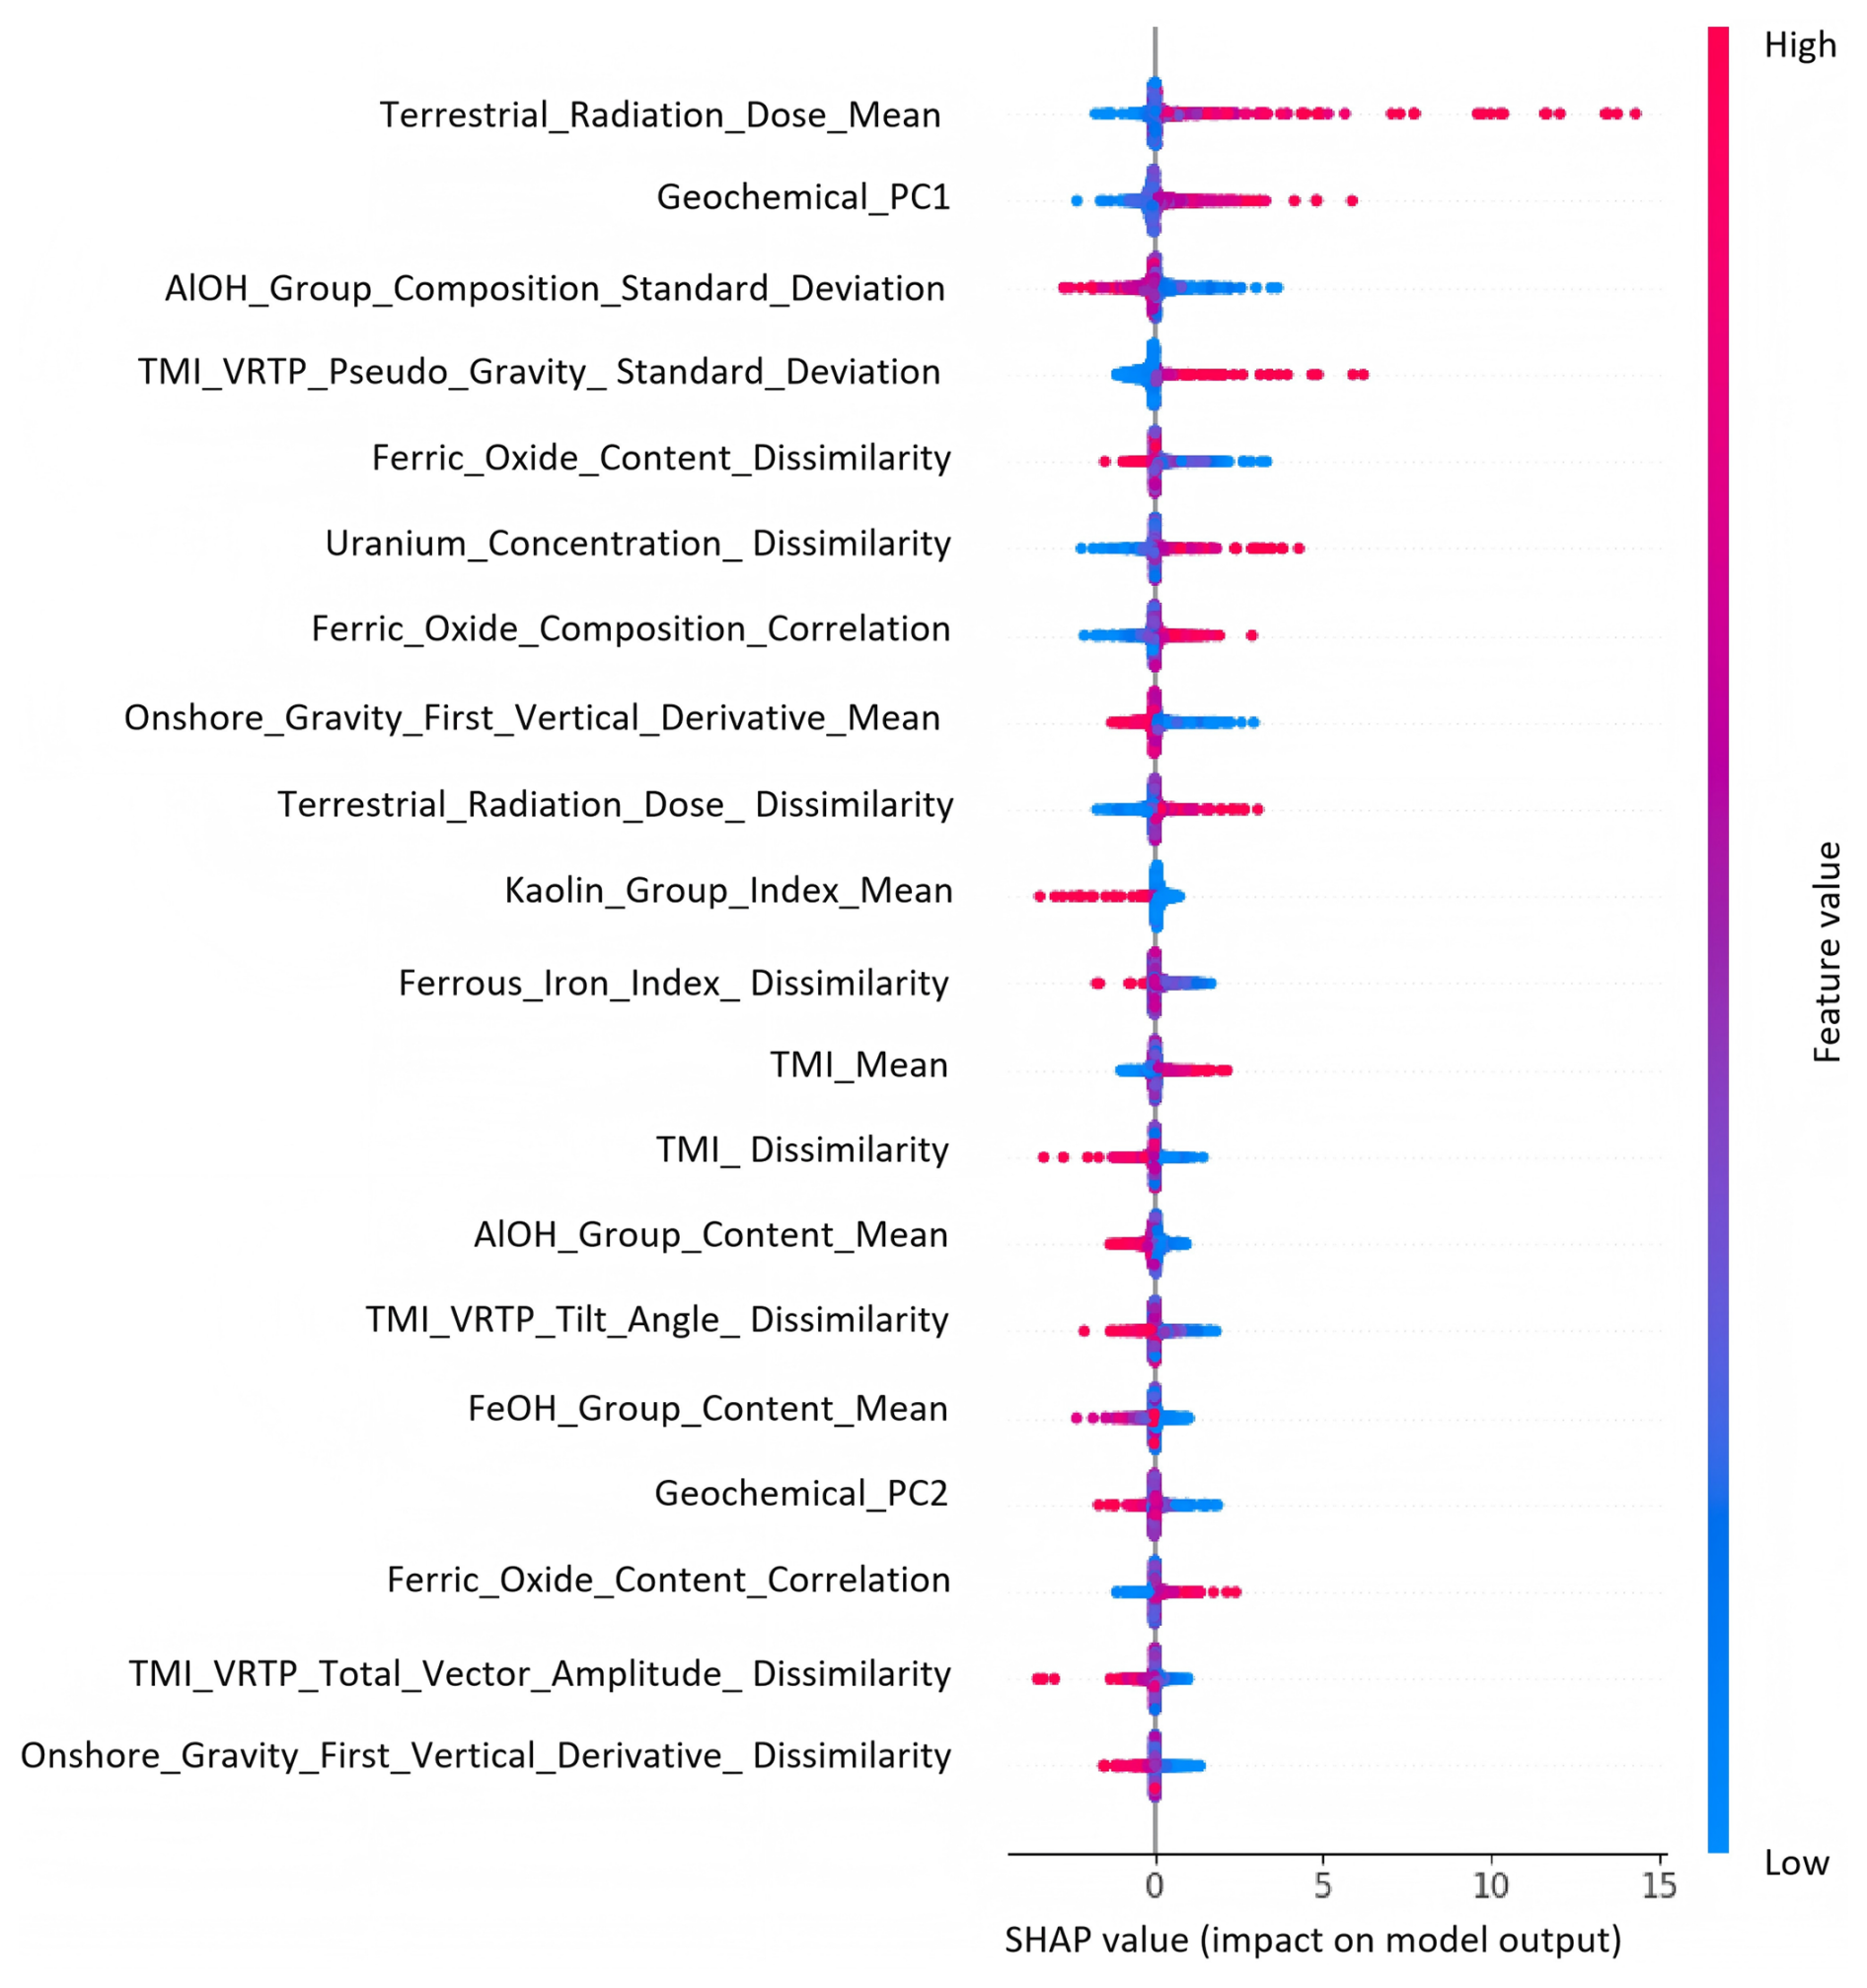
Figure 7SHAP summary scatter plot illustrating the association between individual feature values and their corresponding predicted probability scores. Each dot represents a sample, with color indicating the feature value (red = high, blue = low) and horizontal position showing the SHAP value (positive = increases predicted prospectivity, negative = decreases prospectivity). For example, Terrestrial_Radiation_Dose_Mean, the most influential feature, shows that samples with high values (red dots) predominantly cluster on the positive side of the x axis, while those with low values (blue dots) appear on the negative side. This pattern indicates that higher Terrestrial_Radiation_Dose_Mean values positively contribute to elevated mineralisation anomaly scores predicted by the model.
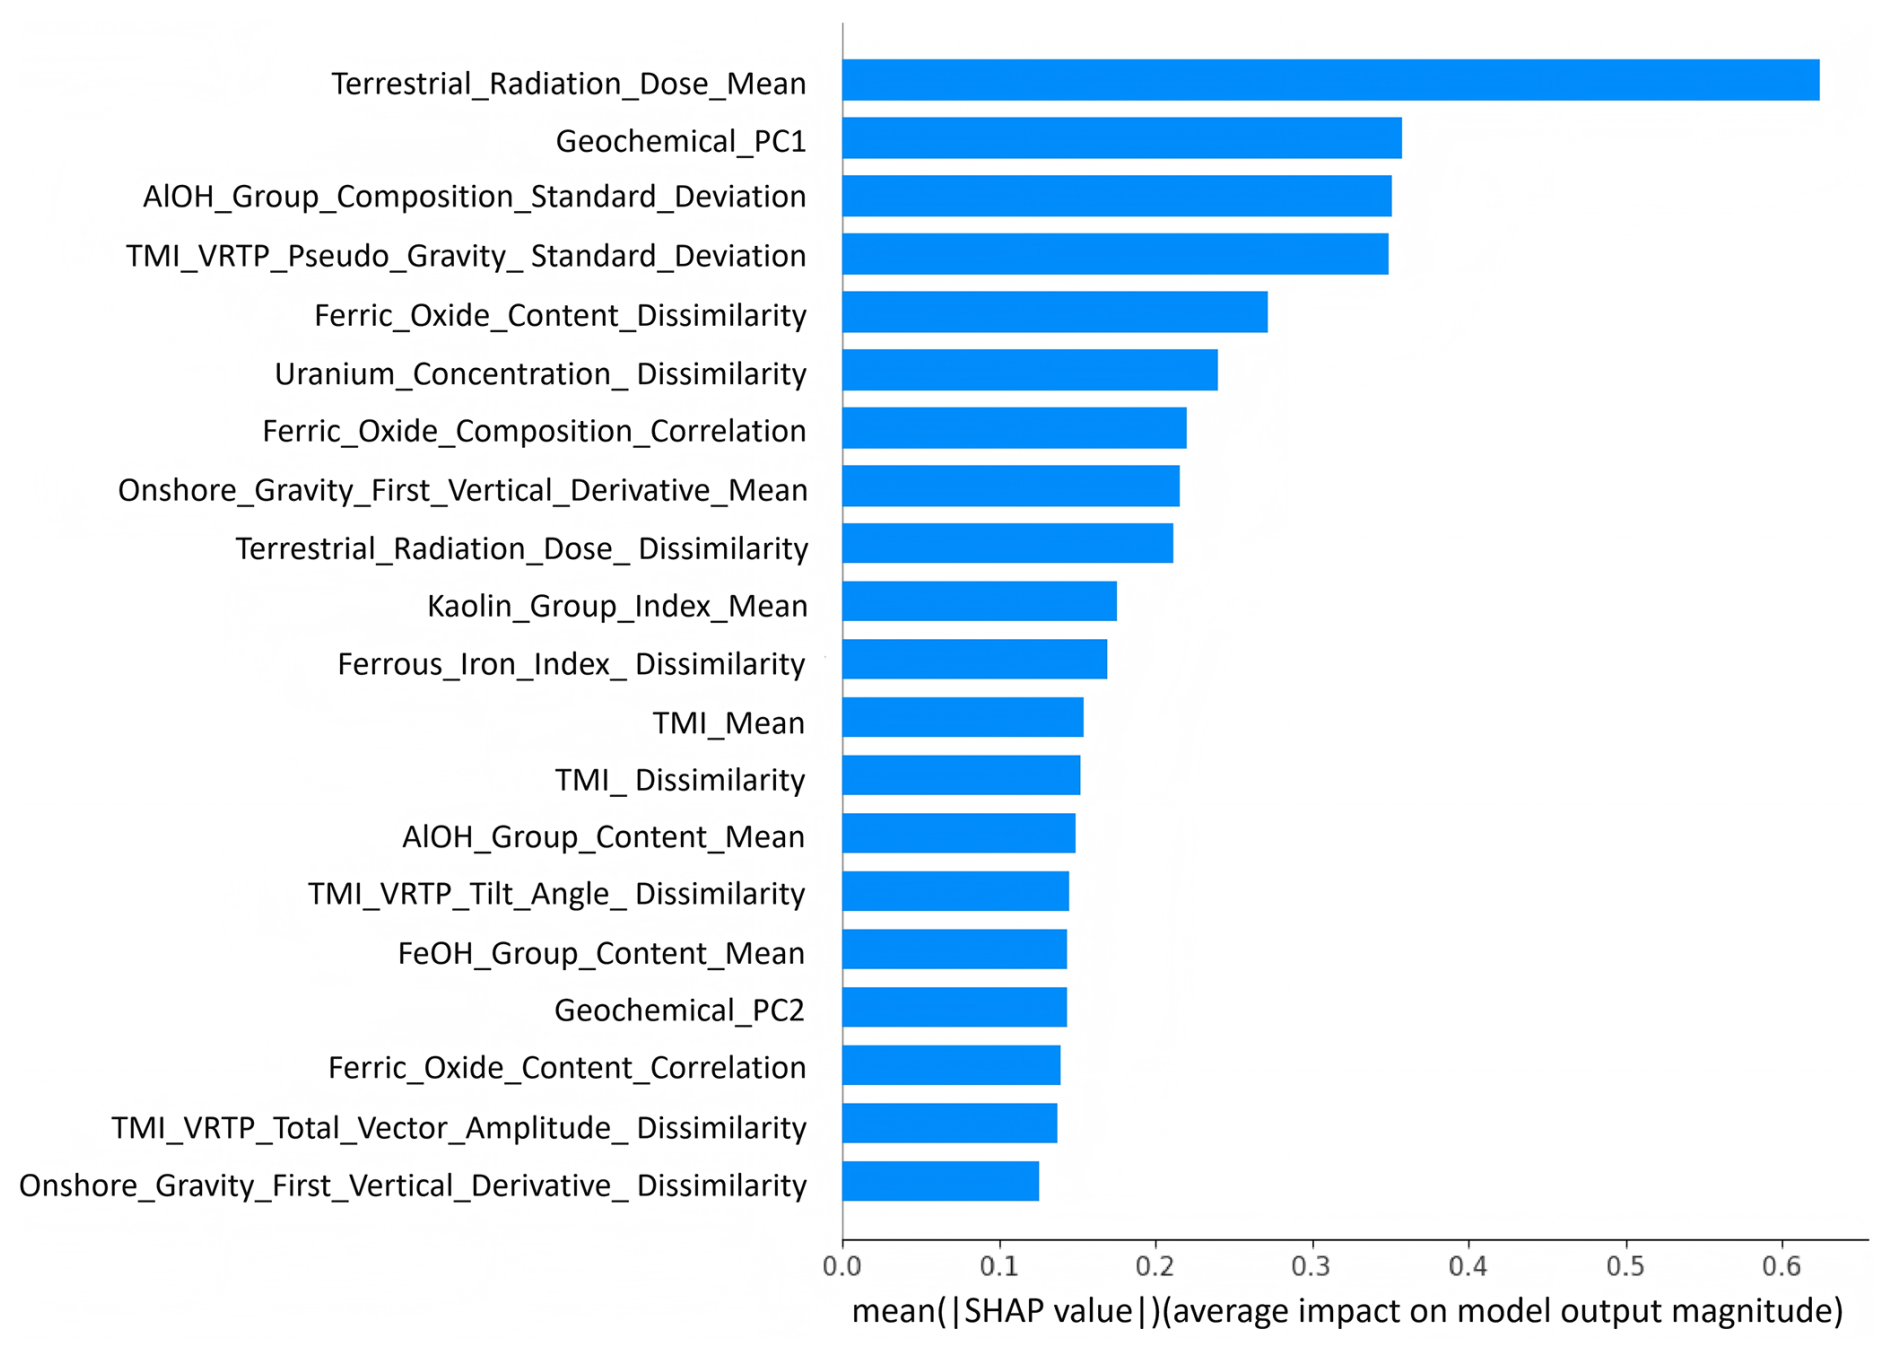
Figure 8Bar plot of SHAP summary depicting feature importance in DevNet model predictions. Each bar represents a feature, with bar length indicating the mean absolute SHAP value across all samples, which quantifies the average magnitude of that feature's contribution to model predictions. For example, Terrestrial_Radiation_Dose_Mean exhibits the highest importance score, indicating it exerts the greatest average influence on predicted mineralisation anomaly scores, followed by Geochemical_PC1.
The “black-box” nature of DL models makes their underlying decision processes difficult to interpret, leading to opacity regarding key driving factors and uncertainty in decision pathways. This lack of transparency can undermine trust in delineating prospective mineralisation zones. To elucidate the internal mechanisms of the DevNet model, this study employs the SHAP technique to analyse the model's predictive decisions from the perspective of feature contributions. Figures 7 and 8 present SHAP summary plots, which assess each feature's significance in the model's decision-making framework from a global perspective, revealing the relationship between feature inputs and predicted outputs. In both figures, the top variables contribute more to the model than the bottom ones. In the scatter plot (Fig. 7), each row represents a feature, and the x axis shows the SHAP values, which can be interpreted as the contribution of that feature to the model's output. Each point in the plot represents a sample, with colour indicating the feature value – red for high values and blue for low values. The bar plot (Fig. 8) displays the ranking of feature importance along with their corresponding average SHAP values, reflecting the average contribution of each feature to the model's decision-making. These visualisations provide a clear understanding of the relative importance of different features within the model and their impact on the prediction outcomes. A pronounced positive relationship between the radioactive element concentrations and REEs abundances underscores the importance of radiometric data in REE exploration (Leroy and Turpin, 1988; Shah et al., 2021), while the contribution of ground dose data (Fig. 8) further validates the effectiveness of radiometric measurements in predicting REE prospectivity zones, consistent with existing geological theories. Furthermore, we used the SHAP decision plot (Fig. 9) to provide localised explanations for the set of samples with high probability values. In the plot, each line represents a sample, with the x axis indicating the model's output value. The results reveal that ground radiation dose is the key factor driving high probability scores, highlighting its crucial role in mineralisation prediction. The geological basis for this strong radiometric signature can be exemplified by Location C (Moolawatana), where a quartz-sericite schist exhibits locally high radioactivity as determined by scintillometer surveys. This schist contains anomalously high Ce (up to 1400 ppm) and Th (with a Ce : Th ratio of approximately 1.7 : 1), indicating the presence of cerium-bearing allanite (McPhee et al., 1982). This mineral is likely the main contributor to the elevated prospectivity scores at this location. Although Ce was not among the elements used in lithogeochemistry (Table 2), the allanite and/or its host rock likely contain other listed elements (e.g., Th, U, Y), thereby providing anomalously high indicator signals for this location. This example demonstrates the direct geological linkage between radioactive minerals (allanite hosting Th and U) and REE enrichment, validating the use of radiometric data as a diagnostic tool for REE prospectivity. And the prospectivity map shows that medium- to high-mineralisation potential areas closely align with areas of high radiation dose (Fig. 10). Similarly, the ground radiation of U (Fig. 10) exhibits a positive interaction with mineralisation probability in the SHAP explanation, which is consistent with existing geological understanding (Fig. 7). The pseudo-gravity values derived from total magnetic intensity data adjusted for polarization (TMI_VRTP_Pseudo_Gravity_Standard_Deviation) (Fig. 10) effectively reflect the magnetic response of subsurface geological bodies. High values of this feature explain the magnetic anomalies associated with carbonatite bodies linked to skarn-type REE mineralisation (Simandl and Paradis, 2018; Thomas et al., 2016). SHAP analysis of the model's decision-making further validates that the DevNet model successfully learns and captures the intrinsic relationship between this feature and mineralisation probability, confirming its critical role in the prediction process (Fig. 7). Figure 8 reveals that the standard deviation of AlOH group composition (AlOH_Group_Composition_Standard_Deviation) (Fig. 10) and the dissimilarity of ferric oxide content (Ferric_Oxid_Content_Dissimilarity) (Fig. 10) significantly contribute to the model's predictions. These features show a negative correlation with the model's output anomaly values, indicating that higher values of these features correspond to lower mineralisation probabilities and vice versa (Fig. 7). The TMI_VRTP_Pseudo_Gravity_Standard_Deviation and AlOH_Group_Composition_Standard_Deviation data layers exhibit pronounced edge effects along the study area boundaries, primarily attributed to statistical bias introduced by buffer zone truncation. While these edge effects are inherent limitations of fixed buffer radius calculations at study boundaries, they are confined to a small subset of high-variability layers. However, the mineralisation prospectivity areas delineated by the DevNet (Fig. 5) show no apparent boundary artefacts, demonstrating the model's capability to effectively suppress the adverse effects of edge phenomena. This suggests that DevNet, through multi-source data integration guided by prior mineralisation knowledge, successfully learns genuine mineralisation-related anomaly patterns rather than spurious boundary-induced signals and noise.
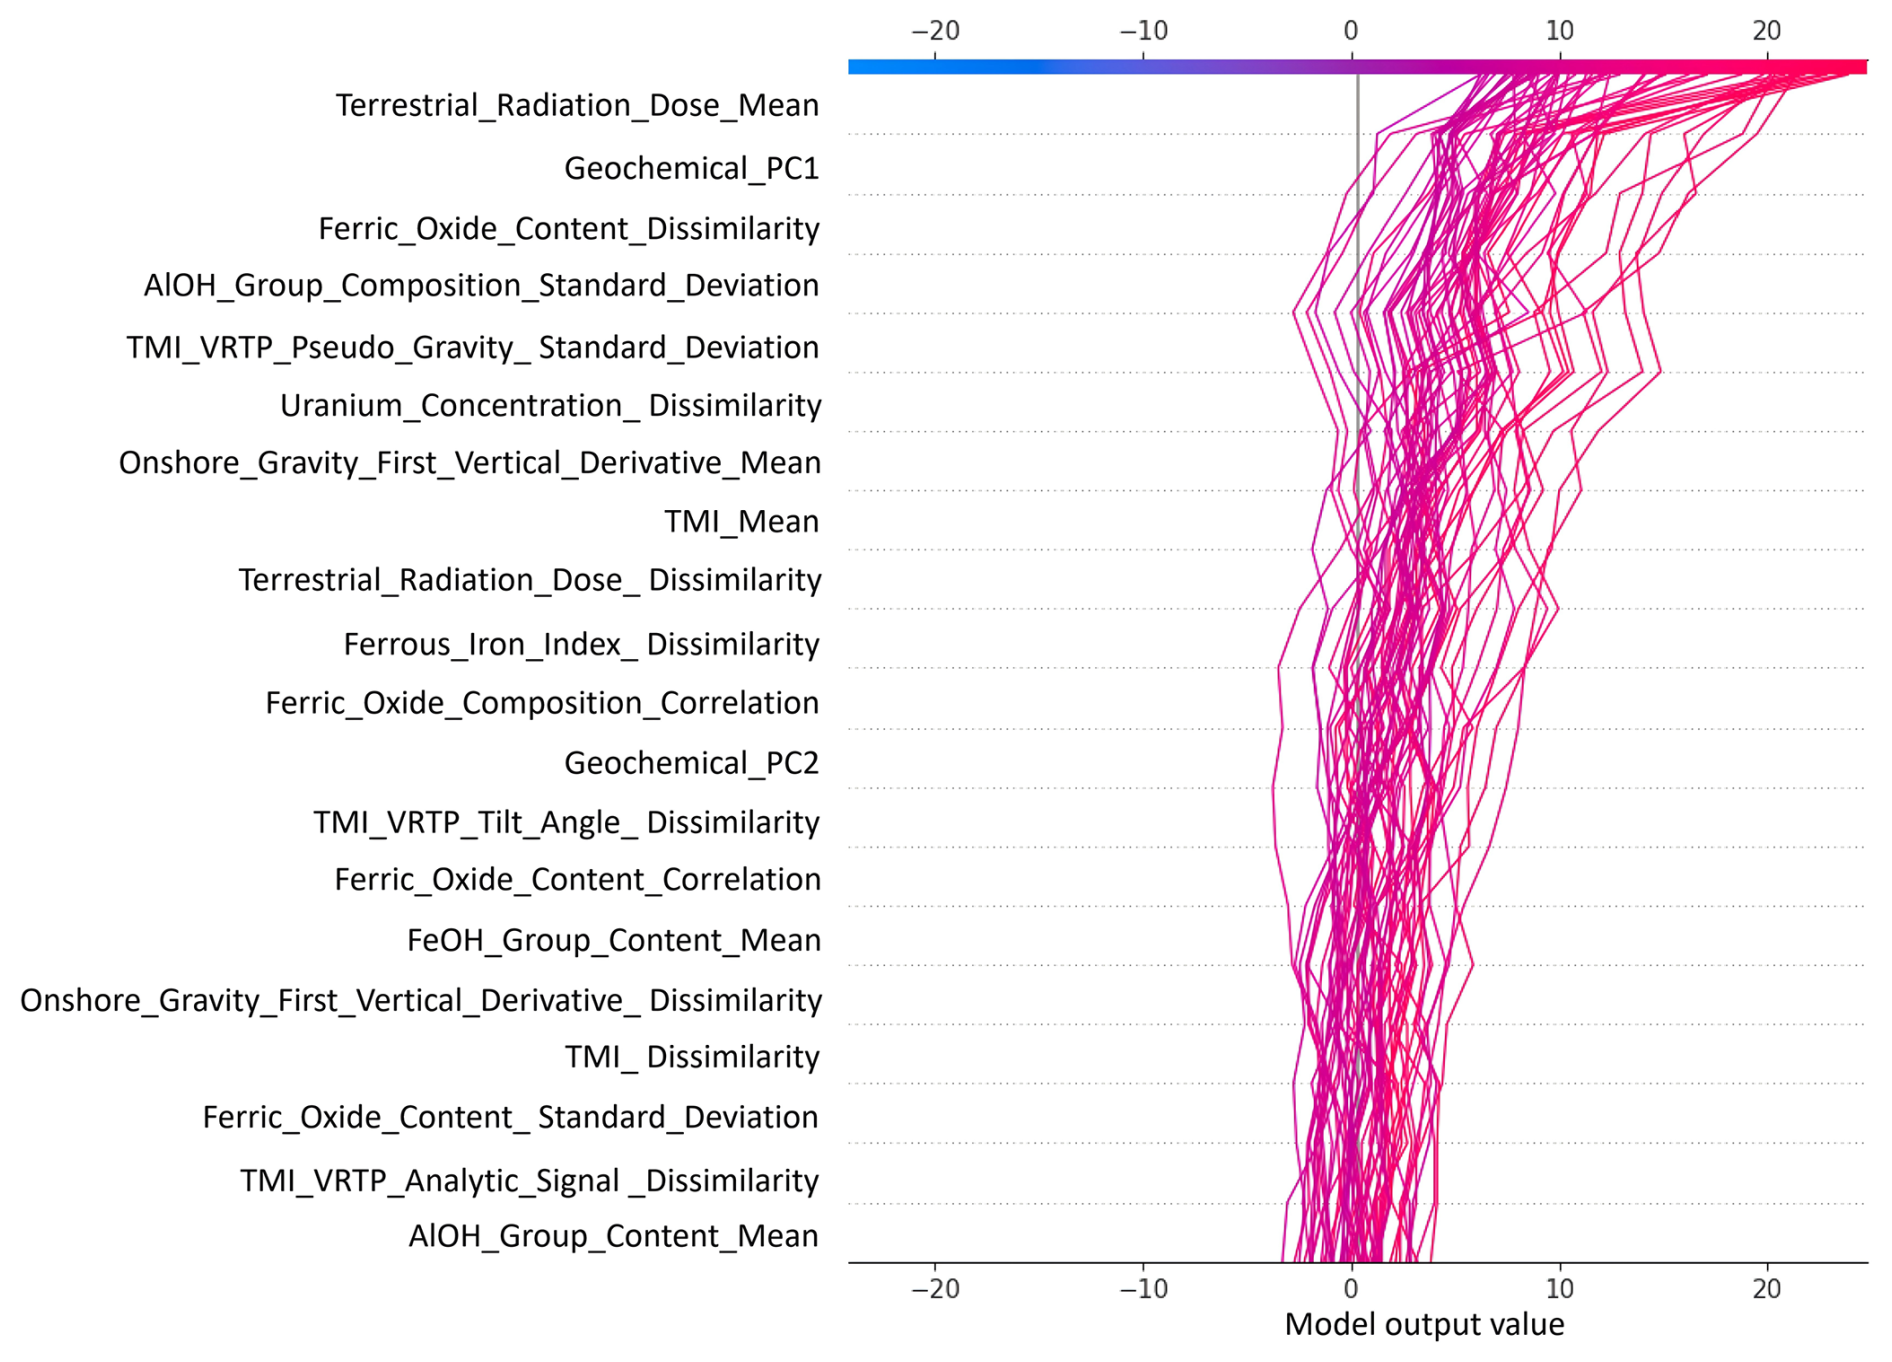
Figure 9SHAP decision plot showing the impact of different features on the original value of DevNet model output. Each line represents a sample, progressing rightward as features cumulatively contribute to the final prediction (x axis: model output score). For example, in the illustrated samples, the top three features (Terrestrial_Radiation_Dose_Mean, Geochemical_PC1, and Ferric_Oxide_Content_Dissimilarity) predominantly push the model toward higher mineralisation anomaly scores.
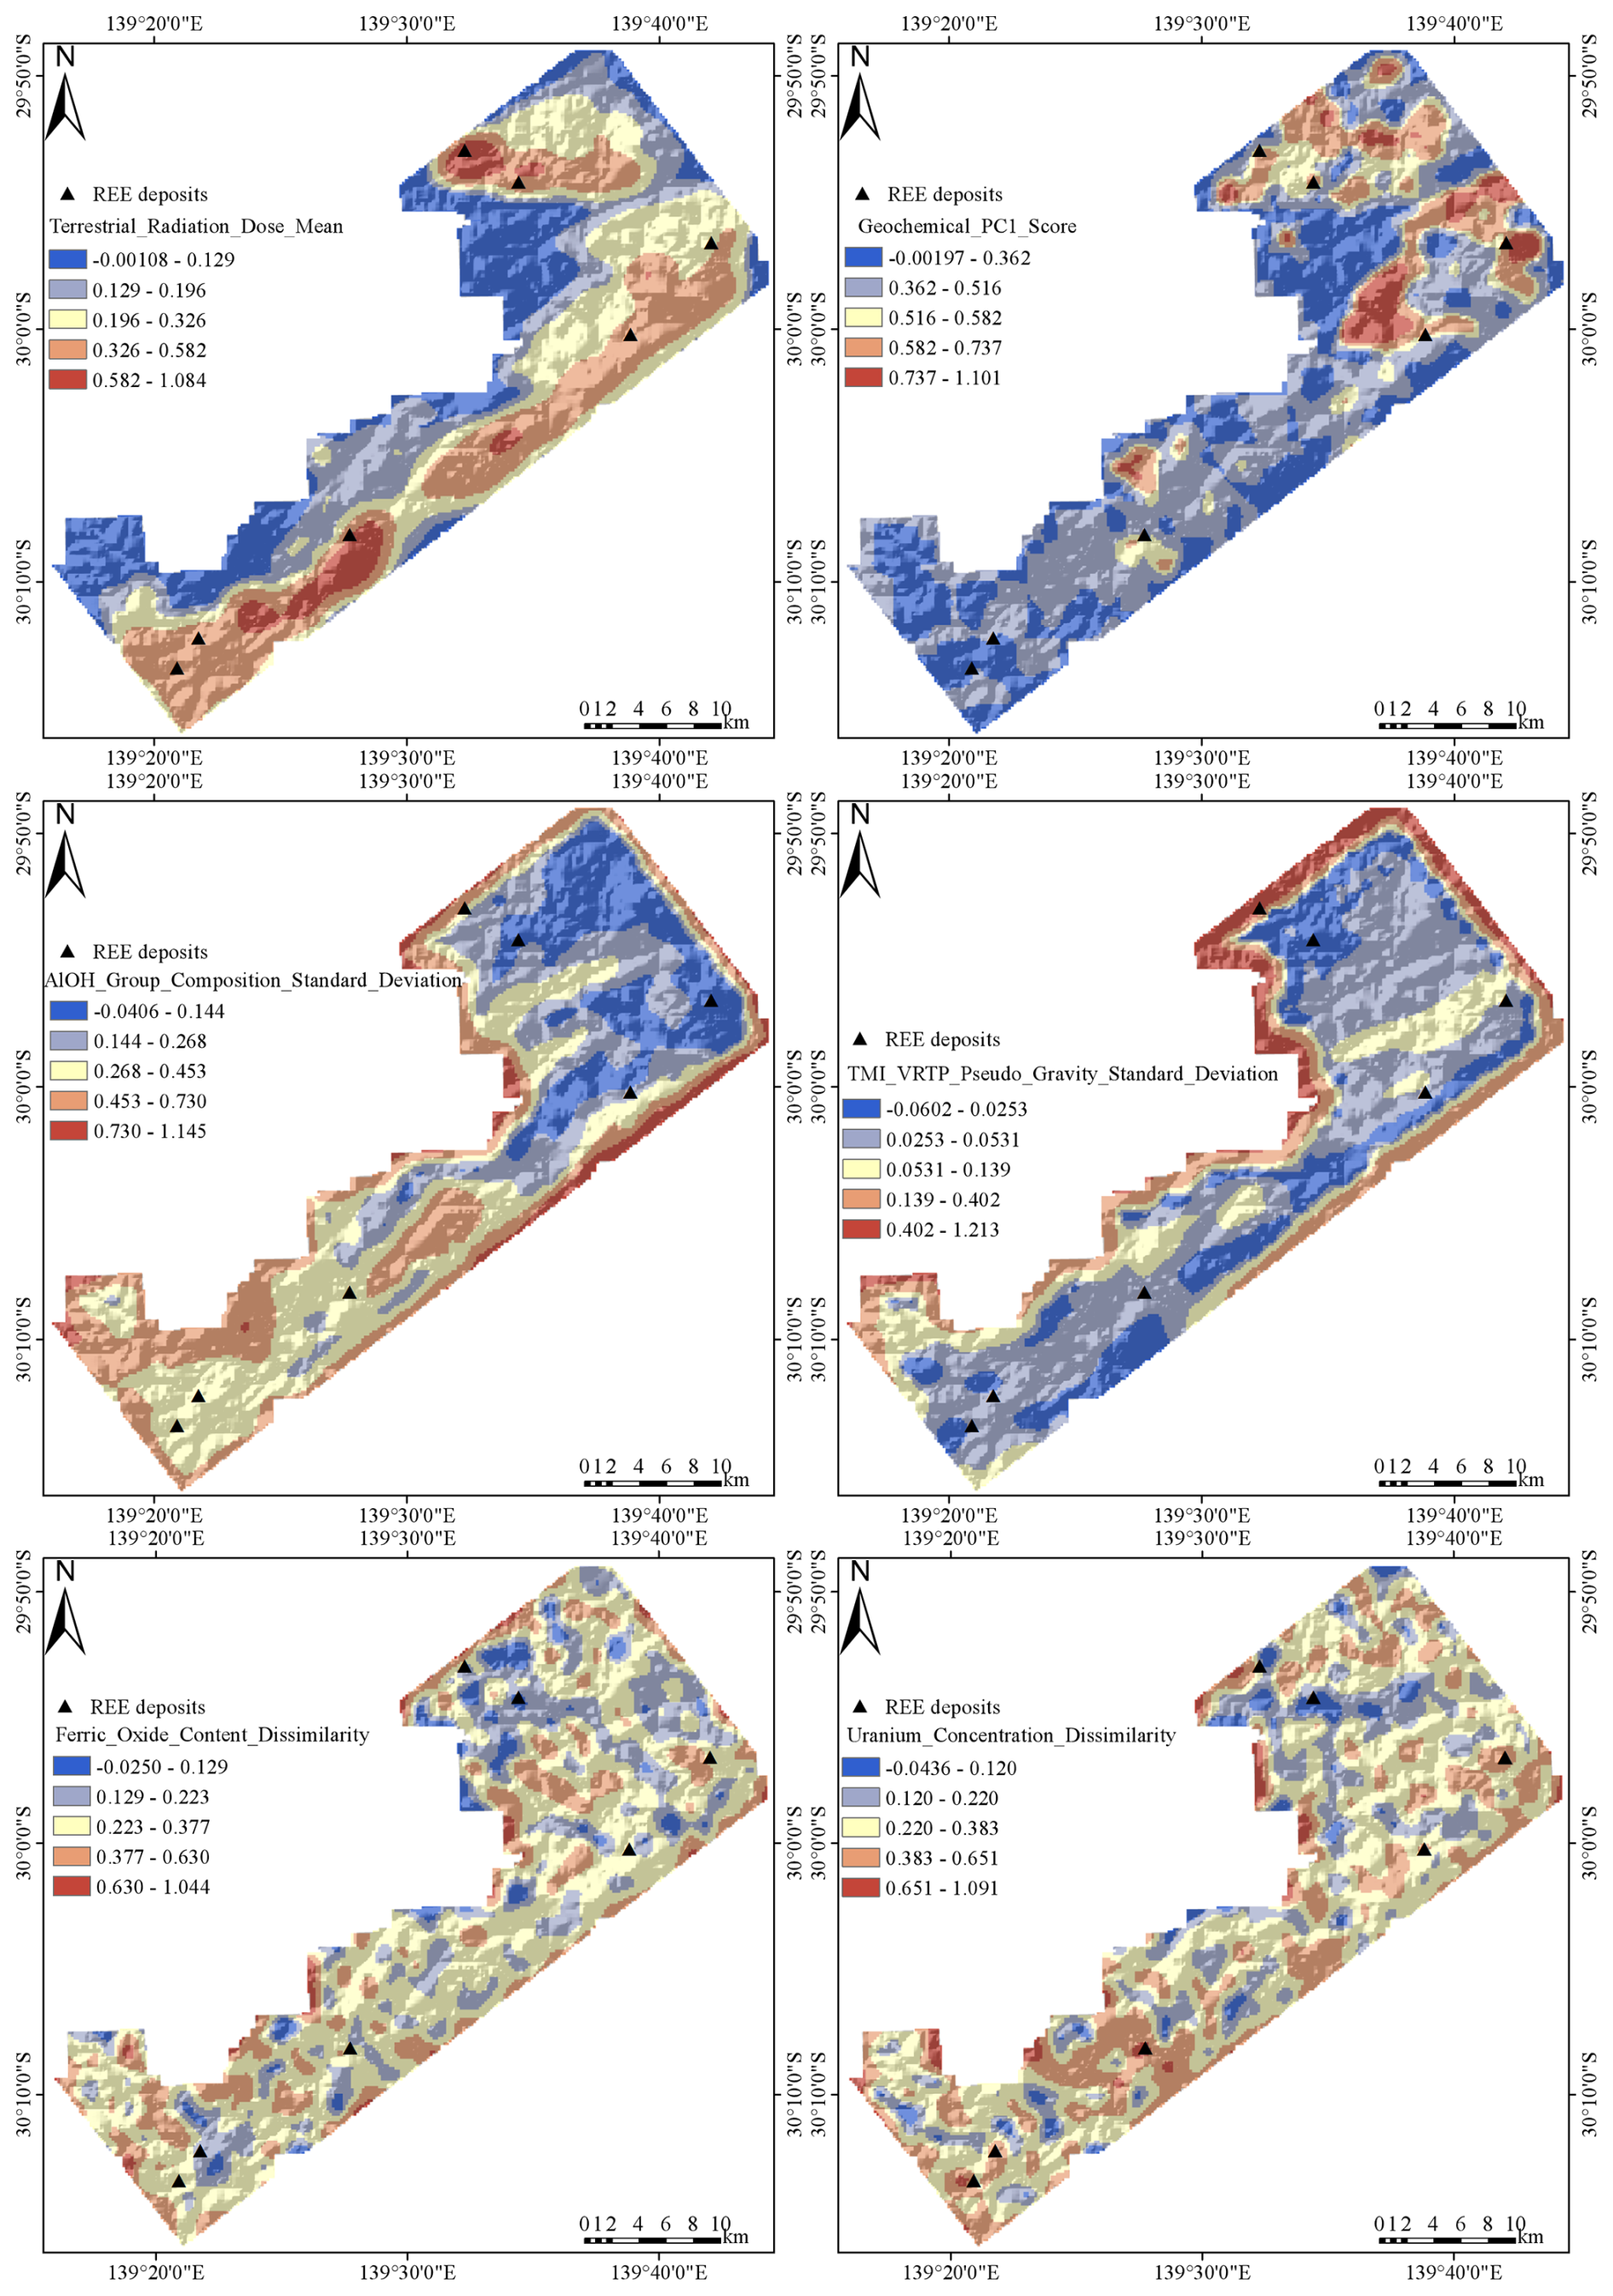
Figure 10Spatial distribution of the top six features influencing model decisions.
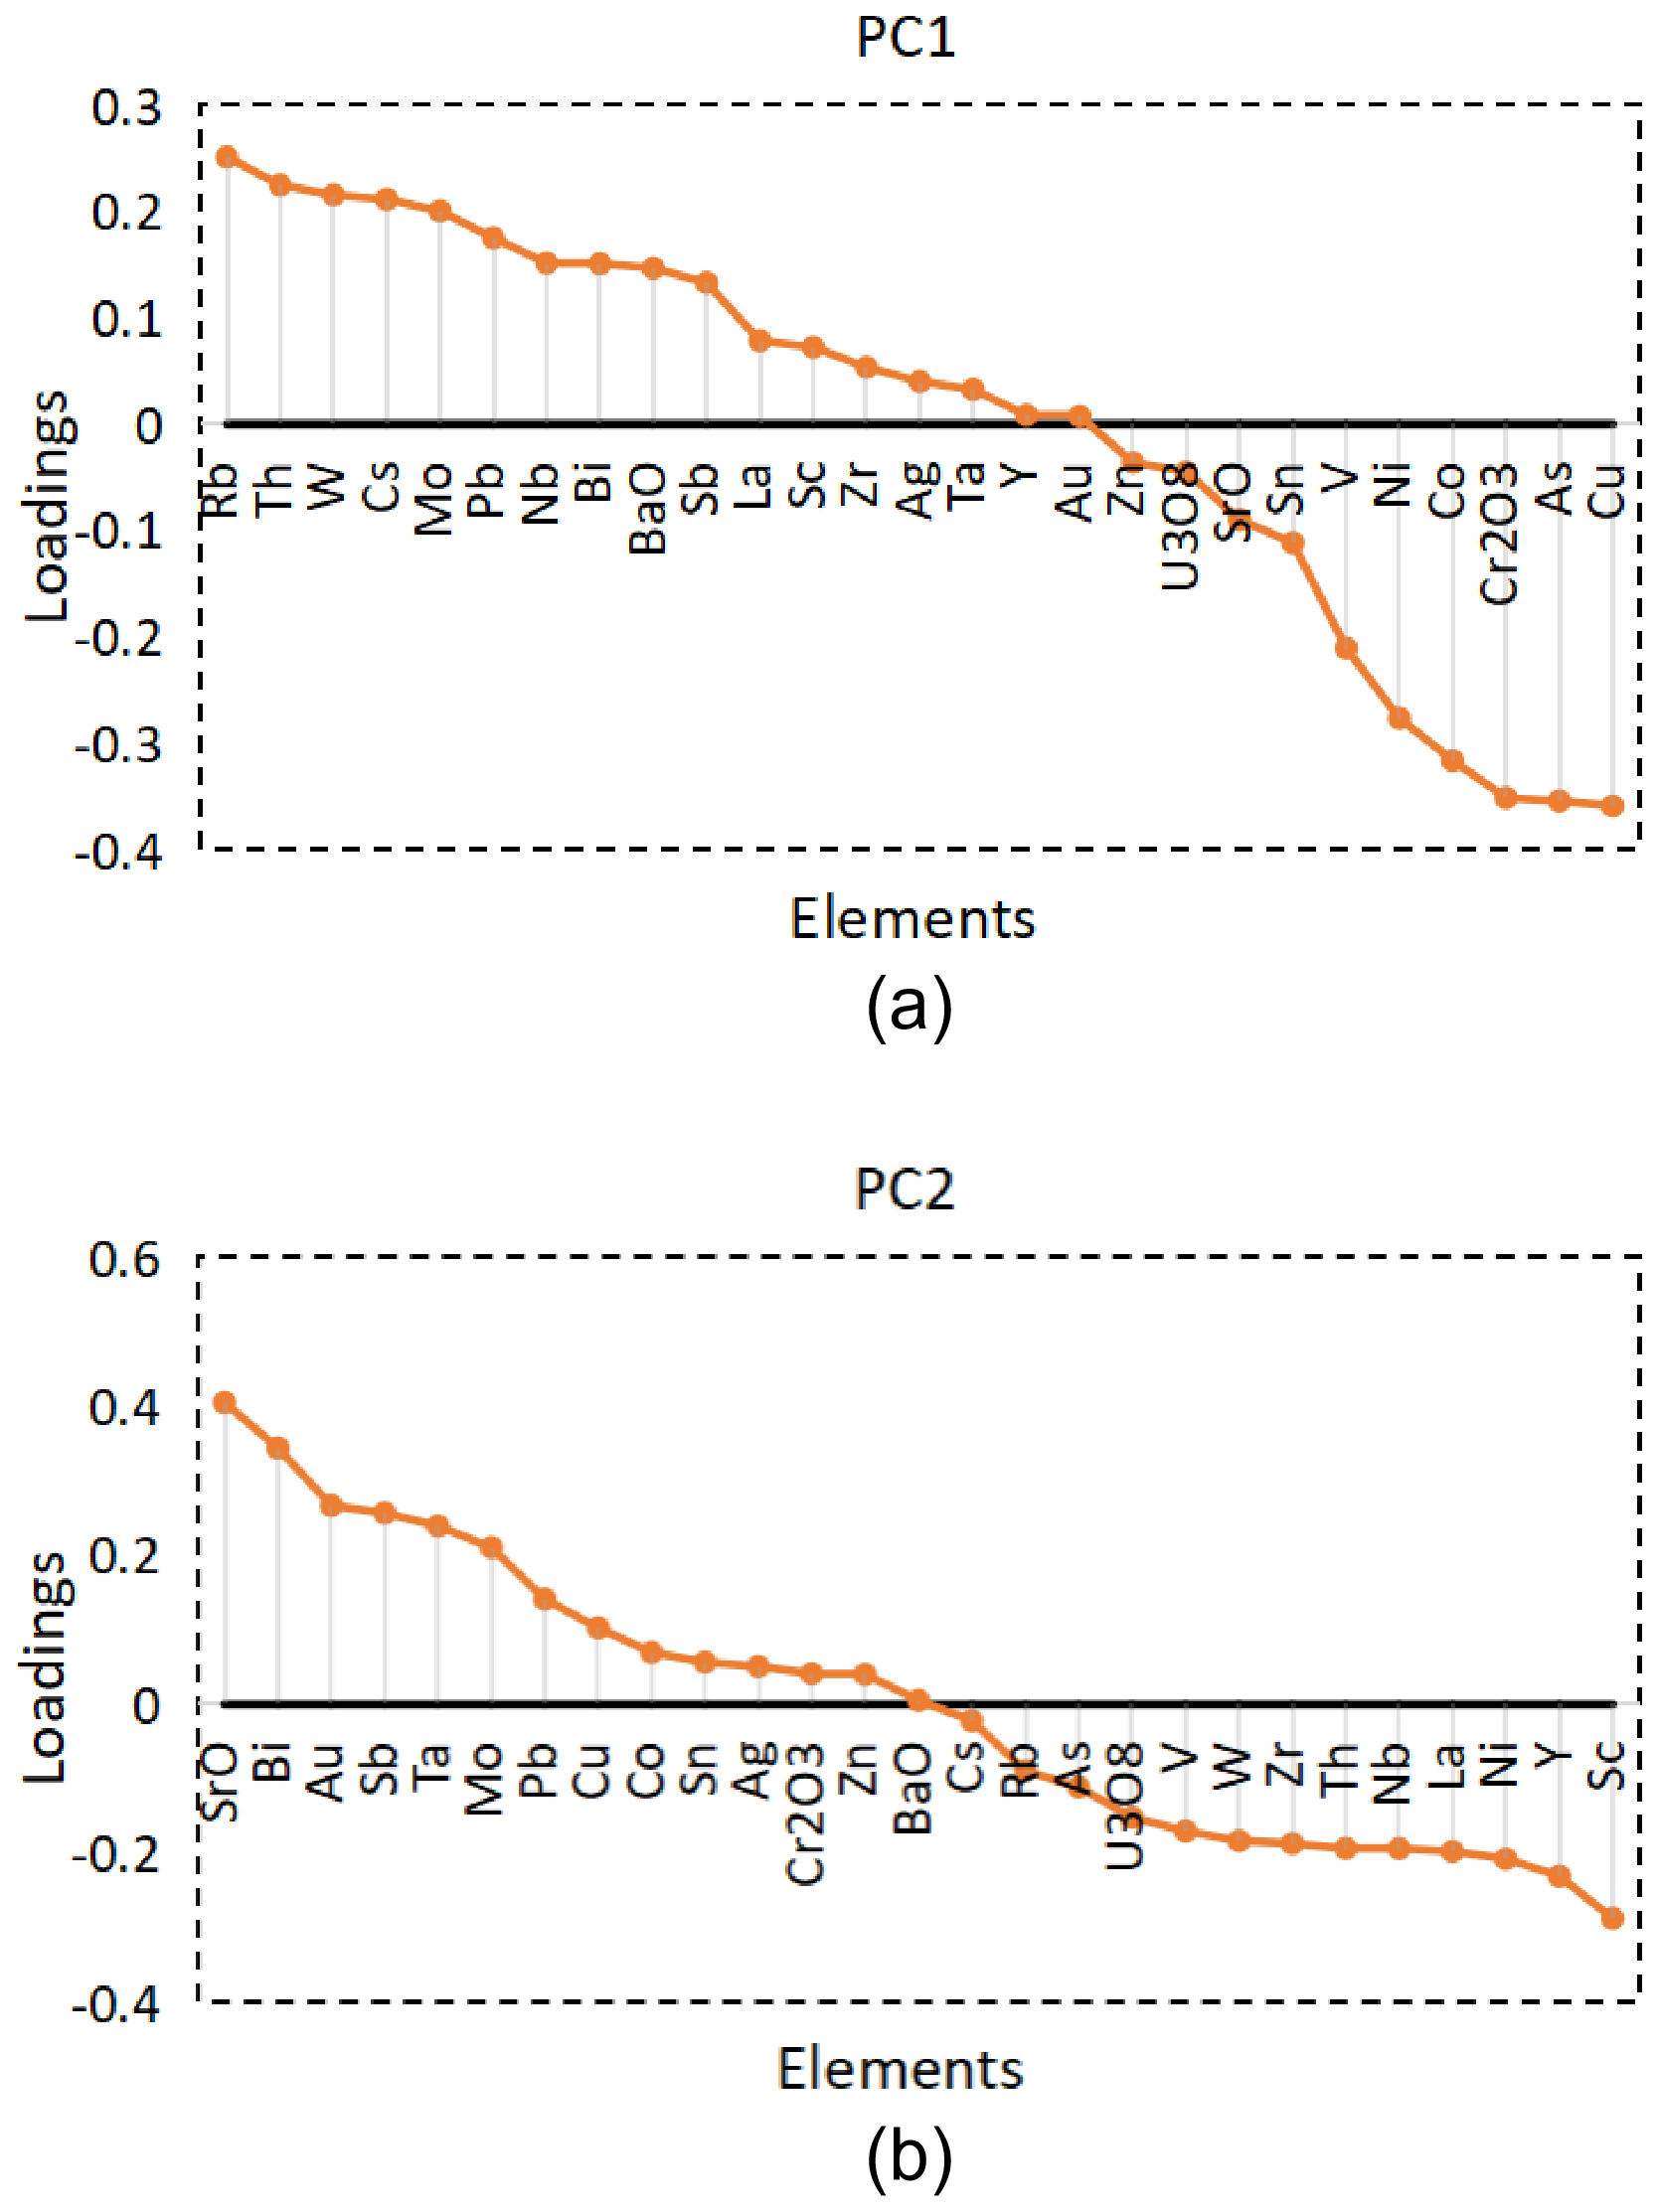
The SHAP interpretation plots indicate that the first (Geochemical_PC1) and second (Geochemical_PC2) PCs of the geochemical data are more important than other geochemical PCs, with the first PC being particularly significant. Specifically, the first PC scores (Fig. 10) are positively correlated with the model's output anomaly scores, meaning that higher scores in the first PC increase the likelihood of higher mineralisation probability scores in the DevNet model (Fig. 7). The ranked-scaled eigenvector plot of the PCs provides an intuitive visualisation of the loadings of each element across the PCs, including their magnitude and sign. The absolute value of the feature loadings reflects the relative contribution of each element to the respective PC, while the sign (positive or negative) of the loadings indicates the relationship between the element and the PC. Differences in sign imply that elements exert opposite influences on the PC. In the PC1, elements such as Rb, Th, W, Cs, Mo, and Pb exhibit significant positive loadings (Fig. 11a). PC1 is characterised by elevated contributions from large-ion lithophile elements (LILE: Rb, Cs, Ba) and high-field-strength elements (HFSE: Th, Nb, W), a geochemical signature indicative of granite-related metasomatic alteration associated with felsic magmatism. This interpretation is supported by established exploration geochemistry principles: Th commonly co-occurs with REE-bearing minerals containing radioactive elements, with REE distribution frequently accompanied by Th anomalies (Dhurandhar and Saxena, 1999). The enrichment of LILE such as Rb and Cs is typically associated with late-stage magmatic differentiation or hydrothermal activity in REE-mineralised systems (Jowitt et al., 2017), whilst W, Mo, and Pb are characteristic ore-forming elements in granite-related hydrothermal deposits, particularly skarn-type systems. The model's decision-making thus aligns closely with existing geological knowledge, reinforcing the relationship between this element assemblage and granite-hosted mineralisation processes. SHAP analysis reveals that lower scores in the second PC increase the likelihood of high anomaly scores in DevNet. Examining the relationship between scores and loadings, Fig. 11b indicates that high concentrations of Sc, Y, Ni, La, Nb, and Th may result in lower second PC scores. PC2 is interpreted to capture hydrothermal enrichment patterns, with the positive loadings reflecting mobile, fluid-enriched elements, whilst the negatively loaded elements (Sc, Y, REE including La) likely remained relatively immobile during hydrothermal overprinting, being retained in refractory accessory phases such as monazite and allanite. Notably, Sc, La, and Y are critical REE commodities, and their association with immobile mineral phases provides a robust geochemical signature for targeting REE-enriched zones in the study area.
Furthermore, we employed SHAP values to comprehensively compare the relative importance of features from surface-indicative datasets (DEM, remote sensing, and radiometric data) and depth-indicative datasets (magnetic and gravity data) in producing high mineralisation probability scores (Fig. 9). The analysis reveals that the top four features contributing most significantly to the model's output anomaly scores are all derived from surface datasets, ranked as follows: Terrestrial_Radiation_Dose_Mean, Geochemical_PC1, Ferric_Oxide_Content_Dissimilarity, and ALOH_Group_Composition_Standard_Deviation. This result demonstrates that although subsurface geophysical data (magnetic and gravity) effectively delineate structural frameworks and identify favourable host rocks, the surface expression of REE enrichment exhibits more prominent signatures. Radiometric data directly detect radioactive elements (e.g., Th and U) associated with REE enrichment, providing direct indicators of REE concentration. Remote sensing derivative indices effectively identify hydrothermal alteration minerals indicative of REE mineralisation. Geochemical data directly reflect the spatial distribution and enrichment-depletion patterns of REEs. The SHAP method's interpretation of the model's decisions indicates that the model effectively learns and captures the logical relationships between these features and mineralisation probability. It not only identifies key features associated with mineralisation but also differentiates their contributions to the mineralising environment. The use of SHAP further validates the model's scientific rationale within the geological context, thereby enhancing the reliability and interpretability of the prediction results.
The DEEP-SEAM framework is designed with potential generalisability and scalability, with its methodological principles applicable to MPM across diverse mineralisation systems. The framework's ability to capture complex, non-linear relationships between multi-source geoscientific data and mineralisation probability establishes a theoretical foundation for its application to various deposit types. The potential transferability of DEEP-SEAM is built upon three key principles. First, the framework requires integration of deposit-specific evidence layers that reflect critical mineralisation processes, including geological proxies (e.g., structural features, lithological units, alteration zones), geochemical pathfinder elements, geophysical signatures, and remote sensing derivatives. The specific indicators employed vary with deposit type. For instance, orogenic Au systems commonly display Au–As–Sb associations (Goldfarb and Groves, 2015; Pitcairn et al., 2006); porphyry Cu deposits exhibit Cu–Mo–Au signatures (Sillitoe, 2010); iron oxide-copper-gold (IOCG) systems are characterised by magnetic and gravity anomalies (Austin and Foss, 2012; McCafferty et al., 2016), whilst volcanic-associated massive sulphide (VMS) deposits display resistivity contrasts (Dusabemariya et al., 2020; Taylor et al., 1995). The framework accommodates these variations through appropriate feature engineering and predictor variable selection. Second, the DL architecture within DEEP-SEAM can be adapted to different datasets through hyperparameter optimisation and structural adjustments, enabling the model to learn deposit-specific spatial patterns and feature interactions. This adaptive tuning process – involving adjustment of parameters such as network depth, learning rate, and dropout rate based on validation performance – represents standard practice in geoscientific machine learning applications where geological heterogeneity demands dataset-specific optimisation. Third, model interpretability through SHAP analysis provides a critical validation mechanism. By examining whether the model's predictive logic aligns with established metallogenic theory and the geological context of the target area, geoscientists can assess the reliability of prospectivity delineation. This interpretability component ensures that the framework operates not as a black box but as a geologically informed predictive tool applicable across mineralisation systems.
This study introduces DEEP-SEAM, an explainable semi-supervised DL framework designed to integrate multi-source exploration datasets for REE prospectivity mapping. By combining tailored data preprocessing, dimensionality reduction, and anomaly-based learning through the DevNet, the framework effectively captures nonlinear relationships between geological features and mineralisation processes even when only a small number of known deposits are available. The resulting prospectivity map successfully delineates areas of high REE potential in the northern Curnamona Province, demonstrating strong spatial agreement with known mineral occurrences and key geological controls such as felsic granites, major fault systems, and Mesoproterozoic strata. The performance metrics and spatial analysis confirm that the semi-supervised architecture can reliably detect subtle mineralisation signals within heterogeneous, noisy, and highly imbalanced datasets. A key strength of DEEP-SEAM is its use of SHAP, which provides transparent insights into model behaviour. Radiometric signatures, magnetic pseudo-gravity attributes, alteration indicators, and geochemical principal components emerged as dominant controls on predictions, aligning closely with established REE mineral system models. These interpretable outputs enhance geological confidence in the predicted targets and support their practical use in exploration decision-making. Although the superior performance of this study has been demonstrated only within a single terrane, the design principles of the DEEP-SEAM framework – including flexible feature engineering, adaptable DL architecture, and SHAP-based interpretability mechanisms – provide a methodological foundation for its application across different geological environments and deposit types. The actual transferability performance of the framework requires assessment through further experimental work; meanwhile, functional extensions incorporating uncertainty quantification, drillhole-scale datasets, and domain adaptation techniques would further enhance its utility for exploration risk assessment. Overall, DEEP-SEAM provides a robust, transparent, and data-efficient approach to prospectivity mapping in complex geological settings. It offers an effective tool for guiding future REE exploration, particularly in regions with limited labelled data and extensive cover, and contributes to the broader development of explainable DL methods in mineral systems analysis.
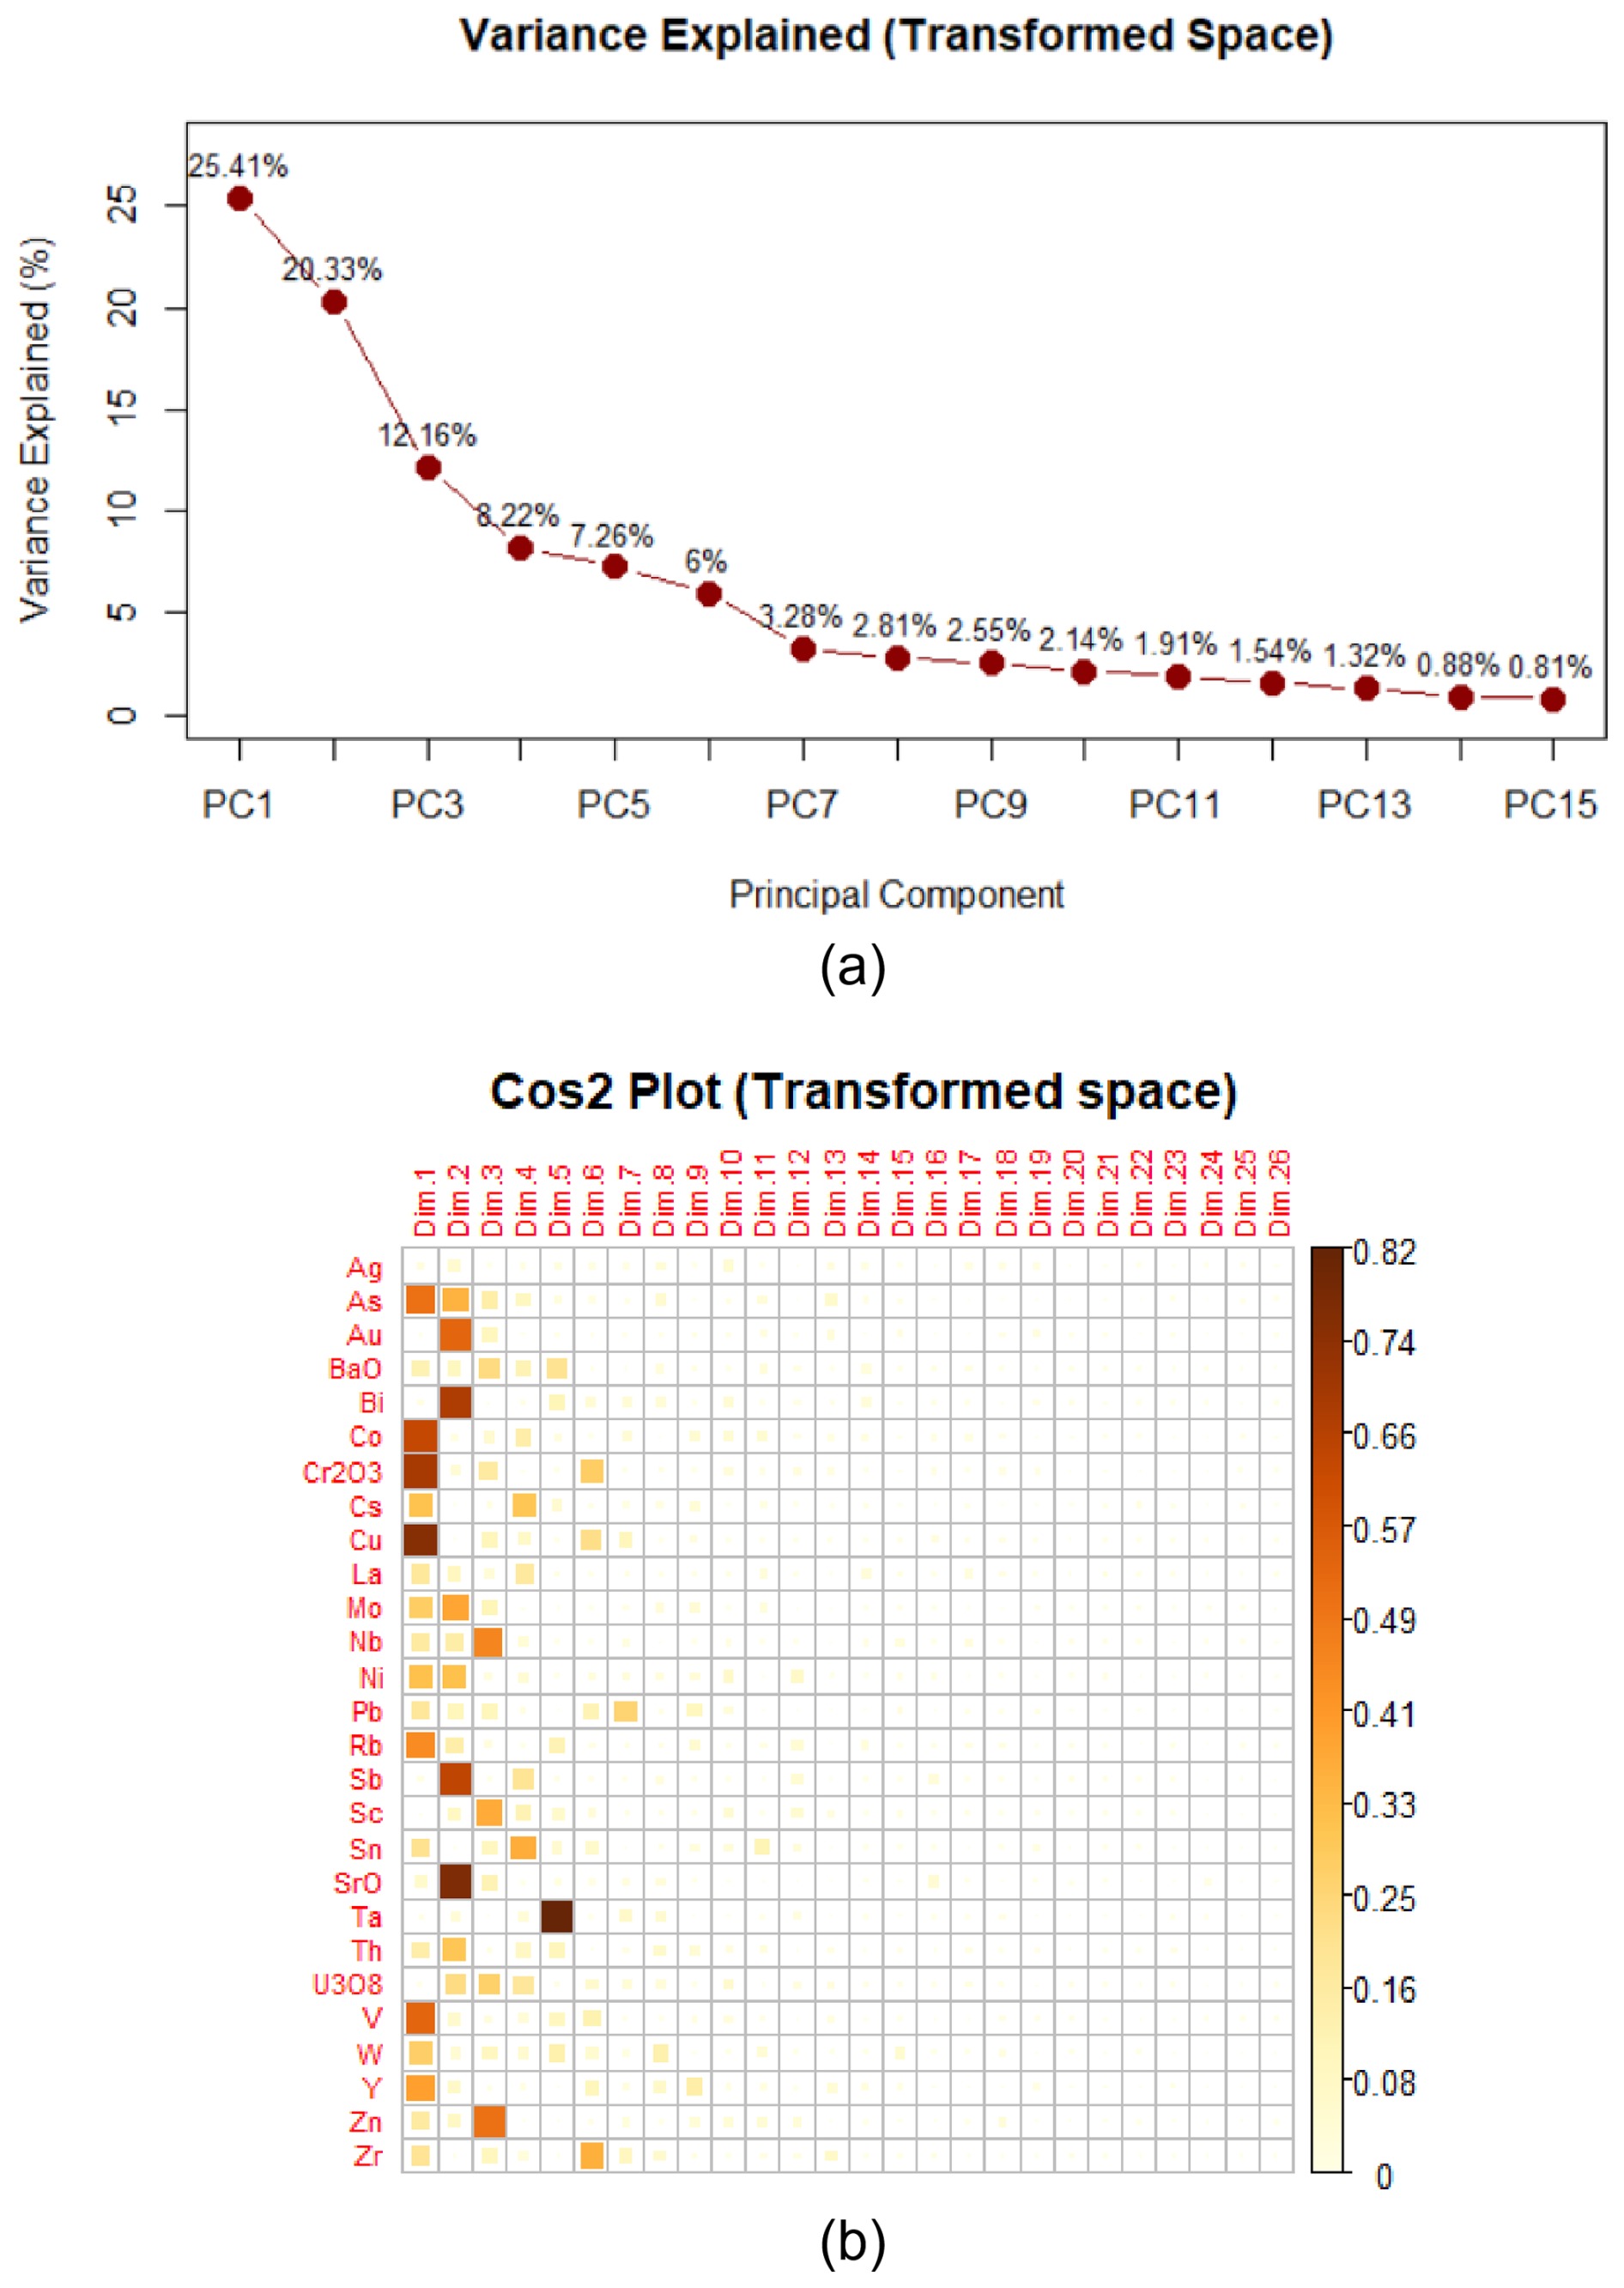
Figure A1RPCA analysis results: (a) scree plot of back-transformed geochemical variables based on variance, (b) representation quality of back-transformed geochemical variables by PCs.
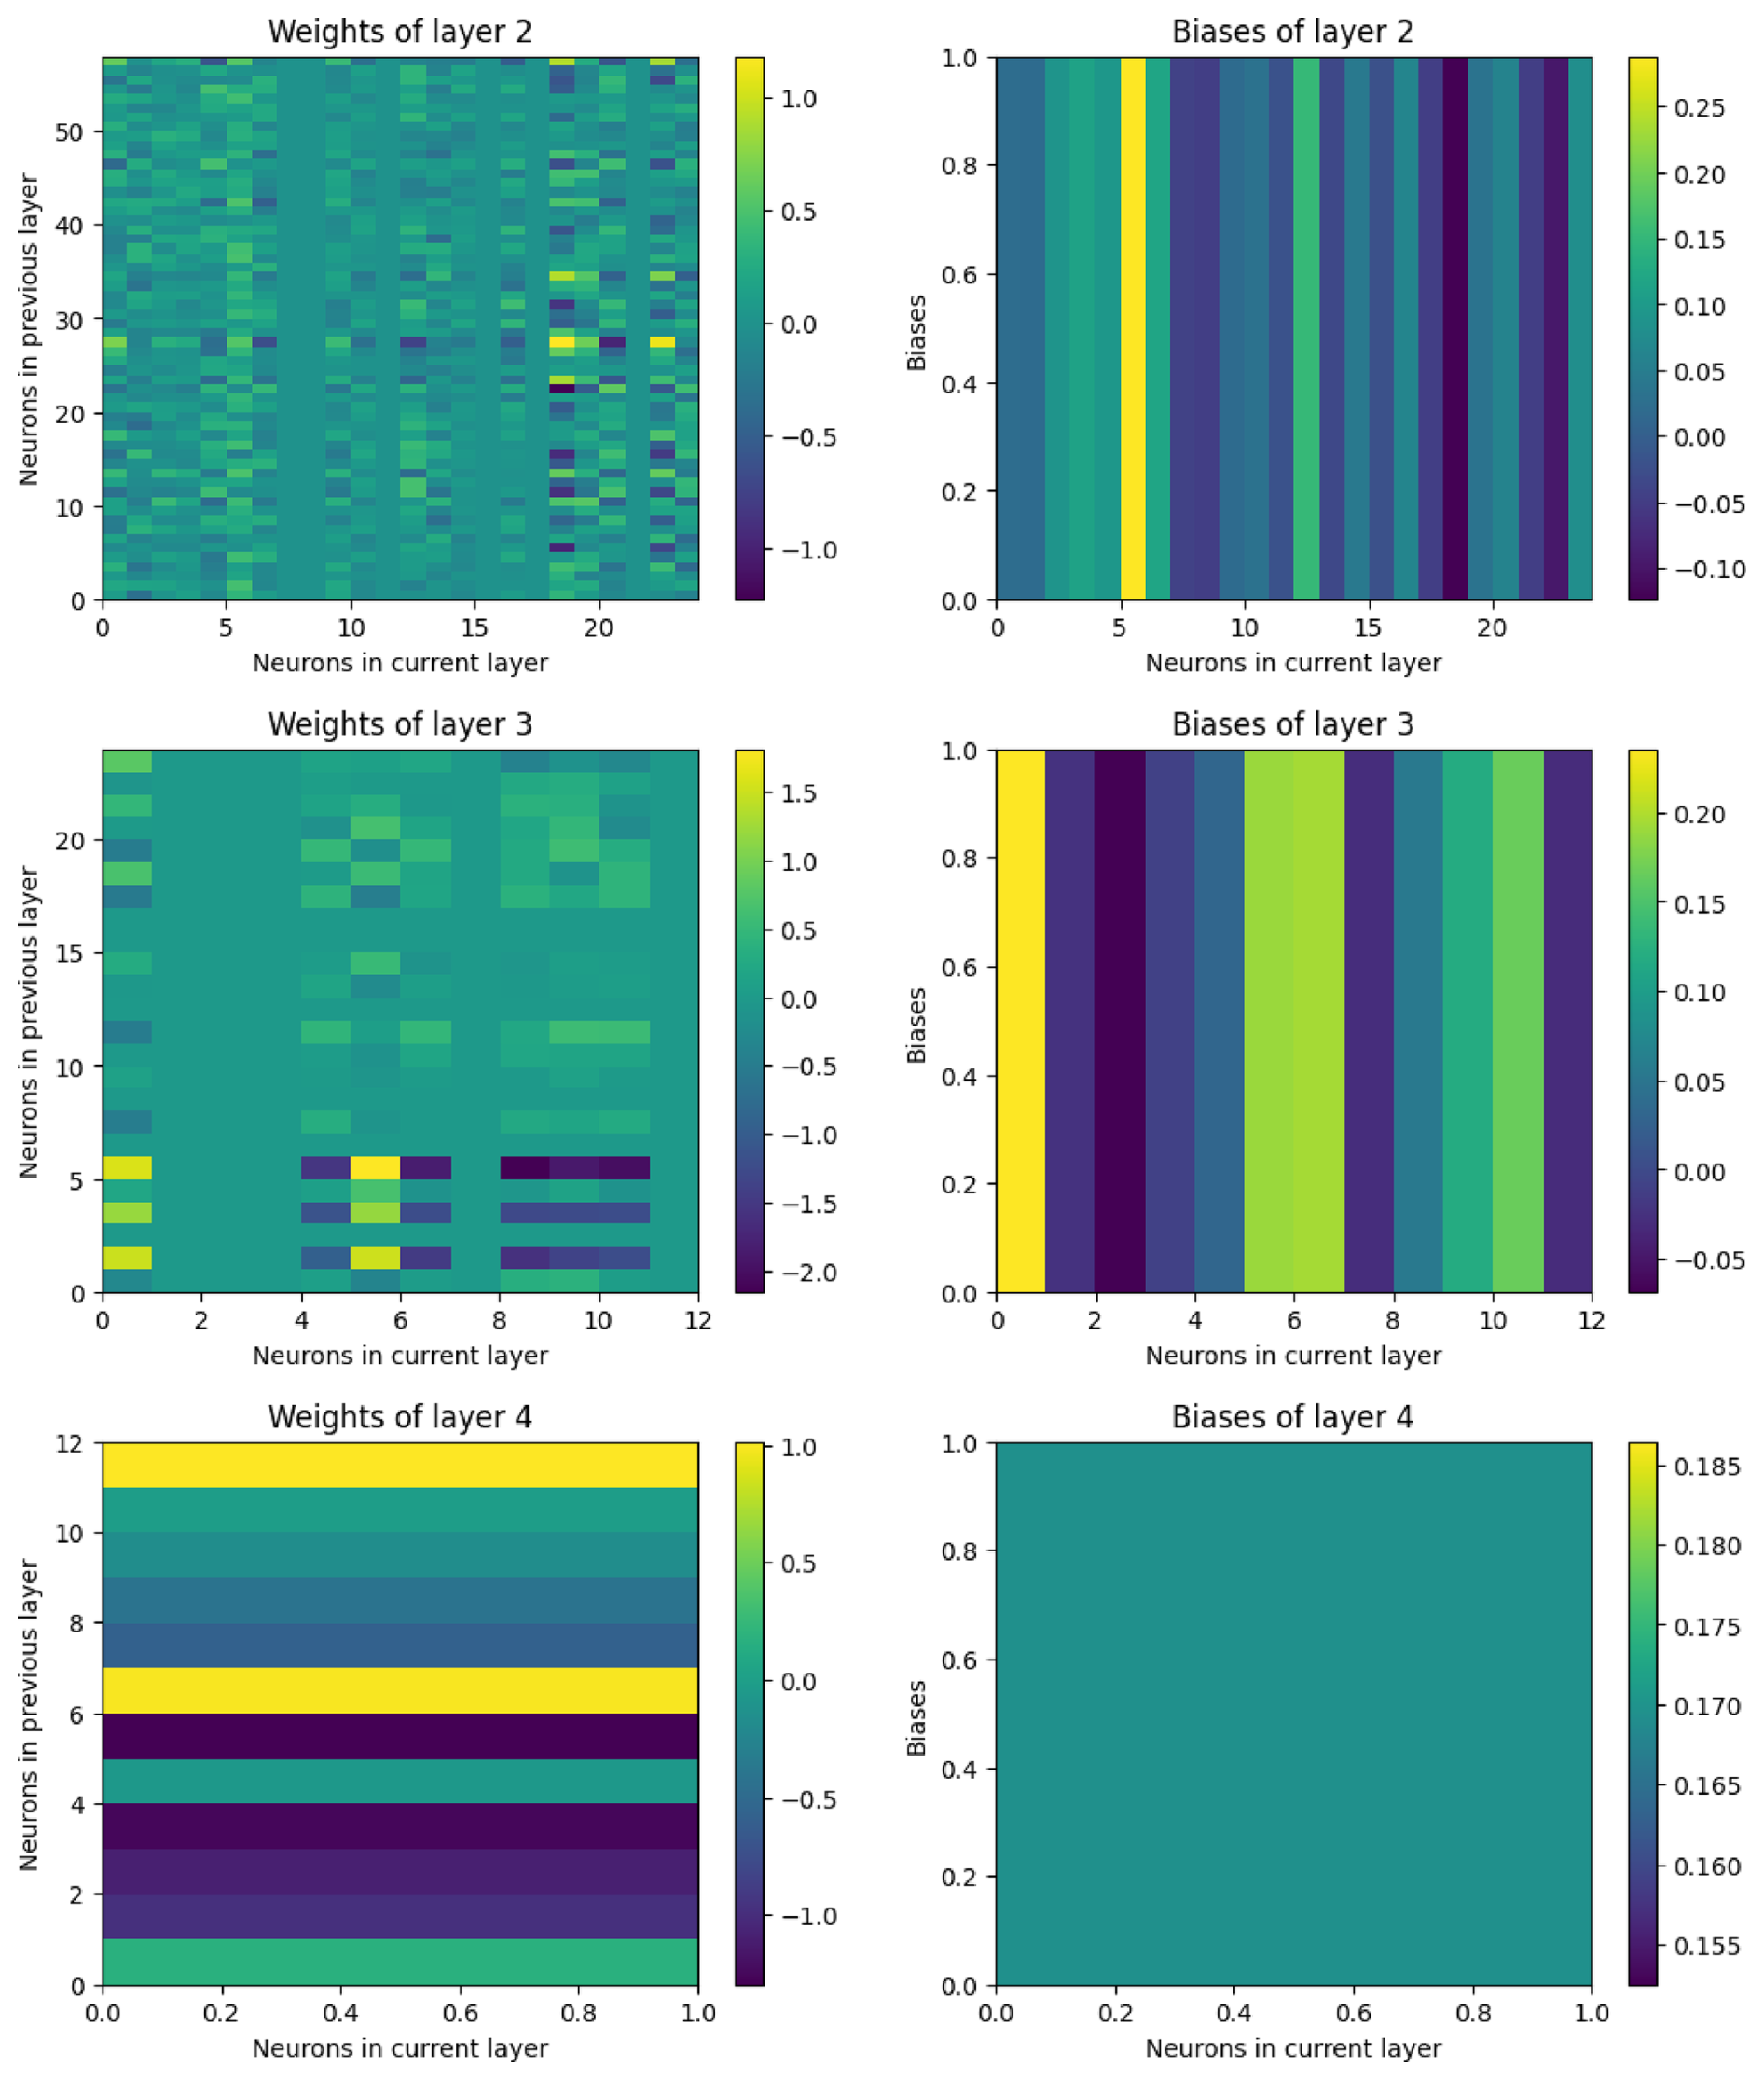
Figure B1Heatmap of neuron weights and biases for all layers of the DevNet model except the input layer.
The code and data used for MPM based on the DEEP-SEAM v1.0 framework are archived on Zenodo (https://doi.org/10.5281/zenodo.17098677; Luo et al., 2025a). All data used in this study are publicly available. The raw data can be downloaded from the South Australian Resources Information Gateway (https://map.sarig.sa.gov.au, last access: 27 March 2026). The DEEP-SEAM v1.0 is also available on GitHub (https://github.com/EarthByte/MPM_Curnamona_REE, Luo et al., 2025b).
ZL: Conceptualization, Methodology, Software, Writing – original draft. EF: Conceptualization, Resources, Software, Writing – review & editing. SH: Conceptualization, Writing – review & editing. RDM: Conceptualization, Writing – review & editing, Supervision.
The contact author has declared that none of the authors has any competing interests.
Publisher's note: Copernicus Publications remains neutral with regard to jurisdictional claims made in the text, published maps, institutional affiliations, or any other geographical representation in this paper. The authors bear the ultimate responsibility for providing appropriate place names. Views expressed in the text are those of the authors and do not necessarily reflect the views of the publisher.
The authors would like to thank the South Australian Resources Information Gateway (https://map.sarig.sa.gov.au, last access: 27 March 2026) for providing geological datasets used in this study. We also extend our sincere gratitude to the anonymous reviewers for their constructive comments and detailed suggestions, which have significantly improved the quality and clarity of this manuscript.
This research has been supported by the China Scholarship Council (grant no. 202206410105) and the Australian Research Council (grant no. LP210100173).
This paper was edited by Thomas Poulet and reviewed by two anonymous referees.
Alley, N. F. and Hore, S. B.: Early Cretaceous sediments reveal a story of prolonged cold climate, glaciations, oscillating sea level and tectonic changes, Geological Survey of South Australia Bulletin 57, Department for Energy and Mining, South Australia, Adelaide, https://catalog.sarig.sa.gov.au/document/2023d008243 (last access: 27 March 2026), 2022.
Alonso, E., Sherman, A. M., Wallington, T. J., Everson, M. P., Field, F. R., Roth, R., and Kirchain, R. E.: Evaluating Rare Earth Element Availability: A Case with Revolutionary Demand from Clean Technologies, Environ. Sci. Technol., 46, 3406–3414, https://doi.org/10.1021/es203518d, 2012.
Alper, O. C., Doğan, H., and Öztürk, H.: Gear pitting fault detection: Leveraging anomaly detection methods, in: IEEE 2023 14th International Conference on Electrical and Electronics Engineering (ELECO), 1–5, https://doi.org/10.1109/ELECO60389.2023.10416063, 2023.
Austin, J. and Foss, C.: Rich, attractive and extremely dense: A geophysical review of Australian IOCGs, ASEG Extend. Abstr., 2012, 1–4, https://doi.org/10.1071/ASEG2012ab278, 2012.
Baldi, P., Brunak, S., Chauvin, Y., Andersen, C. A. F., and Nielsen, H.: Assessing the accuracy of prediction algorithms for classification: an overview, Bioinformatics, 16, 412–424, https://doi.org/10.1093/bioinformatics/16.5.412, 2000.
Bedini, E.: Mineral mapping in the Kap Simpson complex, central East Greenland, using HyMap and ASTER remote sensing data, Adv. Space Res., 47, 60–73, https://doi.org/10.1016/j.asr.2010.08.021, 2011.
Bergen, K. J., Johnson, P. A., de Hoop, M. V., and Beroza, G. C.: Machine learning for data-driven discovery in solid Earth geoscience, Science, 363, eaau0323, https://doi.org/10.1126/science.aau0323, 2019.
Bogacz, W. V.: The tectogenetic explanation of the uranium potential of the Paralana Mineral System in the Mt Painter Inlier, northwest margin of the Curnamona Craton, South Australia, Abstracts for the September 2006 Conference, GA Record 2006/21, https://www.ga.gov.au/bigobj/GA8853.pdf (last access: 27 March 2026), 2006.
Breiman, L.: Random Forests, Mach. Learn., 45, 5–32, https://doi.org/10.1023/A:1010933404324, 2001.
Brewer, A. M.: Annual Report Exploration Licence 480 (Gunsight) for period May 25, 1979 to May 24, 1980. Marathon Petroleum Australia Ltd. Department of Mines and Energy, South Australia Open File Envelope 3536, unpublished, 1980.
Brown, W. M., Gedeon, T. D., Groves, D. I., and Barnes, R. G.: Artificial neural networks: A new method for mineral prospectivity mapping, Aust. J. Earth Sci., 47, 757–770, https://doi.org/10.1046/j.1440-0952.2000.00807.x, 2000.
Bustillo Revuelta, M.: Mineral Resource Exploration, in: Mineral Resources: From Exploration to Sustainability Assessment, edited by: Bustillo Revuelta, M., Springer International Publishing, Cham, 121–222, https://doi.org/10.1007/978-3-319-58760-8_3, 2018.
Carranza, E. J. M.: Controls on mineral deposit occurrence inferred from analysis of their spatial pattern and spatial association with geological features, Ore Geol. Rev., 35, 383–400, https://doi.org/10.1016/j.oregeorev.2009.01.001, 2009.
Carranza, E. J. M., Hale, M., and Faassen, C.: Selection of coherent deposit-type locations and their application in data-driven mineral prospectivity mapping, Ore Geol. Rev., 33, 536–558, https://doi.org/10.1016/j.oregeorev.2007.07.001, 2008.
Chen, Y. and Wu, W.: Mapping mineral prospectivity using an extreme learning machine regression, Ore Geol. Rev., 80, 200–213, https://doi.org/10.1016/j.oregeorev.2016.06.033, 2017.
Cheng, Q.: Mapping singularities with stream sediment geochemical data for prediction of undiscovered mineral deposits in Gejiu, Yunnan Province, China, Ore Geol. Rev., 32, 314–324, https://doi.org/10.1016/j.oregeorev.2006.10.002, 2007.
Cheng, Q.: Singularity theory and methods for mapping geochemical anomalies caused by buried sources and for predicting undiscovered mineral deposits in covered areas, J. Geochem. Explor., 122, 55–70, https://doi.org/10.1016/j.gexplo.2012.07.007, 2012.
Cheng, Q. and Zhao, P.: Singularity theories and methods for characterizing mineralization processes and mapping geo-anomalies for mineral deposit prediction, Geosci. Front., 2, 67–79, https://doi.org/10.1016/j.gsf.2010.12.003, 2011.
Cohen, J.: A Coefficient of Agreement for Nominal Scales, Educ. Psycholog. Meas., 20, 37–46, https://doi.org/10.1177/001316446002000104, 1960.
Connelly, N. G., Damhus, T., Hartshorn, R. M., and Hutton, A. T. (Eds.): Nomenclature of Inorganic Chemistry: IUPAC Recommendations 2005, Royal Society of Chemistry, https://publications.iupac.org/books/rbook/Red_Book_2005.pdf (last access: 27 March 2026), 2005.
Curewitz, D. and Karson, J. A.: Structural settings of hydrothermal outflow: Fracture permeability maintained by fault propagation and interaction, J. Volcanol. Geoth. Res., 79, 149–168, https://doi.org/10.1016/S0377-0273(97)00027-9, 1997.
Dhurandhar, A. P. and Saxena, D. N.: Intergrated Airborne Gammaray Spectral and Satellite Data Analysis for U and REE Mineralisation – A Case Sudy from North Sagobandh Area, District Sonbhadra, Uttar Pradesh, India, J. Indian Soc. Remote Sens., 27, 43–57, https://doi.org/10.1007/BF02990774, 1999.
Drenth, B. J.: Geophysical expression of a buried niobium and rare earth element deposit: The Elk Creek carbonatite, Nebraska, USA, Interpretation, 2, SJ23–SJ33, https://doi.org/10.1190/INT-2014-0002.1, 2014.
Drexel, J. F. and Major, R. B.: Mount Painter uranium – rare earth deposits. in: Geology of the mineral deposits of Australia and Papua New Guinea, Monograph Series 14, edited by: Hughes, F. E., AusIMM– Australasian Institute of Mining and Metallurgy, 993–998, https://www.ausimm.com/publications/monograph/monograph-14—geology-of-the-mineral-deposits-of-australia (last access: 27 March 2026), 1990.
Dusabemariya, C., Qian, W., Bagaragaza, R., Faruwa, A. R., and Ali, M.: Some experiences of resistivity and induced polarization methods on the exploration of sulfide: A review, J. Geosci. Environ. Protect., 8, 68–92, https://doi.org/10.4236/gep.2020.811004, 2020.
Dushyantha, N., Batapola, N., Ilankoon, I. M. S. K., Rohitha, S., Premasiri, R., Abeysinghe, B., Ratnayake, N., and Dissanayake, K.: The story of rare earth elements (REEs): Occurrences, global distribution, genesis, geology, mineralogy and global production, Ore Geol. Rev., 122, 103521, https://doi.org/10.1016/j.oregeorev.2020.103521, 2020.
Edgecombe, D.: Preliminary discussion on field trip to the Mt. Neil – Parabarana area, Period 3rd June to 11th June 1998, Open File Envelope 9205, Goldstream Mining N. L. Department of Mines and Energy, South Australia unpublished, 1998.
Egozcue, J. J., Pawlowsky-Glahn, V., Mateu-Figueras, G., and Barceló-Vidal, C.: Isometric Logratio Transformations for Compositional Data Analysis, Math. Geol., 35, 279–300, https://doi.org/10.1023/A:1023818214614, 2003.
Elburg, M. A., Andersen, T., Bons, P. D., Simonsen, S. L., and Weisheit, A.: New constraints on Phanerozoic magmatic and hydrothermal events in the Mt Painter Province, South Australia, Gondwana Res., 24, 700–712, https://doi.org/10.1016/j.gr.2012.12.017, 2013.
Exoil: Exploration Department of Mines and Energy, South Australia Open File Envelope 3633, unpublished, 1970.
Farahbakhsh, E., Maughan, J., and Müller, R. D.: Prospectivity modelling of critical mineral deposits using a generative adversarial network with oversampling and positive-unlabelled bagging, Ore Geol. Rev., 162, 105665, https://doi.org/10.1016/j.oregeorev.2023.105665, 2023.
Fawcett, T.: An introduction to ROC analysis, Pattern Recognition Letters, 27, 861–874, https://doi.org/10.1016/j.patrec.2005.10.010, 2006.
Filzmoser, P., Hron, K., and Reimann, C.: Principal component analysis for compositional data with outliers, Environmetrics, 20, 621–632, https://doi.org/10.1002/env.966, 2009.
Gao, F., Li, J., Cheng, R., Zhou, Y., and Ye, Y.: Connet: Deep semi-supervised anomaly detection based on sparse positive samples. IEEE Access, 9, 67249–67258, https://doi.org/10.1109/ACCESS.2021.3077014, 2021.
Goldfarb, R. J. and Groves, D. I.: Orogenic gold: Common or evolving fluid and metal sources through time, Lithos, 233, 2–26, https://doi.org/10.1016/j.lithos.2015.07.011, 2015.
Goodenough, K. M., Wall, F., and Merriman, D.: The Rare Earth Elements: Demand, Global Resources, and Challenges for Resourcing Future Generations, Nat. Resour. Res., 27, 201–216, https://doi.org/10.1007/s11053-017-9336-5, 2018.
Goodenough, K. M., Deady, E. A., Beard, C. D., Broom-Fendley, S., Elliott, H. A. L., van den Berg, F., and Öztürk, H.: Carbonatites and Alkaline Igneous Rocks in Post-Collisional Settings: Storehouses of Rare Earth Elements, J. Earth Sci., 32, 1332–1358, https://doi.org/10.1007/s12583-021-1500-5, 2021.
Granek, J. and Haber, E.: Data mining for real mining: A robust algorithm for prospectivity mapping with uncertainties, in: Proceedings of the 2015 SIAM International Conference on Data Mining (SDM), Society for Industrial and Applied Mathematics, 145–153, https://doi.org/10.1137/1.9781611974010.17, 2015.
Grunsky, E. C. and de Caritat, P.: State-of-the-art analysis of geochemical data for mineral exploration, Geochemistry: Explor. Environ. Anal., 20, 217–232, https://doi.org/10.1144/geochem2019-031, 2019.
Guth, P. L., Van Niekerk, A., Grohmann, C. H., Muller, J.-P., Hawker, L., Florinsky, I. V., Gesch, D., Reuter, H. I., Herrera-Cruz, V., Riazanoff, S., López-Vázquez, C., Carabajal, C. C., Albinet, C., and Strobl, P.: Digital Elevation Models: Terminology and Definitions, Remote Sens., 13, 3581, https://doi.org/10.3390/rs13183581, 2021.
Hauke, J. and Kossowski, T.: Comparison of Values of Pearson's and Spearman's Correlation Coefficients on the Same Sets of Data, Quaestion. Geogr., 30, 87–93, https://doi.org/10.2478/v10117-011-0021-1, 2011.
Hoatson, D. M., Jaireth, S., and Miezitis, Y.: The major rare-earth-element deposits of Australia: geological setting, exploration, and resources, Geoscience Australia, https://www.ga.gov.au/bigobj/GA19659.pdf (last access: 27 March 2026), 2011.
Hore, S. B.: Mount Painter region, South Australia 1:100 000 Geological Atlas Special Series Map, DIGIMAP 00005, GSSA – Geological Survey of South Australia, Adelaide, https://dsd-gdp.s3.amazonaws.com/2037106/DIGIMAP00005.zip (last access: 27 March 2026), 2015.
Hore, S. B., Hill, S. M., Reid, A., Wade, B., Alley, N. F., and Mason, D. R.: U–Pb geochronology reveals evidence of a Late Devonian hydrothermal event, and protracted hydrothermal–epithermal system, within the Mount Painter Inlier, northern Flinders Ranges, South Australia, Aust. J. Earth Sci., 67, 1009–1044, https://doi.org/10.1080/08120099.2020.1793383, 2020a.
Hore, S. B., Hill, S. M., and Alley, N. F.: Early Cretaceous glacial environment and paleosurface evolution within the Mount Painter Inlier area, northern Flinders Ranges, South Australia. South Australia, Aust. J. Earth Sci., 67, 1117–1160, https://doi.org/10.1080/08120099.2020.1730963, 2020b.
Hronsky, J. M. and Kreuzer, O. P.: Applying spatial prospectivity mapping to exploration targeting: Fundamental practical issues and suggested solutions for the future, Ore Geol. Rev., 107, 647–653, https://doi.org/10.1016/j.oregeorev.2019.03.016, 2019.
Jagodzinski, E. and Fricke, C. E.: Compilation of new SHRIMP U-Pb geochronological data for the southern Curnamona Province, South Australia, https://catalog.sarig.sa.gov.au/dataset/d20010225/resource/0e05937a-0dc4-4ecb-9b36-35d59b4a7976 (last access: 27 March 2026), 2010.
Jaireth, S., Hoatson, D. M., and Miezitis, Y.: Geological setting and resources of the major rare-earth-element deposits in Australia, Ore Geol. Rev., 62, 72–128, https://doi.org/10.1016/j.oregeorev.2014.02.008, 2014.
Jowitt, S. M., Medlin, C. C., and Cas, R. A. F.: The rare earth element (REE) mineralisation potential of highly fractionated rhyolites: A potential low-grade, bulk tonnage source of critical metals, Ore Geol. Rev.,, 86, 548–562, https://doi.org/10.1016/j.oregeorev.2017.02.027, 2017.
Katona, L. F.: Gridding of South Australian Ground Gravity Data, using the Supervised Variable Density Method, Report Book 2017/00012, Department of the Premier and Cabinet, South Australia, Adelaide, https://catalog.sarig.sa.gov.au/document/d20011685 (last access: 27 March 2026), 2017.
Khoshnoodi, K., Yazdi, M., Behzadi, M., and Gannadi-Maragheh, M.: Using of ASTER, ETM+ and gamma spectrometry airborne data to find the relationship between the distribution of alkali metasomatism and REE mineralization in the Bafq area, Central Iran, J. Sci. Islam. Republ. Iran, 27, 65–77, 2016.
Kovacs, I.: Origin of the South Australian Heat Flow Anomaly, in: An excursion guide to the Flinders Ranges, South Australia, edited by: Aikman, A., Lilly, K., Celerier, J., Kovacs, I., and Estermann, G., J. Virtual Explor., 20, 14, https://doi.org/10.3809/jvirtex.2005.00137, 2005.
LeCun, Y., Bengio, Y., and Hinton, G.: Deep learning, Nature, 521, 436–444, https://doi.org/10.1038/nature14539, 2015.
Leevy, J. L., Khoshgoftaar, T. M., Bauder, R. A., and Seliya, N.: A survey on addressing high-class imbalance in big data, J. Big Data, 5, 42, https://doi.org/10.1186/s40537-018-0151-6, 2018.
Leroy, J. L. and Turpin, L.: REE, Th and U behaviour during hydrothermal and supergene processes in a granitic environment, Chem. Geol., 68, 239–251, https://doi.org/10.1016/0009-2541(88)90024-1, 1988.
Li, T., Zuo, R., Xiong, Y., and Peng, Y.: Random-drop data augmentation of deep convolutional neural network for mineral prospectivity mapping.,Nat. Resour. Res., 30, 27–38, https://doi.org/10.1007/s11053-020-09742-z, 2021.
Liu, B., Lee, W. S., Yu, P. S., and Li, X.: Partially supervised classification of text documents, in: ICML 02(485), 387–394, https://www.cs.uic.edu/~liub/S-EM/unlabelled.pdf (last access: 27 March 2026), 2002.
Liu, B., Dai, Y., Li, X., Lee, W. S., and Yu, P. S.: November. Building text classifiers using positive and unlabeled examples, in: Third IEEE international conference on data mining, 179–186, https://doi.org/10.1109/ICDM.2003.1250918, 2003.
Long, K. R., Van Gosen, B. S., Foley, N. K., and Cordier, D.: The Principal Rare Earth Elements Deposits of the United States: A Summary of Domestic Deposits and a Global Perspective, in: Non-Renewable Resource Issues: Geoscientific and Societal Challenges, edited by: Sinding-Larsen, R. and Wellmer, F.-W., Springer Netherlands, Dordrecht, 131–155, https://doi.org/10.1007/978-90-481-8679-2_7, 2012.
Lottermoser, B. G.: Rare earth elements and hydrothermal ore formation processes, Ore Geol. Rev., 7, 25–41, https://doi.org/10.1016/0169-1368(92)90017-F, 1992.
Lundberg, S. M. and Lee, S.-I.: A Unified Approach to Interpreting Model Predictions, in: Advances in Neural Information Processing Systems, arXiv [preprint], https://doi.org/10.48550/arXiv.1705.07874, 2017.
Luo, Z., Zuo, R., Xiong, Y., and Zhou, B.: Metallogenic-factor variational autoencoder for geochemical anomaly detection by ad-hoc and post-hoc interpretability algorithms, Nat. Resour. Res., 32, 835–853, https://doi.org/10.1007/s11053-023-10200-9, 2023.
Luo, Z., Farahbakhsh, E., Müller, R. D., and Zuo, R.: Multivariate statistical analysis and bespoke deviation network modeling for geochemical anomaly detection of rare earth elements, Appl. Geochem., 174, 106146, https://doi.org/10.1016/j.apgeochem.2024.106146, 2024.
Luo, Z., Farahbakhsh, E., Hore, S., and Müller, R. D.: An explainable semi-supervised deep learning framework for mineral prospectivity mapping: DEEP-SEAM v1.0, Zenodo [code], https://doi.org/10.5281/zenodo.17098677, 2025a.
Luo, Z., Farahbakhsh, E., Hore, S., and Müller, R. D.: An explainable semi-supervised deep learning framework for mineral prospectivity mapping, GitHub [code], https://github.com/EarthByte/MPM_Curnamona_REE (last access: 27 March 2026), 2025b.
Marshall, N. J.: Geochemical Exploration Studies in the Mt. Painter Province, South Australia Open File Envelope 3536, Department of Mines and Energy, unpublished, 1979.
McCafferty, A. E., Phillips, J. D., and Driscoll, R. L.: Magnetic and gravity gradiometry framework for Mesoproterozoic iron oxide-apatite and iron oxide-copper-gold deposits, southeast Missouri, Econ. Geol., 111, 1859–1882, https://doi.org/10.2113/econgeo.111.8.1859, 2016.
McCuaig, T. C. and Hronsky, J. M. A.: The Mineral System Concept: The Key to Exploration Targeting, in: Building Exploration Capability for the 21st Century, vol. 18, edited by: Kelley, K. D. and Golden, H. C., Society of Economic Geologists, https://doi.org/10.5382/SP.18.08, 2014.
McPhee, K. A., Hodkinson, I. P., and Mackie, A. M.: Report for Exploration Licence 871 (Gunsight) for 6 Month Period Ending 28 February, 1982, Open File Envelope 3536, Department of Mines and Energy, South Australia, unpublished, 1982.
Mou, N., Carranza, E. J. M., Wang, G., and Sun, X.: A Framework for Data-Driven Mineral Prospectivity Mapping with Interpretable Machine Learning and Modulated Predictive Modeling, Nat. Resour. Res., 32, 2439–2462, https://doi.org/10.1007/s11053-023-10272-7, 2023.
Mou, N., Carranza, E. J. M., Xue, J., Zhang, S., Wang, G., Song, H., Chen, Y., and Ren, X.: Interpretable machine learning for mineral prospectivity mapping in the Qulong–Jiama district, Tibet, China, Ore Geol. Rev., 106659, https://doi.org/10.1016/j.oregeorev.2025.106659, 2025.
Neumann, N., Sandiford, M., and Foden, J.: Regional geochemistry and continental heat flow: implications for the origin of the South Australian heat flow anomaly, Earth Planet. Sc. Lett., 183, 107–120, https://doi.org/10.1016/S0012-821X(00)00268-5, 2000.
Newton, W., Daly, S., Robertson, S., Preiss, W., Conor, C., and Burtt, A.: Overview of geology and mineralisation in South Australia, ASEG Extend. Abstr., 2003, 1–18, https://doi.org/10.1071/ASEGSpec12_01, 2003.
Nguyen, G., Dlugolinsky, S., Bobák, M., Tran, V., López García, Á., Heredia, I., Malík, P., and Hluchý, L.: Machine Learning and Deep Learning frameworks and libraries for large-scale data mining: a survey, Artif. Intel. Rev., 52, 77–124, https://doi.org/10.1007/s10462-018-09679-z, 2019.
Nykänen, V., Lahti, I., Niiranen, T., and Korhonen, K.: Receiver operating characteristics (ROC) as validation tool for prospectivity models – A magmatic Ni–Cu case study from the Central Lapland Greenstone Belt, Northern Finland, Ore Geol. Rev., 71, 853–860, https://doi.org/10.1016/j.oregeorev.2014.09.007, 2015.
Pang, G., Shen, C., and van den Hengel, A.: Deep Anomaly Detection with Deviation Networks, in: Proceedings of the 25th ACM SIGKDD International Conference on Knowledge Discovery & Data Mining, New York, NY, USA, 353–362, https://doi.org/10.1145/3292500.3330871, 2019.
Pang, G., Shen, C., Jin, H., and van den Hengel, A.: Deep weakly-supervised anomaly detection. in: Proceedings of the 29th ACM SIGKDD International Conference on Knowledge Discovery & Data Mining, New York, NY, USA, 1795–1807, https://doi.org/10.1145/3580305.3599302, 2023.
Pitcairn, I. K., Teagle, D. A., Craw, D., Olivo, G. R., Kerrich, R., and Brewer, T. S.: Sources of metals and fluids in orogenic gold deposits: insights from the Otago and Alpine Schists, New Zealand, Econ. Geol., 101, 1525–1546, https://doi.org/10.2113/gsecongeo.101.8.1525, 2006.
Pour, A. B. and Hashim, M.: Identification of hydrothermal alteration minerals for exploring of porphyry copper deposit using ASTER data, SE Iran, J. Asian Earth Sci., 42, 1309–1323, https://doi.org/10.1016/j.jseaes.2011.07.017, 2011.
Preiss, W. V.: The Adelaide Geosyncline of South Australia and its significance in Neoproterozoic continental reconstruction, Precamb. Res., 100, 21–63, https://doi.org/10.1016/S0301-9268(99)00068-6, 2000.
Reed, G. and Keeping, T.: 2021 State TMI grid merge, Report Book 2024/00017, Department for Energy and Mining, South Australia, Adelaide, https://catalog.sarig.sa.gov.au/document/mesac1793 (last access: 27 March 2026), 2025a.
Reed, G. and Keeping, T.: 2025 State radiometric grid merge, Report Book 2025/00021, Department for Energy and Mining, South Australia, Adelaide, https://catalog.sarig.sa.gov.au/document/mesac1866 (last access: 27 March 2026), 2025b.
Reynolds, J. M.: An Introduction to Applied and Environmental Geophysics, John Wiley & Sons, 1249 pp., ISBN 9781119957140, 2011.
Ribeiro, M. T., Singh, S., and Guestrin, C.: “Why Should I Trust You?”: Explaining the Predictions of Any Classifier, in: Proceedings of the 22nd ACM SIGKDD International Conference on Knowledge Discovery and Data Mining, New York, NY, USA, 1135–1144, https://doi.org/10.1145/2939672.2939778, 2016.
Robertson, R. S., Preiss, W. V., Crooks, A. F., Hill, P. W., and Sheard, M. J.: Review of the Proterozoic geology and mineral potential of the Curnamona Province in South Australia, AGSO J. Aust. Geol. Geophys., 17, 169–182, 1998.
Robertson, R. S., Conor, C. H. H., Preiss, W. V., Crooks, A. F., and Sheard, M. J.: Curnamona Province, in: South Australia mineral explorers guide, 2n Edn., South Australia, Mineral Exploration Data Package 11, chap. 3, edited by: Cooper, B. J. and McGeough, M. A., Department of Primary Industries and Resources, https://catalog.sarig.sa.gov.au/document/mesac19670 (last access: 27 March 2026), 2006.
Rodriguez-Galiano, V., Sanchez-Castillo, M., Chica-Olmo, M., and Chica-Rivas, M.: Machine learning predictive models for mineral prospectivity: An evaluation of neural networks, random forest, regression trees and support vector machines, Ore Geol. Rev., 71, 804–818, https://doi.org/10.1016/j.oregeorev.2015.01.001, 2015.
Ruff, L., Vandermeulen, R. A., Görnitz, N., Binder, A., Müller, E., Müller, K. R., and Kloft, M.: Deep semi-supervised anomaly detection, arxiv [preprint], arxiv:1906.02694, https://doi.org/10.48550/arXiv.1906.02694, 2019.
Rutherford, L., Hand, M., and Barovich, K.: Timing of Proterozoic metamorphism in the southern Curnamona Province: implications for tectonic models and continental reconstructions, Aust. J. Earth Sci., 54, 65–81, https://doi.org/10.1080/08120090600981459, 2007.
Sandiford, M., McLaren, S. and Neumann, N.: Long-term thermal consequences of the redistribution of heat-producing elements associated with large-scale granitic complexes, J. Metamorph. Geol., 20, 87–98, https://doi.org/10.1046/j.0263-4929.2001.00359.x, 2002.
Shah, A. K., Taylor, R. D., Walsh, G. J., and Phillips, J. D.: Integrated geophysical imaging of rare earth element-bearing iron oxide-apatite deposits in the Eastern Adirondack Highlands, New York, Geophysics, 86, B37–B54, https://doi.org/10.1190/geo2019-0783.1, 2021.
Sharma, P. V.: Magnetic method applied to mineral exploration, Ore Geol. Rev., 2, 323–357, https://doi.org/10.1016/0169-1368(87)90010-2, 1987.
Sheard, M. J.: Explanatory Notes for CALLABONNA 1:250 000 Geological Map, sheet SH54-6, Report Book 2009/01, South Australia, Department of Primary Industries and Resources, https://catalog.sarig.sa.gov.au/document/d20010138 (last access: 27 March 2026), 2009.
Sheard, M. J., Fanning, C. M., and Flint, R. B.: Geochronology and definition of Mesoproterozoic volcanics and granitoids of the Mount Babbage Inlier, South Australia, Quarterly Geological Notes 123, South Australia, Geological Survey, 18–32, https://catalog.sarig.sa.gov.au/document/2018d037573 (last access: 27 March 2026), 1992.
Shrikumar, A., Greenside, P., and Kundaje, A.: Learning Important Features Through Propagating Activation Differences, in: Proceedings of the 34th International Conference on Machine Learning, International Conference on Machine Learning, 3145–3153, 2017.
Sillitoe, R. H.: Porphyry copper systems, Econ. Geol., 105, 3–41, https://doi.org/10.2113/gsecongeo.105.1.3, 2010.
Simandl, G. J. and Paradis, S.: Carbonatites: related ore deposits, resources, footprint, and exploration methods, Appl. Earth Sci., 127, 123–152, https://doi.org/10.1080/25726838.2018.1516935, 2018.
Singer, D. A.: Basic concepts in three-part quantitative assessments of undiscovered mineral resources, Nat. Resour. Res., 2, 69–81, https://doi.org/10.1007/BF02272804, 1993.
Singer, D. A. and Kouda, R.: Application of a feedforward neural network in the search for Kuroko deposits in the Hokuroku district, Japan, Math. Geol., 28, 1017–1023, https://doi.org/10.1007/BF02068587, 1996.
Smith, M. P., Moore, K., Kavecsánszki, D., Finch, A. A., Kynicky, J., and Wall, F.: From mantle to critical zone: A review of large and giant sized deposits of the rare earth elements, Geosci. Front., 7, 315–334, https://doi.org/10.1016/j.gsf.2015.12.006, 2016.
Spandler, C., Slezak, P., and Nazari-Dehkordi, T.: Tectonic significance of Australian rare earth element deposits, Earth-Sci. Rev., 207, 103219, https://doi.org/10.1016/j.earscirev.2020.103219, 2020.
Sullivan, C. J., Broadhurst, E., and Sprigg, R. C.: Reports on individual uranium occurrences, in: Report on investigation of uranium deposits at Mount Painter, South Australia [during the period] June 1944 to September 1945, Part III(3), Report Book 40/1, edited by: Newman, J. M., Rivett, D., and Dickinson, S. B., South Australia Department of Mines, Adelaide, 124–168, https://catalog.sarig.sa.gov.au/document/rb4000001 (last access: 27 March 2026), 1945.
Sun, K., Chen, Y., Geng, G., Lu, Z., Zhang, W., Song, Z., Guan, J., Zhao, Y., and Zhang, Z.: A Review of Mineral Prospectivity Mapping Using Deep Learning, Minerals, 14, https://doi.org/10.3390/min14101021, 2024.
Sun, T., Li, H., Wu, K., Chen, F., Zhu, Z., and Hu, Z.: Data-driven predictive modelling of mineral prospectivity using machine learning and deep learning methods: A case study from Southern Jiangxi Province, China, Minerals, 10, 102, https://doi.org/10.3390/min10020102, 2020.
Taylor, C. D., Zierenberg, R. A., Goldfarb, R. J., Kilburn, J. E., Seal, R. R., Kleinkopf, M. D., and Du Bray, E. A.: Volcanic-associated massive sulfide deposits, Open-File Report 95-831, United States Geological Survey, America, https://pubs.usgs.gov/of/1995/ofr-95-0831/CHAP16.pdf (last access: 27 March 2026), 1995.
Teale, G. S.: Wattleowie Rare Earth Prospect, E. L. 480, Northern Flinders Ranges, South Australia, Open File Envelope 3536, Department of Mines, South Australia, unpublished, 1981.
Teale, G. S.: Geology of the Mount Painter and Mount Babbage Inliers (Mesoproterozoic), in: Volume 1, The Precambrian, Bulletin 54, edtited by: Drexel, J. F., Preiss, W. V., and Parker, A. J., The geology of South Australia, South Australia, Geological Survey, Adelaide, 149–156, https://catalog.sarig.sa.gov.au/document/2018d037831 (last access: 27 March 2026), 1993.
Teale, G. S.: Exploration Licence 2173, “Arkaroola”, Report on Geological Reconnaissance Work for Goldstream Mining N. L. Department of Mines and Energy, South Australia Open File Envelope 9205, unpublished, 1995.
Thomas, M. d., Ford, K. l., and Keating, P.: Review paper: Exploration geophysics for intrusion-hosted rare metals, Geophys. Prospect., 64, 1275–1304, https://doi.org/10.1111/1365-2478.12352, 2016.
Tukey, J. W.: Exploratory data analysis, Pearson, London, UK, ISBN 9780134995458, 1977.
Van Rijsbergen, C. J.: Foundation of evaluation, J. Doc., 30, 365–373, 1974.
VanTrump, G. and Miesch, A. T.: The U.S. geological survey rass-statpac system for management and statistical reduction of geochemical data, Comput. Geosci., 3, 475–488, https://doi.org/10.1016/0098-3004(77)90025-5, 1977.
Walters, A. and Lusty, P.: Rare earth elements, British Geological Survey, 54 pp., https://nora.nerc.ac.uk/id/eprint/17448/1/Rare_Earth_Elements_profile[1].pdf (last access: 27 March 2026), 2011.
White, A. J.: Granites and Uranium Mineralisation in the Mount Painter Complex Northern Flinders Ranges, Open File Envelope 12288, PIRSA, Adelaide, unpublished, 2005.
Whitehead, S.: The Mineralology of some Mt. Painter Breccias, Report MP2714/76, AMDEL Petrological, unpublished, 1976.
Williams, H. A., Betts, P. G., and Ailleres, L.: Constrained 3D modeling of the Mesoproterozoic Benagerie Volcanics, Australia, Phys. Earth Planet. Inter., 173, 233–253, https://doi.org/10.1016/j.pepi.2009.01.002, 2009.
Wülser, P. A.: Uranium metallogeny in the North Flinders Ranges region of South Australia, PhD thesis, University of Adelaide, Adelaide, 250 pp., https://digital.library.adelaide.edu.au/items/e3a2b832-4f02-4d7a-b1f6-899d63d98cb5 (last access: 27 March 2026), 2009.
Wülser, P. A., Brugger, J., Foden, J., and Pfeifer, H. R.: The Sandstone-Hosted Beverley Uranium Deposit, Lake Frome Basin, South Australia:Mineralogy, Geochemistry, and a Time-Constrained Model for Its Genesis, Econ. Geol., 106, 835–867, https://doi.org/10.2113/econgeo.106.5.835, 2011.
Xiong, Y., Zuo, R., and Carranza, E. J. M.: Mapping mineral prospectivity through big data analytics and a deep learning algorithm, Ore Geol. Rev., 102, 811–817, https://doi.org/10.1016/j.oregeorev.2018.10.006, 2018.
Xu, S., Hu, X., Carranza, E. J. M., and Wang, G.: Multi-parameter analysis of local singularity mapping and its application to identify geochemical anomalies in the Xishan Gold Deposit, North China, Nat. Resour. Res., 29, 3425–3442, https://doi.org/10.1007/s11053-020-09669-5, 2020.
Yang, F., Zuo, R., and Kreuzer, O. P.: Artificial intelligence for mineral exploration: A review and perspectives on future directions from data science, Earth Sci. Rev., 258, 104941, https://doi.org/10.1016/j.earscirev.2024.104941, 2024.
Yang, N., Zhang, Z., Yang, J., and Hong, Z.: Applications of data augmentation in mineral prospectivity prediction based on convolutional neural networks, Comput. Geosci., 161, 105075, https://doi.org/10.1016/j.cageo.2022.105075, 2022.
Zhang, Y. L., Li, L., Zhou, J., Li, X., and Zhou, Z. H.: Anomaly detection with partially observed anomalies, in: Companion Proceedings of the The Web Conference 2018, 639–646, https://doi.org/10.1145/3184558.3186580, 2018.
Zhao, P. and Chen, Y.: Digital geosciences and quantitative mineral exploration, J. Earth Sci., 32, 269–275, https://doi.org/10.1007/s12583-021-1440-0, 2021.
Zhao, P. D.: “Three Component” quantitative resource prediction and assessment: theory and practice of digital mineral prospecting, J. Earth Sci., 27, 139–148, 2002.
Zheng, H., Sun, D., Han, X., Zhang, X., and Zhao, Y.: Research on Network Security Intrusion Detection Based on Devnet, in: Proceedings of the 3rd International Conference on Signal Processing, Computer Networks and Communications, 251–256, https://doi.org/10.1145/3712335.3712379, 2024.
Zhou, B., Li, Z., Zhao, Y., Zhang, C., and Wei, Y.: Rare Earth Elements supply vs. clean energy technologies: new problems to be solve, Gospodarka Surowcami Mineralnymi, 32, 29–44, https://doi.org/10.1515/gospo-2016-0039, 2016.
Zivak, D.: Rare Earth Element (REE) potential of the Curnamona Province, South Australia, Report Book 2024/00037, Department for Energy and Mining, South Australia, Adelaide, https://catalog.sarig.sa.gov.au/document/mesac2#:~:text=This report provides a review of the major,systems association to better assess the REE potential (last access: 27 March 2026), 2024.
Zuo, R.: Geodata Science-Based Mineral Prospectivity Mapping: A Review, Nat. Resour. Res., 29, 3415–3424, https://doi.org/10.1007/s11053-020-09700-9, 2020.
Zuo, R.: Key technology for intelligent mineral prospectivity map: Challenges and solutions, Sci. China Earth Sci., 68, 2976–2991, https://doi.org/10.1007/s11430-025-1622-1, 2025.
Zuo, R. and Carranza, E. J. M.: Support vector machine: A tool for mapping mineral prospectivity, Comput. Geosci., 37, 1967–1975, https://doi.org/10.1016/j.cageo.2010.09.014, 2011.
Zuo, R. and Xu, Y.: Graph deep learning model for mapping mineral prospectivity, Math. Geosci., 55, 1–21, https://doi.org/10.1007/s11004-022-10015-z, 2023.
Zuo, R., Kreuzer, O. P., Wang, J., Xiong, Y., Zhang, Z., and Wang, Z.: Uncertainties in GIS-Based Mineral Prospectivity Mapping: Key Types, Potential Impacts and Possible Solutions, Nat. Resour. Res., 30, 3059–3079, https://doi.org/10.1007/s11053-021-09871-z, 2021.
Zuo, R., Luo, Z., Xiong, Y., and Yin, B.: A Geologically Constrained Variational Autoencoder for Mineral Prospectivity Mapping, Nat. Resour. Res., 31, 1121–1133, https://doi.org/10.1007/s11053-022-10050-x, 2022.
Zuo, R., Xiong, Y., Wang, Z., Wang, J., and Kreuzer, O. P.: A New Generation of Artificial Intelligence Algorithms for Mineral Prospectivity Mapping, Nat. Resour. Res., 32, 1859–1869, https://doi.org/10.1007/s11053-023-10237-w, 2023.
Zuo, R., Cheng, Q., Xu, Y., Yang, F., Xiong, Y., Wang, Z., and Kreuzer, O. P.: Explainable artificial intelligence models for mineral prospectivity mapping, Sci. China Earth Sci., 67, 2864–2875, https://doi.org/10.1007/s11430-024-1309-9, 2024.
Zuo, R., Yang, F., Cheng, Q., and Kreuzer, O. P.: A novel data-knowledge dual-driven model coupling artificial intelligence with a mineral systems approach for mineral prospectivity map, Geology, 53, 284–288, https://doi.org/10.1130/G52970.1, 2025.
- Abstract
- Introduction
- Geological setting and REE mineralisation
- Materials and methods
- Results and discussion
- Conclusions
- Appendix A: RPCA analysis plots
- Appendix B: Weights and biases heatmap
- Code and data availability
- Author contributions
- Competing interests
- Disclaimer
- Acknowledgements
- Financial support
- Review statement
- References