the Creative Commons Attribution 4.0 License.
the Creative Commons Attribution 4.0 License.
 | 26 Mar 2026
The microbial community model MCoM 1.0: a scalable framework for modelling phototroph–heterotrophic interactions in diverse microbial communities
Michael J. Follows
Jason G. Bragg
Sinikka T. Lennartz
Microbial communities, comprising phototrophic and heterotrophic microorganisms, play a crucial role in global biogeochemical cycles. However, existing biogeochemical models rarely take into account the complex interactions between these groups, usually focusing on competition for resources instead. In this work, we introduce the Microbial Community Model (MCoM), a framework for simulating the dynamics of diverse microbial communities. MCoM incorporates a wide range of interactions, such as cross-feeding, metabolite effects, and competition for nutrients. The model differentiates between dissolved organic nutrients (DON) and carbon (DOC), accounts for phytoplankton and heterotrophic bacterial species-specific organic matter release and uptake profiles, and simulates the impacts of bacterial metabolites on phytoplankton growth. Implemented as a box model, MCoM tracks phototrophic and heterotrophic biomass, active metabolites, DOC, DON, and inorganic nutrients through non-linear differential equations, enabling the exploration of emergent properties and feedbacks. We demonstrate the model's capabilities through simulations of experimental data of pairwise co-cultures of heterotrophic and phototrophic microorganisms, and find overall good agreement. Due to the scalable implementation, interaction matrices for larger, i.e. hundreds, of microbial groups can easily be realised. We show examples for such applications of MCoM in assessing emergent dynamics, including periodic succession patterns and multi-stability. MCoM provides a versatile, scalable, and customizable platform for assessing the range from pairwise interactions to complex microbial communities and their impact on biogeochemical fluxes.
- Article
(1407 KB) - Full-text XML
-
Supplement
(4831 KB) - BibTeX
- EndNote


Microorganisms are the main driver of global biogeochemical cycles of major elements such as carbon, nitrogen and phosphorus. The microbially mediated turnover of these elements does not happen in isolation, because microorganisms live in diverse, interacting communities. The study of such communities in oceanic ecosystems and their adequate representation in biogeochemical models is key to understanding global elemental cycles, which in turn are crucial for the Earth's ecosystems and the habitability of the planet (Tagliabue, 2023). Arguably the two most fundamental processes in these ecosystems are photosynthetic primary production that fixes inorganic carbon and nutrients into organic biomass, and heterotrophic decomposition of organic matter back to CO2 and inorganic nutrients. Biogeochemical models are powerful tools to quantify elemental fluxes mediated by phototrophic and heterotrophic microorganisms at various scales. They can generally achieve good agreement with observations in terms of common macronutrients and carbon reservoirs (e.g., Friedrichs et al., 2007; Séférian et al., 2020), and a biogeochemical component is a central part of state-of-the-art global Earth System Models.
When modeling the interactions between phototrophic phytoplankton and heterotrophic bacteria and archae, it is important to capture their mutual trophic dependency. On one hand, the growth rates of heterotrophic consumers are primarily driven by the availability of organic matter, which is synthesized from inorganic nutrients and carbon by phytoplankton populations. A key factor influencing the composition of the heterotroph community is the specific composition of this organic material produced by phytoplankton, which varies between species (Sarmento et al., 2013; Becker et al., 2014; Mühlenbruch et al., 2018) and favors different consumers that are adapted to specific compounds (Teeling et al., 2012; Sarmento et al., 2013; Elovaara et al., 2021). Phytoplankton not only release DOM through the breakdown of previously assimilated biomass but also exude excess of newly fixed carbon (Myklestad, 2000; Thornton, 2014). The composition of these exudates can vary significantly depending on environmental conditions, phytoplankton species, and growth phase (Buchan et al., 2014). In particular, the elemental ratios of the exudates are influenced by the growth-limiting factor, resulting in varying carbon-to-nutrient ratios, potentially imposing subsequent limitation on heterotrophic bacterial communities (Saad et al., 2016). In turn, phototrophic phytoplankton is dependent on the recycling of organic matter that provides new inorganic nutrients, a process mediated by heterotrophic organisms.
A main limitation of traditional biogeochemical modelling approaches is their focus on competition for resources among microbes, mainly phytoplankton, neglecting widespread experimental evidence that interactions between phototrophs and heterotrophs comprise positive, neutral and negative interactions resulting from cross-feeding or metabolite exchange (Sher et al., 2011; Seymour et al., 2017; Cirri and Pohnert, 2019; Kost et al., 2023). For example, certain bacteria release siderophores, which can either sequester iron, limiting its availability to phytoplankton or make it more accessible (Maldonado and Price, 1999; Kazamia et al., 2018). Other bacteria produce algicides (Coyne et al., 2022), while some synthesize beneficial metabolites such as vitamin B12 (Sultana et al., 2023), or hormones like auxins (Amin et al., 2015). Further, heterotrophic bacteria may relieve oxidative stress on phytoplankton by degrading reactive oxygen species, e.g., hydrogen peroxide (Morris et al., 2022).
These microbial interactions are ubiquitous (Kost et al., 2023), and systematically affect the rates of growth and elemental turnover of microorganisms and, hence, biogeochemical fluxes (Seymour et al., 2017). Even though these interactions occur on cellular scales, they may have cascading effects on the entire ecosystem with consequences for carbon cycling and, ultimately, climate regulation. However, a mathematical framework on how to incorporate these widespread microbial interactions and link it to elemental turnover is missing, hampering our ability to systematically assess their community-level effects. Existing theoretical approaches have started including cooperation (De Mazancourt and Schwartz, 2010) or facilitation (Koffel et al., 2021) into consumer-resource theory, but have not yet been applied in biogeochemical modelling. To address the middle ground between purely theoretical and species specific models, we present the Microbial Community Model (MCoM), which is designed to simulate the dynamics of microbial communities, encompassing both phototrophic and heterotrophic populations and account for various types of interactions. MCoM incorporates features such as the differentiation of dissolved organic nutrients (DON) and carbon (DOC), DOM release profiles of phytoplankton and heterotrophic bacterial species, DOM preference profiles of heterotrophs, as well as the positive or negative impacts of bacterial products on phytoplankton growth. Microbial interactions are represented through matrices that can be constructed based on general network properties, enabling the analysis of collective behaviour such as microbial succession and resource turnover without requiring explicit knowledge of all individual interactions. Additionally, the model accounts for competition for inorganic nutrients, excess production of DON and DOC by phytoplankton, and excess remineralization of DON by heterotrophic bacteria. Currently implemented as a box model, MCoM tracks state variables such as biomass, DOC, DON, and inorganic nutrients in a homogeneous volume of water through non-linear differential equations. This approach allows exploration of emergent properties and feedbacks within microbial communities, which may be essential for advancing predictive oceanic and climate modelling.
We describe the mathematical formulation of the model in Sect. 2. In Sect. 3, we present several examples to evaluate its capabilities to fit experimental data and to describe emergent dynamics, and we discuss these examples and the model's assumptions and possible future developments in Sect. 4.
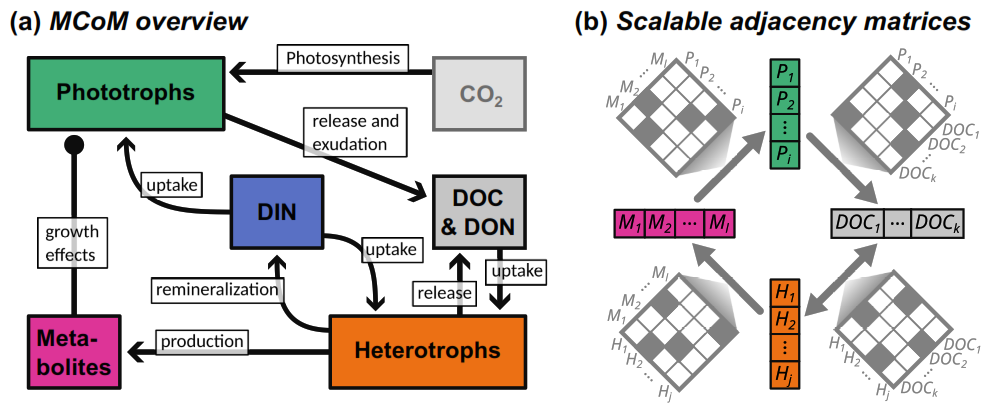
Figure 1(a) Model structure as flux diagram between different elemental pools. DOC: dissolved organic carbon; DON: dissolved organic nutrient; DIN: dissolved inorganic nutrient. (b) Schematic representation of network connectivity between different multi-dimensional components: adjacency matrices connect state vectors.
Figure 1a gives a schematic overview of the processes implemented in MCoM. Most importantly, the model includes two types of microbial populations: phototrophs and heterotrophs. Phototrophs fix CO2 (which is assumed to be abundant and is therefore not explicitly modelled) and an inorganic nutrient. Photosynthesis and nutrient uptake can be decoupled in the model, with the excess material (e.g. DOC in the nutrient limited case) is released by the cell into the surrounding water. DOC and DON are also released when cells disintegrate, where each species can be assigned an associated composition of DOC and DON compounds. Heterotroph populations feed on dissolved organic material and, optionally, on the inorganic nutrient. If DON is abundant, excess remineralization may occur if configured. Upon mortality, heterotrophic biomass is transformed to the DOC and DON pools, in an analogous way as for phototrophs. Additionally, heterotroph populations can be modelled to produce specific metabolites. These can be configured to impact the mortality rate of defined phototrophs, such that symbiotic or inhibitory interactions can be implemented. Hence, complex community interactions can be reproduced, which may shift with environmental conditions. For instance, with a shift to higher nutrient availability, nutrient competition between a phototroph and a heterotroph could switch to mutualistic provision with DOM and remineralized nutrient, respectively.
2.1 State variables
In MCoM, any momentary state of the microbial model system is represented by variables describing chemical concentrations and population densities of the model's components. These state variables are time-dependent, where the time t is measured in days. MCoM's state space is comprised of the following variables:
-
Phytoplankton population densities Pi(t), i∈𝒫 (cells L−1)
-
Heterotroph population densities Hi(t), i∈ℋ (cells L−1)
-
Concentrations of dissolved organic nutrient (DON) compounds Di(t), i∈𝒩 (mM(N))
-
Concentrations of dissolved organic carbon (DOC) compounds Di(t), i∈𝒞 (mM(C))
-
Concentrations of bacterial metabolites acting on phytoplankton growth Mi(t), i∈ℳ (L−1)
-
The nutrient concentration N(t) (mM(N))
2.2 Notation
We are using index sets 𝒫 (phototrophs), ℋ (heterotrophs), 𝒩 (DON compounds), 𝒞 (DOC compounds), and ℳ (metabolites) throughout the text to enumerate the different components of a specific type. These indices are used extensively to refer to parameters, which occur in different contexts. For instance, Vj→i with i∈ℋ and j∈𝒞 denotes the maximal uptake rate of the DOC compound Dj associated with the heterotroph population Hi. For an overview of parameters and associated physical units, we refer to Table S1 in the Supplement. In MCoM, all parameters, as well as the community size and interaction network are fully customizable by configuration files following a scheme described in the README provided with the model's source code (Lücken et al., 2026). The configuration format allows for an explicit definition of all parameters, in particular the interaction matrices shown in Fig. 1b. Additionally, it provides means for randomized community generation.
In the following subsections, we define the different processes that determine the dynamics in detail. For the formal presentation, we use the notation fX→Y to denote elemental fluxes, where X is the source and Y the sink of the corresponding flow. The unit of a flow is the unit of its source and sink per day. We list all flows in Table S2 of the Supplement. Parameters are indexed by the state variable(s) they adhere to. For instance, δi with i∈𝒫 denotes the loss rate for the phytoplankton population Pi, and VN→i denotes the maximal DIN uptake rate for the population Pi. A full list of parameters is given in Table S1. For some parameter, additional information is included in a superscript. E.g., and denote the cellular chlorophyll and nutrient content, respectively.
Further, please note that we assume fixed stoichiometric molar ratios (for i∈𝒫 and i∈ℋ) and an average cell carbon content . Hence, although the populations are measured in cells density, elemental C- and N-content can be associated unambiguously given and .
2.3 Phytoplankton population dynamics
The growth of a phytoplankton population Pi is governed by
where is the cellular carbon content, fC→i is the photosynthetic carbon assimilation flux, fi→DOC summarizes losses of biomass to DOC, and Δ is a physical transport rate, which can, e.g., be used to model dilution or washout in chemostat setups. Assuming a fixed stoichiometric composition of the biomass of population Pi, the elemental in- and outfluxes of carbon and nutrient must adhere to the corresponding C:N-ratio . Algebraically, this is expressed as
We apply Liebig's minimum principle to distinguish two different growth regimes, depending on the limiting factor. Specifically, light intensity determines the maximal carbon assimilation rate , while nutrient availability governs the maximal nutrient assimilation rate . As the realized fluxes must adhere to the stoichiometric constraints (2), nutrient limitation occurs when
and light limitation when .
2.3.1 Maximal and realized assimilation rates
Under conditions where nutrient availability is the primary limiting factor, nutrient uptake is defined by the nutrient concentration () and determines phytoplankton growth. This maximal uptake is assumed to be characterized by a type-II response function:
where VN→i is the (theoretical) maximum nutrient uptake rate (different to , which is the maximal rate under current conditions) and KN→i is the corresponding half-saturation constant. The corresponding carbon assimilation fC→i is calculated according to Eq. (2).
In light-limited regimes the growth is governed by the maximal photosynthetic carbon assimilation
where is the average chlorophyll content per cell and ϕi(I) is the P-I curve associated to phytoplankton species Pi, which describes the dependence of the photosynthesis rate on the irradiance I. For the P-I curve we assume the form
with initial sensitivity αi, photoinhibition coefficient βi and upper bound for the photosynthesis rate (Platt et al., 1980).
2.3.2 Assimilation and exudation of DOM
Phytoplankton species exude excessively fixed organic matter directly into the environment (Myklestad, 2000; Thornton, 2014). In the nutrient limited regime the surplus photosynthetic capacity is assumed to be used for exudation of DOC, which is calculated as the difference between the photosynthesis rate under the respective light conditions and the actual growth rate as constrained by nutrient concentrations:
In the light limited regime, exudates are assumed to be nutrient-saturated1 and we employ an extended scheme to determine the exudation rates, because organic exudates contain a minimal amount of carbon. We assume that nutrient-rich DOM has a uniform C:N ratio (with ), i.e.,
Notably, this assumption implies that not all carbon is utilized for biomass assimilation, even though its fixation rate limits the population's growth. To maintain a balance between growth and exudation in nutrient-rich environments, we introduce a maximal fraction of , up to which carbon can be allocated for exudation. A maximization of DON exudation under this constraint (see Sect. S2 in the Supplement) gives
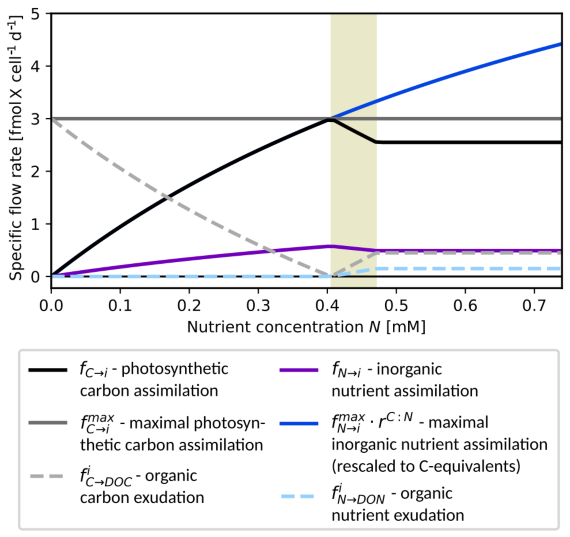
Figure 2Excess DOM exudation by phytoplankton. Exudation rates fC→DOC (gray dashed) and fN→DON (light blue dashed) are plotted against nutrient availability N for a fixed photosynthesis rate = 3.0 (dark gray) and a single cell, i.e., Pi=1. Additional curves: (rescaled) maximal nutrient assimilation rate (blue), realized assimilation rates fC→i (black) and fN→i (purple). Other parameters for this example: = 5.2 mol(C) mol(N)−1, = 3.0 mol(C) mol(N)−1, , VN→i = 2.0 d−1, KN→i = 1.0 mM(N).
Figure 2 shows the resulting dependence of assimilation and exudation on nutrient availability with fixed photosynthesis rate . For low nutrient concentrations, the growth rate follows the maximal nutrient uptake rate, i.e., (overlapping black and blue curves), cf. Eq. (4) and only DOC is excreted at a rate (dashed gray curve). The growth rate reaches its maximum around a concentration N = 0.4 mM, where and no DOM is excreted. For larger concentrations, the growth becomes light-limited and excreted DOM has C:N ratio . Within the interval (shaded background), the first argument of the minimum function in Eq. (8) takes effect, and the fraction of photosynthesised organic carbon allocated to exudation is smaller than . For increasing nutrient an increasing share of fixed organic carbon is exuded until the share reaches the maximal value of at N≈0.47 and the exudation profile becomes independent of further increases in nutrient concentrations.
2.3.3 Population losses
The phytoplankton mortality is governed by the sum of three terms:
where δi is the base rate of linear mortality, δq,i is the coefficient of quadratic mortality, and the sum describes the total impact of present metabolites on Pi. Note that the second term in the maximum function may theoretically become negative, because the coefficients aj→i are allowed to be negative in order to model beneficial metabolite effects. The maximum in Eq. (9) ensures that such a reduction of mortality results in biologically meaningful (i.e., non-negative) values.
2.4 Heterotroph population dynamics
The bacterial population densities Hi change according to:
where fDOC→i describes the carbon assimilation into biomass from DOC compounds and fi→DOC the loss of biomass to organic compounds. As for phytoplankton, heterotrophs are modelled with a fixed stoichiometric composition , which is preserved by imposing
Since heterotrophic populations are assumed to obtain nutrients from inorganic and organic sources, the constraint for the influx involves both sources. Importantly, the DOM assimilation fluxes are aggregates of fluxes from individual compounds, i.e.,
Growth may be limited either by DOC or by total (organic and inorganic) nutrient availability, and the realized assimilation flux is determined by a minimum principle comparing maximal total assimilation rates of carbon () and nutrient (). A population Hi is nutrient limited if
and energy limited if the opposite holds.
2.4.1 Maximal assimilation rates
The maximal uptake rate of an individual organic compound Dj by population Hi is modelled as
Here, Vj→i is the (theoretical) maximal uptake rate (cf. Eq 4) and Kj→i is the corresponding half-saturation constant. Similarly, the maximal uptake of inorganic nutrient is
When consuming DOM compounds, a part of the compounds is assumed to be catabolized, i.e., metabolically degraded for energy extraction. Hence, only a part of the uptake is available for integration into biomass and the remainder is remineralized and released into the inorganic nutrient and carbon pools. Correspondingly, the maximal assimilation rate for the compound Dj is calculated as
where the yield coefficient Yj→i determines the assimilated fraction. The resulting maximal organic assimilation fluxes are
2.4.2 DOM assimilation and remineralization
If the population Hi grows under nutrient limited conditions, it takes up and assimilates DON compounds at the maximum possible rates, i.e.,
The fraction of DON uptake, which is not assimilated, is remineralized and induces a flow from the organic pool Dj to the inorganic nutrient pool N:
Further, the inorganic nutrient is assimilated at maximum rate as well. Adhering to the stoichiometric constraints (11), the uptake of DOC is regulated down. We assume that this regulation decreases the uptake of all available DOC compounds proportionally, i.e., for j∈𝒞, with a factor , yielding corresponding assimilation and remineralization fluxes of
In carbon limited situations (Eq. 3 is not fulfilled), DOC is used at maximum rates, i.e., for all j∈𝒞:
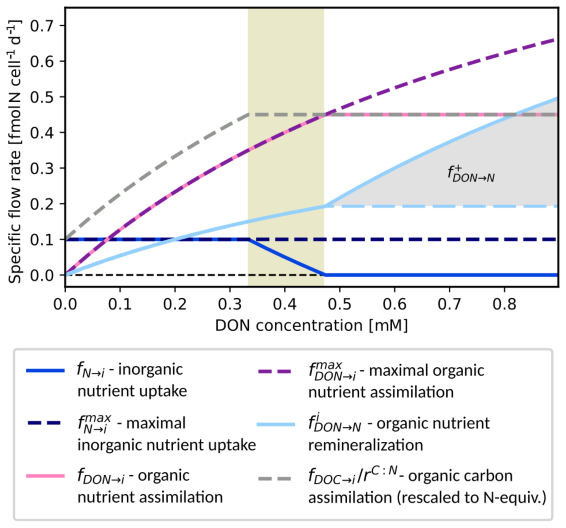
Figure 3Bacterial remineralization of DON by one cell of a population Hi. Remineralization rate (light blue) plotted against DON availability at constant nutrient and DOC concentrations. Variants with (solid) and without (dashed) differ for DON levels (> 0.47 mM). Additional curves: assimilation of DOC (rescaled), DON and DIN , fDON→i, and fN→i, maximal nutrient and DON assimilation and , and remineralization . Parameters for this example: , , , . Maximal nutrient and carbon assimilation rates: and = 1.8.
While the total assimilation rate of nutrient is tied to fDOC→i by stoichiometry, MCoM implements two variants of how heterotrophs behave with regard to excess DON uptake capacities.2 Either, (i) heterotrophs still take up maximal amounts of DON and eventually remineralize any excess, or (ii) they homogeneously decrease the uptake rates for the different DON compounds such that nutrient assimilation matches carbon assimilation. The latter regulation is implemented analogously as above for DOC compounds in the nutrient limited case. In any case, we assume that DON is used preferentially and inorganic nutrient is only taken up to a degree necessary to serve the nutrient demands. More explicitly, for variant (i) we assume that for j∈𝒩. If the DON uptake exceeds DOC uptake, i.e.,
additional remineralization occurs:
If Eq. (22) holds for variant (ii), the realized uptake rates for DON compounds are modified as with a factor and .
Figure 3 shows the uptake, remineralization, as well as assimilation for varying DON at fixed DOC and inorganic nutrient concentrations. For growth limiting concentrations of DON, DON availability controls the population growth rate and is remineralized at a minimal fraction. For intermediate concentrations, the fraction of remineralized DON remains the same but less and less inorganic nutrient is used (shaded interval . For DON concentrations above 0.47 mM, all nutrient requirements are served by DON and for increasing concentrations, the surplus DON is completely remineralized (variant (i), solid light blue curve) or DON remineralization rates remain constant for higher DON concentrations (variant (ii), dashed light blue curve).
2.4.3 Population loss and metabolite investment
Heterotroph biomass loss is assumed to consist of three components:
Here, δi is the base rate of linear mortality, δq,i is the quadratic mortality coefficient, and
is the metabolite production investment with fractions πi→j of newly assimilated biomass expended for the production of metabolite Mj.
2.5 DOM dynamics
The dynamics of individual DOM compounds are considered to follow the form
Here, influxes originate from phytoplankton and heterotroph population decay and from DOM exudation by phytoplankton, and outfluxes correspond to consumption by heterotrophs.
In Sects. 2.3 and 2.4, we introduced the aggregate fluxes fi→DOC and fi→DON, i∈𝒫 or i∈ℋ. To determine their impact on the concentrations on individual DOM compounds Dj, we assume specific partitioning coefficients
That is, the individual fluxes are calculated as
For simplicity, the excess DOC- or DON-exudation and by phytoplankton is assumed to follow the same partitioning to individual compounds:
Further, we denote the total uptake and remineralization fluxes per compound by
2.6 Metabolite dynamics
Metabolite pools Mj are modelled without any specific stoichiometry, since their contribution to the total DOM is assumed to be negligible. The energy expenditure for their synthesis is modelled by the corresponding loss term in Eq. (24). The concentrations Mj represent a basis to calculate the impact of metabolite Mj on susceptible phytoplankton species as described in Sect. 2.3. They are governed by production and decay:
Here, the coefficient θj determines the amount of biomass required to synthesize a unit of Mj and δj determines the decay rate of Mj.
2.7 Nutrient dynamics
The change of nutrient concentration is driven by uptake from phytoplankton and heterotrophs and remineralization of DON by heterotrophs. Further, MCoM permits to define an external nutrient concentration Next to model exchange of medium with an external domain:
Here, the aggregate flows are defined as
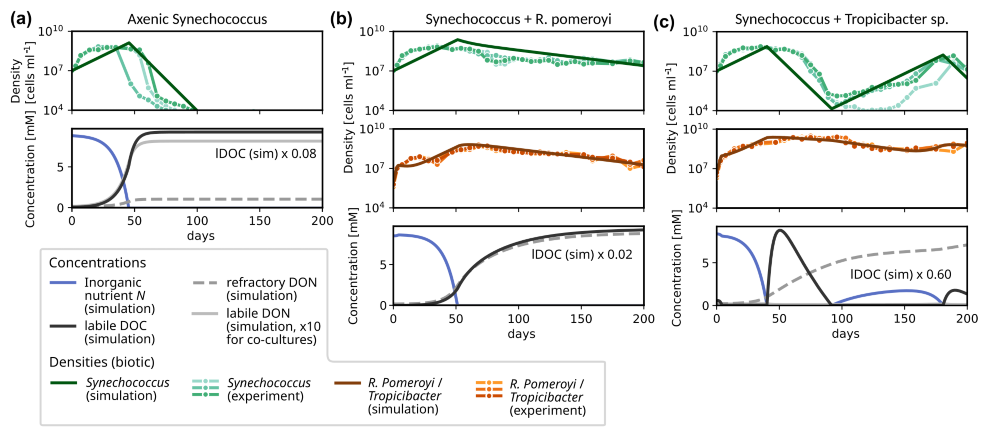
Figure 4Experimentally observed and modelled growth dynamics of Synechococcus in co-culture with different heterotrophic bacteria: (a) axenic culture; (b) co-culture with R. Pomeroyi; (c) co-culture with Tropicibacter sp. For each experimental setup, three replicates were prepared, which are shown in the upper plot of each panel, see (Christie-Oleza et al., 2017) for details. For the simulations, we report Synechococcus (dark green) and heterotroph densities (brown), and concentrations of inorganic nutrient (blue), of labile DOC (black), labile DON (solid gray) and refractory DON (dashed gray).
2.8 Scaling up to diverse microbial communities
A key feature of MCoM is the straightforward scalability to larger interaction networks. The size and connectivity of the interaction network, i.e., the number of phototroph populations, heterotroph populations, metabolites, and organic compounds can be specified in the configuration file, together with respective parameter values and interaction matrices. MCoM offers different built-in ways to define microbial communities and their interaction networks: For controlled set-ups, it is possible to define all rate constants and interactions explicitly. This explicit definition allows the user to write their own algorithms for the generation of the community's interaction network. To generate randomized networks, the entire community or a subset of parameters can be determined stochastically. When employing stochastic network generation, reproducibility can be ensured by setting a seed for the random generation.3 For instance, the user can quickly set up a community by providing the number of phototrophs, heterotrophs, resources and metabolites, specifying the in- and output of populations (the number of produced resources and metabolites, as well as the number of consumed resources in case of heterotrophs and the number of metabolites affecting the population in case of phototrophs) and value ranges for the other system parameters. A specific option4 allows to define a community of phototroph–heterotroph pairs, which only interact by exchange of DOM and metabolites within the pairs, i.e., all adjacency matrices are diagonal. Additional functions to generate interaction matrices according to customized requirements can easily be implemented.
3.1 Evaluation of network motifs without metabolite-induced feedbacks: Nutrient Remineralization in Synechococcus co-cultures
In the following sections, we evaluate model performance for individual motifs of the interaction network as the smallest unit in diverse microbial communities. In a first example, we apply the simplest version of the model, i.e., a co-culture of one phototrophic and one heterotrophic strain, without any metabolite-induced feedbacks, to an incubation experiment to assess its capability to reproduce the observed temporal variation in cell abundances. Christie-Oleza et al. (2017) cultured Synechococcus populations over a 200 d period in co-cultures with two different heterotrophic bacteria (R. Pomeroyi and Tropicibacter sp.) in nutrient enriched ASW medium. When grown axenically, the phototroph population went extinct around day 75–100. If it was co-cultured with a heterotroph, it remained active until the end of the experiment at day 200. The key interaction was hypothesized to be a mutual exchange of essential resources (Christie-Oleza et al., 2017). Synechococcus provided organic material to the heterotrophs, from which these extracted energy and nutrients. In return, the heterotrophs remineralized nutrients, making them available to Synechococcus again. Although the phototroph population densities reached a peak around days 30–40 for each setup, they showed significantly distinct growth trajectories for the different types of heterotrophs. When grown together with R. Pomeroyi, the subsequent population decay proceeded steadily at a relatively slow rate until reaching 2.7–4.4 × 10⁷ cells mL−1 at day 200. For Tropicibacter sp., the temporal development after the initial peak is less stable (cf. Fig. 4c). Within the subsequent 60–70 d, Synechococcus collapsed to minima of 1.0–13.0 × 10⁵ cells mL−1 attained around days 96–117 for this case. These minima were then followed by a gradual recovery of the population density until reaching another peak at 3.6–14.7 × 10⁷ cells mL−1 at the penultimate measurement time around day 190, declining again at the last measurement on day 200 to densities 1.1–2.1 × 10⁷ cells mL−1.
We modelled both co-cultures and the axenic growth using MCoM with fixed growth parameters for the phototroph and specific characteristics for the heterotrophs. We first selected all parameters manually within plausible ranges (cf. Sect. S7 in the Supplement), aiming at a qualitative reproduction of the timing and amplitude of the observed changes in cell densities. Using this parametrization as a starting point, a subset of parameters was used for an automatic maximization of the sum of the R2-values for the different experiments (using the Nelder–Mead routine of the scipy.optimization package, Virtanen et al., 2020). Optimized parameters are: VN→i, , and δi for Synechococcus, and VDON→i, VDOC→i, VDON→i, VDON→i, and δi for the heterotrophic bacteria. The exact values are listed in Table S3 in the Supplement. Importantly, we did not assume metabolite interactions, but the observations could be reproduced qualitatively by the exchange of nutrients in inorganic and organic form.
As an important characteristic of R. Pomeroyi, we incorporated the observation that it did not take up ammonium (as demonstrated in another experiment of Christie-Oleza et al. (2017)). Further the optimized value for YDON (∼ 0.25) implies that R. Pomeroyi immediately remineralizes ∼ 75 % of DON during uptake, thus providing a steady nutrient source for Synechococcus. This recycling of nutrients slowed down the Synechococcus population decline significantly. However, to reproduce the steady decline observed in the experiment, a certain fraction of nutrients must continuously escape the recycling. Otherwise, the total nutrient in both populations and thus their densities would asymptote towards positive constants. We incorporated this by assuming that a fraction (e.g., 10 % for R. Pomeroyi) of the DON release is channelled into a “refractory” pool, which accumulates during the experiment. This pool represents a sink for non-recyclable matter, encompassing not only refractory DON, but all other inaccessible nutrient sinks, e.g., particulate forms.
For the other co-culture, the more severe collapse of the Synechococcus population could be explained by an ongoing competition for inorganic nutrient with Tropicibacter sp., which is assumed to have a higher nutrient affinity () than Synechococcus, i.e., a competitive advantage under low-nutrient conditions. For Tropicibacter sp., the optimized value YDON=0.75 for the assimilated fraction of organic nutrient is significantly higher than for R. pomeroyi, suggesting a more parsimonious remineralization of DON. This leads to a domination of the heterotroph until DOC is depleted and it becomes energy-limited around day 90. During the energy-limited regime, inorganic nutrient is available for Synechococcus once again, which induces a second growth phase.
To explore the impact of DOC exudation and DON remineralization, we included comparative simulations with reduced impact of either process in the Sect. S3 in the Supplement.
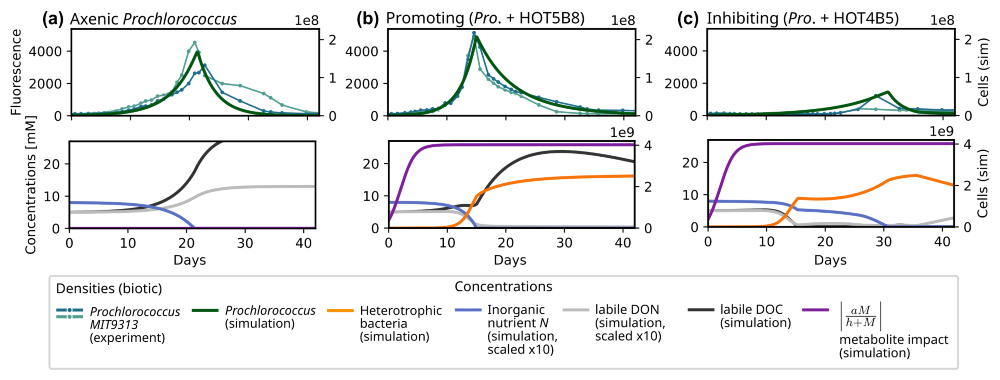
Figure 5Experimentally observed and modelled growth dynamics of Prochlorococcus (MIT9313) in co-culture with different heterotrophic bacteria (Sher et al., 2011): (a) axenic culture; (b) co-culture with Rhodobacterales strain (HOT5B8); (c) co-culture with Marinobacter strain (HOT4B5). For each experimental setup, two replicates were prepared, which are shown in the upper plot of each panel. The simulated Prochlorococcus density (dark green curve) is plotted on top of the bulk chlorophyll fluorescence observed in the experiments. For the simulations, we report Prochlorococcus and heterotroph densities, P and H, and concentrations of inorganic nutrient (N, blue), of labile DOC (black), and labile DON (solid gray). Further, we show the impact strength of metabolites M on the mortality rate of P (solid purple). The model parameters used in this section are listed in Table S4 in the Supplement.
3.2 Evaluation of network motifs with metabolite-induced feedbacks: Interactions in Prochlorococcus co-cultures
In a next step, we evaluate MCoM's ability to model metabolite-induced feedbacks between heterotrophs and phototrophs. For this, we consider Prochlorococcus co-culture experiments conducted by Sher et al. (2011). Cultures were grown on Pro99 medium containing an initial stock of 0.8 mM NH4 and 0.01 % organic carbon sources. Based on the cultures' observed bulk chlorophyll fluorescence over time, Sher et al. clustered the heterotrophs into clearly separated groups exhibiting either inhibitory, neutral or growth-promoting effects on Prochlorococcus. Growth-promoting bacteria induced an earlier (−4 d on average, Fig. 5b) and more pronounced peak of the phototroph population than observed for the axenic (Fig. 5a) (or neutrally affected) cases, while inhibitory bacteria significantly delayed the peak (+13 d on average, Fig. 5c).
We chose two representative examples from the experimental arrays for illustration. In co-culture with a Rhodobacterales strain (HOT5B8), Prochlorococcus growth was clearly promoted (Fig. 5b), whereas in co-culture with a Marinobacter strain (HOT4B5), growth was inhibited (Fig. 5c). For the simulations, we used identical parameters for both heterotrophs and only varied the metabolite impact coefficient aM (cf. Eq. 9, simplified subscript) using for the growth promoting case and aM=0.114 for the inhibitory case. All parameters were initially selected manually within plausible ranges. Subsequently, key parameters (VN→H, VN→P, δP, VDOC→H, YDOC→H, aM) were subjected to an automatic minimization (using the Nelder–Mead routine of the scipy.optimization package, Virtanen et al., 2020) of the root mean square error of simulated and observed growth curves.
For both modelled co-cultures the simulated metabolite concentrations initially accumulate leading to a saturation at full effect strength around days 8–10 (purple curves in Fig. 5). For the growth-promoting case, metabolite effects decrease the loss rate of the Prochlorococcus population. Thereby the net growth rate of phototrophs is increased, leading to larger populations and accelerated depletion of the inorganic nutrient when compared to the axenic. For the inhibitory case, metabolite effects increase the phytoplankton loss rate, resulting in a reduced net growth rate. This implies a slower depletion of the inorganic nutrient stock, in particular after day 15 when DOC (black curve) is depleted and heterotrophic nutrient uptake is reduced during the subsequent DOC-limited growth. For the axenic and promoting co-culture, simulated DOC concentrations increase in the first days due to phototrophic release of organic compounds. In the growth-promoting co-culture, the rate of accumulation slows down with growing heterotrophic densities until nutrient stocks (organic, as well as inorganic) are exhausted around day 15 (day 21 for the axenic culture). When this nutrient limitation sets in Prochlorococcus densities collapse, and DOC release from exudation and mortality accelerates DOC accumulation. However, in the following phase the DOC accumulation rate slows again due to the diminishing release from the shrinking phototroph population. In the co-culture the DOC concentration traverses its maximum around day 28, when release and heterotrophic consumption balance. In the inhibitory co-culture, the slow phototroph growth continuous until the inorganic nutrient stock is depleted around day 30, which triggers a rapid decline. The differences in population peak timing and amplitude are caused by the differing phytoplankton net growth rates in the different scenarios, which largely determine the consumption rate of the inorganic nutrient. In conclusion, with a variation of single parameter (aM) MCoM can capture both, the temporal shifts of the population peaks and the changes of the maximal observed Prochlorococcus density. As far as we have tested it, this cannot be achieved by any other variation of a single heterotroph trait – see the complementary parameter sensitivity analysis in Sect. S4 in the Supplement.
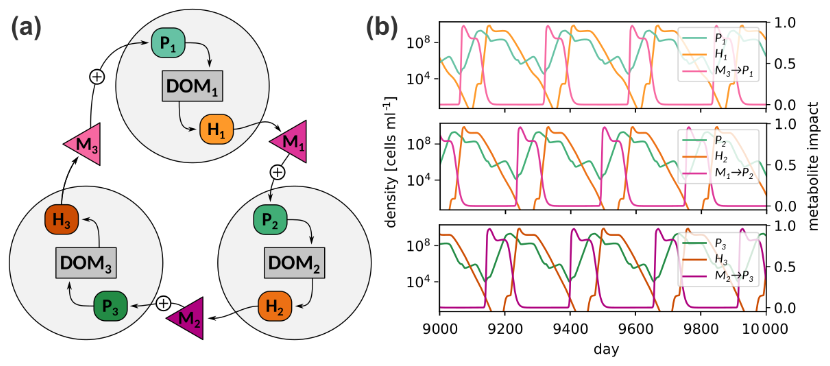
Figure 6(a) Cyclic interaction scheme of three consortia; (b) Simulated population densities and metabolite impacts. The data of a single simulation is distributed over three panels to avoid cluttering of curves. See Table S6 in the Supplement for parameters.
3.3 Application for studying phytoplankton succession: Metabolite interactions lead to fluctuating dynamics
Having evaluated MCoMs ability to reproduce dynamics of individual motifs, which may represent components in a larger microbial interaction network, we now show two examples of MCoM's application when scaled up to more diverse microbial communities. First, we consider a cyclic interaction network to illustrate how feedbacks mediated by metabolite interactions can lead to self-sustained fluctuations in a community of three phytoplankton and three heterotroph populations (Fig 6a). We model associations of specific heterotroph and phytoplankton species, Hi and Pi, by stipulating that the heterotroph Hi specializes on the consumption of organic matter produced by the phototroph Pi, forming a “consortium”. Due to this syntrophic relationship population peaks of Pi tend to be succeeded by peaks of Hi. Further, different consortia are assumed to be coupled via metabolites, such that metabolites produced by Hi positively affect Pi+1. Effectively, this causes population peaks of Hi to be succeeded by peaks of Pi+1, and so on, leading to a “merry-go-round” succession of consortia. Figure 6b shows the trajectories of the population densities and metabolite effects in a chemostat with continuous supply of nutrients (Δ = 0.1 d−1 and Next = 5.0 µM). The figure shows a time interval from simulation day 9000 to 10 000 after it has settled on a periodic orbit. The full set of parameters for this system is given in Table S5 in the Supplement. While such a setup may appear highly artificial, it is robust to parameter variations (see Sect. S5 in the Supplement) and illustrates the potential of metabolite feedbacks to incite non-stationarity of population densities even if no environmental forcing is present.5
3.4 Application for studying community stability: Metabolite interactions facilitate priority effects in microbial consortia
Generalizing the notion of a “consortium” as a coherent sub-community, we proceed to communities consisting of separate highly connected groups of species. A consortium in this sense can loosely be defined as a set of phototrophs, DOM compounds, heterotrophs and metabolites, which interact mostly within themselves. That is, within a consortium, heterotrophs feed on DOM released by members of the consortium, and phototroph growth is positively affected by metabolites produced by these heterotrophs. Although competition between consortium members (for nutrients and DOM) is possible, positive feedback loops within a consortium can be expected to facilitate the growth of its members on average.
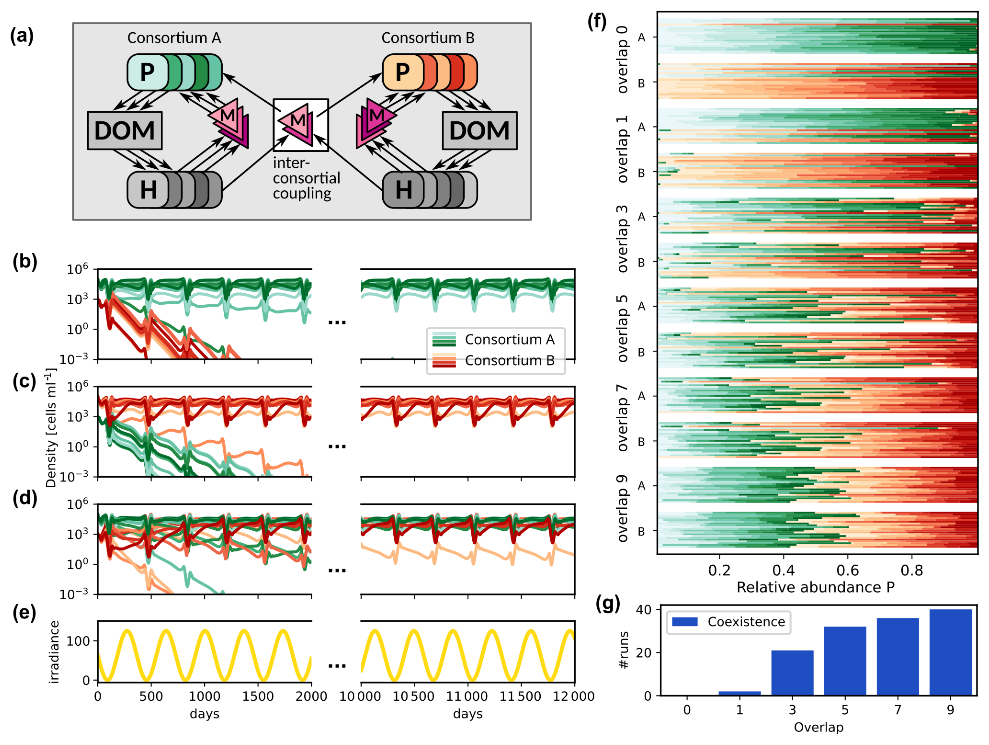
Figure 7Competition between two consortia for different inter-consortial coupling strength and initial states. (a) Schematic representation of the microbial community consisting of two consortia with inter-consortial coupling by shared metabolites. (b–d) Phytoplankton density trajectories; (b) and (c) Priority effects (bi-stability) in case of high connectivity and no coupling: The same interaction network may lead to a competitive exclusion of consortium B by consortium A (b) or vice versa (c), depending on which consortium is initially dominant; (d) Dynamics for higher inter-consortial metabolite interactions (overlap 5), leading to coexistence despite initial dominance of consortium A. (e) Periodic variation of the average environmental irradiance; (f) Asymptotic relative abundances by consortium (green: A, red: B) for different overlap values and initial states. For each overlap, top bar group: initial A dominance; bottom group: initial B dominance. Each horizontal bar represents one community's species distribution (n=20 communities per group). (g) Overlap vs. number of runs displaying coexistence.
For each simulated community, two consortia, A and B, were generated, each consisting of ten phototrophs (distinct in their specific photosynthesis characteristics), ten heterotrophs, ten DOC and ten DON compounds, and ten metabolite types. For the generation, we used MCoM's random community generation facilities to generate two consortia (see the README in the source code repository for details). As input for the generation, we prescribed the in- and out-degrees of the microbial nodes, i.e., the number of released and consumed compounds, the number of produced and effective metabolites, and the ranges, from which photosynthesis parameters for the single phototrophs were drawn (cf. Table S6 in the Supplement). MCoM's algorithm then randomly connects the different components adhering to these degrees. Subsequently, we coupled the two consortia by defining a number of shared metabolites, which effect both consortia. This number is called “overlap” in the following. Figure 7a shows the community structure schematically.
In the following, we assumed an annual cycle of varying average light intensity as shown in Fig. 7e and continuous nutrient supply (Δ = 0.1 d−1 and Next = 5.0 µM). Figure 7b–d show the time series of simulated phytoplankton population densities for different degrees of inter-consortial coupling and different initial conditions. In Fig. 7b and c, we show two simulations for the same community consisting of two consortia with a single overlapping metabolite. This configuration often leads to priority effects, as exemplified by the depicted dynamics: When the phototrophs of consortium A (green curves) are initialized with higher density than the phototrophs of consortium B (see Fig. 7b), consortium A remains dominant over the whole time span of the simulation (approx. 45 years). Vice versa, consortium B remains dominant if its phototrophs have higher initial density (Fig. 7c).
Figure 7d shows a trajectory in a modified network with higher inter-consortial coupling (overlap 5), where priority effects are not observed, i.e., despite differing initial phototroph densities the trajectories converge to identical periodic orbits after a transient time. In such cases, the “crosstalk” between consortia prevents their dynamical separation and an equilibrium, where members of both consortia coexist, is attained independently of the initial state.
We explored this effect systematically. For each of six values of the overlap, we generated 20 communities, each containing two consortia, A and B (20 phototrophs and 20 heterotrophs in total). Each community was initialized twice, with either consortium A or consortium B being dominant, and integrated for 60 years (see Table S6 in the Supplement for a detailed description of parameters). The relative averaged abundance over the last ten years of the simulation is reported for each simulation run in Fig. 7f. In this panel, for each overlap value, two horizontal bar groups are displayed: the top group corresponds to initializations with consortium A dominant, and the bottom group to consortium B dominant. Each group contains 20 stacked bars (one per community), where each bar represents 100 % relative abundance. The bars are divided into colored segments: shades of green for species from consortium A and shades of red for consortium B, with segment lengths proportional to species' average abundances. Starting from different initial states, priority effects appear as systematic differences in the dominant consortium (i.e., predominantly green vs. red segments) between the top and bottom groups for the same overlap. Convergence is indicated when both groups exhibit similar color distributions.
We categorized all observed regimes either as coexistence, where both consortia contribute more than 10 % to the total abundance, or as dominance of either consortium A or B. For low overlap, communities show pronounced priority effects in most cases, where in general the initially dominant consortium remains dominant. For instance, for zero overlap, none of the simulations ended in coexistence (Fig. 7g). However, in of the simulations the finally dominating consortium was the initially rare one. For one overlapping metabolite, two of 40 runs led to a coexistence of both consortia. Already for an overlap of three metabolites about 50 % of the simulations end in coexistence, and for overlap higher than five (where > 30 % of metabolites are shared between consortia), species coexistence is the most frequent (> 75 %) simulation outcome.
4.1 Interpretation of evaluation studies
The Synechococcus simulation (Fig. 4) illustrates MCoM's capacity to qualitatively reproduce mutualistic and competitive dynamics in batch systems. Our simulations captured the experimental divergence in phototroph trajectories between axenic growth (peak followed by steep decline), and co-cultures with R. pomeroyi (persistently elevated densities) and Tropicibacter (collapse-recovery). The optimized parameters suggest that the observations emerge through differential nutrient utilization patterns by the heterotrophs: 75 % DON remineralization rate and no DIN uptake for R. pomeroyi in contrast to 25 % DON remineralization rate paired with strong competition for DIN in case of Tropicibacter. Additional control simulations (Sect. S3 in the Supplement) confirmed these processes as essential for qualitative reproduction of experimental observations. Reduced DOC exudation altered Synechococcus persistence for the Tropicibacter co-culture by weakening heterotroph competition, that is, elevated sustained Synechococcus densities in Tropicibacter co-cultures, contrasting experimental patterns. On the other hand, suppressed DON remineralization caused the Synechococcus population to collapse in the co-culture with R. pomeroyi.
While qualitative agreement could be achieved, the quantitative reproduction of the extended high-density phase of Synechococcus (approx. days 5–50; Fig. 4, upper panels) followed by the steep decline in axenic and Tropicibacter co-cultures proved challenging. Capturing the decline requires high loss rates (δ), while rapid initial growth demands a high maximal growth rate. Further, sustained high density implies balanced phototrophic growth and loss. Yet the subsequent collapse requires loss to abruptly dominate growth. This transition is difficult to achieve with constant loss rates, especially in axenic cultures lacking heterotrophic competition. Potential model extensions to improve quantitative fit include: (i) Phototrophic metabolite production (to account for toxic compound accumulation as suggested by Christie-Oleza et al., 2017), or (ii) Variable C:N quotas with reserve dynamics, where collapse represents starvation from depleted internal reserves below a critical threshold.
For Prochlorococcus co-cultures (Fig. 5), MCoM reproduced divergent phototroph dynamics through metabolite-mediated growth effects. Parameter sensitivity analysis (Sect. S4 in the Supplement) demonstrated that while heterotroph traits (e.g., loss rate δ or nutrient uptake VN) modulate quantitative outcomes (e.g., peak height), a variation of interaction rates aM alone explains the qualitative transition between growth-promoting and inhibitory scenarios. This supports the hypothesis that metabolite exchange is the primary driver of experimental growth trajectory differences (Sher et al., 2011). However, we emphasize that both experiment modeling cases serve as mechanistic illustrations of MCoM's capabilities, not as validation of specific biological mechanisms underlying the experimental dynamics.
Microbial ecosystems bear the potential to exhibit complex, non-equilibrium dynamics. It is possible to model such cases using MCoM as illustrated by the implementation of a cyclic dominance motif (Fig. 6). While intentionally constructed, this consortium-based, self-sustained “merry-go-round” succession highlights how cross-consortia metabolite signalling () can drive persistent fluctuations without external forcing. Parameter scans (Sect. S5 in the Supplement) reveal two critical constraints for maintaining cyclic stability: (1) Balanced nutrient uptake rates across consortia (Fig. S3 in the Supplement), because significant deviations in uptake rates induce competitive exclusion (elevated uptake promotes dominance; diminished uptake enables rival takeover); and (2) Sufficient metabolite interaction strength (Fig. S4 in the Supplement), is essential to maintain oscillatory regimes. Weakened interaction rates imply a collapse into hierarchical competition. These breakdown conditions align with ecological theory, emphasizing that non-hierarchical relationships are essential for such dynamics (May and Leonard, 1975; Huisman and Weissing, 1999). Though stylized, this example illustrates MCoM's utility in probing how interaction networks may structure complex community successions.
4.2 Assumptions, limitations and possible extensions
An important assumption in MCoM concerns the parameterization of DOM exudation mechanics. The fundamental nutrient-dependent stoichiometric pattern, where phototrophs exude carbon-rich compounds under nutrient limitation and nitrogen-rich compounds under nutrient sufficiency, is empirically well-established (Myklestad, 2000; Thornton, 2014). However, the precise functional form governing the extent and composition of exudates in MCoM represents a tractable implementation rather than a formulation derived from species-specific empirical data. Our approach provides flexibility through user-defined parameters ( and ) to accommodate some variability, while explicitly enforcing biochemical constraints (e.g., nitrogen-rich exudates require carbon backbones). Since the mechanistic links between nutrient availability, photosynthetic rate, and exudation dynamics remain an active research area (Saad et al., 2016; Wu et al., 2021), caution is warranted when making quantitative interpretations.
MCoM employs fixed elemental stoichiometry for phytoplankton and heterotrophs, neglecting documented plasticity in elemental ratios under varying environmental conditions (Godwin and Cotner, 2015; Trautwein et al., 2017; Tanioka and Matsumoto, 2020). Future implementations could incorporate adaptive elemental ratios to refine physiological representations. Similarly, interaction strategies are assumed static; extensions might introduce adaptive behaviors like context-dependent algicidal interactions (Seyedsayamdost et al., 2011; Meyer et al., 2017) or expand exo-metabolite roles beyond mortality modulation to influence assimilation kinetics or other physiological parameters.
Further, MCoM assumes independent saturation kinetics for organic compound uptake (Eq. 14), implying distinct transporter systems and metabolic pathways process each compound without interference. While this simplification aligns with established microbial substrate utilization models (e.g., Mentges et al., 2019; Marsland et al., 2020; Zakem et al., 2021), biological systems exhibit interdependencies through mechanisms of metabolic regulation or resource allocation. More complex modeling approaches incorporate such mechanisms allowing them to reproduce phenomena like sequential utilization or adaptation to substrate availability (Brandt et al., 2004; Kremling et al., 2018; Lücken and Blasius, 2026).
As a zero-dimensional box model, MCoM lacks explicit spatial resolution. A positive transport term (coefficient Δ>0) in the governing equations represents a bulk exchange with an external reservoir, approximating chemostat conditions and allowing continuos supply of nutrient (see case studies in Sects. 3.3 and 3.4). If Δ=0 (Sects. 3.1 and 3.2), the equations describe a batch reactor, i.e., a closed system. We note that Δ could serve for future spatially explicit implementations, potentially representing diffusive connectivity in extended frameworks. Such developments would enable modeling of advective-diffusive transport and gradient-driven dynamics.
Environmental variability has an important impact on growth kinetics. In the current version, its configuration is limited to nutrient supply and light intensity, allowing a basic configuration of temporal modes of variation (pulsatile and sinusoidal, plus a rudimentary functionality for noise). We plan to extend these modes and further add temperature-dependent rate modulation (Coles and Jones, 2000; Bouman et al., 2005) in the future.
4.3 Performance
MCoM is suited to simulate large communities comprising diverse species, DOM compounds, and metabolites. However, the numerical complexity and memory requirements of the simulation rise with system size. We assessed the performance of MCoM in a simple test recording run times for different system sizes. The results are shown in Fig. 8. For each number , we initialized 16 random networks with n components of each type (heterotrophs, phototrophs, DOC, DON, and metabolites) and 30 % connectivity. That is, for n=30, each phototroph population produces 10 different DOC and 10 different DON compounds and is affected by 10 metabolites. Each heterotroph population produces the same variety of DOM compounds, is able to consume 10 DOC and 10 DON types, and produces 10 different metabolites. We simulated each community for 100 years with an integration step width of dt = 0.025 d, saving the last 10 years of the simulation to disc saving the system's state every dtout = 0.5 d. Asymptotically, the computation time scales as nγ with exponent γ=2.4, as determined by the asymptotic slope of the graph of log n versus logarithmic computation time (dashed red line in the inset of Fig. 8).
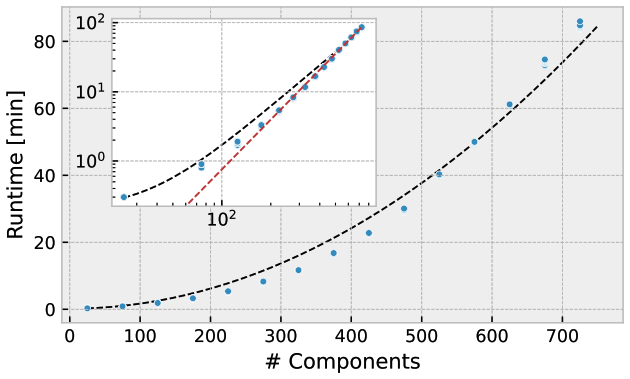
Figure 8Computation time (wall time) for varying total network size. The total number of components is the sum of the numbers of different Pi, Hi, Di, and Mi. For each size 16 different random communities were simulated for 100 years. Inset shows the same data in a log-log plot and a red dashed line with slope γ=2.4. The black dashed curve shows a polynomial fit to the computation time.
MCoM v1.0 is a scalable framework for simulating the dynamics of microbial communities consisting of phototrophic and heterotrophic species that includes a wide range of microbial interactions. The processes implemented into MCoM capture essential mechanisms of these interactions, such as nutrient competition, exo-metabolite and DOM production, as well as remineralization. Due to its flexible structure, MCoM allows to explore a range of ecological scenarios, from single-species experiments (Sher et al., 2011; Christie-Oleza et al., 2017) to complex community interactions (Garcia et al., 2018; Kost et al., 2023). We demonstrated this by simulating simple co-culture experiments, as well as non-linear phenomena such as emergent periodic succession patterns and multi-stability, which are prerequisites for modelling, e.g., ecological tipping points. Aside from aiding mechanistic insights to ecological observations, MCoM may prove useful for the simulation of biotechnological setups as the relevance and the potential of microbial interactions for industrial exploitation becomes increasingly recognized (Ramanan et al., 2016).
Although MCoM can be used to model complex communities, which exhibit rich dynamics, the individual interactions and growth dynamics are intentionally kept relatively simple in order to assess fundamental controls of microbial communities and their impact on biogeochemical fluxes. In summary, MCoM provides a versatile platform that is customizable to specific requirements from assessing pairwise interactions to diverse microbial communities. By taking into account the full range of positive and negative interactions, it expands the currently prevailing competition-centred view in biogeochemical modelling.
The source code for MCoM v1.0 is published under MIT license and can be downloaded from Zenodo (https://doi.org/10.5281/zenodo.19108362, Lücken et al., 2026). The repository contains the software documentation, instructions on configuration and installation, as well as a test suite. To run MCoM, Julia and Python must be installed (see README.md and requirements.txt for more specific dependencies). For the latest version, please visit https://github.com/bgc-mod/MCoM (last access: 19 March 2026).
Scripts reproducing the data underlying the figures in the publication are included in https://doi.org/10.5281/zenodo.19108362 (Lücken et al., 2026). Experimental data used in Sect. 3.1 and 3.2 is published in https://doi.org/10.1038/nmicrobiol.2017.100 (Christie-Oleza et al., 2017) and https://doi.org/10.1038/ismej.2011.1 (Sher et al., 2011).
The supplement related to this article is available online at https://doi.org/10.5194/gmd-19-2461-2026-supplement.
All authors added to the conceptualization of the model; JGB, MJF and STL contributed to an initial implementation of the model; LL transferred and extended the code into its current form. STL and LL conducted the simulation experiments; LL wrote the initial manuscript draft; All authors reviewed the manuscript.
The contact author has declared that none of the authors has any competing interests.
Publisher's note: Copernicus Publications remains neutral with regard to jurisdictional claims made in the text, published maps, institutional affiliations, or any other geographical representation in this paper. The authors bear the ultimate responsibility for providing appropriate place names. Views expressed in the text are those of the authors and do not necessarily reflect the views of the publisher.
We thank Joseph Christie de Oleza and Daniel Sher for sharing their experimental data with us.
This research has been supported by the Simons Foundation (grant nos. 01060273 and 549931), the Niedersächsisches Ministerium für Wissenschaft und Kultur (grant no. 16TTP079), and the Deutsche Forschungsgemeinschaft (grant no. 445120363).
This paper was edited by Yilong Wang and reviewed by Pearse Buchanan and two anonymous referees.
Amin, S. A., Hmelo, L. R., van Tol, H. M., Durham, B. P., Carlson, L. T., Heal, K. R., Morales, R. L., Berthiaume, C. T., Parker, M. S., Djunaedi, B., Ingalls, A. E., Parsek, M. R., Moran, M. A., and Armbrust, E. V.: Interaction and signalling between a cosmopolitan phytoplankton and associated bacteria, Nature, 522, 98–101, https://doi.org/10.1038/nature14488, 2015. a
Becker, J. W., Berube, P. M., Follett, C. L., Waterbury, J. B., Chisholm, S. W., DeLong, E. F., and Repeta, D. J.: Closely related phytoplankton species produce similar suites of dissolved organic matter, Frontiers in Microbiology, 5, https://doi.org/10.3389/fmicb.2014.00111, 2014. a
Bouman, H., Platt, T., Sathyendranath, S., and Stuart, V.: Dependence of light-saturated photosynthesis on temperature and community structure, Deep Sea Research Part I: Oceanographic Research Papers, 52, 1284–1299, https://doi.org/10.1016/j.dsr.2005.01.008, 2005. a
Brandt, B. W., Kelpin, F. D., van Leeuwen, I. M., and Kooijman, S. A.: Modelling Microbial Adaptation to Changing Availability of Substrates, Water Research, 38, 1003–1013, https://doi.org/10.1016/j.watres.2003.09.037, 2004. a
Buchan, A., LeCleir, G. R., Gulvik, C. A., and González, J. M.: Master Recyclers: Features and Functions of Bacteria Associated with Phytoplankton Blooms, Nature Reviews Microbiology, 12, 686–698, https://doi.org/10.1038/nrmicro3326, 2014. a
Christie-Oleza, J. A., Sousoni, D., Lloyd, M., Armengaud, J., and Scanlan, D. J.: Nutrient Recycling Facilitates Long-Term Stability of Marine Microbial Phototroph–Heterotroph Interactions, Nature Microbiology, 2, 17100, https://doi.org/10.1038/nmicrobiol.2017.100, 2017. a, b, c, d, e, f, g
Cirri, E. and Pohnert, G.: Algae-bacteria interactions that balance the planktonic microbiome, New Phytologist, 223, 100–106, https://doi.org/10.1111/nph.15765, 2019. a
Coles, J. F. and Jones, R. C.: Effect of temperature on photosynthesis-light response and growth of four phytoplankton species isolated from a tidal freshwater river, Journal of Phycology, 36, 7–16, https://doi.org/10.1046/j.1529-8817.2000.98219.x, 2000. a
Coyne, K. J., Wang, Y., and Johnson, G.: Algicidal Bacteria: A Review of Current Knowledge and Applications to Control Harmful Algal Blooms, Frontiers in Microbiology, 13, https://doi.org/10.3389/fmicb.2022.871177, 2022. a
De Mazancourt, C. and Schwartz, M. W.: A resource ratio theory of cooperation, Ecology Letters, 13, 349–359, https://doi.org/10.1111/j.1461-0248.2009.01431.x, 2010. a
Elovaara, S., Eronen-Rasimus, E., Asmala, E., Tamelander, T., and Kaartokallio, H.: Contrasting patterns of carbon cycling and dissolved organic matter processing in two phytoplankton–bacteria communities, Biogeosciences, 18, 6589–6616, https://doi.org/10.5194/bg-18-6589-2021, 2021. a
Friedrichs, M. A. M., Dusenberry, J. A., Anderson, L. A., Armstrong, R. A., Chai, F., Christian, J. R., Doney, S. C., Dunne, J., Fujii, M., Hood, R., McGillicuddy, D. J., Moore, J. K., Schartau, M., Spitz, Y. H., and Wiggert, J. D.: Assessment of skill and portability in regional marine biogeochemical models: Role of multiple planktonic groups, Journal of Geophysical Research: Oceans, 112, https://doi.org/10.1029/2006jc003852, 2007. a
Garcia, S. L., Buck, M., Hamilton, J. J., Wurzbacher, C., Grossart, H.-P., McMahon, K. D., and Eiler, A.: Model Communities Hint at Promiscuous Metabolic Linkages between Ubiquitous Free-Living Freshwater Bacteria, mSphere, 3, https://doi.org/10.1128/msphere.00202-18, 2018. a
Godwin, C. M. and Cotner, J. B.: Stoichiometric flexibility in diverse aquatic heterotrophic bacteria is coupled to differences in cellular phosphorus quotas, Frontiers in Microbiology, 6, https://doi.org/10.3389/fmicb.2015.00159, 2015. a
Huisman, J. and Weissing, F. J.: Biodiversity of Plankton by Species Oscillations and Chaos, Nature, 402, 407–410, https://doi.org/10.1038/46540, 1999. a
Kazamia, E., Sutak, R., Paz-Yepes, J., Dorrell, R. G., Vieira, F. R. J., Mach, J., Morrissey, J., Leon, S., Lam, F., Pelletier, E., Camadro, J.-M., Bowler, C., and Lesuisse, E.: Endocytosis-mediated siderophore uptake as a strategy for Fe acquisition in diatoms, Science Advances, 4, eaar4536, https://doi.org/10.1126/sciadv.aar4536, 2018. a
Koffel, T., Daufresne, T., and Klausmeier, C. A.: From Competition to Facilitation and Mutualism: A General Theory of the Niche, Ecological Monographs, 91, https://doi.org/10.1002/ecm.1458, 2021. a
Kost, C., Patil, K. R., Friedman, J., Garcia, S. L., and Ralser, M.: Metabolic exchanges are ubiquitous in natural microbial communities, Nature Microbiology, 8, 2244–2252, https://doi.org/10.1038/s41564-023-01511-x, 2023. a, b, c
Kremling, A., Geiselmann, J., Ropers, D., and de Jong, H.: An Ensemble of Mathematical Models Showing Diauxic Growth Behaviour, BMC Systems Biology, 12, 82, https://doi.org/10.1186/s12918-018-0604-8, 2018. a
Lücken, L. and Blasius, B.: A Network-Based Analysis of Bacterial Growth on Substrate Mixtures Uncovers Glucose Inhibition in Phaeobacter Inhibens, Scientific Reports, 16, 1289, https://doi.org/10.1038/s41598-025-33583-6, 2026. a
Lücken, L., Lennartz, S., Follows, M., and Bragg, J.: bgc-mod/MCoM: MCoM v1.0.0, Zenodo [code], https://doi.org/10.5281/zenodo.19108362, 2026. a, b
Maldonado, M. T. and Price, N. M.: Utilization of iron bound to strong organic ligands by plankton communities in the subarctic Pacific Ocean, Deep Sea Research Part II: Topical Studies in Oceanography, 46, 2447–2473, 1999. a
Marsland, R., Cui, W., Goldford, J., and Mehta, P.: The Community Simulator: A Python Package for Microbial Ecology, PLOS ONE, 15, e0230430, https://doi.org/10.1371/journal.pone.0230430, 2020. a
May, R. M. and Leonard, W. J.: Nonlinear Aspects of Competition Between Three Species, SIAM Journal on Applied Mathematics, 29, 243–253, https://doi.org/10.1137/0129022, 1975. a
Mentges, A., Feenders, C., Deutsch, C., Blasius, B., and Dittmar, T.: Long-Term Stability of Marine Dissolved Organic Carbon Emerges from a Neutral Network of Compounds and Microbes, Scientific Reports, 9, 17780, https://doi.org/10.1038/s41598-019-54290-z, 2019. a
Meyer, N., Bigalke, A., Kaulfuß, A., and Pohnert, G.: Strategies and ecological roles of algicidal bacteria, FEMS Microbiology Reviews, 41, 880–899, https://doi.org/10.1093/femsre/fux029, 2017. a
Morris, J. J., Rose, A. L., and Lu, Z.: Reactive oxygen species in the world ocean and their impacts on marine ecosystems, Redox Biology, 52, 102285, https://doi.org/10.1016/j.redox.2022.102285, 2022. a
Mühlenbruch, M., Grossart, H., Eigemann, F., and Voss, M.: Mini-review: Phytoplankton-derived polysaccharides in the marine environment and their interactions with heterotrophic bacteria, Environmental Microbiology, 20, 2671–2685, https://doi.org/10.1111/1462-2920.14302, 2018. a
Myklestad, S. M.: Dissolved Organic Carbon from Phytoplankton, vol. 5D, Springer-Verlag, Berlin/Heidelberg, pp. 111–148, https://doi.org/10.1007/10683826_5, 2000. a, b, c
Platt, T., Gallegos, C. L., and Harrison, W. G.: Photoinhibition of Photosynthesis in Natural Assemblages of Marine Phytoplankton, Journal of Marine Research, 38, 687–701, 1980. a
Ramanan, R., Kim, B.-H., Cho, D.-H., Oh, H.-M., and Kim, H.-S.: Algae–bacteria interactions: evolution, ecology and emerging applications, Biotechnology Advances, 34, 14–29, 2016. a
Saad, E. M., Longo, A. F., Chambers, L. R., Huang, R., Benitez-Nelson, C., Dyhrman, S. T., Diaz, J. M., Tang, Y., and Ingall, E. D.: Understanding marine dissolved organic matter production: Compositional insights from axenic cultures of Thalassiosira pseudonana, Limnology and Oceanography, 61, 2222–2233, https://doi.org/10.1002/lno.10367, 2016. a, b
Sarmento, H., Romera-Castillo, C., Lindh, M., Pinhassi, J., Sala, M. M., Gasol, J. M., Marrase, C., and Taylor, G. T.: Phytoplankton species-specific release of dissolved free amino acids and their selective consumption by bacteria, Limnology and Oceanography, 58, 1123–1135, https://doi.org/10.4319/lo.2013.58.3.1123, 2013. a, b
Séférian, R., Berthet, S., Yool, A., Palmiéri, J., Bopp, L., Tagliabue, A., Kwiatkowski, L., Aumont, O., Christian, J., Dunne, J., Gehlen, M., Ilyina, T., John, J. G., Li, H., Long, M. C., Luo, J. Y., Nakano, H., Romanou, A., Schwinger, J., Stock, C., Santana-Falcón, Y., Takano, Y., Tjiputra, J., Tsujino, H., Watanabe, M., Wu, T., Wu, F., and Yamamoto, A.: Tracking Improvement in Simulated Marine Biogeochemistry Between CMIP5 and CMIP6, Current Climate Change Reports, 6, 95–119, https://doi.org/10.1007/s40641-020-00160-0, 2020. a
Seyedsayamdost, M. R., Case, R. J., Kolter, R., and Clardy, J.: The Jekyll-and-Hyde Chemistry of Phaeobacter Gallaeciensis, Nature Chemistry, 3, 331, 2011. a
Seymour, J. R., Amin, S. A., Raina, J.-B., and Stocker, R.: Zooming in on the phycosphere: the ecological interface for phytoplankton–bacteria relationships, Nature Microbiology, 2, 1–12, 2017. a, b
Sher, D., Thompson, J. W., Kashtan, N., Croal, L., and Chisholm, S. W.: Response of Prochlorococcus Ecotypes to Co-Culture with Diverse Marine Bacteria, The ISME Journal, 5, 1125–1132, https://doi.org/10.1038/ismej.2011.1, 2011. a, b, c, d, e, f, g
Sultana, S., Bruns, S., Wilkes, H., Simon, M., and Wienhausen, G.: Vitamin B12 Is Not Shared by All Marine Prototrophic Bacteria with Their Environment, The ISME Journal, 17, 836–845, https://doi.org/10.1038/s41396-023-01391-3, 2023. a
Tagliabue, A.: `Oceans Are Hugely Complex': Modelling Marine Microbes Is Key to Climate Forecasts, Nature, 623, 250–252, https://doi.org/10.1038/d41586-023-03425-4, 2023. a
Tanioka, T. and Matsumoto, K.: A meta-analysis on environmental drivers of marine phytoplankton C : N : P, Biogeosciences, 17, 2939–2954, https://doi.org/10.5194/bg-17-2939-2020, 2020. a
Teeling, H., Fuchs, B. M., Becher, D., Klockow, C., Gardebrecht, A., Bennke, C. M., Kassabgy, M., Huang, S., Mann, A. J., Waldmann, J., Weber, M., Klindworth, A., Otto, A., Lange, J., Bernhardt, J., Reinsch, C., Hecker, M., Peplies, J., Bockelmann, F. D., Callies, U., Gerdts, G., Wichels, A., Wiltshire, K. H., Glöckner, F. O., Schweder, T., and Amann, R.: Substrate-Controlled Succession of Marine Bacterioplankton Populations Induced by a Phytoplankton Bloom, Science, 336, 608–611, https://doi.org/10.1126/science.1218344, 2012. a
Thornton, D. C.: Dissolved organic matter (DOM) release by phytoplankton in the contemporary and future ocean, European Journal of Phycology, 49, 20–46, https://doi.org/10.1080/09670262.2013.875596, 2014. a, b, c
Trautwein, K., Feenders, C., Hulsch, R., Ruppersberg, H. S., Strijkstra, A., Kant, M., Vagts, J., Wünsch, D., Michalke, B., Maczka, M., Schulz, S., Hillebrand, H., Blasius, B., and Rabus, R.: Non-Redfield, Nutrient Synergy and Flexible Internal Elemental Stoichiometry in a Marine Bacterium, FEMS Microbiology Ecology, 93, https://doi.org/10.1093/femsec/fix059, 2017. a
Virtanen, P., Gommers, R., Oliphant, T. E., Haberland, M., Reddy, T., Cournapeau, D., Burovski, E., Peterson, P., Weckesser, W., Bright, J., van der Walt, S. J., Brett, M., Wilson, J., Millman, K. J., Mayorov, N., Nelson, A. R. J., Jones, E., Kern, R., Larson, E., Carey, C. J., Polat, I., Feng, Y., Moore, E. W., VanderPlas, J., Laxalde, D., Perktold, J., Cimrman, R., Henriksen, I., Quintero, E. A., Harris, C. R., Archibald, A. M., Ribeiro, A. H., Pedregosa, F., van Mulbregt, P., and SciPy 1.0 Contributors: SciPy 1.0: Fundamental Algorithms for Scientific Computing in Python, Nature Methods, 17, 261–272, https://doi.org/10.1038/s41592-019-0686-2, zSCC: 0000014, 2020. a, b
Wu, Z., Dutkiewicz, S., Jahn, O., Sher, D., White, A., and Follows, M. J.: Modeling Photosynthesis and Exudation in Subtropical Oceans, Global Biogeochemical Cycles, 35, e2021GB006941, https://doi.org/10.1029/2021GB006941, 2021. a
Zakem, E. J., Cael, B. B., and Levine, N. M.: A Unified Theory for Organic Matter Accumulation, Proceedings of the National Academy of Sciences, 118, e2016896118, https://doi.org/10.1073/pnas.2016896118, 2021. a
Light-limited exudation can also be switched off by setting variant.use_exudation=false.
This behaviour is controlled by the parameter
variant.surplus_remineralization.
Parameter run.system_seed
Parameter variant.competing_pairs
In natural situations, successions are regularly reported as a response to an initial environmental impulse, such as seasonal upwelling of nutrients. These scenarios can also be modelled with MCoM specifying a fluctuation for the parameter
environment.nutrient.