the Creative Commons Attribution 4.0 License.
the Creative Commons Attribution 4.0 License.
 | 09 Mar 2026
Improving thermodynamic nudging in the E3SM Atmosphere Model version 2 (EAMv2): strategy and hindcast skills on weather systems
Bryce E. Harrop
Aniruddha Bora
George Karniadakis
Khemraj Shukla
Kai Zhang
Nudging techniques are commonly employed to constrain atmospheric simulations toward observed states, facilitating model evaluation and sensitivity studies. However, if applied improperly – particularly to thermodynamic variables such as temperature and humidity – nudging can distort physical processes and introduce spurious biases, undermining the credibility of the simulations. This study presents an improved nudging implementation that applies vertically modulated tendencies to reduce adverse impacts on model physics. The framework is tested in version 2 of the Energy Exascale Earth System Model (EAMv2) using a suite of hindcast simulations nudged toward ERA5 reanalysis. We systematically evaluate the individual and combined effects of nudging wind, temperature, and humidity fields on the model's ability to represent large-scale atmospheric states and high-impact weather systems. Results show that the revised strategy – particularly when nudging temperature and humidity at selected levels – enhances hindcast skill by improving agreement with ERA5 without degrading the hydrological cycle or precipitation processes. Additional improvements in surface temperature, outgoing longwave radiation, and precipitation biases are achieved through targeted nudging of land-surface variables. The proposed approach strengthens the representation of large-scale conditions relevant to tropical cyclones, atmospheric rivers, and extratropical cyclones in the low-resolution EAMv2. These findings demonstrate that carefully designed thermodynamic nudging, especially of temperature and humidity, improves the realism of constrained simulations and broadens the utility of nudged EAMv2 for atmospheric modeling, machine learning, and high-impact weather research.
- Article
(27396 KB) - Full-text XML
- BibTeX
- EndNote


Nudging is a data assimilation method widely used to adjust dynamical variables of general circulation models (GCMs) toward meteorological reanalysis data, producing realistic representations of weather systems in long-term simulations. Such approaches enable the evaluation of model biases by allowing direct comparison between simulations and observations (e.g., Jeuken et al., 1996; Separovic et al., 2012; Lohmann and Hoose, 2009; Ma et al., 2015; Lin et al., 2016). They also enhance the signal-to-noise ratio in sensitivity experiments, allowing estimation of model responses to external forcing without requiring long integrations or large ensembles (e.g., Zhang et al., 2012; Kooperman et al., 2012; Zhang et al., 2022). Despite these advantages, the success of nudged atmospheric hindcasts depends critically on the design of nudging strategies tailored to the model and research objectives. In terms of the constrained quantities, which include large-scale dynamical (zonal and meridional winds) and thermodynamic (temperature and humidity) fields, many studies have shown that directly nudging temperature and humidity can distort the simulated atmospheric state and fluxes. This reduces the usefulness of bias evaluation and the estimation of model responses to external forcing (Jeuken et al., 1996; Zhang et al., 2014; Ma et al., 2015; Sun et al., 2019; Zhang et al., 2022). As a result, wind-only nudging is often recommended for constrained hindcast experiments (e.g., Sun et al., 2019; Zhang et al., 2022).
However, there are cases where temperature and humidity nudging is advantageous or even necessary for model evaluation and applications. For example, Watt-Meyer et al. (2021) and Bretherton et al. (2021) used nudging to generate numerical training datasets for developing machine learning bias correction models. In this context, all state variables, including wind, temperature, and humidity, must be constrained toward the real atmosphere to enable realistic estimation of model biases across seasons and the diurnal cycle, which is essential for successful training. Similarly, Wehrli et al. (2018, 2019, 2022) designed experiments with atmospheric nudging to investigate the relative roles of thermodynamic and dynamic processes in biased simulations of extreme atmospheric events. In studies of this kind, dynamic and thermodynamic contributions to model biases are separated by nudging subsets of large-scale wind (dynamics), temperature, and humidity (thermodynamics) fields toward observed atmospheric profiles. Such experimental approaches, however, may become less reliable if nudging of temperature and humidity introduces spurious biases or unrealistic fields, as reported in previous studies (Jeuken et al., 1996; Zhang et al., 2014; Sun et al., 2019; Zhang et al., 2022).
Motivated by the emerging need for temperature and humidity nudging in model analysis and evaluation, this study extends the work of Sun et al. (2019) and Zhang et al. (2022) on atmospheric nudging within the Energy Exascale Earth System Model atmosphere component (EAM; Rasch et al., 2019; Xie et al., 2018; Leung et al., 2020; Golaz et al., 2019, 2022). We focus on developing strategies that incorporate temperature and humidity, in addition to large-scale wind fields, to improve the realism of atmospheric simulations nudged toward reanalysis products while avoiding significant drifts in other fields important for evaluation, such as precipitation and radiative fluxes. Our goal is to demonstrate that this enhanced nudging approach enables more reliable, constrained hindcast simulations that are especially valuable for high-impact weather analysis and for machine learning applications using low-resolution models such as EAM. These aspects of nudging strategy and application remain underexplored in previous EAM-based studies (e.g., Sun et al., 2019; Zhang et al., 2022).
The remainder of this manuscript is organized as follows. Section 2 describes the implementation of a modified nudging tendency scheme in version 2 of the EAM (EAMv2). Section 3 examines the limitations of the default temperature and humidity nudging strategy in EAMv2 and introduces the revised formulation proposed in this study, highlighting its improvements through direct comparison with the original approach. Section 4 evaluates the hindcast performance of EAMv2 simulations with different sets of constrained variables, with particular emphasis on the benefits of the revised temperature and humidity nudging strategy for improving the simulation of long-term precipitation evolution and land–atmosphere interactions. Section 5 presents further analysis of the role of humidity nudging in simulating high-impact weather events using the low-resolution EAM. Finally, Sect. 6 summarizes the key findings and offers recommendations.
2.1 A brief overview of E3SM Atmosphere Model (EAM)
E3SM is a global Earth system model developed by the US Department of Energy (Golaz et al., 2019, 2022). This study uses the E3SM Atmosphere Model version 2 (EAMv2; Golaz et al., 2022) with standard resolution (also referred to as the “low-resolution” configuration). In brief, EAMv2 uses separate grids for dynamics and column physics parameterizations. The dynamical core is configured to run on a cubed-sphere mesh with a quasi-uniform horizontal resolution of ∼110 km to solve the dynamics and tracer transport (Dennis et al., 2012; Taylor and Fournier, 2010). While the dynamics is solved on the Gauss–Lobatto–Legendre quadrature points within each element of the grid, the column physics parameterizations are solved on a simple 2×2 subgrid of quadrilaterals within each element (Lauritzen et al., 2018; Herrington et al., 2019; Hannah et al., 2021). The key subgrid-scale physical parameterizations considered in EAMv2 include deep convection (Zhang and McFarlane, 1995), turbulence and shallow convection (Golaz et al., 2002; Larson et al., 2002), cloud microphysics (Morrison and Gettelman, 2008; Gettelman and Morrison, 2015; Wang et al., 2014), aerosol life cycle (Liu et al., 2016; Wang et al., 2020), and radiation (Iacono et al., 2008; Mlawer et al., 1997). In addition, EAMv2 is interactively coupled with a land model (Oleson et al., 2013) that uses the same “pg2” grid for column parameterizations. All model components in E3SMv2 are configured with 72 layers in the vertical, extending from the Earth's surface to ∼0.02 hPa (∼64 km). The vertical grid spacing is uneven, with the layer thickness typically ranging from 20 to 100 m near the surface and up to 600 m near the model top.
2.2 Nudging and modifications in EAMv2
The nudging implementation in EAMv2 builds upon the earlier version described by Sun et al. (2019). In the configuration used for this study, the nudging workflow follows the revised formulation illustrated in Fig. 1a of Zhang et al. (2022). Specifically, model state variables – such as horizontal winds (U, V), temperature (T), and specific humidity (Q) – are compared to corresponding reference values before the radiation parameterization is called. A relaxation term, derived from this comparison, is introduced into the time-integration loop to constrain the model toward the prescribed atmospheric conditions. The prognostic equation incorporating nudging in EAMv2 can be expressed as:
Here, Xm denotes the model state variable within EAMv2. The terms on the right-hand side represent contributions from large-scale dynamics, physical parameterizations, and the nudging-induced correction term , respectively. In the conventional EAMv2 configuration (Sun et al., 2019; Zhang et al., 2022), the nudging tendency is written as
where Xm is the model state variable (U, V, T, or Q), and Xr denotes the corresponding value from the reference dataset, often provided by ERA5 reanalysis from the European Centre for Medium-Range Weather Forecasts (ECMWF, Hersbach et al., 2020). The scalar weight wm controls the nudging strength. In the default design, we have
which is spatially and vertically uniform (i.e., identical at all model levels and grid points within the nudging domain) and has been shown to perform efficiently in previous applications (e.g., Sun et al., 2019; Zhang et al., 2022).
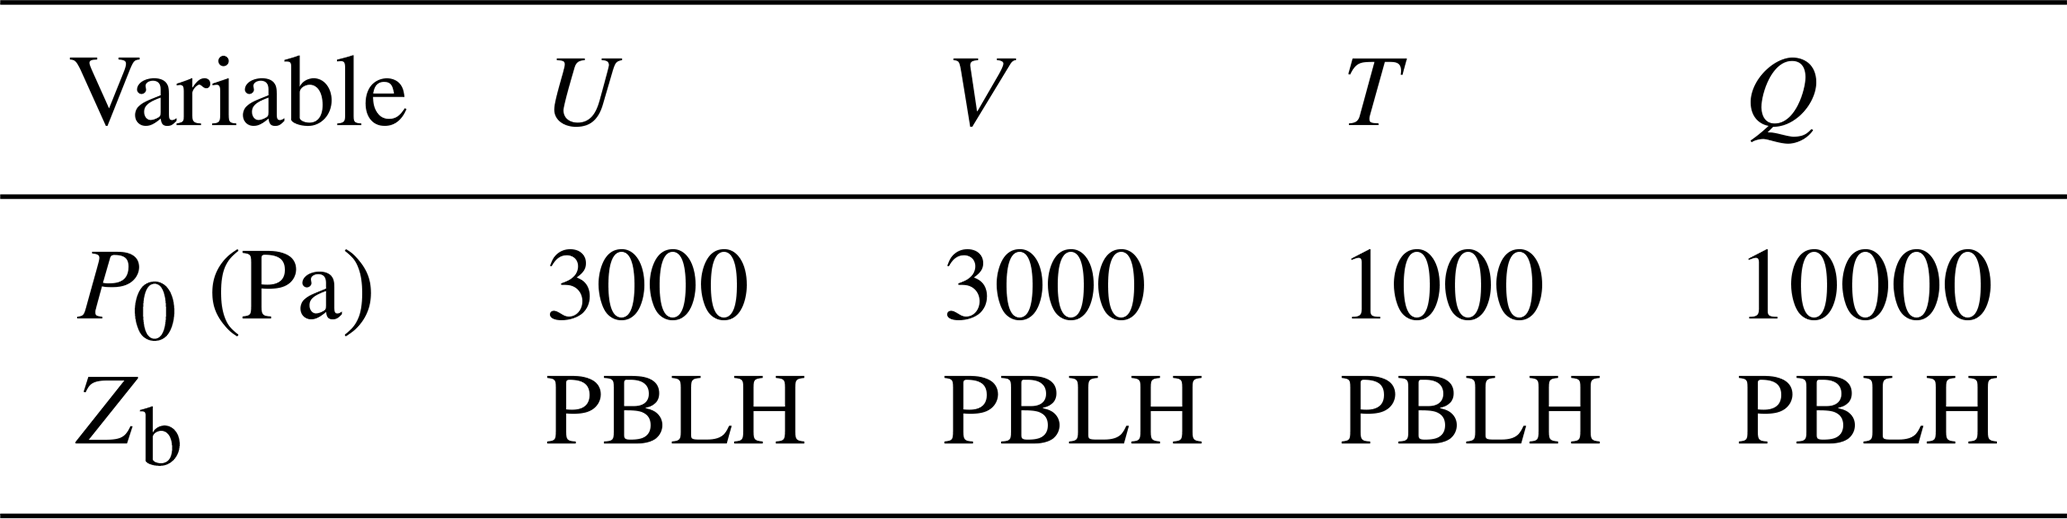
In this study, we propose a more generalized formulation of Eq. (3) by allowing wm to vary with height. Specifically, we define wm as a function of model-layer pressure and geopotential height,
where Pm and Zm denote, respectively, the pressure and geopotential height at the midpoints of the model layers. The parameter Zb represents a user-defined height threshold below which model layers are treated as near-surface layers, while P0 is a user-defined pressure threshold. Distinct from the default formulation in Eq. (3), the proposed Eq. (4) allows the nudging strength to (i) transition smoothly to zero in the upper-atmosphere and (ii) weaken gradually within the PBL, while retaining full strength in the free troposphere. A schematic illustration of the weighting implied by Eqs. (3)–(4) at E3SM model levels is shown in Fig. C1. These modifications to the nudging formulation are motivated by two key considerations discussed below.
First, the vertical extent of EAMv2 reaches up to approximately 0.02 hPa, whereas most widely used reanalysis datasets (e.g., ERA5) provide data only up to around 1 hPa. To apply nudging above this limit, reanalysis fields must be extrapolated to the model’s upper levels – a procedure prone to substantial uncertainties and interpolation errors. These errors can degrade model performance; for example, Zhang et al. (2022) demonstrated that numerical interpolation errors in reanalysis data used for nudging can introduce spurious cloud – radiative effects, thereby compromising the physical realism of nudged simulations. The first two terms in Eq. (4) were designed to address these issues by introducing a threshold parameter, P0, above which a linear scaling is applied to gradually reduce the nudging tendency. This ensures that nudging is smoothly deactivated in the upper model layers where reanalysis information becomes unreliable or unavailable, thereby avoiding the introduction of artificial signals into the model dynamics.
Second, near-surface nudging presents challenges due to the strong influence of local processes and topographic variability. Similar to the issues described above, mismatches in surface elevation between reanalysis and Earth system models exacerbate interpolation errors in near-surface levels, raising questions about the reliability of nudging at these model levels. More importantly, earlier studies Lo et al. (e.g., 2008); Vincent and Hahmann (e.g., 2015) found that strong nudging in the boundary layer can overly constrain the model to large-scale forcing, increasing biases and suppressing realistic variability within planetary boundary layer (PBL) regions. This motivated the introduction of the third term in Eq. (4), which modulates the nudging tendency using a hyperbolic tangent function as the model-simulated geopotential height Zm approaches the height Zb near the surface. This formulation effectively reduces nudging when Zm<Zb, helping preserve the development of mesoscale structures and preventing artificial suppression of subgrid variability.
We emphasize that P0 and Zb in Eq. (4) are, by design, tunable parameters. Sensitivity experiments using different combinations of P0 and Zb provide a general pathway for identifying optimal values for specific modeling configurations or scientific applications; however, such experiments can be computationally demanding, especially for long-term (10 years or longer) global simulations with modeling systems such as E3SM. In this study, we avoid such extensive tuning by setting Zb equal to the diagnosed PBL height, following guidance from previous studies (e.g., Lo et al., 2008; Vincent and Hahmann, 2015). For P0, a practical rule of thumb is to choose a threshold such that nudging is restricted to the altitude range where high-quality, observationally constrained reanalysis data exist, thereby avoiding regions that require extrapolation. Consequently, as summarized in Table 2, we specify different values of P0 for different nudging variables, following guidance from the nudging implementation in the GFDL FV3 model (NOAA GFDL, 2020). These values are suitable for our application because, for ERA5, extrapolation is triggered when the model levels extend above roughly 1 hPa, which is near the top of the reanalysis domain. Therefore, the P0 values listed in Table 2 are all chosen to exceed 1 hPa, with additional expert judgment applied to select threshold values for each model state variable that are large enough to ensure that the nudging strength is smoothly reduced in layers that would otherwise depend on extrapolated reanalysis fields. The primary goal of this study is to explore the benefits of the modified weighting function in Eq. (4) for nudged E3SM simulations, particularly in the context of long-term model analysis and evaluation applications. Although a full set of sensitivity experiments to optimize these tuning parameters would be useful, it is beyond the scope of this study. Furthermore, as discussed in Sect. 4, these specific choices of P0 and Zb provide a reasonable configuration for the proposed scheme, and their implementation in E3SM improves the robustness and overall fidelity of simulations nudged to reanalysis.
2.3 Model simulations
In this study, we conducted simulations with EAMv2 following the Atmospheric Model Intercomparison Project (AMIP) protocol (Gates et al., 1999). This setup couples the interactive atmosphere and land components of EAMv2 with prescribed monthly sea surface temperature (SST) and sea ice extent derived from observational data. The SST and sea ice boundary conditions were sourced from the input4MIPs datasets (Reynolds et al., 2002), ensuring consistency with the AMIP framework. To incorporate external forcings, we prescribed data for volcanic aerosols, solar variability, greenhouse gas concentrations, and anthropogenic emissions of aerosols and their precursors, following the protocols established by the World Climate Research Programme's Coupled Model Intercomparison Project Phase 6 (CMIP6) (Eyring et al., 2016; Hoesly et al., 2018; Feng et al., 2020). For anthropogenic aerosol emissions and precursor gases, present-day conditions were represented using 2010 data.
Three groups of simulations are presented in this study (see Table 1). The first group includes two free-running baseline simulations. The first simulation, referred to as CTRL, is a short-term run spanning from October 2009 to February 2010. The second simulation, referred to as CLIM, is a long-term run covering the period from 1 January 2007 to 31 December 2017. These two simulations serve as the baseline for the nudging experiments conducted in this study. The CLIM simulation specifically spans 2007–2017, as ERA5 reanalysis data were only processed for this time period.
Table 1List of simulations and key nudging setups in this study. Nudging was applied at each physics time step (30 min). A linear interpolation was used to map the 3-hourly ERA5 atmospheric (three-dimensional) and land-surface (single-level) data to each model step to compute the nudging tendency. All simulations in this table use present-day (PD, year 2010) external forcing for anthropogenic aerosol and precursor emissions, consistent with the EAMv2 atmosphere-only setup (Golaz et al., 2022). Note: in NDG-UVTQ_SRF1, U, V, T, and Q were nudged as in NDG-UVTQ, with additional constraints on near-surface variables (U10, V10, T2, TD2, TS). Here, U10 and V10 are the horizontal wind components at the 10 m reference level from ERA5. They are used to nudge the wind fields in the lowest EAMv2 model layer, which is approximately centered at 10 m.
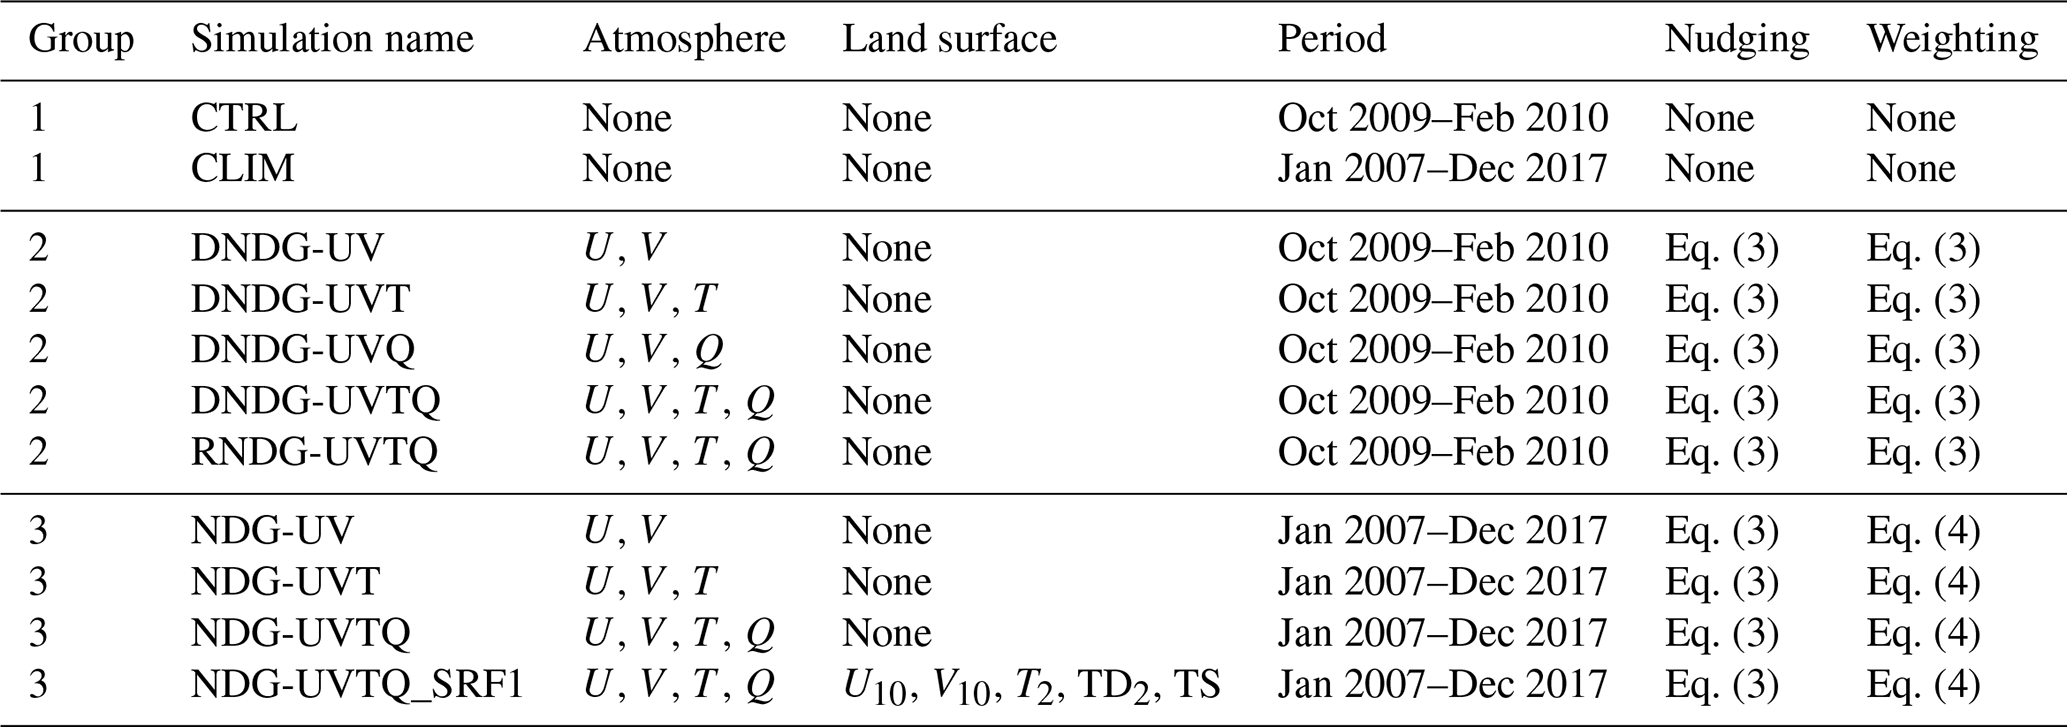
The second group comprises a series of short-term nudged EAMv2 simulations conducted over the same period as CTRL, in which the atmospheric model state is constrained toward the ERA5 reanalysis. A detailed workflow of the EAMv2 nudging framework is provided in Fig. 1b of Zhang et al. (2022). Briefly, the nudging tendency terms are computed by comparing the model's prognostic variables, saved immediately before the radiation parameterization step, with the corresponding ERA5 fields. These tendency terms are then applied after the physics parameterization suite to adjust the model state variables accordingly. This implementation strategy follows Zhang et al. (2022), who showed that computing the nudging tendency and applying it at these specific locations in the time-integration loop improves numerical consistency with the native model physics and reduces spurious deviations in the nudged simulations. The simulations labeled “DNDG” in Group 2 (using the default nudging scheme) were conducted using Eq. (3) to compute , by constraining the EAMv2 model states toward different subsets of the ERA5 reanalysis fields:
-
horizontal winds only (labeled DNDG-UV),
-
horizontal winds and humidity (labeled DNDG-UVQ),
-
horizontal winds and temperature (labeled DNDG-UVT), and
-
horizontal winds, temperature, and humidity (labeled DNDG-UVTQ).
These simulations were used to demonstrate the limitations associated with humidity nudging using Eq. (3). An additional simulation, referred to as RNDG-UVTQ, was performed using the same nudging configuration as DNDG-UVTQ but employing the revised nudging formulation in Eq. (4), which is proposed in this study to improve model performance when nudging humidity. The tunable parameters P0 and Zb used in Eq. (4) were assigned the values listed in Table 2, following the discussion in Sect. 2.2, while we acknowledge that further tuning of these parameters may be necessary when applying this formulation with different reanalysis products. A detailed comparison of RNDG-UVTQ with other experiments in Group 2 will be presented in Sect. 3, where we demonstrate the effectiveness of the revised nudging formulation of Eq. (4) in better addressing the humidity nudging in EAMv2 simulations.
Table 2Choices on threshold parameters used in Eq. (4) for nudged EAMv2 simulations in this study.
The third group consists of long-term nudged EAMv2 simulations conducted over the same period as CLIM, using the revised nudging formulation described in Eq. (4). To assess the impact of different nudging configurations on the model's long-term simulation fidelity, three simulations were performed by nudging subsets of the ERA5 reanalysis fields: horizontal winds only (NDG-UV), winds and temperature (NDG-UVT), and winds, temperature, and humidity (NDG-UVTQ). These experiments were designed to evaluate whether nudging improves the agreement between EAMv2 simulations and the ERA5 reanalysis on climatological timescales. An additional simulation, labeled NDG-UVTQ_SRF1, extended the NDG-UVTQ configuration by also nudging U, V, T, and Q at the model's surface-layer, thereby directly constraining land–atmosphere interactions. In this case, the surface-layer nudging is applied using Eq. (2) with wm=1, meaning that it is not subject to the vertical weighting function in Eq. (4). Instead, it acts as a single-layer constraint at the land–atmosphere interface of EAM, directly relaxing the model state toward ERA5 at the surface before the surface fields (fourth column in Table 1) are passed to the land model. As discussed in Sect. 4, incorporating these surface constraints enhances the model's skill in simulating land-surface variables and precipitation.
It is important to note that all nudged EAMv2 simulations listed in Table 1 differ only in their choice of nudged variables and vertical weighting scheme; all other aspects of the nudging configuration follow the recommendations from prior studies (Sun et al., 2019; Zhang et al., 2022). The ERA5 atmospheric and land-surface reanalysis fields were originally produced on a 0.25°×0.25° horizontal grid with 37 pressure levels. These data were remapped to the EAMv2 model grid (the “pg2” horizontal grid with 72 hybrid sigma–pressure levels) and subsequently used as reference fields for the nudging simulations. The remapping procedures (both horizontal and vertical) followed the algorithms developed for nudging in the Community Earth System Model version 2 (CESM2) (CESM2, 2025). Furthermore, linear-function nudging was applied to the 3-hourly ERA5 reanalysis to derive nudging tendencies at each model time step (30 min). This configuration reflects a balance between the computational cost of online data processing and the demonstrated performance benefits reported in Zhang et al. (2022). The nudging relaxation time scale τ in Eq. (3) was set to 6 h for the upper-atmospheric layers and 1 hour for the land-surface layer. The choice of τ=6 h for the upper-atmosphere is motivated by both practical experience and demonstrated performance in previous EAM/E3SM nudging studies, where it provides an effective constraint while avoiding excessive distortion of the model's internal dynamics (Sun et al., 2019; Zhang et al., 2022). For the land-surface layer, the choice of τ=1 h was empirically determined in this study. The shorter relaxation time is intended to provide a tighter constraint on the model state, given the large variability associated with the spatial inhomogeneity of land-surface processes and the fact that the atmospheric model in EAMv2 is coupled to the land model at a 1-hour frequency. We acknowledge that the performance of the nudging may exhibit some sensitivity to choices of the parameters discussed here, as well as to the tunable parameters P0 and Zb used in the proposed strategy in Eq. (4). However, we believe that these sensitivities do not alter our primary goal of demonstrating how the revised nudging strategy proposed in this study benefits E3SM nudging simulations, as discussed in the following sections.
As a first step, we compared the two nudging strategies that differ in their vertical weighting formulations, as defined in Eqs. (3) and (4), with particular emphasis on cases in which humidity is included as a nudged variable. This investigation was motivated by the findings of Sun et al. (2019), who reported that humidity nudging using Eq. (3) caused substantial disruptions to the hydrological cycle, as evidenced by a significant reduction in precipitation in simulations with an earlier version of the E3SM atmosphere model (EAMv1; see their Figs. 6 and 7). Our analysis uses a set of short-term EAMv2 simulations (CTRL and Group 2; Table 1) that were designed to explore sensitivities while limiting computational cost. Although these integrations are relatively short, they are sufficient to reveal the key differences between the two vertical weighting formulations and do not affect the main conclusions drawn in this section.
Figure 1 presents Hovmöller diagrams of the daily precipitation rate (PRECT; units: mm d−1) over the tropics for the period December 2009 to February 2010. Consistent with the findings of Sun et al. (2019), nudging large-scale winds (U, V) and temperature (T) toward ERA5 reanalysis (DNDG-UV and DNDG-UVT; Fig. 1c and d) using Eq. (3) substantially improves agreement between EAMv2 simulations and TRMM observations (Fig. 1a), relative to the free-running simulation (CTRL; Fig. 1b), as reflected in systematic increases in pattern correlation coefficients (PCC) and reductions in root-mean-square errors (RMSE). Incremental gains from DNDG-UV to DNDG-UVT further underscore the added value of temperature nudging. In contrast, substituting temperature with humidity (DNDG-UVQ; Fig. 1e) results in a noticeable suppression of precipitation intensity, despite improved spatial correlation. This degradation becomes more pronounced when both temperature and humidity are nudged alongside winds (DNDG-UVTQ; Fig. 1f), revealing a key trade-off in the traditional nudging formulation: nudging Q improves the location and timing of precipitation (higher PCC) but substantially worsens its magnitude relative to observations (higher RMSE). As shown in previous studies (Sun et al., 2019), in addition to the realistic large-scale circulation provided by wind (U, V) nudging, further nudging of humidity (Q) improves the large-scale moisture distribution and leads to a more realistic spatial organization of precipitation systems, thereby increasing PCC. At the same time, those studies also demonstrated that improved pattern correlation does not necessarily guarantee a more realistic precipitation intensity, likely because humidity nudging can introduce unrealistic feedbacks between the large-scale moisture field and other model components (e.g., convection and microphysics) through changes to the condensational heating and vertical motion. This issue, however, is largely alleviated by the reformulated vertical weighting function of Eq. (4) in the nudging formulation proposed in this study, as the RNDG-UVTQ simulation (Fig. 1g) retains the enhanced spatial structure achieved by DNDG-UVTQ while avoiding the associated increase in RMSE, thereby achieving a more comprehensive improvement without the trade-offs observed in the default nudging approach. Compared to DNDG-UV (Fig. 1c) and DNDG-UVT (Fig. 1d), RNDG-UVTQ further improves hindcast skill over the tropics, as indicated by both higher PCC and lower RMSE, with similar improvements also found in other regions, including the Northern Hemisphere midlatitudes (figures not shown).
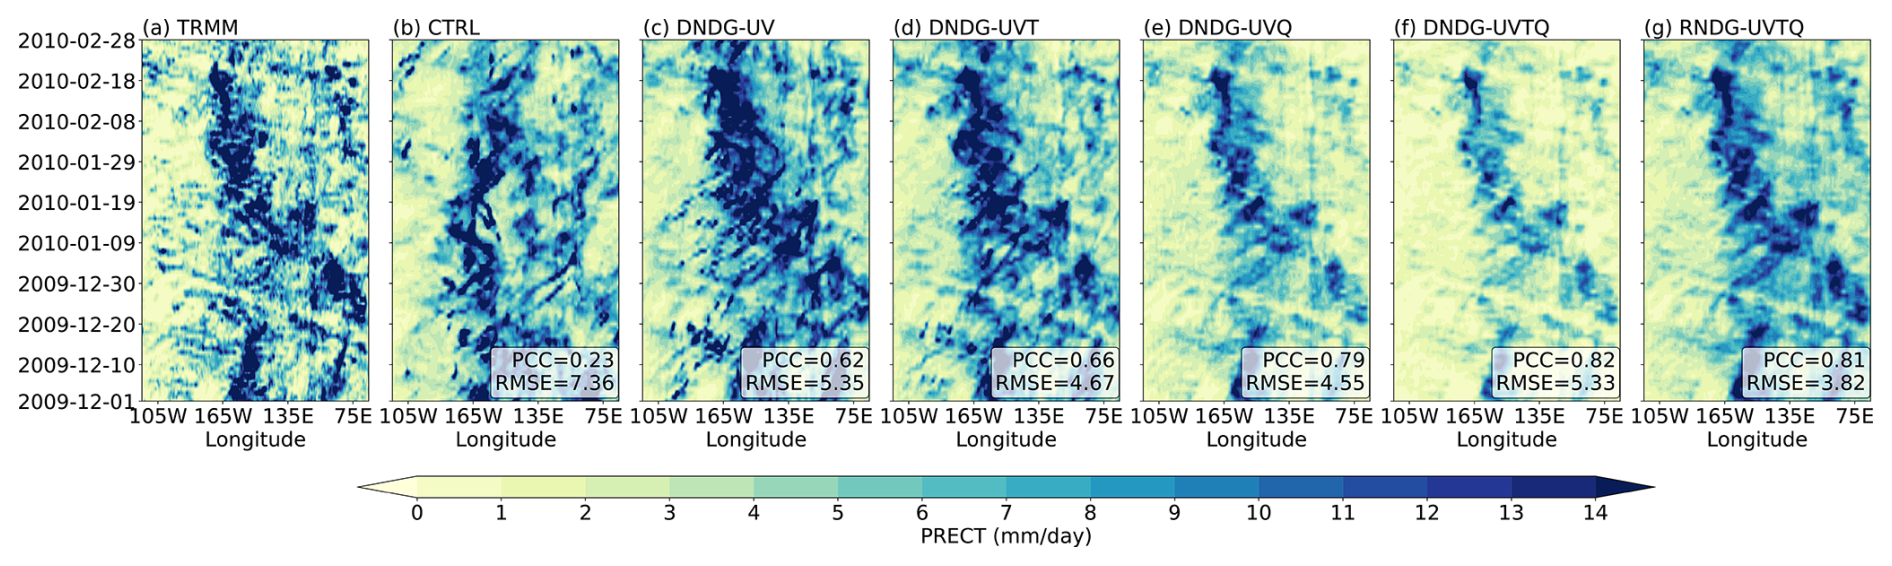
Figure 1Zonal-mean Hovmöller diagrams of daily precipitation rate (mm d−1) over the tropics region (10° S–10° N, 60° E–90° W), based on TRMM observations (a), the free-running EAMv2 simulation (CTRL; panel b), and nudged EAMv2 simulations (c–g) labeled as “DNDG” or “RNDG”. Simulations labeled “DNDG” use the nudging formulation in Eq. (3), while “RNDG” simulations apply the revised formulation in Eq. (4). The suffixes UV, UVT, and UVTQ denote the subsets of model state variables nudged toward the ERA5 reanalysis: large-scale winds (U, V), temperature (T), and humidity (Q), respectively. Pattern correlation coefficients (PCC) and root-mean-square errors (RMSE) between each EAMv2 simulation (b–g) and the TRMM observations (a) are reported in the bottom-right corner of each panel. Further details on the simulation setups are provided in Sect. 2.3 and Table 1.
Figure 2 shows the global pattern correlation coefficients (PCCs) and normalized root-mean-square errors (RMSEs) for selected physical variables, computed by comparing EAMv2 simulations against the observational datasets listed in Table B1, averaged over the three months from December 2009 to February 2010. RMSEs are normalized by the observed RMS values to enable consistent comparison of relative errors across variables with differing units and magnitudes. Overall, the EAMv2 simulations reproduce large-scale spatial patterns reasonably well, with PCCs exceeding 0.9 for most variables (Fig. 2a). However, simulations that include humidity nudging using the default formulation (DNDG-UVQ and DNDG-UVTQ) show substantial increases in RMSE for precipitation, total cloud fraction CLDTOT), and cloud-related radiative fluxes (FLNS, LWCF, and SWCF). Since consistent reductions are observed in large-scale model states such as PSL, TREFHT, and Z500, these degradations are likely attributable to the complex interactions of nudging with subgrid model physics. As reported in previous studies of nudging in the E3SM model series using configurations similar to the DNDG simulations here, including specific humidity in the nudging configuration (e.g., DNDG-UVQ) can directly influence parameterized convection by modifying moisture convergence (Sun et al., 2019), whereas temperature nudging (e.g., DNDG-UVT) has been shown to substantially suppress the model's adjustment to aerosol forcing, even in experiments nudged toward the model's own climatology (Zhang et al., 2022). When both temperature and humidity are nudged simultaneously (e.g., DNDG-UVTQ), these effects are easily triggered together, leading to an even stronger degradation of model performance in terms of simulated precipitation and aerosol life cycle, as reported by Ma et al. (2015). In contrast, the revised formulation in Eq. (4), as implemented in RNDG-UVTQ, effectively alleviates these issues, although it still shows some degradation in RMSEs for cloud and radiation fields relative to CTRL. As discussed further in Sect. 4.2, these residual errors may stem from the absence of nudging over land, compensating errors in the model system, as well as interactions between nudging and physics parameterizations.
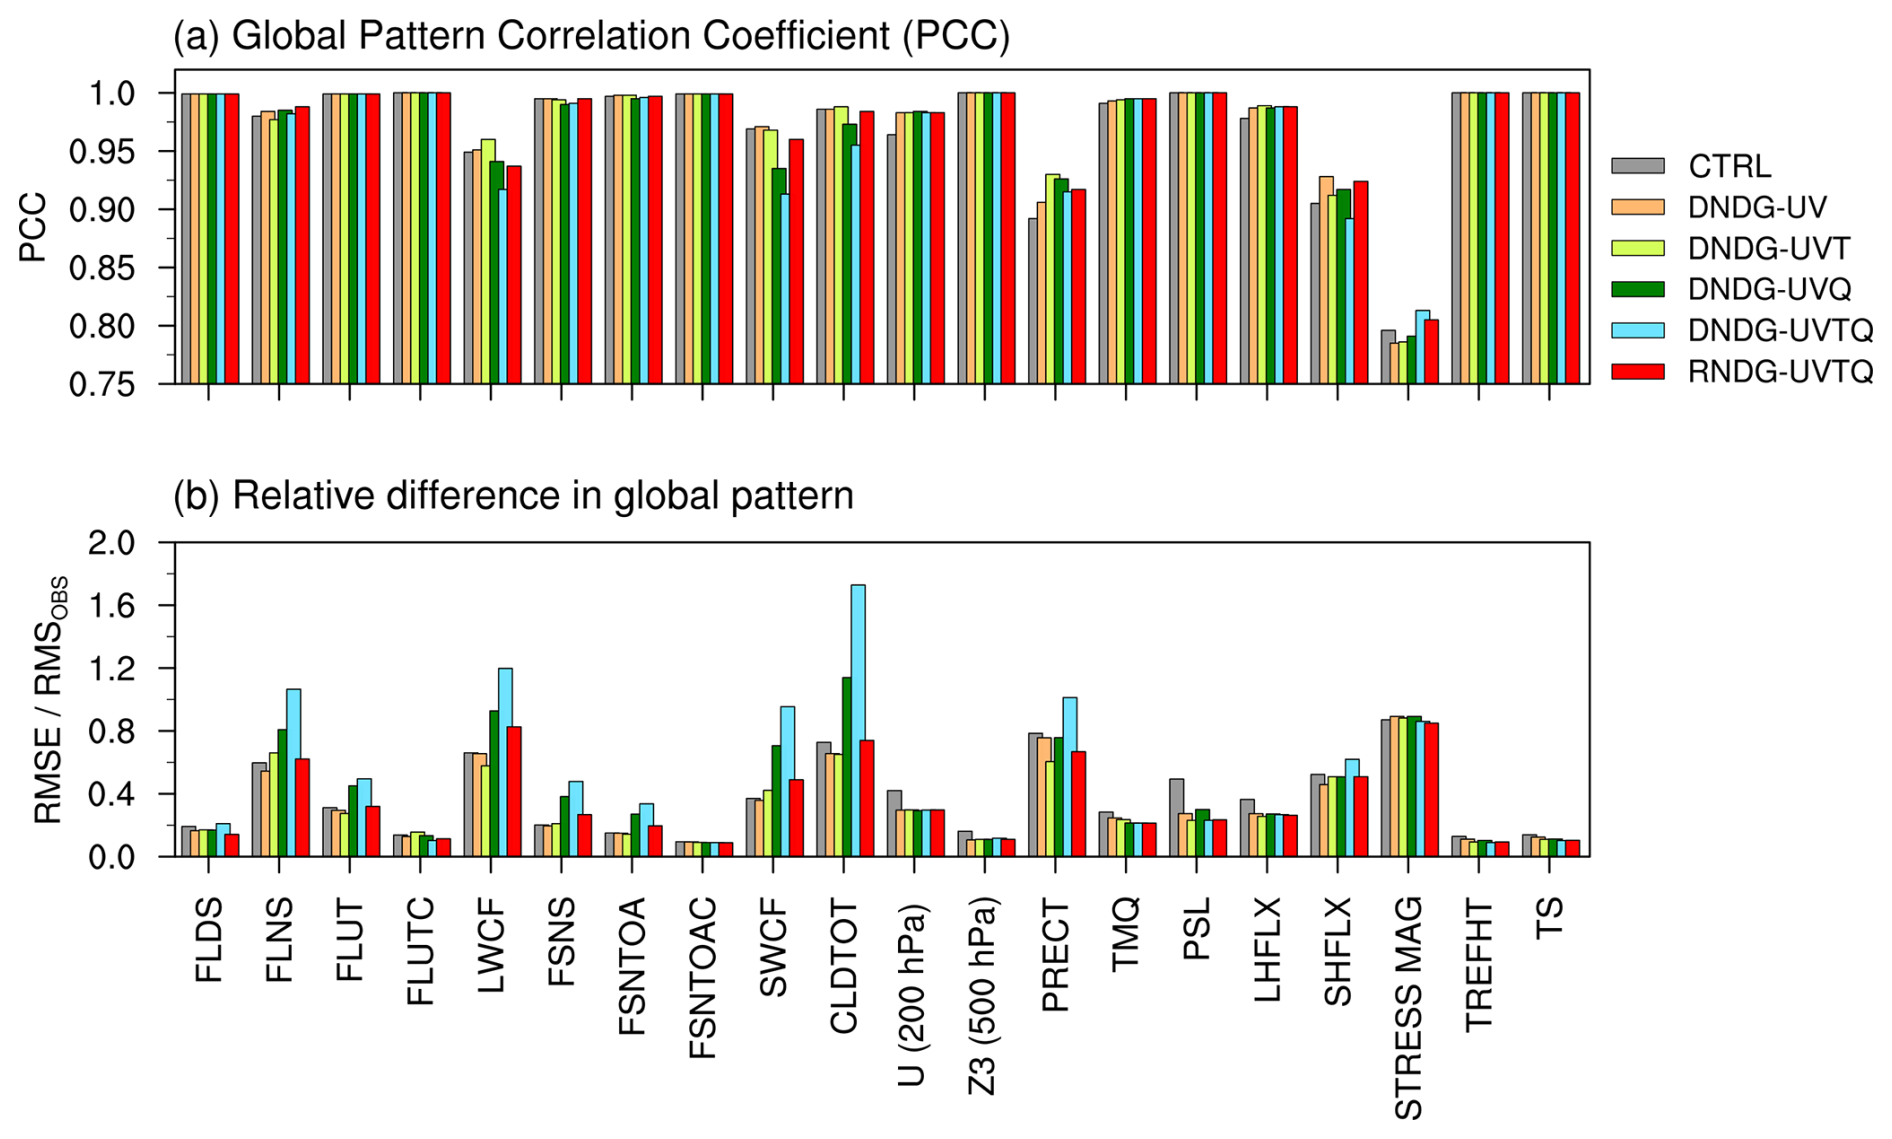
Figure 2Comparison of global pattern correlation coefficients (PCC; a) and normalized root-mean-square errors (RMSE; b) from EAMv2 free-running and nudged simulations, averaged over the 3 months from December 2009 to February 2010. The physical variables along the x axis are listed in Table B1 in the Appendix B. The normalized RMSE is computed as the root-mean-square differences between the model and the corresponding observational dataset (Table B1), divided by the root-mean-square of the observed field (RMSOBS), providing a dimensionless measure of relative error magnitude. Different colors represent distinct nudging configurations, which vary in the frequency of the constraining data and the ordering of the applied physical tendencies. All statistics are computed relative to the observational datasets listed in Table B1. Additional discussion is provided in Sect. 3 and Appendix B, and details of the simulation setups are given in Sect. 2.3 and Table 1.
We also note that the low-pass-filtering nature of nudging, as implemented in Eq. (2), can smooth local temperature and moisture gradients, which in turn affects diagnostic variables with strongly nonlinear characteristics – such as clouds, precipitation, and radiative fluxes – leading to amplified errors in their representation. Such effects operate in both DNDG-UVTQ and RNDG-UVTQ in the free troposphere, but Eq. (4), relative to Eq. (3), is likely better at preserving strong thermodynamic gradients in the boundary layer owing to the omission of nudging there. With the current experiments, we cannot quantify the impact that near-surface temperature or moisture gradients have on diagnostic fields such as clouds or precipitation, and we leave such analyses to future research. Regardless, the comparison between RNDG-UVTQ and DNDG-UVTQ still demonstrates that the proposed nudging strategy significantly improves hindcast performance in EAMv2 by addressing key limitations of the default approach in handling humidity nudging. Finally, because the short-term experiments reveal persistent and systematic degradations when the default formulation in Eq. (3) is applied to humidity – and because similar degradations have also been documented in longer simulations by Sun et al. (2019) and Zhang et al. (2022) – we restrict the subsequent long-term (11-year) integrations to the revised nudging configuration. In the next section, we evaluate how this configuration performs in multi-year integrations and whether it produces realistic long-term climate statistics in E3SM.
In this section, we assess the performance of the present-day long-term simulations in Group 3 of Table 1, which were conducted using the revised nudging formulation described in Eq. (4) and implemented with various nudging strategies. Emphasis is placed on evaluating the fidelity of these nudged EAMv2 simulations in reproducing key observed physical and dynamical fields, based on their hindcast skill.
4.1 Model biases in large-scale mean environmental conditions
Figure 3 presents the zonal and annual mean biases in zonal wind (U), temperature (T), and specific humidity (Q) from the CLIM simulation (first column) and the nudged EAMv2 experiments. All biases are computed relative to ERA5 reanalysis and averaged over the 2008–2017 period. Dotted regions indicate statistically significant differences at the 95 % confidence level based on a Student's t test. Biases in regions of high topography are masked due to large extrapolation errors. Consistent with previous studies (Sun et al., 2019; Zhang et al., 2022), wind-only nudging in the NDG-UV simulation substantially reduces model biases in the zonal wind field (U; Fig. 3a1 and a2). Although hemispheric cancellation obscures coherent patterns in the zonal mean of meridional wind (V), NDG-UV effectively suppresses the dominant error centers present in the CLIM simulation, particularly in the upper troposphere (Fig. 3b1 and b2). Its impact on correcting temperature (T) and specific humidity (Q) biases, however, remains limited (Fig. 3c1–c2 and d1–d2). Extending nudging to include temperature (NDG-UVT) leads to a marked reduction in temperature biases while retaining the wind improvements (Fig. 3a3–c3), but this configuration introduces undesirable increases in humidity biases, especially in the tropical and subtropical middle troposphere (Fig. 3d3). These spurious responses are effectively eliminated when humidity nudging is also applied (NDG-UVTQ), as shown in Fig. 3d4, underscoring the importance of jointly constraining both temperature and humidity to achieve realistic thermodynamic conditions in hindcast simulations. Among all tested configurations, NDG-UVTQ yields the most substantial reduction in biases across the majority of dynamical (U, V) and thermodynamic (T, Q) fields (Fig. 3a4–d4), resulting in a more accurate representation of large-scale atmospheric states across most regions of the globe. Comparable improvements are also observed in the NDG-UVTQ_SRF1 strategy, which incorporates additional nudging of U, V, T, and Q near the surface (figure not shown).
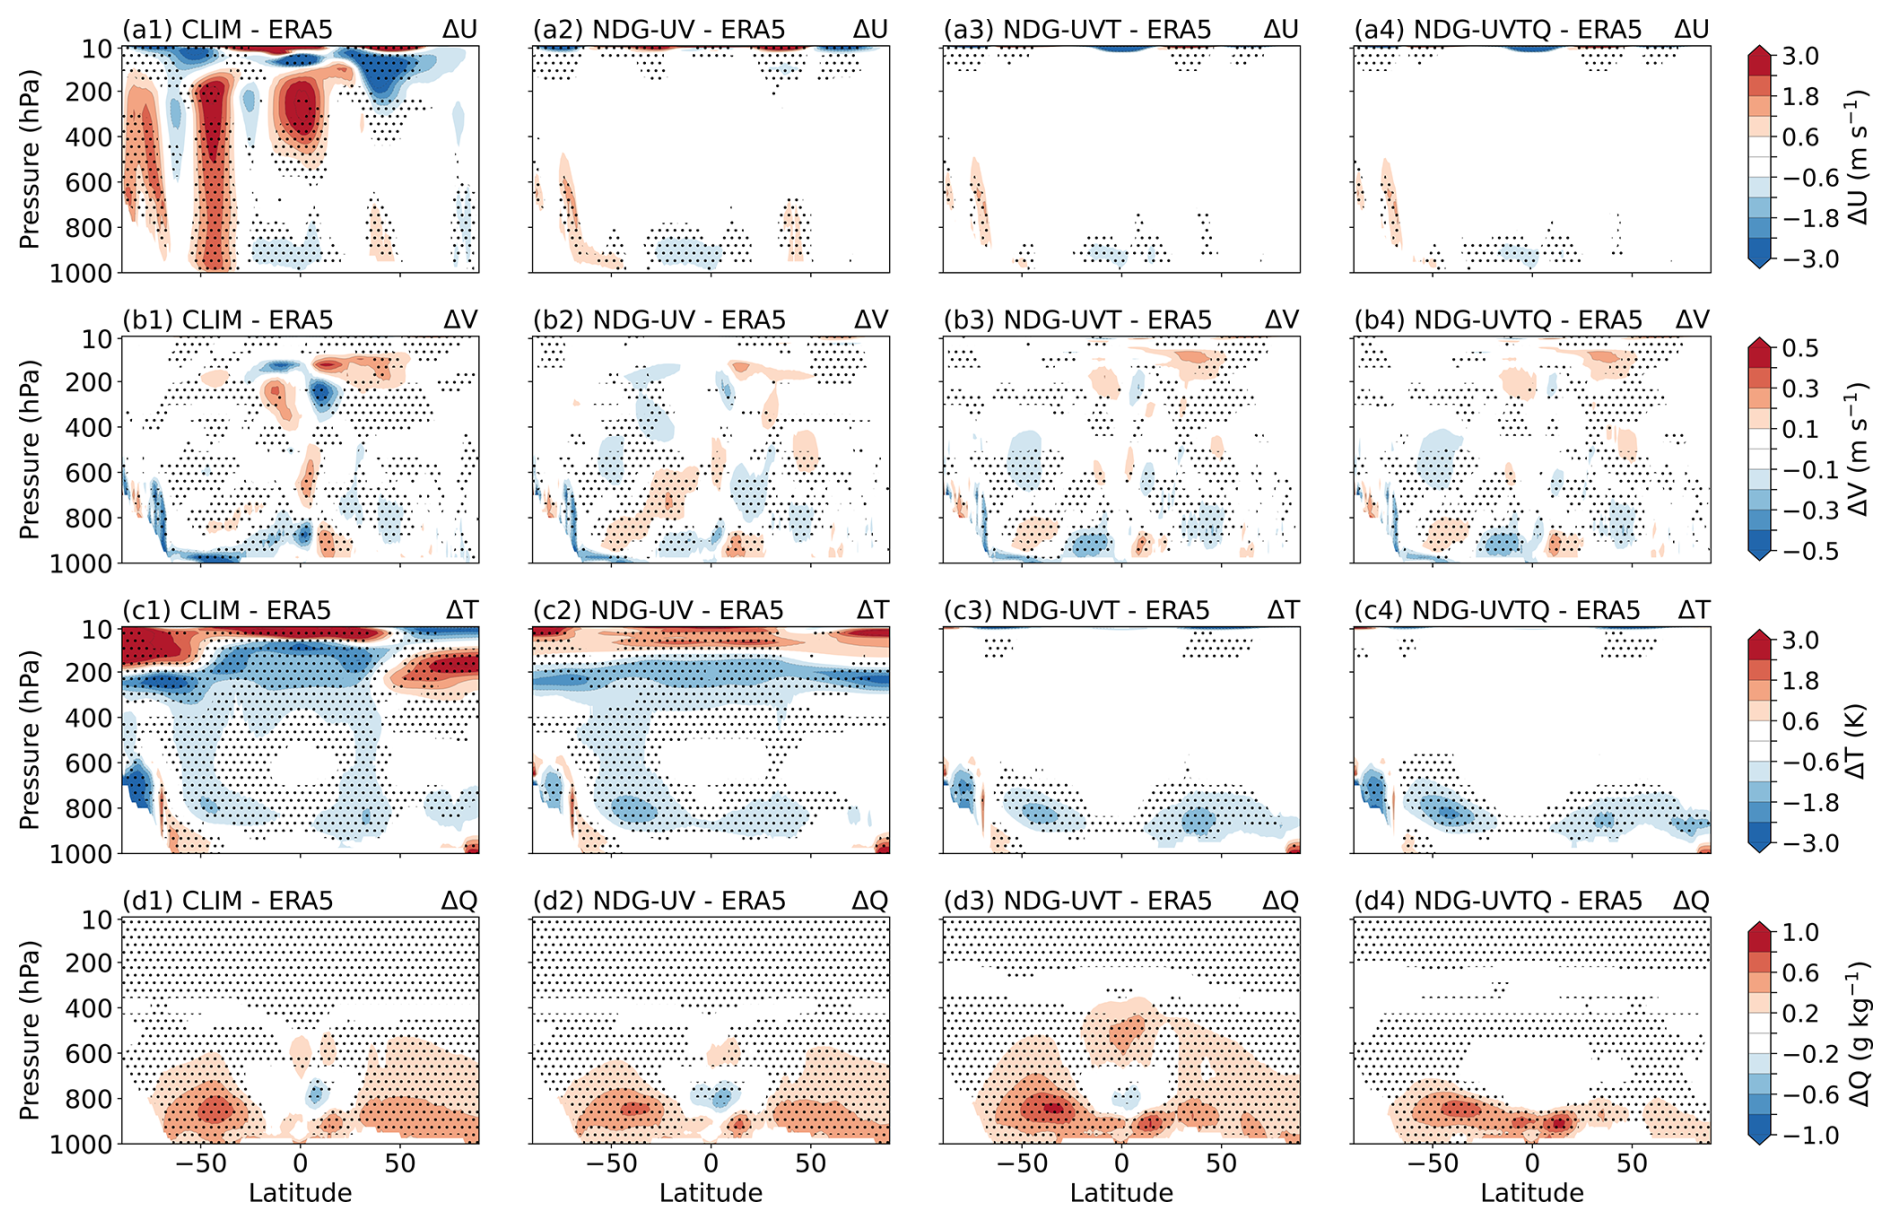
Figure 3Zonal and annual mean model biases in zonal wind (U, unit: m s−1, a1–a4), meridional wind (V, unit: m s−1, b1–b4), temperature (T, unit: K, c1–c4), and water vapor mixing ratio (Q, unit: g kg−1, panels d1–d4) averaged from 2008 to 2017 from free-running (i.e., CLIM, a1, b1, c1, d1), UV-nudging (NDG-UV, a2, b2, c2, d2), UVT-nudging (NDG-UVT, a3, b3, c3, d3) and UVTQ-nudging (NDG-UVTQ, a4, b4, c4, d4) EAMv2 simulations. The biases are derived by comparing monthly mean EAMv2 simulations with ERA5 reanalysis. The dotted region indicates the differences are significant at a 95 % confidence level from a Student's t test. The log-linear interpolation is used to regrid the EAMv2 data on the hybrid sigma-pressure level to the pressure level for comparison with the ERA5 reanalysis. Details of the simulation setups can be found in Table 1.
One notable exception is the tropical lower troposphere (1000–800 hPa), particularly for temperature and humidity, where the nudging exerts relatively weak constraints compared to the upper troposphere. This behavior is partly explained by how the vertical weighting in Eq. (4) modulates the nudging within lower-tropospheric regions. As shown in Fig. C1, the direct nudging tendency term is effectively zeroed out near the surface by Eq. (4). However, once the nudging tendencies are applied, the model dynamics and physical parameterizations respond immediately, such that corrections introduced in one constrained variable at one level or grid point influence other variables, as well as other layers and neighboring locations, through coupled dynamical and physical processes. Through this pathway, indirect constraints from variables and layers above the lower troposphere still act to reduce biases throughout most of the lower troposphere, as seen by comparing NDG-UV (Fig. 3a2–d2) with CLIM (Fig. 3a1–d1). A similar mechanism operates in NDG-UVT (Fig. 3a3–d3) and NDG-UVTQ (Fig. 3a4–d4); however, in these configurations, the interactions between the nudging tendencies – particularly for temperature and humidity – and the model physics also influence the resulting bias structures. These effects are discussed further in the next subsection.
A more quantitative assessment is also performed using root-mean-square error (RMSE) and anomaly correlation coefficient (ACC) metrics derived from comparisons with observational and reanalysis datasets (see Table B1). Figure 4 displays heatmaps of RMSE values for selected upper-atmosphere (Fig. 4a) and surface-level (Fig. 4b) variables, normalized by the multi-experiment mean RMSE for each variable. Values near one indicate average model skill; values greater than one (purple shading) denote larger errors, while values below one (green shading) indicate improved agreement with observations. All nudged simulations outperform the free-running CLIM case, exhibiting systematic reductions in RMSE at both upper and near-surface atmospheric levels. The best performance is observed in the two nudged simulations (i.e., NDG-UVTQ and NDG-UVTQ_SRF1), in which all major prognostic variables are nudged (Fig. 4a). Compared to NDG-UVTQ, the inclusion of land-surface nudging in NDG-UVTQ_SRF1 further improves fidelity in near-surface temperature (T2M, TS) and total column moisture (TPW; Fig. 4b), although it introduces a slight degradation in the simulation of shortwave radiative fluxes (e.g., FSNT, FSNS, FSNSC) and cloud-related quantities (e.g., LWP, IWP). The behavior of the NDG-UVTQ and NDG-UVTQ_SRF1 configurations will be examined in more detail in the following subsections. Despite these trade-offs, both simulations maintain strong agreement with large-scale atmospheric patterns, as evidenced by high ACC values (Fig. C2), consistent with previous findings (Sun et al., 2019; Zhang et al., 2022).
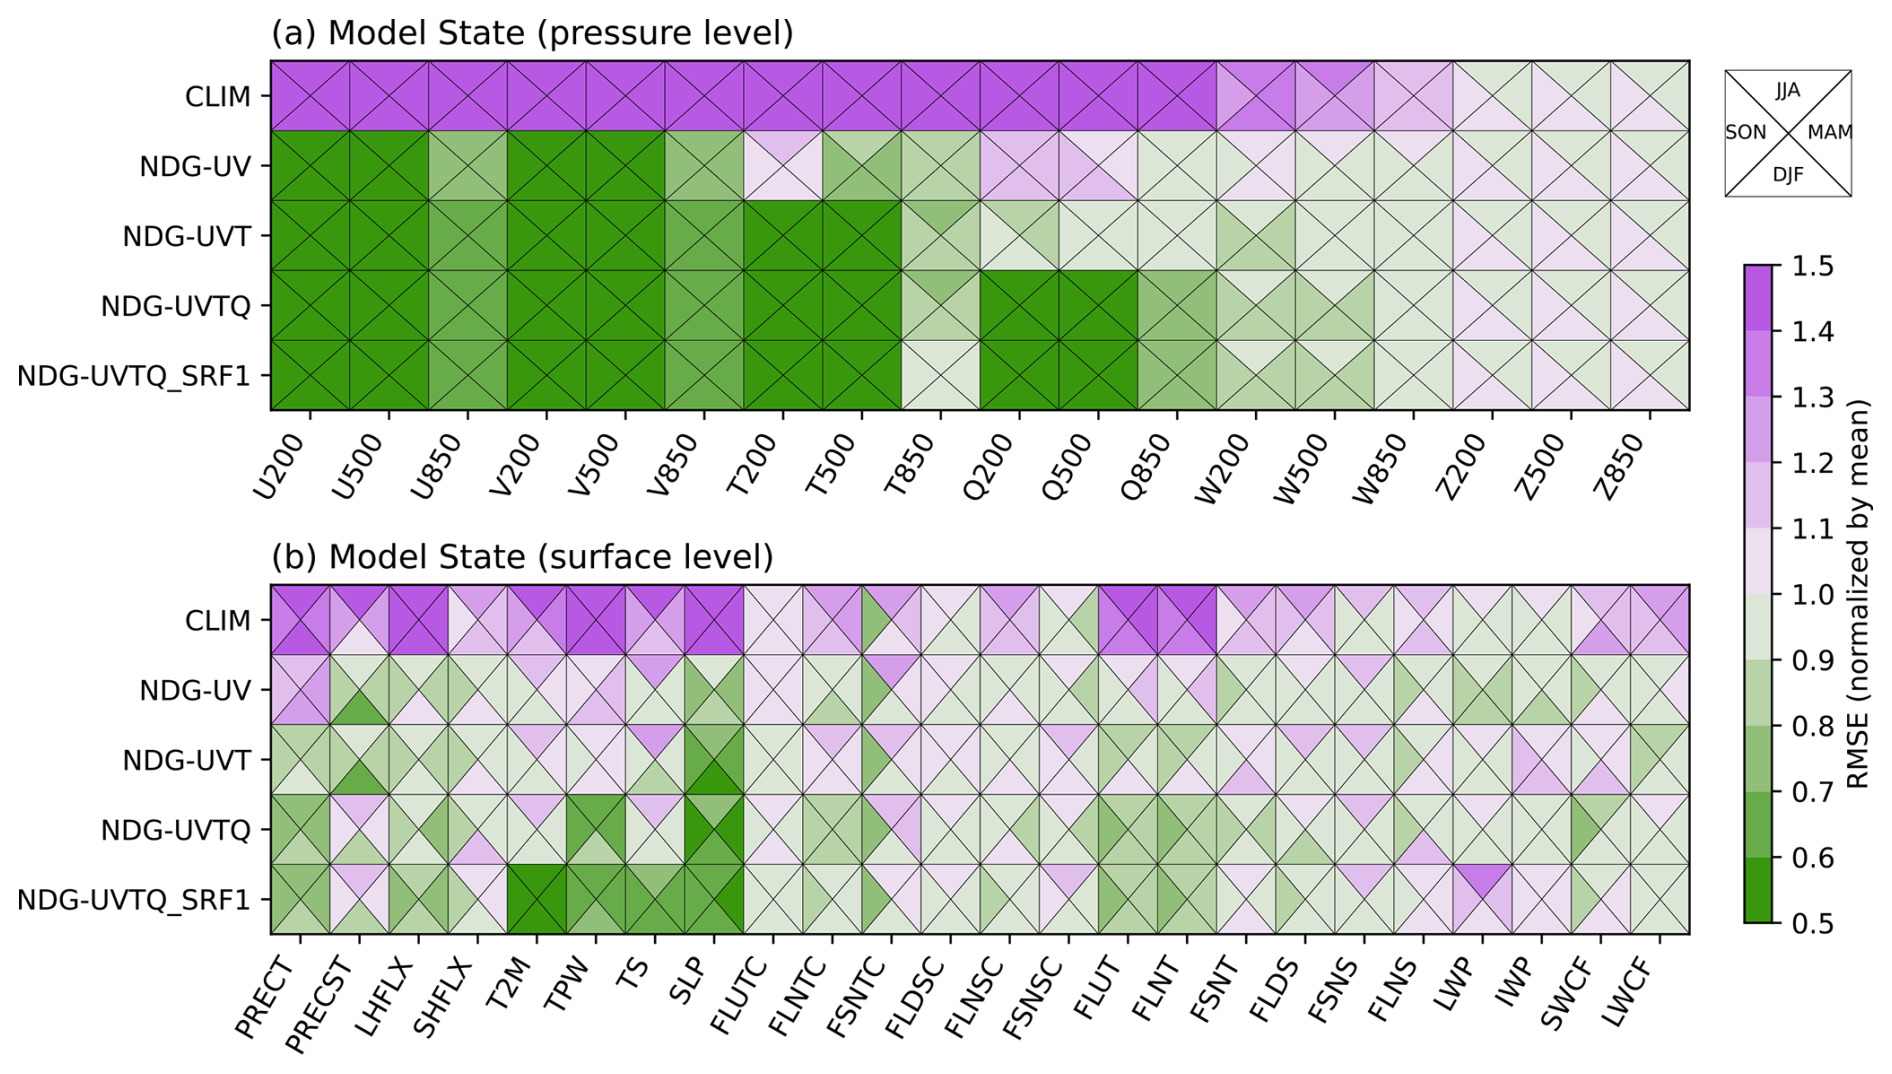
Figure 4Heatmap showing normalized root-mean-square errors (RMSE) of 10-year average seasonal mean physical quantities from EAMv2 free-running (CLIM) and nudged simulations (NDG-UV, NDG-UVT, NDG-UVTQ, NDG-UVTQ_SRF1) in Table 1. The top panel (a) shows upper-atmosphere variables on selected pressure levels calculated from 6-hourly model output, while the bottom panel (b) shows surface-level variables computed from monthly mean model output. Each square is subdivided into four triangles representing seasonal mean values for austral summer (DJF), autumn (MAM), winter (JJA), and spring (SON), respectively. Colors indicate the magnitude of RMSE, normalized by the multi-model mean across experiments for each variable (row-wise). Experiments are listed along the y axis and variables along the x axis. Definitions of the physical quantities and the corresponding reference datasets used for RMSE calculation are provided in Table B1.
Overall, the results presented in this section demonstrate that incorporating humidity nudging – especially when implemented within a revised multi-variable nudging framework – significantly enhances the hindcast skill of EAMv2. These improvements span both dynamical and thermodynamic aspects of the simulation. Crucially, simultaneous nudging of temperature and humidity is not only effective in reducing biases but also essential for maintaining consistency in energy and mass budgets. This need partly arises from the default nudging formulation of Eq. (3), which applies independent relaxation timescales to each nudged variable without accounting for their physical covariances. When only temperature is nudged (as in NDG-UVT), such unbalanced constraints can disrupt cross-variable relationships and generate spurious responses – particularly in humidity fields.
4.2 Hindcast skills of precipitation and land–atmosphere interaction
As a complement to the 10-year global statistics presented in Fig. 4, Fig. 5 further presents Hovmöller diagrams of the daily precipitation rate (PRECT; units: mm d−1) for a representative evaluation year (December 2010–November 2011) over selected tropical (Fig. 5a1–e1) and midlatitude regions (Fig. 5a2–e2), comparing the free-running and nudged simulations listed in Table 1. We find that NDG-UVTQ successfully preserves both the spatial structure and magnitude of precipitation in the tropics (Fig. 5a1–e1) and midlatitudes (Fig. 5a2–e2) throughout the year. Notably, NDG-UVTQ further enhances precipitation hindcast skill in the tropics relative to NDG-UV and NDG-UVT, as evidenced by higher pattern correlation coefficients (PCCs) and lower root-mean-square errors (RMSEs). In the midlatitude regions (Fig. 5a2–e2), substantial improvements in precipitation hindcast skill are already evident with wind-only nudging (NDG-UV) compared to the free-running CLIM simulation, highlighting the dominant role of large-scale circulation in driving midlatitude precipitation. While further nudging of temperature and humidity (NDG-UVT and NDG-UVTQ) leads to modest additional reductions in RMSE, the differences between NDG-UVT and NDG-UVTQ in other precipitation-related fields (Fig. 4) highlight important distinctions between the two nudging strategies.
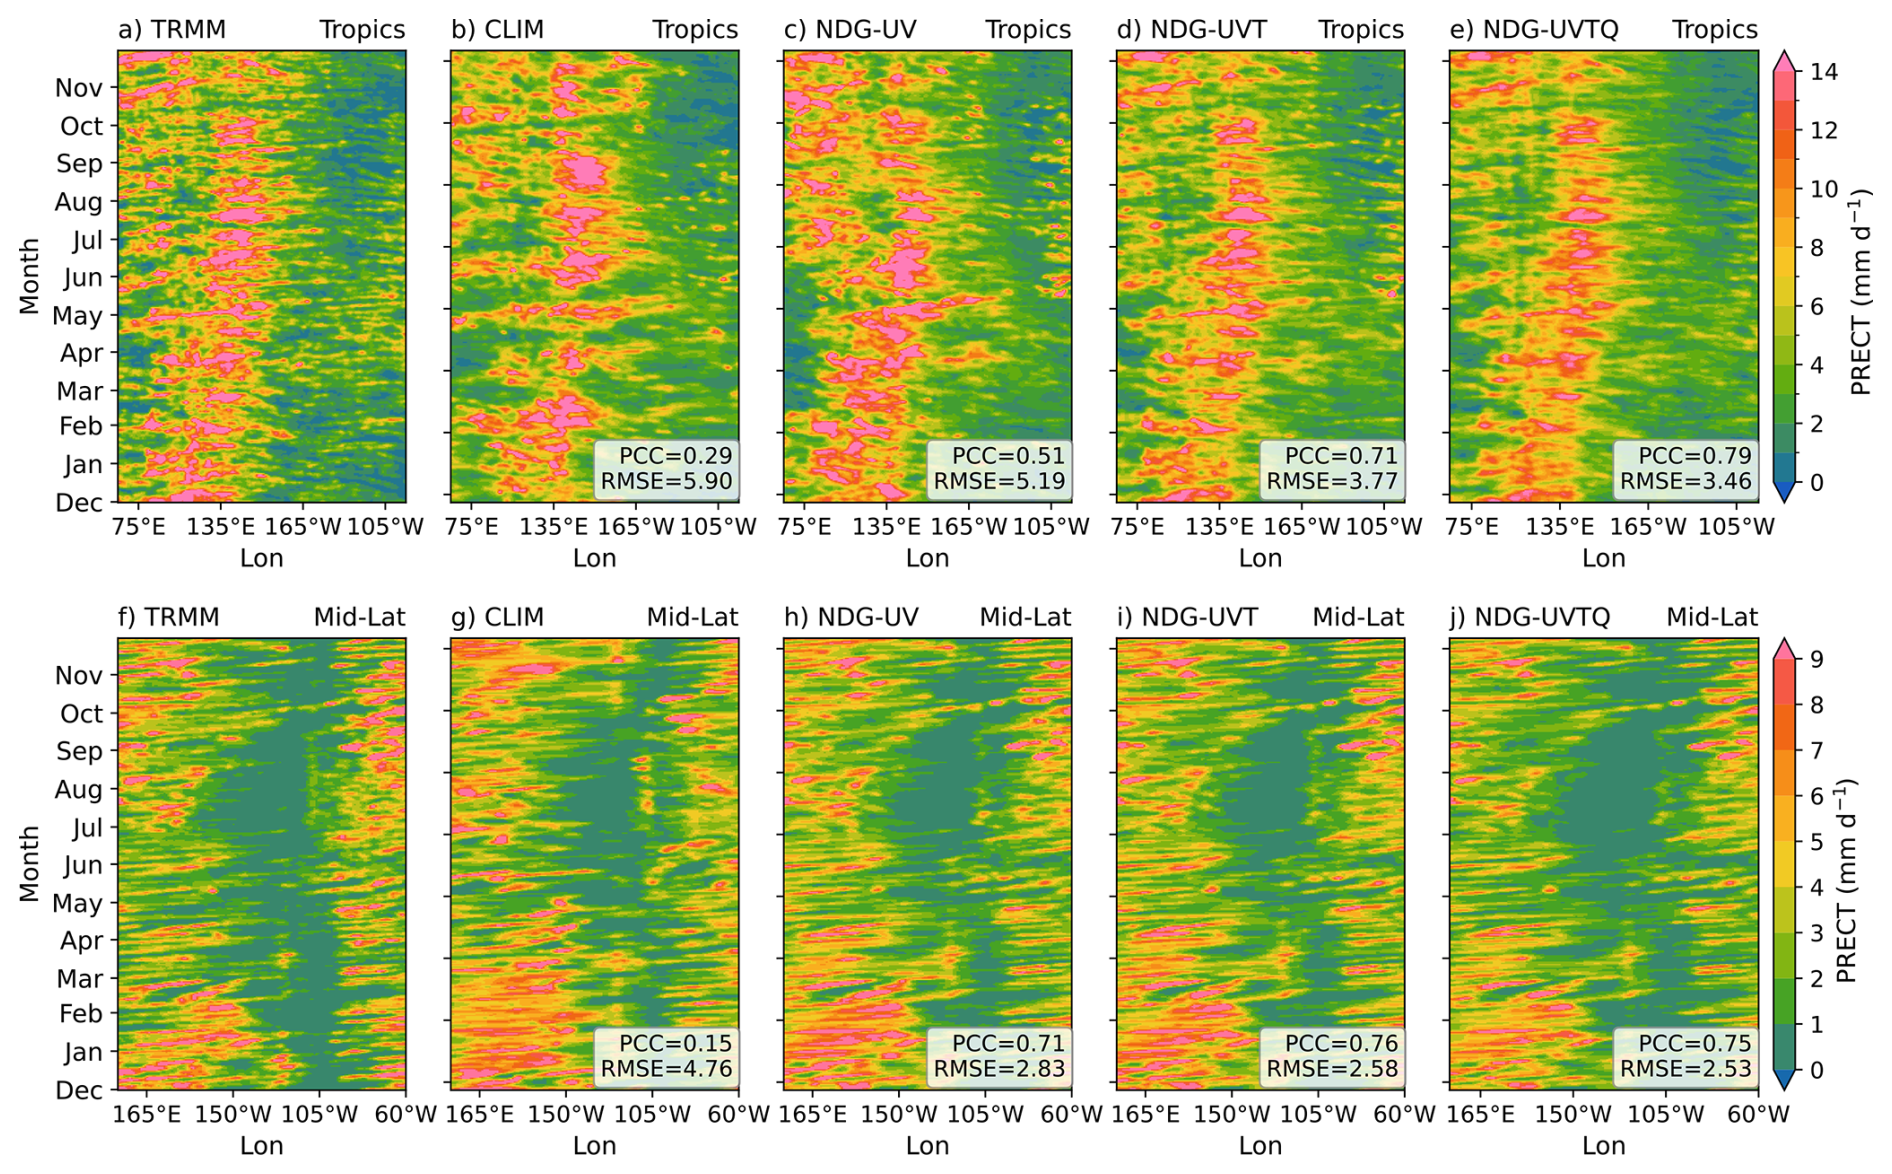
Figure 5Evaluation of the spatiotemporal distribution of daily precipitation from 1 December 2010 to 30 November 2011 over the tropics (10° S–10° N, 60° E–90° W; a–e) and Northern Hemisphere midlatitude region (25–50° N, 150° E–60° W; f–j). Panels (a, f): Hovmöller diagrams of meridionally averaged total precipitation rates (PRECT, mm d−1) from TRMM satellite observations. Panels (b, g): CLIM simulation. Panels (c–e, h–j): simulations with wind-only nudging (NDG-UV), wind-plus-temperature nudging (NDG-UVT), and full-variable nudging (NDG-UVTQ), respectively. Top labels indicate correlation (Corr.) and RMSE with respect to TRMM. Simulation setups are described in Sect. 2.3 and Table 1.
Figure 6 illustrates mean biases in total precipitable water (TPW; first row), outgoing longwave radiation (FLUT; second row), precipitation rate (PRECT; third row), and surface air temperature (T2M; fourth row) from EAMv2 simulations compared against observations. Relative to the free-running CLIM simulation, the NDG-UVT case exhibits a spurious increase in TPW across many regions, particularly within the midlatitude storm track zones (Fig. 6a1 and a2). This artificial moistening of atmospheric columns coincides with an enhanced underestimation of FLUT (Fig. 6b1 and b2) in the same regions. While constraining the temperature field improves long-term mean precipitation (Fig. 6c1 and c2), the simulation struggles to maintain realistic atmospheric mass and energy balances – an issue previously reported by Zhang et al. (2022). When additional humidity nudging is applied (NDG-UVTQ), the spurious TPW increase is effectively removed, leading to a substantial global reduction in TPW biases (Fig. 6a3). This demonstrates that jointly constraining temperature and specific humidity is essential for maintaining a realistic moisture distribution and improving the representation of precipitation. Nevertheless, NDG-UVTQ tends to over-correct FLUT, resulting in overestimated outgoing longwave radiation in many regions relative to both NDG-UVT and CLIM (Fig. 6b3). It also leads to a systematic weakening of long-term mean precipitation over midlatitude regions. This apparent inconsistency with the improved synoptic-scale performance shown in Fig. 5e2 arises from differences in spatial and temporal scales across the diagnostics.
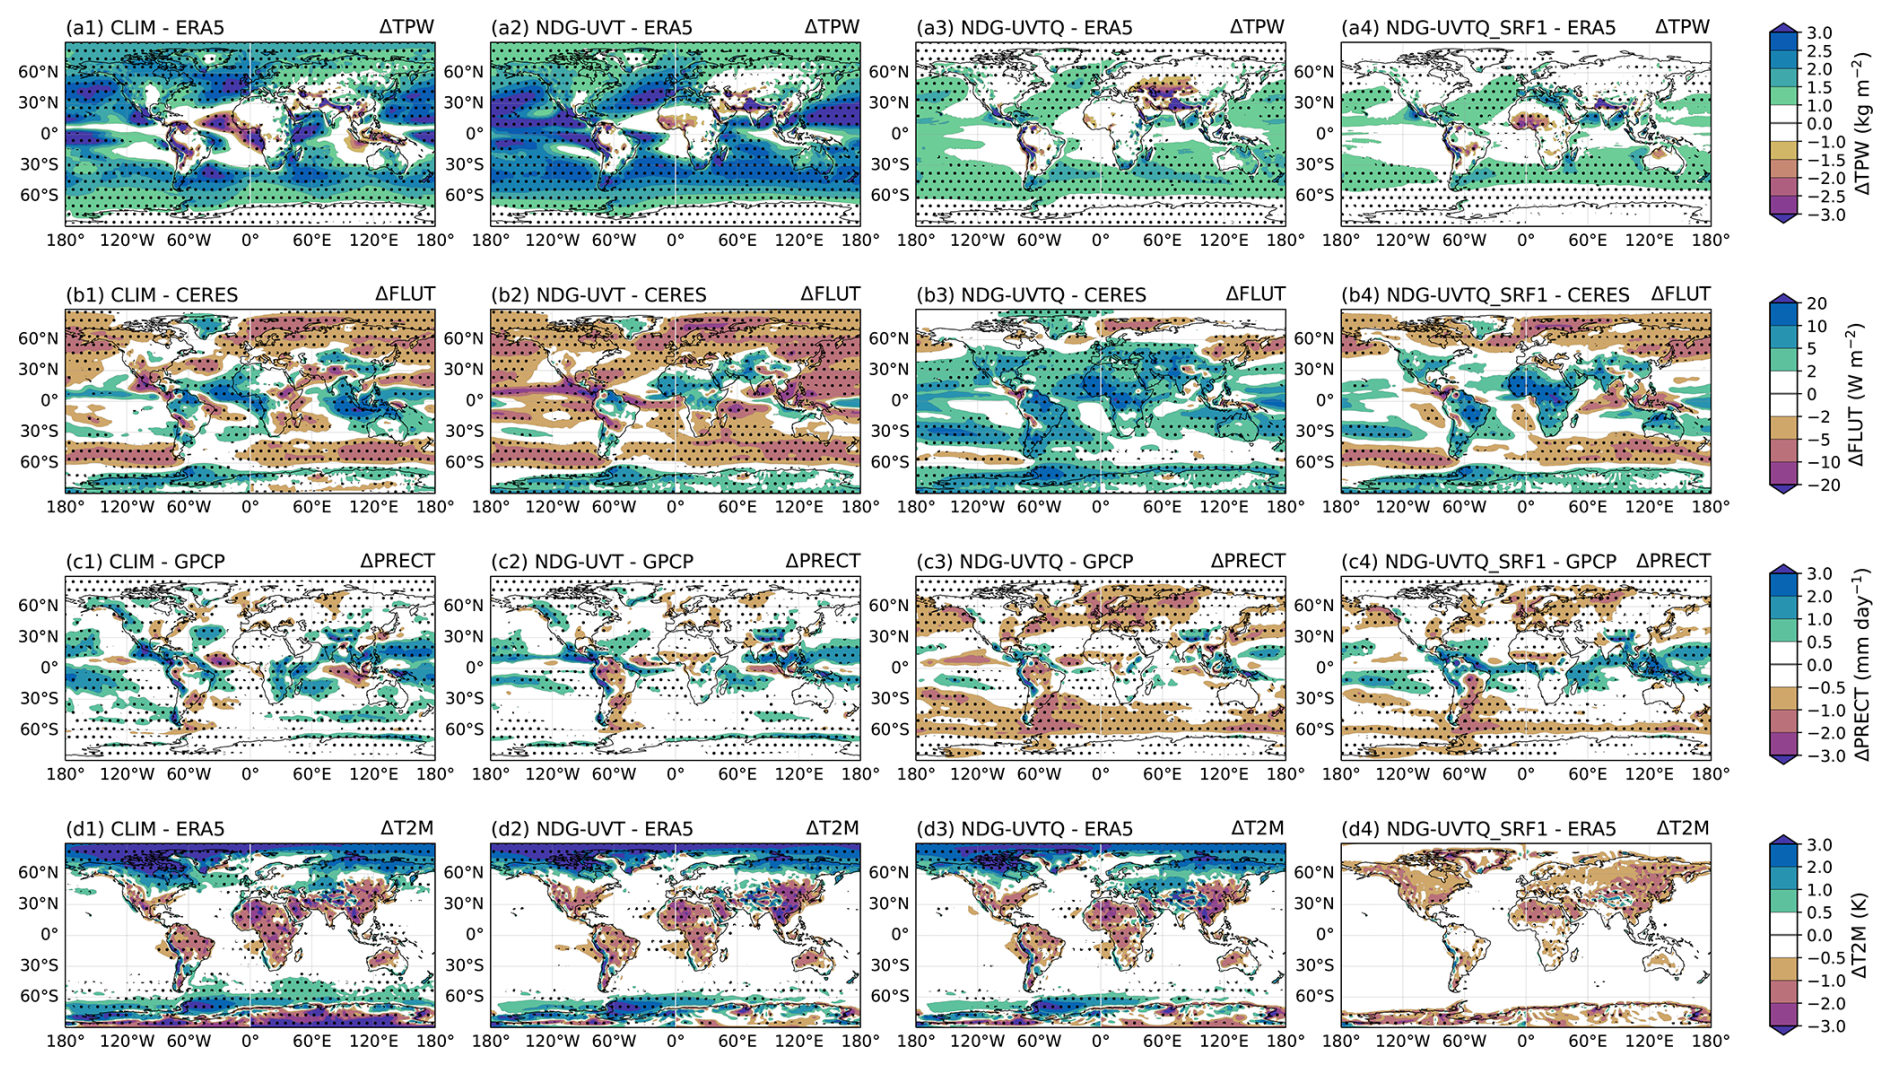
Figure 6Horizontal distribution of annual mean model biases in total precipitable water (TPW, unit: kg m−2; panels a1–a4), outgoing longwave radiation (FLUT, unit: W m−2; panels b1–b4), surface air temperature (T2M, unit: K; panels d1–d4), and total precipitation rate (PRECT, unit: mm d−1; panels c1–c4), averaged over a 10-year simulation period from 2008 to 2017. Results are shown for CLIM (a1, b1, c1, d1), NDG-UVT (a2, b2, c2, d2), NDG-UVTQ (a3, b3, c3, d3), and NDG-UVTQ_SRF1 (a4, b4, c4, d4). Biases are computed relative to observations/reanalysis from GPCP (PRECT; Adler et al., 2003), ERA5 (TREFHT, TMQ; Hersbach et al., 2020), and CERES-EBAF (FLUT; Kato et al., 2018). Dotted regions indicate statistically significant differences at the 95 % level based on a Student's t test. See Table 1 for simulation details.
One key factor contributing to the unfavorable FLUT and PRECT biases in NDG-UVTQ is the lack of constraints on the land-surface model state. As shown in Fig. 6d1–d3, surface air temperature (T2M) biases remain largely unchanged in both magnitude and spatial distribution, regardless of whether a subset or all of the upper-atmosphere variables (U, V, T, Q) are nudged. This suggests that upper-air nudging alone is insufficient to effectively influence surface conditions, underscoring the importance of incorporating surface or land-model constraints to better maintain consistency with observed surface water and energy fluxes. Examination of the NDG-UVTQ_SRF1 experiment, which extends nudging to include the land-surface layer, shows substantial reductions in surface biases such as T2M (Fig. 6d4) compared with NDG-UVTQ (Fig. 6c4) and CLIM (Fig. 6a4). Moreover, NDG-UVTQ_SRF1 restores FLUT closer to the model's favorable climatology (Fig. 6b4 versus Fig. 6b1) while also mitigating the excessive weakening of midlatitude precipitation evident in NDG-UVTQ (Fig. 6c4 versus Fig. 6c1).
Furthermore, the biases in large-scale moisture convergence (LSMC; Fig. C3) in NDG-UVT, NDG-UVTQ, and NDG-UVTQ_SRF1 do not show corresponding changes in total precipitable water (TPW; Fig. 6a2–a4) or precipitation (PRECT; Fig. 6c2–c4). This lack of a coherent response between LSMC and TPW suggests that the sensitivity of precipitation to nudging strategies does not primarily arise from changes in large-scale moisture transport, but rather from adjustments in subgrid physics processes (e.g., microphysics) that may be triggered by the nudging configurations. This also helps explain the relatively weak improvement in precipitation biases in NDG-UVTQ_SRF1 (Fig. 6c4) compared with the other nudging simulations (Fig. 6c1–c3), because precipitation is determined not only by realistic large-scale moisture convergence and surface conditions, but also by how nudging interacts with the physics parameterizations. This interpretation is supported by the strong sensitivity of cloud properties and by systematic changes in both shortwave and longwave cloud radiative effects across the simulations (Fig. C4). As shown in prior parameterization-tuning studies within the E3SM modeling system (e.g., Ma et al., 2022; Song et al., 2025), several physics parameterizations (e.g., microphysics and deep convection) were tuned in the biased mean climate of the free-running simulations (i.e., CTRL), whereas nudging shifts the large-scale thermodynamic state toward the reanalysis constraints. As a consequence, parameterizations that perform well in free-running mode may exhibit unintended sensitivities when nudging is applied – especially when temperature and humidity fields are constrained – because the background cloud-water and instability environments sampled by microphysics and deep convection are altered. Therefore, the increased biases in cloud-related quantities from the nudged simulations relative to CLIM, as shown in Figs. 6 and C4, should not necessarily be viewed as degradations in hindcast skill. Instead, they likely reflect that some degree of retuning may be required for the physics parameterizations to achieve optimal performance under nudged configurations. A systematic evaluation of how these tuning parameters behave under nudged configurations would be valuable, but such an analysis lies beyond the scope of the present study.
Taken together with the findings from the previous section, our results in this section support the conclusion that simultaneous nudging of all major model state variables, including winds, temperature, and humidity, is essential not only for enhancing the model's hindcast skill in reproducing the real atmosphere but also for maintaining realistic mass and energy budgets. Furthermore, nudging the land-surface layer contributes to improved physical realism in long-term simulations of the water and energy budgets. Intercomparison across nudging configurations indicates that microphysical processes and associated cloud properties in EAMv2 are sensitive to land-surface conditions and land–atmosphere interactions, which in turn influence the fidelity of long-term water and energy budgets.
As mentioned in Sect. 1, nudging techniques have been applied in model intercomparison projects such as ExtremeX, which focus on weather and long-term environmental extremes. This motivates an evaluation of whether the humidity nudging strategy proposed in this study can enhance model performance for such applications. In this section, we compare the EAMv2 free-running simulation (CLIM) with three nudged simulations (NDG-UV, NDG-UVT, and NDG-UVTQ_SRF1) to assess the effectiveness of the proposed nudging strategies in improving EAMv2's representation of high-impact weather systems and to explore their implications for evaluating such events using low-resolution models.
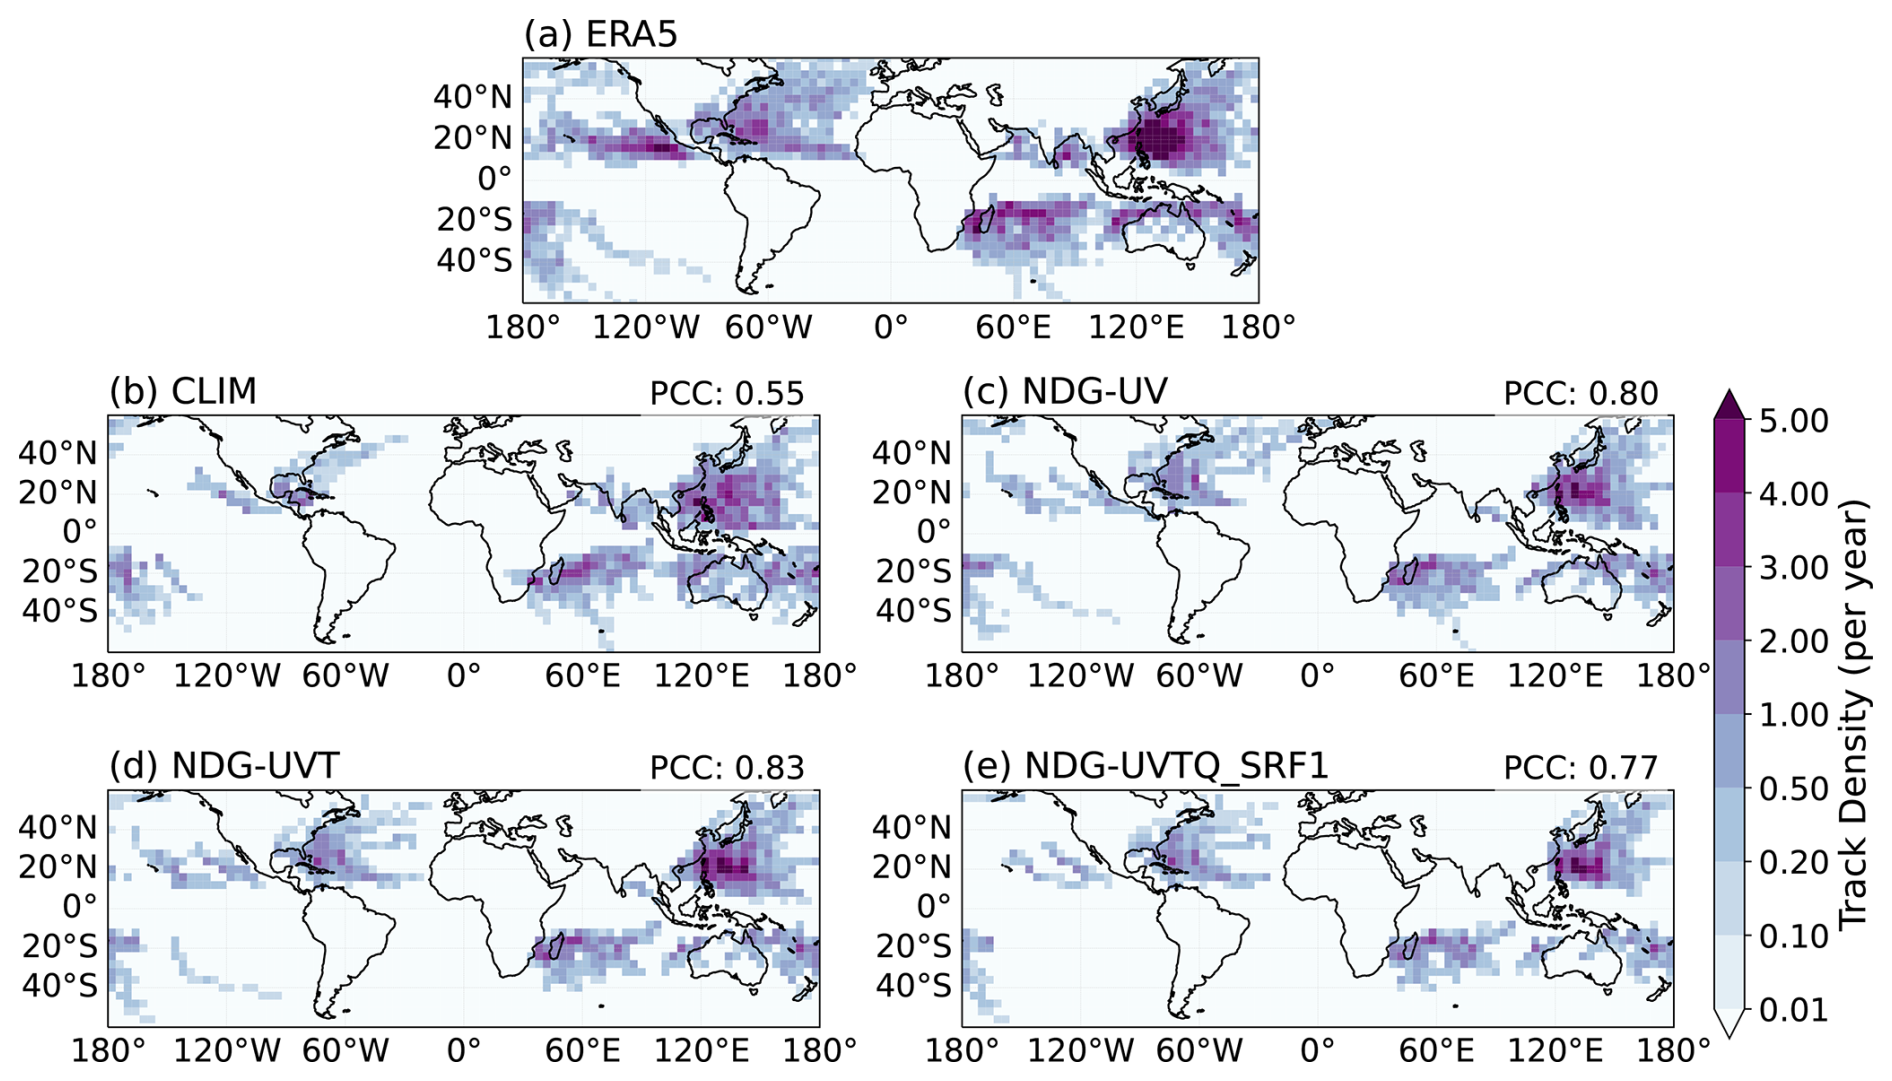
Figure 7Tropical cyclone (TC) track densities computed from the ERA5 reanalysis dataset (a), the EAMv2 free-running simulation (CLIM; b), and nudged simulations including NDG-UV (c), NDG-UVT (d), NDG-UVTQ (e), and NDG-UVTQ_SRF1 (f), over the period 2008–2017. All metrics are calculated on a 4°×4° latitude–longitude grid. Track density is defined as the number of 6-hourly TC positions occurring within each grid cell per year, providing a measure of TC transit frequency. Cyclones were identified using the TempestExtremes algorithm (Ullrich et al., 2021), applied to 6-hourly sea-level pressure (PSL), 10 m wind, and surface geopotential height fields. Detection begins with locating local PSL minima enclosed by closed contours with Laplacian magnitude ≥ 200 Pa and contour radius ≤ 5.5°. A fallback method identifies vortex candidates based on a warm core anomaly, computed from the difference between 200 and 500 hPa temperature (T200–T500), with a minimum threshold of ≥0.6 K, and a separation distance ≤ 6.5° with offset ≤ 1.0°. Candidate centers are merged within 6.0° and filtered based on sustained 10 m wind speeds reaching tropical storm strength (≥17.5 m s−1), surface topography ≤ 150 m, latitude ≤ 50°, and a minimum lifetime of 24 h. A detailed description of the EAMv2 simulations is provided in Table 1.
We begin our discussion with tropical cyclones (TCs), as they represent a relevant and challenging example. Low-resolution models like EAMv2, which operate at approximately 1° horizontal resolution, are not expected to fully resolve TCs. Therefore, dynamical or statistical downscaling is often required to assess TC characteristics in such models. In these cases, accurate simulation of large-scale environmental conditions becomes critical for enabling meaningful TC assessments. Figure 7 shows the TC track densities obtained using the TempestExtremes package (Ullrich et al., 2021), applied to 6-hourly mean sea level pressure (PSL) data from the ERA5 reanalysis and the EAMv2 simulations listed in Table 1. The tracking algorithm and configuration follow the methodology described in Zhang et al. (2024) (see their Appendix A3 for details). The ERA5-based track density serves as the observational reference, providing a benchmark for evaluating the realism of TC activity simulated in the various model experiments. All datasets were regridded to a 1° latitude–longitude grid before TC tracking to ensure a consistent and fair comparison. Although the original ERA5 data has a native resolution of 0.25°, its interpolation to 1° retains much of the fine-scale information relevant to TC structures. It is not surprising that all EAMv2 simulations, including those with atmospheric nudging (Fig. 7b–e), systematically underestimate TC occurrence frequency compared to ERA5 (Fig. 7a) across all basins. This underestimation is largely attributed to the coarse horizontal resolution of EAMv2, which limits the model's ability to resolve the smaller-scale dynamical features critical for TC development and maintenance. However, a comparison between nudged and free-running (CLIM) simulations reveals notable differences in the representation of TC-related weather systems, owing to improved constraints on the large-scale circulation in nudged configurations. Specifically, the CLIM simulation (Fig. 7b) shows reasonably good agreement with ERA5 in terms of the spatial pattern of TC track density over the Pacific and Indian Ocean basins but significantly underestimates TC occurrence over the northeastern Pacific and North Atlantic. In contrast, all nudged simulations exhibit higher pattern correlation coefficients (PCCs) with ERA5 and show a marked reduction in the underestimation over the Pacific and Indian Ocean regions (Fig. 7c–e), indicating that nudging improves the representation of TC-associated weather-scale systems to the extent permitted by the low-resolution EAMv2. In addition, the NDG-UVT and NDG-UVTQ_SRF1 experiments (Fig. 7d and e) do not show significant differences from NDG-UV (Fig. 7c), suggesting that the ability of low-resolution EAMv2 to capture TC-related features is primarily constrained by its dynamical fidelity rather than by additional nudging of thermodynamic fields such as temperature and humidity.
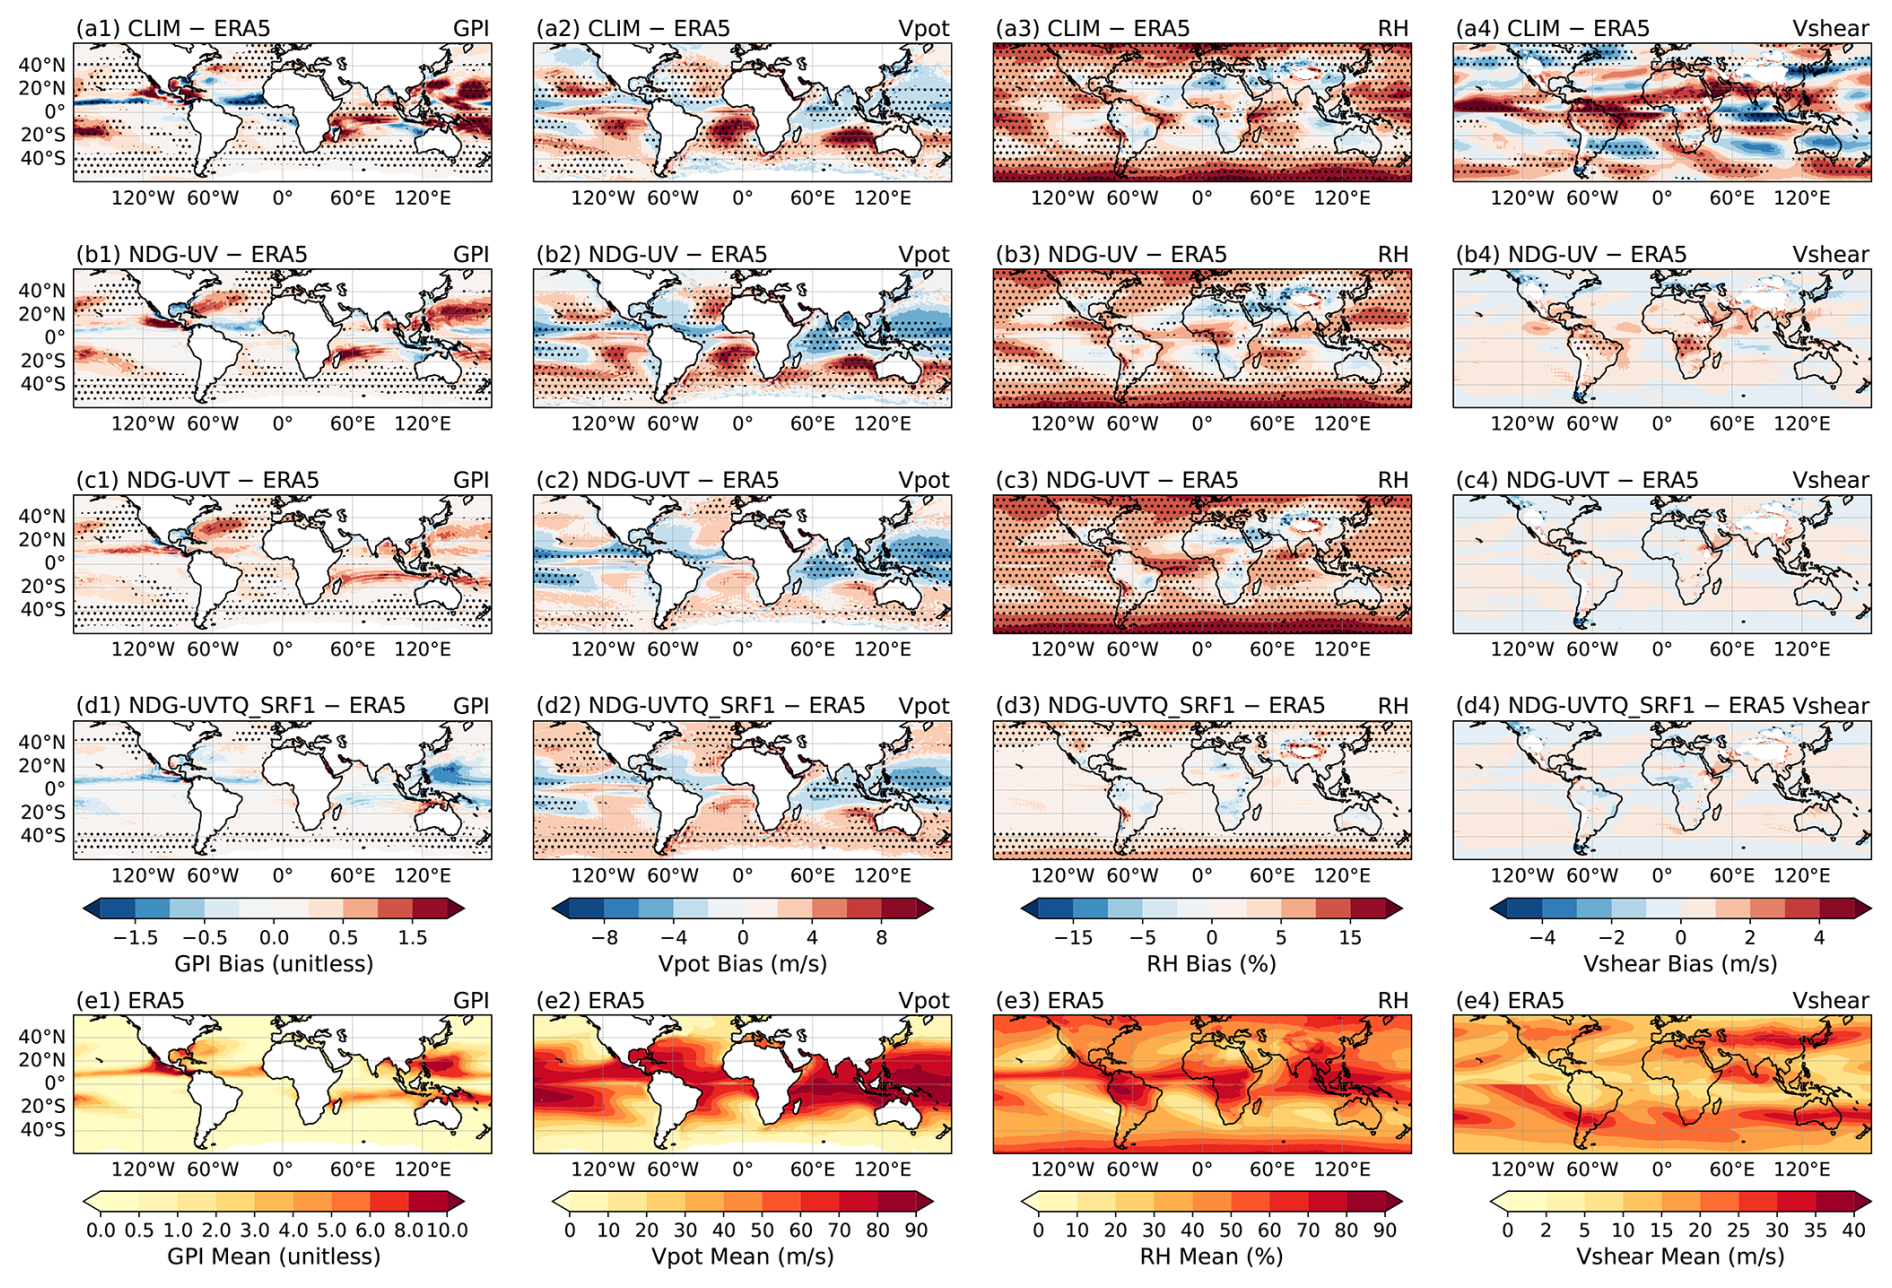
Figure 8Spatial distribution of the Genesis Potential Index (GPI) and its components in free-running and nudged EAMv2 simulations compared to ERA5 reanalysis over the period 2008–2017. The first four rows show seasonal-mean biases (experiment minus ERA5) for GPI and its key components – potential intensity Vpot), mid-tropospheric relative humidity (RH at 600 hPa), and vertical wind shear (200–850 hPa) – across three EAMv2 configurations. Stippling marks regions where differences from ERA5 are statistically significant at the 95 % confidence level based on a two-sample t test. The bottom row displays corresponding seasonal-mean climatologies from ERA5 for each variable. Colored contours represent variable values, while transparent filled circles denote observed tropical cyclone (TC) genesis locations from the IBTrACS dataset during the same period. GPI and component averages are computed using seasonally adjusted months – June to November for the Northern Hemisphere and November to May for the Southern Hemisphere – to reflect TC activity timing. Panel labels are organized as (a1)–(d3) for biases and (e1)–(e4) for ERA5 mean fields. A detailed description of the EAMv2 simulations is provided in Table 1.
The differences observed in Fig. 7 among the EAMv2 simulations, with and without nudging and under varying degrees of thermodynamic constraint, can be better understood by examining the associated large-scale environmental conditions that influence tropical cyclone (TC) activity. Figure 8 further presents the Genesis Potential Index (GPI) along with its key contributing components: potential intensity (Vpot), mid-tropospheric (600 hPa) relative humidity (RH), and vertical wind shear between 850 and 200 hPa (Vshear). The absolute vorticity term (η) is excluded from the figure due to its relatively minor contribution compared to the other components. These diagnostics follow the formulation of Emanuel (2004) (see Appendix A), which provides a quantitative framework for linking environmental conditions to TC genesis. Higher GPI values correspond to more favorable genesis conditions, typically associated with stronger Vpot, higher RH, and weaker Vshear. The free-running EAMv2 simulation (CLIM; Fig. 8a1) exhibits substantial GPI biases, driven by a combination of thermodynamic (Fig. 8a2 and a3) and dynamical (Fig. 8a4) deficiencies. These biases persist in simulations that only reduce dynamical errors (Fig. 8b1–b4) or apply partial constraints on thermodynamic variables (Fig. 8c1–c4). In contrast, the simulation that applies constraints to both dynamical (U, V) and thermodynamic (T, Q) fields (Fig. 8d1–d4) more accurately reproduces the observed GPI climatology. These results highlight the importance of simultaneously constraining both types of fields to improve the model representation of large-scale environmental conditions associated with storms like TCs.
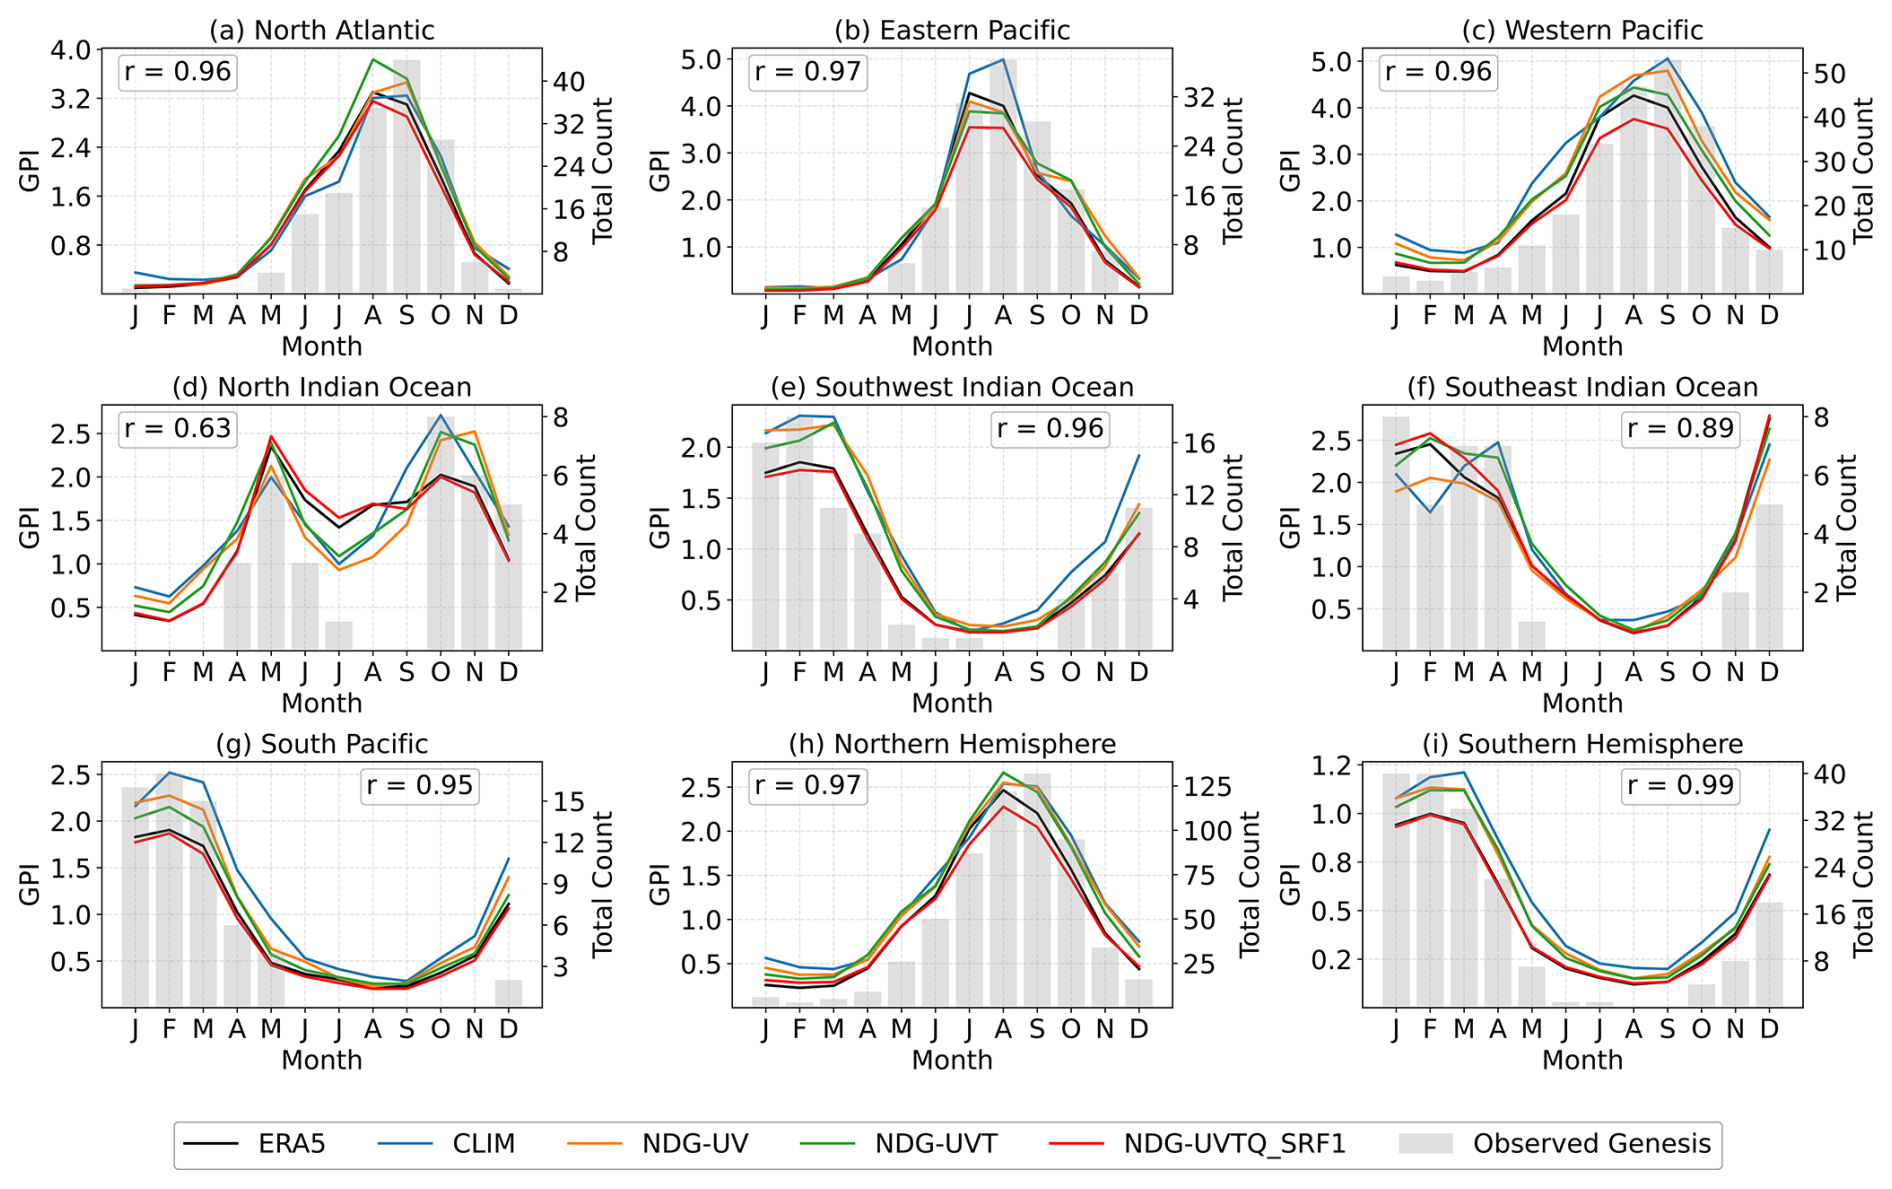
Figure 9Seasonal cycle of the Genesis Potential Index (GPI), derived using Eq. (A1), and observed tropical cyclone (TC) genesis counts across major ocean basins during the period 2008–2017. Colored lines show GPI values computed from ERA5 reanalysis (black) and various EAMv2 free-running and nudged simulations (colored), each averaged over TC basin regions defined according to WMO standards (WMO, 2017). Gray bars indicate observed monthly TC genesis counts from the IBTrACS dataset (Knapp et al., 2010), aggregated within each basin. Twin y axes are used to depict GPI (left axis) and TC genesis frequency (right axis). The correlation coefficient (r) between the annual cycle of GPI from ERA5 and TC genesis counts from IBTrACS is also shown for each basin as a reference. The basins are defined as follows: North Atlantic (0–45° N, 100–10° W), Eastern Pacific (0–35° N, 140–100° W), Western Pacific (0–45° N, 100–180° E), North Indian Ocean (0–30° N, 40–100° E), Southwest Indian Ocean (40–0° S, 30–100° E), Southeast Indian Ocean (40–0° S, 100–135° E), and South Pacific (40–0° S, 135° E–100° W). Two additional hemispheric averages are also included: Northern Hemisphere (0–60° N, global) and Southern Hemisphere (60–0° S, global). A detailed description of the EAMv2 simulations is provided in Table 1.
In addition, the results in Fig. 8 highlight that the substantial storm track density biases over the Atlantic and Eastern Pacific (Fig. 7) are partly driven by an overestimation of vertical wind shear in the lower latitudes of these basins in the CLIM simulation. This interpretation is supported by the NDG-UV experiment, where nudging of horizontal winds reduces the shear biases (Fig. 8b4) and leads to a corresponding increase in TC genesis events (Fig. C5c). However, additional nudging of temperature and humidity does not result in further improvement in TC genesis, suggesting that the remaining deficiencies primarily stem from the coarse resolution of EAMv2, which limits its ability to resolve the dynamics essential for tropical cyclone formation. Nevertheless, constraining both dynamical and thermodynamic fields is essential to improve the model's representation of the seasonal and annual cycles of the GPI, as shown in Fig. 9. Among all experiments, the NDG-UVTQ_SRF1 simulation (red lines), which includes additional constraints on near-surface humidity, generally provides the best reproduction of the observed variability and seasonal peaks of GPI across most tropical-cyclone basins, with improved agreement relative to ERA5 (black lines). An exception occurs in the Eastern and Western Pacific, where the significant overestimation of GPI in the free-running control (CLIM) is reduced when large-scale wind and temperature nudging is applied, but the seasonal GPI peak becomes weaker when humidity nudging is further included in NDG-UVTQ_SRF1 (Fig. 9b and c). The underlying reason is partly informed by the results in Fig. 8 and Eq. (A1): the GPI bias arises from compensation among the component fields that enter the GPI formulation. In CLIM, the positive biases in RH and vertical wind shear (Vshear) are larger in magnitude than the negative bias in Vpot in these regions, resulting in only partial cancellation. Because the RH bias is particularly large, it dominates the total GPI error and ultimately leads to the substantial overestimation seen in CLIM. For the nudged simulations without humidity (i.e., NDG-UV and NDG-UVT), the compensation occurs primarily between Vpot and RH, and the magnitudes of their errors are of similar size in these regions, leading to a smaller net GPI bias. However, when humidity nudging is included in NDG-UVTQ_SRF1, the RH bias is substantially reduced, breaking this compensation, and the remaining negative bias in Vpot results in a weaker seasonal GPI peak in the Eastern and Western Pacific. We note that such understanding would not have been possible without a complete comparison across the series of nudged simulations conducted using the strategy proposed in this study. This indicates that accurately constraining both dynamical and thermodynamic conditions in numerical models is valuable for representing the large-scale environment and for gaining diagnostic insight relevant to tropical cyclones. Given the strong statistical relationship between GPI and TC genesis density (r values in Fig. 9), the results here also highlight the importance of realistically simulating the large-scale temperature and humidity fields that support TC development. In particular, the humidity-nudging strategy proposed in this study provides a practical approach to improving the thermodynamic environment relevant to tropical-cyclone formation, thereby enabling more reliable TC downscaling and associated studies from low-resolution GCMs such as EAMv2.
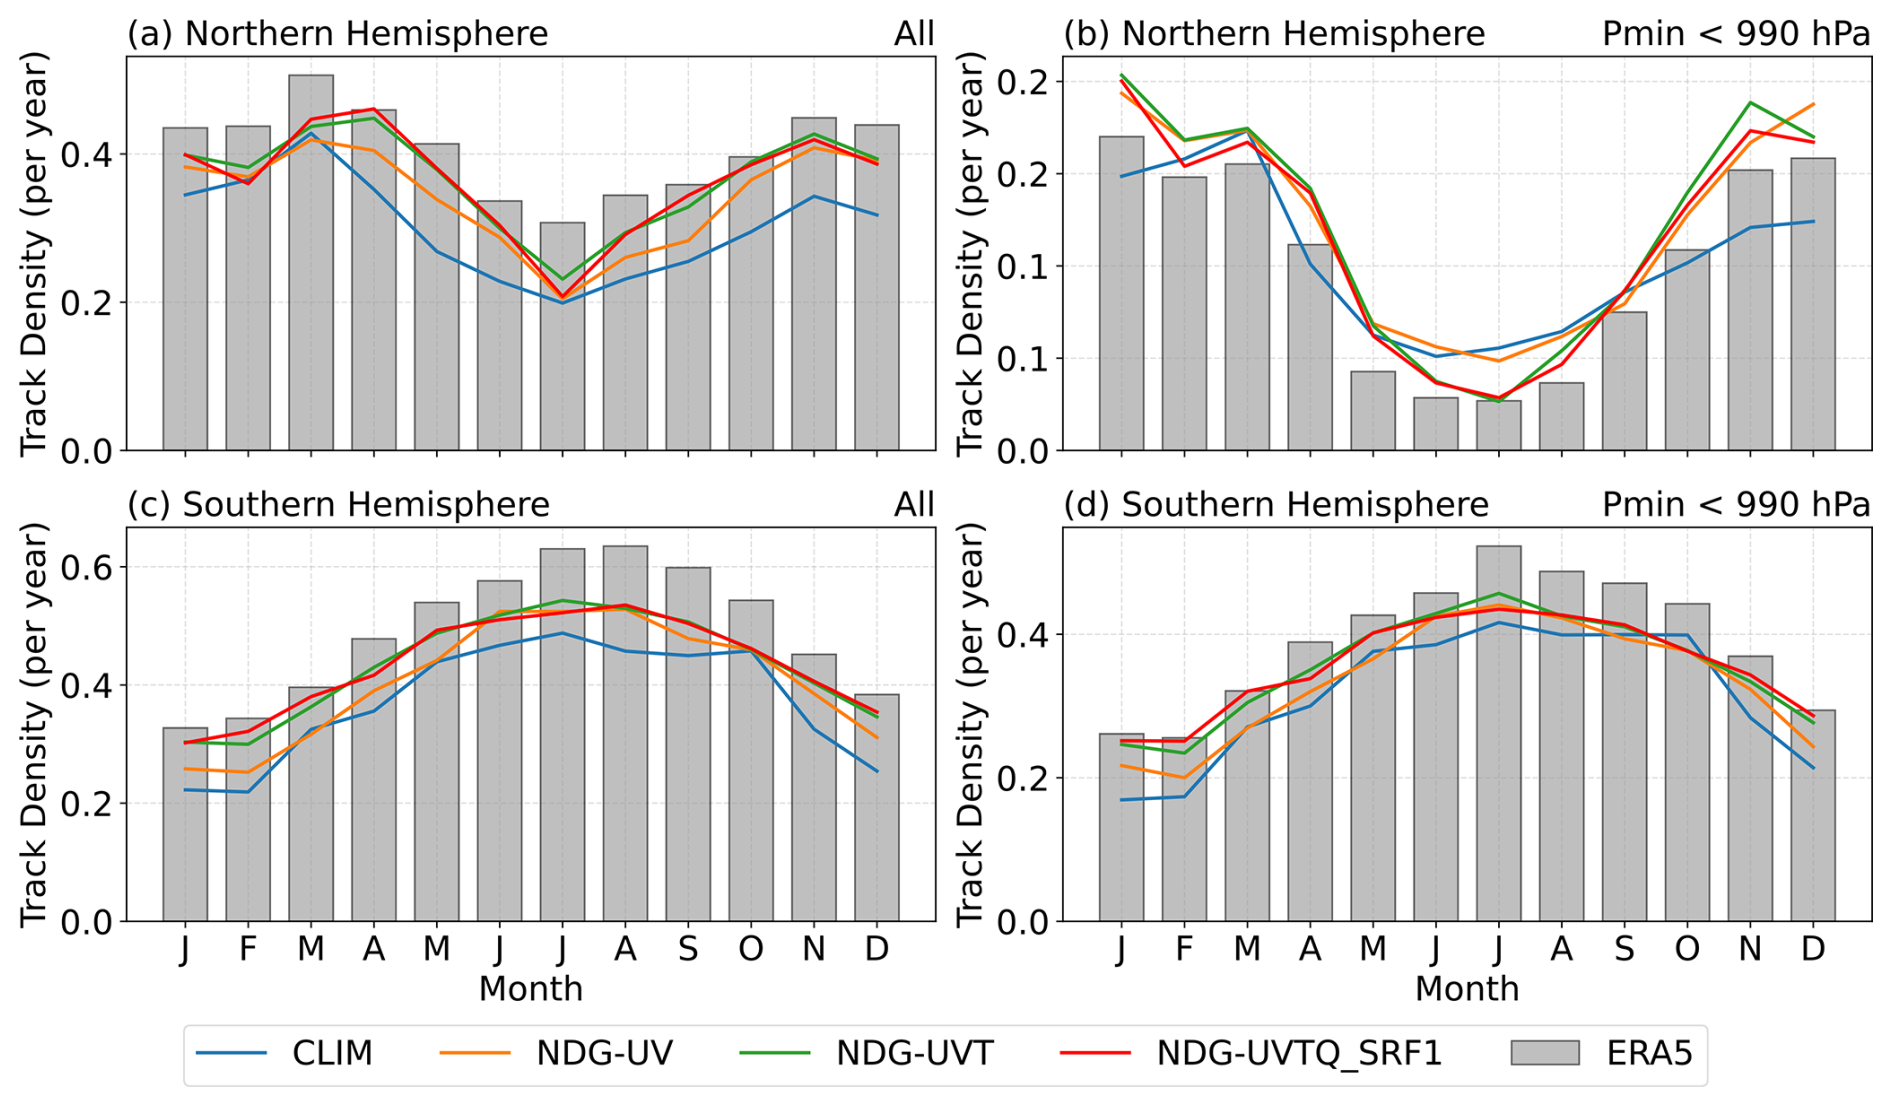
Figure 10Seasonal cycle of extratropical cyclone (ETC) track density averaged over the Northern Hemisphere (20–90° N) and Southern Hemisphere (20–90° S), based on ERA5 reanalysis and EAMv2 simulations during 2008–2017. Bars indicate the monthly climatology from ERA5, and colored lines represent individual model simulations. Two track definitions based on minimum sea-level pressure (Pmin) thresholds are shown: (a, c) all identified ETC-like vortices, and (b, d) intense ETCs with Pmin below 990 hPa. Cyclone detection is performed using the TempestExtremes algorithm (Ullrich et al., 2021), applied to 6-hourly sea-level pressure (PSL) fields. Candidate cyclone centers are first identified as local PSL minima enclosed by closed contours, defined as regions where PSL increases by at least 200 Pa within a 5.5° great-circle radius, following the --closedcontourcmd criterion in TempestExtremes. Tracks are constructed by linking features that travel no more than 9.0° per 6 h interval, with a minimum lifetime of 60 h and a maximum temporal gap of 18 h. Tropical cyclone-like vortices identified in Fig. 7 are excluded. Track density is computed by counting cyclone centers within 5°×5° grid cells and averaging over each hemisphere. Monthly values represent the total number of ETCs per month. Details of the EAMv2 simulations are provided in Table 1.
Further analysis of two additional high-impact weather phenomena, namely extratropical cyclones (ETCs) and atmospheric rivers (ARs), reveals that the benefits of the proposed nudging strategy extend beyond tropical cyclones. Figure 10 presents the seasonal cycle of ETC occurrence frequency and the subset of intense ETCs (defined as those with central pressure below 990 hPa), derived from TempestExtremes tracking of 6-hourly EAMv2 output from the experiments listed in Table 1. The results are averaged over the Northern (Fig. 10a and b) and Southern (Fig. 10c and d) Hemispheres, respectively, as defined according to the climatological distribution of extratropical cyclones (see Fig. C6). Relative to the free-running simulation (CLIM), wind nudging alone (NDG-UV) already brings PSL fields and storm-track characteristics closer to ERA5, reflecting the strong control of large-scale circulation on ETC statistics. However, further nudging of temperature and humidity (NDG-UVT and NDG-UVTQ) still produces additional – though generally modest – improvements in ETC statistics, especially for intense ETCs. Specifically, NDG-UVT and NDG-UVTQ reduce the overestimation of storm frequency during boreal summer (JJA) and correct the underestimation during boreal winter (DJF) in the Northern Hemisphere, while also partially mitigating the underrepresentation of intense ETCs in the Southern Hemisphere. These results highlight the influence of large-scale thermodynamic fields on ETC climatology and support the utility of full-field nudging for improving storm-track variability and extremes in low-resolution models.
In contrast to tropical cyclones (TCs) and extratropical cyclones (ETCs), atmospheric rivers (ARs) are characterized by large-scale water vapor transport governed by both wind and humidity fields – processes that EAMv2 is capable of explicitly resolving. A realistic representation of AR occurrence and its variability, therefore, requires accurate simulation of both dynamical and thermodynamic components. As shown in Fig. 11, the discrepancies in AR occurrences between the CLIM simulation and ERA5 across all major AR-active basins are systematically reduced as EAMv2 is incrementally constrained toward ERA5's wind, temperature, and humidity fields. Consistently, a systematic reduction in the biases of the long-term mean spatial distribution of AR frequencies is also observed across the nudged simulations (Fig. C7). Among the different nudging strategies, constraining humidity is shown to be particularly important for achieving realistic AR occurrence frequency and seasonal variability in GCMs like EAMv2, especially over the Northeast Pacific and North Atlantic regions.
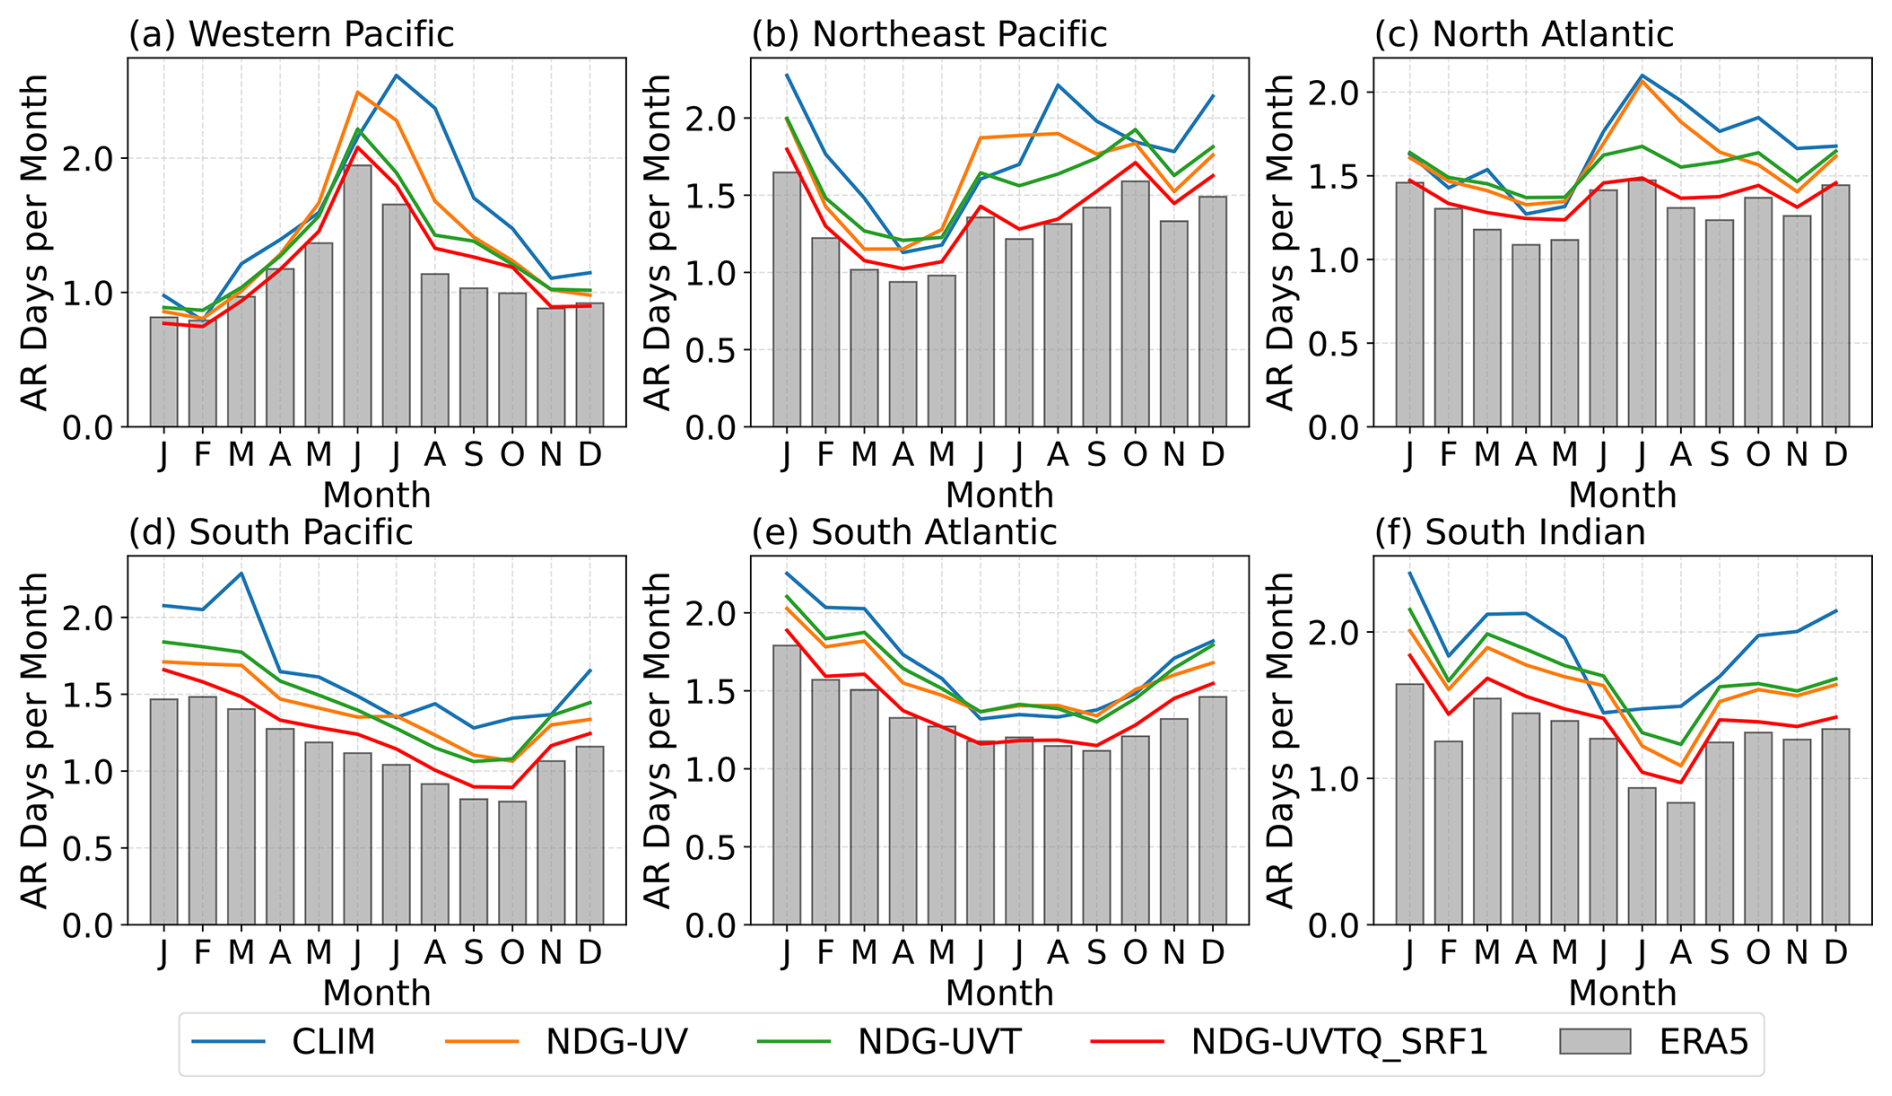
Figure 11Monthly climatology of atmospheric river (AR) occurrence frequency from ERA5 and EAMv2 simulations during 2008–2017, averaged over six ocean basins: Western Pacific, Northeast Pacific, North Atlantic, South Pacific, South Atlantic, and South Indian Ocean. Bars represent ERA5 reanalysis, and solid lines indicate model simulations. ARs are detected using the TempestExtremes algorithm (Ullrich et al., 2021), applied to 6-hourly vertically integrated moisture fluxes (TUQ and TVQ). Detection is based on the Laplacian of integrated vapor transport (IVT) magnitude, which highlights filamentary structures by identifying local maxima. Features are retained i km2, and the feature occurs equatorward of 75° latitude (). Basin definitions follow rectangular latitude–longitude domains adapted from Tier1 regions of the ARTMIP project (Rutz et al., 2019), and are defined as follows: Western Pacific (0–45° N, 120–180° E), Northeast Pacific (20–60° N, 180–240° E), North Atlantic (20–60° N, 270–330° E), South Pacific (60–20° S, 160–240° E), South Atlantic (60–20° S, 300–360° E), and South Indian Ocean (50–20° S, 40–120° E). A detailed description of the EAMv2 simulations is provided in Table 1.
Overall, the results in this section indicate that the nudged EAMv2 simulations, particularly those incorporating additional humidity nudging as proposed in this study, substantially improve the model's representation of large-scale environmental conditions associated with high-impact weather systems. By conducting a series of hindcast simulations in which wind, temperature, and humidity fields are incrementally constrained toward observations, we are able to isolate and assess the contributions of dynamic and thermodynamic biases to the simulated large-scale environment relevant for tropical cyclone development. Comparisons between simulations with and without humidity nudging further underscore the critical role of large-scale moisture fields in capturing the seasonal variability of high-impact weather phenomena – including tropical cyclones, extratropical cyclones, and atmospheric rivers – in low-resolution GCMs. These findings demonstrate that the proposed nudging strategy offers an observationally constrained framework that minimizes disruption to the model's physical balances, supporting the study of extreme atmospheric events and aligning with the objectives emphasized in Wehrli et al. (2022).
This study presents an improved nudging strategy for the E3SM Atmosphere Model version 2 (EAMv2), extending the commonly used wind-field nudging (U, V) to also include temperature (T) and humidity (Q) constraints. The revised formulation modulates nudging tendencies in the upper and lower atmosphere based on pressure and boundary-layer height, thereby reducing artificial distortions near the model top and surface. We evaluate this approach through a suite of atmospheric hindcast experiments with EAMv2, forced by observed sea surface temperature and sea ice concentrations. In these experiments, where U, V, T, and Q were selectively nudged toward ERA5 reanalysis, the strategy enables effective thermodynamic nudging while better preserving internal physical balances and limiting spurious distortions in key simulated fields, including precipitation and radiative fluxes.
Our results show that simultaneous nudging of wind, temperature, and humidity significantly improves the fidelity of the simulated large-scale thermodynamic state. Compared to wind-only or wind-and-temperature nudging, the inclusion of humidity constraints reduces biases in total precipitable water, outgoing longwave radiation, and precipitation. These improvements are particularly pronounced in tropical regions, where realistic moisture fields are essential for capturing convective processes and precipitation variability. Previous studies have reported that nudging temperature and humidity can degrade the hydrological cycle in EAM simulations (Sun et al., 2019), underscoring the challenge of applying thermodynamic constraints without disrupting dynamical and thermodynamic balances. The revised nudging strategy introduced here addresses this issue by objectively limiting the influence of nudging to levels above the time-varying top of the planetary boundary layer (PBL), allowing near-surface processes to respond freely to local conditions. This approach enables effective large-scale constraints while supporting a more realistic representation of the hydrological cycle.
Furthermore, we find that extending nudging to include surface-layer variables enhances land–atmosphere coupling and improves agreement with ERA5 reanalysis for surface-related processes. This extension reduces the spurious impacts of humidity nudging on longwave radiative fluxes and precipitation, highlighting the value of surface constraints in complementing upper-atmosphere nudging while minimizing disruption to the model's intrinsic physical relationships. Meanwhile, compared to NDG-UVTQ, the additional surface-layer nudging in NDG-UVTQ_SRF1 provides only limited benefits for large-scale dynamical features such as moisture convergence. This distinction suggests that the primary improvements in surface diagnostics result from a more accurate representation of the large-scale thermodynamic state, rather than from direct corrections to surface-layer dynamics. Moreover, we note that nudging temperature and humidity toward reanalysis can influence clouds, radiation, and precipitation by modifying how the model physics responds to the large-scale state (see discussion in Sect. 4.2). Although a full investigation of these interactions is beyond the scope of this study, they likely arise in part because many parameterizations were tuned within the biased mean state of the free-running control simulation, whose performance can be suboptimal when the system is subsequently operated under a nudging configuration. Future work using carefully designed experiments, including “nudging-to-climatology” frameworks as demonstrated by Zhang et al. (2022), will be important for developing a process-level understanding of these sensitivities and for clarifying how temperature and humidity nudging affects the model’s internal physical consistency, thereby informing parameter tuning in future E3SM model development.
Beyond the evaluation of long-term mean model biases, the improved nudging strategy enhances EAMv2's ability to represent large-scale environmental conditions associated with high-impact weather systems. By conducting a series of nudged simulations that progressively constrain subsets of model state variables (U, V, T, and Q), we can assess the relative contributions of dynamical and thermodynamic processes to model biases in key diagnostic fields, such as the Genesis Potential Index (GPI), which is closely linked to tropical cyclone (TC) development. The results show that both dynamical (e.g., vertical wind shear) and thermodynamic (e.g., potential intensity, mid-tropospheric humidity) factors contribute to GPI biases. In particular, realistic thermodynamic conditions are found to be essential for capturing the seasonal evolution of GPI, underscoring their importance in representing the variability of large-scale environmental conditions associated with TCs. These findings further extend to the simulation of other high-impact phenomena, including the seasonal variability of atmospheric rivers and extratropical cyclone activity. Collectively, these results demonstrate that effective temperature and humidity nudging offers a valuable approach for studying extreme weather events in global models, particularly those with limited horizontal resolution where such events must be inferred from large-scale storm environments. We also note that the performance of the nudging strategy based on Eq. (4) may exhibit some sensitivity to choices of P0, Zb, and τ, as discussed in Sect. 2.2 and 2.3. However, both exploratory tests and the physical arguments outlined above indicate that the main conclusions of this study are not dependent on the specific values adopted here.
Watt-Meyer et al. (2021) reported that nudging specific humidity in hindcast simulations induced a drying effect in the atmospheric column, which in turn suppressed surface precipitation. When these simulations were subsequently used to train a machine learning (ML) bias-correction method, the ML-predicted humidity corrections reproduced the same drying tendency, ultimately degrading precipitation performance. These results illustrate the risk that humidity nudging may inadvertently alter the model's mean state and physical balances, thereby reducing the reliability of ML models trained on such data. In contrast, as shown in Sect. 4, the humidity-nudging formulation introduced here avoids such impacts on the hydrological cycle and instead improves hindcast skill for precipitation. By better preserving thermodynamic and hydrological consistency, this approach provides nudged hindcast data that offer a more robust foundation for training ML-based bias-correction methods, including those proposed by Watt-Meyer et al. (2021).
Overall, the proposed approach enables more accurate and consistent hindcasts, supporting applications ranging from model evaluation to the generation of training datasets for machine learning. Future efforts should explore the retuning of microphysical parameterizations for use in nudged configurations and assess the generality of these findings across other model resolutions and Earth system components.
The Genesis Potential Index (GPI) proposed by Emanuel (2004) provides a quantitative measure of the favorable environmental conditions for tropical cyclone genesis. It combines contributions from absolute vorticity, mid-level humidity, potential intensity, and vertical wind shear as follows:
where η is the absolute vorticity at 850 hPa (s−1), RH is the relative humidity at 600 hPa (in %), Vpot is the potential intensity (m s−1), and Vshear is the magnitude of the vertical wind shear between 850 and 200 hPa (m s−1). The constants are chosen to nondimensionalize the variables and appropriately scale the index.
Table B1List of physical quantities used for diagnostics in Figs. 4 and C2. The fifth column lists the reference datasets used to derive the error metrics, primarily sourced from ERA5 reanalysis (Hersbach et al., 2020), GPCP (Version 2.3; Adler et al., 2003), and CERES_EBAF (Version 4.1; Kato et al., 2018). Note that all diagnostic variables are directly saved in the E3SM model output, except that STRESS_MAG is computed as , where TAUX and TAUY are the zonal and meridional surface wind stress components from the model output, respectively.
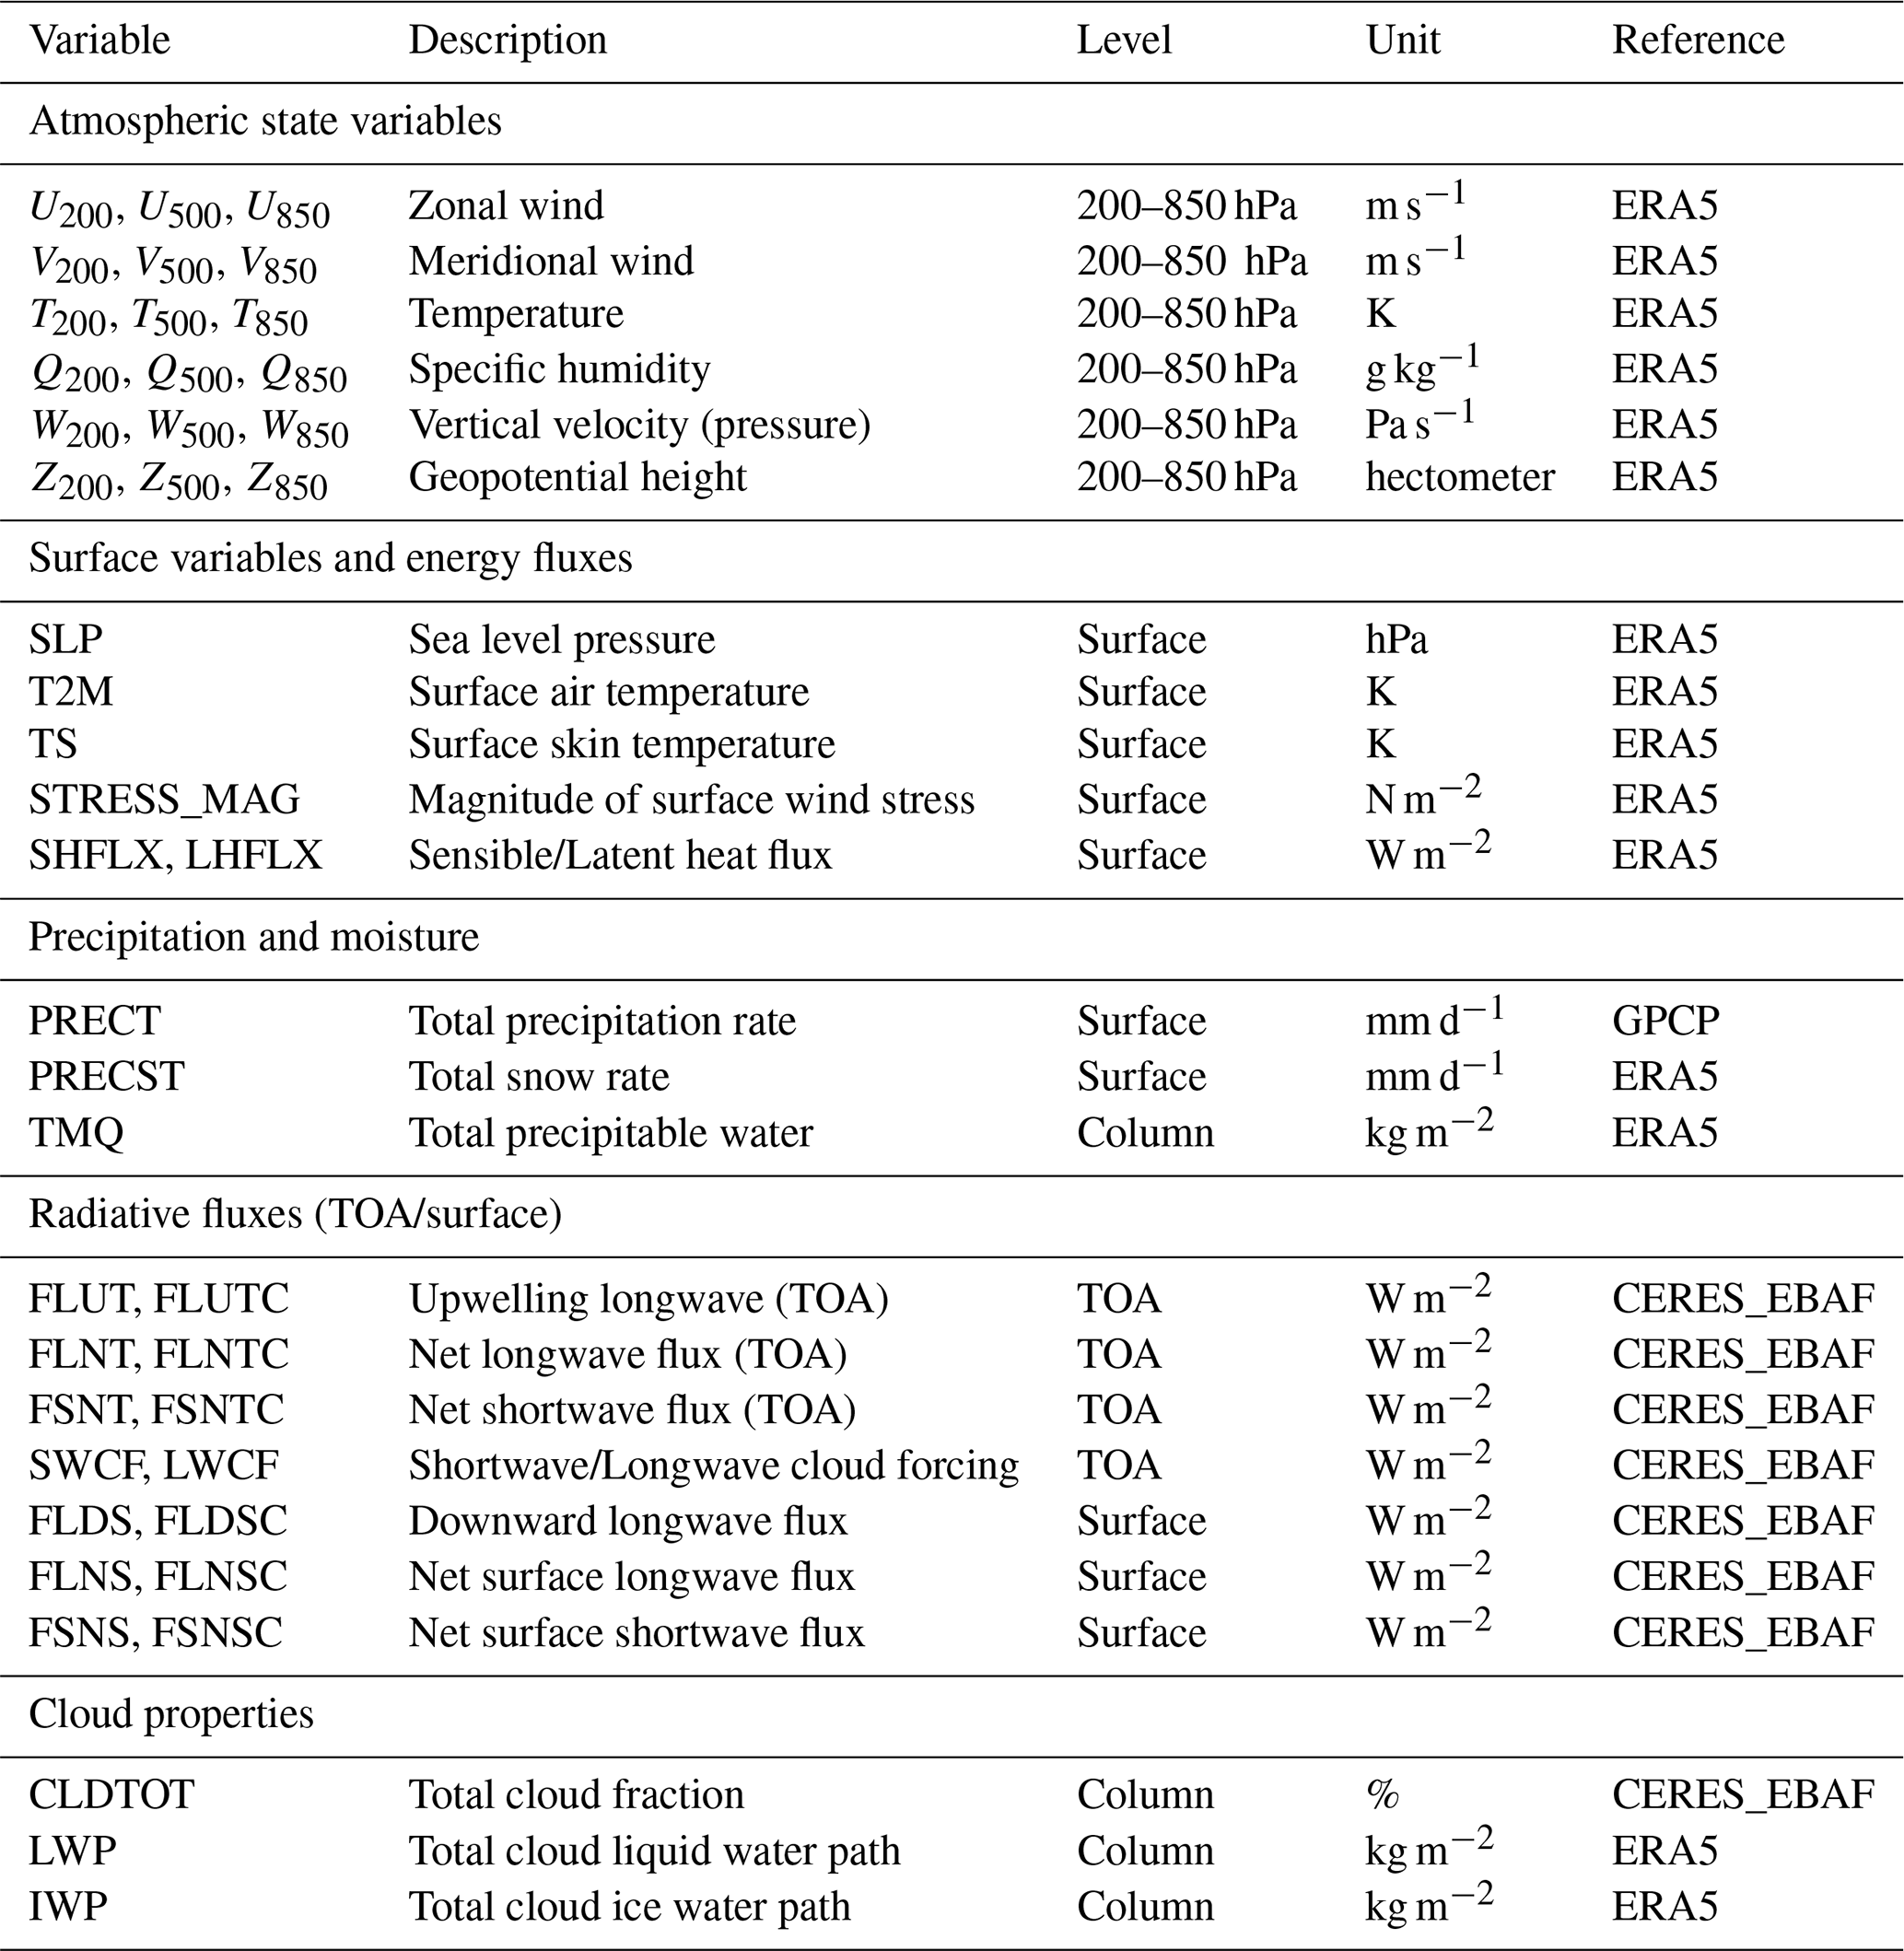
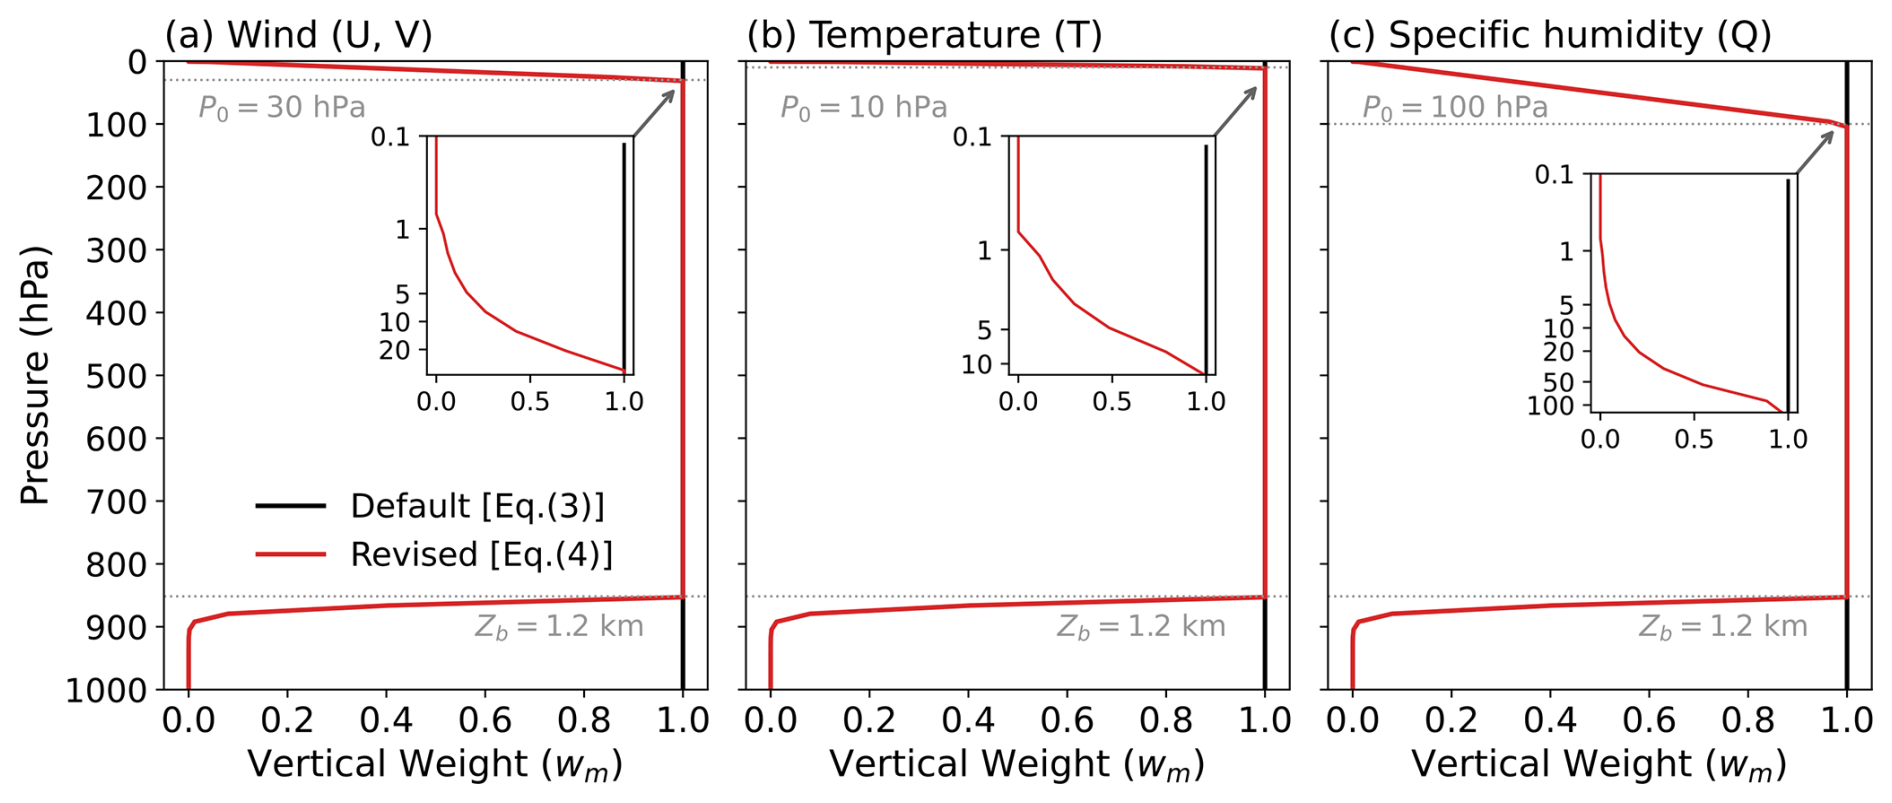
Figure C1Schematic illustration of the vertical weighting functions used for nudging in EAMv2. Panels show the weights from the default scheme with Eq. (3) (black lines) and the revised scheme with Eq. (4) (red lines) as functions of hybrid-pressure model levels for (a) winds (U, V), (b) temperature T, and (c) specific humidity Q. The revised formulation applies a linear taper above a variable-dependent pressure threshold P0 (gray line) and weakens nudging within the planetary boundary layer (PBL) below Zb=1.2 km (dashed gray line), while retaining full nudging in the free troposphere. The inset panels provide a zoomed view of the upper-atmosphere (log-pressure scale), showing only the region above P0 and illustrating how the nudging smoothly approaches zero aloft. The values of P0 used for U, V, T, and Q are identical to those listed in Table 2. The schematic was generated by evaluating Eqs. (3)–(4) on the E3SM hybrid-pressure vertical coordinate under a standard-atmosphere profile (surface pressure 1000 hPa and temperature 280 K). We note that the figure is based on a single grid point; qualitatively similar vertical profiles would be obtained elsewhere, although the detailed shape can vary to some extent with spatial and temporal variations in Zb. More detailed discussion of the nudging formulation and the implications of the vertical weighting scheme is provided in Sects. 2.2 and 4.1, respectively.
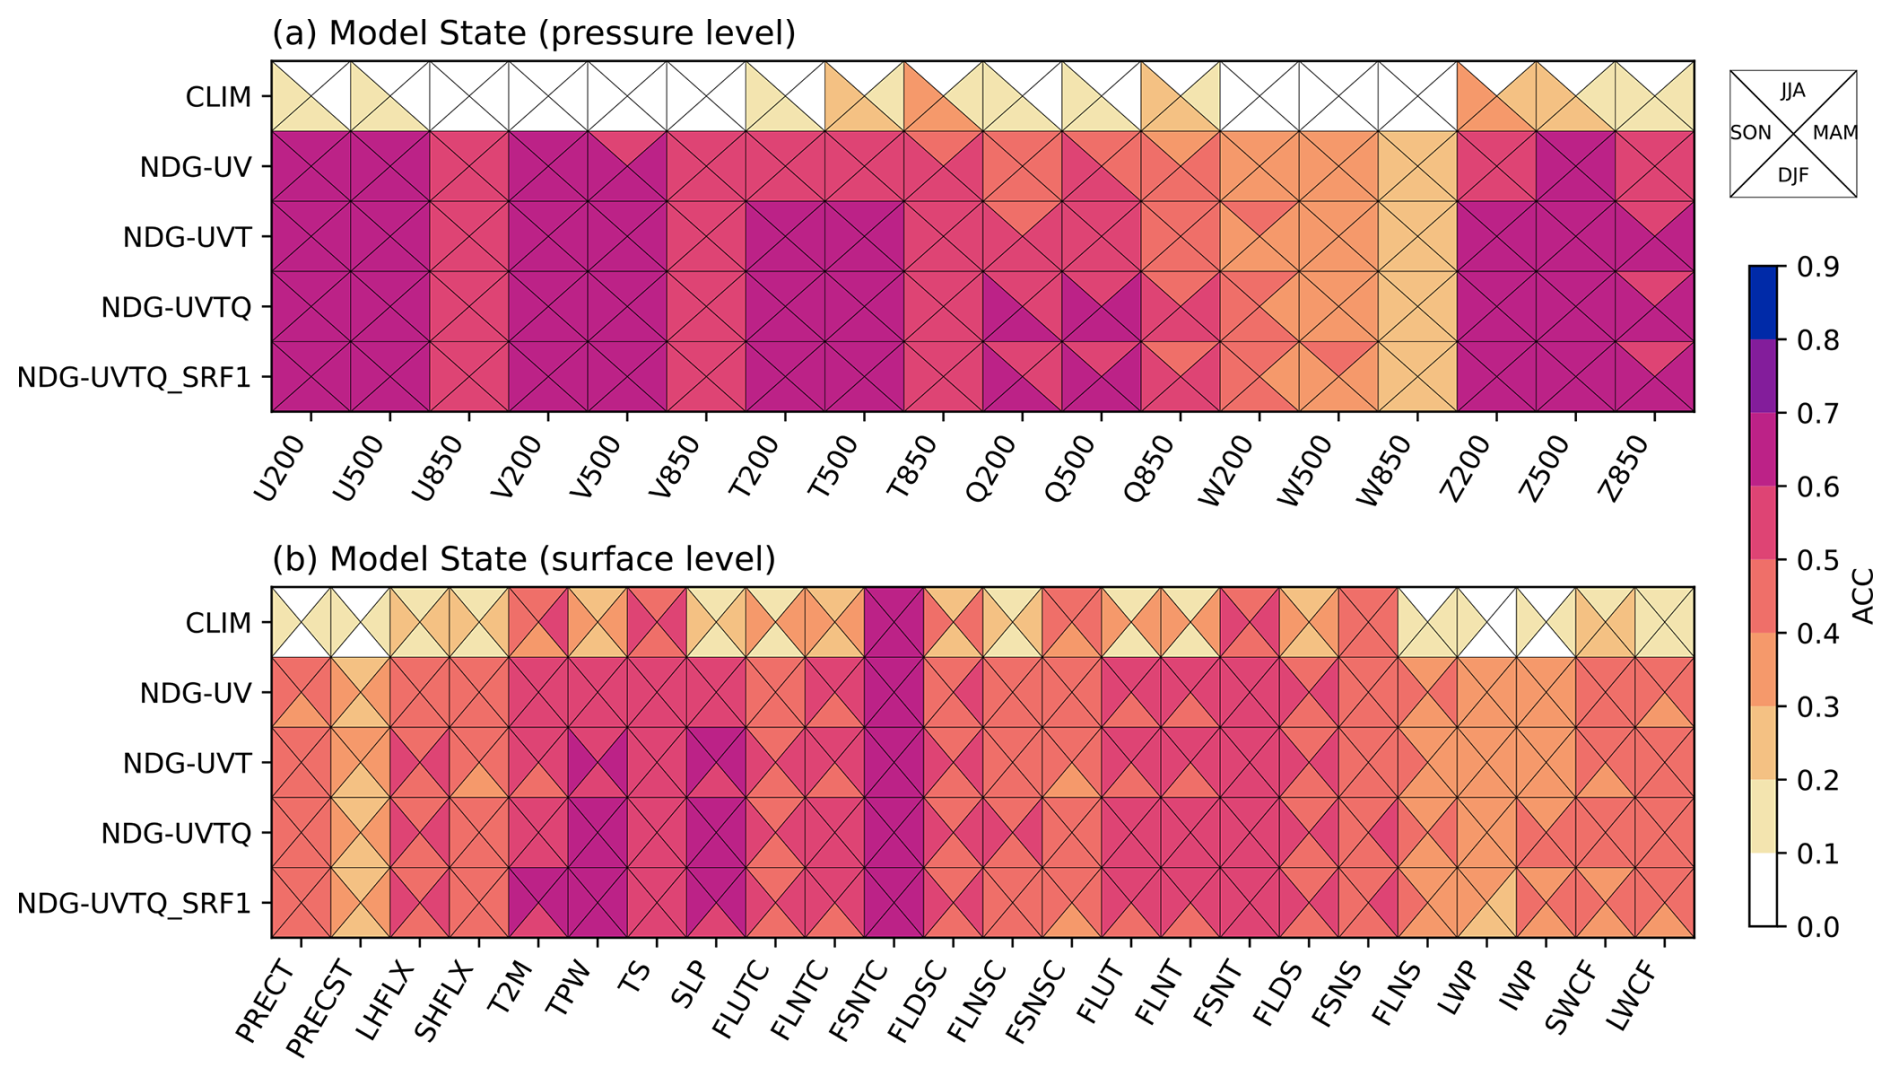
Figure C2Same as Fig. 4, but for anomaly correlation coefficients (ACC) between observations and EAMv2 simulations listed in Table 1. Seasonal anomalies were computed by subtracting the time-mean climatology at each grid point from both model and observational data. Pearson correlation coefficients were then calculated across time at each location to obtain a gridded ACC field. These values were weighted by the cosine of latitude and averaged globally to produce a single ACC per variable and experiment, shown in the figure. Definitions of the physical quantities and their corresponding reference datasets are provided in Table B1. Details of the EAMv2 simulations are summarized in Table 1.
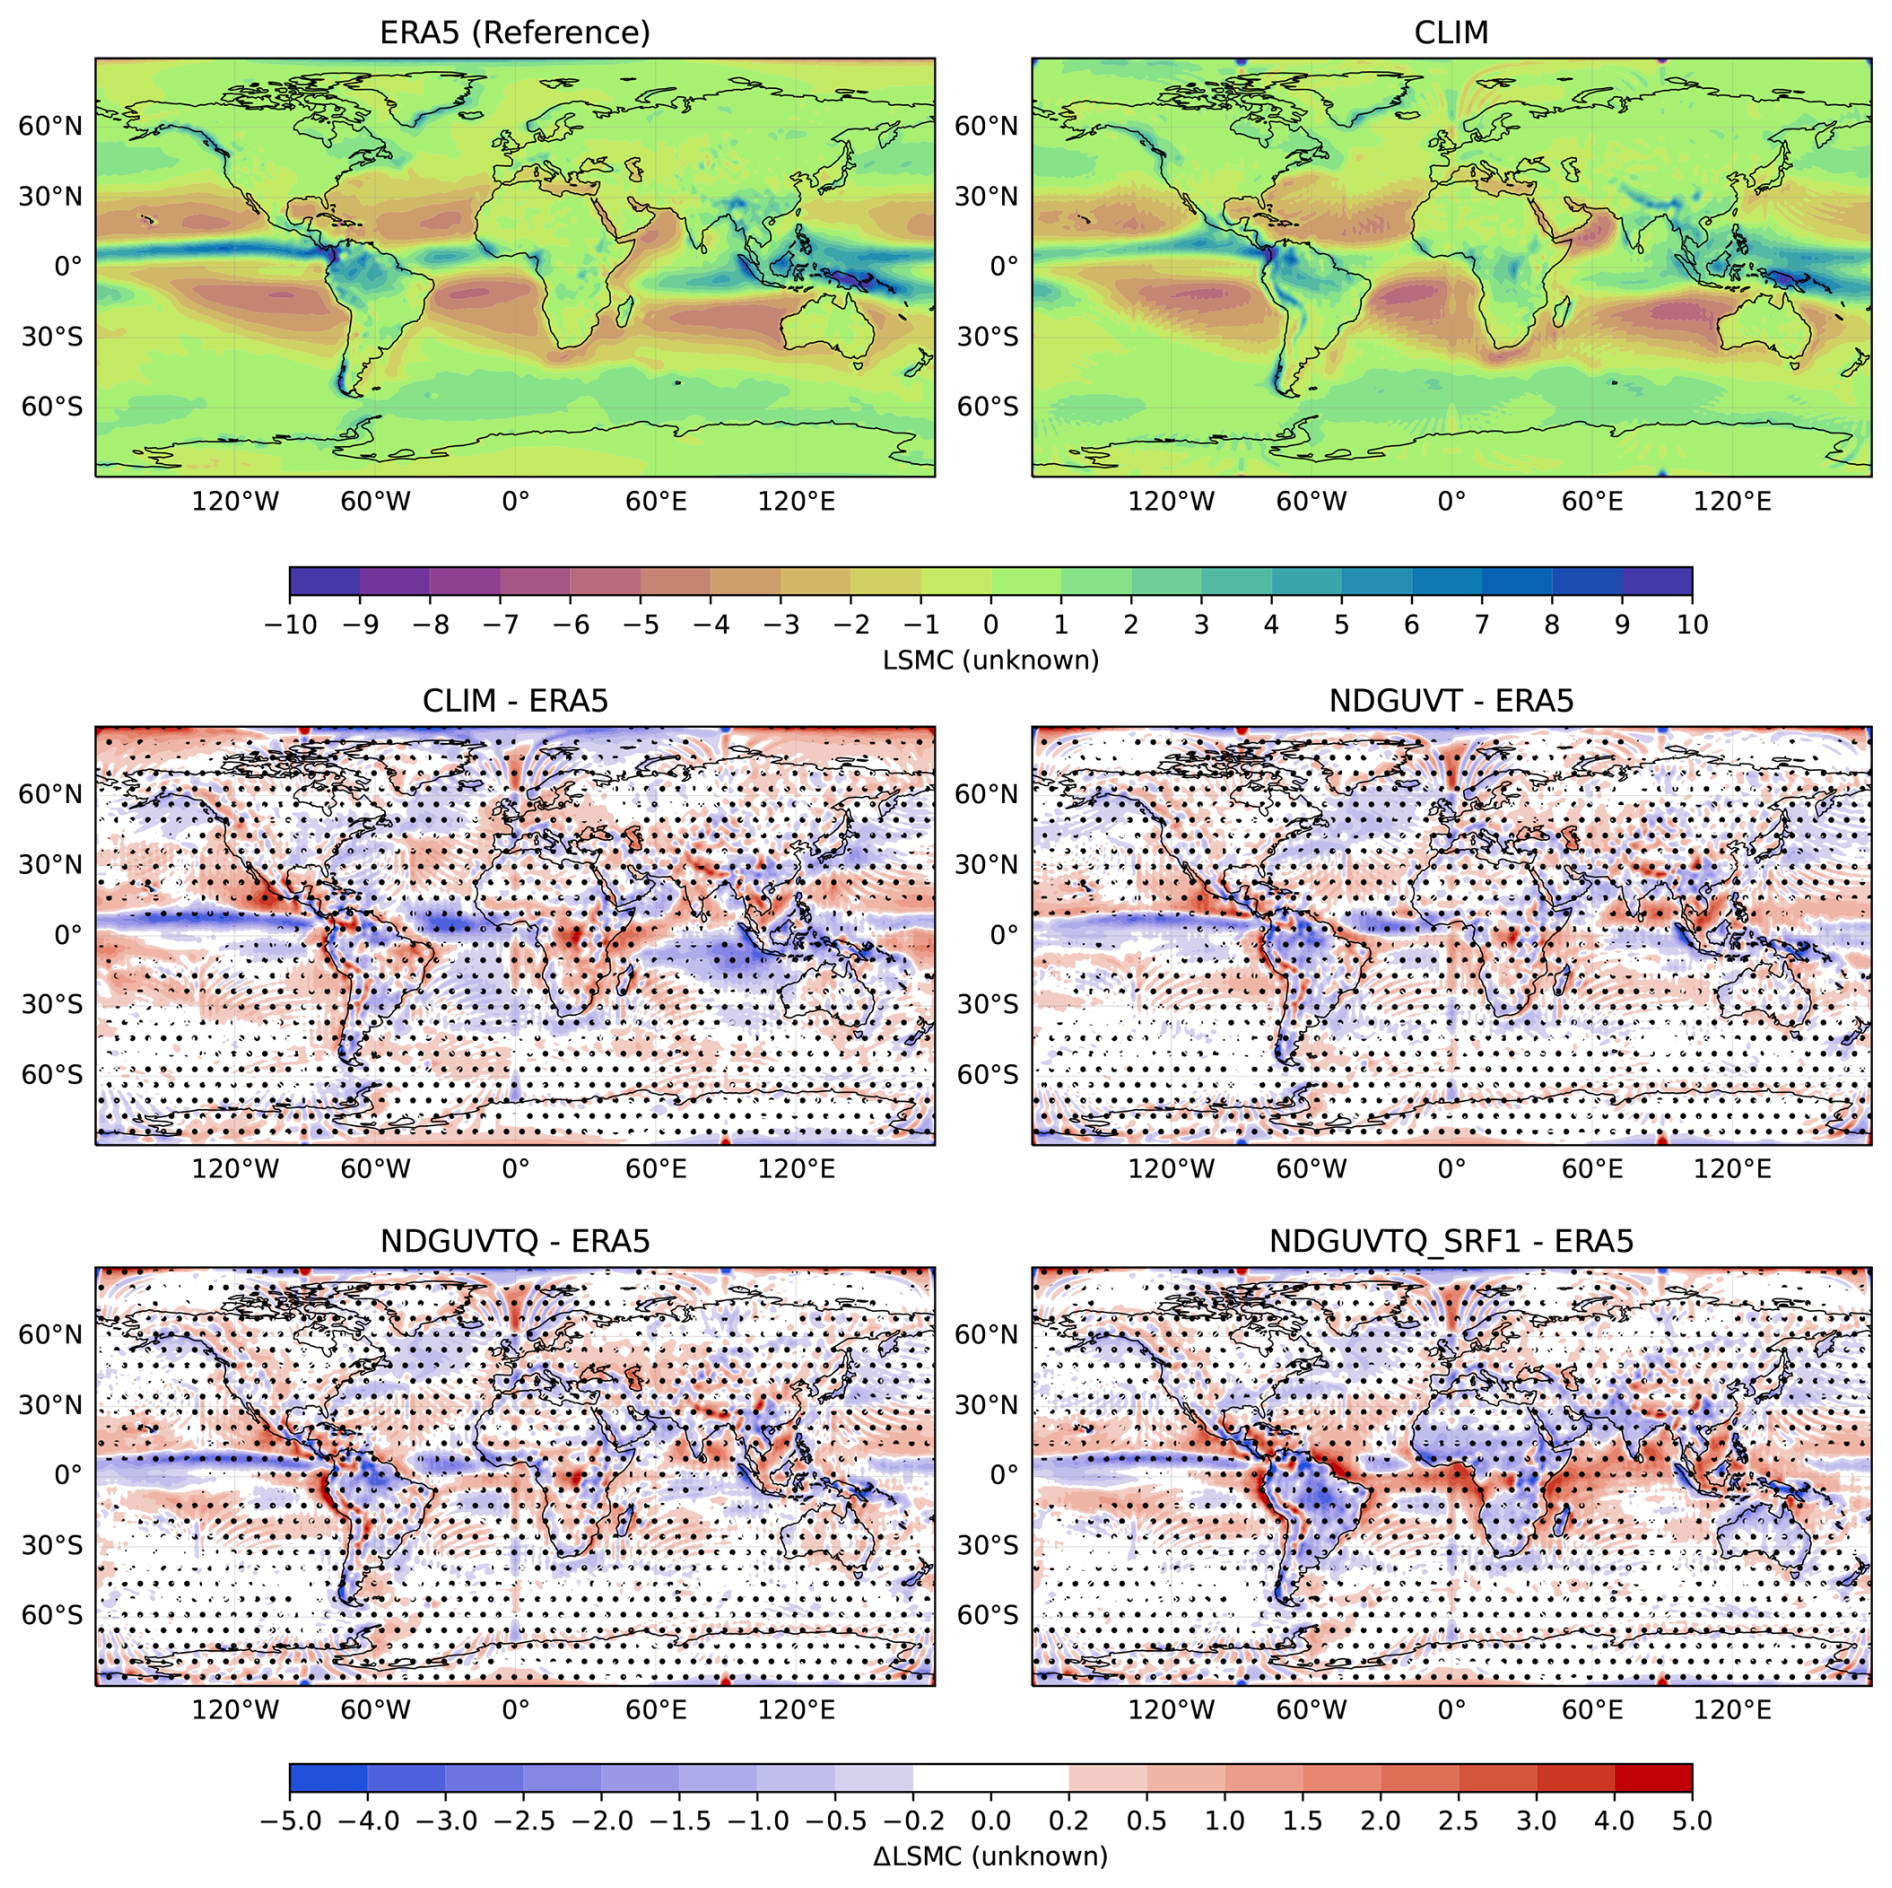
Figure C3Spatial patterns of annual mean large-scale moisture convergence (LSMC) and differences between EAMv2 simulations and observations, averaged over the 10 years from 2008 to 2017. Panels (a) and (b) how annual mean LSMC from ERA5 (reference) and CLIM simulation using EAMv2, respectively. Panels (c) and (f) show differences in annual mean LSMC between the reference and CLIM or nudged model experiments, where positive values indicate greater moisture convergence in the model relative to ERA5. LSMC was derived from vertically integrated zonal and meridional moisture fluxes at a 6-hourly frequency. After derivation, a 1° Gaussian filter was applied to the spatial fields to reduce noise. The 6-hourly LSMC was then averaged over each year to obtain a 10-year climatological mean. Stippling indicates grid points where model–reference differences are statistically significant at the 95 % confidence level based on a two-sided Student's t test. Details of the EAMv2 simulations are summarized in Table 1.
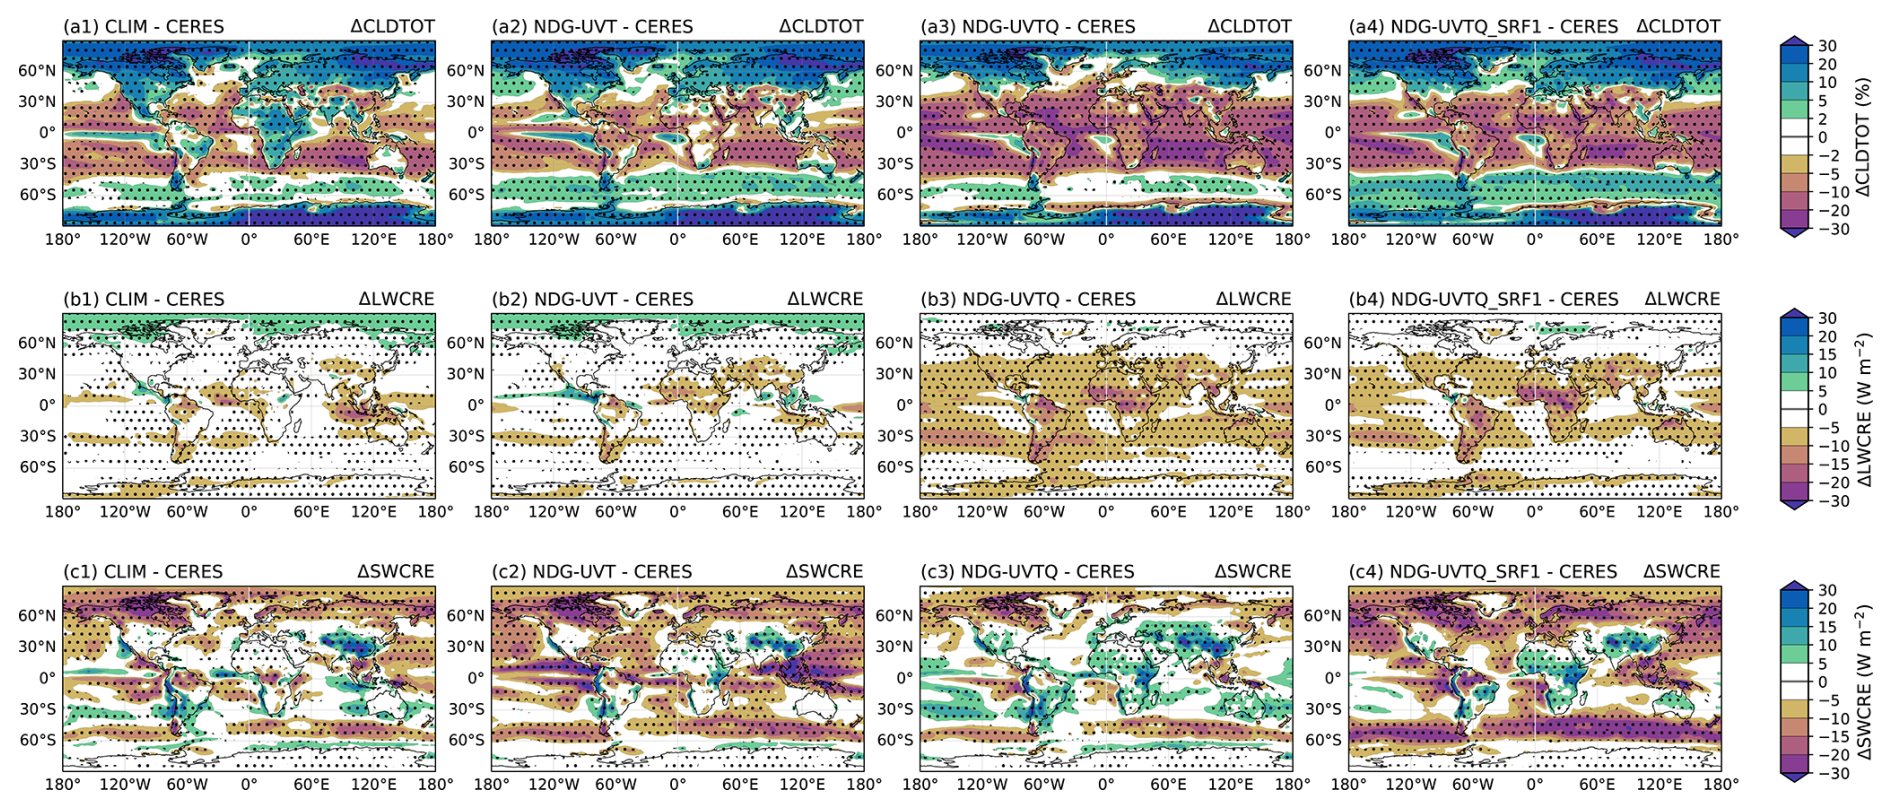
Figure C4Same as Fig. 6, but for horizontal distribution of annual mean model biases in total cloud fraction (CLDTOT, units: %; a1–a3), shortwave cloud radiative effect (SWCRE, units: W m−2; b1–b3), and longwave cloud radiative effect (LWCRE, units: W m−2; c1–c3), averaged over the period 2008–2017. Details of the simulation setups are provided in Table 1.
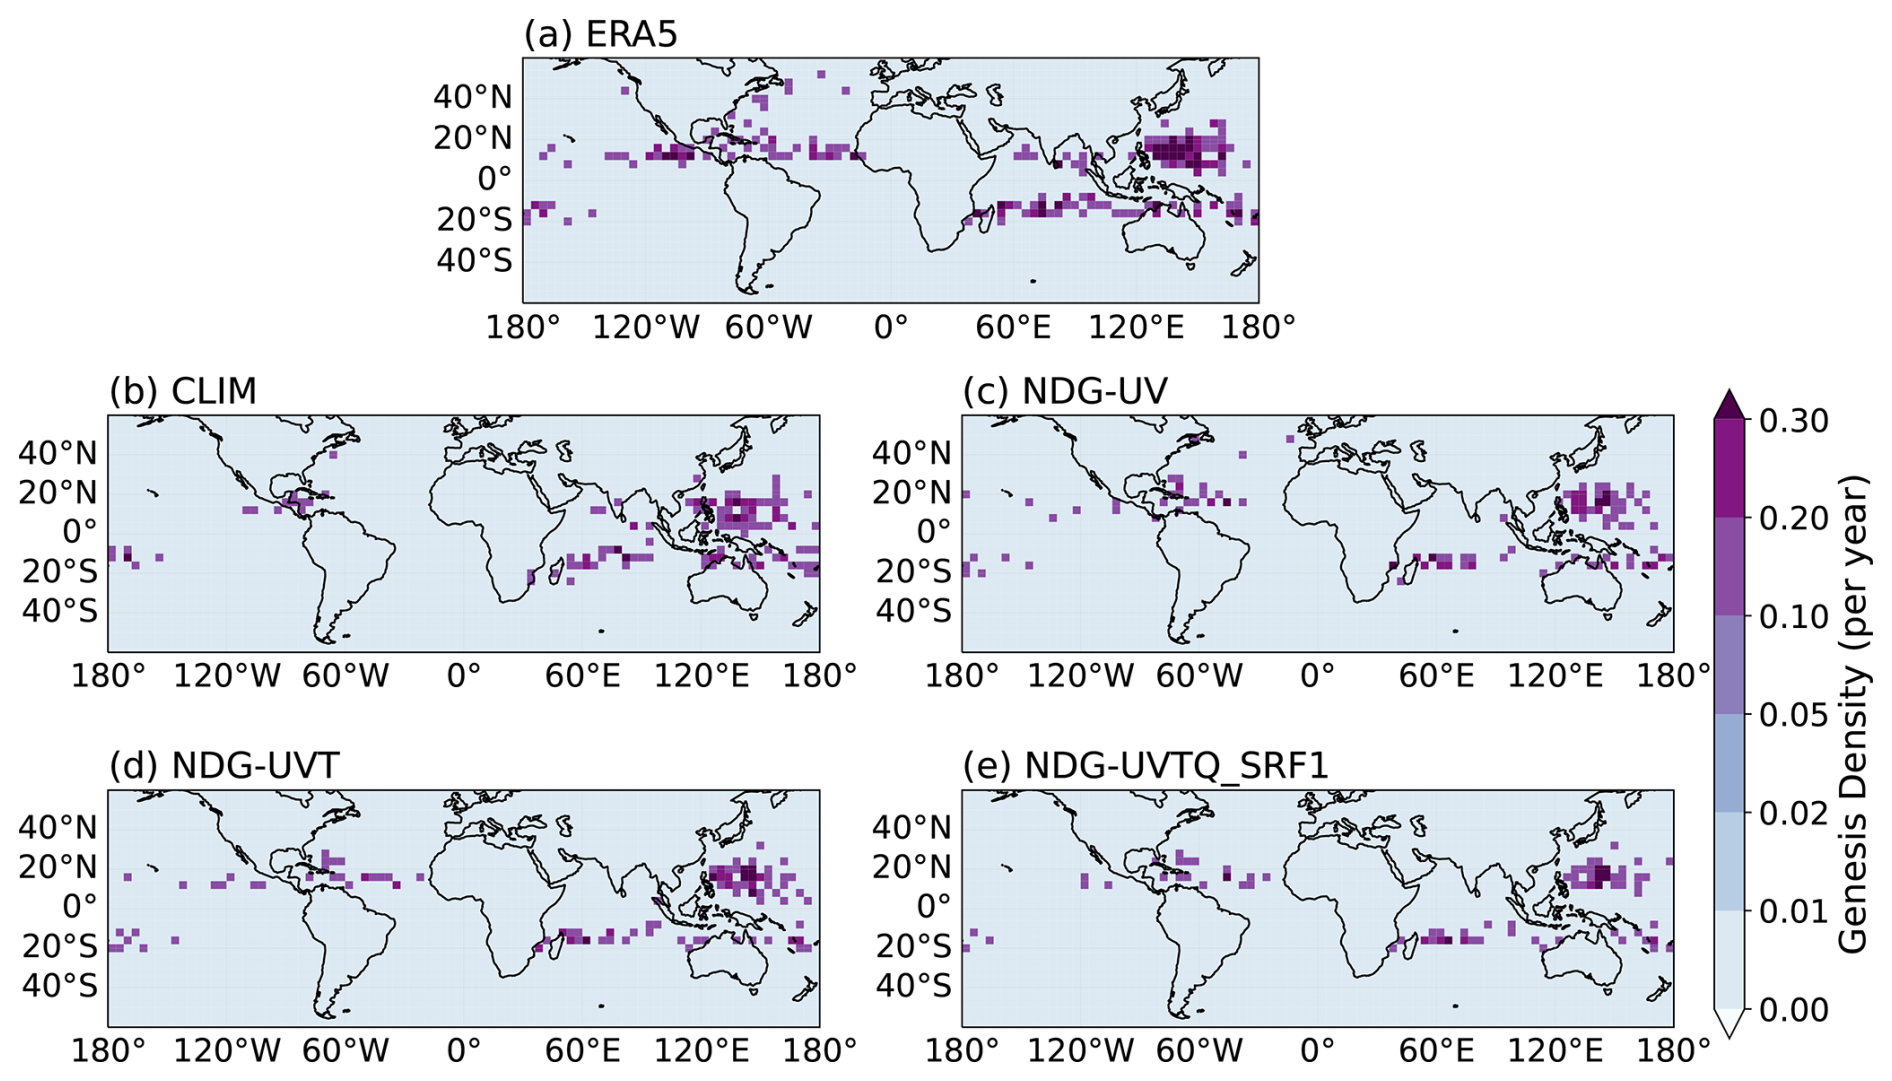
Figure C5Same as Fig. 7, but for tropical cyclone genesis densities tracked by TempestExtremes using ERA5 and E3SM simulations over the period 2008–2017. Cyclone genesis is defined as the first point along each storm track that meets the detection criteria. A detailed description of the EAMv2 simulations is provided in Table 1.
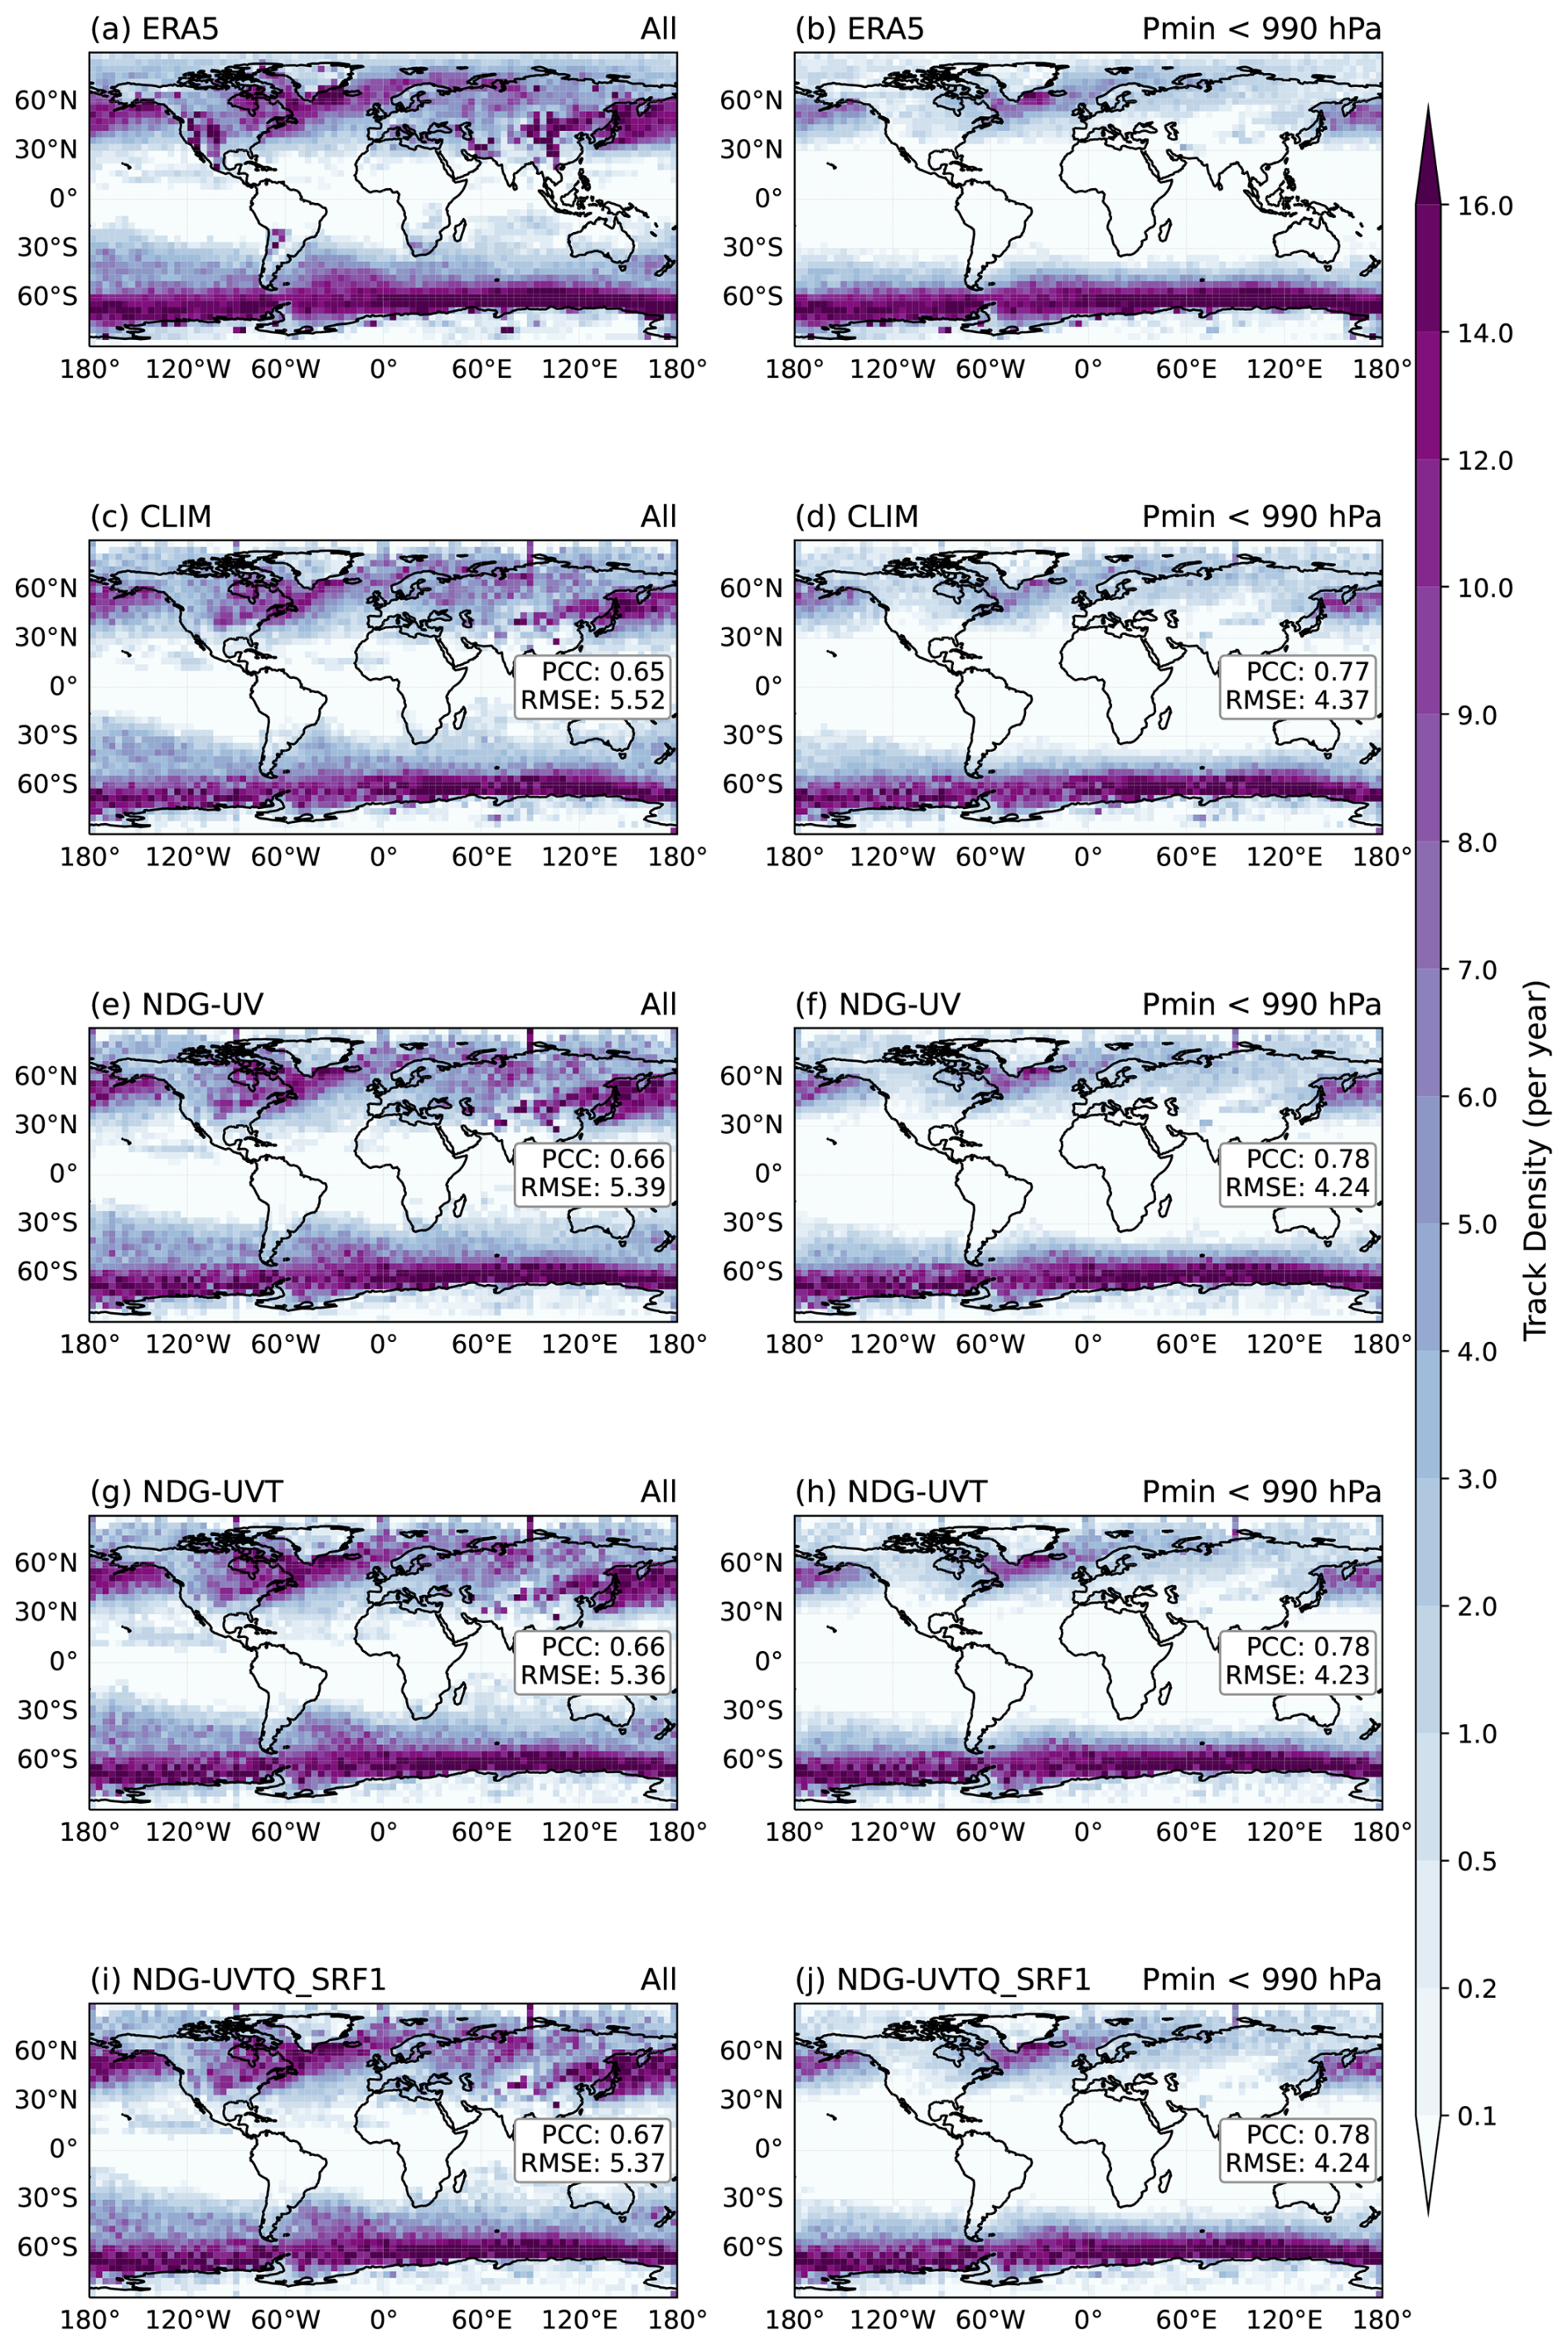
Figure C6Climatological spatial distribution of extratropical cyclone (ETC) track density from ERA5 reanalysis and EAMv2 model simulations during 2008–2017. Each panel shows the mean annual ETC track density (number of cyclones per 4°×4° grid box per year), with ERA5 shown in the top row and model biases (simulation minus ERA5) in subsequent rows. Results are based on TempestExtremes tracking using two criteria: (a, c, e, g, i) all identified ETC tracks and (b, d, f, h, j) tracks with minimum sea-level pressure (Pmin) below 990 hPa. All tropical-cyclone-like vortices, as shown in Fig. 7, were excluded from ETCs. Colored contours represent cyclone density, and pattern correlation (PCC) and root-mean-square error (RMSE) statistics relative to ERA5 are annotated in each model panel. A detailed description of the EAMv2 simulations is provided in Table 1.
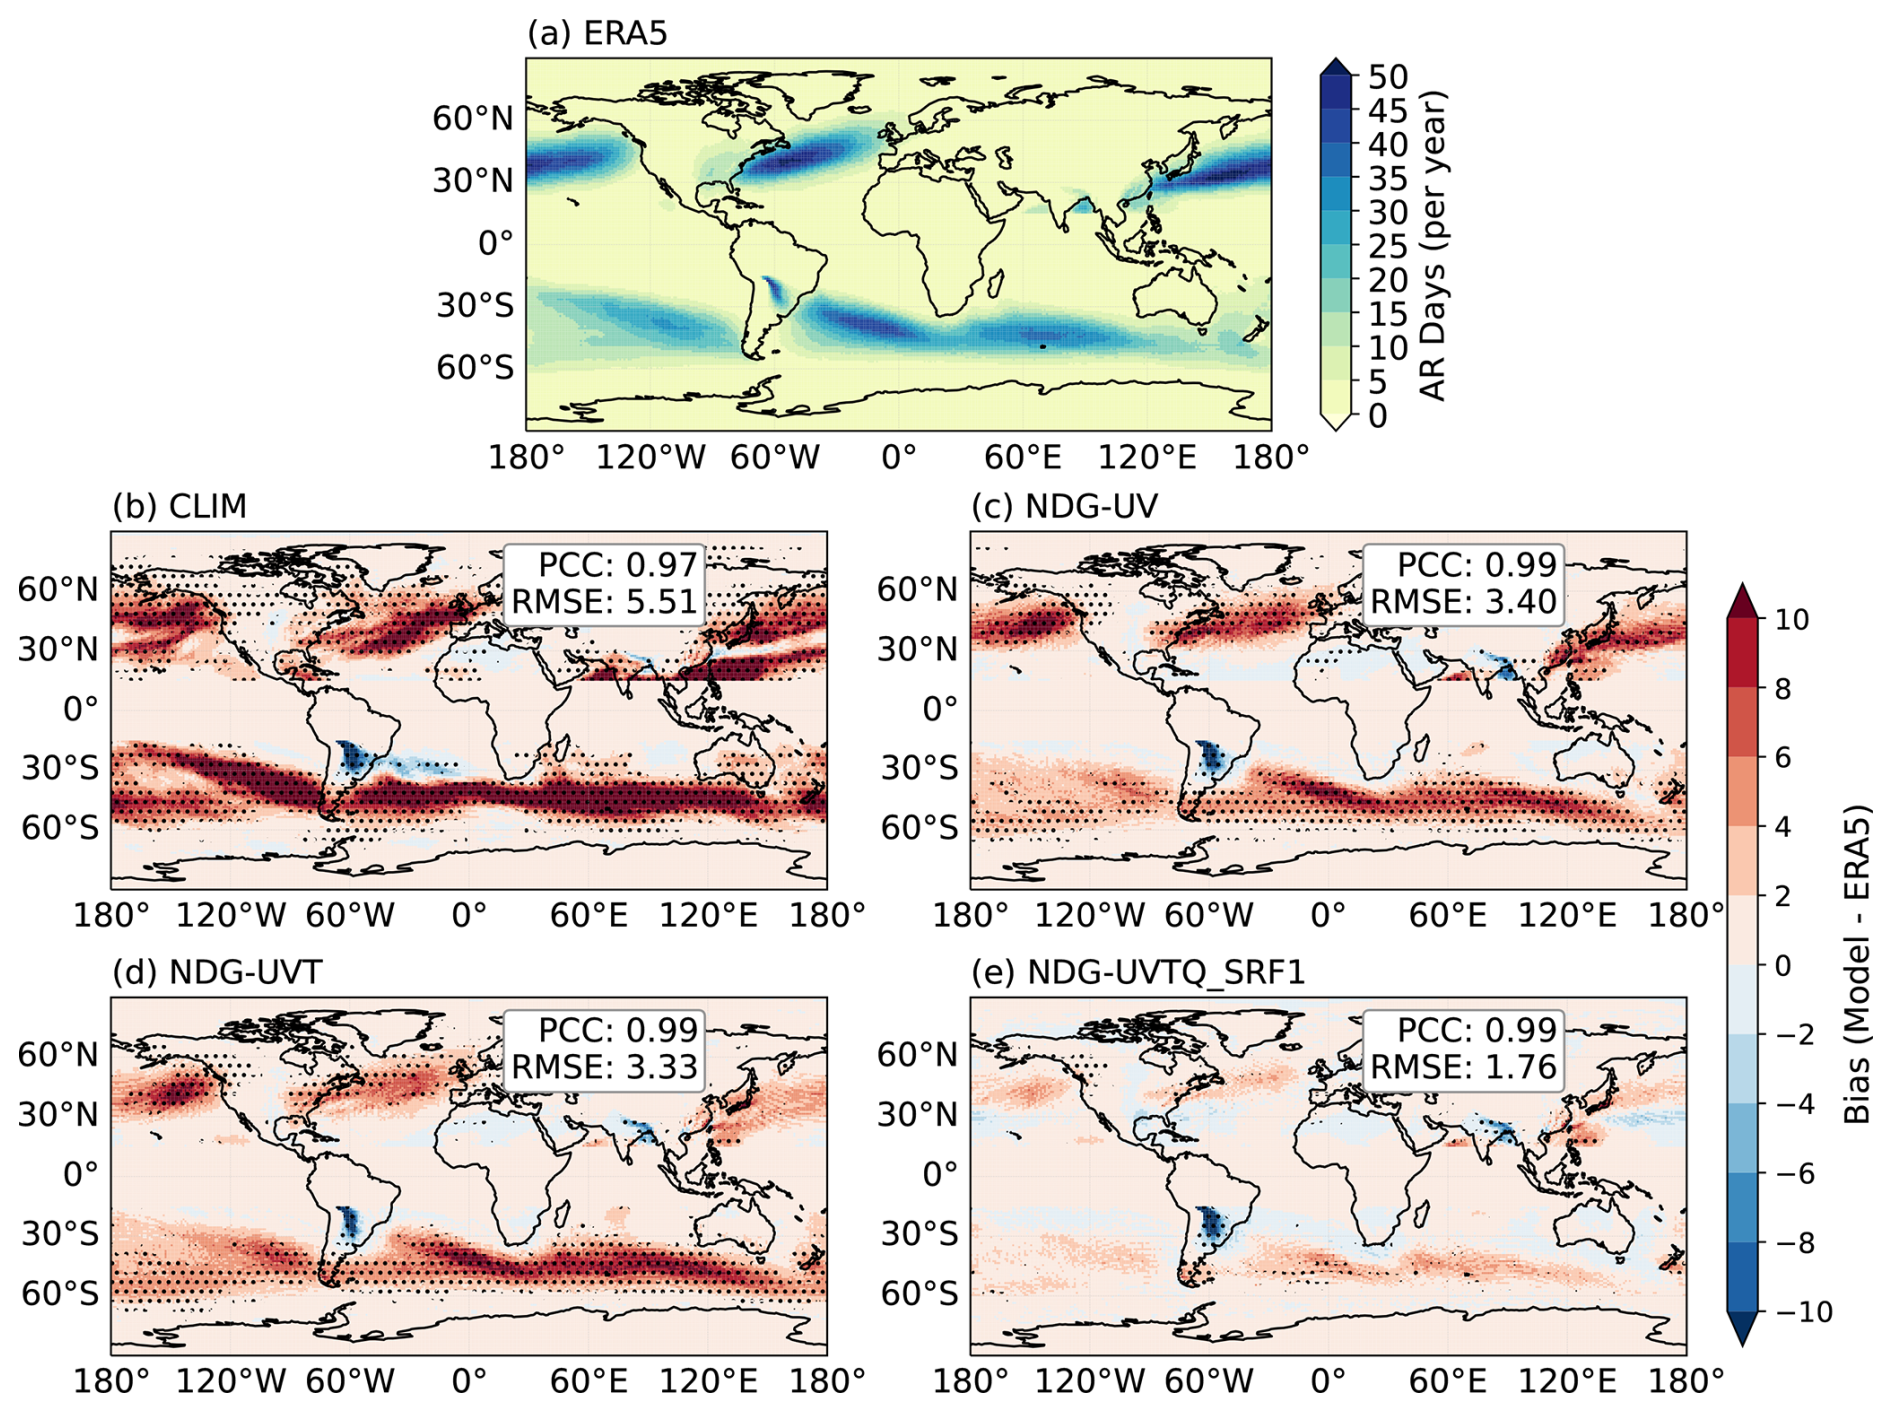
Figure C7Climatological annual mean atmospheric river (AR) occurrence frequency from ERA5 and EAMv2 simulations during 2008–2017. The top panel shows the ERA5 reference in AR days per year, and the lower panels show model biases (model minus ERA5). Stippling indicates regions where the differences are statistically significant at the 95 % confidence level based on a two-sample Student's t test. Colored contours represent cyclone density, and pattern correlation (PCC) and root-mean-square error (RMSE) values relative to ERA5 are annotated in each model panel. ARs were identified using the same tracking algorithm described in Fig. 10. A detailed description of the EAMv2 simulations is provided in Table 1.
The source code for EAMv2 (https://github.com/E3SM-Project/E3SM/releases/tag/v2.0.0, US Department of Energy, 2021) was from the Energy Exascale Earth System Model project, sponsored by the US Department of Energy, Office of Science, Office of Biological and Environmental Research. The revised model code with all changes discussed in this study can be found on Zenodo at https://doi.org/10.5281/zenodo.16815018 (Zhang, 2025a). The TempestExtremes package used for feature tracking of high-impact weather events was extracted from the GitHub at https://github.com/ClimateGlobalChange/tempestextremes/releases/tag/v2.2.1 (Ullrich, 2022), and the user guide for this package can be found at the user guide for this package can be found at https://climate.ucdavis.edu/tempestextremes.php (Ullrich, 2020).
The data used to produce the figures in this paper are archived on Zenodo at https://doi.org/10.5281/zenodo.18226569 (Zhang, 2025b). The ERA5 reanalysis data used for nudging and evaluation in this study are available from the Copernicus Climate Change Service (C3S) Climate Data Store at https://doi.org/10.24381/cds.bd0915c6 (Hersbach et al., 2018a) and https://doi.org/10.24381/cds.adbb2d47 (Hersbach et al., 2018b). Satellite datasets used for analysis in this study were obtained from the following sources:
-
Tropical Rainfall Measuring Mission (TRMM) 3B42 Version 7 Precipitation Product (Huffman and Bolvin, 2015);
-
Global Precipitation Climatology Project (GPCP) Version 3.2 Product (Adler et al., 2003);
-
Clouds and the Earth's Radiant Energy System (CERES) Energy Balanced and Filled (EBAF) Edition 4.0 Product (Kato et al., 2018).
SZ, RL, and BH led the conceptualization of the study. SZ designed the study, implemented the temperature and humidity nudging strategy in EAMv2, conducted the hindcast experiments, performed the analysis, and wrote the initial manuscript draft. RL supervised the project, contributed to the experimental design, and provided substantial input to manuscript revisions. BH assisted with model configuration and post-processing of simulation outputs. BH and KZ contributed substantially to manuscript revisions. AB, GK, and KS contributed to the refinement of the revised nudging methodology and provided feedback on the manuscript. All authors discussed the results and contributed to the final version of the manuscript.
The contact author has declared that none of the authors has any competing interests.
Publisher's note: Copernicus Publications remains neutral with regard to jurisdictional claims made in the text, published maps, institutional affiliations, or any other geographical representation in this paper. The authors bear the ultimate responsibility for providing appropriate place names. Views expressed in the text are those of the authors and do not necessarily reflect the views of the publisher.
Computing resources for the simulations were provided by the National Energy Research Scientific Computing Center (NERSC), a DOE Office of Science User Facility at Lawrence Berkeley National Laboratory, operated under contract no. DE-AC02-05CH11231. PNNL is operated by Battelle Memorial Institute for the DOE under contract no. DE-AC05-76RL01830. The authors acknowledge the use of ChatGPT (OpenAI) to refine the wording of the manuscript.
This research has been supported by the Scalable, Efficient and Accelerated Causal Reasoning Operators, Graphs and Spikes for Earth and Embedded Systems (SEA-CROGS) project, funded by the Office of Science, US Department of Energy, Advanced Scientific Computing Research (ASCR) program.
This paper was edited by Yuefei Zeng and reviewed by Zhaoyang Huo and one anonymous referee.
Adler, R. F., Huffman, G. J., Chang, A., Ferraro, R., Xie, P., Janowiak, J., Rudolf, B., Schneider, U., Curtis, S., Bolvin, D., Gruber, A., Susskind, J. and Arkin, P.: The Version-2 Global Precipitation Climatology Project (GPCP) Monthly Precipitation Analysis (1979–Present), J. Hydrometeorol., 4, 1147–1167, https://doi.org/10.1175/1525-7541(2003)004<1147:TVGPCP>2.0.CO;2, 2003. a, b, c
Bretherton, C. S., Henn, B., Kwa, A., Brenowitz, N. D., Watt-Meyer, O., McGibbon, J., Perkins, W. A., Clark, S. K., and Harris, L.: Correcting coarse-grid weather and climate models by machine learning from global storm-resolving simulations, ESS Open Archive, p. 39, https://doi.org/10.1002/essoar.10507879.1, 2021. a
CESM2: Pre-Processing Reanalyses Data, Tech. Rep., NSF National Center for Atmospheric Research, https://ncar.github.io/CAM/doc/build/html/users_guide/physics-modifications-via-the-namelist.html#nudging (last access: 25 May 2025), 2025. a
Dennis, J. M., Edwards, J., Evans, K. J., Guba, O., Lauritzen, P. H., Mirin, A. A., St-Cyr, A., Taylor, M. A., and Worley, P. H.: CAM-SE: A scalable spectral element dynamical core for the Community Atmosphere Model, Int. J. High Perform. Comput. Appl., 26, 74–89, https://doi.org/10.1177/1094342011428142, 2012. a
Emanuel, K.: Tropical cyclone activity and global climate, Nature, 426, 644–648, https://doi.org/10.1038/nature02188, 2004. a, b
Eyring, V., Bony, S., Meehl, G. A., Senior, C. A., Stevens, B., Stouffer, R. J., and Taylor, K. E.: Overview of the Coupled Model Intercomparison Project Phase 6 (CMIP6) experimental design and organization, Geosci. Model Dev., 9, 1937–1958, https://doi.org/10.5194/gmd-9-1937-2016, 2016. a
Feng, L., Smith, S. J., Braun, C., Crippa, M., Gidden, M. J., Hoesly, R., Klimont, Z., van Marle, M., van den Berg, M., and van der Werf, G. R.: The generation of gridded emissions data for CMIP6, Geosci. Model Dev., 13, 461–482, https://doi.org/10.5194/gmd-13-461-2020, 2020. a
Gates, W. L., Boyle, J. S., Covey, C., Dease, C. G., Doutriaux, C. M., Drach, R. S., Fiorino, M., Gleckler, P. J., Hnilo, J. J., Marlais, S. M., Phillips, T. J., Potter, G. L., Santer, B. D., Sperber, K. R., Taylor, K. E., and Williams, D. N.: An Overview of the Results of the Atmospheric Model Intercomparison Project (AMIP I), B. Am. Meteorol. Soc., 80, 29–56, https://doi.org/10.1175/1520-0477(1999)080<0029:AOOTRO>2.0.CO;2, 1999. a
Gettelman, A. and Morrison, H.: Advanced two-moment bulk microphysics for global models, Part I: Off-line tests and comparison with other schemes, J. Climate, 28, 1268–1287, https://doi.org/10.1175/JCLI-D-14-00102.1, 2015. a
Golaz, J.-C., Larson, V., and Cotton, W.: A PDF-Based Model for Boundary Layer Clouds. Part I: Method and Model Description, J. Atmos. Sci., 59, 3540–3551, https://doi.org/10.1175/1520-0469(2002)059<3540:APBMFB>2.0.CO;2, 2002. a
Golaz, J.-C., Caldwell, P. M., Van Roekel, L. P., Petersen, M. R., Tang, Q., Wolfe, J. D., Abeshu, G., Anantharaj, V., Asay-Davis, X. S., Bader, D. C., Baldwin, S. A., Bisht, G., Bogenschutz, P. A., Branstetter, M., Brunke, M. A., Brus, S. R., Burrows, S. M., Cameron-Smith, P. J., Donahue, A. S., Deakin, M., Easter, R. C., Evans, K. J., Feng, Y., Flanner, M., Foucar, J. G., Fyke, J. G., Griffin, B. M., Hannay, C., Harrop, B. E., Hoffman, M. J., Hunke, E. C., Jacob, R. L., Jacobsen, D. W., Jeffery, N., Jones, P. W., Keen, N. D., Klein, S. A., Larson, V. E., Leung, L. R., Li, H.-Y., Lin, W., Lipscomb, W. H., Ma, P.-L., Mahajan, S., Maltrud, M. E., Mametjanov, A., McClean, J. L., McCoy, R. B., Neale, R. B., Price, S. F., Qian, Y., Rasch, P. J., Reeves Eyre, J. E. J., Riley, W. J., Ringler, T. D., Roberts, A. F., Roesler, E. L., Salinger, A. G., Shaheen, Z., Shi, X., Singh, B., Tang, J., Taylor, M. A., Thornton, P. E., Turner, A. K., Veneziani, M., Wan, H., Wang, H., Wang, S., Williams, D. N., Wolfram, P. J., Worley, P. H., Xie, S., Yang, Y., Yoon, J.-H., Zelinka, M. D., Zender, C. S., Zeng, X., Zhang, C., Zhang, K., Zhang, Y., Zheng, X., Zhou, T., and Zhu, Q.: The DOE E3SM Coupled Model Version 1: Overview and Evaluation at Standard Resolution, J. Adv. Model. Earth Syst., 11, 2089–2129, https://doi.org/10.1029/2018MS001603, 2019. a, b
Golaz, J.-C., Van Roekel, L. P., Zheng, X., Roberts, A. F., Wolfe, J. D., Lin, W., Bradley, A. M., Tang, Q., Maltrud, M. E., Forsyth, R. M., Zhang, C., Zhou, T., Zhang, K., Zender, C. S., Wu, M., Wang, H., Turner, A. K., Singh, B., Richter, J. H., Qin, Y., Petersen, M. R., Mametjanov, A., Ma, P.-L., Larson, V. E., Krishna, J., Keen, N. D., Jeffery, N., Hunke, E. C., Hannah, W. M., Guba, O., Griffin, B. M., Feng, Y., Engwirda, D., Di Vittorio, A. V., Dang, C., Conlon, L. M., Chen, C.-C.-J., Brunke, M. A., Bisht, G., Benedict, J. J., Asay-Davis, X. S., Zhang, Y., Zhang, M., Zeng, X., Xie, S., Wolfram, P. J., Vo, T., Veneziani, M., Tesfa, T. K., Sreepathi, S., Salinger, A. G., Reeves Eyre, J. E. J., Prather, M. J., Mahajan, S., Li, Q., Jones, P. W., Jacob, R. L., Huebler, G. W., Huang, X., Hillman, B. R., Harrop, B. E., Foucar, J. G., Fang, Y., Comeau, D. S., Caldwell, P. M., Bartoletti, T., Balaguru, K., Taylor, M. A., McCoy, R. B., Leung, L. R., and Bader, D. C.: The DOE E3SM Model Version 2: Overview of the Physical Model and Initial Model Evaluation, J. Adv. Model. Earth Syst., 14, e2022MS003156, https://doi.org/10.1029/2022MS003156, 2022. a, b, c, d
Hannah, W. M., Bradley, A. M., Guba, O., Tang, Q., Golaz, J.-C., and Wolfe, J.: Separating Physics and Dynamics Grids for Improved Computational Efficiency in Spectral Element Earth System Models, J. Adv. Model. Earth Syst., 13, e2020MS002419, https://doi.org/10.1029/2020MS002419, 2021. a
Herrington, A. R., Lauritzen, P. H., Reed, K. A., Goldhaber, S., and Eaton, B. E.: Exploring a Lower-Resolution Physics Grid in CAM-SE-CSLAM, J. Adv. Model. Earth Syst., 11, 1894–1916, https://doi.org/10.1029/2019MS001684, 2019. a
Hersbach, H., Bell, B., Berrisford, P., Biavati, G., Horányi, A., Muñoz Sabater, J., Nicolas, J., Peubey, C., Radu, R., Rozum, I., Schepers, D., Simmons, A., Soci, C., Dee, D., and Thépaut, J.-N.: ERA5 hourly data on pressure levels from 1979 to present, Copernicus Climate Change Service (C3S) Climate Data Store (CDS) [data set], https://doi.org/10.24381/cds.bd0915c6, 2018a. a
Hersbach, H., Bell, B., Berrisford, P., Biavati, G., Horányi, A., Muñoz Sabater, J., Nicolas, J., Peubey, C., Radu, R., Rozum, I., Schepers, D., Simmons, A., Soci, C., Dee, D., and Thépaut, J.-N.: ERA5 hourly data on single levels from 1940 to present, Copernicus Climate Change Service (C3S) Climate Data Store (CDS) [data set], https://doi.org/10.24381/cds.adbb2d47, 2018b. a
Hersbach, H., Bell, B., Berrisford, P., Hirahara, S., Horányi, A., Muñoz Sabater, J., Nicolas, J., Peubey, C., Radu, R., Schepers, D., Simmons, A., Soci, C., Abdalla, S., Abellan, X., Balsamo, G., Bechtold, P., Biavati, G., Bidlot, J., Bonavita, M., De Chiara, G., Dahlgren, P., Dee, D., Diamantakis, M., Dragani, R., Flemming, J., Forbes, R., Fuentes, M., Geer, A., Haimberger, L., Healy, S., Hogan, R. J., Hólm, E., Janisková, M., Keeley, S., Laloyaux, P., Lopez, P., Lupu, C., Radnoti, G., de Rosnay, P., Rozum, I., Vamborg, F., Villaume, S., and Thépaut, J.-N.: The ERA5 global reanalysis, Q. J. Roy. Meteorol. Soc., 146, 1999–2049, https://doi.org/10.1002/qj.3803, 2020. a, b, c
Hoesly, R. M., Smith, S. J., Feng, L., Klimont, Z., Janssens-Maenhout, G., Pitkanen, T., Seibert, J. J., Vu, L., Andres, R. J., Bolt, R. M., Bond, T. C., Dawidowski, L., Kholod, N., Kurokawa, J.-I., Li, M., Liu, L., Lu, Z., Moura, M. C. P., O'Rourke, P. R., and Zhang, Q.: Historical (1750–2014) anthropogenic emissions of reactive gases and aerosols from the Community Emissions Data System (CEDS), Geosci. Model Dev., 11, 369–408, https://doi.org/10.5194/gmd-11-369-2018, 2018. a
Huffman, G. J. and Bolvin, D. T.: TRMM and other data precipitation data set documentation, NASA Global Change Master Directory Doc., NASA, Greenbelt, USA, 44 pp., https://gpm.nasa.gov/sites/default/files/document_files/3B42_3B43_doc_V7.pdf (last access: 5 March 2026), 2015. a
Iacono, M. J., Delamere, J. S., Mlawer, E. J., Shephard, M. W., Clough, S. A., and Collins, W. D.: Radiative forcing by long–lived greenhouse gases: Calculations with the AER radiative transfer models, J. Geophys. Res.-Atmos., 113, D13103, https://doi.org/10.1029/2008JD009944, 2008. a
Jeuken, A. B. M., Siegmund, P. C., Heijboer, L. C., Feichter, J., and Bengtsson, L.: On the potential of assimilating meteorological analyses in a global climate model for the purpose of model validation, J. Geophys. Res.-Atmos., 101, 16939–16950, https://doi.org/10.1029/96JD01218, 1996. a, b, c
Kato, S., Rose, F. G., Rutan, D. A., Thorsen, T. J., Loeb, N. G., Doelling, D. R., Huang, X., Smith, W. L., Su, W., and Ham, S.-H.: Surface Irradiances of Edition 4.0 Clouds and the Earth's Radiant Energy System (CERES) Energy Balanced and Filled (EBAF) Data Product, J. Climate, 31, 4501–4527, https://doi.org/10.1175/JCLI-D-17-0523.1, 2018. a, b, c
Knapp, K. R., Kruk, M. C., Levinson, D. H., Diamond, H. J., and Neumann, C. J.: The International Best Track Archive for Climate Stewardship (IBTrACS): Unifying Tropical Cyclone Data, B. Am. Meteorol. Soc., 91, 363–376, https://doi.org/10.1175/2009BAMS2755.1, 2010. a
Kooperman, G. J., Pritchard, M. S., Ghan, S. J., Wang, M., Somerville, R. C. J., and Russell, L. M.: Constraining the influence of natural variability to improve estimates of global aerosol indirect effects in a nudged version of the Community Atmosphere Model 5, J. Geophys. Res.-Atmos., 117, D23204, https://doi.org/10.1029/2012JD018588, 2012. a
Larson, V. E., Golaz, J.-C., and Cotton, W. R.: A PDF-Based Model for Boundary Layer Clouds. Part I: Method and Model Description, J. Atmos. Sci., 59, 3519–3539, https://doi.org/10.1175/1520-0469(2002)059<3519:SSAMVI>2.0.CO;2, 2002. a
Lauritzen, P. H., Nair, R. D., Herrington, A. R., Callaghan, P., Goldhaber, S., Dennis, J. M., Bacmeister, J. T., Eaton, B. E., Zarzycki, C. M., Taylor, M. A., Ullrich, P. A., Dubos, T., Gettelman, A., Neale, R. B., Dobbins, B., Reed, K. A., Hannay, C., Medeiros, B., Benedict, J. J., and Tribbia, J. J.: NCAR Release of CAM-SE in CESM2.0: A Reformulation of the Spectral Element Dynamical Core in Dry-Mass Vertical Coordinates With Comprehensive Treatment of Condensates and Energy, J. Adv. Model. Earth Syst., 10, 1537–1570, https://doi.org/10.1029/2017MS001257, 2018. a
Leung, L. R., Bader, D. C., Taylor, M. A., and McCoy, R. B.: An Introduction to the E3SM Special Collection: Goals, Science Drivers, Development, and Analysis, J. Adv. Model. Earth Syst., 12, e2019MS001821, https://doi.org/10.1029/2019MS001821, 2020. a
Lin, G., Wan, H., Zhang, K., Qian, Y., and Ghan, S. J.: Can nudging be used to quantify model sensitivities in precipitation and cloud forcing?, J. Adv. Model. Earth Syst., 8, 1073–1091, https://doi.org/10.1002/2016MS000659, 2016. a
Liu, X., Ma, P.-L., Wang, H., Tilmes, S., Singh, B., Easter, R. C., Ghan, S. J., and Rasch, P.: Description and evaluation of a new four–mode version of the Modal Aerosol Module (MAM4) within version 5.3 of the Community Atmosphere Model, Geosci. Model Dev., 9, 505–522, https://doi.org/10.5194/gmd-9-505-2016, 2016. a
Lo, J. C.-F., Yang, Z.-L., and Pielke Sr., R. A.: Assessment of three dynamical climate downscaling methods using the Weather Research and Forecasting (WRF) model, J. Geophys. Res.-Atmos., 113, https://doi.org/10.1029/2007JD009216, 2008. a, b
Lohmann, U. and Hoose, C.: Sensitivity studies of different aerosol indirect effects in mixed-phase clouds, Atmos. Chem. Phys., 9, 8917–8934, https://doi.org/10.5194/acp-9-8917-2009, 2009. a
Ma, H.-Y., Chuang, C. C., Klein, S. A., Lo, M.-H., Zhang, Y., Xie, S., Zheng, X., Ma, P.-L., Zhang, Y., and Phillips, T. J.: An improved hindcast approach for evaluation and diagnosis of physical processes in global climate models, J. Adv. Model. Earth Syst., 7, 1810–1827, https://doi.org/10.1002/2015MS000490, 2015. a, b, c
Ma, P.-L., Harrop, B. E., Larson, V. E., Neale, R. B., Gettelman, A., Morrison, H., Wang, H., Zhang, K., Klein, S. A., Zelinka, M. D., Zhang, Y., Qian, Y., Yoon, J.-H., Jones, C. R., Huang, M., Tai, S.-L., Singh, B., Bogenschutz, P. A., Zheng, X., Lin, W., Quaas, J., Chepfer, H., Brunke, M. A., Zeng, X., Mülmenstädt, J., Hagos, S., Zhang, Z., Song, H., Liu, X., Pritchard, M. S., Wan, H., Wang, J., Tang, Q., Caldwell, P. M., Fan, J., Berg, L. K., Fast, J. D., Taylor, M. A., Golaz, J.-C., Xie, S., Rasch, P. J., and Leung, L. R.: Better calibration of cloud parameterizations and subgrid effects increases the fidelity of the E3SM Atmosphere Model version 1, Geosci. Model Dev., 15, 2881–2916, https://doi.org/10.5194/gmd-15-2881-2022, 2022. a
Mlawer, E. J., Taubman, S. J., Brown, P. D., Iacono, M. J., and Clough, S. A.: Radiative transfer for inhomogeneous atmospheres: RRTM, a validated correlated-k model for the longwave, J. Geophys. Res.-Atmos., 102, 16663–16682, https://doi.org/10.1029/97JD00237, 1997. a
Morrison, H. and Gettelman, A.: A New Two-Moment Bulk Stratiform Cloud Microphysics Scheme in the Community Atmosphere Model, Version 3 (CAM3). Part I: Description and Numerical Tests, J. Climate, 21, 3642–3659, https://doi.org/10.1175/2008JCLI2105.1, 2008. a
NOAA GFDL: The GFDL Finite-Volume Cubed-Sphere Dynamical Core: Technical Description, Tech. rep., NOAA Geophysical Fluid Dynamics Laboratory, https://www.gfdl.noaa.gov/wp-content/uploads/2020/02/FV3-Technical-Description.pdf (last access: 5 March 2026), 2020. a
Oleson, K. W., Lawrence, M., Bonan, B., Drewniak, B. A., Huang, M., Koven, D., Levis, S., Li, F., Riley, J. P., Subin, M. C., Swenson, S. C., Thornton, E., Bozbiyik, A., Fisher, R. A., Heald, L., Kluzek, E., Lamarque, J., Lawrence, J., Leung, R., Lipscomb, W. H., Muszala, P., Ricciuto, M., Sacks, J., Sun, Y., Tang, J., and Yang, Z.: Technical description of version 4.5 of the Community Land Model (CLM), NCAR Technical Note NCAR/TN-503+STR, NCAR, USA, 420 pp., https://doi.org/10.5065/D6RR1W7M, 2013. a
Rasch, P. J., Xie, S., Ma, P.-L., Lin, W., Wang, H., Tang, Q., Burrows, S. M., Caldwell, P., Zhang, K., Easter, R. C., Cameron-Smith, P., Singh, B., Wan, H., Golaz, J.-C., Harrop, B. E., Roesler, E., Bacmeister, J., Larson, V. E., Evans, K. J., Qian, Y., Taylor, M., Leung, L. R., Zhang, Y., Brent, L., Branstetter, M., Hannay, C., Mahajan, S., Mametjanov, A., Neale, R., Richter, J. H., Yoon, J.-H., Zender, C. S., Bader, D., Flanner, M., Foucar, J. G., Jacob, R., Keen, N., Klein, S. A., Liu, X., Salinger, A., Shrivastava, M., and Yang, Y.: An Overview of the Atmospheric Component of the Energy Exascale Earth System Model, J. Adv. Model. Earth Syst., 11, 2377–2411, https://doi.org/10.1029/2019MS001629, 2019. a
Reynolds, R. W., Rayner, N. A., Smith, T. M., Stokes, D. C., and Wang, W.: An Improved In Situ and Satellite SST Analysis for Climate, J. Climate, 15, 1609–1625, https://doi.org/10.1175/1520-0442(2002)015<1609:AIISAS>2.0.CO;2, 2002. a
Rutz, J. J., Shields, C. A., Lora, J. M., Payne, A. E., Guan, B., Ullrich, P., O'Brien, T., Leung, L. R., Ralph, F. M., Wehner, M., Brands, S., Collow, A., Goldenson, N., Gorodetskaya, I., Griffith, H., Kashinath, K., Kawzenuk, B., Krishnan, H., Kurlin, V., Lavers, D., Magnusdottir, G., Mahoney, K., McClenny, E., Muszynski, G., Nguyen, P. D., Prabhat, Qian, Y., Ramos, A. M., Sarangi, C., Sellars, S., Shulgina, T., Tome, R., Waliser, D., Walton, D., Wick, G., Wilson, A. M., and Viale, M.: The Atmospheric River Tracking Method Intercomparison Project (ARTMIP): Quantifying Uncertainties in Atmospheric River Climatology, J. Geophys. Res.-Atmos., 124, 13777–13802, https://doi.org/10.1029/2019JD030936, 2019. a
Separovic, L., de Elía, R., and Laprise, R.: Impact of spectral nudging and domain size in studies of RCM response to parameter modification, Clim. Dynam., 38, 1325–1343, https://doi.org/10.1007/s00382-011-1072-7, 2012. a
Song, X., Zhang, G. J., Terai, C., and Xie, S.: Enhanced convective microphysics scheme and its impacts on mean climate in E3SM, J. Adv. Model. Earth Syst., 17, e2024MS004656, https://doi.org/10.1029/2024MS004656, 2025. a
Sun, J., Zhang, K., Wan, H., Ma, P.-L., Tang, Q., and Zhang, S.: Impact of Nudging Strategy on the Climate Representativeness and Hindcast Skill of Constrained EAMv1 Simulations, J. Adv. Model. Earth Syst., 11, 3911–3933, https://doi.org/10.1029/2019MS001831, 2019. a, b, c, d, e, f, g, h, i, j, k, l, m, n, o, p, q, r
Taylor, M. A. and Fournier, A.: A compatible and conservative spectral element method on unstructured grids, J. Comput. Phys., 229, 5879–5895, https://doi.org/10.1016/j.jcp.2010.04.008, 2010. a
Ullrich, P. A.: TempestExtremes User Guide, https://climate.ucdavis.edu/tempestextremes.php (last access: 5 March 2026), 2020. a
Ullrich, P.: TempestExtremes v2.2.1, GitHub [code], https://github.com/ClimateGlobalChange/tempestextremes/releases/tag/v2.2.1 (last access: 5 March 2026), 2022. a
Ullrich, P. A., Zarzycki, C. M., McClenny, E. E., Pinheiro, M. C., Stansfield, A. M., and Reed, K. A.: TempestExtremes v2.1: a community framework for feature detection, tracking, and analysis in large datasets, Geosci. Model Dev., 14, 5023–5048, https://doi.org/10.5194/gmd-14-5023-2021, 2021. a, b, c, d
US Department of Energy: E3SM Project: Energy Exascale Earth System Model v2.0, GitHub [code], https://github.com/E3SM-Project/E3SM/releases/tag/v2.0.0 (last access: 5 March 2026), 2021. a
Vincent, C. L. and Hahmann, A. N.: The Impact of Grid and Spectral Nudging on the Variance of the Near-Surface Wind Speed, J. Appl. Meteorol. Clim., 54, 1021–1038, https://doi.org/10.1175/JAMC-D-14-0047.1, 2015. a, b
Wang, H., Easter, R. C., Zhang, R., Ma, P.-L., Singh, B., Zhang, K., Ganguly, D., Rasch, P. J., Burrows, S. M., Ghan, S. J., Lou, S., Qian, Y., Yang, Y., Feng, Y., Flanner, M., Leung, L. R., Liu, X., Shrivastava, M., Sun, J., Tang, Q., Xie, S., and Yoon, J.-H.: Aerosols in the E3SM Version 1: New Developments and Their Impacts on Radiative Forcing, J. Adv. Model. Earth Syst., 12, e2019MS001851, https://doi.org/10.1029/2019MS001851, 2020. a
Wang, Y., Liu, X., Hoose, C., and Wang, B.: Different contact angle distributions for heterogeneous ice nucleation in the Community Atmospheric Model version 5,, Atmos. Chem. Phys., 14, 10411–10430, https://doi.org/10.5194/acp-14-10411-2014, 2014. a
Watt-Meyer, O., Bretherton, C. S., Gentine, P., Harris, L. M., and Toms, B. A.: Correcting Weather and Climate Models by Machine Learning Nudged Historical Simulations, Geophys. Res. Lett., 48, e2021GL093814, https://doi.org/10.1029/2021GL093814, 2021. a, b, c
Wehrli, K., Guillod, B. P., Hauser, M., Leclair, M., and Seneviratne, S. I.: Assessing the Dynamic Versus Thermodynamic Origin of Climate Model Biases, Geophys. Res. Lett., 45, 8471–8479, https://doi.org/10.1029/2018GL079220, 2018. a
Wehrli, K., Guillod, B. P., Hauser, M., Leclair, M., and Seneviratne, S.: Identifying Key Driving Processes of Major Recent Heat Waves, J. Geophys. Res.-Atmos., 124, 11746–11765, https://doi.org/10.1029/2019JD030635, 2019. a
Wehrli, K., Luo, F., Hauser, M., Shiogama, H., Tokuda, D., Kim, H., Coumou, D., May, W., Le Sager, P., Selten, F., Martius, O., Vautard, R., and Seneviratne, S. I.: The ExtremeX global climate model experiment: investigating thermodynamic and dynamic processes contributing to weather and climate extremes, Earth Syst. Dynam., 13, 1167–1196, https://doi.org/10.5194/esd-13-1167-2022, 2022. a, b
WMO: Global Guide to Tropical Cyclone Forecasting, WMO-No. 1194, https://cyclone.wmo.int/pdf/Global-Guide-to-Tropical-Cyclone-Forecasting.pdf (last access: 5 March 2026), 2017. a
Xie, S., Lin, W., Rasch, P. J., Ma, P.-L., Neale, R., Larson, V. E., Qian, Y., Bogenschutz, P. A., Caldwell, P., Cameron-Smith, P., Golaz, J.-C., Mahajan, S., Singh, B., Tang, Q., Wang, H., Yoon, J.-H., Zhang, K., and Zhang, Y.: Understanding Cloud and Convective Characteristics in Version 1 of the E3SM Atmosphere Model, J. Adv. Model. Earth Syst., 10, 2618–2644, https://doi.org/10.1029/2018MS001350, 2018. a
Zhang, G. J. and McFarlane, N. A.: Sensitivity of climate simulations to the parameterization of cumulus convection in the Canadian Climate Centre general circulation model, Atmos. Ocean, 33, 407–446, https://doi.org/10.1080/07055900.1995.9649539, 1995. a
Zhang, K., O'Donnell, D., Kazil, J., Stier, P., Kinne, S., Lohmann, U., Ferrachat, S., Croft, B., Quaas, J., Wan, H., Rast, S., and Feichter, J.: The global aerosol-climate model ECHAM-HAM, version 2: sensitivity to improvements in process representations, Atmos. Chem. Phys., 12, 8911–8949, https://doi.org/10.5194/acp-12-8911-2012, 2012. a
Zhang, K., Wan, H., Liu, X., Ghan, S. J., Kooperman, G. J., Ma, P.-L., Rasch, P. J., Neubauer, D., and Lohmann, U.: Technical Note: On the use of nudging for aerosol-climate model intercomparison studies, Atmos. Chem. Phys., 14, 8631–8645, https://doi.org/10.5194/acp-14-8631-2014, 2014. a, b
Zhang, S.: E3SM Model Code for Zhang et. al. (2025), Zenodo [code], https://doi.org/10.5281/zenodo.16815018, 2025a. a
Zhang, S.: Analysis scripts and dataset for Zhang et. al. (2025), Zenodo [data set], https://doi.org/10.5281/zenodo.18226569, 2025b. a
Zhang, S., Zhang, K., Wan, H., and Sun, J.: Further improvement and evaluation of nudging in the E3SM Atmosphere Model version 1 (EAMv1): simulations of the mean climate, weather events, and anthropogenic aerosol effects, Geosci. Model Dev., 15, 6787–6816, https://doi.org/10.5194/gmd-15-6787-2022, 2022. a, b, c, d, e, f, g, h, i, j, k, l, m, n, o, p, q, r, s, t, u
Zhang, S., Harrop, B., Leung, L. R., Charalampopoulos, A.-T., Barthel Sorensen, B., Xu, W., and Sapsis, T.: A Machine Learning Bias Correction on Large-Scale Environment of High-Impact Weather Systems in E3SM Atmosphere Model, J. Adv. Model. Earth Syst., 16, e2023MS004138, https://doi.org/10.1029/2023MS004138, 2024. a
- Abstract
- Introduction
- Model and nudging methodology
- Sensitivity experiments for nudging strategies
- Improving the hindcast skills of simulations nudged to reanalysis
- Implication on high-impact weather assessment with EAM
- Conclusions
- Appendix A: Tropical cyclone Genesis Potential Index
- Appendix B: Additional tables
- Appendix C: Additional figures
- Code availability
- Data availability
- Author contributions
- Competing interests
- Disclaimer
- Acknowledgements
- Financial support
- Review statement
- References