the Creative Commons Attribution 4.0 License.
the Creative Commons Attribution 4.0 License.
 | 04 Mar 2026
Deposition velocity concept does not apply to fluxes of ambient aerosol
Rostislav Kouznetsov
Mikhail Sofiev
Andreas Uppstu
Risto Hänninen
We demonstrate that the proportionality between a deposition flux and a corresponding concentration usually does not hold for ambient aerosol. Therefore the deposition velocity Vd, defined as the proportionality coefficient, while might exist for some components of the aerosol, is not applicable to aerosol as a bulk substance or to a size mode of it. Insufficient attention to the proportionality requirement leads to large discrepancies between field and wind-tunnel measurements of Vd of aerosols with aerodynamic diameters ranging from approximately 0.1 to 2 µm. In seemingly similar conditions, the deposition velocities reported in different experiments may differ by up to two orders of magnitude, with field measurements showing much higher values than experiments performed in controlled environments with known particle properties. We demonstrate that the bulk of the discrepancy can be explained by gas-particle partitioning in the immediate vicinity of the surface. With the chemistry-transport model SILAM equipped with gas-particle partitioning for ammonium nitrate, we demonstrate that in presence of even small amounts of ammonium nitrate, the vertical flux of total aerosol mass is not controlled by particle deposition but rather by aerosol-gas partitioning in the vicinity of the surface. Under these conditions, the deposition flux is not proportional to the concentration, and the concept of deposition velocity as a proportionality coefficient between concentration and deposition flux falls apart. Presence of other semi-volatile components in ambient aerosols may further complicate the case, but ammonium nitrate alone is sufficient to invalidate the concept for ambient aerosol. By simulating a renowned field experiment with the SILAM model, we are able to reproduce the magnitudes and temporal behaviors of ambient particle fluxes using the deposition parameterization derived from wind-tunnel studies. Combining these simulations with a set of computational experiments, we suggested guidelines for accounting for the relevant processes in regional atmospheric composition models.
- Article
(3264 KB) - Full-text XML
-
Supplement
(7226 KB) - BibTeX
- EndNote


In memory of Marje Prank.
Dry deposition is one of the key mechanisms for removal of gaseous and particulate species from the atmosphere. The measure of dry deposition is the flux F of a substance, expressed as amount (e.g. mass or number) deposited per unit area per unit time. In many applications, the flux is assumed to be proportional to the substance concentration C at some reference height above the surface:
where Vd is a proportionality coefficient of a velocity dimension, called the deposition velocity. The assumption implies that Vd can be a function of features of atmospheric flow, surface, substance properties, and/or reference height, but not a function of C.
All dry deposition schemes for particles used in atmospheric dispersion models that we are aware of can be expressed in the form of Eq. (1), (e.g. Slinn and Slinn, 1980; Giorgi, 1986; Zhang et al., 2001; Kouznetsov and Sofiev, 2012; Zhang and He, 2014; Pleim et al., 2022). Equation (1) follows from the basic law of mass conservation (Businger, 1986) if one assumes: (1) a quasi-steady-state process, (2) horizontal homogeneity at a sufficient scale, (3) absence of sources and sinks of the substance between the reference height and the surface, and (4) zero concentration at the surface. The assumptions (1)–(3) taken together are equivalent to the constant-flux assumption, i.e., the flux is constant along the vertical between the reference height and the surface if these assumptions are fulfilled (Sofiev, 2002; Kouznetsov and Sofiev, 2012). The assumption (4) implies that particles, once reach the surface, are captured and never return to the air. If any of these assumptions is violated, the flux proportionality to the concentration at the reference height does not hold, and the concept of deposition velocity is inapplicable.
Along with the definition given by Eq. (1), a wider definition of deposition velocity has been adopted within the measurement community and some modelling studies (Vong et al., 2004, 2010; Grönholm et al., 2009; Matsuda et al., 2010; Sun et al., 2014; Deventer et al., 2015; Petroff et al., 2018).
The deposition velocity Vd,a of a substance is defined as the vertical flux F of the substance at a reference height above the surface normalized with its concentration C at the same height, i.e.
Vd,a is a feature of each individual measurement computed from the two observed quantities. It can differ from one measurement to another, i.e., its independence from the concentration postulated in Eq. (1) is not declared. In the following, we will use the term “apparent deposition velocity” for the one defined by Eq. (2) to distinguish it from the definition given by Eq. (1). These two definitions are equivalent only if all four assumptions behind Eq. (1) hold.
Both definitions appeared together for the first time probably in the review of Sehmel (1980), however no explicit distinction between them has been made. An extensive review of Pryor et al. (2008) adopts definition (2), then mentions the importance of negligibility of storage and phase changes below the observation heights. Nemitz et al. (2009) used definition similar to Eq. (1) and explicitly mentioned the requirement of absence of chemical reactions, but in the next sentence Vd was calculated using the average deposition velocity as defined in Eq. (2). A recent review of Farmer et al. (2021) uses the definition in form of Eq. (1) and mentions that Vd is independent from ambient concentration, but without explicitly specifying that this independence is based on assumptions and not guaranteed for arbitrary particles. A few experimental studies (Rohbock, 1982; Hicks et al., 1987) clearly mention the requirement of proportionality between the flux and concentration therefore stick to Eq. (1). A substantial number of experimental studies (Sievering et al., 1981; Sievering, 1981; Rannik et al., 2003b; Mammarella et al., 2011; Zhang and He, 2014; Matsuda et al., 2015; Lavi et al., 2013; Connan et al., 2018) address deposition velocity without giving an explicit definition, and proportionality between flux and concentration was probably assumed in some of them, but obviously not considered in some others.
Many studies have been conducted to infer deposition velocities for different airborne substances in gaseous and aerosol forms under both laboratory and field conditions. They can be classified into two categories: those where the deposition flux is calculated from the amount deposited onto the surface (direct method applying Eq. 1), and those where the flux is inferred above the surface from gradient or eddy-covariance measurements (indirect method). The direct method is more laborious and requires a well-defined and easily identifiable substance, and it is therefore only applicable in laboratory conditions. The indirect method can be applied also outdoors, but ensuring that assumptions (1)–(4) hold for the ambient aerosol mixture is non-trivial.
Literature values for deposition velocities of aerosols in the accumulation-mode size range, i.e. from 0.1 µm up to a few micrometers, exhibit a large scatter, which has been puzzling researchers for decades (Garland, 2001). Studies inferring deposition fluxes from direct measurements (Chamberlain, 1968; Clough, 1975; Zufall et al., 1998; Caffrey et al., 1998) show that typical values of accumulation mode aerosol deposition velocities onto a smooth surface are of the order of 0.01 cm s−1. These studies were performed in wind tunnels for both smooth solid and water surfaces, and for surfaces with small roughness elements. Deposition velocities of the same order of magnitude were also found in the study by Sehmel and Sutter (1974), who used a surrogate surface to collect material deposited on a natural lake. On the other hand, field studies that apply flux or gradient methods above water surfaces have reported two orders of magnitude higher deposition velocities of about 1 cm s−1 (Sievering et al., 1981; Zhang and He, 2014). Moreover, observations over snow or low vegetation show a scatter of about two orders of magnitude. While some of them (Duan et al., 1988; Nemitz et al., 2002) agree with wind-tunnel measurements, others (Sievering et al., 1981; Vong et al., 2010) indicate 1–2 orders of magnitude higher velocities.
Indirect measurements of particle deposition onto high vegetation have yielded deposition velocities of 1 cm s−1, with little dependence on the particle size within a range of 0.2 to 5 µm, as summarized by (Pleim et al., 2022). These deposition velocities are two orders of magnitude higher than those predicted by mechanistic models (Slinn, 1982; Kouznetsov and Sofiev, 2012). To the best of our knowledge, there are no direct measurements of Vd onto high vegetation.
Many of the original studies considered by Pleim et al. (2022) report strong temporal variability and even a change of direction of the particle fluxes over high vegetation. The reported fraction of upward particle fluxes over forest ecosystems range from 30 % to 60 % (Ahlm et al., 2010; Rannik et al., 2003a; Pryor et al., 2007, 2009; Gordon et al., 2011; Lavi et al., 2013; Deventer et al., 2015). For this reason many of these studies avoid the term “deposition velocity” in favour of “transfer velocity”, while still calling the downward particle flux “deposition”.
Several mechanisms causing such discrepancies have have been suggested to explain the upward fluxes. Nemitz and Sutton (2004) and Farmer et al. (2013) pointed out that vertical fluxes of ambient aerosols can be substantially affected by NH4NO3 formation and decomposition due to the equilibrium. Among other mechanisms breaking the particle mass conservation are interactions between aerosol particles (coagulation, agglomeration, fragmentation) or aerosol particles and the carrying gas (mass transfer of water vapour, condensation or evaporation of semi-volatile compounds), etc. (Farmer et al., 2013; Petroff and Zhang, 2010). If any of these mechanisms impacts the vertical flux, it is no longer proportional to the concentration, rendering Eq. (1) inapplicable. This discrepancy has been recognised in many deposition flux studies (e.g. Farmer et al., 2013). The role of ammonium nitrate formation in modifying particle fluxes has been studied in details by Nemitz et al. (2009). However, particle concentrations dominated by non-volatile ammonium sulfate were considered sufficient justification to neglect gas-particle partitioning (Petroff and Zhang, 2010). Therefore, apparent deposition velocities reported in field studies have been used to develop parametrisations for particle deposition in atmospheric composition models (Zhang et al., 2001; Petroff and Zhang, 2010; Zhang and He, 2014; Emerson et al., 2020; Pleim et al., 2022). As a result, the obtained dry deposition schemes predict 1–2 orders of magnitude higher deposition fluxes than mechanistic models based on “first-principles” (Slinn, 1982; Kouznetsov and Sofiev, 2012).
The goal of the present study is to explore the discrepancy between different experimental studies of Vd. We show that the discrepancy does not originate from the natural variability of the particle-surface interaction, but rather from the inconsistency between the deposition velocity defined by Eq. (1) and the apparent deposition velocity defined by Eq. (2). While we primarily focus on the deposition of NH4NO3, our findings should be valid also for other non-inert aerosols. We use a chemistry-transport model SILAM that applies a first-principles based deposition scheme and accounts explicitly for relevant aerosol processes to simulate fluxes and depositions observed in one of the measurement campaigns. This allows us to directly identify the processes responsible for observed particle fluxes (Sect. 3). Then, by using a single-column setup of the model for a system undergoing the reaction , we demonstrate the difference between the particle deposition process and the processes responsible for particle fluxes above the surface (Sect. 4). Finally, we estimate the amount of in-air NH4NO3 needed to break the linear relationship between flux and concentration, and suggest an approach to bridge the gap between observed apparent deposition velocities and deposition parametrisations based on Eq. (1).
To demonstrate the ability of a chemistry-transport model to reproduce the observed range of apparent deposition velocities, we use the Eulerian chemistry transport model SILAM (System for Integrated modelLing of Atmospheric coMpostion, http://silam.fmi.fi, last access: 26 April 2025). The model features mass-conservative transport schemes (Sofiev, 2002; Sofiev et al., 2015), and a mechanistic particle deposition scheme (Kouznetsov and Sofiev, 2012). SILAM includes a scheme for secondary inorganic aerosol formation and gas-particle equilibrium that is capable of gas-particle partitioning of ammonium nitrate with ammonia and nitric acid (Galperin and Sofiev, 1998; Sofiev, 2000). NH4NO3 is formed when NH3 and HNO3 are in abundance, and it decomposes back to the gaseous constituents when the product of their partial pressures drops below a temperature- and humidity-dependent threshold (Mozurkewich, 1993). This simplified approach is consistent with external-mixing representation of aerosols in the model, but ignores the process of exchange of NH3 and HNO3 gases with (usually aqueous) mixed aerosols that include other than NH4NO3 compounds, such as chlorides and sulphates. Such a simplification leads to somewhat overstated gas-phase concentrations in the model, but should not affect the qualitative results of this study. Besides that SILAM does not consider secondary emission of once-deposited NH3, and is thus not expected to reproduce the upward flux of NH3 or NH4NO3 at the surface. The emissions of NH3 are treated independently of deposition.
The particle deposition scheme used in SILAM (Kouznetsov and Sofiev, 2012) is based on the mechanistic approach. Similar to other schemes, the particles are characterized by their aerodynamic relaxation time τp, which drives the processes of settling, impaction and turbophoresis, their physical size dp, which drives the interception process, and Brownian diffusivity Dp, which controls deposition by diffusion. The scheme is derived from the first principles, has no fitting parameters for a smooth and water surfaces, and only one for rough surfaces: “collector scale”, which, along with the aerodynamic roughness, characterizes the rough surfaces. Such approach contrasts to the one used by many other schemes (e.g. Zhang et al., 2001; Petroff and Zhang, 2010; Zhang and He, 2014; Pleim et al., 2022), which include large tables for such parameters fitted to quite limited set of available experimental data. The SILAM scheme agrees well with available wind-tunnel measurements, but had shown a discrepancy with apparent deposition velocities derived from outdoor experiments. The scheme predicts low deposition velocities for accumulation-mode particles – two to three orders of magnitude lower than those for NH3 and HNO3 gases.
SILAM has been extensively used and evaluated in numerous applications of air quality (Kukkonen et al., 2012; Sofiev et al., 2018; Petersen et al., 2019; Blechschmidt et al., 2020; Pachón et al., 2024; Colette et al., 2025), atmospheric composition (Kouznetsov et al., 2020; Sofiev et al., 2020) and emergency response (Brenot et al., 2021; Jylhä et al., 2018). Along with regular air-quality evaluation, various setups of the model have been evaluated for depositions and aerosol composition (Simpson et al., 2014; Fagerli et al., 2023; Schaap et al., 2026).
For the present study, we have performed two simulations with SILAM. The first one was a simulation of a field campaign by Gallagher et al. (1997) at the Speulder forest site in the Netherlands on 29–30 June 1993. The simulations included regular atmospheric pollutants, with the model setup being similar to that of Copernicus Atmosphere Monitoring Service (CAMS) operational forecasts of SILAM https://regional.atmosphere.copernicus.eu/ (last access: 26 April 2025). The simulation was driven by ECMWF ERA5 meteorology and nested into global SILAM simulations for the corresponding period. The European model setup generally followed the CAMS configuration (Colette et al., 2025), as of 2013, with the MACC anthropogenic emission inventory (Kuenen et al., 2011) for 2007. The global simulations closely followed the corresponding operational setup of Sofiev et al. (2020). From the results of the regional run, we extracted concentrations and depositions of PM2.5, NH3, HNO3, NH4NO3 for the site location and the time period of the measurements performed by Gallagher et al. (1997), allowing a direct comparison of modelled and measured time series.
The second simulation applied an idealized single-column setup to explore the difference between the particle fluxes at the reference height and the actual deposition fluxes at the surface. We simulated the 1D case with the disabled regular transport and wet deposition processes, thus keeping only gas-particle partitioning, vertical diffusion, settling of particles, and dry deposition. The simulation had a vertical resolution of 1 m close to the surface, to enable explicit evaluation of profiles of vertical fluxes and actual deposition. Since the SILAM deposition model for smooth and water surfaces (Kouznetsov and Sofiev, 2012) has no tuning parameters, the simulations were performed over water picking a location in Northern Sea (56° N, 0° E). The simulation was driven with the hourly meteorological fields of ERA5 (vertical profiles of wind, temperature and humidity) for 72 h starting from 1 June 2005. The meteorological fields were used to derive parameters for dry deposition, vertical turbulent diffusion, and gas-particle equilibrium. The domain extended up to 250 m above the surface, at which height a zero-flux boundary condition was enforced.
In both simulations NH4NO3 aerosol was represented with a single bin. For the Speulder case, 0.3 µm dry diameter was used to match the observed size range, while for the second case 0.7 µm dry diameter was used, as in the operational SILAM air quality simulations.
The local equilibrium between NH3, HNO3, and NH4NO3 was enforced at each model time step. To separate diffusion- and chemistry-driven fluxes, we introduced a gaseous chemically-inert substance with diffusion characteristics equivalent to those of SO2. For such a gas, the constant-flux assumption is fulfilled in 1D simulations. Then the aerodynamic resistance between two adjacent layers could be evaluated from the deposition flux of the pseudo-SO2 and the difference in its concentrations between the levels. Having the aerodynamic resistance, one can evaluate the diffusion-driven vertical flux of all species from gradients of their concentrations at the corresponding levels.
Since the model uses a process split, it is important to make sure that the order of the processes and the time step of the simulations does not affect the results. To confirm it, we have performed a series of simulations with time steps from 5 s to 10 min and different thicknesses of the vertical levels.
The gas-particle equilibrium in SILAM is established instantly. To investigate the effect of this assumption, additional simulations were performed with the equilibrium relaxation time varying from zero up to 10 000 s.
The particle deposition scheme in SILAM (Kouznetsov and Sofiev, 2012) predicts deposition velocities for sub-micron particles of a fraction of a millimeter per second. At the same time, other schemes fitted with the data of field experiments (Zhang et al., 2001; Emerson et al., 2020; Pleim et al., 2022) predict much higher deposition velocities, . Consider a simulation of one of the experimental datasets used to justify high deposition velocities. Figure 1a shows a sketch1 of the particle-fluxes time series observed by Gallagher et al. (1997) above a coniferous forest at the Speulder site in the Netherlands on 29–30 June 1993. The quantity Vds is so-called surface deposition velocity which is the apparent deposition velocity at the measurement location compensated for aerodynamic resistance between the measurement height and the roughness height. For the SILAM simulation the difference between Vds and Vd,a for the particles is negligible due to slow particle deposition in the model. Other panels in Fig. 1 show the concentrations and deposition fluxes of the SILAM simulation for the same time period and location. The model concentrations are those for the near-surface model layer of 25 m thick.
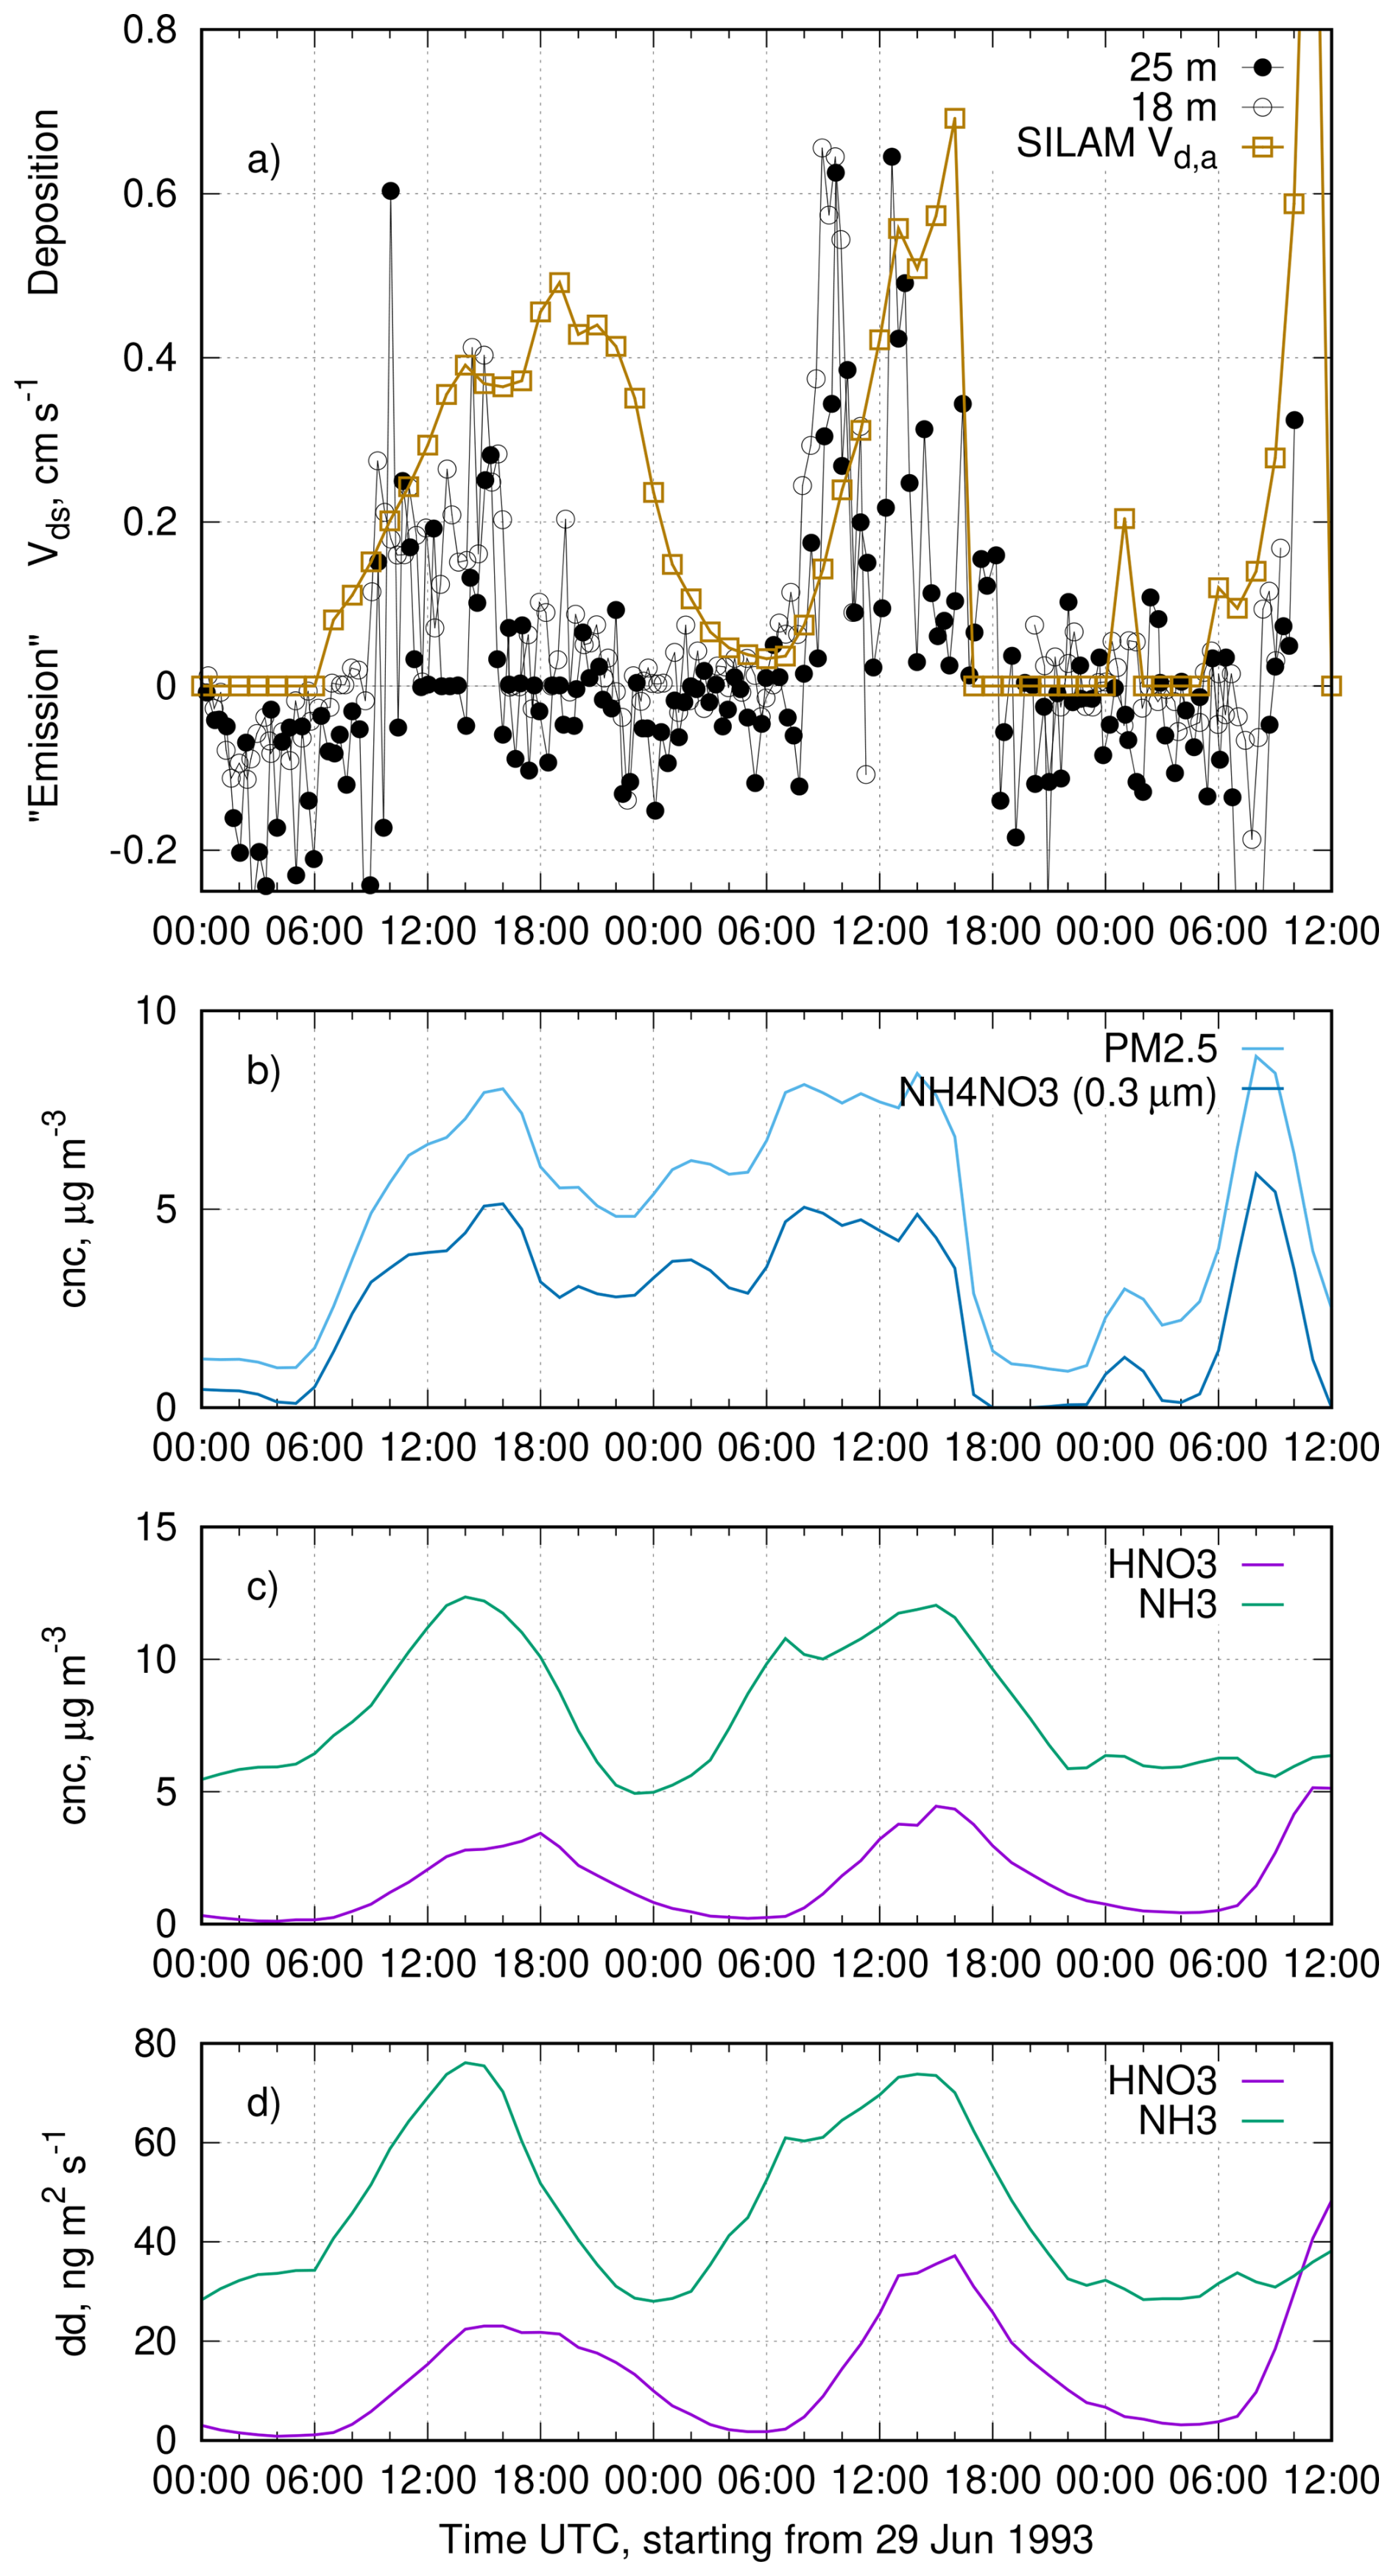
Figure 1Observed “surface deposition velocity” Vds and simulated apparent deposition velocity, concentrations and deposition fluxes of the key species in the campaign of Gallagher et al. (1997). (a) A sketch of the timeseries of aerosol fluxes observed by Gallagher et al. (1997, Fig. 1 there) with an overlay of the apparent deposition velocity derived from SILAM, (b) SILAM-predicted concentrations of NH4NO3 and total PM2.5; (c) SILAM-predicted concentrations of HNO3 and NH3; (d) SILAM-predicted dry deposition fluxes of HNO3 and NH3.
The simulated time series of PM2.5 and NH4NO3 indicate that during the considered period, concentrations of NH3 and HNO3 were high enough to allow for particulate NH4NO3 to be present. Since the deposition rates of both gases are much higher than that of NH4NO3, the downward particle flux was largely dominated by decomposition of NH4NO3 near the surface and the subsequent deposition of NH3 and HNO3. This very process was hypothesised to be the reason for the observed fluxes by Nemitz and Sutton (2004). The periods of observed strong aerosol “deposition” fluxes closely correspond to periods when the concentrations of NH4NO3 and both gases were high in the model. Under these conditions, the modelled deposition flux is controlled by intensively depositing HNO3 and NH3. The resulting near-surface deficit of the gases shifts the gas-particle partitioning and causes disintegration of NH4NO3, which, in turn, creates a net downward flux of the aerosol that is close to the observed fluxes. For comparison, we have plotted an apparent deposition velocity Vd,a deduced from the simulation (Fig. 1a) as if the total particle flux was fully controlled by the deposition of HNO3. This apparent deposition velocity can be deduced from the concentration of and the dry deposition flux at the surface reported by the model.
The ratio of molar masses M is needed to convert the deposition mass flux of HNO3 to the equivalent mass flux of NH4NO3.
We have chosen a concentration threshold for NH4NO3 of 1 µg m−3 as a criterion of abundance of particulate phase. Without this threshold, the division of small values caused excessive noise in the time series. The observed triple-peak pattern and the magnitude of the simulated Vd,a timeseries is well reproduced by the model. The imperfect timing of the peaks can be attributed to the uncertainties in the model, imperfect emission inventories, limited representativeness of point-wise observations and 0.1° grid cell, as well as differences between the ERA5 meteorology and the actual weather conditions at the campaign site.
The temporal evolution of a system where NH3, HNO3, and NH4NO3 interact to form an equilibrium has been studied in a single-column SILAM simulation. The simulation was initialised with a constant molar mixing ratio of NH4NO3 corresponding to a concentration of 5 µg m−3. Figure 2 shows the evolution of the vertical profiles of the concentrations for the three compounds, as well as their deposition rates and vertical fluxes at 2 m. The apparent deposition velocities of the species, i.e. their vertical fluxes normalised with the corresponding concentrations, are plotted in Fig. 2f.
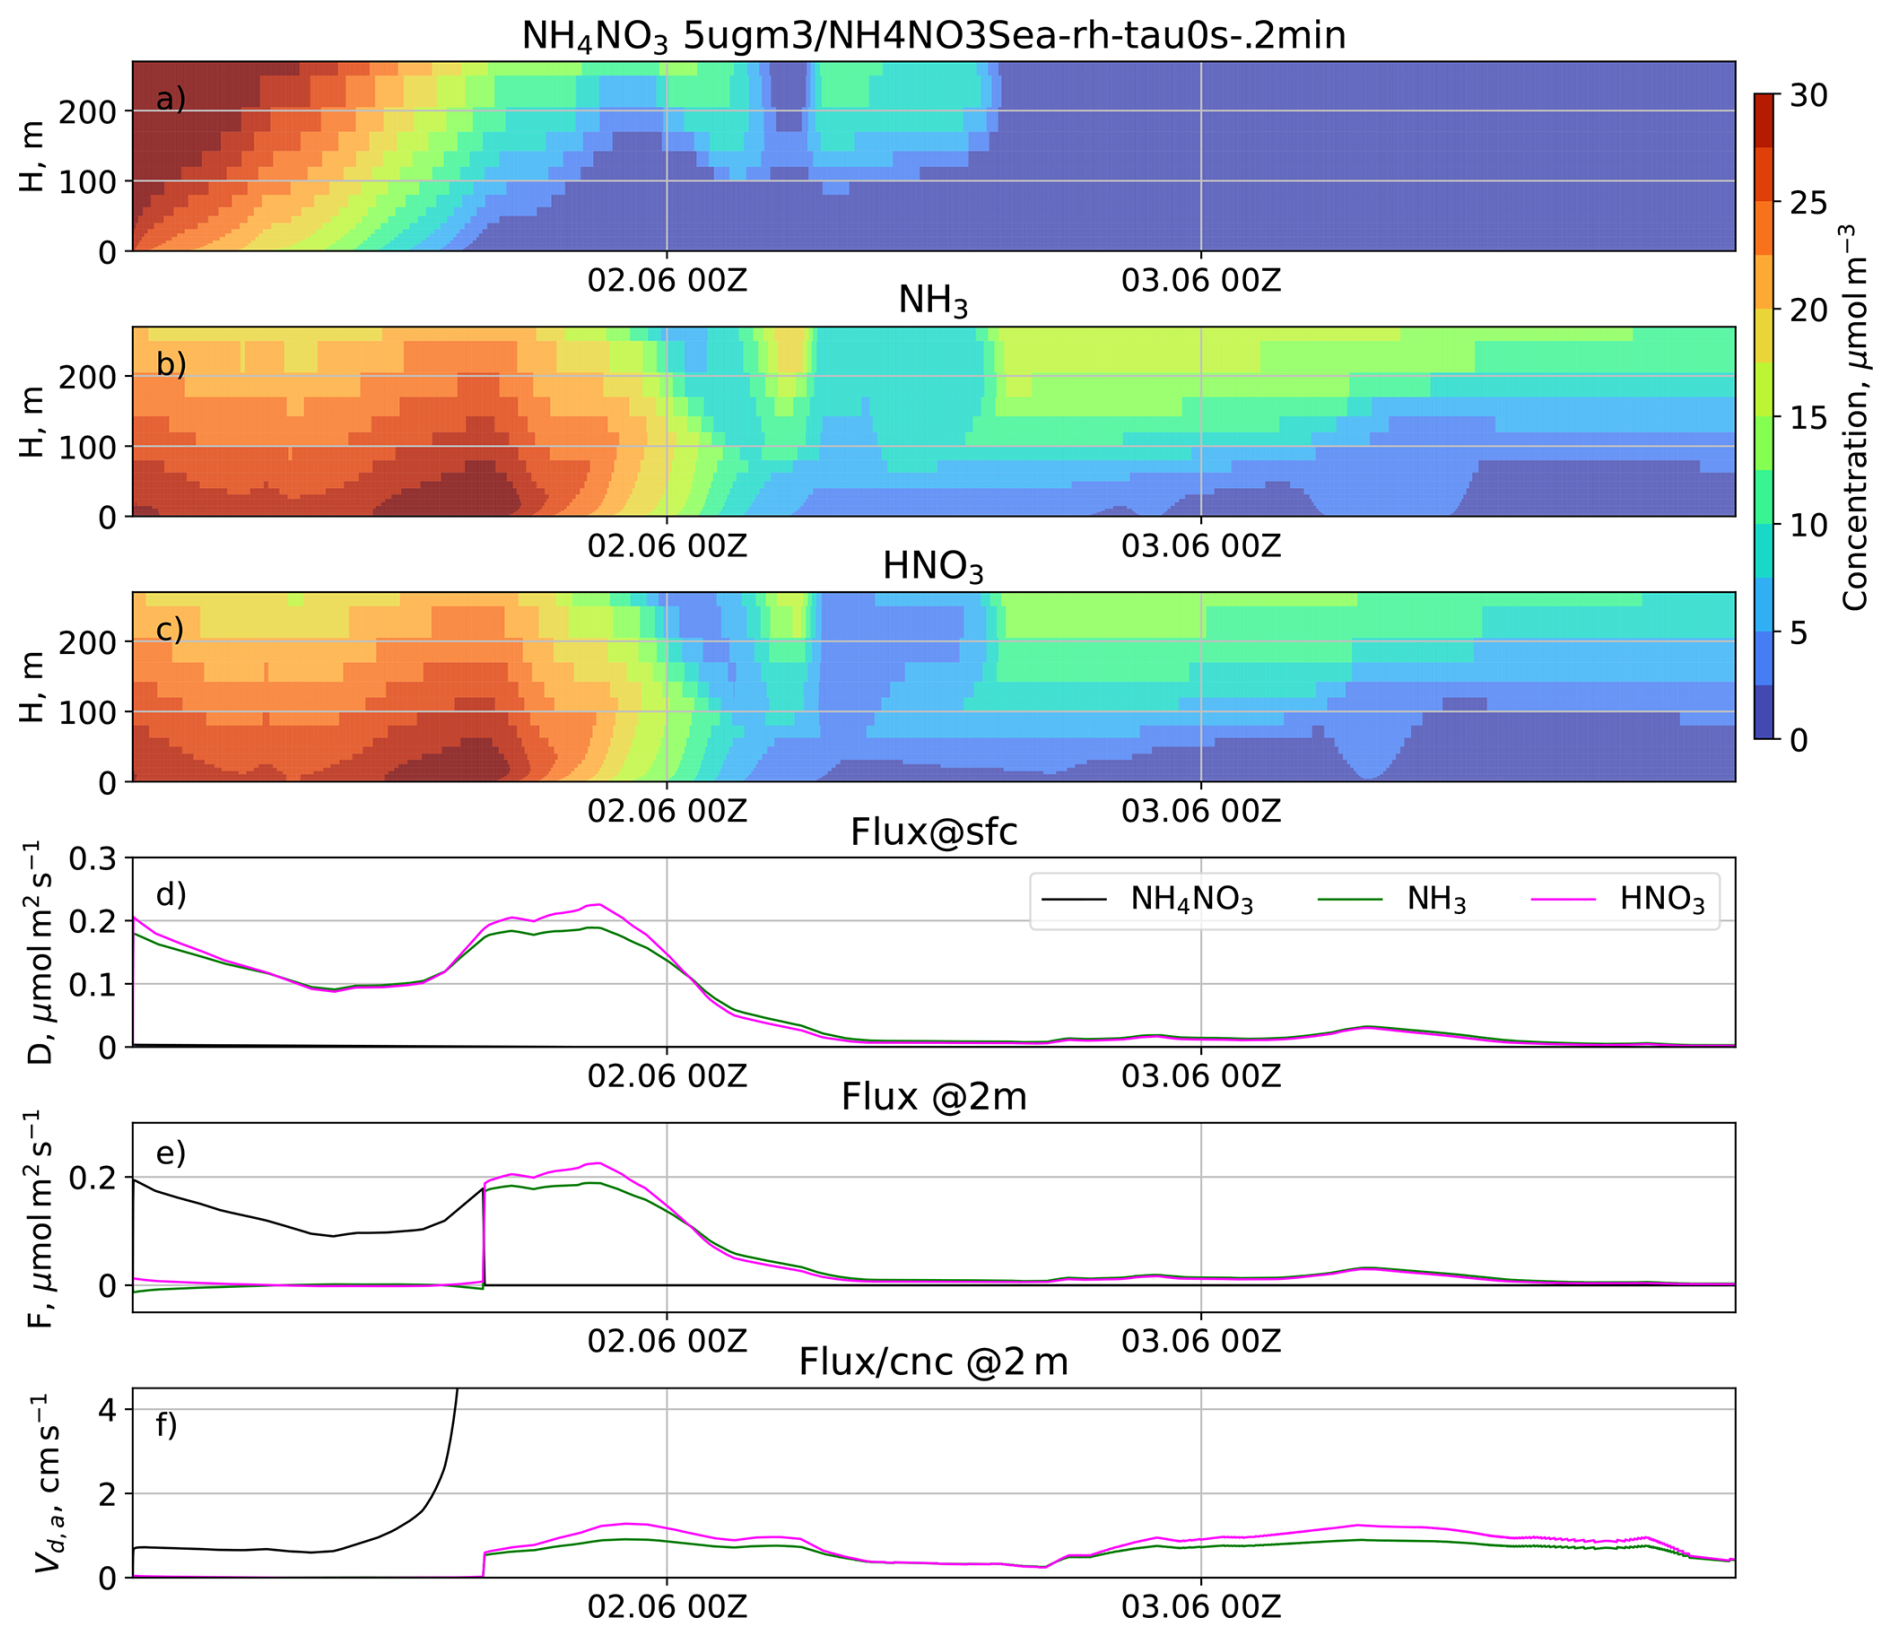
Figure 2The temporal evolution of vertical profiles of concentrations of ammonium NH4NO3 (a), NH3 (b), and HNO3 (c) in the model experiment, and corresponding time series of the deposition fluxes at the surface (d), the downward fluxes at 2 m above the surface (e), and apparent deposition velocity at 2 m (f).
As seen in Fig. 2, the initial NH4NO3 immediately partly decomposes to form an altitude-dependent equilibrium with the gases NH3 and HNO3. The deposition fluxes of the gases are mostly controlled by their respective concentrations in the lowest layer, and gradually decrease as the surface layer becomes depleted. The deposition flux of sub-micron NH4NO3 is several orders of magnitude smaller than that of the gases. While the equilibrium allows for the existence of NH4NO3 at the domain bottom, there is a substantial downward aerosol flux replenishing the decomposed amount in the lowest model layer. A minor upward flux of NH3 (panel e) is due to its somewhat slower deposition rate compared to HNO3 in the simulation. As a result, the disintegration of NH4NO3 (controlled by the gas-phase removal rate) produces more NH3 than becomes deposited, so the excess NH3 diffuses upwards.
The apparent deposition velocity, which would be reported by flux measurements at 2 m above the surface, is about 1 cm s−1 for most of the period, matching the one observed in many field campaigns used by Pleim et al. (2022). However, the simulations show that the apparent deposition velocity originates from the chemical decomposition of NH4NO3 and has no relation to the process of deposition of fine particles.
A remarkable feature of the simulated particle flux is that it is not proportional to the corresponding concentration. Indeed, once the NH4NO3 concentration drops (panels a–c), the apparent deposition velocity of NH4NO3 increases and, theoretically speaking, approaches infinity at the moment when the NH4NO3 concentration tends toward zero (panel f). In reality, infinite apparent deposition velocities are not found in outdoor experiments due to the presence of other aerosols and finite gas-particle conversion rates.
As long as NH4NO3 is present in the lowest layer, the fluxes of both gases are also heavily affected by the aerosol decomposition, which replenishes the gases while they are deposited. When NH4NO3 vanishes, so does the supporting mechanism that kept the gaseous concentrations stable, and the downward fluxes of both gases become proportional to their concentrations. Therefore, the concept of deposition velocity is not only inapplicable to NH4NO3 fluxes, but also to the fluxes of NH3 and HNO3, as long as NH4NO3 is present.
In this section, we consider implication of presence of ambient semi-volatile aerosols on particle fluxes and apparent deposition velocities.
5.1 Idealised systems with gas-particle equilibrium
The deposition process described above is shown in Fig. 3. The downward flux of particles is controlled by gas-phase deposition at the surface rather than particle deposition. The resulting near-surface deficit of the gases is replenished via particle-to-gas conversion, which, in turn, creates a deficit of aerosols, leading to a net downward flux of ammonium nitrate. Quite evidently, the presence of any semi-volatile substance with a high deposition rate of the gas phase will lead to the same result: the aerosol flux at a reference height will be controlled by gaseous deposition and particle-to-gas conversion.
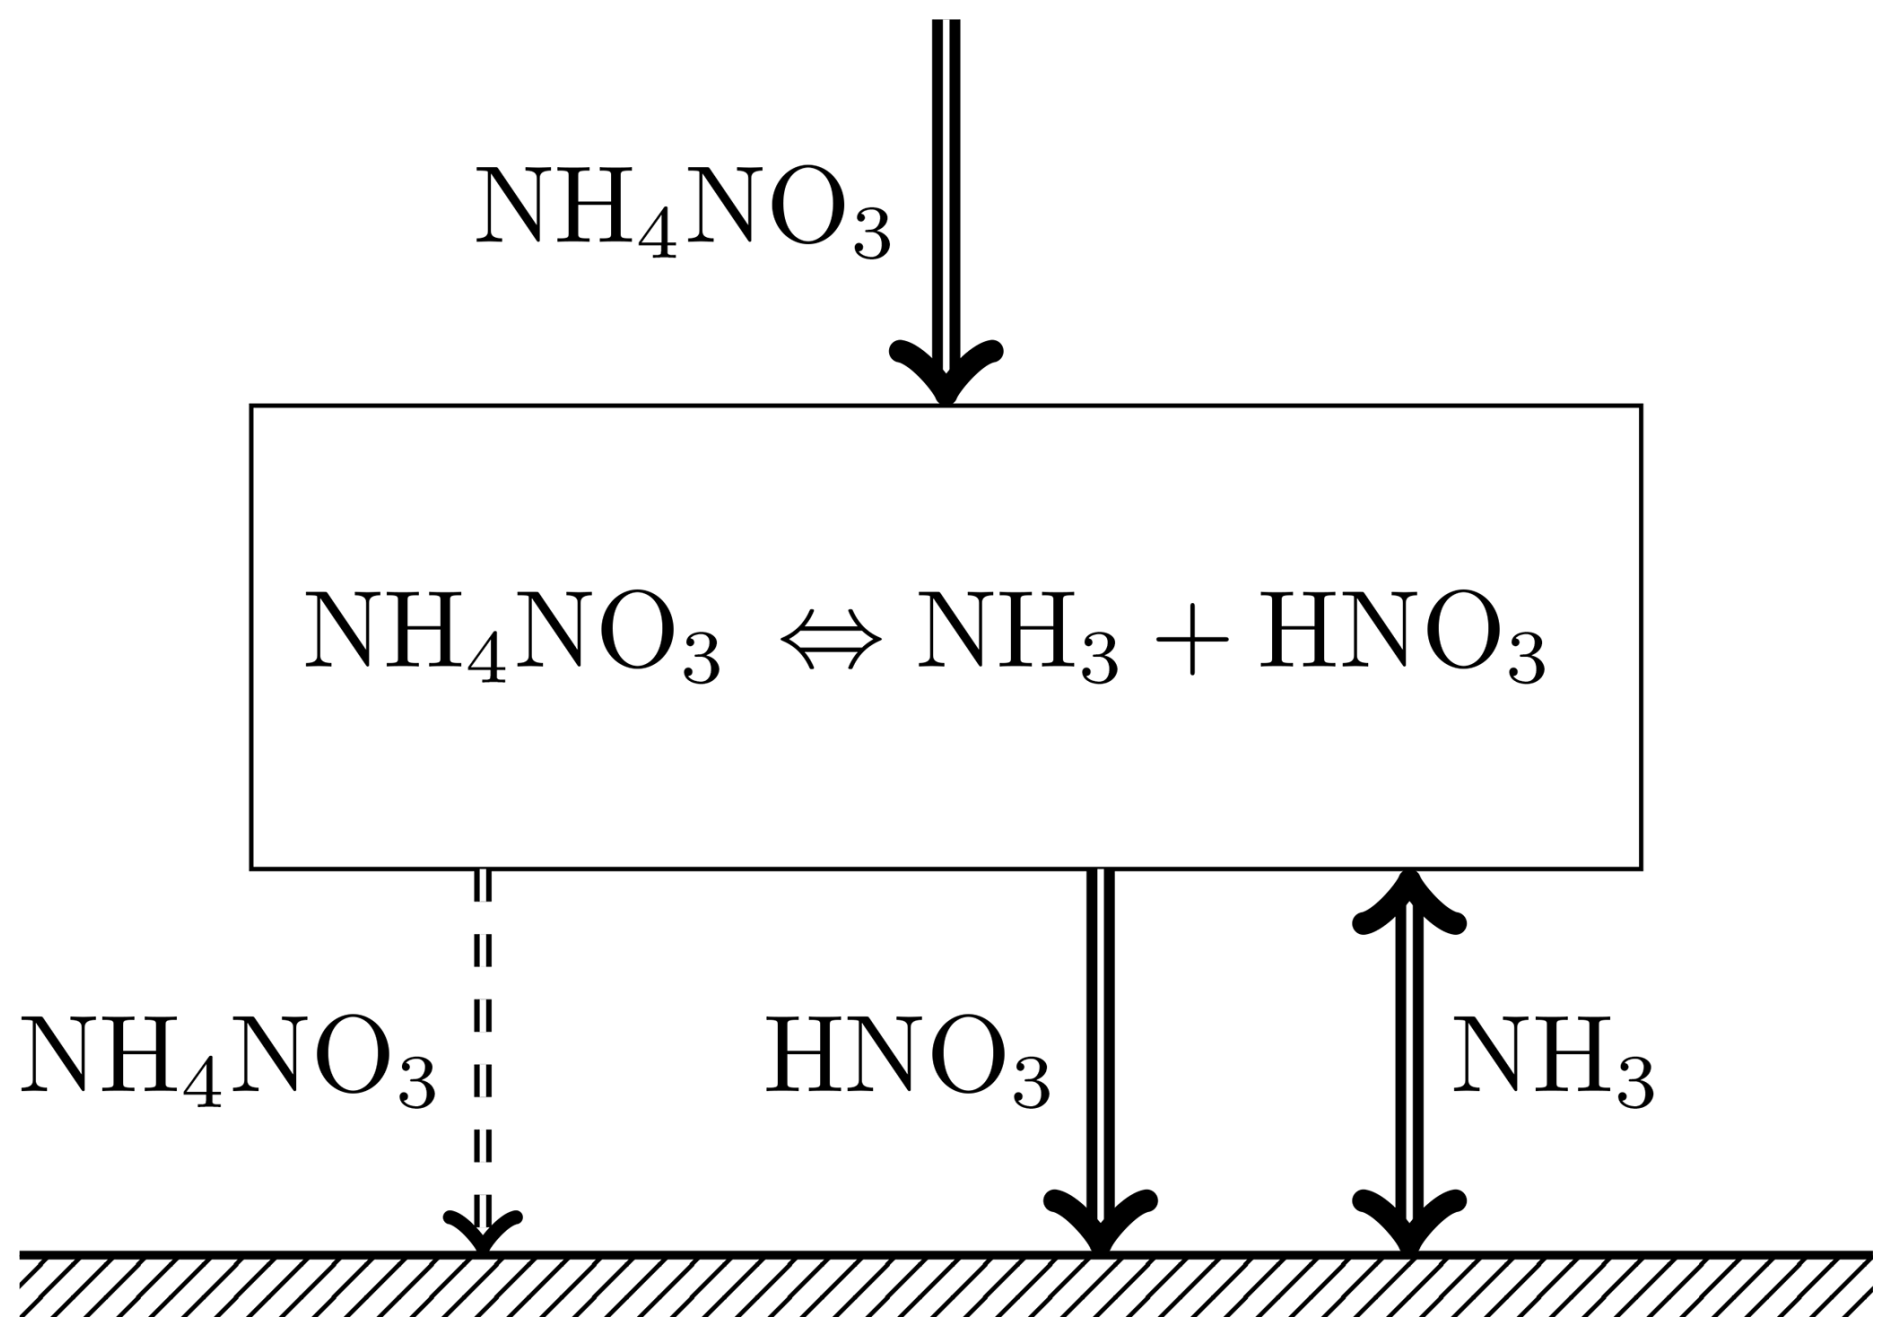
Figure 3The process of ammonium nitrate deposition onto the surface. The thickness of the arrows qualitatively represents the magnitude of the flux. NH4NO3 flux to the surface appears only if the concentrations of gases at the surface allow for NH4NO3 existence
While it is clear that gas-particle conversion breaks the proportionality between the fluxes and concentrations for both phases, the question arises: What concentration of a semi-volatile species is needed to dominate the net particle downward flux? To answer this question, let us consider a mixture of NH4NO3 and an inert sub-micron aerosol with a deposition velocity of Vp=0.1 cm s−1 and a concentration of Cp. The presence of ammonium nitrate implies that the concentrations of NH3 and HNO3 are sufficiently high for its formation, i.e. several µg m−3, depending on the temperature. For such a system, the net downward particulate flux at the reference height will be a sum of the fluxes of the inert aerosol and ammonium nitrate:
The apparent aerosol deposition velocity can be computed as a ratio of the downward flux and aerosol concentration. Assuming that NH3 is deposited slower than HNO3, one obtains that
If the ammonium nitrate concentration is small compared to Cp, the apparent deposition velocity for the total aerosols becomes simply:
and the requirement of the small disturbance of the deposition velocity reads as:
This condition does not depend on (as long as it is small enough) and, since cm s−1 and Vp=0.1 cm s−1, leads to a requirement for the concentration of the inert aerosol Cp≫100 µg m−3. Such concentrations of inert aerosols are rare even in highly polluted locations. Therefore, in a vast majority of real-life cases, even a minor presence of ammonium nitrate in the air guarantees that the apparent deposition velocity of particles is heavily affected by the particle-to-gas conversion near the ground.
5.2 Effect of finite gas-particle equilibration kinetics
The above calculations were performed assuming instant gas-particle conversion. The actual conversion rates depend on the features of the semi-volatile substance(s) and atmospheric conditions. Equilibration times have been considered by Meng and Seinfeld (1996) for inorganic aerosols and by Shiraiwa and Seinfeld (2012) for organic aerosols. The main mechanism for such equilibration is condensation/evaporation of material to/from the particle surface. The rate of this process is controlled by the diffusivity of the gases and by the availability of particle surface. The latter is a function of particle size and concentration.
Meng and Seinfeld (1996) concluded that for the considered cases of ambient environment, except for very low relative humidity conditions when particles stayed dry, the conversion of nitric acid to nitrate was completed within 1000 s. This time scale is probably relevant for most of ambient conditions, since there is strong evidence for ammonium-nitrate particles not crystallizing down to a 10 %–20 % relative humidity (Dougle et al., 1998), while in the simulations of Meng and Seinfeld (1996) deliquescence occurred at 50%.
For the validity of instantaneous gas-particle partitioning of organic compounds, Shiraiwa and Seinfeld (2012) conclude that it is clearly established “for relatively high volatility compounds partitioning into liquid particles, but … breaks down for partitioning of low and semi-volatile compounds into liquid and semi-solid particles”. For liquid particles the equilibration time scale is also quite short and approaches 1000 s only for particle sizes closer to 1 µm at PM concentrations below a few µg m−3.
Using a 1000 s equilibration time as a conservative estimate, one can conclude that the vertical flux of particles with true deposition velocity of 0.1 cm s−1 is affected by the gas-particle conversion at a reference height of 1 m, and explicit calculations are needed to reproduce it.
To evaluate the effect of the resolution and particle kinetics on the simulated particle fluxes and depositions, we implemented a finite relaxation time for gas-particle partitioning into SILAM. The idealized case simulations of Sect. 4 were subsequently repeated with several prescribed relaxation times. Sensitivity simulations were performed for the fine-scale vertical layers, used in Sect. 4, and for the coarser vertical layers typically used for the regional air quality simulations: four layers of 25, 50, 100 and 200 m thick. The vertical fluxes were evaluated at the interface between the lowermost levels of the coarse vertical and the closest interface of the fine-resolution one (25 m above the surface).
The sensitivity simulations were performed with identical initial conditions and meteorological forcing for both verticals and three gas-particle equilibration times of τ=0, 100 and 10 000 s. For each case, the model time step was varying to explore the effect of the time split between the gas-particle transformation and diffusion-deposition processes. Time steps of 12 s, 30 s, 1 min, 2 min, 5 min, 10 min, and 30 min were tested for all setups. For each simulated case, plots similar to the one in Fig. 2 were produced (see Supplement).
In all cases, the removal of ammonium and nitrate was driven by gas-phase deposition onto the surface, and the corresponding rates were quite insensitive to the vertical resolution, as long as the model time step was sufficiently short: despite the implicit diffusion implementation, a finer vertical resolution required a shorter time step.
Large upward fluxes of the gas-phase compounds visible in the beginning of the simulations with fast equilibration while both phases co-exist, were artificial. The flux arises from the difference in equilibrium gas-phase concentrations different levels due to different temperatures and humidity provided by the meteorological model. This effect was not seen for 2 m fluxes (Fig. 2), since the layers above and below the flux sampling point had the same temperature and humidity.
Long equilibration time substantially reduces the gas-phase deposition at the very beginning of the simulations due to lack of the gas phase to deposit. One can also notice some 20 % lower peak deposition rates for τ = 10 000 s compared to the instant equilibration case, due to a slower conversion of particles to depositing gases. At τ=100 s the difference in fluxes and depositions between the instant and non-instant conversion vanishes.
The particle fluxes and apparent deposition velocities at the reference height appear to be quite sensitive to the relaxation time. For shorter relaxation times, gas-particle conversion occurs closer to the surface, so that the deposition of gases is maintained by the downward flux of particles, leading to quite high apparent deposition velocities. The vertical fluxes of particles at the reference height deviate from corresponding surface fluxes even with an unrealistically long relaxation time of several hours. The high sensitivity of the particle fluxes and apparent deposition velocities on the gas-particle conversion rates confirm that these parameters cannot provide a reliable constraint for a deposition parameterization in atmospheric models.
Considering the low sensitivity of deposition fluxes and reference height concentrations of both gases and aerosols to the relaxation time, one can conclude that for air quality and deposition assessment, the instant gas-particle conversion is a valid assumption. There is no need to account for the kinetics of the process unless one is interested in resolving the profiles of gas and particle fluxes separately.
5.3 Intermittency, sign and scaling of particle fluxes
The intermittency of ambient particle fluxes can be clearly seen in the observational time series obtained with fast-response instruments, such as those reported by Gallagher et al. (1997) and many others (e.g. Grönholm et al., 2009; Vong et al., 2004; Deventer et al., 2015; Petroff et al., 2018). One plausible explanation is that the particle flux is shifting back and forth between the gas- and particle-phases driven by changes in ammonia and nitrate concentrations or by changing ambient temperature and humidity, which shift the gas-particle equilibrium point.
In many cases, the observed fluxes of particles change their signs manifesting the upward diffusion of aerosols. This can occur due to particle formation near the surface if, for instance, ammonia evaporates from soil prompting the formation of ammonium nitrate (Nemitz et al., 2009).
So far, we have considered externally mixed particles. In the presence of internally mixed particles with a relatively stable core covered with ammonium nitrate, the flux direction may depend on the particle sizes. Larger particles enriched with ammonium nitrate would then follow the surface flux of ammonia. Indeed, if the gas concentration drops below its saturation level, the ammonium nitrate shells evaporate, resulting in a shrinkage of the particle size and the formation of an opposite-sign flux of smaller particles. This mechanism, explored by Ryder (2010), explains the rather strong anti-correlation of particle fluxes of different sizes reported by Deventer et al. (2015) and Petroff et al. (2018).
Several field studies report a linear scaling of particle fluxes with friction velocity u* (Gallagher et al., 1997; Pryor, 2006; Contini et al., 2010; Lavi et al., 2013). This scaling is consistent with the conclusion that the particle fluxes are controlled by the fast depositing gases, whose deposition scales linearly with the turbulent diffusion intensity in the surface layer.
5.4 Is the flux proportional to the concentration?
The vast majority of experimental studies on particle fluxes report the fluxes in terms of the apparent deposition velocity, without explicit verification of proportionality between the flux and the concentration. While the proportionality rather naturally holds for well-controlled wind-tunnel studies, it is not guaranteed for ambient particles in outdoor experiments.
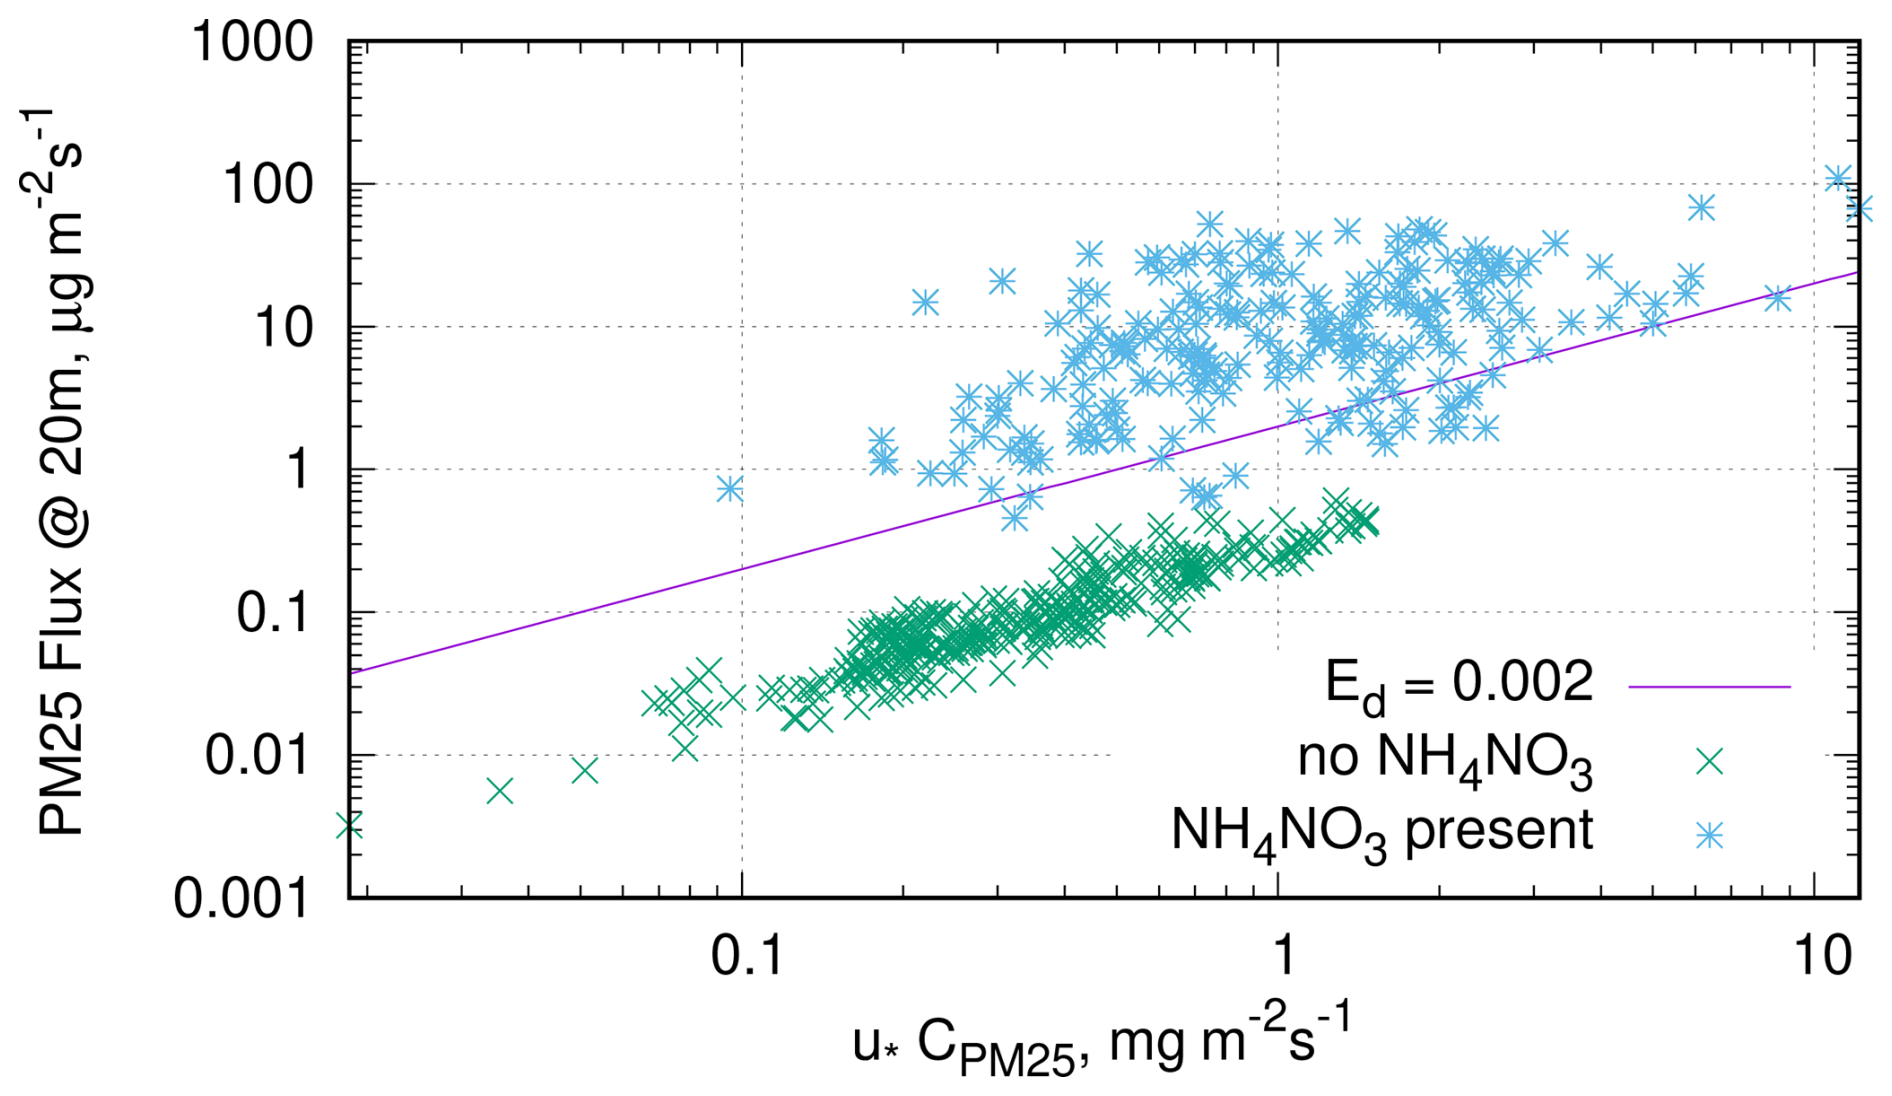
Figure 4Hourly downwards particle fluxes vs. concentrations multiplied with friction velocity, simulated for the Speulder site in the Netherlands for the month of June 1993, same simulation as in Fig. 1. Different markers used for the cases with and without NH4NO3 particles.
To illustrate the non-trivial nature of this requirement, consider a scatter plot of PM2.5 fluxes at a reference height vs. the corresponding PM2.5 concentrations (Fig. 4), simulated by SILAM for the month of the Gallagher et al. (1997) study (Sect. 3). We use different markers for the cases with and without presence of NH4NO3 component in PM2.5. As a reference, we plotted a line corresponding to the dimensionless deposition velocity suggested by Wesely et al. (1985) for neutral and stable stratification, i.e.
The points in the plot form two clearly distinguishable clusters corresponding to the two aforementioned regimes. The lower cluster corresponds to the flux of the particles in the absence of ammonium nitrate, rendering them inert in the model. This cluster manifests a high correlation between the flux and the concentration. The residual scatter is caused by the different size distributions and water contents of the PM2.5 components, as well as the varying meteorological conditions. The upper cluster corresponds to the regime of gas-phase controlled particle flux: much higher fluxes, a two orders of magnitude larger scatter of the values, and a much less pronounced dependency on the concentration.
The regressions calculated over these two clusters separately differ by two orders of magnitude, and are also different from the regression that one would get over the whole dataset. If one applies the definition (2) to every single data point and averages the resulting Vda the result would be clearly different from the one for the regression.
We have not found any publication of a scatter plot similar to one in Fig. 4 made for observed fluxes. Nether we have found attempts to examine the proportionality between the flux and the concentration in outdoor experiments in some other way. The time series in many studies (e.g. Wesely et al., 1985; Petroff et al., 2018) indicate that the correlation between fluxes and concentrations is rather low in outdoor studies. The lack of experimental datasets with a confirmed proportionality between flux and concentration is a clear gap in current knowledge.
5.5 Abundance of ammonium-nitrate
To estimate the frequency of nonzero concentrations of ammonium nitrate in the surface layer, we analyzed SILAM operational air quality forecasts for 2024 performed within the Copernicus CAMS2-40 regional operational service (Colette et al., 2025). The service consists of 11 European air quality models that produce daily forecasts of atmospheric pollution at a spatial resolution of 0.1° × 0.1° and a temporal resolution of one hour. The forecasts have been extensively evaluated against multiple types of observational data (https://atmosphere.copernicus.eu/regional-services, last access: 15 April 2025, https://regional-evaluation.atmosphere.copernicus.eu/, last access: 15 April 2025). Apart from the regulated air pollutants, the model performance has been evaluated for a wide range of atmospheric trace gases and aerosols (Fagerli et al., 2023). The service provides the most reliable forecasts of atmospheric pollution in Europe, and SILAM is among the best performing models of the ensemble.
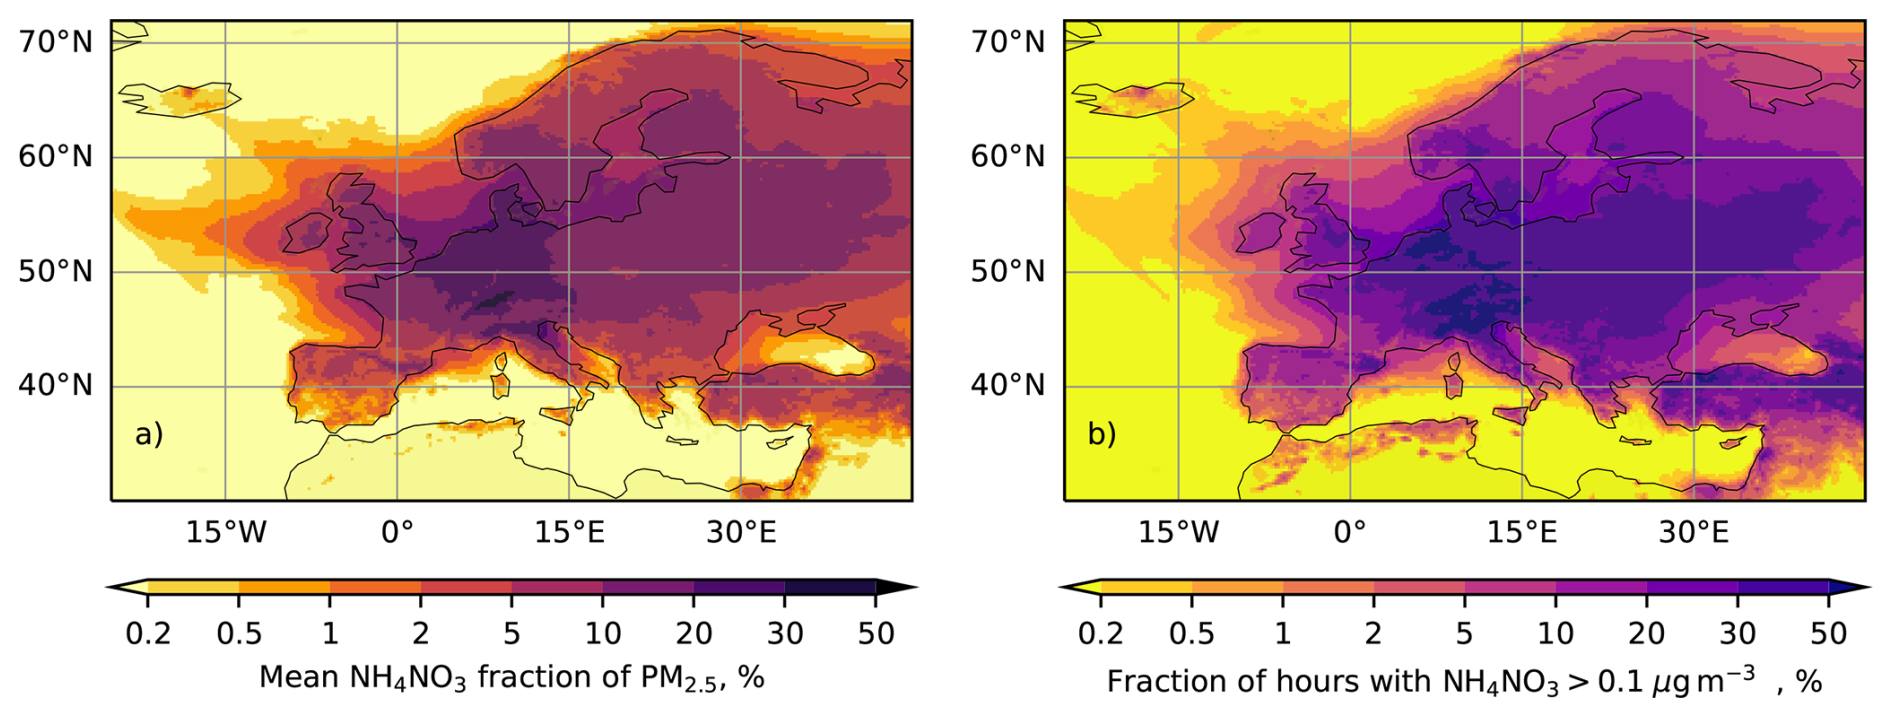
Figure 5Mean fraction of NH4NO3 in PM2.5 for the year of 2024 (a), and fraction of hourly average values with NH4NO3 exceeding 0.1 µg m−3, according to SILAM forecasts made for the CAMS2-40 regional service
For the analysis, we extracted the near-surface concentrations of PM2.5 and NH4NO3 and evaluated the mean contribution of ammonium nitrate to total PM2.5 (Fig. 5a). One can see that for most of the European territory, the fraction of ammonium nitrate is within the range of 10 %–30 %, whereas the mere presence of ammonium nitrate is an indicator of the gas-particle equilibrium strongly affecting the deposition fluxes. The frequency of such occurrences was estimated from the fraction of the hourly NH4NO3 concentrations exceeding 0.1 µg m−3 (Fig. 5b). For most of the European territory, NH4NO3 aerosol is present in the air for more than 30 % of time. The particle fluxes over the Speulder forest site in the Netherlands studied by Gallagher et al. (1997), are impacted by NH4NO3 for more than 50 % of the time, at the Hyytiälä site in central Finland (Buzorius et al., 2003; Pryor, 2006; Grönholm et al., 2007; Pryor et al., 2009; Rannik et al., 2009) – for more than 20 % of the time, at the Waldstein site in Bavaria (Deventer et al., 2015) for over 50 % of the time, and at the Yatir forest research station in Israel (Lavi et al., 2013) for 10 %–20 % of the time.
Based on the above findings and considerations one can formulate recommendations on a consistent way to simulate particles and semi-volatile compounds and their depositions in chemistry-transport models. For such simulations, a model should have implementation of the gas-particle partitioning and deposition processes for both phases. An instant-equilibrium model for partitioning provides a good approximation if one is interested in bulk depositions of ammonium and/or nitrates. For applications analyzing profiles of gaseous and particulate fluxes, more sophisticated schemes with finite conversion rates may be preferable.
A dry deposition scheme of the form (1) should not use values of “effective deposition velocity” or apparent deposition velocity obtained for poorly-known particles. Application of such values would heavily over-deposit inert particles, while being applied to semi-volatile substances it would enforce the false linear relationship between corresponding fluxes and concentrations.
Parameterizations of Vd should be calibrated and evaluated with the data on particles, for which the deposition velocity concept is applicable, i.e., inert aerosols not affected by chemical of phase-transition processes. Such parameterizations can be derived from wind tunnel studies with well-identified and controlled particle features. One can also use mechanistic considerations to obtain the Vd dependencies. Such schemes have a very limited number of tuning parameters and agree well with the Vd values observed for passive particles (Slinn, 1982; Kouznetsov and Sofiev, 2012).
Ambient observations of aerosol concentrations and fluxes, while not providing the deposition fluxes themselves, can provide invaluable material for model evaluation. One should just use the full chemical and physical transformation schemes, as well as corresponding emission data, while simulating these fluxes.
Sensitivity studies reveal only a weak dependence of the deposition flux calculations on vertical resolution near the surface and the model time step. However, the first model layer of 10–20 m thickness can be suggested as a good compromise between simulation costs and accuracy. The model time step will, for the vast majority of cases, be decided by a relaxation time of this layer.
As demonstrated above, such a setup, while relying on seemingly very low deposition rates of aerosols, can successfully reproduce the observed fluxes of particles under ambient conditions. Moreover, together with gas-particle partitioning, this approach reproduces observed intermittency and bidirectional fluxes of particles above natural surfaces.
We identified an inconsistency in using the concept of deposition velocity in the literature. For modeling applications, the concept of deposition velocity implies a proportionality between the deposition flux and the atmospheric concentration, where Vd is a proportionality coefficient. On the other hand, many experimental studies define the deposition velocity as a ratio of observed downward flux and concentration, specific for each measurement (“apparent deposition velocity” Vd,a). We have not found any experimental study where the proportionality between the observed fluxes and the concentrations was explicitly examined across the campaign. Conversely, the time series available from some studies suggest that the correlation between fluxes and concentrations is rather low.
There are several mechanisms that break the proportionality. We considered one of them, the evaporation of particles between the measurement height and the surface due to the particle-to-gas transition of ammonium nitrate. SILAM model simulations of idealized and real-life cases demonstrated that the vertical flux of particles is often not proportional to the particle concentration at a reference height.
The SILAM model, with the particle deposition scheme based on first principles and explicit gas-particle equilibration for ammonium nitrate, is capable of reproducing observed fluxes of ambient aerosols that correspond to apparent deposition velocity of 1 cm s−1, usually reported by outdoor studies. At the same time, the SILAM aerosol deposition velocity is about 0.01 cm s−1. The model also reproduces the intermittent nature and temporal evolution of the observed particle fluxes.
We have shown that even very small amount of ammonium nitrate is sufficient to break the flux conservation because it is broken rather by the presence of sufficiently high concentrations of nitric acid and ammonia, which trigger the gas-particle conversion. Copernicus AQ forecasts for Europe show that ammonium nitrate is present in the air for about half of the time, which implies that at least a fraction of outdoor particle-flux measurements are affected by gas-particle conversion. In addition to ammonium nitrate, the presence of any semi-volatile substance may break the particle mass conservation near the surface.
In laboratory experiments, the nature of the aerosol is usually well known, so the assumption of particle conservation can be ensured. In ambient conditions, this assumption should be explicitly tested by evaluating whether the particle concentrations and corresponding fluxes are proportional to each other for each specific set of conditions. The effect of gas-particle conversion is sufficient to explain the 100-fold differences between the apparent deposition velocities obtained in different experiments for similar surfaces and aerosol sizes.
The concept of deposition velocity (in a sense of Eq. 1) can reduce the complexity of dry deposition schemes in models. However, in order to reliably reproduce particle fluxes and depositions of semi-volatile substances, a particle deposition scheme based on Vd should be accompanied with phase conversion calculations. Application of effective deposition velocities, derived as mean flux divided by mean concentration is by no means a replacement for explicit partitioning: since the proportionality is broken for semi-volatile substances, application of the effective deposition velocity to varying concentration or aerosol composition would lead to incorrect results.
Particle deposition schemes that were fitted with apparent deposition velocities (Zhang et al., 2001; Petroff and Zhang, 2010; Zhang and He, 2014; Emerson et al., 2020; Pleim et al., 2022) are bound to heavily overstate deposition fluxes of accumulation-mode passive particles. For ambient aerosols that include semi-volatile compounds, these schemes would enforce the non-existing linear relationship between fluxes and concentrations, which might be detrimental for the resulting simulations. Therefore, we recommend using Kouznetsov and Sofiev (2012) scheme or another physics-based scheme instead. The results of this paper could be reproduced with any simple scheme that predicts sufficiently small deposition velocities for particles in the accumulation mode, such as Slinn (1982) in the form given by the first edition of Seinfeld and Pandis (1998). However, such a scheme should be accompanied by the gas-particle partitioning of semi-volatile aerosol components if those are of interest.
The experimental data obtained for ambient conditions, where semi-volatile species break the aerosol mass and/or number conservation, the observed vertical fluxes cannot be directly used to infer the dry deposition velocity. Nevertheless, well-documented observations of ambient fluxes provide invaluable means for assessment of chemistry-transport models as a whole, when all relevant processes are considered. For such cases, the comparison of corresponding fluxes or concentrations would be much more beneficial than comparison of apparent deposition velocities.
The code of SILAM model that can be used to reproduce the results of the current study is available from GitHub https://github.com/fmidev/silam-model (last access: 6 June 2025) under the GPLv3 public license, which in particular allows for reusing the code in other models. The specific revision used for this paper has been archived at Zenodo https://doi.org/10.5281/zenodo.18782316 (SILAM team, 2026). The implementation of the particle dry deposition scheme (Kouznetsov and Sofiev, 2012) can be found from depositions.silam.mod.f90 file, and implementation of ammonium-nitrate partitioning in aerosol_dynamics_simple.f90.
The supplement related to this article is available online at https://doi.org/10.5194/gmd-19-1833-2026-supplement.
RK performed the numerical simulations and evaluations, wrote the initial text and prepared the figures. MS contributed to the case conceptualization, participated in writing and editing of the manuscript. AU and RH participated in the model development and editing the manuscript.
The contact author has declared that none of the authors has any competing interests.
The paper represents the authors' personal opinions and views, which might or might not agree with the positions of their organization.
Publisher's note: Copernicus Publications remains neutral with regard to jurisdictional claims made in the text, published maps, institutional affiliations, or any other geographical representation in this paper. The authors bear the ultimate responsibility for providing appropriate place names. Views expressed in the text are those of the authors and do not necessarily reflect the views of the publisher.
We would like to thank Yalda Fatahi, Evgenii Kadantsev, Julia Palamarchuk, Svyatoslav Tyuryakov, and Julius Vira from SILAM team for the fruitful discussions, Eiko Nemitz for the idea to look at the ammonium nitrate deposition process as a possible cause for the discrepancy, Tiia Grönholm and Ullar Rannik for their insights into aerosol-fluxes measurement techniques, Leiming Zhang and two anonymous reviewers for their valuable comments on the initial version of the manuscript submitted to Atmospheric Chemistry and Physics, Jason Williams and four anonymous reviewers for their comments on the present submission.
The study was funded by the taxpayers of the European Union via Horizon Europe-funded projects CAMAERA (grant no. 101134927) and RI-URBANS (grant no. 101036245) and by the taxpayers of Finland via the Research Council of Finland project VFSP-WASE (grant no. 359421), which we gratefully acknowledge.
This paper was edited by Jason Williams and reviewed by four anonymous referees.
Ahlm, L., Krejci, R., Nilsson, E. D., Mårtensson, E. M., Vogt, M., and Artaxo, P.: Emission and dry deposition of accumulation mode particles in the Amazon Basin, Atmos. Chem. Phys., 10, 10237–10253, https://doi.org/10.5194/acp-10-10237-2010, 2010. a
Blechschmidt, A.-M., Arteta, J., Coman, A., Curier, L., Eskes, H., Foret, G., Gielen, C., Hendrick, F., Marécal, V., Meleux, F., Parmentier, J., Peters, E., Pinardi, G., Piters, A. J. M., Plu, M., Richter, A., Segers, A., Sofiev, M., Valdebenito, Á. M., Van Roozendael, M., Vira, J., Vlemmix, T., and Burrows, J. P.: Comparison of tropospheric NO2 columns from MAX-DOAS retrievals and regional air quality model simulations, Atmos. Chem. Phys., 20, 2795–2823, https://doi.org/10.5194/acp-20-2795-2020, 2020. a
Brenot, H., Theys, N., Clarisse, L., van Gent, J., Hurtmans, D. R., Vandenbussche, S., Papagiannopoulos, N., Mona, L., Virtanen, T., Uppstu, A., Sofiev, M., Bugliaro, L., Vázquez-Navarro, M., Hedelt, P., Parks, M. M., Barsotti, S., Coltelli, M., Moreland, W., Scollo, S., Salerno, G., Arnold-Arias, D., Hirtl, M., Peltonen, T., Lahtinen, J., Sievers, K., Lipok, F., Rüfenacht, R., Haefele, A., Hervo, M., Wagenaar, S., Som de Cerff, W., de Laat, J., Apituley, A., Stammes, P., Laffineur, Q., Delcloo, A., Lennart, R., Rokitansky, C.-H., Vargas, A., Kerschbaum, M., Resch, C., Zopp, R., Plu, M., Peuch, V.-H., Van Roozendael, M., and Wotawa, G.: EUNADICS-AV early warning system dedicated to supporting aviation in the case of a crisis from natural airborne hazards and radionuclide clouds, Nat. Hazards Earth Syst. Sci., 21, 3367–3405, https://doi.org/10.5194/nhess-21-3367-2021, 2021. a
Businger, J. A.: Evaluation of the Accuracy with Which Dry Deposition Can Be Measured with Current Micrometeorological Techniques, J. Climate Appl. Meteor., 25, 1100–1124, https://doi.org/10.1175/1520-0450(1986)025<1100:EOTAWW>2.0.CO;2, 1986. a
Buzorius, G., Rannik, Ü., Nilsson, E., Vesala, T., and Kulmala, M.: Analysis of Measurement Techniques to Determine Dry Deposition Velocities of Aerosol Particles with Diameters Less than 100 Nm, Journal of Aerosol Science, 34, 747–764, https://doi.org/10.1016/S0021-8502(03)00025-9, 2003. a
Caffrey, P. F., Ondov, J. M., Zufall, M. J., and Davidson, C. I.: Determination of Size-Dependent Dry Particle Deposition Velocities with Multiple Intrinsic Elemental Tracers, Environ. Sci. Technol., 32, 1615–1622, https://doi.org/10.1021/es970644f, 1998. a
Chamberlain, A. C.: Transport of Gases to and from Surfaces with Bluff and Wave-like Roughness Elements, Quarterly Journal of the Royal Meteorological Society, 94, 318–332, https://doi.org/10.1002/qj.49709440108, 1968. a
Clough, W. S.: The Deposition of Particles on Moss and Grass Surfaces, Atmospheric Environment, 9, 1113–1119, https://doi.org/10.1016/0004-6981(75)90187-0, 1975. a
Colette, A., Collin, G., Besson, F., Blot, E., Guidard, V., Meleux, F., Royer, A., Petiot, V., Miller, C., Fermond, O., Jeant, A., Adani, M., Arteta, J., Benedictow, A., Bergström, R., Bowdalo, D., Brandt, J., Briganti, G., Carvalho, A. C., Christensen, J. H., Couvidat, F., D'Elia, I., D'Isidoro, M., Denier van der Gon, H., Descombes, G., Di Tomaso, E., Douros, J., Escribano, J., Eskes, H., Fagerli, H., Fatahi, Y., Flemming, J., Friese, E., Frohn, L., Gauss, M., Geels, C., Guarnieri, G., Guevara, M., Guion, A., Guth, J., Hänninen, R., Hansen, K., Im, U., Janssen, R., Jeoffrion, M., Joly, M., Jones, L., Jorba, O., Kadantsev, E., Kahnert, M., Kaminski, J. W., Kouznetsov, R., Kranenburg, R., Kuenen, J., Lange, A. C., Langner, J., Lannuque, V., Macchia, F., Manders, A., Mircea, M., Nyiri, A., Olid, M., Pérez García-Pando, C., Palamarchuk, Y., Piersanti, A., Raux, B., Razinger, M., Robertson, L., Segers, A., Schaap, M., Siljamo, P., Simpson, D., Sofiev, M., Stangel, A., Struzewska, J., Tena, C., Timmermans, R., Tsikerdekis, T., Tsyro, S., Tyuryakov, S., Ung, A., Uppstu, A., Valdebenito, A., van Velthoven, P., Vitali, L., Ye, Z., Peuch, V.-H., and Rouïl, L.: Copernicus Atmosphere Monitoring Service – Regional Air Quality Production System v1.0, Geosci. Model Dev., 18, 6835–6883, https://doi.org/10.5194/gmd-18-6835-2025, 2025. a, b, c
Connan, O., Pellerin, G., Maro, D., Damay, P., Hébert, D., Roupsard, P., Rozet, M., and Laguionie, P.: Dry Deposition Velocities of Particles on Grass: Field Experimental Data and Comparison with Models, Journal of Aerosol Science, 126, 58–67, https://doi.org/10.1016/j.jaerosci.2018.08.004, 2018. a
Contini, D., Donateo, A., Belosi, F., Grasso, F. M., Santachiara, G., and Prodi, F.: Deposition Velocity of Ultrafine Particles Measured with the Eddy-Correlation Method over the Nansen Ice Sheet (Antarctica), J. Geophys. Res., 115, 2009JD013600, https://doi.org/10.1029/2009JD013600, 2010. a
Deventer, M. J., Held, A., El-Madany, T. S., and Klemm, O.: Size-Resolved Eddy Covariance Fluxes of Nucleation to Accumulation Mode Aerosol Particles over a Coniferous Forest, Agricultural and Forest Meteorology, 214–215, 328–340, https://doi.org/10.1016/j.agrformet.2015.08.261, 2015. a, b, c, d, e
Dougle, P. G., Veefkind, J., and Ten Brink, H. M.: Crystallisation of Mixtures of Ammonium Nitrate, Ammonium Sulphate and Soot, Journal of Aerosol Science, 29, 375–386, https://doi.org/10.1016/S0021-8502(97)10003-9, 1998. a
Duan, B., Fairall, C. W., and Thomson, D. W.: Eddy Correlation Measurements of the Dry Deposition of Particles in Wintertime, J. Appl. Meteor., 27, 642–652, https://doi.org/10.1175/1520-0450(1988)027<0642:ECMOTD>2.0.CO;2, 1988. a
Emerson, E. W., Hodshire, A. L., DeBolt, H. M., Bilsback, K. R., Pierce, J. R., McMeeking, G. R., and Farmer, D. K.: Revisiting Particle Dry Deposition and Its Role in Radiative Effect Estimates, Proc. Natl. Acad. Sci. U.S.A., 117, 26076–26082, https://doi.org/10.1073/pnas.2014761117, 2020. a, b, c
Fagerli, H., Tsyro, S., Griesfeller, J., Gauss, M., Heinesen, D., Valdebenito, A., Caspel, W. V., Segers, A., Timmermans, R., Schaap, M., Kouznetsov, R., Uppstu, A., Guion, A., Raux, B., Couvidat, F., Jorba, O., Geels, C., Frohn, L., Arteta, J., Flemming, J., Remy, S., and Huijnen, V.: Task 4041 – Report on the Dedicated Study to Evaluate Deposition Fluxes for Key Pollutants, Tech. Rep. CAMS2_40_2021SC1, Copernicus Atmosphere Monitoring Service 2 (CAMS), https://nextcloud.meteo.fr/s/3BggsMZJQoRJpFM (last access: 26 February 2026), 2023. a, b
Farmer, D. K., Chen, Q., Kimmel, J. R., Docherty, K. S., Nemitz, E., Artaxo, P. A., Cappa, C. D., Martin, S. T., and Jimenez, J. L.: Chemically Resolved Particle Fluxes Over Tropical and Temperate Forests, Aerosol Science and Technology, 47, 818–830, https://doi.org/10.1080/02786826.2013.791022, 2013. a, b, c
Farmer, D. K., Boedicker, E. K., and DeBolt, H. M.: Dry Deposition of Atmospheric Aerosols: Approaches, Observations, and Mechanisms, Annu. Rev. Phys. Chem., 72, 375–397, https://doi.org/10.1146/annurev-physchem-090519-034936, 2021. a
Gallagher, M. W., Beswick, K. M., Duyzer, J., Westrate, H., Choularton, T. W., and Hummelshøj, P.: Measurements of Aerosol Fluxes to Speulder Forest Using a Micrometeorological Technique, Atmospheric Environment, 31, 359–373, https://doi.org/10.1016/S1352-2310(96)00057-X, 1997. a, b, c, d, e, f, g, h, i
Galperin, M. and Sofiev, M.: The Long-Range Transport of Ammonia and Ammonium in the Northern Hemisphere, Atmospheric Environment, 32, 373–380, https://doi.org/10.1016/S1352-2310(97)00045-9, 1998. a
Garland, J. A.: On the Size Dependence of Particle Deposition, Water, Air, and Soil Pollution: Focus, 1, 323–332, https://doi.org/10.1023/A:1013183911748, 2001. a
Giorgi, F.: A Particle Dry-deposition Parameterization Scheme for Use in Tracer Transport Models, J. Geophys. Res., 91, 9794–9806, https://doi.org/10.1029/JD091iD09p09794, 1986. a
Gordon, M., Staebler, R. M., Liggio, J., Vlasenko, A., Li, S.-M., and Hayden, K.: Aerosol flux measurements above a mixed forest at Borden, Ontario, Atmos. Chem. Phys., 11, 6773–6786, https://doi.org/10.5194/acp-11-6773-2011, 2011. a
Grönholm, T., Aalto, P. P., Hiltunen, V., Rannik, Ü., Rinne, J., Laakso, L., Hyvönen, S., Vesala, T., and Kulmala, M.: Measurements of Aerosol Particle Dry Deposition Velocity Using the Relaxed Eddy Accumulation Technique, Tellus B: Chemical and Physical Meteorology, 59, 381, https://doi.org/10.1111/j.1600-0889.2007.00268.x, 2007. a
Grönholm, T., Launiainen, S., Ahlm, L., Mårtensson, E. M., Kulmala, M., Vesala, T., and Nilsson, E. D.: Aerosol Particle Dry Deposition to Canopy and Forest Floor Measured by Two-layer Eddy Covariance System, J. Geophys. Res., 114, 2008JD010663, https://doi.org/10.1029/2008JD010663, 2009. a, b
Hicks, B. B., Baldocchi, D. D., Meyers, T. P., Hosker, R. P., and Matt, D. R.: A Preliminary Multiple Resistance Routine for Deriving Dry Deposition Velocities from Measured Quantities, Water Air Soil Pollut, 36, 311–330, https://doi.org/10.1007/BF00229675, 1987. a
Jylhä, K., Kämäräinen, M., Fortelius, C., Gregow, H., Helander, J., Hyvärinen, O., Johansson, M., Karppinen, A., Korpinen, A., Kouznetsov, R., Kurzeneva, E., Leijala, U., Mäkelä, A., Pellikka, H., Saku, S., Sandberg J., Sofiev, M., Vajda, A., Venäläinen, A., and Vira, J.: Recent Meteorological and Marine Studies to Support Nuclear Power Plant Safety in Finland, Energy, 165, 1102–1118, https://doi.org/10.1016/j.energy.2018.09.033, 2018. a
Kouznetsov, R. and Sofiev, M.: A Methodology for Evaluation of Vertical Dispersion and Dry Deposition of Atmospheric Aerosols, Journal of Geophysical Research, 117, D01202, https://doi.org/10.1029/2011JD016366, 2012. a, b, c, d, e, f, g, h, i, j, k
Kouznetsov, R., Sofiev, M., Vira, J., and Stiller, G.: Simulating age of air and the distribution of SF6 in the stratosphere with the SILAM model, Atmos. Chem. Phys., 20, 5837–5859, https://doi.org/10.5194/acp-20-5837-2020, 2020. a
Kuenen, J., Denier van der Gon, H., Visschedijk, A., and van der Brugh, H.: High Resolution European Emission Inventory for the Years 2003–2007, Report TNO-060-UT-2011-00588, TNO, Utrecht, the Netherlands, 2011. a
Kukkonen, J., Olsson, T., Schultz, D. M., Baklanov, A., Klein, T., Miranda, A. I., Monteiro, A., Hirtl, M., Tarvainen, V., Boy, M., Peuch, V.-H., Poupkou, A., Kioutsioukis, I., Finardi, S., Sofiev, M., Sokhi, R., Lehtinen, K. E. J., Karatzas, K., San José, R., Astitha, M., Kallos, G., Schaap, M., Reimer, E., Jakobs, H., and Eben, K.: A review of operational, regional-scale, chemical weather forecasting models in Europe, Atmos. Chem. Phys., 12, 1–87, https://doi.org/10.5194/acp-12-1-2012, 2012. a
Lavi, A., Farmer, D. K., Segre, E., Moise, T., Rotenberg, E., Jimenez, J. L., and Rudich, Y.: Fluxes of Fine Particles Over a Semi-Arid Pine Forest: Possible Effects of a Complex Terrain, Aerosol Science and Technology, 47, 906–915, https://doi.org/10.1080/02786826.2013.800940, 2013. a, b, c, d
Mammarella, I., Rannik, Ü., Aalto, P., Keronen, P., Vesala, T., and Kulmala, M.: Long-Term Aerosol Particle Flux Observations. Part II: Particle Size Statistics and Deposition Velocities, Atmospheric Environment, 45, 3794–3805, https://doi.org/10.1016/j.atmosenv.2011.04.022, 2011. a
Matsuda, K., Fujimura, Y., Hayashi, K., Takahashi, A., and Nakaya, K.: Deposition Velocity of PM2.5 Sulfate in the Summer above a Deciduous Forest in Central Japan, Atmospheric Environment, 44, 4582–4587, https://doi.org/10.1016/j.atmosenv.2010.08.015, 2010. a
Matsuda, K., Watanabe, I., Mizukami, K., Ban, S., and Takahashi, A.: Dry Deposition of PM2.5 Sulfate above a Hilly Forest Using Relaxed Eddy Accumulation, Atmospheric Environment, 107, 255–261, https://doi.org/10.1016/j.atmosenv.2015.02.050, 2015. a
Meng, Z. and Seinfeld, J. H.: Time Scales to Achieve Atmospheric Gas-Aerosol Equilibrium for Volatile Species, Atmospheric Environment, 30, 2889–2900, https://doi.org/10.1016/1352-2310(95)00493-9, 1996. a, b, c
Mozurkewich, M.: The Dissociation Constant of Ammonium Nitrate and Its Dependence on Temperature, Relative Humidity and Particle Size, Atmospheric Environment. Part A. General Topics, 27, 261–270, https://doi.org/10.1016/0960-1686(93)90356-4, 1993. a
Nemitz, E. and Sutton, M. A.: Gas-particle interactions above a Dutch heathland: III. Modelling the influence of the NH3-HNO3-NH4NO3 equilibrium on size-segregated particle fluxes, Atmos. Chem. Phys., 4, 1025–1045, https://doi.org/10.5194/acp-4-1025-2004, 2004. a, b
Nemitz, E., Gallagher, M. W., Duyzer, J. H., and Fowler, D.: Micrometeorological Measurements of Particle Deposition Velocities to Moorland Vegetation, Quarterly Journal of the Royal Meteorological Society, 128, 2281–2300, 2002. a
Nemitz, E., Dorsey, J. R., Flynn, M. J., Gallagher, M. W., Hensen, A., Erisman, J.-W., Owen, S. M., Dämmgen, U., and Sutton, M. A.: Aerosol fluxes and particle growth above managed grassland, Biogeosciences, 6, 1627–1645, https://doi.org/10.5194/bg-6-1627-2009, 2009. a, b, c
Pachón, J. E., Opazo, M. A., Lichtig, P., Huneeus, N., Bouarar, I., Brasseur, G., Li, C. W. Y., Flemming, J., Menut, L., Menares, C., Gallardo, L., Gauss, M., Sofiev, M., Kouznetsov, R., Palamarchuk, J., Uppstu, A., Dawidowski, L., Rojas, N. Y., Andrade, M. D. F., Gavidia-Calderón, M. E., Delgado Peralta, A. H., and Schuch, D.: Air quality modeling intercomparison and multiscale ensemble chain for Latin America, Geosci. Model Dev., 17, 7467–7512, https://doi.org/10.5194/gmd-17-7467-2024, 2024. a
Petersen, A. K., Brasseur, G. P., Bouarar, I., Flemming, J., Gauss, M., Jiang, F., Kouznetsov, R., Kranenburg, R., Mijling, B., Peuch, V.-H., Pommier, M., Segers, A., Sofiev, M., Timmermans, R., van der A, R., Walters, S., Xie, Y., Xu, J., and Zhou, G.: Ensemble forecasts of air quality in eastern China – Part 2: Evaluation of the MarcoPolo–Panda prediction system, version 1, Geosci. Model Dev., 12, 1241–1266, https://doi.org/10.5194/gmd-12-1241-2019, 2019. a
Petroff, A. and Zhang, L.: Development and validation of a size-resolved particle dry deposition scheme for application in aerosol transport models, Geosci. Model Dev., 3, 753–769, https://doi.org/10.5194/gmd-3-753-2010, 2010. a, b, c, d, e
Petroff, A., Murphy, J., Thomas, S., and Geddes, J.: Size-Resolved Aerosol Fluxes above a Temperate Broadleaf Forest, Atmospheric Environment, 190, 359–375, https://doi.org/10.1016/j.atmosenv.2018.07.012, 2018. a, b, c, d
Pleim, J. E., Ran, L., Saylor, R. D., Willison, J., and Binkowski, F. S.: A New Aerosol Dry Deposition Model for Air Quality and Climate Modeling, J. Adv. Model Earth Syst., 14, e2022MS003050, https://doi.org/10.1029/2022MS003050, 2022. a, b, c, d, e, f, g, h
Pryor, S.: Size-Resolved Particle Deposition Velocities of Sub-100 Nm Diameter Particles over a Forest, Atmospheric Environment, 40, 6192–6200, https://doi.org/10.1016/j.atmosenv.2006.04.066, 2006. a, b
Pryor, S. C., Larsen, S. E., Sørensen, L. L., Barthelmie, R. J., Gronholm, T., Kulmala, M., Launiainen, S., Rannik, U., and Vesala, T.: Particle Fluxes over Forests: Analyses of Flux Methods and Functional Dependencies, Journal of Geophysical Research, 112, D07205, https://doi.org/10.1029/2006JD008066, 2007. a
Pryor, S. C., Gallagher, M., Sievering, H., Larsen, S. E., Barthelmie, R. J., Birsan, F., Nemitz, E., Rinne, J., Kulmala, M., Grönholm, T., Taipale, R., and Vesala, T.: A Review of Measurement and Modelling Results of Particle Atmosphere – Surface Exchange, Tellus B, 60B, 42–75, https://doi.org/10.1111/j.1600-0889.2007.00298.x, 2008. a
Pryor, S. C., Barthelmie, R. J., Spaulding, A. M., Larsen, S. E., and Petroff, A.: Size-Resolved Fluxes of Sub-100-Nm Particles over Forests, J. Geophys. Res., 114, https://doi.org/10.1029/2009JD012248, 2009. a, b
Rannik, Ü., Aalto, P., Keronen, P., Vesala, T., and Kulmala, M.: Interpretation of Aerosol Particle Fluxes over a Pine Forest: Dry Deposition and Random Errors, J. Geophys. Res., 108, 2003JD003542, https://doi.org/10.1029/2003JD003542, 2003a. a
Rannik, Ü., Markkanen, T., Raittila, J., Hari, P., and Vesala, T.: Turbulence Statistics Inside and Over Forest: Influence on Footprint Prediction, Boundary-Layer Meteorology, 109, 163–189, https://doi.org/10.1023/A:1025404923169, 2003b. a
Rannik, Ü., Mammarella, I., Aalto, P., Keronen, P., Vesala, T., and Kulmala, M.: Long-Term Aerosol Particle Flux Observations Part I: Uncertainties and Time-Average Statistics, Atmospheric Environment, 43, 3431–3439, https://doi.org/10.1016/j.atmosenv.2009.02.049, 2009. a
Rohbock, E.: Atmospheric Removal of Airborne Metals by Wet and Dry Deposition, in: Deposition of Atmospheric Pollutants, edited by: Georgii, H.-W. and Pankrath, J., 159–171, Springer Netherlands, Dordrecht, ISBN 978-94-009-7866-9, 978-94-009-7864-5, https://doi.org/10.1007/978-94-009-7864-5_16, 1982. a
Ryder, J.: Emission, Deposition and Chemical Conversion of Atmospheric Trace Substances in and above Vegetation Canopies, School for Earth, Atmospheric and Environmental Sciences University of Manchester, Manchester, https://nora.nerc.ac.uk/id/eprint/525861 (last access: 26 February 2026), 2010. a
Schaap, M., Kraneburg, R., Michaud van der Wal, C., Geers, L., Kouznetsov, R., and Bergström, R.: National Scale Modelling of Nitrogen Deposition in the Netherlands, Report TNO-2025-R11248, TNO, Utrecht, the Netherlands, 2026. a
Sehmel, G. A.: Particle and Gas Dry Deposition: A Review, Atmospheric Environment, 14, 983–1011, https://doi.org/10.1016/0004-6981(80)90031-1, 1980. a
Sehmel, G. A. and Sutter, S. L.: Particle Deposition Rates on a Water Surface as a Function of Particle Diameter and Air Velocity, Journal de Recherches Atmospheriques, 8, 911–920, 1974. a
Seinfeld, J. and Pandis, S.: Atmospheric Chemistry and Physics, Wiley, New York, ISBN 0-471-1816-0, 1998. a
Shiraiwa, M. and Seinfeld, J. H.: Equilibration Timescale of Atmospheric Secondary Organic Aerosol Partitioning, Geophysical Research Letters, 39, 2012GL054008, https://doi.org/10.1029/2012GL054008, 2012. a, b
Sievering, H.: Profile Measurements of Particle Mass Transfer at the Air-Water Interface, Atmospheric Environment, 15, 123–129, https://doi.org/10.1016/0004-6981(81)90003-2, 1981. a
Sievering, H., Cooke, J., and Pueschel, R.: Importance of Deposition Velocity for Sulfur Gas to Sulfate Particle Transformation Rates at the Four Corners Power Plant, Atmospheric Environment, 15, 2593–2596, https://doi.org/10.1016/0004-6981(81)90076-7, 1981. a, b, c
SILAM team: fmidev/silam-model: Silam_v6_1 For the revised version of dry-deposition paper (silam_v6_1_1), Zenodo [code], https://doi.org/10.5281/zenodo.18782316, 2026. a
Simpson, D., Andersson, C., Christensen, J. H., Engardt, M., Geels, C., Nyiri, A., Posch, M., Soares, J., Sofiev, M., Wind, P., and Langner, J.: Impacts of climate and emission changes on nitrogen deposition in Europe: a multi-model study, Atmos. Chem. Phys., 14, 6995–7017, https://doi.org/10.5194/acp-14-6995-2014, 2014. a
Slinn, S. and Slinn, W.: Predictions for Particle Deposition on Natural Waters, Atmospheric Environment, 14, 1013–1016, https://doi.org/10.1016/0004-6981(80)90032-3, 1980. a
Slinn, W.: Predictions for Particle Deposition to Vegetative Canopies, Atmospheric Environment, 16, 1785–1794, https://doi.org/10.1016/0004-6981(82)90271-2, 1982. a, b, c, d
Sofiev, M.: A Model for the Evaluation of Long-Term Airborne Pollution Transport at Regional and Continental Scales, Atmospheric Environment, 34, 2481–2493, https://doi.org/10.1016/S1352-2310(99)00415-X, 2000. a
Sofiev, M.: Extended Resistance Analogy for Construction of the Vertical Diffusion Scheme for Dispersion Models, Journal of Geophysical Research, 107, 4159, https://doi.org/10.1029/2001JD001233, 2002. a, b
Sofiev, M., Vira, J., Kouznetsov, R., Prank, M., Soares, J., and Genikhovich, E.: Construction of the SILAM Eulerian atmospheric dispersion model based on the advection algorithm of Michael Galperin, Geosci. Model Dev., 8, 3497–3522, https://doi.org/10.5194/gmd-8-3497-2015, 2015. a
Sofiev, M., Winebrake, J. J., Johansson, L., Carr, E. W., Prank, M., Soares, J., Vira, J., Kouznetsov, R., Jalkanen, J.-P., and Corbett, J. J.: Cleaner Fuels for Ships Provide Public Health Benefits with Climate Tradeoffs, Nature Communications, 9, 406, https://doi.org/10.1038/s41467-017-02774-9, 2018. a
Sofiev, M., Palamarchuk, Y., Bédard, A., Basagana, X., Anto, J. M., Kouznetsov, R., Urzua, R. D., Bergmann, K. C., Fonseca, J. A., De Vries, G., Van Erd, M., Annesi-Maesano, I., Laune, D., Pépin, J. L., Jullian-Desayes, I., Zeng, S., Czarlewski, W., and Bousquet, J.: A Demonstration Project of Global Alliance against Chronic Respiratory Diseases: Prediction of Interactions between Air Pollution and Allergen Exposure – the Mobile Airways Sentinel NetworK-Impact of Air POLLution on Asthma and Rhinitis Approach, Chinese Medical Journal, 133, 1561–1567, https://doi.org/10.1097/CM9.0000000000000916, 2020. a, b
Sun, F., Yin, Z., Lun, X., Zhao, Y., Li, R., Shi, F., and Yu, X.: Deposition Velocity of PM2.5 in the Winter and Spring above Deciduous and Coniferous Forests in Beijing, China, PLoS ONE, 9, e97723, https://doi.org/10.1371/journal.pone.0097723, 2014. a
Vong, R. J., Vickers, D., and Covert, D. S.: Eddy Correlation Measurements of Aerosol Deposition to Grass, Tellus B: Chemical and Physical Meteorology, 56, 105, https://doi.org/10.3402/tellusb.v56i2.16414, 2004. a, b
Vong, R. J., Vong, I. J., Vickers, D., and Covert, D. S.: Size-dependent aerosol deposition velocities during BEARPEX'07, Atmos. Chem. Phys., 10, 5749–5758, https://doi.org/10.5194/acp-10-5749-2010, 2010. a, b
Wesely, M. L., Cook, D. R., Hart, R. L., and Speer, R. E.: Measurements and Parameterization of Particulate Sulfur Dry Deposition over Grass, J. Geophys. Res., 90, 2131–2143, https://doi.org/10.1029/JD090iD01p02131, 1985. a, b
Zhang, L. and He, Z.: Technical Note: An empirical algorithm estimating dry deposition velocity of fine, coarse and giant particles, Atmos. Chem. Phys., 14, 3729–3737, https://doi.org/10.5194/acp-14-3729-2014, 2014. a, b, c, d, e, f
Zhang, L., Gong, S., Padro, J., and Barrie, L.: A Size-Segregated Particle Dry Deposition Scheme for an Atmospheric Aerosol Module, Atmospheric Environment, 35, 549–560, https://doi.org/10.1016/S1352-2310(00)00326-5, 2001. a, b, c, d, e
Zufall, M. J., Davidson, C. I., Caffrey, P. F., and Ondov, J. M.: Airborne Concentrations and Dry Deposition Fluxes of Particulate Species to Surrogate Surfaces Deployed in Southern Lake Michigan, Envirionmental Science and Technology, 32, 1623–1628, https://doi.org/10.1021/es9706458, 1998. a
The original paper is copyrighted by the Elsevier Group, which refused to give a permission to use their intellectual property in the openly-distributable publication. Readers are encouraged to reach out to the paper and compare our results to the original figure.
- Abstract
- Dedication
- Introduction
- Methods
- Simulation of particle fluxes under real-life conditions
- Idealised case of NH4NO3 fluxes
- Discussion
- Recommendations
- Conclusions
- Code and data availability
- Author contributions
- Competing interests
- Disclaimer
- Acknowledgements
- Financial support
- Review statement
- References
- Supplement