
the Creative Commons Attribution 4.0 License.
the Creative Commons Attribution 4.0 License.
 | 20 Nov 2026
The 4-mode Modal Aerosol Module in C+ + (MAM4xx) v1.0: representing prognostic aerosols in a global cloud-system resolving atmosphere model for GPU exascale computing
Jerome D. Fast

Balwinder Singh
Oscar Diaz-Ibarra
Jeff Johnson
Chandru Dhandapani
Brian Gaudet
Taufiq Hassan
Meng Huang
Jaelyn Litzinger
James Overfelt
Kyle Pressel
Michael Schmidt
Shuaiqi Tang
Adam C. Varble
Mingxuan Wu
Kai Zhang
Po-Lun Ma
Aerosols are a key component of Earth system models since they affect meteorology and the Earth's energy budget through complex cloud-aerosol-radiation interactions. Over the past decade, Earth system models have increased their spatial resolution to better resolve atmospheric processes; however, this advancement comes with significantly higher computational costs. To address this issue, some models now take advantage of high-performance Graphics Processing Unit (GPU) exascale computer clusters which offer faster processing capabilities with a higher level of parallelism than traditional Central Processing Unit (CPU) systems, but these models still lack detailed representations of aerosols. In this study, we describe the development of a new GPU-enabled prognostic aerosol model based on the four-mode version of the Modal Aerosol Module (MAM4), called MAM4xx, that has been coupled to the Energy Exascale Earth System (E3SM) Atmospheric Model (EAM) in C (EAMxx). To the best of our knowledge, MAM4xx is the first fully GPU-enabled aerosol model with sophisticated process representations. MAM4 has been completely rewritten in C using the Kokkos performance-portability programming library while preserving all the physical and chemical processes in the original Fortran version. The Kokkos library ensures compatibility across GPUs from various vendors and thus enables execution on multiple GPU exascale high-performance computer clusters. We describe the steps undertaken to port the code to C/Kokkos as well as the rigorous testing methodology (i.e., unit tests, real-world tests) so that the functionality remains intact and that bugs were not inadvertently introduced. We demonstrate that MAM4xx coupled within EAMxx with ∼12 km horizontal grid spacing behaves as expected for real-world conditions based on comparison with observations and a reanalysis aerosol dataset over the central U.S. during the spring of 2016. Currently, MAM4xx increases the computational cost of the host atmospheric model by ∼40 %, which is due primarily to the treatment of aerosol-cloud interactions, highlighting the need to optimize these processes for GPU computational efficiency. Future improvements to MAM4xx will benefit from recent advancements in the physical representation of aerosols in MAM4 as they are ported to C/Kokkos. Additional testing for longer periods of time to encompass a wider range of atmospheric conditions, over other geographic regions, and at higher spatial resolution will be conducted in the future to more robustly assess simulated aerosol properties.
- Article
(13938 KB) - Full-text XML
- BibTeX
- EndNote


Aerosol and aerosol-cloud interaction (ACI) processes remain the largest source of uncertainty in long-term Earth system model predictions of global temperature (Forster et al., 2021; McCoy et al., 2020; Bellouin et al., 2020). This uncertainty stems from complex, multi-scale processes that models struggle to capture, such as how aerosols alter cloud micro- and macro-physical properties and how clouds alter aerosol populations. These complex processes, in turn, influence the Earth's radiation budget and water cycle. Traditional global Earth system models are still fairly coarse, with horizontal grid spacings from tens to a few hundred kilometers; therefore, part of the uncertainty in ACI likely arises to due to the inability to adequately resolve cloud and aerosol populations as well as the intersection of clouds and aerosols (e.g., Huang et al., 2025; Khain et al., 2025; Ma et al., 2014; Terai et al., 2020; Wang et al., 2025). Consequently, models rely on parameterizations to represent these subgrid-scale processes that cannot be resolved explicitly.
Several global convection permitting Earth system models have been developed over the past decade that use horizontal grid spacings of a few to ten kilometers (i.e., kilometer-scale), similar to weather forecast models. This includes models participating in the DYnamics of the Atmospheric general circulation Modeled On Non-hydrostatic Domains (DYAMOND) model intercomparison (Stevens et al., 2019). More recently, Segura et al. (2025) describe 30-year Earth system simulations using the ICON and IFS-FESOM models with a 10 km grid spacing. ICON has also been used over shorter periods using a 1 km grid spacing (Klocke et al., 2025) and coupled with the HAM-lite aerosol model with a 5 km grid spacing (Weiss et al., 2025). This kilometer spatial resolution permits the simulation of more realistic terrain and atmospheric conditions, particularly for moist convection, though uncertainty still arises from the physics parameterizations approximating many subgrid-scale processes. One example of a persistent bias in kilometer-scale Earth system models is that too many precipitating convective cells are triggered that produce too much convective precipitation and not enough stratiform precipitation (e.g., Caldwell et al., 2021; Su et al., 2026; Stanford et al., 2026; Terai et al., 2025; Tian et al., 2024). This bias is not alleviated at O(100 m) horizontal grid spacing (Zhang et al., 2024), suggesting that inadequate subgrid-scale physics parameterizations are a primary source of error instead of spatial resolution.
The Energy Exascale Earth System (E3SM) Atmospheric Model written in C (EAMxx) using the Simple Cloud-Resolving E3SM Atmospheric Model (SCREAM) configuration (Caldwell et al., 2021) is one of the new kilometer-scale global models that is designed to run on high-performance Graphical Processing Unit (GPU) computer clusters (Donahue et al., 2024; Taylor et al., 2023). GPU chips are more energy efficient than CPU chips when running a massive batch of calculations in parallel, such as atmospheric model simulations. “xx” in the E3SM community is used to denote C code to differentiate it from Fortran versions. The EAMxx code was restructured into a data-parallel form using Kokkos (Trott et al., 2022) abstractions to achieve performance portability across heterogeneous architectures (e.g., multi-core CPUs and GPUs from various vendors). Donahue et al. (2024) assess the performance of four 40 d EAMxx simulations for each season (Δx∼3.25 km) using NASA satellite and Atmospheric Radiation Measurement (ARM, Stokes and Schwartz, 1994) data products. EAMxx has also been evaluated using a simulation of Hurricane Katrina's evolution (Bercos-Hickey et al., 2025), comparison of predicted spatiotemporal cloud variability with observations and other global Earth system models (Chao et al., 2025), and examination of the effect of spatial resolution on aerosol effective radiative forcing using prescribed aerosols (Mahfouz et al., 2025).
EAMxx currently uses prescribed aerosols for ACI and aerosol-radiation interaction (ARI) processes, which are based on monthly 5-year climatologies of cloud condensation nuclei (CCN) and aerosol optical properties with a spatial grid spacing of 1° generated by an E3SMv2 (Golaz et al., 2022) Atmospheric Model Intercomparison Project (AMIP) configuration. The monthly values are then interpolated in time and space for a particular simulation configuration. While this approach saves computational time by not explicitly treating aerosols as prognostic variables, the magnitude and spatial variability of aerosol properties will not be consistent with actual conditions. It is therefore desirable to have a prognostic aerosol treatment option for EAMxx to better represent the aerosol lifecycle and consequently processes affecting ACI and ARI that occur at kilometer-scale resolutions. The objectives of this study are to describe (1) how the four-mode version of the Modal Aerosol Model (MAM4, Liu et al., 2016) was completely rewritten in C/Kokkos, (2) the testing procedure that ensures the new code represents the same physical treatments as the Fortran version, and (3) the computational performance of the new code called MAM4xx. In addition, a real-world case study is used to demonstrate that the new aerosol model within EAMxx predicts spatiotemporal variations in aerosol mass, composition, size, and CCN concentrations similar to observations and another global aerosol modeling system. As far as we know, MAM4xx is the first fully GPU-enabled aerosol model with sophisticated treatment of aerosol processes that can also run on multi-core CPU computer clusters. This paper serves as the documentation of the model development and the first evaluation based on a case study. While ACI and ARI motivates the development of MAM4xx, it is critical to establish the performance of aerosol predictions first. ACI and ARI effects within EAMxx using prognostic aerosols will be the subject of future studies.
2.1 EAMxx
SCREAM (Caldwell et al., 2021) was designed to be a global convection permitting model using a grid spacing of 3.25 km. While the original Fortran version of SCREAM (version 0) has been shown to reproduce many aspects of observed cloud distributions, it is computationally expensive. To take advantage of graphics processing units (GPUs) used by the world's fastest supercomputers and significantly reduce the computational cost, the entire code was rewritten in C/Kokkos. Kokkos (Trott et al., 2022) enables C code to be compatible with GPUs from different manufacturers (e.g., AMD, NVIDIA, SYCL), ensuring that the code can run on different GPU exascale supercomputers such as Frontier operated by the Oak Ridge Leadership Computing Facility, Perlmutter operated by the National Energy Research Scientific Computing Center (NERSC), and Aurora operated by the Argonne Leadership Computer Facility (ALCF). The new E3SM Atmosphere Model in C/Kokkos called EAMxx is described in detail by Donahue et al. (2024). EAMxx was also awarded the Association for Computer Machinery CM Gordon Bell special prize for climate modeling in 2023.
EAMxx uses the C/Kokkos version of the Higher Order Method Modeling Environment (HOMME) nonhydrostatic dynamical core. Physics parameterizations include the Rapid Radiation Transfer Model for General circulation model applications – Parallel (RRTMGP, Pincus et al., 2019) parameterization to represent radiation, the Simplified Higher Order Closure (SHOC, Bogenschutz and Krueger, 2013) parameterization to represent cloud macrophysics and turbulence, and the Predicted Particle Properties (P3, Morrison and Milbrandt, 2015) parameterization to represent cloud microphysics. Aerosols affect the P3 cloud microphysics through cloud condensation nuclei (CCN) and ice number particle (INP) concentrations that are based on monthly climatology and read into the model. This representation of cloud-aerosol interactions is referred to as the Simple Prescribed Aerosols (SPA). The monthly climatology of SPA also includes aerosol extinction and absorption that is used in RRTMG to account for aerosol-radiation effects. While the computational cost of SPA is negligible, the climatological CCN and optical property distributions are coarse in resolution (monthly 1°) and may or may not be consistent with simulated atmospheric conditions. These Fortran codes were rewritten in C/Kokkos and integrated into EAMxx. One exception that has not been ported to C/Kokkos is the E3SM Land Model (ELM) used to simulate the exchanges between terrestrial land surface and other Earth system components. Instead, a coupler is used to run ELM on CPUs while the rest of EAMxx runs on GPUs. The computational cost of ELM is relatively small compared to other physics parameterizations; therefore, the coupling to CPUs for ELM does not add a significant computational burden to the overall cost of EAMxx simulations.
As an alternative to the SPA treatment, a prognostic aerosol parameterization described next is integrated into EAMxx to more realistically treat the aerosol lifecycle and consequently aerosol-cloud interactions and aerosol-radiation interactions.
2.2 MAM4
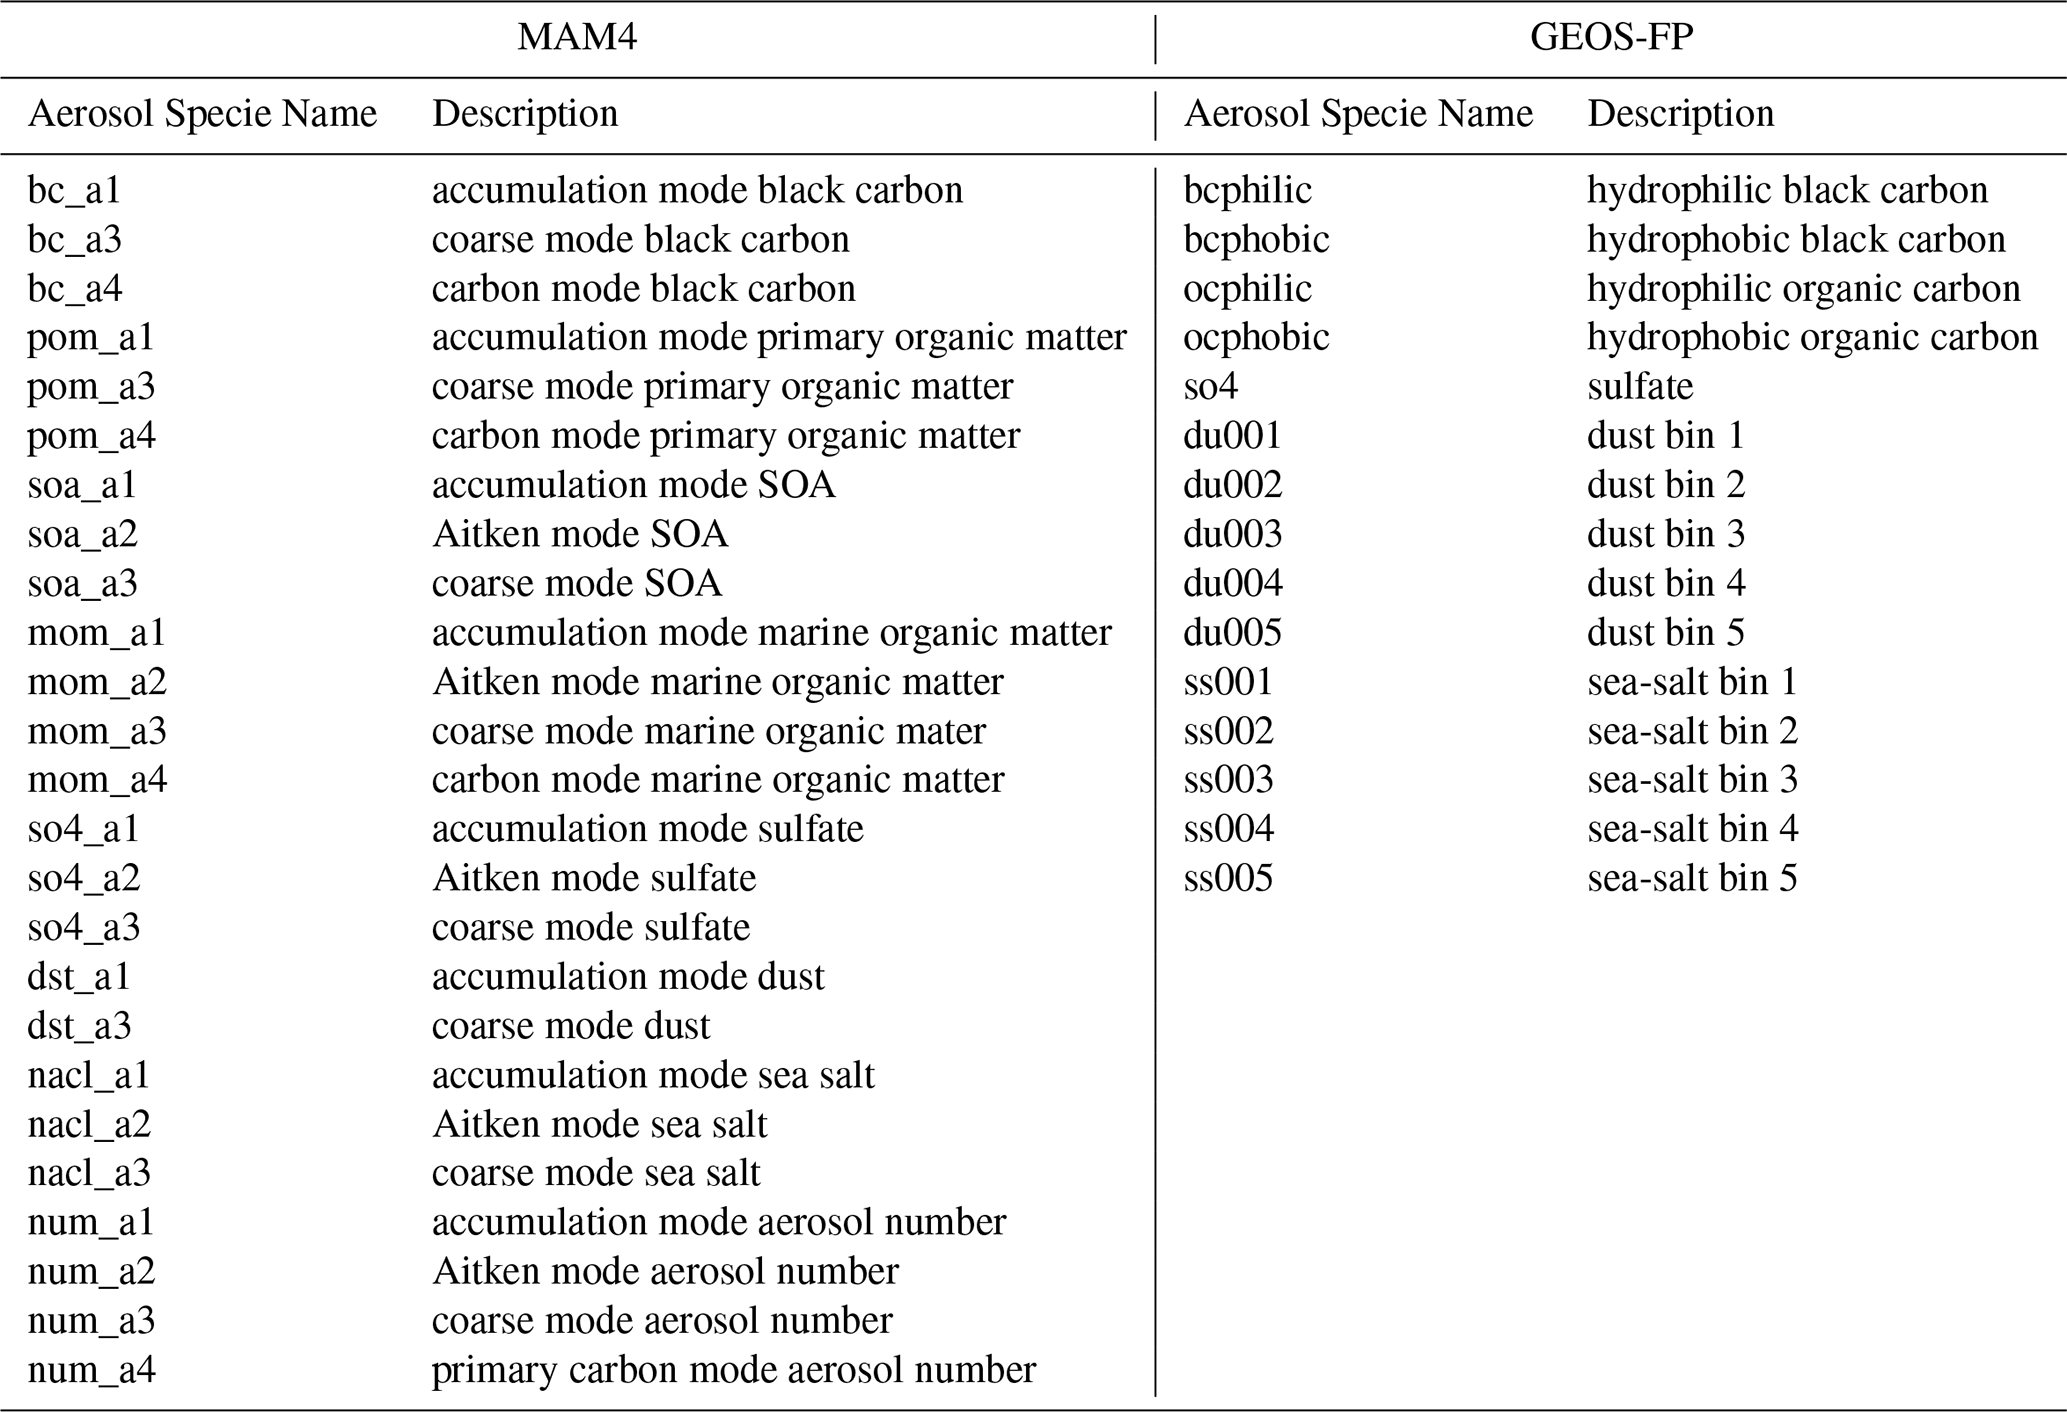
The four-mode version of the Modal Aerosol Module (MAM4, Liu et al., 2016; Wang et al., 2020) is a double-moment, 7-species representation of aerosols used by E3SM and the Community Earth System Model (CESM, Mills et al., 2017; Tilmes et al., 2023), though the representations of some of the aerosol processes in MAM4 in E3SM and CESM have diverged over time. MAM4 is similar to its precursor MAM3 (Liu et al., 2012), except that MAM4 includes a primary carbon mode to represent the microphysical aging of primary organic matter (POM) and black carbon (BC) in addition to simulating the aerosol size distribution using Aitken, accumulation, and coarse modes. MAM4 includes representations for prescribed primary emissions, online calculations of dust and sea-salt emissions, nucleation, coagulation, secondary aerosol formation that includes sulfate (SO4) and secondary organic aerosol (SOA), dry deposition, wet scavenging, and aerosol-cloud-radiation interactions. As listed in Table 1, MAM4 consists of 25 tracers representing aerosol mass composition and four tracers of aerosol number for each mode. The Fortran version of the code is included in E3SM versions 1–3. The performance of MAM4 within E3SM in representing aerosols and aerosol-cloud-radiation interactions is well known and has been tested extensively (e.g., Christensen et al., 2023; Hassan et al., 2024; Liu et al., 2016; Tang et al., 2022, 2023; Shan et al., 2024; Varble et al., 2023; Wang et al., 2018, 2026; Wu et al., 2022).
2.3 GEOS-FP
Aerosol simulations made by the Goddard Earth Observing System Forward Processing modeling system (GEOS-FP) are used in this study as a reference to assess the performance of MAM4xx predictions. GEOS-FP is similar to GEOS Composition Forecast (GEOS-CF, Keller et al., 2021) in that meteorological fields are based on the Modern-Era Retrospective analysis for Research and Applications Version 2 (MERRA-2, Gelaro et al., 2017) and aerosols are based on the Goddard Chemistry Aerosol Radiation and Transport (GOCART, Chin et al., 2002) model. GOCART aerosols are constrained by satellite AOD measurements from the Moderate Resolution Imaging Spectroradiometer (MODIS) from the Terra and Aqua satellites (Randles et al., 2017; Buchard et al., 2017). GOCART is a single moment bulk aerosol model that simulates aerosol mass. Aerosol number is not a predicted quantity but can be derived from prescribed size distributions. Emissions are either calculated online (e.g., dust, sea-salt) or obtained from the Hemispheric Transport of Air Pollution (HTAP) anthropogenic emission inventories. MODIS fire radiative power measurements are also used to derive biomass burning emission rates as produced by the Quick Fire Emissions Dataset (QFED, Darmenov and da Silva, 2015).
Global GEOS-FP output was obtained for April and May 2016 and a subset of the output over the continental U.S. is used to compare with MAM4xx and observations. Fifteen aerosol species are available for black carbon, organic carbon (OC), sulfate, dust and sea salt (Table 1). It is important to note that GEOS-FP treats organics as OC whereas MAM4xx treats organics as organic matter (OM). Aerosol concentrations are available every 3 h using a 0.3125° longitude by 0.25° latitude grid and 72 vertical levels.
The MAM4 version ported to C/Kokkos originated from E3SMv2. The overall philosophy of porting Fortran MAM4 to C/Kokkos was to preserve the original functionality, enabling direct one-to-one comparison between the Fortran and C implementations. In this way, differences in simulated aerosol properties between E3SMv2 and EAMxx simulations would only be due to the differences in the other physics parameterizations that will affect ambient meteorological conditions. For example, E3SMv2 uses the Morrison and Gettelman (2008) treatment for cloud microphysics and the Cloud Layers Unified by Binormals (CLUBB, Larson et al., 2002) treatment for subgrid scale turbulence and cloud macrophysics, while EAMxx uses P3 (Morrison and Milbrandt, 2015) and SHOC (Bogenschutz and Kruger, 2013). Once MAM4xx is evaluated using real-world conditions to ensure the code was correctly reformulated in C/Kokkos, then additional improvements to aerosol treatments could be incorporated directly into MAM4xx in the future.
Porting MAM4 to MAM4xx consisted of three steps, as shown in Fig. 1: (1) Fortran refactoring, (2) porting to C, and (3) creating interfaces to integrate MAM4xx into EAMxx. As described in the next section, each step involved a series of tests to ensure that the resulting C/Kokkos code has the same functionality as the original Fortran code. The Fortran codes were ported manually, since many of the tools for automated code conversion using artificial intelligence (AI) and large-language models (LLMs) had not yet been developed or were not mature at the time.
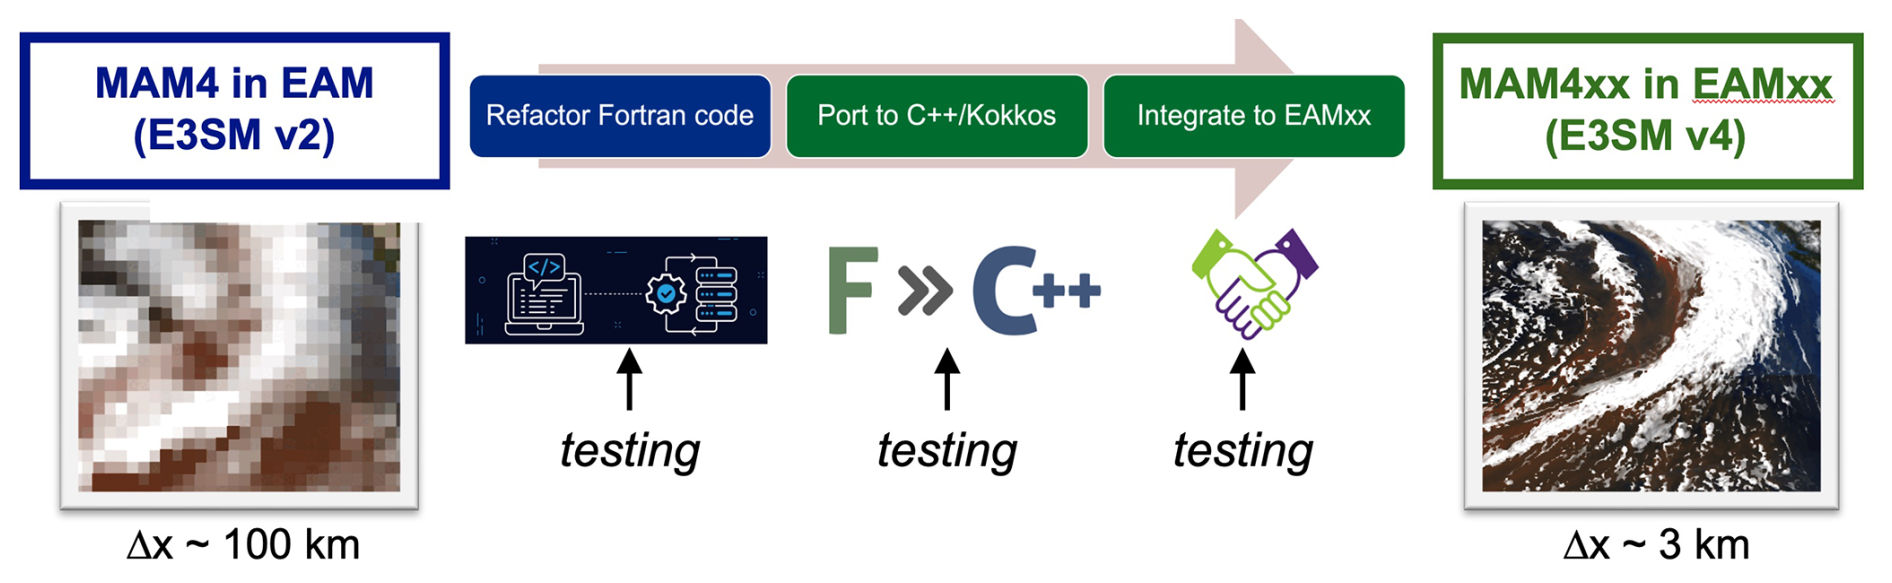
Figure 1Diagram depicting the main steps used to port the MAM4 Fortran code to C and integrate it into the EAMxx model.
3.1 Step 1: Fortran Refactoring
The goal of refactoring the Fortran code was to restructure it so that it could be more easily and correctly ported to C and to enable rigorous testing of the port's correctness. We started with a set of curated system-level regression tests that maximizes the code coverage of the MAM4 codes in E3SMv2. These tests included smoke, restart, and multi-node regression tests at various model resolutions and simulation lengths. Since these tests ran the full E3SMv2 model with real atmospheric conditions, they also captured the rare atmospheric events that are typically not seen in more idealized tests. Before refactoring, baselines were generated using these tests. During code refactoring, the generated baselines were compared against the refactored code to ensure bit-for-bit reproducibility for the entire refactor.
As the first step of refactoring, we removed all the “dead” MAM4 code that was not operational in E3SMv2. These codes were outdated and never tested under E3SMv2 (e.g., old MAM configurations such as MAM3 and MAM7, temporary research codes, and unused legacy codes from E3SMv1 and earlier code used in the Community Earth System Model, CESM). Our guiding principle for refactoring was modularization: we decomposed the large Fortran routines into smaller components to make the porting process more manageable and to facilitate systematic verification of each unit of code (i.e., unit testing). Each low-level routine was designed to perform a single, well-defined task, while higher-level driver routines invoked and coordinated these units to execute the overall workflow.
For testing the correctness of the port, we built a new Fortran-based testing infrastructure called FORTRESS (FORtran To C Record–rEplay teSt harneS) within E3SMv2. FORTRESS allows us to capture the inputs and outputs of all the refactored Fortran subroutines using simple code instrumentation. The captured inputs and outputs are stored in a YAML file format. A Python-based tool called SKYWALKER reads these YAML files to compare the outputs of Fortran routines against the ported C routines, given the same inputs (explained in Sect. 3.2).
The FORTRESS design requires that Fortran subroutines use only intrinsic data types (e.g., int, real, char) with explicit argument intents (“in” for read only, “inout” for read and write, and “out” for write only). All derived-type arguments were eliminated and replaced with intrinsic types to simplify the Fortran interfaces. This restructuring improved readability, made data flow explicit, and significantly simplified rigorous testing and cross-language porting.
After the refactoring process, the new MAM4 code removed ∼106 700 lines of Fortran code compared to the original MAM4, substantially simplifying the overall implementation. The model results before and after the refactor remained bit-for-bit identical due to our rigorous regression testing.
3.2 Step 2: Porting code to C/Kokkos
After refactoring the Fortran MAM4 codes, the next step is to port individual small subroutines to C/Kokkos. To align with the EAMxx hierarchical parallelism, the loops that iterate over atmospheric columns were stripped away. The loops that iterate over each level within a column were parallelized using Kokkos parallelism constructs. The interior loops (e.g., loops over MAM4 species, modes, etc.) were also parallelized wherever possible to exploit all parallelism offered by the MAM4 processes. See Sect. 2.4 in Donahue et al. (2024) for more details on parallelism within EAMxx.
Since the subroutines were typically small and independent pieces, it was easy to divide the work among developers. The input and output test data generated by FORTRESS infrastructure for each Fortran subroutine were used here to test the correctness of each C/Kokkos routine (i.e., validation testing). We used the CTest utility to invoke these unit tests that run the C codes with the same input as the Fortran codes. We expect the C routines to produce the same output as the Fortran routine. The SKYWALKER tool was used to read the FORTRESS-generated input and compare C produced output with the FORTRESS-generated output. Here, we did not expect to obtain the same bit-identical output between C and Fortran codes since small differences would likely be produced by differences in compilers, software environments, and the use of GPU hardware. Instead, if relative differences in the output from Fortran and C codes were very small (i.e., attributable to numerical round-offs), then we considered the code was ported correctly. If the differences were relatively large, the team would identify and fix any bugs introduced to the code and execute the testing procedure again until the differences between the Fortran and C code are at round-off levels.
To further test and debug the ported codes, we created a testing framework where synthetic data was generated to invoke the C and Fortran routines. Since the data types were simple (integer, real, character, etc.), it was straightforward to generate synthetic data and assemble it to invoke these routines. For the same synthetic input, we expected the routines to produce the same output. This method helped us catch many hard-to-find bugs and improved our code coverage. This also acted as an additional layer of testing.
At this stage, variable names, shapes, sizes, and units were also changed to be consistent with EAMxx. In this process, about 16 000 lines of C code were written to represent all aerosol physics and chemistry in MAM4.
3.3 Step 3: Integrate new code into EAMxx
MAM4 (and hence MAM4xx) interacts with the host model at many different places in a time step for a given process ordering. Each interaction requires a new interface code that translates and feeds EAMxx inputs to MAM4xx codes and translates back the MAM4xx outputs to update EAMxx. This is unlike other parameterization such as cloud microphysics (P3), macrophysics (SHOC), and radiation (RRTMGP), which interact with the host model only once in a time step. We created seven new interfaces to integrate all the MAM4xx processes into EAMxx. EAMxx configuration includes 10 processes, while the EAMxx-MAM4xx configuration replaces SPA with MAM4xx to expand this to 16 processes. We had the opportunity to combine a few of these interfaces into one to reduce the total number of interfaces. We decided against it and added one interface for each MAM4xx process, as it provides us a clean way to test each process in isolation and build unit tests at a more granular level.
Another challenge was the additional NetCDF files that MAM4xx needed to read, such as those for primary emissions (surface and vertical) and online emissions (e.g., dust and sea salt) calculations, as well as other calculations. EAMxx's SPA reads only one spatially and temporally varying NetCDF file, while MAM4xx reads 21 files (e.g., information needed for dry deposition, oxidants, optical properties, dust erodibility, and marine organics) with and without spatial and temporal variations. We extended EAMxx's file reading capabilities to accommodate MAM4xx requirements.
Once each MAM4xx process passed the unit tests, we integrated them with EAMxx. Coarse resolution simulations were conducted with the EAMxx model by turning on individual MAM4xx processes to thoroughly test and analyze its output. Since we built the capability of turning on and off each MAM4xx process individually, we could test each MAM4xx process coupled with EAMxx in isolation and reason about its impact on a global model simulation. For example, sanity checks were performed when testing the new emission code to ensure the highest aerosol concentrations were produced over the highest emission regions, aerosol plumes were transported by the ambient meteorological conditions, and aerosol burden continually increased. For aerosol microphysics, we examined when, where, and how much secondary aerosols (SO4, SOA) were produced, and that coagulation and condensation processes altered the distribution of aerosols among the modes as expected. For aerosol optical properties, simulated AOD from EAMxx was compared to equivalent E3SMv2 simulations, including checking that simulated scattering and extinction altered the radiation budget as expected. Tests were also performed with and without dry deposition to verify that aerosols were removed at the ground and that the total atmospheric burden gradually decreased in the absence of other aerosol processes. Similarly, we verified that wet scavenging was removed when and where hydrometeors were predicted by P3. Finally, simulated CCN concentrations were assessed, and we examined cloud properties (e.g., droplet number) to determine whether aerosol-cloud interaction processes, such as the Twomey effect, behaved as expected. While the quantitative testing performed for steps 1 and 2 ensured that individual pieces of the code were ported correctly, these qualitative tests revealed additional issues associated with the merging of MAM4xx code with EAMxx so that they could be resolved.
After each aerosol process was tested individually, aerosol processes were merged one at a time. Tests at this stage sometimes produced unexpected behavior, revealing other issues that needed to be resolved. After all the aerosol processes were integrated into EAMxx, coarse global simulations were performed over long periods of time to ensure the code did not crash unexpectedly and produced reasonable simulated aerosol fields. We found that the code often crashed, usually due to issues with rapidly changing GPU cluster configurations and/or updates to the EAMxx code that also affected aerosol processes in unexpected ways. In this process, we added about 5000 lines of new C code, to connect MAM4xx with the host model EAMxx.
Some testing was conducted using a 3.5 km global grid, as in Donahue et al. (2024); however, the computational cost limited simulation periods to a few days. Therefore, real-world testing of MAM4xx in this study uses a 12 km global horizontal grid spacing.
3.4 Computational Cost
The overall computational expense of the various processes in EAMxx and MAM4xx is shown in Fig. 2, based on a 10 d global simulation using a 12 km grid spacing. When the SPA treatment is used in EAMxx to represent aerosols, the dynamical core uses most of the computation time (79 %). In comparison, physics makes up the remaining 21 % of the time (Fig. 2a). The SPA treatment that prescribes aerosols takes up 2 % of the total computational burden. As shown in Fig. 2b, MAM4xx adds a significant computational cost to EAMxx. While adding 25 scalars also adds computational cost to the dynamical core via advection, MAM4xx alone comprises 40 % of the total computational cost (Fig. 2b). As shown in Fig. 2c most of that cost is due to the code associated with the aerosol-cloud interaction processes in MAM4xx. The objective of the creation of MAM4xx was to ensure that the code works as expected within EAMxx on GPU exascale clusters, but we did not consider optimizing the GPU kernels for computational efficiency at this time. We note that ACI processes in the Fortran version of the model also use the most computational time which is likely due to how MAM4 was structured as described next.
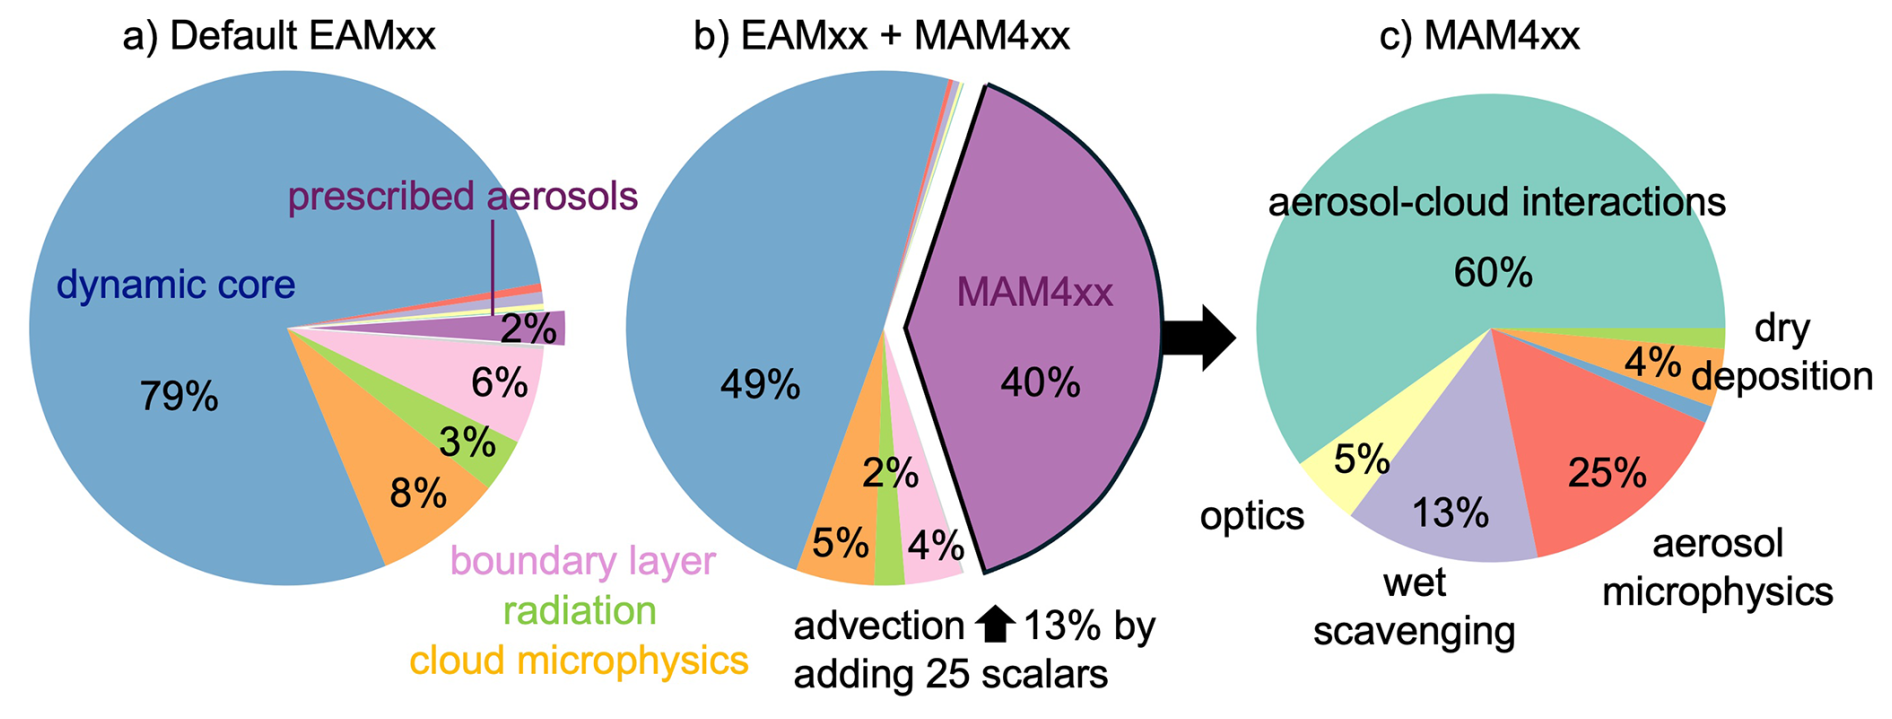
Figure 2Relative computational cost for (a) the default version of EAMxx, (b) EAMxx with MAM4xx, and (c) the cost of individual aerosol processes for a simulation on the Frontier supercomputer.
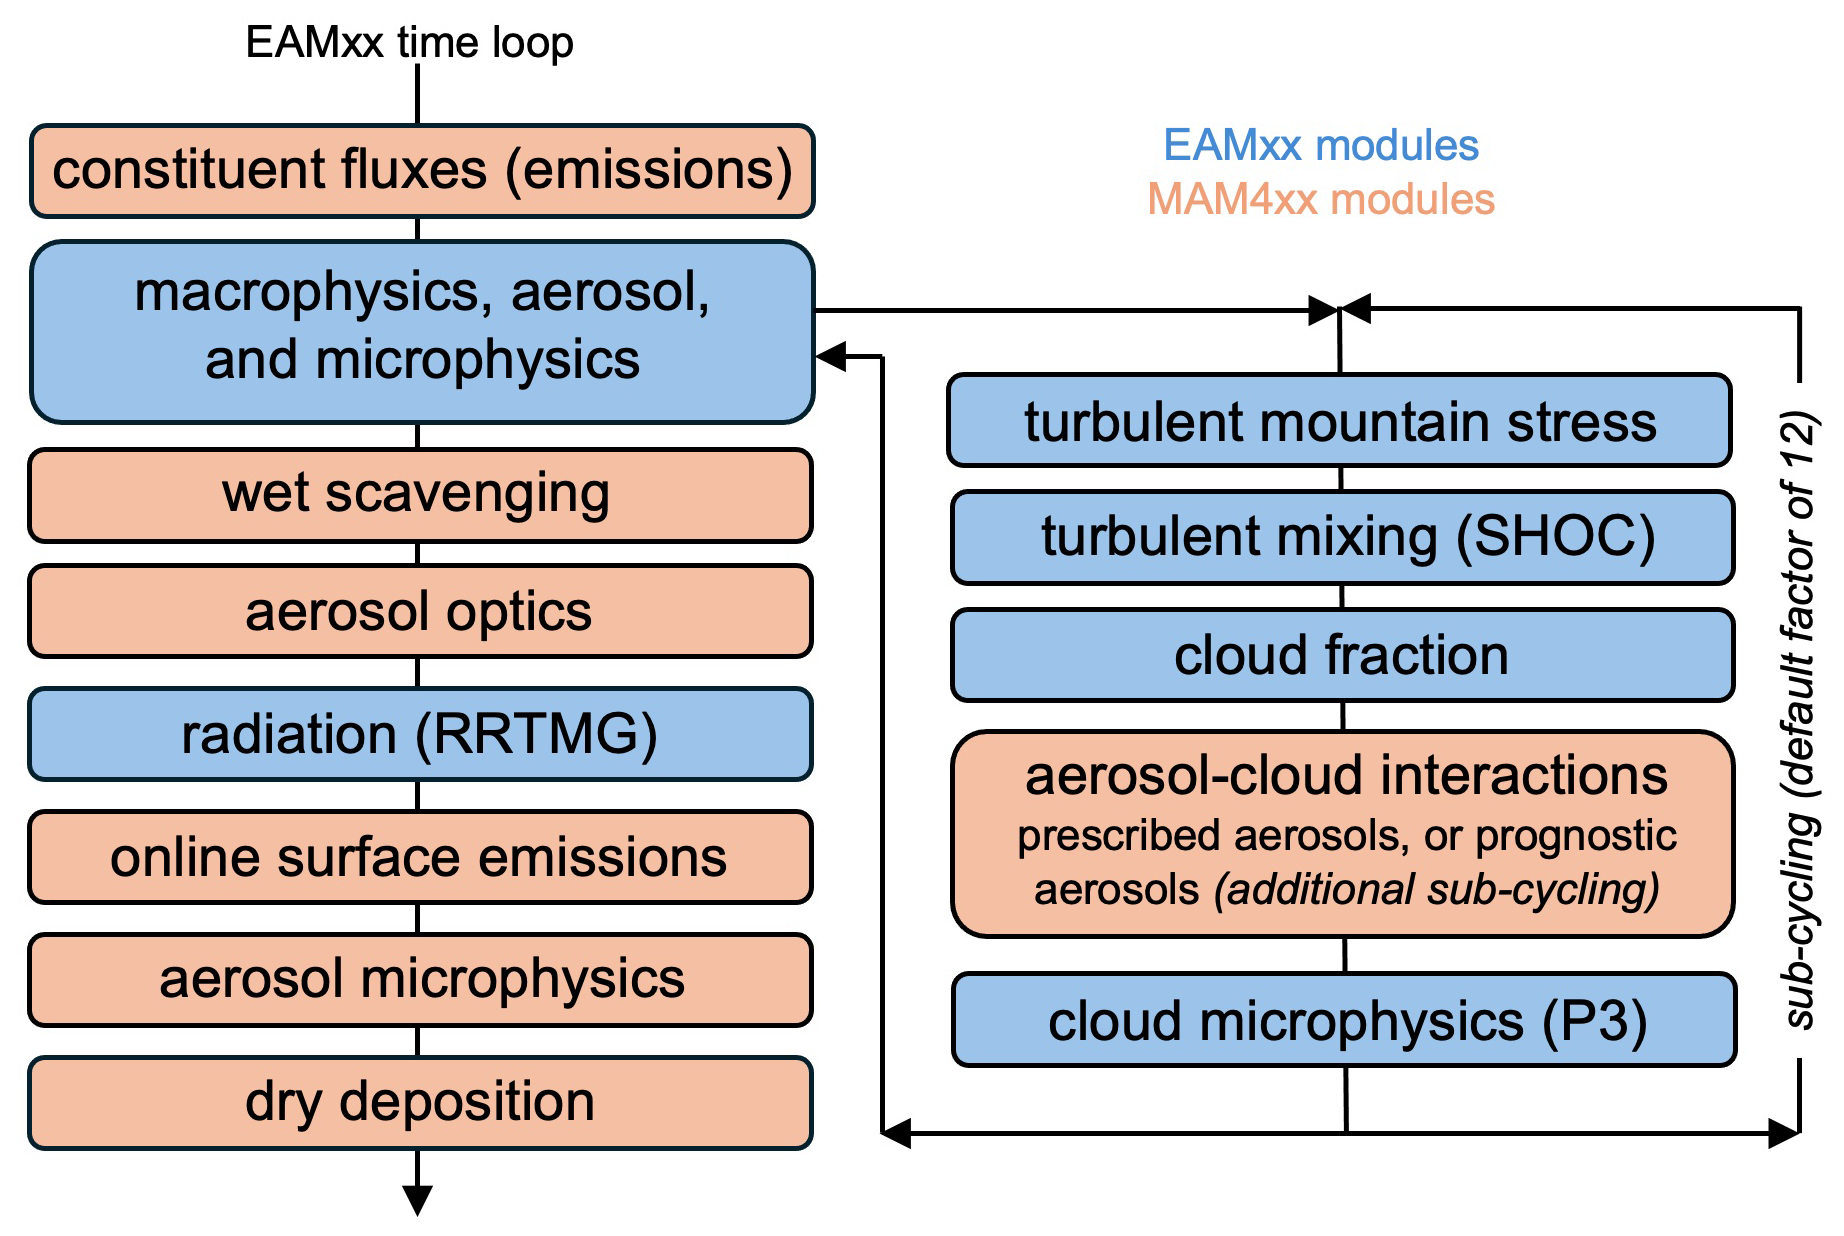
Part of the reason for the substantial computational expense is sub-cycling where ACI is invoked more frequently as often as other aerosol processes as shown in Fig. 3. In addition, we suspect that a large portion of the computational expense is due to the treatment of aerosol vertical mixing. In E3SMv2, a separate explicit-in-time vertical mixing treatment was included in MAM4, which was coupled with droplet activation within updrafts as part of the aerosol-cloud interaction modules. Thus, vertical mixing of aerosol scalars was not performed by the boundary layer parameterization as with other meteorological variables. This portion of MAM4 also required a large portion of the computational time in the Fortran version of the code. This treatment was preserved in EAMxx because our philosophy was to test the code processes as is. We expect that letting SHOC handle vertical mixing or adopting an implicit-in-time numerical scheme will result in significant cost savings; however, that would also require some modifications to the SHOC code or the current aerosol mixing parameterization.
The costs shown in Fig. 2 can be used in the future to target which pieces of the code can be reformulated to increase the efficiency on GPUs. We note that the relative computational cost of specific processes depends on the supercomputer. For example, we found that most of the computational expense of MAM4xx on Perlmutter was used by wet scavenging in contrast to the results shown for Frontier in Fig. 2c.
4.1 Model Configuration
A 33 d global simulation of EAMxx from 19 April through 21 May 2016 is used to demonstrate that the simulated aerosols from MAM4xx reasonably represent observations, focusing on measurements over the continental U.S. This spring period encompasses the first intensive observing period during the HI-SCALE field campaign (Fast et al., 2019) conducted around the ARM Southern Great Plains (SGP) site in north-central Oklahoma that has more detailed measurements of aerosol properties from operational surface monitoring networks, including aircraft measurements up to ∼4 km MSL. The Earth System Model Aerosol-Cloud Diagnostics package (ESMAC Diags, Tang et al., 2022, 2023) developed for the Fortran version of E3SM, has been adapted to use EAMxx metadata and sub-1° resolution to compute some of the comparisons of observed and simulated aerosol quantities in this study.
The simulation uses a horizontal grid spacing of ∼12 km and there are 128 vertical levels from the surface to the model top at 2.25 hPa. The initial conditions for winds, temperature, humidity, and ozone in EAMxx were based on ECMWF reanalyses (ERA5, Hersbach et al., 2020). Horizontal winds are nudged towards ERA5 at every vertical level using a nudging time scale of 6 h. Aerosols are initialized from an AMIP-style E3SMv2 simulation with 1° grid spacing. Anthropogenic emissions are obtained from Community Earth atmospheric Data System (CEDS) released in 2021 that has 0.1° grid spacing. The Global Fire Emissions Database (GFED, van der Werf et al., 2017) is used for biomass burning emissions that vary from day to day based on satellite thermal anomalies. While there is a five-day spin up period prior to the first HI-SCALE measurements on 24 April, the aerosol distributions in the lower troposphere are reasonably spun up within one simulation day.
EAMxx-MAM4xx simulations were conducted on the Department of Energy (DOE) Oak Ridge Leadership Computing Facility's Frontier supercomputer using 192 GPU nodes and National Energy Research Scientific Computing (NERSC) Perlmutter supercomputer using 256 GPU nodes, where each node has 4 cores. On Perlmutter, the 33 d simulation took about 2.74 h of wall-clock time to complete, or about 0.82 simulated year per wall-clock day, compared to 0.71 simulated year per wall-clock day on Frontier.
It is important to note that EAMxx was designed to be a global cloud-system scale resolving model, targeting a horizontal grid spacing of ∼3 km. As such, it does not have a parameterization to represent cloud macrophysics as is commonly done in coarse global Earth system models. The treatment of sub-grid scale clouds, transport, and precipitation in SHOC is not yet fully coupled with aerosols. Therefore, the current EAMxx-MAM4xx simulation that uses a grid spacing of ∼12 km will likely under-represent the vertical mixing of aerosols due to convective transport and the removal of aerosols by wet scavenging. It is not the objective of this paper to assess those uncertainties.
4.2 Spatial and Temporal Variability in Aerosol Mass
To illustrate the spatial variability of aerosol mass using a 12 km grid spacing, a snapshot of the predicted surface PM2.5 concentrations from MAM4xx at 12:00 UTC (06:00 CST) on 4 May 2016, is shown in Fig. 4a. Here, PM2.5 mass is defined as the sum of the Aitken and accumulation mode BC, organics, SO4, dust, and sea-salt. The large variations in aerosol mass over the south-central and southeastern U.S. are due to the accumulation of anthropogenic emissions and secondary aerosols over urban areas within the shallow nighttime stable boundary layer. Simulated PM2.5 from GEOS-FP at this time (Fig. 4b), defined as BC, OC, SO4, as well as dust and sea-salt from bin 1, is qualitatively similar to MAM4xx. For example, both models produce northerly winds behind a cold front with lower aerosol concentrations that are advected over eastern South Dakota, southern Minnesota, Iowa, and Wisconsin. Aerosol concentrations from both models are also higher ahead of this cold front over the central U.S. However, aerosol concentrations from GEOS-FP are lower behind the front and higher ahead of the front than those from MAM4xx, resulting in a stronger horizontal gradient in aerosol mass. Animations of the simulated surface concentrations (not shown) indicate that the driving synoptic meteorology that affects horizontal transport is similar between the models; therefore, how each model represents aerosol physical processes and emissions are likely driving the differences in concentrations. Another difference between the models is that the coarser spatial resolution of GEOS-FP does not produce distinct higher concentrations over urban areas as with MAM4xx.
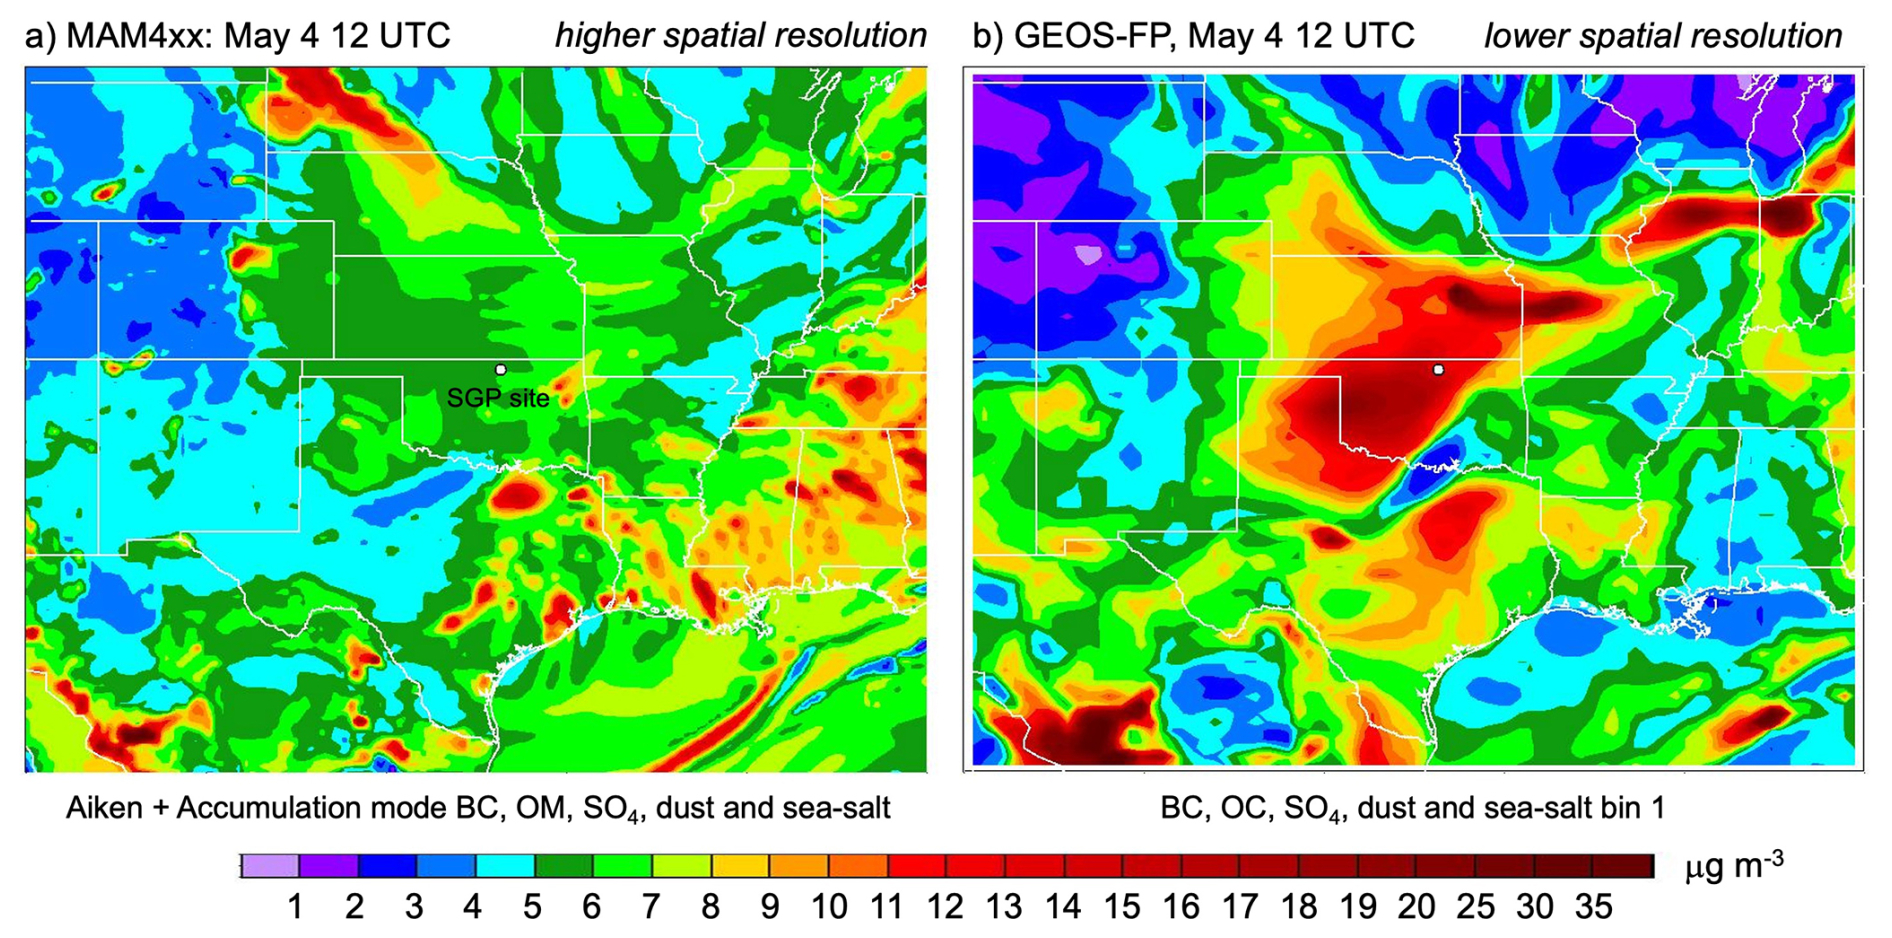
Figure 4Fine mode aerosols simulated by (a) MAM4xx and (b) GEOS-FP at 12:00 UTC on 4 May 2016. The white dot denotes the location of the ARM SGP site where detailed surface and aircraft measurements of aerosol properties are available during the HI-SCALE field campaign period.
A quantitative assessment of simulated PM2.5 at the Ponca City, Oklahoma EPA monitoring station is shown in Fig. 5. The average observed concentration during the simulation period (19 April to 22 May) is 5.8 µg m−3 and the bias in MAM4xx and GEOS-FP is −0.2 and 0.8 µg m−3, respectively. Multi-day and diurnal variations in observed and MAM4xx concentrations are moderately correlated with a Pearson correlation coefficient (r) of 0.41. The correlation of observed and GEOS-FP concentrations over the same time period is somewhat higher (r=0.45). In particular, GEOS-FP can represent spikes in PM2.5 (e.g., 4–5, 9, 13, 14 April) that are likely due to biomass burning plumes passing over the region since they are comprised mostly of organic carbon (not shown). Nevertheless, GEOS-FP does not reproduce all the PM2.5 spikes seen in the observations (e.g., 22 April, 14 May and 26 May) and sometimes simulates spikes that are not observed. The pie charts in Fig. 5 show the relative contribution of aerosol composition at 12:00 UTC, 4 May 2016, at the same time as Fig. 4. Aerosol mass from MAM4xx is comprised mostly of SO4, primary organic matter (POM), and secondary organic aerosols (SOA). Previous Aerosol Chemical Speciation Monitor (ACSM) measurements in the region (Parworth et al., 2015) show that springtime OM is often the largest fraction of PM1 concentrations over north-central Oklahoma and that primary organic aerosols, defined as hydrocarbon-like organic aerosol (HOA) via Positive Matrix Factorization source apportionment, are a negligible fraction of fine mode organic matter. Therefore, the ratio of primary to secondary organic aerosols from MAM4xx is likely too high. The relative contribution of BC from both models is nearly the same. Conversely, GEOS-FP concentrations at this time are comprised mostly of dust which explains why aerosol concentrations are higher than MAM4xx over northern Texas, Oklahoma, Kansas, and Missouri (Fig. 4b). These results demonstrate that even when MAM4xx and GEOS-FP aerosol concentrations are similar, the simulated composition can be quite different.
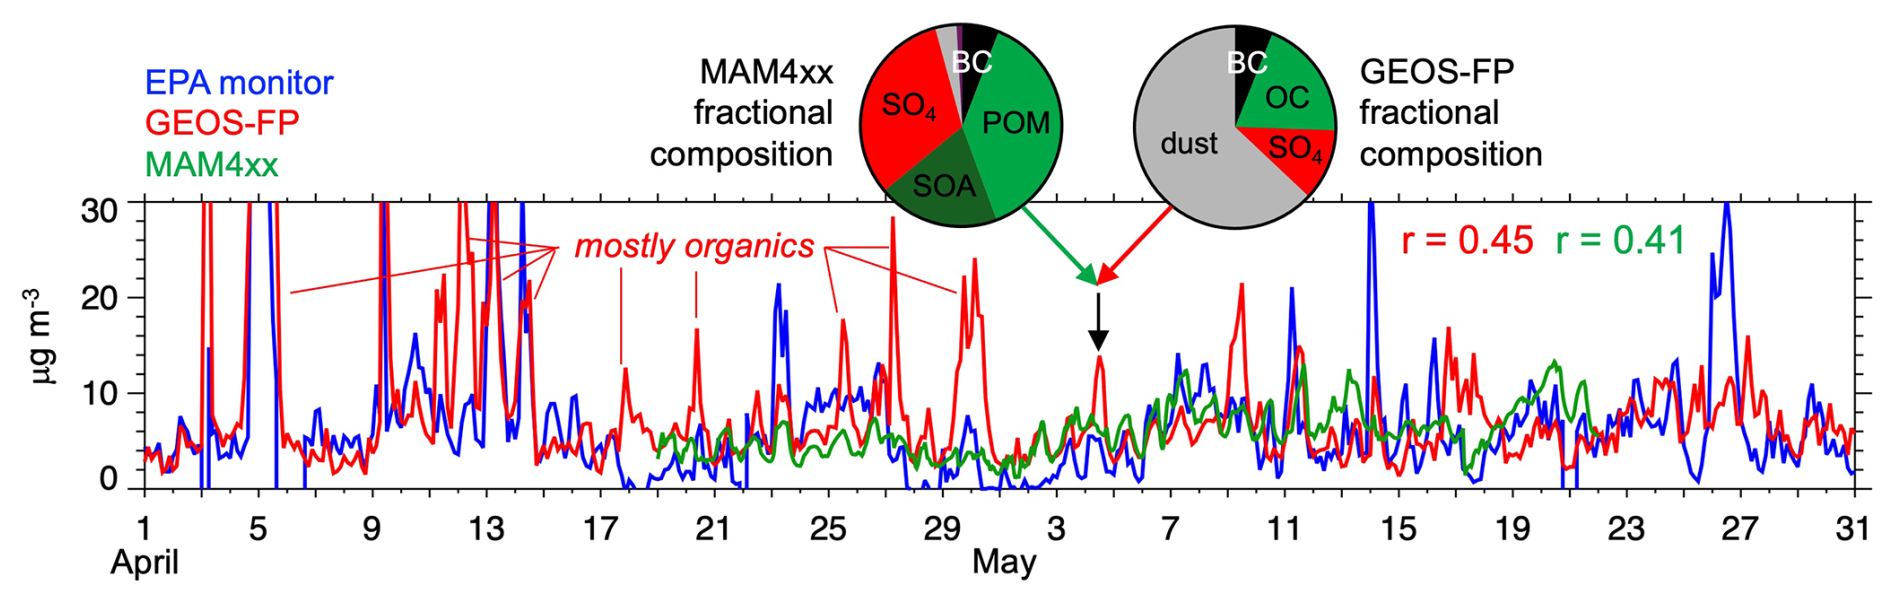
Figure 5Time series of observed and simulated PM2.5 at Ponca City, Oklahoma (∼30 km east of ARM SGP site). Pie charts denote fractional composition from both models at 12:00 UTC 4 May 2016, corresponding to the spatial distribution shown in Fig. 4. The blue line denotes the observations, while the red and green lines denote the GEOS-FP and MAM4xx simulations, respectfully.
Figure 6a is similar to Fig. 5, except that it represents an average of observed and simulated PM2.5 over all the EPA monitors within the domain shown in the lower right panel. The observed mass from all the EPA monitors is 7.84 µg m−3. The simulated PM2.5 mass from GEOS-FP (7.63 µg m−3) and MAM4xx (7.09 µg m−3) is lower than observed. Both models represent the multi-day trends in aerosol mass over the domain, with r=0.42 and 0.48 for MAM4xx and GEOS-FP, respectively; however, the models struggle to represent the temporal trend in average aerosol mass during late April and early May. MAM4xx concentrations are too low between 25 April and 1 May and GEOS-FP concentrations are too high between 29 April and 2 May. The range of PM2.5 concentrations simulated by MAM4xx at the EPA monitors (vertical green lines) is smaller than observed (light blue shading) as shown in Fig. 6b. One reason for the inability of MAM4xx to represent peak aerosol concentrations is that it does not account for nitrate and ammonium; however, those two components are usually a small component of PM2.5. More likely, the SOA treatment in MAM4xx is simple and likely under-represents the formation of SOA. The 12 km horizontal grid spacing also contributes to underestimates of clouds and rain which would act as a sink for aerosols. EAMxx currently does not have a sub-grid scale convection parameterization outside of SHOC so that wet scavenging may be too low which could explain why the model does not represent the lowest observed PM2.5 concentrations. The range of simulated PM2.5 from GEOS-FP (light red shading) is also smaller than observed, but it is closer to observations than MAM4xx.
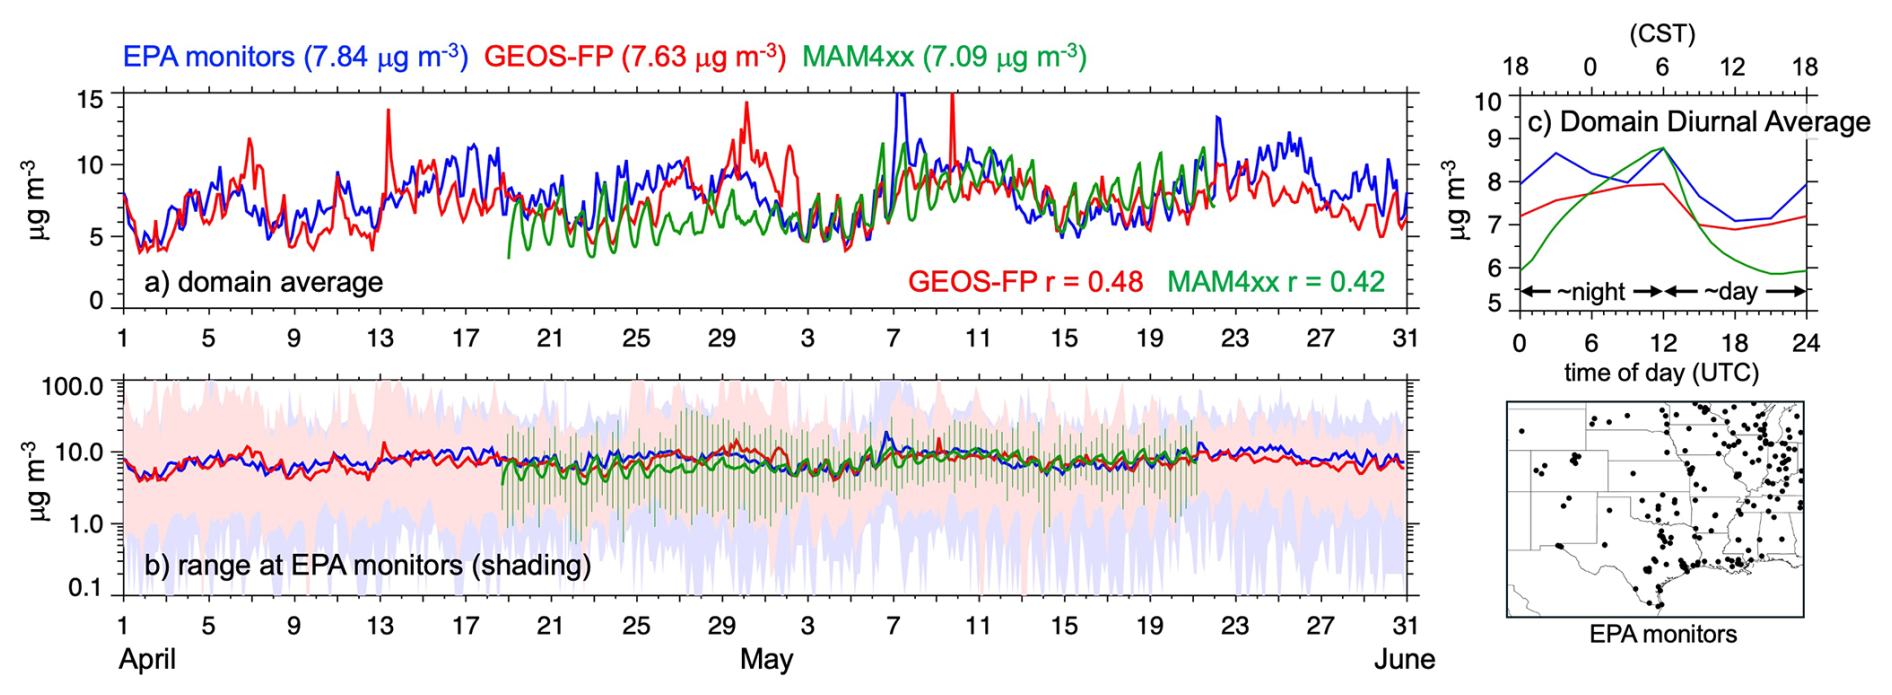
Figure 6(a) Average, (b) range, and (c) diurnal average of observed and simulated PM2.5 over central U.S. at stations as defined by the bottom right panel. Time of day expressed in UTC since stations encompass multiple time zones, although Central Standard Time (CST) denoted in (c) to reflect night and day periods. The blue line denotes the observed average, while the red and green lines denote the GEOS-FP and MAM4xx simulated averages.
Variation in emissions, boundary layer mixing, and secondary aerosol formation will result in diurnal variations in near-surface aerosol concentrations. Figure 6c shows the observed and simulated mean diurnal variations among all the EPA monitors. Not surprisingly, observations tend to be higher at night. While emissions are usually lowest during the night, the boundary layer is shallower so that vertical mixing and dilution is reduced compared to the daytime. Observed concentrations are lower during the day due to increased vertical mixing within the convective boundary layer that dilutes aerosol concentrations, despite condensational growth resulting from photochemical reactions. The diurnal variation from MAM4xx reproduces this overall trend; however, the diurnal variability is stronger than observed which is also reflected in the time series shown in Fig. 6a. Conversely, GEOS-FP tends to have diurnal variations that more closely resemble observations, although the nighttime concentrations tend to be lower than observed.
A scatter plot of observed versus simulated PM2.5 is shown in Fig. 7a. Both models occupy the same footprint with MAM4xx having fewer stations with a positive bias (65 compared to 94) and more stations with a negative bias (126 compared to 97) than GEOS-FP. While the overall bias from both models is similar, there are differences in where the largest biases occur. In MAM4xx, the largest overpredictions are over the central Mississippi valley, and the largest underpredictions are over Iowa (Fig. 7b). In contrast, GEOS-FP tends to overpredict PM2.5 in the region surrounding Chicago and western South Dakota with underpredicted PM2.5 along the Gulf coast (Fig. 7c).
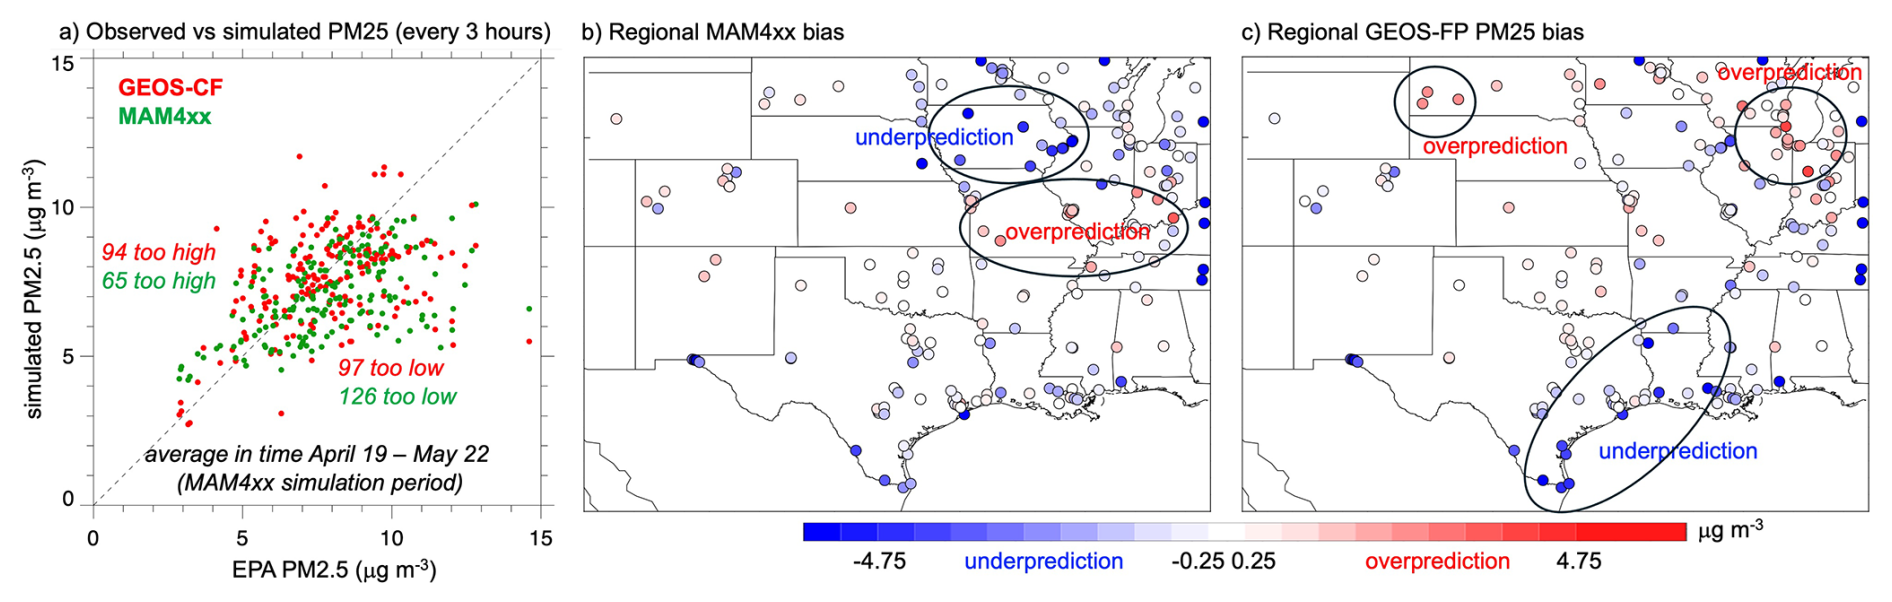
Figure 7(a) Errors in simulated PM2.5 and regional variations in overall bias from (b) GEOS-FP and (c) MAM4xx. Values in (a) are every 3 h at the same time intervals as the GEOS-FP analyses. Red and green dots in (a) denote values from GEOS-FP and MAM4xx, respectively.
The correlations of observed and simulated PM2.5 also show regional variations as shown in Fig. 8. MAM4xx has the highest correlations with r>0.5 over most of southeastern Texas, while the lowest correlations close to zero are produced over the Midwest (Fig. 8a). The highest correlations with r>0.5 from GEOS-FP occur at stations over the central and northern Great Plains, while the lowest correlations near zero occur around Houston (Fig. 8b).
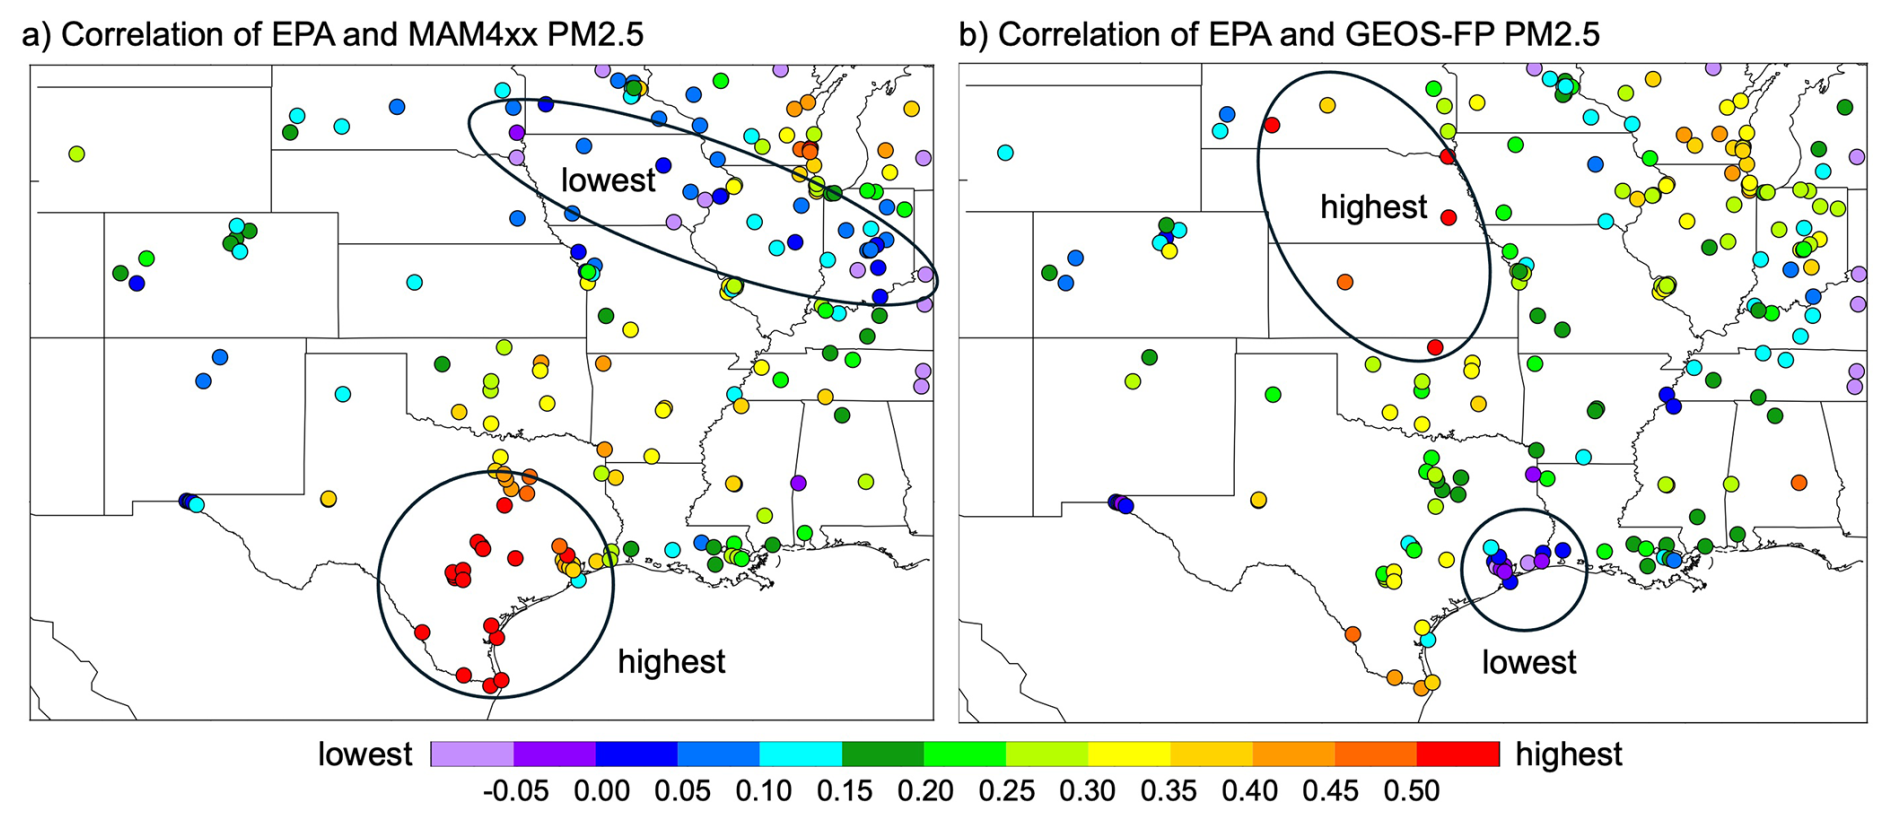
Figure 8Regional variations in correlation between observed and simulated PM2.5 from (a) GEOS-FP and (b) MAM4xx.
4.3 Aerosol Composition, Size, and CCN during HI-SCALE
The ARM SGP site provides various measurements of aerosol properties that are useful to evaluate models. For example, the ACSM (e.g., Parworth et al., 2015) has obtained aerosol composition measurements of PM1 at this site for over a decade. The observed and simulated OM and SO4 during April and May 2016, are shown in Fig. 9a. While the ACSM also measures NO3, NH4, and chloride, those species are not simulated by either model. The average total of OM and SO4 between 21 April and 22 May is 2.12 µg m−3. Both models have higher concentrations of 4.86 and 5.41 µg m−3 from MAM4xx and GEOS-FP respectively. The bottom two panels of Fig. 9a show this positive bias is mostly due to an overprediction in SO4. MAM4xx produces a consistent bias throughout the simulation period, while GEOS-FP tends to produce intermittent SO4 plumes that contribute to the overall bias. Both models are approximately five times higher than observed on average. In contrast, simulated OM is only about 1.4 and 1.7 times higher than observed for MAM4xx, and GEOS-FP respectively. Figure 9b shows the observed and simulated relative fraction of OM and SO4 as a function of time. While there are some periods where the ratio of OM and SO4 is similar to observed, it is generally too low in both models.
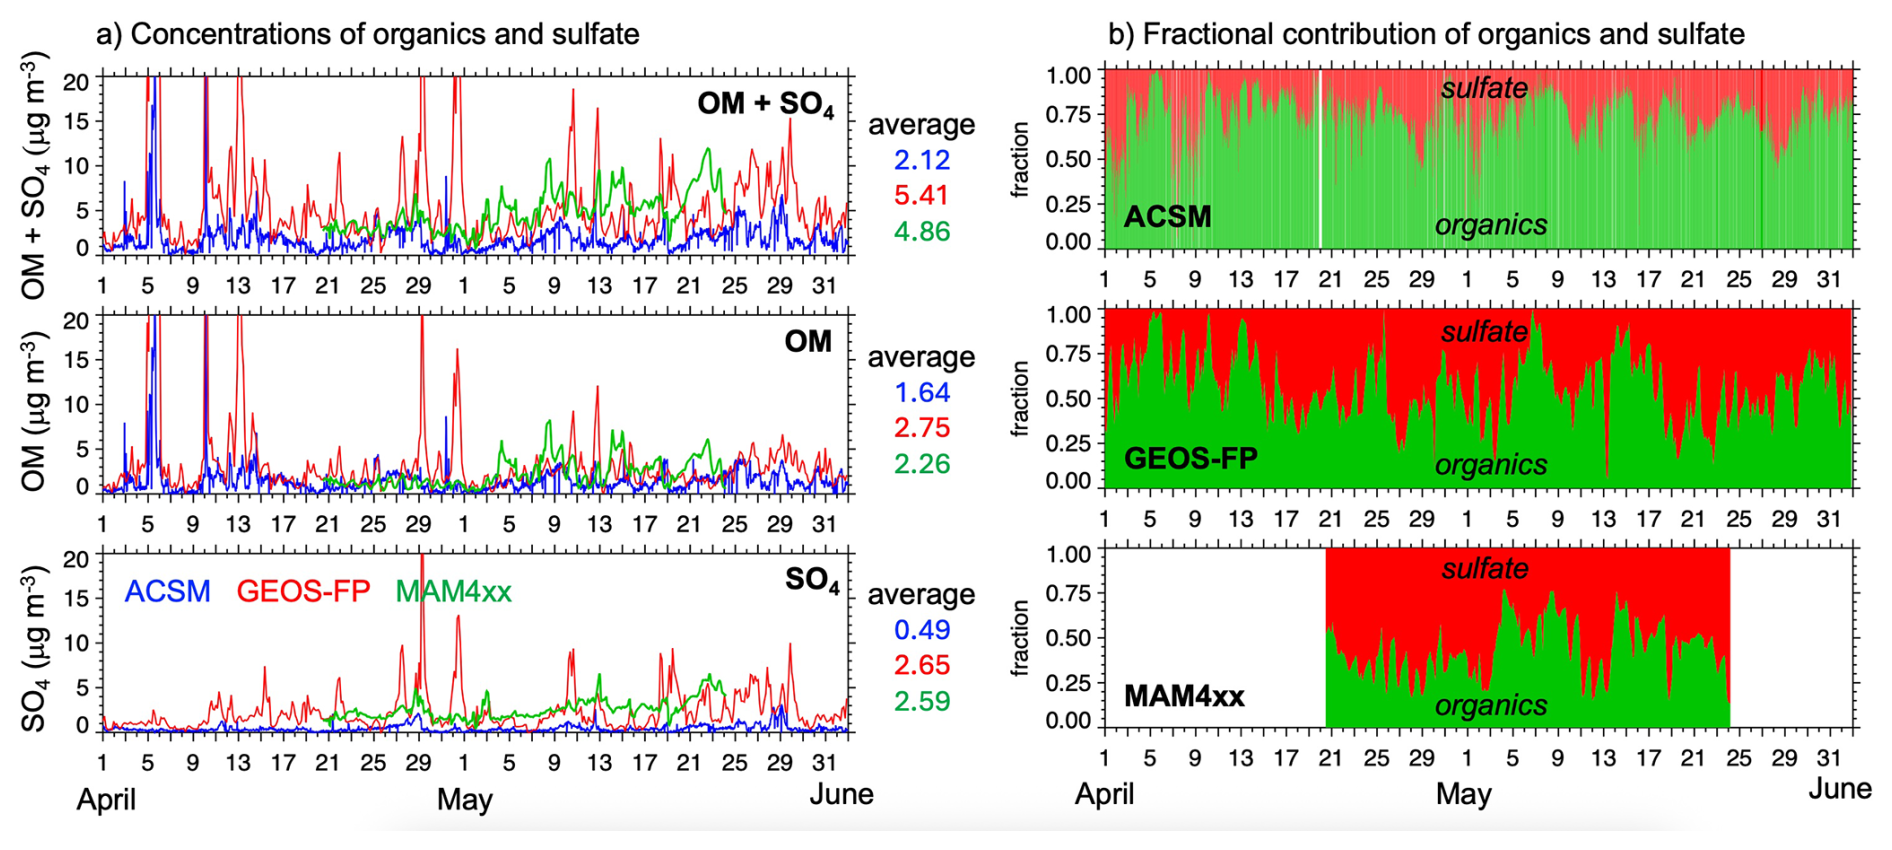
Figure 9Observed and simulated (a) surface concentrations and (b) fractional contributions of organics and sulfate at the ARM SGP site in north-central Oklahoma. The blue line denotes observations, while the red and green lines denote GEOS-FP and MAM4xx simulations, respectfully.
There were also aircraft measurements of aerosol composition from an Aerosol Mass Spectrometer (AMS) as part of the HI-SCALE campaign. There were 17 flights where sampling was usually conducted within 100 km of the ARM SGP site up to an altitude of 4 km MSL. Most of the flights occurred between mid-morning and early afternoon. The ESMAC Diags package extracts MAM4xx simulation output at grid cells that most closely match the location and time along the aircraft flight paths. Figure 10 summarizes the observed and simulated OM and SO4 across all the flights with probability density functions (PDFs) using 0.2 µg m−3 bins. While the observed and simulated OM PDFs are similar between 1 and 3 µg m−3, the model produces too many occurrences of higher OM concentrations between 4 and 6 µg m−3 that are not observed and too few occurrences of low OM concentrations <1 µg m−3 (Fig. 10a). In contrast, there is very little overlap in the observed and simulated PDFs of SO4 (Fig. 10b) where MAM4xx usually produces concentrations greater than 1.5 µg m−3 while the observations are usually less than 1 µg m−3. These results are consistent with the biases at the surface as shown in Fig. 9, showing that overprediction of OM and SO4 is not confined to the surface.
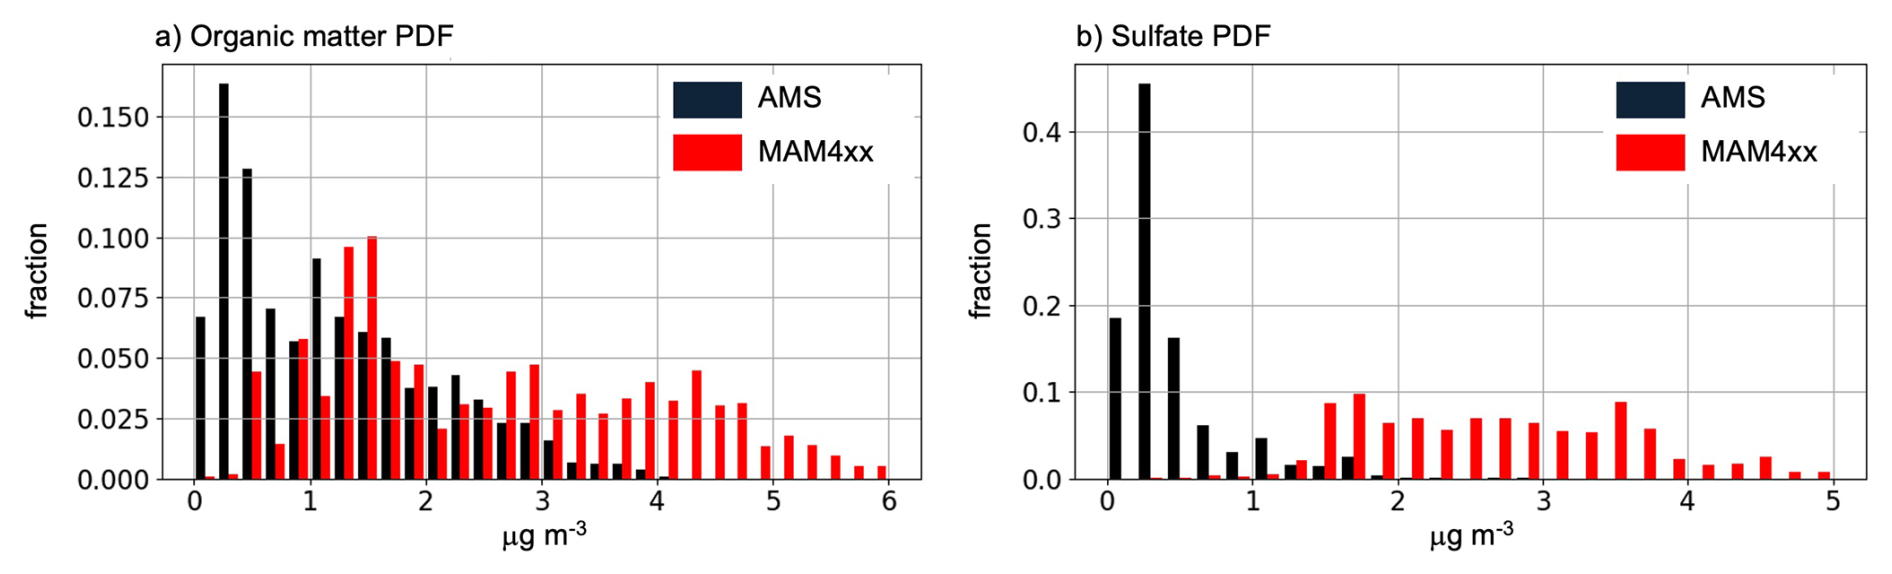
Figure 10Observed and simulated probability density function of (a) organic matter and (b) sulfate for all G-1 aircraft flights during the HI-SCALE field campaign.
The Interagency Monitoring of Protected Visual Environments (IMPROVE) network also provides 3 d averages of aerosol composition measurements across the U.S. The simulated surface concentrations of BC, OM, SO4, and PM2.5 from MAM4xx and GEOS-FP are averaged over the same 3 d periods and compared with the IMPROVE network measurements that are available during the simulation period (Fig. 10). The locations of the IMPROVE monitors are shown in the right panel of Fig. 11. The locations of the IMPROVE monitors are shown in the right panel of Fig. 11. While there are often large errors in simulated BC for some sites and periods, simulated BC averaged over all the sites between 19 April and 22 May is similar to observed (Fig. 11a). As with the SGP site, both models tend to have OM and SO4 that is higher than observed (Fig. 11b and c), with average OM concentrations closer to observed than SO4. While average simulated PM2.5 concentrations at the EPA monitors is somewhat lower than observed (Fig. 5), average simulated PM2.5 at the IMPROVE sites (Fig. 11d) is somewhat higher than observed. This difference is likely due to measurement site locations. IMPROVE sites are in rural regions and western U.S., while EPA monitors tend to be located within or close to cites in the eastern U.S.
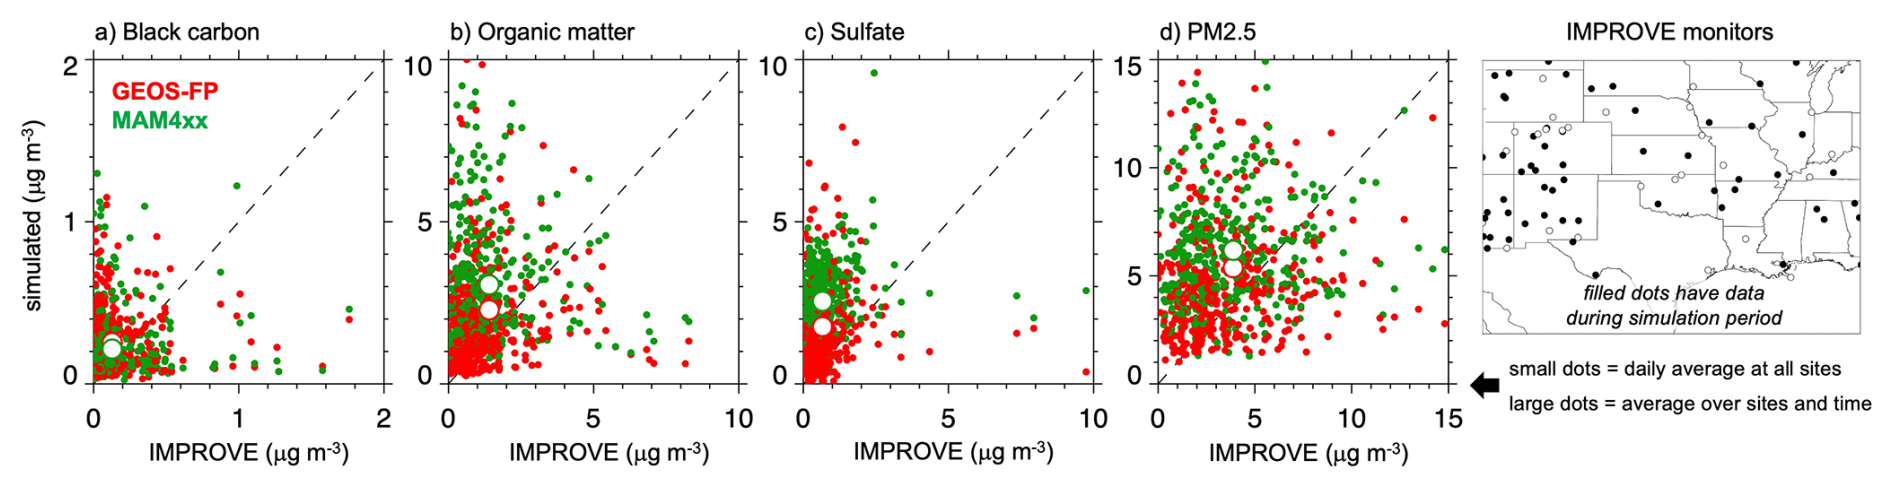
Figure 11Scatter plots of observed and simulated (a) black carbon, (b) organic matter, (c) sulfate, and (d) PM2.5 at IMPROVE monitoring stations over the central U.S. Red and green dots denote GEOS-FP and MAM4xx values, respectfully.
There were also several instruments (FIMS, UHSAS, PCASP, CAS, FCDP) that measured portions of the aerosol size distribution on the aircraft. These measurements have been merged into a single product, called the Best Estimate Aerosol Size Distribution (BEASD), that used here to compare with the MAM4xx simulated size distribution. As with the aircraft aerosol composition (Fig. 10), the aerosol size distribution is extracted from the model output along the flight paths in ESMAC Diags. The average and range of values of aerosol number as a function of aerosol diameter are shown in Fig. 12. While simulated aerosol number concentrations are similar to observations between 150 and 400 nm diameters, they are usually lower than observed for diameters less than 100 nm higher than observed for diameters between 400 and 1000 nm. The simulated aerosol number concentration variability is also less than observed, consistent with predictions of PM2.5 (Fig. 5). The overprediction in aerosol number between 400 and 1000 nm is consistent with the high bias in OM and SO4 shown in Fig. 10. The underprediction in aerosol number for diameters less than 150 nm is likely due to the simple aerosol nucleation scheme that represents new particle formation (NPF) and using only the Aitken mode to represent the smallest particles. Zhao et al. (2024) added 11 NPF mechanisms and an ultrafine mode in E3SMv1 to better represent nucleation and particle growth to larger sizes and showed improvements in the simulated aerosol size distribution. These mechanisms are not incorporated into MAM4xx; therefore, porting this code to C and integrating it with MAM4xx in the future will likely improve the representation of the aerosol size distribution.
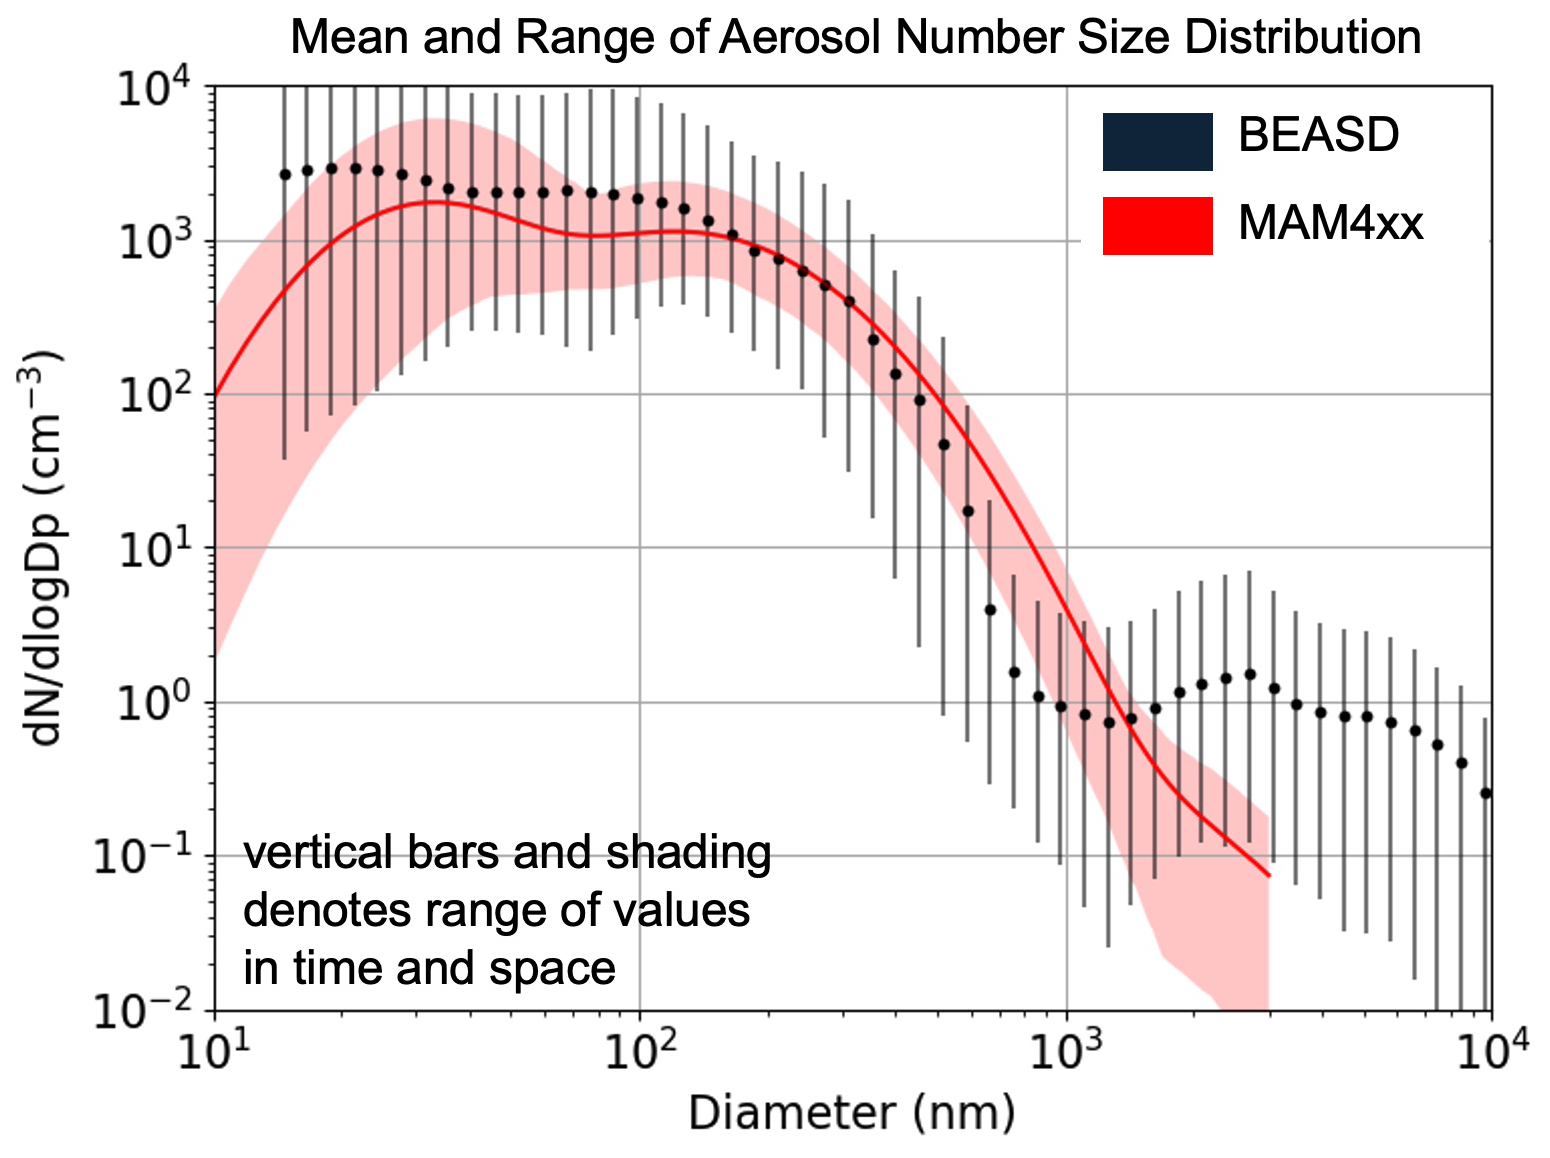
Figure 12Observed and simulated aerosol number size distribution for all G-1 aircraft flights during the HI-SCALE field campaign. Black dots (observed) and red line (simulated) are mean values. Vertical bars and shading denote the 5th to 95th percentiles along the flight paths that vary in space and time.
Aerosol composition (via hygroscopicity), aerosol size distribution, and supersaturation over liquid water are factors that determine cloud condensation nuclei (CCN) concentrations (e.g., Abdul-Razzak and Ghan, 2000; Petters and Kreidenweis et al., 2007; Twomey, 1974) that influence cloud droplet activation and cloud properties. Figure 13 shows the observed and simulated CCN concentration PDFs along the HI-SCALE aircraft flight using 50 cm−3 bins. The observed and simulated PDFs overlap for both 0.2 % and 0.5 % supersaturations, although MAM4xx produces a narrower distribution that does not produce as many low and high CCN concentrations as observed. Given the high bias in OM and SO4 concentrations (Fig. 10) and the high biased SO4 to OM ratios that will lead to higher than observed hygroscopicity, it may be surprising that CCN concentrations are not biased high as well. Since aerosol number concentrations between 100 and 300 nm are reasonably simulated on average, errors in aerosol size distribution may not have as large of effect on CCN at 0.2 % supersaturation. At higher supersaturations such as 0.5 %, smaller aerosols with diameter down to 25 nm can activate. Nevertheless, errors in simulated CCN at 0.5 % are similar to those at 0.2 % even though the model underestimates aerosol concentrations smaller than 150 nm. The specific factors contributing to CCN errors are likely due in part to compensating errors; however, understanding these compensating errors would require a CCN closure study that is beyond the scope of this paper.
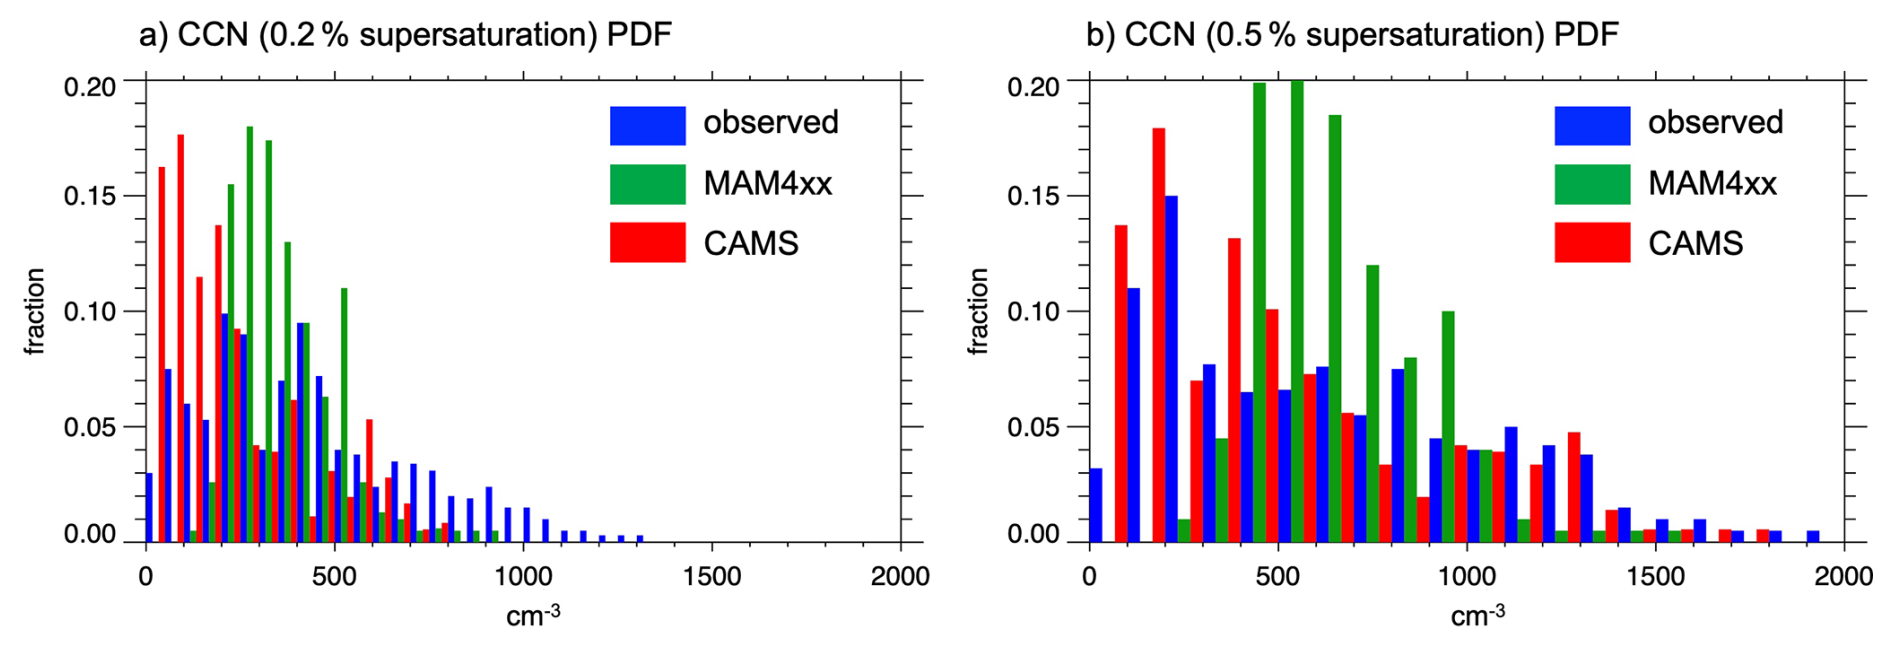
Figure 13Observed and simulated CCN at (a) 0.2 % and (b) 0.5 % supersaturation for G-1 aircraft flights during the HI-SCALE field campaign. Blue denotes observed, while green and red denote MAMxx and CAMS results.
Also included in Fig. 13 are CCN concentrations derived from aerosols in the Copernicus Atmosphere Monitoring Service (CAMS) reanalysis (Block et al., 2024) over the SGP on the same days as the aircraft measurements. At 0.2 % supersaturation, CAMS produces concentrations that tend to be smaller than observed and MAM4xx but the concentrations at 0.5 % supersaturate are closer to observed than MAM4xx. This is consistent with Block et al. (2024) that show CAMS CCN at 0.4 % supersaturation that show a relatively low bias compared with surface measurements, although the correlation is around 0.24. Data assimilation in CAMS constrains the meteorological fields in CAMS; therefore, transport and mixing is likely different than the present EAMxx simulation. In addition, aerosols in CAMS are corrected by assimilation of AOD observations. For these reasons it is a not surprising that CCN from MAM4xx and CAMS are different. Figure 13 also shows that constraining meteorology and assimilating observed AOD does not necessary result in reasonable CCN concentrations at all supersaturations.
4.4 Aerosol Optical Depth
Aerosol optical depth (AOD) is used to evaluate the performance of simulated aerosols throughout the atmospheric column. The optical properties of aerosols influence the radiation budget via scattering and absorption. The ARM SGP central facility (E13) provides measurements of AOD at 500 nm derived from an MFRSR instrument (Fig. 14). Data are not available during the night or during cloudy periods. There are also two other sites within 80 km of the central facility that also provide AOD measurements, E39 and E40, that are used to show variability of AOD. Simulated AOD for the MAM4xx grid cell that encompasses the E13 site are usually higher than observed. The average observed AOD during the period is 0.063 while the average AOD from MAM4xx is 0.149, about 2.4 times higher than observed. This is consistent with the high bias in OM and SO4 at both the surface (Fig. 9a) and aloft (Fig. 10). The vertical lines denote the simulated range of AOD for all MAM4xx grid cells within 80 km of the SGP central facility. However, additional AOD measurements are needed to better characterize the observed spatial variability that could be used to evaluate the simulated spatial variability. While GOES-FP better represents the multi-day trend in AOD at the SGP site than MAM4xx after 5 May, the AOD is also higher than observed. The simulated average during the period is 0.188, which is about three times higher than observed.
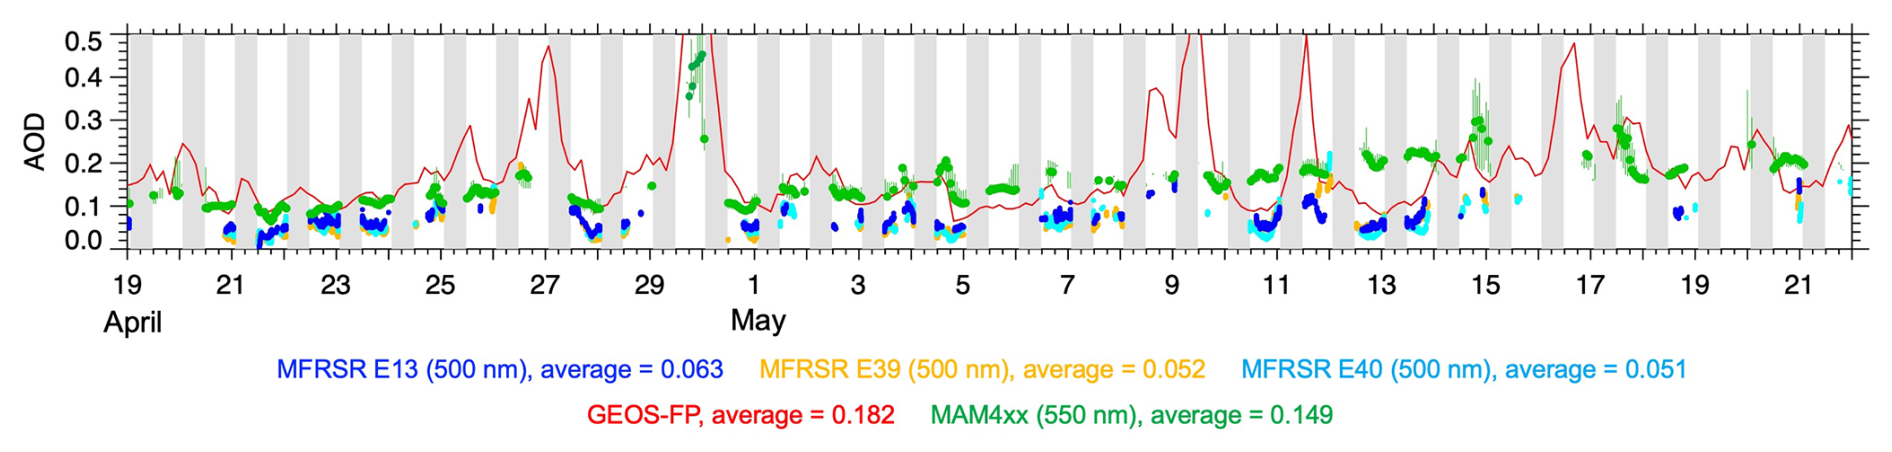
Figure 14Observed and simulated AOD at the ARM SGP site. E13, E39, and E40 are three sites around the SGP site where AOD at 500 nm is obtained from the MFRSR instrument (blue, light blue, orange dots). Green dots and red line denote the MAM4xx and GOES-FP simulations, respectively. Vertical lines denote range of MAM4xx AOD up to 80 km from E13. Gray shading denotes nighttime periods.
We also compared the simulated AOD averaged over the simulation period with those from the MODIS Aqua satellite (Fig. 15). The white areas in Fig. 15a are missing data and the dots in Fig. 15a and b represent average AOD from NASA's Aerosol Robotic Network (AERONET) sites. The missing data from MODIS is most likely due to cloud cover in certain regions during the overpass times. In contrast, EAMxx produces fewer clouds at these overpass times, and thus Fig. 15b indicates that there is simulated clear-sky AOD for each grid cell on at least one of the simulation days.
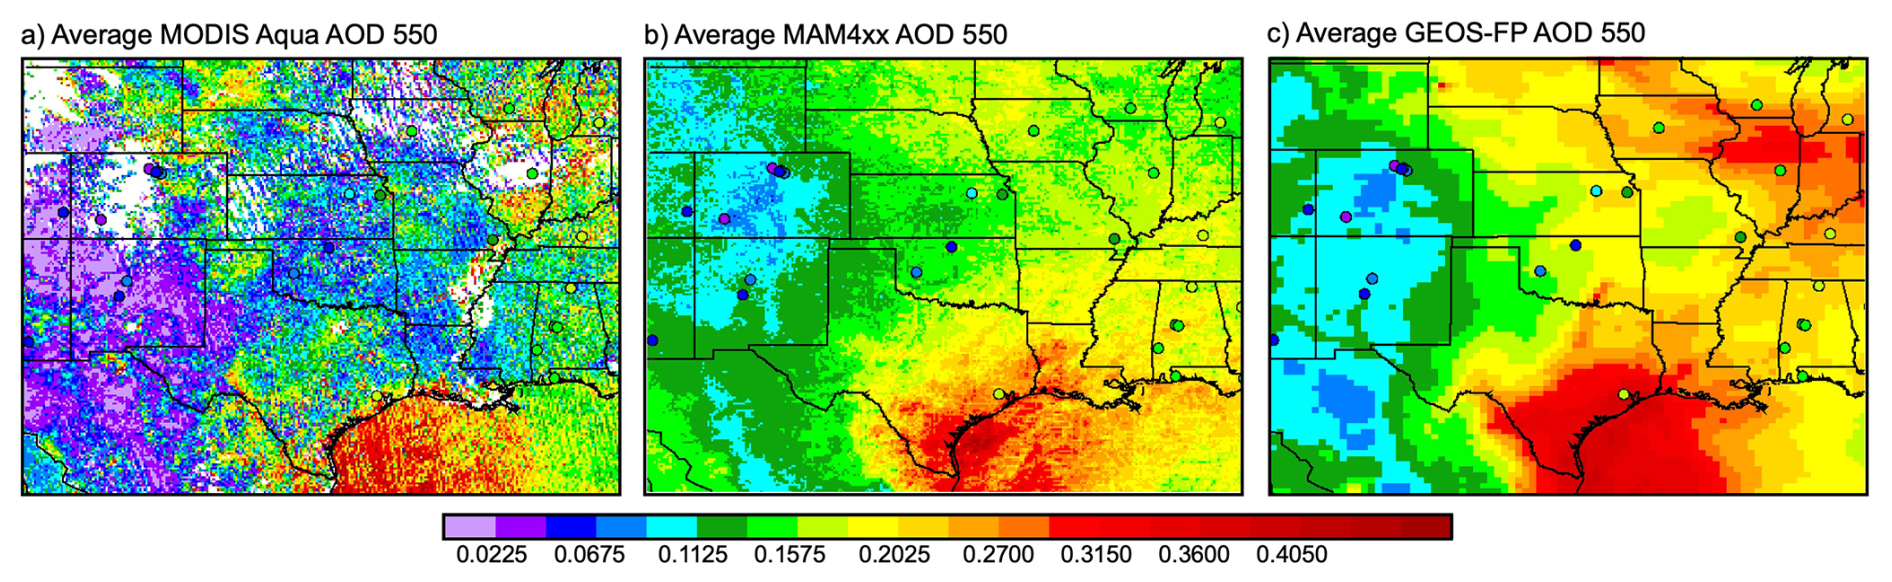
Figure 15Spatial distribution of average AOD at 550 nm during the simulation period from (a) MODIS Aqua, (b) MAM4xx, and (c) GEOS-FP. (b) and (c) are the approximate time of the MODIS Aqua overpass.
Not surprisingly, the AERONET and MODIS data are usually consistent (Fig. 15a). The simulated spatial pattern in AOD is similar in some respects to MODIS. The highest AOD is observed and simulated over the western Gulf of Mexico and the lowest AOD is observed and simulated over the interior of the western U.S. and western Mexico. While the simulated AOD from MAM4xx (Fig. 15b) is usually too high, there are regions in the Midwest and northeastern U.S. where the simulated AOD is too low. GEOS-FP (Fig. 15c) produces high AOD over the Gulf of Mexico and low AOD over the interior of the western U.S. similar to MAM4xx; however, GEOS-FP produces higher AOD over the Great Lakes region that is more consistent with MODIS. Figure 16 directly compares the average AOD from MAM4xx over the simulation period at each grid cell compared with the equivalent values from MODIS AOD for the same grid cells. The white dots denotes average values from MODIS, MAM4xx, and GEOS-FP which are 0.127, 0.165, and 0.188, respectively. Figure 16 also shows that the minimum AOD from MAM4xx and GEOS-FP is rarely less than 0.09, even though such values are common in observations. Thus, while both models reproduce the large-scale geographical pattern of AOD, values from both models are more commonly too high than too low, with substantial regional variability in biases.
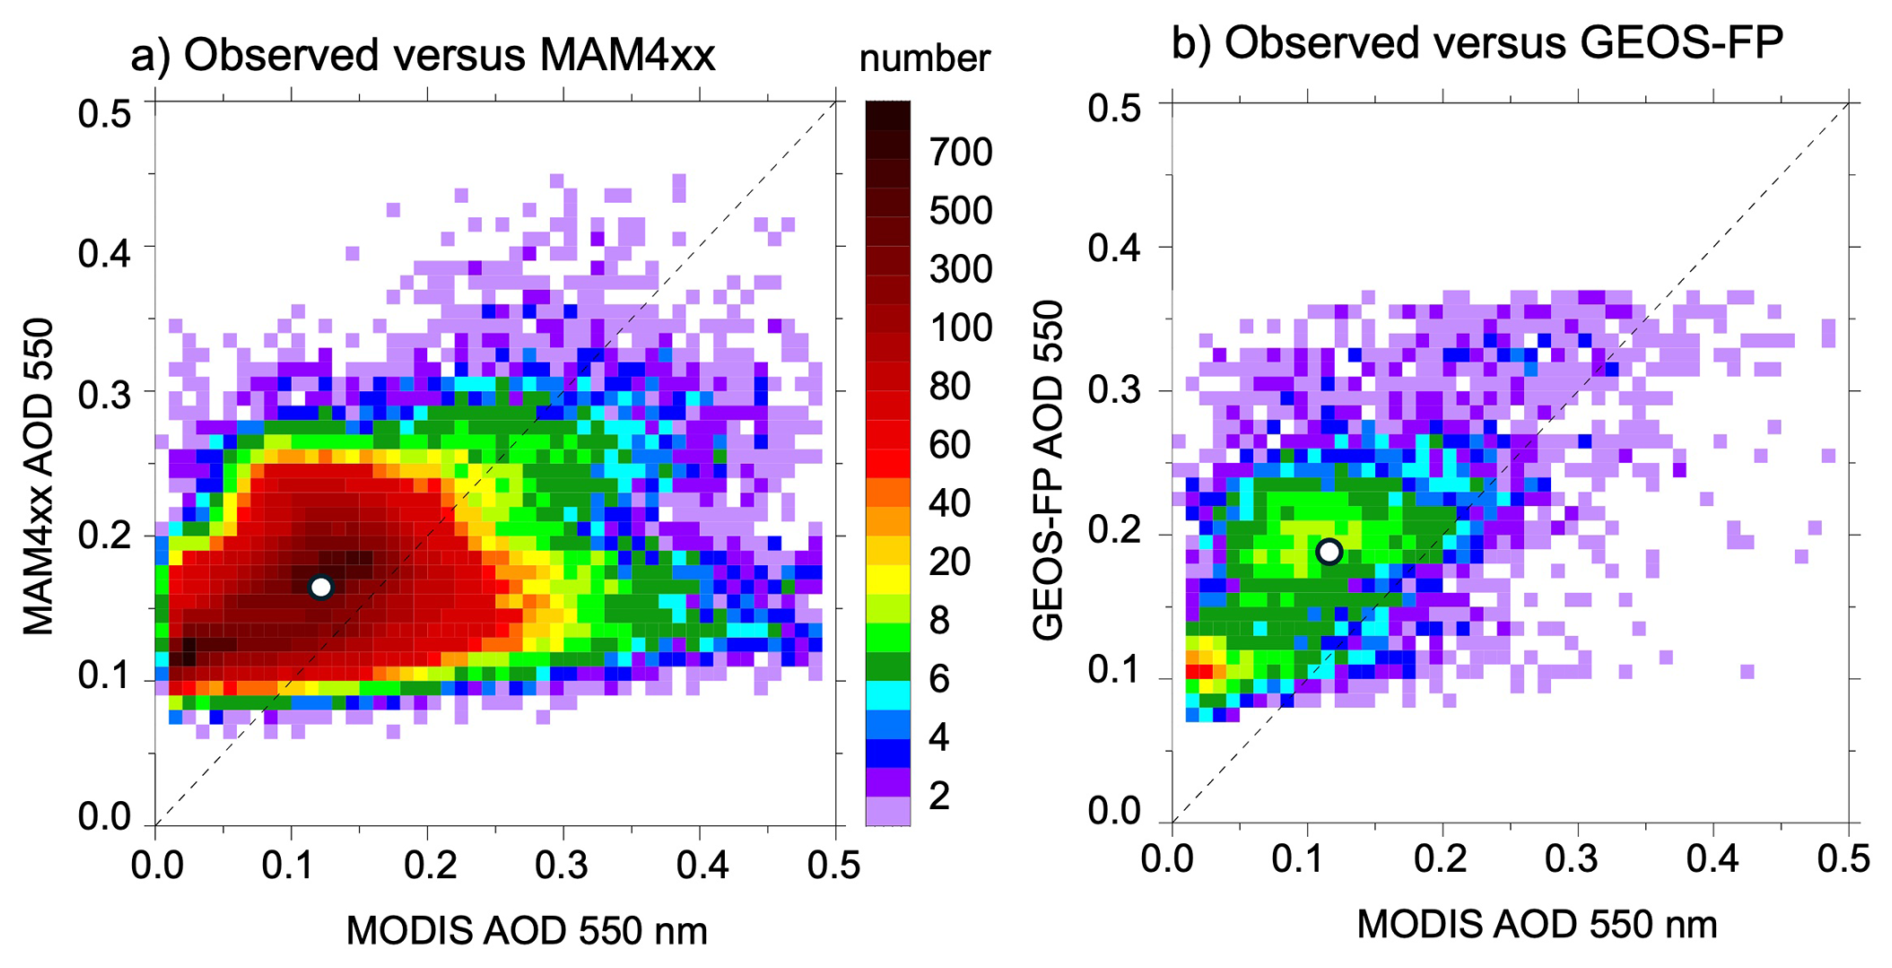
Figure 16Heat map depicting observed and simulated AOD averaged over the month for (a) MAM4xx and (b) GOES-FP, where MODIS values are also averaged spatially within the model grid cells.
Figure 17 further illustrates the differences in observed and simulated AOD that vary by region over the entire globe. In contrast to the positive bias at the ARM SGP site (Fig. 14), simulated AOD is too low over east Asia and other land regions. Simulated AOD over the ocean is usually closer to observed. The global average from the MAMxx simulation is ∼15 % lower than MODIS. These results are also consistent with predictions from the Fortran version of MAM4 in E3SM version 2. Golaz et al. (2022) found that the model also underpredicted AOD over central America, northern Africa, the Middle East, south Asia, and parts of east Asia similar to Fig. 17. However, the global average AOD was 0.034 higher than the MODIS observations in contrast to the 0.023 underprediction in this study. Differences in the simulation period (15 year versus 1 month) between these studies likely contributes to differences in AOD between the simulations.
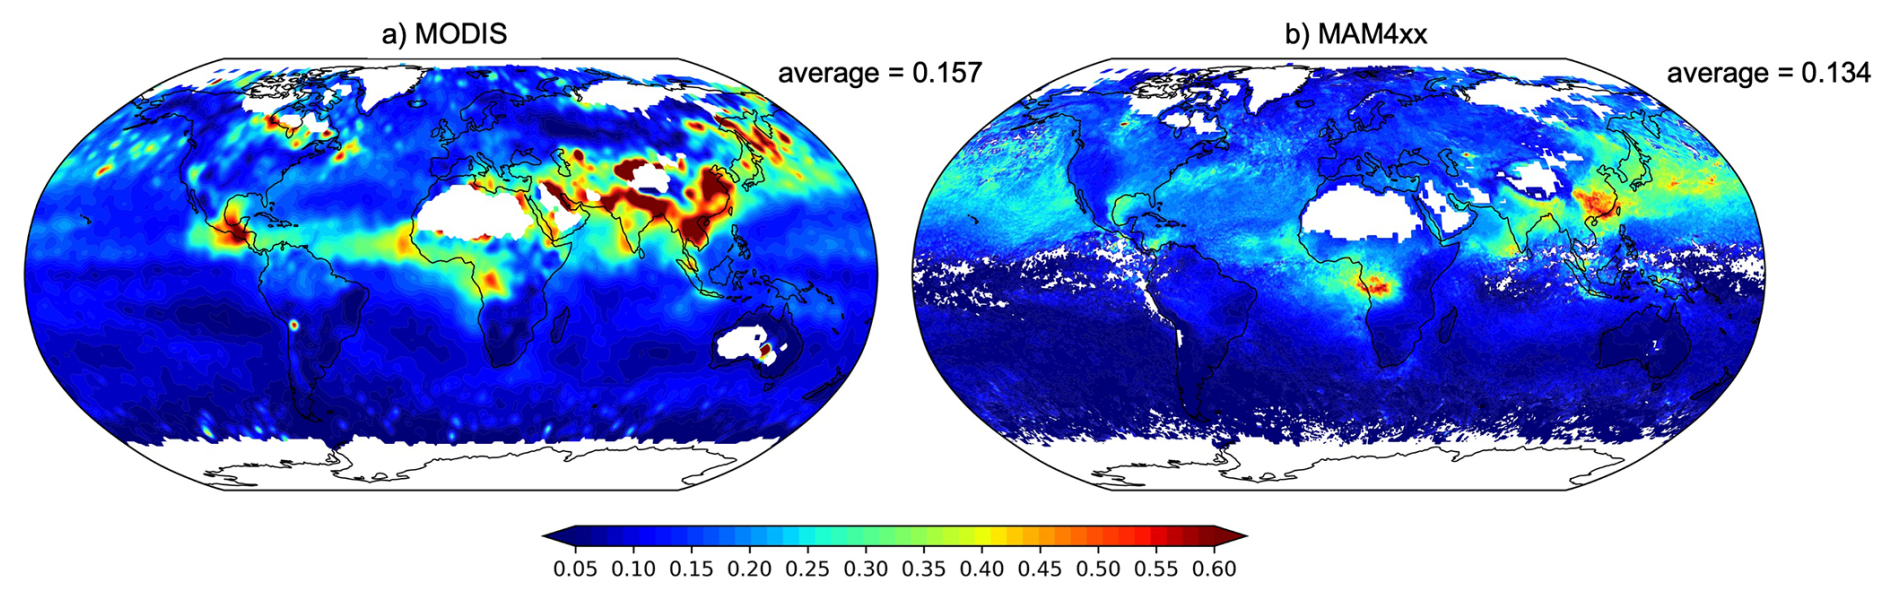
Figure 17Global average AOD during the simulation period from (a) MODIS and (b) MAM4xx. White regions are missing data from the MODIS dark target AOD over bright surfaces.
The simulated global aerosol burden from MAM4xx that contributes to AOD is within other estimates from the AeroCom model intercomparison phase III that are described in Sand et al. (2021). As expected, most of the simulated aerosol burden is associated with dust and OA (the sum of primary and secondary organics in MAM4xx), followed by sea-salt and SO4 as shown in Fig. 18. The aerosol burden of dust from AeroCom models ranges from ∼10 to ∼40 mg m−2, while the value from MAM4xx corresponds to ∼11.5 mg m−2 which is on the low end of the AeroCom model range. In contrast, the burden of BC from MAM4xx corresponds to 0.45 mg m−2 which is on the high end of the ∼0.15 to ∼0.5 mg m−2 estimate from the AeroCom models. The burden of organic aerosols (POM+SOA) from MAM4xx corresponds to 10.66 mg m−2 which is higher than the range of ∼1.5 to ∼6 mg m−2 from the AeroCom models. The treatment of SOA varies among these models and likely contributes to differences in the burden of organic aerosol. The burdens simulated by MAM4xx therefore provides additional evidence that the model is performing similarly to other models.
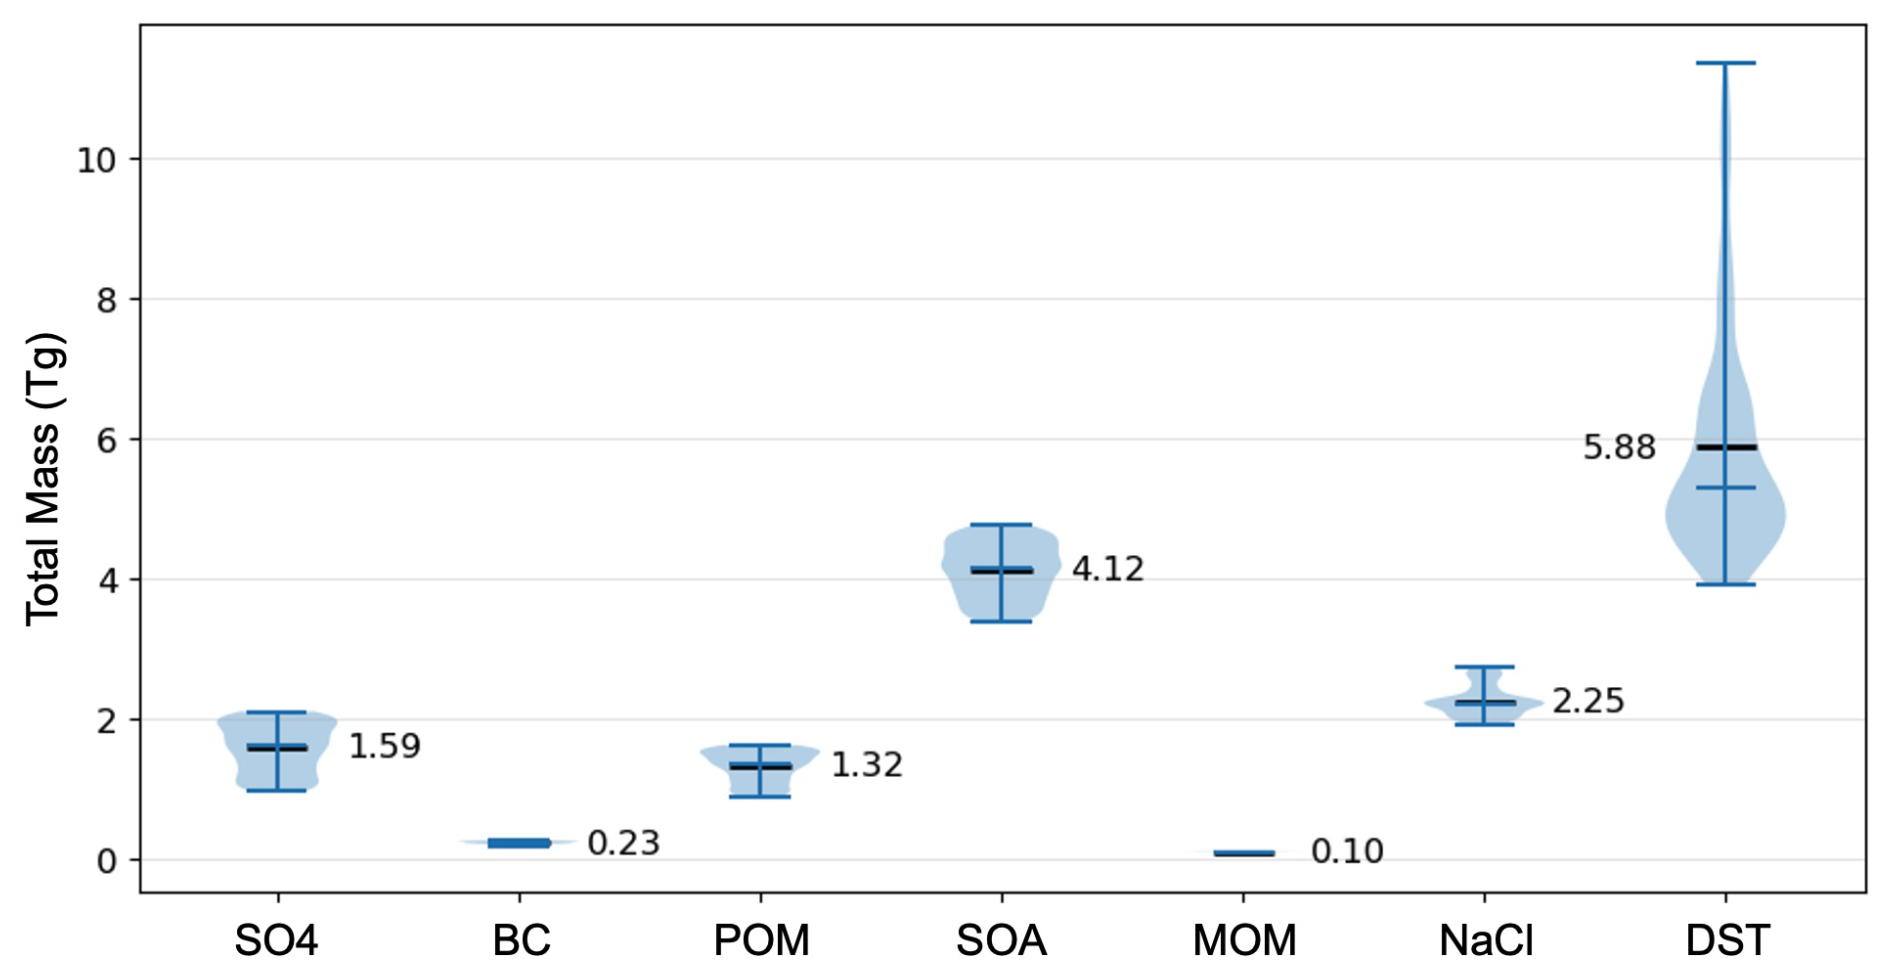
Figure 18Violin plot with percentiles of the variations in the global burden of seven aerosol species during the month-long simulation.
The development of a new GPU-enabled aerosol model called MAM4xx has been described that also runs on multi-core CPU computer clusters. While the underlying physics is the same as in the MAM4 model written in Fortran, the code was been completely rewritten in C/Kokkos. The overall process of porting MAM4 to C/Kokkos was done in three steps: (1) refactoring the Fortran code, (2) manually porting the code to C/Kokkos, and (3) integrating the code into the E3SM code base. Each step consisted of series of rigorous tests to ensure the functionality did not change and that bugs were not introduced. This included unit-testing where small pieces of new code are run with a range of input values to ensure the output values are identical or nearly identical to those obtained from the original code. It also included simulations of individual aerosol processes using a coarse global model configuration to ensure consistent values for real-world conditions.
We further demonstrated that MAM4xx coupled within EAMxx behaves as expected by simulating a previously documented ∼1-month case study over the central U.S. during the spring of 2016 using 12 km horizontal grid spacing covering the globe. Performance is assessed by comparing predictions of aerosol properties with observations and the GEOS-FP global aerosol model. GEOS-FP can be considered a global aerosol reanalysis product, since aerosols are constrained by satellite measurements of AOD. We demonstrate that simulated aerosol mass, composition, and size compare reasonably well with surface and aircraft observations. While there are many differences in the configuration of EAMxx-MAM4xx and GEOS-FP, simulated aerosol mass and composition is also shown to be similar in many respects. While MAM4xx exhibits biases in some simulated aerosol properties, those biases are consistent with the original MAM4 model coupled with E3SMv2.
The MAM4xx computational performance on a GPU cluster was quantified, showing that the updated version of EAMxx requires ∼40 % of its time on aerosol processes. However, most of the additional computational burden is due to aerosol-cloud interaction processes. Since this computational expense is isolated in one process module, developing alternative code that is more efficient on GPUs should be possible.
Now that we have demonstrated that MAM4xx coupled with EAMxx functions as expected, additional improvements can now be considered. First, this and other previous evaluation studies show that increasing spatial resolution improves spatiotemporal variability but does not eliminate biases; thus, the treatment of physical processes within parameterizations still require improvement. This includes processes contributing to the overpredictions of SO4 and the ratio of primary to secondary organic aerosol. MAM4xx could also take advantage of improved process representations developed for the Fortran version of MAM4 over the past few years, such as the new particle formation mechanisms and ultrafine mode (Zhao et al., 2024), improved Dimethyl Sulfide (DMS) chemistry (Kang et al., 2025), incorporation of agricultural dust (Shi et al., 2025) and wildfire aerosol plumes (Lu et al., 2024), neural network-based aerosol optics (Geiss and Ma, 2025) improved aerosol activation (Silva et al., 2021), and modifications to MAM4 within E3SM version 3 (Wang et al., 2026). These treatments in Fortran would need to be ported to C/Kokkos and tested within EAMxx. Second, it would be useful to couple MAM4xx with the C/Kokkos version of the doubly periodic configuration of SCREAM, called DP-SCREAM (Bogenschutz et al., 2023). DP-SCREAM is a limited area version of SCREAM, which is better suited to developing and testing new treatments since the computational expense is significantly lower. Third, MAM4xx should also be evaluated within EAMxx at higher resolution using the global 3 km grid configuration. It is likely that some of the treatments in MAM4xx, particularly those associated with aerosol-cloud interactions, will need to be reformulated to better suit kilometer-scale simulations. While simulations longer than a season at convection-permitting scales are still computationally expensive on GPU clusters, some evaluation could be done over shorter periods of time using a more diverse set of observations that span tropical, mid-latitude, and Arctic regions including contrasting continental and maritime regimes.
The MAM4xx code is available at http://github.com/eagles-project/mam4xx (last access: 12 November 2026), MAM4 Fortran code is available via the E3SMv2 repository at http://github.com/E3SM-Project/E3SM (last access: 12 November 2026), and the SKYWALKER python tool is available at http://github.com/eagles-project/mam4xx (last access: 12 November 2026). The EAMxx with MAM4xx code and the set-up script used for the simulations used in this study have been archived at https://doi.org/10.5281/zenodo.19140449 (Fast et al., 2026).
Global GEOS-FP output was obtained from a NASA archive and available at https://portal.nccs.nasa.gov/datashare/gmao/geos-fp/das (last access: 12 November 2026). ARM in situ and remote sensing observations are publicly available at https://adc.arm.gov/discovery/#/ (last access: 12 November 2026). Air quality monitoring data from EPA and IMPROVE was obtained from https://aqs.epa.gov/aqsweb/airdata/download_files.html (last access: 12 November 2026) and https://vista.cira.colostate.edu/Improve/ (last access: 12 November 2026), respectively. AOD from MODIS satellite and AERONET ground sties were from https://ladsweb.modaps.eosdis.nasa.gov/search/ (last access: 12 November 2026), and https://aeronet.gsfc.nasa.gov/new_web/webtool_aod_v3.html (last access: 12 November 2026), respectively.
JF lead the code conversion effort, performed the evaluation shown in Sect. 3, and wrote the manuscript. BS and ODI were task leads for the code conversion effort consisting of JJ, CD, BG, MW, JL, JO, KP, MS, ST, HW, MW, and KZ The EAMxx simulation was performed by PLM, TH provided emissions, AV ran the ESMACS diagnostics. All investigators contributed to editing the manuscript.
At least one of the (co-)authors is a member of the editorial board of Geoscientific Model Development. The peer-review process was guided by an independent editor, and the authors also have no other competing interests to declare.
Publisher's note: Copernicus Publications remains neutral with regard to jurisdictional claims made in the text, published maps, institutional affiliations, or any other geographical representation in this paper. The authors bear the ultimate responsibility for providing appropriate place names. Views expressed in the text are those of the authors and do not necessarily reflect the views of the publisher.
This research used resources of the Oak Ridge Leadership Computing Facility at the Oak Ridge National Laboratory, which is supported by the Office of Science of the U.S. Department of Energy under Contract No. DE-AC05-00OR22725. This research also used resources of the National Energy Research Science Computing Center (NERSC), a U.S. Department of Energy Office of Science User Facility located at Lawrence Berkley National Laboratory, operated under contract DE-AC02-05CH11231, using NERSC awards BER-ERCAP0033555 and BER-ERCAP0037401. The GEOS-FP data used in this study/project have been provided by the Global Modeling and Assimilation Office (GMAO) at NASA Goddard Space Flight Center. We thank the E3SM team for providing technical expertise needed to couple MAM4xx with EAMxx and the Global Modeling and Assimilation Office (GMAO) at the NASA Goddard Space Flight Center for providing the GEOS-FP data used in this study. IMPROVE is a collaborative association of state, tribal, and federal agencies, and international partners. US Environmental Protection Agency is the primary funding source for IMPROVE, with contracting and research support from the National Park Service. The Air Quality Research Center at the University of California, Davis is the central analytical laboratory, with ion analysis provided by Research Triangle Institute, and carbon analysis provided by Desert Research Institute. We thank the numerous AERONET PIs and their staff for establishing and maintaining the sites used in this investigation.
This effort was supported as part of the “Enabling Aerosol-cloud interactions at GLobal convection-permitting scalES (EAGLES)” project (project no. 74358), sponsored by the U.S. Department of Energy, Office of Science, Office of Biological and Environmental Research, Earth System Model Development (ESMD) and Regional and Global Model Analysis (RGMA) program areas. The Pacific Northwest National Laboratory (PNNL) is operated for the DOE by the Battelle Memorial Institute under contract DE-AC06-76RL01830.
This paper was edited by Ulas Im and reviewed by two anonymous referees.
Abdul-Razzak, H. and Ghan, S. J.: A parameterization of aerosol activation 2. Multiple aerosol types, J. Geophys. Res., 105, 6837–6844, https://doi.org/10.1029/1999JD901161, 2000.
Bellouin, N., Quaas, J., Gryspeerdt, E., Kinne, S., Stier, P., Watson-Parris, D., Boucher, O., Carslaw, K. S., Christensen, M., Daniau, A. L., Dufresne, J. L., Feingold, G., Fiedler, S., Forster, P., Gettelman, A., Haywood, J. M., Lohmann, U., Malavelle, F., Mauritsen, T., McCoy, D. T., Myhre, G., Mülmenstädt, J., Neubauer, D., Possner, A., Rugenstein, M., Sato, Y., Schulz, M., Schwartz, S. E., Sourdeval, O., Storelvmo, T., Toll, V., Winker, D., and Stevens, B.: Bounding global aerosol radiative forcing of climate change, Rev. Geophys., 58, https://doi.org/10.1029/2019rg000660, 2020.
Bercos-Hickey, E., Mahfouz, N., Keen, N. D., Patricola-DiRosario, C. M., Hannah, W. M., Beydoun, H., Wehner, M. F., Lin, W., Terai, C. R., and Hillman, B.: Simulating hurricane Katrina in the Simple Cloud-Resolving E3SM Atmosphere Model v1, J. Adv. Model. Earth Sy., 17, e2025MS005210, https://doi.org/10.1029/2025MS005210, 2025.
Block, K., Haghighatnasab, M., Partridge, D. G., Stier, P., and Quaas, J.: Cloud condensation nuclei concentrations derived from the CAMS reanalysis, Earth Syst. Sci. Data, 16, 443–470, https://doi.org/10.5194/essd-16-443-2024, 2024.
Bogenschutz, P. A. and Krueger, S. K.: A simplified PDF parameterization of subgrid-scale clouds and turbulence for cloud-resolving models, J. Adv. Model. Earth Sy., 5, 195–211, https://doi.org/10.1002/jame.20018, 2013.
Bogenschutz, P. A., Eldred, C., and Caldwell, P. M.: Horizontal resolution sensitivity of the simple convection-permitting E3SM atmosphere model in a doubly-periodic configuration, J. Adv. Model. Earth Sy., 15, e2022MS003466, https://doi.org/10.1029/2022MS003466, 2023.
Buchard, V., Randles, C. A., da Silva, A. M., Darmenov, A., Colarco, P. R., Govindaraju, R., Ferrare, R., Hair, J., Beyersdorf, A. J., Ziemba, L. D., and Yu, H.: The MERRA-2 aerosol reanalysis, 1980 onward. Part II: Evaluation and case studies, J. Climate, 30, 6851–6872, https://doi.org/10.1175/JCLI-D-16-0613.1, 2017.
Caldwell, P. M., Terai, C. R., Hillman, B., Keen, N. D., Bogenschutz, P., Lin, W., Beydoun, H., Taylor, M., Bertagna, L., Bradley, A. M., Clevenger, T. C., Donahue, A. S., Eldred, C., Foucar, J., Golaz, J.-C., Guba, O., Jacob, R., Johnson, J., Krishna, J., Liu, W., Pressel, K., Salinger, A. G., Singh, B., Steyer, A., Ullrich, P., Wu, D., Yuan, X., Shpund, J., Ma, H.-Y., and Zender, C. S.: Convection-permitting simulations with the E3SM global atmosphere model, J. Adv. Model. Earth Sy., 13, e2021MS002544, https://doi.org/10.1029/2021MS002544, 2021.
Chao, L.-W., Zelinka, M. D., Terai, C. R., Beydoun, H., Hillman, B. R., Keen, N. D., Caldwell, P. M., and Klein, S. A.: Evaluating Mean State Cloud Properties in the Simple Cloud-Resolving E3SM Atmosphere Model (SCREAM), J. Adv. Model. Earth Sy., 17, e2025MS005133, https://doi.org/10.1029/2025MS005133, 2025.
Chin, M., Ginoux, P., Kinne, S., Torres, O., Holben, B. N., Duncan, B. N., Martin, R. V., Logan, J. A., Higurashi, A., and Nakajima, T.: Tropospheric aerosol optical thickness from the GOCART model and comparisons with satellite and sun photometer measurements, J. Atmos. Sci., 59, 461–483, https://doi.org/10.1175/1520-0469(2002)059<0461:TAOTFT>2.0.CO;2, 2002.
Christensen, M. W., Ma, P.-L., Wu, P., Varble, A. C., Mülmenstädt, J., and Fast, J. D.: Evaluation of aerosol–cloud interactions in E3SM using a Lagrangian framework, Atmos. Chem. Phys., 23, 2789–2812, https://doi.org/10.5194/acp-23-2789-2023, 2023.
Darmenov, A. and da Silva, A. M.: The Quick Fire Emissions Dataset (QFED) – Documentation of versions 2.1, 2.2 and 2.4, Technical Report Series on Global Modeling and Data Assimilation, edited by: Koster, R. D., NASANASA/TM–2015–104606, 212, https://ntrs.nasa.gov/citations/20180005253 (last access: 17 November 2026), 2015.
Donahue, A. S., Caldwell, P. M., Bertagna, L., Beydoun, H., Bogenschutz, P. A., Bradley, A. M., Clevenger, T. C., Foucar, J., Golaz, C., Guba, O., Hannah,W., Hillman, B. R., Johnson, J. N., Keen, N., Lin, W., Singh, B., Sreepathi, S., Taylor, M. A., Tian, J., Terai, C. R., Ullrich, P. A., Yuan, X., and Zhang, Y.: To exascale and beyond – The Simple Cloud-Resolving E3SM Atmosphere Model (SCREAM), a performance portable global atmosphere model for cloud-resolving scales, J. Adv. Model. Earth Sy., 16, e2024MS004314, https://doi.org/10.1029/2024MS004314, 2024.
Fast, J. D., Berg, L. K., Alexander, L., Bell, D., D'Ambro, E., Hubbe, J., Kuang, C., Liu, J., Long, C., Matthews, A., Mei, F., Newsom, R., Pekour, M., Pinterich, T., Schmid, B., Schobesberger, S., Shilling, J., Smith, J., Springston, S., Suski, K., Thornton, J. A., Tomlinson, J., Wang, J., Xiao, H., and Zelenyuk, A.: Overview of the HI-SCALE field campaign: A new perspective on shallow convective clouds, B. Am. Meteorol. Soc., 100, 821–840, https://doi.org/10.1175/BAMS-D-18-0030.1, 2019.
Fast, J. D., Singh, B., Diaz-Ibarra, O., Johnson, J., Dhandapani, C., Gaudet, B., Hassan, T., Huang, M., Litzinger, J., Overfelt, J., Pressel, K., Schmidt, M., Tang, S., Varble, A. C., Wan, H., Wu, M., Zhang, K., and Ma, P.-L.: E3SM with the 4-mode Modal Aerosol Module in C (MAM4xx), Zenodo [code], https://doi.org/10.5281/zenodo.19140449, 2026.
Forster, P., Storelvmo, T., Armour, K., Collins, W., Dufresne, J. L., Frame, D. Lunt, D. L., Mauritsen, T., Palmer, M. D., Watanabe, M., Wild, M., and Zhang, H.: The Earth's energy budget, climate feedbacks, and climate sensitivity, in: Climate change 2021: The physical science basis. Contribution of working group I to the sixth assessment report of the intergovernmental panel on climate change, Chap. 7, Cambridge University Press, https://doi.org/10.1017/9781009157896.009, 2021.
Geiss, A. and Ma, P.-L.: NeuralMie (v1.0): an aerosol optics emulator, Geosci. Model Dev., 18, 1809–1827, https://doi.org/10.5194/gmd-18-1809-2025, 2025.
Gelaro, R., McCarty, W., Suárez, M. J., Todling, R., Molod, A., Takacs, L., Randles, C., Darmenov, A., Bosilovich, M. G., Reichle, R., Wargan, K., Coy, L., Cullather, R., Draper, C., Akella, S., Buchard, V., Conaty, A., da Silva, A., Gu, W., Kim, G.-K., Koster, R., Lucchesi, R., Merkova, D., Nielsen, J. E., Partyka, G., Pawson, S., Putman, W., Rienecker, M., Schubert, S. D., Sienkiewicz, M., and Zhao, B.: The Modern-Era Retrospective Analysis for Research and Applications, Version 2 (MERRA-2), J. Climate, 30, 5419–5454, https://doi.org/10.1175/JCLI-D-16-0758.1, 2017.
Golaz, J.-C., Van Roekel, L. P., Zheng, X., Roberts, A. F., Wolfe, J. D., Lin, W., Bradley, A. M., Tang, Q., Maltrud, M. E., Forsyth, R. M., Zhang, C., Zhou, T., Zhang, K., Zender, C. S., Wu, M., Wang, H., Turner, A. K., Singh, B., Richter, J. H., Qin, Y., Petersen, M.R., Mametjanov, A., Ma, P.-L., Larson, V. E., Krishna, J., Keen, N. D., Jeffery, N., Hunke, E. C., Hannah, W. M., Guba, O., Griffin, B. M., Feng, Y., Engwirda, D., Di Vittorio, A. V., Dang, C., Conlon, L. M., Chen, C.-C.-J., Brunke, M. A., Bisht, G., Benedict, J. J., Asay-Davis, X. S., Zhang, Y., Zhang, M., Zeng, X., Xie, S., Wolfram, P. J., Vo, T., Veneziani, M., Tesfa, T. K., Sreepathi, S., Salinger, A. G., Eyre, J. E. J . R., Prather, M. R., Mahajan, S., Li, Q., Jones, P. W., Jacob, R. L., Huebler, G. W., Huang, X., Hillman, B. R., Harrop, B. E., Foucar, J. G., Fang, Y., Comeau, D. S., Caldwell, P. M., Bartoletti, T., Balaguru, K., Taylor, M. A., McCoy, R. B., Leung, L. R., and Bader, D. C.: The DOE E3SM model version 2: Overview of the physical model and initial model evaluation, J. Adv. Model. Earth Sy., 14, e2022MS003156, https://doi.org/10.1029/2022MS003156, 2022.
Kang, L., Marchand, R., Ma, P.-L., Huang, M., Wood, R., Jongebloed, U., and Alexander, B.: Impacts of DMS emissions and chemistry on E3SMv2 simulated cloud droplet numbers and aerosol concentrations over the Southern Ocean, J. Adv. Model. Earth Sy., 17, e2024MS004683, https://doi.org/10.1029/2024MS004683, 2025.
Hassan, T., Zhang, K., Li, J., Singh, B., Zhang, S., Wang, H., and Ma, P.-L.: Impacts of spatial heterogeneity of anthropogenic aerosol emissions in a regionally refined global aerosol–climate model, Geosci. Model Dev., 17, 3507–3532, https://doi.org/10.5194/gmd-17-3507-2024, 2024.
Hersbach, H., Bell, B., Berrisford, P., Hirahara, S., Horányi, A., Muñoz-Sabater, J., Nicolas, J., Peubey, C., Radu, R., Schepers, D., Simmons, A., Soci, C., Abdalla, S., Abellan, X., Balsamo, G., Bechtold, P., Biavati, G., Bidlot, J., Bonavita, M., De Chiara, G., Dahlgren, P., Dee, D., Diamantakis, M., Dragani, R., Flemming, J., Forbes, R., Fuentes, M., Geer, A., Haimberger, L., Healy, S., Hogan, R. J., Hólm, E., Janisková, M., Keeley, S., Laloyaux, P., Lopez, P., Lupu, C., Radnoti, G., de Rosnay, P., Rozum, I., Vamborg, F., Villaume, S., and Thépaut, J.-N.: The ERA5global reanalysis, Q. J. Roy. Meteor. Soc., 146, 1999–2049, https://doi.org/10.1002/qj.3803, 2020.
Huang, M., Ma, P.-L., Varble, A. C., Fast, J. D., Hassan, T., Li, J., Qin, Y., Tang, S., Ullrich, P. A., and Yao, Y.: Evaluation of E3SM simulated aerosols and aerosol-cloud interactions across GCM and convection-permitting scales, J. Adv. Model. Earth Sy., 17, e2025MS005288, https://doi.org/10.1029/2025MS005288, 2025.
Keller, C. A., Knowland, K. E., Duncan, B. N., Liu, J., Anderson, D. C., Das, S., Lucchesi, R. A., Lundgren, E. W., Nicely, J. M., Nielsen, E., Ott, L. E., Saunders, E., Strode, S. A., Wales, P. A., Jacob, D. J., and Pawson, S.: Description of the NASA GEOS Composition Forecast Modeling System GEOS-CF v1.0, J. Adv. Model. Earth Sy., 13, e2020MS002413, https://doi.org/10.1029/2020MS002413, 2021.
Khain, A., Lynn, B., and Gavze, E.: Effect of mutual cloud–aerosol interaction on a mesoscale convective system, J. Atmos. Sci., 82, 2693–2710, https://doi.org/10.1175/JAS-D-25-0056.1, 2025.
Klocke, D., Frauen, C., Engels, J. F., Alexeev, D., Redler, R., Schnur, R., Haak, H., Kornblueh, L., Brüggemann, N., Chegini, F., Römmer, M., Hoffmann, L., Griessbach, S., Bode, M., Coles, J., Gila, M., Sawyer, W., Calotoiu, A., Budanaz, Y., Mazumder, P., Copik, M., Weber, B., Herten, A., Bockelmann, H., Hoefler, T., Hohenegger, C., and Stevens, B.: in: Proceedings of the International Conference for High Performance Computing, Networking, Storage and Analysis, 125–136, https://doi.org/10.1145/3712285.3771789, 2025.
Larson, V. E., Golaz, J.-C., and Cotton, W. R.: Small-scale and mesoscale variability in cloudy boundary layers: Joint probability density functions, J. Atmos. Sci., 59, 3519–3539, https://doi.org/10.1175/1520-0469(2002)059<3519:SSAMVI>2.0.CO;2, 2002.
Liu, X., Easter, R. C., Ghan, S. J., Zaveri, R., Rasch, P., Shi, X., Lamarque, J.-F., Gettelman, A., Morrison, H., Vitt, F., Conley, A., Park, S., Neale, R., Hannay, C., Ekman, A. M. L., Hess, P., Mahowald, N., Collins, W., Iacono, M. J., Bretherton, C. S., Flanner, M. G., and Mitchell, D.: Toward a minimal representation of aerosols in climate models: description and evaluation in the Community Atmosphere Model CAM5, Geosci. Model Dev., 5, 709–739, https://doi.org/10.5194/gmd-5-709-2012, 2012.
Liu, X., Ma, P.-L., Wang, H., Tilmes, S., Singh, B., Easter, R. C., Ghan, S. J., and Rasch, P. J.: Description and evaluation of a new four-mode version of the Modal Aerosol Module (MAM4) within version 5.3 of the Community Atmosphere Model, Geosci. Model Dev., 9, 505–522, https://doi.org/10.5194/gmd-9-505-2016, 2016.
Lu, Z., Liu, X., Ke, Z., Zhang, K., Ma, P.-L., and Fan, J.: Incorporating an interactive fire plume-rise model in the DOE's energy exascale earth system model version 1 (E3SMv1) and examining aerosol radiative effect, J. Adv. Model. Earth Sy., 16, e2023MS003818, https://doi.org/10.1029/2023MS003818, 2024.
Ma, P.-L., Rasch, P. J., Fast, J. D., Easter, R. C., Gustafson Jr., W. I., Liu, X., Ghan, S. J., and Singh, B.: Assessing the CAM5 physics suite in the WRF-Chem model: implementation, resolution sensitivity, and a first evaluation for a regional case study, Geosci. Model Dev., 7, 755–778, https://doi.org/10.5194/gmd-7-755-2014, 2014.
Mahfouz, N., Beydoun, H., Mülmenstädt, J., Keen, N., Varble, A. C., Bertagna, L., Bogenschutz, P., Bradley, A., Christensen, M. W., Clevenger, T. C., Donahue, A., Fast, J., Foucar, J., Golaz, J.-C., Guba, O., Hannah, W., Hillman, B., Jacob, R., Lin, W., Ma, P.-L., Qian, Y., Singh, B., Terai, C., Wang, H., Wu, M., Zhang, K., Gettelman, A., Taylor, M., Leung, L. R., Caldwell, P., and Burrows, S.: Prescribing the aerosol effective radiative forcing in the Simple Cloud-Resolving E3SM Atmosphere Model v1, Atmos. Chem. Phys., 25, 15105–15120, https://doi.org/10.5194/acp-25-15105-2025, 2025.
McCoy, D. T., Field, P., Gordon, H., Elsaesser, G. S., and Grosvenor, D. P.: Untangling causality in midlatitude aerosol–cloud adjustments, Atmos. Chem. Phys., 20, 4085–4103, https://doi.org/10.5194/acp-20-4085-2020, 2020.
Mills, M. J., Richter, J. H., Tilmes, S., Kravitz, B., MacMartin, D. G., Glanville, A. A., Tribbia, J. J., Lamarque, J.-F., Vitt, F., Schmidt, A., Gettelman, A., Hannay, C., Bacmeister, J. T., and Kinnison, D. E.: Radiative and chemical response to interactive stratospheric sulfate aerosols in fully coupled CESM1(WACCM), J. Geophys. Res.-Atmos., 122, https://doi.org/10.1002/2017JD027006, 2017.
Morrison, H. and Gettelman, A.: A new two-moment bulk stratiform cloud microphysics scheme in the Community Atmosphere Model, version 3 (CAM3). Part I: Description and numerical tests, J. Climate, 21, 3642–3659, https://doi.org/10.1175/2008JCLI2105.1, 2008.
Morrison, H. and Milbrandt, J. A.: Parameterization of cloud microphysics based on the prediction of bulk ice particle properties. Part I: Scheme description and idealized tests, J. Atmos. Sci., 72, 287–311, https://doi.org/10.1175/JAS-D-14-0065.1, 2015.
Parworth, C., Fast, J. D., Mei, F., Shippert, T., Sivaraman, C., Tilp, A., Watson, T., and Zhang, Q.: Long-term measurements of submicrometer aerosol chemistry at the ARM Southern Great Plains (SGP) site using an Aerosol Chemical Speciation Monitor (ACSM), Atmos. Environ., 106, 45–55, https://doi.org/10.1016/j.atmosenv.2015.01.060, 2015.
Petters, M. D. and Kreidenweis, S. M.: A single parameter representation of hygroscopic growth and cloud condensation nucleus activity, Atmos. Chem. Phys., 7, 1961–1971, https://doi.org/10.5194/acp-7-1961-2007, 2007.
Pincus, R., Mlawer, E. J., and Delamere, J. S.: Balancing accuracy, efficiency, and flexibility in radiation calculations for dynamical models, J. Adv. Model. Earth Sy., 11, 3074–3089, https://doi.org/10.1029/2019MS001621, 2019.
Randles, C. A., da Silva, A. M., Buchard, V., Colarco, P. R., Darmenov, A., Govindaraju, R., Smirnov, A., Holben, B., Ferrare, R., Hair, J., Shinozuka, Y., and Flynn, C. J.: The MERRA-2 aerosol reanalysis, 1980 onward, Part I: System description and data assimilation evaluation, J. Climate, 30, 6823–6850, https://doi.org/10.1175/JCLI-D-16-0609.1, 2017.
Sand, M., Samset, B. H., Myhre, G., Gliß, J., Bauer, S. E., Bian, H., Chin, M., Checa-Garcia, R., Ginoux, P., Kipling, Z., Kirkevåg, A., Kokkola, H., Le Sager, P., Lund, M. T., Matsui, H., van Noije, T., Olivié, D. J. L., Remy, S., Schulz, M., Stier, P., Stjern, C. W., Takemura, T., Tsigaridis, K., Tsyro, S. G., and Watson-Parris, D.: Aerosol absorption in global models from AeroCom phase III, Atmos. Chem. Phys., 21, 15929–15947, https://doi.org/10.5194/acp-21-15929-2021, 2021.
Segura, H., Pedruzo-Bagazgoitia, X., Weiss, P., Müller, S. K., Rackow, T., Lee, J., Dolores-Tesillos, E., Benedict, I., Aengenheyster, M., Aguridan, R., Arduini, G., Baker, A. J., Bao, J., Bastin, S., Baulenas, E., Becker, T., Beyer, S., Bockelmann, H., Brüggemann, N., Brunner, L., Cheedela, S. K., Das, S., Denissen, J., Dragaud, I., Dziekan, P., Ekblom, M., Engels, J. F., Esch, M., Forbes, R., Frauen, C., Freischem, L., García-Maroto, D., Geier, P., Gierz, P., González-Cervera, Á., Grayson, K., Griffith, M., Gutjahr, O., Haak, H., Hadade, I., Haslehner, K., ul Hasson, S., Hegewald, J., Kluft, L., Koldunov, A., Koldunov, N., Kölling, T., Koseki, S., Kosukhin, S., Kousal, J., Kuma, P., Kumar, A. U., Li, R., Maury, N., Meindl, M., Milinski, S., Mogensen, K., Niraula, B., Nowak, J., Praturi, D. S., Proske, U., Putrasahan, D., Redler, R., Santuy, D., Sármány, D., Schnur, R., Scholz, P., Sidorenko, D., Spät, D., Sützl, B., Takasuka, D., Tompkins, A., Uribe, A., Valentini, M., Veerman, M., Voigt, A., Warnau, S., Wachsmann, F., Wacławczyk, M., Wedi, N., Wieners, K.-H., Wille, J., Winkler, M., Wu, Y., Ziemen, F., Zimmermann, J., Bender, F. A.-M., Bojovic, D., Bony, S., Bordoni, S., Brehmer, P., Dengler, M., Dutra, E., Faye, S., Fischer, E., van Heerwaarden, C., Hohenegger, C., Järvinen, H., Jochum, M., Jung, T., Jungclaus, J. H., Keenlyside, N. S., Klocke, D., Konow, H., Klose, M., Malinowski, S., Martius, O., Mauritsen, T., Mellado, J. P., Mieslinger, T., Mohino, E., Pawłowska, H., Peters-von Gehlen, K., Sarré, A., Sobhani, P., Stier, P., Tuppi, L., Vidale, P. L., Sandu, I., and Stevens, B.: nextGEMS: entering the era of kilometer-scale Earth system modeling, Geosci. Model Dev., 18, 7735–7761, https://doi.org/10.5194/gmd-18-7735-2025, 2025.
Shan, Y., Fan, J., Zhang, K., Shpund, J., Terai, C., Zhang, G. J., Song, X., Chen, C. C. J., Lin, W. Liu, X., Shrivastava, M., Wang, H., and Xie, S.: Improving aerosol radiative forcing and climate in E3SM: Impacts of new cloud microphysics and improved wet removal treatments, J. Adv. Model. Earth Sy., 16, e2023MS004059, https://doi.org/10.1029/2023MS004059, 2024.
Shi, Y., Liu, X., Wu, C., Lu, Z., Zhang, K., and Ma, P.-L.: Representing anthropogenic dust from agricultural sources in E3SMv1: Implementation, evaluation, and assessment of the radiative forcing, J. Adv. Model. Earth Sy., 17, e2023MS003925, https://doi.org/10.1029/2023MS003925, 2025.
Silva, S. J., Ma, P.-L., Hardin, J. C., and Rothenberg, D.: Physically regularized machine learning emulators of aerosol activation, Geosci. Model Dev., 14, 3067–3077, https://doi.org/10.5194/gmd-14-3067-2021, 2021.
Stanford, M. W., Varble, A. C., Feng, Z., Fast, J., Gustafson Jr., W. I., Glienke, S., Hardin, J. C., and Zhang. Z.: Excessive convective precipitation formation caused by warm-phase bulk microphysical scheme biases: Multi-platform observational diagnosis, J. Geophys. Res., 131, e2026JD047076, https://doi.org/10.1029/2026JD047076, 2026.
Stevens, B., Satoh, M., Auger, L., Biercamp, J., Bretherton, C. S., Chen, X., Düben, P., Judt, F., Khairoutdinov, M., Klocke, D., Kodama, C., Kornblueh, L., Lin, S.-J., Neumann, P., Putman, W. M., Röber, N., Shibuya, R., Vanniere, B., Vidale, P. L., Wedi, N., and Zhou, L.: DYAMOND: the DYnamics of the Atmospheric general circulation Modeled On Non-hydrostatic Domains, Prog. Earth Planet. Sci., 6, 61, https://doi.org/10.1186/s40645-019-0304-z, 2019.
Stokes, G. M. and Schwartz, S. E.: The Atmospheric Radiation Measurement (ARM) program: Programmatic background and design of the cloud and radiation testbed, B. Am. Meteorol. Soc., 75, 1201–1221, https://doi.org/10.1175/1520-0477(1994)075<1201:TARMPP>2.0.CO;2, 1994.
Su, T., Zhang, Y., Ma, H.-Y., Varble, A. C., and Bogenshutz, P. A.: Convective biases in the US DOE global storm-resolving model: Insights from regionally refined simulations during the CACTI campaign, J. Geophys. Res., 131, e2025JD045449, https://doi.org/10.1029/2025JD045449, 2026.
Tang, S., Fast, J. D., Zhang, K., Hardin, J. C., Varble, A. C., Shilling, J. E., Mei, F., Zawadowicz, M. A., and Ma, P.-L.: Earth System Model Aerosol–Cloud Diagnostics (ESMAC Diags) package, version 1: assessing E3SM aerosol predictions using aircraft, ship, and surface measurements, Geosci. Model Dev., 15, 4055–4076, https://doi.org/10.5194/gmd-15-4055-2022, 2022.
Tang, S., Varble, A. C., Fast, J. D., Zhang, K., Wu, P., Dong, X., Mei, F., Pekour, M., Hardin, J. C., and Ma, P.-L.: Earth System Model Aerosol–Cloud Diagnostics (ESMAC Diags) package, version 2: assessing aerosols, clouds, and aerosol–cloud interactions via field campaign and long-term observations, Geosci. Model Dev., 16, 6355–6376, https://doi.org/10.5194/gmd-16-6355-2023, 2023.
Taylor, M., Caldwell, P. M., Bertagna, L., Clevenger, C., Donahue, A., Foucar, J., Guba, J., Hillman, B. R., Keen, N., Krishna, J., Norman, M. R, Sreepathi, S., Terai, C. R., White, J. B., Wu, D., Salinger, A. G., McCoy, R. B., Leung, L. R., and Bader, D. C.: The Simple Cloud-Resolving E3SM Atmosphere Model running on the Frontier exascale system, in: Proceedings of the International Conference for High Performance Computing, Networking, Storage and Analysis, Association for Computing Machinery, https://dl.acm.org/doi/10.1145/3581784.3627044 (last access: 17 November 2026), 2023.
Terai, C. R., Pritchard, M. S., Blossey, P., and Bretherson, C. S.: The impact of resolving subkilometer processes on aerosol-cloud interactions of low-level clouds in global model simulations, J. Adv. Model. Earth Sy., 20, e2020MS002274, https://doi.org/10.1029/2020MS002274, 2020.
Terai, C. R., Keen, N. D., Caldwell, P. M., Beydoun, H., Bogenschutz, P. A., Chao, L.-W., Hillman, B. R., Ma, H.-Y., Zelika, M. D., Bertanga, L., Bradley, A. M., Clevenger, T. C., Donahue, A. S., Foucar, J., Golaz, J.-C., Guba, O., Hannah, W., Lee, J., Lin, W., Mahfouz, N., Mülmenstädt, J., Salinger, A. G., Singh, B., Sreepathi, S., Qin, Y., Taylor, M. A., Ullrich, P. A., Wu, W.-Y., Yuan, X., Zender, C. S., and Zhang, Y.: Radiative, hydrologic, and circulation responses to warming in Cess-Potter simulations using the global 3.25 km SCREAM, J. Adv. Model. Earth Sy., 17, e2024MS004930, https://doi.org/10.1029/2024MS004930, 2025.
Tian, J., Zhang, Y., Klein, S. A., Terai, C. R., Caldwell, P. M., Beydoun, H., Bogenschutz, P., Ma, H.-Y., and Donahue, A. S.: How well does the DOE global storm resolving model simulate clouds and precipitation over the Amazon?, Geophys. Res. Lett., 51, e2023GL108113, https://doi.org/10.1029/2023GL108113, 2024.
Tilmes, S., Mills, M. J., Zhu, Y., Bardeen, C. G., Vitt, F., Yu, P., Fillmore, D., Liu, X., Toon, B., and Deshler, T.: Description and performance of a sectional aerosol microphysical model in the Community Earth System Model (CESM2), Geosci. Model Dev., 16, 6087–6125, https://doi.org/10.5194/gmd-16-6087-2023, 2023.
Trott, C. R., Lebrun-Grandié, D., Arndt, D., Ciesko, J., Dang, V., Ellingwood, N., Gayatri, R., Harvey, E., Hollman, D. S., Ibanez, D., Liber, N., Madsen, J., Miles, J., Poliakoff, D., Powell, A., Rajamanickam, S., Simberg, M., Sunderland, D., Turcksin, B., and Wilke, J.: Kokkos3: Programming model extensions for the exascale era, IEEE T. Parall. Distr., 33, 805–817, https://doi.org/10.1109/TPDS.2021.3097283, 2022.
Twomey, S.: Pollution and the planetary albedo, Atmos. Environ., 8, 1251–1256, 1974.
van der Werf, G. R., Randerson, J. T., Giglio, L., van Leeuwen, T. T., Chen, Y., Rogers, B. M., Mu, M., van Marle, M. J. E., Morton, D. C., Collatz, G. J., Yokelson, R. J., and Kasibhatla, P. S.: Global fire emissions estimates during 1997–2016, Earth Syst. Sci. Data, 9, 697–720, https://doi.org/10.5194/essd-9-697-2017, 2017.
Varble, A. C., Ma, P.-L., Christensen, M. W., Mülmenstädt, J., Tang, S., and Fast, J.: Evaluation of liquid cloud albedo susceptibility in E3SM using coupled eastern North Atlantic surface and satellite retrievals, Atmos. Chem. Phys., 23, 13523–13553, https://doi.org/10.5194/acp-23-13523-2023, 2023.
Wang, H., Easter, R. C., Zhang, R., Ma, P. L., Singh, B., Zhang, K., Ganguly, D., Rasch, P. J., Burrows, S. M., Ghan, S. J., Lou, S., Qian, Y., Yang, Y., Feng, Y., Flanner, M., Leung, L. R., Liu, X., Shrivastava, M., Sun, J., Tang, Q., Xie, S., and Yoo, J.-H.: Aerosols in the E3SM Version 1: New developments and their impacts on radiative forcing, J. Adv. Model. Earth Sy., 12, e2019MS001851, https://doi.org/10.1029/2019MS001851, 2020.
Wang, H., Wu, M., Ke, Z., Feng, Y., Shrivastava, M., Tang, Q., Wan, H., Liu, X., Easter, R. C., Lin, W., Singh, B., Terai, C. R., Burrows, S. M., Fan, J., Ma, P.-L., Mahfouz, N., Mülmenstädt, J., Qian, Y., Shan, Y., Zhang, K., Zhang, Y., Leung, L. R., Xie, S., and Rasch, P. J.: Overview of aerosols in the E3SM Version 3: New model features and their impacts, J. Adv. Model. Earth Sy., 18, e2025MS005733, https://doi.org/10.1029/2025MS005733, 2026.
Wang, W., Liu, X., Lin, G., Lu, Z., and Wu, C.: The Impact of model horizontal resolution on aerosol modeling over East Asia using variable-resolution CESM2, J. Geophys. Res., 130, e2025JD043518, https://doi.org/10.1029/2025JD043518, 2025.
Wang, Y., Ma, P. L., Peng, J., Zhang, R., Jiang, J. H., Easter, R. C., and Yung, Y. L.: Constraining aging processes of black carbon in the Community Atmosphere Model using environmental chamber measurements, J. Adv. Model. Earth Sy., 10, 2514–2526, https://doi.org/10.1029/2018MS001387, 2018.
Weiss, P., Herbert, R., and Stier, P.: ICON-HAM-lite 1.0: simulating the Earth system with interactive aerosols at kilometer scales, Geosci. Model Dev., 18, 3877–3894, https://doi.org/10.5194/gmd-18-3877-2025, 2025.
Wu, M., Wang, H., Easter, R. C., Lu, Z., Liu, X., Singh, B., Ma, P. L., Tang, Q., Zaveri, R. A., Ke, Z., Zhang, R., Emmons, L. K., Tilmes, S., Dibb, J. E., Zheng, X., Xie, S., and Ruby Leung, L. R.: Development and evaluation of E3SM-MOSAIC: Spatial distributions and radiative effects of nitrate aerosol, J. Adv. Model. Earth Sy., 14, e2022MS00357, https://doi.org/10.1029/2022MS003157, 2022.
Zhang, Z., Varble, A. C., Feng, Z., Marquis, J., Hardin, J., and Zipser, E.: Dependencies of simulated convective cell and system growth biases on atmospheric instability and model resolution, J. Geophys. Res.-Atmos., 129, e2024JD041090, https://doi.org/10.1029/2024JD041090, 2024.
Zhao, B., Donahue, N. M., Zhang, K., Mao, L., Shrivastava, M., Ma, P. L., Shen, J., Wang, S., Sun, J., Gordon, H., Tang, S., Fast, J. D., Wang, M., Gao, Y., Yan, C., Singh, B., Li, Z., Huang, L., Lou, S., Lin, G., Wang, H., Jiang, J., Ding, A., Nie, W., Qi, X., Chi, X., and Wang, L.: Global variability in atmospheric new particle formation mechanisms, Nature, 631, 98–105, https://doi.org/10.1038/s41586-024-07547-1, 2024.