
the Creative Commons Attribution 4.0 License.
the Creative Commons Attribution 4.0 License.
 | 20 Nov 2026
Species-resolved inventory of forest biogenic volatile organic emissions across China with MEGAN v3.2
Hao Xu
Yixin Huang
Yunting Xiao
Qinghao Guo
Xi Zhao
Junjun Deng
Pingqing Fu

Biogenic volatile organic compounds (BVOCs) are important precursors of secondary organic aerosols and tropospheric ozone, yet their emissions are commonly modelled at the plant functional type (PFT) level, which obscures substantial interspecies variability. This limitation is particularly acute for China, where high forest diversity and ambitious afforestation initiatives are expected to reshape national BVOC budgets. Here, we present a species-resolved BVOC emissions inventory for China covering 234 tree species (Liu et al., 2026). The inventory was developed within the Model of Emissions of Gases and Aerosols from Nature (MEGAN) v3.2 modeling framework, with refined inputs comprising species-specific emission factors and high-resolution forest composition data for China. Total forest BVOC emissions were estimated at 10.26 Tg of compound mass in 2019, with summer emissions accounting for about 50 % of the annual total and a clear decreasing gradient from southern to northern China. Emissions were highly concentrated among a limited number of species: the five largest contributors, Pinus massoniana, Quercus liaotungensis, Phyllostachys edulis, Cunninghamia lanceolata, and Quercus variabilis accounted for 41.7 % of total emissions while occupying only 25.4 % of forest area. At the compound-class level, Quercus liaotungensis dominated isoprene emissions, whereas Pinus massoniana was the leading contributor to monoterpene emissions. Applying this species-resolved framework to two future afforestation scenarios with identical planted areas but contrasting species composition, we found that BVOC emissions may increase by 4.65 Tg yr−1 with the biomass-maximization tree species and by 5.10 Tg yr−1 under the most environmental-suitability species. Notably, the dominant component of additional BVOC emissions shifts from isoprene under biomass maximization (BIO) to monoterpenes under highest environmental suitability (HIGH). These results demonstrate the importance of incorporating species-specific emission traits into BVOC models and suggest that future afforestation strategies could substantially reshape both the magnitude and chemical composition of biogenic emissions, with implications for atmospheric chemistry and air quality depending on species selection.
- Article
(13667 KB) - Full-text XML
- BibTeX
- EndNote


Biogenic volatile organic compounds (BVOCs) comprise ∼ 90 % of atmospheric non-methane organic vapors and contribute ∼ 1000 Tg of trace gases containing reactive carbon to the troposphere annually (Goldstein and Galbally, 2007; Guenther et al., 2012), with forests accounting for the dominant share (∼ 90 %) of global emissions. After being released by plants, BVOCs undergo rapid atmospheric oxidation and substantially influence the formation of secondary organic aerosol (SOA) and tropospheric ozone (Zhu et al., 2025a; Xu et al., 2025). BVOC-derived SOA scatters solar radiation and nucleates clouds, altering precipitation (Pöschl et al., 2010), and accounts for 15 %–80 % of atmospheric fine particulate matter responsible for regional haze (Kenseth et al., 2023), while tropospheric ozone acts as both a photochemical pollutant and greenhouse gas (Stenke, 2020). These processes establish BVOC emissions as a natural linkage governing the interplay between ecosystems, air quality (Rissanen et al., 2025), and climate (Sanaei et al., 2023). Accurate quantification of BVOC emissions is therefore essential for understanding ecosystem–atmosphere interactions and for informing climate mitigation and air quality improvement strategies.
BVOC emissions are regulated by interacting physiological and environmental processes (Bergman et al., 2025). These short-lived, highly reactive compounds, such as isoprene, monoterpenes, and sesquiterpenes, mediate interplant communication while modulating stress responses (Yu et al., 2024), both critical to terrestrial ecosystem stability. Their biosynthesis depends on photosynthesis, which supplies carbon and energy substrates, while their release is mediated by stomatal conductance and other diffusion pathways (Niinemets and Reichstein, 2003; Zhang et al., 2025). These controls vary with intrinsic plant traits, including leaf age, species identity, and plant functional type, and respond strongly to environmental conditions such as light, temperature, humidity, atmospheric CO2 concentration, and drought stress (Li et al., 2024). Emission rates increase non-linearly with light and temperature up to an optimum (∼ 40 °C), but decline under severe heat stress (Wang et al., 2024b). Elevated CO2 tends to suppress isoprene emissions, partially offsetting the stimulatory influence of warming (Sahu et al., 2023). Drought further complicates emission responses: moderate water deficit may transiently enhance emissions by increasing leaf temperature, whereas prolonged or severe drought ultimately suppresses emissions through physiological stress (Wang et al., 2022).
Current approaches to quantifying BVOC fluxes generally integrate vegetation-specific emission factors with environmental response algorithms, driven by land-cover and meteorological datasets (Guenther et al., 2012; Wang et al., 2016b). The Model of Emissions of Gases and Aerosols from Nature (MEGAN) stands as the most widely adopted framework, incorporating canopy-scale parameterizations and environmental activity factors related toradiation, temperature, CO2 concentration, phenology and soil moisture (Guenther et al., 2012). Using such frameworks, previous researches have quantified the effects of climate change, rising CO2 drought and land-use change on BVOC emissions. For example, warming and enhanced radiation have increased global isoprene emissions by ∼ 1 % annually in recent decades (Opacka et al., 2021), whereas elevated CO2 and drought have exerted suppressing effects (Wang et al., 2024a, 2022). Land-cover change has also altered global BVOC budgets, particularly through tropical deforestation associated reductions in isoprene emissions (Chen et al., 2018; Vella et al., 2025).
Despite these advances, a central uncertainty in BVOCs modeling lies in the coarse representation of vegetation diversity (Wu et al., 2024). Due to differences in their physiological structures, each tree species exhibits inherent variations in physiological processes and photosynthetic capacity, leading to distinct differences in the composition and emission rates of BVOCs. Most emission inventories, including applications of MEGAN in China, represent vegetation at the PFT level, such as deciduous broadleaf forest, evergreen coniferous forest. Due to the lack of local input data at the tree species level in China, it is still unable to differentiate emissions at the species level, leading to substantial uncertainty in BVOC emissions estimates for China (Guenther et al., 2012). This approach assumes similar emission characteristics within each PFT and therefore cannot capture substantial interspecific differences in BVOC composition and emission rates. Field measurements show that species within the same PFT may exhibit sharply contrasting emission profiles. For instance, within temperate deciduous broadleaf trees, Lonicera maackii emits predominantly isoprene at a mean rate of 9.17 µg gdw−1 h−1, whereas Acer truncatum emits mainly monoterpenes (2.29 µg gdw−1 h−1, expressed as micrograms per gram of dry leaf weight per hour) with only marginal isoprene fluxes (0.05 µg gdw−1 h−1, Jing et al., 2020), although both may be assigned a uniform isoprene-dominated profile of 12 µg gdw−1 h−1 under a PFT-based scheme. Similarly, among temperate evergreen needleleaf species, Platycladus orientalis is characterized by strong monoterpene emissions (27.18 µg gdw−1 h−1) with minimal isoprene (1.60 µg gdw−1 h−1), while Taxus cuspidata emits primarily isoprene (5.86 µg gdw−1 h−1) with negligible monoterpenes (Jing et al., 2020). These discrepancies highlight PFT-based approaches may obscure species-level emission heterogeneity and contribute to substantial uncertainty in China's BVOC emission inventories.
This limitation is particularly consequential for China, where extensive forest cover, high tree diversity, and large-scale afforestation may substantially reshape national BVOC emissions. China's forests contain approximately 142.6 billion trees over 220 million hectares currently (based on Ninth National Forest Resource Inventory during 2009–2013) (Wu et al., 2026; Cheng et al., 2025), equivalent to 23 % of its national territory. Driven by complex topography and climatic heterogeneity, this vast territory sustains 4886 distinct tree species (BGCI, 2021). However, 234 dominant species account for more than 90 % of national forest area, indicating that a species-resolved inventory constructed around these dominant taxa can represent the overwhelming majority of China's forest BVOC emissions while remaining tractable to develop and evaluate. The combination of extensive forest distribution, heterogeneous species composition, and strong climatic gradients make China an important but uncertain source of BVOCs (Cao et al., 2022). Meanwhile, China has committed to expanding forestation (including afforestation and reforestation) as part of its pathway toward carbon neutrality by 2060 (Mallapaty, 2020). Previous studies suggest that forestation and climate warming have already contributed to persistent rises in BVOC emissions in China and may further enhance future emissions under warming scenarios (Zhu et al., 2025b; Li et al., 2021; Wang et al., 2021; Liu et al., 2019). However, because existing estimates rarely resolve emissions at the species level, it remains unclear which tree species dominate current BVOC budgets and how alternative forestation species selection strategies may alter the magnitude, spatial distribution, and chemical composition of future emissions.
Here, we developed a species-resolved BVOC emission inventory for 234 dominant tree species that collectively represent more than 90 % of China's forest area (Liu et al., 2026). Our inventory rests on advances in three interconnected areas. To capture interspecific differences in BVOC emission capacity and composition, we first compiled a localized, species-specific emission factor database. We then developed a spatial disaggregation procedure that allocates mixed-stand areas among their constituent species, which allows forest cover to be mapped at the species level and ties each species' emission factors to its actual spatial distribution. Building on this foundation, we further quantified how compound-specific emissions respond to two afforestation and reforestation scenarios that share the same planting area but differ in how species are selected: one maximizing biomass (BIO) and the other prioritizing highest environmental suitability (HIGH) (Xu et al., 2023). This framework identifies the dominant species contributing to current forest BVOC emissions and quantifies how species selection in support of carbon neutrality influences emission magnitude, spatial distribution, and chemical composition.
2.1 MEGAN Model
The Model of Emissions of Gases and Aerosols from Nature (MEGAN) is a mechanistic modeling framework designed to estimate the net emission of gases and aerosols from terrestrial ecosystems to atmosphere. It uses simplified mechanistic algorithms to represent the major known biological and environmental controls on biogenic emissions (Guenther et al., 2012). In this study, we applied MEGAN v3.2 to develop emission inventories of existing forests and future forestation-driven forest expansion in China (Guenther et al., 2020).
MEGAN v3.2 consists of three major computational modules (https://doi.org/10.5281/zenodo.10526206, Guenther, 2024a). First, the preprocessor module reformats land-cover and meteorological data to generate environmental inputs for the simulation domain. Second, the emission factor processor module derives landscape-averaged emission factors and light-dependent fractions through hierarchical integrating vegetation information. This processor combines three complementary datasets (https://doi.org/10.5281/zenodo.10939297, Guenther, 2024b): (1) vegetation growth-form datasets describing the spatial distribution of trees, shrubs, grasses, and crops; (2) ecotype classifications characterizing all emitting plant species and their proportional contributions within each grid cell; and (3) species-level emission factor libraries constrained by observation. This hierarchical approach enables MEGAN v3.2 to capture emission factor variability associated with differences in species composition, including among regions assigned to the same plant functional type. Third, the emission rate estimator module integrates the preprocessed environmental fields and emission factor distributions to compute gridded biogenic emission fluxes at each time step. In the model, BVOC emissions are formulated as:
where EF (mg m−2 h−1; from the emission factor processor module) represents the emission factor under standard environmental conditions (temperature = 30 °C, photosynthetically active radiation = 1000 µmol m−2 s−1), characterizing the intrinsic emission capacity of vegetation. EA (from the emission rate estimator module) is a dimensionless emission activity factor that accounts for departures from standard conditions driven by meteorology and vegetation state. The dimensionless factor ρ accounts for the loss and transformation of emitted compounds within the canopy before they reach the above-canopy atmosphere (Guenther et al., 2006). In this study, the default treatment of canopy production and loss in MEGAN v3.2 was retained without modification. The emission factor is aggregated to the grid-cell level using the fractional coverage of different vegetation species:
where EFtree, EFshrub, EFgrass, and EFcrop denote the emission factors associated with different vegetation species, and f represents their fractional area coverage within each model grid cell. Besides, emission activity factors (EA) dynamically modulate the baseline emission potential in response to changing environmental conditions:
where LAI is the leaf area index (m2 m−2) and γ terms are dimensionless activity scalars that describe the sensitivity of BVOC emissions to environmental and physiological drivers. Specifically, γP accounts for the response to solar radiation, γT represents the temperature dependence of emissions, γA reflects the influence of leaf age, γSM captures soil moisture stress effects, and γC describes the response to atmospheric CO2 concentration. No separate canopy environment coefficient is applied in the MEGAN v3.2 implementation used here. This is consistent with the transition to leaf-level emission factors in the full MEGAN3 framework, which removes the need for the separate canopy normalization used with canopy-scale emission factors (Silva et al., 2020). The detail introduction to MEGAN v3.2 refers to Guenther et al. (2020).
2.2 Enhanced local input for China
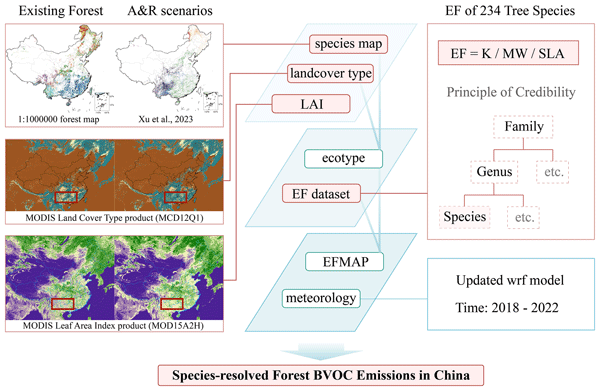
To better represent the spatial heterogeneity of BVOCs emission potentials across China's diverse forest ecosystems, we integrated tree species distribution data with the MEGAN framework. This enhancement was achieved through updates to four core components within the model (Fig. 1): dominant species-level forest distribution to characterize vegetation diversity (Sect. 2.2.1), a species-specific emission factor database to account for interspecific variability in emission potentials (Sect. 2.2.2), enhanced leaf area index (Sect. 2.2.3) and land cover (Sect. 2.2.4) datasets to better describe canopy structure and forest extent.
2.2.1 Current tree species distribution
Tree species distribution data were incorporated into Eq. (2) to determine the species composition within each model grid cell ftree, specifying the number of species occurring at the grid scale. These data are derived from a 1:1 000 000 vector map of forest type distribution (https://doi.org/10.12041/geodata.43370179401687.ver1.db, Liu et al., 2020), based on the forest inventory conducted during 2013–2017 by the China Forest Vegetation Survey project of the Chinese Academy of Forestry Sciences, which provides one of the most comprehensive species-level forest distribution datasets currently available for China. With the previous national forest record dating back to 1980s (Yi et al., 2020), this dataset is considered suited for characterizing forest conditions in our study. The original data were resampled to 1 km resolution to provide a spatial representation of ecotypes that replaces the plant functional type classification in MEGAN (Fig. 1). Following Forest Resource Report of China (Zeng et al., 2015), forests in this study are defined as stands with canopy closure ≥0.2, which inherently excludes sparse woodlands and shrublands failing to meet the thresholds. The dataset encompasses 234 dominant taxa, covering 187 million hectares and accounting for 90 % of the national forested area. Among them, 225 taxa were resolved at the species level and ranked by individual contribution, whereas the remaining nine were assigned to aggregated functional-type classes to account for rare or taxonomically unresolved groups.
The 225 species-level taxa span 113 genera, among which the five most species-rich genera are Pinus (19 species), Quercus (15 species), Populus (10 species), Castanopsis (9 species), and Phyllostachys (8 species). These genera belong to 47 families, with Pinaceae (42 species), Fagaceae (32 species), Poaceae (17 species), Rosaceae (12 species), and Salicaceae (12 species) being the five most extensively represented. In contrast, the standard MEGAN PFT scheme aggregates this taxonomic diversity into only eight PFTs: broadleaf evergreen tropical forest, broadleaf evergreen temperate forest, broadleaf deciduous tropical forest, broadleaf deciduous temperate forest, broadleaf deciduous boreal forest, needleleaf evergreen temperate forest, needleleaf evergreen boreal forest, and needleleaf deciduous boreal forest.
Species-specific forested areas were computed through a systematic disaggregation procedure applied to the vector map (Fig. 1). All polygons were first classified as either pure stands, in which a single species accounts for the entire polygon area, or mixed stands, containing two or more co-dominant species. For pure-stand polygons, the full area was assigned directly to the dominant species (e.g., Quercus mongolica forest). In mixed-stand polygons, the total area was disaggregated among constituent species in equal proportions, that each of the n species received of the polygon area (e.g., a Quercus mongolica–Populus davidiana mixed forest polygon was split evenly, allocating 50 % of the area to each species). This equal-proportion assumption was applied across all mixed stands because species-level area ratios were not available at the grid scale. Although total forest area is conserved, equal partitioning may introduce species-level allocation bias where actual species proportions differ from the assumed fractions. Following disaggregation, the areas assigned to each species were summed across polygons to obtain the total forest area attributed to each of the 234 tree species. Thus, the area attributed to a given species represents both its full area in pure stands and its proportional area in mixed stands where it occurs as a co-dominant species. This species-level forest distribution inventory provides a spatially explicit basis for representing BVOC emission heterogeneity across China and enables more detailed emission estimates than conventional PFT-based classifications.
2.2.2 Emission factor database
We constructed a species-specific emission factor database through a comprehensive literature survey of field measurements and observational studies (Table B4). This database provides the EFtree parameter required in Eq. (2). Emission factors are calculated by normalizing BVOC emission rates with leaf area:
where K denotes the emission rate (µg gdw−1 h−1), MW represents the molecular weight (g mol−1). SLA values were preferentially compiled from published measurements for the target species in East Asia, with missing values supplemented by conspecific records from FloraVeg.EU database (http://www.floraveg.eu/, last access: 24 June 2026; Chytrý et al., 2024), an online repository documenting biological traits, ecological indicator values, and distributional information for plant species. This approach preserves species-level correspondence, although geographic variation in SLA within species may introduce uncertainty into the conversion of mass-based emission rates to leaf-area-based emission factors.
K values for the 234 tree species were derived from a comprehensive review of 129 peer-reviewed studies, supplemented by Appendix 12 of Understanding i-Treea – a suite of computer software tools published by the United States Forest Service for assessing and quantifying urban forest resources (Nowak, 2024), as well as the default emission factor library embedded in MEGAN v3.2. These empirical K values are obtained through measurements conducted using dynamic chamber or static enclosure approaches, in which emitted BVOCs were collected onto automatic sampler and subsequently analyzed by gas chromatography-mass spectrometry (GC/MS). The majority of measurements were made under standardized conditions (temperature = 30 °C, photosynthetically active radiation = 1000 µmol m−2 s−1). When multiple sources were available, measurements for the target species in China were prioritized, followed by international measurements for the same species and default MEGAN emission factors. When emission rates for certain species vary across multiple sources, we prioritized the arithmetic mean of available measurements or the observed value closest to that mean. For species lacking published emission measurements, we estimated emission factors through a principle of credibility based on classifications from the China Plant Science Data Center (http://www.plantplus.cn, last access: 24 June 2026). This process involved assigning values from congeneric species within the same genus or moving to the family level when genus-level data were unavailable (Table B1). This systematic prioritization ensured that the most representative and taxonomically relevant information was utilized for each species in the database.
2.2.3 Leaf area index
The preprocessor module quantifies the amount of foliage across the simulation domain, thereby providing the LAI inputs required in Eq. (3). We employed the MODIS global LAI product (MCD15A2H, https://doi.org/10.5067/MODIS/MCD15A2H.061, Myneni et al., 2021) which features a 500 m spatial resolution and 8 d temporal resolution (Fig. 1). The 2019 LAI datasets were integrated into the MEGAN model to replace the default 2003 inputs. This enhancement ensures that the LAI data used in our simulations are both temporally relevant with tree species distribution and spatially representative of the study period.
2.2.4 Land cover type
In the preprocessor module, land cover data were processed to determine the fractional coverage of each plant growth form, including trees (ftree), shrubs (fshrub), grasses (fgrass), and crops (fcrop), as required in Eq. (2). In this study, land-cover inputs were updated using the MODIS Land Cover Type product at 500 m resolution (MCD12Q1, https://doi.org/10.5067/MODIS/MCD12Q1.061, Friedl and Sulla-Menashe, 2022). Each MODIS land-cover class was mapped to one or more plant growth-form categories following the MEGAN default land-cover crosswalk of specified fractional contributions (Fig. 1). The five core forest classes (evergreen needleleaf, evergreen broadleaf, deciduous needleleaf, deciduous broadleaf, and mixed forest) were assigned entirely to tree cover. Woody savannas were apportioned as 60 % tree, 20 % grass, and 20 % shrub cover, while savannas were split into 30 % tree, 35 % grass, and 35 % shrub cover. Closed shrublands were assigned entirely to shrub cover, whereas open shrublands were comprised 60 % shrub and 40 % grass cover. Natural vegetation mosaics were distributed equally across all four growth forms at 25 % each. The fractional cover of each plant growth form within a coarse grid cell was then calculated by aggregating the weighted contributions of all relevant MODIS land-cover classes. Specifically, tree cover received contributions from the five core forest classes, woody savannas, savannas, and natural vegetation mosaics; grass and shrub cover were each aggregated from woody savannas, savannas, grasslands or shrublands, and natural vegetation mosaics; and crop cover was derived from croplands and natural vegetation mosaics.
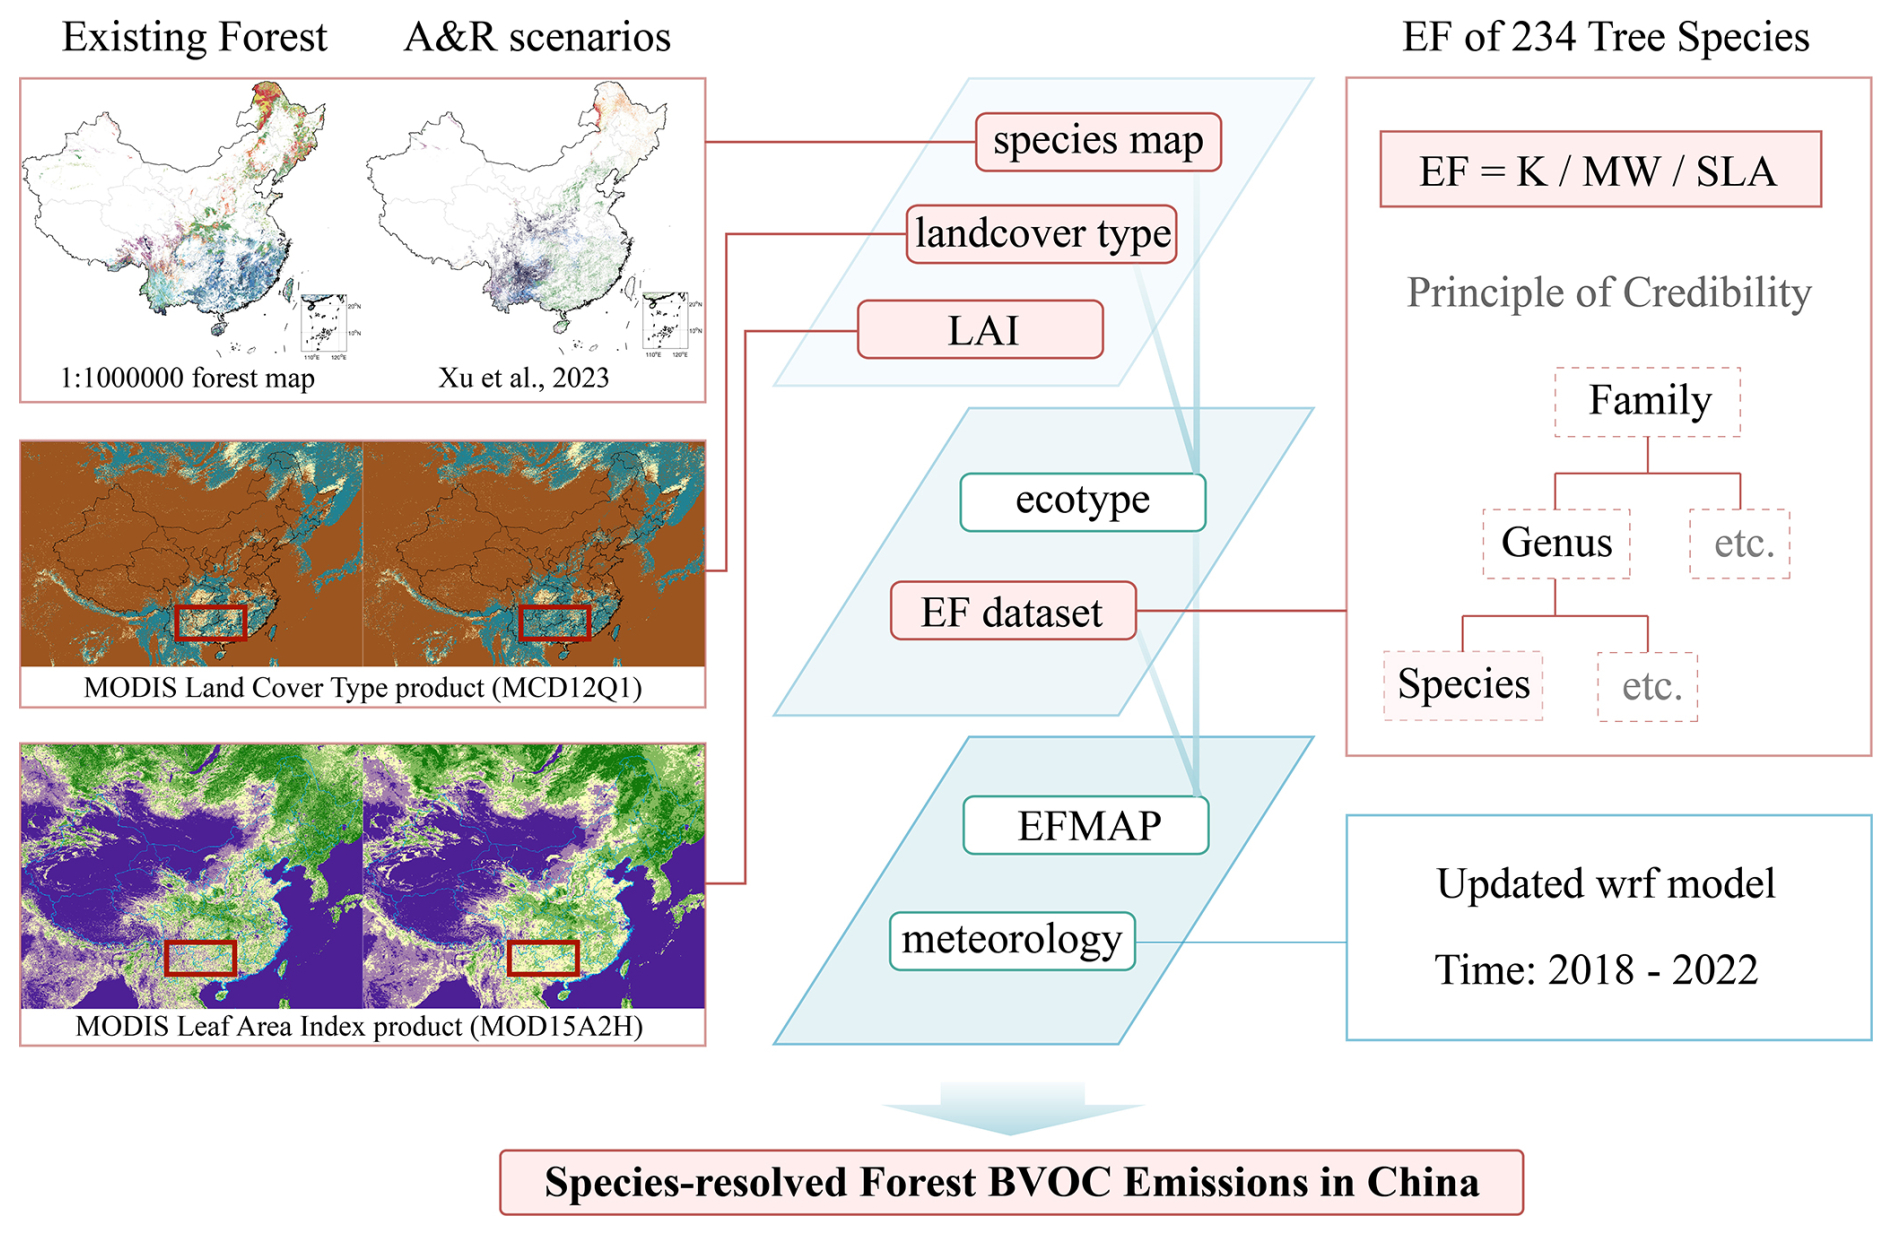
Figure 1Schematic overview of enhanced local inputs for estimating BVOC emissions in China from existing forests and afforestation & reforestation (A&R) scenarios using the MEGAN model. Red boxes highlight the four key local input enhancements: (1) Species map: refined tree species distribution maps capturing China's vegetation diversity, Sect. 2.2.1; (2) emission factors (EF) dataset: a species-specific emission factor database accounting for inter-specific variability in emission potentials, Sect. 2.2.2; (3) leaf area index (LAI): an enhanced leaf area index dataset representing canopy structure, Sect. 2.2.3; and (4) Landcover type: revised land cover data, Sect. 2.2.4.
2.3 Implementation of afforestation & reforestation scenarios
To assess changes in BVOC emissions driven by future afforestation and reforestation (A&R) in China, we implemented two A&R scenarios from Xu et al. (2023), with the dataset obtained from Zenodo (https://doi.org/10.5281/zenodo.8297679, Xu, 2023). Both scenarios cover the same potential planting area of 78 Mha but differ in tree species selection strategies: a biomass-maximizing scenario (BIO) and a highest environmental suitability scenario (HIGH). To represent these scenarios in MEGAN, we updated three key surface inputs within the target A&R areas: forest cover fraction, tree species composition, and leaf area index (LAI). These inputs determine the tree growth-form fraction (ftree) in Eq. (2) and the canopy foliage conditions required in Eq. (3).
2.3.1 Afforestation and reforestation scenarios
Both A&R scenarios adopted the 78 Mha potential forestation area delineated by Xu et al. (2023) at 1 km resolution. Potential forest extent was determined by combining three approaches: random-forest predictions based on tree-cover observations and environmental variables from WorldClim v2.1, SoilGrids250m, and GMTED2010; the World Resources Institute potential forest map; and ORCHIDEE simulations driven by the China Meteorological Forcing Dataset. Only locations identified as potential forest by all three approaches were retained, thereby excluding areas with lower agreement among the predictions. Existing forests, cropland, and urban areas were subsequently excluded using the 2013–2017 China Forest Vegetation Survey and six satellite-derived datasets: Hansen Global Forest Change, CNLUC, MODIS MCD12Q1, GLC-FCS3, GlobeLand30, and ESA-CC. The resulting 78 Mha defines the common spatial extent of the BIO and HIGH scenarios, which differ in tree-species allocation. Detailed delineation procedures and dataset specifications are provided in Xu et al. (2023).
The BIO scenario prioritizes carbon sequestration through biomass-optimized tree species selection and was designed to achieve nearly twice the carbon storage of the HIGH scenario by the end of century. It is mainly composed of typical deciduous broadleaf forests (35.7 %) in southeastern China and evergreen broadleaf forests (31.8 %) in southwest China. The five most prevalent taxa in this scenario are Cunninghamia lanceolata, Quercus aquifolioides, Camellia sinensis, Juglans spp. and Castanopsis delavayi, with four being broadleaf species reflects their superior carbon storage capacity. However, species selection in the BIO scenario is optimized for biomass carbon storage, without explicitly incorporating biodiversity conservation, soil erosion control, or water provision into the optimization objectives (Xu et al., 2023). The scenario therefore does not represent a universally preferred afforestation strategy, and its implementation requires consideration of local ecological conditions and management priorities.
In contrast, the HIGH scenario emphasizes ecological suitability of tree species to ensure long-term forest stability and climate adaptability. Species allocation in this scenario follows local climatic and ecological conditions to reduce the risk of plantation failure caused by water stress or species-environment mismatch. Pinus massoniana forests (9.40 %) are predominantly allocated to southeastern China, while other deciduous broadleaf forests (16.8 %) and warm Pinaceae forests (17.5 %) are concentrated in southern regions, Betula-Populus (11.6 %) demonstrate tolerance to diverse climatic conditions across the country. Compared with BIO, the HIGH scenario includes a larger share of needleleaf forests, with four of its five most prevalent species (Pinus yunnanensis, Pinus massoniana, Pinus tabuliformis and Pinus armandii) being conifers, while Betula platyphylla is the only broadleaf species among the top five.
2.3.2 Tree cover fraction adjustments
Under the baseline (BASE) land-cover condition, the 78 Mha area identified for potential A&R consists of multiple land cover types, predominantly savannas, grasslands, and shrublands. In the A&R scenarios, target grid cells are converted to forest, with the forest cover fraction (ftree) set to 1 to estimate the upper bound of potential A&R effects, representing a fully closed canopy in plantations (Fig. 1). The fractional covers of shrubs (fshrub), grasses (fgrass), and crops (fcrop) in Eq. (2) are all set to zero. This adjustment ensures that BVOC emissions within A&R cells are dominated by the selected tree species, while leaving surrounding regions unchanged to preserve a consistent regional background.
2.3.3 Species composition in A&R
The A&R scenarios distinguish 15 forest types, each represented by a dominant species or species group. These categories remain too broad for species-resolved BVOC emission estimation in MEGAN. We therefore developed a nearest-neighbor spatial matching procedure to disaggregate the 15 forestation forest types into species-level compositions.
For each A&R grid cell, we first identified existing forest cells belonging to the same forest type in the 1:1 000 000 tree species vector map of China. Among these candidate cells, the geographically nearest existing forest cell was selected based on Euclidean distance. The underlying assumption is that nearby existing forest cells within the same forest type provides the closest ecologically analogous for species composition, because they have established under broadly comparable environmental conditions. The species composition of matched existing forest cell was transferred to the corresponding A&R grid cell. Through this procedure, the 15 coarse forest type were spatially disaggregated into 234 tree species at 1 km resolution, yielding afforestation vector maps for both BIO and HIGH scenarios, thereby providing the kilometer-scale, species-level inputs required for estimating subsequent BVOC emissions.
2.3.4 Prediction of leaf area index under A&R scenarios
Since LAI observations are unavailable for future potential A&R landscapes, we developed a set of random forest models to estimate monthly LAI distributions across A&R grid cells (Fig. 1). Twelve independent models were trained, one per calendar month, using historical monthly LAI data from 2003 to 2018. Despite the initial inclusion of climate variables (temperature, precipitation, relative humidity, shortwave radiation, sunshine duration, and surface pressure) as candidate predictors, feature importance analysis revealed their contributions to be marginal. The final models therefore retained four dominant land surface predictors: Fraction of Green Vegetation Cover (https://doi.org/10.2909/7d726671-9647-4116-8dc3-cf7470a1a782, CLMS, 2017), MCD12Q1 land cover classifications (https://doi.org/10.5067/MODIS/MCD12Q1.061, Friedl and Sulla-Menashe, 2022), soil properties from the Harmonized World Soil Database (https://www.fao.org/soils-portal/data-hub/soil-maps-and-databases/harmonized-world-soil-database-v12/en/, FAO/IIASA/ISRIC/ISS-CAS/JRC, 2012), and the 1:1 000 000 vector map of forest type distribution (https://doi.org/10.12041/geodata.43370179401687.ver1.db, Liu et al., 2020). Since each model is trained on data from a single calendar month, seasonal variability in LAI is implicitly captured across the twelve models rather than driven by climate forcing within any individual model, rendering climate variables largely redundant. Model performance was assessed through independent temporal validation, with models trained on 2003–2018 data and evaluated against MCD15A2H LAI observations for the corresponding months in 2019. Across all grid cells, the models achieved monthly correlation coefficients of 0.62–0.76, root mean square errors (RMSE) of 15.5–17.3, and mean absolute errors (MAE) of 9.5–11.3 (Table B2). To predict LAI under the A&R scenarios, baseline surface attributes were replaced with A&R-specific parameters, including species composition derived from the nearest-neighbor matching procedure and the enhanced forest fraction associated with plantation establishment, thereby enabling monthly LAI predictions under the A&R scenarios. The resulting monthly mean LAI fields were incorporated into Eq. (3) as surface input parameters, collectively representing the effects of vegetation cover change and canopy density modification on BVOC emissions.
2.4 Simulation scenarios
For existing forests, three scenarios were designed to characterize current forest BVOC emissions (Table 1): Exist-SPE simulated species-resolved forest BVOC emissions for 2018–2022. The resulting five-year mean inventory was used to reduce the influence of interannual meteorological variability and to drive WRF-Chem simulations of SOA for inventory evaluation. Exist-PFT adopted the conventional PFT-level scheme for 2019, serving as a benchmark to assess the improvement achieved by updating emission calculations from the PFT level to the species level. Exist-IND generated a set of individual emission inventories for each of the 234 tree species in 2019, enabling identification of the dominant contributors to China's forest BVOC emissions.
For A&R scenarios, BIO-IND and HIGH-IND applied the same species-resolved framework as Exist-IND to 2019 (Table 1), replacing current forest cover, species composition, and LAI with those derived from two A&R scenarios described in Sect. 2.3, respectively. These two scenarios quantify national emission changes attributable to A&R activities and also enable identification of dominant BVOC-emitting tree species under each A&R scenario. In both scenarios, meteorological fields were held constant at present-day conditions, consistent with those applied in Exist-IND, isolating the influence of A&R-driven changes in forest cover and composition on BVOC emissions from potential climate feedbacks.
In this study, the Weather Research and Forecasting model coupled with Chemistry (WRF-Chem version 4.2; Skamarock et al., 2019) was used to simulate meteorological field to drive biogenic emission estimation by MEGAN and to simulate SOA for evaluation of the emission inventory. As an online coupled mesoscale modeling system, WRF-Chem simulates trace gases and aerosols simultaneously with meteorological fields within a unified computational framework. It supports a wide range of gas-phase chemical mechanisms and aerosol schemes of varying complexity, and incorporates parameterizations for photolysis, dry and wet deposition, biogenic and anthropogenic emissions, and SOA formation. The model was employed in two configurations. The chemistry module was disabled to run the model in meteorology-only mode, thereby generating the 2018–2022 meteorological fields as input for MEGAN v3.2 biogenic emission estimation. The fully coupled WRF-Chem configuration was then used to simulate tropospheric chemistry and aerosol, including BVOCs and SOA over 2018, with results compared against observations to evaluate the derived emission inventory. The Exist-SPE and Exist-PFT simulations used identical meteorological forcing and model configurations to ensure a consistent comparison of the emission schemes. Evaluation used 32 observational records from 30 sites, with sampling periods spanning 2011–2022. Simulated SOA concentrations were averaged over the corresponding calendar dates in 2018. This approach aligns the seasonal sampling windows, although meteorological differences between simulation and observation years introduce uncertainty into the comparison. To improve the representation of surface conditions, the default land cover and LAI in both configurations were replaced with enhanced datasets, as described in Sect. 2.2.
Both configurations share same domain and physical parameterization schemes (configuration detailed in Table B3). The model domain encompasses China and surrounding regions at a horizontal resolution of 27 km, with 35 vertical layers extending from the surface to 100 hPa. Initial and lateral boundary conditions are derived from the National Centers for Environmental Prediction Final (FNL, https://doi.org/10.5065/D6M043C6, National Centers for Environmental Prediction/National Weather Service/NOAA/U.S. Department of Commerce, 2000) Analysis data at 1° spatial resolution and 6-hourly temporal resolution. The physical parameterization schemes include the Morrison double-moment scheme for microphysics (Morrison et al., 2009), the Grell-3D ensemble scheme for cumulus convection (Grell and Freitas, 2014), the Rapid Radiative Transfer Model for GCMs scheme for shortwave and longwave radiation (Iacono et al., 2008), the Mellor-Yamada Nakanishi and Niino Level 2.5 scheme for the planetary boundary layer (Nakanishi and Niino, 2006), and the Community Land Model version 4 for the land surface (Oleson et al., 2013). For the coupled simulation, gas-phase chemistry is represented by the Model for Ozone and Related chemical Tracers scheme (Emmons et al., 2010), and aerosol processes are treated using the Model for Simulating Aerosol Interactions and Chemistry with 4 sectional aerosol bins (Zaveri et al., 2008). Anthropogenic emissions are prescribed using the 2020 Multi-resolution Emission Inventory for China (MEIC) and the 2017 MIX inventory for regions outside China (http://meicmodel.org.cn/, Cheng et al., 2023), while biogenic emissions are calculated by MEGAN v3.2 with improved model inputs.
Table 1Simulation Scenarios.
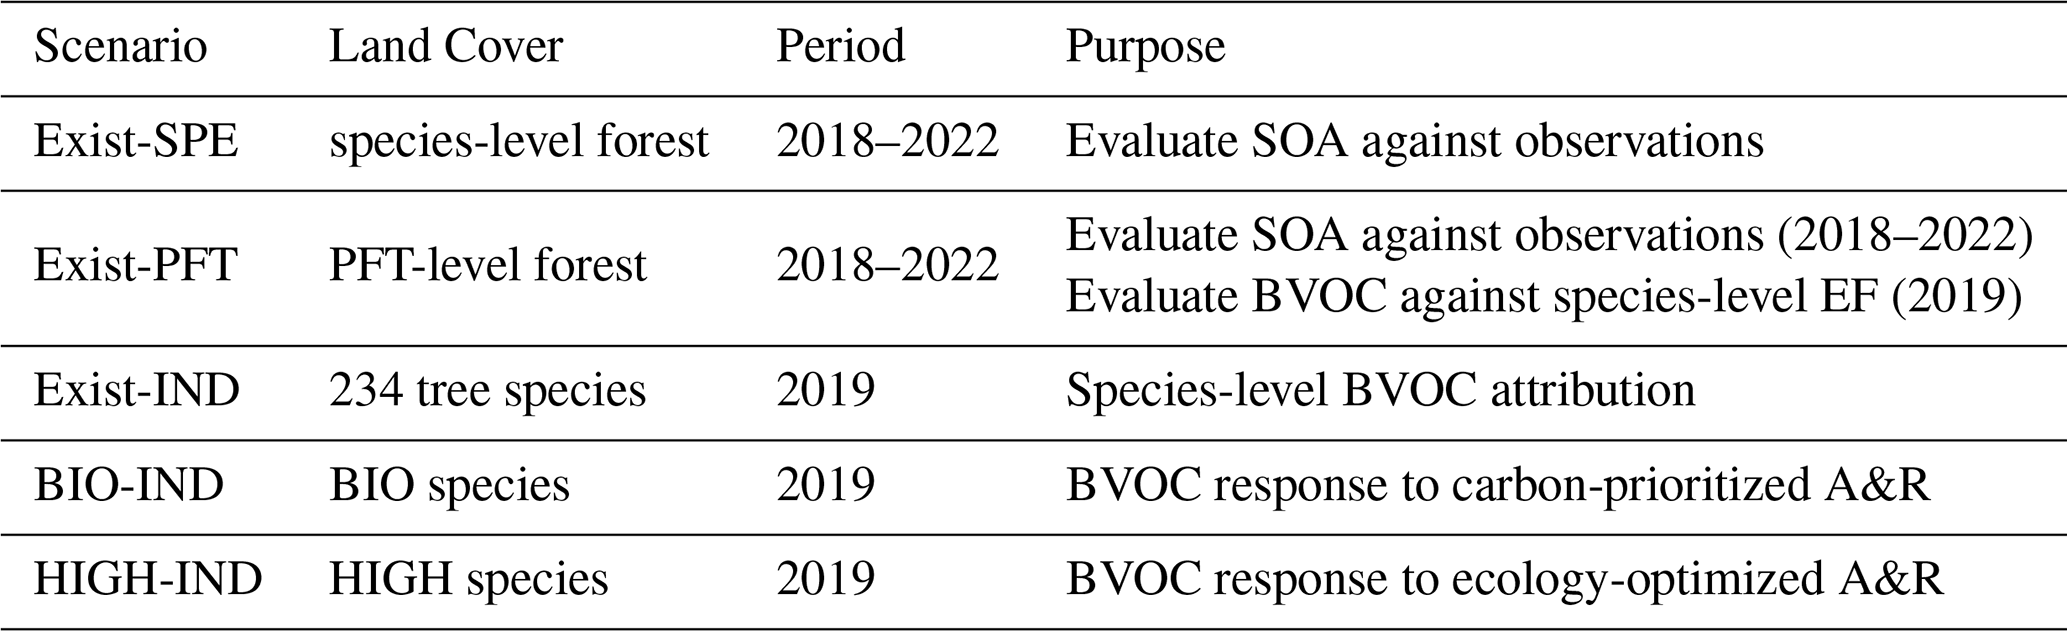
Note: Exist-SPE and Exist-PFT uses the 2018–2022 mean to reduce the influence of interannual meteorological variability and obtain a more representative BVOC inventory. The IND scenarios use fixed 2019 meteorology to quantify individual species contributions and identify dominant BVOC-emitting taxa. Restricting these calculations to one year limits the computational cost of generating separate inventories for 234, 161, and 199 tree categories in Exist-IND, BIO-IND, and HIGH-IND, respectively, while enabling consistent comparisons of vegetation-driven emission differences. All mass-based BVOC emissions reported in this study are expressed as compound mass rather than carbon mass.
3.1 Validation with BVOC observations
To evaluate the species-resolved BVOC emissions inventory, observed emission rates of isoprene and monoterpenes from four forest monitoring stations were compared (Fig. 2; Bai et al., 2026). The selected stations include Mountain Changbai (CBM, 42°24′ N, 128°6′ E; Bai et al., 2015), Linan (LA, 30°18′ N, 119°34′ E; Bai et al., 2016), Qianyanzhou (QYZ, 26°44′ N, 115°04′ E; Bai et al., 2017) and Danzhou (DZ, 19°32′ N, 109°28′ E; Bai et al., 2025), spanning a broad latitudinal gradient from temperate to tropical forest ecosystems across China. Along this gradient, floristic composition varies considerably, with dominant tree species exhibiting divergent BVOC emission potentials that conventional PFT-based classifications fail to capture.
Simulations with two parallel MEGAN3 configurations were conducted, one applying the default PFT emission factors (Exist-PFT) and the other the species-resolved scheme (Exist-SPE). The resulting BVOC emission rates from both schemes were evaluated against observational records from different periods between 2011 and 2019. For each monitoring station, the two scenarios shared identical meteorological and LAI inputs, ensuring a consistent atmospheric and vegetation density background across both simulations. The species-resolved scheme yielded more accurate concentration magnitudes than Exist-PFT. For isoprene, mean bias (MB) decreased from 1.33 to 0.90 mg m−2 h−1 and root mean square error (RMSE) from 1.64 to 1.18 mg m−2 h−1. For monoterpenes, MB declined from −0.47 to −0.35 mg m−2 h−1 and RMSE from 1.22 to 1.12 mg m−2 h−1. These reductions in bias demonstrate that species-level refinement reduces errors introduced by PFT averaging without altering the temporal patterns.
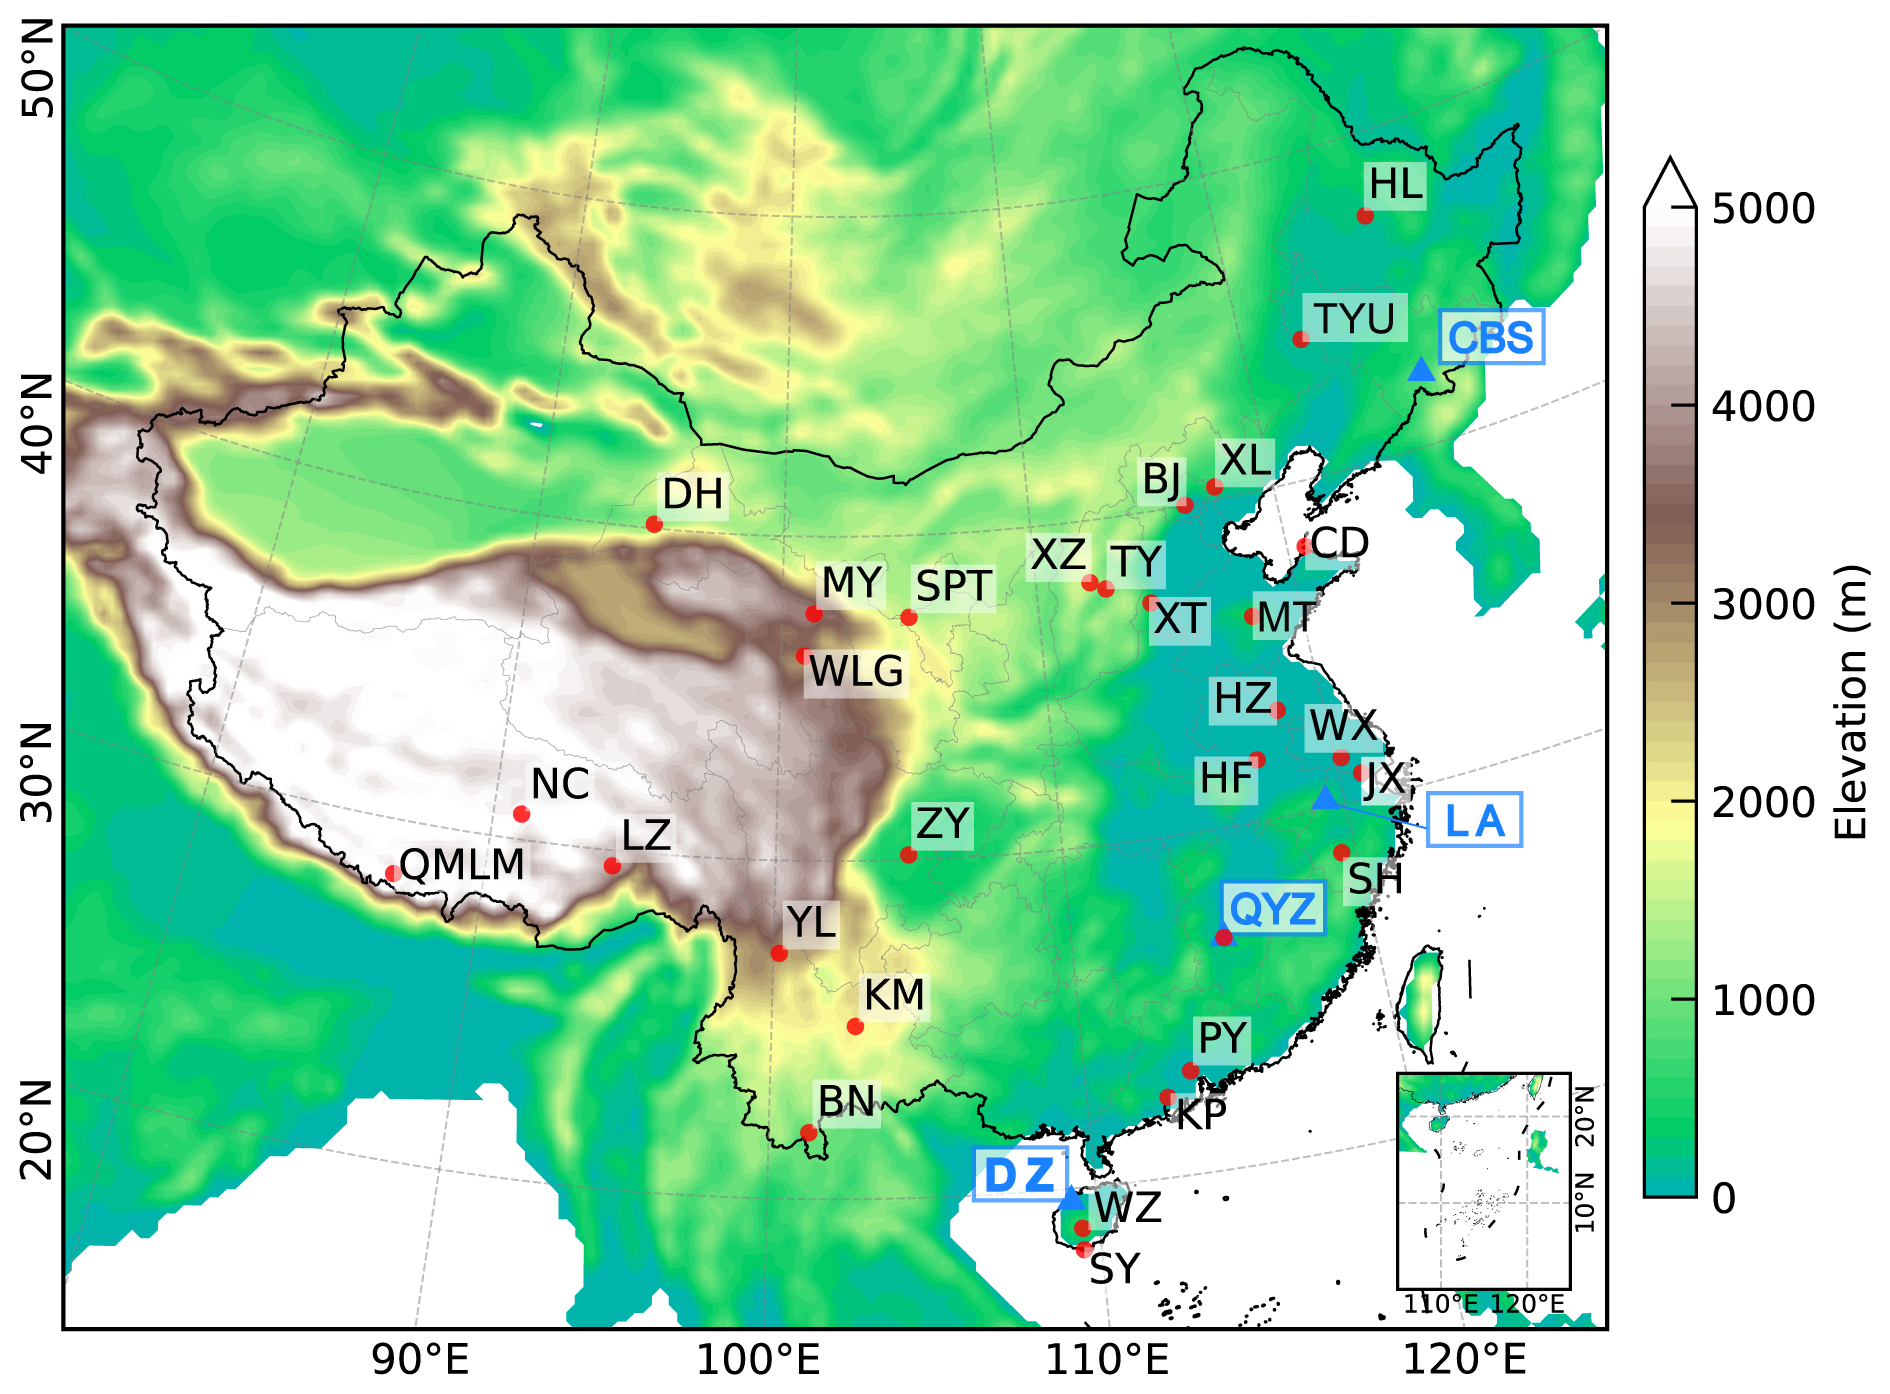
Figure 2Locations of BVOCs observation sites (CBM, LA, QYZ, and DZ; blue triangles) and 30 SOA observation sites (red circles) used for inventory evaluation. BVOC observations were used to evaluate simulated BVOC emissions, while SOA observations were used to assess model performance in reproducing secondary organic aerosol levels.
Site-specific analysis further showed how species-level emission factors affected the agreement between simulated and observed BVOC fluxes across seasons (Table 2). The DZ station (Fig. 3), dominated by Hevea brasiliensis, was classified as tropical broadleaf forest in the PFT scheme, with emission factors of 8.59 nmol m−2 s−1 for isoprene and 0.70 nmol m−2 s−1 for monoterpenes. These values deviated from the measured values (isoprene: 0.09 nmol m−2 s−1; monoterpenes: 2.22 nmol m−2 s−1), leading to an overestimation of isoprene and underestimation of monoterpenes emission, with mean biases of +1.87 and −1.65 mg m−2 h−1. For isoprene (Fig. 3), observed fluxes showed a clear seasonal contrast, with higher means in spring and summer (1.04 and 1.15 mg m−2 h−1, Table 2) than in autumn and winter (0.34 and 0.45 mg m−2 h−1). Both the PFT-based and Exist-SPE configurations captured this broad seasonal pattern, but Exist-SPE consistently brought simulated magnitudes closer to observations across seasons. In summer, the simulated mean decreased from 3.55 to 2.15 mg m−2 h−1 and RMSE decreased from 2.89 to 1.55 mg m−2 h−1; in winter, the mean decreased from 1.19 to 0.72 mg m−2 h−1 and RMSE decreased from 0.91 to 0.47 mg m−2 h−1. This consistent improvement across seasons supports the use of a species-specific isoprene emission capacity for this rubber plantation. Monoterpene observations at DZ exhibited a different seasonal pattern (Fig. 3): the mean was lowest in summer (1.33 mg m−2 h−1), whereas appreciable emissions persisted in autumn and winter (2.84 and 2.18 mg m−2 h−1, Table 2). Exist-SPE alleviated the PFT-based underestimation in spring, autumn, and winter, although it did not reproduce the observed summer minimum. Thus, the species-level update improved the representation of the relatively low-isoprene, higher-monoterpene emission profile of this plantation, but did not fully capture its monoterpene seasonality.
At QYZ station, dominated by Pinus massoniana, observed isoprene and monoterpene fluxes both peaked in summer, but their responses to species-level parameterization differed (Fig. 4). For isoprene, observed mean fluxes increased from 0.084 mg m−2 h−1 in spring to 0.263 mg m−2 h−1 in summer before declining to 0.051 mg m−2 h−1 in autumn. By replacing the default PFT isoprene emission factor (8.30 nmol m−2 s−1) with the species-specific value (0.39 nmol m−2 s−1), more than an order of magnitude lower, Exist-SPE reduced MB by 65 %–71 % and RMSE by 65 %–68 % across all three seasons. The largest absolute improvement occurred in summer, when the simulated mean decreased from 2.45 to 0.90 mg m−2 h−1 and RMSE from 2.39 to 0.77 mg m−2 h−1. For monoterpenes, both configurations reproduced the higher mean emissions in summer than others but underestimated episodic high fluxes (Fig. 4), with scheme differences in RMSE ranging from 0.01 to 0.03 mg m−2 h−1 (Table 2). Thus, the evaluation at QYZ demonstrates a consistent reduction in isoprene bias and RMSE across the sampled seasons, whereas monoterpene performance remained broadly comparable between the two configurations.
At LA station, dominated by Phyllostachys edulis, the species-level update increased the isoprene emission factor from 11.50 to 23.65 nmol m−2 s−1 and decreased the monoterpene factor from 0.60 to 0.08 nmol m−2 s−1, producing contrasting adjustments in simulated emissions (Fig. 5). Observed isoprene and monoterpene fluxes both declined from summer to winter, with seasonal means decreasing from 1.91 to 0.005 mg m−2 h−1 and from 0.03 to 0.006 mg m−2 h−1, respectively. Both configurations reproduced this seasonal decline. For isoprene (Fig. 5), Exist-SPE more closely reproduced the amplitudes of some summer emission peaks than Exist-PFT, including the observed peak near 10 mg m−2 h−1 in July. For monoterpenes, Exist-SPE reduced the magnitude of MB and RMSE. In summer, the simulated mean decreased from 0.53 to 0.21 mg m−2 h−1 towards the observed 0.03 mg m−2 h−1, while RMSE decreased from 0.53 to 0.20 mg m−2 h−1 (Table 2). The winter mean of 0.005 mg m−2 h−1 closely matched the observed 0.006 mg m−2 h−1. Thus, the LA evaluation indicates improved representation of selected summer isoprene peak magnitudes and a consistent reduction in monoterpene errors across seasons (Fig. 5).
At the CBM station, dominated by a mixture of Betula platyphylla, Populus davidiana, and Quercus mongolica, isoprene exhibited a pronounced seasonal contrast, with mean flux declining by 83 % from summer to autumn, whereas monoterpenes showed both lower flux magnitudes and a more modest seasonal decline of 44 % (Fig. 6). Both configurations captured the direction of this seasonal transition. Summer isoprene was characterized by mean overestimation alongside underestimation of several major emission peaks. Although Exist-SPE reduced the error at some peaks, it simultaneously increased the overall seasonal positive bias (Fig. 6), raising RMSE from 1.08 to 1.30 mg m−2 h−1 (Table 2). This result indicates that increasing emission capacity did not resolve the mismatch between mean fluxes and episodic maxima. For monoterpenes, the two simulated time series largely overlapped (Fig. 6); Exist-SPE reduced mean overestimation and lowered summer RMSE from 0.25 to 0.23 mg m−2 h−1 (Table 2), while both configurations underestimated several observed peaks.
Across all four sites, species-resolved scheme (Exist-SPE) eliminated the artificial smoothing inherent in PFT averaging, where a single value within same PFT conflates species whose emission factors differ by up to two orders of magnitude. The resulting BVOC emissions captured the flux ranges more faithfully than the Exist-PFT. The improvements in bias, error statistics, and temporal fidelity collectively confirm that species-specific emission factors elevate model performance, rendering the BVOC emissions inventory reliable for integration into regional atmospheric chemistry simulations, which is further supported by the SOA evaluation in the following section.
Table 2Comparison of simulated and observed BVOCs at four stations (mg m−2 h−1).
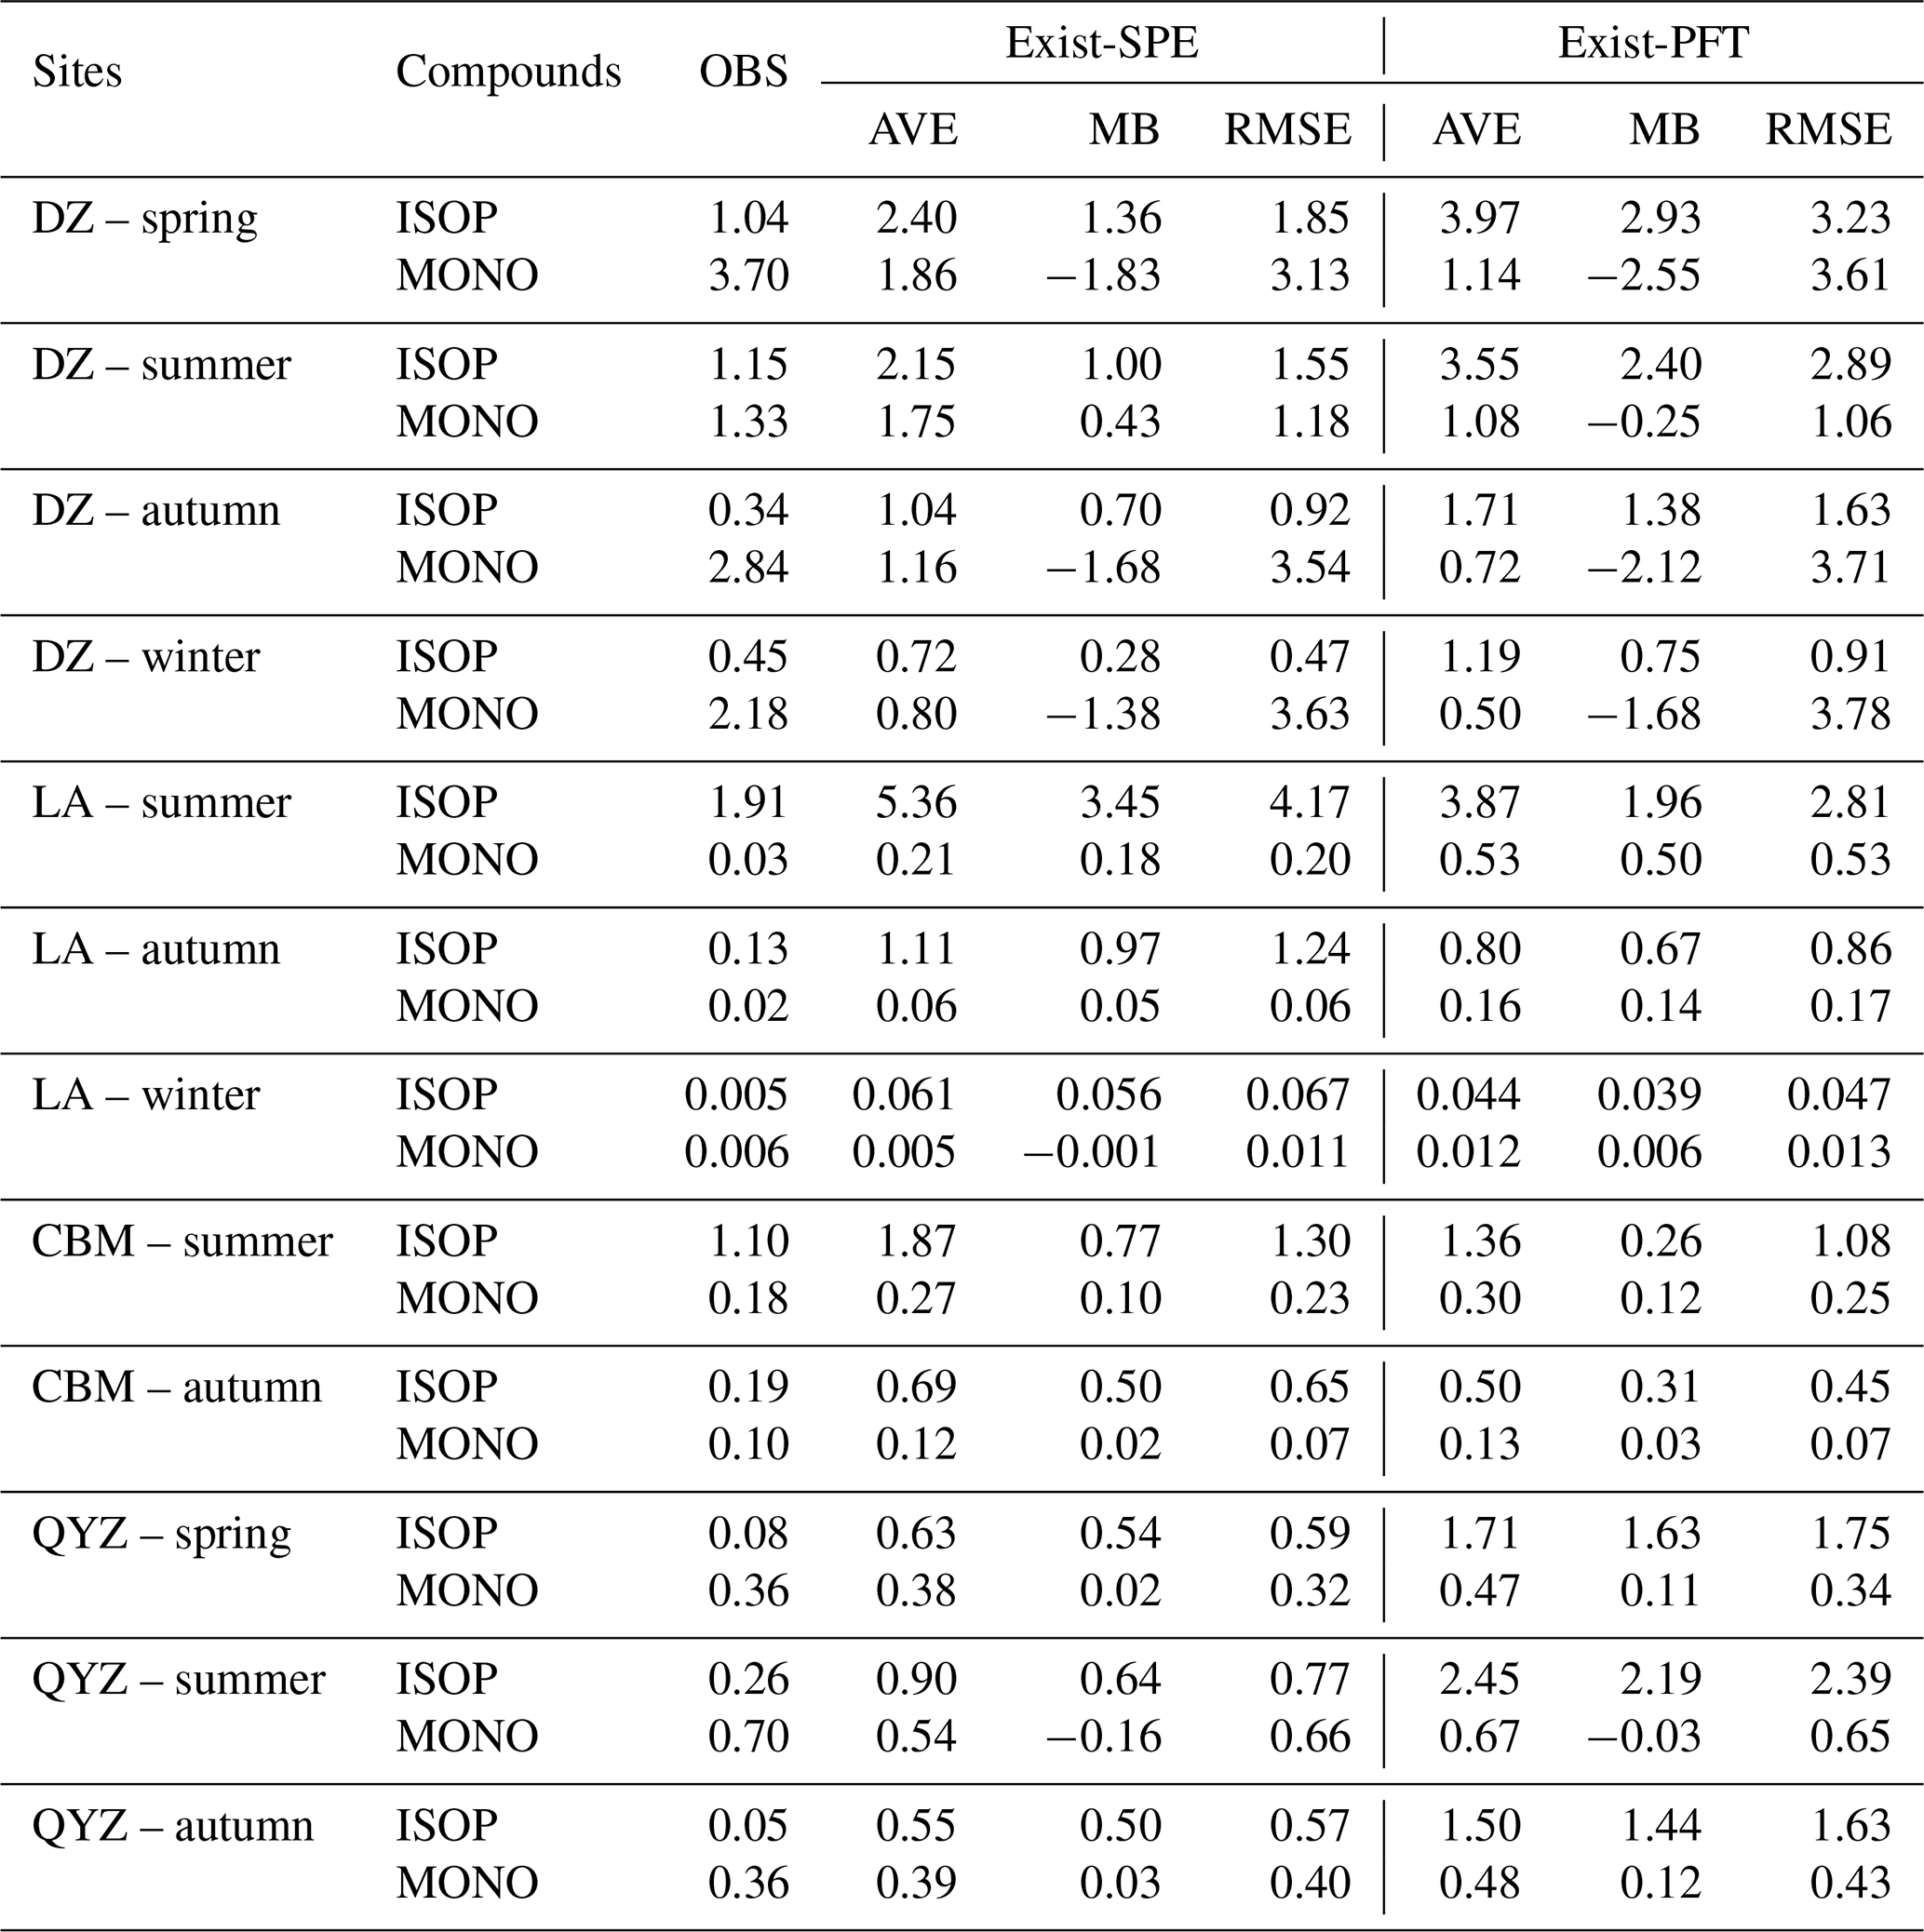
MB denotes mean bias, RMSE denotes root mean square error, Exist-SPE represents the species-level approach, and Exist-PFT represents the traditional plant functional type approach.
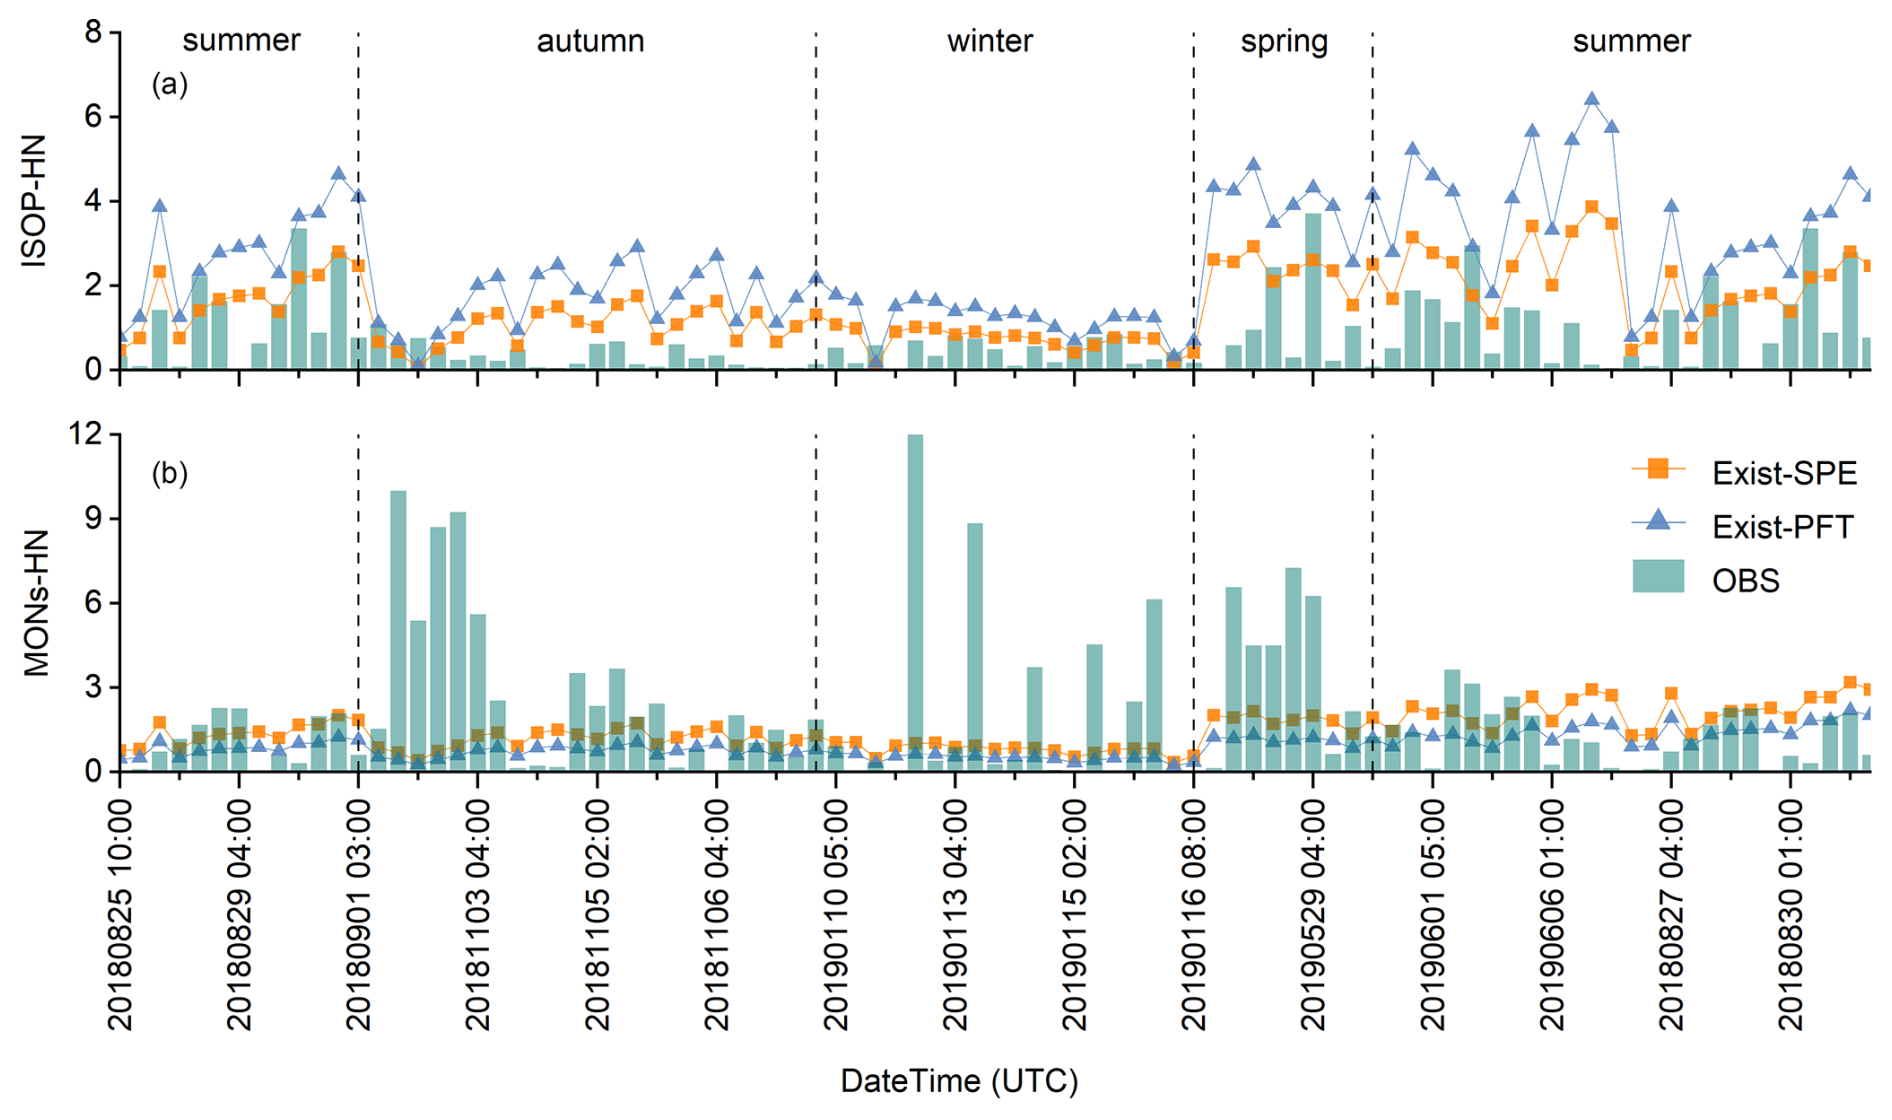
Figure 3Observed versus simulated isoprene and monoterpene emissions at Danzhou. (a) Comparison of observed and simulated isoprene emissions. (b) Comparison of observed and simulated monoterpene emissions. Green bars represent observations (OBS), while the yellow and blue lines represent simulations using species-level emission factors (SPE) for existing forests in China and the plant functional type (PFT)-based approach, respectively.
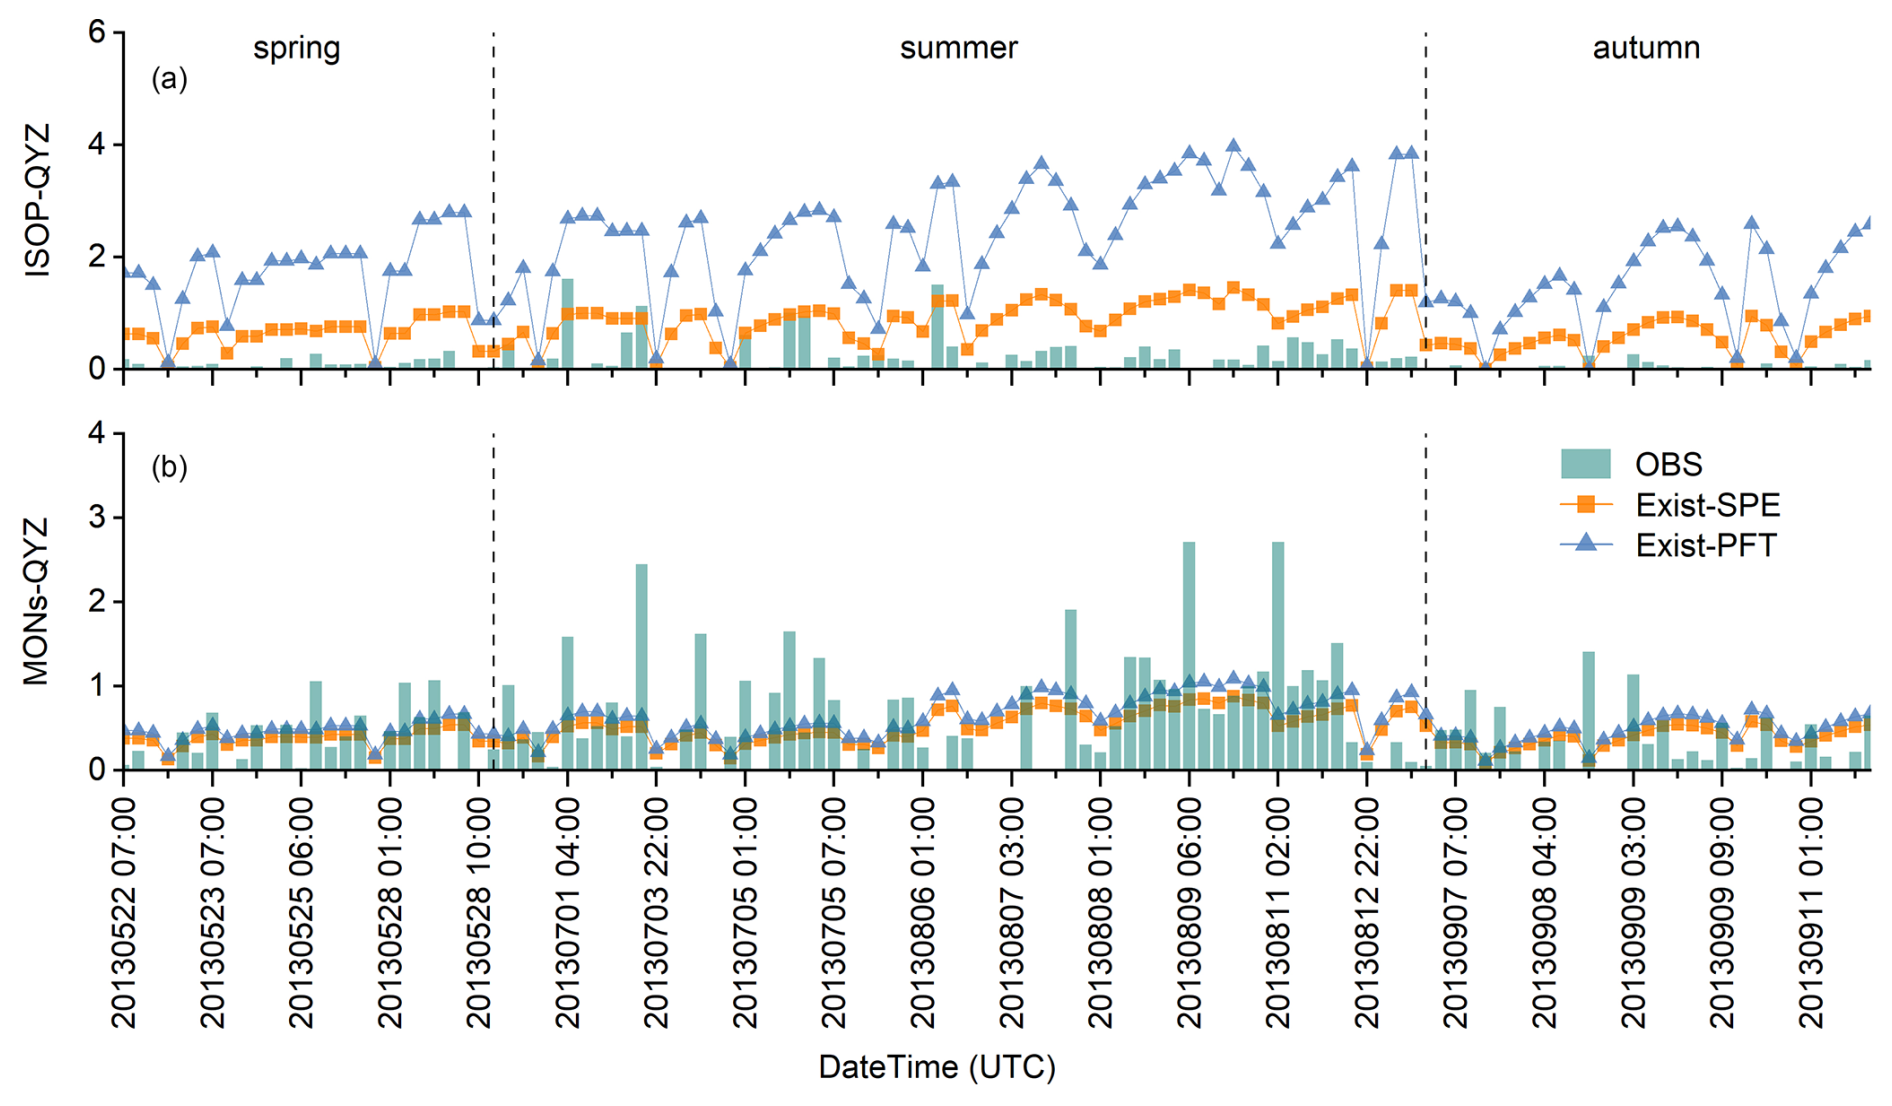
Figure 4Observed versus simulated isoprene and monoterpene emissions at Qianyanzhou. (a) Comparison of observed and simulated isoprene emissions. (b) Comparison of observed and simulated monoterpene emissions. Green bars represent observations (OBS), while the yellow and blue lines represent simulations using species-level emission factors (SPE) for existing forests in China and the plant functional type (PFT)-based approach, respectively.
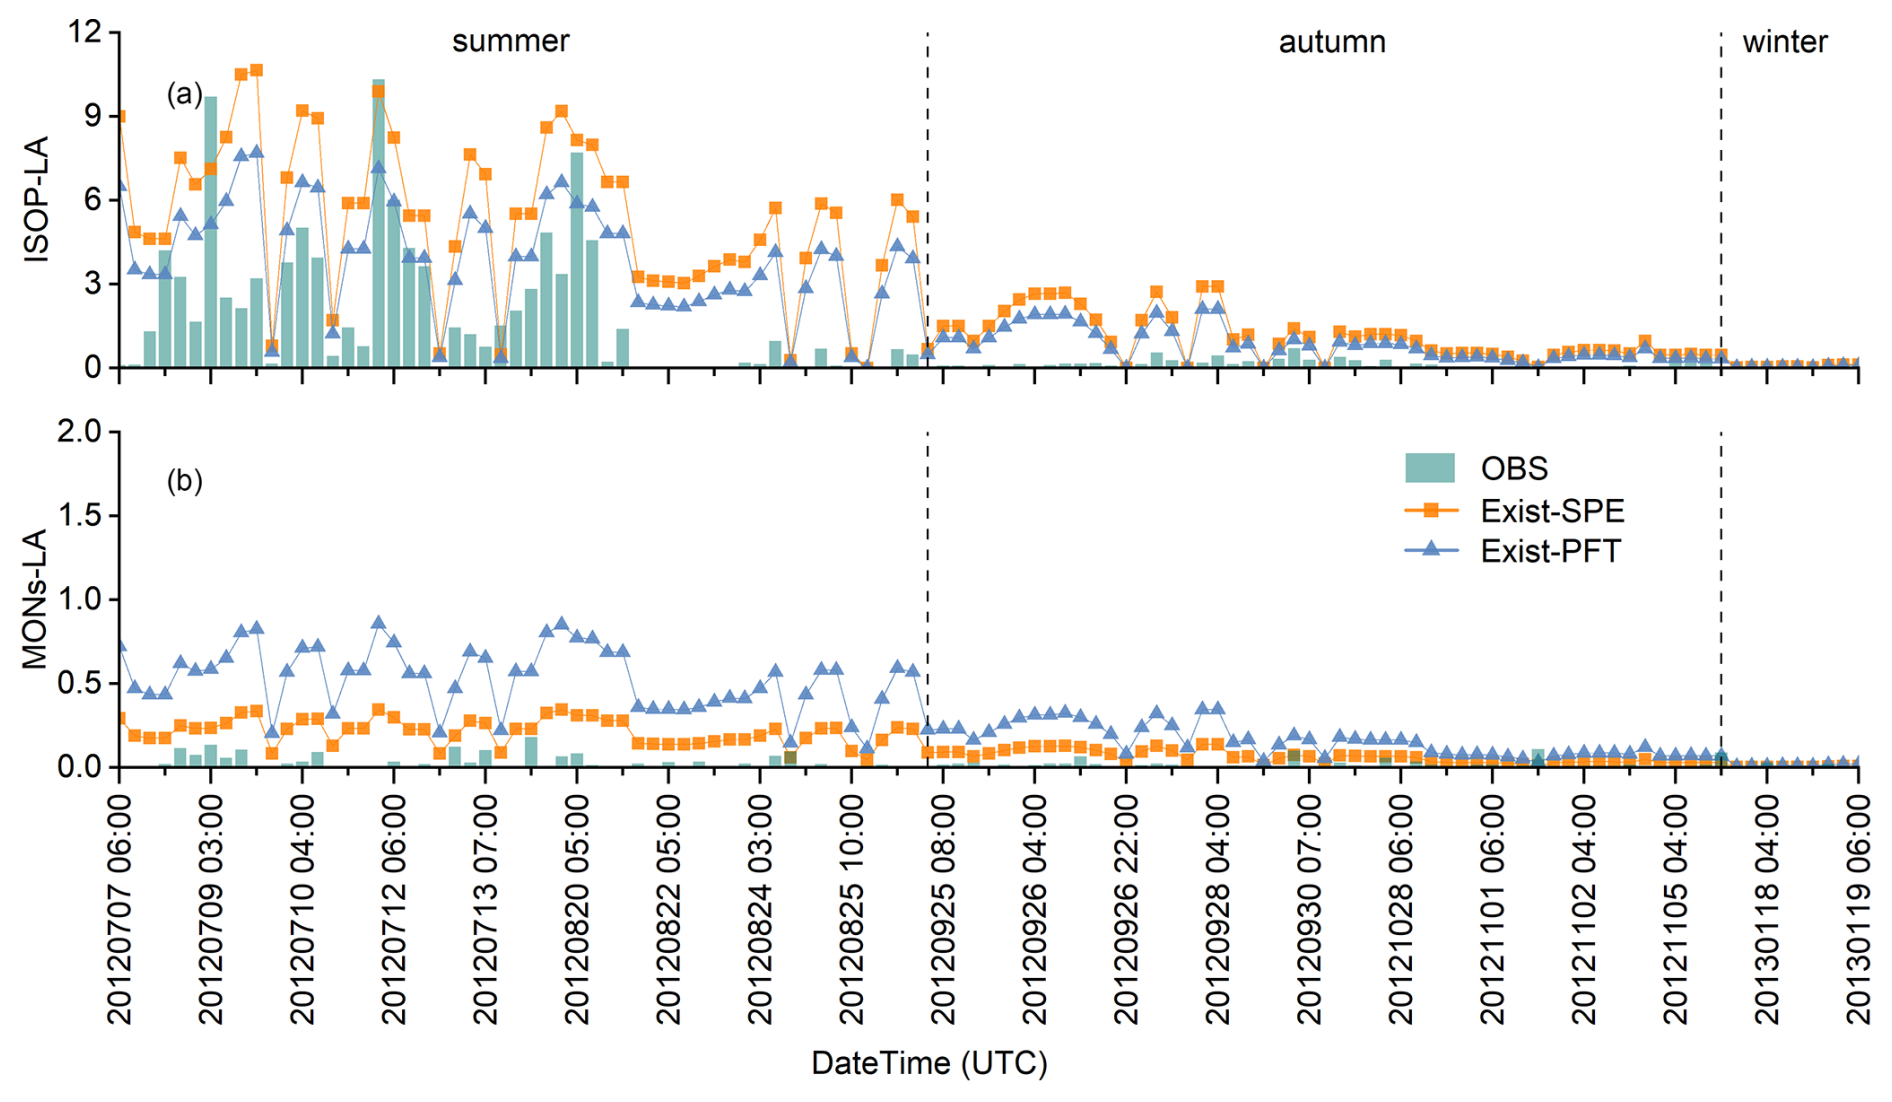
Figure 5Observed versus simulated isoprene and monoterpene emissions at Linan. (a) Comparison of observed and simulated isoprene emissions. (b) Comparison of observed and simulated monoterpene emissions. Green bars represent observations (OBS), while the yellow and blue lines represent simulations using species-level emission factors (SPE) for existing forests in China and the plant functional type (PFT)-based approach, respectively.
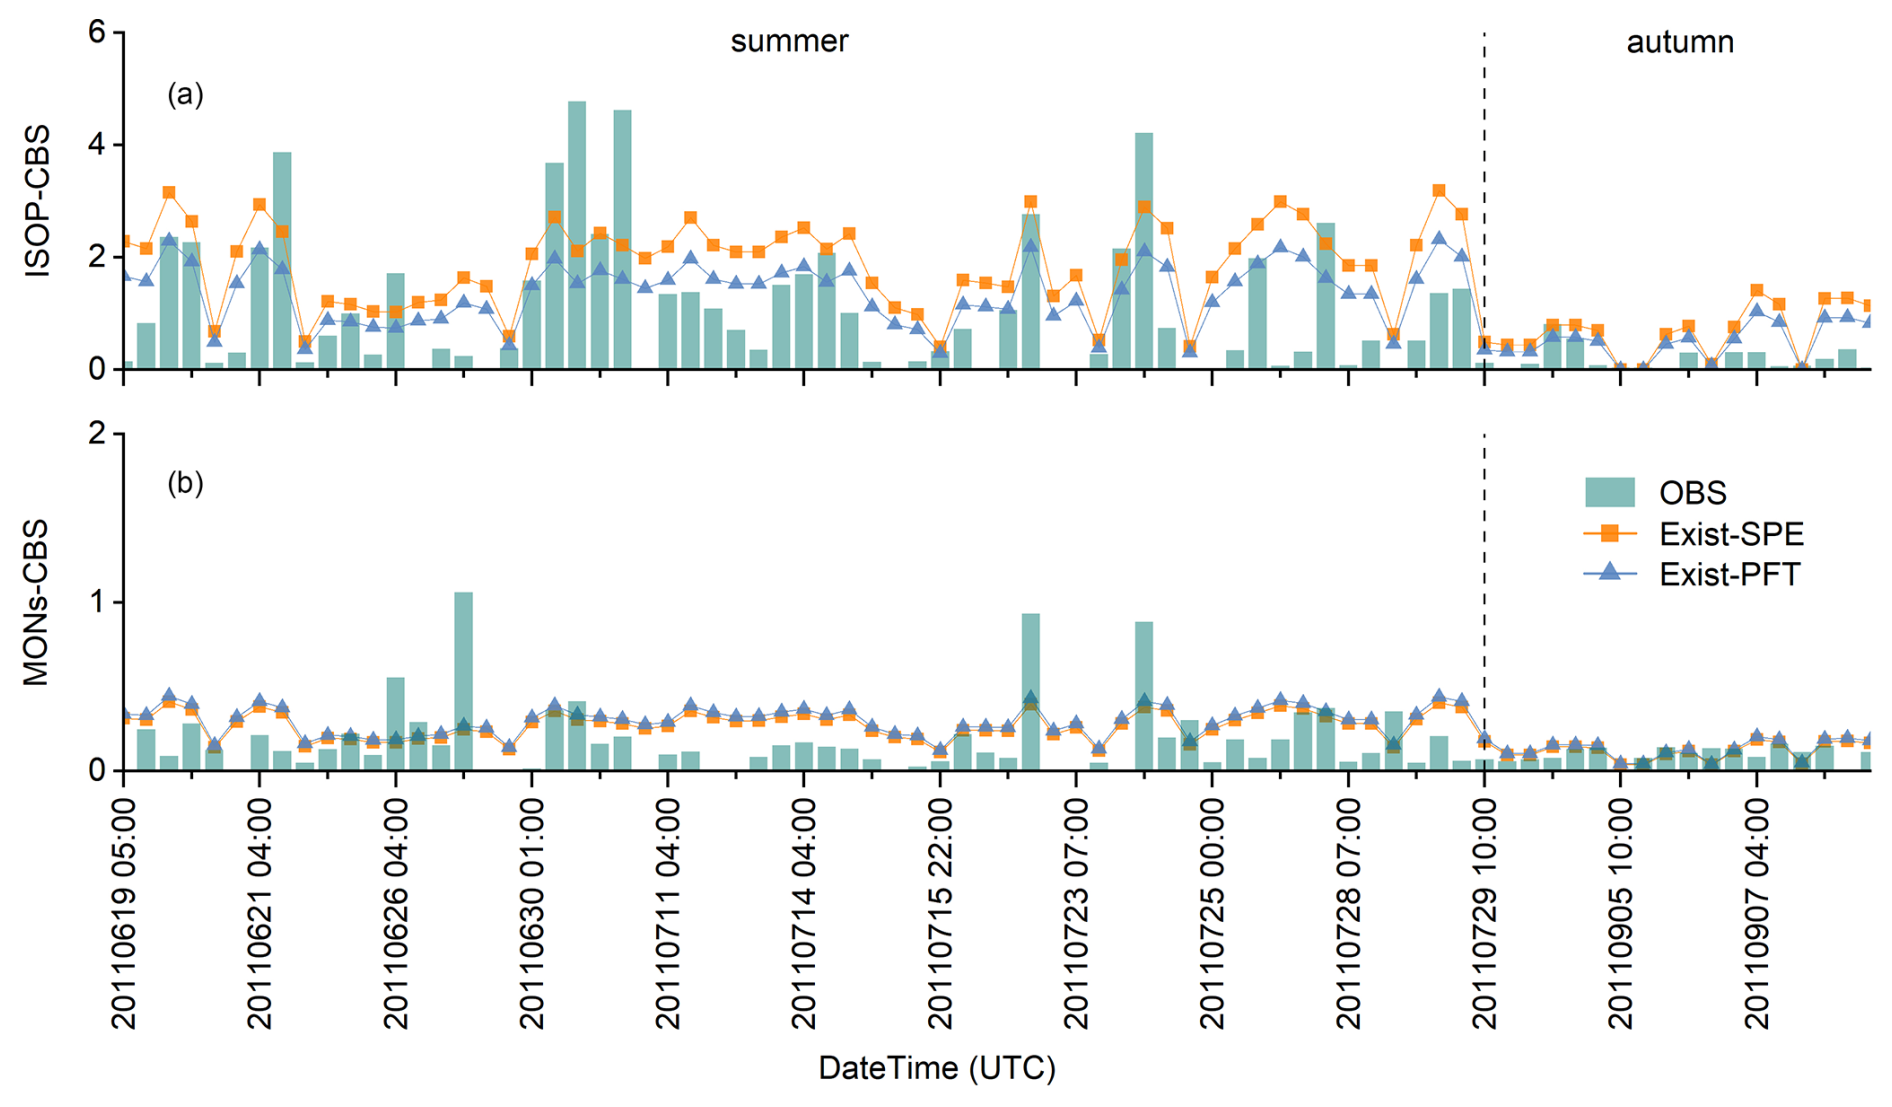
Figure 6Observed versus simulated isoprene and monoterpene emissions at Changbai. (a) Comparison of observed and simulated isoprene emissions. (b) Comparison of observed and simulated monoterpene emissions. Green bars represent observations (OBS), while the yellow and blue lines represent simulations using species-level emission factors (SPE) for existing forests in China and the plant functional type (PFT)-based approach, respectively.
3.2 Evaluation with SOA observations
To further evaluate the species-resolved BVOC emissions inventory (Exist-SPE), we integrated it into the Weather Research and Forecasting model coupled with Chemistry (WRF-Chem; configuration detailed in Table B3) to simulate SOA over China in 2018. Simulated concentrations were evaluated against 32 ground-based observation records from 30 monitoring stations across China (Fig. 2), yielding a positive correlation between simulations and observations (r=0.55). The mean simulated concentration was 3.47 µg m−3, compared with the observed mean of 4.72 µg m−3, corresponding to a mean bias (MB) of −1.26 µg m−3 and a normalized mean bias of −26.64 % (Table 3). Beyond this overall underestimation, discrepancies across individual records were characterized by a root mean square error (RMSE) of 3.16 µg m−3 and a mean absolute error (MAE) of 2.39 µg m−3. Model performance varied across sites over an observed concentration range of 0.81–15.40 µg m−3 (Fig. 7a). The relatively low concentrations at LZ and QMLM were reproduced, while simulated magnitudes closely matched observations at BJ, BN, SY, and JX. Nevertheless, concentrations were underestimated in 23 of the 32 records, with larger absolute deficits at several high-concentration sites (Fig. 7a). These included CD (simulated: 2.49 µg m−3 versus observed: 9.40 µg m−3; difference: −6.91 µg m−3), XT (3.01 versus 8.80; −5.79 µg m−3), and PY (4.38 versus 12.50; −8.12 µg m−3), highlighting the remaining difficulty in reproducing elevated SOA concentrations at these sites. Compared with Exist-PFT, Exist-SPE increased the correlation with observations from 0.52 to 0.55 while reducing MAE by 7.88 % and RMSE by 2.61 %, with MB remaining largely unchanged (−1.20 versus −1.26 µg m−3, Table 3). These results indicate that species-level refinement improved overall agreement across individual records, although systematic underestimation persisted.
To evaluate how model performance varied across sampling environments, the monitoring stations were classified into three categories: urban (13 stations), rural (6 stations), and background sites (11 stations, Table 3), representing locations within or near cities, non-urban rural environments, and representative regional background conditions, respectively. The response to species-level refinement differed among the three groups. At urban and background sites, Exist-SPE yielded consistent improvements in agreement with observations (Fig. 7a), with correlation coefficients increasing from 0.40 to 0.53 and from 0.54 to 0.63, respectively, accompanied by corresponding reductions in error: urban MAE decreased from 3.16 to 2.55 µg m−3, while background RMSE declined from 2.12 to 2.04 µg m−3. At rural sites, the simulated mean approached the observed mean despite an increase in absolute error, suggesting a more complex response to the refined inventory.
The clearest improvement occurred at urban sites, where the correlation coefficient increased from 0.40 to 0.53 and MAE decreased from 3.16 to 2.55 µg m−3 (Table 3). Exist-SPE reduced overestimation at HF, lowering the simulated concentration from 9.00 to 6.15 µg m−3 toward the observed 5.44 µg m−3, while alleviating underestimation at XZ, where the simulation increased from 6.62 to 7.56 µg m−3 against the observed 9.60 µg m−3. Similar improvements were observed at KM and TY through reduced overestimation, and through reduced underestimation at HL (Fig. 7a). These corrections demonstrate that refining forest BVOC emissions improved SOA concentrations at receptors beyond forest environments. Despite persistent underestimation at XT, PY, and ZY, RMSE nevertheless decreased from 3.89 to 3.61 µg m−3, and the overall reduction in MAE and RMSE points to improved agreement across individual records despite the continued systematic underestimation.
At rural sites, Exist-SPE increased the simulated mean from 3.82 to 4.12 µg m−3 toward the observed 5.23 µg m−3 (Table 3), however, the response across individual stations was heterogeneous. Underestimation was reduced at TYU (Fig. 7a), whereas it intensified at KP, and overestimation increased at QYZ, resulting in an overall increase in RMSE from 3.45 to 3.83 µg m−3. This divergence indicates that the apparent reduction in group-level bias did not correspond to a consistent improvement across the six rural records.
Background sites encompass a range of environments, including lakeside locations, high plateaus, and high-altitude mountain settings, as well as forest-surrounded sites such as XL and SH. At these stations, Exist-SPE increased the correlation coefficient from 0.54 to 0.63 and reduced RMSE from 2.12 to 2.04 µg m−3 (Table 3), reflecting improved agreement with the observed concentration pattern. However, simulated concentrations at most sites showed limited variation between configurations (Fig. 7a), and an overall underestimation of approximately 45 %–46 % persisted. This limited response suggests that refining forest emission factors alone exerts a weaker influence on SOA concentrations at these receptors, where regional transport and non-forest emission sources likely play a more substantial role. Taken together, these results support species-level refinement as a meaningful improvement to the forest BVOC inventory, evidenced by reduced absolute errors at urban sites and enhanced correlations at both urban and background sites. However, the lack of uniform improvement across all site types underscores the need for further attention to non-forest precursor emissions and to the broader processes governing SOA formation and transport.
The systematic SOA underestimation likely reflects limitations in both precursor emissions and chemical processing. BVOC sources in this inventory are restricted to forests, excluding precursor contributions from croplands, shrublands, and grasslands, whose contribution to the SOA deficit remains unquantified. Within forests themselves, insufficient measurements for certain native tree species may bias the assigned emission factors, though neither the direction nor the magnitude of this bias can currently be established. Chemical uncertainties provide additional plausible explanations. Including both anthropogenic and biogenic precursors does not ensure that their coupled effects on SOA formation are fully represented: anthropogenic pollution can modify biogenic oxidation pathways and promote aerosol formation through sulfate-mediated uptake of isoprene oxidation products (Surratt et al., 2010; Hu et al., 2017). Incomplete treatment of these processes could therefore contribute to underestimation in polluted air masses. Likewise, simplified aqueous-phase pathways could suppress SOA production under conditions favorable for reactive uptake. Li et al. (2019) demonstrated that incorporating dicarbonyl uptake substantially reduced the SOA deficit in a regional simulation over China. Finally, uncertainties in product volatility can alter gas-particle partitioning and SOA evolution during atmospheric aging (Cappa and Wilson, 2012). Incomplete emission coverage and chemical processing limitations shared by both configurations point to a common source of systematic bias that species-level refinement alone cannot resolve.
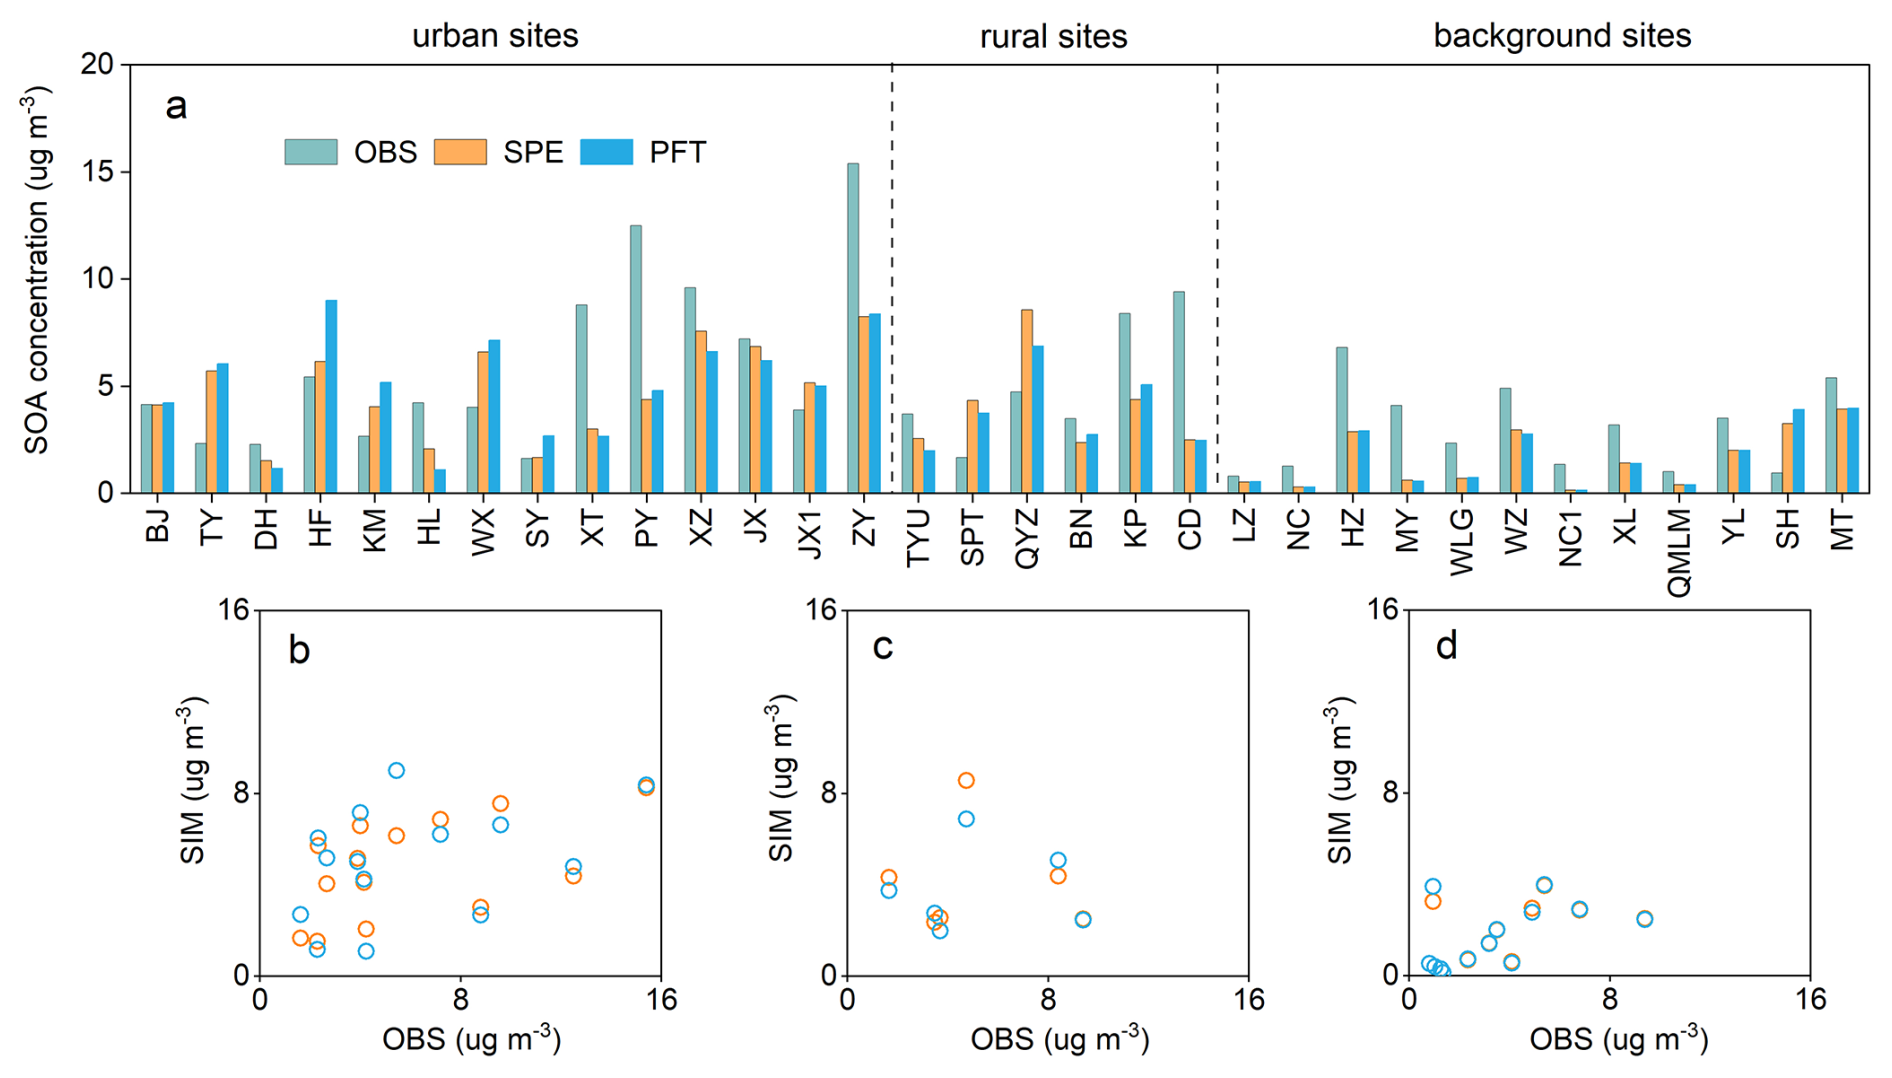
Figure 7Comparison of observed and simulated surface SOA concentrations across China. (a) SOA concentrations at observation sites grouped into urban, rural, and background categories. Green bars indicate observations compiled from previous studies, while yellow and blue bars show concentrations simulated using Exist-SPE and Exist-PFT, respectively. (b–d) Observed versus simulated SOA concentrations at urban (b), rural (c), and background (d) sites. Yellow and blue circles represent Exist-SPE and Exist-PFT simulations, respectively. Observational data were compiled from Ding et al. (2014), Zhang et al. (2024), Zheng et al. (2017), Zhu et al. (2016), Zhang et al. (2018a), Xu et al. (2018), Zhang et al. (2019), Qin et al. (2017), Hu et al. (2016), Hu et al. (2013), Huang et al. (2011), Huang et al. (2013), Du et al. (2015), Li et al. (2020a), Wang et al. (2016a), and Zhang et al. (2018b).
Table 3Evaluation of SOA simulated by Exist-SPE and Exist-PFT inventories against observations at 30 sites (µg m−3).
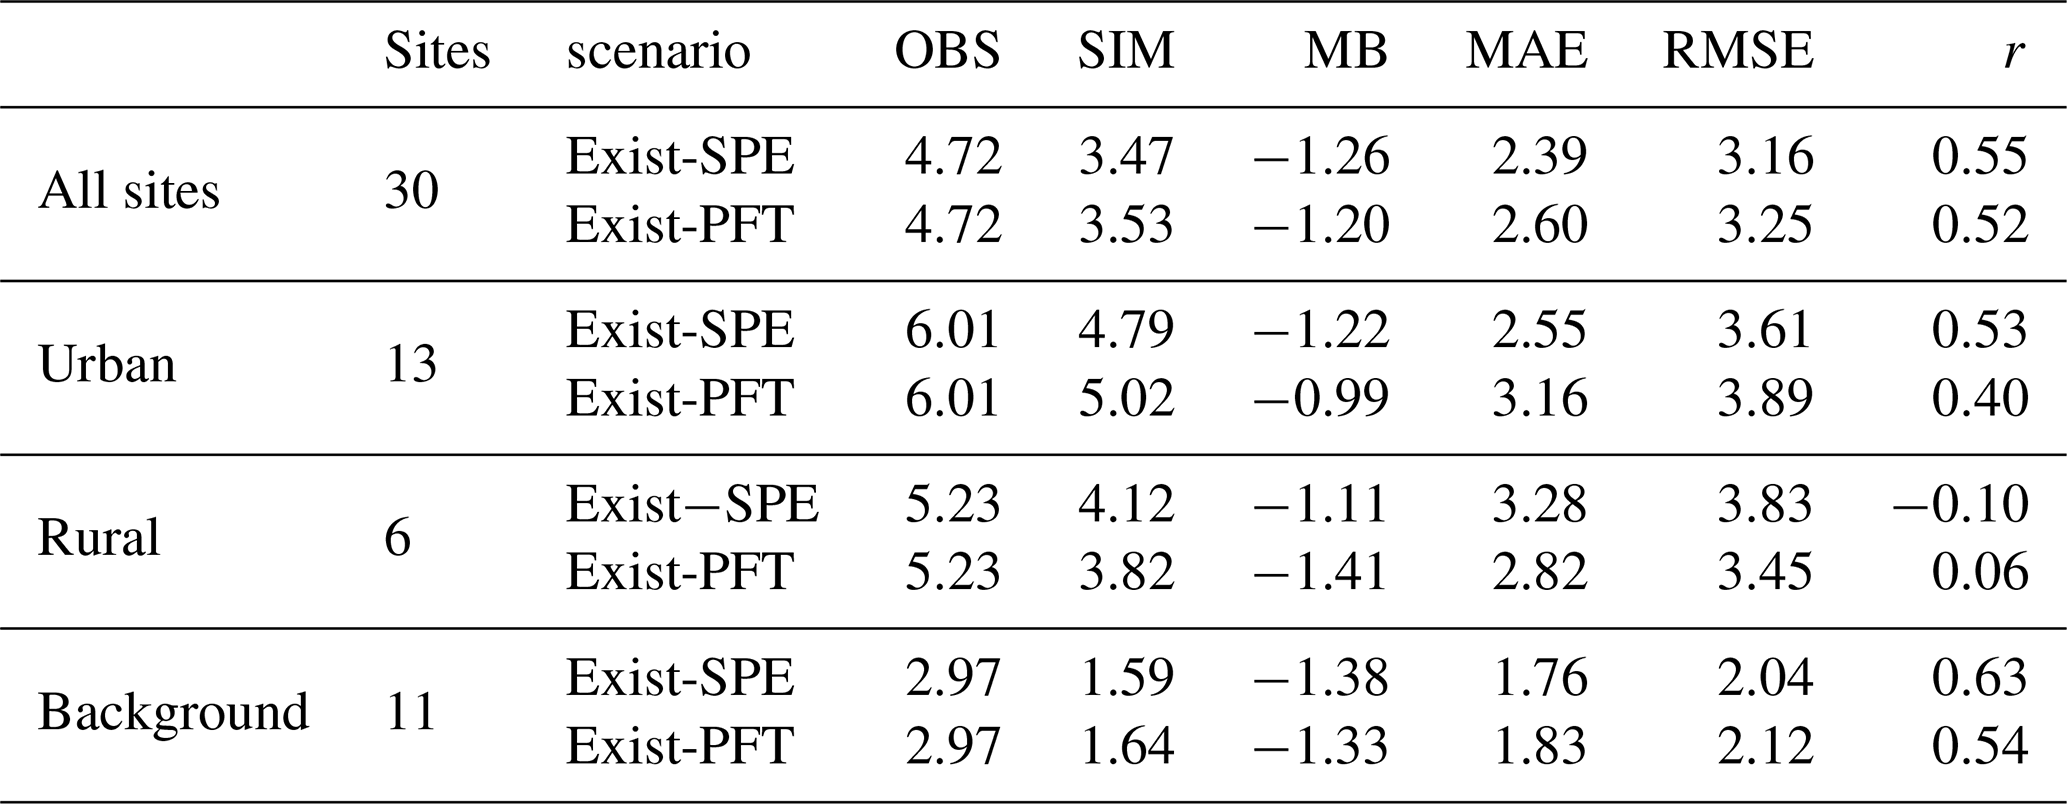
Note: OBS and SIM denote mean observed and simulated concentrations, respectively; MB, MAE, and RMSE denote mean bias, mean absolute error, and root mean square error, respectively; r denotes the Pearson correlation coefficient. All metrics except r are expressed in µg m−3.
3.3 Comparison with PFT-resolved model
Our species-resolved scheme (Exist-SPE) estimated annual BVOC emissions at 30.28 Tg of compound mass in China, consisting of 9.27 Tg isoprene, 7.63 Tg monoterpenes, 0.53 Tg sesquiterpenes and 12.85 Tg other VOC species. Our estimated isoprene emissions fall within the reported range of 5.4–37.5 Tg yr−1 in existing literature, while monoterpene emissions align with the 2.66–7.64 Tg yr−1 range (Table 4; Gao et al., 2025; Cao et al., 2018; Li et al., 2023; Li and Xie, 2014; Wang et al., 2021; Stavrakou et al., 2014; Fu and Liao, 2012; Li et al., 2013; Wu et al., 2020; Ma et al., 2023; Li et al., 2020b; Cao et al., 2024; Wang et al., 2025). Notably, monoterpenes account for 25.2 % of total emissions, exceeding values reported in most studies, which we attribute to the use of species-resolved algorithms (Xi et al., 2025; Li et al., 2025). Previous estimates were predominantly generated by MEGAN2.1 with PFT scheme, though some incorporated satellite-based inverse modeling for top-down constraints. Such PFT-based approaches overlook inter-species variability in emission potentials and thereby systematically bias emission flux estimates. Notably, Gao et al. employed the MEGAN v3 model and provided both national and forest-scale estimates for China, offering a consistent basis for cross-scale evaluation. In national scale, total BVOC emissions in this study align with Gao et al. (29.57 Tg yr−1), with lower isoprene (9.27 vs. 12.56 Tg yr−1) and closer monoterpenes (7.63 vs. 7.64 Tg yr−1) fluxes. Across ecosystem types, forests accounted for 30.8 % of national BVOC emissions (10.26 Tg yr−1), followed by other woodlands (canopy closure < 0.2) contributing 28.1 %, shrublands 17.9 %, grasslands 13.2 %, and croplands 9.8 %. For forests specifically, our results show more monoterpenes emission than those reported by Cao et al. (2024) (isoprene: 3.57 vs. 3.90 Tg yr−1; monoterpenes: 3.12 vs. 1.97 Tg yr−1).
Moreover, incorporating species-specific emission factors refined BVOC estimates for China's forests, with the Exist-SPE yielding total emissions of 10.26 Tg yr−1 in 2019, representing a 16.2 % reduction relative to the Exist-PFT estimate of 12.25 Tg yr−1 (Fig. 8a). This discrepancy was primarily driven by isoprene and monoterpenes, contributing 1.06 and 1.12 Tg yr−1 respectively (Fig. 8b, c), whereas sesquiterpenes accounted for only 0.03 Tg yr−1 given their intrinsically low emission. In contrast, other VOCs were 0.20 Tg yr−1 higher in Exist-SPE than its PFT-based counterpart. Spatially, Exist-PFT exhibited widespread overestimation across most forested regions in China (Fig. 8a). For instance, the average isoprene emission factor for temperate evergreen needleleaf forests is 2.45 nmol m−2 s−1 in Exist-PFT, whereas species-level refinement gives a much lower value of 0.39 nmol m−2 s−1 for the dominant species, e.g., Pinus massoniana. A similar pattern is observed in temperate broadleaf forests, whose emission factor is 40.85 nmol m−2 s−1 in Exist-PFT, largely exceeding the refined value of 18.01 nmol m−2 s−1 for prevalent species such as Quercus mongolica. Underestimation of emission factor in Exist-PFT was confined mostly in southwestern and central-eastern regions. For isoprene specifically (Fig. 8b), underestimation in southwestern China was associated with Quercus liaotungensis stands (species-specific emission factor: 34.0 nmol m−2 s−1 vs. PFT-resolved emission factor: 7.45 nmol m−2 s−1), while in central China, it occurred across Quercus variabilis forests in the northern part of this region (25.0 vs. 12.60 nmol m−2 s−1) and Quercus serrata forests in the central part (25.4 vs. 12.34 nmol m−2 s−1). In eastern China, mixed woodlands comprising Quercus chenii (34.0 nmol m−2 s−1), Quercus serrata (25.4 nmol m−2 s−1), Robinia pseudoacacia (20.0 nmol m−2 s−1), and Quercus glauca (94.7 nmol m−2 s−1) collectively exceeded the Exist-PFT emission factor of 11.50 nmol m−2 s−1. Additionally, Phyllostachys edulis plantations (23.65 nmol m−2 s−1 vs. PFT: 11.50 nmol m−2 s−1) across several provinces reinforced this pattern in southeastern China.
The incorporation of species-level data accentuated the spatial heterogeneity of BVOC emissions, engendering sharper delineations and localized hotspots that mirror the intrinsic disparities among tree species. By comparison, the Exist-PFT simulations projected smoother gradients and seamless transitions, wherein emission intensities varied with latitudinal or climatic gradients. These discrepancies arise from intra-PFT averaging, which conflates species with variable emission factors into a default value, thereby obscuring the impacts of actual vegetation assemblages.
Table 4BVOC emissions in China from previous and this Study (Tg).
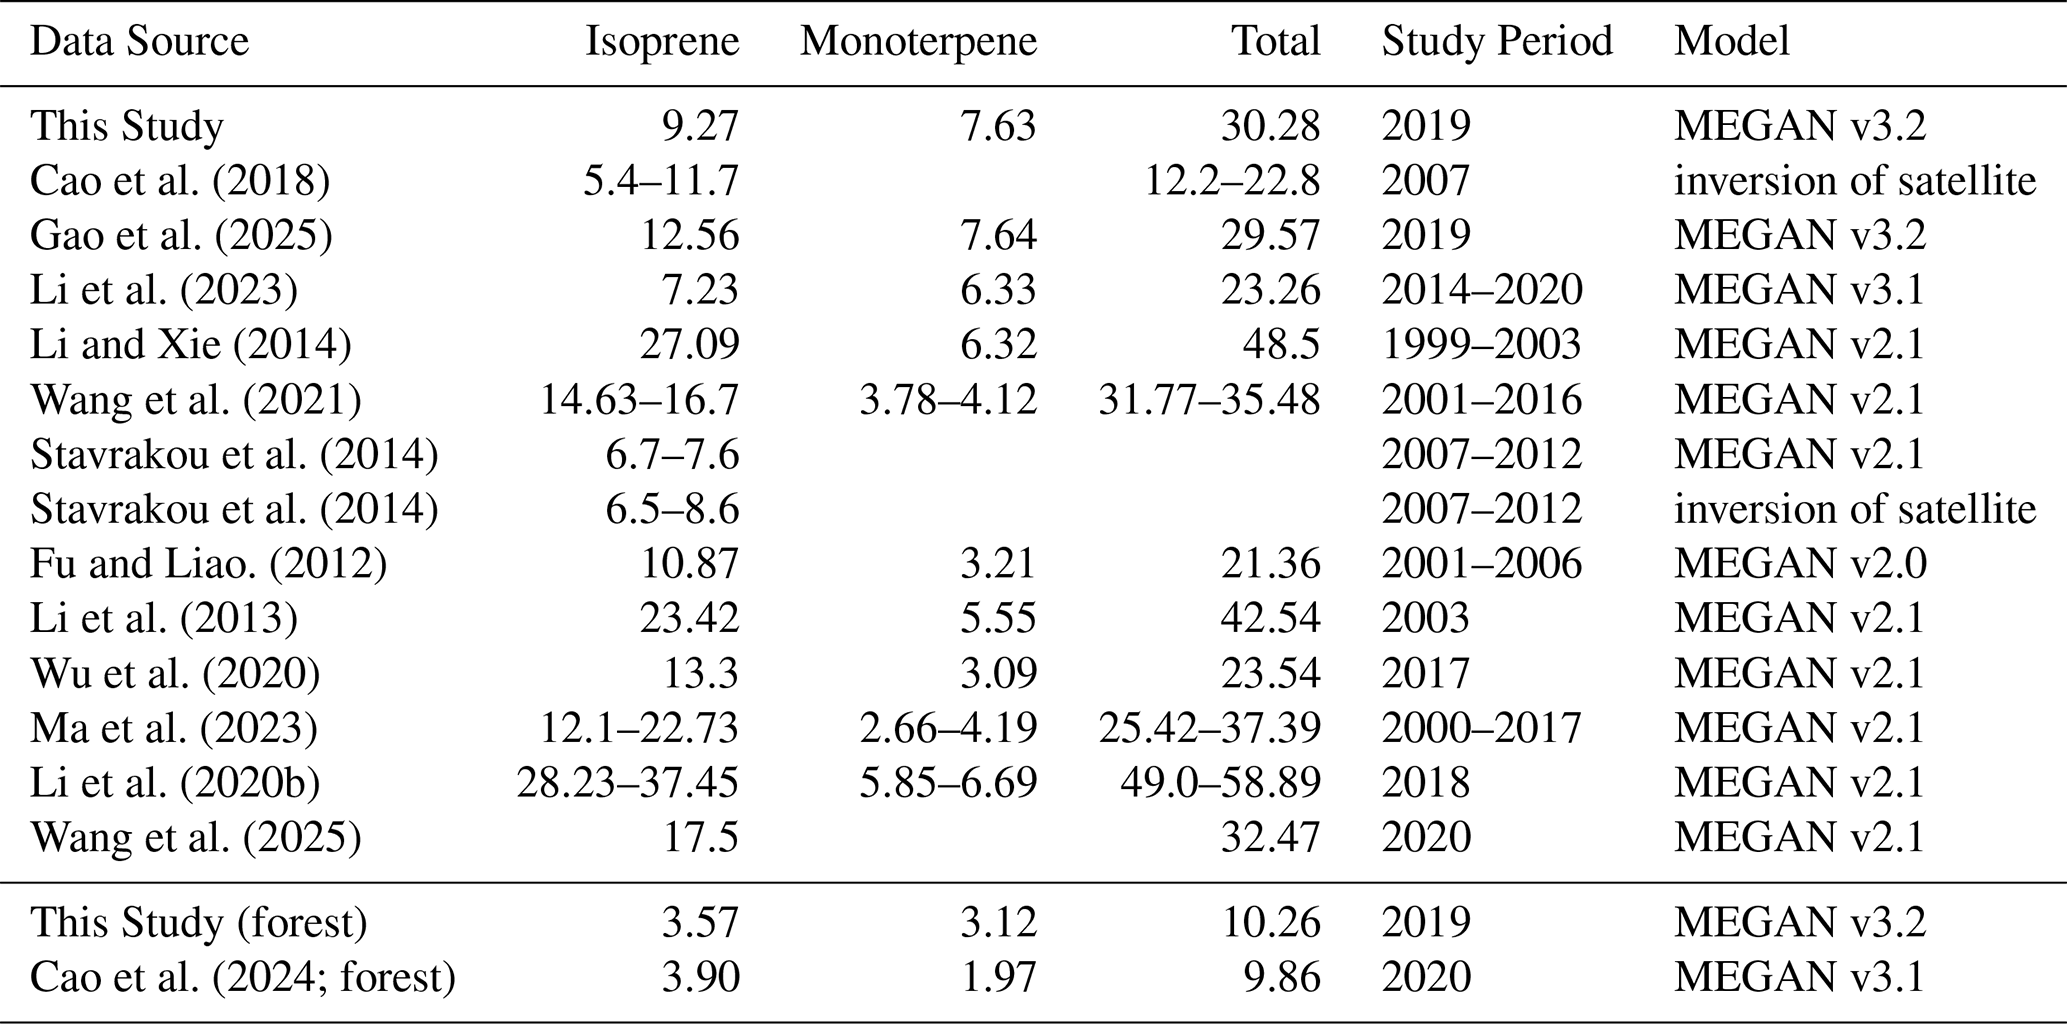
Note Emission estimates from this study are expressed in Tg of compound mass, not Tg C.
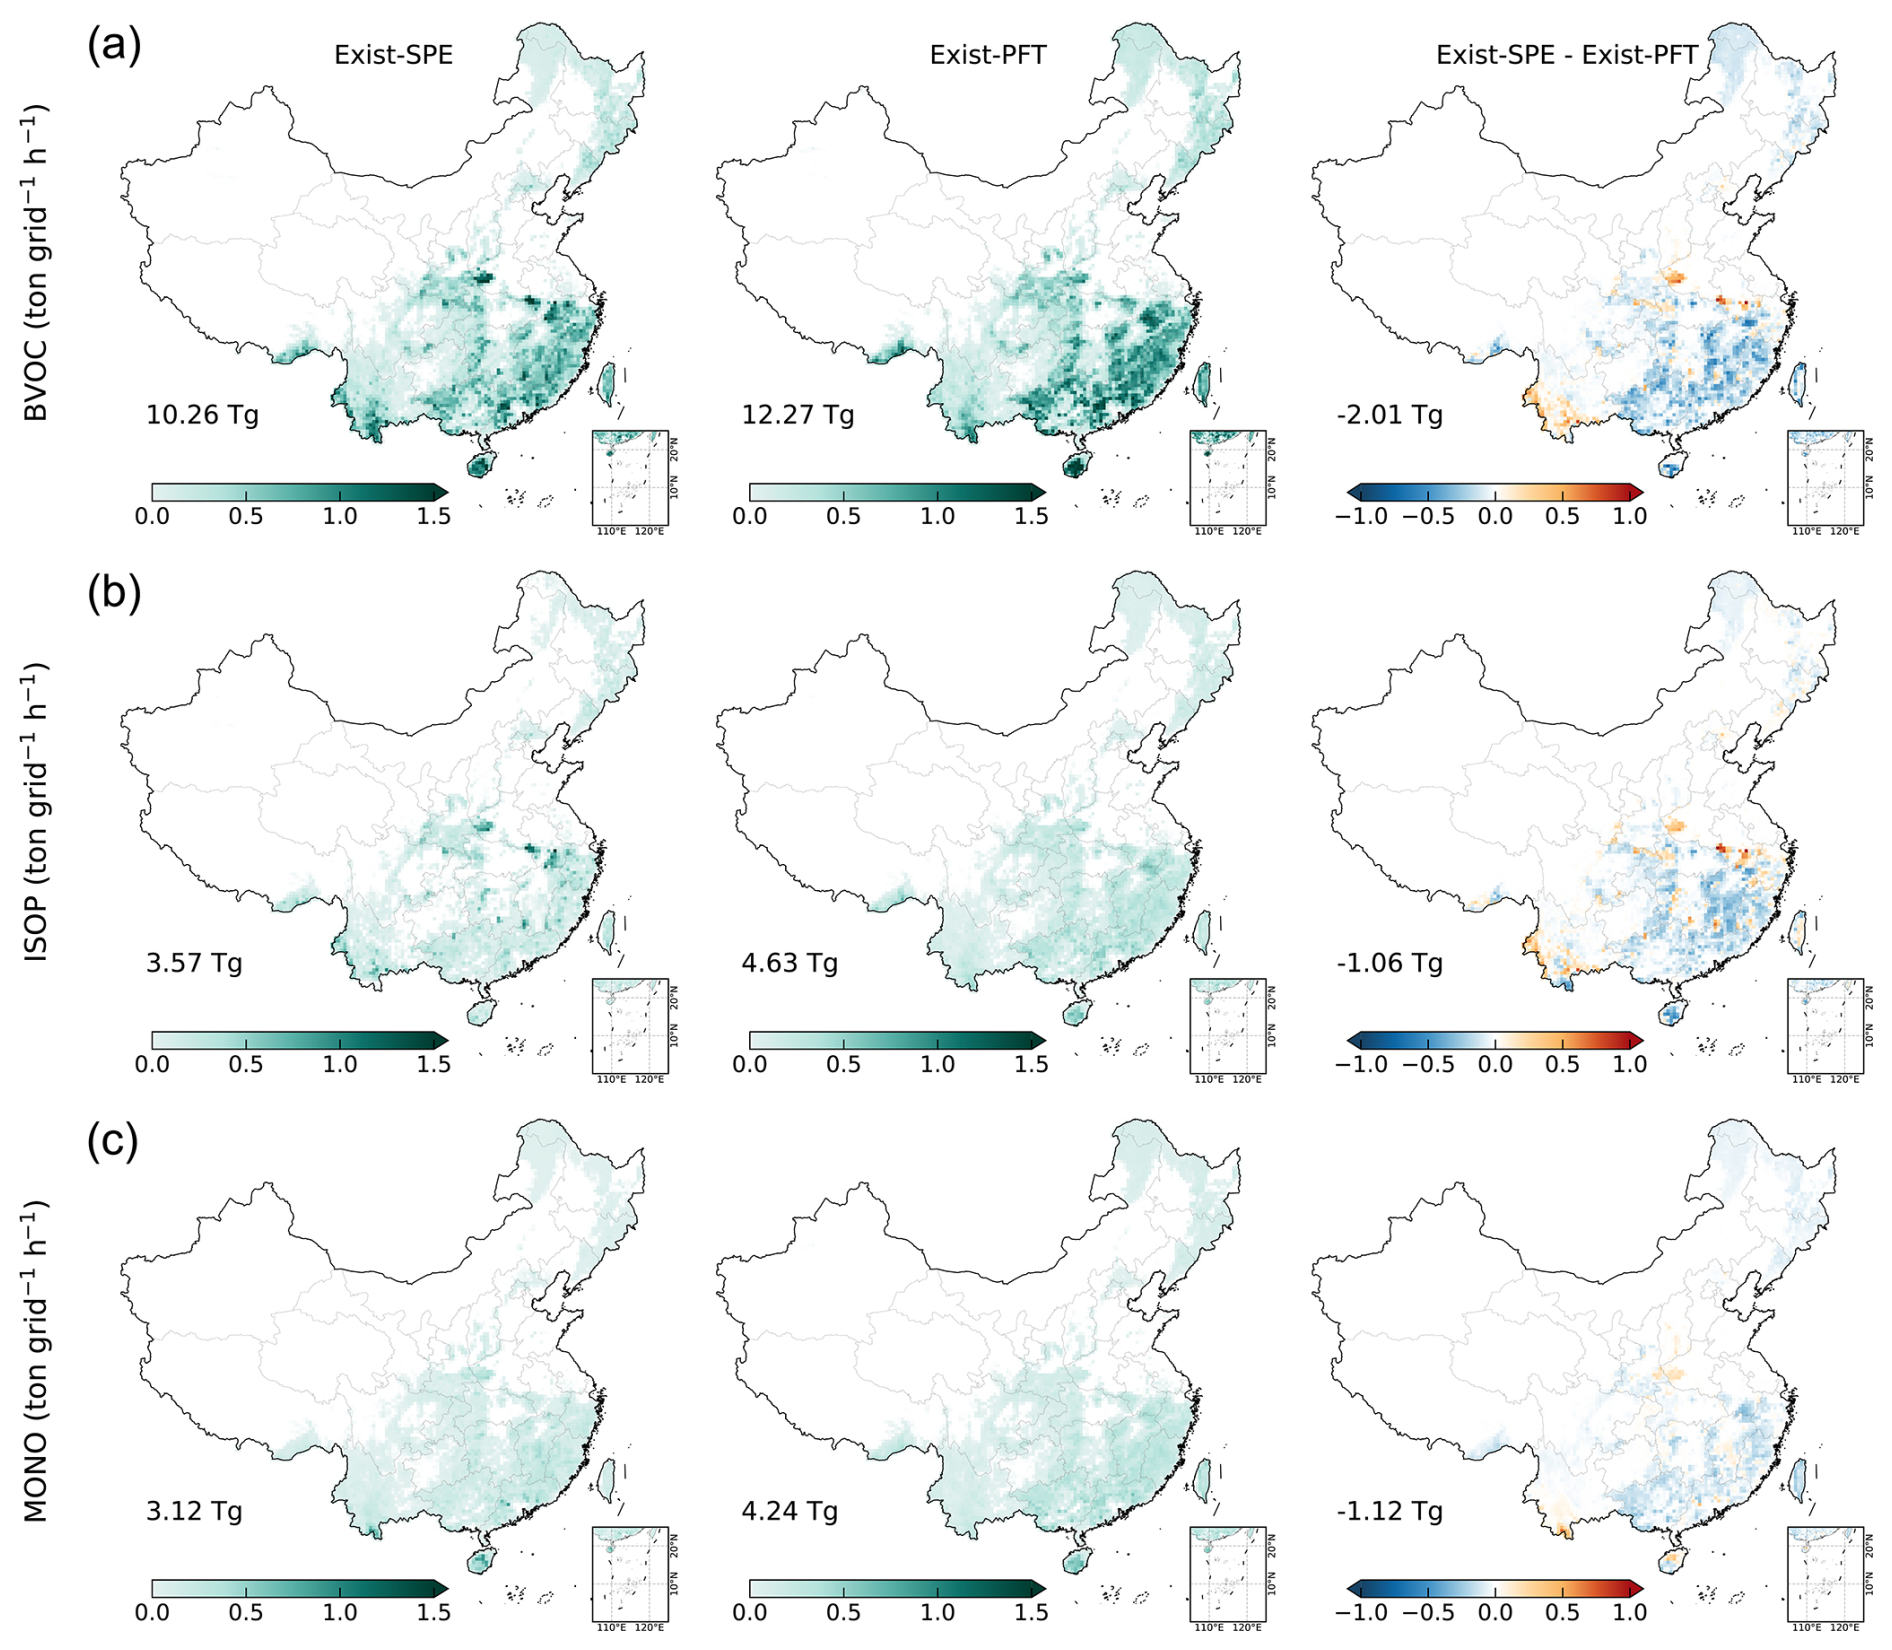
Figure 8Spatial patterns of BVOC emissions in China under species-resolved and PFT-based schemes. Columns 1–3 show the annual mean emissions from the Exist-SPE, the Exist-PFT, and their difference, respectively. Rows 1–3 represent total BVOCs, isoprene, and monoterpenes, respectively. All emission quantities are expressed on a compound-mass rather than carbon-mass basis.
4.1 Characteristics of national BVOC emissions
We developed a high-resolution BVOC emissions inventory of forests in China using our enhanced input data and adjusted model (Liu et al., 2026), integrating spatial distribution with species-level emission factors across 234 tree species (Table B4). The national annual BVOC emissions in 2019 are estimated at 10.26 Tg on a compound-mass basis, which includes 3.57 Tg of isoprene, 3.12 Tg of monoterpenes, 0.18 Tg of sesquiterpenes, and 3.39 Tg of other VOC species (Table 4). Pinus massoniana occupies the most extensive area (19.71 Mha, 10.5 % of total forested coverage; Fig. 9) and serves as the leading contributor to national forest BVOC emissions (1.68 Tg yr−1; 16.4 % of total emissions), primarily through monoterpene and sesquiterpene release (0.95 Tg yr−1).
Spatially, BVOC emissions exhibit a south-to-north decreasing gradient, with the largest source concentrated in the subtropical and tropical regions of southern China (Fig. 8a). In these regions, Pinus massoniana, Quercus liaotungensis, Phyllostachys edulis and Cunninghamia lanceolata are the primary BVOC-emitting species, with a combined planted area of 44.77 Mha and total emissions of 3.94 Tg yr−1, driven largely by dense forest cover, elevated temperatures, and intense solar radiation (Fig. 9). In northeastern China, boreal forests dominated by species such as Quercus mongolica and Larix gmelinii (17.6 Mha), exhibit limited emission due to low temperatures and solar radiation, particularly during the winter. Emissions are also low in the western China, though the underlying constraints differ between subregions. Over the Tibetan Plateau, persistently low temperatures restrict temperature-dependent BVOC synthesis and release (Guenther et al., 2012), while in the arid and semi-arid zones of northwestern China, sparse forest cover reduces the availability of emitting biomass. Together, these distinct climatic and vegetation constraints converge to produce a consistently low-emission regime across western China, in agreement with previous estimates (Cao et al., 2022). This spatial variability highlights the linkage between forest composition, regional climate conditions, and BVOC emission intensity, which together shape the geographic distribution of BVOC emissions.
Seasonally, national BVOC emissions exhibit pronounced temporal dynamics driven by the combined effects of temperature, solar radiation, and leaf area index. Summer (June–August) represents the dominant emission season, accounting for approximately 49.9 % of the total emission under optimal meteorological and phenological phase, followed by autumn (22.7 %, September–November), spring (21.2 %, March–May), and winter (6.3 %, December–February). This seasonal pattern manifests distinctly in the spatial distribution of emissions. During summer, elevated emissions occur across forests nationwide, reflecting broadly favorable growth and metabolic conditions. In winter, emissions from northern forests decline due to low temperatures and leaf senescence, whereas forests south of 35° N, predominantly composed of evergreen species, maintain comparatively high emission rates year-round. These spatiotemporal patterns highlight temperature and solar radiation as key drivers of vegetative metabolic activity, thereby shaping BVOC emission dynamics.
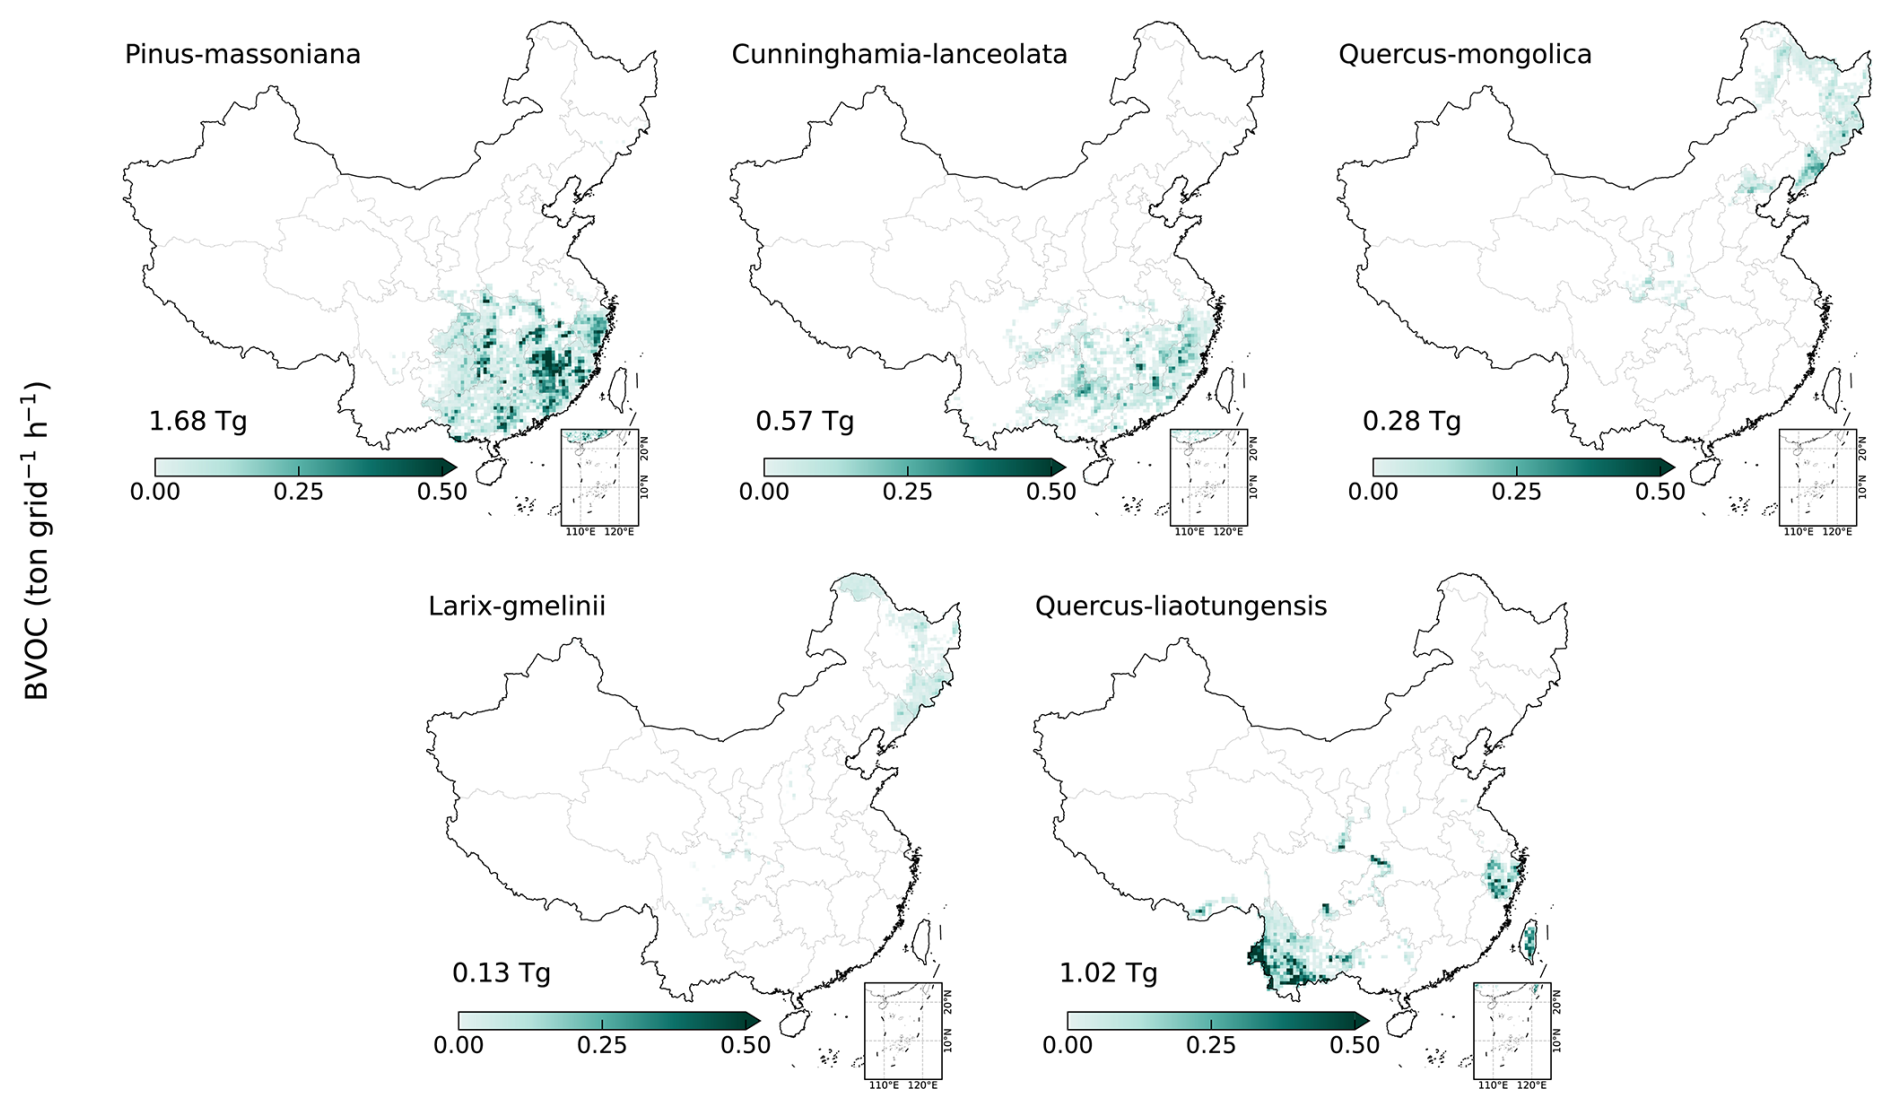
Figure 9Spatial distribution and BVOC emission characteristics of the five most widely distributed tree species in China. The five species ranked by forest area are Pinus massoniana (19.7 Mha), Cunninghamia lanceolata (12.3 Mha), Quercus mongolica (9.0 Mha), Larix gmelinii (8.6 Mha), and Quercus liaotungensis (7.98 Mha). Green shading indicates mean annual BVOC emission rates (ton per grid h−1), and numbers denote total annual emissions (Tg). All emission quantities are expressed on a compound-mass rather than carbon-mass basis.
4.2 BVOC emissions and species contributions
The top five species by area, including Pinus massoniana (19.7 Mha), Cunninghamia lanceolata (12.3 Mha), Quercus mongolica (9.0 Mha), Larix gmelinii (8.6 Mha), and Quercus liaotungensis (7.98 Mha), with these five species collectively account for 30.8 % of China's forest area (Fig. 9), underscoring a concentrated species composition at the national scale. However, tree species dominance in terms of BVOC emissions shows a different pattern. The top five species contributing to national BVOC emissions, e.g., Pinus massoniana (1.68 Tg yr−1), Quercus liaotungensis (1.02 Tg yr−1), Phyllostachys edulis (0.66 Tg yr−1), Cunninghamia lanceolata (0.57 Tg yr−1), and Quercus variabilis (0.34 Tg yr−1), collectively account for 41.7 % of the BVOC emissions while occupying only 25.4 % of the forested area (Fig. 10a). This disparity calls for attention to high-emitting species in forest management and atmospheric modeling, as they occupy a limited forest area yet account for a large fraction of national BVOC budgets. Compound-level contributions demonstrate clear interspecific variability. Pinus massoniana is characterized by a terpene-dominant profile, whereas Quercus liaotungensis and Phyllostachys edulis are strong isoprene emitters, reflecting unique biochemical characteristics inherent to each species. The role of any given species in the national BVOC budget is co-determined by its coverage area, inherent emission capacity, and the environmental context of its distribution, as illustrated by cases discussed below.
Pinus massoniana is the greatest contributor to China's forest BVOCs inventory (Fig. 10a), with total emissions reaching 1.68 Tg yr−1, accounting for 16.4 % of the national forest BVOC emissions, and is characterized by a terpene-dominant emission profile comprising monoterpenes (0.91 Tg yr−1), sesquiterpenes (0.04 Tg yr−1), other BVOCs (0.70 Tg yr−1), and a negligible isoprene contribution (0.03 Tg yr−1). With a distribution covering 19.7 Mha, equivalent to 10.5 % of China's total forest area, Pinus massoniana provides the most extensive spatial coverage for BVOC emissions of any single species in the country (Fig. 9). Additionally, Pinus massoniana possesses inherently high emission rates, with isoprene and monoterpenes fluxes reaching 0.39 and 0.71 nmol m−2 s−1, respectively. As an evergreen conifer without seasonal leaf abscission, Pinus massoniana sustains elevated BVOC fluxes year-round and reaches peak emissions in summer, unlike deciduous species that undergo substantial emission reductions during winter. Collectively, its extensive spatial coverage, favorable climatic setting, and high intrinsic emission capacity establish Pinus massoniana as the dominant contributor to China's national forest BVOC budget. The next two leading emitters are Quercus liaotungensis (1.02 Tg yr−1) and Phyllostachys edulis (0.66 Tg yr−1), both characterized by isoprene-dominant emission profiles. Quercus liaotungensis occurs across 7.98 Mha primarily in southwestern and eastern China (Fig. 10b), driven by a high isoprene flux of 34 nmol m−2 s−1 alongside a minor monoterpenes flux of 0.3 nmol m−2 s−1, yielding isoprene 0.74 Tg yr−1, monoterpenes 0.13 Tg yr−1, sesquiterpenes 0.01 Tg yr−1, and other BVOCs 0.14 Tg yr−1. Phyllostachys edulis, an often overlooked yet key emission source spanning 4.82 Mha in southeastern China (Fig. 10b), exhibiting a strong isoprene emission rate of 23.65 nmol m−2 s−1, with isoprene dominating its emission budget at 0.50 Tg yr−1. Cunninghamia lanceolata (0.57 Tg yr−1) and Quercus variabilis (0.34 Tg yr−1) complete the list of the top five contributors. The role of any given species in the national BVOC budget is co-determined by its coverage area, inherent emission capacity, and the environmental context of its distribution, of which a principle illustrated by Quercus variabilis, which occupies only 2.7 Mha of forested area yet accounts for 0.34 Tg yr−1 of BVOC emissions (Fig. 10b), a contribution driven primarily by its high isoprene emission factor of 25.02 nmol m−2 s−1. By contrast, Larix gmelinii is distributed across 8.56 Mha of northern boreal forest but yields only 0.13 Tg yr−1 of total BVOC emissions (Fig. 9). This disparity arises from its low intrinsic isoprene emission factor (0.04 nmol m−2 s−1) combined with the constraints of unfavorable environmental conditions, where low temperatures and limited solar radiation suppress emission rates.
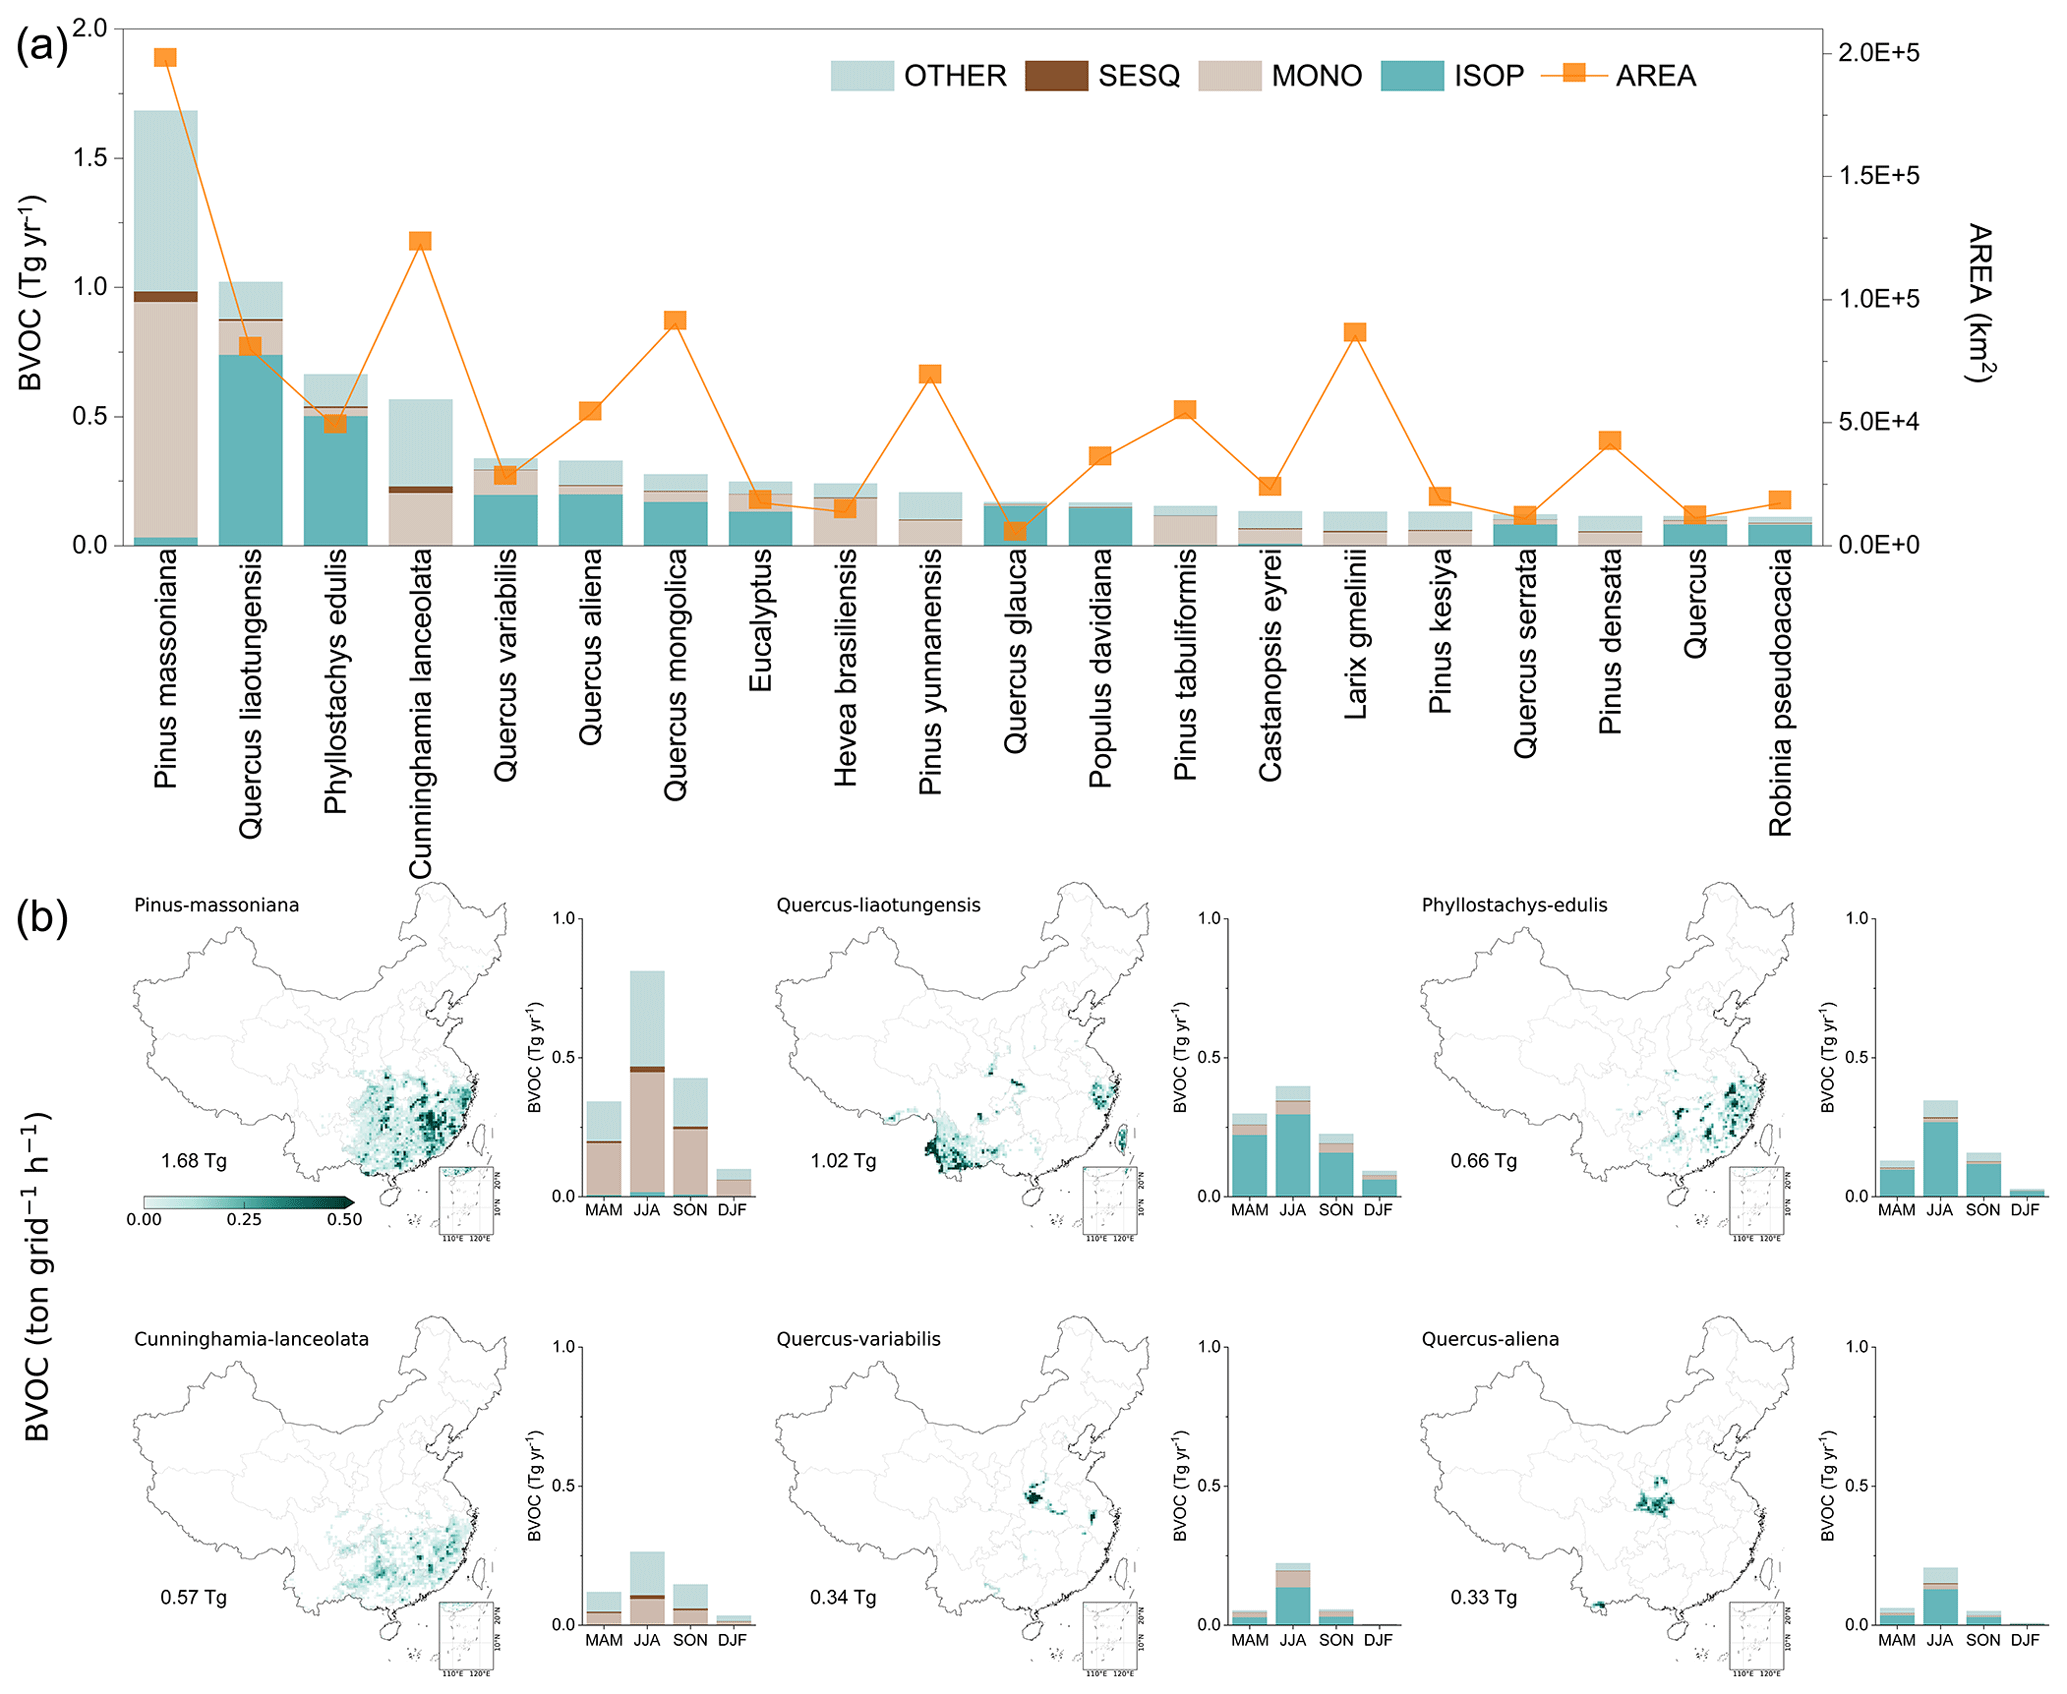
Figure 10BVOC emissions ranking at the tree species level in China. (a) Bar chart ranking the top 20 tree species by total BVOC emissions in 2019 (Tg yr−1), with the yellow line denoting the total canopy coverage area (km2) of each species. (b) Spatial distribution of BVOC emission rates (ton per grid h−1) for the six leading emitters: Pinus massoniana, Quercus liaotungensis, Phyllostachys edulis, Cunninghamia lanceolata, Quercus variabilis, and Quercus aliena, with annotated values representing total annual emissions in 2019 (Tg yr−1). Inset bar charts show seasonal variation in BVOC emissions (Tg) across MAM (March–May), JJA (June–August), SON (September–November), and DJF (December–February). All emission quantities are expressed on a compound-mass rather than carbon-mass basis.
Isoprene emissions across China's forests are dominated by broadleaf tree species. Quercus liaotungensis ranks as the largest contributor (Fig. 11), emitting 0.74 Tg yr−1 (20.7 % of the national isoprene budget) from a distribution area of 7.98 Mha (4.3 % of the national forest area) concentrated in southwestern and eastern China (Fig. 9), driven by a high emission factor of 34 nmol m−2 s−1. Phyllostachys edulis follows closely, contributing 0.50 Tg yr−1 (14.0 %) from 4.82 Mha (2.6 %) across southeastern China, with an emission factor of 23.65 nmol m−2 s−1. Quercus aliena, Quercus variabilis, and Quercus mongolica contribute 0.20 Tg yr−1 (5.6 %), 0.20 Tg yr−1 (5.6 %), and 0.17 Tg yr−1 (4.8 %), respectively, with emission factors ranging from 13.16 to 25.02 nmol m−2 s−1 and distribution areas spanning central and northeastern China. Collectively, these five species account for 1.8 Tg yr−1 of isoprene emissions, representing 50.7 % of the national total (3.57 Tg yr−1; Fig. 11), while occupying only 15.9 % of China's total forest area (187.27 Mha). This striking contrast, with half of the national isoprene budget coming from less than one-sixth of the forest area, highlights the key role of a few high-emitting broadleaf species in shaping China's BVOC emissions.
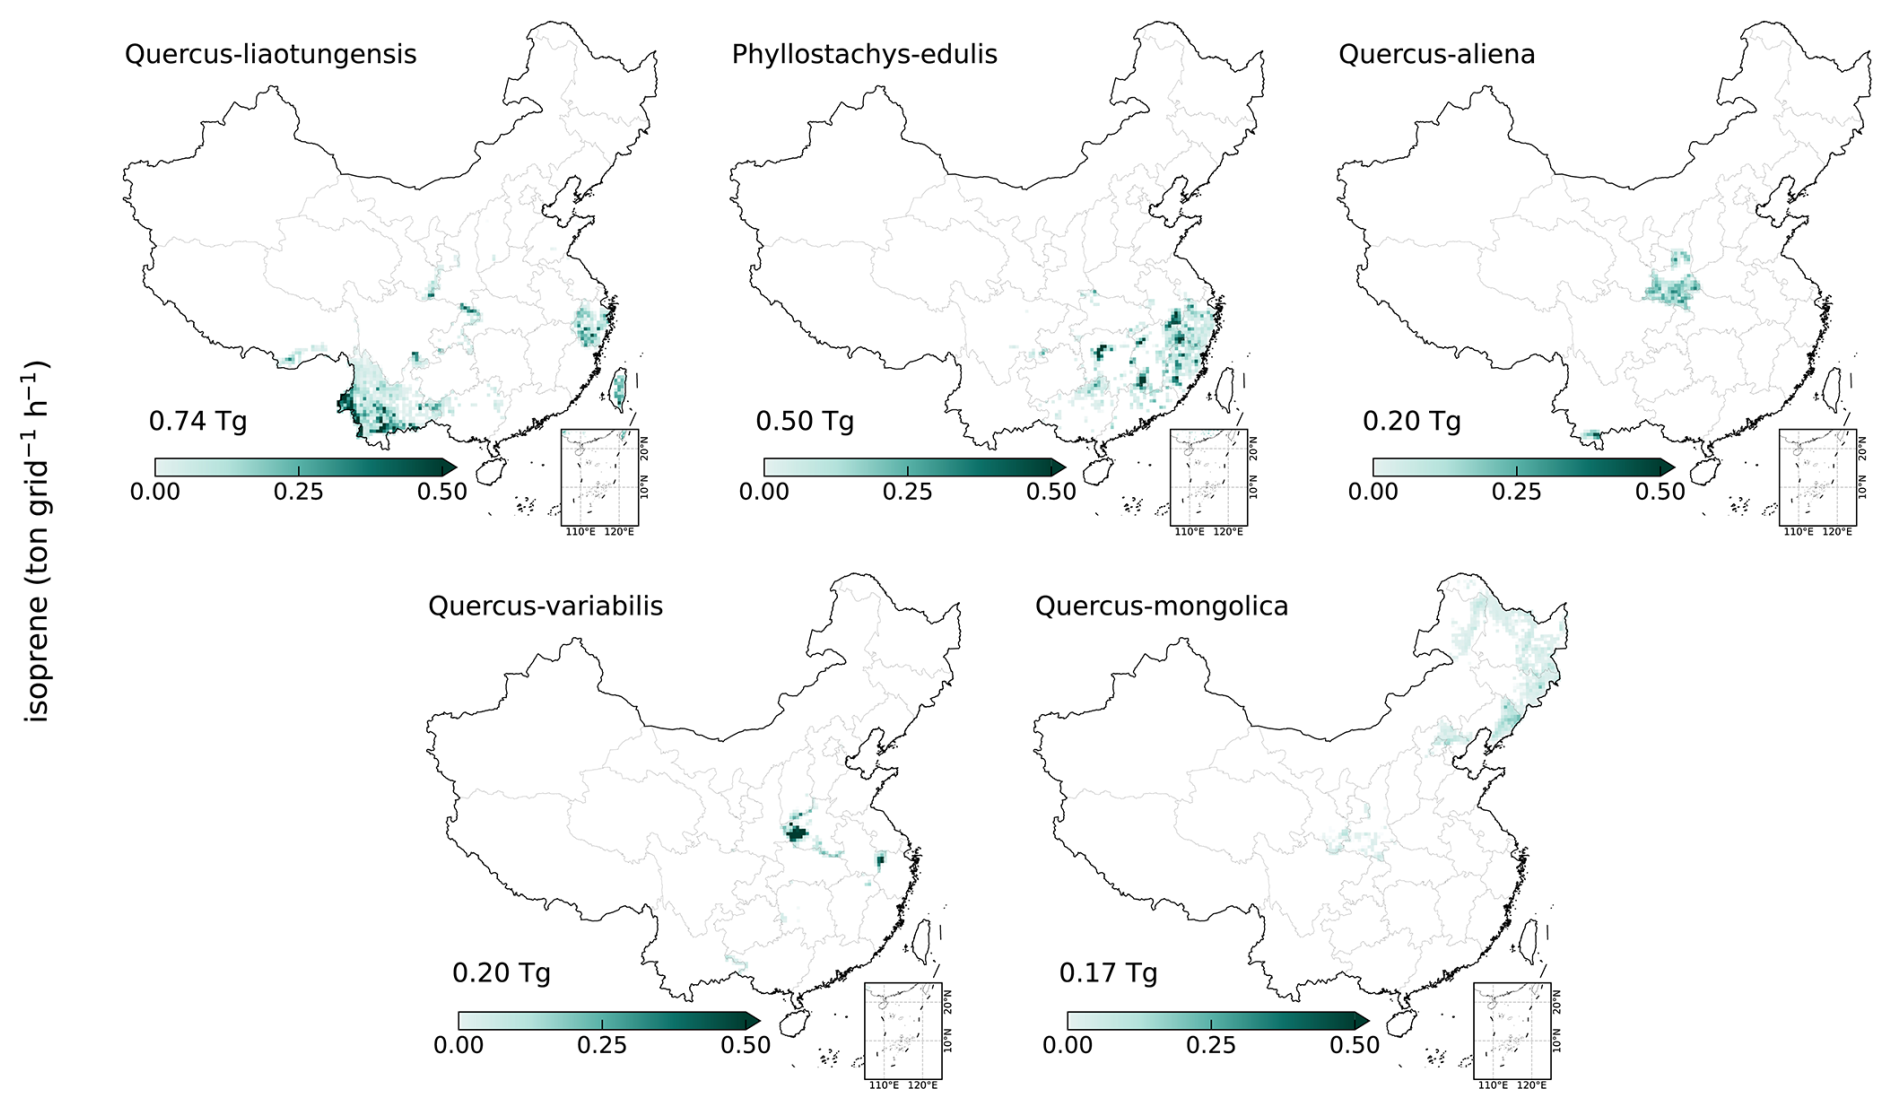
Figure 11Isoprene emission ranking at the tree species level in China. The five leading tree species ranked by isoprene annual emissions are Quercus liaotungensis (0.74 Tg yr−1), Phyllostachys edulis (0.50 Tg yr−1), Quercus aliena (0.20 Tg yr−1), Quercus variabilis (0.20 Tg yr−1), and Quercus mongolica (0.17 Tg yr−1). Green shading indicates isoprene emission rates (ton per grid h−1), and numbers denote annual emissions (Tg). All emission quantities are expressed on a compound-mass rather than carbon-mass basis.
Compared to isoprene, monoterpene emissions are dominated by coniferous species rather than broadleaf species. Pinus massoniana accounts for 0.91 Tg yr−1 (Fig. 12), representing nearly 30 % of the national monoterpene budget, while occupying only 10.5 % of China's total forest area (19.71 Mha) – a contribution enabled by its emission factor of 0.71 nmol m−2 s−1 and the warm, high-radiation conditions of southeastern China. Cunninghamia lanceolata, co-distributed in the same region across 12.26 Mha, contributes a further 0.20 Tg yr−1 (6.5 %), reinforcing the geographic concentration of monoterpene emissions in southern China. Together, these two southeastern conifers represent over one-third of national monoterpene emissions (Fig. 12). Spatial extent alone is insufficient to explain monoterpene emissions among tree species. Although Hevea brasiliensis occupies only a small area of 1.37 Mha in tropical southern China, its high monoterpene emission factor of 2.22 nmol m−2 s−1, results in a total emission (0.18 Tg yr−1) comparable to that of Cunninghamia lanceolata, which distributes across nearly nine times the area (0.20 Tg yr−1; 12.26 Mha). Pinus tabuliformis contributes 0.11 Tg yr−1 (3.6 %) from 5.41 Mha with an emission factor of 1.66 nmol m−2 s−1. Collectively, these five species emit 1.53 Tg yr−1, accounting for 49.4 % of the national monoterpene emissions while covering 24.8 % of China's forest area (Fig. 12). Monoterpene budgets are governed primarily by conifers with high intrinsic terpene biosynthesis capacity, in contrast to the broadleaf and bamboo-dominated isoprene budget. This contrast underscores the necessity of compound-specific, species-resolved approaches in national BVOC inventory construction.
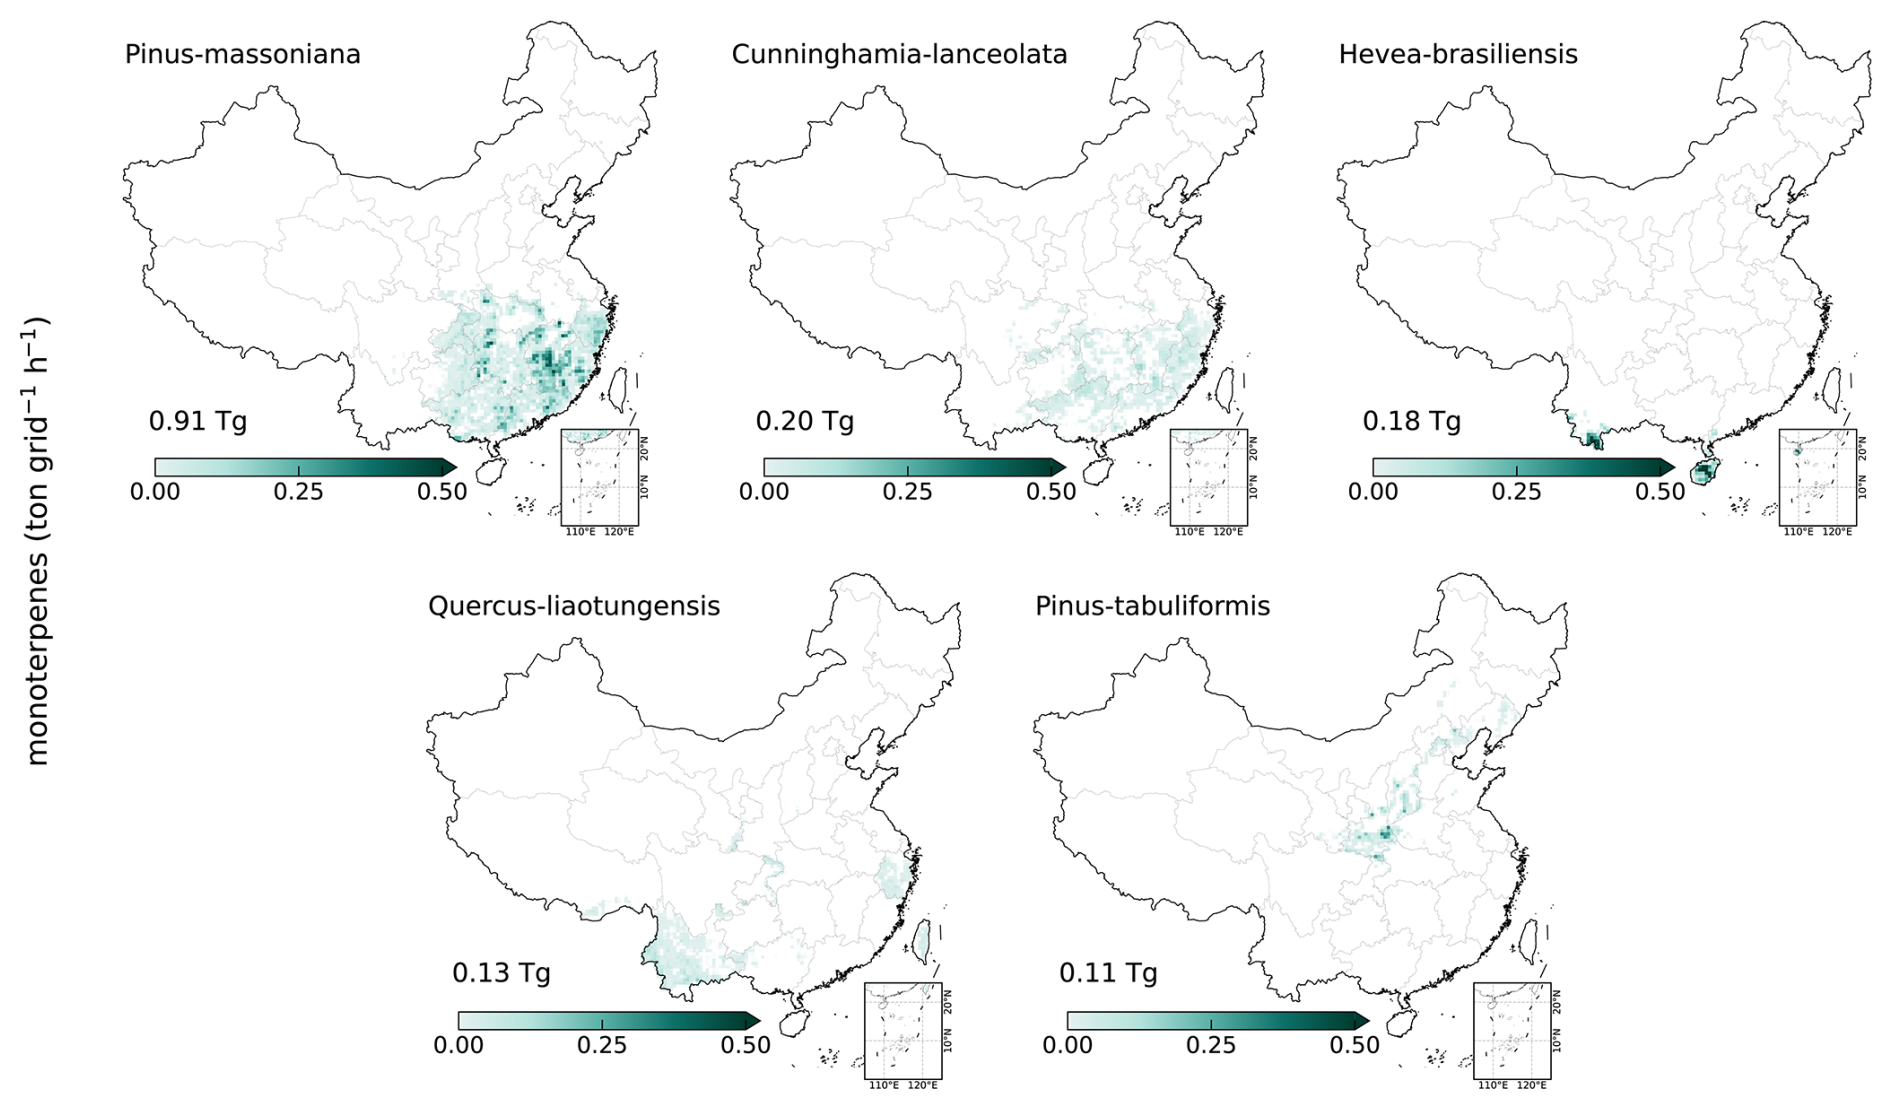
Figure 12Monoterpene emissions ranking at the tree species level in China. The five leading tree species ranked by monoterpene annual emissions are Pinus massoniana (0.91 Tg yr−1), Cunninghamia lanceolata (0.20 Tg yr−1), Hevea brasiliensis (0.18 Tg yr−1), Quercus liaotungensis (0.13 Tg yr−1), and Pinus tabuliformis (0.11 Tg yr−1). Green shading indicates monoterpene emission rates (ton per grid h−1), and numbers denote annual emissions (Tg). All emission quantities are expressed on a compound-mass rather than carbon-mass basis.
4.3 Seasonal patterns of BVOC emissions
Seasonal variability in China's forest BVOC emissions is primarily governed by the differential responses of dominant tree species to temperature and solar radiation across seasons. During summer (Fig. 13), the five largest contributors to BVOC emissions are Pinus massoniana (0.81 Tg), Quercus liaotungensis (0.40 Tg), Phyllostachys edulis (0.35 Tg), Cunninghamia lanceolata (0.26 Tg), and Quercus variabilis (0.22 Tg), a ranking that mirrors the annual order given summer's dominant contribution to the yearly total. This consistency reflects the convergent influence of spatial coverage, intrinsic emission capacity, and climatic conditions. Specifically, evergreen conifers such as Pinus massoniana and Cunninghamia lanceolata sustain continuous BVOCs biosynthesis year-round, attaining highest emission rates when temperatures and solar radiation peak in summer. Meanwhile, isoprene-dominant deciduous species such as Quercus liaotungensis, Phyllostachys edulis, and Quercus variabilis reach peak emissions in summer, when leaf area reach seasonal maximum and high temperatures together with intense solar radiation stimulate isoprene biosynthesis.
In winter (Fig. 13), Pinus massoniana and Quercus liaotungensis remain the two largest contributors, yet their emissions decline by 87.7 % and 77.5 % relative to summer, falling to 0.10 and 0.09 Tg, respectively. Notably, Hevea brasiliensis, a minor contributor in summer (0.07 Tg), rises to the third largest emitter nationwide in winter (0.04 Tg). The low-latitude distribution of Hevea brasiliensis in tropical southern China experiences persistently high temperatures and solar radiation that sustain enzymatic and photosynthetic activity throughout winter, allowing temperature-dependent BVOC synthesis to continue whereas emissions from high-latitude species decline. As an evergreen species, Hevea brasiliensis retains an active canopy throughout the year, in contrast to deciduous species, which shed their foliage during the dormant season. Given the close coupling between leaf biomass and BVOC output, this sustained foliar activity enables emissions to persist at levels unattainable by deciduous competitors in winter. These climatic and phenological factors together account for the disproportionate importance of low-latitude southern China as a winter BVOC source, despite the overall decline in national emissions. Examining the full annual emission cycle of individual species could further illustrate this latitudinal contrast. Temperate species north of 35° N exhibit pronounced seasonal variation, as exemplified by Quercus variabilis, which allocates 66.0 % of annual emissions to summer but only 1.4 % to winter. By contrast, subtropical species such as Hevea brasiliensis show a more uniform seasonal distribution (spring 30.4 %, summer 30.7 %, autumn 23.3 %, winter 15.6 %), indicating that lower-latitude climatic conditions sustain BVOC emissions across seasons.
This latitudinal contrast is echoed at the functional-group level when species are stratified by leaf habit (Fig. 14). In summer, emissions from evergreen and deciduous species are comparable, reaching 2.68 and 2.44 Tg, respectively. In winter, emissions decline to 0.41 Tg for evergreen species and 0.23 Tg for deciduous species, corresponding to reductions of 84.7 % and 90.6 % (Fig. 14). Consequently, the evergreen contribution to total forest BVOC emissions increases from 52.3 % in summer to 64.1 % in winter. The steeper decline among deciduous species is consistent with seasonal leaf senescence and abscission, which reduce emitting leaf area in addition to the effects of lower temperature and light availability. Evergreen species retain foliage through winter, allowing continued emissions where climatic conditions remain favorable, particularly in southern China; nevertheless, their substantial winter decline indicates that foliage retention alone does not sustain summer-level emission rates. Together, these contrasting responses suggest that vegetation phenology, in conjunction with temperature and light availability, contributes to the pronounced seasonal cycle observed at the national scale.
A clear seasonal shift is imprinted on emission composition. Isoprene constitutes 37.4 % of seasonal BVOCs in summer but falls to 26.1 % in winter, whereas monoterpenes rise from 28.4 % to 37.2 %. Two primary factors contribute to this compositional divergence. Isoprene biosynthesis, proceeding via the methylerythritol phosphate pathway, exhibits higher sensitivity to both light intensity and leaf temperature than monoterpene synthesis, leading to greater production under summer conditions. In parallel, deciduous broadleaf isoprene emitters such as Quercus variabilis (EF: 25.02 nmol m−2 s−1) further amplify this seasonal divergence. In summer (Fig. 13), developed leaf area combined with peak photosynthetic activity boosts isoprene production, whereas in winter, leaf abscission limits its isoprene flux, reducing the isoprene fraction of the seasonal emission.
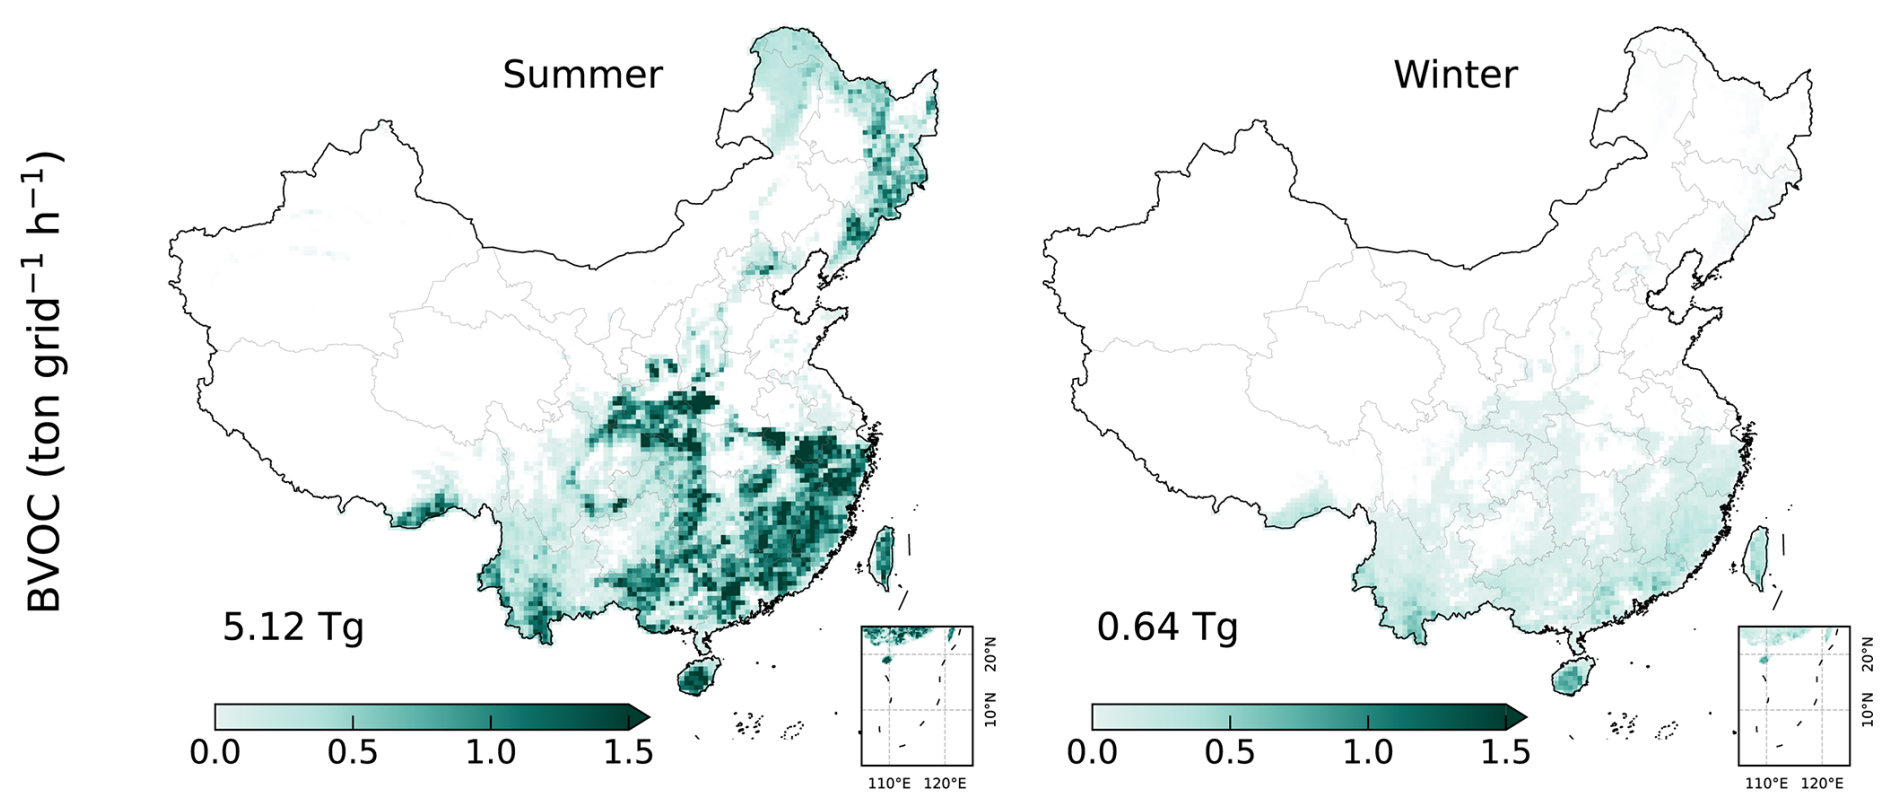
Figure 13Spatial distribution of BVOC emissions from forests in China during summer and winter. Green shading indicates gridded BVOC emission rates (ton per grid h−1), with seasonal emissions reaching 5.12 Tg during summer (JJA) and 0.64 Tg during winter (DJF), reflecting the strong seasonal contrast driven by temperature and radiation conditions across China's forest ecosystems. All emission quantities are expressed on a compound-mass rather than carbon-mass basis.
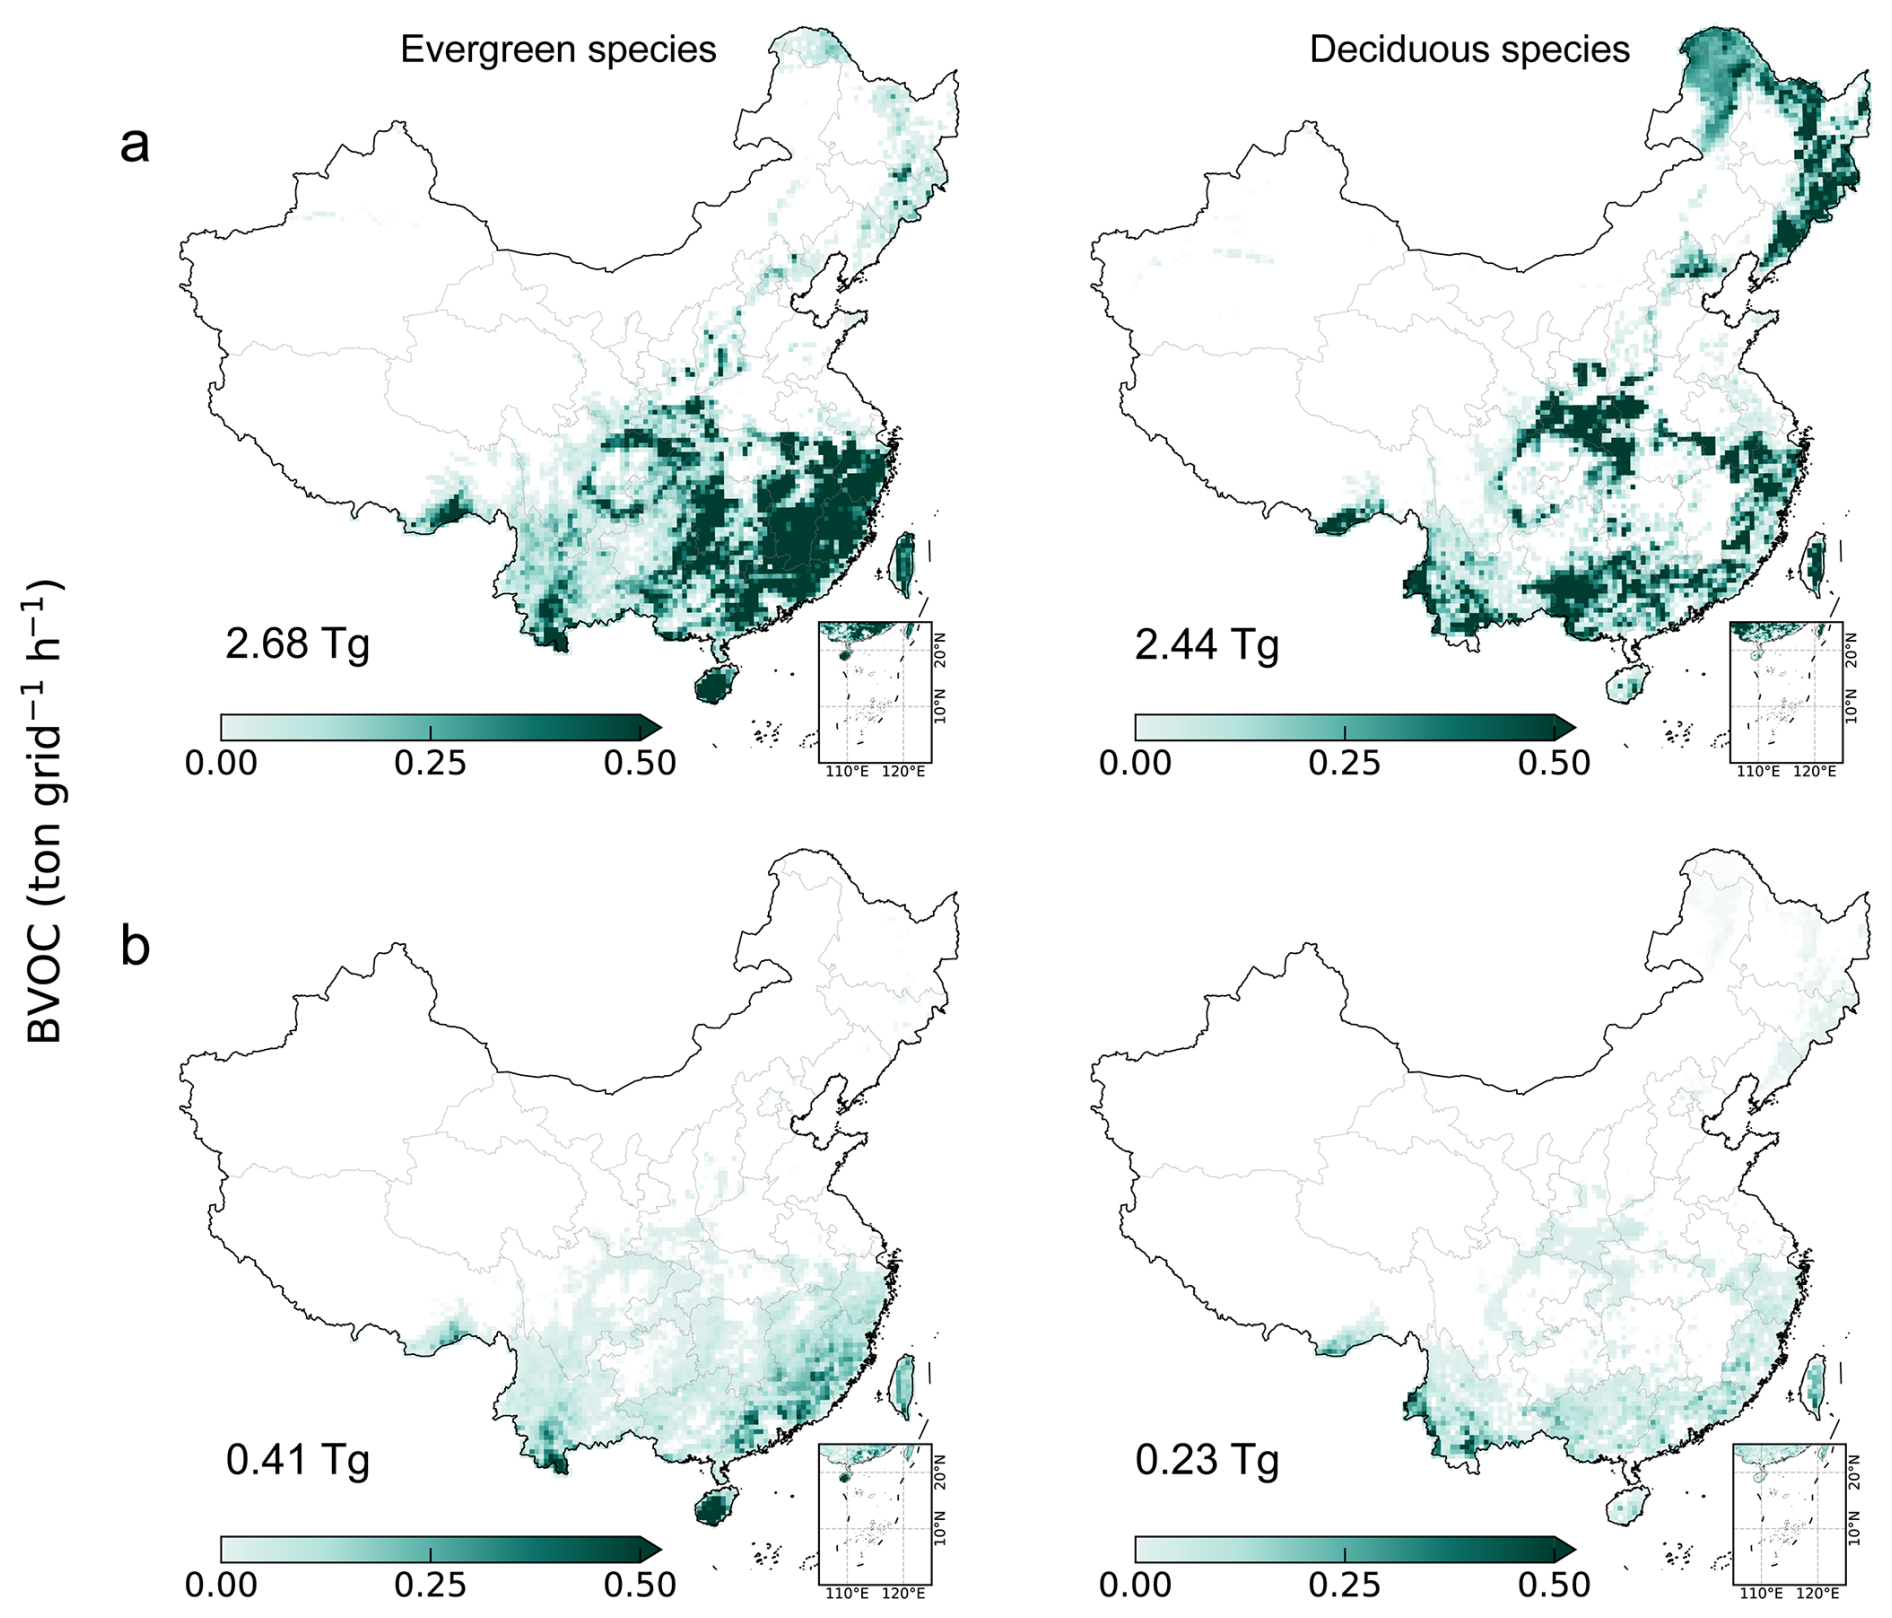
Figure 14Spatial distribution of BVOC emissions from evergreen and deciduous forests in China during summer and winter. Green shading indicates gridded BVOC emission rates (ton per grid h−1) for (a) summer (JJA) and (b) winter (DJF), illustrating the contrasting seasonal emission patterns between evergreen and deciduous forest types across China. All emission quantities are expressed on a compound-mass rather than carbon-mass basis.
Tree-species selection shapes the chemical composition of afforestation-induced BVOC emissions. Across an identical planting footprint of 78 Mha, contrasting forestation priorities fundamentally diverge the national chemical budget: biomass maximization (BIO) induces an isoprene-dominated emission surge, whereas highest environmental suitability (HIGH) triggers a monoterpene-dominated shift. This divergence demonstrates that tree species selection acts as an atmospheric lever, inherently dictating whether future afforestation promotes isoprene- or monoterpene-dominated photochemical regimes.
5.1 BIO scenario
In the BIO scenario, the 78 Mha area designated for A&R is converted to plantation forests optimized for biomass accumulation, driving a national BVOC emission increment of 4.65 Tg yr−1 (Fig. 15), which marks a 45.3 % increase compared to the existing forests (10.26 Tg yr−1). This incremental emission consists of isoprene at 1.72 Tg yr−1, monoterpenes at 1.29 Tg yr−1, sesquiterpenes at 0.08 Tg yr−1, and other VOCs at 1.55 Tg yr−1. The BIO plantations are dominated by deciduous broadleaf forests concentrated in southeastern China (35.7 %) and evergreen broadleaf forests in the southwestern region (31.8 %). The five most extensively planted species including Cunninghamia lanceolata (8.65 Mha; Fig. A1), Quercus aquifolioides (8.43 Mha), Camellia sinensis (4.70 Mha), Juglans (3.20 Mha), and Castanopsis delavayi (2.65 Mha) collectively account for 35.7 % of the A&R area (78 Mha). Although Cunninghamia lanceolata covers the largest area (10.9 %), it is not the dominant emitter of BVOCs, primarily due to low emission rates for isoprene (0.01 nmol m−2 s−1) and monoterpenes (0.33 nmol m−2 s−1).
Among all planted species in the BIO scenario, Quercus aquifolioides, concentrated predominantly in southwestern China across 8.43 Mha, emerges as the single largest contributor at 0.47 Tg yr−1 (Fig. A2), with isoprene accounting for approximately 69.4 % and monoterpenes for 14.7 %. In contrast, Cunninghamia lanceolata – the most widely planted species at 8.65 Mha across southern China – contributes 0.37 Tg yr−1 and ranks second overall (Fig. A2), consistent with its low emission factors (isoprene: 0.01 nmol m−2 s−1; monoterpenes: 0.33 nmol m−2 s−1). Quercus liaotungensis (Fig. A2), despite occupying only 1.84 Mha, contributes total emissions of 0.34 Tg yr−1 (isoprene: 0.25 Tg yr−1; monoterpenes: 0.04 Tg yr−1), attributable to its high leaf-level emission factors for isoprene (34 nmol m−2 s−1) and monoterpenes (0.3 nmol m−2 s−1).
From a spatial perspective, the incremental BVOC emissions following BIO scenario exhibit regional heterogeneity, with high-emission hotspots concentrated in southwestern and southern China (Fig. 15). This pattern is governed by the spatial distribution of high-emitting species. The southwestern hotspot reflects the spatial coincidence of extensive Quercus aquifolioides plantations (8.43 Mha) with meteorological conditions favorable for BVOC release. Its high, isoprene-dominated emission profile is further amplified by the region's summer warmth and high irradiance, which elevate the temperature- and light-dependent activity factors in MEGAN and translate its intrinsic capacity into elevated realized fluxes across the planted area. Planting extent thus determines where this source is located, while species-specific emission capacity and local meteorology jointly determine its intensity. South-central China constitutes another major emission center, where mixed deciduous broadleaf forests dominated by Quercus contribute to regional BVOC fluxes. Further south, tropical southern China emerges as a localized hotspot, attributable to the deployment of other deciduous broadleaf forest types with comparatively elevated emission capacities (12 nmol m−2 s−1 of isoprene; 0.3 nmol m−2 s−1 of monoterpenes).
5.2 HIGH scenario
The HIGH scenario prioritizes needleleaf and mixed forest types selected for ecological resilience, with afforestation designed to optimize species-environment matching. This strategy results in a national BVOC emission increase of 5.10 Tg yr−1 (Fig. 15), comprising isoprene (1.21 Tg yr−1), monoterpenes (1.99 Tg yr−1), sesquiterpenes (0.09 Tg yr−1), and other VOCs (1.81 Tg yr−1). In contrast to the BIO scenario, monoterpenes become the dominant component, indicating that the compositional shift arises from the forest-type configuration and associated species assemblages. Warm Pinaceae forests constitute the largest share (17.5 %), followed by other deciduous broadleaf forests (16.8 %), Betula-Populus forests (11.6 %), and Pinus massoniana forests (9.40 %), collectively distributed across the 78 Mha afforestation area. At the species level, conifers dominate the five most extensively planted taxa (Fig. A3): Pinus yunnanensis (8.91 Mha), Pinus massoniana (7.32 Mha), Pinus tabuliformis (4.05 Mha), and Pinus armandii (3.23 Mha), with Betula platyphylla (4.09 Mha) as the primary broadleaf counterpart.
The resulting emission structure is governed by the combined effects of species-specific emission factors and regional climatic conditions. Among all planted species in the HIGH scenario, Pinus massoniana, widely distributed in southeastern China, emerges as the largest BVOC contributor (0.76 Tg yr−1; Fig. A4), with emissions dominated by monoterpenes (0.43 Tg yr−1), reflecting both high emission factors (isoprene: 0.39 nmol m−2 s−1; monoterpenes: 0.71 nmol m−2 s−1) and the warm climatic conditions that sustain elevated BVOC biosynthesis. In contrast, Pinus yunnanensis occupies a larger planted area than Pinus massoniana (8.91 versus 7.32 Mha) yet yields lower total BVOC emissions (0.56 versus 0.76 Tg yr−1), reflecting the combined influence of species-specific and climatic constraints. Its monoterpene emission factor is 37.0 % lower than that of Pinus massoniana (0.45 versus 0.71 nmol m−2 s−1; Table B4), indicating a reduced intrinsic emission capacity. This is compounded by its concentration in cooler, high-elevation habitats, where lower ambient temperatures attenuate monoterpene synthase activity and reduce precursor vapor pressure, thereby suppressing both de novo biosynthesis and volatilization (Fischbach et al., 2000; Komenda and Koppmann, 2002). Together, these physiological and climatic constraints outweigh the effect of its larger planted area, resulting in a net emission deficit relative to Pinus massoniana. Meanwhile, Eucalyptus ranks third (0.41 Tg yr−1), with emissions dominated by isoprene (0.22 Tg yr−1), driven by a high isoprene emission factor (16 nmol m−2 s−1), thereby decoupling emission contribution from planted area. Under the HIGH scenario, emission hotspots are concentrated in south-central and tropical southern China (Fig. 15). In south-central China, Liquidambar formosana plantations generate elevated isoprene fluxes, whereas in tropical southern China, extensive Eucalyptus plantations (1.91 Mha) produce 0.29 Tg yr−1, supported by an isoprene emission factor reaching 16 nmol m−2 s−1 and favorable tropical climatic conditions, forming a secondary emission center.
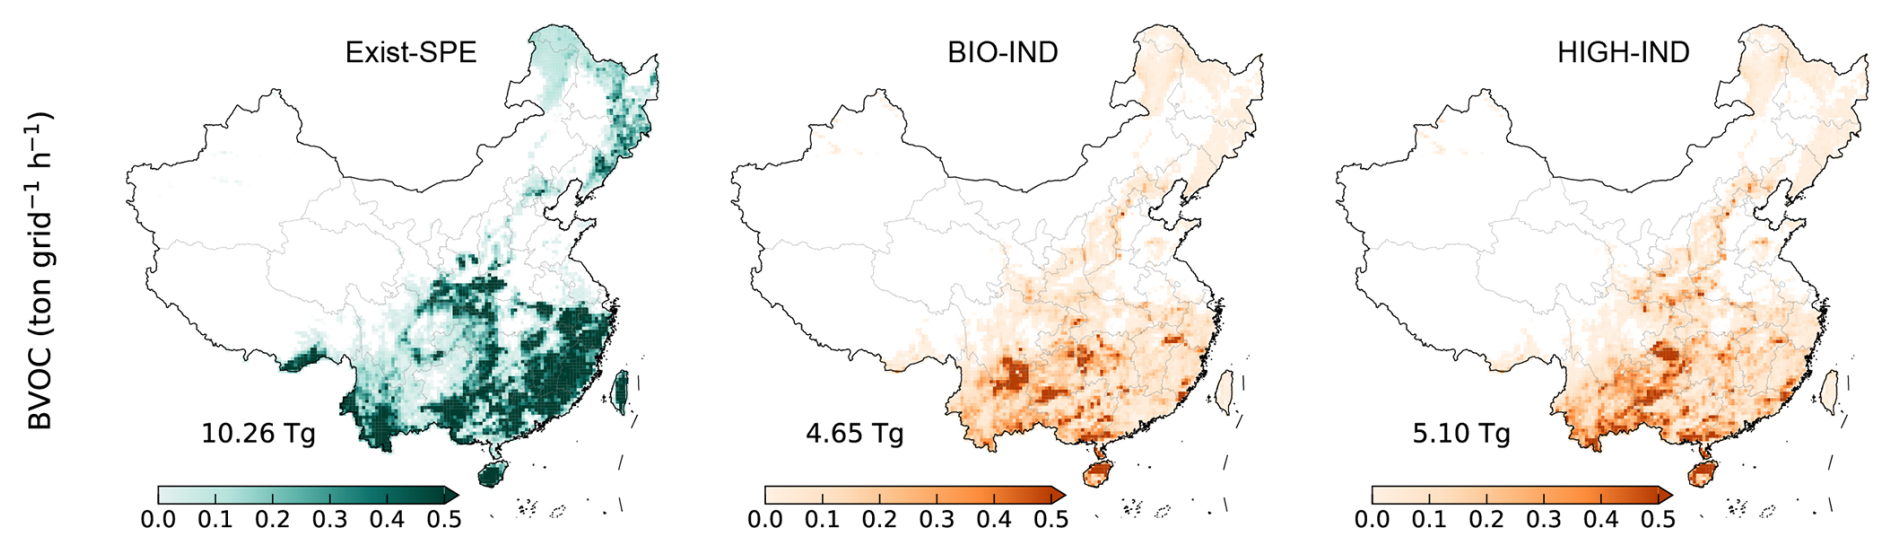
Figure 15Spatial patterns of BVOC emission increases under BIO and HIGH scenarios. Green shading indicates the spatial distribution of BVOC emission rates (ton per grid h−1) from existing forest species (Exist-SPE), while yellow shading denotes the incremental BVOC emission rates attributable to A&R. Annotated values represent the annual BVOC emissions from Exist-SPE in 2019 and the corresponding emission increases under the BIO (4.65 Tg yr−1) and HIGH (5.10 Tg yr−1) scenarios, respectively. All emission quantities are expressed on a compound-mass rather than carbon-mass basis.
This study develops a species-resolved enhancement of the MEGAN framework for estimating BVOC emissions from China's forests (Liu et al., 2026), integrating four key improvements to the model inputs: a tree species distribution map derived from China Forest Vegetation Survey, a species-specific emission factor database compiled from 129 peer-reviewed studies, an updated MODIS LAI product (MCD15A2H), and a refined MODIS land cover classification (MCD12Q1). Applying this enhanced framework, we construct a species-resolved BVOC emission inventory for 234 dominant tree species across China's forests in 2019, estimating total forest BVOC emissions at 10.26 Tg yr−1 with a south-to-north decreasing gradient and a summer peak accounting for ∼ 50 % of the annual total. The five largest contributors – Pinus massoniana, Quercus liaotungensis, Phyllostachys edulis, Cunninghamia lanceolata, and Quercus variabilis – collectively accounted for 41.7 % of total emissions while occupying only 25.4 % of the forested area, indicating that emission magnitude is co-determined by intrinsic emission capacity, spatial coverage, and local climatic conditions. Several sources of uncertainty warrant consideration in interpreting these results. First, tree age influences both the magnitude and composition of BVOC emissions (Tian et al., 2026), yet age-related variation was not considered here. Seedlings have been reported to emit ∼ 50 % more isoprene and to be enriched in cyclic monoterpenes compared with mature trees (Tian et al., 2026). This limitation is particularly relevant for large-scale plantation forests, where trees are concentrated in active growth stages and age-dependent emission differences cannot be neglected. Second, the current model applies uniform stress-response parameterizations across all tree species, neglecting interspecific heterogeneity in BVOC emission responses to environmental stressors. Heat stress, for instance, converts beech from a negligible to an active isoprene emitter while suppressing isoprene emissions in oak (Dey et al., 2026), underscoring the risk of systematic bias from species-uniform stress-response parameterizations. Third, mixed-stand areas were divided equally among co-dominant species because species-level area fractions were unavailable. Deviations from the actual proportions may bias species-specific area estimates and, where emission factors differ among species, affect both total BVOC emissions and their chemical composition. Fourth, European SLA data were used where measurements in East Asia were unavailable. Regional variation in SLA may introduce bias into the derived emission factors and subsequent BVOC emission estimates, and its magnitude and direction remain unquantified. Fifth, the baseline simulations did not include explicit soil-moisture suppression and may therefore overestimate emissions during drought episodes. Representing this process remains challenging because conventional corrections depend on uncertain soil-moisture inputs and wilting-point thresholds (Opacka et al., 2022). Further evaluation of drought formulations incorporating leaf-temperature and physiological responses (Wang et al., 2022) could improve emission estimates under water-limited conditions. Addressing these uncertainties requires expanded field measurements across age classes and underrepresented species, alongside high-resolution forest inventory data resolving species-level composition.
Transitioning from PFT-level to species-resolved scheme represents an advance in biogenic emission modeling for China, enabling the detection of high-emitting species otherwise obscured by PFT averaging and yielding a more physically consistent representation of spatial emission heterogeneity. Our finding challenges the prevailing assumption that extensive forest area implies correspondingly high emissions – a misconception with non-trivial consequences for land management decisions. This insight reframes the interpretation of existing forest emissions and, by extension, the evaluation of planned afforestation. Because A&R programs inherently involve species selection, they determine the chemical composition of subsequent BVOC emissions. Specifically, the BIO scenario produces isoprene-dominated emission increments, whereas the HIGH scenario shifts the balance toward monoterpene-dominated emissions, reflecting the combined influence of species-specific emission factor profiles, tree species selection, and regional climate gradients on national-scale BVOC composition. It should be noted that these scenario contrasts were evaluated under fixed meteorological condition for 2019. Because future warming would further enhance temperature-dependent BVOC emissions, the present estimates likely represent a conservative lower bound on the emission increments associated with A&R, particularly where temperature stimulation is sustained over the coming decades. Beyond this quantitative caveat, the contrasting atmospheric chemistry footprints carry implications that extend beyond differences in total BVOC flux, encompassing secondary organic aerosol formation, tropospheric ozone chemistry, and regional air quality – underscoring the need to integrate species-resolved biogenic emission considerations into future afforestation policy design.
More broadly, because afforestation simultaneously functions as a carbon sink and a driver of BVOC-mediated changes in ozone, particulate air quality, and local climate through altered surface energy and water fluxes, its net environmental benefit cannot be assessed on climate-mitigation grounds alone. Specifically, under BIO, the isoprene-dominated surge is driven disproportionately by Quercus aquifolioides, raising surface ozone concerns when deployed in NOx-rich environments. Conversely, under HIGH, Pinus massoniana accounts for the largest share of the monoterpene-dominated increment, enhancing SOA formation across warm, high-irradiance regions and potentially altering regional aerosol loading and radiative balance. Realizing the full impact of large-scale forestation therefore requires an integrated evaluation framework that jointly weighs carbon-sequestration potential against region-specific atmospheric consequences. The species-resolved inventory developed here provides a quantitative basis for such region-specific optimization, supporting the integration of biogenic emission considerations into future afforestation policy design.
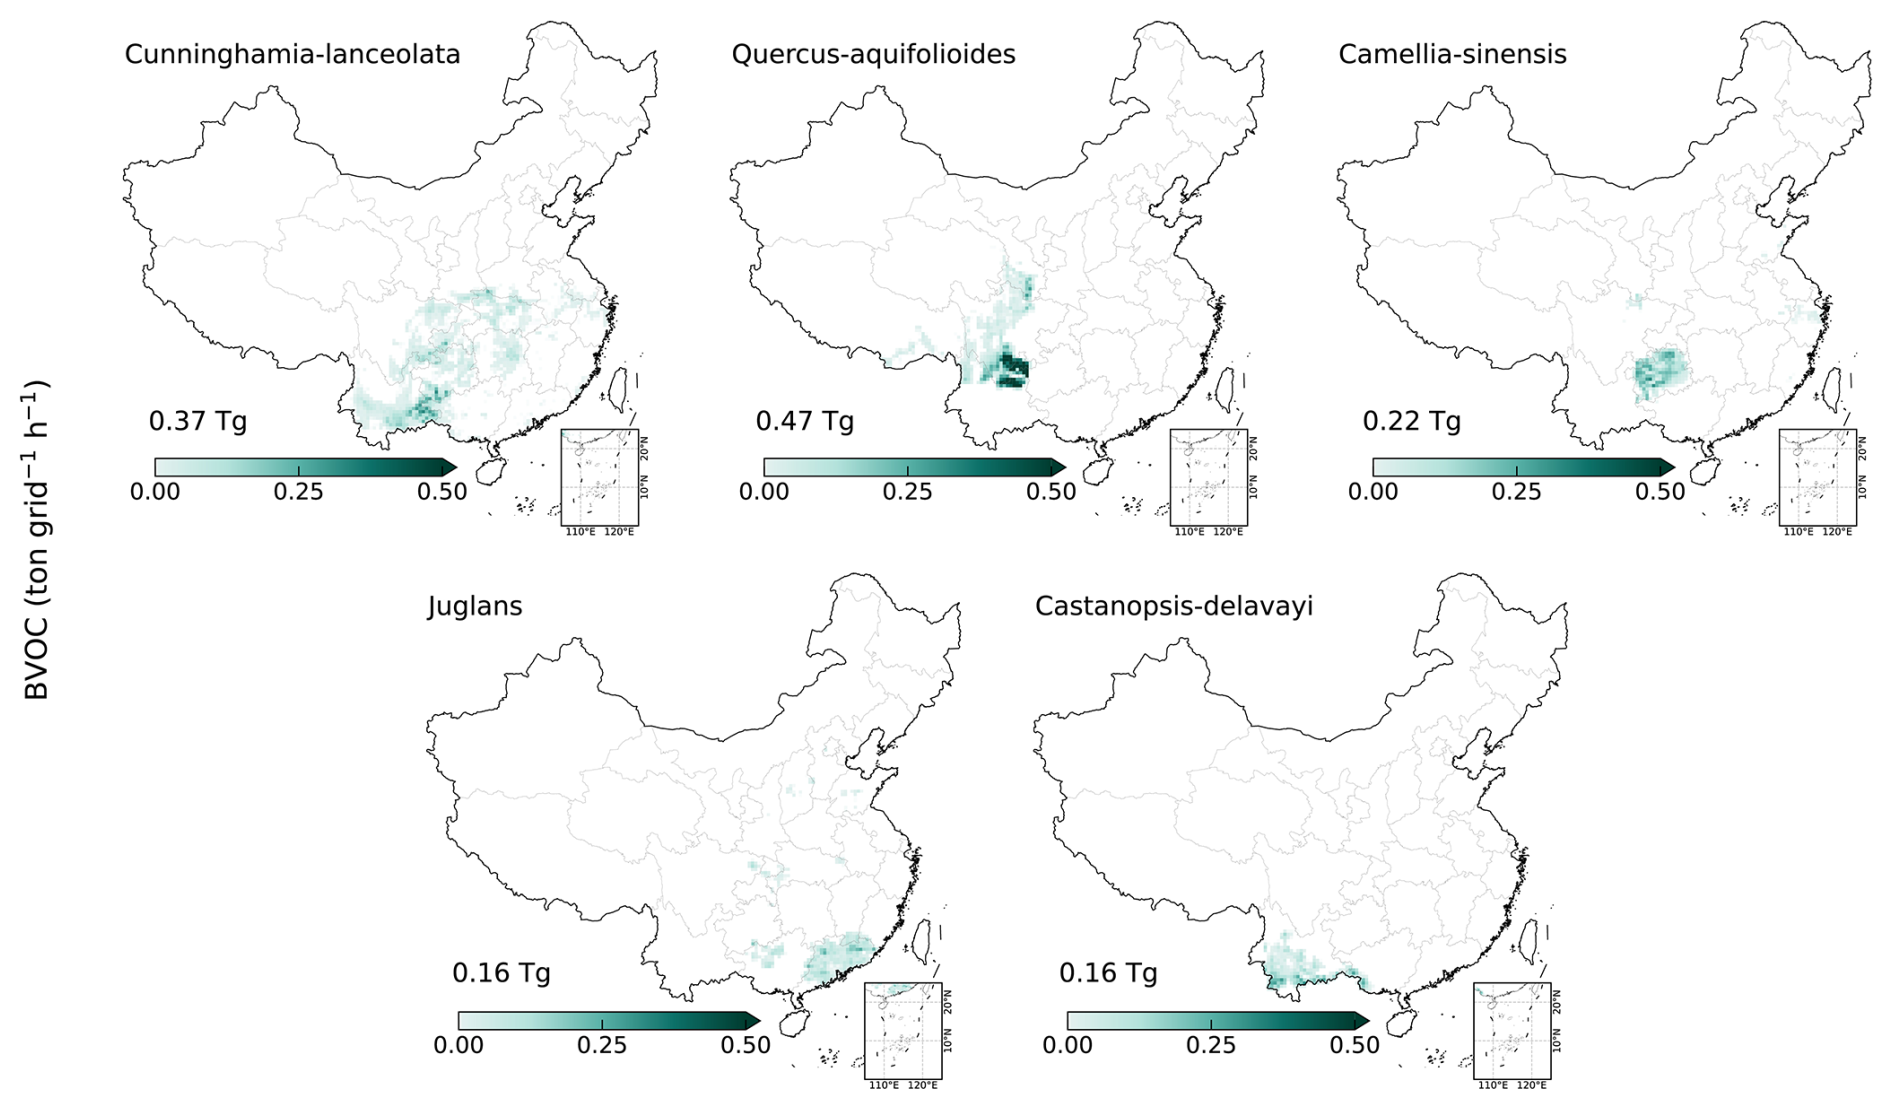
Figure A1Spatial distribution and BVOC emission characteristics of the five most widely distributed tree species in BIO scenario. The five species ranked by forest area are Cunninghamia lanceolata (8.65 Mha), Quercus aquifolioides (8.43 Mha), Camellia sinensis (4.70 Mha), Juglans (3.20 Mha), and Castanopsis delavayi (2.65 Mha). Green shading indicates the spatial distribution of afforestation-induced BVOC emission increments (ton per grid h−1), and numbers denote the annual increment in BVOC emissions attributable to A&R (Tg). All emission quantities are expressed on a compound-mass rather than carbon-mass basis.
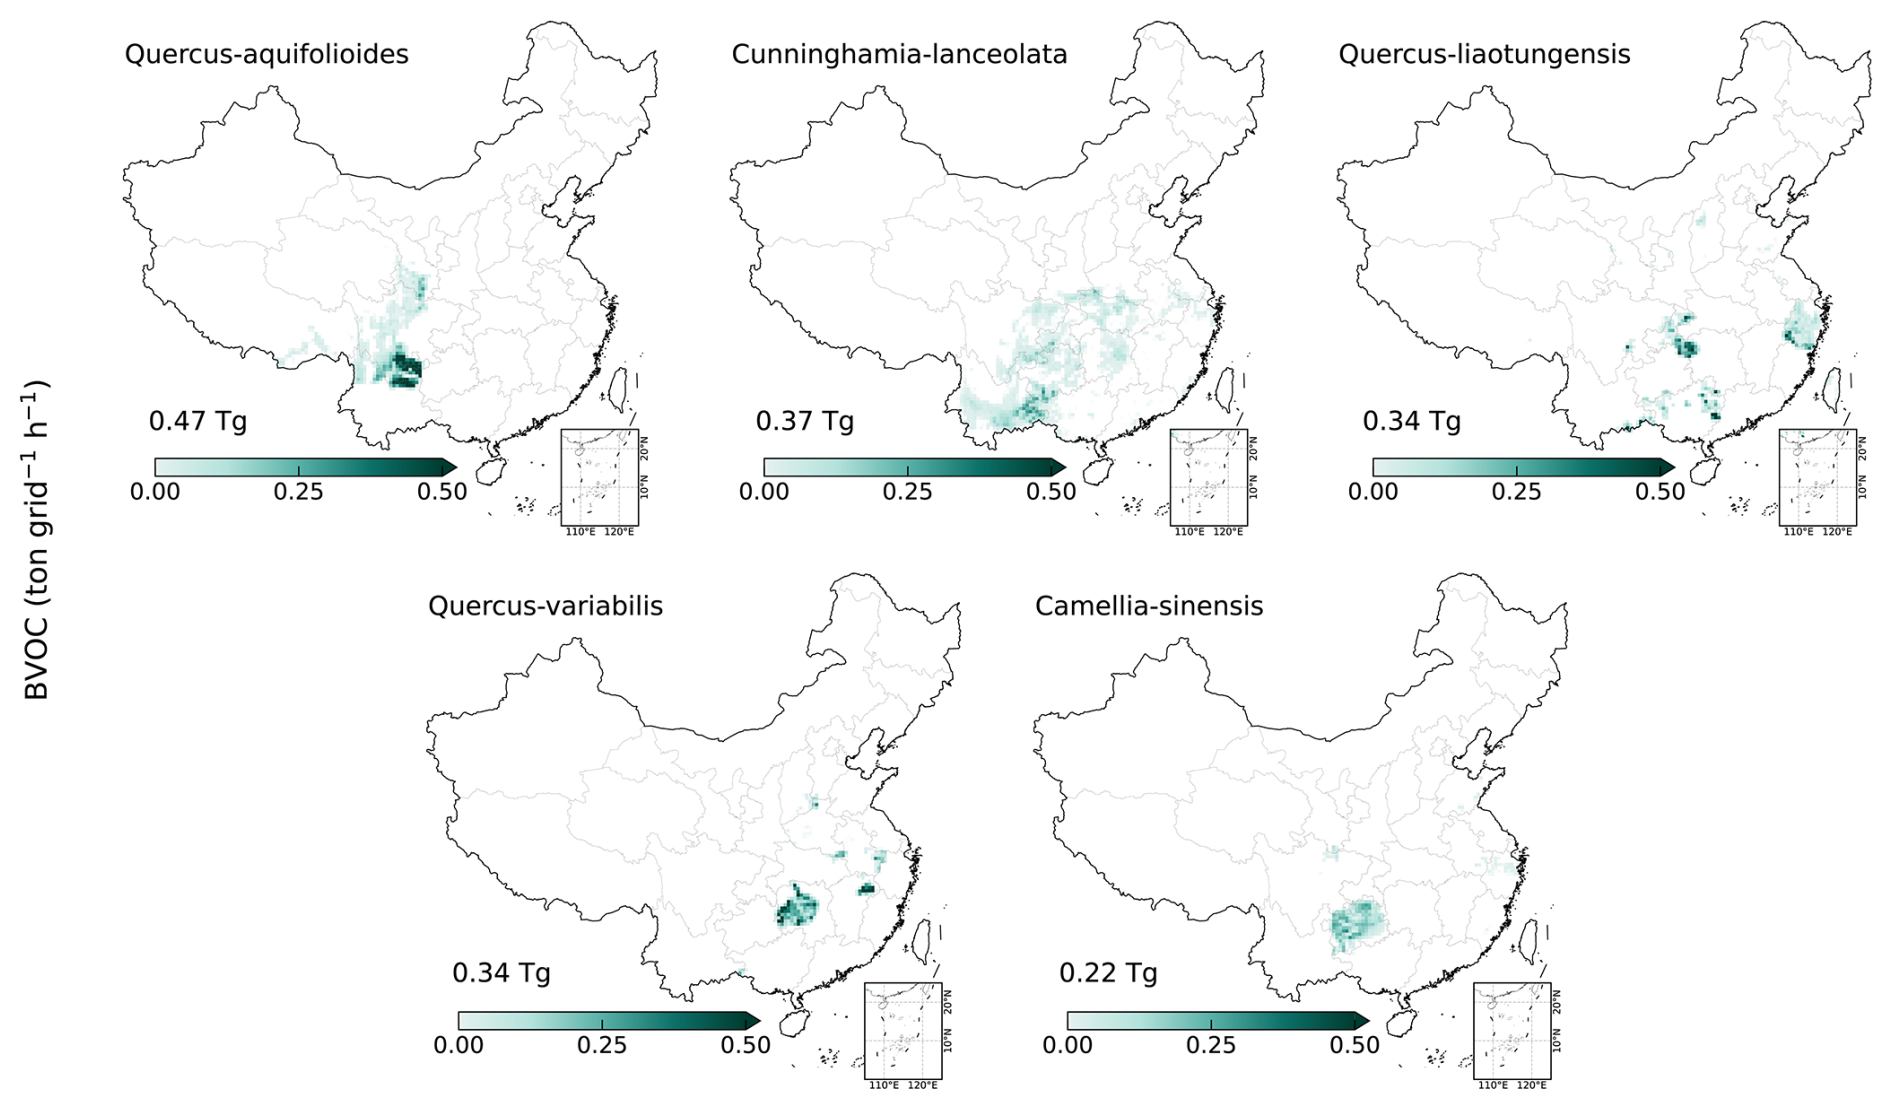
Figure A2BVOC emissions ranking at the tree species level in BIO scenario. Spatial distribution of afforestation-induced BVOC emission increments (ton per grid h−1) for the five leading emitters: Quercus aquifolioides, Cunninghamia lanceolata, Quercus liaotungensis, Quercus variabilis, and Camellia sinensis, with annotated values representing the annual increment in BVOC emissions attributable to A&R (Tg yr−1). All emission quantities are expressed on a compound-mass rather than carbon-mass basis.
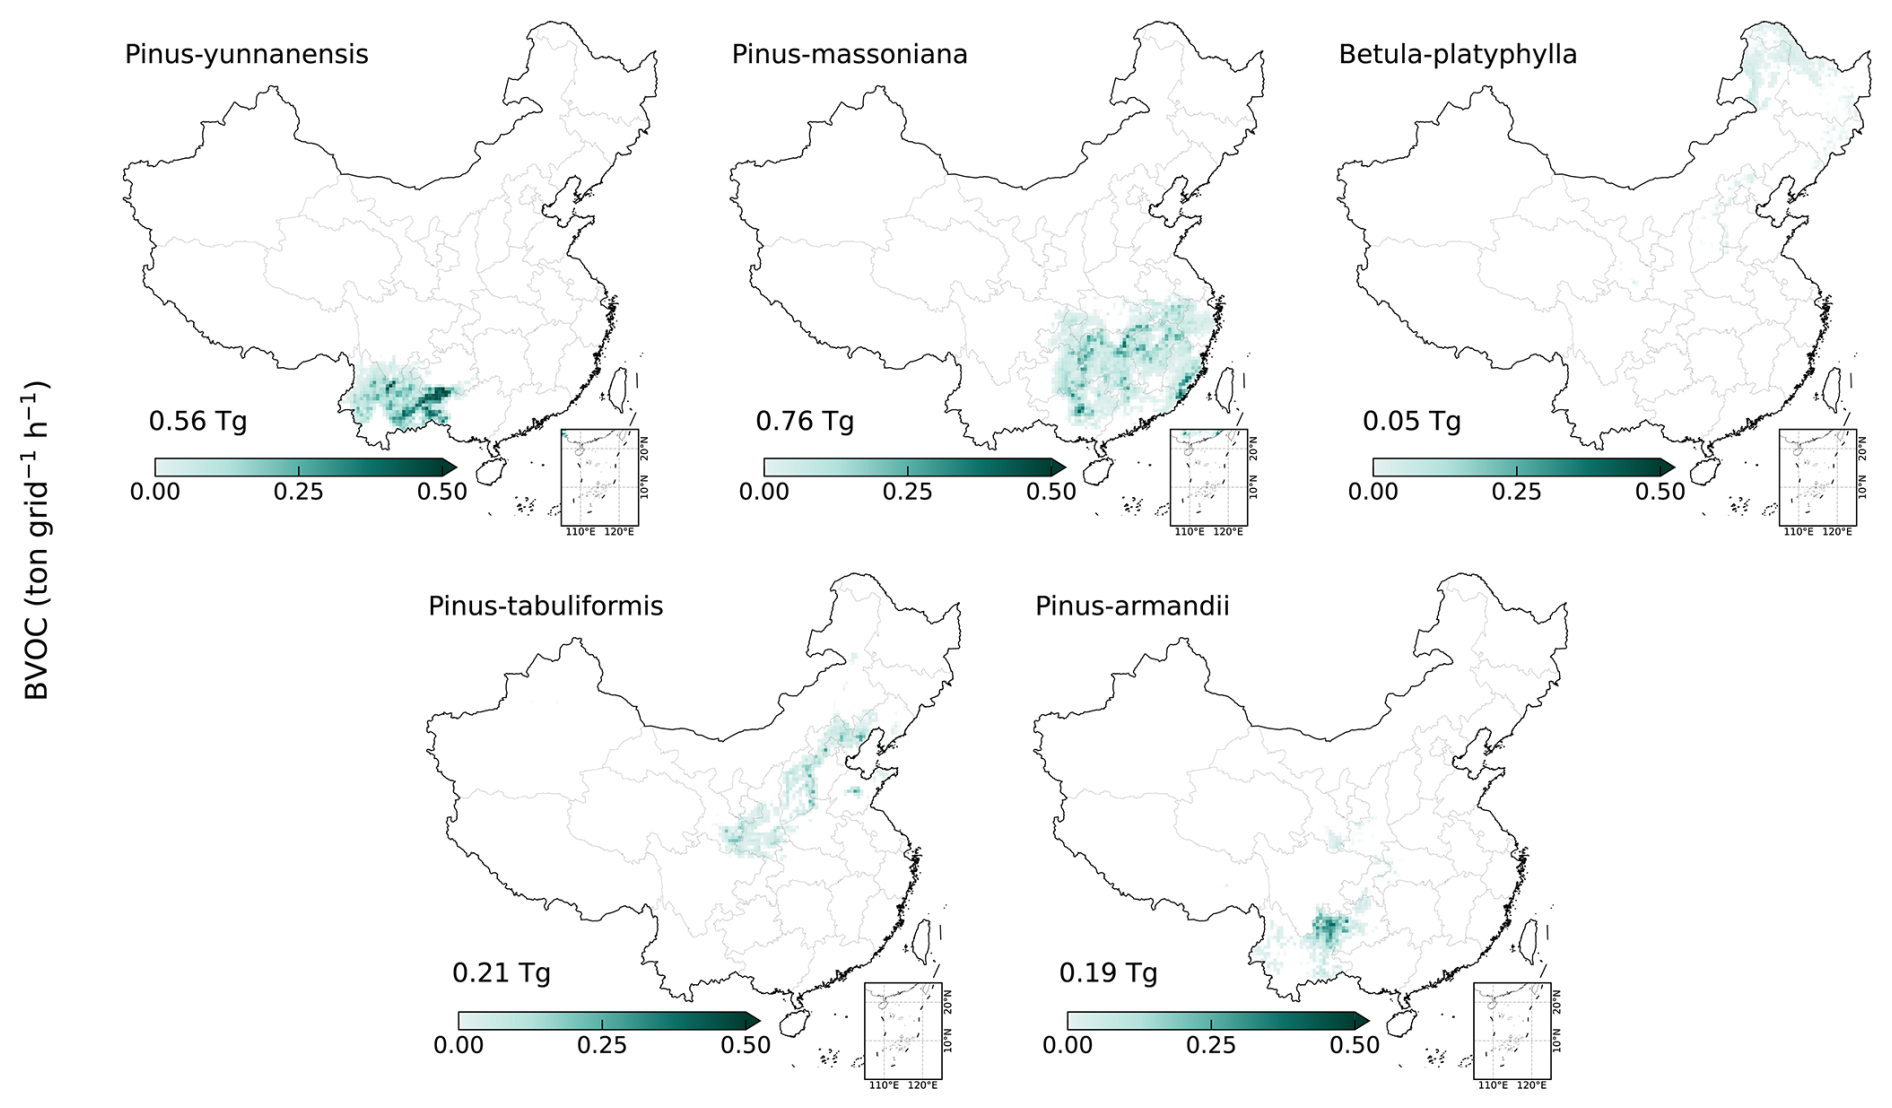
Figure A3Spatial distribution and BVOC emission characteristics of the five most widely distributed tree species in HIGH scenario. The five species ranked by forest area are Pinus yunnanensis (8.91 Mha), Pinus massoniana (7.32 Mha), Betula platyphylla (4.09 Mha), Pinus tabuliformis (4.05 Mha), and Pinus armandii (3.23 Mha). Green shading indicates the spatial distribution of afforestation-induced BVOC emission increments (ton per grid h−1), and numbers denote the annual increment in BVOC emissions attributable to A&R (Tg yr−1). All emission quantities are expressed on a compound-mass rather than carbon-mass basis.
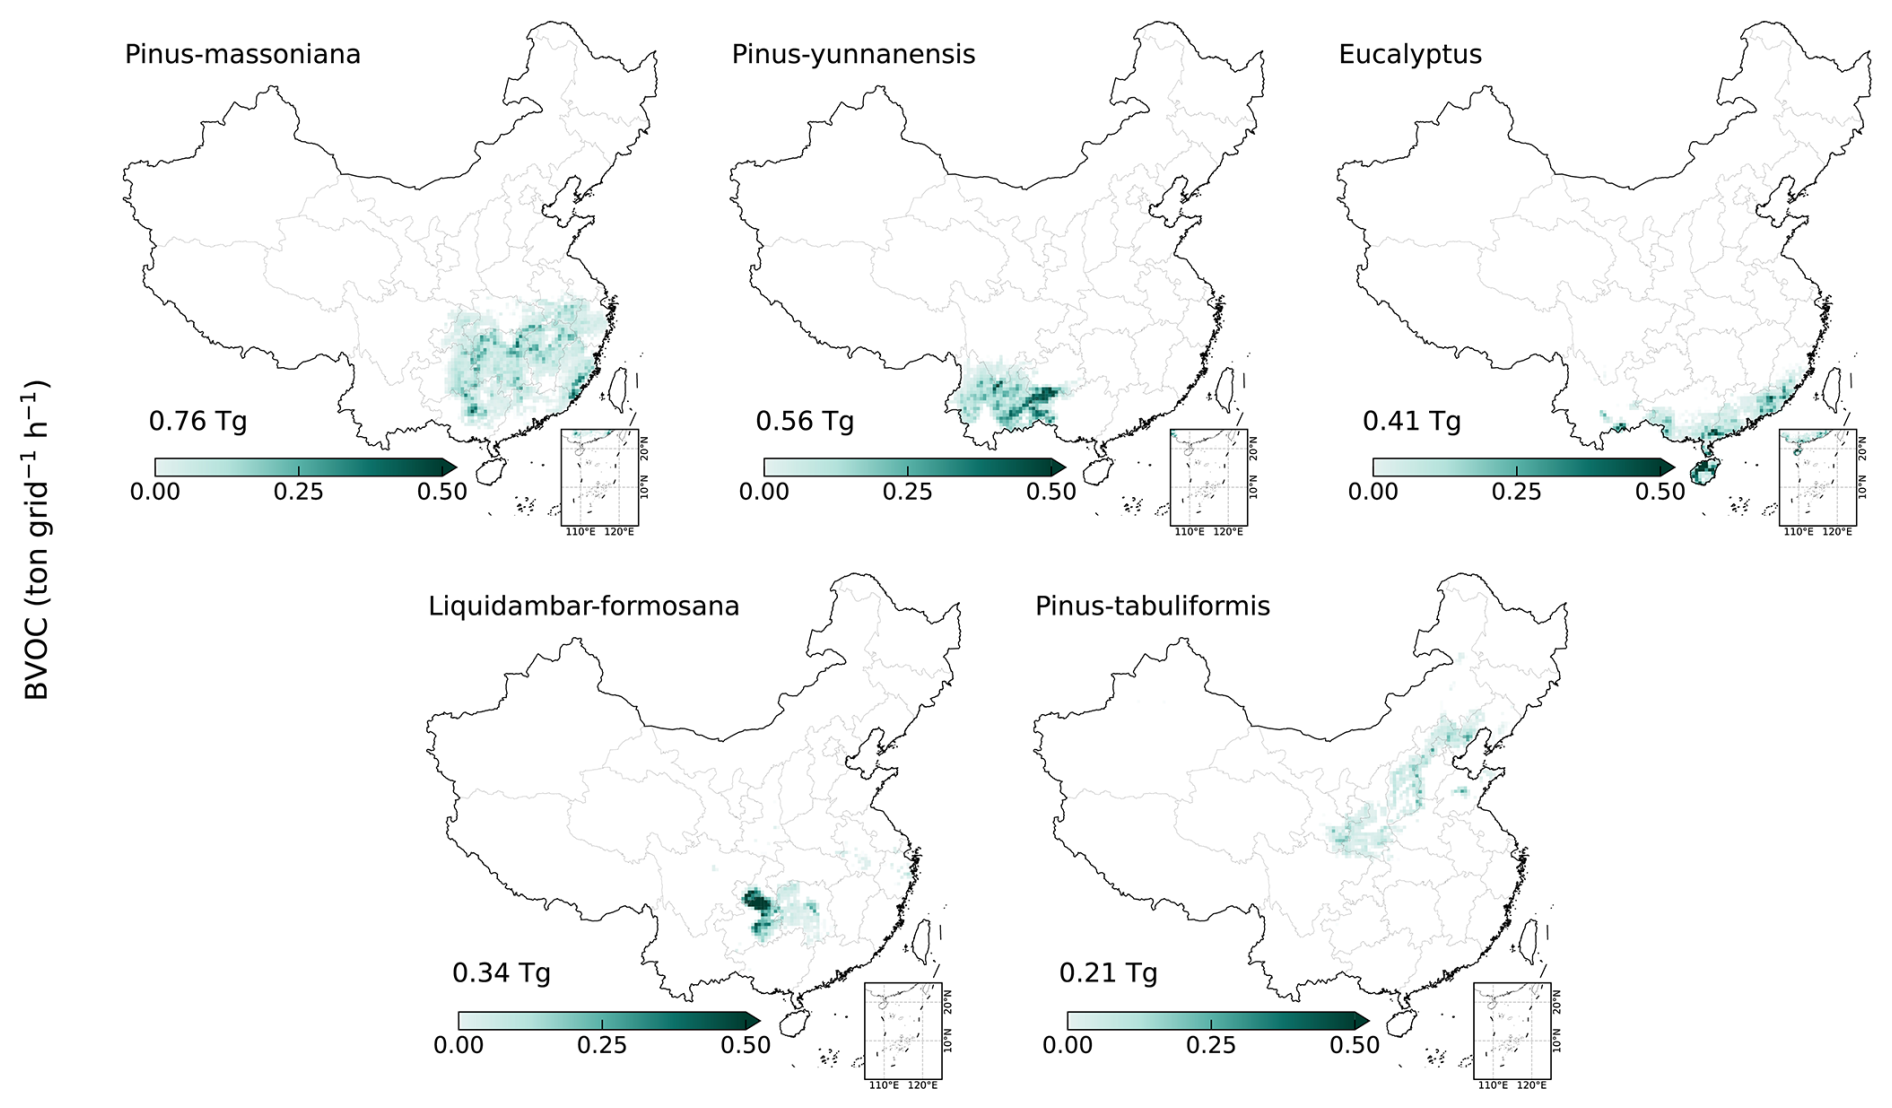
Figure A4BVOC emissions ranking at the tree species level in HIGH scenario. Spatial distribution of afforestation-induced BVOC emission increments (ton per grid h−1) for the five leading emitters: Pinus massoniana, Pinus yunnanensis, Eucalyptus, Liquidambar formosana, and Pinus tabuliformis, with annotated values representing the annual increment in BVOC emissions attributable to A&R (Tg yr−1). All emission quantities are expressed on a compound-mass rather than carbon-mass basis.
Table B1Priority hierarchy for assigning species-specific BVOC emission rate K (µg gdw−1 h−1, as defined in Eq. 4).
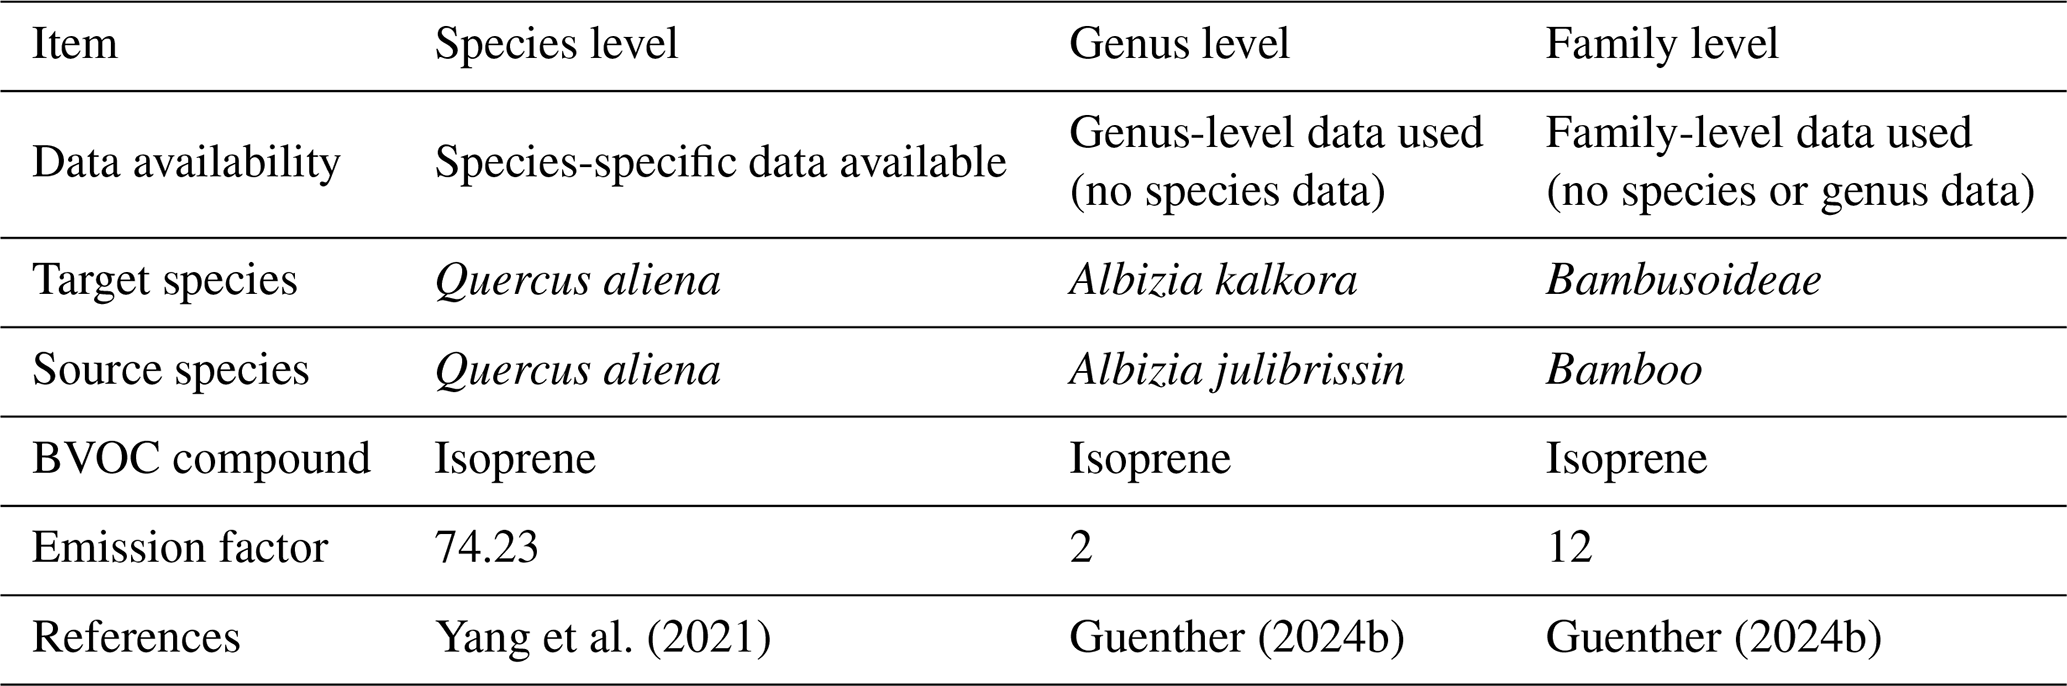
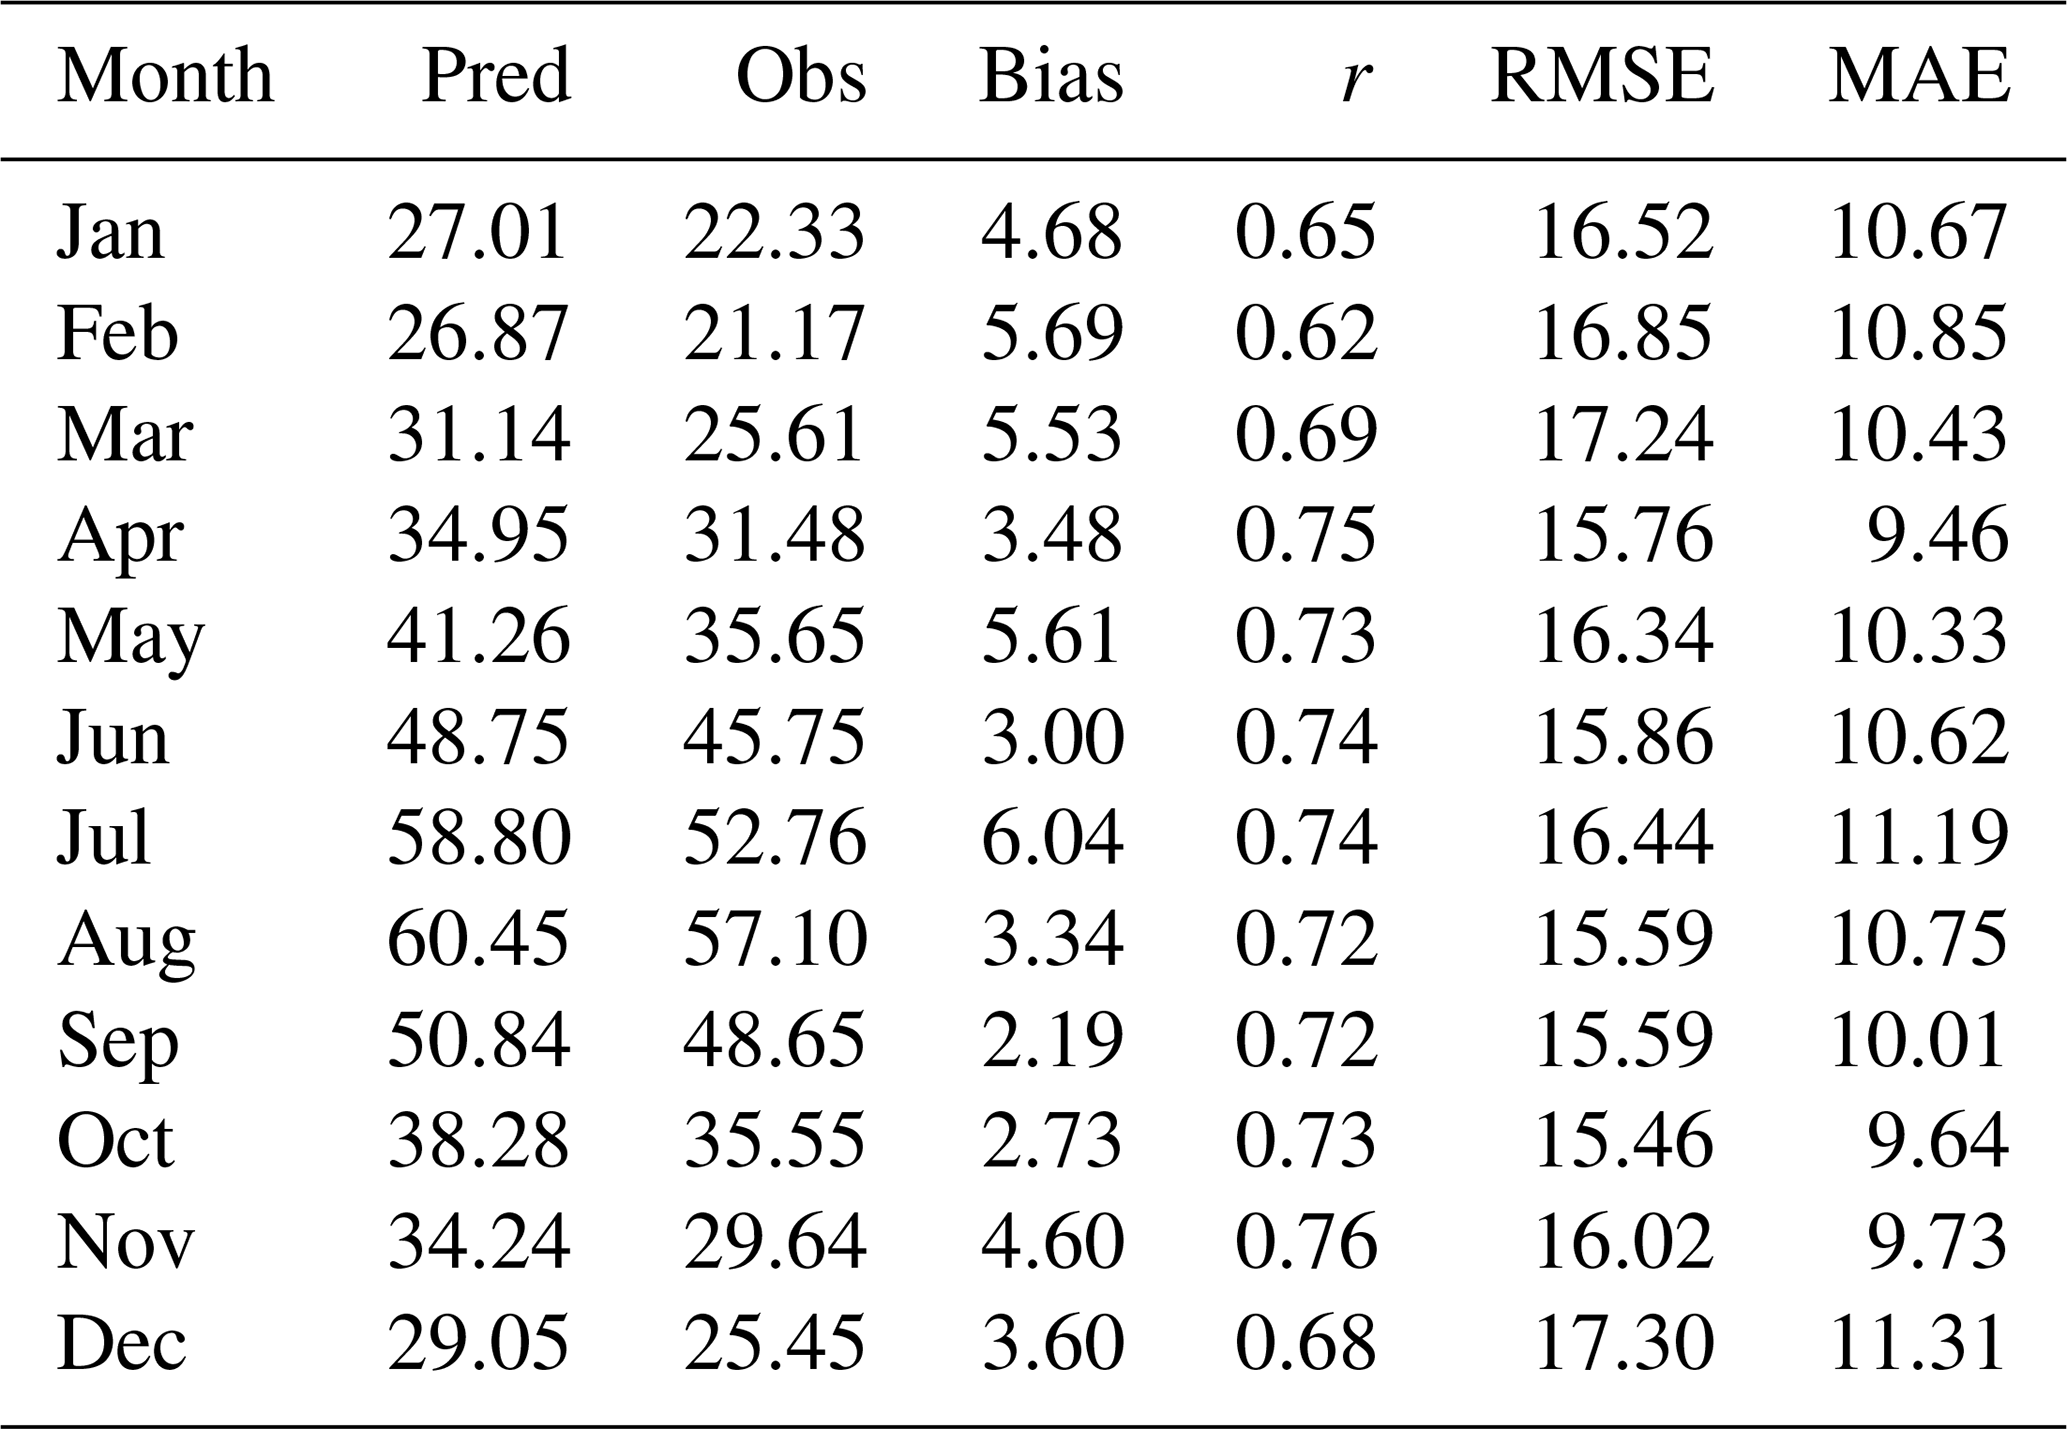
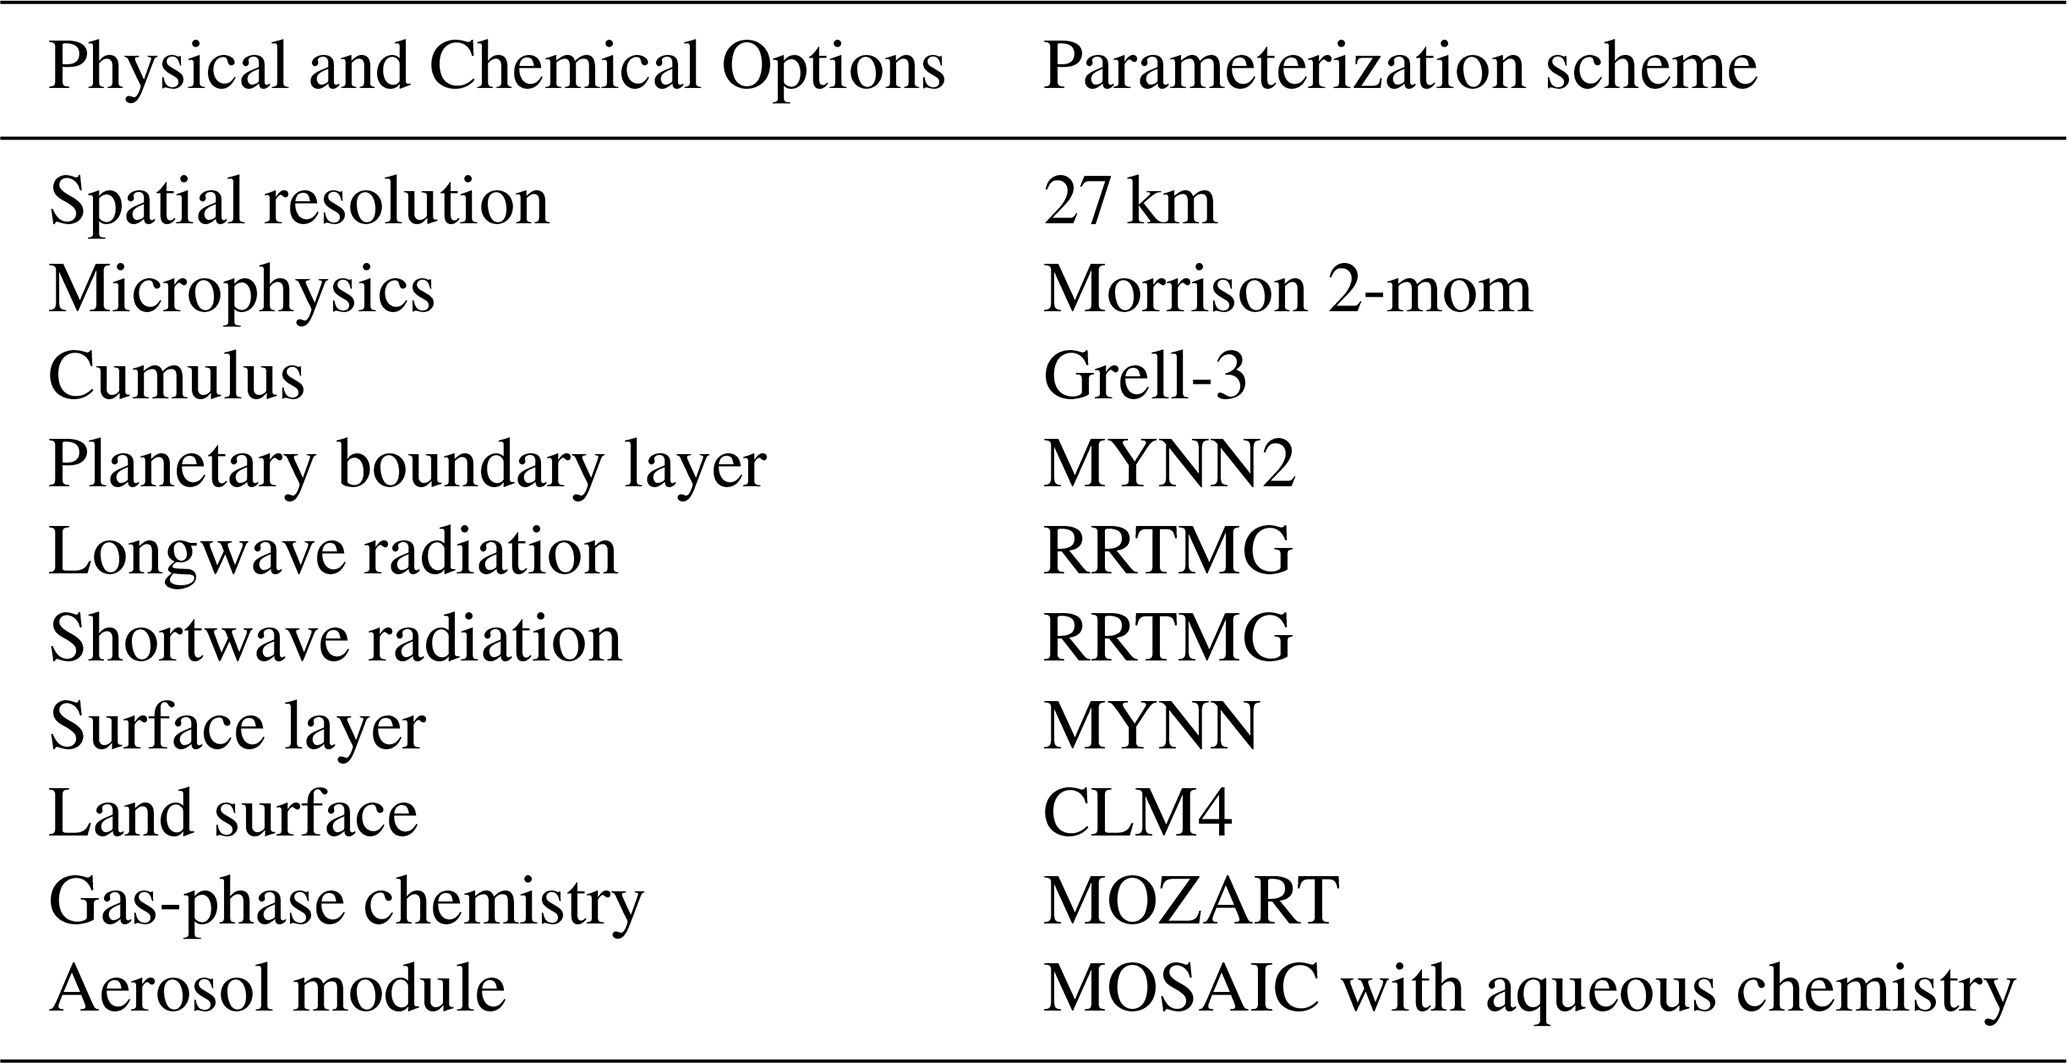
Table B4BVOC emission factors for individual tree species (nmol m−2 s−1).

Note: Zero emission factors indicate emissions below instrumental detection limits in the available measurements and should not be interpreted as an absence of emissions under all conditions. Trace emissions may occur under field conditions depending on environmental factors. Full bibliographic details for the references cited in this table are provided at https://doi.org/10.5281/zenodo.21212755 (Liu et al., 2026).
The species-resolved MEGAN v3.2 model code used in this study is publicly available at https://doi.org/10.5281/zenodo.21212755 (Liu et al., 2026). Installation guidance and supporting documentation are available from the official MEGAN website (https://bai.ess.uci.edu/megan, last access: 11 March 2024).
The 1:1 000 000 forest type vector map was obtained from the China Forest Vegetation Survey project of the Chinese Academy of Forestry, based on surveys conducted during 2013–2017, and is available at https://doi.org/10.12041/geodata.43370179401687.ver1.db (Liu et al., 2020). The MODIS Land Cover Type product (MCD12Q1) is obtained from https://doi.org/10.5067/MODIS/MCD12Q1.061 (Friedl and Sulla-Menashe, 2022). The MODIS Terra/Aqua Leaf Area Index combined product (MCD15A2H) is available at https://doi.org/10.5067/MODIS/MCD15A2H.061 (Myneni et al., 2021). The Multi-resolution Emission Inventory for China is obtained from http://meicmodel.org.cn/ (Cheng et al., 2023). The Final Analysis dataset is available from https://doi.org/10.5065/D6M043C6 (National Centers for Environmental Prediction/National Weather Service/NOAA/U.S. Department of Commerce, 2000). The monthly BVOC emission inventories generated in this study are publicly available at https://doi.org/10.5281/zenodo.21212755 (Liu et al., 2026).
JZ, PF and HL conceived and designed the research. HL, HX, YS, WZ, XZ, and JD developed the methodology. HL performed the simulations, data analysis and investigation. HL, YH, YX, and QG prepared the visualization. The manuscript was primarily written by HL and JZ, with contributions from PF All authors discussed the results, commented on the manuscript and gave final approval for publication.
The contact author has declared that none of the authors has any competing interests.
Publisher's note: Copernicus Publications remains neutral with regard to jurisdictional claims made in the text, published maps, institutional affiliations, or any other geographical representation in this paper. The authors bear the ultimate responsibility for providing appropriate place names. Views expressed in the text are those of the authors and do not necessarily reflect the views of the publisher.
We thank the computing resources provided by the National SuperComputer Center in Tianjin, which served as essential research infrastructure for this study. The authors also sincerely thank all colleagues and collaborators who participated in and contributed to this research.
This research has been supported by the National Natural Science Foundation of China (grant no. 42221001), Tianjin Natural Science Foundation (grant no. 25JCJQJC00200), Scientific Research Innovation Capability Support Project for Young Faculty (grant no. SRICSPYFZY2025154).
This paper was edited by Samuel Remy and reviewed by five anonymous referees.
Bai, J., Guenther, A., Turnipseed, A., and Duhl, T.: Seasonal and interannual variations in whole-ecosystem isoprene and monoterpene emissions from a temperate mixed forest in Northern China, Atmos. Pollut. Res., 6, 696–707, https://doi.org/10.5094/APR.2015.078, 2015.
Bai, J., Guenther, A., Turnipseed, A., Duhl, T., Yu, S., and Wang, B.: Seasonal variations in whole-ecosystem BVOC emissions from a subtropical bamboo plantation in China, Atmos. Environ., 124, 12–21, https://doi.org/10.1016/j.atmosenv.2015.11.008, 2016.
Bai, J., Guenther, A., Turnipseed, A., Duhl, T., and Greenberg, J.: Seasonal and interannual variations in whole-ecosystem BVOC emissions from a subtropical plantation in China, Atmos. Environ., 161, 176–190, https://doi.org/10.1016/j.atmosenv.2017.05.002, 2017.
Bai, J., Wu, Z., Yang, C., and Guenther, A.: Seasonal variations in whole-ecosystem BVOC emissions and ozone fluxes from a tropical rubber tree plantation in China, Atmos. Environ., 351, 121182, https://doi.org/10.1016/j.atmosenv.2025.121182, 2025.
Bai, J., Wu, Z., Yang, C., and Guenther, A. B.: Development and application of a generalized empirical model of BVOC emission (GEMBE) using observations from four Chinese forests, Atmos. Pollut. Res., 17, 102814, https://doi.org/10.1016/j.apr.2025.102814, 2026.
Bergman, M. E., Huang, X.-Q., Baudino, S., Caissard, J.-C., and Dudareva, N.: Plant volatile organic compounds: Emission and perception in a changing world, Curr. Opin. Plant Biol., 85, 102706, https://doi.org/10.1016/j.pbi.2025.102706, 2025.
Botanic Gardens Conservation International (BGCI): State of the World's Trees. Botanic Gardens Conservation International, Richmond, UK, https://www.bgci.org/resources/bgci-tools-and-resources/state-of-the-worlds-trees/ (last access: 24 June 2026), 2021.
Cao, H., Fu, T.-M., Zhang, L., Henze, D. K., Miller, C. C., Lerot, C., Abad, G. G., De Smedt, I., Zhang, Q., van Roozendael, M., Hendrick, F., Chance, K., Li, J., Zheng, J., and Zhao, Y.: Adjoint inversion of Chinese non-methane volatile organic compound emissions using space-based observations of formaldehyde and glyoxal, Atmos. Chem. Phys., 18, 15017–15046, https://doi.org/10.5194/acp-18-15017-2018, 2018.
Cao, J., Situ, S., Hao, Y., Xie, S., and Li, L.: Enhanced summertime ozone and SOA from biogenic volatile organic compound (BVOC) emissions due to vegetation biomass variability during 1981–2018 in China, Atmos. Chem. Phys., 22, 2351–2364, https://doi.org/10.5194/acp-22-2351-2022, 2022.
Cao, J., Han, H., Qiao, L., and Li, L.: Biogenic Volatile Organic Compound Emission and Its Response to Land Cover Changes in China During 2001–2020 Using an Improved High-Precision Vegetation Data Set, J. Geophys. Res.-Atmos., 129, e2023JD040421, https://doi.org/10.1029/2023JD040421, 2024.
Cappa, C. D. and Wilson, K. R.: Multi-generation gas-phase oxidation, equilibrium partitioning, and the formation and evolution of secondary organic aerosol, Atmos. Chem. Phys., 12, 9505–9528, https://doi.org/10.5194/acp-12-9505-2012, 2012.
Chen, W. H., Guenther, A. B., Wang, X. M., Chen, Y. H., Gu, D. S., Chang, M., Zhou, S. Z., Wu, L. L., and Zhang, Y. Q.: Regional to Global Biogenic Isoprene Emission Responses to Changes in Vegetation From 2000 to 2015, J. Geophys. Res.-Atmos., 123, 3757–3771, https://doi.org/10.1002/2017JD027934, 2018.
Cheng, J., Tong, D., Liu, Y., Geng, G, N., Davis, J, S., He, K, B., and Zhang, Q.: A synergistic approach to air pollution control and carbon neutrality in China can avoid millions of premature deaths annually by 2060, One Earth, 6, 978–989, https://doi.org/10.1016/j.oneear.2023.07.007, 2023.
Cheng, K., Yang, H., Chen, Y., Yang, Z., Ren, Y., Zhang, Y., Lin, D., Liu, W., Huang, G., Xu, J., Chen, M., Qi, Z., Xu, G., Tao, S., Guan, H., Ma, Q., Wan, H., Hu, T., Su, Y., Wang, Z., Ma, K., and Guo, Q.: How many trees are there in China?, Sci. Bull., 70, 1076–1079, https://doi.org/10.1016/j.scib.2025.02.001, 2025.
Chytrý, M., Řezníčková, M., Novotný, P., Holubová, D., Preislerová, Z., Attorre, F., Biurrun, I., Blažek, P., Bonari, G., Borovyk, D., Čeplová, N., Danihelka, J., Davydov, D., Dřevojan, P., Fahs, N., Guarino, R., Güler, B., Hennekens, S. M., Hrivnák, R., Kalníková, V., Kalusová, V., Kebert, T., Knollová, I., Knotková, K., Koljanin, D., Kuzemko, A., Loidi, J., Lososová, Z., Marcenò, C., Midolo, G., Milanović, D., Mucina, L., Novák, P., Raab-Straube, E. v., Reczyńska, K., Schaminée, J. H. J., Štěpánková, P., Świerkosz, K., Těšitel, J., Těšitelová, T., Tichý, L., Vynokurov, D., Willner, W., and Axmanová, I.: FloraVeg.EU – An online database of European vegetation, habitats and flora, Appl. Veg. Sci., 27, e12798, https://doi.org/10.1111/avsc.12798, 2024.
Copernicus Land Monitoring Service (CLMS): Fraction of Vegetation Cover 1999–2020 (raster 1 km), global, 10-daily – version 2, European Commission, Joint Research Centre [data set], https://doi.org/10.2909/7d726671-9647-4116-8dc3-cf7470a1a782, 2017.
Dey, B., Sjøgren, T. D., Khare, P., Gkatzelis, G. I., Wu, Y., Vasireddy, S., Schultz, M., Knohl, A., Rinnan, R., Hohaus, T., and Pfannerstill, E. Y.: Multi-stress interaction effects on BVOC emission fingerprints from Oak and Beech: A cross-investigation using Machine Learning and Positive Matrix Factorization, Biogeosciences, 23, 1423–1457, https://doi.org/10.5194/bg-23-1423-2026, 2026.
Ding, X., He, Q. F., Shen, R. Q., Yu, Q. Q., and Wang, X. M.: Spatial distributions of secondary organic aerosols from isoprene, monoterpenes, β-caryophyllene, and aromatics over China during summer, J. Geophys. Res.-Atmos., 119, 11877–11891, https://doi.org/10.1002/2014JD021748, 2014.
Du, W., Sun, Y. L., Xu, Y. S., Jiang, Q., Wang, Q. Q., Yang, W., Wang, F., Bai, Z. P., Zhao, X. D., and Yang, Y. C.: Chemical characterization of submicron aerosol and particle growth events at a national background site (3295 m a.s.l.) on the Tibetan Plateau, Atmos. Chem. Phys., 15, 10811–10824, https://doi.org/10.5194/acp-15-10811-2015, 2015.
Emmons, L. K., Walters, S., Hess, P. G., Lamarque, J.-F., Pfister, G. G., Fillmore, D., Granier, C., Guenther, A., Kinnison, D., Laepple, T., Orlando, J., Tie, X., Tyndall, G., Wiedinmyer, C., Baughcum, S. L., and Kloster, S.: Description and evaluation of the Model for Ozone and Related chemical Tracers, version 4 (MOZART-4), Geosci. Model Dev., 3, 43–67, https://doi.org/10.5194/gmd-3-43-2010, 2010.
FAO/IIASA/ISRIC/ISS-CAS/JRC: Harmonized World Soil Database (version 1.2), FAO, Rome, Italy and IIASA, Laxenburg, Austria [data set], https://www.fao.org/soils-portal/data-hub/soil-maps-and-databases/harmonized-world-soil-database-v12/en/ (last access: 24 June 2026), 2012.
Fischbach, R. J., Zimmer, I., Steinbrecher, R., Pfichner, A., and Schnitzler, J.-P.: Monoterpene synthase activities in leaves of Picea abies (L.) Karst. and Quercus ilex L., Phytochemistry, 54, 257–265, https://doi.org/10.1016/S0031-9422(00)00119-9, 2000.
Friedl, M. and Sulla-Menashe, D.: MODIS/Terra+Aqua Land Cover Type Yearly L3 Global 500 m SIN Grid V061, NASA Land Processes Distributed Active Archive Center [data set], https://doi.org/10.5067/MODIS/MCD12Q1.061, 2022.
Fu, Y. and Liao, H.: Simulation of the interannual variations of biogenic emissions of volatile organic compounds in China: Impacts on tropospheric ozone and secondary organic aerosol, Atmos. Environ., 59, 170–185, https://doi.org/10.1016/j.atmosenv.2012.05.053, 2012.
Gao, C., Zhang, X., Yang, H., Huang, L., Zhao, H., Zhang, S., and Xiu, A.: Quantifying the impacts of environmental stress factors on biogenic volatile organic compound emissions in China, Agr. Forest Meteorol., 366, 110480, https://doi.org/10.1016/j.agrformet.2025.110480, 2025.
Goldstein, A. H. and Galbally, I. E.: Known and Unexplored Organic Constituents in the Earth's Atmosphere, Environ. Sci. Technol., 41, 1514–1521, https://doi.org/10.1021/es072476p, 2007.
Grell, G. A. and Freitas, S. R.: A scale and aerosol aware stochastic convective parameterization for weather and air quality modeling, Atmos. Chem. Phys., 14, 5233–5250, https://doi.org/10.5194/acp-14-5233-2014, 2014.
Guenther, A.: MEGANv3.21.tar.gz emission calculator code, Zenodo [code], https://doi.org/10.5281/zenodo.10526206, 2024a.
Guenther, A.: MEGAN 3.2 input files, Zenodo [data set], https://doi.org/10.5281/zenodo.10939297, 2024b.
Guenther, A., Karl, T., Harley, P., Wiedinmyer, C., Palmer, P. I., and Geron, C.: Estimates of global terrestrial isoprene emissions using MEGAN (Model of Emissions of Gases and Aerosols from Nature), Atmos. Chem. Phys., 6, 3181–3210, https://doi.org/10.5194/acp-6-3181-2006, 2006.
Guenther, A. B., Jiang, X., Heald, C. L., Sakulyanontvittaya, T., Duhl, T., Emmons, L. K., and Wang, X.: The Model of Emissions of Gases and Aerosols from Nature version 2.1 (MEGAN2.1): an extended and updated framework for modeling biogenic emissions, Geosci. Model Dev., 5, 1471–1492, https://doi.org/10.5194/gmd-5-1471-2012, 2012.
Guenther, A., Jiang, X., Shah, T., Huang, L., Kemball-Cook, S., and Yarwood, G.: Model of Emissions of Gases and Aerosol from Nature Version 3 (MEGAN3) for Estimating Biogenic Emissions, Air Pollution Modeling and its Application XXVI, Cham, 187–192, https://doi.org/10.1007/978-3-030-22055-6_29, 2020.
Hu, W. W., Hu, M., Yuan, B., Jimenez, J. L., Tang, Q., Peng, J. F., Hu, W., Shao, M., Wang, M., Zeng, L. M., Wu, Y. S., Gong, Z. H., Huang, X. F., and He, L. Y.: Insights on organic aerosol aging and the influence of coal combustion at a regional receptor site of central eastern China, Atmos. Chem. Phys., 13, 10095–10112, https://doi.org/10.5194/acp-13-10095-2013, 2013.
Hu, W., Hu, M., Hu, W.-W., Niu, H., Zheng, J., Wu, Y., Chen, W., Chen, C., Li, L., Shao, M., Xie, S., and Zhang, Y.: Characterization of submicron aerosols influenced by biomass burning at a site in the Sichuan Basin, southwestern China, Atmos. Chem. Phys., 16, 13213–13230, https://doi.org/10.5194/acp-16-13213-2016, 2016.
Hu, J., Wang, P., Ying, Q., Zhang, H., Chen, J., Ge, X., Li, X., Jiang, J., Wang, S., Zhang, J., Zhao, Y., and Zhang, Y.: Modeling biogenic and anthropogenic secondary organic aerosol in China, Atmos. Chem. Phys., 17, 77–92, https://doi.org/10.5194/acp-17-77-2017, 2017.
Huang, X.-F., He, L.-Y., Hu, M., Canagaratna, M. R., Kroll, J. H., Ng, N. L., Zhang, Y.-H., Lin, Y., Xue, L., Sun, T.-L., Liu, X.-G., Shao, M., Jayne, J. T., and Worsnop, D. R.: Characterization of submicron aerosols at a rural site in Pearl River Delta of China using an Aerodyne High-Resolution Aerosol Mass Spectrometer, Atmos. Chem. Phys., 11, 1865–1877, https://doi.org/10.5194/acp-11-1865-2011, 2011.
Huang, X.-F., Xue, L., Tian, X.-D., Shao, W.-W., Sun, T.-L., Gong, Z.-H., Ju, W.-W., Jiang, B., Hu, M., and He, L.-Y.: Highly time-resolved carbonaceous aerosol characterization in Yangtze River Delta of China: Composition, mixing state and secondary formation, Atmos. Environ., 64, 200–207, https://doi.org/10.1016/j.atmosenv.2012.09.059, 2013.
Iacono, M. J., Delamere, J. S., Mlawer, E. J., Shephard, M. W., Clough, S. A., and Collins, W. D.: Radiative forcing by long-lived greenhouse gases: Calculations with the AER radiative transfer models, J. Geophys. Res.-Atmos., 113, https://doi.org/10.1029/2008JD009944, 2008.
Jing, X., Lun, X., Fan, C., and Ma, W.: Emission patterns of biogenic volatile organic compounds from dominant forest species in Beijing, China, J. Environ. Sci., 95, 73-81, https://doi.org/10.1016/j.jes.2020.03.049, 2020.
Kenseth, C. M., Hafeman, N. J., Rezgui, S. P., Chen, J., Huang, Y., Dalleska, N. F., Kjaergaard, H. G., Stoltz, B. M., Seinfeld, J. H., and Wennberg, P. O.: Particle-phase accretion forms dimer esters in pinene secondary organic aerosol, Science, 382, 787–792, https://doi.org/10.1126/science.adi0857, 2023.
Komenda, M. and Koppmann, R.: Monoterpene emissions from Scots pine (Pinus sylvestris): Field studies of emission rate variabilities, J. Geophys. Res.-Atmos., 107, 4161, https://doi.org/10.1029/2001JD000691, 2002.
Li, L. Y., Chen, Y., and Xie, S. D.: Spatio-temporal variation of biogenic volatile organic compounds emissions in China, Environ. Pollut., 182, 157–168, https://doi.org/10.1016/j.envpol.2013.06.042, 2013.
Li, L. Y. and Xie, S. D.: Historical variations of biogenic volatile organic compound emission inventories in China, 1981–2003, Atmos. Environ., 95, 185–196, https://doi.org/10.1016/j.atmosenv.2014.06.033, 2014.
Li, J., Zhang, M., Tang, G., Sun, Y., Wu, F., and Xu, Y.: Assessment of dicarbonyl contributions to secondary organic aerosols over China using RAMS-CMAQ, Atmos. Chem. Phys., 19, 6481–6495, https://doi.org/10.5194/acp-19-6481-2019, 2019.
Li, J., Liu, Z., Cao, L., Gao, W., Yan, Y., Mao, J., Zhang, X., He, L., Xin, J., and Tang, G.: Highly time-resolved chemical characterization and implications of regional transport for submicron aerosols in the North China Plain, Sci. Total. Environ., 705, 135803, https://doi.org/10.1016/j.scitotenv.2019.135803, 2020a.
Li, L., Yang, W., Xie, S., and Wu, Y.: Estimations and uncertainty of biogenic volatile organic compound emission inventory in China for 2008–2018, Sci. Total. Environ., 733, 139301, https://doi.org/10.1016/j.scitotenv.2020.139301, 2020b.
Li, L., Zhang, B., Cao, J., Xie, S., and Wu, Y.: Isoprenoid emissions from natural vegetation increased rapidly in eastern China, Environ. Res., 200, 111462, https://doi.org/10.1016/j.envres.2021.111462, 2021.
Li, L., Cao, J., and Hao, Y.: Spatial and species-specific responses of biogenic volatile organic compound (BVOC) emissions to elevated ozone from 2014–2020 in China, Sci. Total. Environ., 868, 161636, https://doi.org/10.1016/j.scitotenv.2023.161636, 2023.
Li, Q., Lerner, G., Bar, E., Lewinsohn, E., and Tas, E.: Impact of meteorological conditions on the biogenic volatile organic compound (BVOC) emission rate from eastern Mediterranean vegetation under drought, Biogeosciences, 21, 4133–4147, https://doi.org/10.5194/bg-21-4133-2024, 2024.
Li, P., Yu, Y., and Zhao, S.: Comparative assessment of MEGAN v2.1 and v3.2 biogenic VOC emissions over the Qinghai-Tibet Plateau: implications for summertime surface ozone simulations, EGUsphere [preprint], https://doi.org/10.5194/egusphere-2025-5579, 2025.
Liu, S., Xing, J., Zhang, H., Ding, D., Zhang, F., Zhao, B., Sahu, S. K., and Wang, S.: Climate-driven trends of biogenic volatile organic compound emissions and their impacts on summertime ozone and secondary organic aerosol in China in the 2050s, Atmos. Environ., 218, 117020, https://doi.org/10.1016/j.atmosenv.2019.117020, 2019.
Liu, S., Chen, Y., and Zang, R.: 1:1000000 forest distribution map of China for 2013–2017, Geodata [data set], https://doi.org/10.12041/geodata.43370179401687.ver1.db, 2020.
Liu, H., Xu, H., Huang, Y., Zhou, W., Xiao, Y., Guo, Q., Zhao, X., Deng, J., Sun, Y., Fu, P., and Zhu, J.: Species-resolved inventory of forest biogenic volatile organic emissions across China with MEGAN v3.2, Zenodo [data set], https://doi.org/10.5281/zenodo.21212755, 2026.
Ma, J., Zhu, S., Wang, S., Wang, P., Chen, J., and Zhang, H.: Impacts of land cover changes on biogenic emission and its contribution to ozone and secondary organic aerosol in China, Atmos. Chem. Phys., 23, 4311–4325, https://doi.org/10.5194/acp-23-4311-2023, 2023.
Mallapaty, S.: How China could be carbon neutral by mid-century, Nature, 586, 482–483, https://doi.org/10.1038/d41586-020-02927-9, 2020.
Morrison, H., Thompson, G., and Tatarskii, V.: Impact of Cloud Microphysics on the Development of Trailing Stratiform Precipitation in a Simulated Squall Line: Comparison of One- and Two-Moment Schemes, Mon. Weather Rev., 137, 991–1007, https://doi.org/10.1175/2008MWR2556.1, 2009.
Myneni, R., Knyazikhin, Y., and Park, T.: MODIS/Terra+Aqua Leaf Area Index/FPAR 8-Day L4 Global 500m SIN Grid V061, NASA EOSDIS Land Processes Distributed Active Archive Center [data set], https://doi.org/10.5067/MODIS/MCD15A2H.061, 2021.
Nakanishi, M. and Niino, H.: An Improved Mellor-Yamada Level-3 Model: Its Numerical Stability and Application to a Regional Prediction of Advection Fog, Bound.-Lay. Meteorol., 119, 397–407, https://doi.org/10.1007/s10546-005-9030-8, 2006.
National Centers for Environmental Prediction/National Weather Service/NOAA/U.S. Department of Commerce: NCEP FNL Operational Model Global Tropospheric Analyses, continuing from July 1999, NSF National Center for Atmospheric Research [data set], https://doi.org/10.5065/D6M043C6, 2000.
Niinemets, Ü. and Reichstein, M.: Controls on the emission of plant volatiles through stomata: Differential sensitivity of emission rates to stomatal closure explained, J. Geophys. Res.-Atmos., 108, https://doi.org/10.1029/2002JD002620, 2003.
Nowak, D. J.: Understanding i-Tree: 2023 summary of programs andmethods, U.S. Department of Agriculture, Forest Service, Northern Research Station, USA, https://doi.org/10.2737/NRS-GTR-200-2023, 2024.
Oleson, K. W., Lawrence, D. M., Bonan, G. B., Fisher, R. A., Lawrence, P. J., and Muszala, S. P.: Technical description of version 4.5 of the Community Land Model (CLM), NCAR, https://doi.org/10.5065/D6RR1W7M, 2013.
Opacka, B., Müller, J.-F., Stavrakou, T., Bauwens, M., Sindelarova, K., Markova, J., and Guenther, A. B.: Global and regional impacts of land cover changes on isoprene emissions derived from spaceborne data and the MEGAN model, Atmos. Chem. Phys., 21, 8413–8436, https://doi.org/10.5194/acp-21-8413-2021, 2021.
Opacka, B., Müller, J.-F., Stavrakou, T., Miralles, D. G., Koppa, A., Pagán, B. R., Potosnak, M. J., Seco, R., De Smedt, I., and Guenther, A. B.: Impact of drought on isoprene fluxes assessed using field data, satellite-based GLEAM soil moisture and HCHO observations from OMI, Remote Sens., 14, 2021, https://doi.org/10.3390/rs14092021, 2022.
Pöschl, U., Martin, S. T., Sinha, B., Chen, Q., Gunthe, S. S., Huffman, J. A., Borrmann, S., Farmer, D. K., Garland, R. M., Helas, G., Jimenez, J. L., King, S. M., Manzi, A., Mikhailov, E., Pauliquevis, T., Petters, M. D., Prenni, A. J., Roldin, P., Rose, D., Schneider, J., Su, H., Zorn, S. R., Artaxo, P., and Andreae, M. O.: Rainforest Aerosols as Biogenic Nuclei of Clouds and Precipitation in the Amazon, Science, 329, 1513–1516, https://doi.org/10.1126/science.1191056, 2010.
Qin, Y. M., Tan, H. B., Li, Y. J., Schurman, M. I., Li, F., Canonaco, F., Prévôt, A. S. H., and Chan, C. K.: Impacts of traffic emissions on atmospheric particulate nitrate and organics at a downwind site on the periphery of Guangzhou, China, Atmos. Chem. Phys., 17, 10245–10258, https://doi.org/10.5194/acp-17-10245-2017, 2017.
Rissanen, K., Aalto, J., Bäck, J., Hellén, H., Tykkä, T., and Paquette, A.: Variability in BVOC emissions and air quality impacts among urban trees in Montreal and Helsinki, Atmos. Chem. Phys., 25, 15415–15435, https://doi.org/10.5194/acp-25-15415-2025, 2025.
Sahu, A., Mostofa, M. G., Weraduwage, S. M., and Sharkey, T. D.: Hydroxymethylbutenyl diphosphate accumulation reveals MEP pathway regulation for high CO2-induced suppression of isoprene emission, P. Natl. Acad. Sci. USA, 120, e2309536120, https://doi.org/10.1073/pnas.2309536120, 2023.
Sanaei, A., Herrmann, H., Alshaabi, L., Beck, J., Ferlian, O., Fomba, K. W., Haferkorn, S., van Pinxteren, M., Quaas, J., Quosh, J., Rabe, R., Wirth, C., Eisenhauer, N., and Weigelt, A.: Changes in biodiversity impact atmospheric chemistry and climate through plant volatiles and particles, Commun. Earth Environ., 4, 445, https://doi.org/10.1038/s43247-023-01113-9, 2023.
Silva, S. J., Heald, C. L., and Guenther, A. B.: Development of a reduced-complexity plant canopy physics surrogate model for use in chemical transport models: a case study with GEOS-Chem v12.3.0, Geosci. Model Dev., 13, 2569–2585, https://doi.org/10.5194/gmd-13-2569-2020, 2020.
Skamarock, W. C., Klemp, J. B., Dudhia, J., Gill, D. O., Liu, Z., Berner, J., Wang, W., Powers, J. G., Duda, M. G., Barker, D. M., and Huang, X.-Y.: A Description of the Advanced Research WRF Version 4, NCAR Technical Note NCAR/TN-556 +STR, National Center for Atmospheric Research, 145 pp., https://doi.org/10.5065/1dfh-6p97, 2019.
Stavrakou, T., Müller, J.-F., Bauwens, M., De Smedt, I., Van Roozendael, M., Guenther, A., Wild, M., and Xia, X.: Isoprene emissions over Asia 1979–2012: impact of climate and land-use changes, Atmos. Chem. Phys., 14, 4587–4605, https://doi.org/10.5194/acp-14-4587-2014, 2014.
Stenke, A.: Natural control on ozone pollution, Nat. Clim. Change, 10, 101–102, https://doi.org/10.1038/s41558-019-0686-3, 2020.
Surratt, J. D., Chan, A. W. H., Eddingsaas, N. C., Chan, M. N., Loza, C. L., Kwan, A. J., Hersey, S. P., Flagan, R. C., Wennberg, P. O., and Seinfeld, J. H.: Reactive intermediates revealed in secondary organic aerosol formation from isoprene, P. Natl. Acad. Sci. USA, 107, 6640–6645, https://doi.org/10.1073/pnas.0911114107, 2010.
Tian, X., Zeng, J., Zhang, Y., Pang, W., Lu, Y., Ran, H., Guo, H., Mu, Z., Song, W., and Wang, X.: Measurement report: Age-dependent BVOC emissions in Eucalyptus urophylla: a comparison of leaf cuvette and branch chamber measurements, Atmos. Chem. Phys., 26, 6213–6221, https://doi.org/10.5194/acp-26-6213-2026, 2026.
Vella, R., Forrest, M., Pozzer, A., Tsimpidi, A. P., Hickler, T., Lelieveld, J., and Tost, H.: Influence of land cover change on atmospheric organic gases, aerosols, and radiative effects, Atmos. Chem. Phys., 25, 243–262, https://doi.org/10.5194/acp-25-243-2025, 2025.
Wang, H., Wu, Q., Guenther, A. B., Yang, X., Wang, L., Xiao, T., Li, J., Feng, J., Xu, Q., and Cheng, H.: A long-term estimation of biogenic volatile organic compound (BVOC) emission in China from 2001–2016: the roles of land cover change and climate variability, Atmos. Chem. Phys., 21, 4825–4848, https://doi.org/10.5194/acp-21-4825-2021, 2021.
Wang, H., Lu, X., Seco, R., Stavrakou, T., Karl, T., Jiang, X., Gu, L., and Guenther, A. B.: Modeling Isoprene Emission Response to Drought and Heatwaves Within MEGAN Using Evapotranspiration Data and by Coupling With the Community Land Model, J. Adv. Model. Earth Sy., 14, e2022MS003174, https://doi.org/10.1029/2022MS003174, 2022.
Wang, H., Liu, X., Wu, C., and Lin, G.: Regional to global distributions, trends, and drivers of biogenic volatile organic compound emission from 2001 to 2020, Atmos. Chem. Phys., 24, 3309–3328, https://doi.org/10.5194/acp-24-3309-2024, 2024a.
Wang, H., Welch, A. M., Nagalingam, S., Leong, C., Czimczik, C. I., Tang, J., Seco, R., Rinnan, R., Vettikkat, L., Schobesberger, S., Holst, T., Brijesh, S., Sheesley, R. J., Barsanti, K. C., and Guenther, A. B.: High temperature sensitivity of Arctic isoprene emissions explained by sedges, Nat. Commun., 15, 6144, https://doi.org/10.1038/s41467-024-49960-0, 2024b.
Wang, N., Liu, S., Xu, J., Wang, Y., Li, C., Xie, Y., Lu, H., and Yang, F.: Climate-driven biogenic emissions alleviate the impact of human-made emission reductions on O3 control in the Pearl River Delta region, southern China, Atmos. Chem. Phys., 25, 8859–8870, https://doi.org/10.5194/acp-25-8859-2025, 2025.
Wang, Q., Zhao, J., Du, W., Ana, G., Wang, Z., Sun, L., Wang, Y., Zhang, F., Li, Z., and Ye, X.: Characterization of submicron aerosols at a suburban site in central China, Atmos. Environ., 131, 115–123, https://doi.org/10.1016/j.atmosenv.2016.01.054, 2016a.
Wang, X., Situ, S., Chen, W., Zheng, J., Guenther, A., Fan, Q., and Chang, M.: Numerical model to quantify biogenic volatile organic compound emissions: The Pearl River Delta region as a case study, J. Environ. Sci. (China), 46, 72–82, https://doi.org/10.1016/j.jes.2015.08.032, 2016b.
Wu, G., Yu, Z., Zhou, F., Han, W., Zhou, G., and Liu, S.: Spatio-temporal changes of biomass carbon stocks in China's mixed forests, J. For. Res., 37, 128, https://doi.org/10.1007/s11676-026-02067-2, 2026.
Wu, J., Zhang, Q., Wang, L., Li, L., Lun, X., Chen, W., Gao, Y., Huang, L., Wang, Q., and Liu, B.: Seasonal biogenic volatile organic compound emission factors in temperate tree species: Implications for emission estimation and ozone formation, Environ. Pollut., 361, 124895, https://doi.org/10.1016/j.envpol.2024.124895, 2024.
Wu, K., Yang, X., Chen, D., Gu, S., Lu, Y., Jiang, Q., Wang, K., Ou, Y., Qian, Y., Shao, P., and Lu, S.: Estimation of biogenic VOC emissions and their corresponding impact on ozone and secondary organic aerosol formation in China, Atmos. Res., 231, 104656, https://doi.org/10.1016/j.atmosres.2019.104656, 2020.
Xi, S., Wang, Y., Yuan, X., Feng, Z., Zhao, F., Zhang, Y., and Wang, X.: The Speciated isoprene emission model with the MEGAN algorithm for China (SieMAC), Geosci. Model Dev., 18, 8627–8649, https://doi.org/10.5194/gmd-18-8627-2025, 2025.
Xu, H.: Forestation at the right time with the right species can generate persistent carbon benefits in China, Zenodo [data set], https://doi.org/10.5281/zenodo.8297679, 2023.
Xu, H., Yue, C., Zhang, Y., Liu, D., and Piao, S.: Forestation at the right time with the right species can generate persistent carbon benefits in China, P. Natl Acad. Sci. USA, 120, e2304988120, https://doi.org/10.1073/pnas.2304988120, 2023.
Xu, J., Zhang, Q., Shi, J., Ge, X., Xie, C., Wang, J., Kang, S., Zhang, R., and Wang, Y.: Chemical characteristics of submicron particles at the central Tibetan Plateau: insights from aerosol mass spectrometry, Atmos. Chem. Phys., 18, 427–443, https://doi.org/10.5194/acp-18-427-2018, 2018.
Xu, J., Silver, B., Tang, R., Wang, N., Huang, X., Ding, A., and Arnold, S. R.: A model assessment of the relationship between urban greening and ozone air quality in China: a study of three metropolitan regions, npj Clim. Atmos. Sci., 8, 184, https://doi.org/10.1038/s41612-025-01054-4, 2025.
Yang, W., Cao, J., Wu, Y., Kong, F., and Li, L.: Review on plant terpenoid emissions worldwide and in China, Sci. Total Environ., 787, 147454, https://doi.org/10.1016/j.scitotenv.2021.147454, 2021.
Yi, S., Zhou, J., Lai, L., Du, H., Sun, Q., Yang, L., Liu, X., Liu, B., and Zheng, Y.: Simulating highly disturbed vegetation distribution: the case of China's Jing-Jin-Ji region, PeerJ, 8, e9839, https://doi.org/10.7717/peerj.9839, 2020.
Yu, H., Buchholz, A., Pullinen, I., Saarela, S., Li, Z., Virtanen, A., and Blande, JD: Biogenic secondary organic aerosol participates in plant interactions and herbivory defense, Science, 385, 1225-1230, https://doi.org/10.1126/science.ado6779, 2024.
Zaveri, R. A., Easter, R. C., Fast, J. D., and Peters, L. K.: Model for Simulating Aerosol Interactions and Chemistry (MOSAIC), J. Geophys. Res.-Atmos., 113, https://doi.org/10.1029/2007JD008782, 2008.
Zeng, W., Tomppo, E., Healey, S. P., and Gadow, K. V.: The national forest inventory in China: history – results – international context, For. Ecosyst., 2, 23, https://link.springer.com/article/10.1186/s40663-015-0047-2 (last access: 24 June 2026), 2015.
Zhang, C., Bäck, J., Peñuelas, J., Liu, D., Filella, I., Porcar-Castell, A., and Atherton, J.: Connecting optical remote sensing of plant photosynthesis with biogenic volatile organic compound emissions, New Phytol., 248, 494-506, https://doi.org/10.1111/nph.70504, 2025.
Zhang, X., Xu, J., Kang, S., Liu, Y., and Zhang, Q.: Chemical characterization of long-range transport biomass burning emissions to the Himalayas: insights from high-resolution aerosol mass spectrometry, Atmos. Chem. Phys., 18, 4617–4638, https://doi.org/10.5194/acp-18-4617-2018, 2018a.
Zhang, X., Xu, J., Kang, S., Zhang, Q., and Sun, J.: Chemical characterization and sources of submicron aerosols in the northeastern Qinghai–Tibet Plateau: insights from high-resolution mass spectrometry, Atmos. Chem. Phys., 19, 7897–7911, https://doi.org/10.5194/acp-19-7897-2019, 2019.
Zhang, Y., Du, W., Wang, Y., Wang, Q., Wang, H., Zheng, H., Zhang, F., Shi, H., Bian, Y., Han, Y., Fu, P., Canonaco, F., Prévôt, A. S. H., Zhu, T., Wang, P., Li, Z., and Sun, Y.: Aerosol chemistry and particle growth events at an urban downwind site in North China Plain, Atmos. Chem. Phys., 18, 14637–14651, https://doi.org/10.5194/acp-18-14637-2018, 2018b.
Zhang, Z., Xu, W., Zhang, Y., Zhou, W., Xu, X., Du, A., Zhang, Y., Qiao, H., Kuang, Y., Pan, X., Wang, Z., Cheng, X., Liu, L., Fu, Q., Worsnop, D. R., Li, J., and Sun, Y.: Measurement report: Impact of cloud processes on secondary organic aerosols at a forested mountain site in southeastern China, Atmos. Chem. Phys., 24, 8473–8488, https://doi.org/10.5194/acp-24-8473-2024, 2024.
Zheng, J., Hu, M., Du, Z., Shang, D., Gong, Z., Qin, Y., Fang, J., Gu, F., Li, M., Peng, J., Li, J., Zhang, Y., Huang, X., He, L., Wu, Y., and Guo, S.: Influence of biomass burning from South Asia at a high-altitude mountain receptor site in China, Atmos. Chem. Phys., 17, 6853–6864, https://doi.org/10.5194/acp-17-6853-2017, 2017.
Zhu, J., Penner, J. E., Hong, C., Liu, H., Zhao, X., Deng, J., Liu, C.-Q., Zhang, Q., and Fu, P.: Cropland expansion reduces biogenic secondary organic aerosol and associated radiative cooling, Nat. Geosci., 18, 624–630, https://doi.org/10.1038/s41561-025-01718-z, 2025a.
Zhu, J., Penner, J. E., Liu, H., Guo, Q., Liu, Y., Deng, J., Zhao, X., Liu, C.-Q., and Fu, P.: Reforestation-induced aerosol cooling effects divergently modulated by various types of biogeophysical feedback, Natl. Sci. Rev., 12, nwaf323, https://doi.org/10.1093/nsr/nwaf323, 2025b.
Zhu, Q., He, L.-Y., Huang, X.-F., Cao, L.-M., Gong, Z.-H., Wang, C., Zhuang, X., and Hu, M.: Atmospheric aerosol compositions and sources at two national background sites in northern and southern China, Atmos. Chem. Phys., 16, 10283–10297, https://doi.org/10.5194/acp-16-10283-2016, 2016.
- Abstract
- Introduction
- Methods
- Model evaluations
- Contributions of tree species to BVOC emissions
- BVOC contributions under A&R scenarios
- Conclusion and Discussion
- Appendix A
- Appendix B
- Code availability
- Data availability
- Author contributions
- Competing interests
- Disclaimer
- Acknowledgements
- Financial support
- Review statement
- References
- Abstract
- Introduction
- Methods
- Model evaluations
- Contributions of tree species to BVOC emissions
- BVOC contributions under A&R scenarios
- Conclusion and Discussion
- Appendix A
- Appendix B
- Code availability
- Data availability
- Author contributions
- Competing interests
- Disclaimer
- Acknowledgements
- Financial support
- Review statement
- References