
the Creative Commons Attribution 4.0 License.
the Creative Commons Attribution 4.0 License.
 | 23 Oct 2026
Process-based upgrades to the WRF multi-layer green-roof scheme (WRF-MLGR v2.0) and evaluation against field observations

Maria Martinez Mendoza
Eric Scott Krayenhoff
James Voogt
Andrea Zonato
Sylvie Leroyer
Claudia Wagner-Riddle
Green roofs can moderate urban heat by increasing latent heat flux and reducing sensible heat flux. However, capturing these effects in models depends on accurate representation of key green-roof processes, including substrate heat and moisture transport, soil-vegetation-atmosphere energy and moisture exchanges, interactions with the underlying roof, and drainage. Here we introduce targeted, process-based updates to the green-roof scheme (hereafter, MLGR) within the multi-layer urban canopy model (BEP-BEM) in the WRF mesoscale model to address key limitations in the original formulation. The updates include a non-linear dependence of soil thermal conductivity on moisture, vegetation-modulated surface thermal conductivity, explicit soil-surface evaporation, multi-layer root water uptake for transpiration, and canopy interception with evaporation and dew formation. We evaluate the original and modified MLGR schemes using hourly observations from an extensive sedum roof in London, Canada, for “summer” (1 July–31 August 2014) and “fall” (1 September–31 October 2014) periods. We also analyze 11–18 October 2025, when green roof modules were placed directly on the roof deck – which corresponds to the model's lower boundary assumption. Following implementation of the process-based improvements, model–measurement agreement for the conductive heat flux is markedly improved: RMSE is reduced from 105.9 to 24.0 W m−2 in summer and from 94.2 to 24.0 W m−2 in fall and the model produces more realistic overall green roof energy partitioning. The modified model better captures post-rain increases in latent heat flux (QE) and improves the timing and magnitude of daytime turbulent latent and sensible heat flux peaks (QE and QH). Drainage is reduced relative to the original scheme; however, it remains slightly underestimated during summer and slightly overestimated during fall, and biases persist in surface temperature (warm during the day and cool at night) and in the magnitude and variability of QE. Overall, the revised MLGR physics improves surface-flux realism, and future development should focus on developing a more realistic vegetation canopy submodule.
- Article
(7541 KB) - Full-text XML
-
Supplement
(1273 KB) - BibTeX
- EndNote


Rapid urbanization has intensified heat exposure as cities alter the surface energy balance through suppressed evapotranspiration, enhanced heat storage in impervious materials, and complex radiative geometry (Oke, 1982; Grimmond and Oke, 1999; Oke et al., 2017), producing urban heat islands (UHIs) and compounding heat-wave risks (Arnfield, 2003; Li and Bou-Zeid, 2013). Green roofs, engineered vegetated systems atop buildings, have emerged as a practical intervention capable of reducing air temperatures because they repartition turbulent heat exchange, decreasing sensible heat flux (QH) and enhancing (QE) (Oberndorfer et al., 2007; Berardi et al., 2014; Santamouris, 2014; Tabares-Velasco and Srebric, 2012), act as a sink for air pollutants by trapping particulate matter on vegetated surfaces (Rowe, 2011), and provide hydrologic co-benefits when deployed at scale (Berndtsson, 2010; Stovin, 2010; Li and Babcock, 2014). The magnitude and persistence of these benefits depend on climate, roof composition, vegetation traits, and especially substrate moisture (Sailor et al., 2008; Tabares-Velasco and Srebric, 2012; Tabares-Velasco et al., 2012) and irrigation management, which together control the partitioning of net radiation into heat storage, sensible heat and evapotranspiration (Heusinger et al., 2018).
At the building scale, the EnergyPlus “EcoRoof” module introduced a physically based coupling between a plant canopy and an engineered soil substrate, while highlighting the need for more mechanistic hydrology and canopy microclimate formulations (Sailor, 2008; Sailor et al., 2008; Heusinger et al., 2018). Subsequent work showed that sensible-heat reduction depends strongly on water availability, with post-rain evaporation playing a key role in shifting energy partitioning toward latent heat flux and enhanced cooling (Heusinger et al., 2018). At the city scale, urban canopy parameterizations (UCPs) embedded in mesoscale models, single-layer schemes (Kusaka et al., 2001; Yang et al., 2015), and multi-layer approaches such as TEB (Masson, 2000; Hamdi and Masson, 2008) and BEP (Martilli et al., 2002; Salamanca et al., 2011) represent radiative geometry, turbulent exchange, storage, and building–atmosphere feedbacks, enabling scenario testing of rooftop interventions at neighbourhood and city scales (Zonato et al., 2021). These coupled model frameworks have been used to assess how green roofs influence urban temperature and heat mitigation, and how these changes affect building energy demand, in both idealized and real-city applications (Li et al., 2014; Sun et al., 2016; de Munck et al., 2018; Jiang et al., 2025).
Despite this progress, there are two persistent gaps that limit fidelity at urban scales. First, the hydrology and thermophysics of thin, engineered substrates are often simplified in mesoscale implementations relative to detailed building-scale models (Yang et al., 2015; Ribeiro et al., 2021). Second, ensuring strict conservation of energy and water across multi-layer substrate and canopy elements remains challenging in offline tests and coupled WRF runs (Tsiringakis et al., 2019; Lipson et al., 2024). Addressing these issues is essential if we are to translate building-scale realism into robust city-scale modelling of green roof scenarios.
This study advances the state of green-roof representation in the WRF multi-layer urban canopy model (BEP+BEM). A recent process-level evaluation of the WRF-BEP+BEM green roof scheme (Zonato et al., 2021) has identified structural deficiencies in its representation of vegetation and soil processes, including the absence of soil evaporation and lack of canopy radiative buffering, which lead to systematic biases in energy partitioning, pronounced daytime warm biases in surface temperature (Ts), and failure to reproduce the observed diurnal phase and magnitude of QE and QG (Martinez Mendoza et al., 2026). These findings motivate the targeted physical upgrades and evaluation presented here. We further develop and evaluate this model (Zonato et al., 2021) by (i) applying a moisture-dependent thermal conductivity that improves soil heat storage and release during high soil water content, (ii) modulating effective surface thermal conductivity as a function of vegetation cover to better capture diurnal heat storage, (iii) adding direct soil evaporation alongside plant transpiration to represent total evapotranspiration, (iv) allowing plant water uptake from all substrate layers rather than the top layer alone, and (v) including interception storage, evaporation, and dew formation on leaves. Together, these changes target the two gaps above: improving flux partitioning and the phase and magnitude of diurnal cycles, including the timing of QH, QE, and QG, while remaining computationally compatible with WRF's BEP+BEM framework and conserving energy and mass.
Our objectives are twofold. First, we document the implementation of new formulations in the green-roof scheme implemented in WRF's multi-layer urban canopy model (BEP+BEM). Second, we evaluate the modified model against observations from a monitored extensive green roof in London, Canada, assessing surface temperature, turbulent latent heat flux, storage heat flux, substrate moisture, and runoff.
2.1 Experimental design
2.1.1 Site and simulation periods
Field observations were collected from a green-roof test array on the rooftop of the Talbot College building at Western University (London, Ontario, Canada). The analysis focuses on the instrumented central portion of the array, which is elevated above the surrounding roof surface to accommodate lysimeters and drainage units. The monitored modules were planted with Sedum spurium and had a total substrate depth of 0.15 m.
This paper evaluates the WRF multi-layer green-roof scheme using observations from 2014 and a focused period in 2025. We analyze two continuous periods in 2014: “summer” (1 July–31 August 2014) and “fall” (1 September–31 October 2014). We also examine 11–18 October 2025, when the heat-flux module was moved from the upper array to a layer of styrofoam insulation above the roof deck, providing a better physical match to the modeled roof–substrate setup for clearer interpretation of measured ground heat flux.
Raw measurements were quality controlled, and time periods affected by instrument malfunction, maintenance, calibration events, or missing data were excluded. For this paper, both the observational time series and the corresponding model output were processed to hourly resolution (hourly means for state variables and fluxes, and hourly totals for precipitation). Further details on the site instrumentation, observational processing, and quality-control procedures are provided in Martinez Mendoza et al. (2026); readers are referred there for a complete description of the observational dataset.
2.1.2 Simulation development
The simulations were performed using the multi-layer green roof scheme from WRF v4.3.3 with BEP+BEM in offline mode. The full atmospheric WRF model was not run. Instead, the green roof model was driven directly by observed meteorological forcing.
Atmospheric forcing data were prescribed from observations collected on the roof at, or near, the green-roof array. The forcing time series includes incoming shortwave radiation (W m−2), incoming longwave radiation (W m−2), near-surface air temperature (°C), relative humidity (%), wind speed (m s−1), precipitation (mm; hourly accumulation), and surface air pressure (Pa). Pressure was taken from the nearby London A meteorological station at London International Airport (WMO 71623).
Initial conditions for prognostic substrate temperature and water-content variables were prescribed using the available observations at the initialization time. Geometric and material parameters (e.g., layer depths) were prescribed from site measurements and prior characterization (Martinez Mendoza et al., 2026; Perelli, 2014).
2.1.3 Evaluation metrics
Model performance was assessed against measurements of latent heat flux QE (W m−2), surface ground heat flux QG (W m−2), surface temperature Ts (°C), and substrate volumetric water content θ (m3 m−3).
Performance statistics reported in Table 1 include mean absolute error (MAE), root-mean-square error (RMSE), systematic RMSE (RMSEs), unsystematic RMSE (RMSEu), and the refined index of agreement (d) following Willmott et al. (2012).
Table 1Performance statistics for the original and modified WRF multi-layer green-roof models during summer and fall. QE and QG in W m−2; Ts in °C; θ in m3 m−3.
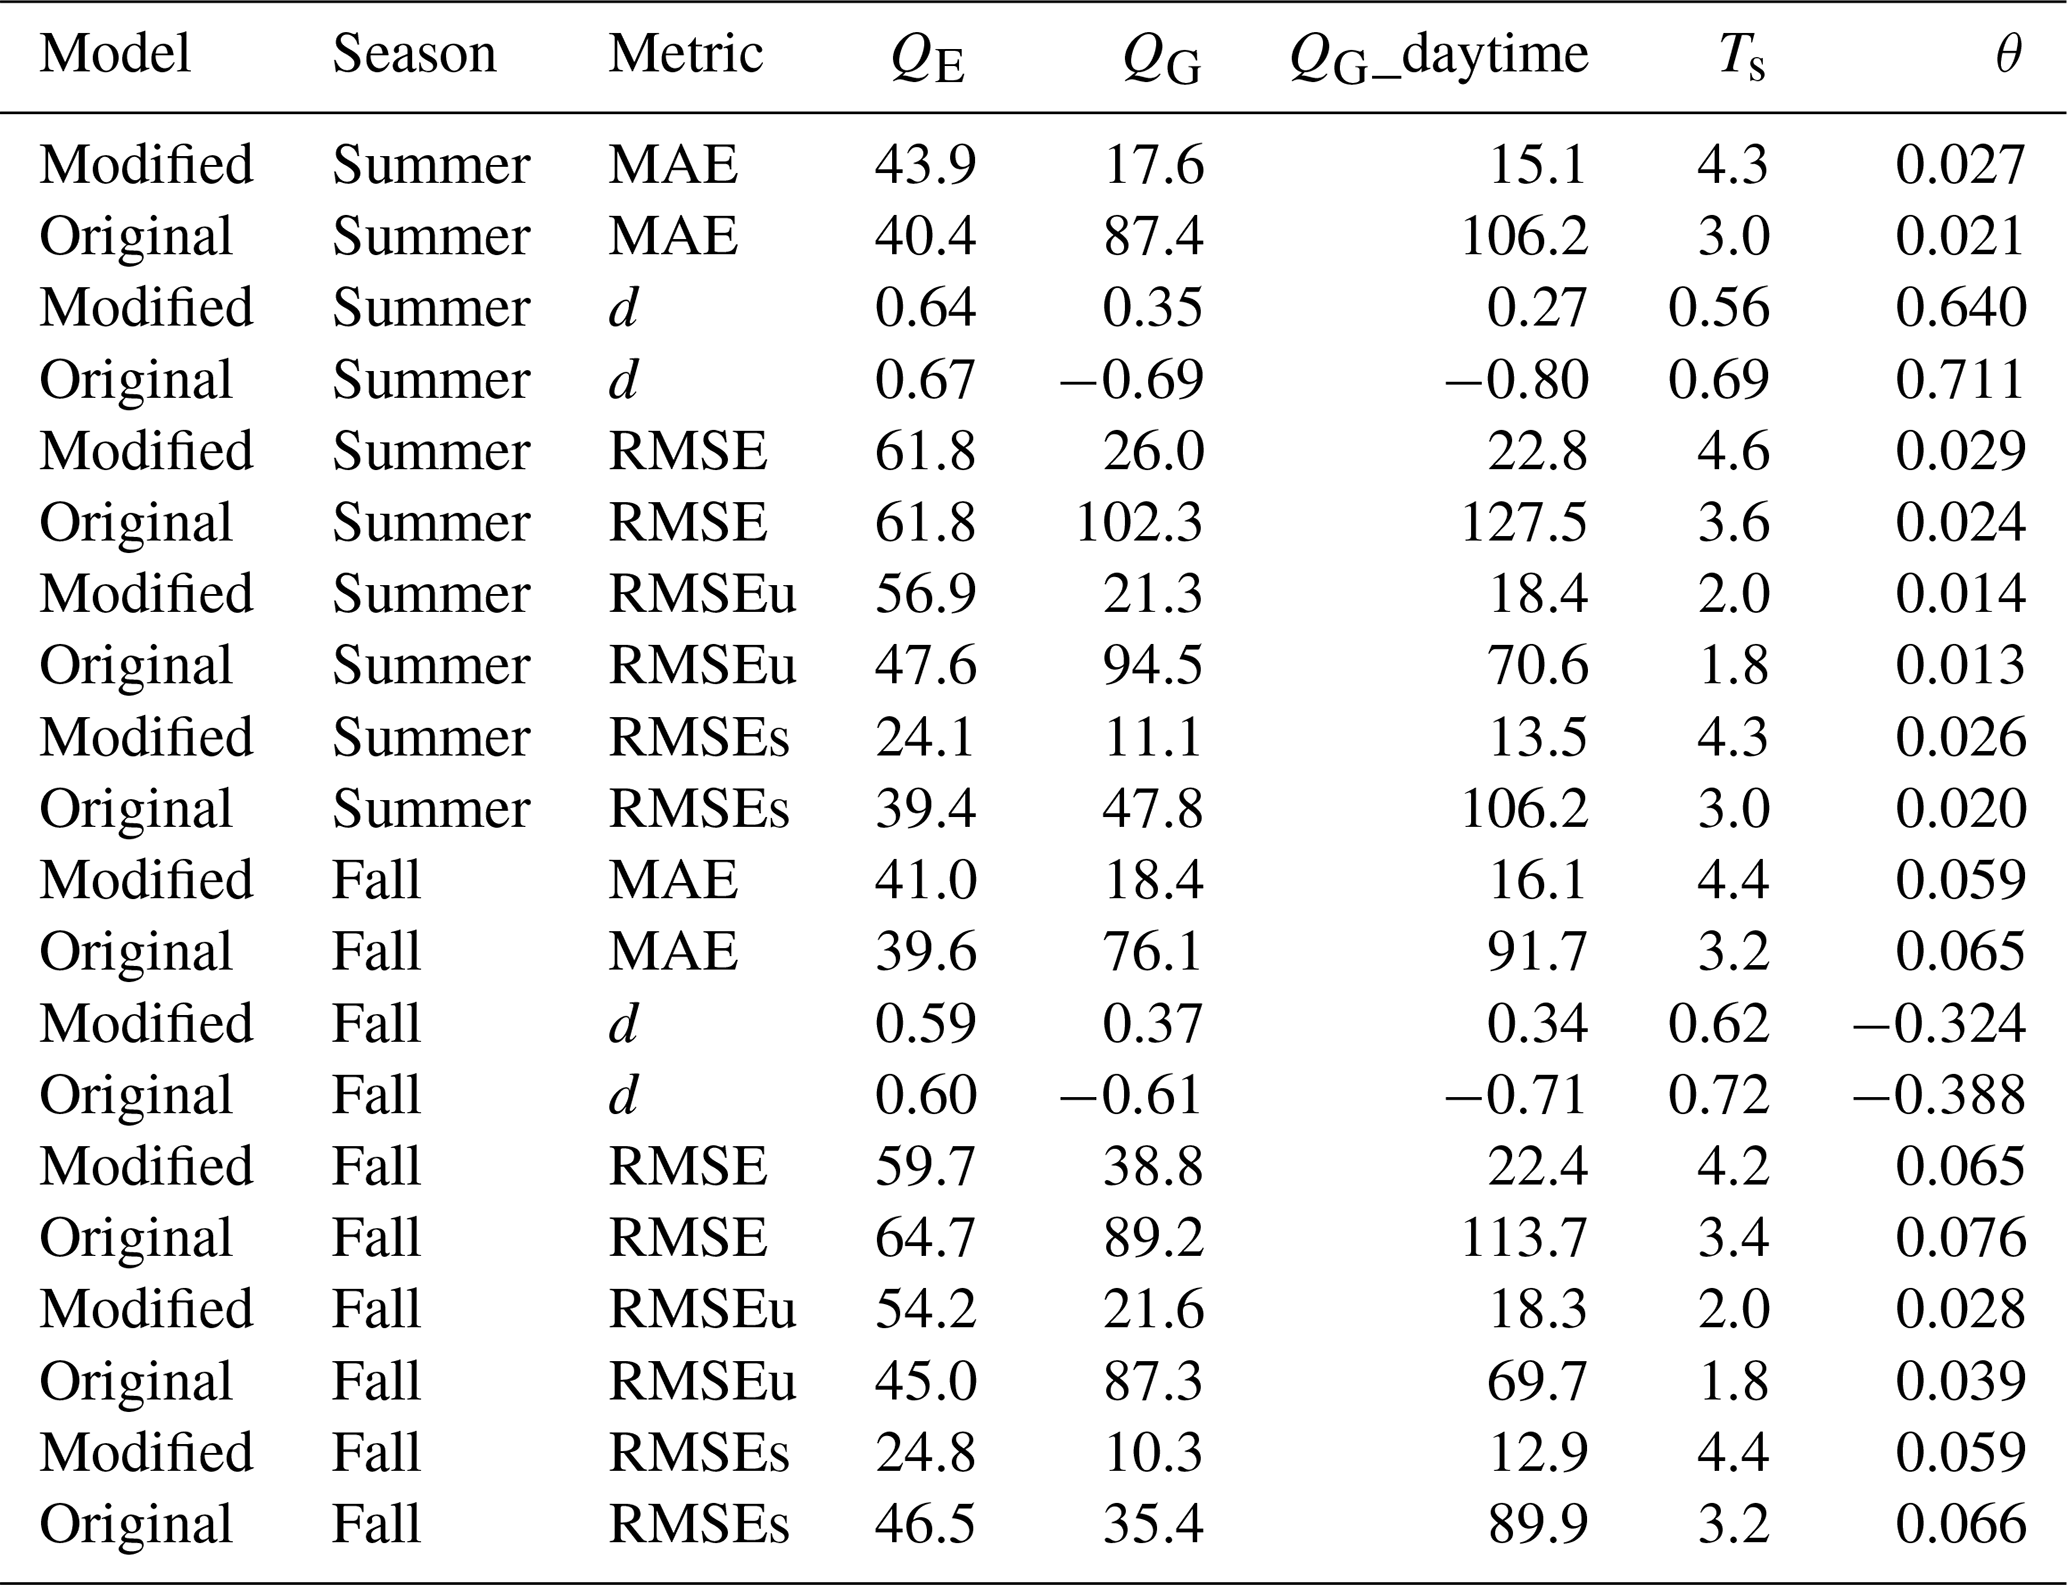
Note: MAE = mean absolute error; RMSEu = unbiased RMSE; RMSEs = systematic RMSE; d = refined index of agreement per Willmott et al. (2012).
The coefficient of determination (R2) shown in the scatter plots was calculated using the residual-based form (Onyutha, 2022), where Mi and Oi are the modeled and observed values, respectively, and is the mean of the observations. This metric evaluates model performance relative to the observed mean as a reference predictor; values below zero indicate that the model performs worse than simply using the observed mean (Nash and Sutcliffe, 1970; Onyutha, 2022).
2.2 Original WRF multi-layer urban canopy model green roof scheme
Following the formulations of de Munck et al. (2013), as summarized by Zonato et al. (2021), the offline WRF-MLGR configuration contains 10 thermal layers in total. Six layers represent the green-roof substrate and have a combined depth of 0.15 m, consistent with the observed substrate depth of the experimental modules, while the remaining four layers represent approximately 0.15 m of underlying roof construction. Thus, the complete modeled thermal column is approximately 0.30 m deep, but only the upper 0.15 m represents the green-roof substrate. Temperature is calculated in all thermal layers, while volumetric water content is calculated only for the six soil layers. Layer-resolved soil temperature and moisture diagnostics are provided in Figs. S2 and S3.
During the offline evaluation, the indoor temperature is not simulated. Instead, the model uses a fixed temperature of 23 °C at the bottom of the green-roof system. representing a typical indoor/building temperature and providing the lower thermal boundary condition for the offline simulations. This temperature affects the amount of heat transferred between the green roof and the underlying roof. This model computes the roof's heat and water balances by accounting for net radiation, water added by rainfall and irrigation, evapotranspiration from the vegetation, convective heat exchange with the atmosphere, and the vertical diffusion of heat and moisture within the soil layers. In the original scheme, the model makes an important simplification: it does not distinguish a separate vegetation canopy in terms of radiation exchange, or a distinct canopy air layer for heat and moisture exchange. Instead, the green roof has a single surface and associated temperature which is effectively a soil surface with the ability to transpire (and with substantive thermal admittance, unlike a vegetation canopy). Therefore, the reported surface temperature Ts in the current WRF-MLGR formulation should be interpreted as a bulk or aggregated green-roof skin temperature, rather than as a separately resolved soil-surface temperature, vegetation-canopy temperature, or canopy-air temperature. It is this surface that exchanges heat and moisture with the atmosphere and conducts heat downward into the roof/substrate column. Heat transfer within the layers is then calculated based on Fourier diffusion, and for the soil-based roof layers the model uses a moisture-dependent thermal diffusivity (Zonato et al., 2021):
where Ψ is the moisture potential (matric suction; negative under unsaturated conditions), and is the volumetric heat capacity of wet soil (). It is computed as a weighted average of the volumetric heat capacity of dry soil (Cd) and water (Cw), with θ the volumetric water content Zonato et al. (2021).
For hydrology, rainfall (and optional irrigation) is added at the green roof (i.e., soil) surface, and water moves only vertically through the substrate in a one-dimensional column; therefore, lateral subsurface flow is not represented. Any excess water that reaches the drainage layer is removed as drainage. In the baseline scheme, moisture loss to the atmosphere is represented through plant transpiration (controlled by canopy and atmospheric resistances), and the model does not include a separate explicit term for direct soil-surface evaporation. The scheme also does not explicitly track a separate canopy-interception water store.
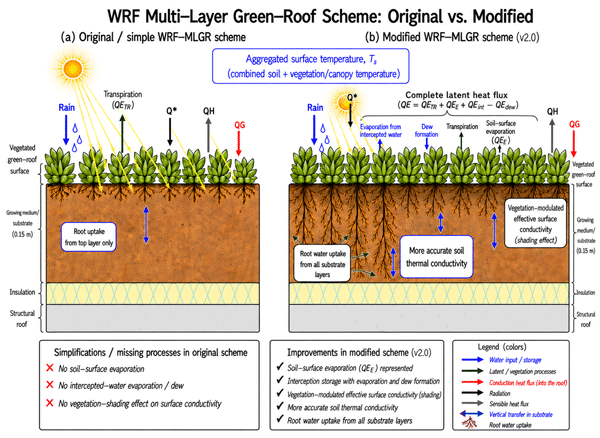
As discussed by Martinez Mendoza et al. (2026), the original green roof scheme in the WRF multi-layer urban canopy model exhibits important limitations, particularly in its representation of soil heat flux (Qg). The model does not correctly reproduce the timing and magnitude of Qg, and these errors propagate through the surface energy balance, leading to inaccuracies in both the strength and timing of latent (Qe) and sensible (Qh) heat fluxes. This issue is traced to the fact that there is no radiative canopy, and the soil layer (which has high thermal admittance relative to vegetation) is the radiatively active surface in the model instead of the vegetation. In the next section we detail several updates to this original model version that correct this problem as well as other model issues, and also add additional functionality and realism. To clarify the structural and process-level differences between the original and modified WRF multi-layer green-roof schemes, Fig. 1 provides a schematic comparison of the two model formulations. The figure highlights the main layer structure, the key heat and water flux pathways, and the locations of the five process-based modifications introduced in Sect. 2.3.
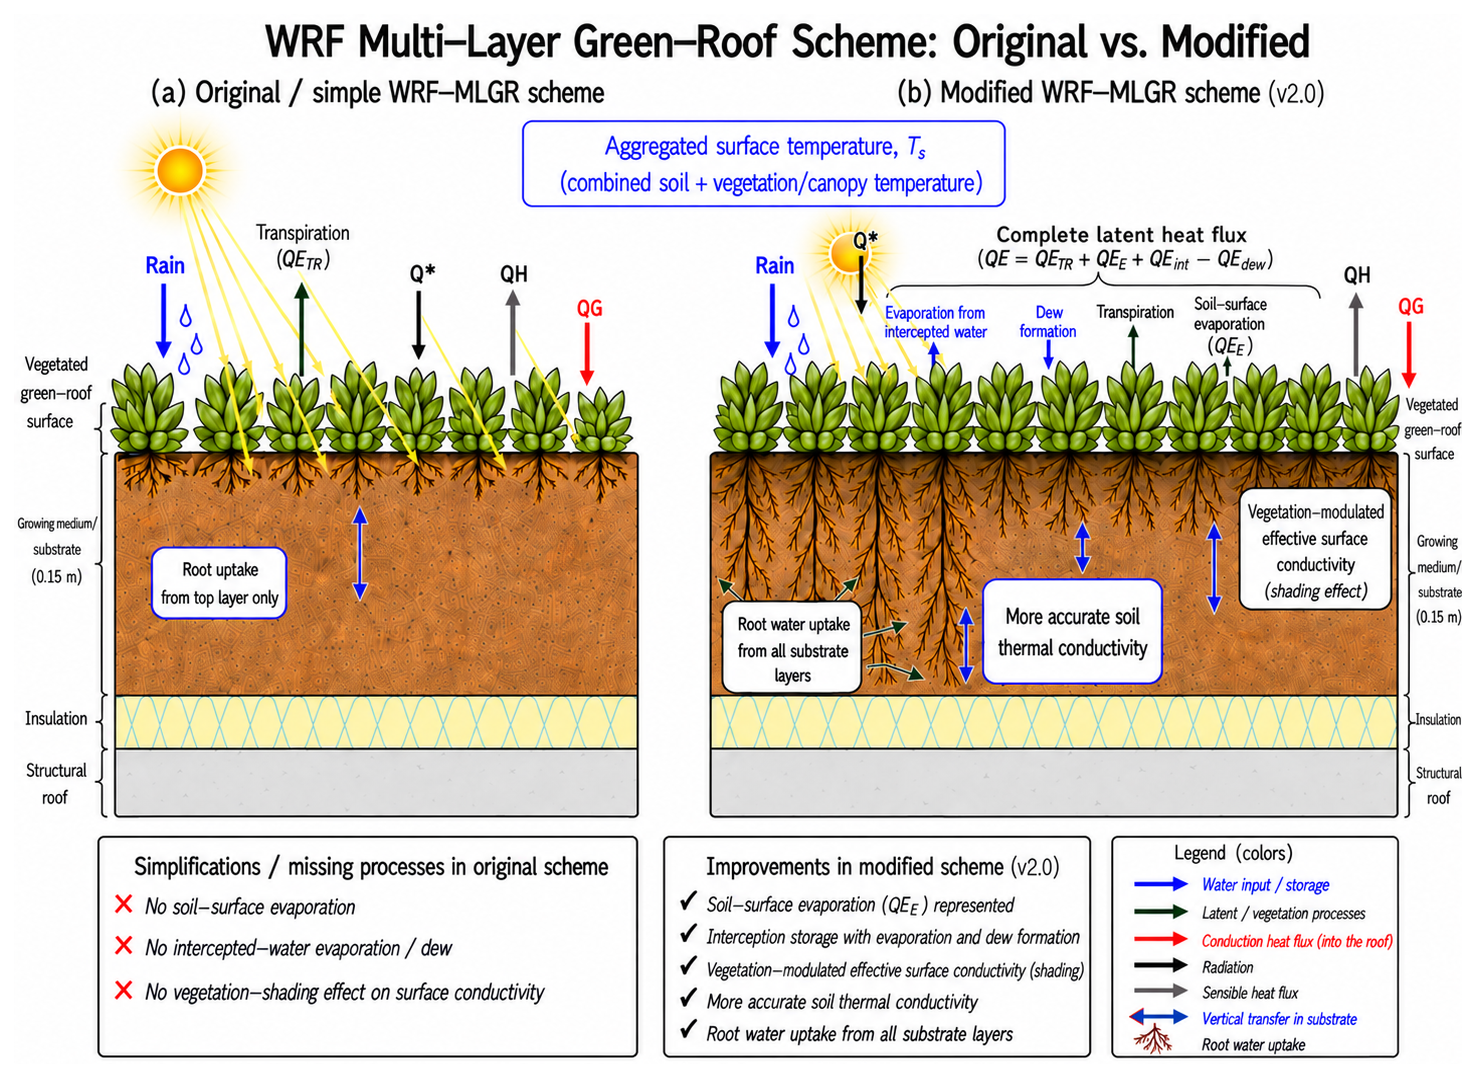
Figure 1Schematic comparison of the original and modified WRF multi-layer green-roof schemes.
2.3 Modifications to the WRF multi-layer urban canopy model green roof scheme
To improve the representation of heat and water exchange in the WRF multi-layer green-roof scheme, we implemented five physically based modifications. The two thermal modifications mainly change how heat moves through the green roof substrate and how much energy is stored as QG. The revised soil thermal conductivity provides a more realistic representation of heat transfer as soil moisture changes, while the vegetation-dependent surface conductivity reduces excessive heat storage at the soil surface to represent the effect of vegetation shading on heat storage.
The three hydrological modifications mainly affect evapotranspiration and soil water. Soil evaporation allows water to evaporate directly from the substrate surface. Multilayer root uptake allows plants to take up water from several soil layers rather than only from the top layer. Canopy interception allows rainfall to be temporarily stored on the vegetation, evaporated back to the atmosphere, and also allows dew formation. Together, these modifications change QG and QE and therefore also affect how the remaining available energy is partitioned into QH.
2.3.1 Revised soil thermal conductivity (“Ksoil”)
In the original scheme, the substrate soil thermal conductivity, k, was defined as a simple linear function of volumetric water content. This approach tends to overestimate heat conductivity when the soil is very wet, which can make the simulated ground heat flux too large and reduce the diurnal range of surface temperature under wet conditions. To address this, we replaced the linear relationship with a Johansen-type formulation (Peters-Lidard et al., 1998). In this method, the effective soil thermal conductivity, k, is calculated as a weighted combination of the dry and saturated conductivities using the Kersten number, Ke:
Here kdry is the dry soil thermal conductivity, ksat is the saturated soil thermal conductivity, and Ke is a dimensionless function of the degree of saturation. For dry soils we follow Peters-Lidard et al. (1998), who recommend the following semi-empirical expression for kdry as a function of dry bulk density ρb (kg m−3) and mineral density ρs (kg m−3):
with ρs=2700 kg m−3 for mineral soils. The saturated thermal conductivity ksat is calculated from the volume fractions and thermal conductivities of solids, water, air, and (when present) ice. The Kersten number Ke is parameterized as a smooth function of liquid water saturation, with different coefficients for coarse and fine substrates, which reduces the sensitivity of k at very low moisture contents. Overall, the updated formulation gives a more realistic shift from dry to wet conditions and reduces the unrealistically high soil heat conduction produced by the original linear method.
2.3.2 Vegetation-dependent surface thermal conductivity (“Heat Storage”)
In the original green-roof scheme, the model does not include an explicit vegetation canopy, so it does not represent vegetation cover or the shading effect of plants. This means the soil surface receives the full incoming radiation, which can lead to unrealistically large surface heat storage, particularly in the morning, with associated impacts on morning sensible and latent heat fluxes. To make the simulated surface heat storage more realistic, we added a vegetation dependent effective surface conductivity that acts as a simplified representation of the vegetation effect on surface heat storage. Following Peters-Lidard et al. (1997) and Ek et al. (2003), we used a vegetation-dependent effective thermal conductivity at the top soil layer, kveg, which scales the bare-soil conductivity ks1 by an exponential function of vegetation cover σf:
where σf is the fractional vegetative coverage of the roof and βveg is an empirical coefficient. Consistent with offline Noah LSM tests (Ek et al., 2003), βveg was set to 2.0. Corresponding effective thermal conductivities were used within the upper 10 cm of soil for the calculation of heat conduction.
To quantify the effect of the revised thermal treatment, we compared the time-varying average soil thermal conductivity produced by the original and modified green-roof schemes during summer 2014 (Fig. S1 in the Supplement). The original formulation produced unrealistically large and highly variable conductivity values, with peaks exceeding 49 , indicating excessive conductive heat transfer under wet conditions. In contrast, the modified formulation produced conductivity values mainly within the range 0.32–0.98 , which is physically more reasonable for engineered green-roof growing media, for which thermal conductivity has been shown to vary strongly with substrate moisture content and composition (Barozzi et al., 2017; Shao et al., 2021).
2.3.3 Addition of soil surface evaporation (“Soil Evap”)
In the original WRF multi-layer green-roof model, latent heat flux was derived only from plant transpiration, and direct evaporation from the soil surface was not included. This approach is not applicable to scenarios where green roof vegetation fraction drops significantly below 1.0. We used the bulk-transfer approach of Viterbo and Beljaars (1995) to quantify evaporation from the soil/substrate surface. The evaporation rate from the top substrate layer, QEE (), is given by:
where ρ is air density, ra is the aerodynamic resistance between the surface and the lowest atmospheric model level, qL is the specific humidity at that level, and qsat(Tsk,ps) is the saturation specific humidity at the surface skin temperature Tsk and surface pressure ps. α(θ1) is a soil-wetness factor that scales the soil-surface vapor pressure (and thus soil evaporation) from dry to saturated conditions. It is computed from the top-layer water content θ1, with α≈1 for wet soil and smaller α for drier soil defined as:
where θ1 is the volumetric water content of the upper soil layer and θcap the field-capacity value, Viterbo and Beljaars (1995).
2.3.4 Multi-layer transpiration and root water uptake (“Root Uptake”)
In the original scheme, plant transpiration draws water only from the thin uppermost soil layer, which can make the surface layer dry too quickly. As a result, when the top layer becomes dry, the model limits transpiration, leading to reduced transpiration and an underestimation of latent heat flux. To address this issue, we introduced a multi-layer root-uptake approach that distributes the transpiration demand across the soil layers based on their available water, assuming that plant roots have good access to all soil layers. Total transpiration Et () is still computed using the original canopy-resistance formulation, but the fraction taken from layer i is:
where dzi is the thickness of layer i, and the sum is over the N soil layers from which transpiration is allowed to draw water. The transpiration extraction from layer i is then:
2.3.5 Interception storage, evaporation, and dew formation on leaves (“Intercepted Water”)
Finally, we implemented a canopy interception sub-model following Heusinger et al. (2018), whose formulation is based on Cammalleri et al. (2010). This sub-model tracks the canopy water store on the leaves and accounts for both evaporation of intercepted water and dew formation (condensation) on the leaf surfaces, depending on atmospheric conditions. The maximum amount of water that can remain on the leaves (interception storage capacity) is assumed to be proportional to leaf area index (LAI):
Here, FSmax (m) is a parameter that depends on leaf inclination and morphological properties. A value of Fsmax=0.2 mm was adopted based on measurements conducted for herbaceous species on a mountain meadow in Austria (Wohlfahrt et al., 2006). At each time step, a fraction of the incident precipitation P is intercepted in proportion to vegetation cover σf:
The intercepted water depth on the canopy, S, is updated by adding I. If S exceeds Smax, the excess water drips to the top soil layer as D:
where Δt is the model time step. Water stored on the leaves exchanges moisture with the canopy air through a bulk-transfer formulation of the latent heat flux from intercepted water, LI (W m−2):
In this expression, Cf is a bulk transfer coefficient, Lv is the latent heat of vaporization, uaf is wind speed at canopy height, ρaf is air density at canopy height, qaf is the specific humidity in the canopy air space, and qf,sat is the saturation specific humidity at foliage temperature. The factor r accounts for the fullness of the interception store:
When intercepted water is present on the canopy, a fraction of the leaf area is assumed to be water-covered (r), so transpiration is limited to the remaining dry fraction (1−r); as the interception store evaporates and r decreases, transpiration progressively returns toward its dry-canopy rate. So, transpiration (Zonato et al., 2021) is defined as:
Here ra is the aerodynamic resistance (Louis, 1979) and rs is the stomatal resistance.
3.1 Surface energy balance and temperature
Performance of the original and modified WRF multi-layer green-roof models was assessed against measurements of latent (QE) and ground (QG) heat fluxes at the surface, surface temperature (Ts), and soil water content (θ), along with a residual estimate of sensible heat flux (QH).
Time series show small warm biases for both modelled surface temperatures (Fig. 2a and b). For latent heat flux (QE), the original and modified models show similar overall performance in summer, with identical RMSE and R2 values (61.8 W m−2 and R2=0.40, respectively). However, the original model has a slightly lower MAE and higher refined index of agreement (d) than the modified model (40.4 vs. 43.9 W m−2; d=0.67 vs. 0.64). In fall, the modified model shows a lower RMSE and higher R2 than the original model (59.7 vs. 64.7 W m−2; R2=0.29 vs. 0.17), while the original model has a slightly lower MAE and slightly higher d (39.6 vs. 41.0 W m−2; d=0.60 vs. 0.59) (Table 1; Fig. 2e and f). For ground heat flux (QG), the largest model observation discrepancy occurs at night, when the observed QG signal becomes nearly flat and approaches zero, whereas both model versions simulate a stronger nighttime heat release. The experimental configuration can influence measured QG throughout the full diurnal cycle because the elevated modules leave an air space beneath the green roof system and the individual modules introduce exposed lateral boundaries. These effects appear to be strongest at night due to smaller energy balance forcing (i.e., Q∗) at this time, but may also influence daytime measurements. We therefore additionally report daytime-only QG metrics (QG_daytime) in Table 1. Nevertheless, the air gap may also impact the daytime measurements (further discussed later in this section based on measurements in 2025).
Overall, for QG the modified model delivers a clear, season-independent improvement, with significant reductions in total error. The removal of bias evident in the original model simulations (lower RMSE and higher index of agreement; Table 1) is visible in both seasons (Fig. 2c and d). This indicates a substantive correction to substrate heat storage, which impacts modelled QE and critically, QH.
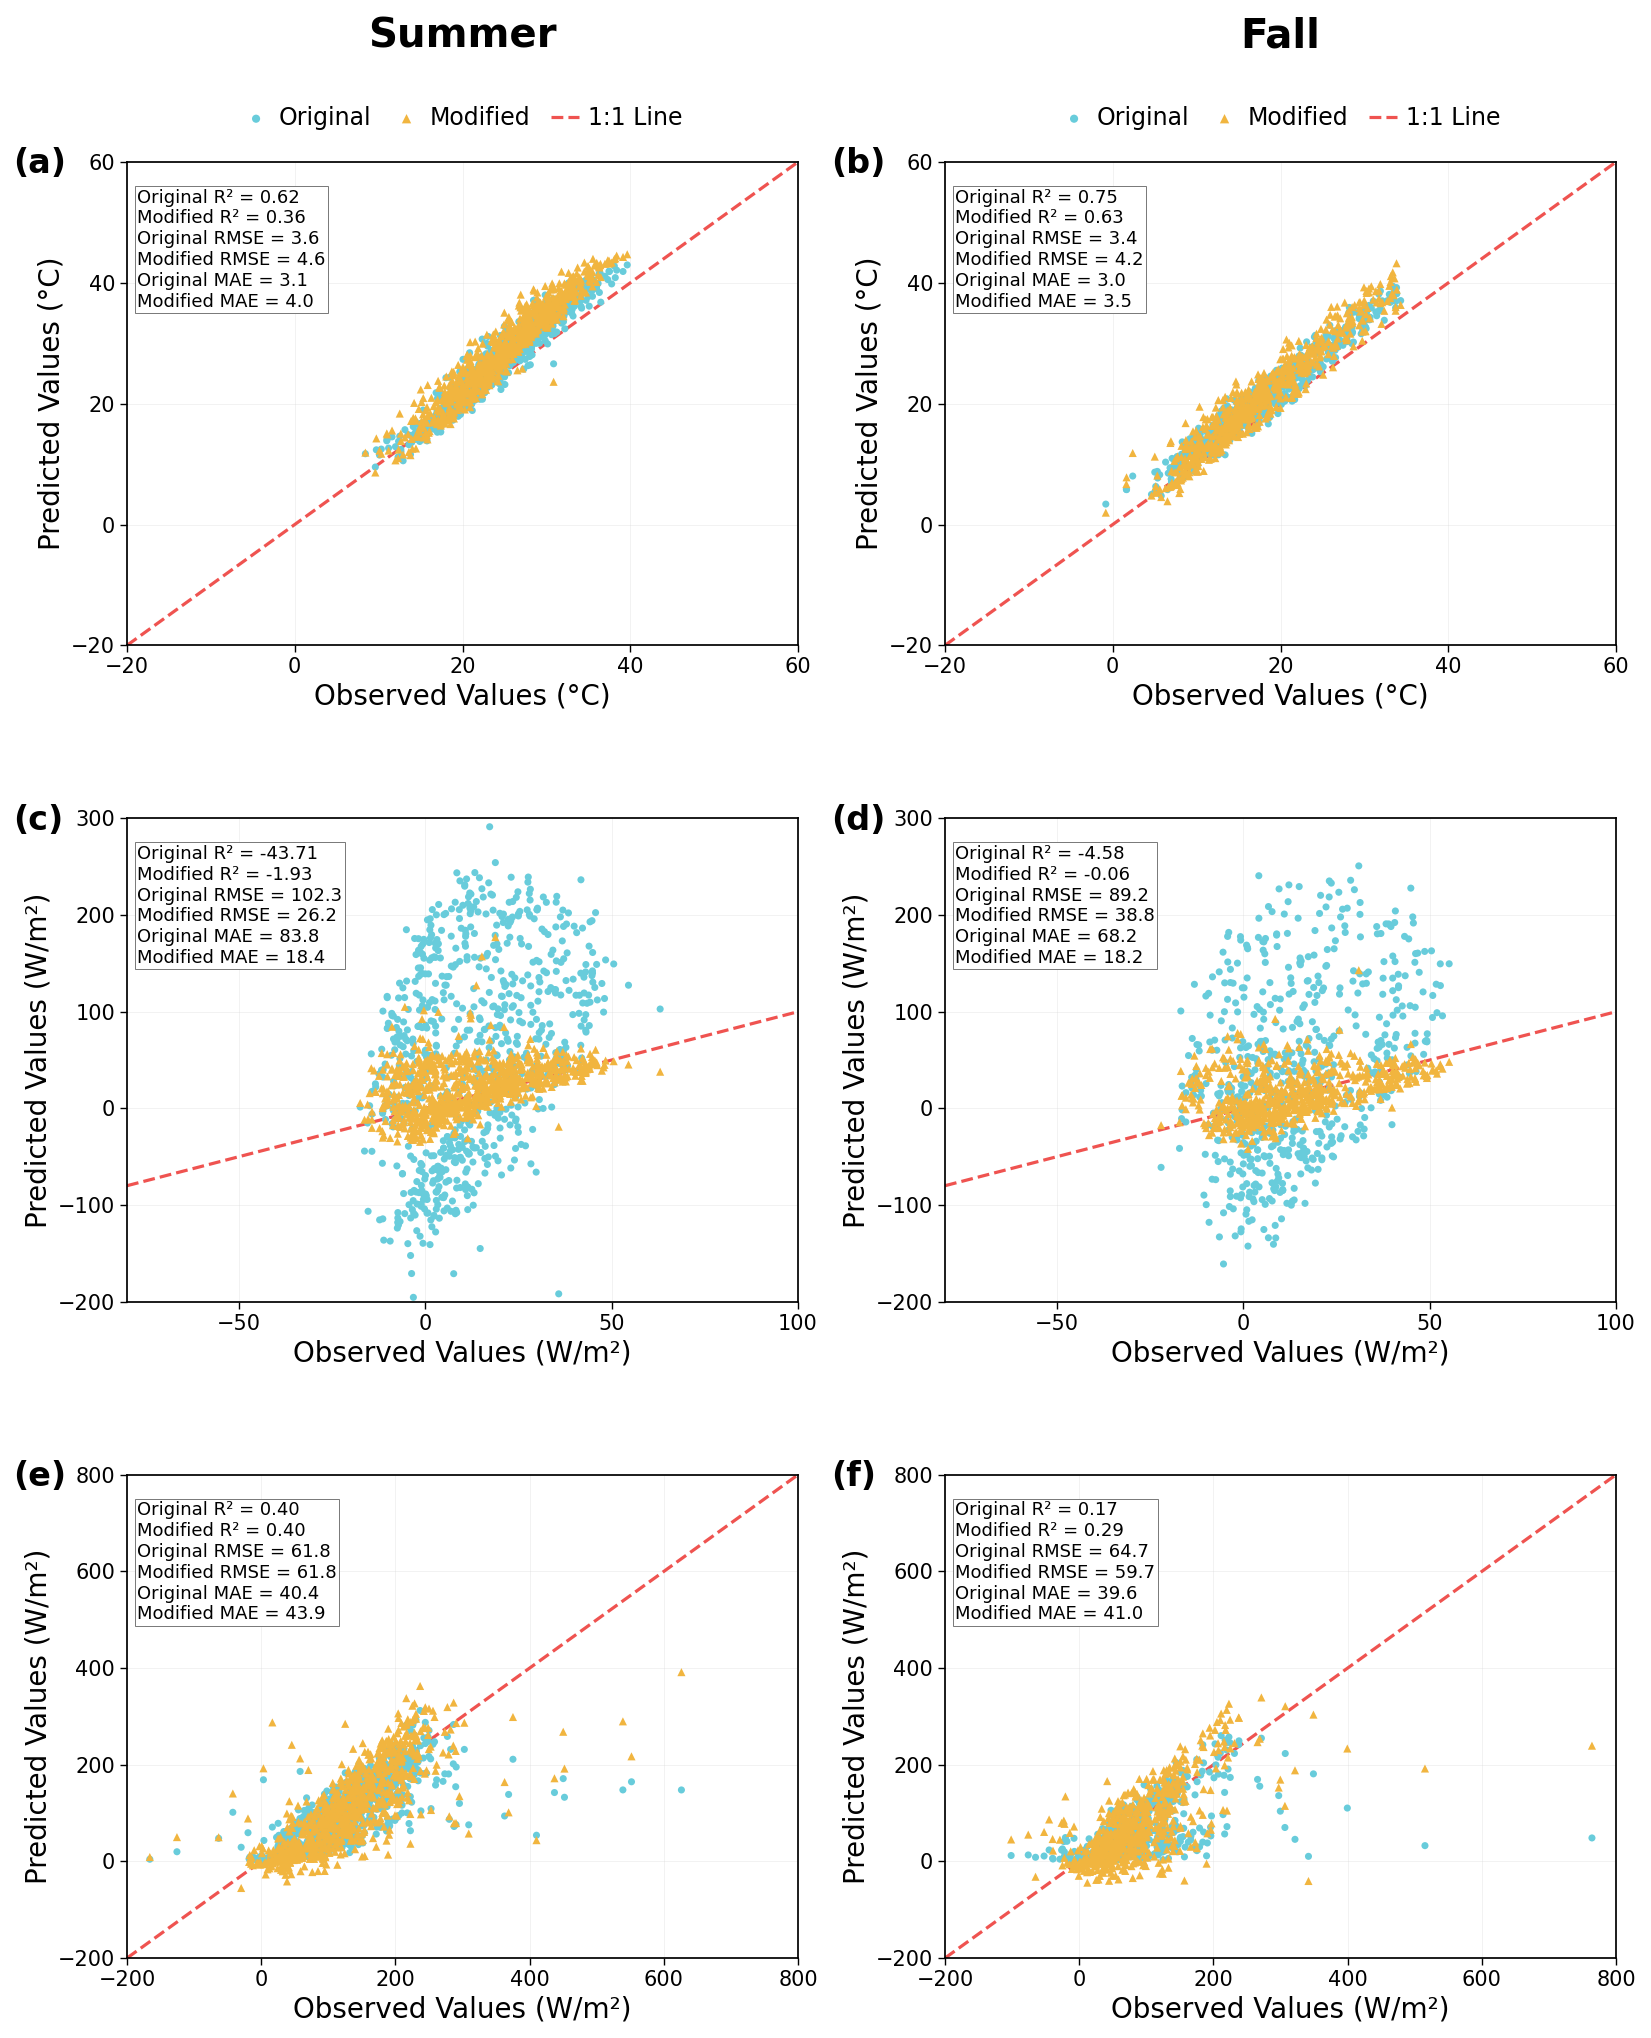
Figure 2Comparison of the original and modified multi-layer green roof models against observations during 1 July to 31 August 2014 (Summer; left column) and 1 September to 31 October 2014 (Fall; right column). In each panel, the original model is shown with blue circles and the modified model with orange triangles. Panels (a) and (b) show surface temperature, Ts (°C); panels (c) and (d) show soil heat flux, QG (W m−2); and panels (e) and (f) show latent heat flux, QE (W m−2). The dashed red line indicates the 1:1 line, and R2, RMSE, and MAE are reported in each panel.
In terms of soil water content (θ), the original model shows slightly better statistical agreement with the observations during summer, with a lower RMSE and higher refined index of agreement (d) than the modified model (Table 1). In fall, however, the modified model shows slightly better agreement, with a lower RMSE and a less negative d. Overall, the two model configurations produce similar seasonal evolution of soil water content, particularly during summer (Figs. 3d and 4d). The relatively good summer performance of the original model does not necessarily indicate that its simpler hydrological representation is more physically realistic, because compensating differences in atmospheric water loss and drainage reduce overall errors. This behaviour is examined further in Sect. 3.2 based on the seasonal water-balance analysis presented in Sect. S3 and Table S1 in the Supplement.
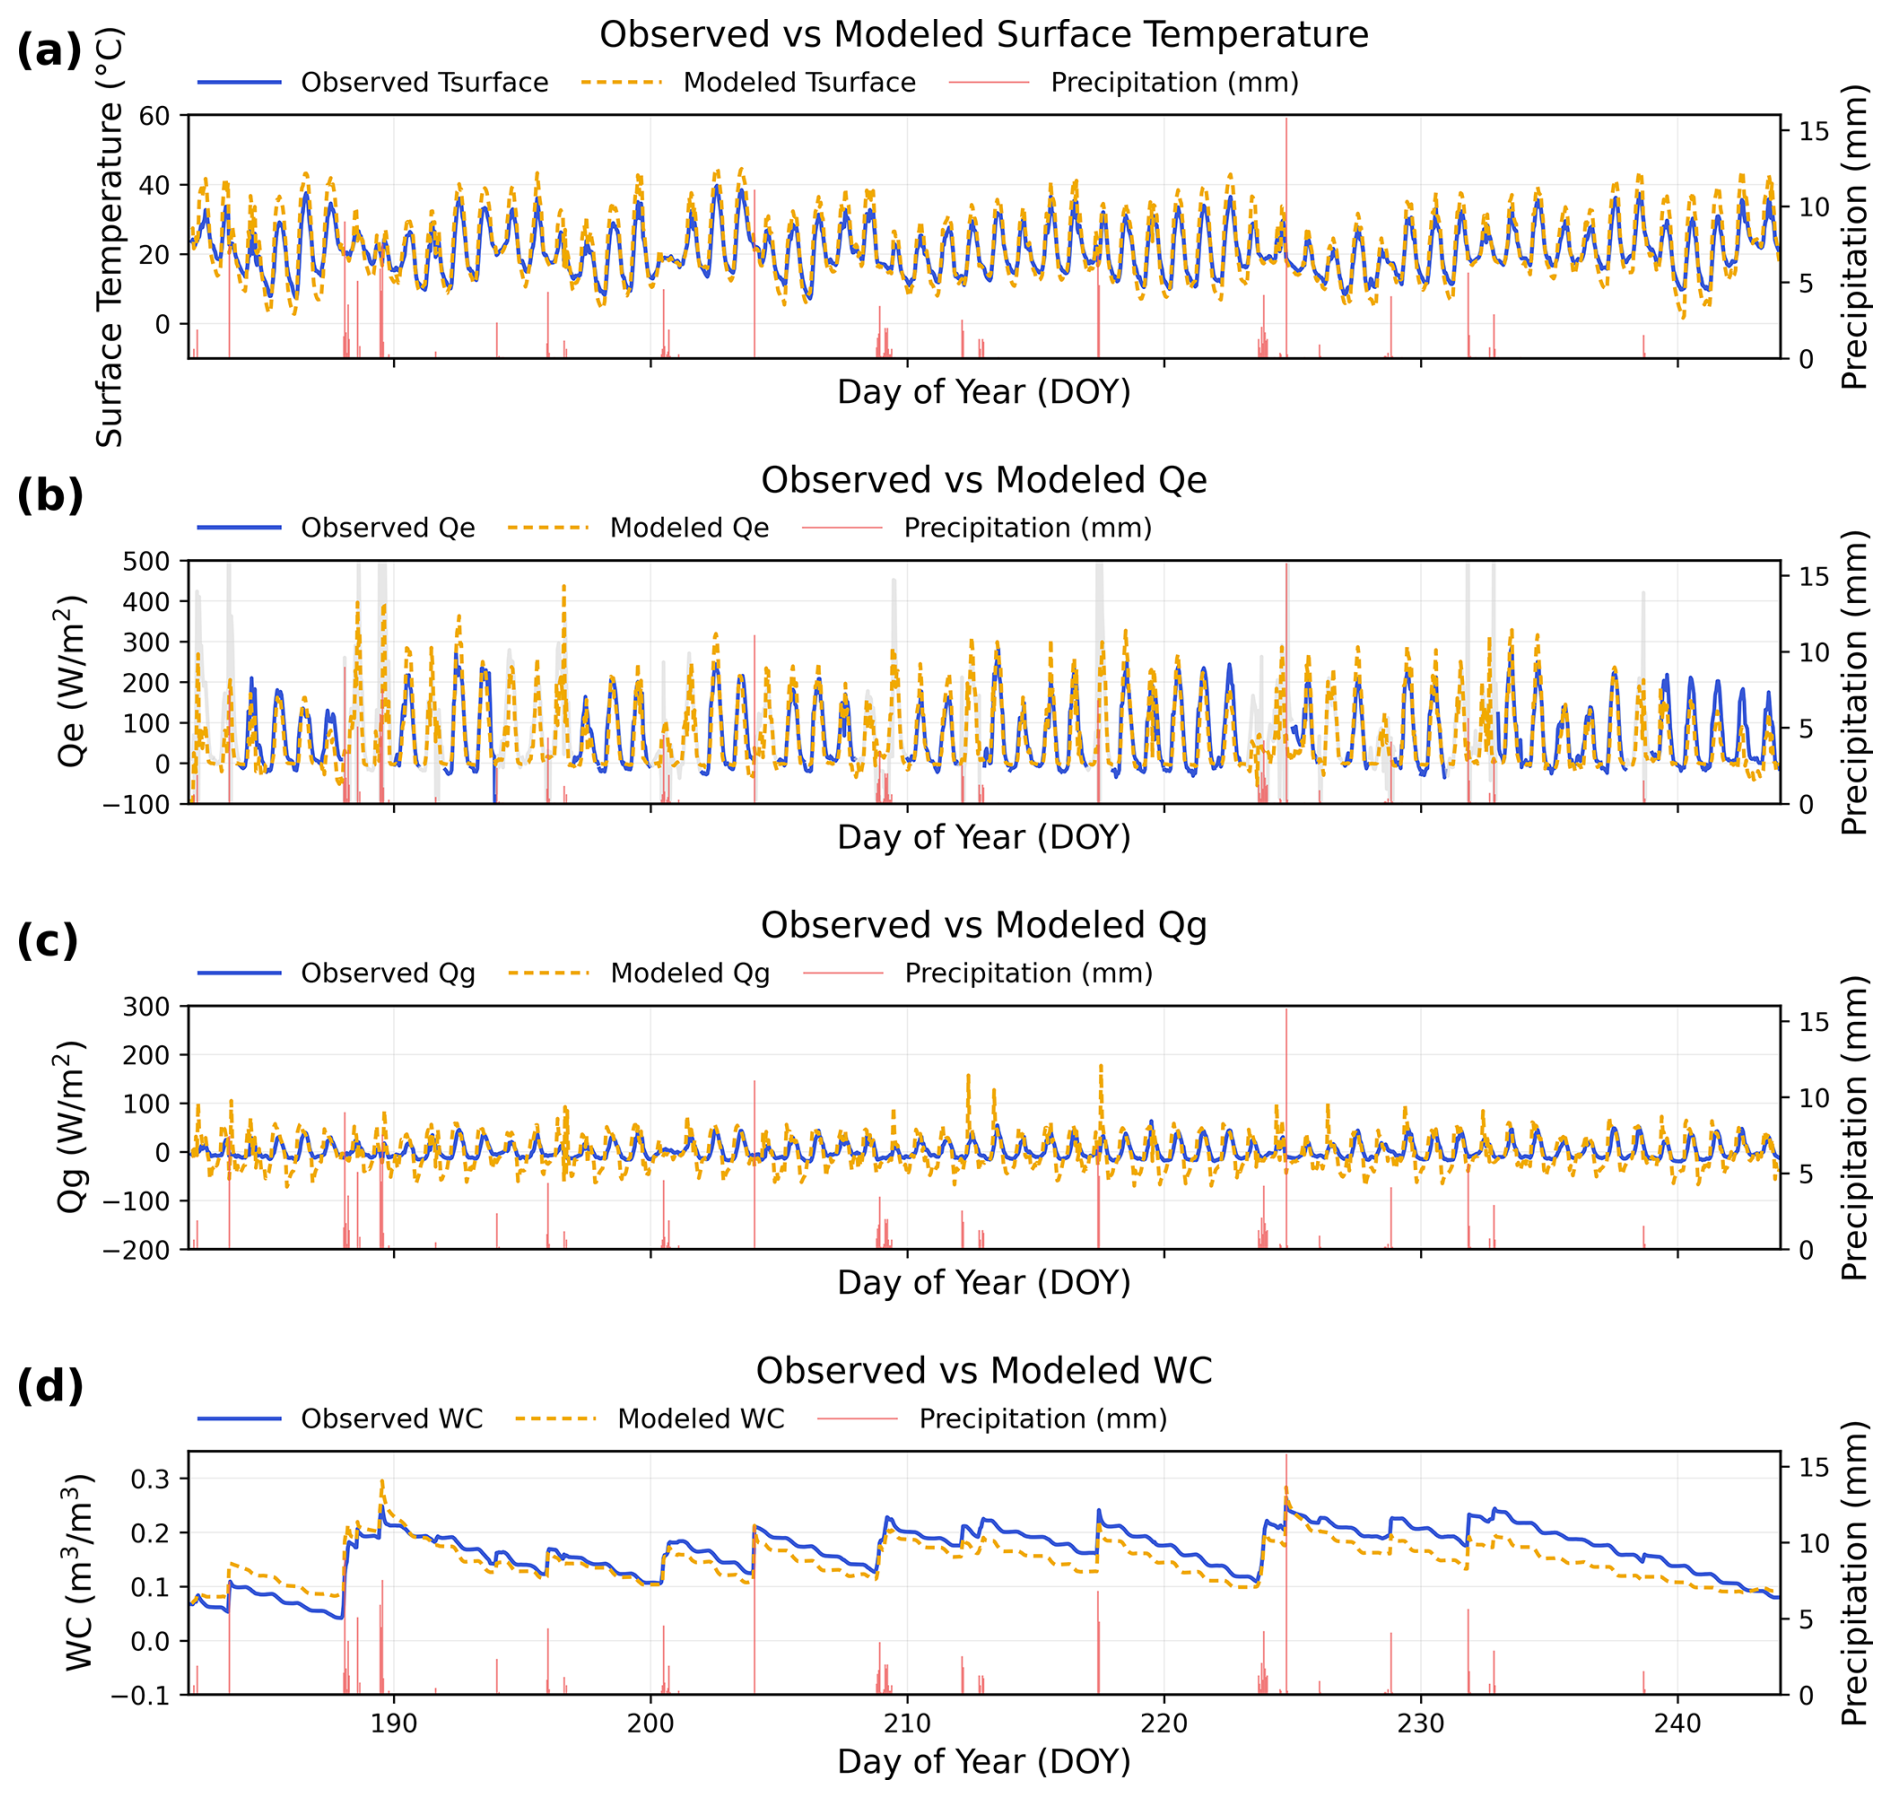
Figure 3Observed and modified model daily (a) surface temperature Ts, (b) latent heat flux QE, (c) ground heat flux QG, and (d) volumetric soil water content θ for a period from 1 July to 31 August 2014. In panel (b), gray lines indicate observed latent heat flux during rainy days.
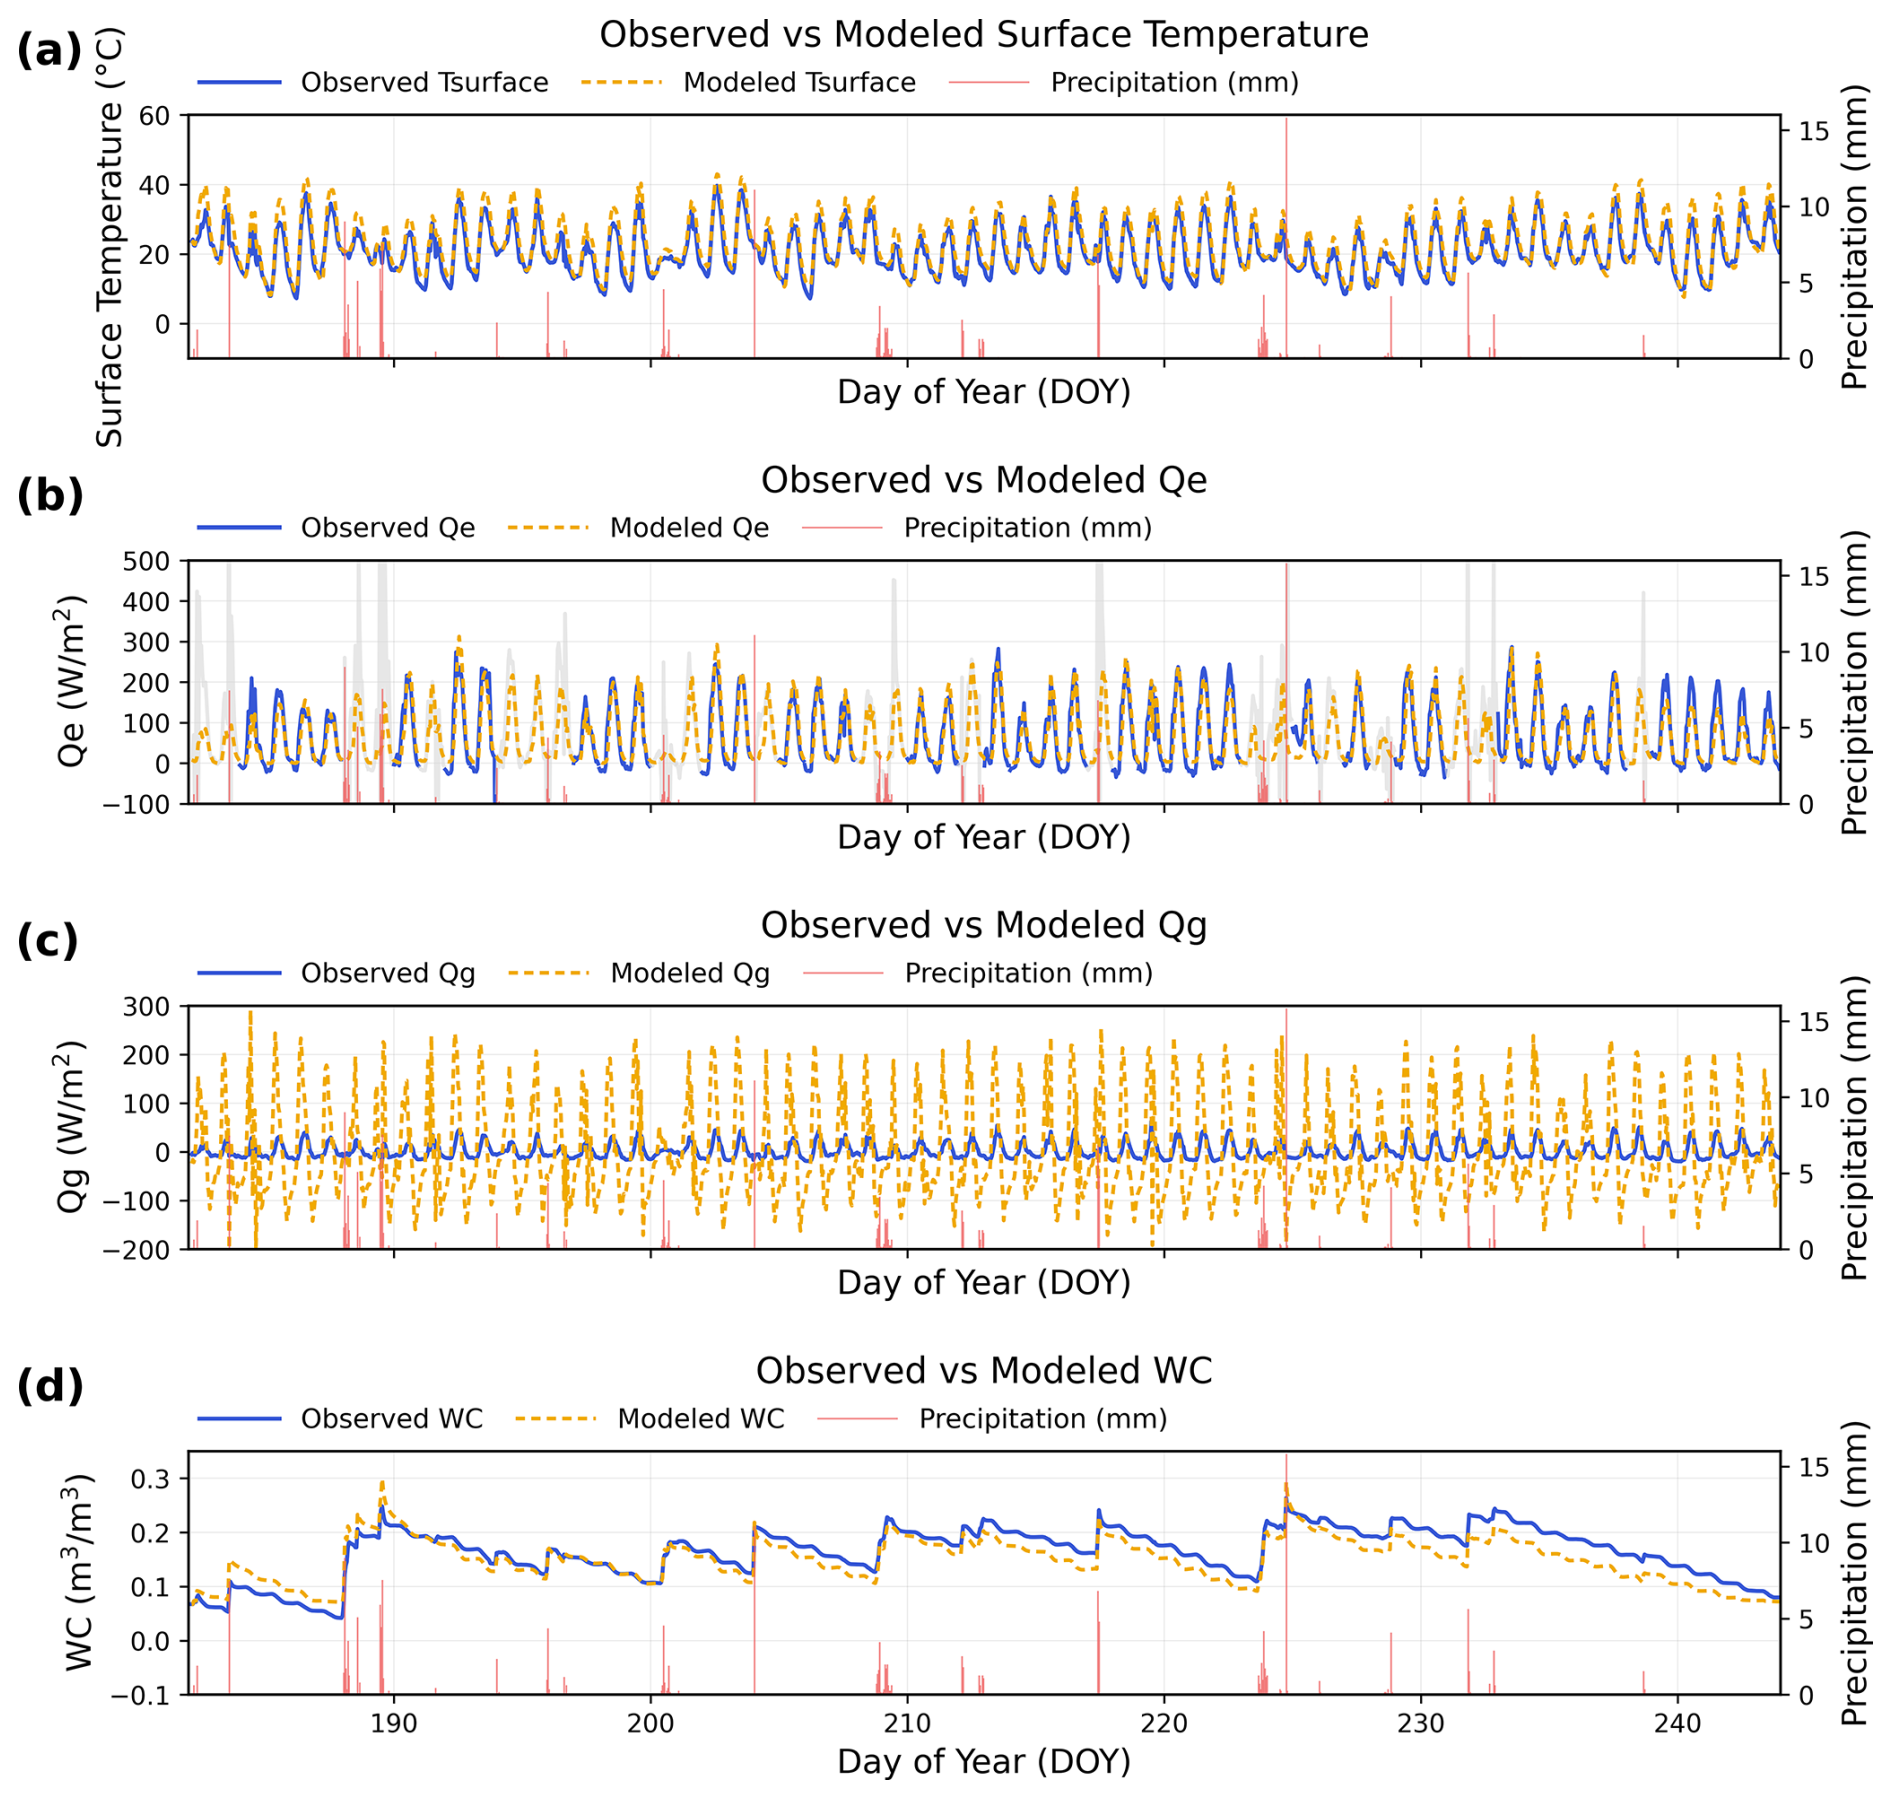
Both models slightly overestimate daytime surface temperature maxima; at night, the modified model shows a stronger cold bias, while the original exhibits a smaller bias (Figs. 3a and 4a). The original model underestimates daytime latent heat flux and largely misses the immediate post-rainfall increase, whereas the modified model better matches both the timing and magnitude of the peaks. For direct visual comparison of the timing and magnitude of the original and modified model responses, the corresponding time series are overlaid in Fig. S4. In particular, the sharp increase in QE after rainfall is clearly seen in the observations but is missed by the original model. By adding evaporation from intercepted water on the foliage, the modified model can now reproduce this post-rainfall boost in latent heat flux. This addition allows the model to respond quickly to wet conditions and better match the observed evapotranspiration peaks (Figs. 3b and 4b). To illustrate the post-rainfall latent-heat-flux response more clearly, Fig. 5 shows an event spanning 15–17 July 2014 (DOY 196–198). Following precipitation on DOY 196, the leaf wetness sensor signal increases sharply, indicating rapid wetting of the sedum canopy surface. At the same time, the modified model produces a strong, short-lived increase in modeled latent heat flux (QE), consistent with enhanced evaporation immediately after rainfall (including evaporation of intercepted water on the canopy). As the leaf surfaces dry, both the leaf wetness signal and modelled QE decrease. The lysimeter-derived observed QE also increases rapidly following rainfall and shows close temporal agreement with the modeled response, with only a small difference in the timing of the peak. In fact, observed QE is derived from changes in lysimeter mass over each measurement interval, which can contribute to small differences in the apparent timing of the responses. In contrast, the original model shows a much more muted response and largely fails to capture the rapid post-rainfall peak.
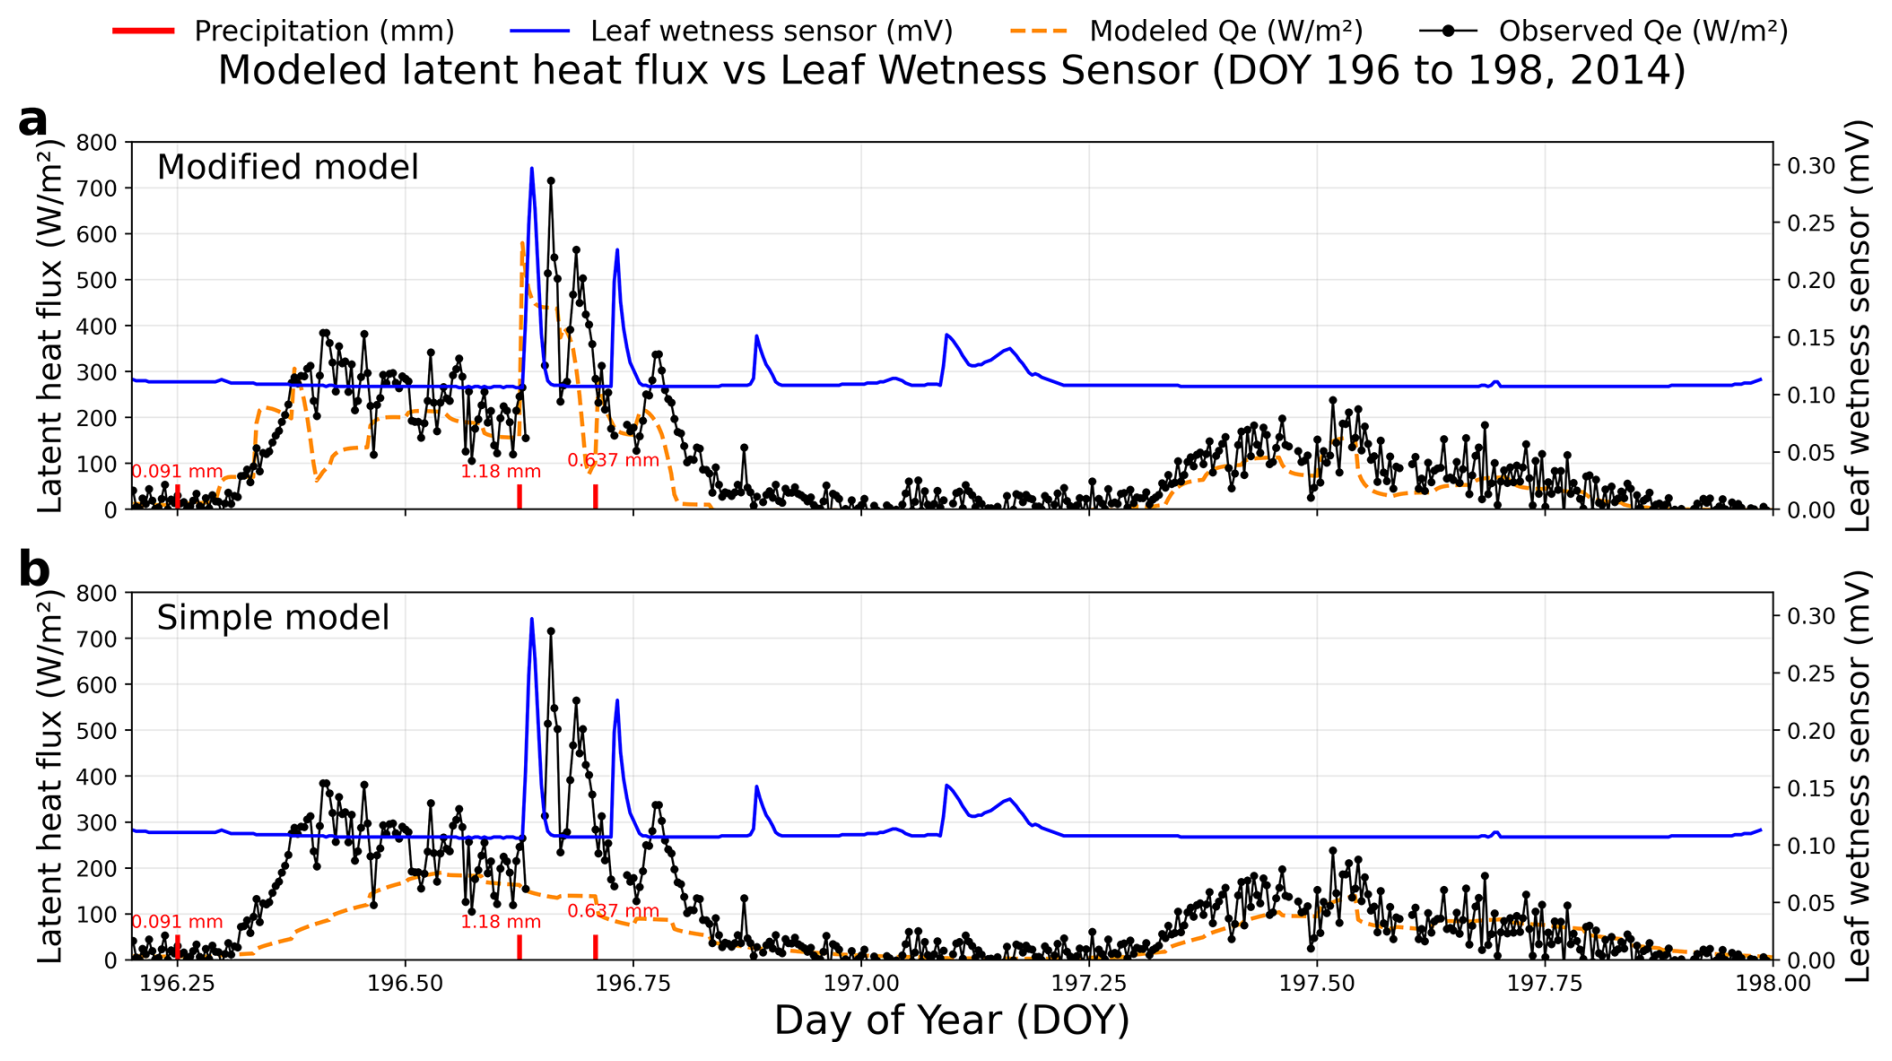
Figure 5Event-scale comparison of modeled latent heat flux (left axis, W m−2) with leaf wetness sensor signal at the sedum surface (right axis, mV) and precipitation (red bars, mm) for DOY 196–198 (15–17 July 2014). The leaf wetness sensor reports the raw voltage output (mV) from the probe; higher values indicate a wetter surface. Modeled QE is shown in dashed orange for (a) modified model and (b) original model. Observed QE is shown as the solid black line with markers.
The most pronounced differences between the model versions appear in the ground heat flux: the modified model damps the exaggerated daytime spikes seen in the original model and exhibits a more realistic nocturnal recovery, consistent with improved substrate thermal conductivity and heat storage – and hence better phase and amplitude (Figs. 3c and 4c). In addition to the long-period evaluation, Fig. 6 shows an event-scale comparison of observed and modeled ground heat flux (QG) for 11–18 October 2025 (DOY 284–291), a week with clear observations. During this period, the experimental green-roof module was placed directly on the roof deck (i.e., without an airspace beneath), providing lower-boundary conditions for vertical heat-flux measurements that are both more typical of actual green roofs and which match the model assumptions. Under these conditions, the observed QG exhibits a physically consistent diurnal cycle, and the modified model reproduces the main phase and amplitude of QG variability, including the daytime peaks and nighttime recovery (R2=0.642).
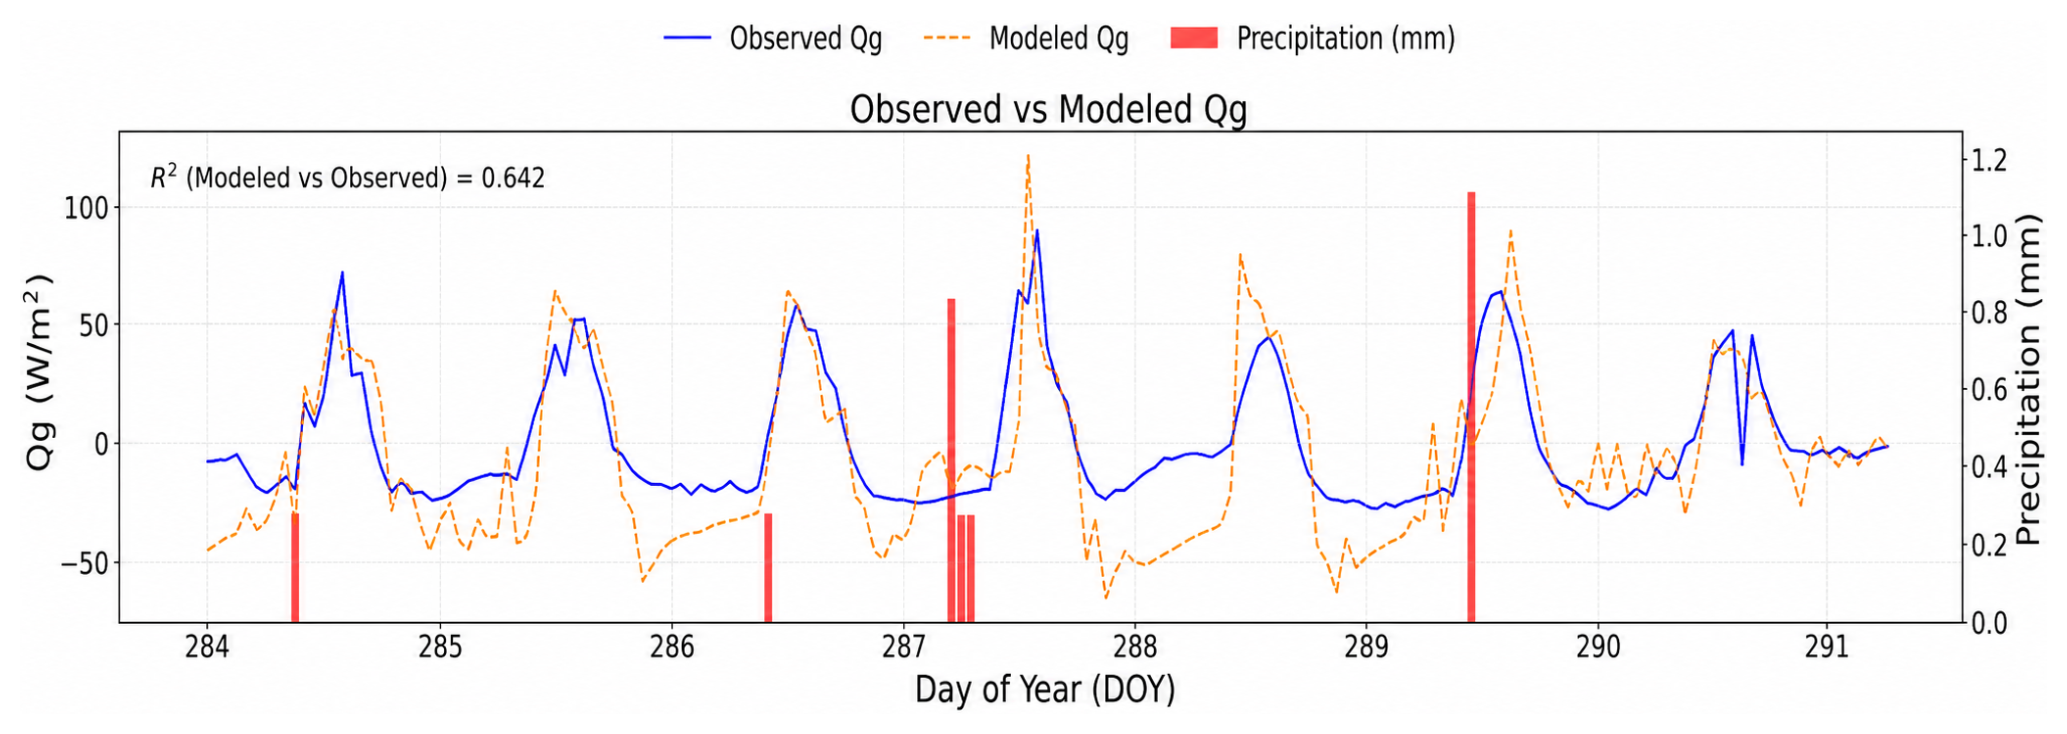
Figure 6Observed and modeled (modified model) ground heat flux (left axis) and precipitation (right axis) for 11–18 October 2025 (DOY 284–291).
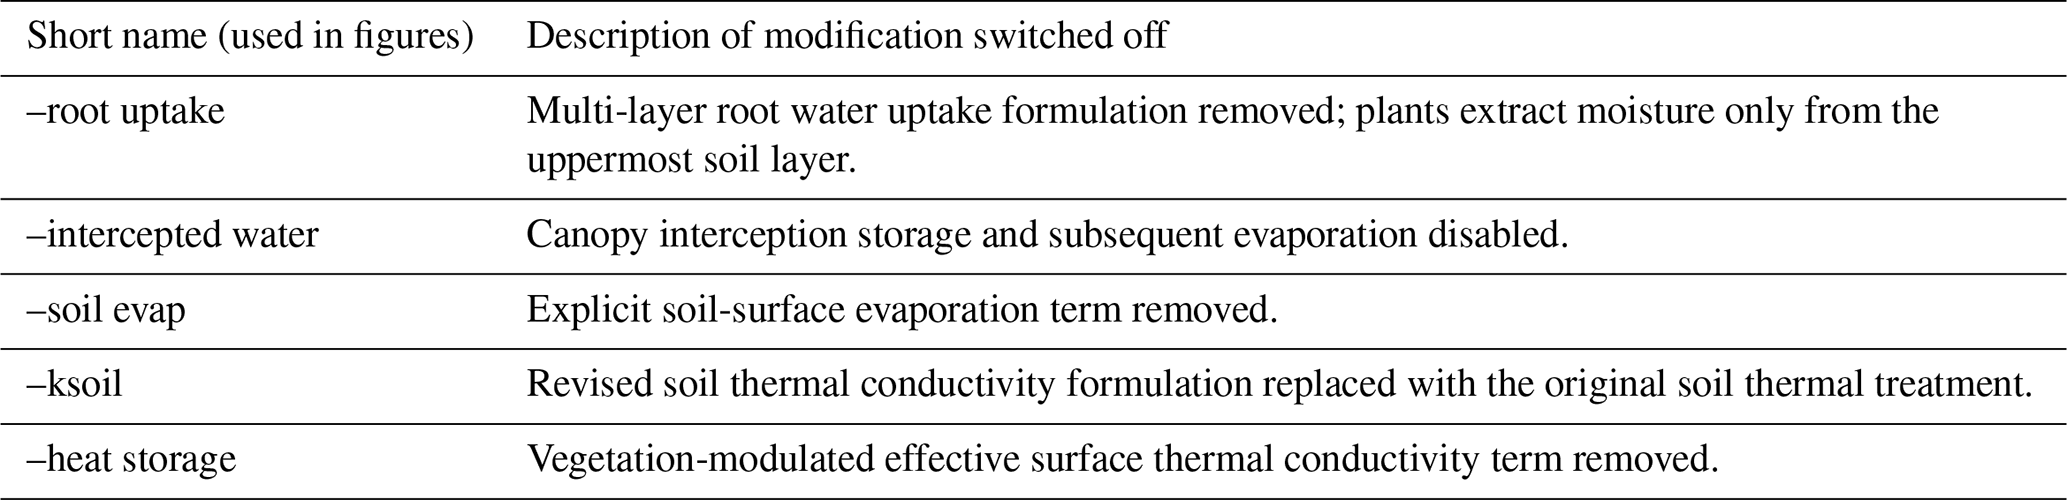
Table 2Summary of one-at-a-time sensitivity experiments in the WRF multi-layer green roof scheme. Short names correspond to titles in Sect. 2 and labels used in Figs. 8 and 9.
The original model exaggerates the diurnal cycle of QG, diverting energy from the turbulent fluxes and depressing morning values as well as midday peaks in QE and QH (Fig. 7a). Figure 7b demonstrates that the modified model captures both the magnitude and timing of peak latent heat flux QE, yielding a realistic daytime partitioning of available energy. The modified model tempers the large positive morning QG bias in the original model and as a result better reproduces the timing and amplitude of the daytime peaks of QH and QE. Differences in Q∗ are small between the models.
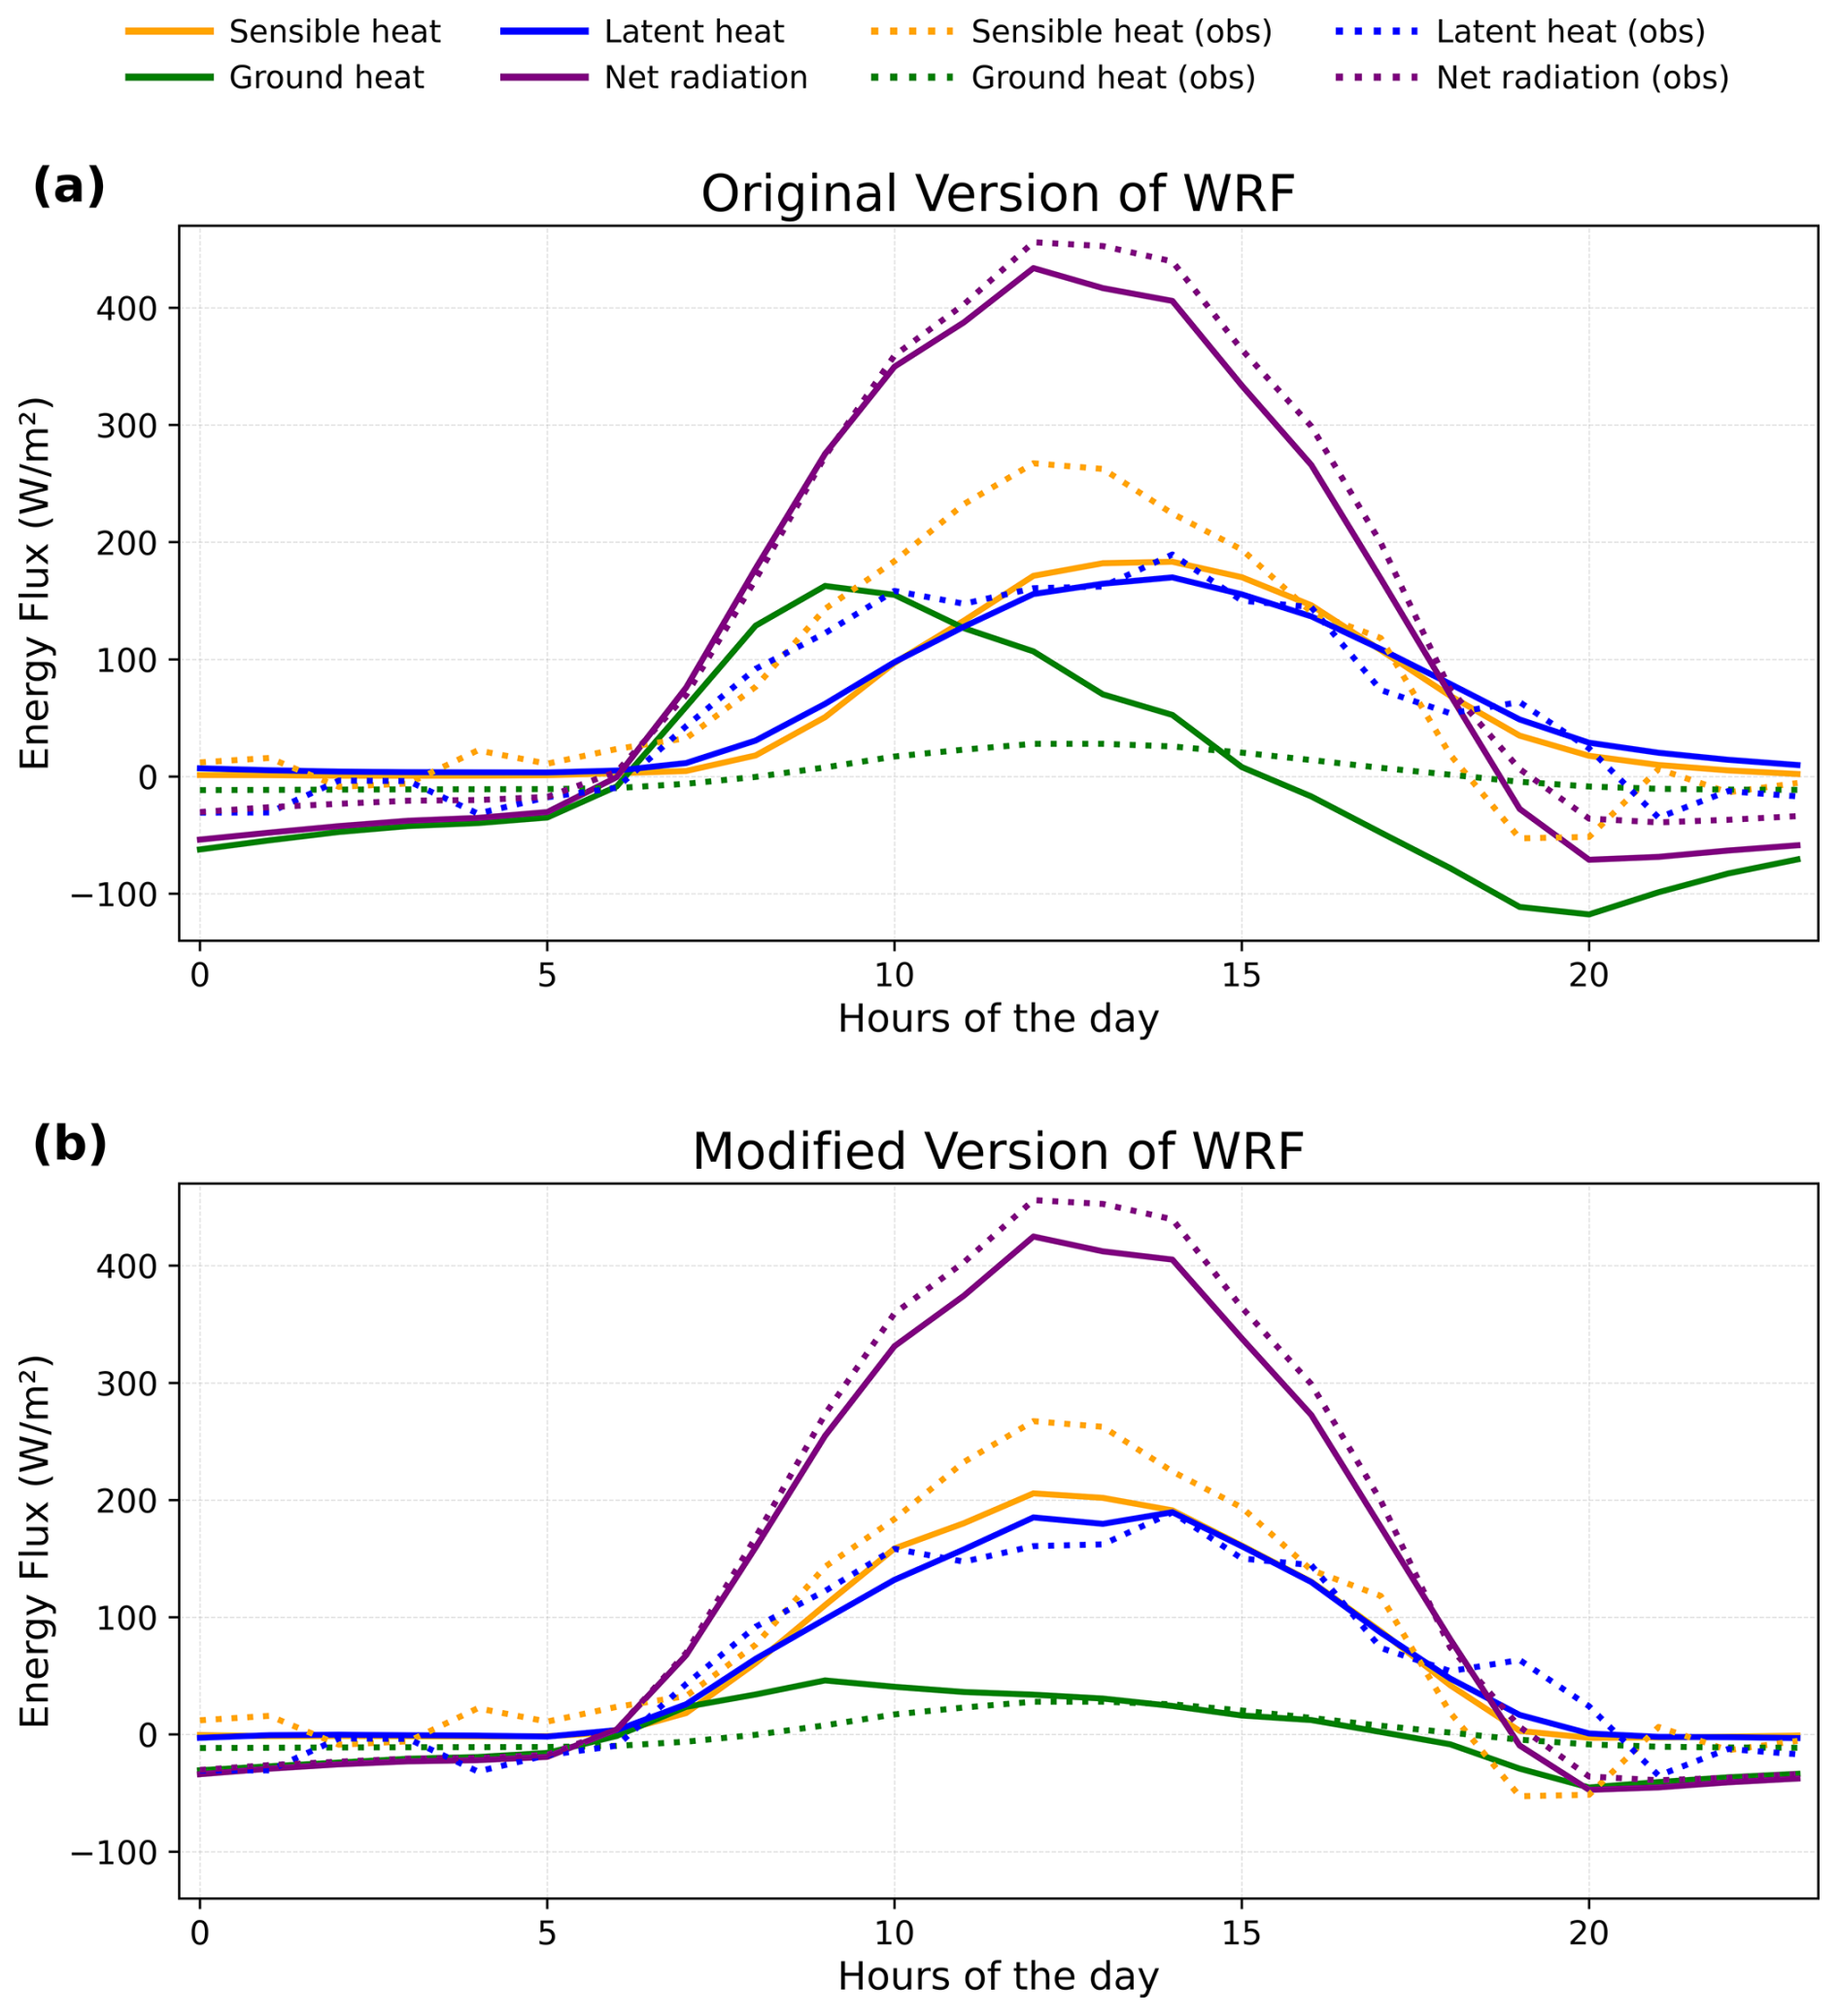
Figure 7Diurnal mean energy-flux composites for the original model (a) and the modified model (b). Solid lines are model output; dotted lines are observations. Curves are hourly means from 1 July to 31 August 2014.
Figures 8 and 9 present a one-at-a-time sensitivity analysis, where each of the five modifications summarized in Table 2 and described in detail in Sect. 2.3 is switched off individually while the other updates remain active. These experiments are used to isolate the role of each added process and to show how the different modifications shape the modelled surface energy partitioning relative to the observations.
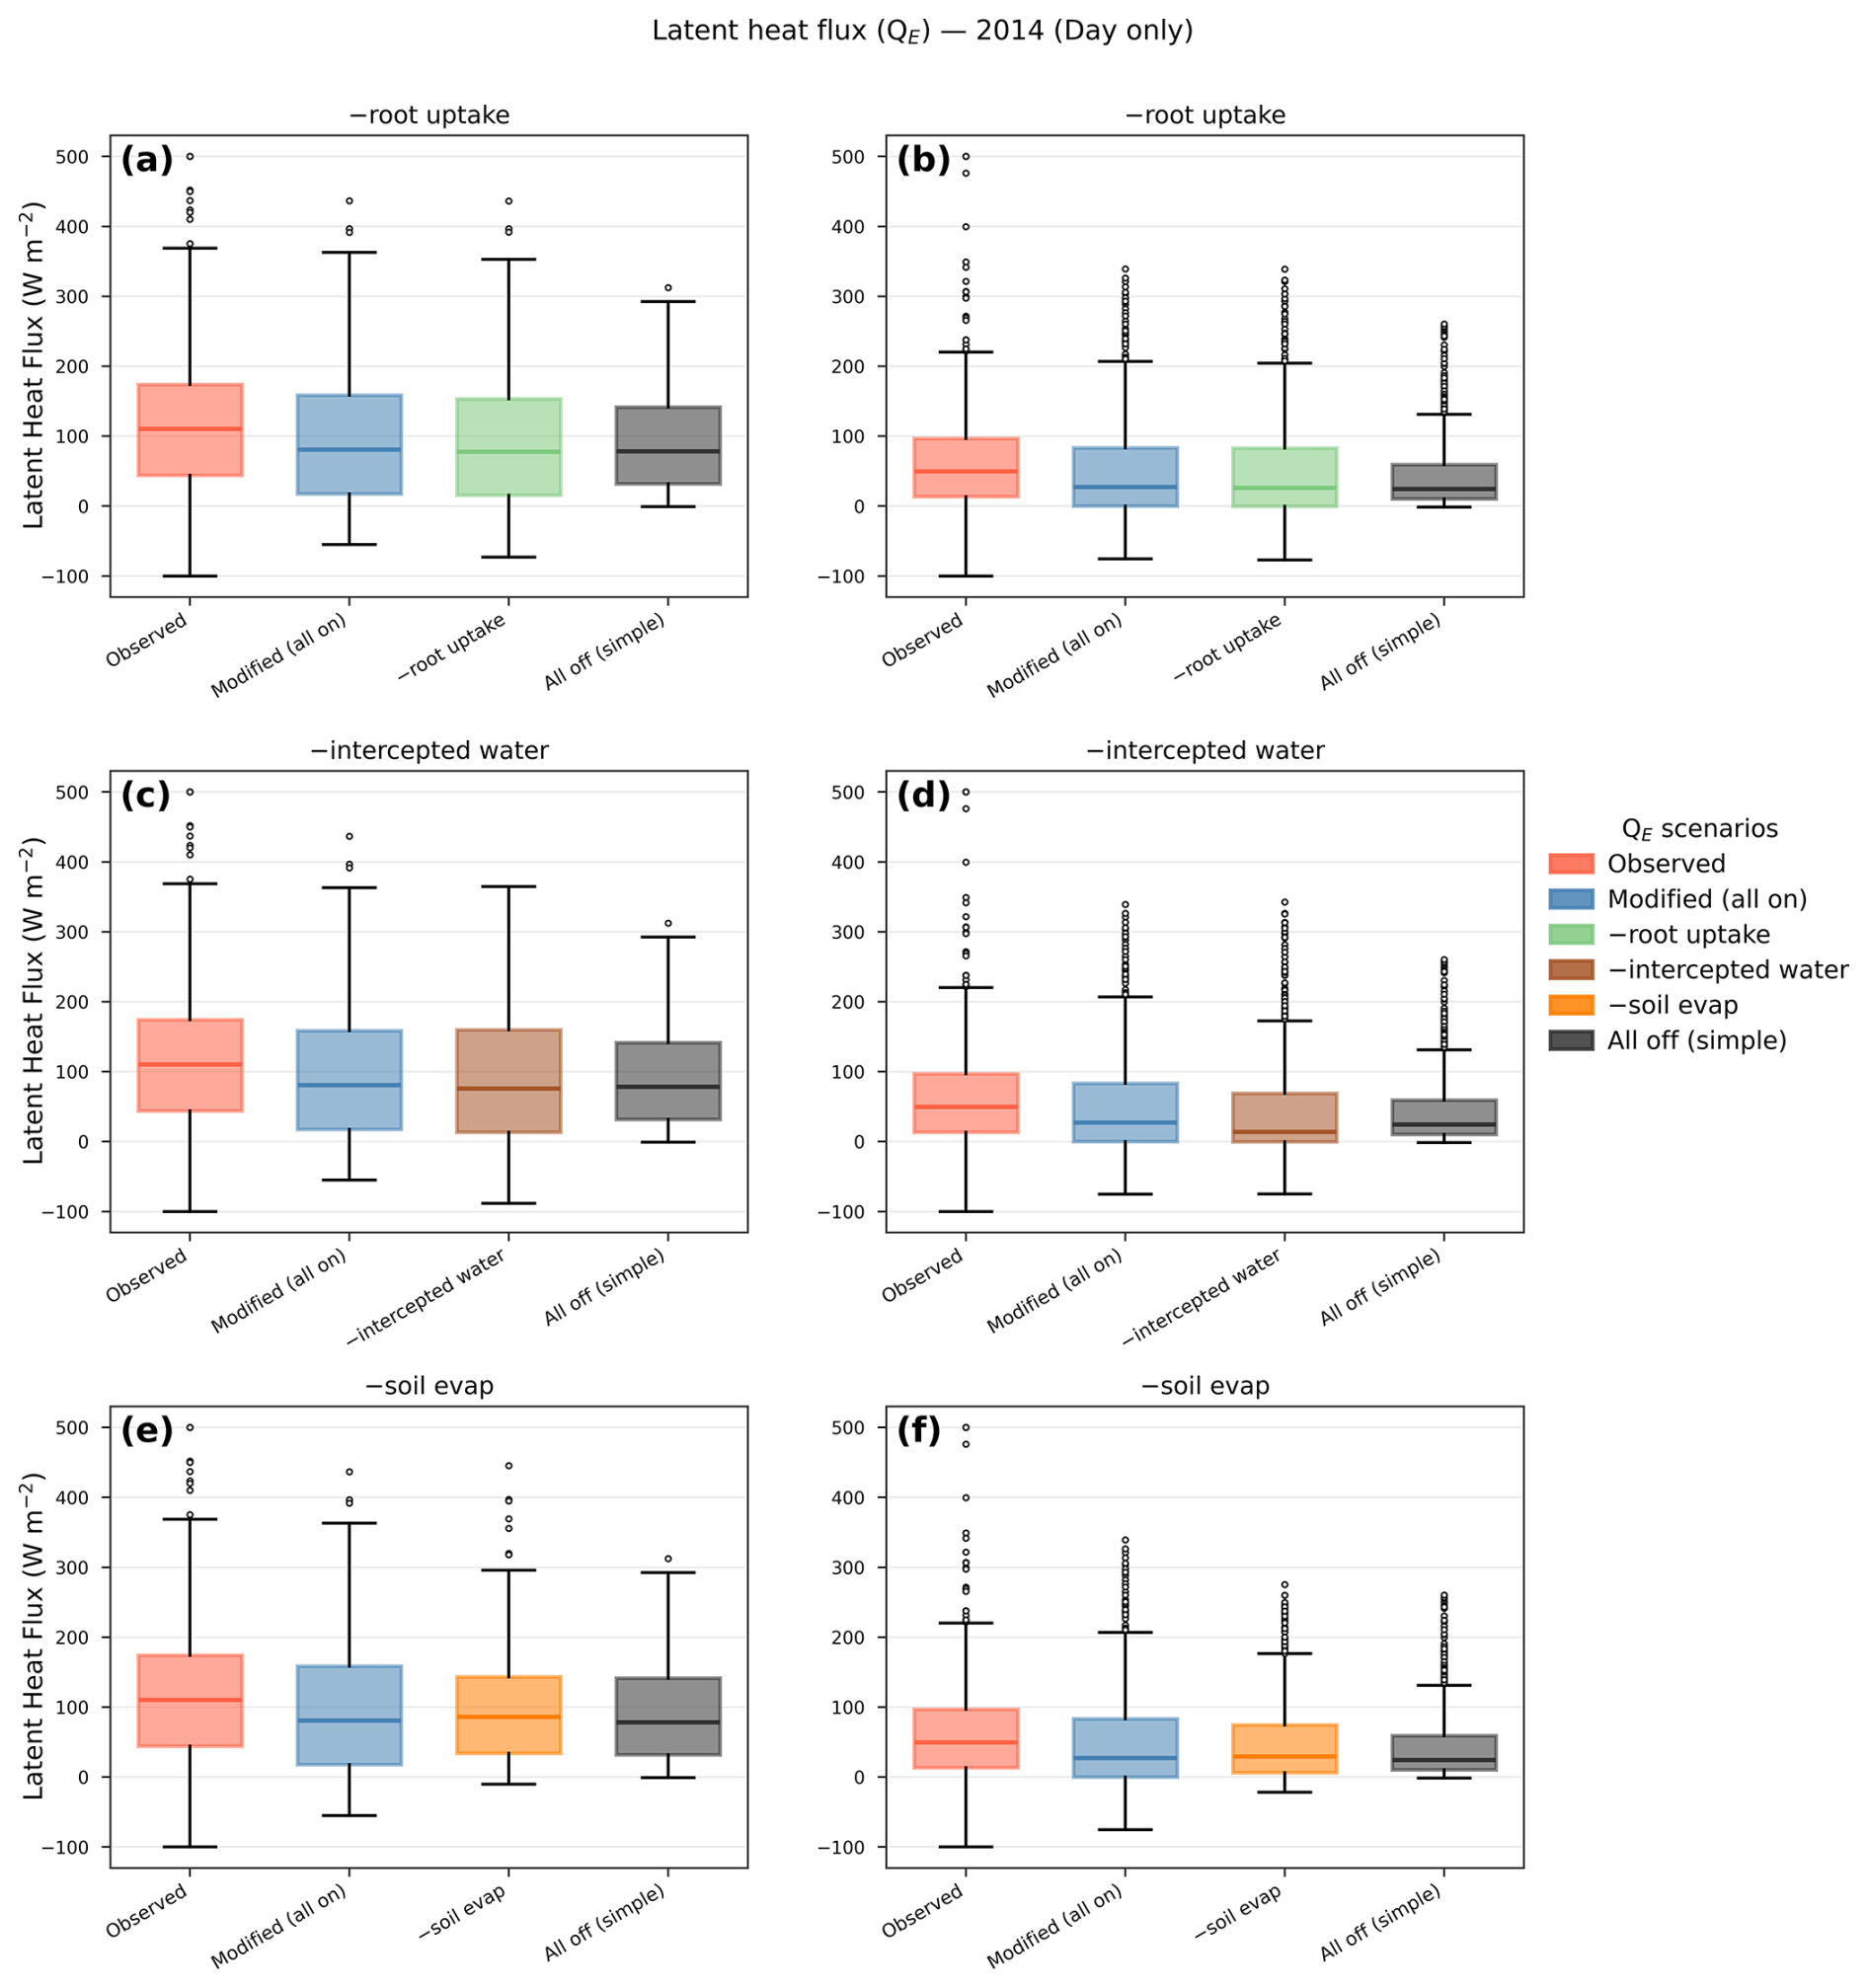
Figure 8Seasonal distributions of observed and modeled daytime (06:48–20:02 LST) latent heat flux QE for 2014, shown separately for summer (a, c, e; left column) and fall (b, d, f; right column). Panels (a) and (b) multi-layer plant water-uptake removed; reverts to the old uptake treatment (–root uptake), panels (c) and (d) canopy interception storage and its evaporation removed (–intercepted water), and panels (e) and (f) explicit soil-surface evaporation removed (–soil evap). Each panel compares observations with the full modified configuration (all on), the corresponding switch-off experiment, and the original model (all off).
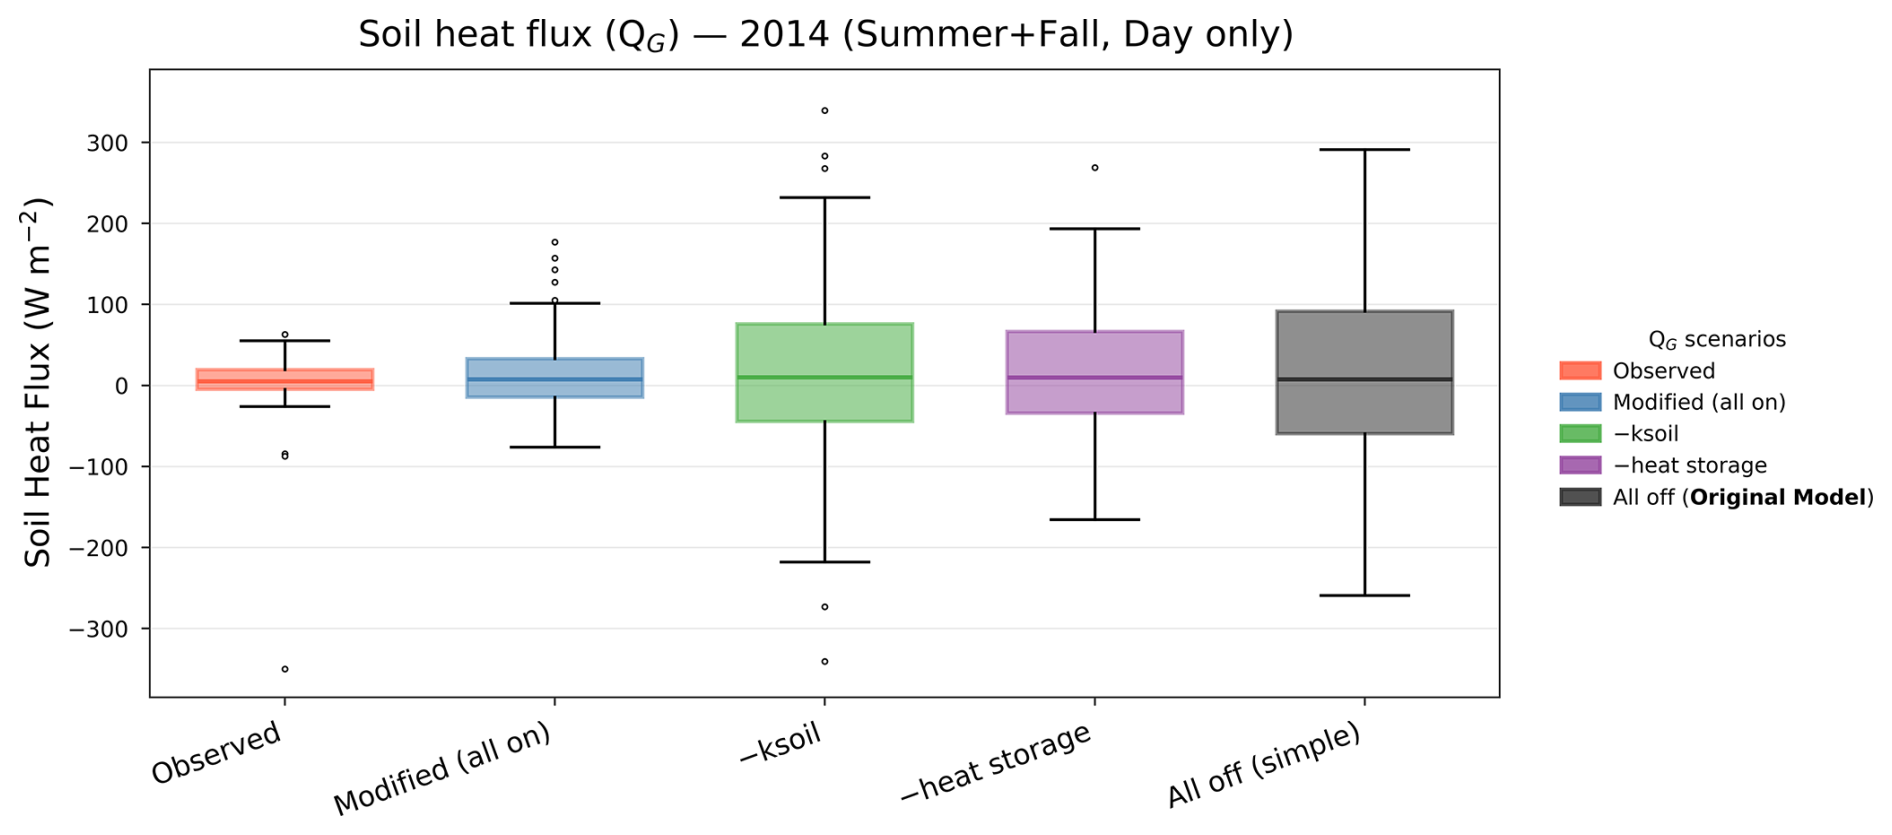
Figure 9Seasonal distributions of daytime (06:48–20:02 LST) observed and modeled soil heat flux QG for 2014, comparing observations with the modified configuration (all on), –ksoil (new soil thermal-conductivity formulation removed), –heat storage (vegetation-modulated effective surface thermal conductivity term removed), and the original model (all off).
In Fig. 8, the six panels focus on moisture related processes and how they affect the total latent heat flux (QE) in both summer and fall (focus on daytime-only). When multi-layer root uptake is removed (–root uptake; Fig. 8a and b), plants rely primarily on moisture from the uppermost soil layer. As this layer dries during dry-down periods, transpiration becomes increasingly water-limited, leading to a modest reduction in mean daytime QE, with a small decrease in the median, particularly in summer, bringing median modeled values below both the observations and the fully modified configuration, and a narrowing of the upper distribution. Removing canopy interception storage and its subsequent evaporation (–intercepted water; Fig. 8c and d) suppresses short-lived evaporation pulses following rainfall events, lowering the summer maximum and the fall upper quartile of the daytime QE distribution and shifting the median to lower values in both summer and fall relative to the observations and the fully modified model. Eliminating explicit soil-surface evaporation (–soil evap; Fig. 8e and f) further decreases daytime QE by removing direct evaporation from the exposed soil. In the present simulations, vegetation cover is high (86 %), limiting the exposed soil fraction and therefore the magnitude of this effect. Under lower vegetation coverage, however, soil-surface evaporation would contribute more substantially to daytime QE, and the sensitivity to this process would be expected to increase.
Figure 9 highlights the thermal-related modifications, which produce the clearest and most systematic sensitivity in the soil heat flux QG. Turning off the revised soil thermal-conductivity formulation (–ksoil) causes the QG distribution to widen substantially and more extreme values occur, showing that the updated substrate thermal treatment is one of the key controls on soil heat exchange. Removing the vegetation-modulated effective surface thermal conductivity term (–heat storage) also increases the spread and magnitude of QG. This modification primarily affects the mean behavior of QG by regulating how efficiently incoming radiation is conducted into the substrate. Without vegetation modulation, the roof surface behaves more like bare soil, absorbing and storing a larger fraction of solar energy, which systematically enhances heat storage and leads to stronger daytime QG peaks. Together, these results indicate that while the revised substrate thermal conductivity governs the range and extremes of QG, the vegetation-dependent surface thermal conductivity plays a dominant role in controlling the mean partitioning of energy into heat storage, thereby reducing persistent biases in QG.
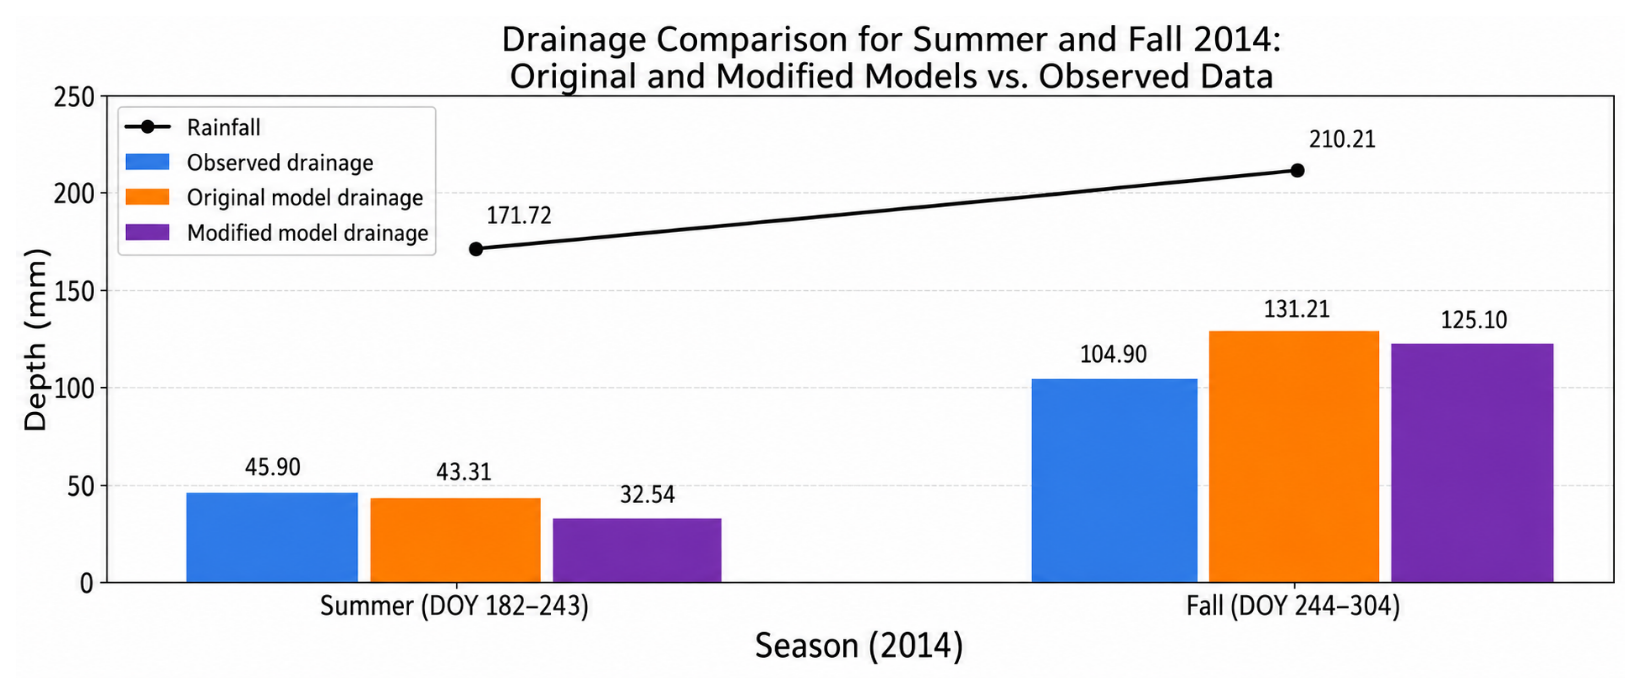
Figure 10Seasonal totals of observed rainfall (line) and cumulative drainage (bars) for summer (DOY 182–243) and fall (DOY 244–304) 2014. Drainage totals are shown for observations and for the original and modified model configurations.
3.2 Water balance and hydrological processes
Figure 10 compares the seasonal cumulative drainage over the full observation periods in summer (DOY 182–243) and fall (DOY 244–304) 2014, together with the total observed rainfall during each season. In summer, both model configurations produce lower drainage than observed (45.90 mm), with the original model giving 43.31 mm and the modified model giving 32.54 mm. In fall, both models produce more drainage than observed (104.90 mm), reaching 131.21 mm in the original model and 125.10 mm in the modified model. Overall, the seasonal totals indicate an underestimation of drainage in summer and an overestimation in fall, while the modified configuration consistently reduces drainage relative to the original model. As an additional conservation diagnostic, the seasonal water-balance closure errors were 1.95 % and 1.31 % for the original model in summer and fall, respectively, compared with only 0.13 % and 0.16 % for the modified model, after accounting for precipitation, net atmospheric water loss, drainage, and changes in water storage (Sect. S3 and Table S1). These results also help explain why the original model can reproduce soil water content reasonably well despite its simpler hydrological representation. In summer, the original model produces lower atmospheric water loss but higher drainage than the modified model, so these differences partly compensate and result in a similar seasonal change in soil water storage. Therefore, the slightly better summer soil water content statistics of the original model do not necessarily indicate a more physically realistic representation of the water balance.
4.1 Model strengths and residual weaknesses after targeted upgrades
The performance of the modified WRF multi-layer green roof scheme can be evaluated relative to other physically based green roof models. Simulations of extensive green roofs, such as those presented by Heusinger et al. (2018) with a modified version of the EnergyPlus green roof model “EcoRoof”, explicitly represent vegetation processes including canopy transpiration, soil evaporation, and evaporation of intercepted water, supported by a detailed canopy microclimate sub-model that resolves radiative and turbulent exchanges between the atmosphere, the canopy, and the surface. Simulations with this modified EcoRoof (ER-modified) model for London indicate that the enhanced canopy microclimate formulation improves surface temperature predictions relative to the original WRF multi-layer green-roof scheme, but with a tendency to overestimate latent and ground heat fluxes (Martinez Mendoza et al., 2026). Because ER-modified and WRF-MLGR v2.0 are evaluated against the same observational dataset, a direct quantitative comparison can be made. ER-modified demonstrates stronger agreement for surface temperature and ground heat flux, with a index of agreement (d) of 0.77 for Ts and 0.74 for QG, when evaluated over the full July–October 2014 period (i.e., combined summer and fall). In comparison, WRF-MLGR v2.0 yields seasonal values of 0.56 (summer) and 0.62 (fall) for Ts and 0.35 (summer) and 0.37 (fall) for QG in WRF-MLGR v2.0. In contrast, WRF-MLGR v2.0 exhibits improved skill in simulating latent heat flux, with d values of 0.64 (summer) and 0.59 (fall), exceeding the long-period performance of ER-modified (d=0.55).
It is relevant to additionally compare other green-roof models. A separate WRF green-roof scheme has also been developed for the single-layer urban canopy model (Yang et al., 2015). This scheme is different from the multi-layer WRF-BEP+BEM green-roof scheme of Zonato et al. (2021) evaluated and modified in the present study. The single-layer scheme does not document a dedicated interception storage and evaporation process; however, it was shown to reproduce surface temperature and turbulent energy fluxes within a reasonable range when evaluated against observations over a 6 d period. Another approach is that the TEB-GREENROOF model directly couples the vegetated substrate to the roof layers without a canopy air space. When evaluated, it showed underestimated substrate moisture, overestimated drainage, and larger than observed temperature amplitudes, reflecting a warm bias and discrepancies in moisture dynamics (de Munck et al., 2013). In the following, we assess the behavior of the modified WRF multi-layer green roof scheme and its strengths, weaknesses, and the impacts of the applied updates.
This study develops a modified version of the WRF multi-layer green-roof scheme and evaluates it against observations in summer and fall of 2014 in London, Canada. The goal of the updates is to address specific process-based limitations identified in the original scheme. In brief, the modified configuration adds (i) a revised non-linear moisture-dependent substrate thermal conductivity formulation (replacing the original linear relationship), (ii) a vegetation-modulated effective surface thermal conductivity term, (iii) explicit soil-surface evaporation, (iv) multi-layer root water uptake, and (v) a canopy interception module that represents interception storage, evaporation of intercepted water, and dew formation on the canopy. Below, we summarize which aspects improve model results most clearly, where key biases remain, and what these results suggest for future development and applications within WRF.
Across both seasons, the largest improvement is in ground heat flux (QG). In summer, QG mean absolute error decreases from 87.4 to 17.6 W m−2 and RMSE decreases from 105.9 to 24.0 W m−2 (Table 1). In fall, QG RMSE decreases from 94.2 to 24.0 W m−2 (Table 1). The time series and diurnal plots explain this improvement: the original scheme produces QG that swings too strongly, with peaks that are too large during the day and also exaggerated at night, especially an unrealistically sharp morning spike. The modified scheme reduces these exaggerated peaks, so the daily cycle has a more realistic timing and magnitude (Figs. 2–4 and 7).
It is also important to interpret QG in the context of the measurement setup. During the 2014 deployment the design of the experimental green roof array provides an elevated platform to allow installation of lysimeters and drainage units below the modules, which also results in an air layer beneath the green roof array. This configuration allows heat to exchange through the bottom (and potentially sides) of the module, which can make the plate-based QG measurement harder to interpret – particularly at night, when signals are smaller and boundary effects can be more influential. For this reason, we emphasize a separate one-week period (11–18 October 2025), when the modules were placed directly on the roof deck and the physical setup more closely matched the model's lower-boundary assumption of direct contact between the green roof soil and the roof deck underneath. During this week, the observed QG shows a clearer diurnal cycle, and the modified model aligns closely with the measurements in both timing and magnitude (Fig. 6), providing strong evidence that the revised physics substantially improves the simulation of ground heat flux (QG) under conditions that best match the model configuration (and the configuration of most actual green roofs).
Reducing the unrealistic daytime QG peak changes how the available energy is divided between the different heat fluxes. Net radiation (Q∗) is very similar in the original and modified simulations. Therefore, when QG becomes smaller in the modified model, more energy is available for QE and QH.
The main reason for the large change in QG is the improved soil thermal conductivity. Ground heat flux depends on both the temperature difference within the soil and the soil thermal conductivity. Therefore, QG can change a lot even if the modeled surface temperature does not change very much. In the original model, the soil thermal conductivity became unrealistically high in the morning, which caused too much heat to move into the soil. In the modified model, the revised soil thermal conductivity and especially the vegetation-dependent surface conductivity reduce this excessive heat transfer. As a result, more of the available energy is directed to QE and QH, particularly earlier in the day, shifting the timing of the diurnal cycle of these fluxes.
The hydrological modifications further influence this coupled energy balance. Soil evaporation provides an additional pathway for water loss from the green roof, canopy interception allows stored rainfall to evaporate rapidly after rain, and multilayer root uptake allows plants to access water from deeper soil layers as the upper soil becomes dry. These processes generally enhance QE when water is available. The resulting changes in QE, QG, surface temperature, and moisture conditions also affect QH. Therefore, the modified model produces a more realistic overall partitioning and diurnal evolution of the surface energy fluxes, even though changes in surface temperature remain relatively small.
The hydrological modifications also help explain the changes in latent heat flux (QE). Figures 3b and 4b show the diurnal cycles with a noticeable increase in QE right after rainfall. The original model often represents this response too weakly or misses it, which contributes to an overall underestimation of QE during wet periods. In contrast, the modified model captures these short-lived post-rain increases more consistently and provides a better overall prediction of QE variability and magnitude. This behavior is especially clear during 15–17 July 2014 (DOY 196–198). Following rainfall, the leaf wetness sensor signal rises sharply, indicating rapid wetting of the sedum canopy surface, and the modified model simultaneously produces a strong, short-lived spike in modeled QE. As the leaf surfaces dry, both the sensor signal and modeled QE decrease. The original model, however, produces a much weaker response and largely fails to capture this rapid post-rainfall peak (Fig. 5). Overall, this suggests that the modified scheme better represents fast evaporation pathways immediately after wetting, consistent with the inclusion of evaporation from intercepted water on the canopy. The most direct explanation is the added canopy interception module, which allows intercepted water stored on the canopy to evaporate quickly after rainfall (and also represents dew formation), rather than relying only on slower changes in substrate moisture and evaporation. This is consistent with the broader land-surface modeling literature, where interception loss is recognized as an efficient, rapid pathway for returning precipitation to the atmosphere and is often needed to reproduce these short post-rain evaporation responses (e.g., Cammalleri et al., 2010; Heusinger et al., 2018).
Another important improvement comes from the updated root water uptake. In the original scheme, transpiration draws water mainly from the thin top layer, so QE drops when that layer dries and more water ends up draining from the bottom of the soil layer. In the modified model, uptake can access moisture from multiple soil layers, which supports more realistic QE during dry-down and reduces excess drainage. We also added explicit evaporation from the soil surface. Together, these changes improve the overall energy partitioning. The drainage comparison is consistent with this behavior: the modified model produces less drainage than the original model (Fig. 10). However, drainage remains underestimated in summer and overestimated in fall in both model configurations.
Even with these improvements, some biases remain. First, daytime surface temperature (Ts) is still too warm in both model configurations (Figs. 3a and 4a). A key reason for this remaining Ts bias is that the current WRF-MLGR formulation calculates only a single bulk surface skin temperature for the green-roof system. Separate computation of the soil/substrate surface temperature, vegetation/canopy surface temperature, and canopy-air temperature is not available in the present formulation. As a result, Ts cannot be directly interpreted as either a soil-surface temperature or a vegetation-canopy temperature, but instead represents an aggregated surface temperature produced by the simplified bulk representation of the green roof. This limits the ability to diagnose whether the remaining Ts bias arises primarily from the substrate thermal state, vegetation thermal response, or both. Second, QE is still low and shows less variability than the observations (Fig. 8). The sensitivity tests help explain this: when canopy interception storage and its evaporation (–intercepted water) or multi-layer root uptake is removed (–root uptake), QE decreases further and more energy can shift into QH and QG (Fig. 8). This shows that the added moisture pathways are working as intended. However, the remaining underestimation of QE variability suggests that the model still misses some real-world controls, such as microclimatic gradients within the canopy air space and plant physiological responses (for example, a more detailed canopy microclimate). For example, the EnergyPlus green roof (EcoRoof) model represents vegetation as an explicit canopy, including within-canopy radiative exchange (e.g., shading effects) and canopy air exchange processes that regulate evapotranspiration, which may help capture some of the canopy-microclimate controls that are still simplified in the present WRF configuration (Sailor, 2008). Future development should therefore separate the vegetation canopy, canopy air, and soil/substrate surface in the model, instead of representing them with one bulk surface temperature. This would allow the model to calculate their heat exchange processes separately, including radiation, turbulent heat exchange, and heat conduction into the substrate. It would also make it possible to identify whether any remaining errors in Ts come mainly from the vegetation or the soil surface, and to improve the inaccurate model component.
In terms of substrate moisture, the original model better captured the observed temporal variability in volumetric water content (θ) during summer, whereas the modified model showed improved agreement in fall (Table 1). However, both model versions show a small bias in drainage, modestly underestimating summer totals and overestimating fall totals (Fig. 10). During the summer of 2014, conditions were relatively dry, with even the strongest convective rainfall events producing less than 14 mm. In contrast, fall 2014 saw powerful thunderstorms, with notable events exceeding 73 mm of rainfall in just 3 h and another event surpassing 45 mm in 2 h. This difference in seasonal rainfall intensity helps explain the models biases. During drier summer periods, the models may underestimate drainage since soils rarely reach near-saturation. Conversely, during fall's intense rain events, soil often approach saturation, prompting the models to produce excessive drainage. The modified model produces marginally lower drainage than the original, consistent with the added water-loss pathways through soil evaporation, transpiration via root uptake across all soil layers, and evaporation of intercepted water from the canopy.
4.2 Limitations and future work
Several limitations affect how these results should be interpreted and also highlight priorities for future work. The main observational limitation is ground heat flux (QG), which needs to be considered in the context of the experimental setup. During the 2014 deployment, the elevated green roof modules left an air space between the modules and the underlying roof, while the use of individual modules introduced exposed lateral boundaries. These conditions allow additional heat exchange through the bottom and side boundaries that is not represented in the model. The influence appears to be strongest at night, when observed QG becomes nearly flat and approaches zero, suggesting weak thermal coupling between the green roof modules and the underlying roof structure. However, the same boundary effects may also influence daytime QG. We therefore report daytime-only QG statistics (QG,day; Table 1) as an additional evaluation metric, while recognizing that daytime measurements are not completely unaffected by the experimental configuration. The October 2025 comparison, conducted under a configuration more representative of the modeled lower boundary, shows a clearer observed diurnal QG cycle, and the modified model reproduces the main timing and magnitude of the observed variability more closely (Fig. 6).
A related limitation is that the “observed” sensible heat flux (QH) is not measured directly. Instead, it is calculated as a residual: net radiation minus the sum of measured QE and measured QG. This means that any bias in QG, during the day and especially at night – will automatically appear as a bias in the residual QH, which makes nighttime QH comparisons harder to interpret. Importantly, this does not change one of the main conclusion of this study: the modified model dramatically reduces the large QG errors seen in the original scheme. Rather, the residual nature of QH mainly limits how confidently we can interpret the remaining nighttime QH differences as resulting from model physics.
From a model-development perspective, the upgrades in this study are focused on specific processes, but several simplifications remain. Even with the new interception module, the canopy representation is still basic. For example, the scheme does not fully represent a separate canopy microclimate (its own temperature and humidity near the leaves) or detailed radiation exchange within the canopy. It also simplifies how vegetation modifies near-surface aerodynamics, such as wind reduction, roughness, and the resistances that control heat and moisture transfer. Probably most important is separation of the soil surface and canopy radiation and energy balances together with addition of a clearer resistance/aerodynamic formulation. A likely contributor to the surface temperature bias is that the observed canopy surface (as seen by the infrared radiation thermometer) has substantial three-dimensional structure, with a mixture of sunlit and shaded elements during the day, and locally reduced sky-view factors at night that keep sheltered portions of the canopy warmer than exposed upper surfaces. However, the model represents the vegetation canopy as a flat, uniform layer, thus generating an apparent overheat during the day and too much nocturnal cooling relative to the measured values. These additions would likely help reduce the remaining surface-temperature biases (too warm during the day and too cool at night), improve the spread and magnitude of QE (Fig. 8), and further improve the daytime heat storage and nighttime release. Incorporating these processes consistent with field studies showing that green-roof energy partitioning depends strongly on soil moisture, vegetation state, and canopy wetness (e.g., Heusinger and Weber, 2017).
Also, this evaluation focuses on warm-season conditions (summer and fall 2014). For Canadian and broader climate applications, cold-season processes may also be important. Future development should include snow accumulation and melt, freezing and thawing of the substrate, and temperature-dependent hydraulic and thermal properties, because these processes can strongly modify wintertime heat exchange and spring moisture availability. In addition, the scheme could be extended to represent green roof uptake of trace gases – such as CO2 exchange through photosynthesis (e.g., Mirebeau et al., 2025) and a simple deposition/uptake pathway, so the model can also be used to explore potential green-roof impacts on urban air quality.
Finally, since the ground-level vegetation scheme in WRF-BEP+BEM is based on this green roof model, these upgrades can be applied in the future to further improve the accuracy of urban vegetation simulations within that framework.
This study introduces targeted process-based modifications to the WRF multi-layer green-roof scheme and evaluates the updated model using field observations from 2014 for continuous summer and fall periods. To better match the model's lower-boundary setup and to interpret ground heat flux (QG) more clearly, we also analyze a one-week period (11–18 October 2025) when the green roof modules were placed directly on the roof deck.
The targeted process changes to the green roof model address key limitations in the original scheme. These updates include (i) a revised non-linear, moisture-dependent treatment of substrate thermal conductivity, (ii) a vegetation cover-modulated effective surface thermal conductivity, (iii) explicit soil-surface evaporation, (iv) multi-layer root water uptake, and (v) a canopy interception module that accounts for interception storage, evaporation of intercepted water, and dew formation on the canopy.
Across both seasons, the largest improvement is in ground heat flux (QG). In the original scheme, the diurnal QG cycle was too strong, with unrealistically large peaks during morning and midday and overly large variations at night. The modified scheme reduces these overestimations and better reproduces both the timing and the magnitude of the daily cycle, leading to much lower QG errors (Table 1). This improvement is also supported by the October 2025 test week: when the modules were placed directly on the roof deck, the observed QG shows a clearer diurnal pattern, and the modified model matches it closely.
Improving QG also ameliorates partitioning of available energy among the remaining surface fluxes. When QG is too large, the model directs too much energy into the ground and leaves too little for turbulent exchange, which overly reduces the morning and midday latent heat flux (QE) and sensible heat flux (QH). By mitigating this unrealistic QG draw, the modified scheme reproduces the timing and magnitude of the daytime QE and QH peaks more accurately. The modified model also represents QE more realistically: it captures brief increases in QE after rain more consistently, supported by evaporation of intercepted water (including dew-related canopy exchanges), added soil-surface evaporation, and multi-layer root uptake that allows transpiration to draw water from deeper layers. Together, these changes reduce drainage compared with the original model.
Despite this progress, some biases remain. Daytime surface temperature (Ts) is still too warm, nighttime Ts can be too cool, and daytime QE is still somewhat low and shows less variability than the observations.
Overall, these results show that the targeted physical updates greatly improve how the WRF MLGR scheme simulates energy and water exchanges, mainly by correcting the substrate thermal treatment as well as adding or modifying select hydrological processes. The modified scheme therefore provides a stronger basis for WRF-based urban climate applications.
The modified and baseline versions of the WRF multi-layer green roof model source code, the input datasets for the 2014 summer and fall evaluation periods, the observational data used for validation, and the post-processing notebooks used to reproduce the figures and evaluation metrics are permanently archived on Zenodo at: https://doi.org/10.5281/zenodo.18704671 (Saeedi et al., 2026).
The supplement related to this article is available online at https://doi.org/10.5194/gmd-19-10103-2026-supplement.
AS developed and implemented the updates to the WRF multi-layer green roof model, performed the simulations, and carried out the model evaluation against real-world observations. AS also prepared the manuscript. MMM prepared and curated the observational and input datasets used for model evaluation. ESK supervised the project, contributed ideas for model development, and revised the manuscript. JV designed and supervised the observational experiment and revised the manuscript. HY contributed to model development. AZ was the developer of the original WRF multi-layer green roof model described in Zonato et al. (2021) and provided technical guidance during this study, as well as reviewing and commenting on the manuscript. CWR and SL provided feedback and revised the manuscript. All authors reviewed and approved the final manuscript.
The contact author has declared that none of the authors has any competing interests.
Publisher's note: Copernicus Publications remains neutral with regard to jurisdictional claims made in the text, published maps, institutional affiliations, or any other geographical representation in this paper. The authors bear the ultimate responsibility for providing appropriate place names. Views expressed in the text are those of the authors and do not necessarily reflect the views of the publisher.
This research was funded by the Climate Action and Awareness Fund, administered by Environment and Climate Change Canada. We gratefully acknowledge the contributions of Dimuth Kurukulaarachchi, as well as the 2014 Green Roof research team lead by Denis O'Carroll, for collecting the observational data used in this study.
This work was funded by a Climate Action and Awareness Fund (CAAF) grant from Environment and Climate Change Canada (ECCC) to Eric Scott Krayenhoff and James Voogt.
This paper was edited by Jason Williams and reviewed by three anonymous referees.
Arnfield, A. J.: Two decades of urban climate research: a review of turbulence, exchanges of energy and water, and the urban heat island, Int. J. Climatol., 23, 1–26, https://doi.org/10.1002/joc.859, 2003.
Barozzi, B., Bellazzi, A., Maffè, C., and Pollastro, M. C.: Measurement of thermal properties of growing media for green roofs: assessment of a laboratory procedure and experimental results, Buildings, 7, 99, https://doi.org/10.3390/buildings7040099, 2017.
Berardi, U., GhaffarianHoseini, A., and GhaffarianHoseini, A.: State-of-the-art analysis of the environmental benefits of green roofs, Appl. Energ., 115, 411–428, https://doi.org/10.1016/j.apenergy.2013.10.047, 2014.
Berndtsson, J. C.: Green roof performance towards management of runoff water quantity and quality: A review, Ecol. Eng., 36, 351–360, https://doi.org/10.1016/j.ecoleng.2009.12.014, 2010.
Cammalleri, C., Agnese, C., Ciraolo, G., Minacapilli, M., Provenzano, G., and Rallo, G.: Actual evapotranspiration assessment by means of a coupled energy/hydrologic balance model: Validation over an olive grove by means of scintillometry and measurements of soil water contents, J. Hydrol., 392, 70–82, https://doi.org/10.1016/j.jhydrol.2010.07.046, 2010.
de Munck, C., Lemonsu, A., Masson, V., Le Bras, J., Bonhomme, M., and Kounkou-Arnaud, R.: Evaluating the impacts of greening scenarios on thermal comfort and energy and water consumptions for adapting Paris city to climate change, Urban Climate, 23, 260–286, https://doi.org/10.1016/j.uclim.2017.01.003, 2018.
de Munck, C. S., Lemonsu, A., Bouzouidja, R., Masson, V., and Claverie, R.: The GREENROOF module (v7.3) for modelling green roof hydrological and energetic performances within TEB, Geosci. Model Dev., 6, 1941–1960, https://doi.org/10.5194/gmd-6-1941-2013, 2013.
Ek, M. B., Mitchell, K. E., Lin, Y., Rogers, E., Grunmann, P., Koren, V., Gayno, G., and Tarpley, J. D.: Implementation of Noah land surface model advances in the National Centers for Environmental Prediction operational mesoscale Eta model, J. Geophys. Res., 108, 8851, https://doi.org/10.1029/2002JD003296, 2003.
Grimmond, C. S. B. and Oke, T. R.: Heat Storage in Urban Areas: Local-Scale Observations and Evaluation of a Simple Model, J. Appl. Meteorol., 38, 922–940, https://doi.org/10.1175/1520-0450(1999)038<0922:HSIUAL>2.0.CO;2, 1999.
Hamdi, R. and Masson, V.: Inclusion of a drag approach in the Town Energy Balance (TEB) scheme: Offline 1D evaluation in a street canyon, J. Appl. Meteorol. Clim., 47, 2627–2644, https://doi.org/10.1175/2008JAMC1865.1, 2008.
Heusinger, J. and Weber, S.: Surface energy balance of an extensive green roof as quantified by full year eddy-covariance measurements, Sci. Total Environ., 577, 220–230, https://doi.org/10.1016/j.scitotenv.2016.10.168, 2017.
Heusinger, J., Sailor, D. J., and Weber, S.: Modeling the reduction of urban excess heat by green roofs with respect to different irrigation scenarios, Build. Environ., 131, 174–183, https://doi.org/10.1016/j.buildenv.2018.01.003, 2018.
Jiang, T., Krayenhoff, E. S., Martilli, A., Nazarian, N., Stone Jr., B., and Voogt, J. A.: Prioritizing urban heat adaptation infrastructure based on multiple outcomes: Comfort, health, and energy, P. Natl. Acad. Sci. USA, 122, e2411144122, https://doi.org/10.1073/pnas.2411144122, 2025.
Kusaka, H., Kondo, H., Kikegawa, Y., and Kimura, F.: A simple single-layer urban canopy model for atmospheric models: Comparison with multi-layer and slab models, Bound.-Lay. Meteorol., 101, 329–358, https://doi.org/10.1023/A:1019207923078, 2001.
Li, D. and Bou-Zeid, E.: Synergistic Interactions between Urban Heat Islands and Heat Waves: The Impact in Cities Is Larger than the Sum of Its Parts, J. Appl. Meteorol. Clim., 52, 2051–2064, https://doi.org/10.1175/JAMC-D-13-02.1, 2013.
Li, D., Bou-Zeid, E., and Oppenheimer, M.: The effectiveness of cool and green roofs as urban heat island mitigation strategies, Environ. Res. Lett., 9, 055002, https://doi.org/10.1088/1748-9326/9/5/055002, 2014.
Li, Y. and Babcock, R. W.: Green roof hydrologic performance and modeling: a review, Water Sci. Technol., 69, 727–738, https://doi.org/10.2166/wst.2013.770, 2014.
Lipson, M. J., Grimmond, S., Best, M., Abramowitz, G., Coutts, A., Tapper, N., Baik, J.-J., Beyers, M., Blunn, L., Boussetta, S., Bou-Zeid, E., De Kauwe, M. G., de Munck, C., Demuzere, M., Fatichi, S., Fortuniak, K., Han, B.-S., Hendry, M. A., Kikegawa, Y., Kondo, H., Lee, D.-I., Lee, S.-H., Lemonsu, A., Machado, T., Manoli, G., Martilli, A., Masson, V., McNorton, J., Meili, N., Meyer, D., Nice, K. A., Oleson, K. W., Park, S.-B., Roth, M., Schoetter, R., Simón-Moral, A., Steeneveld, G.-J., Sun, T., Takane, Y., Thatcher, M., Tsiringakis, A., Varentsov, M., Wang, C., Wang, Z.-H., and Pitman, A. J.: Evaluation of 30 urban land surface models in the Urban-PLUMBER project: Phase 1 results, Q. J. Roy. Meteor. Soc., 150, 126–169, https://doi.org/10.1002/qj.4589, 2024.
Louis, J.-F.: A parametric model of vertical eddy fluxes in the atmosphere, Bound.-Lay. Meteorol., 17, 187–202, https://doi.org/10.1007/BF00117978, 1979.
Martilli, A., Clappier, A., and Rotach, M. W.: An urban surface exchange parameterisation for mesoscale models, Bound.-Lay. Meteorol., 104, 261–304, https://doi.org/10.1023/A:1016099921195, 2002.
Martinez Mendoza, M., Saeedi, A., Voogt, J. A., and Krayenhoff, E. S.: Process-based evaluation of green roof models for assessment of heat mitigation efficacy in WRF (v4.3.1) and EnergyPlus (v8.6.0), Geosci. Model Dev., 19, 9729–9749, https://doi.org/10.5194/gmd-19-9729-2026, 2026.
Masson, V.: A physically-based scheme for the urban energy budget in atmospheric models, Bound.-Lay. Meteorol., 94, 357–397, https://doi.org/10.1023/A:1002463829265, 2000.
Mirebeau, A., de Munck, C., Bonan, B., Delire, C., Lemonsu, A., Masson, V., and Weber, S.: Modelling extensive green roof CO2 exchanges in the Town Energy Balance urban canopy model, Geosci. Model Dev., 18, 5329–5349, https://doi.org/10.5194/gmd-18-5329-2025, 2025.
Nash, J. E. and Sutcliffe, J. V.: River flow forecasting through conceptual models, Part I – A discussion of principles, J. Hydrol., 10, 282–290, https://doi.org/10.1016/0022-1694(70)90255-6, 1970.
Oberndorfer, E., Lundholm, J., Bass, B., Coffman, R. R., Doshi, H., Dunnett, N., Gaffin, S., Köhler, M., Liu, K. K. Y., and Rowe, B.: Green Roofs as Urban Ecosystems: Ecological Structures, Functions, and Services, BioScience, 57, 823–833, https://doi.org/10.1641/B571005, 2007.
Oke, T. R.: The energetic basis of the urban heat island, Q. J. Roy. Meteor. Soc., 108, 1–24, https://doi.org/10.1002/qj.49710845502, 1982.
Oke, T. R., Mills, G., Christen, A., and Voogt, J. A.: Urban Climates, Cambridge University Press, https://doi.org/10.1017/9781139016476, 2017.
Onyutha, C.: A hydrological model skill score and revised R-squared, Hydrol. Res., 53, 51–64, https://doi.org/10.2166/nh.2021.071, 2022.
Perelli, G. A.: Characterization of the Green Roof Growth Media, M. Eng. Sci. thesis, The University of Western Ontario, London, Ontario, Canada, Electronic Thesis and Dissertation Repository, 2205, https://ir.lib.uwo.ca/etd/2205 (last access: 10 October 2025), 2014.
Peters-Lidard, C. D., Zion, M. S., and Wood, E. F.: A soil-vegetation-atmosphere transfer scheme for modeling spatially variable water and energy balance processes, J. Geophys. Res., 102, 4303–4324,https://doi.org/10.1029/96JD02948, 1997.
Peters-Lidard, C. D., Blackburn, E., Liang, X., and Wood, E. F.: The effect of soil thermal conductivity parameterization on surface energy fluxes and temperatures, J. Atmos. Sci., 55, 1209–1224, https://doi.org/10.1175/1520-0469(1998)055<1209:TEOSTC>2.0.CO;2, 1998.
Ribeiro, I., Martilli, A., Falls, M., Zonato, A., and Villalba, G.: Highly resolved WRF-BEP/BEM simulations over Barcelona urban area with LCZ, Atmos. Res., 248, 105220, https://doi.org/10.1016/j.atmosres.2020.105220, 2021.
Rowe, D. B.: Green roofs as a means of pollution abatement, Environ. Pollut., 159, 2100–2110, https://doi.org/10.1016/j.envpol.2010.10.029, 2011.
Saeedi, A., Martinez Mendoza, M., Krayenhoff, E. S., Voogt, J., Zonato, A., Leroyer, S., and Wagner-Riddle, C.: WRF-MLGR v2.0: Process-based upgrades to the WRF multi-layer green roof scheme implemented in WRF-BEP+BEM, Zenodo [code and data set], https://doi.org/10.5281/zenodo.18704671, 2026.
Sailor, D. J.: A green roof model for building energy simulation programs, Energ. Buildings, 40, 1466–1478, https://doi.org/10.1016/j.enbuild.2008.02.001, 2008.
Sailor, D. J., Hutchinson, D., and Bokovoy, L.: Thermal property measurements for ecoroof soils common in the western U. S., Energ. Buildings, 40, 1246–1251, https://doi.org/10.1016/j.enbuild.2007.11.004, 2008.
Salamanca, F., Martilli, A., Tewari, M., and Chen, F.: A Study of the Urban Boundary Layer Using Different Urban Parameterizations and High-Resolution Urban Canopy Parameters with WRF, J. Appl. Meteorol. Clim., 50, 1107–1128, https://doi.org/10.1175/2010JAMC2538.1, 2011.
Santamouris, M.: Cooling the cities – A review of reflective and green roof mitigation technologies to fight heat island and improve comfort in urban environments, Sol. Energy, 103, 682–703, https://doi.org/10.1016/j.solener.2012.07.003, 2014.
Shao, B., Valeo, C., Mukhopadhyaya, P., and He, J.: Influence of temperature and moisture content on thermal performance of green roof media, Energies, 14, 2421, https://doi.org/10.3390/en14092421, 2021.
Stovin, V.: The potential of green roofs to manage urban stormwater, Water Environ. J., 24, 192–199, https://doi.org/10.1111/j.1747-6593.2009.00174.x, 2010.
Sun, T., Grimmond, C. S. B., and Ni, G.-H.: How do green roofs mitigate urban thermal stress under heat waves?, J. Geophys. Res.-Atmos., 121, 5320–5335, https://doi.org/10.1002/2016JD024873, 2016.
Tabares-Velasco, P. C. and Srebric, J.: A heat transfer model for assessment of plant based roofing systems in summer conditions, Build. Environ., 49, 310–323, https://doi.org/10.1016/j.buildenv.2011.07.019, 2012.
Tabares-Velasco, P. C., Zhao, M., Peterson, N., Srebric, J., and Berghage, R.: Validation of predictive heat and mass transfer green roof model with extensive green roof field data, Ecol. Eng., 47, 165–173, https://doi.org/10.1016/j.ecoleng.2012.06.012, 2012.
Tsiringakis, A., Steeneveld, G.-J., Holtslag, A. A. M., Kotthaus, S., and Grimmond, S.: On- and off-line evaluation of the single-layer urban canopy model in London summertime conditions, Q. J. Roy. Meteor. Soc., 145, 1474–1489, https://doi.org/10.1002/qj.3505, 2019.
Viterbo, P. and Beljaars, A. C. M.: An improved land surface parameterization scheme in the ECMWF model and its validation, J. Climate, 8, 2716–2748, https://doi.org/10.1175/1520-0442(1995)008<2716:AILSPS>2.0.CO;2, 1995.
Willmott, C. J., Robeson, S. M., and Matsuura, K.: A refined index of model performance, Int. J. Climatol., 32, 2088–2094, https://doi.org/10.1002/joc.2419, 2012.
Wohlfahrt, G., Bianchi, K., and Cernusca, A.: Leaf and stem maximum water storage capacity of herbaceous plants in a mountain meadow, J. Hydrol., 319, 383–390, https://doi.org/10.1016/j.jhydrol.2005.06.036, 2006.
Yang, J., Wang, Z.-H., Chen, F., Miao, S., Tewari, M., Voogt, J. A., and Myint, S.: Enhancing hydrologic modelling in the coupled Weather Research and Forecasting–urban modelling system, Bound.-Lay. Meteorol., 155, 87–109, https://doi.org/10.1007/s10546-014-9991-6, 2015.
Zonato, A., Martilli, A., Gutierrez, E., Chen, F., He, C., Barlage, M., Zardi, D., and Giovannini, L.: Exploring the effects of rooftop mitigation strategies on urban temperatures and energy consumption, J. Geophys. Res.-Atmos., 126, e2021JD035002, https://doi.org/10.1029/2021JD035002, 2021.