the Creative Commons Attribution 4.0 License.
the Creative Commons Attribution 4.0 License.
 | 04 Dec 2025
CMIP7 data request: impacts and adaptation priorities and opportunities
Charlotte L. Pascoe
Claas Teichmann
David J. Brayshaw
Carlo Buontempo
Ibrahima Diouf
Jesus Fernandez
Paula L. M. Gonzalez
Birgit Hassler
Vanessa Hernaman
Doroteaciro Iovino
Martin Juckes
Iréne L. Lake
Timothy Lam
Xiaomao Lin
Jiafu Mao
Negin Nazarian
Sylvie Parey
Indrani Roy
Wan-Ling Tseng
Briony Turner
Andrew Wiebe
Damaris Zurell
The Coupled Model Intercomparison Project Phase 7 (CMIP7) undertook an extensive process to gather community input and refine data requests related to impacts and adaptation applications of Earth System Model (ESM) outputs. The Impacts and Adaptation (I&A) Data Request Team worked with CMIP7 leadership to distribute an open solicitation across many communities that use climate model outputs requesting inputs for new and existing variables, the most applicable temporal characteristics, and groupings of variables that together allow for specific application opportunities. This input was then collated and translated into CMIP7 standard templates for inclusion in the broader data request, leading to 13 I&A data request opportunities, 60 variable groups and 539 unique variables sought by vulnerability, impacts, adaptation, and climate services user communities. Here, we describe these opportunities and variable groups, as well as new insights into how ESM groups can prioritize outputs that set off a chain of further analyses, ultimately informing decisions impacting society and natural systems. These include an emphasis on high-resolution outputs to allow further modeling of climate impacts at regional and local scales, improved representation of extreme weather events, enhanced accuracy of downscaling and bias-adjustment techniques, and support for more detailed assessments for decision-making in adaptation and mitigation strategies. There is also broad interest in more extensive provisioning of two-dimensional variables at the Earth's surface, prioritizing experiments that enhance our understanding of both the recent past and future scenarios, and providing outputs that allow further downscaling and bias adjustment. We emphasize that variable groups are the fundamental level at which to engage with the I&A data request, matching the scale of input and the way output provision enables specific I&A applications. Given resource constraints, we applaud CMIP7 efforts to foster strong engagement and communication between ESM groups and the I&A team to build consensus around prudent compromises in priority variables, temporal resolutions, simulation experiments, time subsets, and ensemble members.
- Article
(1969 KB) - Full-text XML
- BibTeX
- EndNote


1.1 Background
Recent climate extremes and record-breaking global temperatures emphasize that climate change is a present and urgent challenge to nature and nearly every aspect of society (IPCC, 2023). Mitigation and adaptation actions require clear-eyed insight into the ways that humans are altering the Earth's climate and modifying specific conditions that affect the systems we care about (Ruane et al., 2022). Climate change information must also be timely to enable proactive planning, implementation and system transitions.
The Coupled Model Intercomparison Project (CMIP) has served as the premier protocol-based community for understanding Earth System Models (ESMs) and coordinating ensemble-driven climate assessments. In its previous Phase 6 (Eyring et al., 2016), CMIP6 data requests emphasized the importance of producing data that would be useful for vulnerability, impacts, adaptation and climate services (VIACS) communities (Ruane et al., 2016). This reflected that a major motivation for building and running ESMs is to understand how climate changes affect natural and human systems (Eyring et al., 2019). Inputs from a number of impact sectors and climate services experts in the lead up to CMIP6 pointed to a set of prioritized climate variables (including several variables new since CMIP5) anticipated to be of primary interest to many communities and a number of variable groups tailored to the needs of select communities. In practice, there was a disconnect between the climate variables available from CMIP6 and the needs from various Impact & Adaptation (I&A) communities (Craig et al., 2022). This disconnect can be attributed to several factors: the mismatch between the spatial and temporal resolutions of CMIP6 outputs and the requirements of impact assessments, which often demand higher-resolution data to inform local adaptation strategies. Additionally, the lack of standardized data formats, bias correction and downscaling techniques, pre-computed ensembles and metadata has posed challenges for users attempting to integrate CMIP6 data into their models and decision-making processes. Addressing these gaps is crucial for enhancing the usability of climate model outputs in real-world applications.
CMIP7 (Dunne et al., 2025) features new and improved ESMs that take advantage of more powerful computational and data storage capabilities. Within the CMIP7 framework, data request processes have been conducted to prepare efficient and effective variable production for 35 registered Model Intercomparison Projects (MIPs) and other applications within the VIACS communities (which also extends well beyond CMIP7). The CMIP7 design recognizes that VIACS communities are rising in prominence given their critical role in climate action planning and implementation, and they are growing in expertise, organization, and engagement with both stakeholders and the physical climate science community.
1.2 ESMs in applications context
In practice, CMIP's relevance to impacts and adaptation planning is vital but not always direct. ESM outputs provide the fundamental climate response information that launches a long sequence of processing and analysis that supports risk management and adaptation planning (Fig. 1) (Doblas-Reyes et al., 2021). This process is initiated by scenario inputs (e.g., emissions and land use information associated with socioeconomic and geopolitical pathways) provided by groups such as the integrated assessment models associated with ScenarioMIP (van Vuuren et al., 2025). These outputs are then converted into greenhouse gas, aerosol, and land use forcing fields that will serve as driving conditions (as overseen by the CMIP7 Forcings Task team and input4MIPs). The ESMs then simulate the responses of the Earth system to these scenarios, generating foundational understanding of changes to the atmosphere, ocean, biosphere, cryosphere and land surface potentially including all of the variables requested by this CMIP7 I&A team. ESMs rely on some of the world's most powerful computing systems, yet they must remain efficient in order to simulate long time periods, large ensembles, multiple models, different model versions (with varying structures and physics), and a wide range of future scenarios. The importance of ESM efficiency can lead to coarse outputs that motivate further downscaling (Gutowski et al., 2016; Jones et al., 2024; Yu et al., 2022) and bias-adjustment (Karger et al., 2017; Lange, 2019; Thrasher et al., 2022, 2024) to capture important sub-grid-scale responses and reach decision relevant temporal and spatial scales, although these can also introduce delays into assessment planning. This information is often then passed into impacts models that represent the response of human and natural systems (e.g., agriculture, water resources, human health, infrastructure, energy, fisheries, ecosystems), further translating global change information into the units of asset risks and benefits that may govern stakeholder decisions. Outputs from all these models are then interpreted, translated, and communicated by experts, boundary organizations, climate services and practitioners, allowing for the design and implementation of climate responses (Doblas-Reyes et al., 2021). Climate services communities therefore depend on ESM outputs and help connect stakeholders with the climate information they need to inform risk management, adaptation, and mitigation on a variety of time horizons (e.g., World Meteorological Organization (WMO) Climate Services, NOAA, UK Met Office, the World Bank Climate Change Knowledge Portal, Copernicus Climate Services).
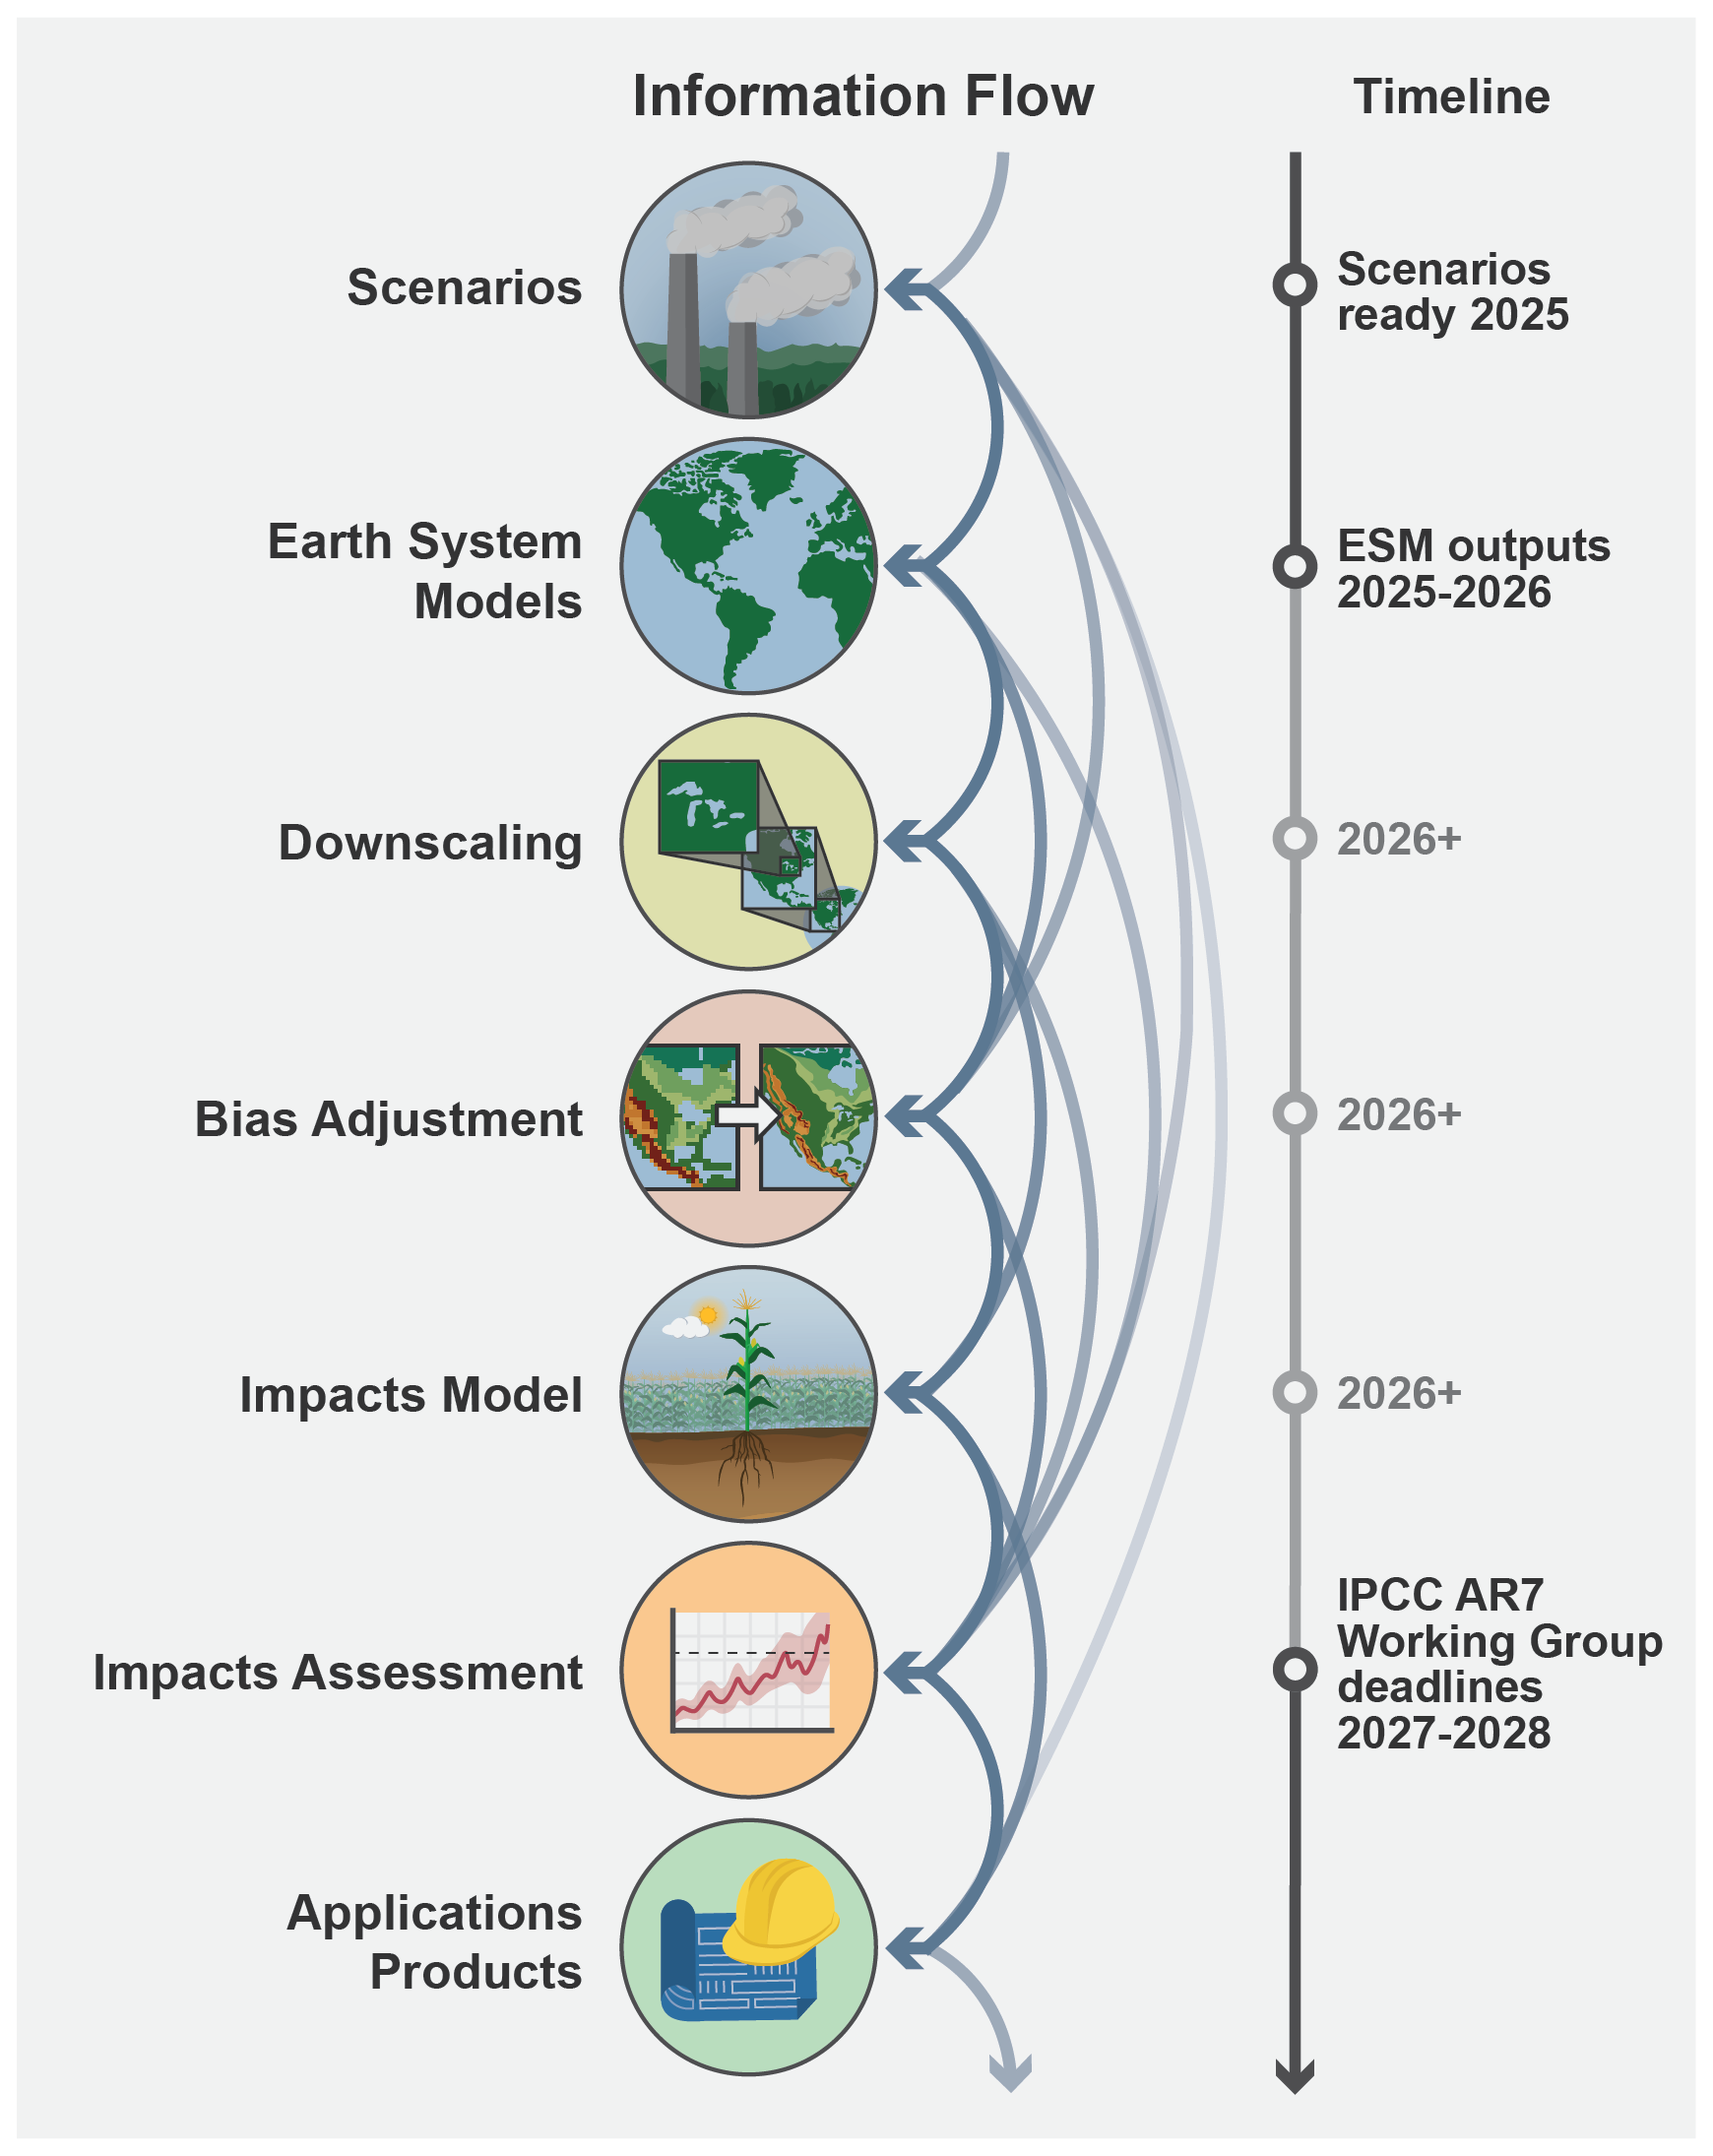
Figure 1ESM outputs in the broader context of information flow and analysis for impacts and adaptation applications. Dark arrows indicate a direct chain of inputs and outputs for analyses developing scenarios into applications products, while lighter arrows indicate the potential for skipped steps utilizing methods such as artificial intelligence or emulators to accelerate the process and conserve resources. The timeline on the right indicates targeted milestones that puts time pressure on the larger process (although precise dates are not yet finalized by the IPCC and UNFCCC), with gray dates indicating reduced certainty given dependence on resources and the successful completion of previous steps and accessibility of outputs (Ruane and Kozlowski, 2025).
The flow of climate information from ESMs to adaptation-relevant decision-making is complex, non-linear, and increasingly flexible. Figure 1 illustrates that the processing pipeline is not a fully closed system; information can enter or exit at various stages. Many applications are designed to bypass certain steps to conserve resources or address methodological limitations. For instance, some workflows move directly from ESM outputs to bias-adjusted datasets without intermediate dyanmical downscaling. Other worksflows may utilize emulators as simplified, computationally efficient models approximating the behavior of full ESMs using statistical or machine learning methods trained on existing ESM outputs. While they cannot replace ESMs entirely, they allow users to explore additional scenarios or sensitivity analyses with reduced computational cost. While these shortcuts may introduce simplifications or degrade signal quality, emerging technologies – such as artificial intelligence and physics-informed machine learning – offer promising pathways to bridge gaps efficiently, provided they are applied with care (Molina et al., 2023; Kashinath et al., 2021).
The ESM step is critical to the entire processing and decision-making pipeline, motivating great interest in the CMIP7 variable request from many downstream communities. Lack of information from ESMs cuts off whole areas of downstream application, so it is critical that CMIP7 establish an early, close and sustained engagement with the VIACS communities. Even where emulators may be used to skip the ESM step, these would depend on foundational ESM simulations with robust outputs to train the emulators across all requested variables. Machine learning and other data-driven approaches are only as good as the underlying datasets, which underscores the importance of CMIP's original, physics-based information about climate response. The steps following the ESM simulations also take substantial time and effort, which emphasizes the need for timely production and sharing of CMIP outputs, particularly in light of pressing (though not yet finalized at time of writing) IPCC AR7 deadlines.
The I&A Theme is unique within the CMIP7 Data Request because of its need to reach communities far beyond those developing and running ESMs. Work thus began by recruiting a team that could speak to the experience and practice of CMIP applications for nature and society. CMIP7 began by drawing from the foundation of the VIACS Advisory Board initiated in CMIP6 (Ruane et al., 2016), opening further with an open solicitation for participation that attracted dozens of applicants. The author team was selected based on expertise in the I&A application of CMIP outputs, an interest in covering major application sectors (e.g., water resources, cities, agriculture, ecosystems, infrastructure, health), community-led projects, and regions (Bernier et al., 2024). The team also selected authors who could utilize established networks to reach the broader VIACS communities to maximize input and community representation in the CMIP data request process.
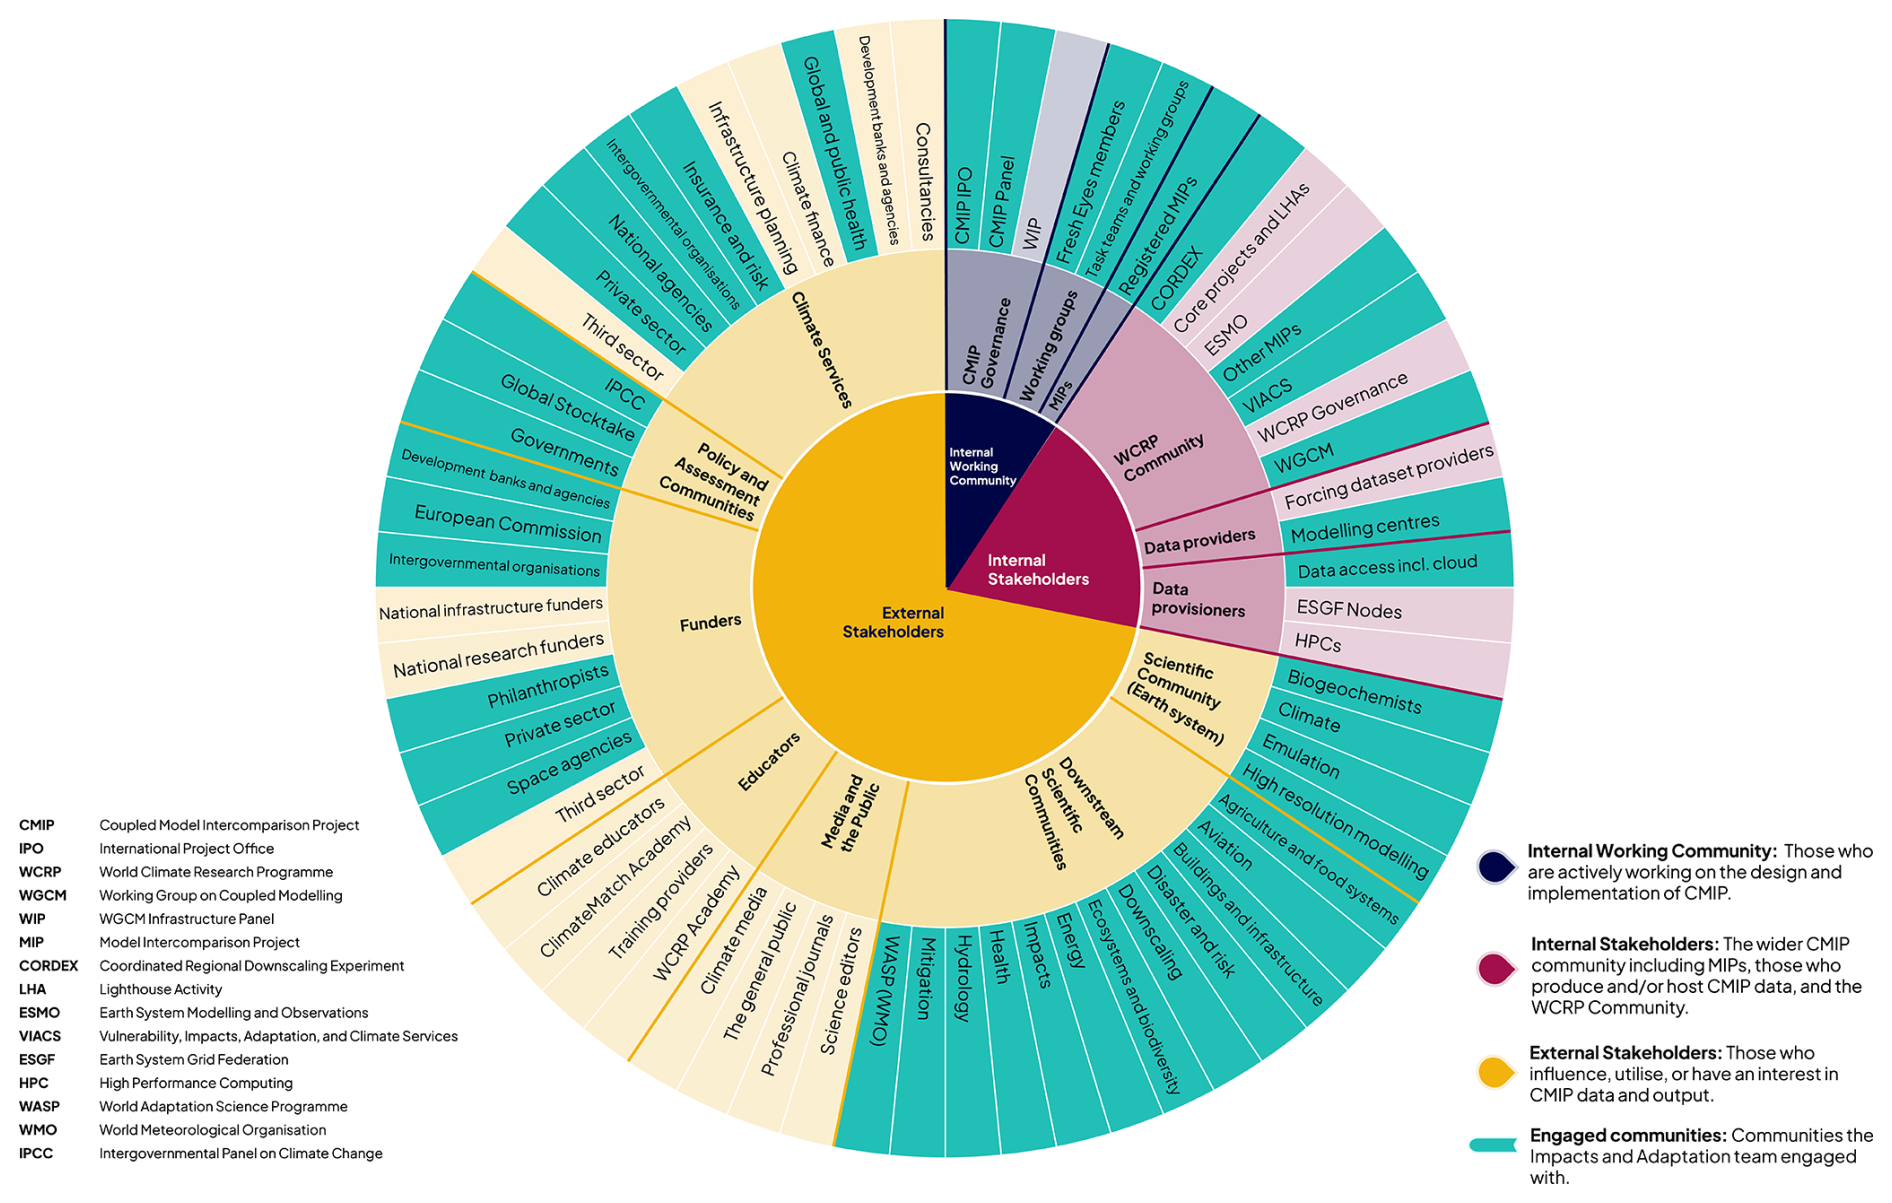
Figure 2Categories of communities contacted and contributing to the I&A Data Request, with additional informal interactions furthering the reach of the input process. The bottom-right legend indicates the broad categories of stakeholders as colored in the innermost circle, with those categories elaborated outward and the final ring indicating which communities the I&A Team specifically engaged (Ruane et al., 2025).
The I&A Team was especially interested in soliciting feedback from non-traditional CMIP partners and users of ESM outputs; however, this led to a larger gap in terms of familiarity with CMIP interfaces and data tools. Rather than asking the broader VIACS community experts to navigate the Climate and Forecasting (CF) Standard forms and CMIP7 AirTables, which define variables, variable groups and opportunities, the I&A team worked with the CMIP International Program Office (IPO) to establish a Mural Board web link for community input. Mural Board operates like a white board for generating priority data requests, with space for respondents to leave notes indicating variables of interest, provide a short justification of prioritization, and to describe the community/perspective and application they were representing. This process allowed aggregating input into relatively broad opportunities, each covering inputs from several community expert groups, many of which are not (yet) as well organized as the ESM community. The Mural Board was divided into boards for 11 sectors (Climate Services, Agriculture, Cities, Fisheries, Human Health, Infrastructure, Marine Fisheries, Terrestrial and Freshwater Ecosystems, Peace and Socioeconomic Development, Water Resources, Energy) and a Miscellaneous/Other board. These Mural boards provided instructions, examples, and templates to make I&A data requests as easy and accessible as possible, while also collecting contact information associated with each entry to document reach and allow for follow-ups when clarification was necessary. The I&A Author team then sent out invitations to provide input across broad author and CMIP networks (Fig. 2). Outreach followed a multi-pronged strategy to advertise the effort and solicit community input, including personal conversations, workshop and conference announcements and sessions, direct emails, messages on project and community list-servs, social media alerts, communications and special events organized by the CMIP IPO, and bulletins on WCRP websites (e.g., https://www.wcrp-climate.org/, last access: 25 November 2025). In many cases, these advertisements were further disseminated through partner networks reaching thousands of impacts and adaptation experts (e.g., via CORDEX, AgMIP, ISIMIP). The I&A Author team also filled in data request needs determined by their own experiences, conversations with colleagues in their field, and information drawn from groups that have published data requirements in the literature (e.g., for the storm surge community; Bernier et al., 2024). The co-development effort was also aided by web announcements, emails, and direct invitations from the CMIP IPO.
The overall I&A outreach response successfully included direct inputs on each sectoral Mural Board, with professional and scientific communities being the most common respondents, likely reflecting internal deliberations within groups already organized for collaboration in a climate applications realm. Where gaps were identified the team conducted more direct follow-on outreach, although it is likely that groups with additional inputs did not explicitly engage in the process. As inputs were public at the time of solicitation, some later inputs built on or clarified earlier inputs. The I&A Team tracked this iterative process to help determine shared priorities when combining variable requests.
Inputs from the climate applications community allowed the I&A Team to summarize the VIACS perspective to engage ESM groups in planning output production. These contributions came both from individuals responding directly to the solicitation and from communities that had deliberated internally before submitting collective feedback. The vast majority of Mural Board inputs were akin to variable groups, providing a list of specific variables required to perform a given application, for example capturing the breadth of climatic impact-drivers needed to assess risks for a vulnerable asset, calculating an impacts-relevant metric, or driving an impacts model. In some cases, the same Mural Board input included several groupings of variables for distinct applications or indications of broad support for existing requests.
Harmonizing the I&A data request with the broader CMIP7 Data Request efforts required translating the Mural Board inputs into the CF Standard forms for proposing new variables and the CMIP7 AirTables for proposing variable groups and opportunities (Mackallah et al., 2025). This process began with an initial review of inputs and communication with community members to clarify any potentially confusing entries and to track down any missing information. The I&A team then merged similar variable groups according to the type of application that each group made possible. Finally, variable groups were clustered into coherent opportunities that generally aligned with the major impacts sectors. Reflecting the collaborative nature of the process, opportunities were named according to topic rather than for specific communities, projects, or models. Multiple opportunities were constructed in broad sectors like infrastructure, which had distinct output requirements for aviation and ground transportation applications. I&A opportunities were then scrutinized by independent CMIP7 data request authors, resulting in an additional round of consolidation to avoid overwhelming ESM groups deciding on their output targets (Appendix A). The details of the other thematic areas and variable groups included in the Data Request are provided in the companion manuscripts in Atmosphere (Dingley et al., 2025), Land and Land Ice (Li et al., 2025), Earth System (McPartland et al., 2025), and Ocean and Sea Ice (Fox-Kemper et al., 2025) themes.
4.1 I&A Opportunities and variable groups
The I&A Data Request process produced 13 I&A opportunities (Table 1) consisting of 60 variable groups.
Table 1Overview of all opportunities associated with the Impacts and Adaptation data request (further details on variable groups provided in opportunity motivations below).
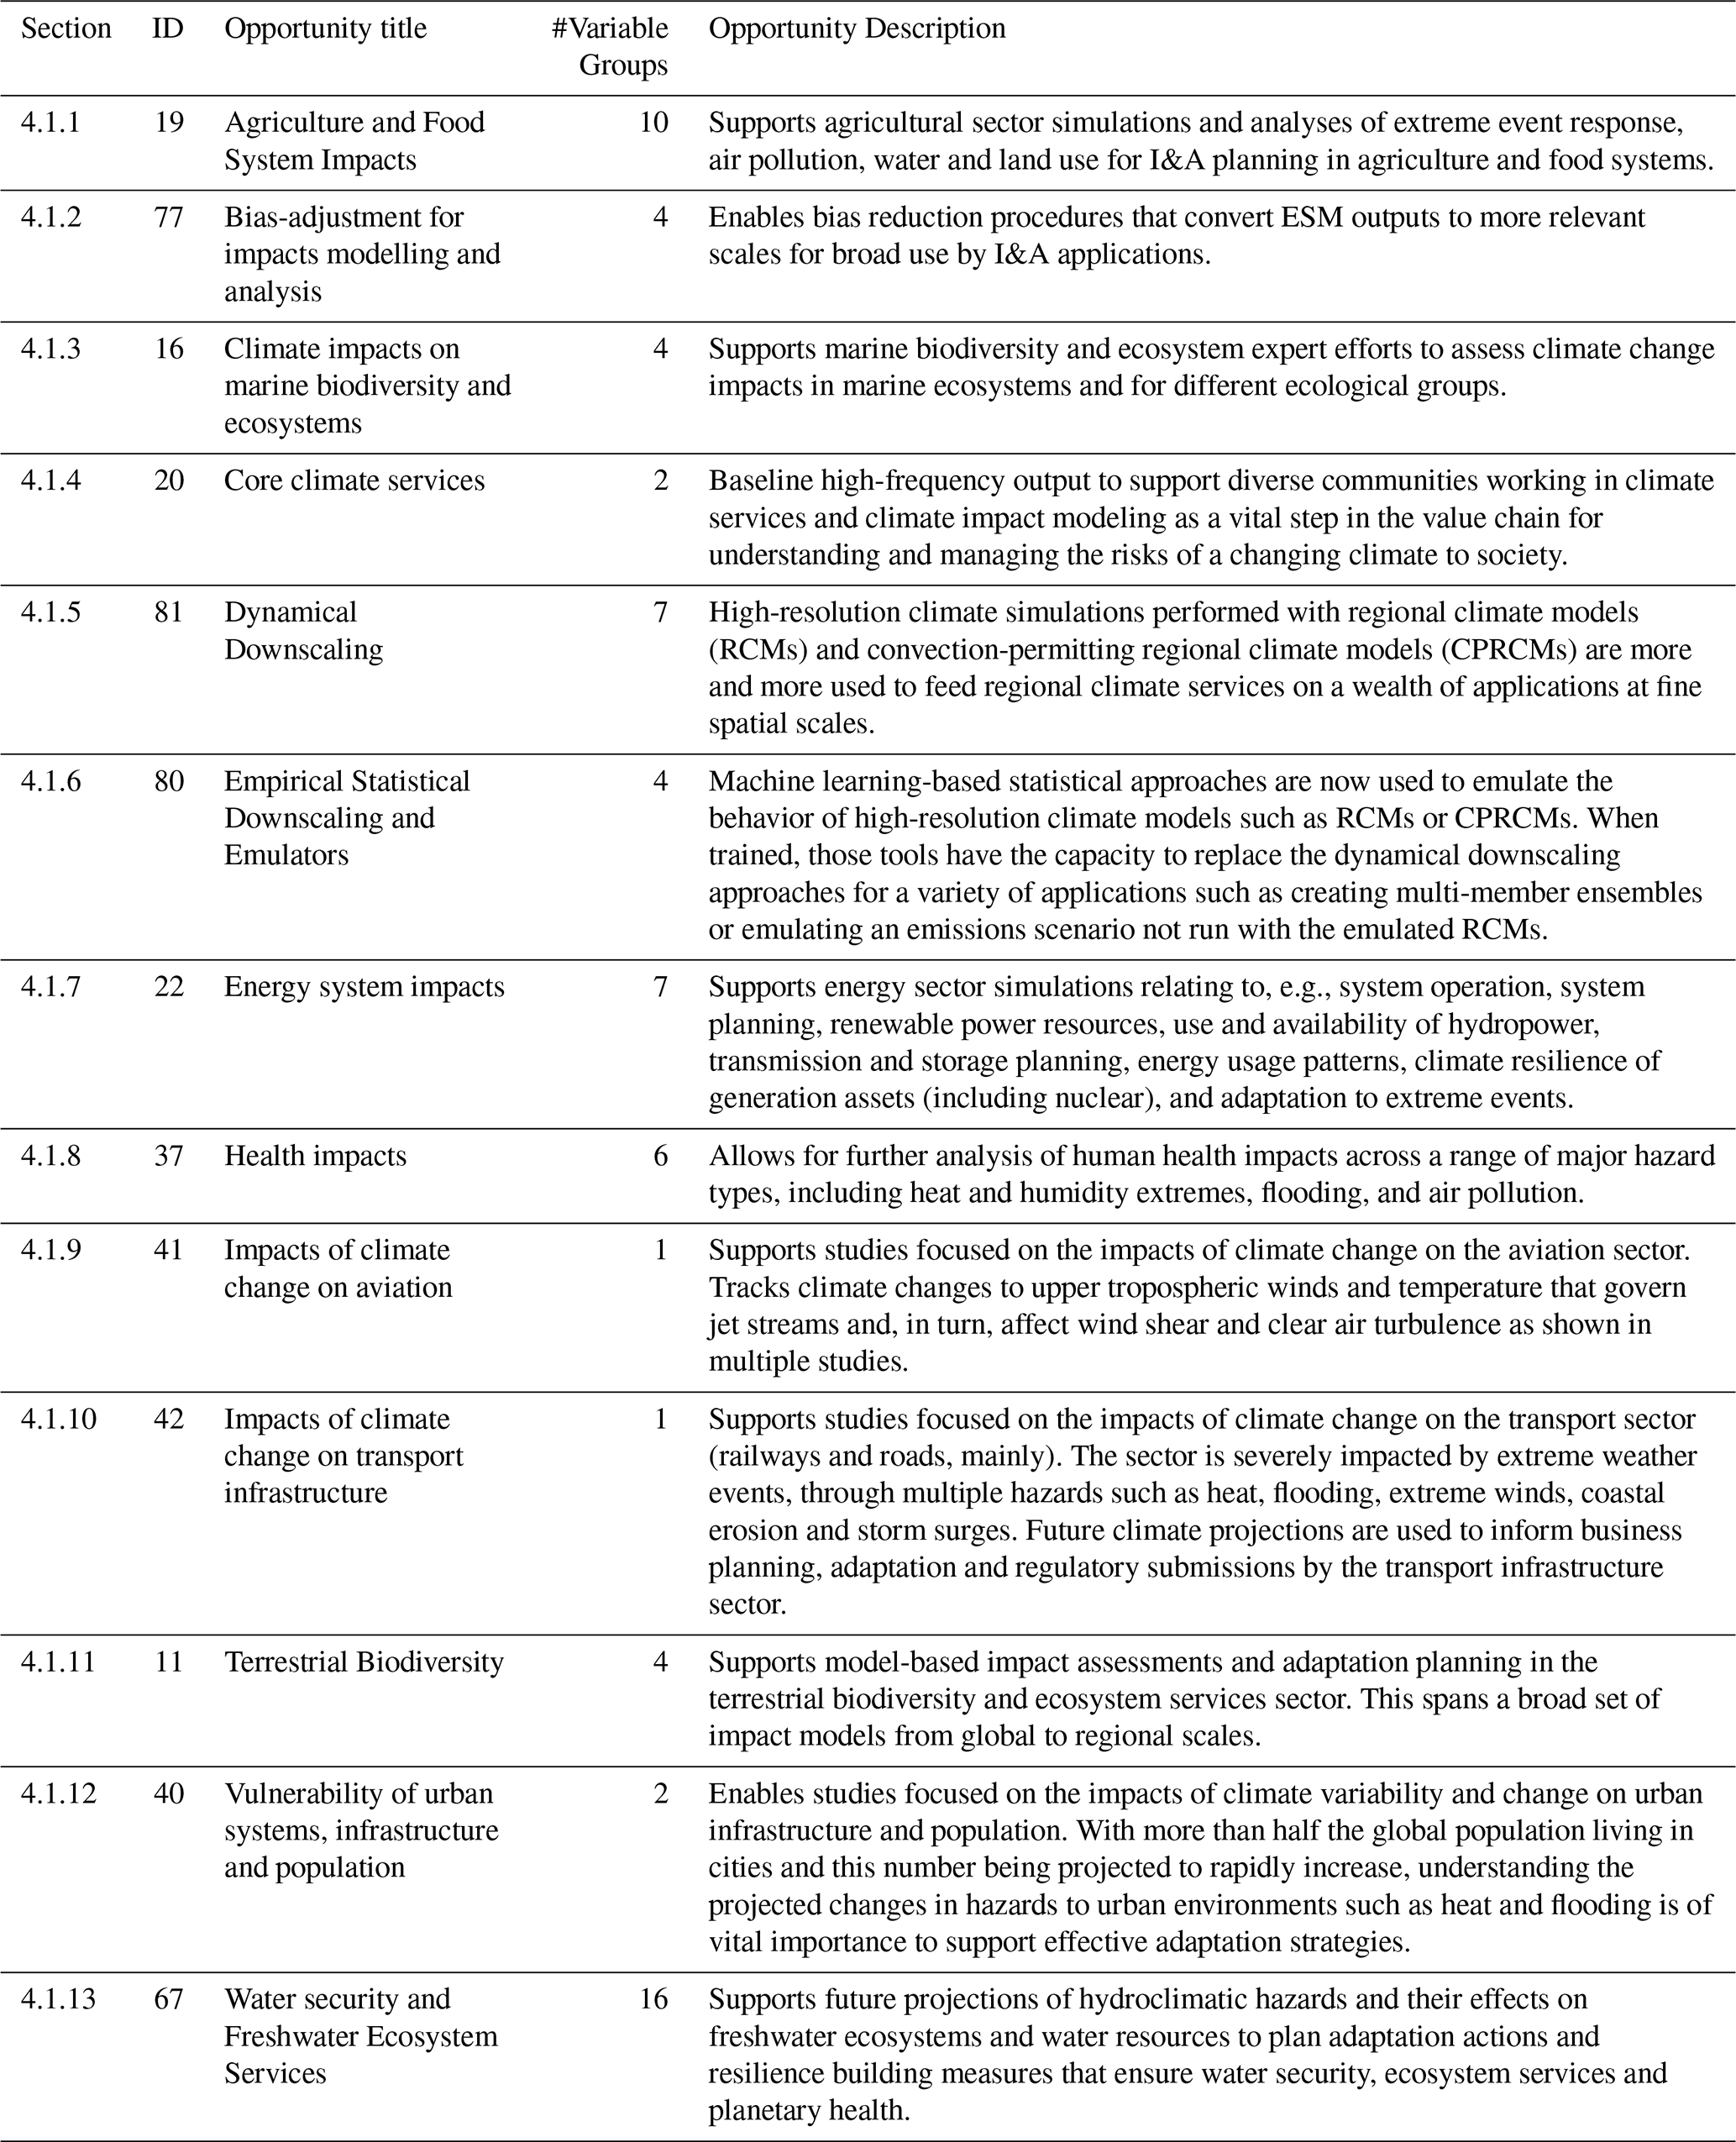
Many of the I&A opportunities cover a large number of applications appealing to broad audiences for use of CMIP7 outputs. Opportunities often align with IPCC Working Group II sectoral chapter topics, which in turn have a large number of sub-topics with unique variable groups and potential applications that could stand alone as their own opportunities. The I&A Data Request Team emphasizes that ESM groups should engage with the Opportunities first to determine the types of applications they would hope their model outputs would support, and then select among Variable Groups according to their own judgment balancing resource constraints, scientific interests, and motivation to support particular impacts and adaptation decision processes. As the I&A Team expects decisions operating on the Variable Group level, some variables are included in multiple variable groups to ensure internal coherence and sufficiency for the intended application (see also Sect. 5.1). Redundancies of output variables across variable groups are seen as highlighting a benefit given that it indicates multiple uses for the same output and a reduced overall burden for the ESM teams. The I&A Team also encourages ESM groups to avoid thinking that opportunities are all-or-nothing; even providing variables for one Variable Group (or a subset of those variables) is valuable.
In the following sections we describe the motivations for each I&A Data Request Opportunity and variable group, deepening the summaries and justifications provided in the CMIP7 Data Request AirTable.
4.1.1 Opportunity ID 19: Agriculture and Food Systems Impacts
Variables in this Opportunity support applications that help understand and prepare for risks to regional and global food systems, food security, and the livelihoods of many rural populations that rely on agricultural systems (Mbow et al., 2019; Bezner Kerr et al., 2022). Agricultural systems, here focused on terrestrial practices including field crops, agroforestry, and animal agriculture, have great potential for adaptation and mitigation as the agricultural sector is a major emitter of greenhouse gases and driver of land cover change. Forewarning of future risks allows for proactive planning and the development of adaptation and mitigation strategies that will be effective, timely, and just, even when responses are non-linear or influenced by non-climatic factors (Ruane et al., 2024)
Large communities of practice are well-established in using climate model outputs for agricultural applications. This requested received multiple inputs from the Agricultural Model Intercomparison and Improvement Project (AgMIP), which is an independent (non-CMIP7) community undertaking multi-crop-model ensemble projections of future agricultural yields, water requirements, and the downstream ramifications on food prices, food security, socioeconomic development, and geopolitical stability (Rosenzweig et al., 2013; Ruane et al., 2017; Hasegawa et al., 2018). AgMIP also coordinates global gridded crop model simulations (Jägermeyr et al., 2021) in collaboration with the Inter-Sectoral Impacts Model Intercomparison Project (ISIMIP; Frieler et al., 2024). Additional applications utilize empirical or machine learning models to anticipate crop risks or viability under different environments (Sweet et al., 2025).
Table 2Motivation for variable groups associated with Agriculture and Food Systems Impacts.
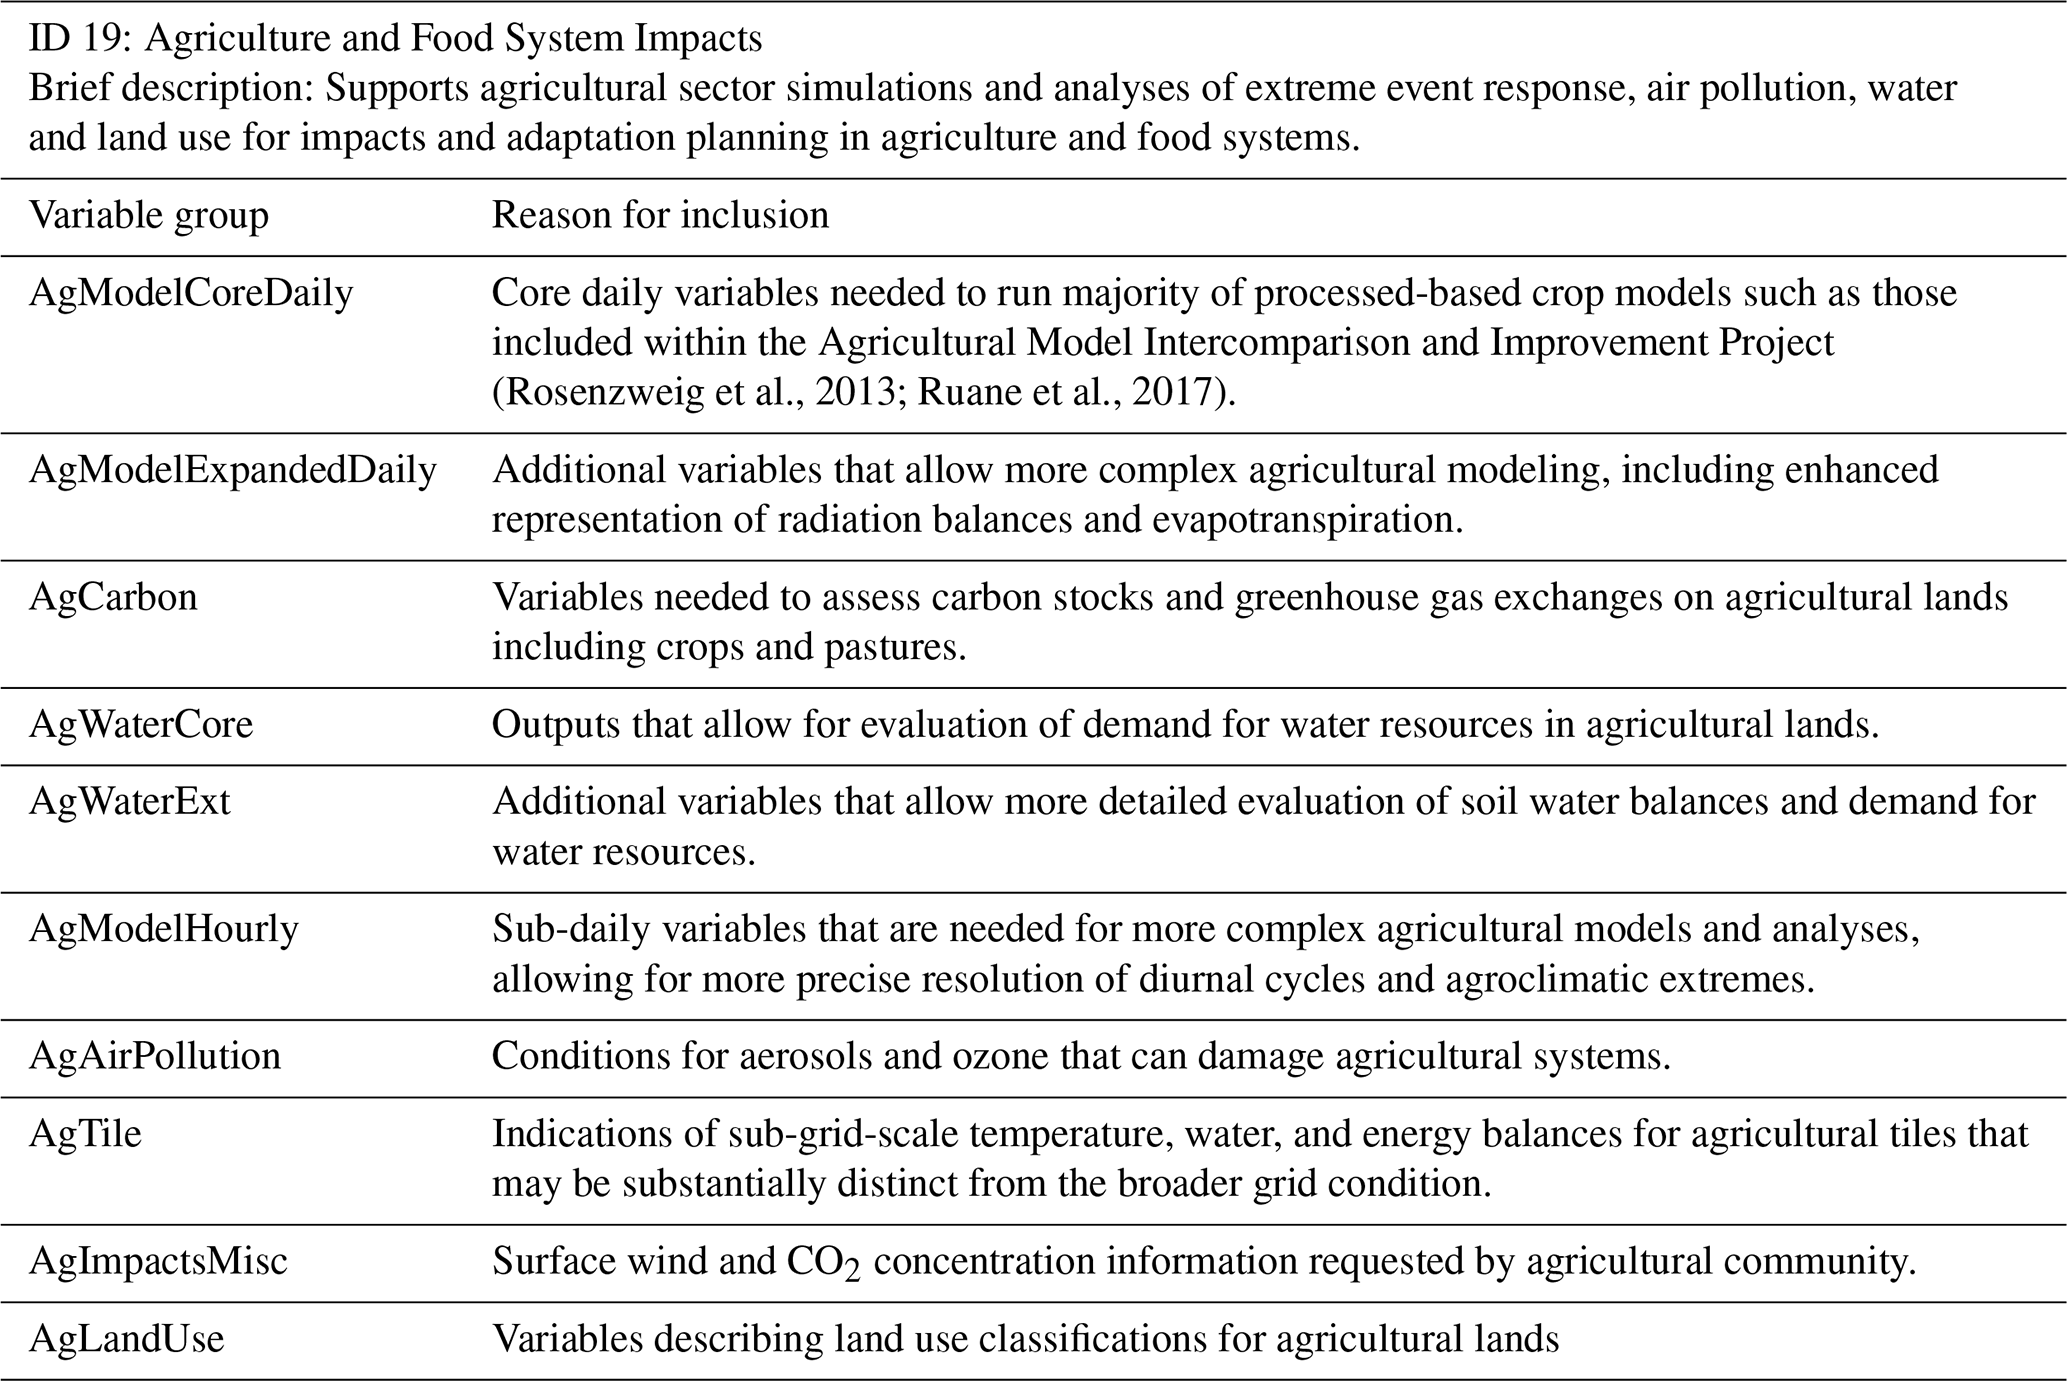
The opportunity includes 10 variable groups (Table 2), beginning with an AgModelCoreDaily variable group that includes the most commonly required information to drive a process-based crop model. This core set also serves as a minimal dataset for a large number of additional agricultural indices and suitability analyses. The AgModelExpandedDaily variable group allows for more complex determination of evapotranspiration and drought conditions in agricultural lands. An AgModelHourly variable group adds sub-daily information for more complex agricultural modeling efforts (see Appendix B for more information on new variables from all I&A opportunities). The opportunity also features variable groups that explore specific aspects of agricultural systems in a changing world, including a focus on carbon stocks and fluxes, agricultural water resources (core and extended), air pollution impacts, and land use change. The AgTile variable group requests tile water and energy balance information corresponding to the agricultural components of a larger grid cell, and the AgImpactsMisc variable group includes additional variables related to wind gusts and monthly CO2 concentrations.
4.1.2 Opportunity ID 77: Bias-adjustment for impacts modeling and analysis
This opportunity requests variables that are critical to the pipeline of bias-adjustment for impacts model assessment (Fig. 1). Variable groups were consolidated from community feedback from groups including ISIMIP (Frieler et al., 2024) and variables for the Climatologies at High-resolution for the Earth's Land Surface (CHELSA) project (Karger et al., 2020, 2023). ISIMIP produced bias-adjusted climate datasets from CMIP6 outputs (Lange, 2019) for coordinated use by impacts models across numerous sectors (e.g., agriculture, human health, forests, fisheries, water resources, energy). The requested ISIMIPMinimalAtmos variable group will enable the CMIP7 generation of ISIMIP climate projections allowing for analysis of multi-sectoral risk. ISIMIP also requested the ISIMIP3hourlyAtmos variable group given interest by regional models that operate at finer temporal resolution. The ISIMIP_deposition_variables group includes wet and dry deposition variables (NH3, NH4, NOy) useful for ecosystems, agriculture, and water resources analyses. CHELSA utilizes mechanistic statistical downscaling to produce fine resolution (1 km) mean climate statistics that have proven useful for analysis of biodiversity, wildlife and ecosystem services that may be highly sensitive to niche climate conditions in areas with complex topography, heterogeneous land use or coastlines. The CHELSA_land_daily provides outputs that would continue this work with CMIP7 outputs.
Table 3Motivation for variable groups associated with Bias-adjustment for impacts modeling and analysis.
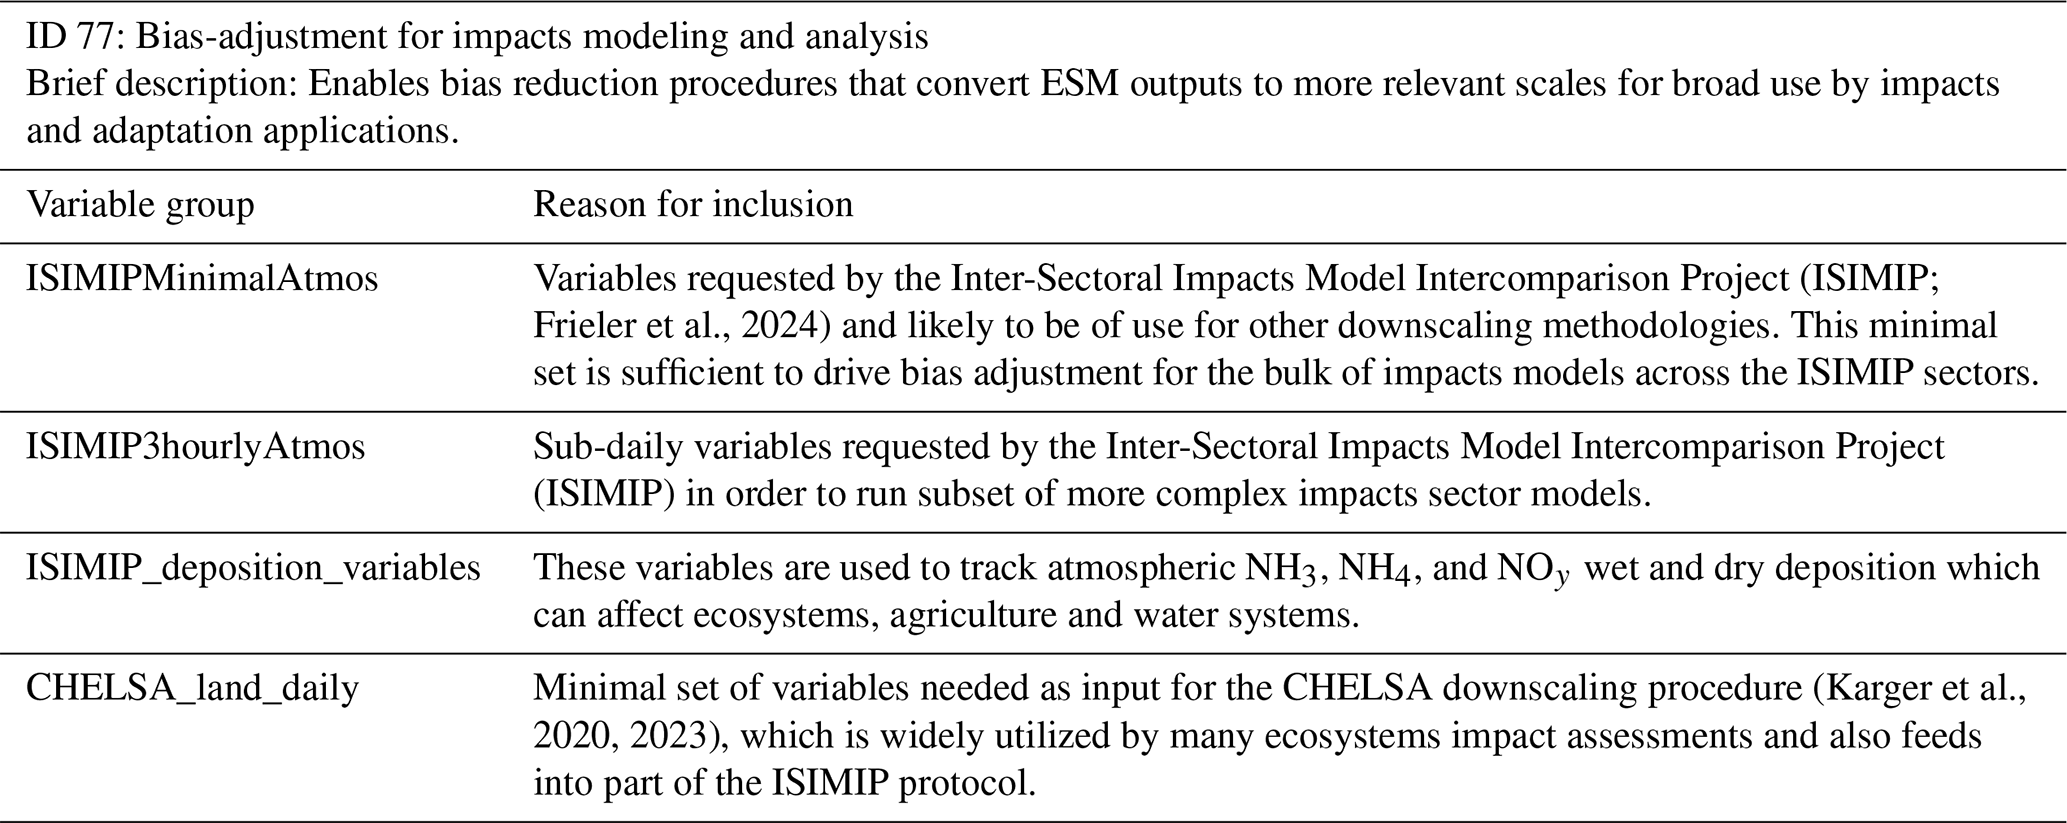
Variable groups included in this opportunity were developed with strong input from developers of ISIMIP and CHELSA (Table 3). Their established applications communities, many of whom have developed their own processing pipeline to convert climate projections into impacts model input datasets, make further application of CMIP7 outputs likely. These outputs will also enable other existing products (e.g., NASA NEX; Thrasher et al., 2022, 2024) and new bias-adjustment and statistical downscaling approaches that may emerge in the coming years, potentially including novel machine learning methods.
4.1.3 Opportunity ID 16: Climate impacts on marine biodiversity and ecosystems
This opportunity provides outputs of interest to marine biodiversity and ecosystem modellers assessing climate change impacts on marine ecosystems for different ecological groups (Cooley et al., 2022). The variables and experiments in this opportunity provide input to a broad set of fisheries and marine ecosystem models within the Fisheries and Marine Ecosystem Model Intercomparison Project (FishMIP; Tittensor et al., 2018, 2021) and beyond. Mariculture is a growing industry expected to further expand as the need for protein increases globally. Fisheries models, which focus on both wild populations, ecosystems and mariculture, play a crucial role in fisheries management, conservation, and the understanding of marine ecosystems (Doney et al., 2012). For example, these models can evaluate the impact of temperature variability on fishery sustainability (Wang et al., 2020), helping to evaluate habitat suitability and population management strategies, ensuring sustainable practices. This opportunity provides critical data to enhance the models and assess future environmental shifts and corresponding effects on marine life. Daily resolution and extended variables can significantly enhance the accuracy of fish abundance estimates. Factors such as algal primary production, dissolved oxygen and the depth of the 17 °C isotherm can provide a more comprehensive understanding of fish distributions. By integrating these variables, the model can offer more insight into aquatic life population responses to changing climate.
Table 4Motivation for variable groups associated with Climate impacts on marine biodiversity and ecosystems.
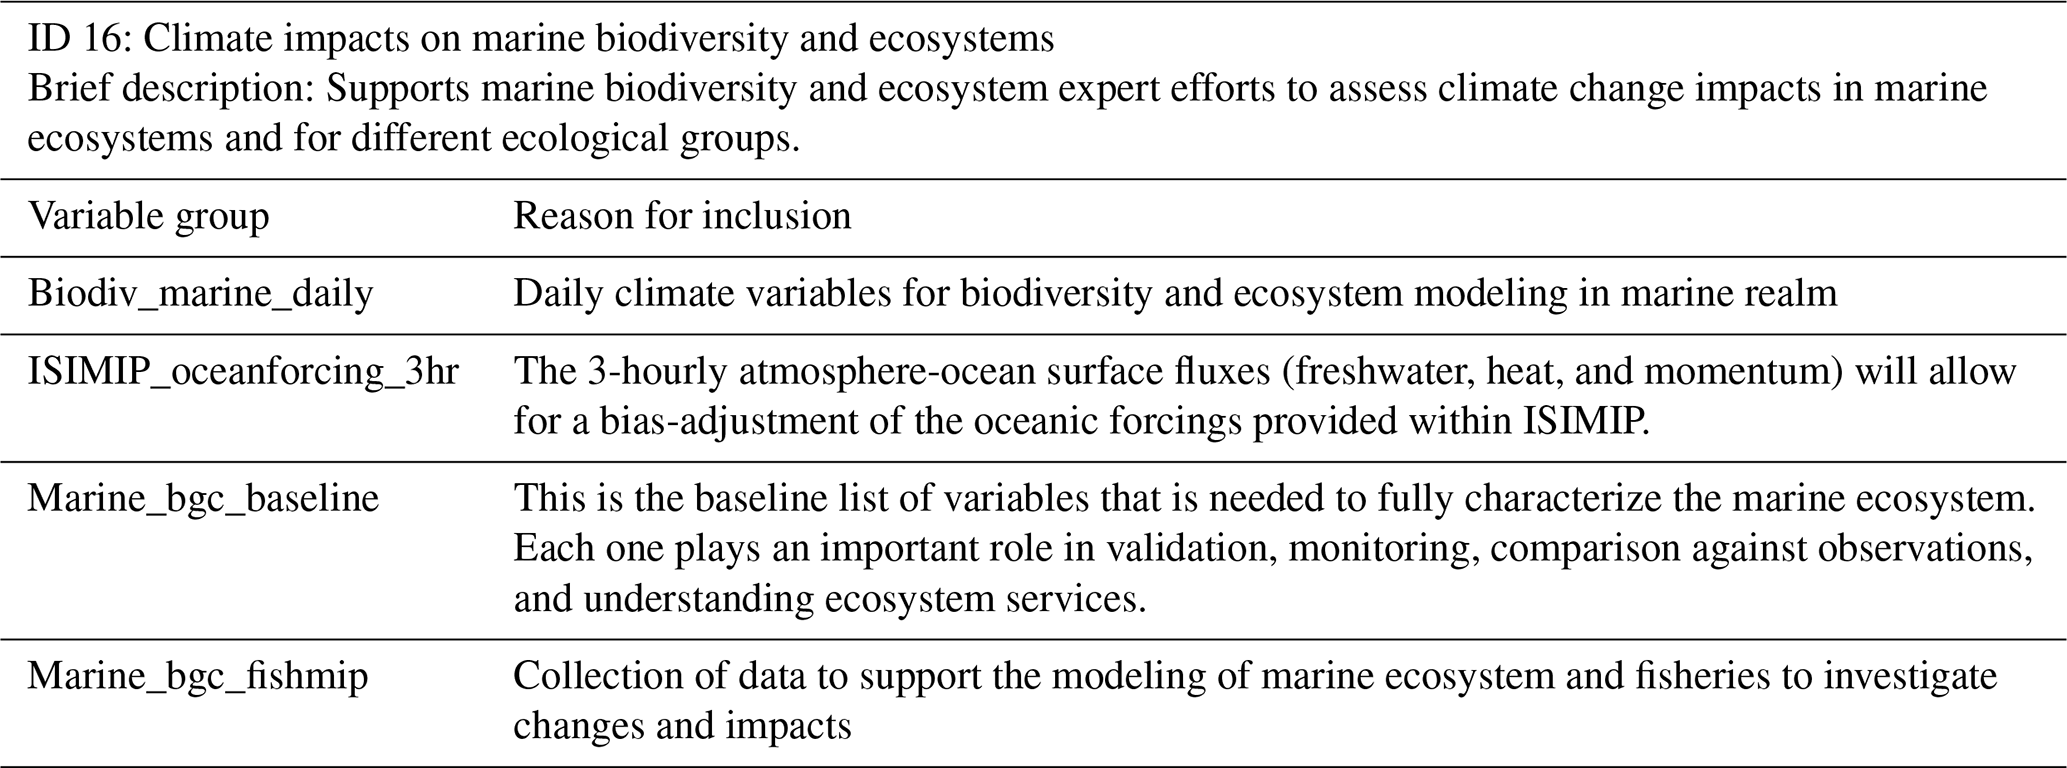
The opportunity thus supports a broad set of use cases to model marine ecosystem services (Table 4). The variable group Marine_bgc_baseline is the baseline list of biogeochemical variables needed to fully characterise the marine ecosystem. The variable group biodiv_marine_daily is requested to provide inputs for marine biodiversity models. The variable group ISIMIP_oceanforcing_3hr is required for bias-adjustment of the oceanic forcings provided within ISIMIP. To date, oceanic forcing is typically not bias-adjusted although that is quite critical for the regional marine ecosystem and fisheries models that are calibrated by observational data (Frieler et al., 2024; Lengaigne et al., 2024).
4.1.4 Opportunity ID 20: Core Climate Services
WMO (2024) noted that the “delivery and use of climate information to enable climate action has never been more crucial”. Activities within climate service and climate impact analyses tackle a diverse range of challenges, spanning different sectors, scales, and actors. It is conducted both in public and private organizations, and may take the form of relatively general user interface platforms or more bespoke activities for specific use cases. This field is rapidly growing – in 2024, 98 National Meteorological and Hydrometoerological services reported having implemented a National Framework for Climate Services, up from 36 in 2019 (WMO, 2024). Provision of a base set of high-quality near-surface climate variables is thus expected to be taken up by a very large and diverse community to improve the understanding and assessment of climate risk and impacts on key sectors.
The need for high-quality climate information cuts across many areas from water and agriculture to energy, financial services and health. Climate services are vital steps in this chain, supporting the assessment, understanding and interpretation of climate change in the context of specific sectoral applications. The impacts considered are often highly complex and require fine-resolution modeling in both time and space. However, because of the nature of climate impacts work, many different applications depend on a relatively small set of common surface/near-surface meteorological variables – for example, health risks from heatwaves and the demand for energy are both strongly sensitive to near-surface temperatures and humidity (Taylor and Buizza, 2003; Simpson et al., 2023). In previous CMIP rounds, the availability of sub-daily input data relating to these fields has been patchy, inhibiting impact modeling for climate services by requiring compromises on the temporal resolution of impact modeling activities or the extent of inter-model comparison (e.g., restricting analysis to only the subset of CMIP models providing output at the required granularity). In more extreme cases, lack of available data may even prevent the use of CMIP simulations in high-quality impact models completely (e.g., the absence of suitable high-frequency data has stymied some energy-system applications; Craig et al., 2022). This opportunity seeks to provide high-quality, high-frequency outputs to underpin a wide range of climate impact modeling activities to support enhanced climate service provision.
Table 5Motivation for variable groups associated with Core Climate Services.
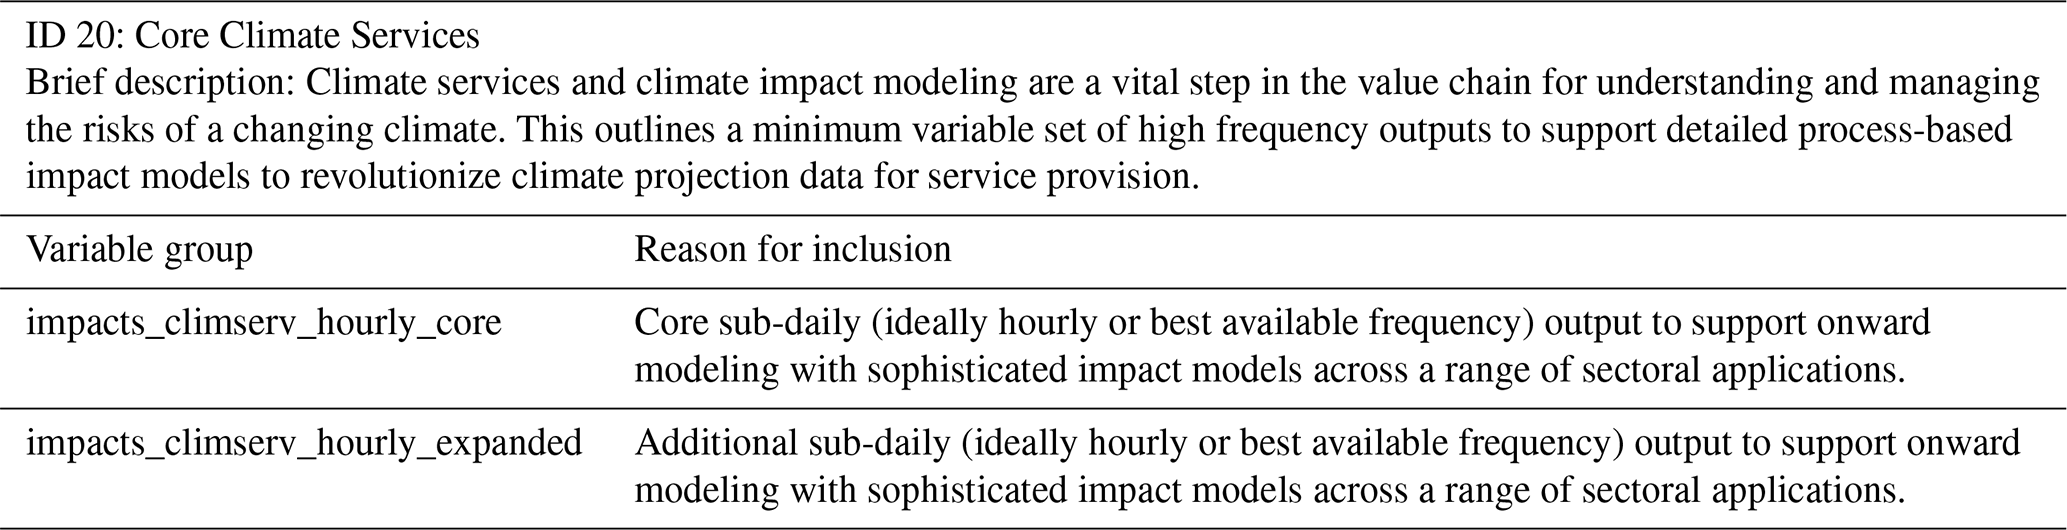
The Opportunity includes 2 variable groups (Table 5), both including high-frequency data, with both also requested in Opportunity 22 (Energy System Impacts) and enabling additional applications. The first group, impact_climserv_hourly_core focuses on a small set of sub-daily near-surface properties – temperature, wind-vectors, wind gusts, precipitation, humidity, insolation – which are suitable to support diverse applications in, e.g., health, energy, water, insurance. The second group, impact_climserv_hourly_expanded extends this to support a broader range of applications or more detailed impact models (e.g., building energy use, hydrological applications, splitting solar power between concentrating and PV types). Hourly frequency is indicated, but this is intended to be interpreted as a request for the “best possible” sub-daily resolution. Note that variable properties are selected according to the use case need (e.g., instantaneous sampling vs time-averaging, spatial sampling) and preserving these aspects is important for physical consistency and intercomparison. Experiments are selected to have most relevance to real-world challenges within the energy sector. Significant time subsets (with a minimum 20–30 years) and ensemble sizes (as many realizations as possible) are requested to ensure statistical robustness of analysis (e.g., to separate model uncertainty and internal variability). It is noted throughout that single-precision output is very likely sufficient for most impact applications.
4.1.5 Opportunity ID 81: Dynamical Downscaling
High-resolution climate simulations using regional climate models (RCMs) are increasingly vital for informing climate services across a range of societal and environmental applications. Dynamical downscaling will play a crucial role in bridging CMIP7 global projections and the needs of the impacts, adaptation, and vulnerability communities. The 3D, model-level data requested from the historical and scenario experiments are essential to perform dynamical downscaling. Among the key initiatives providing such data, the Coordinated Regional Climate Downscaling Experiment (CORDEX), endorsed by the WCRP, is recognized for its standardized approach, delivering authoritative downscaled outputs over 14 nearly continental-scale domains, derived from ESM simulations (Gutowski et al., 2016). A global effort under CORDEX-CMIP6 has already produced over 250 simulations (with 600+ planned, https://wcrp-cordex.github.io/simulation-status, last access: 26 November 2025), underlining the widespread demand for standardized boundary forcings.
Dynamical downscaling by means of RCMs (Giorgi, 2019), the core methodology in CORDEX, relies on high-frequency (typically 6-hourly) three-dimensional boundary conditions from ESMs, spanning both historical and future scenario periods. To better capture the range of global warming levels (GWLs), particularly the pre-industrial baseline (GWL+0), an extension of the temporal coverage historical ESM outputs would be needed. Specifically, we recommend extending the provision of lateral boundary conditions back to 1850 and forward to 2100 using scenario experiments; then at least up to 2125 using extension experiments. For standard CORDEX domains (10–25 km resolution), 6-hourly ESM data suffice. However, higher-frequency outputs (e.g., 3-hourly) may be required for future km-scale nesting applications anticipated under CORDEX-CMIP7, particularly from higher-resolution ESMs (e.g., < 40 km grid spacing) as envisioned in HighResMIP (Roberts et al., 2025).
Apart from the CORDEX output, this opportunity also merges requests from individual downscaling groups including those interested in regional ocean downscaling. The request has been divided into 7 variable groups (Table 6). The dynamical_downscaling_core group includes essential 6-hourly 3D atmospheric variables required for general downscaling. To address the growing demand for refined marine climate projections, the dynamical_downscaling_ocean_core group provides variables to force regional ocean models, including physics, biogeochemistry, and sea ice. The dynamical_downscaling_aerosols_chemistry group expands on traditional atmospheric variables by including aerosols and chemistry-related data, to be used by models including chemical components. For biogeochemical modeling, dynamical_downscaling_ocean_biogeochemistry_forcing and dynamical_downscaling_ocean_air_sea_biogeochemistry_forcing request monthly and daily 3D-global forcing fields, respectively. Meanwhile, dynamical_downscaling_ocean_air_sea_forcing considers hourly variables at the air-sea interface, critical for ocean-only model forcing. Finally, dynamical_downscaling_soil addresses the land component by requiring high-frequency 3D soil temperature and moisture fields.
Table 6Motivation for variable groups associated with Dynamical Downscaling.
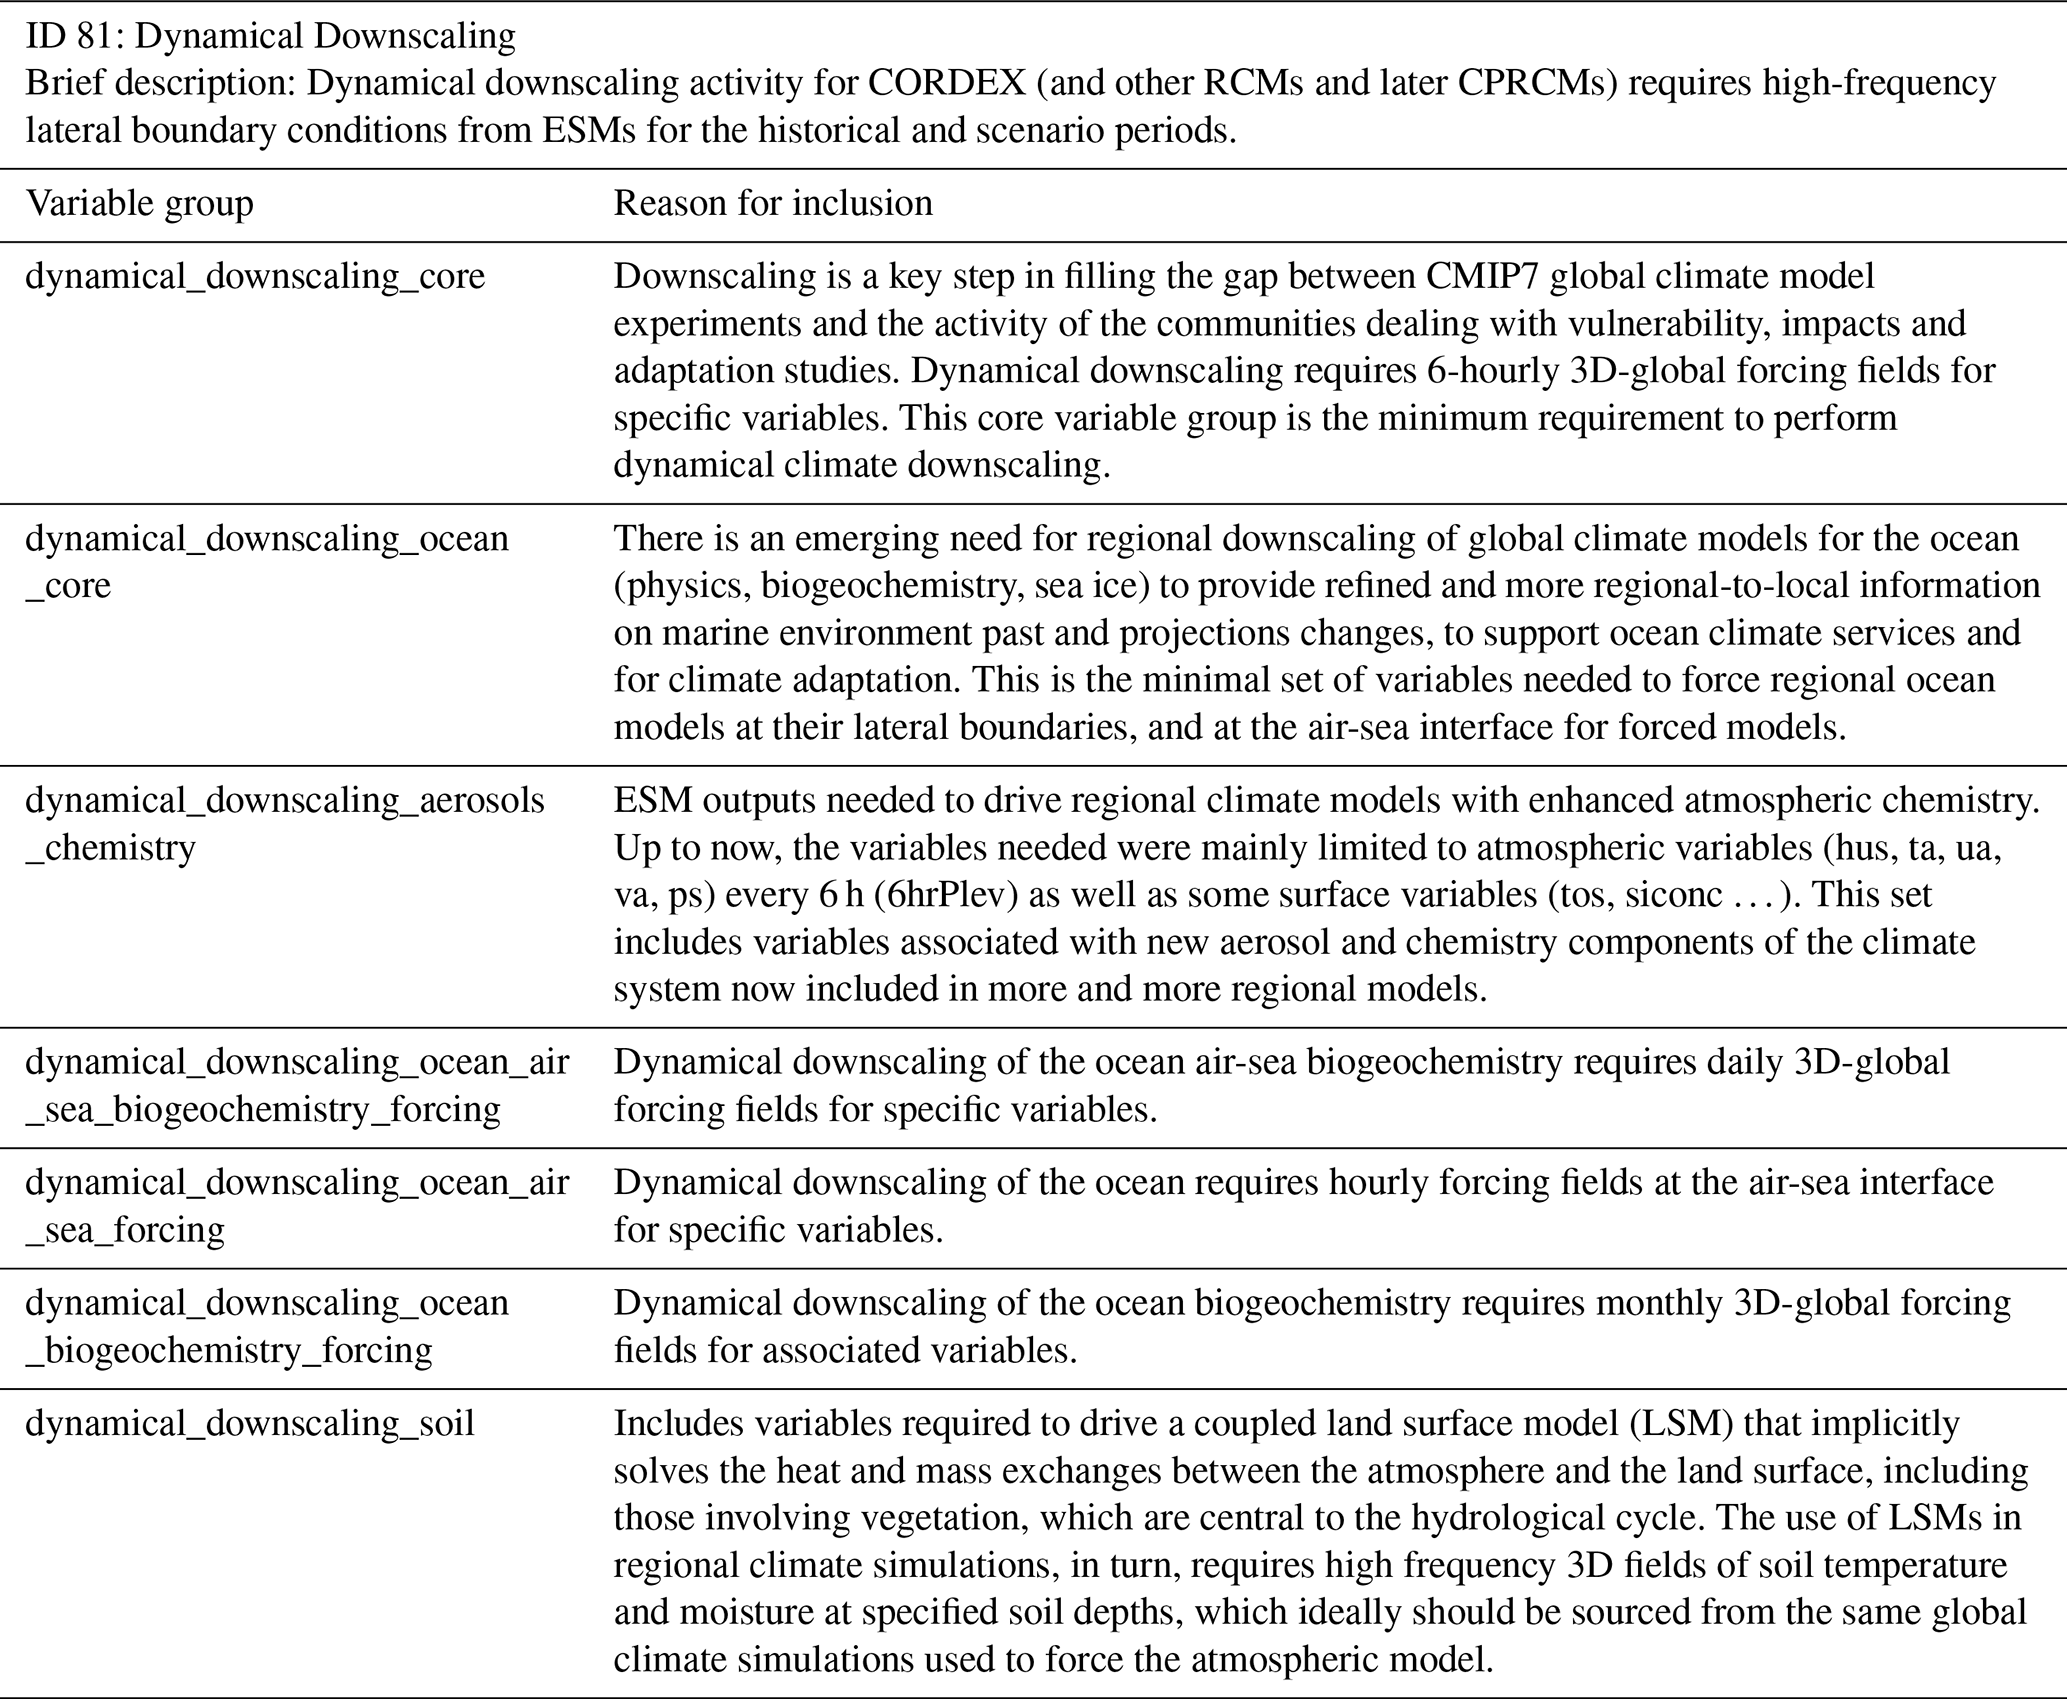
Given the larger size of 3-dimensional, high temporal resolution variables included in the Dynamical Downscaling opportunity, we reiterate that ESM groups can focus on the core variable groups and are encouraged to provide as many of the additional groups as they deem practical . Note that variables provided for RCM simulations also enable further downscaling by CPRCMs to achieve higher resolution for specific regions.
4.1.6 Opportunity ID 80: Empirical Statistical Downscaling and Emulators
Empirical-statistical downscaling (ESD; Maraun et al., 2019) exploits the relationship between large-scale and local climate observations to convert coarse ESM output into regional-to-local climate projections. Mathematical models can also be trained on complex ESM and RCM outputs to reproduce key features at lower computational cost, thus statistically emulating its behaviour (Baño-Medina et al., 2024). Both ESD and RCM-emulators are increasingly important components of the CORDEX framework, enabling an efficient generation of high-resolution climate information tailored to regional and local needs. As in the previous case, this is an intermediate opportunity that is not sector-specific but enables a key step in the information pipeline described in Fig. 1. These CORDEX techniques and similar ESD efforts can serve critical sectors such as agriculture, water management, energy, and urban planning, where timely, location-specific climate data is vital for decision-making. Stakeholders include national meteorological services, environmental agencies, infrastructure planners, and adaptation practitioners. Established communities, like the CORDEX-ESD group or the recently established CORDEX Task Force on Machine Learning, help coordinate efforts and improve methodological robustness.
Table 7Motivation for variable groups associated with Empirical Statistical Downscaling and Emulators (CORDEX).
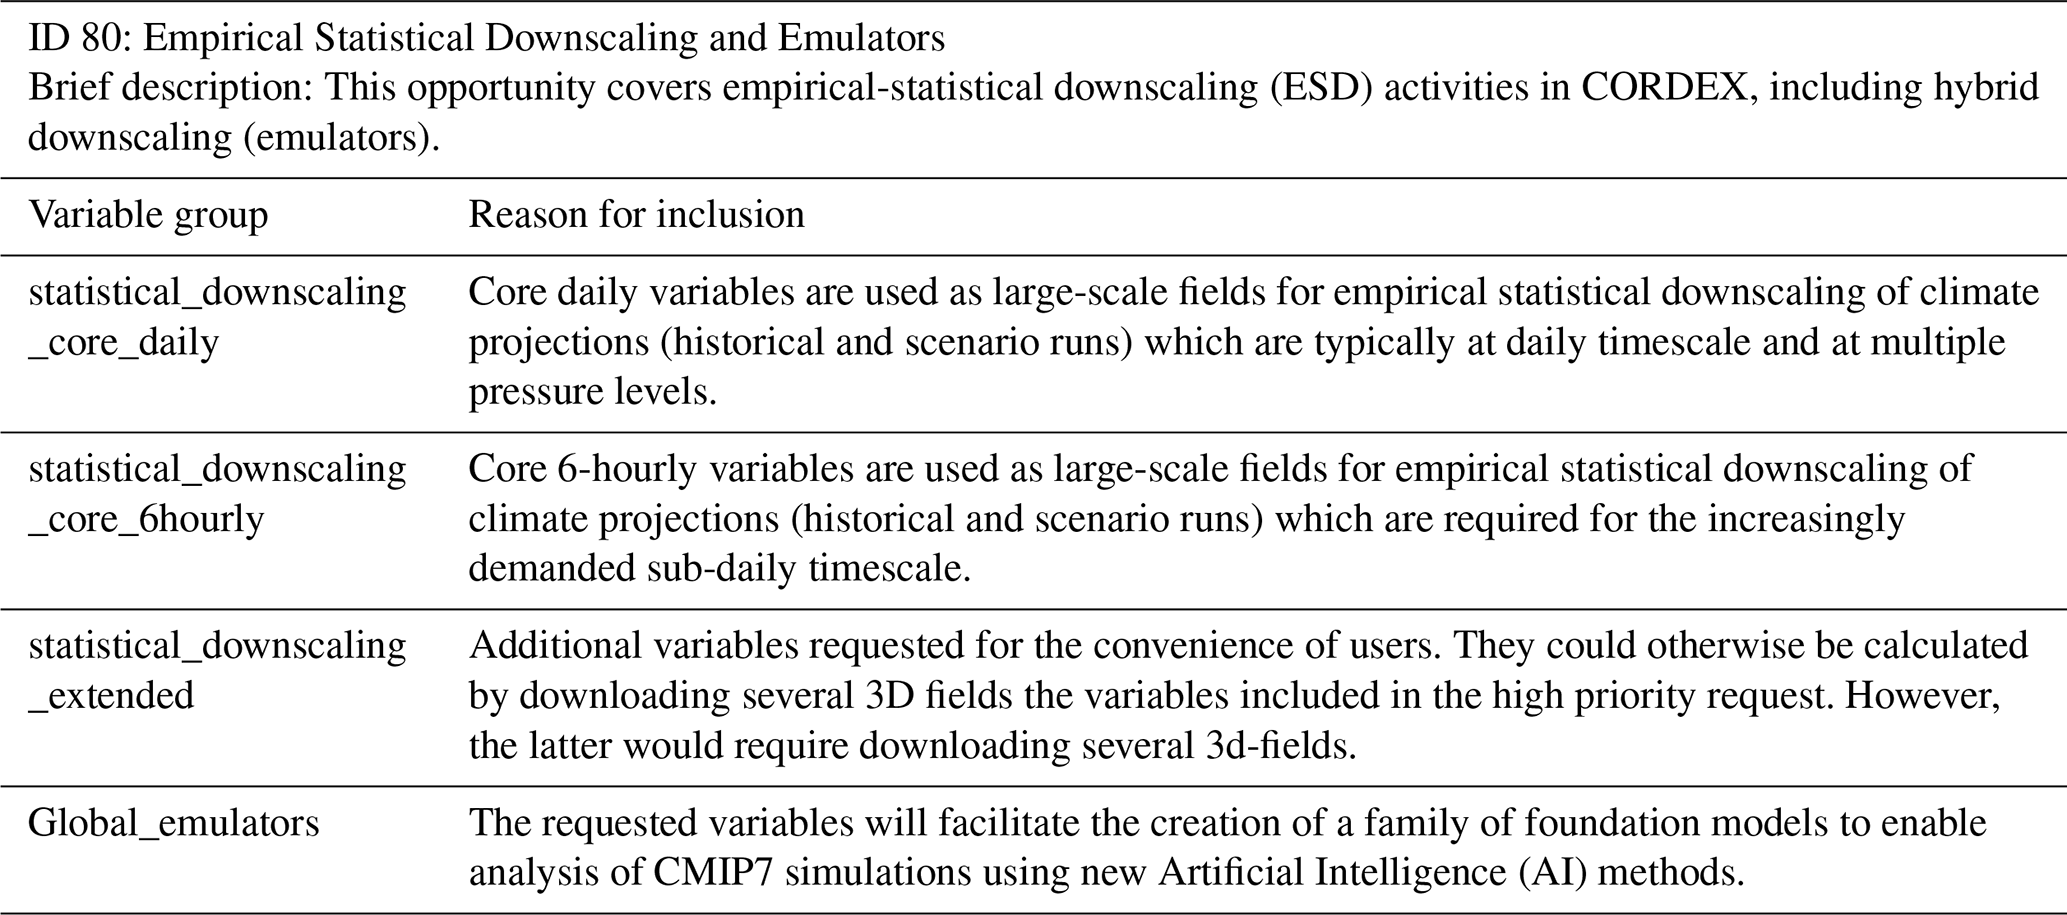
This request targets key variables needed for both traditional ESD methods and newer hybrid emulators. (Table 7) These tools are trained on large-scale atmospheric fields from reanalysis products or driving ESMs and can be applied to CMIP7 outputs, provided compatible variables are available. The statistical_downscaling_core_daily group includes essential daily variables (e.g., temperature, wind, moisture, geopotential height) on standardized pressure levels, supporting the main workflow of empirical-statistical methods that downscale historical and scenario simulations. In response to increasing user demand for high-frequency climate information, the statistical_downscaling_core_6hourly group covers the same set of variables at 6 h resolution. These are crucial for applications such as hydrological modeling, sub-daily event analysis, and early warning systems. Maintaining consistency in pressure levels across both daily and sub-daily datasets ensures compatibility in training and deployment phases. The statistical_downscaling_extended group includes variables like monthly wet-day frequency and mean wet-day precipitation, which, while derivable from daily data, are computationally intensive to calculate. Their inclusion directly supports efficient modeling of 24 h precipitation statistics and broader adoption of ESD by users with limited processing capacity. Finally, the global_emulators group provides variables for training AI-based emulators that replicate the behaviour of complex climate models. These emulators enable cost-effective, flexible projections, including under scenarios not originally simulated. AI-driven tools are also expected to play a transformative role in CMIP7 analysis by enabling rapid synthesis across multi-model ensembles.
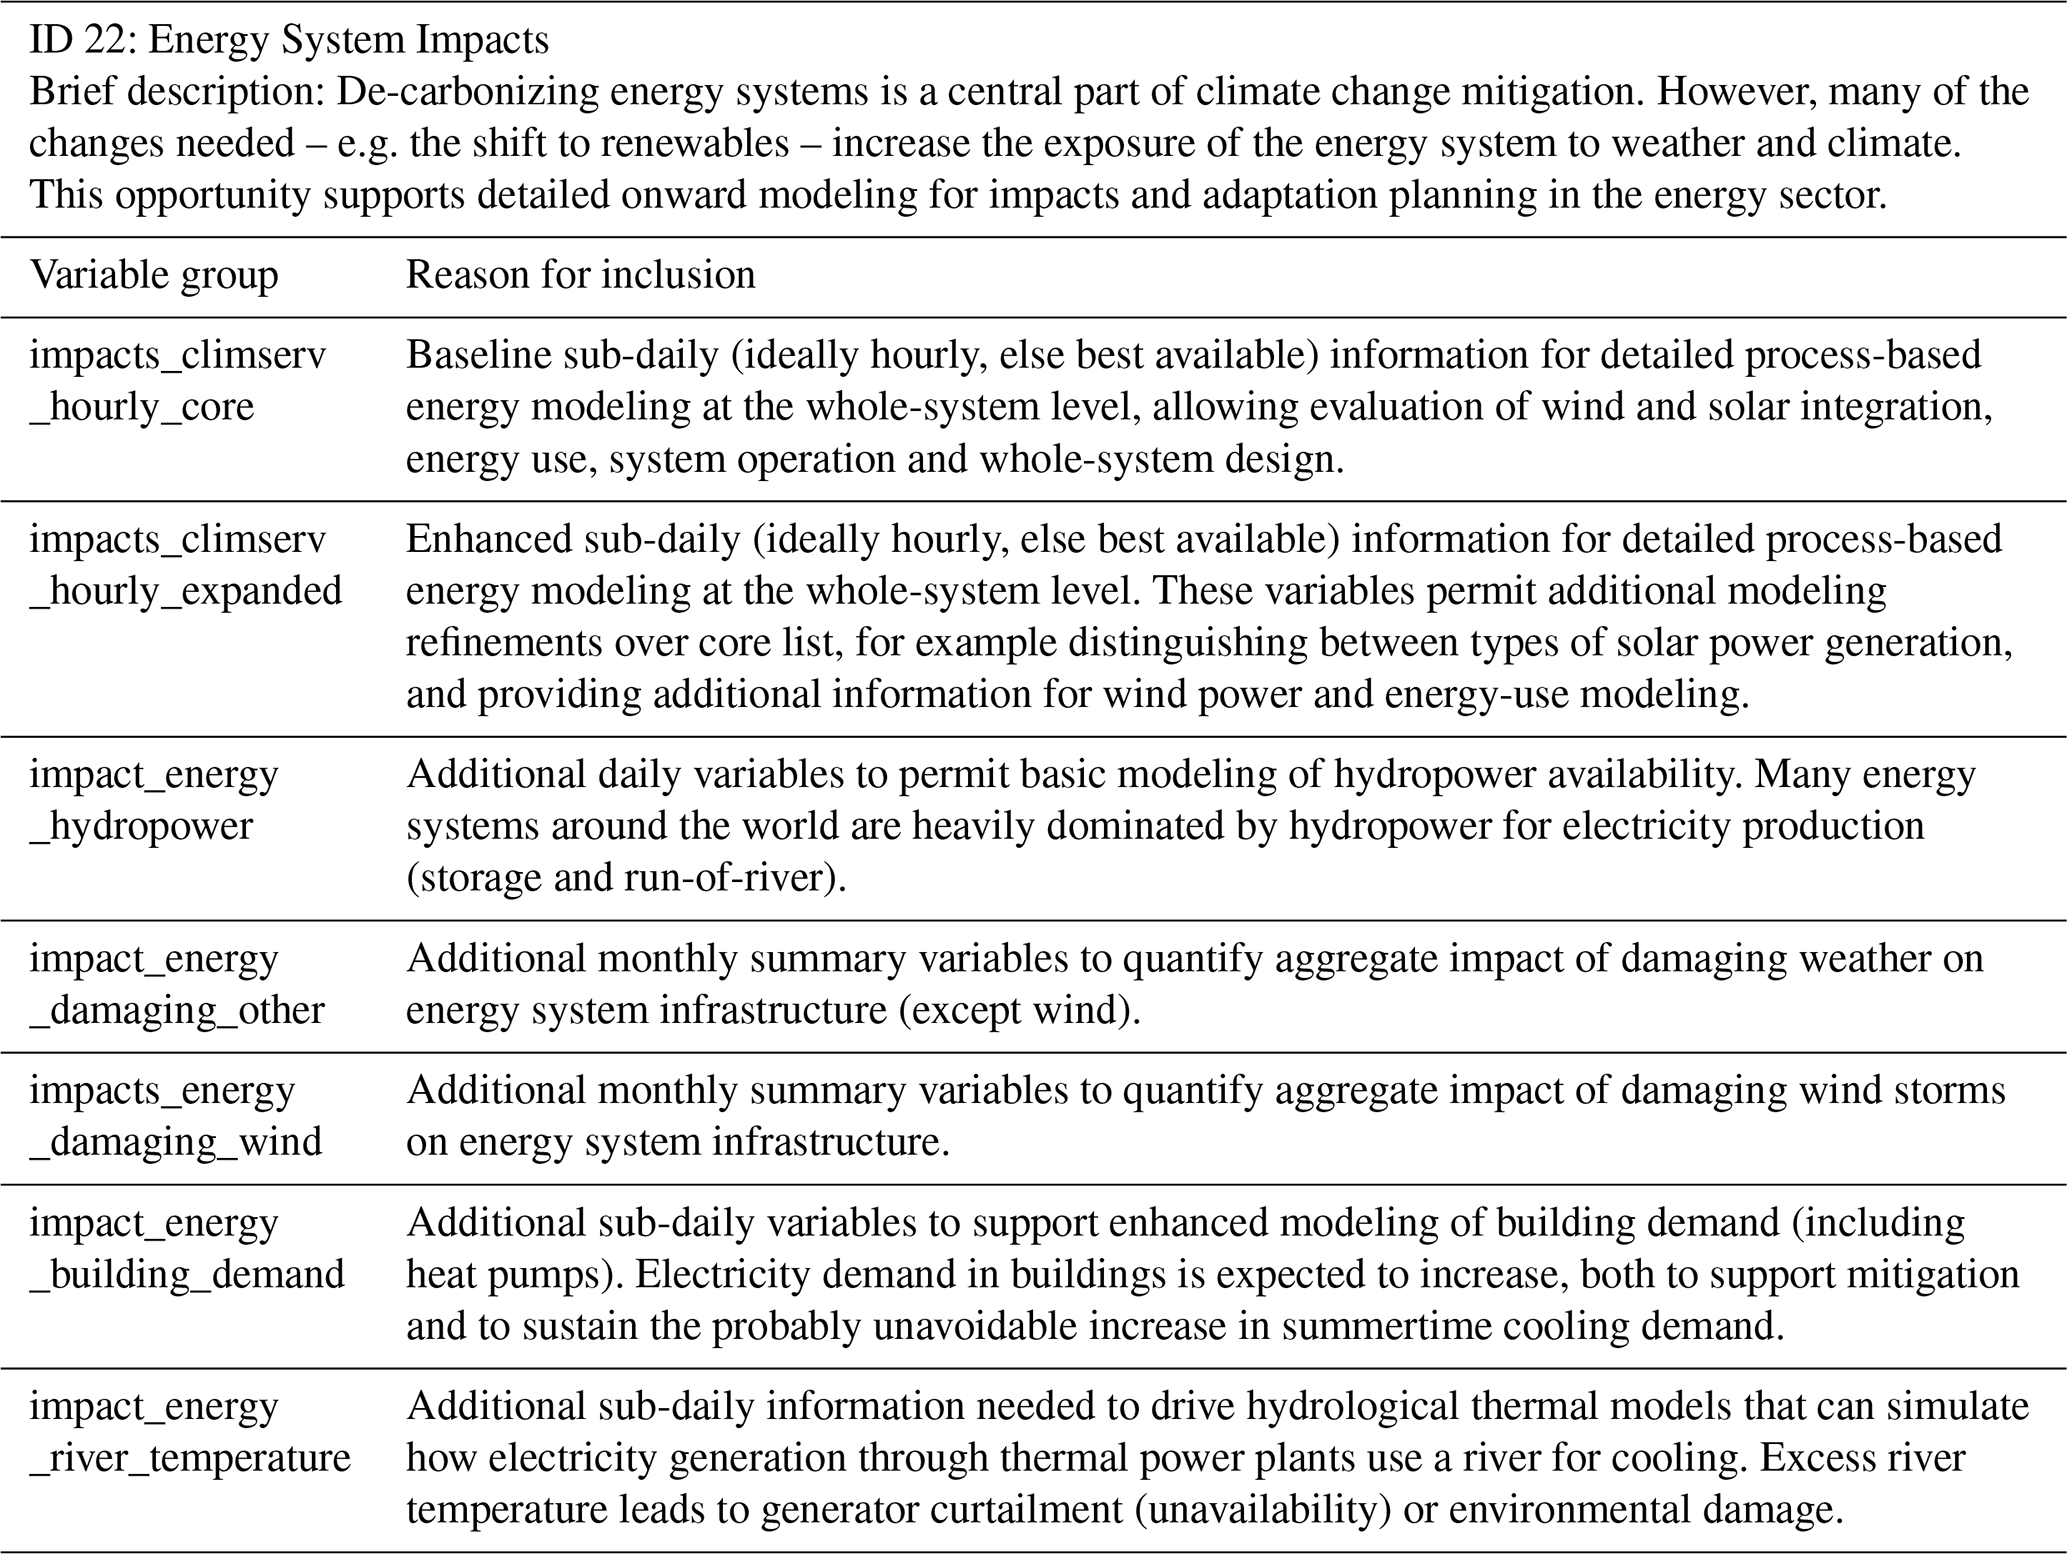
4.1.7 Opportunity ID 22: Energy System Impacts
The de-carbonization of the global energy system is central to climate mitigation, with investment in clean energy reaching USD 2 trillion in 2024 (Giroud, 2024; Hassan et al., 2024; IEA, 2024). The scale of change is fundamentally transforming the nature of how energy systems operate. The CMIP outputs requested in this opportunity support a wide range of energy-sector applications seeking to understand, assess and manage climate risk within this complex and rapidly-evolving energy landscape, “overcoming the disconnect” that has previously existed between the energy- and climate- system science communities (Craig et al., 2022). Specific applications include the understanding and assessment of system operation, system planning, renewable power resources, use and availability of hydropower, transmission and storage planning, energy usage patterns, climate resilience of generation assets (including nuclear), and adaptation to extreme events.
There is an emerging international community of practice to support the uptake of energy systems-relevant ESM output, including its onward “conversion” to provide vital climate services to end-users and decision-making stakeholders (WMO, 2022). While no single, definitive WCRP-based “-MIP” exists (perhaps reflecting the aforementioned historic disconnect between energy and climate scientists; Craig et al., 2022), numerous overlapping groups draw in a wide community of research, industry and policy-makers. These include the Next Generation Challenges in Energy and Climate Modelling workshop community (NextGenEC; Craig et al., 2022), the International Conference on Energy and Meteorology (ICEM), the Open Energy Modelling Initiative (OpenMod), multiple long-running dedicated sessions at the American Geophysical Union and European Geophysical Union, established provision climate services and datasets (e.g, PECDv4, Dubus et al., 2022), and relevant parts of ISIMIP.
The Opportunity includes 7 variable groups, sharing a set of high-frequency variable groups with Opportunity 20 (Core Climate Services): impacts_climserv_hourly_core and impacts_climserv_hourly_extended (Table 8). These emphasize a small set of sub-daily output of near-surface fields pertaining to energy applications – ideally hourly but intended to request the “best possible” sub-daily resolution. The core set impacts_climserv_hourly_core provides the baseline information for detailed process-based energy modeling at the whole-system level (i.e., informing the integration of renewable generation and whole-system design), while impacts_climserv_hourly_expanded permits additional modeling refinements, making it possible to distinguish between types of solar power generation and providing additional information for wind power and energy-use modeling. It is noted that the need for high-frequency output is dictated by both scientific necessity and convention. Scientific necessity tracks that power systems require quasi-instantaneous matching of supply, demand and storage across a spatially extended transmission network, thus recommending complex data which maintains “realistic” multi-variate spatio-temporal co-variability that is essential even as statistical downscaling is usually not possible. Convention favors data for detailed energy-system models typically run at hourly resolution, which facilitates greater uptake by the energy modeling community. Variable properties are selected carefully according to need: e.g., instantaneous sampling of wind vectors is essential to avoid smoothing associated with time-averaging that produces substantial biases in wind-power modeling applications. Sub-daily outputs (at least 3-hourly) are also required for: impact_river_temperature (risk to environment and/or curtailment of cooling systems for nuclear and fossil-fuel generation) or impact_energy_building_demand (use of energy in buildings), while daily outputs, including daily maxima, can be used for impact_energy_hydropower (hydropower availability); impact_energy_damaging_wind (wind storm damage to energy infrastructure); impact_energy_damaging_other (proxies for damage to energy infrastructure from other meteorological hazards). Experiments are selected to have most relevance to real-world challenges within the energy sector. Significant time subsets (min 20–30 years) and ensemble sizes (as many as possible) are requests to ensure statistical robustness of analysis (the sensitivity of energy system planning to climate variability on multi-annual timescales has been well established; Bloomfield et al., 2016, 2021; Zeyringer et al., 2018). It is noted throughout that single-precision output is very likely sufficient for most energy applications.
Table 8Motivation for variable groups associated with Energy Systems Impacts.
4.1.8 Opportunity ID 37: Health impacts
This opportunity facilitates applications of ESM outputs to gauge impacts and potential adaptation to climatic impact-drivers connected to human health (Ranasinghe et al., 2021) across 6 variable groups (Table 9). Climate change has both direct and indirect impacts on human health. Direct health impacts arise from a number of climatic impact-drivers, including pervasive mean conditions and extreme heat, cold, wind storms, flooding, and ice events, as well as changes to atmospheric composition which influences the air pollution levels humans are exposed to (Im et al., 2022, 2023). Indirect health risks arise from climate's influence on the many natural and human systems that are linked to broader health systems, including effects on vector-borne diseases, food and water safety and security, malnutrition, and the consequences of malnutrition and displacement. The nature of these climate impacts heightens the interests of the general population and a large number of public, private, civil society and non-governmental organizations charged with reactive and proactive planning to reduce morbidity and mortality across complex health systems and diverse, vulnerable populations.
Table 9Motivation for variable groups associated with Health impacts.
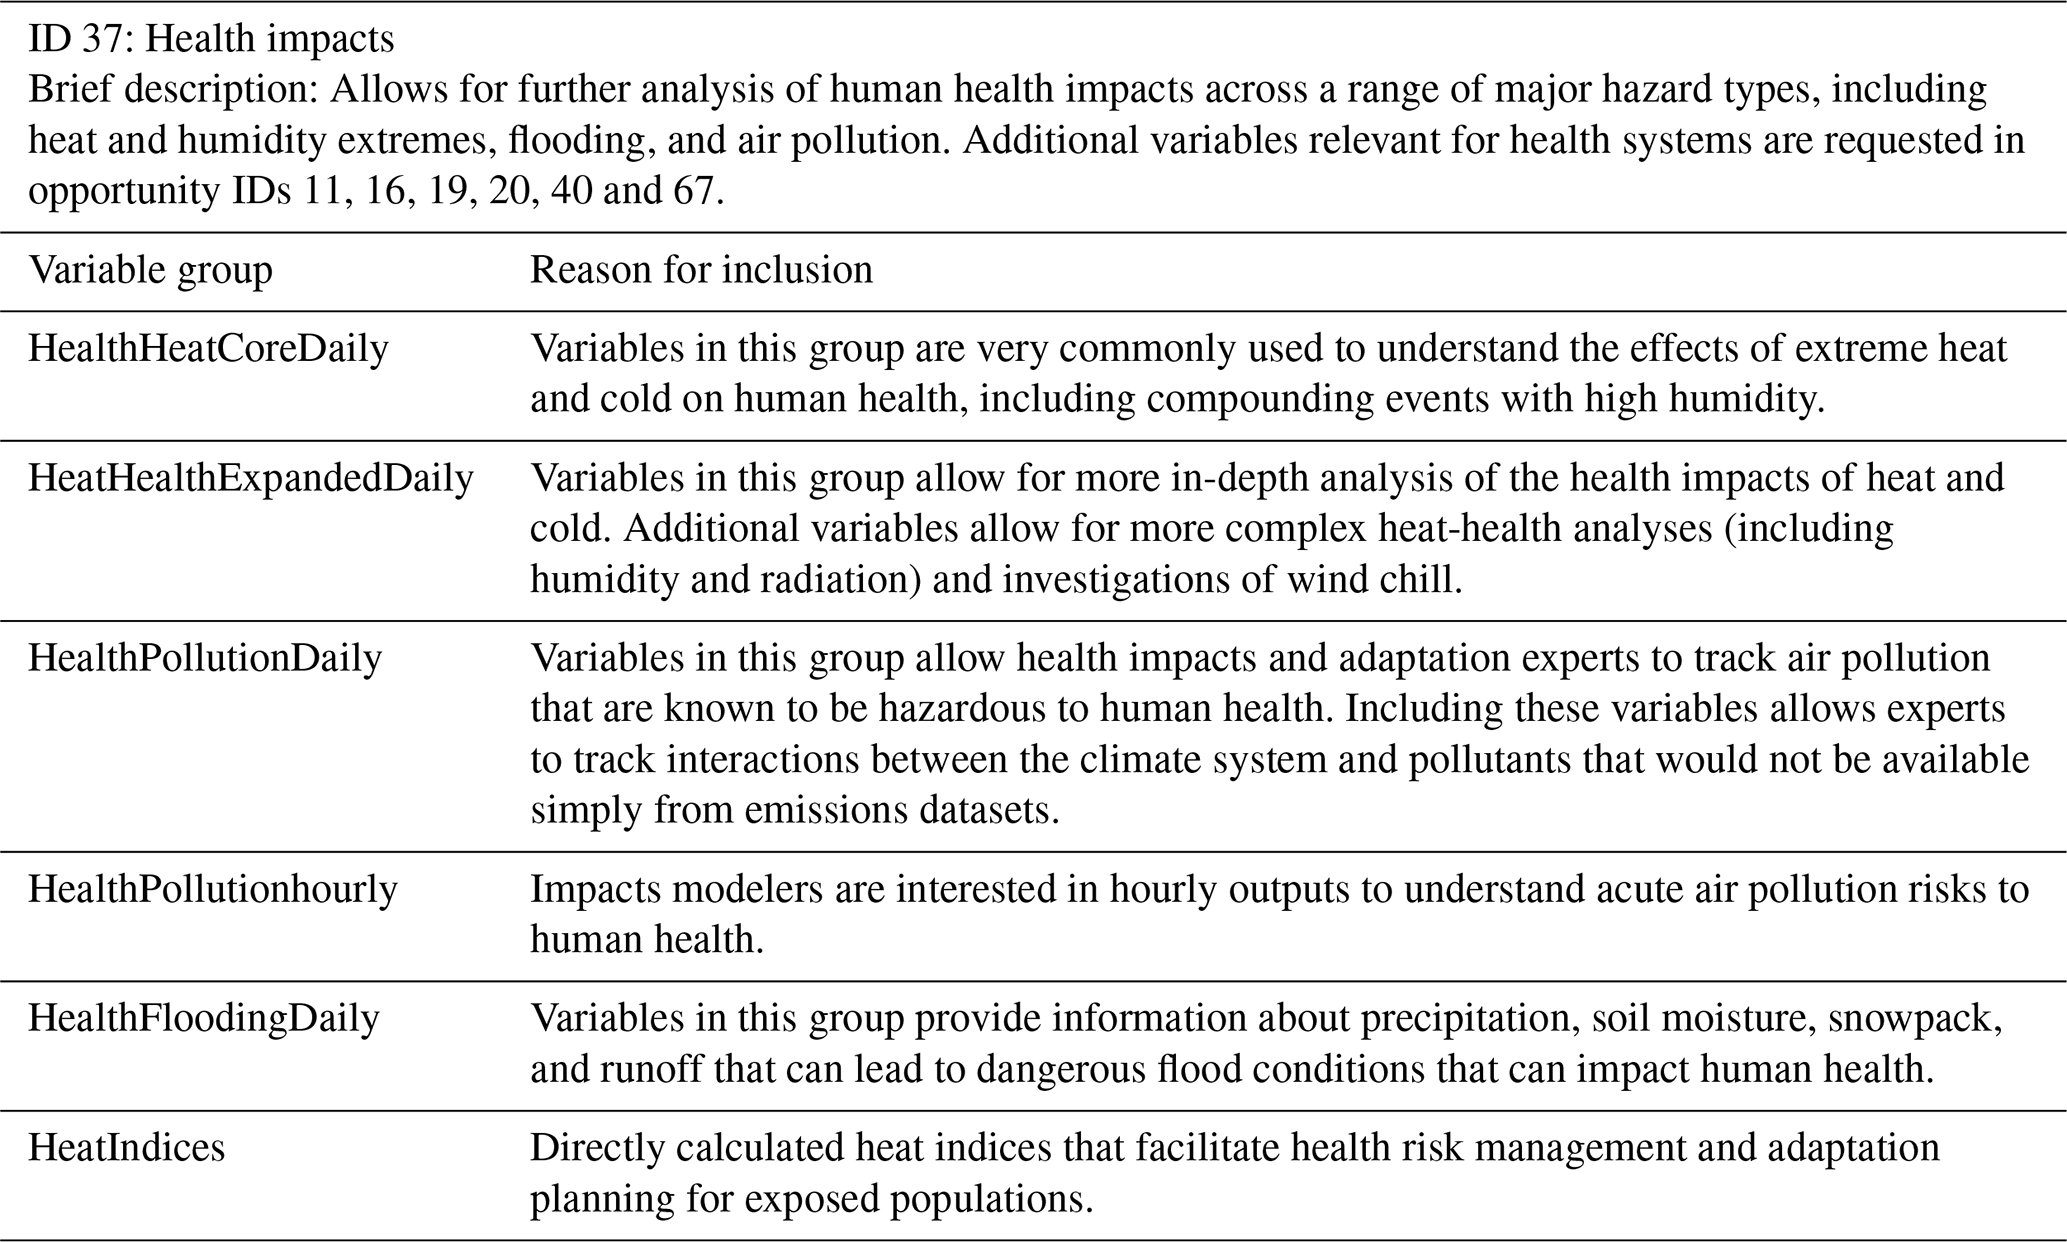
Three variable groups allow for deepening analysis of the effects of extreme heat and cold risks for human populations including heat stroke, heat exhaustion, hyperthermia and hypothermia. First, a core dataset of daily variables (HealthHeatCoreDaily) includes both surface daily maximum temperature and relative humidity information given that many impacts are strongly connected with compound heat and humidity hazards that can challenge the body's ability to self-regulate temperature through perspiration (Staiger et al., 2019). These outputs are also useful for outdoor recreation and tourism applications. Daily resolution is essential, as heat waves are poorly represented by monthly outputs. In addition, minimum temperature data support the evaluation of cold-season hazards such as hypothermia and the calculation of wind chill indices (Kinney et al., 2015). Second, the HeatHealthExpandedDaily variable group is designed to meet the needs of health experts who have developed a large number of heat-health indices to understand risks to different demographic groups and populations exposed through outdoor labor (e.g., agricultural or construction work) (Vanos et al., 2020). This includes further information on the daily range of humidity, short- and longwave radiation and wind speeds that can drive extremes in body heat or dangerous wind chills. Third, the HeatIndices variable group requests that daily and maximum daily wet bulb globe temperature (Knutson and Ploshay, 2016) and NOAA Heat Index (Lin et al., 2012) be calculated within the model so that there is no methodological confusion in downstream impacts and adaptation applications.
Two variable groups in this opportunity focus on health risks associated with air pollution, which depends strongly on the type of air pollution and the duration and intensity of exposure (Orru et al., 2017). HealthPollutionDaily captures information related to mixing ratios for surface particulate matter at 1, 2.5, and 10 µm diameters, surface NO2, and surface ozone on a daily scale. That set also includes temperature and humidity outputs as these govern the environment for chemical processes in the atmosphere that may convert precursors into dangerous air pollution constituents. Corresponding hourly outputs are also requested when possible in the HealthPollutionhourly variable group in order to gauge acute extremes and interactions with the diurnal cycle of temperature, humidity and precipitation. This information cannot be determined only from emissions data and projections.
HealthFloodingDaily requests variables important for developing engineering solutions to reduce risks to humans from inland flood waters. This includes details on maximum hourly precipitation rates, snow water equivalent, soil moisture, and runoff to describe the pre-conditioning and extent of flooding events. Additional variables relevant to indirect health CIDs are available in other I&A opportunities related to food systems (ID 19), water systems (ID 67), ecosystems (IDs 11 and 16), urban populations (ID 40), and broader climate services (ID 20).
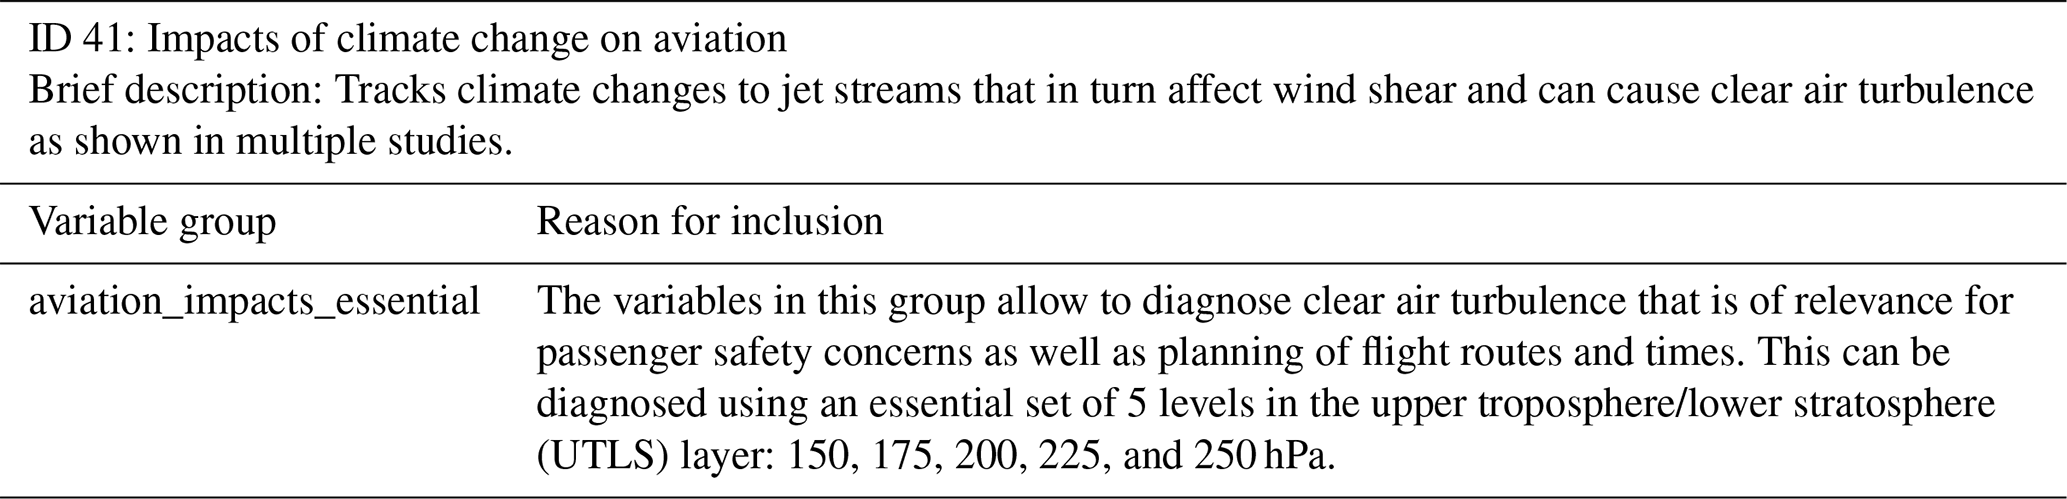
4.1.9 Opportunity ID 41: Impacts of climate change on aviation
This opportunity was designed to support studies focused on the impacts of climate change on air travel and the broader aviation sector. Climate change causes changes on the jet streams that in turn affect wind shear and can cause clear air turbulence (Gratton et al., 2022; Lee et al., 2019; Williams and Joshi, 2013, 2016). The variables in this group allow experts to diagnose clear air turbulence that is of relevance for passenger safety concerns as well as planning of flight routes and times (Table 10). The “essential” variable group unlocks the opportunity of diagnosing clear air turbulence from climate model output from 5 pressure levels (150, 175, 200, 225, and 250 hPa) in the upper troposphere/lower stratosphere (UTLS) region. These are standard model output variables (horizontal wind components and temperature) but requested at specific vertical levels.
Table 10Motivation for variable groups associated with Impacts of climate change on aviation.
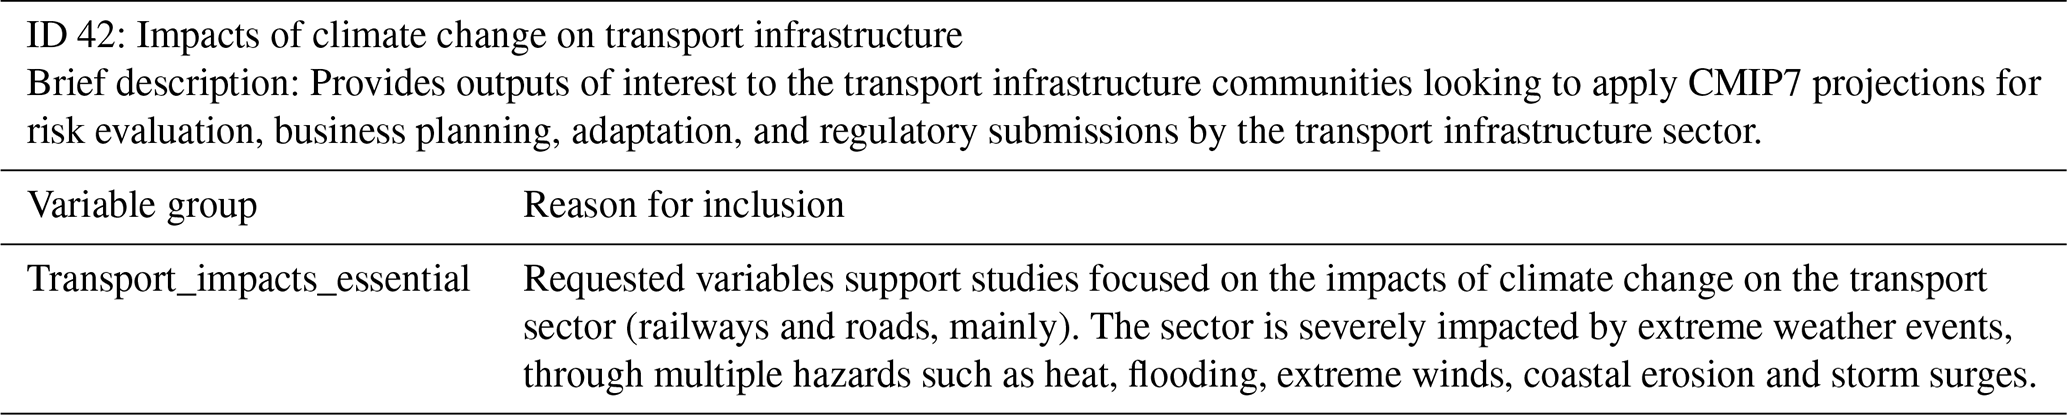
4.1.10 Opportunity ID 42: Impacts of climate change on transport infrastructure
This opportunity provides outputs of interest to the transport infrastructure communities looking to CMIP7 for projections in order to evaluate impacts, risks, and potential adaptations in the transport sector (railways and road, mainly) (Table 11). The sector is severely impacted by extreme weather events, through multiple hazards such as heat, flooding, extreme winds, coastal erosion and storm surges. Future climate projections are used to inform business planning, adaptation and regulatory submissions by the transport infrastructure sector. This is supported by substantial work in the topic focused on different regions of the world (de Abreu et al., 2022; UK Climate Change Committee, 2022; Nemry and Demirel, 2012; Palin et al., 2013, 2021). Climate resilience and efficiency of transport infrastructure also impacts mitigation efforts given transportation's role in current emissions.
Table 11Motivation for variable groups associated with Impacts of climate change on transport infrastructure.
4.1.11 Opportunity ID 11: Terrestrial Biodiversity
This opportunity includes variable groups providing information needed for model-based impact assessments and adaptation planning in the terrestrial biodiversity and ecosystem services sector relevant for initiatives such as the IPCC (Parmesan et al., 2022) and the Intergovernmental Science-Policy Platform on Biodiversity and Ecosystem Services (IPBES). The included variable groups will serve a broad range of biodiversity and ecosystem models aiming to understand past biodiversity and ecosystem changes as well as projecting future trends in biodiversity and ecosystem services. These are applied to evaluate impacts, risks, and potential adaptations that safeguard biodiversity and ecosystem services and ensure planetary health and human well-being.
Table 12Motivation for variable groups associated with Terrestrial Biodiversity.
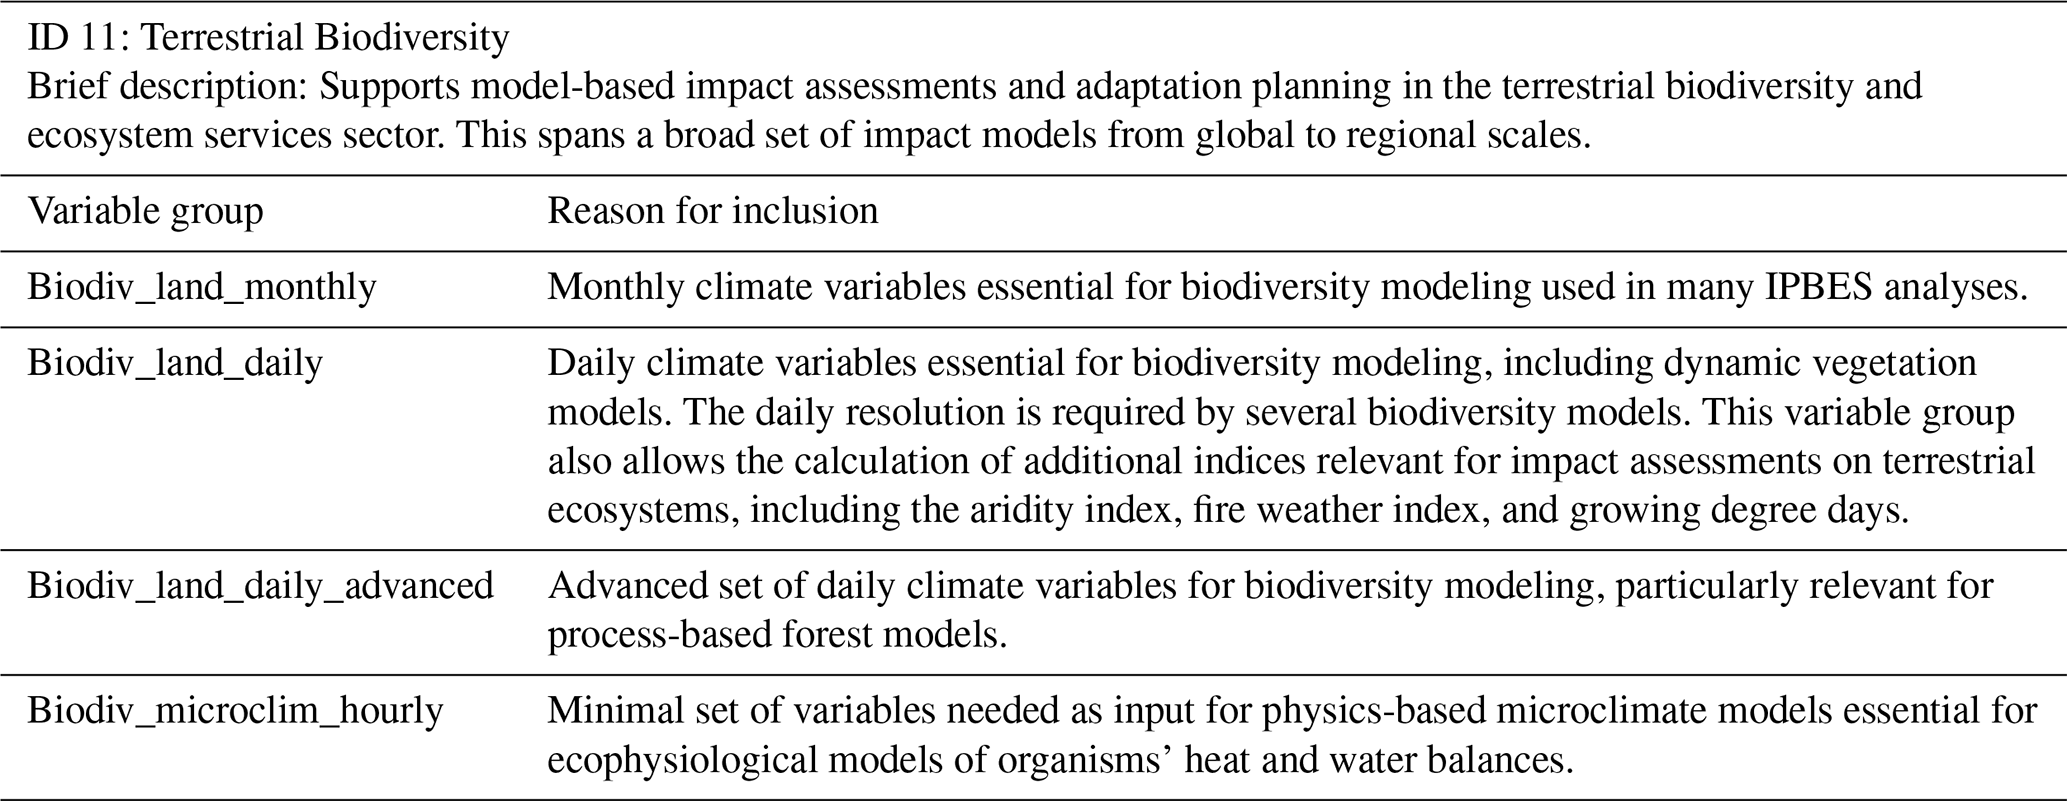
Variable groups in this opportunity provide the minimal set of monthly variables essential for assessing broad-scale impacts of climate change on biodiversity and ecosystem services as well as advanced sets of variables with daily and sub-daily resolution essential for understanding long-term dynamics through process-based biodiversity, forest, and biophysical models (Table 12). Biodiv_land_monthly covers typical inputs needed for coarse-scale biodiversity and ecosystem services models as summarised in the BES-SIM protocols (Kim et al., 2018; Pereira et al., 2024). Additionally, these variables can be used to conduct impact assessments for different ecological groups and realms (Hof et al., 2018; Zurell et al., 2018). Biodiv_land_daily requests variables needed as input for advanced process-explicit and statistical biodiversity models and process-based forest models (Ferrier et al., 2016). These span models that predict spatiotemporal distribution and abundances of species or functional types, to models of avian species migration pathways and disease spread; thus supporting a broad set of use cases for modeling interactions between nature and people. Biodiv_land_daily_advanced provides additional input for process-based forest models (Grünig et al., 2024). Forests provide crucial ecosystem services to people, help mitigate climate change impacts, and are affected by synergistic global changes like climate extremes and disease spread. The variable group supports advanced process-based forest models through provision of variables related to extreme disturbances. Biodiv_microclim_hourly variables serve as input to biophysical models that help to understand and predict climate change impacts on species' behaviour, phenology, survival, distribution, and abundance (Briscoe et al., 2023). The variables in this variable group constitute typical input needed for microclimate and biophysical models. These biophysical models are uniquely suited to solve climate change biology problems that involve predicting and interpreting responses to climate variability and extremes, multiple or shifting constraints, and novel abiotic or biotic environments.
4.1.12 Opportunity ID 40: Vulnerability of urban systems, infrastructure and populations
This opportunity provides global multi-model output variables that are relevant to urban areas and built environments (Table 13). Cities are both hot spots of climate impacts and fundamental foci of adaptation strategies (Dodman et al., 2022), which has motivated a Special Report on climate change and cities in the IPCC Seventh Assessment Report (AR7) cycle. While only covering 2 %–3 % of the Earth's land surface (Chakraborty et al., 2024; Schneider et al., 2009, 2010), cities accommodate over half of the world's population and contribute to a large proportion of carbon emissions (Creutzig et al., 2015; Seto et al., 2014) – a percentage projected to increase to 68 % by 2050 (Birch and Wachter, 2011; Seto et al., 2014). They also respond differently to climate change compared to natural land covers. Due to heat islands, impervious surfaces and lack of arable land, urban environments are even more vulnerable to globally recognized climate risks including heatwaves, extreme precipitation, flooding, water scarcity, and food and energy insecurity (Cao et al., 2016; Georgescu et al., 2021; Li et al., 2024; Zhang et al., 2023; Zhao et al., 2018; Zheng et al., 2021). To address this grand global urban challenge, it is urgent to better understand urbanization and its complex two-way interactions with climate system across spatiotemporal scales. City and infrastructure resilience planning benefits from enhanced understanding of projected changes in physical climate impacts on urban environments, associated biophysical and biogeochemical processes, interconnections with urban microclimates, potential thresholds, and global and regional climate tipping points. Community groups such as the Urban Climate Change Research Network (UCCRN) share best practices in climate output application for impacts and adaptation planning around the world (Rosenzweig et al., 2018; Mahadevia et al., 2025).
Table 13Motivation for variable groups associated with Vulnerability of urban systems, infrastructure and populations.
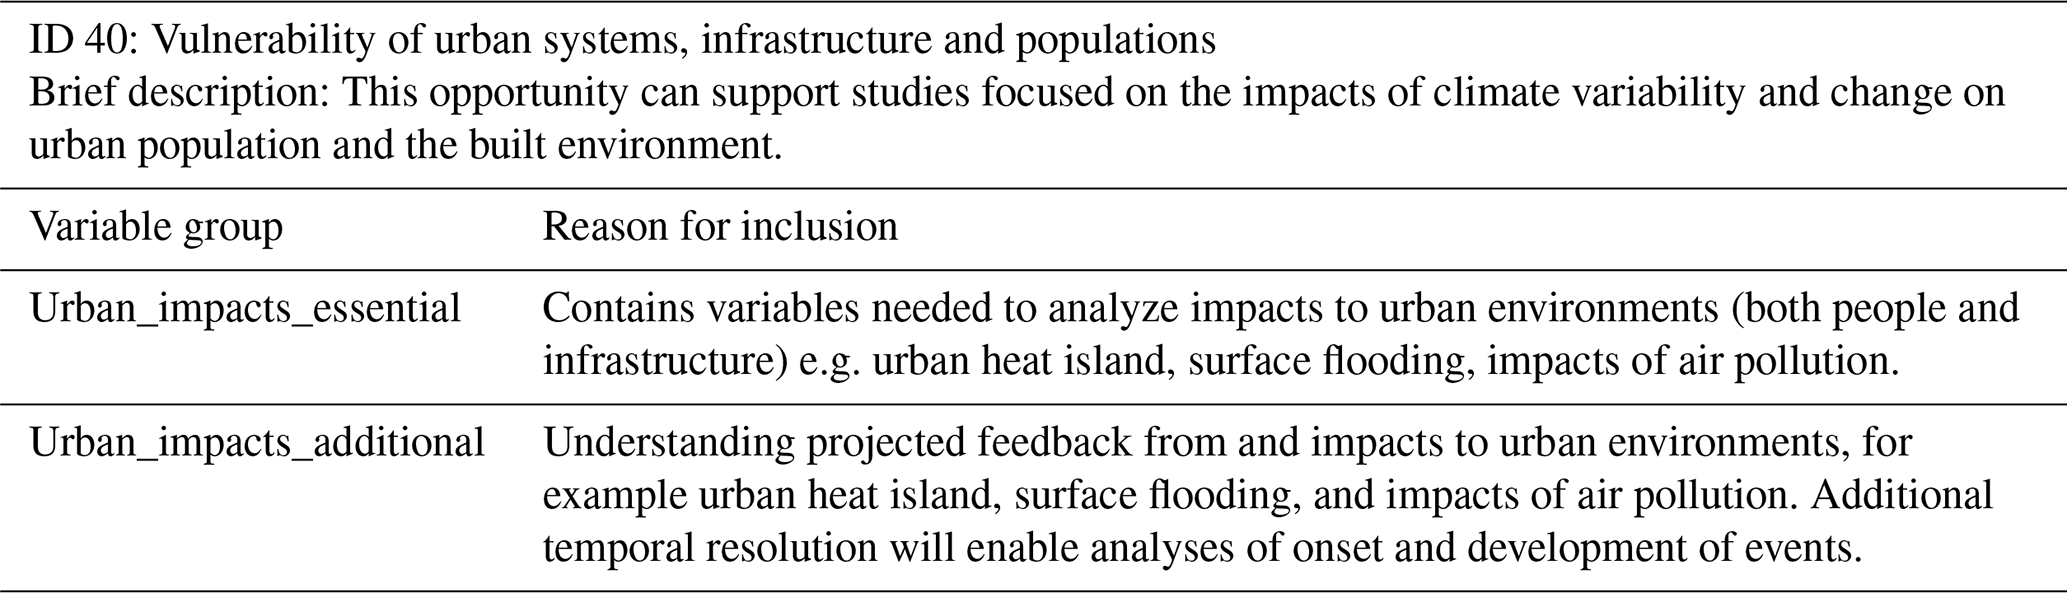
The Urban_impacts_essential variable group is the highest priority for urban applications, indicating the minimal set needed to pursue main research and application tasks, with the Urban_impacts_additional variable group enabling deeper analyses of more climatic impact-drivers. Robust characterization of urban climate risks and effective urban planning under climate change relies on robust climate projections specific to built landscapes (Zheng et al., 2021). This opportunity will provide crucial information to robustly underpin those working in urban climate science and impacts assessment, urban governance, urban planning, and sustainable and resilient urban development amidst the challenges posed by a changing climate. This includes improving understanding of city-specific risks in the form of extremes, slow-onset events, and the compounding and cascading of risks in order to inform those working to reduce vulnerability and exposure across urban systems and sectors, including, but not limited to critical infrastructure, buildings, urban ecosystems and biodiversity, food, energy, water and population health. One manifestation of such impacts is the urban heat island (Zhao et al., 2014), which requires detailed sub-daily variables to be modelled. Finally, some requested variable support studies into the urban boundary layer height, which modulates the impacts of air pollution, clouds and precipitation. Furthermore, attribution of these events to rapid urbanization vs. climate change, as well as the synergies between the two, is key in addressing future risks while navigating sustainable developments. An increasing number of ESMs and finer-scale models now have an urban representation and there is interest in tracking how each focuses on processes (ranging from atmospheric turbulence and wind to energy and water balance) and complexity (ranging from multi-layer parameterizations in the urban canyon to AI/ML), to robustly characterize uncertainty in global cities.
4.1.13 Opportunity ID 67: Water Security and Freshwater Ecosystem Services
This opportunity identifies variable groups that allow hydrology and ecosystem analysis for water resources, hydropower and freshwater habitats (Table 14). Climate change increases the risk of floods and droughts and changes groundwater and river flow regimes with implications for water security, ecosystem services, natural hazards and human health (Caretta et al., 2022). Freshwater ecosystems have experienced severe habitat degradation and losses in biodiversity and urgent actions would be required to halt biodiversity loss and restore ecosystem health following climate-driven changes (Parmesan et al., 2022).
Table 14Motivation for variable groups associated with Water security and freshwater ecosystem services.
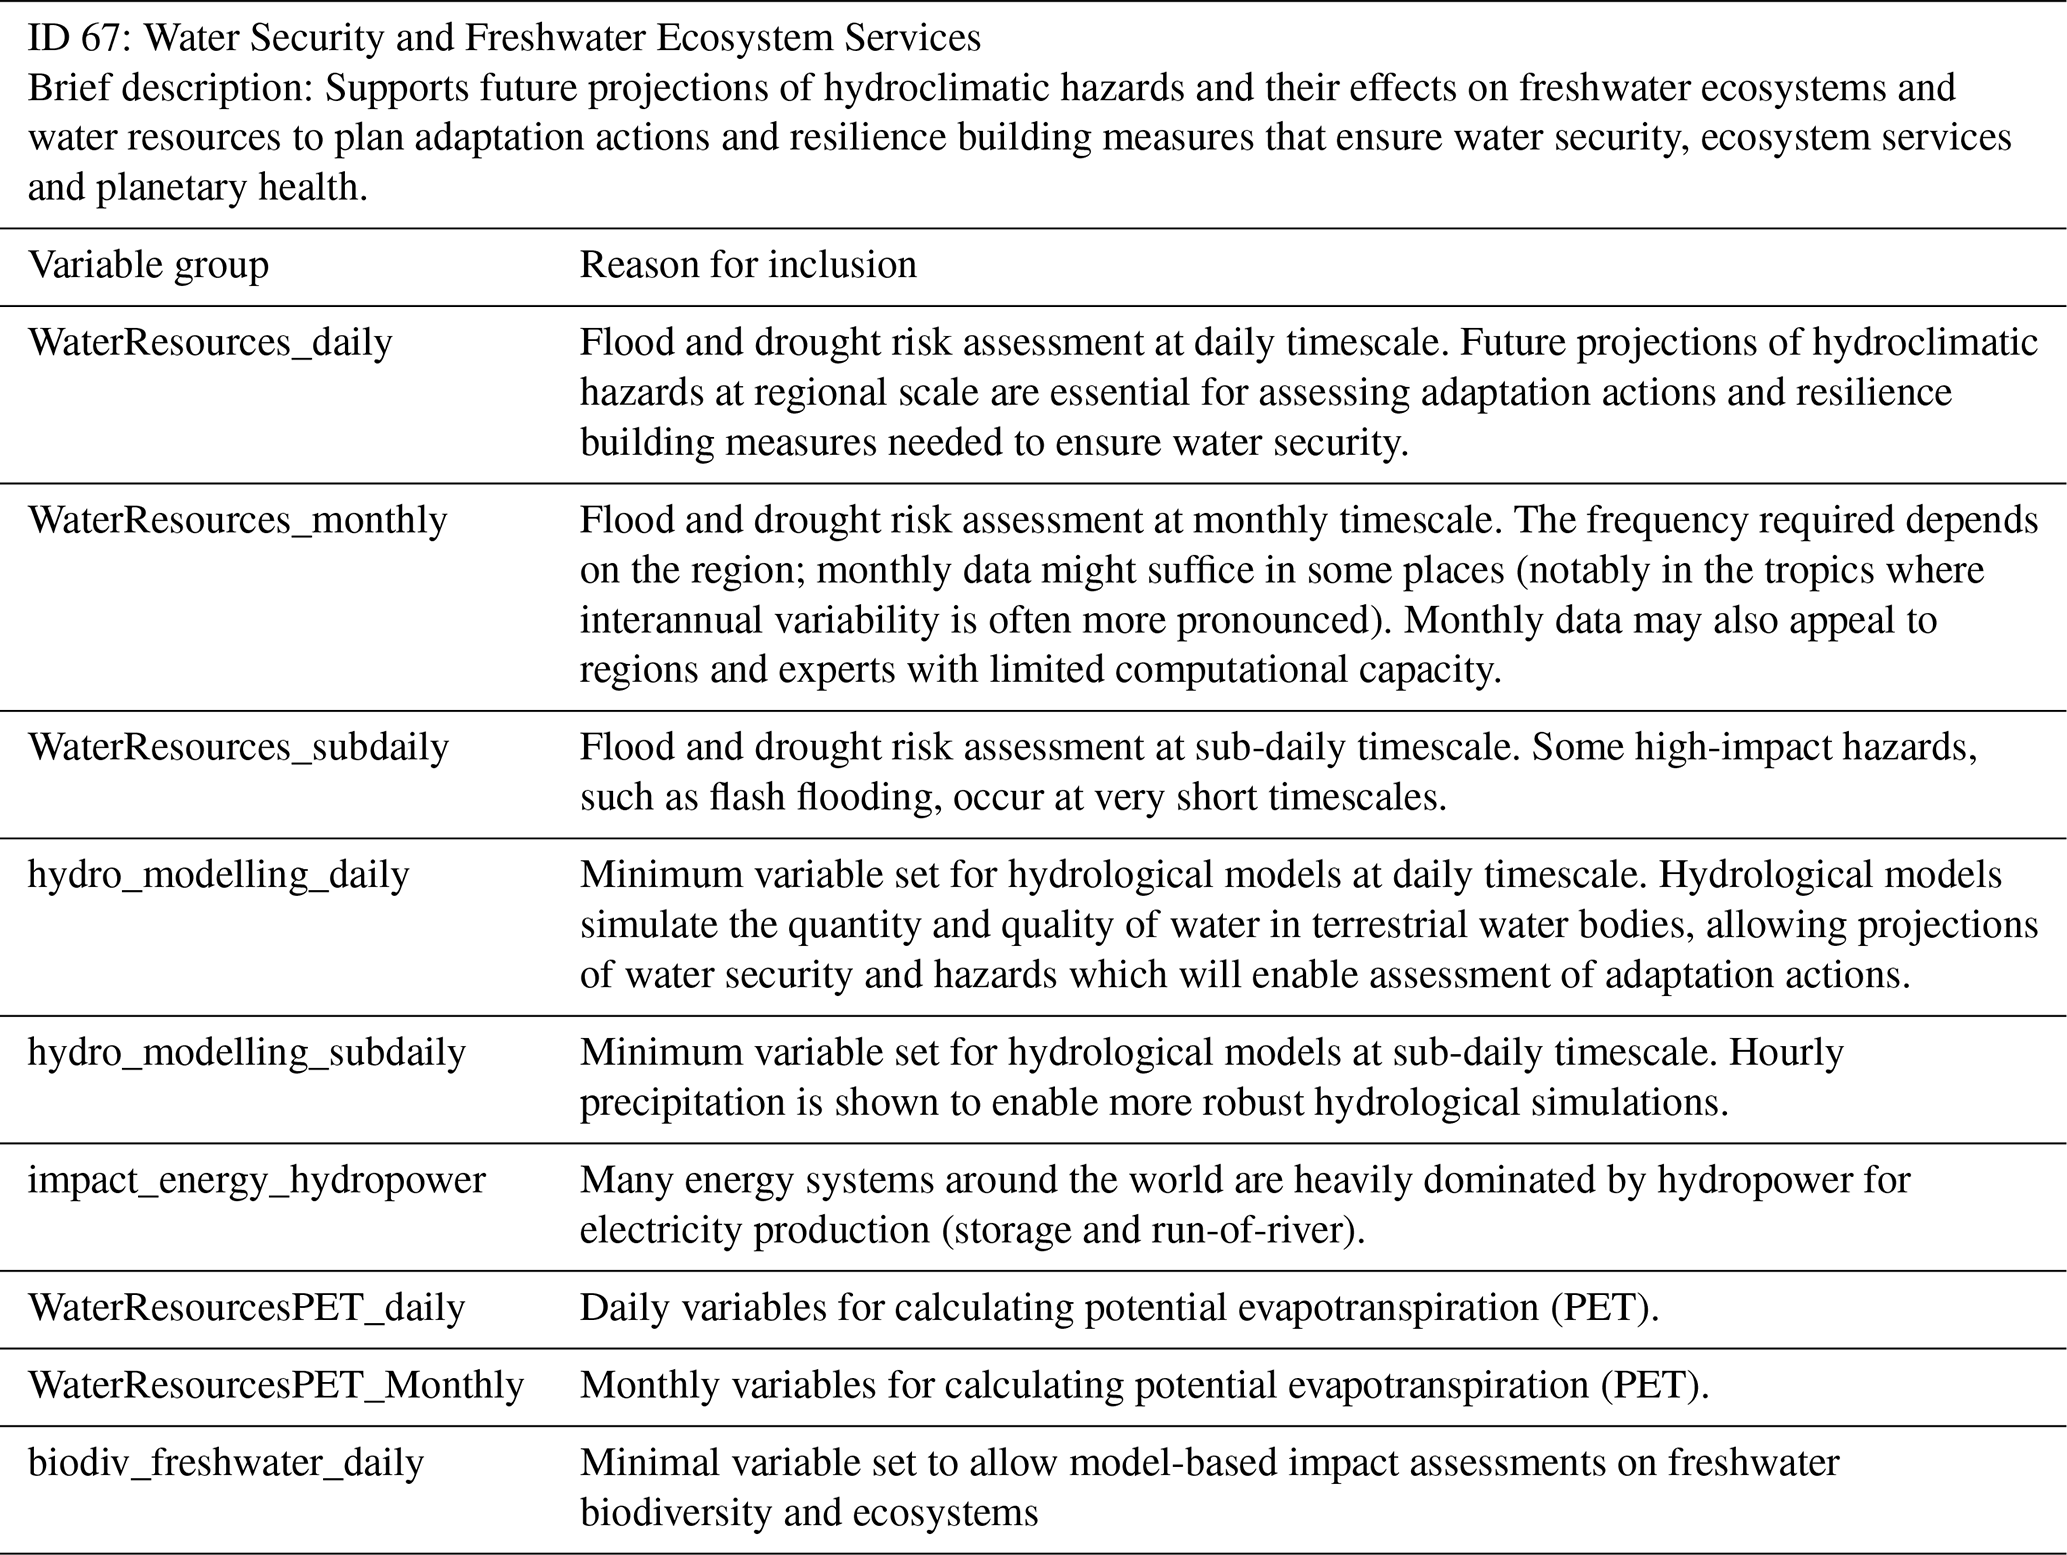
Future projections of hydroclimatic hazards and their effects on the ecosystems and water resources are essential for assessing what adaptation actions and resilience building measures are needed to ensure water security, ecosystem services and planetary health. Enhanced modeling, utilizing high resolution climatic data, will aid IPBES in understanding changes in freshwater biodiversity and ecosystem services and refining scenario development (Ferrier et al., 2016). Large ensemble simulations are also beneficial in capturing the plausible range of precipitation variability which is crucial for risk assessment and ensures well-informed adaptation actions (Mankin et al., 2020).
4.1.14 Other proposed opportunities with Impacts and Adaptation Relevance
An additional 16 opportunities proposed by other CMIP7 Data Request thematic teams have relevance for impacts and adaptation. In many cases these focus on dynamical structures, surface conditions, or extreme events that are often of great interest in VIACS applications. Cross-thematic evaluation of opportunities identified variable groups that could be combined or merged into opportunities focused on impacts and adaptation. The overall approach continued to recognize that some redundancy in variables across opportunities was acceptable as different variable groups request specific combinations of variables required for proposed analyses. Table 15 summarizes these I&A-adjacent opportunities, with the impacts and adaptation motivation for two opportunities provided to demonstrate their added relevance.
Table 15Overview of all opportunities associated with the Impacts and Adaptation data request (further details on variable groups provided in example opportunity motivations below).
Opportunity ID 55: Rapid Evaluation Framework
The CMIP Rapid Evaluation Framework (REF) is cross-listed with the Earth System data request (McPartland et al., 2025). REF was created to evaluate and benchmark the newly available CMIP7 AFT simulations as soon as they are uploaded to the Earth System Grid Federation (ESGF) with metrics and diagnostics that are available through different open-source evaluation and benchmarking tools (Hoffman et al., 2025). This opportunity contains the set of variables that are needed for the planned diagnostics and metrics for the REF (Table 16; CMIP Model Benchmarking Task Team, 2024). The suggested REF metrics/diagnostics to be available for all CMIP7 AFT experiments are in the first instance very basic evaluations and are not expected to require very specific variables. The exact selection of variables was also made consistent with the model evaluation diagnostics in Working Group I Chap. 3 of the latest IPCC report (Eyring et al., 2021). Due to the fixed timeline for the CMIP7 AFT simulations there is only a short time period for technical implementation of the REF, and therefore the available metrics and diagnostics in this first version of the REF will be limited to a temporal resolution of monthly mean data and about five metrics/diagnostics per realm based on a community selection. REF variables and metrics will also support initial evaluation of formats and fundamental climatologies relevant for VIACS investigations, with broad findings helping to identify models, time periods, and conditions that merit more extensive investigations when more complete outputs become available. The realms were chosen specifically to be consistent with the realms used for the data request. Find more information about the REF opportunity in Dingley et al. (2025).
Table 16Motivation for variable groups associated with the Rapid Evaluation Framework.
Opportunity ID 49: Ocean extremes
While the CMIP7 Ocean and Sea Ice paper Fox-Kemper et al. (2025) provides a detailed examination of ocean extremes and their underlying processes, it is important to also recognize them here due to their significant role in impacts and adaptation studies which are critical for improved understanding of future climate vulnerability and informing robust adaptation strategies. As the frequency and intensity of extreme ocean conditions - such as marine heatwaves, low-oxygen zones, extreme sea levels, and storm surges - continue to rise globally, they pose significant threats to marine and coastal ecosystems, coastal infrastructure and communities, human health, industries and global economies (Bernier et al., 2024; Fox-Kemper et al., 2021; Gruber et al., 2021; Holbrook et al., 2022). For example, ocean extremes can disrupt fisheries, degrade critical habitats like coral reefs, kelp forests, and seagrass beds, and intensify coastal flooding and erosion. Studying ocean extremes enables researchers, managers and policy makers to identify vulnerable regions, assess risks to infrastructure and ecosystems, and inform policy decisions aimed at building resilience in a rapidly changing climate. The Ocean Extremes opportunity was developed to request the critical climate model variables at the necessary spatial and temporal resolution that underpins impacts and adaptation modeling and assessments (Table 17). This, in turn, supports informed decision making, empowers stakeholders to develop proactive adaptation strategies, build resilience in vulnerable regions facing climate change and better understand their sensitivity to anthropogenic forcing through a wide range of climate scenarios. This information is critical to assess impacts of ocean extremes and accurately determine the extent and nature of required adaptation measures. In the coming decades, ocean extremes and associated floods and erosion are likely to remain a leading cause of natural disasters due to the effects of the increasing frequency and intensity of extremes combined with increased coastal development associated with greater exposure (Bernier et al., 2024).
Table 17Motivation for variable groups associated with Ocean extremes.
4.2 I&A Variables
These I&A opportunities and variable groups included 539 unique varabiles, including 93 new variables defined for CMIP7 (Appendix B). Several variables were not easily added given that they are not yet established in CF-standards, and were thus left for Data Request v2 (see further discussion in Sect. 5.4).
Most requested variables are similar to previous CMIP requests, but many new variables were existing physical parameters now defined at higher temporal resolution. This is motivated by the increasing complexity and precision of many impacts models, as well as by a strong interest in compound extremes that can result from conditions not resolved at the daily or monthly resolution. For example, with the growing share of intermittant renewable electricity generation, a precise analysis of flexibility and storage needs demand that sub-daily consideration of peak loads are balanced with the concomitant available generation. Therefore, electricity balance models work at a sub-daily resolution and generally use at least hourly observations or hourly reanalysis products for the current climate. Additionally, building and facilities design relies on regulations which require the estimation of extreme values, expressed in terms of return levels, and based on the highest values of each variable under consideration (for wind: extreme wind gust or daily maximum 10-min average wind speed). Information on humidity is of utmost importance for determining thermal comfort even in indoor environments with heating, ventilation and air conditions systems, with temperature and air quality also affecting system selection. Since extreme temperature and extreme humidity may not occur at the same time, detailed sub-daily evolutions of both variables are necessary.
5.1 Prioritization Process
Given limited resources (in personnel, funding, computational systems, data storage and time) for ESM groups, the I&A team organized a set of direct consultations with ESM leaders to communicate VIACS community priorities for output data production. Operating under the assumption that resources would remain constrained, the I&A Team placed a strong emphasis on feasibility, striving to balance the need for comprehensive climate information with the practical limitations of data storage, processing capacity, and model complexity.
5.1.1 Core and extended variable groups
Many I&A opportunities include a core/minimum variable group that is of highest priority as determined by variables that (1) ESMs are likely to be capable of producing, and (2) impacts and adaptation communities will use for nearly all applications in this opportunity. An ESM contributing the core/minimum variable group will increase the likelihood of that ESM's outputs informing the broadest applications in that opportunity, while electing to skip these variables may result in that ESM's outputs being left out of prominent applications in that sector. Opportunities with core/minimum variable groups are accompanied by variable groups that serve to enhance or extend related applications. ESM groups are therefore encouraged to consider contributing these deeper variable groups (e.g., more variables, higher temporal resolution outputs) to increase the likelihood of that ESM's outputs being used in more complex applications and impacts modeling studies, some of which may provide critical levels of detail that elevate these studies in planning processes. ESM groups may be motivated to include more niche applications areas that are of particular interest for that ESM development team (e.g., carbon cycles, extreme events, atmospheric chemistry) or that allow for more tailored impacts and adaptation decision support. In many cases there are substantial overlaps and only a small number of additional variables are needed to create deeper understanding to enable concrete applications.
5.1.2 Temporal resolution
Many important extreme events happen on time scales finer than one day (e.g., extreme rainfall, heat extremes, acute air pollution exposure) or have important covariance on a sub-daily scale (e.g., heat and humidity extremes for drought), yet obtaining model outputs on these time scales is a common stumbling block for VIACS communities. This directly challenges the use of models and decision support metrics that require sub-daily data (Jägermeyr et al., 2021; Zabel and Poschlod, 2023) (e.g., crop models, biophysical models, ocean and wave models, river temperature models, models of energy demand in buildings, electricity system balance models.), as well as applications built around short-interval extreme events (e.g., storm water flooding that may be governed by maximum hourly rainfall rate). Without this high-resolution information experts have often employed various types of bias adjustment, turned to downscaling models, or resorted to imposing the climatological diurnal cycle or stochastic extreme events. In some cases – for example, certain electricity system planning applications where coherent sets of multivariate sub-daily time series across an extended geographical domain are essential – the absence of high-frequency output has been a complete barrier to the use of CMIP data outputs in I&A modeling. In requesting sub-daily outputs, the I&A Team is requesting the “best possible” resolution: hourly is better than 3-hourly, but 3-hourly is better than 6-hourly which is better than daily. As will be discussed in Sect. 5.1.4, modeling groups may find efficiency by using time slices on the highest resolution simulations.
Although some ESM groups may feel that their models were not designed for analysis on fine temporal time steps, this output would likely be bias-adjusted with a procedure that needs to know unique aspects of change for sub-daily variances, extremes and covariances that would not be available in daily and monthly outputs. For groups concerned about the data burden of high-resolution ESM outputs, we note that the I&A high resolution variable requests are mostly 2-dimensional variables with smaller sizes within the 3-dimensional ESM. We also emphasize that ESMs should not dismiss opportunities given calculations of overall data sizes, as an opportunity's size may be skewed by its largest variable group while a smaller core/minimal variable group should also be considered.
5.1.3 Experimental relevance
A large number of CMIP7 MIPs are directly relevant to impacts and adaptation (Dunne et al., 2025). While I&A opportunities and variable groups would be appreciated from any ESM in any of the MIPs, priority is placed on a smaller subset of MIP experiments. The Historical simulations and 21st century ScenarioMIP simulations (van Vuuren et al., 2025) simulations are by far the most desired for impacts and adaptation analysis given that they are most directly relevant to the recent past, the present, and planning procedures covering the coming decades. This information was also conveyed to the CMIP7 panel which helped motivate the inclusion of ScenarioMIP in the CMIP7 Fast Track which will support rapid analysis ahead of approaching deadlines for the Intergovernmental Panel on Climate Change Seventh Assessment Report (IPCC AR7) (Fig. 1).
Many groups expressed interest in a 100 year outlook (out to 2125), noting that the last several CMIP experiments have kept 2100 as the distant time horizon even as that horizon gets ever closer. The 2125 time horizon is also important to understand the ramifications of overshooting in the coming century, which may require a combination of standard ScenarioMIP experiments (out to 2100) augmented with the first 25 years of the extensions (out to 2125). Several sectors have clear interest in longer-term scenarios out to 2500 (e.g., for modeling inert systems such as forest ecosystems within the terrestrial biodiversity sector and sectors at risk of impacts from cryospheric changes and sea level rise).
The growing scientific capabilities and public interest in detection and attribution put a spotlight on I&A outputs from the Detection and Attribution MIP (DAMIP) given direct implications for risk management, which also indicates applications within the Pre-industrial (Pi)Control experiment. Finer resolution outputs are also a shared interest of the I&A Theme, HighResMIP (Roberts et al., 2025) and the Decadal Climate Prediction Project (DCPP) (Boer et al., 2016). MIP experiments with relevance to a particular sector or dynamical process may be of particular interest (e.g., the Land Use Model Intercomparison Project (LUMIP) (Lawrence et al., 2016) for some agriculture and ecosystem variable groups) but are not as broadly used for application. There is also general interest in determining the sensitivity of climate impacts to uncertain ESM components, but this is at the discretion of the MIP leaders and we would recommend one or a very small number of MIP experiments producing extensive I&A variable groups beyond the historical and ScenarioMIP experiments (as resources allow).
5.1.4 Time subsets
ESM groups with resource constraints may elect to produce more extensive I&A variable groups for a limited time period, or time subset(s), rather than the entire historical and 21st century periods. This saves resources and provides I&A outputs that would not be possible if there was a requirement to produce all variables for all years, but begs the question as to which time subsets would be most desirable for VIACS communities. Engagement by the I&A Data Request Theme found greatest interests in understanding the climate of the most recent past, with 10 years likely the minimal number of years required to calculate important climate statistics even as 30 years matches WMO guidance for climatological analysis (WMO, 2017), More rare events typically benefit from longer climatological normals, although this is not always practical in a non-stationary climate. IPCC AR6 used 20-year time subsets to represent distinct global warming levels, with that time span also being more relevant within a non-stationary climate given that climate shifts are occurring on similar time horizons (IPCC, 2021). Time subsets for the recent past also benefit from alignment with modern-era satellite observations and retrospective analyses (Gelaro et al., 2017), for example the 1979–2025 period. Projections for the next 10 years are likely to only have a statistically-weak difference from the previous decades, so we recommend using future time subsets centered first on the 2050s (when many climate signals emerge) followed by a late century time subset centered on the 2080s (when scenarios are more distinct) (Ranasinghe et al., 2021). These time subsets also align with decision processes supported by the VIACS communities (Stuart et al., 2024). As in the historical period, future time subsets of 20, 30, or more years are helpful. The team also considered time subsets centered around targeted global warming levels (GWLs); however, this is less practical given that it would require an iterative process to run initial ESM simulations that determine the period corresponding to a given GWL, then re-running the ESM with more extensive I&A outputs in that time subset. Additionally, not all variables and climatic impact-drivers cleanly track GWLs (Tebaldi et al., 2023).
As an illustration of one sector's use of different time subsets, energy planning decisions are usually based on prospective studies targeting the next 5–10 years, although planning efforts are increasingly reaching 20–25 years. Those prospective studies generally rely on recent climate conditions, using 30-year time series of the required variables coming from station observations or reanalyses, representative of the current climatology (1991–2020 currently for example). Continuing climate change means that the recent past is no longer sufficient to anticipate even near future climate evolution, especially for heat wave frequency. Climate projections can provide a large scope of possible combinations of climate response to the human induced radiative forcing and decadal variability; however, decadal predictions may help reduce/specify this ensemble of possibilities for the next 5–10 years.
5.1.5 Ensemble members and gap filling
Robustness of ESM output for impacts and adaptation applications may also be improved by driving multiple initial condition ensemble members for a given experiment. This is particularly intriguing for VIACS applications given that initial condition ensembles provide more simulated years in a given climatological period or GWL within a non-stationary climate system that features a relatively larger range of internal variability than the climate change signal itself (Chan et al., 2022). VIACS applications manage uncertainty across ESM ensemble members, ESM groups, and model versions and physics packages within a given ESM. For the latter category, perturbed physics ensembles can provide important information about parameter uncertainty and model stability; however, these are of less interest for extensive I&A outputs given the likely high data volume. Large ensemble member experiments are particularly useful for infrequent extreme events that are at the forefront of impacts and adaptation concerns. When resources are constrained, artificial intelligence and other statistical approaches may help us fill in gaps when the full set of years, variables, time resolutions, ensemble members and experiments are not practical. It may therefore be helpful to simulate (at least) a subset of model ensemble members in a targeted time subset with more comprehensive variable outputs and sub-daily temporal resolution. These could then serve as a training dataset to emulate other ensemble members, models, time subsets, variables and time resolutions building off a less resource-intensive set of background simulations (e.g., monthly outputs of core variables over more years, models and ensemble members).
5.2 Gaps and opportunities across impacts and adaptation applications
The I&A Data Request process led to the identification of several gaps in earth system processes that support climate applications. While this effort has focused on the ESM component of the applications chain outlined in Fig. 1, in some cases the bottleneck for applications comes further down. The provision of impacts and adaptation ESM variables opens the door to many opportunities for research and improvement all along the chain. Downscaling is strongly influenced by the selection of RCMs, as well as resources required to operate high-resolution nested models spanning the world. Bias adjustment is built on a foundation of high quality and long period Earth observations that are not available for many impacts-relevant variables. Improved ESM resolution and process understanding will reduce the need for downscaling and bias-adjustment to reach current application scales, but will enable reach to even finer decision-relevant scales. Impacts models have their own biases and uncertainties and most can only represent responses to a subset of the climatic impact-drivers (Wang et al., 2024). Improved impacts models will therefore better translate climatic impact-drivers into projected impacts for natural and human systems, as well as allow evaluation of adaptation interventions.
Additional requested variables proved too challenging for the first version of the I&A Data Request given required shifts in model infrastructure and requirements around constructed indices, but these remain of great interest in the community and motivate future ESM capability improvements. To reduce the burden of high-resolution outputs, there remains a potential to save less frequent outputs that capture high-frequency statistics and characteristics. As noted also in the previous CMIP VIACS request, the impacts and adaptation community would benefit from ESM groups saving monthly outputs of event count or statistical distribution parameters related to daily or sub-daily events (Ruane et al., 2016), for example monthly counts of the number of rainy days, hourly precipitation rates exceeding a threshold, or the number of frost events. For CMIP7 there was an additional request for data that would provide information about the daily timing of extreme events, for example noting the time of day when maximum temperature was simulated. Additional variables like heat indices requested by the Health Impacts opportunity could be assembled by the applications expert if all ingredients to the index's numerical recipe are provided, but these indices were requested to reduce the burden on output users and also to minimize the likelihood that errors or slight methodological differences could affect applications. Calculating these variables within the ESMs also allows more efficient outputs, for example the maximum daily wet bulb globe temperature (WBGT) is a single key impacts relevant variable that spares modeling groups from having to provide its many individual variable components at hourly resolution. The I&A Team thus encourages models to develop new code and structures to make these outputs feasible, and encourages practitioners and data providers to share best practices, tutorials and guidelines as part of broader capacity building for CMIP7 applications. For example, we encourage continuing collaborations around CMIP7 data provision, access, further processing and applications between CMIP and the World Climate Research Programme's Regional Information for Society (RIfS) Joint Task Team on Responsible Data Use, as well as with the World Adaptation Science Program (WASP).
I&A requests for ESM outputs also set the stage for the rapidly evolving community of climate services. Recent efforts have increased the utility of climate information for many applications, including efforts to work directly with professional societies such as the International Actuarial Association working to manage changing insurance baselines in the face of rising seas and increased risk of coastal floods, fire weather, flooding, drought and heat waves (Connors et al., 2022).
5.3 Key reflections from data request process
The Impacts and Adaptation data request is unique within CMIP7 in having a mandate to reach far beyond the ESM groups that are at the center of the CMIP community. The web of applications stemming from CMIP work extends to a huge number of experts, policymakers, stakeholders, and practitioners across all aspects of society. This is truly a testament to the impact and ongoing legacy of the CMIP endeavor, and it is likely under-appreciated even by many who are directly involved. The VIACS communities are distributed and have unique networks and collaboration structures, and they are eager to be engaged.
CMIP7 has demonstrated a growing recognition of the importance of the VIACS communities; not just as model users, but as participants with helpful input into all phases of planning, conduct, sharing, and interpretation of results. Continuity of the VIACS Advisory Board between CMIP6 and CMIP7, as well as VIACS participation in CMIP panel meetings and workshops, helped ensure a continuation of institutional experience and networks that allowed the I&A Data Request Team to hit the ground running in recruitment, goal-setting, outreach, and translation of inputs into specific and practical data requests. The I&A Team also benefited from an open nomination and selection process that emphasized broad perspectives and strong networks to application communities, drawing from the VIACS Advisory Board but extending far beyond.
CMIP7 enables a process for community input and ESM group uptake that would not be feasible through independent outreach. I&A Team and CMIP7 IPO efforts to make the input solicitation process clear, accessible and easy through established and informal network outreach and the Mural Board proved invaluable given that CMIP was requesting voluntary contributions from busy community experts. The I&A data request author team, participating in a voluntary basis, also appreciated efforts by the CMIP7 Data Request Task Team participants to track details and translate technical information between subsequent versions of the AirTable.
CMIP7 also supports climate services and decision making beyond the information generation. Outreach must be cognizant of stakeholder fatigue, as each new round of projections and the subsequent updates to scientific literature do not necessarily match the investment or policy development cycles in private and public decision making. The Rapid Evaluation Framework and Diagnostic, Evaluation, and Characterization of Klima (DECK) Experiment Group analyses are critical to helping stakeholders build familiarity with the new sets of outputs, helping to motivate capacity investments and new analyses required to switch from planning based around CMIP5 or CMIP6 to planning based upon the state-of-the-science CMIP7 (Dunne et al., 2025). Improvements in accuracy and changes to the baseline context (e.g., land use changes and emissions of greenhouse gases and aerosols) would be particularly compelling in justifying stakeholders' shift to planning with the latest CMIP7 outputs and scenarios. CMIP7 and climate service organizations can increase uptake by making outputs more accessible. Examples may include the provision of outputs in decision-ready format that is directly ingestible by catastrophe models and optimization analysis, or pre-computed ensemble statistics that would allow users, such as practitioners in the financial sector, to consistently apply climate related impacts in a transparent and reproducible manner. CMIP7 efforts to standardize data taxonomy, spatial and temporal resolution, and metadata are therefore critical to early adoption.
The I&A Data request process aimed to establish consensus on output needs and priorities across a broad spectrum of ESM output users in the VIACS communities and the ESM groups, resulting in 13 I&A data request opportunities, 60 variable groups (Sect. 4) and 539 unique variables (Appendix B). The various opportunities and variable groups discussed here can inform decisions impacting systems across society and the natural world even as these systems are increasingly intertwined. This process required collaboration between climate scientists and impacts sector practitioners, with experts who can converse in both spheres providing especially helpful insights.
Throughout this data request the I&A Thematic team has endeavored to emphasize how different levels of resource commitments can maximize the impact of CMIP7 for some of society's most pressing challenges. This includes minimal or core variable groups that are likely to enable broad use (Sect. 4), the identification of smaller subsets of variables around targeted applications (Sect. 4), and time subset prioritization for focused analysis (Sect. 5). The I&A data request also invites ESM groups with more resources to drive larger scientific advances by meeting the rising demand for more variables, new variables, and high-resolution variables that can allow applications to match the complexity of the systems they aim to protect and help thrive. The overall process is enlightening for CMIP leadership, modeling groups producing ESM outputs, and ESM development priorities that will elevate the application and utility of ESM outputs. Even those groups that cannot meet this full CMIP7 request may consider ways to be better positioned to meet I&A requests for CMIP8.
Pressing deadlines from policymakers and an increasing appetite for systems-level knowledge emphasize the need for clear organization and communication of CMIP7 governance, data processing and dissemination of ESM outputs. This is especially true for impacts and adaptation applications that require additional information processing in the form of downscaling, bias-adjustment, impacts modeling, analyses, and decision making around implementation. Waiting to get perfect ESM outputs may leave these later phases of application without enough time to properly inform policymakers and stakeholders through initiatives such as the IPCC. The Rapid Evaluation Framework may help facilitate this process. It would be beneficial for CMIP7 modeling groups to provide clear communication on variable groups they intend to produce, allowing important preparation to set the stage for CMIP7 across the impact & adaptation sectors. Engagement up and down that pipeline is important to indicate priorities, communicate uncertainties, track error propagation, and give due credit to scientific contributors who may not be at the stakeholder interface.
The I&A Team also received feedback that clear documentation of outputs is needed to facilitate broad use in applications. Lack of clarity or barriers to use would create the need for more intermediary organizations (e.g., consulting groups) that can navigate this space, but that would increase the distance between those who produce the data and those who use it, with the potential to lead to information degradation or misuse (particularly in the Global South). Public-private-academic collaborations hold great potential to provide open climate services for research that would enable a large number of applications and support pressing decisions around the world. The I&A Team thus encourages ESM teams to follow through and stretch to meet the needs of this important community, which carries key climate messages to the world with an emphasis on the specific points of contact whereby climate change affects the things that society cares about.
Table A1Actions taken in the processing of proposed opportunities for the I&A Data Request Theme. The processing of opportunities proposed in the open call of August 2024, including proposals from both within the author team and more widely, was carried out by revising the evaluation made within each thematic author team in the framework of a cross-thematic meeting in mid-September 2024. The meeting participants selected certain opportunities, rejected some, and merged others with shared scientific objectives and domain. In a subsequent step, an interactive discussion was held between members of our author team, opportunity proposal leaders, and the relevant domain communities. The goal was to harmonize the initially proposed opportunities and improve their description and data requirements. The following table summarises the key processing actions and decisions with specific reference to a working copy Airtable database available at the following link https://bit.ly/CMIP-DR-Opportunities (last access: 25 November 2025).
Table B1New variables proposed and variable formula updates by the Impacts and Adaptation Data Request Theme. The variables that are newly introduced in CMIP7 are tabulated below. The Coordinate Specifications column is lists special aspects of the temporal and spatial requirements for each variable. The full grid specifications can be found in v1.2 of the CMIP7 Data Request (Data Request Task Team, 2025a).
∗ Note: Variables with existing physical parameters were requested at higher temporal resolution, including existing monthly variables requested at daily resolution, and existing daily resolution variables requested at sub-daily resolution (as fine as 1-hourly).
The variables and their metadata included latest CMIP7 Assessment Fast Track Data Request can be accessed via the Data Request Task Team. At the time of this publication, the latest major release (v1.2) is accessible at Zenodo under https://doi.org/10.5281/zenodo.15116894 (Data Request Task Team, 2025a), and the latest minor release (v1.2.1) is accessible at Zenodo under https://doi.org/10.5281/zenodo.15288187 (Data Request Task Team, 2025b).
ACR prepared the manuscript with contributions from all co-authors. ACR, MJ, BT and CLP provided conceptualization with inputs from CMIP Team. ACR and BT developed the outreach and input methods with help from the CMIP Team. CLP and MJ developed the methods for data inputs and oversaw opportunity evaluation as part of their roles on the CMIP Data Request team. ACR, CT, DJB, CB, ID, JF, PLMG, BH, VH, UI, DI, ILL, TL, XL, JM, NN, SP, IR, W-LT, AW, LZ, and DZ conducted outreach to I&A communities and then processed and summarized their inputs into original manuscript draft preparation. Data curation contributions were provided by ACR, CLP, DJB, JF, PLMG,VH, and BT and ACR and BT provided contributions to visualization. Review and editing was carried out by ACR, BT, CB, ID, DJB, VH, DI, ILL, IR, TL. XL, JM, NN, AW and DZ. BT provided resources and project administration support.
Alex C. Ruane is Co-chair of the VIACS Advisory Board and an employee of NASA. Briony Turner is an employee of HE Space Ltd which delivers the CMIP IPO service to the European Space Agency and is Vice Chair of the Chartered Institution of Building Services Engineers Knowledge Generation Panel. Claas Teichmann is Co-chair of the VIACS Advisory Board. Carlo Buontempo is the director of the Copernicus Climate Change service at ECMWF. Paula L.M. Gonzalez is employed by the Met Office, UK. Vanessa Hernaman is employed by CSIRO. Sylvie Parey is employed by EDF Lab, lab of an electricity company. Andrew Wiebe is employed by Riskthinking.AI. Our authors making these declarations do so in accordance with the Competing Interests Policy but do not believe their positions have influenced their ability to provide complete and objective presentation of this research.
Briony Turner is a staff member of the CMIP IPO which is hosted by the European Space Agency, with staff provided on contract by HE Space Operations Ltd. Views and opinions expressed are however those of the authors only and do not necessarily reflect those of their employers or funders. Neither the European Union nor the granting authority can be held responsible for them.
Publisher's note: Copernicus Publications remains neutral with regard to jurisdictional claims made in the text, published maps, institutional affiliations, or any other geographical representation in this paper. While Copernicus Publications makes every effort to include appropriate place names, the final responsibility lies with the authors. Views expressed in the text are those of the authors and do not necessarily reflect the views of the publisher.
The Impacts and Adaptation Theme Author Team acknowledges the valuable contributions from a widespread scientific community who participated in the data request effort and public consulting processes including members of the ESM groups who participated in drop-in and feedback webinars. Members of the CMIP7 Vulnerability, Impacts, Adaptation and Climate Services (VIACS) Advisory Board helped develop initial ideas for the data request and aided in efforts to request community inputs. We thank Eleanor O'Rourke and Gang Tang for their helpful comments on the draft. We thank Natalie Kozlowski at Columbia University for design contributions to Fig. 1 and Elisabeth Dingley for her conceptualization and design of Fig. 2. PLMG acknowledges the contributions of Dr. Erika Palin for supporting the interactions with the transport sector, and Dr. Paul Williams for his support of the aviation applications opportunity. The author team acknowledges all authors of the opportunities that underpin this paper, and appreciates the suggestions from two anonymous reviewers. The manuscript also benefited from a helpful health applications community comment from Kris Ebi and a comment with additional insights on energy applications from Rémi Gandoin, Andrea Hahmann and Jan Wohland.
ACR contributions were supported by a NASA Community Service Grant and Earth Science Division support of the NASA GISS Climate Impacts Group. The work of CLP was supported by the National Centre for Atmospheric Science (NCAS, UK). UI acknowledges European Union's Horizon Europe Programme under CleanCloud (No. 101137639). JM was supported by the Reducing Uncertainties in Biogeochemical Interactions through Synthesis and Computing Scientific Focus Area (RUBISCO SFA) project funded through the Earth and Environmental Systems Sciences Division of the Biological and Environmental Research Office in the US Department of Energy (DOE) Office of Science. Oak Ridge National Laboratory (ORNL) is supported by the Office of Science of the DOE under Contract No. DE-AC05-00OR22725. DZ contributions were supported by the German Science Foundation DFG (Grant no. ZU 361/6-1). The work of DI was supported by the Foundation Euro-Mediterranean Center on Climate Change (CMCC, Italy). BH received funding from the European Union's Horizon 2020 Research and Innovation program under grant agreement no. 101003536 (ESM2025 – Earth System Models for the Future). The work of CB was supported by the Copernicus Climate Change Service, a programme of the European Commission implemented by ECMWF. The work of MJ was supported by UK Research and Innovation (grant no. NE/Y001729/1). The work of XL was supported by U.S. NSF #2420405. The work of LZ was supported by US NSF CAREER Award no. 2145362; US NASA no. 80NSSC25K7322.
This paper was edited by Lele Shu and reviewed by two anonymous referees.
Baño-Medina, J., Iturbide, M., Fernández, J., and Gutiérrez, J. M.: Transferability and Explainability of Deep Learning Emulators for Regional Climate Model Projections: Perspectives for Future Applications, Artificial Intelligence for the Earth Systems, 3, https://doi.org/10.1175/AIES-D-23-0099.1, 2024.
Bernier, N. B., Hemer, M., Mori, N., Appendini, C. M., Breivik, O., de Camargo, R., Casas-Prat, M., Duong, T.M., Haigh, I. D., Howard, T., Hernaman, V., Huizy, O., Irish, J. L., Kirezci, E., Kohno, N., Lee, J.-W., McInnes, K. L., Meyer, E. M. I., Marcos, M., Marsooli, R., Martin Oliva, A., Menendez, M., Moghimi, S., Muis, S., Polton, J. A., Pringle, W. J., Ranasinghe, R., Saillour, T., Smith, G., Getachew Tadesse, M., Swail, V., Tomoya, S., Voukouvalas, E., Wahl, T., Wang, P., Weisse, R., Westerink, J. J., Young, I., and Zhang, Y. J.: Storm surges and extreme sea levels: Review, establishment of model intercomparison and coordination of surge climate projection efforts (SurgeMIP), Weather and Climate Extremes, 45, 100689, https://doi.org/10.1016/j.wace.2024.100689, 2024.
Bezner Kerr, R., Hasegawa, T., Lasco, R. D., Bhatt, I. D., Deryng, D., Farrell, A., Gurney-Smith, H., Ju, H., Lluch-Cota, S. E., Nelson, G., Neufeldt, H., and Thornton, P. K.: Food, Fibre, and other Ecosystem Products, in: Climate Change 2022: Impacts, Adaptation and Vulnerability, Contribution of Working Group II to the Intergovernmental Panel on Climate Change Sixth Assessment Report, edited by: Pörtner, H.-O., Roberts, D. C., Tignor, M., Poloczanska, E. S., Mintenbeck, K., Alegría, A., Craig, M., Langsdorf, S., Löschke, S., Möller, V., Okem, A., and Rama, B., Cambridge University Press, 713–906, https://doi.org/10.1017/9781009325844.007, 2022.
Birch, E. L., and Wachter, S. M.: Global Urbanization, University of Pennsylvania Press, Philadelphia, USA, 384 pp., ISBN 978-0-8122-4284-3, 2011.
Bloomfield, H. C., Brayshaw, D. J., Shaffrey, L. C., Coker, P. J., and Thornton, H. E.: Quantifying the increasing sensitivity of power systems to climate variability, Environmental Research Letters, 11, 124025, https://doi.org/10.1088/1748-9326/11/12/124025, 2016.
Bloomfield, H. C., Gonzalez, P. L. M., Lundquist, J. K., Stoop, L. P., Browell, J., Dargaville, R., M. De Felice, Gruber, K., Hilbers, A., Kies, A., Panteli, M., Thornton, H. E., Wohland, J., Zeyringer, M., and Brayshaw, D. J.: The importance of weather and climate to energy systems: a workshop on next generation challenges in energy–climate modeling, Bulletin of the American Meteorological Society, 102, E159–E167, https://doi.org/10.1175/BAMS-D-20-0256.1, 2021.
Boer, G. J., Smith, D. M., Cassou, C., Doblas-Reyes, F., Danabasoglu, G., Kirtman, B., Kushnir, Y., Kimoto, M., Meehl, G. A., Msadek, R., Mueller, W. A., Taylor, K. E., Zwiers, F., Rixen, M., Ruprich-Robert, Y., and Eade, R.: The Decadal Climate Prediction Project (DCPP) contribution to CMIP6, Geosci. Model Dev., 9, 3751–3777, https://doi.org/10.5194/gmd-9-3751-2016, 2016.
Briscoe, N. J., Morris, S. D., Mathewson, P. D., Buckley, L. B., Jusup, M., Levy, O., Maclean, I. M. D., Pincebourde, S., Riddell, E. A., Roberts, J. A., Schouten, R., Sears, M. W., and Kearney, M. R.: Mechanistic forecasts of species responses to climate change: The promise of biophysical ecology, Global Change Biology, 29, 1451–1470, https://doi.org/10.1111/gcb.16557, 2023.
Cao, C., Lee, X., Liu, S., Schultz, N., Xiao, W., Zhang, M., and Zhao, L.: Urban heat islands in China enhanced by haze pollution, Nat. Commun., 7, 12509, https://doi.org/10.1038/ncomms12509, 2016.
Caretta, M. A., Mukherji, A., Arfanuzzaman, M., Betts, R. A., Gelfan, A., Hirabayashi, Y., Lissner, T. K., Liu, J., Lopez Gunn, E., Morgan, R., Mwanga, S., and Supratid, S.: Water, in: Climate Change 2022: Impacts, Adaptation and Vulnerability, Contribution of Working Group II to the Sixth Assessment Report of the Intergovernmental Panel on Climate Change, edited by: Pörtner, H.-O., Roberts, D. C., Tignor, M., Poloczanska, E. S., Mintenbeck, K., Alegría, A., Craig, M., Langsdorf, S., Löschke, S., Möller, V., Okem, A., and Rama, B., Cambridge University Press, Cambridge, UK and New York, NY, USA, 551–712, https://doi.org/10.1017/9781009325844.006, 2022.
Chakraborty, T., Venter, Z. S., Demuzere, M., Zhan, W., Gao, J., Zhao, L., and Qian, Y.: Large disagreements in estimates of urban land across scales and their implications, Nat. Commun., 15, 9165, https://doi.org/10.6084/m9.figshare.25225535, 2024.
Chan, W. C. H., Shepherd, T. G., Facer-Childs, K., Darch, G., and Arnell, N. W.: Storylines of UK drought based on the 2010–2012 event, Hydrol. Earth Syst. Sci., 26, 1755–1777, https://doi.org/10.5194/hess-26-1755-2022, 2022.
CMIP Model Benchmarking Task Team: CMIP AR7 Fast Track Diagnostics list for the Rapid Evaluation Framework, Zenodo [data set], https://doi.org/10.5281/zenodo.14284375, 2024.
Connors, S., Dionne, M., Hanák, G., Musulin, R., Aellen, N., Amjad, M., Bowen, S., Carrascal, D.R., Coppola, E., Dal Moro, E., Dosio, A., Faria, S. H., Gan, T. Y., Gomis, M., Gutiérrez, J. M., Hope, P., Kopp, R., Krakovska, S., Leitzell, K., Maraun, D., Masson-Delmotte, V., Matthews, R., Maycock, T., Paddam, S., Plattner, G. K., Pui, A., Rahimi, M., Ranasinghe, R., Rogelj, J., Ruane, A. C., Szopa, S., Turner, A., Vautard, R., Velichkova, Y., Weigel, A., and Zhang, X.: Climate Science: A Summary for Actuaries: What the IPCC Climate Change Report 2021 Means for the Actuarial Profession, International Actuarial Association, https://actuaries.org/paper/climate-science-a-summary-for-actuaries/ (last access: 25 November 2025), 2022.
Cooley, S., Schoeman, D., Bopp, L., Boyd, P., Donner, S., Ghebrehiwet, D. Y., Ito, S. I., Kiessling, W., Martinetto, P., Ojea, E., Racault, M. F., Rost, B., and Skern-Mauritzen, M.: Oceans and Coastal Ecosystems and Their Services, in: Climate Change 2022: Impacts, Adaptation and Vulnerability, Contribution of Working Group II to the Sixth Assessment Report of the Intergovernmental Panel on Climate Changeedited by: Pörtner, H.-O., Roberts, D. C., Tignor, M., Poloczanska, E. S., Mintenbeck, K., Alegría, A., Craig, M., Langsdorf, S., Löschke, S., Möller, V., Okem, A., and Rama, B., Cambridge University Press, Cambridge, UK and New York, NY, USA, 379–550, https://doi.org/10.1017/9781009325844.005, 2022.
Craig, M. T., Wohland, J., Stoop, L. P., Kies, A., Pickering, B., Bloomfield, H. C., Browell, J., De Felice, M., Dent, C. J., Deroubaix, A., Frischmuth, F., Gonzalez, P. L. M., Grochowicz, A., Gruber, K., Härtel, P., Kittel, M., Kotzur, L., Labuhn, I., Lundquist, J. K., Pflugradt, N., van der Wiel, K., Zeyringer, M., and Brayshaw, D. J.: Overcoming the disconnect between energy system and climate modeling, Joule, 6, 1405–1417, https://doi.org/10.1016/j.joule.2022.05.010, 2022.
Creutzig, F., Baiocchi, G., Bierkandt, R., Pichler, P. P., and Seto, K. C.: Global typology of urban energy use and potentials for an urbanization mitigation wedge, Proc. Natl. Acad. Sci, 112, 6283–6288, https://doi.org/10.1073/pnas.1315545112, 2015.
Data Request Task Team: CMIP-Data-Request/CMIP7_DReq_Content: Data request content for v1.2 (v1.2), Zenodo [data set], https://doi.org/10.5281/zenodo.15116894, 2025a.
Data Request Task Team: CMIP-Data-Request/CMIP7_DReq_Content: Data request content for v1.2.1 (v1.2.1), Zenodo [data set], https://doi.org/10.5281/zenodo.15288187, 2025b.
de Abreu, V. H. S., Santos, A. S., and Monteiro, T. G. M.: Climate change impacts on the road transport infrastructure: A systematic review on adaptation measures, Sustainability, 14, 8864, https://doi.org/10.3390/su14148864, 2022.
Dingley, B., Anstey, J. A., Abalos, M., Abraham, C., Bergman, T., Bock, L., Fiddes, S., Hassler, B., Kramer, R. J., Luo, F., O'Connor, F. M., Šácha, P., Simpson, I. R., Wilcox, L. J., and Zelinka, M. D.: CMIP7 Data Request: Atmosphere Priorities and Opportunities, EGUsphere [preprint], https://doi.org/10.5194/egusphere-2025-3189, 2025.
Doblas-Reyes, F. J., Sörensson, A. A., Almazroui, M., Dosio, A., Gutowski, W. J., Haarsma, R., Hamdi, R., Hewitson, B., Kwon, W.-T., Lamptey, B. L., Maraun, D., Stephenson, T. S., Takayabu, I., Terray, L., Turner, A., and Zuo, Z.: Linking Global to Regional Climate Change. In Climate Change 2021: The Physical Science Basis. Contribution of Working Group I to the Sixth Assessment Report of the Intergovernmental Panel on Climate Change, edited by: Masson-Delmotte, V., Zhai, P., Pirani, A., Connors, S. L., Péan, C., Berger, S., Caud, N., Chen, Y., Goldfarb, L., Gomis, M. I., Huang, M., Leitzell, K., Lonnoy, E., Matthews, J. B. R., Maycock, T. K., Waterfield, T., Yelekçi, O., Yu, R., and Zhou B., Cambridge University Press, Cambridge, United Kingdom and New York, NY, USA, 1363–1512, https://doi.org/10.1017/9781009157896.012, 2021.
Dodman, D., Hayward, B., Pelling, M., Castan Broto, V., Chow, W., Chu, E., Dawson, R., Khirfan, L., McPhearson, T., Prakash, A., Zheng, Y., and Ziervogel, G.: Cities, Settlements and Key Infrastructure, In: Climate Change 2022: Impacts, Adaptation and Vulnerability, Contribution of Working Group II to the Sixth Assessment Report of the Intergovernmental Panel on Climate Changeedited by: Pörtner, H.-O., Roberts, D. C., Tignor, M., Poloczanska, E. S., Mintenbeck, K., Alegría, A., Craig, M., Langsdorf, S., Löschke, S., Möller, V., Okem, A., and Rama, B., Cambridge University Press, Cambridge, UK and New York, NY, USA, 907–1040, https://doi.org/10.1017/9781009325844.008, 2022.
Doney, S. C., Ruckelshaus, M., Emmett Duffy, J., Barry, J. P., Chan, F., English, C. A., Galindo, H. M., Grebmeier, J. M., Hollowed, A. B., Knowlton, N., Polovina, J., Rabalais, N. N., Sydeman, W. J., and Talley, L. D.: Climate change impacts on marine ecosystems, Annual Review of Marine Science, 1, 11–37, https://doi.org/10.1146/annurev-marine-041911-111611, 2012.
Dubus, L., Brayshaw, D. J., Huertas-Hernando, D., Radu, D., Sharp, J., Zappa, W., and Stoop, L. P.: Towards a future-proof climate database for European energy system studies, Environmental Research Letters, 17, 121001, https://doi.org/10.1088/1748-9326/aca1d3, 2022.
Dunne, J. P., Hewitt, H. T., Arblaster, J. M., Bonou, F., Boucher, O., Cavazos, T., Dingley, B., Durack, P. J., Hassler, B., Juckes, M., Miyakawa, T., Mizielinski, M., Naik, V., Nicholls, Z., O'Rourke, E., Pincus, R., Sanderson, B. M., Simpson, I. R., and Taylor, K. E.: An evolving Coupled Model Intercomparison Project phase 7 (CMIP7) and Fast Track in support of future climate assessment, Geosci. Model Dev., 18, 6671–6700, https://doi.org/10.5194/gmd-18-6671-2025, 2025.
Eyring, V., Bony, S., Meehl, G. A., Senior, C. A., Stevens, B., Stouffer, R. J., and Taylor, K. E.: Overview of the Coupled Model Intercomparison Project Phase 6 (CMIP6) experimental design and organization, Geosci. Model Dev., 9, 1937–1958, https://doi.org/10.5194/gmd-9-1937-2016, 2016.
Eyring, V., Cox, P. M., Flato, G. M., Gleckler, P. J., Abramowitz, G., Caldwell, P., Collins, W. D., Gier, B. K., Hall, A. D., Hoffman, F. M., Hurrt, C., G., Jahn, A., Jones, D. C., Klein, S. A., Krasting, J. P., Kwiatkowski, L., Lorenz, R., Maloney, E., Meehl, G. A., Pendergrass, A. G., Pincus, R., Ruane, A. C., Russell, J. L., Sanderson, B., M., Santer, B. D., Sherwood, S. C., Simpson, I. R., Stouffer, R. J., and Williamson, M. S.: Taking climate model evaluation to the next level, Nature Clim. Change, 9, 102–110, https://doi.org/10.1038/s41558-018-0355-y, 2019.
Eyring, V., Gillett, N. P., Achuta Rao, K. M., Barimalala, R., Barreiro Parrillo, M., Bellouin, N., Cassou, C., Durack, P. J., Kosaka, Y., McGregor, S., Min, S., Morgenstern, O., and Sun, Y.: Human Influence on the Climate System, in: Climate Change 2021: The Physical Science Basis, Contribution of Working Group I to the Sixth Assessment Report of the Intergovernmental Panel on Climate Change, edited by: Masson-Delmotte, V., Zhai, P., Pirani, A., Connors, S. L., Péan, C., Berger, S., Caud, N., Chen, Y., Goldfarb, L., Gomis, M. I., Huang, M., Leitzell, K., Lonnoy, E., Matthews, J. B. R., Maycock, T. K., Waterfield, T., Yelekçi, O., Yu, R., and Zhou, B., Cambridge University Press, Cambridge, United Kingdom and New York, NY, USA, 423–552, https://doi.org/10.1017/9781009157896.005, 2021.
Ferrier, S., Ninan, K. N., Leadley, P., Alkemade, R., Kolomytsev, G., Moraes, M., and Joly, C.: technical report of the methodological assessment of scenarios and models of biodiversity and ecosystem services; Work programme of the Platform: scenarios and models of biodiversity and ecosystem services (deliverable 3á (c)), Note by the Secretariat, https://www.ipbes.net/resource-file/5371 (last access: 25 November 2025), 2016.
Fox-Kemper, B., Hewitt, H. T., Xiao, C., Adalgeirsdottir, G., Drijfhout, S. S., Edwards, T. L., Golledge, N. R., Hemer, M., Kopp, R. E., Krinner, G., Mix, A., Notz, D., Nowicki, S., Nurhati, I. S., Ruiz, L., Sallee, J.-B., Slangen, A. B. A., and Yu, Y.: Ocean, Cryosphere and Sea Level Change, in: Climate Change 2021: The Physical Science Basis. Contribution of Working Group I to the Sixth Assessment Report of the Intergovernmental Panel on Climate Change, edited by: Masson-Delmotte, V., Zhai, P., Pirani, A., Connors, S. L., Péan, C., Berger, S., Caud, N., Chen, Y., Goldfarb, L., Gomis, M. I., Huang, M., Leitzell, K., Lonnoy, E., Matthews, J. B. R., Maycock, T. K., Waterfield, T., Yelekçi, O., Yu, R., and Zhou, B., Cambridge University Press, United Kingdom and New York, NY, USA, 1211–1362, https://doi.org/10.1017/9781009157896.011, 2021.
Fox-Kemper, B., DeRepentigny, P., Treguier, A. M., Stepanek, C., O'Rourke, E., Mackallah, C., Meucci, A., Aksenov, Y., Durack, P. J., Feldl, N., Hernaman, V., Heuzé, C., Iovino, D., Madan, G., Marquez, A. L., Massonnet, F., Mecking, J., Samanta, D., Taylor, P. C., Tseng, W.-L., and Vancoppenolle, M.: CMIP7 Data Request: Ocean and Sea Ice Priorities and Opportunities, EGUsphere [preprint], https://doi.org/10.5194/egusphere-2025-3083, 2025.
Frieler, K., Volkholz, J., Lange, S., Schewe, J., Mengel, M., del Rocío Rivas López, M., Otto, C., Reyer, C. P. O., Karger, D. N., Malle, J. T., Treu, S., Menz, C., Blanchard, J. L., Harrison, C. S., Petrik, C. M., Eddy, T. D., Ortega-Cisneros, K., Novaglio, C., Rousseau, Y., Watson, R. A., Stock, C., Liu, X., Heneghan, R., Tittensor, D., Maury, O., Büchner, M., Vogt, T., Wang, T., Sun, F., Sauer, I. J., Koch, J., Vanderkelen, I., Jägermeyr, J., Müller, C., Rabin, S., Klar, J., Vega del Valle, I. D., Lasslop, G., Chadburn, S., Burke, E., Gallego-Sala, A., Smith, N., Chang, J., Hantson, S., Burton, C., Gädeke, A., Li, F., Gosling, S. N., Müller Schmied, H., Hattermann, F., Wang, J., Yao, F., Hickler, T., Marcé, R., Pierson, D., Thiery, W., Mercado-Bettín, D., Ladwig, R., Ayala-Zamora, A. I., Forrest, M., and Bechtold, M.: Scenario setup and forcing data for impact model evaluation and impact attribution within the third round of the Inter-Sectoral Impact Model Intercomparison Project (ISIMIP3a), Geosci. Model Dev., 17, 1–51, https://doi.org/10.5194/gmd-17-1-2024, 2024.
Gelaro, R., McCarty, W., Suárez, M. J., Todling, R., Molod, A., Takacs, L., Randles, C. A., Darmenov, A., Bosilovich, M. G., Reichle, R., Wargan, K., Coy, L., Cullather, R., Draper, C., Akella, S., Buchard, V., Conaty, A., da Silva, A. M., Gu, W., Kim, G.-K., Koster, R., Lucchesi, R., Merkova, D., Nielsen, J. E., Partyka, G., Pawson, S., Putman, W., Rienecker, M., Schubert, S. D., Sienkiewicz, M., and Zhao, B.: The Modern-Era Retrospective Analysis for Research and Applications, version 2 (MERRA-2), J. Climate, 30, 5419–5454, https://doi.org/10.1175/JCLI-D-16-0758.1, 2017.
Georgescu, M., Broadbent, A. M., Wang, M., Krayenhoff, E. S., and Moustaoui, M.: Precipitation response to climate change and urban development over the continental United States, Environ. Res. Lett., 16, 044001, https://doi.org/10.1088/1748-9326/abd8ac, 2021.
Giorgi, F.: Thirty Years of Regional Climate Modeling: Where Are We and Where Are We Going next?, Journal of Geophysical Research: Atmospheres, 124, 5696–5723, https://doi.org/10.1029/2018JD030094, 2019.
Giroud, A.: World Investment Report 2023: Investing in sustainable energy for all, J. Int. Bus. Policy, 7, 128–131, https://doi.org/10.1057/s42214-023-00178-9, 2024.
Gratton, G. B., Williams, P. D., Padhra, A., and Rapsomanikis, S.: Reviewing the impacts of climate change on air transport operations, The Aeronautical Journal, 126, 209–221, https://doi.org/10.1017/aer.2021.109, 2022.
Gruber, N., Boyd, P. W., Frölicher, T. L., and Vogt, M.: Biogeochemical extremes and compound events in the ocean, Nature, 600, 395–407, https://doi.org/10.1038/s41586-021-03981-7, 2021.
Grünig, M., Rammer, W., Albrich, K., André, F., Augustynczik, A. L., Bohn, F., Bouwman, M., Bugmann, H., Collalti, A., Cristal, I., Dalmonech, D., De Caceres, M., De Coligny, F., Dobor, L., Dollinger, C., Forrester, D. I., Garcia-Gonzalo, J., González, J. R., Hiltner, U., Hlásny, T., Honkaniemi, J., Huber, N., Jonard, M., Maria Jönsson, A., Lagergren, F., Nieberg, M., Mina, M., Mohren, F., Moos, C., Morin, X., Muys, B., Peltoniemi, M., Reyer, C. P., Storms, I., Thom, D., Toïgo, M., and Seidl, R. A.: Harmonized database of European forest simulations under climate change, Data in Brief, Elsevier BV, 54, 110384, https://doi.org/10.1016/j.dib.2024.110384, 2024.
Gutowski Jr., W. J., Giorgi, F., Timbal, B., Frigon, A., Jacob, D., Kang, H.-S., Raghavan, K., Lee, B., Lennard, C., Nikulin, G., O'Rourke, E., Rixen, M., Solman, S., Stephenson, T., and Tangang, F.: WCRP COordinated Regional Downscaling EXperiment (CORDEX): a diagnostic MIP for CMIP6, Geosci. Model Dev., 9, 4087–4095, https://doi.org/10.5194/gmd-9-4087-2016, 2016.
Hasegawa, T., Fujimori, S., Havlík, P., Valin, H., Bodirsky, B. L., Doelman, J. C., Fellmann, T., Kyle, P., Koopman, J. F. L., Lotze-Campen, H., Mason-D'Croz, D., Ochi, Y., Pérez Domínguez, I., Stehfest, E., Sulser, T. B., Tabeau, A., Takahashi, K., Takakura, J., van Meijl, H., van Zeist, W.-J., Weibe, K., and Witzke, P.: Risk of increased food insecurity under stringent global climate change mitigation policy, Nature Climate Change, 8, 699–703, https://doi.org/10.1038/s41558-018-0230-x, 2018.
Hassan, Q., Viktor, P., Al-Musawi, T. J., Ali, B. M., Algburi, S., Alzoubi, H. M., Al-Jiboory, A. K., Sameen, A. Z., Salman, H. M., and Jaszczur, M.: The renewable energy role in the global energy Transformations, Renewable Energy Focus, 48, 100545, https://doi.org/10.1016/j.ref.2024.100545, 2024.
Hof, C., Voskamp, A., Biber, M. F., Böhning-Gaese, K., Engelhardt, E. K., Niamir, A., Willis, S. G., and Hickler, T.: Bioenergy cropland expansion may offset positive effects of climate change mitigation for global vertebrate diversity, Proceedings of the National Academy of Sciences, 115, 13294–13299, https://doi.org/10.1073/pnas.1807745115, 2018.
Hoffman, F. M., Hassler, B., Swaminathan, R., Lewis, J., Andela, B., Collier, N., Hegedűs, D., Lee, J., Pascoe, C., Pflüger, M., Stockhause, M., Ullrich, P., Xu, M., Bock, L., Chun, F., Gier, B. K., Kelley, D. I., Lauer, A., Lenhardt, J., Schlund, M., Sreeush, M. G., Weigel, K., Blockley, E., Beadling, R., Beucher, R., Dugassa, D. D., Lembo, V., Lu, J., Brands, S., Tjiputra, J., Malinina, E., Mederios, B., Scoccimarro, E., Walton, J., Kershaw, P., Marquez, A. L., Roberts, M. J., O'Rourke, E., Dingley, E., Turner, B., Hewitt, H., and Dunne, J. P.: Rapid Evaluation Framework for the CMIP7 Assessment Fast Track, EGUsphere [preprint], https://doi.org/10.5194/egusphere-2025-2685, 2025.
Holbrook, N. J., Hernaman, V., Koshiba, S., Lako, J., Katjar, J. B., Amosa, P., and Singh, A.: Impacts of marine heatwaves on tropical western and central Pacific Island nations and their communities, Global and Planetary Change, 208, 103680, https://doi.org/10.1016/j.gloplacha.2021.103680, 2022.
IEA: World Energy Investment 2024, IEA, Paris, https://www.iea.org/reports/world-energy-investment-2024 (last access: 25 November 2025), 2024.
Im, U., Geels, C., Hanninen, R., Kukkonen, J., Rao, S., Ruuhela, R., Sofiev, M., Schaller, N., Hodnebrog, Ø., Sillmann, J., Schwingshackl, C., Christensen, J. H., Bojariu, R., and Aunan, K.: Reviewing the links and feedbacks between climate change and air pollution in Europe, Front. Environ. Sci., 10, 954045, https://doi.org/10.3389/fenvs.2022.954045, 2022.
Im, U., Bauer, S. E. Frohn, L. M., Geels, C., Tsigaridis, K., and Brandt, J.: Present-day and future PM2.5 and O3-related global and regional premature mortality in the EVAv6.0 health impact assessment model, Environment Research, 216, 114702, https://doi.org/10.1016/j.envres.2022.114702, 2023.
IPCC: Climate Change 2021 – The Physical Science Basis, Contribution of Working Group I to the Sixth Assessment Report of the Intergovernmental Panel on Climate Change, edited by: Masson-Delmotte, V., Zhai, P., Pirani, A., Connors, S. L., Péan, C., Berger, S., Caud, N., Chen, Y., Goldfarb, L., Gomis, M. I., Huang, M., Leitzell, K., Lonnoy, E., Matthews, J. B. R., Maycock, T. K., Waterfield, T., Yelekçi, O., Yu, R., and Zhou, B., Cambridge University Press, Cambridge, UK and New York, NY, USA, https://doi.org/10.1017/9781009157896.001, 2021.
IPCC: Climate Change 2023: Synthesis Report, Contribution of Working Groups I, II and III to the Sixth Assessment Report of the Intergovernmental Panel on Climate Change, edited by: Core Writing Team, H. Lee and J. Romero, IPCC, Geneva, Switzerland, 184 pp., https://doi.org/10.59327/IPCC/AR6-9789291691647, 2023.
Jägermeyr, J., Müller, C., Ruane, A. C., Elliott, J., Balkovic, J., Castillo, O., Faye, B., Foster, I., Folberth, C., Franke, J. A., Fuchs, K., Guarin, J., Heinke, J., Hoogenboom, G., Iizumi, T., Kain, A. K., Kelly, D., Khabarov, N., Lange, S., Lin, T.-S., Liu, W., Mialyk, O., Minoli, S., Moyer, E. J., Okada, M., Phillips, M., Porter, C., Rabin, S., Scheer, C., Schneider, J. M., Schyns, J. F., Skalsky, R., Smerald, A., Stella, T., Stephens, H., Webber, H., Zabel, F., and Rosenzweig, C.: Climate impacts on global agriculture emerge earlier in new generation of climate and crop models, Nat. Food, 11, 873–885, https://doi.org/10.1038/s43016-021-00400-y, 2021.
Jones, C. G., Adloff, F., Booth, B. B. B., Cox, P. M., Eyring, V., Friedlingstein, P., Frieler, K., Hewitt, H. T., Jeffery, H. A., Joussaume, S., Koenigk, T., Lawrence, B. N., O'Rourke, E., Roberts, M. J., Sanderson, B. M., Séférian, R., Somot, S., Vidale, P. L., van Vuuren, D., Acosta, M., Bentsen, M., Bernardello, R., Betts, R., Blockley, E., Boé, J., Bracegirdle, T., Braconnot, P., Brovkin, V., Buontempo, C., Doblas-Reyes, F., Donat, M., Epicoco, I., Falloon, P., Fiore, S., Frölicher, T., Fučkar, N. S., Gidden, M. J., Goessling, H. F., Graversen, R. G., Gualdi, S., Gutiérrez, J. M., Ilyina, T., Jacob, D., Jones, C. D., Juckes, M., Kendon, E., Kjellström, E., Knutti, R., Lowe, J., Mizielinski, M., Nassisi, P., Obersteiner, M., Regnier, P., Roehrig, R., Salas y Mélia, D., Schleussner, C.-F., Schulz, M., Scoccimarro, E., Terray, L., Thiemann, H., Wood, R. A., Yang, S., and Zaehle, S.: Bringing it all together: science priorities for improved understanding of Earth system change and to support international climate policy, Earth Syst. Dynam., 15, 1319–1351, https://doi.org/10.5194/esd-15-1319-2024, 2024.
Karger, D. N., Conrad, O., Böhner, J., Kawohl, T., Kreft, H., Soria-Auza, R. W., Zimmermann, N. E., Linder, H. P., and Kessler, M.: Climatologies at high resolution for the earth's land surface areas, Sci. Data, 4, 170122, https://doi.org/10.1038/sdata.2017.122, 2017.
Karger, D. N., Lange, S., Hari, C., Reyer, C. P. O., Conrad, O., Zimmermann, N. E., and Frieler, K.: CHELSA-W5E5: daily 1 km meteorological forcing data for climate impact studies, Earth Syst. Sci. Data, 15, 2445–2464, https://doi.org/10.5194/essd-15-2445-2023, 2023.
Karger, D. N., Schmatz, D. R., Dettling, G., and Zimmermann, N. E.: High-resolution monthly precipitation and temperature time series from 2006 to 2100, Sci. Data, 7, 248, https://doi.org/10.1038/s41597-020-00587-y, 2020.
Kashinath, K., Mustafa, M., Albert, A., Wu, J.-L., Jiang, C., Esmaeilzadeh, S., Azizzadenesheli, K., Wang, R., Chattopadhyay, A., Singh, A., Manepalli, A., Chirila, D., Yu, R., Walters, R., White, B., Xiao, H., Tchelepi, H. A., Marcus, P., Anandkumar, A., Hassanzadeh, P., and Prabhat: Physics-informed machine learning: case studies for weather and climate modelling, Philosophical Transactions of the Royal Society A, 379, 20200093, https://doi.org/10.1098/rsta.2020.0093, 2021.
Kim, H., Rosa, I. M. D., Alkemade, R., Leadley, P., Hurtt, G., Popp, A., van Vuuren, D. P., Anthoni, P., Arneth, A., Baisero, D., Caton, E., Chaplin-Kramer, R., Chini, L., De Palma, A., Di Fulvio, F., Di Marco, M., Espinoza, F., Ferrier, S., Fujimori, S., Gonzalez, R. E., Gueguen, M., Guerra, C., Harfoot, M., Harwood, T. D., Hasegawa, T., Haverd, V., Havlík, P., Hellweg, S., Hill, S. L. L., Hirata, A., Hoskins, A. J., Janse, J. H., Jetz, W., Johnson, J. A., Krause, A., Leclère, D., Martins, I. S., Matsui, T., Merow, C., Obersteiner, M., Ohashi, H., Poulter, B., Purvis, A., Quesada, B., Rondinini, C., Schipper, A. M., Sharp, R., Takahashi, K., Thuiller, W., Titeux, N., Visconti, P., Ware, C., Wolf, F., and Pereira, H. M.: A protocol for an intercomparison of biodiversity and ecosystem services models using harmonized land-use and climate scenarios, Geosci. Model Dev., 11, 4537–4562, https://doi.org/10.5194/gmd-11-4537-2018, 2018.
Kinney, P. L., Schwartz, J., Pascal, M., Petkova, E., Le Tertre, A., Medina, S., and Vautard, R.: Winter season mortality: Will climate warming bring benefits?, Environmental Research Letters, 10, 064016, https://doi.org/10.1088/1748-9326/10/6/064016, 2015.
Knutson, T. R. and Ploshay, J. J.: Detection of anthropogenic influence on a summertime heat stress index, Climatic Change, 138, 25–39, https://doi.org/10.1007/s10584-016-1708-z, 2016.
Lange, S.: Trend-preserving bias adjustment and statistical downscaling with ISIMIP3BASD (v1.0), Geosci. Model Dev., 12, 3055–3070, https://doi.org/10.5194/gmd-12-3055-2019, 2019.
Lawrence, D. M., Hurtt, G. C., Arneth, A., Brovkin, V., Calvin, K. V., Jones, A. D., Jones, C. D., Lawrence, P. J., de Noblet-Ducoudré, N., Pongratz, J., Seneviratne, S. I., and Shevliakova, E.: The Land Use Model Intercomparison Project (LUMIP) contribution to CMIP6: rationale and experimental design, Geosci. Model Dev., 9, 2973–2998, https://doi.org/10.5194/gmd-9-2973-2016, 2016.
Lee, S. H., Williams, P. D., and Frame, T. H.: Increased shear in the North Atlantic upper-level jet stream over the past four decades, Nature, 572, 639–642, https://doi.org/10.1038/s41586-019-1465-z, 2019.
Lengaigne, M., Pang, S., Silvy, Y., Danielli, V., Gopika, S., Sadhvi, K., Rousset, C., Ethé, C., Person, R., Madec, G., Barrier, N., Maury, O., Menkes, C., Nicol, S., Gorgues, T., Melet, A., Guihou, K., and Vialard, J.: An ocean-only framework for correcting future CMIP oceanic projections from their present-day biases, ESS Open Archive, https://doi.org/10.22541/essoar.172019498.89258365/v1, 2024.
Li, X. C., Zhao, L., Qin, Y., Oleson, K., and Zhang, Y.: Elevated urban energy risks due to climate-driven biophysical feedbacks, Nat. Clim. Change, 14, 1056–1063, https://doi.org/10.1038/s41558-024-02108-w, 2024.
Li, Y., Tang, G., O'Rourke, E., Minallah, S., e Braga, M. M., Nowicki, S., Smith, R. S., Lawrence, D. M., Hurtt, G. C., Peano, D., Meyer, G., Hassler, B., Mao, J., Xue, Y., and Juckes, M.: CMIP7 Data Request: Land and Land Ice Priorities and Opportunities, EGUsphere [preprint], https://doi.org/10.5194/egusphere-2025-3207, 2025.
Lin, Y.-K., Chang, C.-K., Li, M.-H., Wu, Y.-C., and Wang, Y.-C.: High-temperature indices associated with mortality and outpatient visits: Characterizing the association with elevated temperature, Science of The Total Environment, 427–428, 41–49, https://doi.org/10.1016/j.scitotenv.2012.04.039, 2012.
Mackallah, C., Juckes, M., Anstey, J., Pascoe, C., Rigoudy, G., Moine, M.-P., Lovato, T., Pamment, A., Kawamiya, M., Bergman, T., Schupfner, M., Koven, C., Lam, T., Dingley, B., O'Rourke, E., Turner, B., Ellis, D., and Mizielinski, M.: CMIP7 Data Request: a transparent community-led approach leveraging interactive web tools and enhanced CMIP governance, in preparation, 2025.
Mahadevia, D., Delgado Ramos, G. C., Barnes, J., Fitzgerald, J., Kamei, M., and Lanza, K.: Learning from COVID-19 for Climate-Ready Urban Transformation, in: Climate Change and Cities: Third Assessment Report of the Urban Climate Change Research Network, edited by: Solecki, W., Pathak, M., Barata, M., Barau, A., Dombrov, M., and Rosenzweig, C., Cambridge University Press, Cambridge, https://doi.org/10.1017/9781009527279, 2025.
Mankin, J. S., Lehner, F., Coats, S., and McKinnon, K. A.: The value of initial condition large ensembles to robust adaptation decision-making, Earth's Future, 8, e2012EF001610, https://doi.org/10.1029/2020EF001610, 2020.
Maraun, D., Huth, R., Gutiérrez, J. M., Martín, D. S., Dubrovsky, M., Fischer, A., Hertig, E., Soares, P. M. M., Bartholy, J., Pongrácz, R., Widmann, M., Casado, M. J., Ramos, P., and Bedia, J.: The VALUE perfect predictor experiment: Evaluation of temporal variability, International Journal of Climatology, 39, 3786–3818, https://doi.org/10.1002/joc.5222, 2019.
Mbow, C., Rosenzweig, C., Barioni, L. G., Benton, T. G., Herrero, M., Krishnapillai, M., Pradhan, P., Rivera-Ferre, M. G., Sapkota, T., Tubiello, F. N., Xu, Y., and Smith, P.: Food Security, In: Climate Change and Land: an IPCC Special Report on Climate Change, Desertification, Land Degradation, Sustainable Land Management, Food Security, and Greenhouse Gas Fluxes in Terrestrial Ecosystems, edited by: Shukla, P. R., Skea, J., Buendia, E. C., Masson-Delmotte, V., Pörtner, H.-O., Roberts, D. C., Zhai, P., Slade, R., Connors, S., van Diemen, R., Ferrat, M., Haughey, E., Luz, S., Neogi, S., Pathak, M., Petzold, J., Portugal Pereira, J., Vyas, P., Huntley, E., Kissick, K., Belkacemi, M., and Malley, J., Cambridge University Press, Cambridge, UK and New York, NY, USA, https://doi.org/10.1017/9781009157988.007, 2019.
McPartland, M. Y., Lovato, T., Koven, C. D., Wilson, J. D., Turner, B., Petrik, C. M., Licón-Saláiz, J., Li, F., Lhardy, F., Clement Kinney, J., Kawamiya, M., Hassler, B., Gillett, N. P., Fall, C. M. N., Danek, C., Brierley, C. M., Bastos, A., and Andrews, O.: CMIP7 Data Request: Earth System Priorities and Opportunities, EGUsphere [preprint], https://doi.org/10.5194/egusphere-2025-3246, 2025.
Molina, M. J., O'Brien, T. A., Anderson, G., Ashfaq, M., Bennett, K. E., Collins, W. D., Dagon, K., Restrepo, J. M., and Ullrich, P. A.: A review of recent and emerging machine learning applications for climate variability and weather phenomena, Artificial Intelligence for the Earth Systems, 2, 220086, https://doi.org/10.1175/AIES-D-22-0086.1, 2023.
Nemry, F. and Demirel, H.: Impacts of Climate Change on Transport: A focus on road and rail transport infrastructures, European commission, joint research centre (JRC), Institute for prospective technological studies (IPTS), 89, https://doi.org/10.2791/15504, 2012.
Orru, H., Ebi, K. L., and Forsberg, B.: The Interplay of Climate Change and Air Pollution on Health, Current Environmental Health Reports, 4, 504–513, https://doi.org/10.1007/s40572-017-0168-6, 2017.
Palin, E. J., Thornton, H. E., Mathison, C. T., McCarthy, R. E., Clark, R. T., and Dora, J.: Future projections of temperature-related climate change impacts on the railway network of Great Britain, Climatic Change, 120, 71–93, https://doi.org/10.1007/s10584-013-0810-8, 2013.
Palin, E. J., Stipanovic Oslakovic, I., Gavin, K., and Quinn, A.: Implications of climate change for railway infrastructure, Wiley Interdisciplinary Reviews: Climate Change, 12, e728, https://doi.org/10.1002/wcc.728, 2021.
Parmesan, C., Morecroft, M. D., Trisurat, Y., Adrian, R., Anshari, G. Z., Arneth, A., Gao, Q., Gonzalez, P., Harris, R., Price, J., Stevens, N., and Talukdarr, G. H.: Terrestrial and Freshwater Ecosystems and Their Services, In: Climate Change 2022: Impacts, Adaptation and Vulnerability. Contribution of Working Group II to the Sixth Assessment Report of the Intergovernmental Panel on Climate Change, edited by: Pörtner, H.-O., Roberts, D. C., Tignor, M., Poloczanska, E. S., Mintenbeck, K., Alegría, A., Craig, M., Langsdorf, S., Löschke, S., Möller, V., Okem, A., and Rama, B., Cambridge University Press, Cambridge, UK and New York, NY, USA, 197–377, https://doi.org/10.1017/9781009325844.004, 2022.
Pereira, H. M., Martins, I. S., Rosa, I. M. D., Kim, H., Leadley, P., Popp, A., van Vuuren, D. P., Hurtt, G., Quoss, L., Arneth, A., Baisero, D., Bakkenes, M., Chaplin-Kramer, R., Chini, L., Marco, M. D., Ferrier, S., Fujimori, S., Guerra, C. A., Harfoot, M., Harwood, T. D., Hasegawa, T., Haverd, V., Havlík, P., Hellweg, S., Hilbers, J. P., Hill, S. L. L., Hirata, A., Hoskins, A. J., Humpenöder, F., Janse, J. H., Jetz, W., Johnson, J. A., Krause, A., Leclère, D., Matsui, T., Meijer, J. R., Merow, C., Obersteiner, M., Ohashi, H., Palma, A. D., Poulter, B., Purvis, A., Quesada, B., Rondinini, C., Schipper, A. M., Settele, J., Sharp, R., Stehfest, E., Strassburg, B. B. N., Takahashi, K., Talluto, L., Thuiller, W., Titeux, N., Visconti, P., Ware, C., Wolf, F., and Alkemade, R.: Global trends and scenarios for terrestrial biodiversity and ecosystem services from 1900 to 2050, Science, 384, 458–465, https://doi.org/10.1126/science.adn3441, 2024.
Ranasinghe, R., Ruane, A. C., Vautard, R., Arnell, N., Coppola, E., Cruz, F. A., Dessai, S., Islam, A. S., Rahimi, M., Ruiz Carrascal, D., Sillmann, J., Sylla, M. B., Tebaldi, C., Wang, W., and Zaaboul, R.: Chapter 12: Climate change information for regional impact and for risk assessment, in: Climate Change 2021: The Physical Science Basis, Contribution of Working Group I to the Sixth Assessment Report of the Intergovernmental Panel on Climate Change, edited by: Masson-Delmotte, V., Zhai, P., Pirani, A., Connors, S. L., Péan, C., Berger, S., Caud, N., Chen, Y., Goldfarb, L., Gomis, M. I., Huang, M., Leitzell, K., Lonnoy, E., Matthews, J. B. R., Maycock, T. K., Waterfield, T., Yelekçi, O., Yu, R., and Zhou, B., Cambridge University Press, 1767–1926, https://doi.org/10.1017/9781009157896.014, 2021.
Roberts, M. J., Reed, K. A., Bao, Q., Barsugli, J. J., Camargo, S. J., Caron, L.-P., Chang, P., Chen, C.-T., Christensen, H. M., Danabasoglu, G., Frenger, I., Fučkar, N. S., ul Hasson, S., Hewitt, H. T., Huang, H., Kim, D., Kodama, C., Lai, M., Leung, L.-Y. R., Mizuta, R., Nobre, P., Ortega, P., Paquin, D., Roberts, C. D., Scoccimarro, E., Seddon, J., Treguier, A. M., Tu, C.-Y., Ullrich, P. A., Vidale, P. L., Wehner, M. F., Zarzycki, C. M., Zhang, B., Zhang, W., and Zhao, M.: High-Resolution Model Intercomparison Project phase 2 (HighResMIP2) towards CMIP7, Geosci. Model Dev., 18, 1307–1332, https://doi.org/10.5194/gmd-18-1307-2025, 2025.
Rosenzweig, C., Jones, J. W., Hatfield, J. L., Ruane, A. C., Boote, K. J., Thorburn, P., Antle, J. M., Nelson, G. C., Porter, C., Janssen, S., Asseng, S., Basso, B., Ewert, F., Wallach, D., Baigorria, G., and Winter, J. M.: The Agricultural Model Intercomparison and Improvement Project (AgMIP): Protocols and pilot studies, Agric. Forest Meteorol., 170, 166–182, https://doi.org/10.1016/j.agrformet.2012.09.011, 2013.
Rosenzweig, C., Solecki, W., Romero-Lankao, P., Mehrotra, S., Dhakal, S., and Ali Ibrahim, S. (Eds.): Climate Change and Cities: Second Assessment Report of the Urban Climate Change Research Network, Cambridge University Press, https://doi.org/10.1017/9781316563878.007, 2018.
Ruane, A. C. and Kozlowski, N.: Climate Information Flow for Impacts and Adaptation (Version 6), Zenodo, https://doi.org/10.5281/zenodo.15888031, 2025.
Ruane, A. C., Teichmann, C., Arnell, N. W., Carter, T. R., Ebi, K. L., Frieler, K., Goodess, C. M., Hewitson, B., Horton, R., Kovats, R. S., Lotze, H. K., Mearns, L. O., Navarra, A., Ojima, D. S., Riahi, K., Rosenzweig, C., Themessl, M., and Vincent, K.: The Vulnerability, Impacts, Adaptation and Climate Services Advisory Board (VIACS AB v1.0) contribution to CMIP6, Geosci. Model Dev., 9, 3493–3515, https://doi.org/10.5194/gmd-9-3493-2016, 2016.
Ruane, A. C., Rosenzweig, C., Asseng, S., Boote, K. J., Elliott, J., Ewert, F., Jones, J. W., Martre, P., McDermid, S., Müller, C., Snyder, A., and Thorburn, P. J.: An AgMIP framework for improved agricultural representation in IAMs, Environ, Res. Lett., 12, 125003, https://doi.org/10.1088/1748-9326/aa8da6, 2017.
Ruane, A. C., Vautard, R., Ranasinghe, R., Sillmann, J., Coppola, E., Arnell, N., Cruz, F. A., Dessai, S., Iles, C. E., Islam, A. K. M. S., Jones, R. G., Rahimi, M., Ruiz Carrascal, D., Seneviratne, S. I., Servonnat, J., Sörensson, A. A., Sylla, M. B., Tebaldi, C., Wang, W., and Zaaboul, R.: The Climatic Impact-Driver framework for assessment of risk-relevant climate information, Earth's Future, 10, e2022EF002803, https://doi.org/10.1029/2022EF002803, 2022.
Ruane, A. C., Phillips, M., Jägermeyr, J., and Müller, C.: Non-linear climate change impacts on crop yields may mislead stakeholders, Earth's Future, 12, e2023EF003842, https://doi.org/10.1029/2023EF003842, 2024.
Ruane, A. C., Dingley, B., and Turner, B.: Community engagement during Impacts and Adaptation CMIP7 Data Request process, Zenodo, https://doi.org/10.5281/zenodo.15834319, 2025.
Schneider, A., Friedl, M. A., and Potere, D.: A new map of global urban extent from MODIS satellite data, Environ. Res. Lett., 4, 044003, https://doi.org/10.1088/1748-9326/4/4/044003, 2009.
Schneider, A., Friedl, M. A., and Potere, D.: Mapping global urban areas using MODIS 500-m data: New methods and datasets based on “urban ecoregions”, Remote Sens. Environ., 114, 1733–1746, https://doi.org/10.1016/j.rse.2010.03.003, 2010.
Seto, K. C., Dhakal, S., Bigio, A., Blanco, H., Delgado, G. C., Dewar, D., Huang, L., Kabisch, N., Kraas, F., Little, R., Olazabal, M., and Romanelli, M.: Human settlements, infrastructure and spatial planning, in: Climate Change 2014: Mitigation of Climate Change. Contribution of Working Group III to the Fifth Assessment Report of the Intergovernmental Panel on Climate Change, edited by: Edenhofer, O., Pichs-Madruga, R., Sokona, Y., Farahani, E., Kadner, S., Seyboth, K., Adler, A., Baum, I., Brunner, S., Eickemeier, P., Kriemann, B., Savolainen, J., Schlömer, S., von Stechow, C., Zwickel, T., and Minx, J. C., Cambridge University Press, Cambridge, UK and New York, NY, USA, https://doi.org/10.1017/CBO9781107415416.018, 2014.
Simpson, C. H., Brousse, O., Ebi, K. L., and Heaviside, C.: Commonly used indices disagree about the effect of moisture on heat stress, npj Clim. Atmos. Sci., 6, 78, https://doi.org/10.1038/s41612-023-00408-0, 2023.
Stuart, L., Hobbins, M., Neibuhr, E., Ruane, A. C., Pulwarty, R., Hoell, A., Thiaw, W., Rosenzweig, C., Muñoz-Arriola, F., Jahn, M., and Farrar, M.: Enhancing global food security: Opportunities for the American Meteorological Society, Bull. Amer. Meteorol. Soc., 125, E760–E777, https://doi.org/10.1175/BAMS-D-22-0106.1, 2024.
Sweet, L.-B., Athanasiadis, I. N., van Bree, R., Castellano, A., Martre, P., Paudel, D., Ruane, A. C., and Zscheischler, J.: Transdisciplinary coordination is essential for advancing agricultural modeling with machine learning, One Earth, 8, 101233, https://doi.org/10.1016/j.oneear.2025.101233, 2025.
Staiger, H., Laschewski, G., and Matzarakis, A.: Selection of Appropriate Thermal Indices for Applications in Human Biometeorological Studies, Atmosphere, 10, 18, https://doi.org/10.3390/atmos10010018, 2019.
Taylor, J. W. and Buizza, R.: Using weather ensemble predictions in electricity demand forecasting, International Journal of Forecasting, 19, 57–70, https://doi.org/10.1016/S0169-2070(01)00123-6, 2003.
Tebaldi, C., Aðalgeirsdóttir, G., Drijfhout, S., Dunne, J., Edwards, T. L., Fischer, E., Fyfe, J. C., Jones, R., Kopp, R. E., Koven, C., Krinner, G., Otto, F., Ruane, A. C., Seneviratne, S. I., Sillmann, J., Szopa, S., and Prodromos, Z.: The hazard components of representative key risks. The physical climate perspective, Clim. Risk Manag., 40, 100516, https://doi.org/10.1016/j.crm.2023.100516, 2023.
Thrasher, B., Khajehei, S., Kim, J. B., and Brosnan, I.: NASA Earth Exchange Downscaled Climate Projections 30 Arcseconds CMIP6, Sci. Data, 11, 1346, https://doi.org/10.1038/s41597-024-04188-x, 2024.
Thrasher, B., Wang, W., Michaelis, A., Melton, F., Lee, T., and Nemani, R.: NASA Global Daily Downscaled Projections, CMIP6, Sci. Data, 9, 262, https://doi.org/10.1038/s41597-022-01393-4, 2022.
Tittensor, D. P., Eddy, T. D., Lotze, H. K., Galbraith, E. D., Cheung, W., Barange, M., Blanchard, J. L., Bopp, L., Bryndum-Buchholz, A., Büchner, M., Bulman, C., Carozza, D. A., Christensen, V., Coll, M., Dunne, J. P., Fernandes, J. A., Fulton, E. A., Hobday, A. J., Huber, V., Jennings, S., Jones, M., Lehodey, P., Link, J. S., Mackinson, S., Maury, O., Niiranen, S., Oliveros-Ramos, R., Roy, T., Schewe, J., Shin, Y.-J., Silva, T., Stock, C. A., Steenbeek, J., Underwood, P. J., Volkholz, J., Watson, J. R., and Walker, N. D.: A protocol for the intercomparison of marine fishery and ecosystem models: Fish-MIP v1.0, Geosci. Model Dev., 11, 1421–1442, https://doi.org/10.5194/gmd-11-1421-2018, 2018.
Tittensor, D. P., Novaglio, C., Harrison, C. S., Heneghan, R. F., Barrier, N., Bianchi, D., Bopp, L., Bryndum-Buchholz, A., Britten, G. L., Büchner, M., Cheung, W. W. L., Christensen, V., Coll, M., Dunne, J. P., Eddy, T. D., Everett, J. D., Fernandes-Salvador, J. A., Fulton, E. A., Galbraith, E. D., Gascuel, D., Guiet, J., John, J. G., Link, J. S., Lotze, H. K., Maury, O., Ortega-Cisneros, K., Palacios-Abrantes, J., Petrik, C. M., du Pontavice, H., Rault, J., Richardson, A. J., Shannon, L., Shin, Y.-J., Steenbeek, J., Stock, C. A., and Blanchard, J. L.: Next-generation ensemble projections reveal higher climate risks for marine ecosystems, Nature Climate Change, 11, 973–981, https://doi.org/10.1038/s41558-021-01173-9, 2021.
UK Climate Change Committee: Understanding climate risks to UK infrastructure-Evaluation of the third round of the Adaptation, 81, https://www.theccc.org.uk/wp-content/uploads/2022/07/Understanding-climate-risks-to-UK-infrastructure-Evaluation-of-the-third-round-of-the-Adaptation-Reporting-Power.pdf (last access: 25 November 2025), 2022.
Vanos, J. K., Baldwin, J. W., Jay, O., and Ebi, K. L.: Simplicity lacks robustness when projecting heat-health outcomes in a changing climate, Nature Communications, 11, 6079, https://doi.org/10.1038/s41467-020-19994-1, 2020.
van Vuuren, D., O'Neill, B., Tebaldi, C., Chini, L., Friedlingstein, P., Hasegawa, T., Riahi, K., Sanderson, B., Govindasamy, B., Bauer, N., Eyring, V., Fall, C., Frieler, K., Gidden, M., Gohar, L., Jones, A., King, A., Knutti, R., Kriegler, E., Lawrence, P., Lennard, C., Lowe, J., Mathison, C., Mehmood, S., Prado, L., Zhang, Q., Rose, S., Ruane, A., Schleussner, C.-F., Seferian, R., Sillmann, J., Smith, C., Sörensson, A., Panickal, S., Tachiiri, K., Vaughan, N., Vishwanathan, S., Yokohata, T., and Ziehn, T.: The Scenario Model Intercomparison Project for CMIP7 (ScenarioMIP-CMIP7) , EGUsphere [preprint], https://doi.org/10.5194/egusphere-2024-3765, 2025.
Wang, B., Jägermeyr, J., O'Leary, G. J., Wallach, D., Ruane, A. C., Feng, P., Li, L., Liu, D. L., Waters, C., Yu, Q., Asseng, S., and Rosenzweig, C.: Pathways to identify and reduce uncertainties in agricultural climate impact assessments, Nat. Food, 5, 550–556, https://doi.org/10.1038/s43016-024-01014-w, 2024.
Wang, H.-Y., Shen, S.-F., Chen, Y.-S., Kiang, Y.-K., and Heino, M.: Life histories determine divergent population trends for fishes under climate warming, Nat. Commun., 11, 4088, https://doi.org/10.1038/s41467-020-17937-4, 2020.
Williams, P. D. and Joshi, M. M.: Intensification of winter transatlantic aviation turbulence in response to climate change, Nature Climate Change, 3, 644–648, https://doi.org/10.1038/nclimate1866, 2013.
Williams, P. D. and Joshi, M. M.: Clear-air turbulence in a changing climate, Aviation Turbulence: processes, detection, prediction, 465–480, https://doi.org/10.1007/978-3-319-23630-8_23, 2016.
WMO: WMO guidelines on the calculation of climate normal, WMO-1203, 29, ISBN: 978-92-63-11203-3, https://library.wmo.int/records/item/55797-wmo-guidelines-on-the-calculation-of-climate-normals (last access: 25 November 2025), 2017.
WMO: 2022 State of Climate Services: Energy, World Meteorological Organization (WMO), 1301, 52, https://library.wmo.int/records/item/58116-2022-state-of-climate-services (last access: 25 November 2025), 2022.
World Meteorological Organization (WMO): 2024 State of Climate Services, Five-year Progress Report (2019–2024), WMO-No. 1363, 168 pp., https://library.wmo.int/idurl/4/69061 (last access: 26 November 2025), 2024.
Yu, Y., Mao, J., Wullschleger, S. D., Chen, A., Shi, X., Wang, Y., Hoffman, F. M., Zhang, Y., and Pierce, E.: Machine learning–based observation-constrained projections reveal elevated global socioeconomic risks from wildfire, Nat. Commun., 13, 1250, https://doi.org/10.1038/s41467-022-28853-0, 2022.
Zabel, F. and Poschlod, B.: The Teddy tool v1.1: temporal disaggregation of daily climate model data for climate impact analysis, Geosci. Model Dev., 16, 5383–5399, https://doi.org/10.5194/gmd-16-5383-2023, 2023.
Zeyringer, M., Price, J., Fais, B., Li, P. H., and Sharp, E.: Designing low-carbon power systems for Great Britain in 2050 that are robust to the spatiotemporal and inter-annual variability of weather, Nature Energy, 3, 395–403, https://doi.org/10.1038/s41560-018-0128-x, 2018.
Zhao, L., Lee, X., Smith, R. B., and Oleson, K.: Strong contributions of local background climate to urban heat islands, Nature, 511, 216–219, https://doi.org/10.1038/nature13462, 2014.
Zhao, L., Oppenheimer, M., Zhu, Q., Baldwin, J. W., Ebi, K. L., Bou-Zeid, E., Guan, K., and Liu, X.: Interactions between urban heat islands and heat waves, Environ. Res. Lett., 13, 034003, https://doi.org/10.1088/1748-9326/aa9f73, 2018.
Zhang, K., Cao, C., Chu, H., Zhao, L., Zhao, J., and Lee, X.: Increased heat risk in wet climate induced by urban humid heat, Nature, 617, 738–742, https://doi.org/10.1038/s41586-023-05911-1, 2023.
Zheng, Z., Zhao, L., and Oleson, K. W.: Large model structural uncertainty in global projections of urban heat waves, Nat. Commun., 12, 3736, https://doi.org/10.1038/s41467-021-24113-9, 2021.
Zurell, D., Graham, C. H., Gallien, L., Thuiller, W., and Zimmermann, N. E.: Long-distance migratory birds threatened by multiple independent risks from global change, Nature Climate Change, 8, 992–996, https://doi.org/10.1038/s41558-018-0312-9, 2018.
- Abstract
- Introduction
- Approach and methodology
- Information management and decision making
- Results: Content included in the CMIP7 Data Request
- Discussion
- Conclusions
- Appendix A: Data Request Opportunity Evaluation and Processing
- Appendix B: Description of new variables proposed by Impacts and Adaptation Data Request Theme
- Code and data availability
- Author contributions
- Competing interests
- Disclaimer
- Acknowledgements
- Financial support
- Review statement
- References