the Creative Commons Attribution 4.0 License.
the Creative Commons Attribution 4.0 License.
 | 25 Nov 2025
Proximal surface pedogeophysical characterization in Maritime Antarctica: assessing pedogeomorphological, periglacial, and landform influences
Danilo César de Mello
Clara Glória Oliveira Baldi
Cássio Marques Moquedace
Isabelle de Angeli Oliveira
Gustavo Vieira Veloso
Lucas Carvalho Gomes
Márcio Rocha Francelino
Carlos Ernesto Gonçalves Reynaud Schaefer
Elpídio Inácio Fernandes-Filho
Edgar Batista de Medeiros Júnior
Fabio Soares de Oliveira
José João Lelis Leal Souza
Tiago Osório Ferreira
José A. M. Demattê
Maritime Antarctica (M.A.) contains the most extensive and diverse lithological exposure compared to the entire continent. This lithological substrate reveals a rich history encompassing lithological, pedogeomorphological, and glaciological aspects of M.A., all of with are influenced by periglacial processes. Although pedogeophysical surveys can detect and provide valuable information to understand Antarctic lithologies and their history, such surveys are scarce on this continent and, in practice, almost non-existent. In this sense, we conducted a pioneering and comprehensive γ-spectrometric (natural radioactivity) and magnetic susceptibility (κ) survey on various igneous rocks. This study aimed to improve the geoscientific understanding of periglacial and pedogeomorphological processes in Keller Peninsula by integrating radiometric and magnetic data with advanced spatial analysis. It investigates the spatial variability of natural radiouclides and magnetic susceptibility across different substrates, evaluates a machine learning approach for data modelling, and interprets γ-ray and κ maps to reveal soil and landscape-forming processes. For that, we used proximal γ-spectrometric and κ data in different lithological substrates associated to terrain attributes. The pedogeophysical variables were collected in the field from various lithological substrates, by use field portable equipment. The pedogeophysical variables were collected in the field from various lithological substrates using portable equipment. These variables, combined with relief data and lithology, served as input data for modeling to predict and spatially map the content of radionuclides and κ by random forest algorithm (RF). In addition, we use nested-LOOCV as a form of external validation in a geophysical data with a small number of samples, and the error maps as evaluation of results. The RF algorithm successfully generated detailed maps of γ-spectrometric and κ variables. The distribution of radionuclides and ferrimagnetic minerals was influenced by morphometric variables. Nested-LOOCV method evaluated algorithm performance accurately with limited samples, generating robust mean maps. The highest thorium levels were observed in elevated, flat, and west beach areas, where detrital materials from periglacial erosion came through fluvioglacial channels. Lithology and pedogeomorphological processes-controlled thorium contents. Steeper areas formed a ring with the highest uranium contents, influenced by lithology and geomorphological-periglacial processes (rock cryoclasty, periglacial erosion, and heterogeneous deposition). Felsic rocks and areas less affected by periglacial erosion had the highest potassium levels, while regions with sulfurization-affected pyritized-andesites near fluvioglacial channels showed the lowest potassium contents. Lithology and pedogeochemical processes governed potassium levels. The κ values showed no distinct distribution pattern. Hydrothermal alteration affected the pyritized andesites, with heat and magmatic fluids driving iron enrichment and the formation of hydrothermal magnetite, which in turn led to elevated κ values. Conversely, Cryosol areas, experiencing freezing and thawing activity, had the lowest κ values due to limited ferrimagnetic mineral formation. In regions characterized by diverse terrain attributes and abundant active and intense periglacial processes, the spatial distribution of geophysical variables does not reliably reflect the actual lithological composition of the substrate. The complex interplay of various periglacial processes in the area, along with the morphometric features of the landscape, leads to the redistribution, mixing, and homogenization of surface materials, contributing to the inaccuracies in the predicted-spatialized geophysical variables.
- Article
(7087 KB) - Full-text XML
- BibTeX
- EndNote


Recently, proximal geophysical sensors have been used for lithological-pedological characterization in other parts of the world, where the provided information is used to understand the lithosphere-pedosphere interaction and dynamics in a geoenvironmental context (Bastos et al., 2023; Vingiani et al., 2022). Pedogeophysics is the application of one or more geophysical survey techniques to pedology to acquire pedogeophysical variables, aiming to understand pedogenesis, soil attributes, their landscape distribution, and the relationships between soil-forming factors and broader land surface processes. Pedogeophysical surveys utilizing sensors enabled the gathering of soil field information swiftly and efficiently, reducing the necessity of sample collection for laboratory analysis (Souza et al., 2021; Mello et al., 2020, 2021, 2023a, b). Among the geophysical techniques used for lithological surveys, radiometric (γ-ray spectrometry) and magnetic (magnetic susceptibility) stand out.
Gamma-spectrometry involves the quantification uranium (e238U), thorium (e232Th), and potassium (40K) commonly called (radionuclides) in naturally radioactive rocks, soils, and sediments (Minty et al., 1997). The quantities of these radionuclides are influenced by various factors such as lithological substrate and surface processes (weathering, pedogenesis, geomorphological, and periglacial) (Navas et al., 2018). Dickson and Scott (1997), Wilford and Minty (2006) and Mello et al. (2021) have shown that radionuclide contents depend not only on the soil parent material but also on surface processes. Proximal γ-ray spectrometry offers a precise method for determining concentrations of specific radioactive elements and mapping their sources accurately in soil, bedrock, and surface geological exploration (Ford et al., 2008).
Magnetic susceptibility (κ) quantifies the degree of magnetization induced in a material relative to the strength of the applied magnetic field (Mullins, 1977). In soils, κ is primarily controlled by ferrimagnetic minerals either inherited from lithological substrates or formed through weathering and pedogenesis, typically occurring as magnetite in the sand fraction and maghemite in the clay fraction (Ayoubi et al., 2018). In addition, the surface processes a role in determining κ values (Garankina et al., 2022; Mello et al., 2020; Ribeiro et al., 2018; Sarmast et al., 2017).
Many studies used γ-ray spectrometry mapping to delineate lithological maps (Arivazhagan et al., 2022; Loiseau et al., 2020; Shebl et al., 2021) and magnetic susceptibility (Bressan et al., 2020; Costa et al., 2019; Harris and Grunsky, 2015). In addition, recently Mello et al. (2020, 2021, 2022a, b, c) have successfully used machine learning algorithms combined with data from multiple field geophysical equipment to map pedogeophysical variables and understand tropical soils, lithology and landscapes, obtaining satisfactory results in mapping and understanding these landscapes using modeling via machine learning algorithms.
Maritime Antarctica (MA) is currently a great geosciences frontier to be explored in pedogeophysical studies in with its complex and heterogeneous landforms and lithological characteristics. MA has a different climate from continental Antarctica, being hotter and more humid (Turner et al., 2007, 2005). In this region, periglacial environments are abundant and ruled by seasonal cycles of water freezing-thawing, which determine the specific landforms, permafrost and typical soils (French, 2017; Pollard, 2018). The MA lithology is predominantly composed of igneous rocks and a few sedimentary rocks. This complex lithological system associated with climatic conditions produces heterogeneous soils, sediments and saprolites, forming a unique geoenvironment on the planet (Meier et al., 2023; Siqueira et al., 2022).
Traditionally geoscientists use invasive, destructive and time-consuming techniques for lithological and pedological characterization in natural systems, employing sample collection for physical-chemical and mineralogical analysis in the laboratory. Besides, the lack of detailed characterization of samples in the field demands a high collection of samples. In Antarctica, material collection is limited by a lack of logistics and restricted access to a small number of researchers who sample on the continent. While geophysical survey techniques are well-established and commonly utilized in research, only a few studies have demonstrated their use, specifically γ-ray spectrometry and magnetic susceptibility, for characterizing and understanding periglacial landscapes such as MA (Mello et al., 2023a). This scarcity of studies is particularly evident in the Antarctic environment, where hostile and inaccessible conditions have limited pedogeophysical characterization such as γ spectrometry and magnetic susceptibility mapping, and their correlation with periglacial processes and landforms. Fieldwork logistics in such extreme geoenvironmental settings are inherently challenging. Consequently, acquiring in situ pedogeophysical data can support more accurate inferences about the lithological, mineralogical, and pedological characteristics of the terrain, reducing the need for extensive sample collection and laboratory analysis. This approach is especially valuable when utilizing diverse sensor technologies in remote and sensitive environments.
Given the above, this study aimed to enhance the geoscientific understanding of periglacial and pedogeomorphological processes in Keller Peninsula (Maritime Antarctica) by integrating radiometric and magnetic surficial data with advanced spatial analysis techniques. Specifically, we sought to: (i) investigate how natural radioactivity (238U, 232Th, and 40K) and magnetic susceptibility (κ) vary across heterogeneous lithological and pedological substrates and how they reflect underlying geomorphic and periglacial dynamics; (ii) evaluate the performance of a machine learning algorithm, combined with the Nested Leave-One-Out Cross-Validation method, in modeling and spatializing pedogeophysical surface data; (iii) use the generated γ-ray ternary and κ maps as tools to interpret and reveal spatial patterns related to soil development, rock weathering, and cryogenic processes in the study area.
This study can improve our understanding about periglacial processes, which can improve pedogeophysical surveys and soil-lithological digital mapping in the Antarctic environment. This expectation is based on research that has focused on comprehending lithological characteristics, periglacial processes and landscape evolution in Antarctic pedosphere-lithosphere interactions.
2.1 Study area, lithological-soil surveys and sampling points
The study site comprises Keller Peninsula (62°4′33′′ S, 58°23′46′′ W), Admiralty Bay, King George Island, and in the South Shetland Archipelago in M.A. (Fig. 1). The Keller Peninsula covers an area of 500 ha, stretching 4 km (north–south) and 2 km (east–west) (Francelino et al., 2011). The geological framework of Keller Peninsula (Admiralty Bay, King George Island) was characterized based on the volcanic stratigraphy described by Birkenmajer (1980) and subsequent revisions of the volcanic geology of Admiralty Bay. The peninsula is composed predominantly of Tertiary volcanic sequences, representing three major eruptive cycles associated with caldera collapse and subsequent migration of volcanic centers. Field descriptions and petrographic data indicate the dominance of basaltic-andesitic to andesitic lithologies, locally pyritized, with phenocrysts of labradorite-andesine plagioclase and accessory pyroxenes. These lithological features, combined with the caldera structure and stratigraphic relations to Ullman Spur and Point Hennequin, were used to establish the geological context of the study area, ensuring a robust framework for subsequent soil, geomorphological, and pedogeophysical analyses.
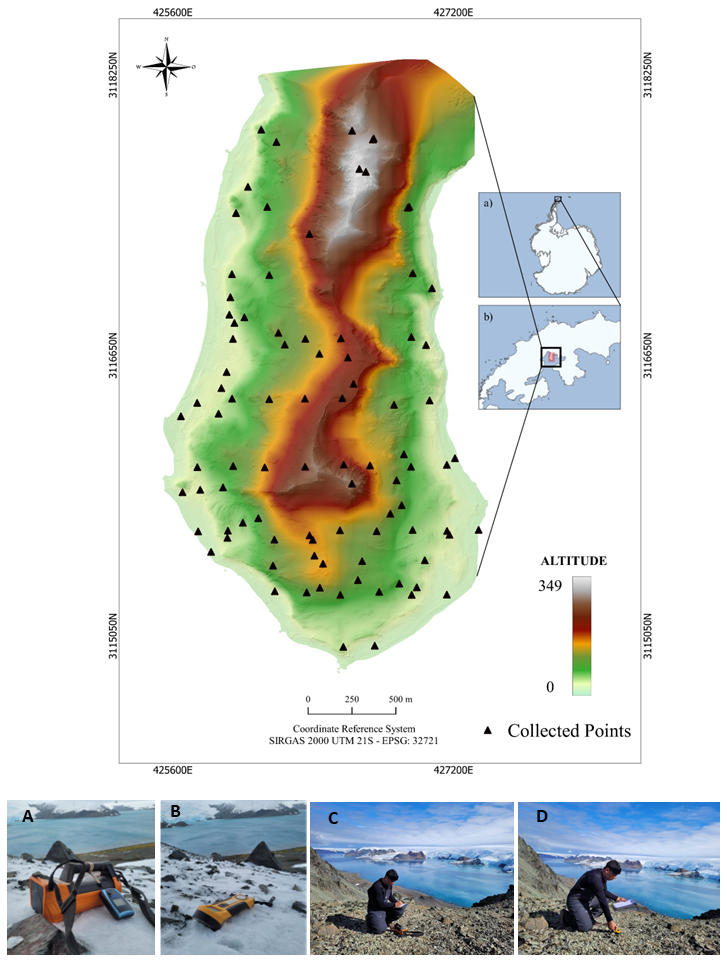
Figure 1Study area in Maritime Antarctic (Keller Peninsula), collected point, digital elevation model, and geophysical sensors. (a) Antarctic continent; (b) Keller Peninsula. (A) Gamma-ray spectrometer (Radiation Solution – RS 230); (B) Magnetic susceptibility meter (KT-10 Terraplus); (C) Gamma-ray readings; (D) Magnetic susceptibility readings.
We used the most detailed comprehensive lithological map of Admiralty Bay and its surroundings produced by British geologists stationed at Base G on Keller Peninsula between 1948 and 1980 (Birkenmajer, 1980), at a scale of 1 : 50 000. The geological framework of the area is linked to volcanic activity involving transitional magmas between the oceanic crust and the Antarctic Plate, generating basaltic to andesitic lavas, pyroclastic deposits, volcanic tuffs, and hypabyssal intrusions, dated from the Upper Cretaceous to the Oligocene (Pride et al., 1990). Overall, the lithology of Keller Peninsula is dominated by igneous rocks, including andesitic-basalts, basaltic-andesites, diorites, pyritized-andesites, and tuffites, as well as undifferentiated Quaternary deposits comprising local material and sediments reworked by marine erosion (Fig. 2A). Marine terraces characterize the lower landscape, while andesitic-basalts and basaltic-andesites predominate in the upper sectors. Pyritized-andesites occur in various topographic positions, tuffites typically occupy intermediate elevations, and diorites appear sporadically in isolated outcrops. These data supported the interpretation of bedrock as a key soil-forming factor, particularly in the mobilization and spatial distribution of radionuclides (238U, 232Th, and 40K) in surface soils. The mineralogical composition of the parent material, especially the presence of Fe-bearing silicates and accessory minerals, influenced the geochemical dynamics of secondary ferrimagnetic mineral formation and the inheritance of primary minerals. The spatial relationship between sampling points and lithological boundaries was assessed using a detailed lithological map, revealing distinct geological compartments corresponding to variations in landscape relief.
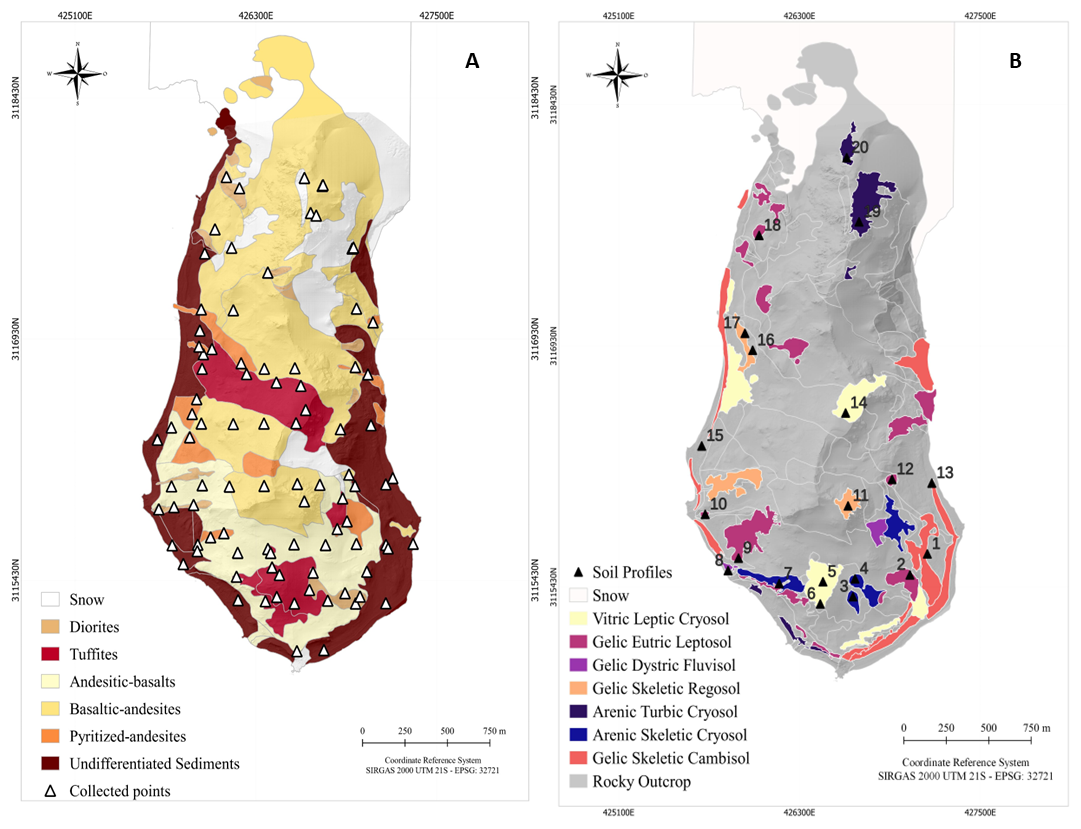
Figure 2The maps indicated: (A) Lithology (adapted from Birkenmajer, 1980). (B) Soil classes: The lithological and soil classes maps were adapted from Francelino et al. (2011).
The weather in Maritime Antarctica follows a typical pattern, albeit slightly warmer, as outlined by Rakusa-Suszczewski (2002). Summer (December–March) temperatures average around +1.6 °C, whereas winter (June–September) temperatures drop to an average of −5.3 °C (INPE, 2009). Annual precipitation is around 400 mm. The Keller Peninsula spans elevations between 0 and 380 m above sea level, featuring a diverse topography from flat to steep (slopes ranging from 0 to 75 %). This region is characterized by various landforms like moraines, protalus, inactive rock glaciers, uplifted marine terraces, and Felsenmeer. These lithological features have formed due to both paraglacial and periglacial conditions, as discussed by Francelino et al. (2011).
The lower portions of the landscape consist mainly of marine terraces. At intermediate elevations, lithified pyroclastic deposits, known as tuffites, are predominant. These tuffites are characterized by volcanic glass shards, plagioclase, and pyroxene crystals, as well as lithic clasts embedded in a fine ash matrix. They frequently exhibit varying degrees of alteration, including chloritization and sericitization, and may be cemented by secondary silica or calcite (Nawrocki et al., 2021).
Above the tuffites, extensive outcrops of andesitic-basalts and basaltic-andesites dominate the upper landscape. These volcanic rocks primarily consist of labradorite-andesine phenocrysts set within a groundmass of plagioclase, volcanic glass, and clinopyroxene (Nawrocki et al., 2021). Scattered throughout these units are occurrences of pyritized andesites, which have undergone significant post-magmatic hydrothermal alteration. This alteration transformed primary plagioclase and pyroxene into secondary minerals such as chlorite, albite, carbonate, and quartz. Additionally, quartz–pyrite mineralization developed within these andesites (Birkenmajer, 1980).
Less abundant and restricted to specific localized zones, diorite outcrops occur notably on Keller Peninsula. These diorites are composed mainly of plagioclase (andesine to labradorite), hornblende, and minor biotite, with accessory minerals such as magnetite, apatite, titanite, and zircon. The texture is generally coarse-grained and equigranular (Birkenmajer, 1980; de Morisson Valeriano et al., 2008).
Soil classification and mapping were carried out by an experienced pedologist, using 20 representative soil profiles. The overall soil development in the area is limited, and according to the World Reference Base for Soil Resources (WRB) (FAO, 2014), the soils in the region can be categorized into various types, including Gelic Eutric Leptosol, Gelic Skeletic Regosol, Gelic Skeletic Cambisol, Gelic Leptic Regosol, Gelic Dystric Fluvisol, Arenic Skeletic Cryosol, Vitric Leptic Cryosol, Gelic Leptic Cambisol, and Arenic Turbic Cryosol, as illustrated in Fig. 2B. The occurrence of permafrost was observed the first two meters below the soil surface in five soil profiles. Additionally, it is discontinuously found within the first two meters in regions with mid-slope and flat topography, all of which are classified as Cryosols (Francelino et al., 2011; Mello et al., 2023a). Within each soil profile, samples were meticulously collected from identified diagnostic soil horizons at various soil depths to facilitate subsequent physico-chemical analyses.
The sampling design and the selection of measurement locations were conducted while considering mainly 5 topossequences (topographic gradients) that account for various lithologies and soils. The distribution of collection points by the proximal γ-ray and magnetic susceptibilimeter is shown in Fig. 1. The readings with the sensors were carried out, taking into account the lithological diversity of the Peninsula, as well as pedological diversity and variations in relief.
2.2 Pedogeophysical survey, radiometric and κ characterization
The pedogeophysical variables (radiometric and κ), were collected using proximal geophysical sensors, RS-230 and KT-10 Terraplus, respectively (Fig. 1A and B, respectively). The radiometric data (γ-ray spectrometry) correspond to the acquisition of radionuclide contents eU, eTh and 40K, quantified in ppm (eU and eTh) and % for 40K. Magnetic susceptibility is given in 10−3 SI units and the sensor is able to detect mean κ values to a depth of 2 cm below the rock outcrops surface (Sales and Terraplus, 2021). Detailed calibration methods, method of collection and interpretation of results can be found in (Mello et al., 2021, 2022a, b).
Gamma spectrometric readings (Fig. 1C) were taken on the rock outcrop surface and soil depth (saprolite/rock), at the 91 collection points shown in Fig. 1, in “essay mode”, which provides greater precision, and the reading time was adjusted to 3 min at each point. The sensor is able to detect radiation up to a mean depth of 30–60 cm depending on the characteristics of the substrate (Beamish, 2015; Taylor et al., 2002; Wilford et al., 1997). Subsequently, the equipment data were transferred to a computer and concatenated with soil κ values and environmental data (lithology and terrain attributes).
Similarly, the κ survey readings (Fig. 1D) was undertaken at each of the 87 points to a mean depth of 2 cm below the rock outcrops surface and soil depth (saprolite/rock). Three readings were taken for each point to reduce sensor noise and increase the precision reading and, the κ mean values of these three readings were used in data processing. The resulting κ data were then combined with their respective γ-ray spectrometric data, lithology and terrain attributes in order to be processed.
All readings were carried out in different lithological-pedological compartments, with emphasis on in situ materials (igneous rocks), despite of the little presence of marine terraces with presence of external materials.
It is important to highlight that only 87 points with geophysical sensors were taken on pedological substrates. Furthermore, these few points are found in soils with little pedogenetic evolution, characterized by a high content of rock fragments and a predominance of the coarse fraction composed of cryoclastic rocks (many with a skeletal character). Additionally, where there was soil, we opened a small trench and carried out geophysical readings at the base of the soil profiles, in direct contact with the rock. As a result, we do not have enough number of points to carry out an analysis to identify differences between surface geophysical variables and pedological substrates. Therefore, we consider these points as readings carried out on the lithological substrate.
2.3 Digital Elevation Model
Geoprocessing and Digital Elevation Model (DEM) analysis were conducted utilizing R software version 4.10 version (R Core Team, 2023), employing data derived from a High-Resolution Topography (HRT) survey to create the DEM (Fig. 1). The HRT survey, conducted during the 2014/2015 and 2015/2016 periods, utilized a Terrestrial Laser Scanner (TLS) of the RIEGL VZ-1000 model, known for its nominal accuracy and precision of 8 and 5 mm, respectively (Schünemann et al., 2018). This advanced sensor and geoprocessing methodology yielded a low root mean square error and a high number of points per cell, resulting in a densely populated point cloud. This dataset facilitated a comprehensive generalization process to generate surface models with superior performance, accurately representing local relief. This, in turn, enabled in-depth studies of landscape evolution at a micro scale over time, specifically allowing for the assessment of pedogeomorphological processes.
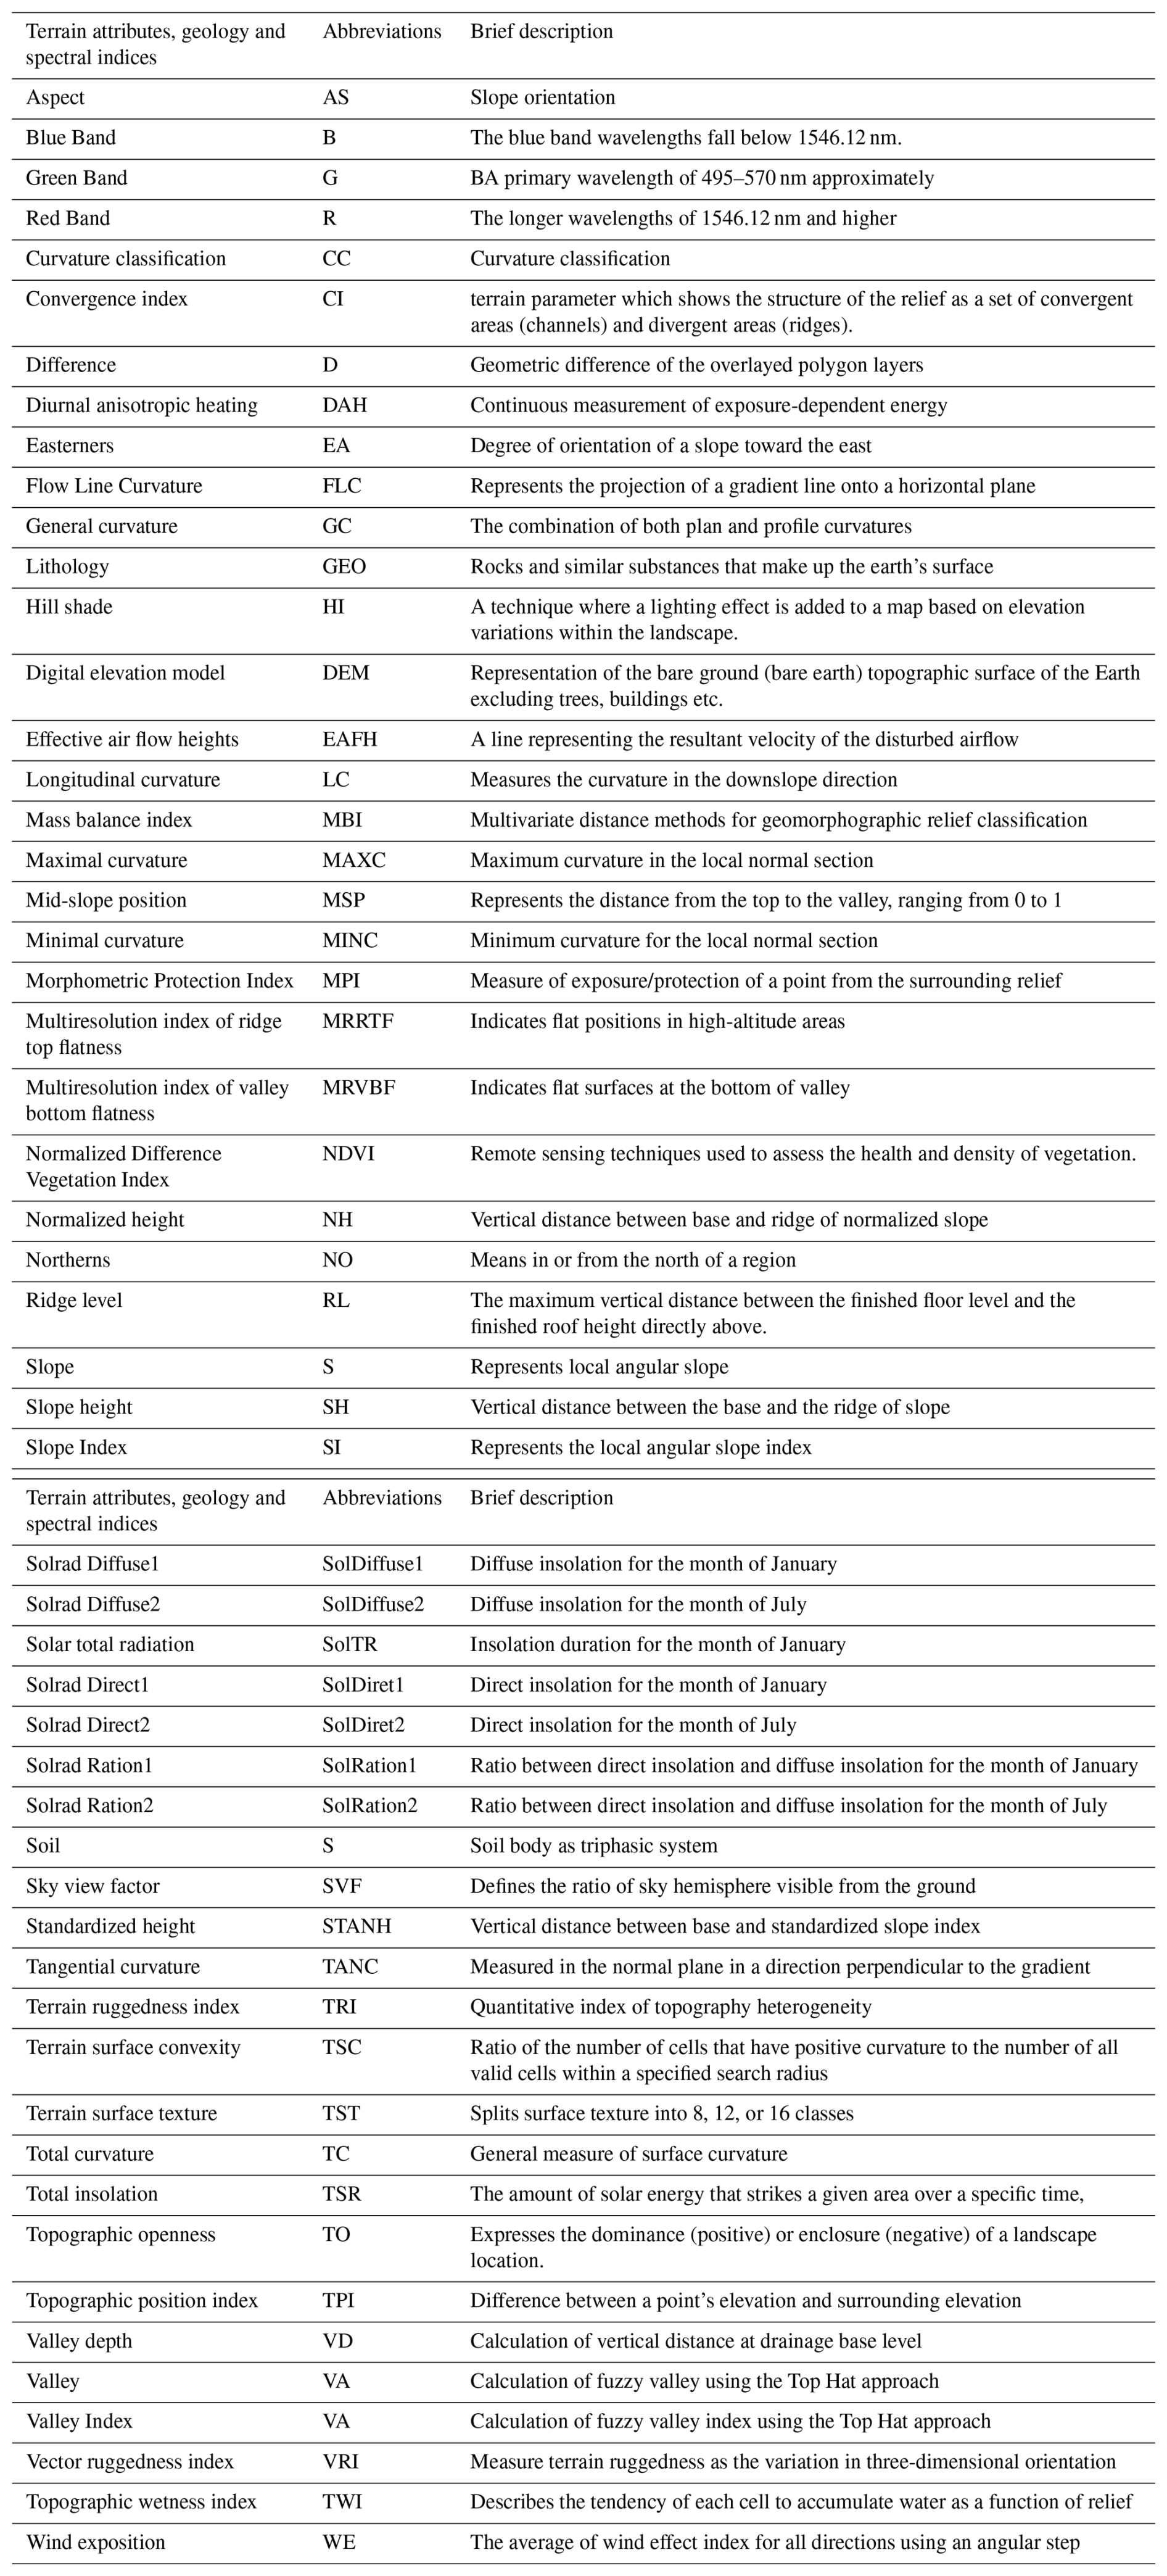
Using the R software (R Core Team, 2023), a total of forty-eight additional topographic attributes were computed based on the DEM data extracted from the Digital Terrain Model (DTM) (Table 1). These attributes were derived using the utilization of the “Rsaga” tool (Brenning, 2008) and the “raster” package (Hijmans and Van Etten, 2016).
Table 1Terrain attributes generated from the digital terrain model, geology, soil and spectral indices.
2.4 Modeling processes and statistical analysis
The point values of eU, eTh, K40, and κ, linked with terrain attributes, soil type, lithology, and RGB (Table 1), were utilized to modeling these variables for other areas, employing the Random Forest (RF) algorithm. The modeling process comprises two main steps: covariate selection and model tuning/performance evaluation. During the covariates the selection phase, the algorithm aims to generate an optimal set of covariates, adhering to the principle of parsimony. This involved two sequential methods, we initially removed self-correlated variables and subsequently assessed the importance of the remaining variables.
Initially, to assess the correlation between variables, we used a Spearman correlation cut-off limit . We eliminated one variable from each pair showing correlations above the established threshold. To decide which variable to remove, we selected the one with the highest sum of absolute correlations with the remaining covariates in the dataset. To carry out this phase, we employed the “cor” and “findcorrelation” functions from the “stats” (Hothorn, 2021) and “caret” (R Core Team, 2020) packages in the R software, respectively (Kuhn and Johnson, 2013). The covariates that successfully passed this selection phase were combined with the samples and, subsequently, the samples were separated into training and test sets.
To partition the data into training and test subsets, we adopted the “nested leave-one-out cross-validation” (nested LOOCV) method (Ferreira et al., 2021; Paes et al., 2022; Rytky et al., 2020). It is noteworthy that the number of samples and readings obtained from geophysical sensors was limited (92) due to various challenges encountered during data collection in the field (e.g., sloping terrain, high hazard areas, glaciers, steep terrain, snowbanks, etc.). Given the small sample size, the nested LOOCV method was chosen, as this method has already been recommended by other authors in similar cases (Ferreira et al., 2021; Mello et al., 2022a, b, c). This particular approach represents a significant innovation in our research.
The nested LOOCV approach involves a double looping process. In the first loop, the model is trained on a dataset of size n−1, and in the second loop, testing is performed using the omitted sample to evaluate the training performance (Jung et al., 2020; Neogi and Dauwels, 2019; Mello et al., 2025). The final machine learning algorithm performance results are calculated as average performance indicators across all points (training/testing). This method proves to be robust in evaluating the real generalization ability of the algorithm and in identifying possible problematic samples or outliers in the data set. Each iteration generates a training set that undergoes covariate selection by importance and subsequent training.
The covariate selection based on importance is executed using the backward-forward method, employing the Recursive Feature Elimination (RFE) function available in the “caret” package (Kuhn and Johnson, 2013). This RFE technique is algorithm-specific and yields an optimal set of covariates utilized in predicting the final model for each respective algorithm (Moquedace et al., 2024). RFE is a selection procedure that iteratively removes variables contributing the least to the model, employing an importance measure tailored to each algorithm (Kuhn and Johnson, 2013).
The algorithm is then trained on discrete subsets of variables, going from 2 to the total variables one by one. The ideal subset of covariates is optimized based on the leave-one-out cross-validation (LOOCV), for each of the internal hyperparameters of the tested algorithms (10). The hyperparameters for each algorithm are described in the caret package manual, Chap. 6, “Described Models”, available at https://topepo.github.io/caret/train-models-by-tag.html (last access: 11 November 2025). The Mean Absolute Error (MAE) was used as a metric to select the best subset for the RF algorithm.
Training is then performed using the previously selected variables and tested with LOOCV. Additionally, ten values of each RF hyperparameter were evaluated. At the end of the training phase, predictions are made on samples not used in the training process, and the results are saved for performance analysis. The assessment of algorithm predictions and sensor sets is carried out using a collection of samples from the outer loop within the nested Leave-One-Out Cross-Validation (LOOCV) method. Three key evaluation parameters are utilized: Concordance Correlation Coefficient (CCC) (Eq. 1), Root Mean Square Error (RMSE) (Eq. 2), and Mean Absolute Error (MAE) (Eq. 3) (Lin, 1989).
Where: n represents the number of samples; ρc is the correlation coefficient between the two variables; μx and μy are the means for the two variables; and are the corresponding variances; Pi and Oi represent the predicted and observed values at location i.
Where: Qpred = the mean of the training samples; = the validation sample; n = number of samples (loop).
As additional validation, we used the “null model” approach (NULL_RMSE and NULL_MAE). This null model involves using the mean value determined from the collected samples (Eqs. 4 and 5). The null model represents the simplest possible model when given a training set, providing a single average value for numerical results.
The null model serves as a reference and can be seen as the simplest adjustable model. Any other models that present similar or inferior performances in relation to the null model must be discarded. This indicates that the final model outperforms the use of average values, highlighting its superior quality in model creation. Furthermore, the null model approach is widely employed, especially in spatialization processes such as kriging, where the variable under consideration exhibits spatial dependence, often called the pure nugget effect. The equations used for NULL_RMSE and NULL_MAE calculations are as follows:
Where: Qtrain = the mean of the training samples; = the validation sample; n = number of samples (loop).
The NULL_RMSE and NULL_MAE values were computed using the nullMode function within the caret package (R Core Team, 2020). To assess the overall performance of the algorithms for each attribute, a total of 87 loops were conducted. The training results represent the average performance, and the test sample results were calculated from the 87 outer loops using Eqs. (1), (2), and (3).
Eighty-seven maps were predicted, yielding one map for each execution of the outer loop in the nested Leave-One-Out Cross-Validation (LOOCV). Coefficient of Variation (CV) was calculated for each pixel across the 87 stacked maps. Additionally, a coefficient of variation map (CV% = standard deviationmean) was generated to illustrate the variation of predicted values in each pixel of the map relative to the mean. Spatial predictions exhibiting lower CV indicate more consistent results, thereby resulting in smaller errors in the estimation/predictions and reduced uncertainty.
The statistical differences between the pedogeophysical variables and lithology substrates were analysed by using the Kruskal-Wallis and Dunn's posthoc tests with a significance level of 5 %.
3.1 Model's performance and variables' importance
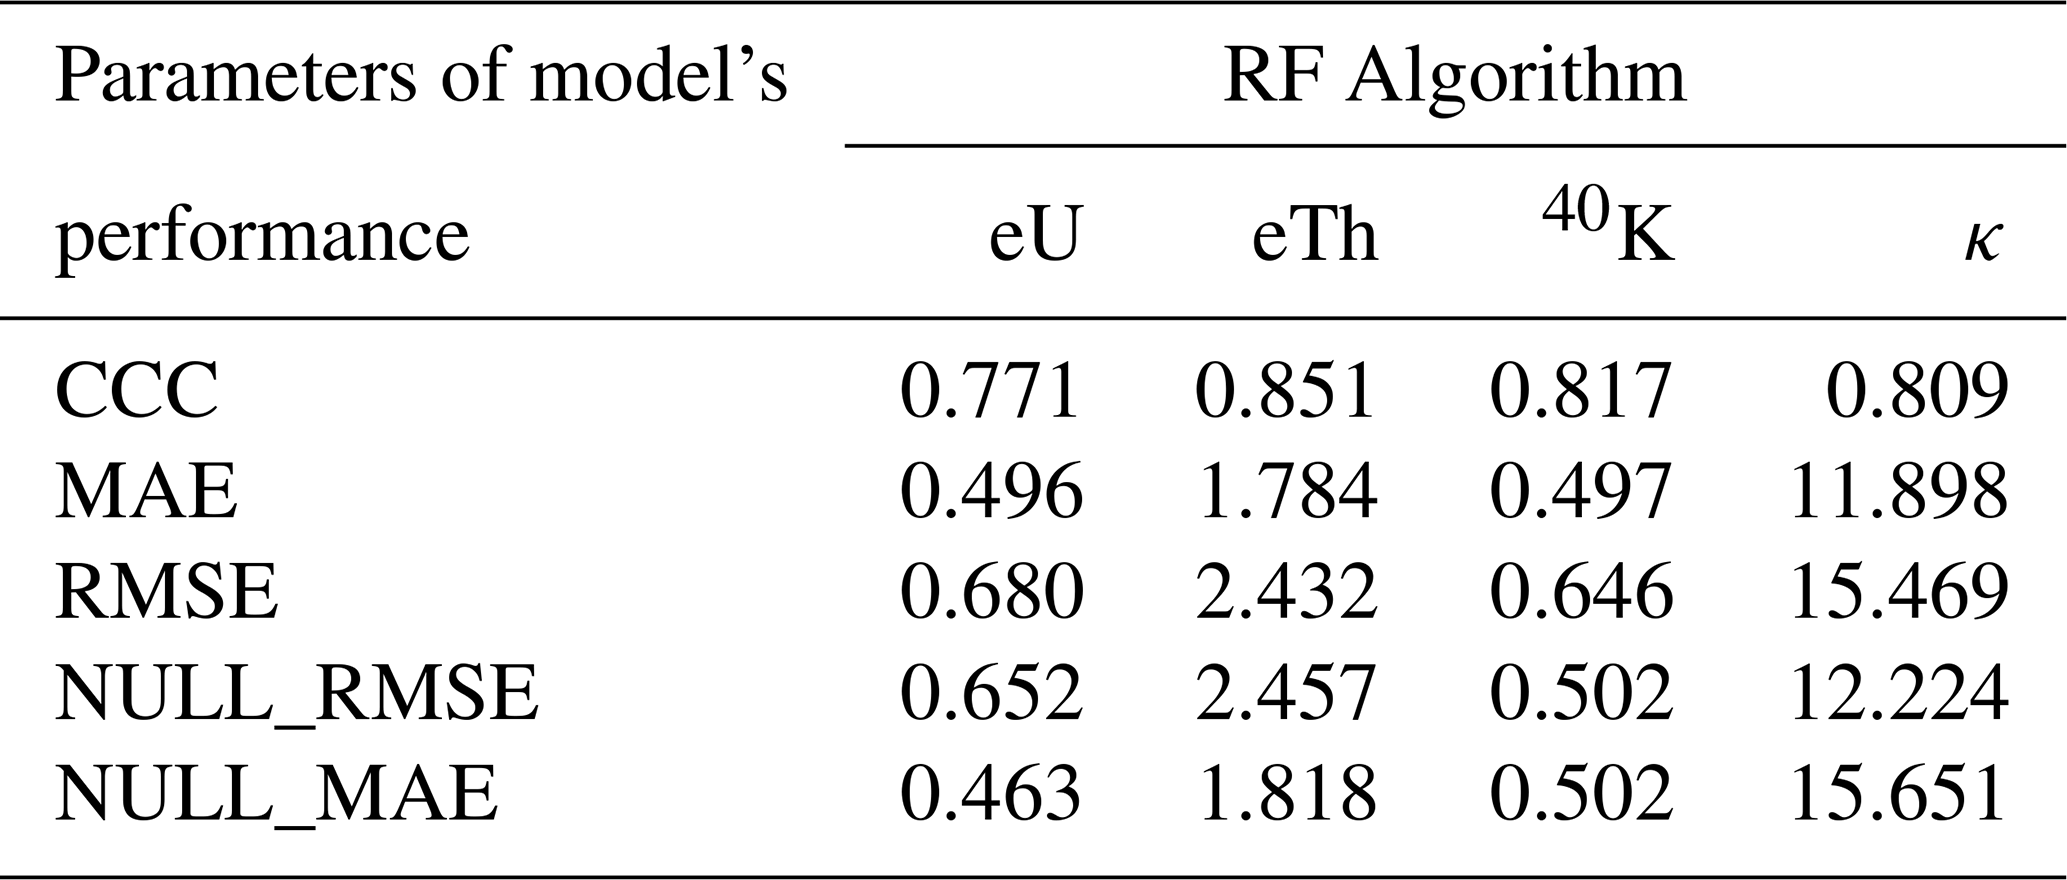
The Random Forest (RF) algorithm was employed to predict γ-ray data and magnetic susceptibility of the substrate, enabling the production of ternary γ-ray and κ maps (Table 2). The Concordance Correlation Coefficient (CCC) values ranged from 0.771 to 0.851 (Table 2). The CCC is a modified version of the coefficient of determination (R2); in addition to measuring the strength of correlation, it also assesses how closely the model predictions align with the 1 : 1 line (a 45° line from the origin). This feature makes the CCC a robust metric for evaluating both the precision and accuracy of predictions (Svensson et al., 2022; Zhao et al., 2022). Unlike the Pearson correlation coefficient, the CCC can detect systematic bias in model outputs. This key distinction makes it a more appropriate choice for model validation than R2 (Khaledian and Miller, 2020). In recent geoscience studies, CCC has been effectively used to assess the performance of machine learning algorithms (Chen et al., 2019a, b; Feng et al., 2019; Khosravi et al., 2018; Mishra et al., 2022; Siqueira et al., 2023; Zhou et al., 2022). In addition, the nested-LOOCV methodological framework was better than NULL-model (Table 2), for prediction of radionuclides and magnetic susceptibility with a limited number of samples. This approach consistently generated comparable maps across loops, where 87 samples were utilized for training in each loop, and at the conclusion of the process, all samples were used as the test dataset. As a result, the models and/or coefficients of variation in the maps were similar (Ferreira et al., 2021).
Table 2Model's performance in terms of Concordance Correlation Coefficient (CCC), Root Mean Squared Error (RMSE), Mean Absolute Error (MAE), NULL_RMSE and NULL_MAE.
The importance of covariates in predicting pedogeophysical variables revealed that morphometric attributes such as minimal curvature (MINC), mid-slope position (MSP), diurnal anisotropic heating (DAH), difference (D), total insolation (TSR), flow line curvature (FLC), effective air flow heights (EAFH), terrain surface convexity (TSC), hill shading (HI), aspect (AS), mass balance index (MBI), ridge level (RL), digital elevation model (DEM) minimal curvature (MINC), and convergence index (CI) were the most influential, collectively contributing to over 50 % of the reduction in mean prediction error (Fig. 3). In contrast, lithological variables contributed less significantly, accounting for less than 50 % of the predictive importance (Fig. 3). Similar results were reported by Cracknell and Reading (2014), Harris and Grunsky (2015), and Kuhn et al. (2018), who also achieved satisfactory performance using the RF algorithm to predict radionuclide content and magnetic susceptibility for lithological mapping. In addition, the Red Band (R) and Green Band (G) were found to be important for predicting 40K concentrations in more than 75 % (Fig. 3). In periglacial Antarctic environments characterized by shallow soils, rugged terrain, sparse vegetation, and exposures of mafic and felsic igneous rocks (Francelino et al., 2011), VIS-NIR reflectance predominantly captures variations in surface mineralogy and soil exposure. Landscape dynamics such as erosion and deposition are largely controlled by relief (Viscarra Rossel, 2011). At our study site, exposed mineral surfaces on steep slopes and weathered areas exhibit strong red band reflectance, making this spectral band a valuable proxy for modelling the spatial distribution of 40K when integrated with topographic and lithological data within machine learning frameworks.
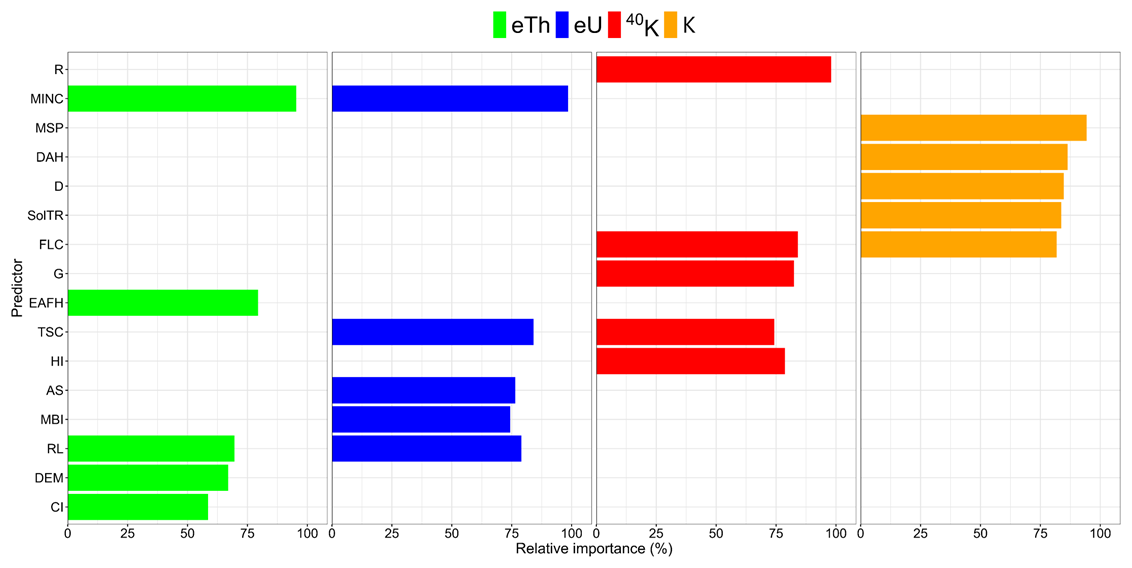
Figure 3Importance of variables of predictors. x axis: variables that most contributed to the predictive models. Axis y: value in relative percentage of the contribution. eTh: equivalent thorium; eU: equivalent uranium; 40K potassium; κ: magnetic susceptibility; The predictors included in the analysis were: Red Band (R); Minimal curvature (MINC); Mid-slope position (MSP); Diurnal anisotropic heating (DAH); Difference (D); Solar total radiation (SolTR); Flow line curvature (FLC); Green Band (G); Effective air flow heights (EAFH); Terrain surface convexity (TSC); Hill shade (HI); Aspect (AS); Mass balance index (MBI); Ridge level (RL); Digital elevation model (DEM); and Convergence index (CI). Colours represent the target variable: green for eTh, blue for eU, red for 40K, and orange for κ.
3.2 Radionuclides and κ contents on lithological compartments and their relationship with mineralogy
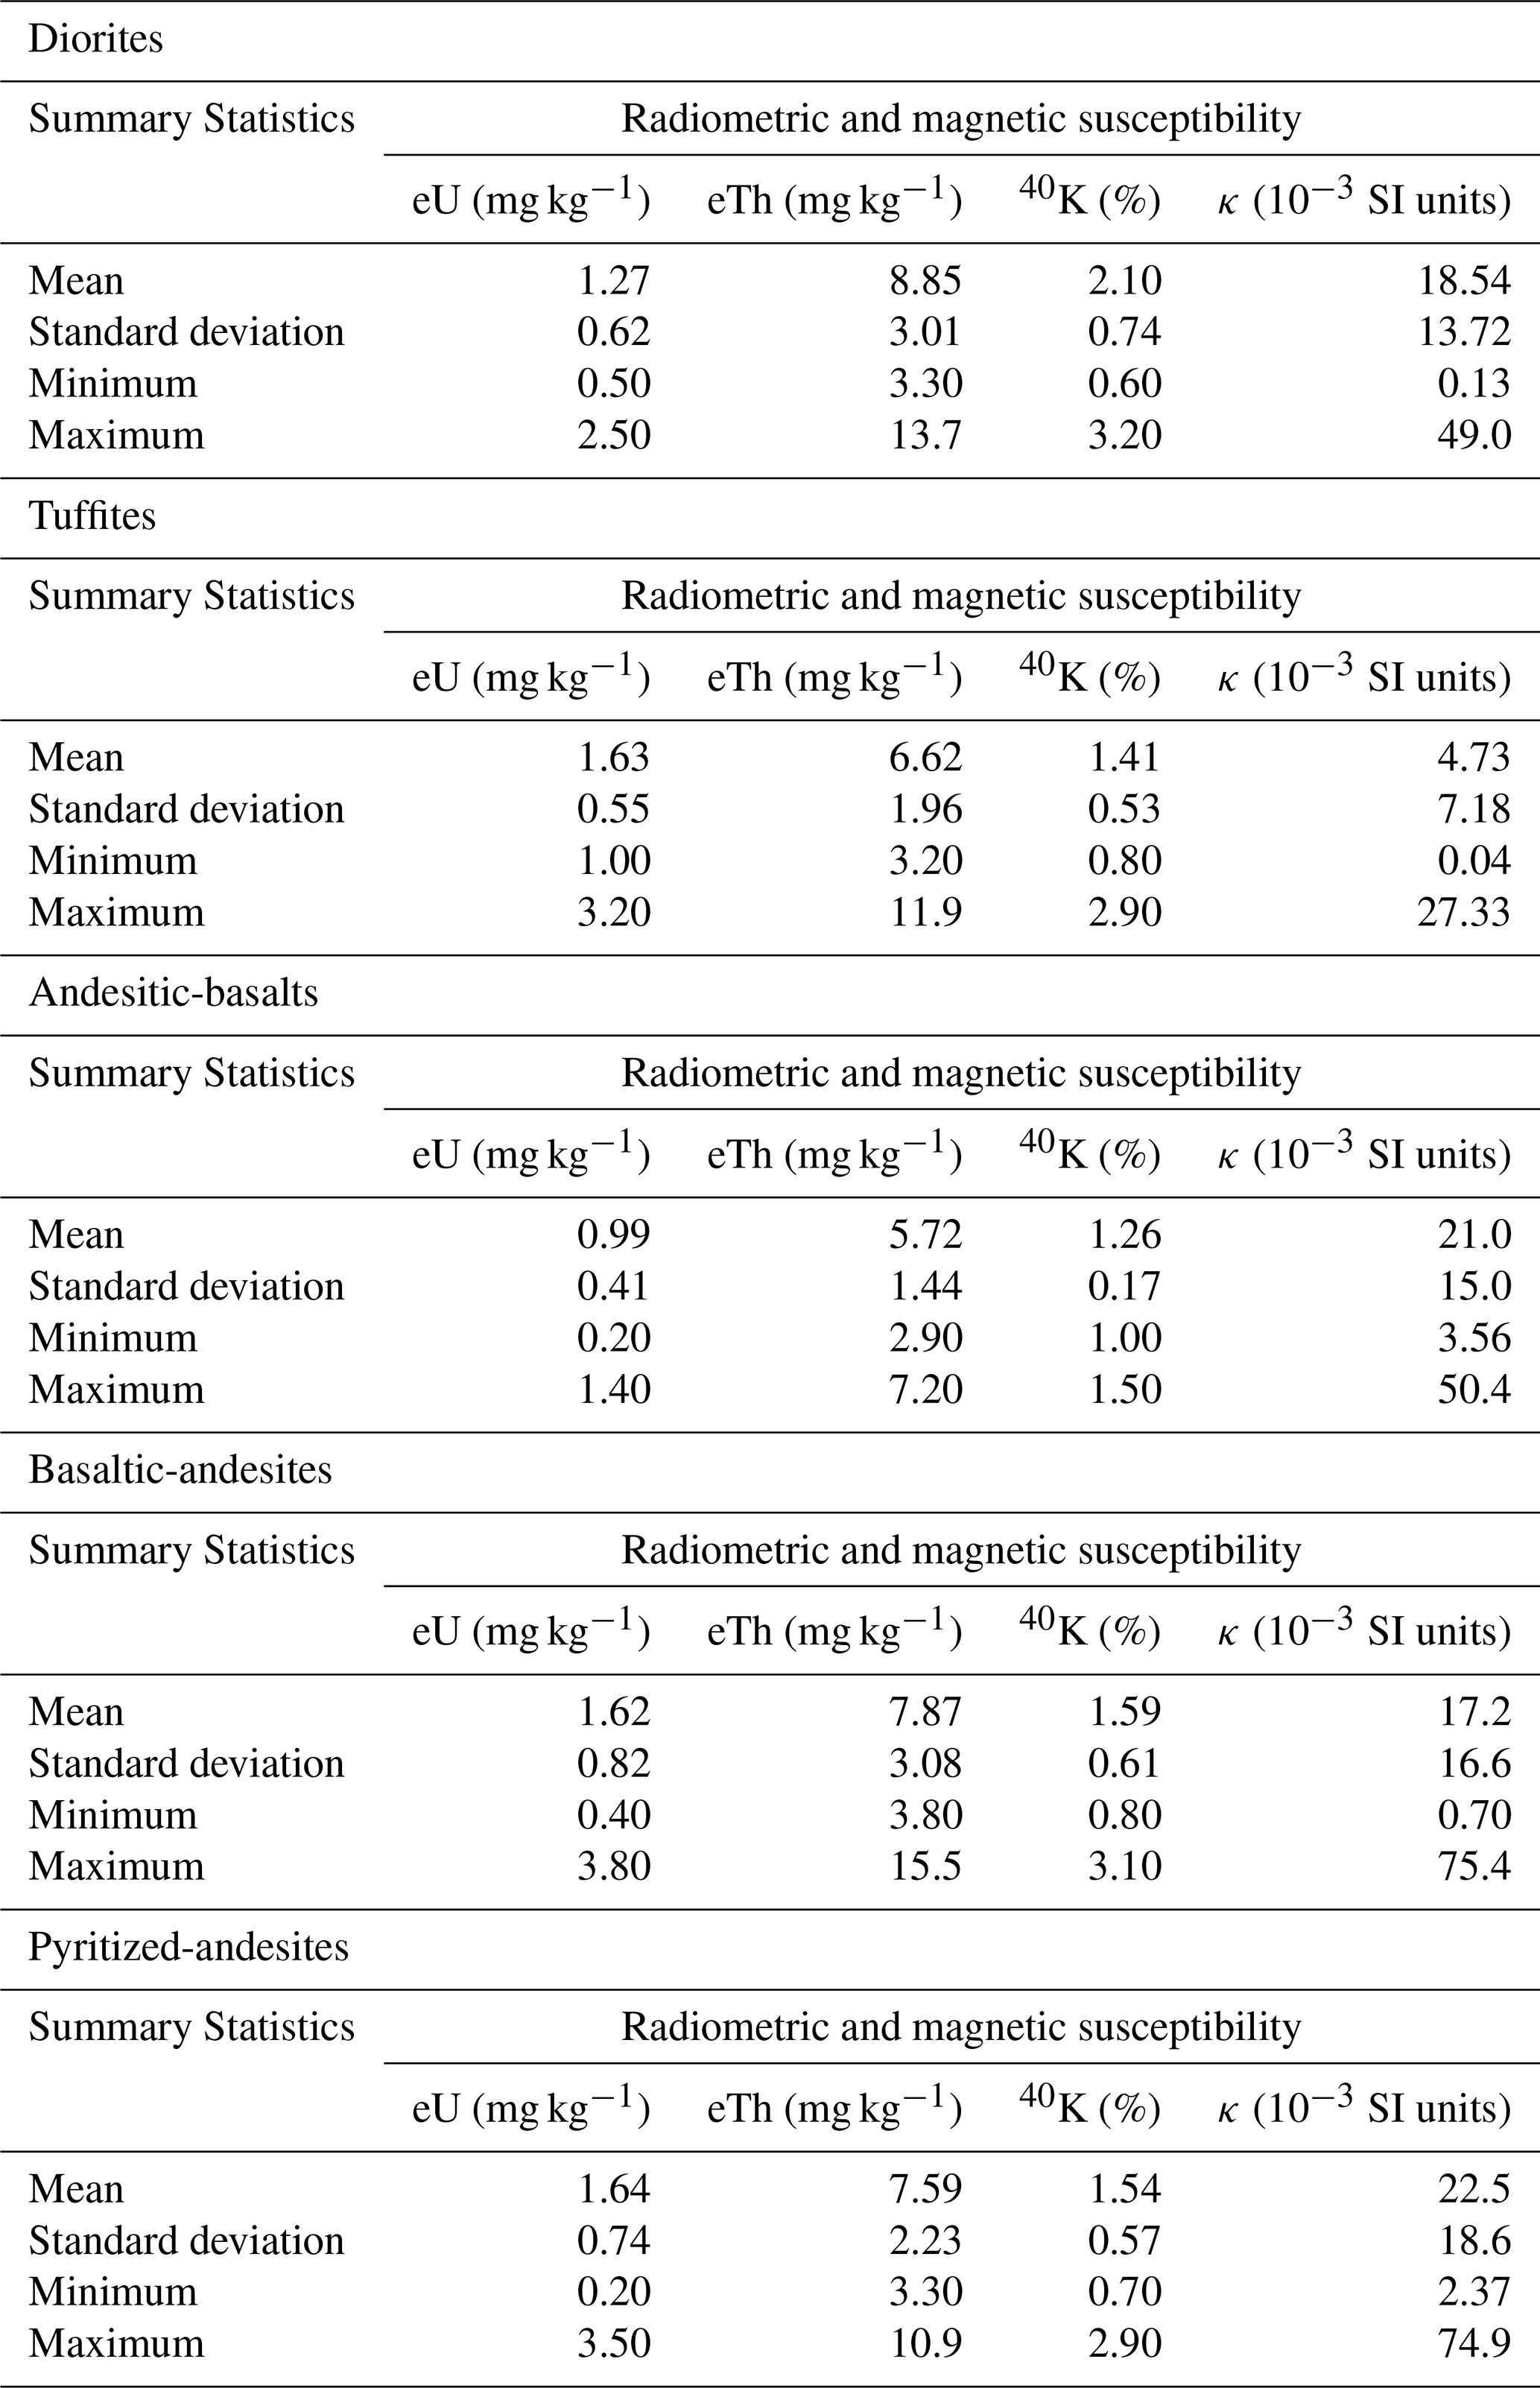
The eU mean content was generally low and showed the greatest variation on the lithologies (Fig. 4). The highest eU mean content values were observed on tuffites and the lowest on andesitic-basalts (Fig. 4). The diorite presented the highest mean eTh contents, while the andesitic-basalts showed the lowest one. Regarding the 40K, the mean values were high in all lithologies (>1 %) excepted on pyritized-andesite (Fig. 4). However, the observed 40K were low compared to those of continental crust rocks (plutonic, metamorphic and sedimentary. According to literature these values are consistent with the average of oceanic crust rocks, which are predominantly basaltic. The highest 40K contents were observed on diorite, and the lowest one on pyritized-andesite (Fig. 4). The mean κ values ranged from moderate to low in all lithologies, where pyritized-andesites showed the highest mean values and tuffites the lowest (Fig. 4). The descriptive statistics for radionuclides and κ content for all lithological units are shown in Table 3, and corroborates and complements the information provided in Fig. 4 in quantitative terms.
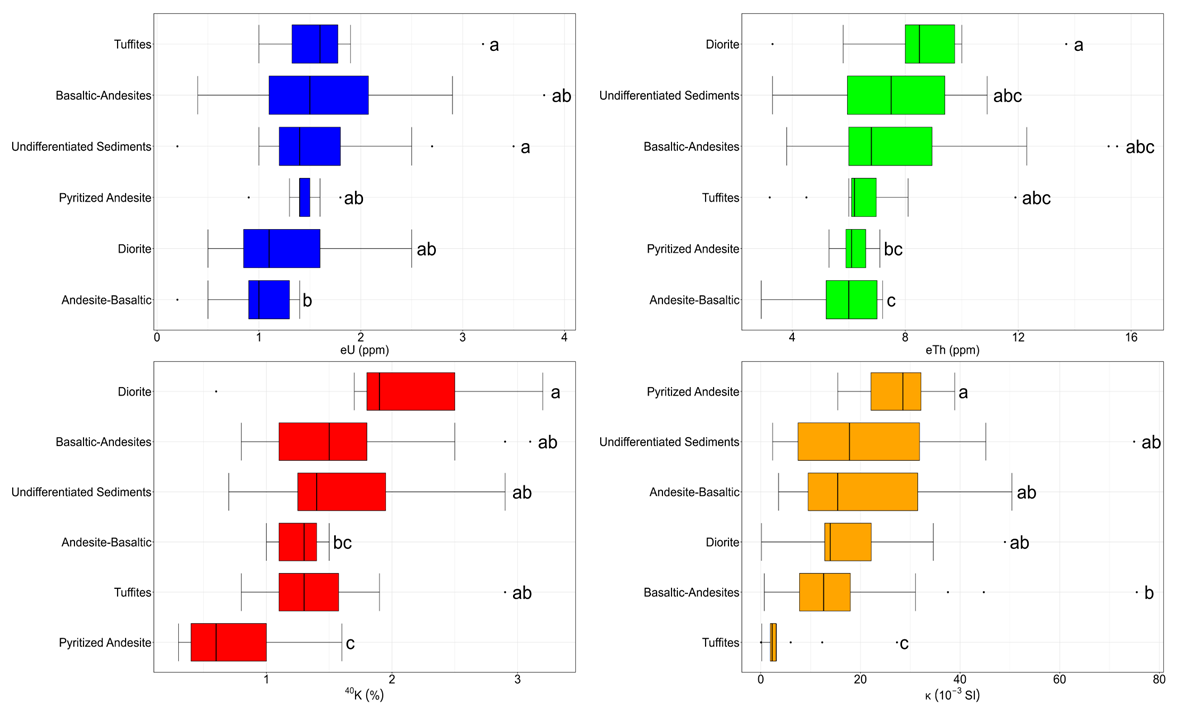
Figure 4Boxplot with descriptive statistics of the distribution of radionuclide contents and magnetic susceptibility by lithology. Lowercase letters to the right of the boxplot bars indicate statistical differences as determined by the Kruskal-Walli's test.
Table 3Descriptive statistics for the analyzed radionuclides and κ by lithology.
In our study area, the high variability in eU content and/or the relatively low concentrations observed in basic–intermediate igneous rocks (Fig. 4, Table 3) can be primarily explained by the fact that uranium and other radionuclides are typically concentrated during the late stages of magmatic crystallization. As a result, mafic rocks, which crystallize earlier in the magmatic sequence, are expected to exhibit lower radionuclide contents (Ragland et al., 1967; Whitfield et al., 1959). In addition, according to Wilford and Minty (2006) and Wilford et al. (1997), the mean contents of radionuclides in the Earth crust vary to 2.3 %, 3 ppm and 12 ppm, for 40K, uranium and thorium, respectively, similar to the values observed in our study site.
The eTh and 40K contents tended to increase with an increase in the silicon content in our lithology composed by igneous rocks (from andesitic-basalts to diorite) (Fig. 4, Table 3). Our results are corroborated by Dickson and Scott (1997) and Mello et al. (2023b), who found an increasing in eTh and 40K contents in acid-felsic igneous rocks and lower levels in basic-mafic igneous rocks. It is noteworthy that the undifferentiated sediments receive materials from various parts of the Peninsula and from outside it, in which case it is not appropriate to use this lithology for radionuclides comparison purposes. Most of the γ-ray radiation detected and quantified by the sensor originates from the first 45–60 cm of the dry substrate (rocks, soils and sediments), which the mineralogy and geochemistry of the substrate presented the greater contribution to radionuclides contents (Gregory and Horwood, 1961). In addition, Earth surface processes and landforms such as chemical weathering, pedogenesis and relief affect radionuclide contents, since 40K content decreases with weathering advance once it is removed by destruction of feldspars. Also, 40K is not incorporated in secondary minerals, so it is leached, whereas Th composes highly resistant minerals, such as ilmenite and zircon. Consequently, Th content increases with weathering (Dickson and Scott, 1997; Wilford et al., 1997b; Mello et al., 2021, 2022a, 2023c). Despite this, physical weathering in this environment associated with periglacial processes (governed by cycles of freezing and thawing of water in the different portions and types of substrates) should not be neglected, since during these processes, radionuclides are redistributed in the landscape.
The low mean κ values were not expected on basic mafic igneous lithologies (basaltic-andesite, andesitic-basalts) (Fig. 4, Table 3), since there is a great probability to these rocks present more abundance of ferrimagnetic minerals in the rock. According to Mullins (1977) increasing in ferrimagnetic mineral contents in the substrate results in increases in κ values. The relatively low κ values in the basaltic-andesite and andesitic-basalt substrates may be attributed to the combined influence of the Antarctic cold climate, limited water availability, and slow pedogenesis, which favor the formation of amorphous or poorly crystalline iron oxides, even in lithological substrates with sufficient iron content, such as ferrihydrite, rather than well-crystalline magnetite or maghemite. Despite this, κ values remains highly heterogeneous, except for the tuffites, no statistically significant differences were observed among the other lithologies, including the marine terraces. Regarding the low κ values on tuffite, this igneous rock is formed from volcanic ashes and containing large amounts of poorly crystalline minerals (Fabris et al., 1995), which is difficult to form ferrimagnetic minerals. Poggere et al. (2018), also found low magnetic signature on soil formed from tuffites in Brazilian soils with contrasting rock parent material.
The greater κ values on pyritized-andesites (Fig. 4, Table 3), can be explained by the presence of pyrite and hydrothermal alteration process (Passier et al., 2001). Hydrothermal processes in island-arc settings, similar to the study area, can lead to the formation of hydrothermal magnetite. As hydrothermal fluids, heated by magmas, circulate through permeable rocks, they dissolve minerals and subsequently precipitate iron oxides, such as magnetite, in response to changes in fluid temperature, pressure, and chemistry (Nawrocki et al., 2021; Sillitoe, 2010). In addition, some of the elevated κ values may result from the formation of pyrite in pyritized andesites, along with the development of ferrimagnetic minerals such as pyrrhotite and magnetite within the rock.
3.3 Ternary γ-ray and magnetic susceptibility predicted maps, radionuclides content and κ variability at landscape scale
The predicted maps of 40K, eTh, and eU are demonstrated in Fig. 5A, B and C, respectively. In addition, Fig. 5D and E demonstrate the high resolution predicted ternary γ-ray and magnetic susceptibility maps. Our initial focus lies on describing the interpretations of the three radionuclides in relation to the γ-ray response associated to lithological-pedological substrates found in the specific landscapes and geomorphic processes.
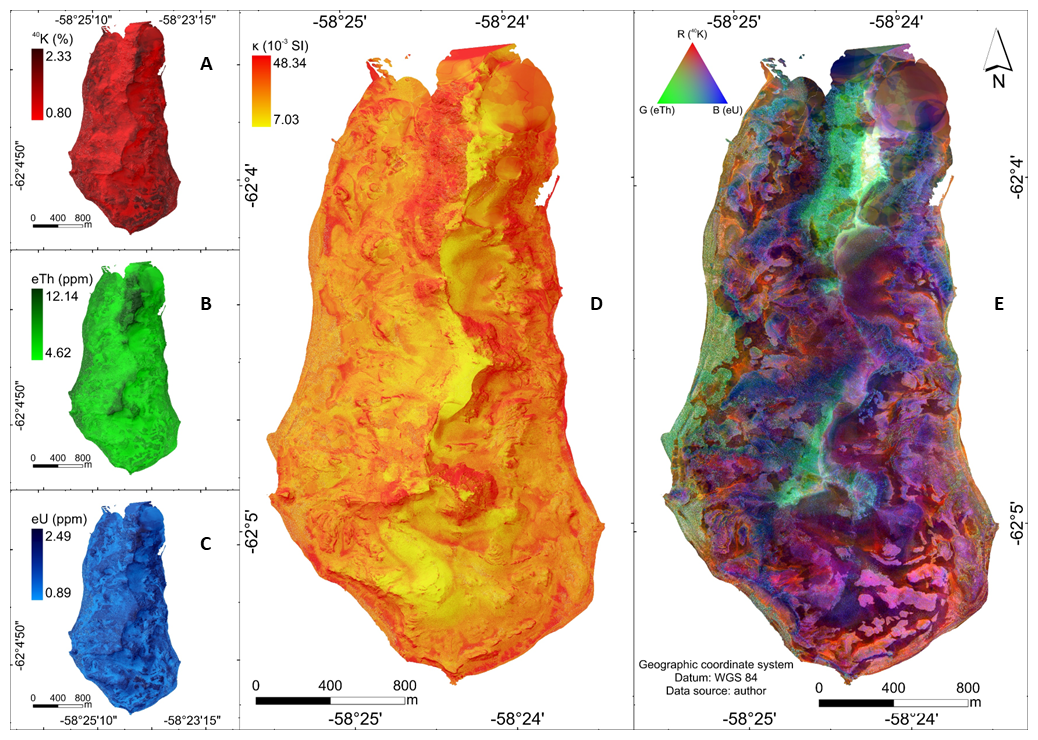
Figure 5(A) Predicted map of 40K; (B) Predicted map of eU; (C) Predicted map of eTh; (D) and (E) 3D landscape perspective and magnetic susceptibility and γ-ray ternary image, respectively over part of the Keller Peninsula. By integrating γ-ray spectrometric images with digital elevation models (DEMs) in 3D perspective views, a comprehensive visualization emerges, revealing intricate connections between γ-ray responses, terrain morphology attributes and surface processes (pedogeomorphological and periglacial).
The highest eTh values, predominantly represented by the green areas on the map, occur mainly over basaltic-andesite lithologies, rocks that are less mafic and richer in plagioclase and quartz (Fig. 5D). These regions coincide with flatter, high-elevation plateaus where deeper soils with higher clay content develop. The increased clay fraction enhances the adsorption capacity for eTh onto soil particle surfaces, thereby elevating eTh readings in these high plateau zones. In such areas, the spatial distribution and concentration of eTh are primarily controlled by lithology and pedogeomorphological factors.
In contrast, the western beach area, located at lower landscape positions, also exhibits elevated eTh levels associated with undifferentiated sediments (Fig. 5E). This pattern is explained by the geomorphological setting where fluvioglacial meltwaters originating from the high plateaus transport cryoclastically derived, eTh-rich sediments downslope. These sediments accumulate on the western beaches, demonstrating how erosive and depositional processes in a periglacial environment govern the distribution of eTh in this sector.
Regarding eU, the highest values are found on steep slopes characterized by shallow or absent soils, mainly over basaltic-andesites and andesitic-basalts lithologies (Fig. 5E). In these geomorphologically active areas, eU distribution largely reflects the chemical composition of the bedrock, indicating strong lithological and geomorphological control. Cryoclastically fractured and eroded materials are transported downslope by periglacial processes and deposited more evenly across lower plateaus, where eU concentrations reflect distinct source materials, in contrast to the focused sediment transport through fluvioglacial channels, which is responsible for eTh enrichment on the west beach. The 4 K values peaks predominantly in lower landscape positions, including lower plateaus and southeastern beaches, where andesitic-basalts and dioritic lithologies prevail (Fig. 5E). Conversely, pyritized-andesite zones show the lowest 4 K values, likely due to enhanced chemical weathering driven by natural acid drainage and sulfurization processes in local fluvioglacial channels. These processes accelerate potassium depletion, as observed in recent studies of sulfate-affected landscapes in Keller Peninsula (Mello et al., 2023c). Therefore, both lithological composition and pedogeochemical processes regulate 4 K distribution in the area.
Previous research (Wilford and Minty, 2006; Dickson and Scott, 1997) has demonstrated that combining ternary γ imaging with digital elevation models improves the interpretation of radionuclide spatial patterns by integrating lithological, soil, periglacial, and geomorphological influences (Mello et al., 2023b). Dickson and Scott (1997) showed that rock radioelement contents explain much of the γ radiation variability, while also highlighting intra-class heterogeneity – granites, for example, lack a unique radionuclide signature. Similarly, Rawlins et al. (2012) quantified that bedrock type accounted for 52 % of γ radiation variability across Northern Ireland. Felsic rocks generally exhibit elevated eU, eTh, and 4 K contents (Rawlins et al., 2007). Recent tropical environment studies (Ribeiro et al., 2018; Souza et al., 2021; Guimarães et al., 2021; Mello et al., 2020, 2021, 2022a, b) have linked radionuclide variability to lithology in areas with minimal pedogenetic alteration, to relief in erosion and sediment deposition zones, and to weathering and pedogenesis in well-developed soils. However, recent studies, including the first applications of γ spectrometry and magnetic susceptibility to Antarctic soils undertaken by Mello et al. (2023a, b), have suggested a strong influence of topography on the distribution of pedogeophysical variables, which were thoroughly detailed in this work.
Magnetic susceptibility (κ) values exhibit high spatial variability across lithologies, soils, and landforms, showing no consistent broad-scale pattern (Fig. 5D). Nonetheless, localized zones of elevated κ correlate with pyritized-andesite and andesitic-basalt lithologies, particularly on steep slopes or areas minimally influenced by sediment influx from other parts of the landscape. Conversely, hydrothermal alteration in pyritized andesites can enhance κ values as reported by Nawrocki et al. (2021) and Sillitoe (2010). This effect is further intensified by higher iron availability and chemical weathering, which together concentrate ferrimagnetic minerals and contribute to increased susceptibility values (Mello et al., 2023c).
The lowest κ values are observed in areas dominated by Cryosols, which are young soils with minimal pedogenetic development (Fig. 5D). Although pedogenetic processes can influence κ, the low magnetic susceptibility primarily reflects the lack of magnetite and other ferrimagnetic phases. The limited formation of secondary magnetic minerals appears less important for susceptibility differences than the accumulation of magnetite in more developed soils. This pattern aligns with findings by Daher et al. (2019), who reported low κ values in Antarctic soils derived from igneous rocks, attributed to their relatively young age and limited weathering.
The spatial distribution of radionuclides and magnetic susceptibility in Keller Peninsula (Fig. 5) results from a dynamic interplay between mineralogical characteristics of the bedrock, topographic controls on soil development and sediment transport, and active periglacial geomorphological processes. These factors collectively modulate the pedogeophysical signatures observed, producing patterns that cannot be solely attributed to lithology but rather to its modification through landscape evolution and pedogeochemical cycling.
Our results regarding the distribution of radionuclides across the landscape differ slightly from those commonly reported in the literature (Dickson and Scott, 1997; Mello et al., 2021; Wilford and Minty, 2006; Wilford et al., 2012), which typically reports a strong correlation between radionuclide concentrations and the parent material in poorly developed soils. Although the low chemical weathering intensity observed in our study area suggests that lithology should exert primary control, the presence of highly dissected terrain, steep slopes, and active periglacial processes including periglacial erosion, freezing-thawing cycles, and cryoturbation intensifies the influence of topography on the redistribution of radionuclides. As a result, in certain areas of Keller Peninsula, radionuclide concentrations in soils deviate from the expected values based solely on the underlying rock types. Practically all the relief variables are associated with the landform that control the surface periglacial and pedogeomorphological processes of the Keller Peninsula landscape. Periglacial erosion, glacial fluvial melt channels, freezing and thawing of the active layer of permafrost and solifluxion are the most frequent periglacial and pedogeomorphological processes in Keller Peninsula, as observed by Francelino et al. (2011) and López-Martínez et al. (2012). These processes promote the fragmentation, redistribution and mixing of materials in significant areas of the landscape (Mello et al., 2023a, b), which can contribute to variations in radionuclide and k values, as well as increase prediction errors in the points of greater occurrence of these processes, such as the sloping areas of the landscape (Mello et al., 2022c). The same periglacial processes and landscape dynamics also influence iron geochemistry. As a result, soils and areas underlain by mafic rocks such as basaltic-andesite and andesitic-basalt may exhibit relatively low concentrations of ferrimagnetic minerals, which is reflected in lower magnetic susceptibility readings (Fig. 4). The opposite can also occur; for example, soils developed over pyritized andesite show higher magnetic susceptibility values, indicating greater concentrations of ferrimagnetic minerals (Fig. 4).
The spatial patterns of natural radioactivity and magnetic susceptibility across Keller Peninsula are more strongly influenced by topography than by lithology. In steep, periglacially active terrains, geomorphic and pedogeomorphological processes such as cryoturbation, freeze–thaw cycles, and periglacial erosion promote the downslope transport and mixing of soil and minerals, resulting in the redistribution of radionuclides and ferrimagnetic minerals independent of bedrock type. Birkenmajer (1980)'s geological mapping and petrographic studies further support that variations in mineral assemblages, especially between lightly altered mafic rocks and hydrothermal zones, and the presence of secondary minerals such as zeolites, albite, and iron oxides contribute to these patterns. Consequently, pedogeophysical signals (e.g., eU, eTh, 4 K, and magnetic susceptibility) often reflect a mixed mineralogical signature redistributed by topographic and geomorphological dynamics, rather than a direct inheritance from the parent material. This may explain our observations such as unexpectedly low magnetic susceptibility over mafic rocks and elevated values over altered andesites, underscoring the dominant role of relief and periglacial processes in shaping pedogeophysical variability in Keller Peninsula.
3.4 Applicability of geophysical techniques on soil-lithological survey and understanding of periglacial processes
A relationship between radionuclide content/distribution and κ in the landscape in a digital elevation model are demonstrated in Figs. 6 and 7, respectively). Rock color variations between different lithologies were also observed in the field (Fig. 8). The content and distribution of radionuclides and κ are occasionally associated with the lithology of the area, making it difficult to establish a direct and generalist relationship between radionuclides and κ with the lithological units. This method allows for the estimation of apparent surface concentrations of naturally occurring radionuclides and their relationship with lithology, pedogeomorphological and periglacial processes (Mello et al., 2023b). By assuming that the absolute and relative concentrations of these radioelements vary significantly with lithology (Dickson and Scott, 1997; Wilford et al., 2016), γ-ray spectrometric surveys can be used effectively for lithological mapping (Elawadi et al., 2004). However, in this particular study, the surface lithology is difficult to be map due to multiple geomorphological and periglacial processes that operates in M.A.
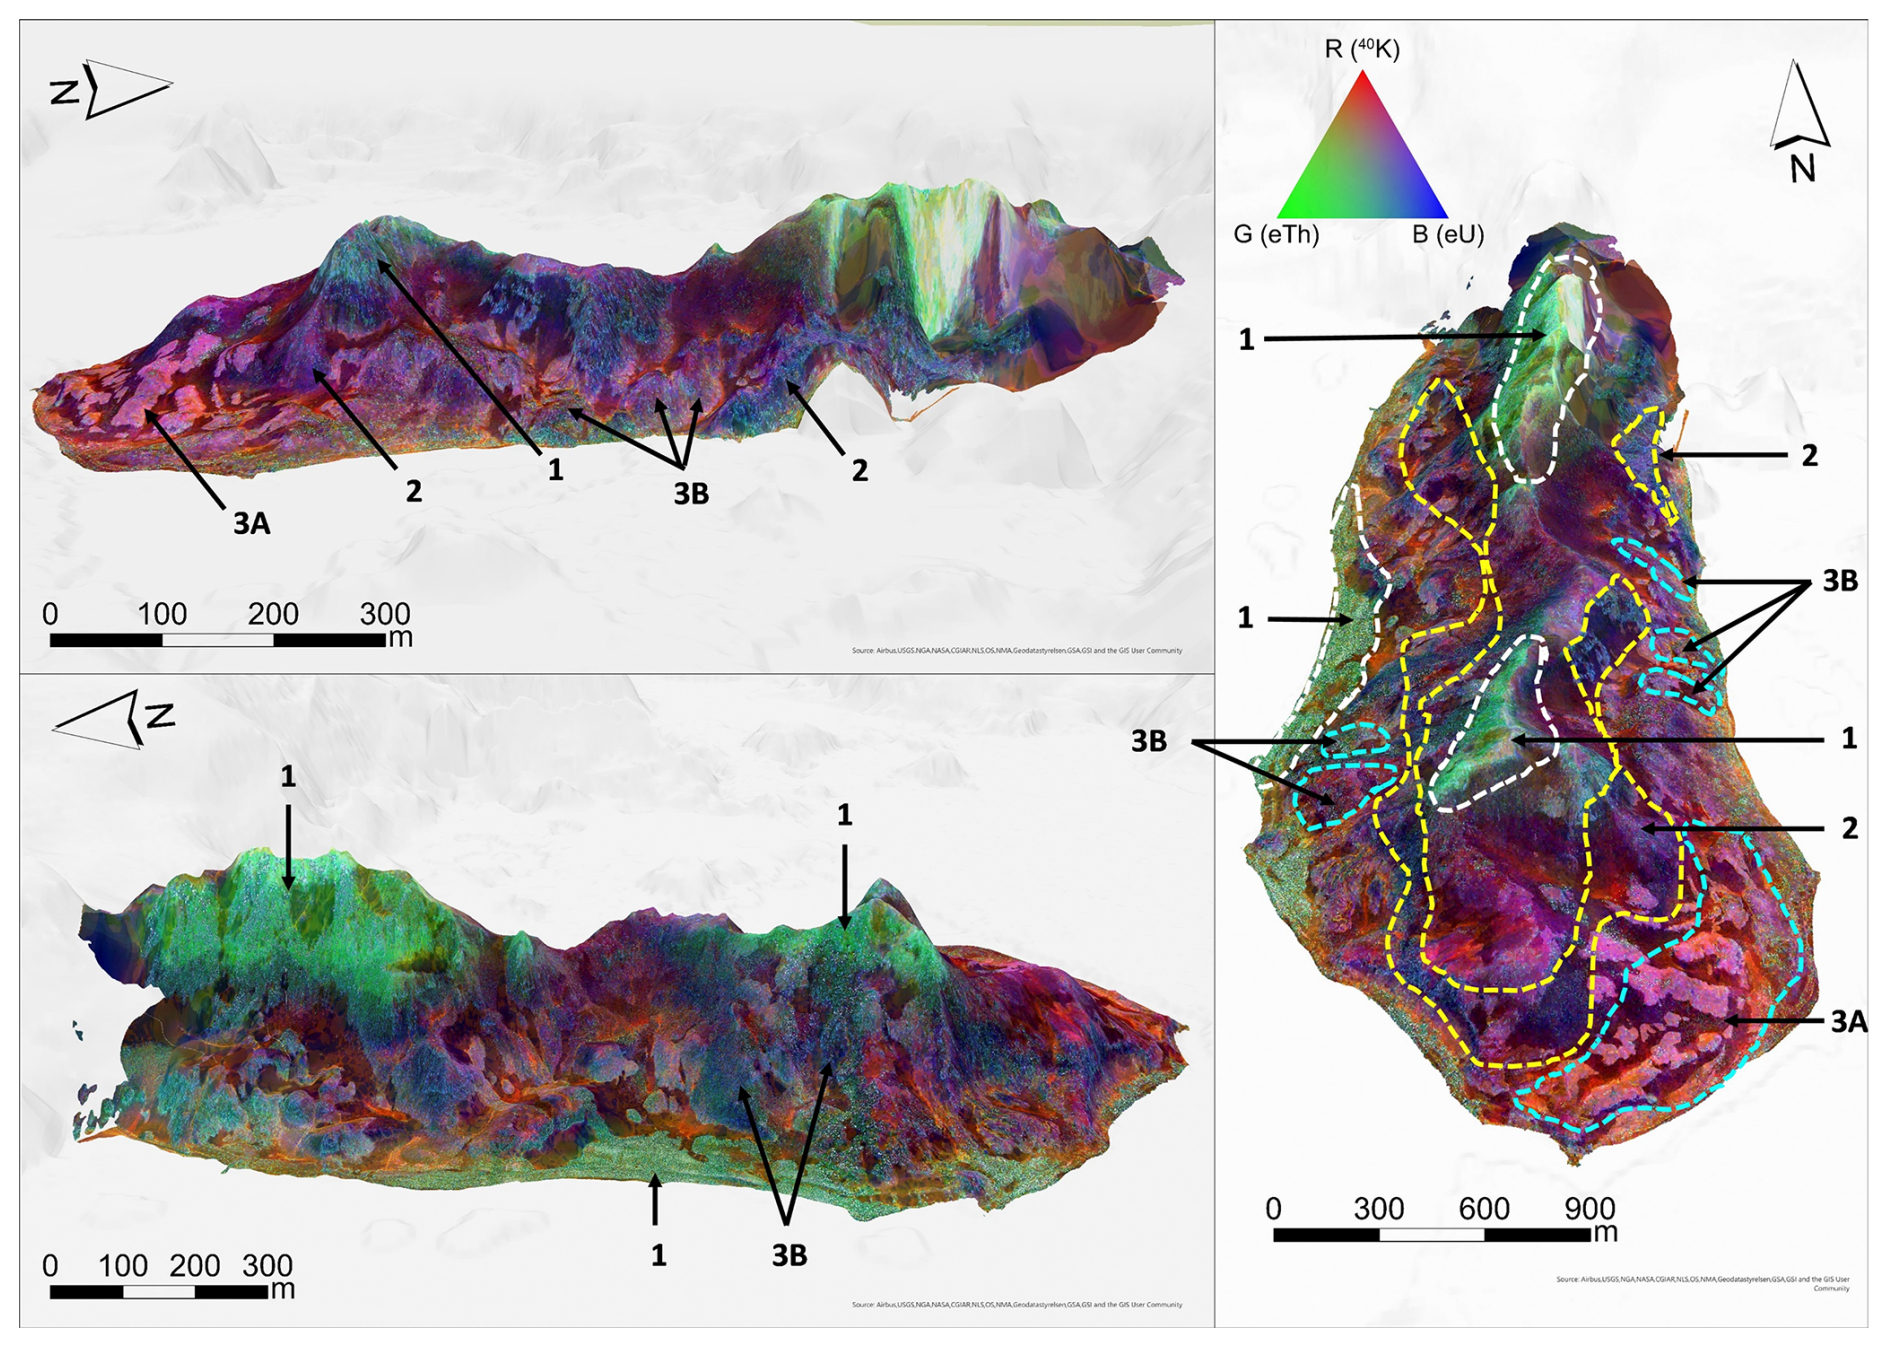
Figure 6Gamma-ray ternary image combined with 3D landscape perspective in different views highlighting areas with higher and lower values of radionuclides. (1) Higher eTh content; (2) higher eU content; (3A) higher 40K content; (3B) miner 40K content in natural sulfate-affected areas.
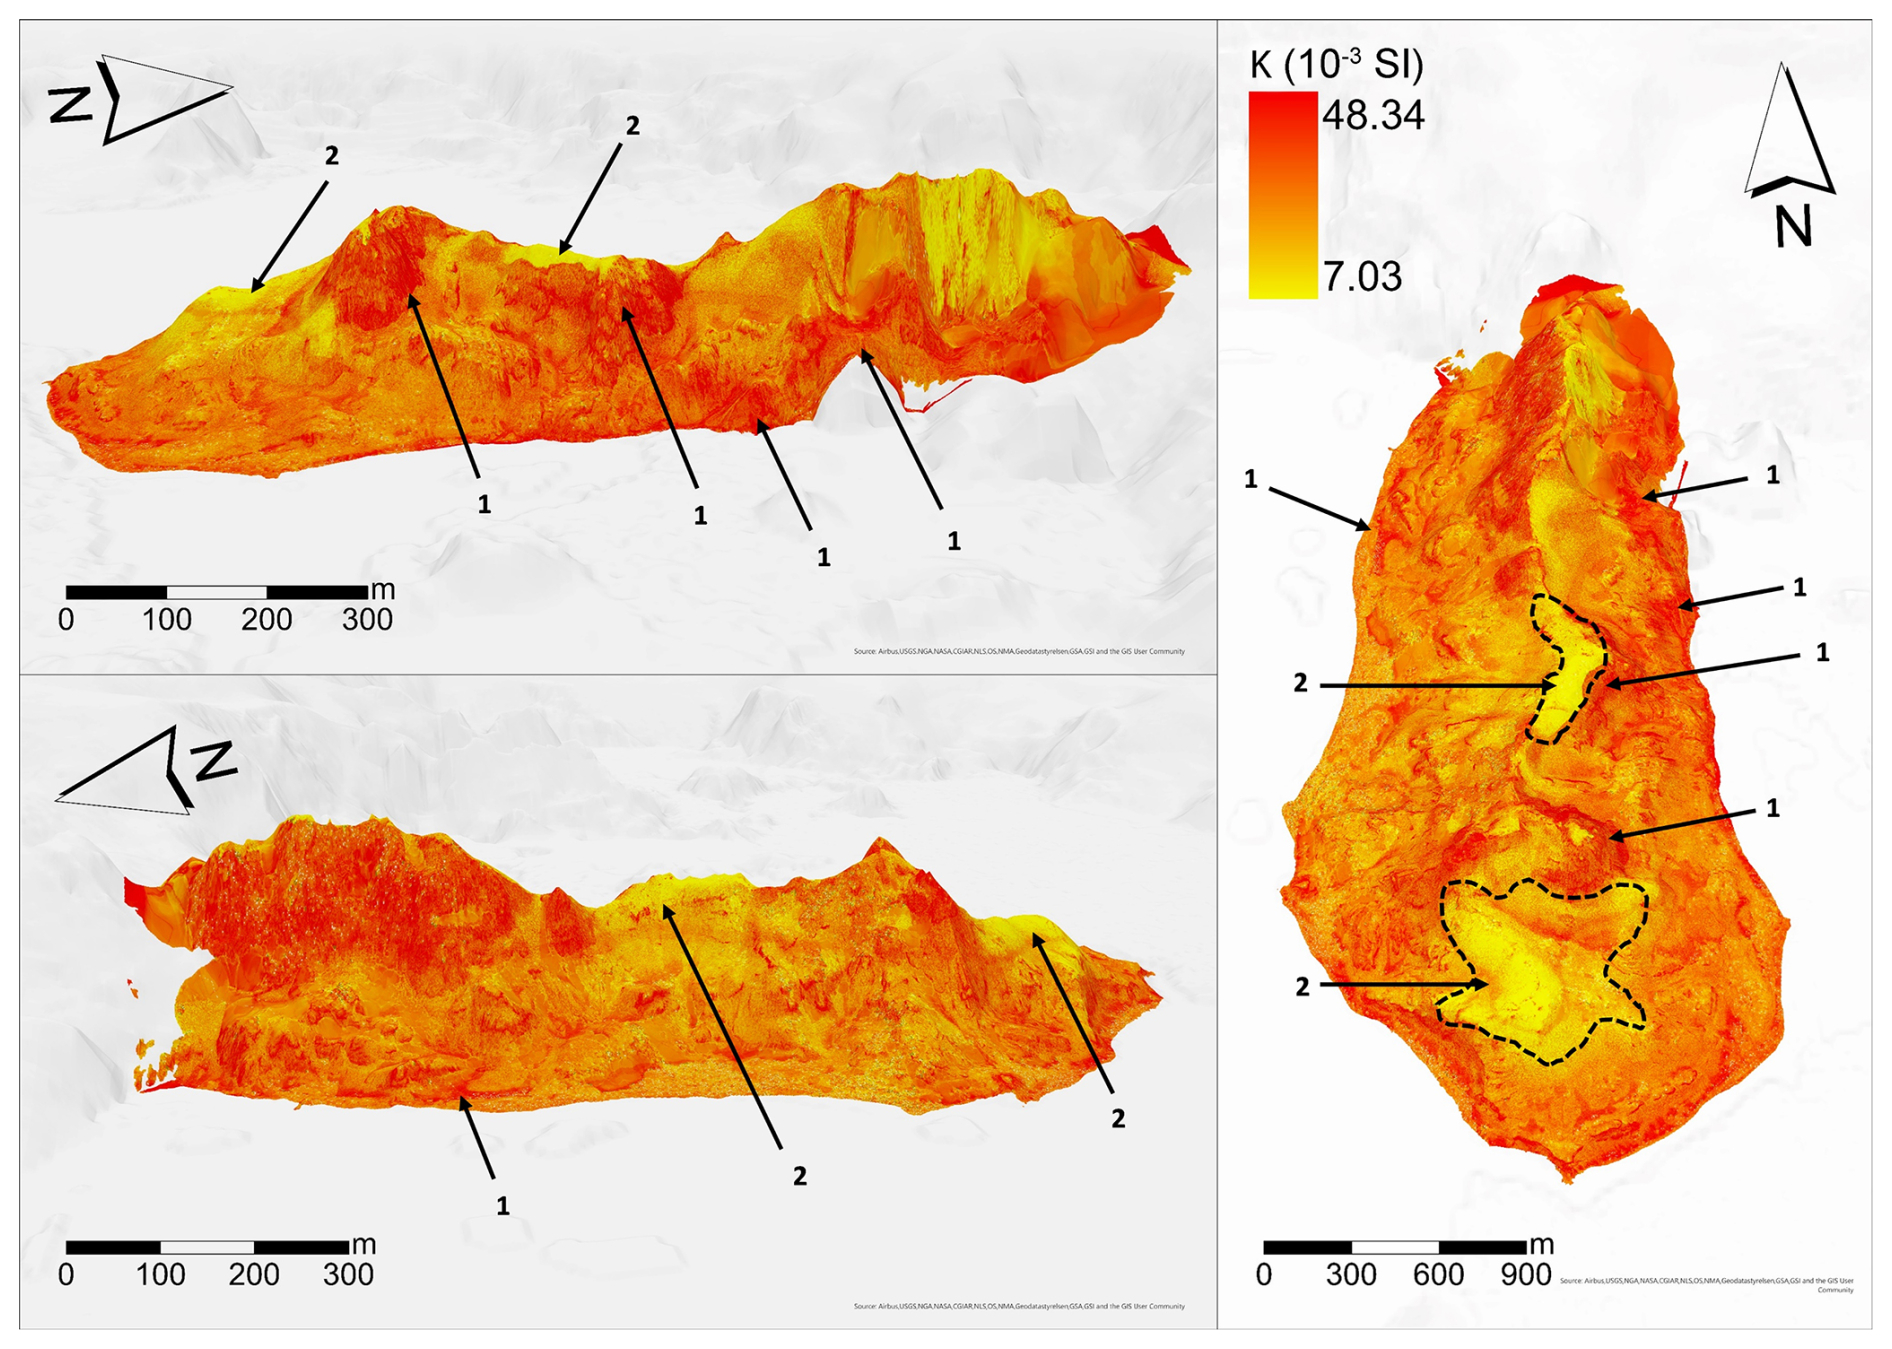
Figure 7Magnetic susceptibility combined with 3D landscape perspective in different views highlighting areas with higher and lower κ values. (1) Areas with high κ values; (2) areas with lower κ values over Cryosols.
Gamma-ray ternary image combined with 3D landscape perspective in different views highlighting areas with higher and lower values of radionuclides (Fig. 6). The predicted ternary γ-ray map (composite image) technique by machine learning was employed to simultaneously display three parameters of radioelement concentrations and distributions on a single image (Fig. 6). By utilizing color differences, this technique proved effective in discerning periglacial and pedogeomorphological processes associated to lithology and not only lithology (Fig. 6). This methodology allowed the identification of areas where distinct surface processes operate where different lithofacies occur within the larger mapped region and detailed studies involving surface process by using γ-ray spectrometry and κ should be encouraged.
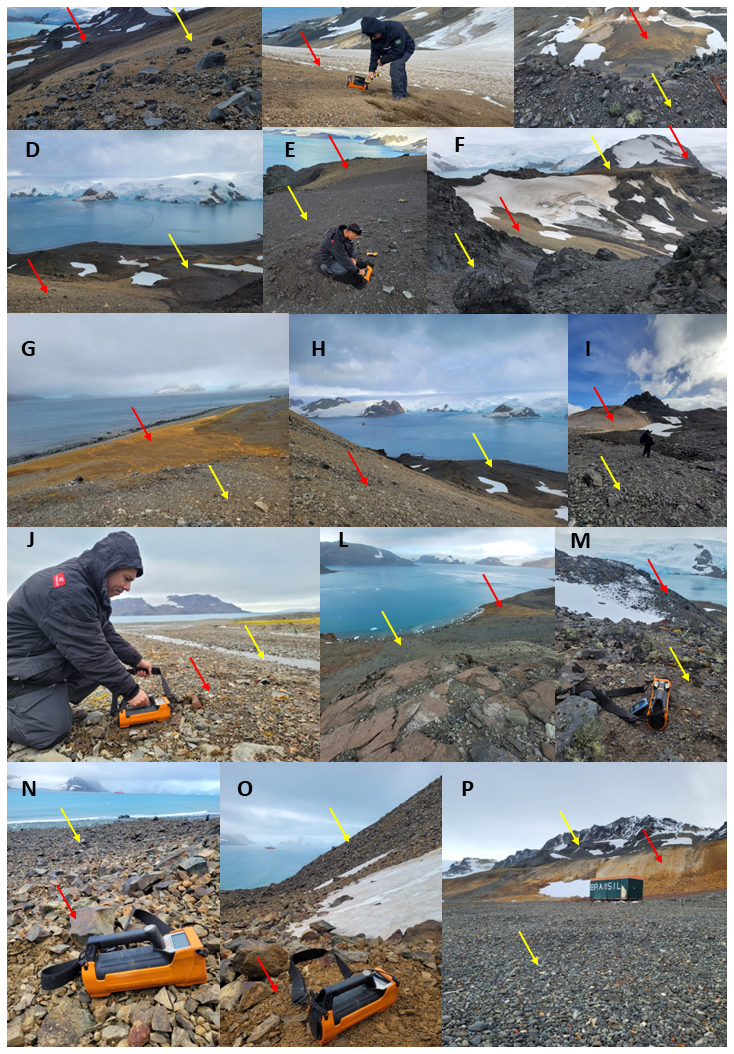
Figure 8Examples of lithological transitions in Keller Peninsula. (A) Pyritized-andesite/basaltic-andesites; (B, C) pyritized-andesite/andesitic-basalts; (D, E) pyritized-andesite/tuffites; (F) pyritized-andesite/andesitic-basalts; (G) pyritized-andesite/basaltic-andesites; (H) pyritized-andesite/andesitic-basalts; (I) pyritized-andesite/diorite; (J) undifferentiated marine sediments; (L) tuffite/pyritized-andesite; (M) andesitic-basalts/basaltic-andesites; (N) undifferentiated marine sediments/pyritized-andesite; (O) pyritized-andesite/basaltic-andesites; (P) andesitic-basalts/pyritized-andesite/undifferentiated marine sediments.
Regarding κ, surface pedogeomorphological and periglacial processes also influence the distribution of magnetic susceptibility in the landscape, such that the spatial variability of κ has specific relationships with the lithology of the area (Fig. 7). Low values may not reflect the properties of the in-situ lithology, as many of the areas are affected by depositional processes caused by periglacial erosion, resulting in the mixing of surface materials (Mello et al., 2023c). In a similar vein, Joju et al. (2023) conducted research and discovered that coarse soils in Larsemann Hills, East Antarctica, are primarily composed of magnetic minerals originating directly from the parent material, showcasing the strong influence of lithology on soil composition. Furthermore, despite the milder and moister climate in the maritime Antarctic region, Lee et al. (2004) observed minimal chemical weathering of bedrocks, suggesting that the soils mainly consist of physically weathered minerals and rock fragments. Moreover, our findings align with those of Warrier et al. (2021), who argued that while pedogenesis is indeed occurring, its intensity is insufficient to generate magnetic grains.
In some areas, the sulfurization due to hydrothermal processes, induced by the influence of pyritized-andesite (Fig. 7), leads to significant environmental acidification and hydrothermal magnetite formation affecting κ values (Souza et al., 2012; Lopes et al., 2019). This process may have played a role in the limited occurrence of ferrimagnetic minerals and their uniform distribution across the landscape contributing low variety in κ values (Mello et al., 2023b). Certain regions situated in the lower sections of the terrain are surrounded by mafic igneous rock (andesitic-basalts) in sloping areas, where periglacial erosion rates are high affect ferrimagnetic minerals distribution over landscape (Francelino et al., 2011; Mello et al., 2023c) On the other hand, some areas are located on marine terraces composed of undifferentiated sediments, exhibiting diverse κ values patterns (Mello et al., 2023a). The variation in κ values can be attributed to the presence of different sediment types with distinct mineralogical compositions in these specific locations.
It is also notable the occurrence of low κ values in the elevated and flat parts of the landscape (Fig. 7), where Cryosols occur. The permafrost in this compartment of the landscape hinders ferrimagnetic minerals formation. Water derived from snow melt during summer infiltrates through soil pores and accumulated in the active layer due to low permeability of permafrost. The saturation of soil induces gleyzation and avoid ferrimagnetic minerals precipitation (Zhu et al., 2021). In addition, the presence of a deeper regolith associated with periglacial processes of freezing and thawing of the active layer of permafrost, increases the differences between content and distribution of ferrimagnetic minerals on the surface and ferrimagnetic properties of the lithology (Mello et al., 2023a).
The sensors were able to detect some lithological transitions, with significant changes in radionuclide and κ contents (Fig. 8). However, the sensors do not present values directly associated with lithology due to the high intensity of surface pedogeomorphological and periglacial processes, it exerts a great influence on pedogeophysical readings in agreement with Dickson and Scott (1997) and Mello et al. (2020, 2021).
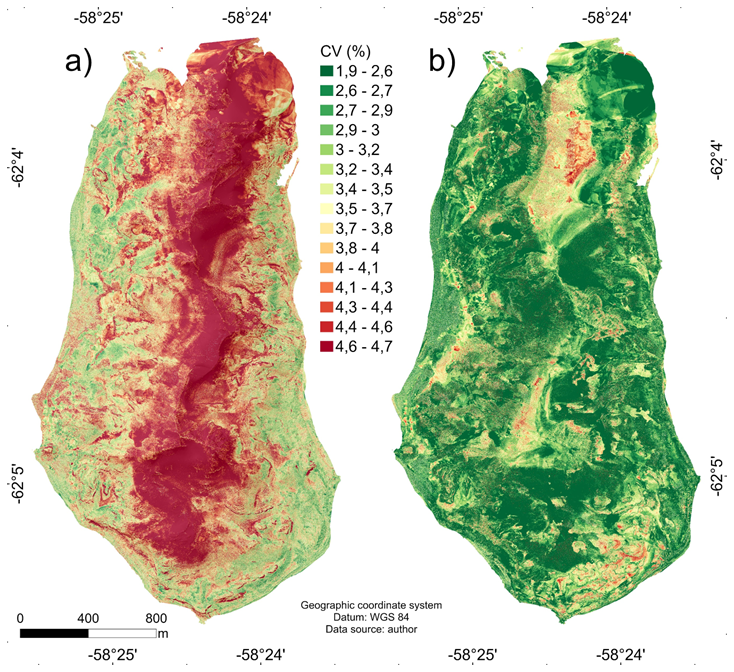
Figure 9(a) Coefficient of variation for magnetic susceptibility predicted map; (b) coefficient of variation for ternary γ-ray predicted maps.
3.5 Study limitations and recommendations
Figure 9 demonstrates the coefficient of variation (prediction error) of the ternary γ-ray and κ maps. The relatively low coefficient of variation values in our study can be attributed to the nested-LOOCV technique. These maps, associated with the CCC (Table 2), illustrates the limitations of the models in predicting and spatializing pedogeophysical data. The prediction errors were low for the pedogeophysical variables, in agreement with the high CCC values shown in Table 2, however, such errors do exist. It is possible to observe that the main prediction errors are associated with the steepest areas of the Peninsula, while the smallest are associated with areas with smoother to flat slopes. This shows that the main limitation of the modeling is related to the small number and distribution of samples read with the geophysical sensors. In this context, the relatively limited sample number as well as the distribution of samples is justified by the adverse field conditions (e.g., steep areas with snowbanks, glaciers, sharp rocks and frozen ground combined with high slopes, resulting in high danger areas for data acquisition by using proximal sensors). In other words, the logistical difficulties imposed by cold environments in field conditions were one of the significant limitations of this work, as noted by Fisher (2014, 2015) and Mello et al. (2023a, c). However, moderate CCC values and satisfactory CV in modeling processes, an exploratory evaluation for field data acquisition can provided informative results (Dharumarajan et al., 2017; Khaledian and Miller, 2020; Mansuy et al., 2014; Mosleh et al., 2016; Poggio et al., 2016).
The low number of samples in this study (87) was not so appropriate for a more specific approach. However, the RF algorithm combined with nested-LOOCV were appropriate for small samples number, as demonstrated in other researches (Mello et al., 2022a, b, c). In addition, in-situ evaluation brings several uncontrolled factors (such as rocks or fragments mixing due to periglacial erosion, permafrost activity, fluvioglacial channels and others), can impact the prediction and reduce the CCC and increase CV (Mello et al., 2023b).
The absence of detailed mineralogical, petrographic, and geochemical analyses constitutes a limitation of this study. This constraint was primarily due to logistical and operational challenges associated with fieldwork in remote and climatically extreme environments, which limited both the time available for sample collection and the transport of materials for laboratory analysis. Additionally, the main focus of the study was the application and evaluation of predictive models based on surface pedogeophysical data, rather than a comprehensive mineralogical-petrographic characterization. Nevertheless, we mitigated this limitation by incorporating and referencing existing detailed geological studies of the area, which provided essential information on the lithological framework, mineralogy and post-magmatic alteration processes. This information contributed significantly to understanding lithology as both a source of radionuclides and a provider of iron, which plays a key role in the formation of ferrimagnetic minerals either through pedogenetic processes (in the clay fraction) or as an inherited feature from the parent material (in the sand fraction). We recommend that future studies integrate in situ mineralogical and geochemical analyses to deepen the interpretation of the geophysical signals and refine model accuracy. Another limitation of this study is the unavailability of spatially continuous detailed lithological map (1 : 5000 for example), which affects the prediction performance (CCC, Table 2) and CV maps (Fig. 9). Furthermore, the variability of sensor readings is another limitation, which is little, but it exists. As a result, this variability can reduce the accuracy of the information. Nevertheless, our methodology tackled this concern by extending the reading time of the γ-ray sensor to 3 min and employing the mean values of three magnetic susceptibility readings. Mello et al., (2023a, c), carried out a similar approach where the same errors and experimental conditions were observed when modeling the intensity of weathering and studying pedogenesis in soil profiles in Keller Peninsula, using machine learning algorithms. These researchers also adjusted the data collection method with the same geophysical sensors used in this research.
The applicability of the findings here, however, is restricted to comparable environments, specifically those exhibiting periglacial conditions, igneous lithology, similar precipitation, temperature, and relief patterns. Given that many of the Maritime Antarctica Islands and some parts of Antarctic Peninsula share these common or similar environmental features, it is strongly recommended to promote similar pedogeophysical survey characterization efforts.
The research introduced a structured approach to specialize pedogeophysical variables using machine learning techniques. It has been demonstrated that employing machine learning methodologies is promising for accurately mapping natural γ-ray radioactivity and magnetic susceptibility characteristics. Through our methodology, we fitted regression models that identified key predictors, assessing accuracy and uncertainty across the RF model and ensuring consistent predictions through multiple pedogeoenvironmental iterations.
The RF algorithm was efficient and successfully predicted detailed maps of γ-spectrometric and magnetic susceptibility variables in periglacial environments with diverse igneous rock substrates. Relief-related morphometric variables significantly influenced the distribution of radionuclides and ferrimagnetic minerals on the land surface. The nested-LOOCV method proved suitable for pedogeophysical data with limited samples, providing robust evaluation of algorithm performance and generating accurate and high-performing mean maps.
Although the low degree of pedogenetic development and limited chemical weathering in the study area would typically suggest a strong lithological control over radionuclide concentrations, our findings indicate that topographic factors play a more dominant role. The highly dissected relief, steep slopes, and active periglacial processes, such as erosion and cryoturbation, contribute significantly to the redistribution of materials and radionuclides. As a result, in certain areas of Keller Peninsula, radionuclide concentrations do not align with the expected values based solely on the underlying lithology.
The highest levels of eTh were observed in three key areas: the elevated parts of the landscape, the flat areas, and the west beach. The west beach receives detrital materials from periglacial erosion, which come through fluvioglacial melting channels from the eTh-rich elevated parts. The eTh contents are controlled by lithology and pedogeomorphological processes.
The highest eU contents were observed in the steepest areas, characterized by the greatest slope, forming a ring around the highest parts of the landscape. In this case, the control of eU contents is determined by lithology and geomorphological processes, such as rock cryoclasty, periglacial erosion, and heterogeneous Accumulation of materials in the lower elevations of the terrain.
The highest levels of 40K were found in the most felsic rocks and areas with minimal influence from material deposition caused by periglacial erosion. Conversely, the lowest contents of 40K were observed in regions affected by the pedogeochemical process of sulfurization, specifically on pyritized-andesite within/around fluvioglacial melting channels. The control of 40K levels is determined by both lithology and pedogeochemical processes.
The κ did not exhibit an apparent distribution pattern, although the highest levels were observed in pyritized-andesites areas, while the lowest levels were found in Cryosol areas. Pyritized andesites were influenced by hydrothermal alteration, where heat and magmatic fluids promoted iron concentration and the formation of hydrothermal magnetite, thereby contributing to higher κ values. On the other hand, Cryosols, in addition to increasing the distance between surface materials and the rocky substrate, experience seasonal freezing and thawing activity of the active permafrost layer, creating conditions that discourage the formation of ferrimagnetic minerals and reduce κ values. The control of κ values is determined by lithology and less influenced by pedological-periglacial processes associated with Cryosols.
In areas with diverse terrain attributes and a prevalence of active and intense periglacial processes, the predicted-spatialized pedogeophysical variables do not accurately represent the lithological composition of the substrate. This is because the various periglacial processes in the region, combined with the morphometric characteristics of the landscape, work to redistribute, mix, and homogenize the surface materials.
All analyses and codes used in this research were developed in R software version 4.0.3 (R Core Team, 2023; Kuhn and Johnson, 2013). The codes and data used in this research can be found at https://doi.org/10.5281/zenodo.10828281 (Moquedace, 2024). All packages used in the R software, as well as their respective versions, are listed in the database, and codes are available in the data_base.zip file in the indicated repository.
DM: conceived of the presented idea, carried out the experiment, developed the theoretical formalism, contributed to the design and implementation of the research, to the analysis of the results and to the writing of the manuscript. He provided critical feedback and helped shape the research, analysis and manuscript.
CB: designed the model and the computational framework and analysed the data, planned and carried out the simulations, performed the analytic calculations and performed the numerical simulations, modelling processing, evaluate algorithms performance, variables importance and statistical analyses.
CM: contributed to the interpretation of the results, took the lead in writing the manuscript. Devised the project, the main conceptual ideas and proof outline. He worked out almost all of the technical details. All authors provided critical feedback and helped shape the research, analysis and manuscript.
IO: contributed to the interpretation of the results, took the lead in writing the manuscript. All authors provided critical feedback and helped shape the research, analysis and manuscript.
GV: contributed to the interpretation of the results, took the lead in writing the manuscript. All authors provided critical feedback and helped shape the research, analysis and manuscript.
LG: performed the analysis, drafted the manuscript and designed the figure. All authors provided critical feedback and helped shape the research, analysis and manuscript.
MF: Provided de financial support, leadership of the group, critical revision of the article. He contributed to the interpretation of the results and verified the analytical methods. Encouraged the co-authors to investigate a specific aspect and supervised the findings of this work.
CS: Critical revision of the article. All authors discussed the results and commented on the manuscript. He contributed to the interpretation of the results and verified the analytical methods.
EF: Critical revision of the article. He designed the model and the computational framework and analysed the data. He contributed to the interpretation of the results and verified the analytical methods. All authors discussed the results and commented on the manuscript.
JS: Critical revision of the article. He contributed to the interpretation of the results and verified the analytical methods. All authors discussed the results and commented on the manuscript.
EJ: Critical revision of the article. He contributed to the interpretation of the results and verified the analytical methods. All authors discussed the results and commented on the manuscript.
FO: Critical revision of the article. He contributed to the interpretation of the results and verified the analytical methods. All authors discussed the results and commented on the manuscript.
TF: Critical revision of the article. He contributed to the interpretation of the results and verified the analytical methods. All authors discussed the results and commented on the manuscript.
JD: Critical revision of the article. He contributed to the interpretation of the results and verified the analytical methods. All authors discussed the results and commented on the manuscript.
At least one of the (co-)authors is a member of the editorial board of Geoscientific Model Development. The peer-review process was guided by an independent editor, and the authors also have no other competing interests to declare.
Publisher's note: Copernicus Publications remains neutral with regard to jurisdictional claims made in the text, published maps, institutional affiliations, or any other geographical representation in this paper. While Copernicus Publications makes every effort to include appropriate place names, the final responsibility lies with the authors. Views expressed in the text are those of the authors and do not necessarily reflect the views of the publisher.
We express our gratitude to the National Council for Scientific and Technological Development (CNPq) for providing the first author's scholarship and essential resources through grant No. 134608/2015-1 and grant number 305996/2018-5. Additionally, we acknowledge partial funding for this study from the Coordenação de Aperfeiçoamento de Pessoal de Nível Superior – Brazil (CAPES) – Finance Code 001.
We extend our thanks to the Terrantar – UFV group, Geotechnologies in Soil Science group, Laboratório de Geoprocessamento e Pedometria – UFV (LabGeo – UFV), “Programa de Pós-Graduação em Solos e Nutrição de Plantas – PGSNP” of the Soil Department of the Universidade Federal de Viçosa, Brazil, and Programa Antártico Brasileiro for their valuable support.
Declaration of Generative AI and AI-assisted technologies in the writing process. During the preparation of this work, the authors utilized GPT-4 to correct the grammar and structure of the English language, ensuring clarity in the sentences for the reader. After using this tool/service, the author reviewed and edited the content as needed and take full responsibility for the content of the publication.
This research has been supported by the Coordenação de Aperfeiçoamento de Pessoal de Nível Superior (grant no. 001). We also extend our gratitude to Fundação de Amparo a Pesquisa do Estado de São Paulo (FAPESP) for the scholarship awarded to the first author (project 2024/06285-1), which enabled the completion of this manuscript at another institution (ESALQ/USP).
This paper was edited by Mauro Cacace and reviewed by two anonymous referees.
Arivazhagan, S., Naseer, K. A., Mahmoud, K. A., Arun Kumar, K. V., Libeesh, N. K., Sayyed, M. I., Alqahtani, M. S., Yousef, E. S., and Khandaker, M. U.: Gamma-ray protection capacity evaluation and satellite data-based mapping for the limestone, charnockite, and gneiss rocks in the Sirugudi taluk of the Dindigul district, India, Radiation Physics and Chemistry, 196, 110108, https://doi.org/10.1016/j.radphyschem.2022.110108, 2022.
Ayoubi, S., Abazari, P., and Zeraatpisheh, M.: Soil great groups discrimination using magnetic susceptibility technique in a semi-arid region, central Iran, Arab. J. Geosci., 11, 616, https://doi.org/10.1007/s12517-018-3941-4, 2018.
Bastos, B. P., Pinheiro, H. S. K., Junior, W. C., dos Anjos, L. H. C., and Ferreira, F. J. F.: Clustering airborne gamma-ray spectrometry data in Nova Friburgo, State of Rio de Janeiro, southeastern Brazil, Journal of Applied Geophysics, 209, 104900, https://doi.org/10.1016/j.jappgeo.2022.104900, 2023.
Beamish, D.: Relationships between gamma-ray attenuation and soils in SW England, Geoderma, 259–260, 174–186, https://doi.org/10.1016/j.geoderma.2015.05.018, 2015.
Birkenmajer, K.: Geology of Admiralty Bay, King George Island (South Shetland Islands) – An outline, Polish Polar Research, 1, 29–54, 1980.
Brenning, A.: Statistical geocomputing combining R and SAGA: The example of landslide susceptibility analysis with generalized additive models, Hamburger Beiträge zur Physischen Geographie und Landschaftsökologie, 19, 410, 2008.
Bressan, T. S., Kehl de Souza, M., Girelli, T. J., and Junior, F. C.: Evaluation of machine learning methods for lithology classification using geophysical data, Computers & Geosciences, 139, 104475, https://doi.org/10.1016/j.cageo.2020.104475, 2020.
Chen, D., Chang, N., Xiao, J., Zhou, Q., and Wu, W.: Mapping dynamics of soil organic matter in croplands with MODIS data and machine learning algorithms, Science of the Total Environment, 669, 844–855, https://doi.org/10.1016/j.scitotenv.2019.03.151, 2019a.
Chen, S., Liang, Z., Webster, R., Zhang, G., Zhou, Y., Teng, H., Hu, B., Arrouays, D., and Shi, Z.: A high-resolution map of soil pH in China made by hybrid modelling of sparse soil data and environmental covariates and its implications for pollution, Science of the Total Environment, 655, 273–283, https://doi.org/10.1016/j.scitotenv.2018.11.230, 2019b.
Costa, I. S. L., Tavares, F. M., and de Oliveira, J. K. M.: Predictive lithological mapping through machine learning methods: a case study in the Cinzento Lineament, Carajás Province, Brazil, Journal of Geology and Survey of Brazil, 2, 26–36, 2019.
Cracknell, M. J. and Reading, A. M.: Geological mapping using remote sensing data: A comparison of five machine learning algorithms, their response to variations in the spatial distribution of training data and the use of explicit spatial information, Computers & Geosciences, 63, 22–33, https://doi.org/10.1016/j.cageo.2013.10.008, 2014.
Daher, M., Schaefer, C. E. G. R., Fernandes Filho, E. I., Francelino, M. R., and Senra, E. O.: Semi-arid soils from a topolithosequence at James Ross Island, Weddell Sea region, Antarctica: Chemistry, mineralogy, genesis and classification, Geomorphology, 327, 351–364, https://doi.org/10.1016/j.geomorph.2018.11.003, 2019.
de Morisson Valeriano, M.: Topodata: guia para utilização de dados geomorfológicos locais, Inpe, 73, http://mtc-m16c.sid.inpe.br/col/sid.inpe.br/mtc-m18@80/2008/07.11.19.24/doc/publicacao.pdf (last access: 12 November 2025), 2008.
Dharumarajan, S., Hegde, R., and Singh, S. K.: Spatial prediction of major soil properties using Random Forest techniques: A case study in semi-arid tropics of South India, Geoderma Regional, 10, 154–162, https://doi.org/10.1016/j.geodrs.2017.07.005, 2017.
Dickson, B. L. and Scott, K. M.: Interpretation of aerial gamma-ray surveys – adding the geochemical factors, AGSO Journal of Australian Geology and Geophysics, 17, 187–200, 1997.
Elawadi, E., Ammar, A., and Elsirafy, A.: Mapping surface geology using airborne gamma-ray spectrometric survey data – A case study, in: Proceedings of the 7th SEGJ International Symposium, Japan, https://www.academia.edu/1062717/Mapping_surface_geology_using_airborne_gamma_ray_spectrometric_survey_data_A_case_study (last access: 14 November 2025), 2004.
Fabris, J. D., Coey, J. M. D., Qi, Q., and Mussel, W. da N.: Characterization of Mg-rich maghemite from tuffite, American Mineralogist, 80, 664–669, 1995.
FAO: World Reference Base for Soil Resources 2014: International soil classification system for naming soils and creating legends for soil maps, World Soil Resources Reports, No. 106, https://doi.org/10.1017/S0014479706394902, 2014.
Feng, Y., Cui, N., Hao, W., Gao, L., and Gong, D.: Estimation of soil temperature from meteorological data using different machine learning models, Geoderma, 338, 67–77, https://doi.org/10.1016/j.geoderma.2018.11.044, 2019.
Ferreira, R. G., da Silva, D. D., Elesbon, A. A. A., Fernandes-Filho, E. I., Veloso, G. V., de Souza Fraga, M., and Ferreira, L. B.: Machine Learning Models for Streamflow Regionalization in a Tropical Watershed, J. Environ. Manage., 280, 111713, https://doi.org/10.1016/j.jenvman.2020.111713, 2021.
Fisher, M.: The Challenges of Doing Soils Research in Antarctica: A Day in the Life of Ed Gregorich, Soil Horizons, 55, 1–3, 2014.
Fisher, M.: A Day in the Life of an Arctic Soil Scientist, Soil Horizons, 56, 1–3, 2015.
Ford, K., Harris, J. R., Shives, R., Carson, J., and Buckle, J.: Remote predictive mapping 2. Gamma-ray spectrometry: A tool for mapping Canada's North, Geoscience Canada, 35, 109–126, 2008.
Francelino, M. R., Schaefer, C. E. G. R., Simas, F. N. B., Fernandes Filho, E. I., de Souza, J. J. L. L., and da Costa, L. M.: Geomorphology and soils distribution under paraglacial conditions in an ice-free area of Admiralty Bay, King George Island, Antarctica, Catena, 85, 194–204, 2011.
French, H. M.: The Periglacial Environment, John Wiley & Sons, Chichester, 2017.
Garankina, E. V., Lobkov, V. A., Shorkunov, I. G., and Belyaev, V. R.: Identifying relict periglacial features in watershed landscape and deposits of Borisoglebsk Upland, Central European Russia, Journal of the Geological Society of London, 179, https://doi.org/10.1144/jgs2021-135, 2022.
Gregory, A. F. and Horwood, J. L.: A laboratory study of gamma-ray spectra at the surface of rocks, Geological Survey of Canada, Ottawa, Department of Mines and Technical Surveys, https://doi.org/10.2172/4833372, 1961.
Guimarães, C. C. B., Demattê, J. A. M., de Azevedo, A. C., Dalmolin, R. S. D., ten Caten, A., Sayão, V. M., da Silva, R. C., Poppiel, R. R., de Sousa Mendes, W., and Salazar, D. F. U.: Soil weathering behavior assessed by combined spectral ranges: Insights into aggregate analysis, Geoderma, 402, 115154, https://doi.org/10.1016/j.geoderma.2021.115154, 2021.
Harris, J. R. and Grunsky, E. C.: Predictive lithological mapping of Canada's North using Random Forest classification applied to geophysical and geochemical data, Computers & Geosciences, 80, 9–25, https://doi.org/10.1016/j.cageo.2015.03.013, 2015.
Hijmans, R. J. and Van Etten, J.: raster: Geographic Data Analysis and Modeling, R package version 2.5–8, https://cir.nii.ac.jp/crid/1370005520447936526 (last access: 12 November 2025), 2016.
Hothorn, T.: CRAN Task View: Machine Learning and Statistical Learning, https://cran.ms.unimelb.edu.au/web/views/MachineLearning.html (last access: 12 November 2025), 2021.
INPE Instituto Nacional de Pesquisas Espaciais: EACF Weather Data, http://antartica.cptec.inpe.br/~rantar/weatherdata.shtml (last access: 11 November 2025, 2009.
Joju, G. S., Warrier, A. K., Chaparro, M. A. E., Mahesh, B. S., Matthew, F. A., Anusree, S., and Mohan, R.: Mineral magnetic properties of surface soils from the Broknes and Grovnes Peninsula, Larsemann Hills, East Antarctica, Polar Science, 100968, https://doi.org/10.1016/j.polar.2023.100968, 2023.
Jung, Y., Lee, J., Lee, M., Kang, N., and Lee, I.: Probabilistic analytical target cascading using kernel density estimation for accurate uncertainty propagation, Structural and Multidisciplinary Optimization, 61, 1–19, 2020.
Khaledian, Y. and Miller, B. A.: Selecting appropriate machine learning methods for digital soil mapping, Applied Mathematical Modelling, 81, 401–418, 2020.
Khosravi, V., Doulati Ardejani, F., Yousefi, S., and Aryafar, A.: Monitoring soil lead and zinc contents via combination of spectroscopy with extreme learning machine and other data mining methods, Geoderma, 318, 29–41, https://doi.org/10.1016/j.geoderma.2017.12.025, 2018.
Kuhn, M. and Johnson, K.: Applied Predictive Modeling, Springer, New York, https://doi.org/10.1007/978-1-4614-6849-3, 2013.
Kuhn, S., Cracknell, M. J., and Reading, A. M.: Lithologic mapping using Random Forests applied to geophysical and remote-sensing data: A demonstration study from the Eastern Goldfields of Australia, Geophysics, 83, B183–B193, 2018.
Lee, Y. I., Lim, H. S., and Yoon, H. I.: Geochemistry of soils of King George Island, South Shetland Islands, West Antarctica: Implications for pedogenesis in cold polar regions, Geochimica et Cosmochimica Acta, 68, 4319–4333, https://doi.org/10.1016/j.gca.2004.01.020, 2004.
Lin, L. I.-K.: A concordance correlation coefficient to evaluate reproducibility, Biometrics, 45, 255–268, https://doi.org/10.2307/2532051, 1989.
Loiseau, T., Richer-de-Forges, A. C., Martelet, G., Bialkowski, A., Nehlig, P., and Arrouays, D.: Could airborne gamma-spectrometric data replace lithological maps as co-variates for digital soil mapping of topsoil particle-size distribution? A case study in Western France, Geoderma Regional, 22, e00295, https://doi.org/10.1016/j.geodrs.2020.e00295, 2020.
Lopes, D., Schaefer, C. E. G. R., Souza, J. J. L. L. de, Oliveira, F. S. de, Simas, F. N. B., and Daher, M.: Concretionary horizons, unusual pedogenetic processes and features of sulfate affected soils from Antarctica, Geoderma, 347, 13–24, https://doi.org/10.1016/j.geoderma.2019.03.024, 2019.
López-Martínez, J., Serrano, E., Schmid, T., Mink, S., and Linés, C.: Periglacial processes and landforms in the South Shetland Islands (northern Antarctic Peninsula region), Geomorphology, 155–156, 62–79, https://doi.org/10.1016/j.geomorph.2011.12.018, 2012.
Mansuy, N., Thiffault, E., Paré, D., Bernier, P., Guindon, L., Villemaire, P., Poirier, V., and Beaudoin, A.: Digital mapping of soil properties in Canadian managed forests at 250 m resolution using the k-nearest neighbor method, Geoderma, 235–236, 59–73, https://doi.org/10.1016/j.geoderma.2014.06.032, 2014.
Meier, M., Francelino, M. R., Gasparini, A. S., Thomazini, A., Pereira, A. B., von Krüger, F. L., Fernandes-Filho, E. I., and Schaefer, C. E. G. R.: Soilscapes and geoenvironments at Stansbury Peninsula, Nelson Island, maritime Antarctica, Catena, 223, 106884, https://doi.org/10.1016/j.catena.2022.106884, 2023.
Mello, D. C., Demattê, J. A. M., Silvero, N. E. Q., Di Raimo, L. A., Poppiel, R. R., Mello, F. A. O., and Rizzo, R. L: Soil magnetic susceptibility and its relationship with naturally occurring processes and soil attributes in pedosphere, in a tropical environment, Geoderma, 372, 114364, https://doi.org/10.1016/j.geoderma.2020.114364, 2020.
Mello, D., Demattê, J. A. M., Silvero, N. E. Q., Di Raimo, L. A. D. L., Poppiel, R. R., Mello, F. A. O., Souza, A. B., Safanelli, J. L., Resende, M. E. B., Rizzo, R., and Schaefer, C. E. G. R.: Applied gamma-ray spectrometry for evaluating tropical soil processes and attributes, Geoderma, 381, 114736, https://doi.org/10.1016/j.geoderma.2020.114736, 2021.
Mello, D. C., Ferreira, T. O., Veloso, G. V., de Lana, M. G., de Oliveira Mello, F. A., Di Raimo, L. A. D. L., Schaefer, C. E. G. R., Francelino, M. R., Fernandes-Filho, E. I., and Demattê, J. A. M.: Pedogenetic processes operating at different intensities inferred by geophysical sensors and machine learning algorithms, Catena, 216, 106370, https://doi.org/10.1016/j.catena.2022.106370, 2022a.
Mello, D. C., Safanelli, J. L., Poppiel, R. R., Veloso, G. V., Cabrero, D. R. O., Greschuk, L. T., de Oliveira Mello, F. A., Francelino, M. R., Ker, J. C., and Leite, E. P.: Soil apparent electrical conductivity survey in different pedoenvironments by geophysical sensor EM38: a potential tool in pedology and pedometry studies, Geocarto International, 37, 1–24, https://doi.org/10.1080/10106049.2022.2076913, 2022b.
Mello, D. C. D., Veloso, G. V., Lana, M. G. D., Mello, F. A. D. O., Poppiel, R. R., Cabrero, D. R. O., Di Raimo, L. A. D. L., Schaefer, C. E. G. R., Filho, E. I. F., Leite, E. P., and Demattê, J. A. M.: A new methodological framework for geophysical sensor combinations associated with machine learning algorithms to understand soil attributes, Geosci. Model Dev., 15, 1219–1246, https://doi.org/10.5194/gmd-15-1219-2022, 2022c.
Mello, D., Veloso, G. V., Moquedace, C. M., de Angeli Oliveira, I., de Oliveira, F. S., Gomes, L. C., de Souza, J. J. L. L., Francelino, M. R., Fernandes-Filho, E. I., Schaefer, C. E. G. R., and Demattê, J. A. M.: Radiometric and magnetic susceptibility characterization of soil profiles: Geophysical data and their relationship with Antarctic periglacial processes, pedogenesis, and lithology, Catena, 232, 107427, https://doi.org/10.1016/j.catena.2023.107427, 2023a.
Mello, D. C., Ferreira, T. O., Veloso, G. V., de Lana, M. G., de Oliveira Mello, F. A., Di Raimo, L. A. D. L., Cabrero, D. R. O., de Souza, J. J. L. L., Fernandes-Filho, E. I., and Francelino, M. R.: Digital mapping of soil weathering using field geophysical sensor data coupled with covariates and machine learning, Journal of South American Earth Sciences, 104449, https://doi.org/10.1016/j.jsames.2023.104449, 2023b.
Mello, D. C., Vieira, G., Marques, C., Angeli, I. De, Soares, F., Oliveira, D., and Demattê, M.: 2023. Chemical weathering detection in the periglacial landscapes of Maritime Antarctica : New approach using geophysical sensors, topographic variables and machine learning algorithms, Geoderma 438, https://doi.org/10.1016/j.geoderma.2023.116615, 2023c.
Mello, D. C. de, Veloso, G. V., Mello, M. F. de, Lana, M. G. de, Oliveira, I. de A., Mello, F. A. de O., Siqueira, R. G., Gomes, L. C., Fernandes-Filho, E. I., Schaefer, C. E. G. R., Francelino, M. R., Leite, E. P., Ferreira, T. O., and Demattê, J. A. M.: Integrating proximal geophysical sensing and machine learning for digital soil mapping: Spatial prediction and model evaluation using a small dataset, Soil Advances, 3, 100024, https://doi.org/10.1016/j.soilad.2024.100024, 2025.
Minty, B. R. S., Luyendyk, A. P. J., and Brodie, R. C.: Calibration and data processing for airborne gamma-ray spectrometry, AGSO Journal of Australian Geology and Geophysics, 17, 51–62, 1997.
Mishra, G., Sulieman, M. M., Kaya, F., Francaviglia, R., Keshavarzi, A., Bakhshandeh, E., Loum, M., Jangir, A., Ahmed, I., Elmobarak, A., Basher, A., and Rawat, D.: Machine learning for cation exchange capacity prediction in different land uses, Catena, 216, 106404, https://doi.org/10.1016/j.catena.2022.106404, 2022.
Moquedace, C. M.: Codes/Rasters – Application of machine learning to proximal gamma-ray and magnetic susceptibility surveys in the Maritime Antarctic: Assessing the influence of periglacial processes and landforms (Version v2), Zenodo [code, data set], https://doi.org/10.5281/zenodo.10828281, 2024.
Mosleh, Z., Salehi, M. H., Jafari, A., Borujeni, I. E., and Mehnatkesh, A.: The effectiveness of digital soil mapping to predict soil properties over low-relief areas, Environmental Monitoring and Assessment, 188, 195, https://doi.org/10.1007/s10661-016-5204-8, 2016.
Moquedace, C. M., Baldi, C. G. O., Siqueira, R. G., Cardoso, I. M., de Souza, E. F. M. , Fontes, R. L. F., Francelino, M. R., Gomes, L. C., and Fernandes-Filho, E. I.: High-Resolution Mapping of Soil Carbon Stocks in the Western Amazon, Geoderma Reg., 36, e00773, https://doi.org/10.1016/j.geodrs.2024.e00773, 2024.
Mullins, C. E.: Magnetic susceptibility of the soil and its significance in soil science – a review, Journal of Soil Science, 28, 223–246, https://doi.org/10.1111/j.1365-2389.1977.tb02232.x, 1977.
Navas, A., Serrano, E., López-Martínez, J., Gaspar, L., and Lizaga, I.: Interpreting environmental changes from radionuclides and soil characteristics in different landform contexts of Elephant Island (maritime Antarctica), Land Degradation and Development, 29, 3141–3158, 2018.
Nawrocki, J., Pańczyk, M., Wójcik, K., and Tatura, A.: U–Pb isotopic ages and provenance of some far-travelled exotic pebbles from glaciogenic sediments of the Polonez Cove Formation (Oligocene, King George Island), Journal of the Geological Society of London, 178, jgs2020-113, https://doi.org/10.1144/jgs2020-113, 2021.
Neogi, S. and Dauwels, J.: Factored latent-dynamic conditional random fields for single and multi-label sequence modeling, arXiv [preprint], https://doi.org/10.48550/arXiv.1911.03667, 2019.
Paes, É. de C., Veloso, G. V., Fonseca, A. A. da, Fernandes-Filho, E. I., Fontes, M. P. F., and Soares, E. M. B.: Predictive modeling of contents of potentially toxic elements using morphometric data, proximal sensing, and chemical and physical properties of soils under mining influence, Science of the Total Environment, 817, 152972, https://doi.org/10.1016/j.scitotenv.2022.152972, 2022.
Passier, H. F. de, De Lange, G. J., and Dekkers, M. J.: Magnetic properties and geochemistry of the active oxidation front and the youngest sapropel in the eastern Mediterranean Sea, Geophysical Journal International, 145, 604–614, 2001.
Poggere, G. C., Inda, A. V., Barrón, V., Kämpf, N., de Brito, A. D. B., Barbosa, J. Z., and Curi, N.: Maghemite quantification and magnetic signature of Brazilian soils with contrasting parent materials, Applied Clay Science, 165, 39–50, https://doi.org/10.1016/j.clay.2018.05.014, 2018.
Poggio, L., Gimona, A., Spezia, L., and Brewer, M. J.: Bayesian spatial modelling of soil properties and their uncertainty: The example of soil organic matter in Scotland using R-INLA, Geoderma, 277, 69–82, https://doi.org/10.1016/j.geoderma.2016.04.026, 2016.
Pollard, W.: Periglacial processes in glacial environments, in: Past Glacial Environments, Elsevier, 537–564, https://doi.org/10.1016/B978-0-08-100524-8.00016-6, 2018.
Pride, D. E., Cox, C. A., Moody, S. V., Conelea, R. R., and Rosen, M. A.: Investigation of mineralization in the South Shetland Islands, Gerlache Strait, and Anvers Island, northern Antarctic Peninsula, Mineral Resources Potential of Antarctica, 51, 69–94, 1990.
Ragland, P. C., Billings, G. K., and Adams, J. A. S.: Chemical fractionation and its relationship to the distribution of thorium and uranium in a zoned granite batholith, Geochimica et Cosmochimica Acta, 31, 17–33, https://doi.org/10.1016/0016-7037(67)90095-6, 1967.
Rakusa-Suszczewski, S.: King George Island—South Shetland Islands, Maritime Antarctic. In Geoecology of Antarctic ice-free coastal landscapes, Berlin, Heidelberg: Springer Berlin Heidelberg, 23–39, https://doi.org/10.1007/978-3-642-56318-8_3, 2002.
Rawlins, B. G., Lark, R. M., and Webster, R.: Understanding airborne radiometric survey signals across part of eastern England, Earth Surface Processes and Landforms, 32, 1503–1515, https://doi.org/10.1002/esp.1468, 2007.
Rawlins, B. G., Scheib, C., Tyler, A. N., and Beamish, D.: Optimal Mapping of Terrestrial Gamma Dose Rates Using Geological Parent Material and Aerogeophysical Survey Data, J. Environ. Monit., 14, 3086–3093, 2012.
R Core Team: Package “caret”, The R Journal, https://journal.r-project.org/ (last access: 12 November 2025), 2020.
R Core Team: R: A language and environment for statistical computing, R Foundation for Statistical Computing, Vienna, https://cir.nii.ac.jp/crid/1574231874043578752 (last access: 12 November 2025), 2023.
Ribeiro, F. C. A., Silva, J. I. R., Lima, E. S. A., do Amaral Sobrinho, N. M. B., Perez, D. V., and Lauria, D. C.: Natural radioactivity in soils of the State of Rio de Janeiro (Brazil): Radiological characterization and relationships to geological formation, soil types and soil properties, Journal of Environmental Radioactivity, 182, 34–43, https://doi.org/10.1016/j.jenvrad.2017.11.017, 2018.
Rytky, S. J. O., Tiulpin, A., Frondelius, T., Finnilä, M. A. J., Karhula, S. S., Leino, J., Pritzker, K. P. H., Valkealahti, M., Lehenkari, P., Joukainen, A., and Saarakkala, S.: Automating Three-Dimensional Osteoarthritis Histopathological Grading of Human Osteochondral Tissue Using Machine Learning on Contrast-Enhanced Micro-Computed Tomography, Osteoarthr. Cartil., 28, 1133–1144, https://doi.org/10.1016/j.joca.2020.05.002, 2020.
Sales, S. and Terraplus, C.: KT-10 v2 User Manual 2021, User's Guide ver. 2.1, https://pt.scribd.com/document/410478813/KT-10-User-Manual-GR (last access: 12 November 2025), 2021.
Sarmast, M., Farpoor, M. H., and Esfandiarpour Boroujeni, I.: Magnetic susceptibility of soils along a lithotoposequence in southeast Iran, Catena, 156, 252–262, https://doi.org/10.1016/j.catena.2017.04.019, 2017.
Schünemann, A. L., Almeida, P. H. A., Thomazini, A., Fernandes Filho, E. I., Francelino, M. R., Schaefer, C. E. G. R., and Pereira, A. B.: High-resolution topography for digital terrain model (DTM) in Keller Peninsula, Maritime Antarctica, Anais da Academia Brasileira de Ciências, 90, 2001–2010, 2018.
Shebl, A., Abdellatif, M., Hissen, M., Ibrahim Abdelaziz, M., and Csámer, Á.: Lithological mapping enhancement by integrating Sentinel-2 and gamma-ray data utilizing support vector machine: A case study from Egypt, International Journal of Applied Earth Observation and Geoinformation, 105, 102619, https://doi.org/10.1016/j.jag.2021.102619, 2021.
Siqueira, R. G., Veloso, G. V., Fernandes‐Filho, E. I., Francelino, M. R., Schaefer, C. E. G., and Corrêa, G. R.: Evaluation of machine learning algorithms to classify and map landforms in Antarctica, Earth Surface Processes and Landforms, 47, 367–382, 2022.
Siqueira, R. G., Moquedace, C. M., Francelino, M. R., Schaefer, C. E. G. R., and Fernandes-Filho, E. I.: Machine learning applied for Antarctic soil mapping: Spatial prediction of soil texture for Maritime Antarctica and Northern Antarctic Peninsula, Geoderma, 432, 116405, https://doi.org/10.1016/j.geoderma.2023.116405, 2023.
Sillitoe, R. H.: Porphyry copper systems, Economic Geology, 105, 3–41, 2010.
Souza, J. J. L. L., Schaefer, C. E. G. R., Abrahão, W. A. P., de Mello, J. W. V., Simas, F. N. B., da Silva, J., and Francelino, M. R.: Hydrogeochemistry of sulfate-affected landscapes in Keller Peninsula, Maritime Antarctica, Geomorphology, 155, 55–61, 2012.
Souza, A. B., Demattê, J. A. M., Bellinaso, H., de Mello, D. C., da Silva Lisboa, C. J., de Oliveira Mello, F. A., Marques, K. P. P., de Resende, M. E. B., Reis, J. V., and Mancini, M.: A sensors-based profile heterogeneity index for soil characterization, Catena, 207, 105670, https://doi.org/10.1016/j.catena.2021.105670, 2021.
Svensson, D. N., Messing, I., and Barron, J.: An investigation in laser diffraction soil particle size distribution analysis to obtain compatible results with sieve and pipette method, Soil and Tillage Research, 223, 105450, https://doi.org/10.1016/j.still.2022.105450, 2022.
Taylor, M. J., Smettem, K., Pracilio, G., and Verboom, W.: Relationships between soil properties and high-resolution radiometrics, central eastern Wheatbelt, Western Australia, Exploration Geophysics, 33, 95–102, 2002.
Turner, J., Colwell, S. R., Marshall, G. J., Lachlan-Cope, T. A., Carleton, A. M., Jones, P. D., Lagun, V., Reid, P. A., and Iagovkina, S.: Antarctic climate change during the last 50 years, International Journal of Climatology, 25, 279–294, 2005.
Turner, J., Overland, J. E., and Walsh, J. E.: An Arctic and Antarctic perspective on recent climate change, Int. J. Climatol. A J. R. Meteorol. Soc., 27, 277–293, https://doi.org/10.1002/joc.1406, 2007.
Vingiani, S., Agrillo, A., De Mascellis, R., Langella, G., Manna, P., Mileti, F. A., and Terribile, F.: Multi-sensor approach combined with pedological investigations to understand site-specific variability of soil properties and potentially toxic elements content of an industrial contaminated area, Applied Sciences, 12, 8393, https://doi.org/10.3390/app12083993, 2022.
Viscarra Rossel, R. A.: Fine-resolution multiscale mapping of clay minerals in Australian soils measured with near infrared spectra, Journal of Geophysical Research: Earth Surface, 116, F04023, https://doi.org/10.1029/2011JF001977, 2011.
Warrier, A. K., Sebastian, J. G., Amrutha, K., Yamuna Sali, A. S., Mahesh, B. S., and Mohan, R.: Magnetic Properties of Surface Sediments in Schirmacher Oasis, East Antarctica: Spatial Distribution and Controlling Factors, J. Soils Sediments, 21, 1206–1221, 2021.
Whitfield, J. M., Rogers, J. J. W., and Adams, J. A. S.: The relationship between the petrology and the thorium and uranium contents of some granitic rocks, Geochimica et Cosmochimica Acta, 17, 248–271, https://doi.org/10.1016/0016-7037(59)90099-7, 1959.
Wilford, J. and Minty, B.: The use of airborne gamma-ray imagery for mapping soils and understanding landscape processes, Developments in Soil Science, 31, 409–427, https://doi.org/10.1016/S0166-2481(06)31016-1, 2006.
Wilford, J. R., Thomas, M. A., and Minasny, B.: Modelling soil–regolith thickness in complex weathered landscapes of the central Mt Lofty Ranges, South Australia, in: Digital Soil Assessments and Beyond, edited by: Minasny, B., Malone, B. P., and McBratney, A. B., Taylor & Francis Group, London, UK, 69–75, 2012.
Wilford, J. R., Bierwirth, P. N., and Craig, M. A.: Application of Airborne Gamma-Ray Spectrometry in Soil/Regolith Mapping and Applied Geomorphology, AGSO J. Aust. Geol. Geophys., 17, 201–216, https://www.osti.gov/etdeweb/biblio/499123 (last access: 12 November 2025), 1997.
Wilford, J. R., Searle, R., Thomas, M., Pagendam, D., and Grundy, M. J.: A regolith depth map of the Australian continent, Geoderma, 266, 1–13, https://doi.org/10.1016/j.geoderma.2015.11.033, 2016.
Zhao, X., Zhao, D., Wang, J., and Triantafilis, J.: Soil organic carbon (SOC) prediction in Australian sugarcane fields using Vis–NIR spectroscopy with different model setting approaches, Geoderma Regional, 30, e00566, 2022.
Zhou, Y., Zhao, X., Guo, X., and Li, Y.: Mapping of soil organic carbon using machine learning models: Combination of optical and radar remote sensing data, Soil Science Society of America Journal, 86, 293–310, 2022.
Zhu, C., Wang, H., Li, S., Luo, Y., Xue, T., Song, Y., Qiu, A., and Liu, H.: Mineral magnetism variables as potential indicators of permafrost aggradation and degradation at the southern edge of the permafrost zone, Northeast China, Boreas, 50, 497–518, 2021.