the Creative Commons Attribution 4.0 License.
the Creative Commons Attribution 4.0 License.
 | 16 Sep 2025
An endogenous modelling framework of dietary behavioural change in the fully coupled human-climate FRIDA v2.1 model
Jefferson K. Rajah
Benjamin Blanz
Birgit Kopainsky
William Schoenberg
Integrated assessment models (IAMs) occupy a central role in understanding and assessing the intricate interlinkages within the human-climate system for informing climate mitigation and adaptation strategies. However, there has been limited work on explicitly representing the internal social system dynamics that underlie human behavioural responses to climate change within IAMs. Instead, behavioural change and demand-side strategies are assessed with external, non-probabilistic narrative-based scenario analyses. In this paper, we introduce an alternative fully endogenous behavioural change modelling framework within the FRIDA v2.1 model, operationalized with the system dynamics method. Applied to the context of dietary behaviour, the framework models behavioural change as a function of perceived accessibility, descriptive norm, and personal norms, constrained by accessibility and past behaviour. By doing so, it captures the complex social-economic-cultural-environmental feedback processes within the human-climate system that dynamically determine per capita food demand and consumption. Our simulation results show that endogenizing human behaviour leads to lower future demand projections compared to the more prevalent GDP-driven modelling approach. This demonstrates the significant impact of behavioural feedbacks on emission behaviours and thus climate outcomes. Importantly, using an uncertainty approach, our results account for a range of plausible behaviours within the 95 % confidence bounds, which includes scenarios where we observe reversals of sustainable behavioural change in the future. We contribute to the limited work on human behaviour in IAMs, extending the complexity of current representations. Future work will extend this framework to other domains of high-impact behaviours, enhancing the robustness of IAMs for assessing demand-side mitigation.
- Article
(5154 KB) - Full-text XML
- BibTeX
- EndNote


Global climate change is a highly complex issue characterized by multifarious interconnected feedback interactions between subsystems in the broader human-climate system (Wohlgezogen et al., 2020). Integrated assessment models (IAMs), that integrate knowledge from various disciplines, have come to play a pivotal role for understanding and assessing the impacts of such complex interactions (van Beek et al., 2020). Today, the Intergovernmental Panel for Climate Change (IPCC) relies on IAMs for scenario analysis to support the design of climate mitigation and adaptation strategies. While IPCC authors have emphasized the potential of demand-side mitigation for reducing emissions (e.g., Creutzig et al., 2016, 2018, 2023), most IAMs still do not adequately represent the human system components necessary for assessing climate-relevant behaviours – whether these behaviours are direct responses to climate change or arise from other broader drivers (Beckage et al., 2020; van Valkengoed et al., 2025). The dominant approach, instead, is coupling separate behaviour change narratives and scenarios with IAMs to exogenously drive relevant technoeconomic decisions that interface with biophysical processes (e.g., van den Berg et al., 2019, 2024; Riahi et al., 2017). However, Beckage et al. (2022) warn that the external narratives approach does not provide information about the likelihood of distinct future trajectories, and importantly, fails to capture the internal feedback processes that describe the co-evolution of adaptive human behaviour and biophysical impacts. Accordingly, scholars have called for improved representations of endogenous social processes in IAMs to dynamically model and assess demand-side behavioural change (Beckage et al., 2020; Mathias et al., 2020).
In this paper, we formally introduce our fully endogenous behavioural change modelling framework, operationalized as a system dynamics model, that responds to such calls. System dynamics is a simulation modelling methodology that focuses on representing dynamic complexity surrounding problem behaviours – i.e., the dynamic interactions of key feedback loops, within a closed boundary of a system, that endogenously give rise to system behaviour (Forrester, 1968). Such models are quantified with a system of stocks and flows, which are expressed through integral equations for continuous accumulations over time and differential equations for defining the rates of change. This approach allows us to represent our framework as a set of endogenous feedback processes that determine changes in environmentally significant consumptive behaviour. Briefly, consumptive behaviour is modelled as a function of three sources of motivations (perceived accessibility, descriptive norm, and personal norms), constrained by accessibility and past behaviour. Importantly, these determinants are embedded within and responsive to feedback processes between the human and climate sub-systems. We iteratively developed the framework by abstracting and integrating knowledge from several sources, including an array of behavioural theories (e.g., Bamberg and Möser, 2007; Shove, 2010; van Valkengoed et al., 2025), systematic reviews of extant literature (e.g., Godfray et al., 2018; Hammerseng, 2024; Milford et al., 2019), as well as insights from participatory modelling activities (see Rajah and Kopainsky, 2024, 2025) and preliminary proof-of-concepts (see Tusch, 2024; Rajah et al., 2024).
Our framework is incorporated within the Behavioural Change module of the novel FRIDA (Feedback-based knowledge Repository for IntegrateD Assessments) model version 2.1. Also based on system dynamics, FRIDA aims to represent the co-evolution of the climate and human processes by closing all major feedback loops at the global aggregate scale, and in doing so, provide a fully endogenous, process-based explanation of system behaviour (Schoenberg et al., 2025b). The module endogenously models dietary behavioural change in terms of changes in total caloric food demand and diet shifts between animal products and vegetal products. After situating our modelling framework among existing work, the remaining sections of this paper provide a formal description and evaluation of the framework as applied to dietary behavioural change in FRIDA v2.1. In Sect. 3, we detail the conceptualization and quantification of the framework. Section 4 reports the calibration and uncertainty analysis process used for model parameterization, along with the results. In Sect. 5, we compare and explain differences in the baseline results from our endogenous modelling framework versus the standard GDP-driven modelling approach that does not represent behavioural change processes. We conclude with a discussion of the results, the framework's contributions and its limitations.
To date, there have been limited studies that have fully endogenized behavioural change within existing IAMs or similar human-climate models. Beckage et al. (2018) were among the first to fully couple a social model with a climate model to capture human behavioural responses as part of climate feedback: people's perceptions of a climate risk, based on the frequency of extreme events, alter their subsequent emission behaviours. In turn, such behavioural change affects emissions, influencing global mean temperature and the occurrence of extreme events. Climate risk is modelled as a function of stochastic extreme events in memory (events are perceived but also forgotten after a certain delay time), with structural uncertainty over the functional form as either linear, logistic, or cubic (Beckage et al., 2018). Premised on the Theory of Planned Behaviour (Ajzen, 1991), perceived climate risk endogenously influences attitudes, which then determines emissions behaviour change. All other theoretical constructs (e.g., efficacy, social norms, behavioural control) were kept exogenous. Having demonstrated that such coupling resulted in altered climate projections, the authors emphasize the need for endogenizing human behavioural change (Beckage et al., 2018, 2020).
Following this study, Eker et al. (2019) adapted the model to the behaviour-specific context of diet shifts within the FeliX IAM, while retaining the original climate risk perception model structures and the main theoretical constructs. They innovate by closing an additional social transmission loop to endogenize social norms. For this purpose, the global population is segmented into a two-stock structure for meat-eaters and lacto-ovo vegetarians (Eker et al., 2019). People shift from meat-based to vegetarian diet based on changes in income (per capita GDP). On the other hand, the shift from vegetarian to meat-based diet is determined by attitudes, social norms, and a constant perceived behavioural control. Here, descriptive social norms are represented as the prevalence of the population segments: as the proportion of vegetarians increases, more people shift their diets by way of social transmission. In addition to the effect of climate risk on attitudes (as described above), Eker et al. (2019) further include perceived health risk from changes in deaths related to red meat consumption as another determinant, following the Protection Motivation Theory (Rogers, 1975; Prentice-Dunn and Rogers, 1986).
The behavioural components of both models are grounded on compatible social-psychological theories (i.e., Theory of Planned Behaviour and Protection Motivation Theory) with similar constructs. However, psychologists contend that there is a plurality of theories that could challenge or expand upon any one theory, and focusing only on theories could exclude non-psychological determinants of behaviour (Nielsen et al., 2021; van Valkengoed et al., 2025). To mitigate this challenge, our framework integrates various theories consistent with the Motivation, Agency, Past Behaviour meta-theoretical framework (van Valkengoed et al., 2025), along with insights from experiential knowledge and non-psychological determinants in the literature. Consequently, our framework extends existing work by closing additional feedback loops involving socioeconomic and sociocultural processes.
Pettifor et al. (2023, 2024) recently introduced an alternative framework to endogenously model shifts in lifestyle archetypes (Resourceful, Active, Constrained and Cautious) as opposed to behaviours. Each of the four lifestyle archetypes is assigned different propensities for low-carbon behaviours, which then serve as inputs to IAMs. Arguably, population segmentation into neatly defined identity categories masks internal variations and assumes that people consistently adhere to their respective identities across various social and material contexts of environmentally significant behaviours. This contradicts the known value-action gap, wherein “people who espouse green values do not always act in accordance with them” (Shove, 2010, p. 1276). Instead, social scientists have varyingly called for a behaviour-specific focus to understand how complex feedback processes, embedded in socio-material arrangements, contribute to behaviour change (e.g., Demski et al., 2015; Lange and Dewitte, 2019; Manfredo et al., 2017; Nielsen et al., 2021; Shove, 2010). Accordingly, our behaviour-specific modelling framework seeks to represent important social-economic-cultural-environmental feedback processes that endogenously determine changes in dietary behaviours.
Moreover, our modelling choices significantly depart from previous behavioural models (i.e., Beckage et al., 2018; Eker et al., 2019). First, we model climate risk perception as a function of both experiential (i.e., extreme events exposure) and cognitive processes. This accounts for the modulating effects of climate knowledge and is more consistent with psychological models of risk (van der Linden, 2015; Villacis et al., 2021). Also, perceived risk is not determined by present state values (i.e., stock of extreme events in memory in both models) but by normalized values to changing reference conditions of normality. This is in line with models of human judgments where “reference dependence is ubiquitous in sensation and perception” (Kahneman, 2011, p. 275), allowing us to capture the psychophysical process by which people adapt to changing conditions over time. Second, we do not segment the global population into dietary categories (e.g., meat-eaters vs. vegetarians). Dietary choices are multi-dimensional and heterogenous, encompassing an array of individual consumption practices within each identity category. In Eker et al. (2019), for instance, changes in followers of meat-based diets and vegetarian diets are modelled endogenously. However, the time-varying shifts in average diet composition for each of these identity categories are modelled exogenously. Accurately representing such nuances in identities and practices requires high-resolution intra-sectoral modelling, which contrasts with FRIDA's focus on highly aggregated processes to close the inter-sectoral feedback loops within the human-climate system. Instead, our modelling framework captures the endogenous behavioural processes that determine changes in both aspects of dietary behaviour: (i) the aggregate per capita caloric intake of food products, and (ii) the average dietary composition (animal vs. vegetal products). In that sense, we do not focus on any one direction of behavioural change (e.g., pro-environmental shift from meat-based to vegetarian diets); rather, diet shifts may or may not be sustainable from a climate mitigation perspective, depending on the underlying behavioural processes.
Given that our model is embedded within the novel global IAM, FRIDA v2.1, we first present a brief overview of the FRIDA model (see Schoenberg et al., 2025b for more details). FRIDA represents the climate and human systems together, each represented with similar levels of fidelity. FRIDA places strong emphasis on feedback dynamics and interpretability. It endogenously incorporates key components of the Earth system such as the radiation balance, carbon and water cycles, and it does so alongside the endogenous representation of human factors like population, economy (including GDP), agriculture, and energy use. The only exogenous inputs to FRIDA are solar radiation cycles, Montreal gas emissions, and global policy (economic, climate or otherwise). The FRIDA model is capable of simulating from 1980–2150, reproducing historical behaviour with no additional exogenous inputs.
In prevailing technoeconomic modelling approaches, food demand, D, is typically expressed as a function of per capita real GDP (proxy for income) and population, P (e.g., Bijl et al., 2017; Tilman et al., 2011; Tilman and Clark, 2014). Fitted to empirical data and projected into the future, D increases less than proportionally (βgdp<1) with higher income levels. Within FRIDA's Land Use and Agriculture (LUA) module, we reproduce this standard formulation with a switch (“use GDP for food demand”) to toggle between the GDP-driven model and our novel endogenous modelling framework for comparison purposes. Equation (1) represents the GDP-driven model, which is applied to both food demand for direct consumption, measured in kilocalories per person per day (kcal p−1 d−1), and animal products demand per capita, measured in petacalories per million person per year (Pcal Mp−1 yr−1).
where D represents the respective food demands, P is the total global population (Mp), GDPp is the perceived real GDP per capita (B USD Mp−1 yr−1), and βgdp is the sensitivity of demand to changes in income (dmnl).
GDPp is modelled as an exponential smooth of real GDP per capita (GDP) – see Eq. (2). Exponential smooths are used to model perception delays, where perceptions are updated gradually as newer information becomes available, thus smoothing out temporary fluctuations in the information input (Sterman, 2000).
where GDPp(0) is the initial perceived real GDP per capita set to GDP(0), and ATgdp is the averaging time or the delay time for changes in income to affect demand.
The averaging time determines the rate at which existing perceptions are discounted: smaller averaging times give more weight to newer information (i.e., quick to update perceptions), while larger averaging times gives more weight to older information (i.e., slow to update perceptions).
Our endogenous modelling framework, encapsulated within FRIDA's Behavioural Change module, comprises three sub-modules: Animal Products Demand, Total Food Demand, and Climate Risk Perception (see Fig. 1). Total Food Demand captures changes in overall diet (total desired caloric intake), whereas Animal Products Demand computes changes in the share of animal products in the average diet. Vegetal products demand is calculated as the remaining share. We model the key behavioural processes that endogenously determine changes in total food demand (i.e., diet) and animal products demand (i.e., diet composition). This provides input to the supply-side dynamics within LUA module, where food production adjusts to changes in demand. In turn, production determines the available supply for consumption, which influences the various behavioural processes that determine food demand. This creates direct two-way feedback between the Behavioural Change and LUA modules, placing demand and supply on equal footing. Additional indirect feedback interlinkages are formed with the Climate, Demographics, and Economy modules. For a description of these other modules, see Schoenberg et al. (2025b). The rest of this section documents the conceptualization and formulations of our modelling framework. For expediency, we report uncertain parameter values and ranges in Appendix A.
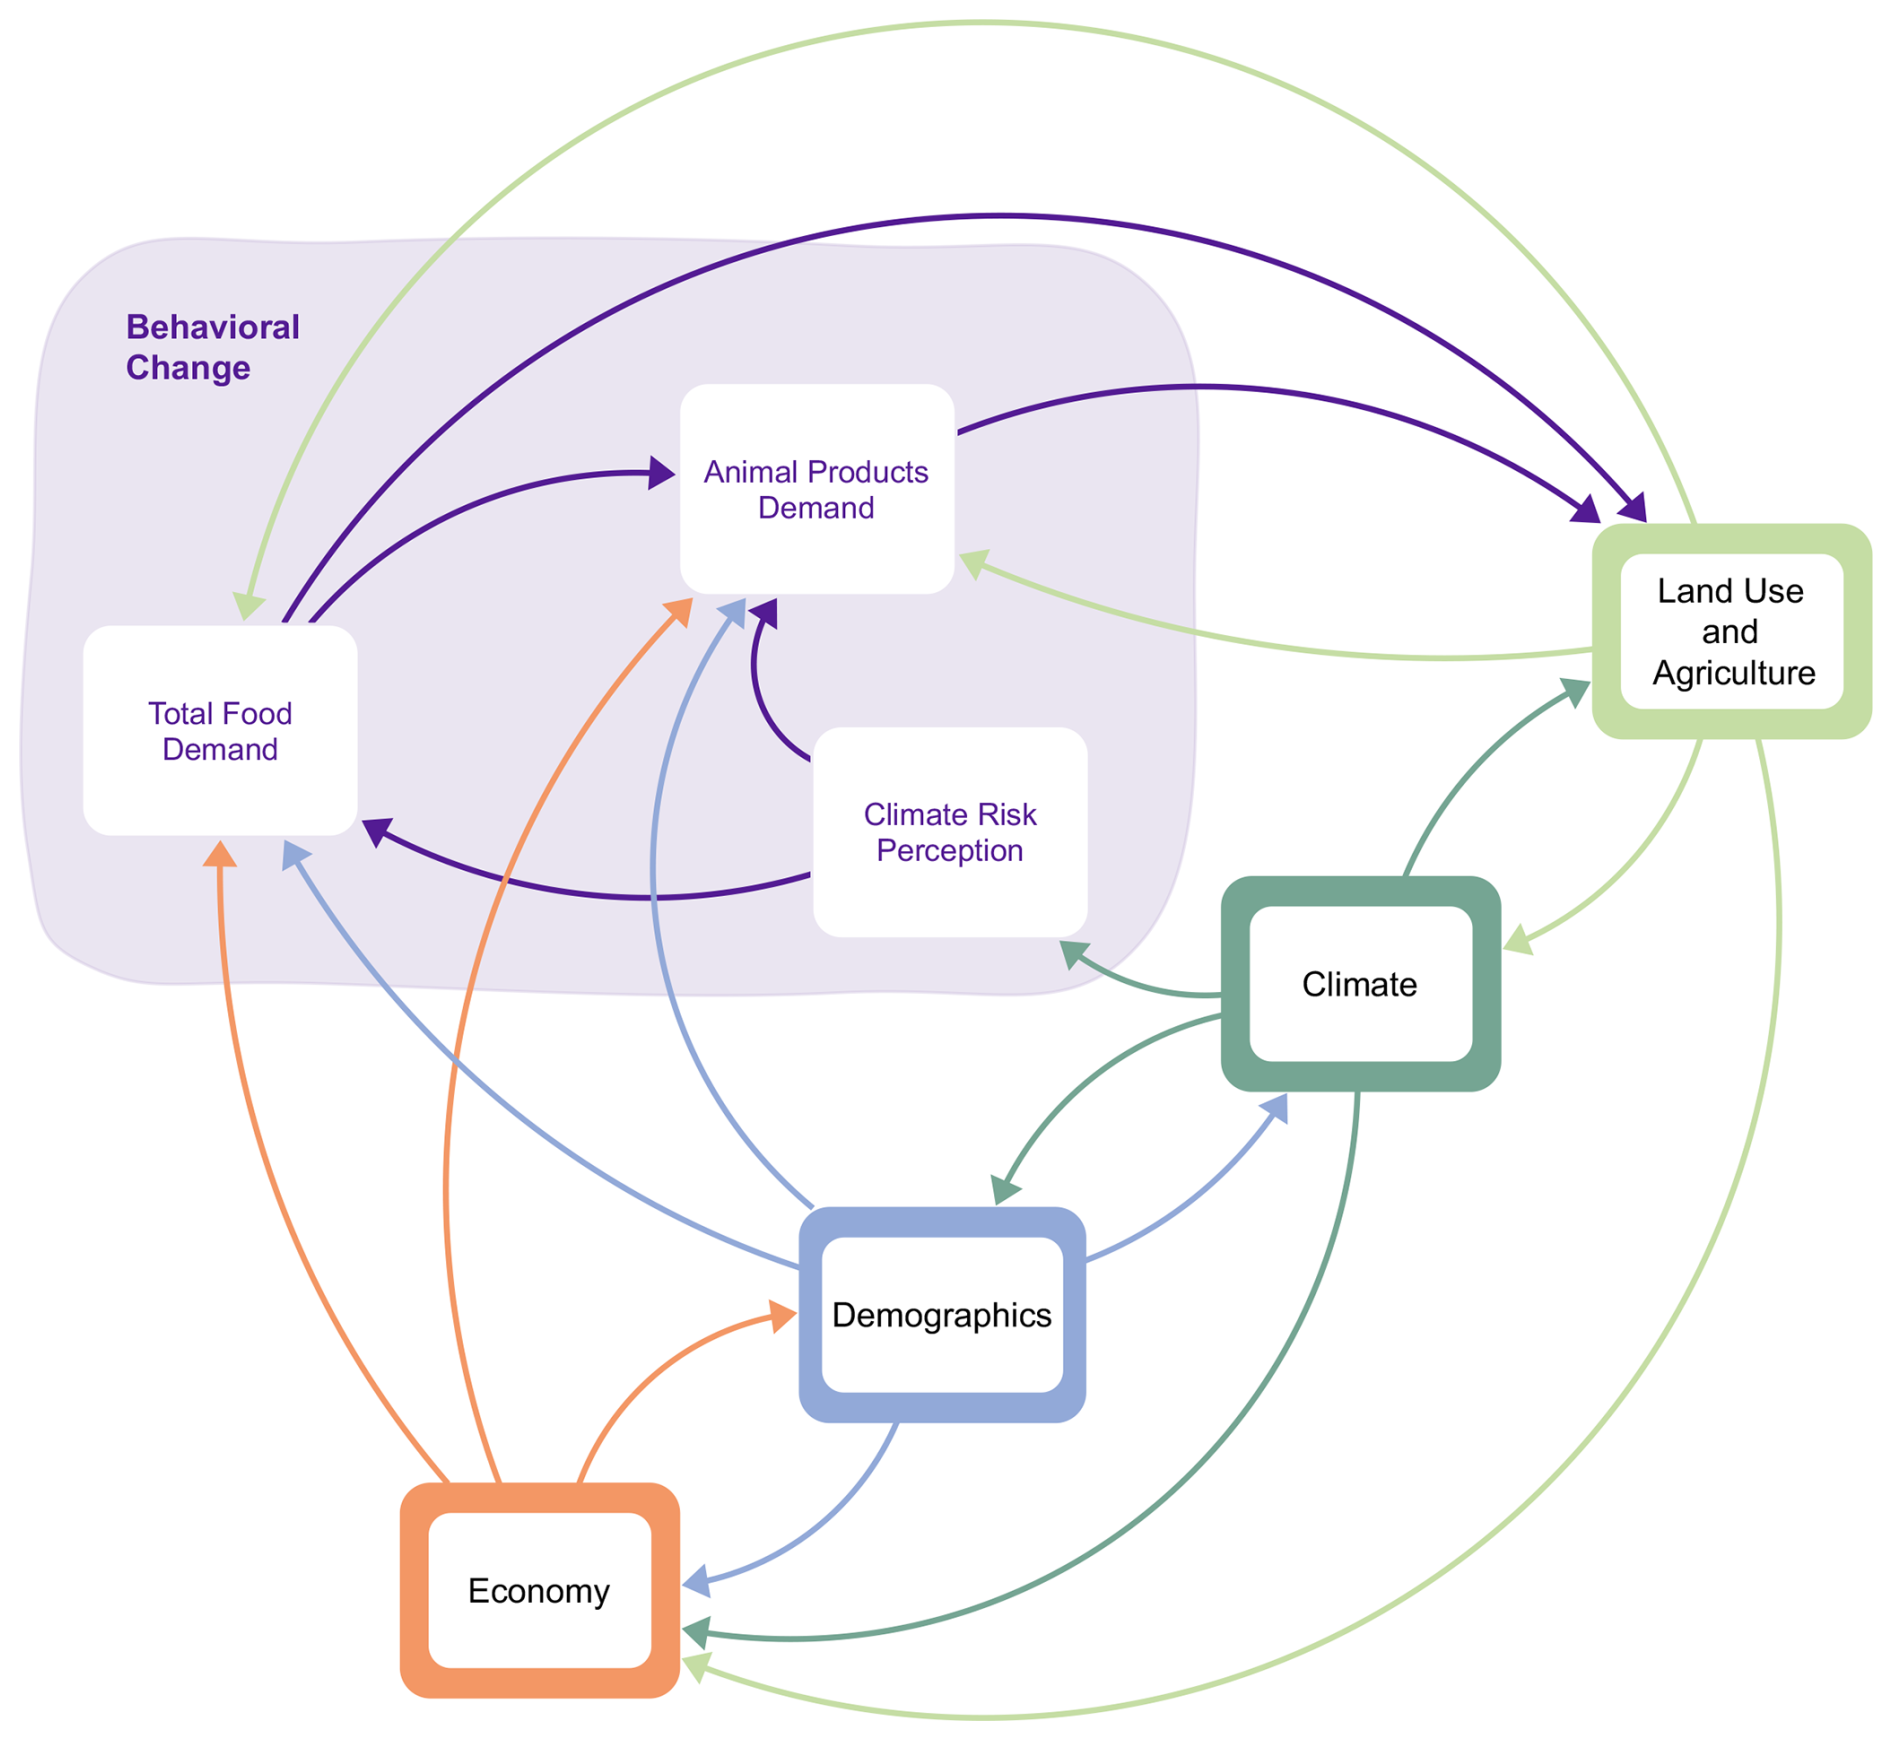
Figure 1Sub-system diagram of Behavioural Change module (in blue) and its interlinkages with other relevant top-level modules in FRIDA v2.1.
3.1 Modelling dietary change
The framework represents several endogenous processes, beyond the simplified GDP-driven model, which influence dietary behaviour in terms of per capita demand and consumption (see Fig. 2). Unless otherwise stated, the structure is replicated for both total food demand and animal product demand. The average daily demand (ADD), measured in kcal p−1 d−1, is determined by the desired average daily demand (DADD) or the accessible demand from perceived accessibility (DADDa), whichever is smaller. This ensures that dietary behaviours are constrained by agency or the ability to act on intentions (Ajzen, 1991; van Valkengoed et al., 2025). After accounting for population and unit conversion, total demand influences total production (Pcal yr−1) in the LUA module. Here, the supply-demand balance each year influences future decisions for adjusting production capacity and yield. Additionally, a reserve capacity multiplier is included to buffer against demand fluctuations, implicitly capturing the role of strategic reserves without modelling explicit inventory dynamics. Global food inventory dynamics were deemed unimportant over the multi-decadal time scale of FRIDA. The average daily consumption (ADC; kcal p−1 d−1) is computed as either the total production or total demand (smaller of the two) and normalized by population. This provides an additional constraint on behaviour such that people cannot consume beyond the available supply. In this context, DADD is the dietary behavioural intention that is adjusted by four groups of behavioural processes: (i) past behaviour from habits that moderate desired changes in behaviour; (ii) perceived accessibility in terms of socio-economic factors determining the affordability and availability of food products; (iii) descriptive norm that describes what others in the social environment are doing, which exerts a conformity pressure; and (iv) personal norms or standards that people hold and expect of themselves, which are shaped by perceptions of the social and natural environment.
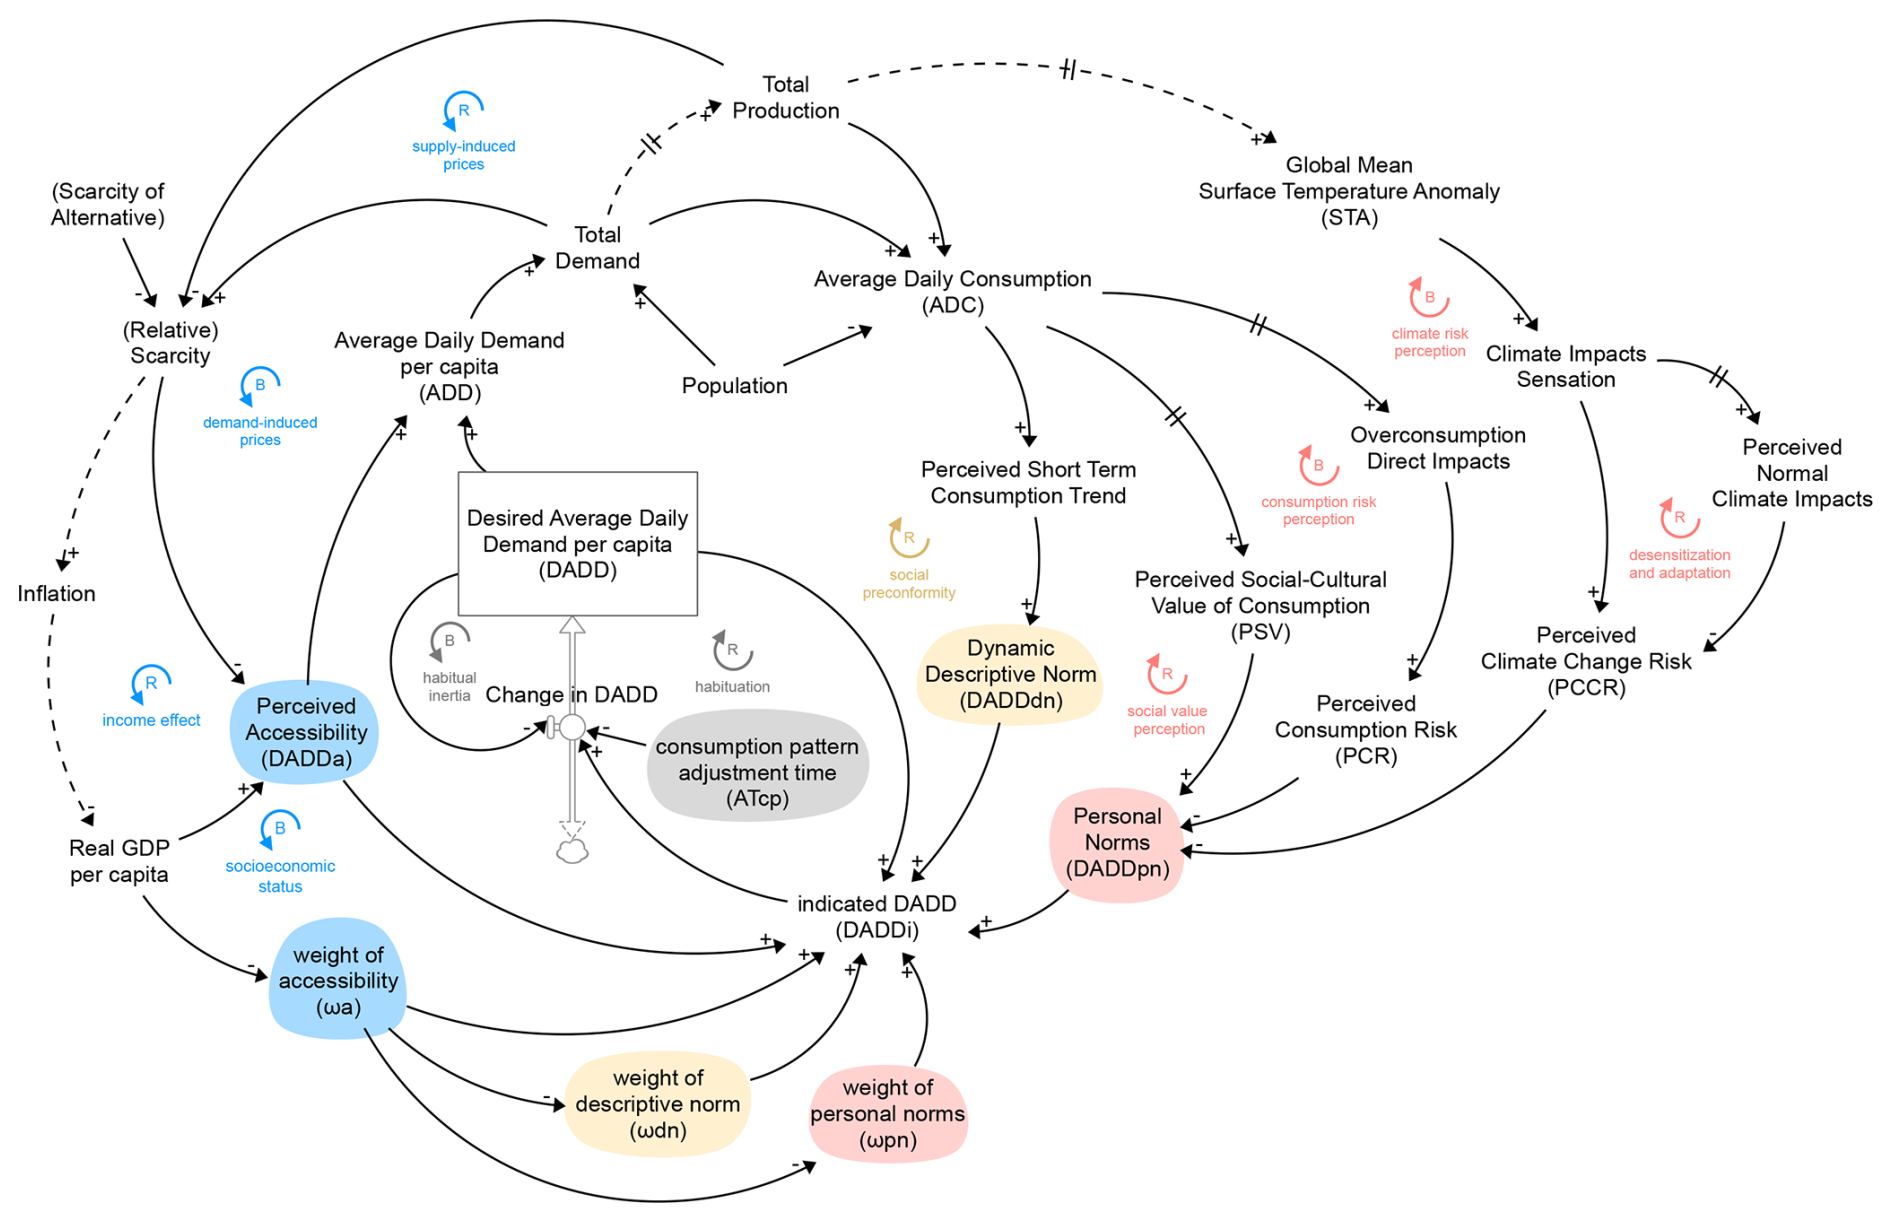
Figure 2Simplified causal loop diagram of the endogenous modelling framework; colour coding: grey is associated with past behaviour, blue is associated with perceived accessibility, yellow is associated with descriptive norm, and red with personal norms; R labels denote reinforcing loops (changes are amplified) whereas B labels denote balancing loops (changes are attenuated); double strokes on connectors indicate delays; solid connectors are internal to the Behavioural Change module while dashed connectors denote connections to other modules in FRIDA.
3.1.1 Past behaviour
Humans are creatures of habit, where past habitual behaviour exerts an unconscious influence that could inhibit sustained behaviour change (Linder et al., 2022; van Valkengoed et al., 2025). Sustained repetition is required for the formation of a new habitual behaviour. To represent habituation and the barrier it poses, DADD is modelled as a stock (i.e., integral) that adjusts gradually to its indicated value, measured in kcal p−1 d−1, with a certain delay time for the new behavioural pattern to become sustained, as shown in Eq. (3):
where DADD is desired average daily demand (kcal p−1 d−1); DADDi is the indicated value that the stock adjusts towards, and ATcp is the averaging time to adjust consumption patterns (year).
As explained previously, larger averaging times give more weight to past habitual behaviour, representing its inhibiting influence. DADDi is modelled as a weighted average of the desired demand computed from the remaining motivational processes that determine behavioural intentions: perceived accessibility, descriptive norm, and personal norms – see Eq. (4).
where DADDa is the desired demand from perceived accessibility, DADDdn is the desired demand from descriptive norm, DADDpn is the desired demand from personal norms, and ω is the average weight (dmnl) or relative importance attributed to each motivational process.
An additive weighted average is used to account for actor heterogeneity at the global scale. Within and across countries, individuals hold differing stable value priorities (Fischer and Schwartz, 2011), placing varying weights on each behavioural motivation. Conflicting values may also be activated under different situational contexts, causing certain motivational processes to become more prominent (De Groot and Steg, 2009): e.g., a person might succumb to the social pressure of the descriptive norm in one situation, but act on their personal norms in another. Using a weighted average formulation allows for the integration of these diverse motivational processes while reflecting their relative importance, on average, across different individuals and contexts.
3.1.2 Perceived accessibility
Accessibility, here, refers to perceptions of the affordability and availability of food products, generally involving socio-economic factors such as price, income, and economic development (Godfray et al., 2018; Milford et al., 2019). For animal products, people are not only responsive to changes in price, but also to its relative price: they are more willing to purchase and consume animal products when its price decreases more than changes in the price of its substitute, and vice versa (Milford et al., 2019). However, since FRIDA does not model the prices of products directly given its level of aggregation, the concept of scarcity (represented by the supply-demand balance) is used as proxy for price. Following the microeconomic principle, we assume that gaps in the supply-demand balance drive price changes at the margins (Tomek, 2000). Relative prices, then, is captured by comparing the supply-demand balance between animal products and all crop products (e.g., food products, feed for animals, biofuel crops, and other uses). Hence, when the animal products are relatively more available (i.e., less scarce) than crop products, people are more willing to increase their animal products demand. The responsiveness of the perceived accessible animal products demand to relative scarcity is modelled following Eq. (5):
where productionap is the animal products production rate (Pcal yr−1), demandap is the total animal products demand (Pcal yr−1), productioncrop is the crop production rate (Pcal yr−1), demandcrop is the total crop demand (Pcal yr−1), and βs is the sensitivity of demand to relative scarcity (dmnl) and is set to less than 1 (Milford et al., 2019).
The structure is different for total food demand, since there are no alternatives to food – i.e., food scarcity is not relativized. Instead, the combined animal and vegetal products supply-demand balance is used as a measure of food availability/scarcity and the attendant proxy for changes in price. It should be noted that with FRIDA, we do not model malnourishment; crop demand for direct food consumption is first met, taking away from the availability for all other uses. Consequently, food scarcity is mainly responsive to the animal products balance.
The other key driver of accessibility is changes in income: as income increases, people not only expand their caloric intake but also substitute more of their diet with animal products (Milford et al., 2019; Schmidhuber and Shetty, 2005; Tilman and Clark, 2014). Like other models, we express the income effect on demand as a function of changes in GDP as in Eq. (6):
where GDP(0) is the initial real GDP per capita converted to USD p−1 yr−1 and held constant to the 2021-dollar value, and βi is the sensitivity of desired demand from perceived accessibility to changes in income (βi<1; dmnl).
In the GDP-driven model, described previously, GDP is exponentially smoothed to account for delays. Here, DADDa is exponentially smoothed to account for the perception of both scarcity and income effects – as shown in Eqs. (7) and (8):
where DADDa is the desired demand from perceived accessibility (kcal p−1 d−1), DADDia is the indicated perceived accessible demand (kcal p−1 d−1), ATa is the averaging time (year) for taking stock of changing socioeconomic conditions and adjusting the perceived accessible demand, and DADDa(0) is the initial value of the stock set to DADD(0), which is the reference average daily demand.
With the multiplicative formulation in the indicated accessible demand (DADDia), the response to changes in income is moderated by availability. Equation (8) is formulated differently for animal products demand, since it is a subset of total food demand. Instead, the effects are applied on the initial share of animal products in diets, %AP( , representing more substitution of diet with animal products as it becomes more available (less scarce) and/or income increases. %AP is constrained to a maximum of 1, under extreme conditions, and multiplied with the average daily food demand (ADDTF input from Total Food Demand module) to determine DADDia for animal products. In doing so, we account for both the desired expansion and substitution of calories.
However, econometric analyses of empirical data have found that the income effect follows an inverted u-shaped curve: while consumption increases with income (less than proportionally), it reaches an inflection point at a certain level of income and declines thereafter (Cole and McCoskey, 2013; Milford et al., 2019; Vranken et al., 2014). Using a non-monotonic function to represent both an increase and decrease in demand serves as an unsatisfactory explanation from a process-based perspective. A social-psychological perspective might provide a better explanation: less accessible dietary behaviours can amass a symbolic value as markers of socioeconomic status, making them more desirable to individuals from lower socioeconomic groups as a form of compensatory consumption aimed at signalling upward social mobility or aspirational identity (Chan and Zlatevska, 2019; Doyle and Richardson, 2025). Higher socioeconomic class consumers, having greater material security and social capital, are generally less influenced by the symbolic status of consumption; instead, they are more likely to prioritize post-material concerns and cultural values such as health, environmental sustainability, and ethical considerations (Doyle and Richardson, 2025; Vranken et al., 2014). We capture this socioeconomic effect as a distinct process. While DADDa represents the potential accessible desired demand, the extent to which it becomes realized is determined by how much weight is given to accessibility, ωa. Less weight is given to accessibility as GDP per capita increases over time, by way of a logistic function as expressed in Eq. (9):
where ωa is the weight of perceived accessibility (dmnl), ωref is the reference weight (dmnl), GDPref is the reference GDP value for the inflection point (USD p−1 yr−1), m is the minimum effect (dmnl), L is the maximum effect (dmnl), and k is the steepness of the curve (dmnl) that determines the rate of change.
The reference weight, ωref, is set to one-third denoting that all three motivational processes (accessibility, descriptive and personal norms) are weighted equally when GDP reaches its inflection point. As income increases beyond the reference value, the socioeconomic effect on ωa decreases at a decreasing rate to a minimum effect (m). The effect increases decreasingly to a maximum (L) as income falls below its reference. A variance parameter, v, is added to L and m in order to vary the minimum and maximum effects symmetrically around the inflection point in sensitivity analyses. This allows us to explore different ranges of socioeconomic effects while holding the inflection point at GDPref. The remaining weight is then evenly distributed between the other two processes as computed in Eq. (10):
where ωdn is the weight of descriptive norm and ωpn is the weight of personal norms.
3.1.3 Descriptive norm
The descriptive norm refers to perceptions of typical or prevailing behaviours within the social environment, which provides a social motivation for people to conform (Cialdini, 2007; Cialdini et al., 1991; van Valkengoed et al., 2025). Sparkman and Walton (2017) further distinguish between static and dynamic descriptive norms. The static norm indicates the current state of the prevailing behaviour (e.g., eating meat is normal), whereas the dynamic norm points to how the norm is changing over time (e.g., more people have been reducing their meat consumption). They contend that people may form expectations about the future state of normative behaviour based on their perceptions of changing social trends, which motivates “preconformity” to behaviours that are presently counter-normative (Sparkman and Walton, 2017, p. 1664).
We model the process of conformity to the dynamic descriptive norm as a weighted adjustment of DADD to expectations of the normative behaviour (DADDdn) – see Eq. (4). Expectation formation can be modelled with the TREND function, which computes the past growth rate of an input variable in order to estimate its likely future value (Sterman, 1987). In our case, the input variable is the current (static) normative behaviour, ADCp (perceived average daily consumption), which is an exponential smooth of ADC, as shown in Eq. (11):
where ADCp is the perceived average daily consumption (kcal p−1 d−1), ADC is the actual average daily consumption rate (kcal p−1 d−1), ATadc is the averaging time (year) for perceiving the current behaviour, and ADCp(0)=ADC(0).
People do not have perfect information on the year-on-year changes in consumption rates; rather the perceived trend is anchored on an estimated normal reference consumption from the recent past. This short-term reference, ADCSTref, is thus modelled as an exponential smooth of the ADCp with a short-term time horizon of the recent past (ATSTref), initialized with ADCp(0). The short-term trend for changes in perceived consumption is then computed in Eq. (12) as the average yearly growth rate of ADCp relative to ADCSTref:
where TrendST is the short-term trend (dmnl yr−1), ADCp is the perceived average daily consumption (kcal p−1 d−1), ADCSTref is the short-term reference average daily consumption rate (kcal p−1 d−1), and ATSTref is the short-term time horizon time (year).
The TrendST provides an indication of whether the static descriptive norm is trending upwards or downwards over the short term – i.e., the perceived changing social trend. Based on this indication, people form an expectation of what the dynamic descriptive norm (i.e., DADDdn) would be in the immediate future by adjusting the desired demand (DADD) proportionally to the growth rate of the trend, as shown in Eq. (13):
where DADDdn is the desired average daily demand from descriptive norm (kcal p−1 d−1), DADD is the desired average daily demand (kcal p−1 d−1), and ATexp is the expectation time horizon for the immediate future set to 1 (year).
Here, the anchoring and adjustment of previous behavioural intentions (i.e., DADD) captures the reinforcing habituation feedback: DADDdn is both determined by and a determinant of DADD. Thus, a persistent upward trend in consumption would amplify the upward adjustment of DADD over time, counteracting the inertia of past habitual behaviour.
3.1.4 Personal norms
Personal norms refer to the individually-held personal standards that one expects of themselves and are founded in personal values, moral beliefs, and attitudes toward a certain behaviour (Kaiser et al., 2005; Niemiec et al., 2020; Schwartz, 1977; van Valkengoed et al., 2025). This is distinguished from injunctive social norms, which are society-wide standards or socially approved ways of acting (Cialdini et al., 1991). While there is no consensus within psychology literature on the nature of relationships between the various norms, Niemiec et al. (2020) found personal and descriptive norms to be more significant predictors of behavioural intentions than injunctive social norms. However, personal norms are not formed in a vacuum but shaped by the existing social environment that provides information about socially approved ways of acting (Bamberg and Möser, 2007). Similarly, from a sociocultural perspective, personal values are socially constructed within a social system and reproduced through feedback processes: certain behaviours are assigned a social-cultural value or worth and reinforced as social practices (Demski et al., 2015; Godfray et al., 2018; Kendal and Raymond, 2019; Manfredo et al., 2017). In other words, people internalize injunctive social norms, at least in part, as personal norms (Bertoldo and Castro, 2016).
We represent the internalization of injunctive norms by modelling the perceived social-cultural value, PSV, of the dietary behaviour based on long-term consumption patterns. Like descriptive norm perception, a reference long-term ADC is modelled as an exponential smooth to represent the normal consumption level in the distant past, as shown in Eq. (14):
where ADCLTref is the reference long-term average daily consumption rate (kcal p−1 d−1), ADCp is the perceived average daily consumption rate (kcal p−1 d−1), ATLTref is the long-term time horizon (year) under consideration, and ADCLTref(0)=ADCp(0).
We assume that when ADCp is more (or less) than ADCLTref, the behaviour has become more (or less) institutionalized as a social practice, in turn adjusting PSV proportionally. As sociocultural scholars contend, reproduction of social practices make social values sticky phenomena that require lasting long-term observation for change (Manfredo et al., 2017). A delay process is thus introduced for the adjustment of PSV to its indicated value – see Eqs. (15) and (16).
where PSV is the perceived social-cultural value of the behaviour (dmnl), PSVi is the indicated value (dmnl) that the stock adjusts to, ATpsv is the averaging time (year) for the social value perception, PSVn is the normal perceived social-cultural value (dmnl), and αadc is the sensitivity parameter for value perception (dmnl).
PSVn is fixed at a normalized value of 1 since PSV is conceptualized as a dimensionless relative variable. The sensitivity parameter, αadc, determines how aggressively PSV adjusts to relative changes in long-term consumption patterns. In turn, PSV provides the contextual information about societal standards that is internalized as a source of influence on personal norms.
Personal norms are also shaped by the socio-ecological environment, which provides informational cues about risks and consequences of certain behaviours (Bamberg and Möser, 2007). For one, the perceived consumption risk (PCR) represents the direct tangible impacts of overconsumption that pose a threat to people, adversely influencing moral beliefs and attitudes. For food and animal products, this is often tied to concerns over adverse health consequences and moral concerns over animal welfare (Berndsen and van der Pligt, 2005; Godfray et al., 2018). We model PCR as the average daily consumption relative to a healthy reference level, ADCHref, with exponential smoothing applied to capture the delay for consequences to be observed, as shown in Eq. (17):
where PCR is the perceived consumption risk (dmnl), ADC is the average daily consumption rate (kcal p−1 d−1), ADCHref is the healthy reference average daily consumption rate, ATpcr is the averaging time (year) to observe the consequences in consumption risk perception, and PCR(0) is the initial ADC relative to ADCHref.
ADCHref is set to the planetary health diet recommendation of 2500 and 304 kcal p−1 d−1 for total food and animal products respectively, which accounts for both nutritional requirements and sustainable production (Willett et al., 2019). PCR is the second source of influence on personal norms.
The third source of influence on personal norms is the perceived climate change risk, PCCR, which is an input from the Climate Risk Perception module, described in the next section. Unlike PCR that is based on direct observable consequences of overconsumption, PCCR stems from indirect consequences. Therefore, subjective attribution is necessary for connecting indirect climate consequences to behaviour (Ogunbode et al., 2019; Wong-Parodi and Berlin Rubin, 2022). PCCR represents the attribution of perceived changes in climatic conditions to climate change, more generally. It is then differentially attributed to personal norms surrounding specific behavioural domains. For instance, the same PCCR might have a stronger influence on reducing animal products demand (i.e., dietary shifts), than on reducing total food demand (i.e., reducing waste).
The desired demand from personal norms, DADDpn, accounts for people's response to all three informational sources. In psychophysical models of human perception, the sensation of the intensity of a certain stimulus is often modelled as power function (Stevens, 1975). The exponent in this power function tends to be less than 1 for social stimuli, indicating that people's response diminishes with larger magnitudes due to desensitization from psychophysical numbing (Fetherstonhaugh et al., 1997; Slovic, 2007). Others have also emphasized reference dependence in human judgments, where the magnitude of the stimulus is judged relative to a reference point, such as expected values or past experiences (Kahneman, 2011; Kahneman and Tversky, 1979). The power law has been applied to scale social phenomena, for quantifying responses to social influences (e.g., Stevens, 1975), humanitarian disasters (e.g., Slovic, 2007), and epidemic risks (e.g., Bagnoli et al., 2014; Noyes, 2021). Accordingly, we express DADDpn as a scaled adjustment of DADD to the three perceptions, as shown in Eq. (18):
where DADDpn is the desired average daily demand from personal norms (kcal p−1 d−1), DADD is the desired average daily demand (kcal p−1 d−1), PSV is the perceived social-cultural value (dmnl), PCR is the perceived consumption risk (dmnl), PCCR is the perceived climate change risk (dmnl), and the dimensionless sensitivity parameters (β) determine the responsiveness of personal norms to each perception.
The perceptions, here, are already expressed as relative values, accounting for reference dependence. A multiplicative formulation is used since the effects are likely not independent: e.g., a high social-cultural significance attached to meat consumption (PSV) weakens the moral imperative to protect the climate (PCCR). These perceptions, together, provide the social cues for adjusting DADD upwards or downwards, contributing to the gradual habituation of new behavioural intentions guided by personal norms. For total food demand, a minimum caloric intake of 1800 kcal p−1 d−1 is set for DADDpn to prevent malnourishment under extreme scenarios. The MAXSOFT function (see Mathematical builtins, 2025) is used to smoothly transition DADDpn towards the minimum with a tolerance of 100 kcal p−1 d−1.
3.2 Modelling perceived climate change risk
Psychological models of climate risk perception generally consider four main determinants: experiential, cognitive, socio-demographic and socio-cultural factors (van der Linden, 2015; Villacis et al., 2021). Experiential processes refer to affective evaluations of personal experience with climate change (e.g., exposure to extreme weather events) and/or indirect vicarious experience (e.g., media representations) that attach negative risk-as-feelings (Akerlof et al., 2013; Leiserowitz, 2006; van der Linden, 2015). Cognitive factors such as levels and accuracy of climate change knowledge underpin reasoning about risk severity and have found to be positively associated with climate risk perceptions (van der Linden, 2015; Xie et al., 2019). In our model, we express PCCR as a function of both experiential and cognitive processes as shown in Eq. (19):
where PCCR is the perceived climate change risk (dmnl) and PCCRn is the normal perceived risk set to an index value of 1 (dmnl).
PCCR>1 indicate that current climatic conditions are perceived as abnormal, whereas PCCR<1 indicate better-than-normal perceived conditions. A multiplicative formulation allows cognition to modulate experience: when knowledge about climate change is taken more seriously, affective responses to climate events are heightened and thus risk perception is amplified. We exclude socio-demographic factors (e.g., age, gender, income and educational level) in our model since they have been found to be relatively insignificant predictors (Xie et al., 2019). Socio-cultural factors, such as individual value orientations and norms surrounding climate mitigation (Xie et al., 2019), are implicitly included as weights assigned within the cognitive and experiential processes (i.e., averaging times and sensitivities). Pro-environmental values and norms, for instance, would suggest a higher weight and therefore a stronger risk perception. Such socio-cultural factors are kept exogenous and captured as part of model-wide calibration due to the lack of time-series data for PCCR, especially at the global level.
3.2.1 Exposure
In our model, the experiential effect captures affective responses to extreme weather events exposure and flooding exposure from sea level rise (SLR). Extreme weather events are modelled in the Climate module as climate indices (listed below) with record-breaking exposure, measured in indices per p per year. The climate indices estimate the average exposure to at least one historically record-breaking weather event at the global scale, weighted by population (see Wells et al., 2025). Expressed as a function of global mean surface temperature anomaly (STA), the climate indices aggregate local record-breaking exposures calculated at the grid-cell level data from 35 climate models across seven metrics as found in Li et al. (2023): annual total precipitation, maximum 1 d precipitation, days with heavy precipitation, warm days, heatwave, sequential precipitation-humid heatwave, and compound drought and heatwave. In the Climate Risk Perception module, the perceived extreme weather events exposure is modelled as an exponential smooth of climate indices to account for the perception delay, as in Eq. (20):
where PWE is the perceived extreme weather events exposure (indices per p per year), “climate indices” represents the average exposure to extreme or record-breaking events (indices per p per year), ATpwe is the averaging time (year) to update perceptions of exposure, which also reflects the rate of discounting of new experiences, and PWE(0) is set to climate indices(0).
Since human judgments are reference dependent, Osberghaus (2017) argues that climate change responses are dependent on people's reference for the baseline climate condition. Importantly, perceptions of normality changes over time as people acclimatize – i.e., what is defined as abnormal today could become the new normal at a later point in time (Hulme et al., 2009; Osberghaus, 2017). Consequently, not only does the sensation of risk marginally diminish as exposure increases (from the power law), but it further declines over time as the reference condition updates to a newer normal. The reference exposure, PWEref, is an exponential smooth of PWE to model updating reference conditions, as shown in Eq. (21):
where PWEref is the reference perceived extreme weather events exposure (indices per p per year), ATrpwe is the additional averaging time (year) for updating perceptions of the reference normal exposure, and PWEref = PWE(0).
The additive formulation ensures that the perception of the reference condition can never update faster than perceptions of the present condition (e.g., in multivariate sensitivity analyses). This representation is consistent with definitions of the reference climate condition as a rolling experienced past, used to “anomalize” the present condition (Hulme et al., 2009; Osberghaus, 2017). In other words, the present exposure to extreme weather events is considered abnormal only if it exceeds the average exposure from the experienced past. While this updating reference condition captures the psychological adaptation process, it could also relate to physical adaptation of the built environment to accommodate higher extreme exposures.
Exposure to SLR is included as a distinct input to the experiential effect for two reasons. First, unlike temperature-related weather events, SLR impacts are directly experienced by relatively smaller coastal populations. Second, SLR impacts manifest as flooding, which people tend to associate with local storm surges rather than SLR and global climate change (Akerlof et al., 2017). Nevertheless, SLR communication may still capture public imagination as the magnitude of its impacts increases in the future, providing a vicarious experience to the broader global population for influencing risk perceptions (Akerlof et al., 2013, 2017). The SLR sub-module in the Climate module computes changes in sea level from climatic processes, whereas the SLR Impacts and Adaptation sub-module in the Economy module estimates the number of people exposed to SLR-induced floods from coastal populations, measured in Mp−1 yr−1 (see Ramme et al., 2025). The sensation of SLR exposure is similarly modelled as function of both the perceived SLR flooding exposure (PSE) and the reference normal level, PSEref. PSE is an exponential smooth of the exposure metric (Mp−1 yr−1) from the SLR sub-module. For PSEref, however, there is a conceptual difference: perceptions of risk or abnormality are sensed only when the extent of the exposure is large enough to warrant global media attention. Therefore, we constrain PSEref to a minimum reference value, as shown in Eqs. (22) and (23):
where PSEref is the reference perceived SLR flooding exposure (Mp−1 yr−1), PSEminref is the minimum reference SLR flooding exposure (Mp−1 yr−1), PSEiref is the indicated reference perceived SLR flooding exposure (Mp−1 yr−1), ATpse is the averaging time (year) to update perceptions of SLR exposure, ATrpse is the additional time horizon (year) for updating the reference perceived SLR exposure, and PSEref(0)=PSE(0).
PSEiref is the instantaneously calculated indicated reference value that accounts for the updating process of the normal condition over the much longer time horizon. The MAX function in Eq. (22) ensures that PSEiref updates only if the computed indicated value is larger than the minimum reference value, PSEminref. In doing so, it prevents PSEref from falling below the minimum threshold for risk perception.
Following the psychophysical power law, the experiential effect of climatic events on risk perception is expressed as a power function of both inputs normalized to their respective reference conditions, as shown in Eq. (24):
where βexp is the sensitivity of PCCR to changes in perceptions of climatic events exposure: perceived extreme weather events (PWE) and perceived SLR flooding (PSE).
We use an additive formulation since temperature-related weather events and SLR-induced flooding are conceptualized as independent sensory experiences that accumulate in the individual and collective human imagination (Hulme et al., 2009). Moreover, since SLR impacts are negligible for most of the historical period and only expected to cross the minimum reference in a future point in time, βexp is set to be one and the same for both types of climatic events.
3.2.2 Cognition
To model the cognitive influence of climate change knowledge on risk perception, we use information about STA, measured in °C, as a proxy for knowledge. Here, changing levels of STA are taken to be positively associated with awareness-raising initiatives to raise climate change knowledge. As STA increases over time, knowledge of global warming (i.e., STAp) increases with a perception delay. STAp (in °C) is modelled with a third-order exponential smooth, where the input is smoothed three times over a total averaging time, ATsta (year). Multistage or higher-order exponential smoothing provides a much more gradual and smoother updating of climate information, which is required to account for delays in scientific information gathering, reporting, and eventually broader societal awareness-raising (Sterman, 2000). This contrasts with other first-order perception delays, such as those related to climatic events, which are more immediate and readily perceived by people. ATsta also functions as a weight given to climate information: smaller values would indicate stronger receptivity (cf. socio-cultural factors), enabling a faster updating of awareness, and vice versa. Climate information is further valuated against a reference “normal” condition, STApref. Just as people acclimatize to abnormal climatic conditions over time, people could become desensitized to increasing climate change knowledge over time (e.g., climate fatigue). Hence, STApref similarly updates over time to account for the desensitization following Eq. (25):
where STApref is the reference perceived surface temperature anomaly (°C), STAp is the perceived surface temperature anomaly (°C), ATsta is the averaging time to report and perceive climate information (year), ATrsta is the additional time horizon (year) for updating the reference, and STApref(0)=STAp(0).
ATrsta also determines the rate at which climate information is discounted over time. A smaller time horizon suggests that people evaluate global warming less seriously (cf. socio-cultural factors), since the reference condition updates more quickly and shifts the reference point to the right for the evaluation. The cognitive effect is then expressed as a power function of this climate information evaluation as shown in Eq. (26):
where βcog is the sensitivity of PCCR to changes in perceptions of climate information about STA (dmnl). Since the cognitive effect is multiplicative, risk perception is modulated by climate information: i.e., when climate knowledge is taken more seriously, PCCR is amplified.
The above formulations were implemented in Stella Architect 3.8 (isee systems) with a simulation horizon from 1980 to 2150 and a time-step of using the fourth-order Runge–Kutta (RK4) integration method. Given the high level of aggregation in FRIDA, where the dynamic complexity of main system-wide feedback processes is prioritized over specificity, uncertainty is inherent in the model's parameterization. A multi-step protocol was, therefore, developed for parameter estimation under deep uncertainty and presentation of results as an ensemble of runs, reporting the sample median and uncertainty range (see Schoenberg et al., 2025b).
First, model calibration was performed in Stella Architect, which uses Powell's BOBYQA algorithm (Powell, 2009). For parameters without known ranges from data or literature, a wide range was set based on prior belief. The calibration process minimized the squared error between observed and simulated data across seven model variables for the historical period between 1980 to 2020: animal products production, animal products demand, crop production, vegetal products demand (subset of crops used for food), average daily animal products demand per capita, average daily vegetal products demand per capita, and average daily food demand per capita. The calibration data were obtained or calculated from Food and Agriculture Organization of the United Nations (FAO, 2024), assuming demand equates to available caloric supply at retail. Hence, demand includes consumer food waste. We performed partial model calibration of parameters in the Behavioural Change module and the GDP-driven model, separately, to prevent errors from propagating to other modules in FRIDA. It should be noted that all three sub-modules within the Behavioural Change module were calibrated together due to the lack of reliable time-series for Climate Risk Perception. In other words, climate risk parameters were calibrated to fit both total food and animal products data simultaneously. The calibration parameters and estimated values are reported in Appendix A.
Figure 3 presents the default model run using the calibrated values, for both our endogenous modelling framework and GDP-driven model, which does not yet account for uncertainty within that calibration. We refer to the simulated behaviour produced by FRIDA v.2.1 that incorporates our modelling framework as the endogenous model behaviour (hereafter, EMB). Even though both models provide a good fit to data for the historical period between 1980 and 2020, our framework performs marginally better when comparing the root mean squared error (RMSE) that quantifies the error between the simulated and observed data. The total RMSE for animal products production, animal products demand, crop production and vegetal products (Fig. 3a–d; measured in Pcal yr−1) for the default EMB is 484.34, lower than the 498.75 for the default GDP-driven behaviour. As for the average daily animal products, vegetal products, and total food demand (Fig. 3e–g; measured in kcal p−1 yr−1), the total RMSE for EMB is 61.11 compared to 64.18 for GDP-driven. Despite the marginal difference in performance for the past, the difference in structure for the two models generates significantly different future projections, as will be shown in the next section.
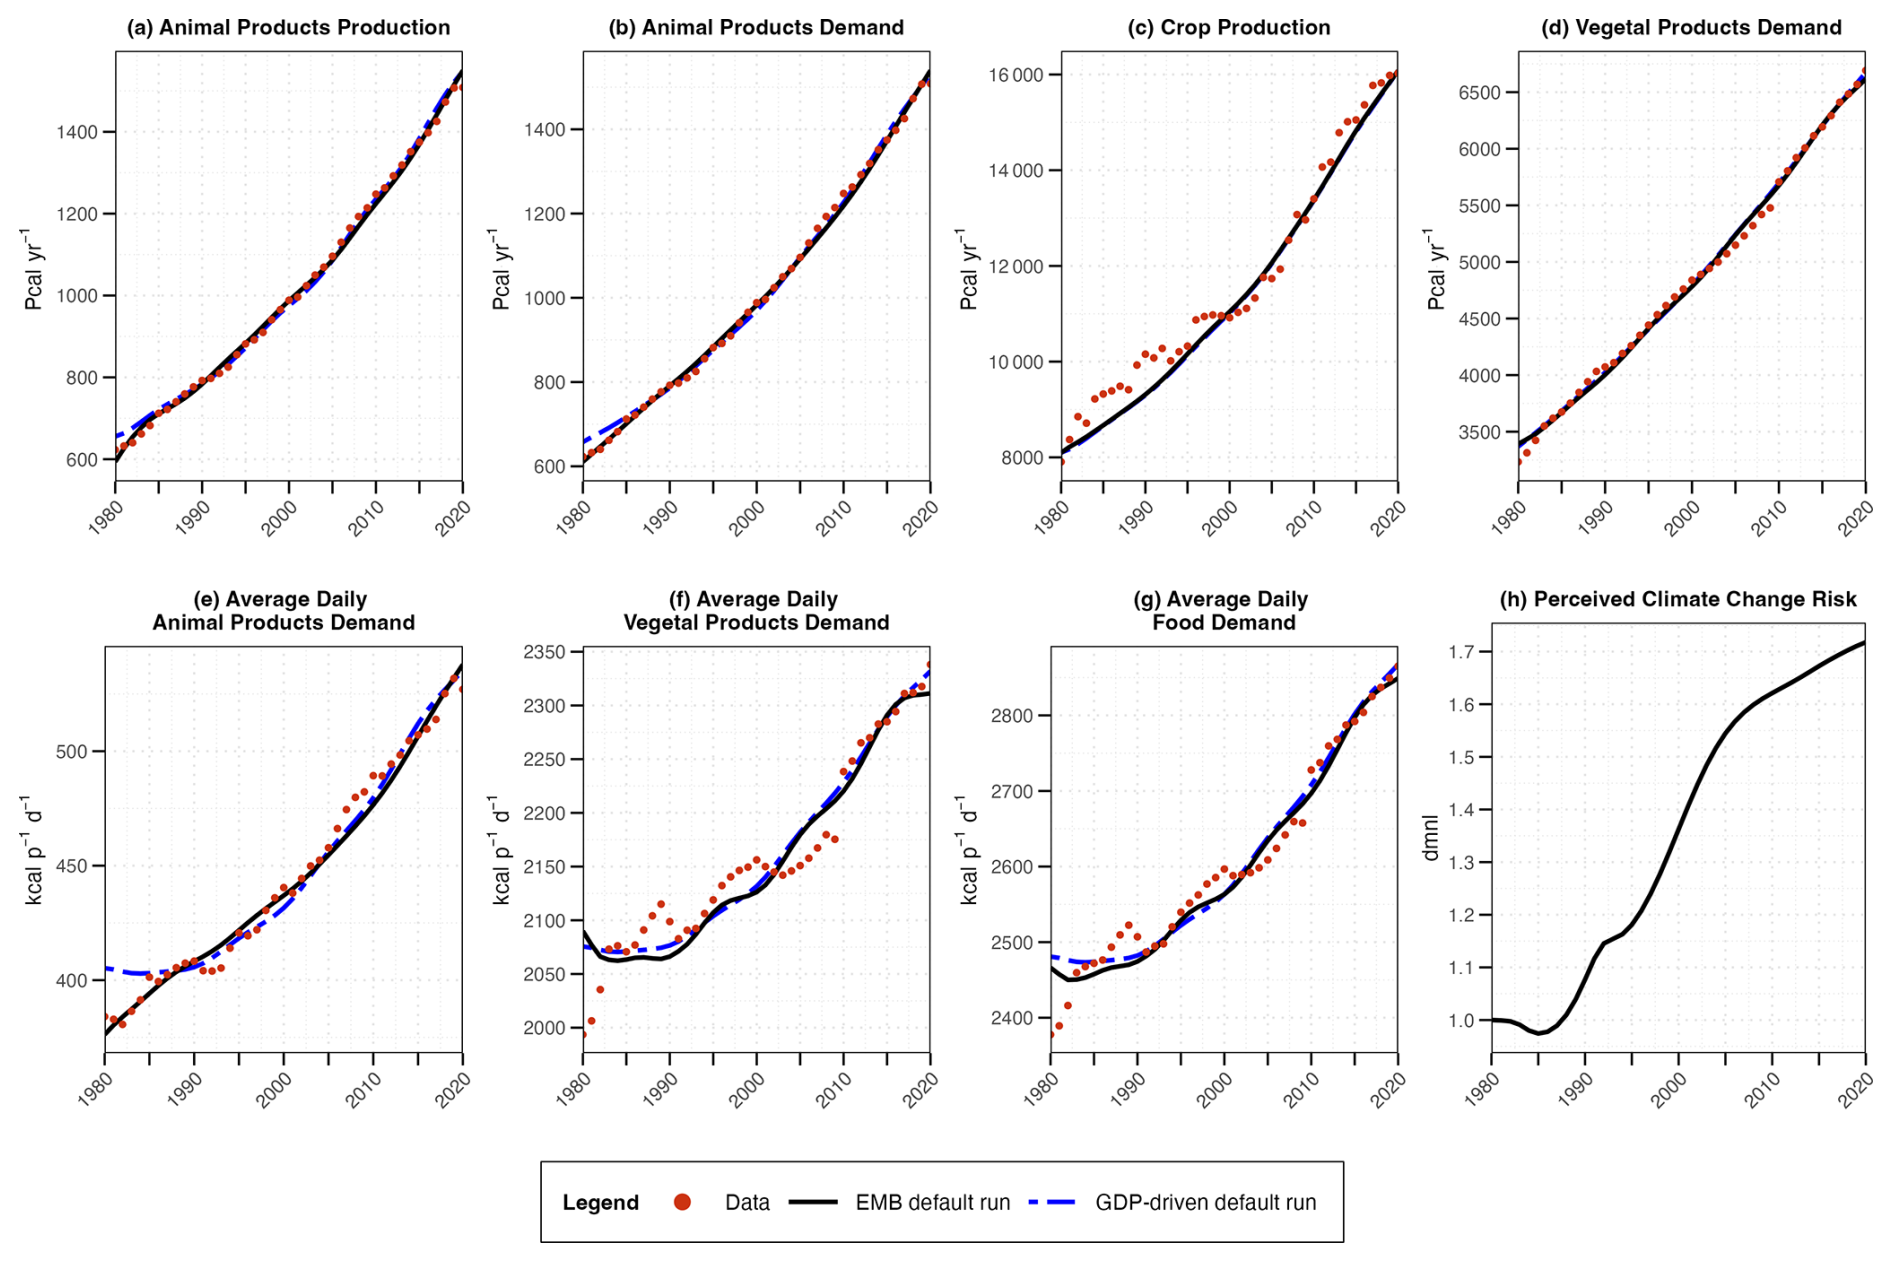
Figure 3Comparison of simulated single-run EMB produced by our modelling framework (black solid line) against GDP-driven behaviour produced by changes in income (blue dashed line) and observed data points (in red).
Given the lack of quantitative measurements for the Climate Risk Perception module, we qualitatively assess the calibrated PCCR, as depicted in Fig. 3h, against available literature. Psychological inventories measuring climate change risk perceptions are relatively recent developments (e.g., Libarkin et al., 2018), and even then collected data tend to be analysed cross-sectionally rather than temporally. Nevertheless, Capstick et al. (2015) provide an international and temporal analysis of public opinion surveys and polls. Briefly, they found that basic climate change knowledge and awareness burgeoned in the 1980s, which resulted in a rapid growth in public concern between the mid-1980s and early 1990s. Despite some fluctuations, public concern saw a sustained growth from the mid-1990s to mid-2000s, alongside increased scientific and media attention. From the mid- to late-2000s, they found growing climate scepticism in some parts of the world, but globally, the decline in public concern was offset by increased concern from other regions. Since the 2010s, they suggest that public concern has stabilized and, in some cases, increased. More recent survey polls, as found in van Valkengoed et al. (2023), further indicate that public concern has been gradually increasing since the late-2010s. Though not from validated psychometric measures, these findings may be indicative of the dynamic development in risk perception. The EMB produced by our modelling framework broadly captures these major trends, following a somewhat s-shaped curve. Regardless, without validated time-series for partial model calibration of the module, the uncertainty in this calibration remains irreducible.
Relying on single model runs, as above, misrepresents the model's precision because it does not account for the deep uncertainty in the calibration process. To represent this calibration uncertainty, the second step in the protocol reduces the prior sampling range of parameters to a likely range. The algorithm determines a likely range for each parameter independently by: (i) finding the maximum value and minimum value before the likelihood drops below th of the maximum likelihood found via calibration and (ii) symmetrizing the range using the minimum distance between a discovered endpoint and the calibrated value without breaking the prior range. The likelihood is the probability that the model, with a given set of parameters, reproduces historical data. The estimated uncertainty ranges for each parameter are reported in Appendix A. The algorithm was not able to determine a likely range for ATrpse (additional time horizon of reference SLR flooding) since it has no historical impact. However, since it impacts future projections, we externally loaded a range with a variance of ±15 % from the calibrated value. This relatively narrow range represents only a gradual desensitization to SLR flooding, which is projected to have significant cascading societal and economic impacts (Akerlof et al., 2017; Ramme et al., 2025). As for the GDP-driven model, the parameters were not reduced using the algorithm due to the associated computational costs – except for the time constant, ATgdp, which is used elsewhere in the EMB. Instead, we used local sensitivity analyses to select sufficiently wide ranges that represented the maximum possible variance while still accurately capturing historical data.
Thereafter, we performed multivariate sensitivity analysis using Sobol Sequences sampling (Sobol' and Levitan, 1999) across all uncertain parameters in FRIDA, including those in other modules, for EMB and GDP-driven models separately (see Rajah, 2025 for the full list of varied parameters along with the ranges). This produced two sets of 100 000-run ensembles, with the median plotted alongside the 67 % and 95 % confidence intervals. Sample runs that do not complete due to overflow and divide errors are excluded from the ensemble, and all remaining ensemble runs are equally weighted. Given the small sample size relative to the number of parameters varied, likelihood weighting was not applied to the ensemble runs since doing so would have resulted in too few runs being included in the uncertainty range. Therefore, the ensembles include runs with low statistical likelihood and results in a larger uncertainty range than if we were to weight the runs by likelihood with a sufficiently large sample size.
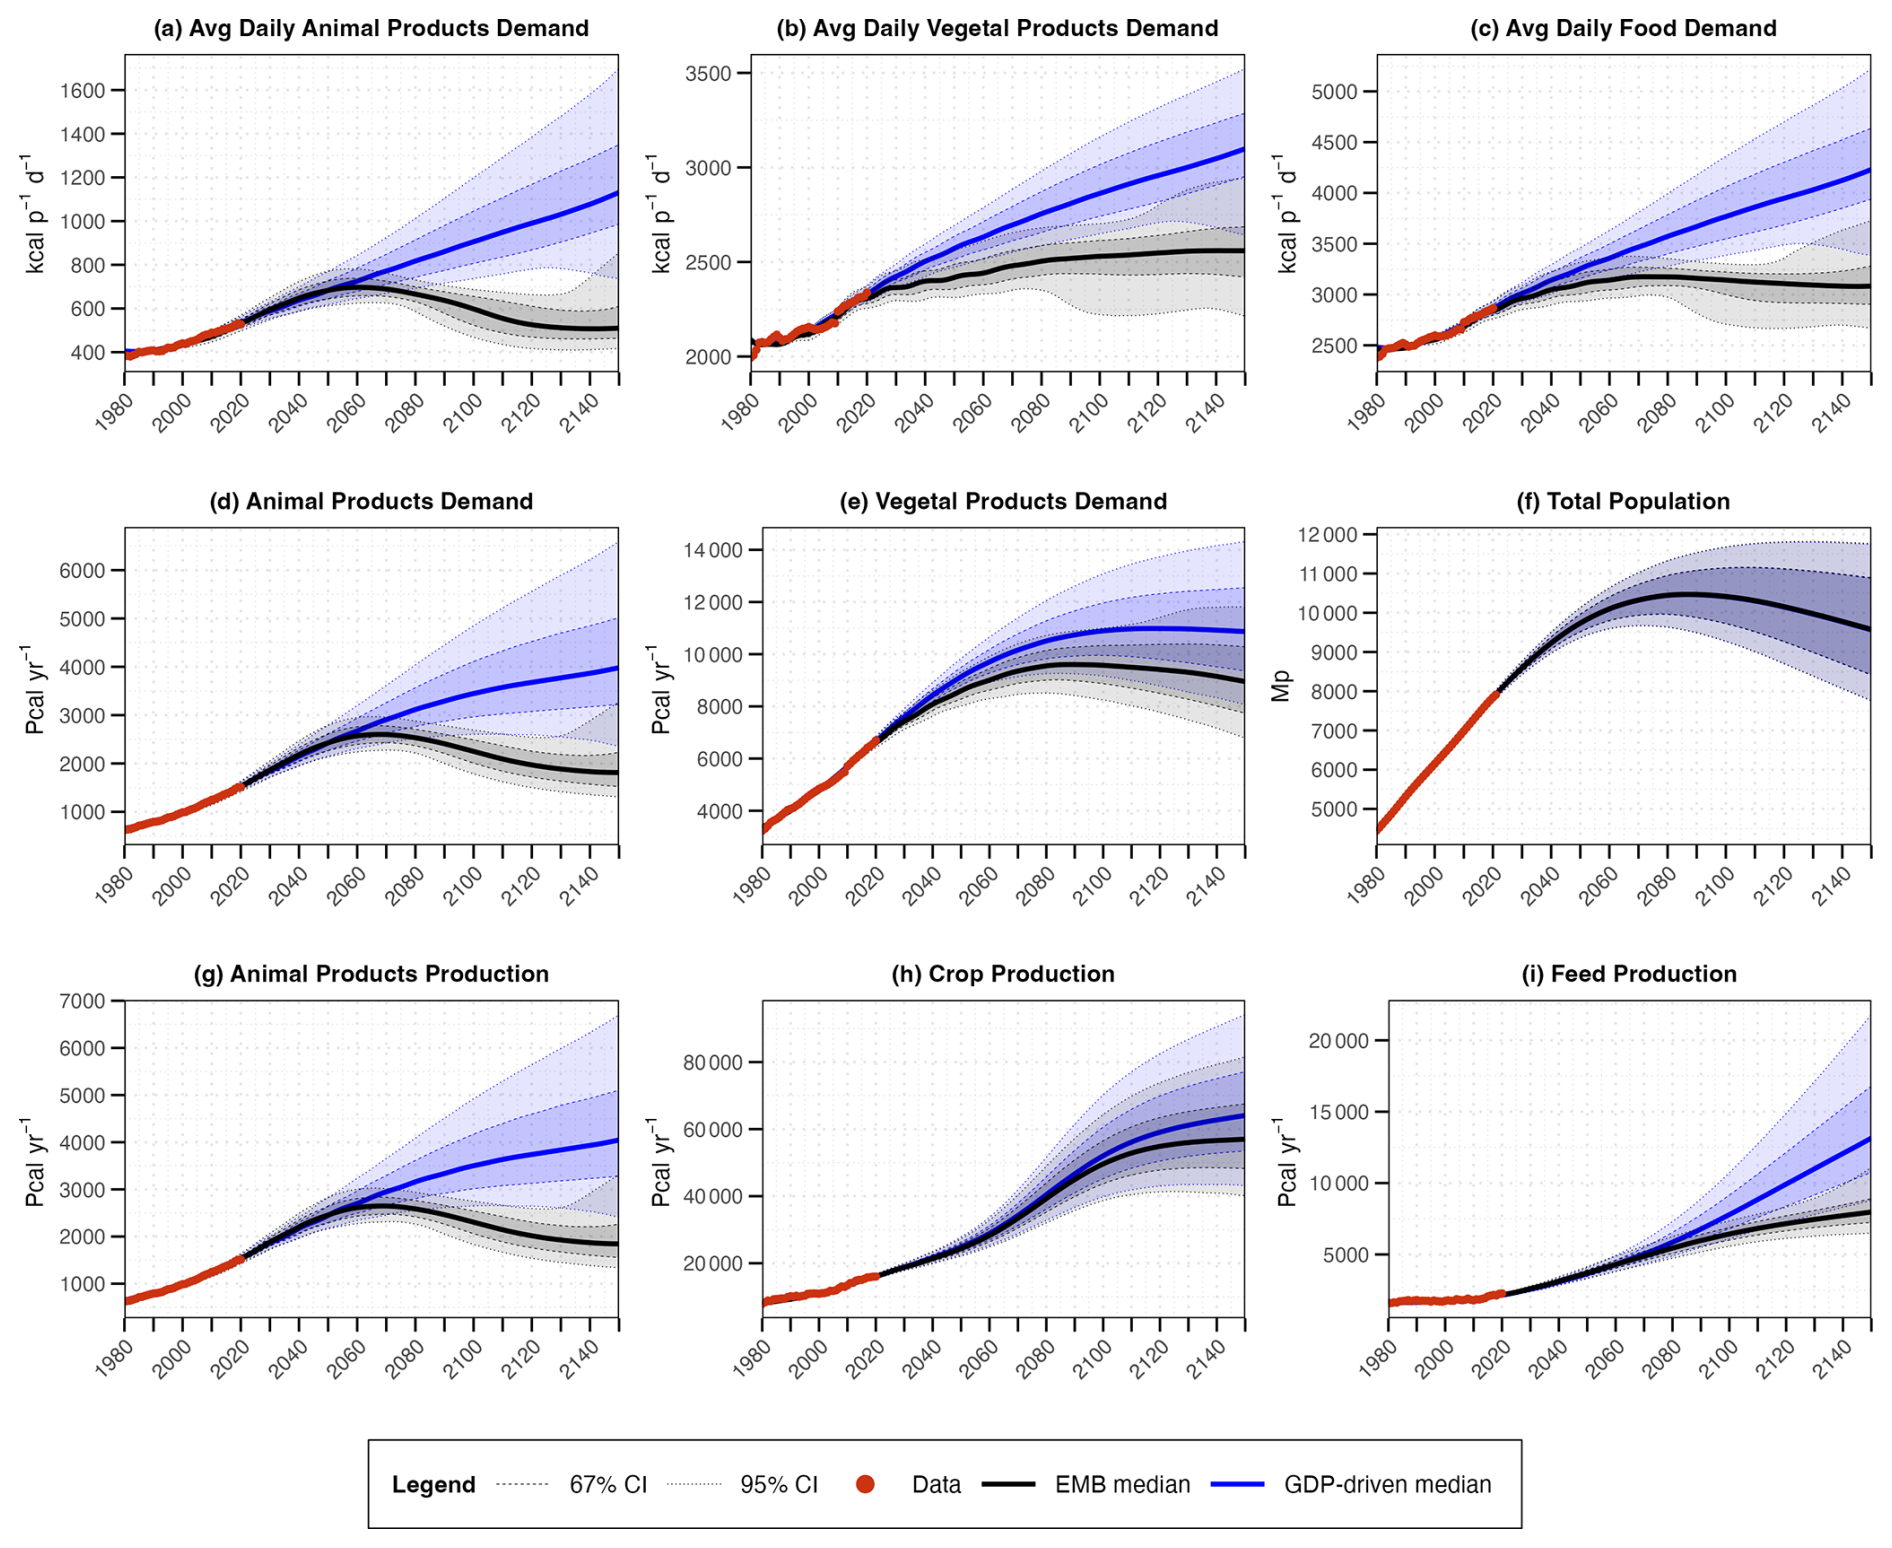
Figure 4Comparison of simulation results for EMB (in black) and GDP-driven (in blue) 100 000-member ensembles across key dietary performance indicators in the human system, with confidence intervals.
Figure 4 presents the baseline results of the key indicators for dietary behaviour, comparing the performance of our endogenous modelling framework (i.e., EMB) to the GDP-driven model. In general, we observe that future projections for GDP-driven food demand are higher than our EMB. GDP-driven animal products demand (Fig. 4d) increases at a diminishing rate to 3980 Pcal yr−1 by 2150, 95 % CI [2352, 6593]. Whereas the median vegetal products demand (Fig. 4e) peaks at 10 986 [8828, 13683] Pcal yr−1 around 2120 before gradually declining to 10 864 [8059, 14319] in 2150. The slowing growth and even decline in demand, however, is largely attributed to the decline in the global population towards the end of the simulation (Fig. 4f) due to reduced fertility from increased literacy and income, and increased mortality from climate damages. Accounting for population and unit conversion, we arrive at developments in the various average daily food demands (Fig. 4a and b) that increase throughout the simulation duration to high figures, especially at the global scale: total food demand reaches 4230 [3387, 5526] kcal p−1 d−1 in year 2150 with animal products constituting about 27 [22, 31] % of food demand. These results are unsurprising since demand is unbounded, allowing it to increase so long as real income increases.
On the other hand, our endogenous modelling framework captures people's dynamic response to changes in their social-ecological environment, which results in considerably lower future estimates across all food-related indicators. The median average daily food demand (Fig. 4c) peaks around 2070 at 3175 [2990, 3373] kcal p−1 d−1, then declines to 3083 [2669, 3727] by 2150. In contrast, the average daily animal products demand (Fig. 4a) peaks earlier in 2060 at 697 [624, 781] kcal p−1 d−1, drops to 507 [413, 777] by around 2140, and gradually increases to 510 [417, 856] by 2150. This translates to a share of about 22 [21, 23] % in 2060, 16 [15, 21] % around 2140, and 17 [16, 23] % by 2150. This trend indicates that more people, on average, are likely to reduce their overall intake and shift their diet composition, substituting animal products with vegetal products. Daily vegetal products demand (Fig. 4b), however, is dependent on the dynamics of the other two: the median peaks at around 2140, when animal products demand is at its minimum, at 2560 [2250, 2924] kcal p−1 d−1, or 83 [83, 80] % share, and stabilizes thereafter, given that the more pronounced decline in animal products demand drives a substitution that outpaces the overall decline in food demand.
However, considering the confidence bounds, dietary behavioural change is uncertain. For instance, we observe sample runs in the lower bound that result in more marked reductions in total food demand, allowing vegetal products demand to peak earlier and decline more considerably – i.e., reduction exceeds diet substitution. As for the upper bound, more concerning dynamics are observed: both daily food demand and animal products demand decline for a period before increasing once again towards the end of the simulation. In fact, a slight increase in daily animal products demand has already been observed in the median. Consequently, there is a declining share of vegetal products demand at the 97.5th percentile despite higher quantities being demanded: between 2120 and 2150, the quantity demanded increases from 2779 to 2941 kcal p−1 d−1, but the share declines from 83 % to 78 %. In other words, the increased overall caloric food intake toward the end of the simulation is accompanied by a faster rate of increase in animal products demand compared to vegetal products. These results suggests that there are plausible scenarios where sustainable dietary behavioural change reverses.
To account for such complex dietary behavioural changes, Fig. 5 presents the simulation results of the key explanatory variables for endogenous behavioural responses modelled within our framework. Average daily animal products demand and total food demand are driven by the relative importance of perceived accessibility, descriptive norm, and personal norms, as depicted in Fig. 5a and b respectively. The perceived accessibility of food products exerts an upward pressure on dietary behaviour. The perceived food accessibility increases steadily over time (Fig. 5b) mostly from a sustained increase in real income; although in the lower bound of the 95 % CI, real income and thus accessibility declines sometime after 2120 from climate-driven inflation in the Economy module. As for animal products, income and relative scarcity determine the accessible share of animal products in diets. Consequently, a declining desired caloric intake (i.e., total food demand) could lead to a reduced animal products demand despite increased desired animal products shares (depending on the relative rate of change). The perceived accessible animal products demand therefore starts slowing down around 2070 (Fig. 5a), as total food demand declines, but increases again as animal products are relatively less scarce than vegetal products as well as the behavioural change reversal in the 95 % CI of total food.
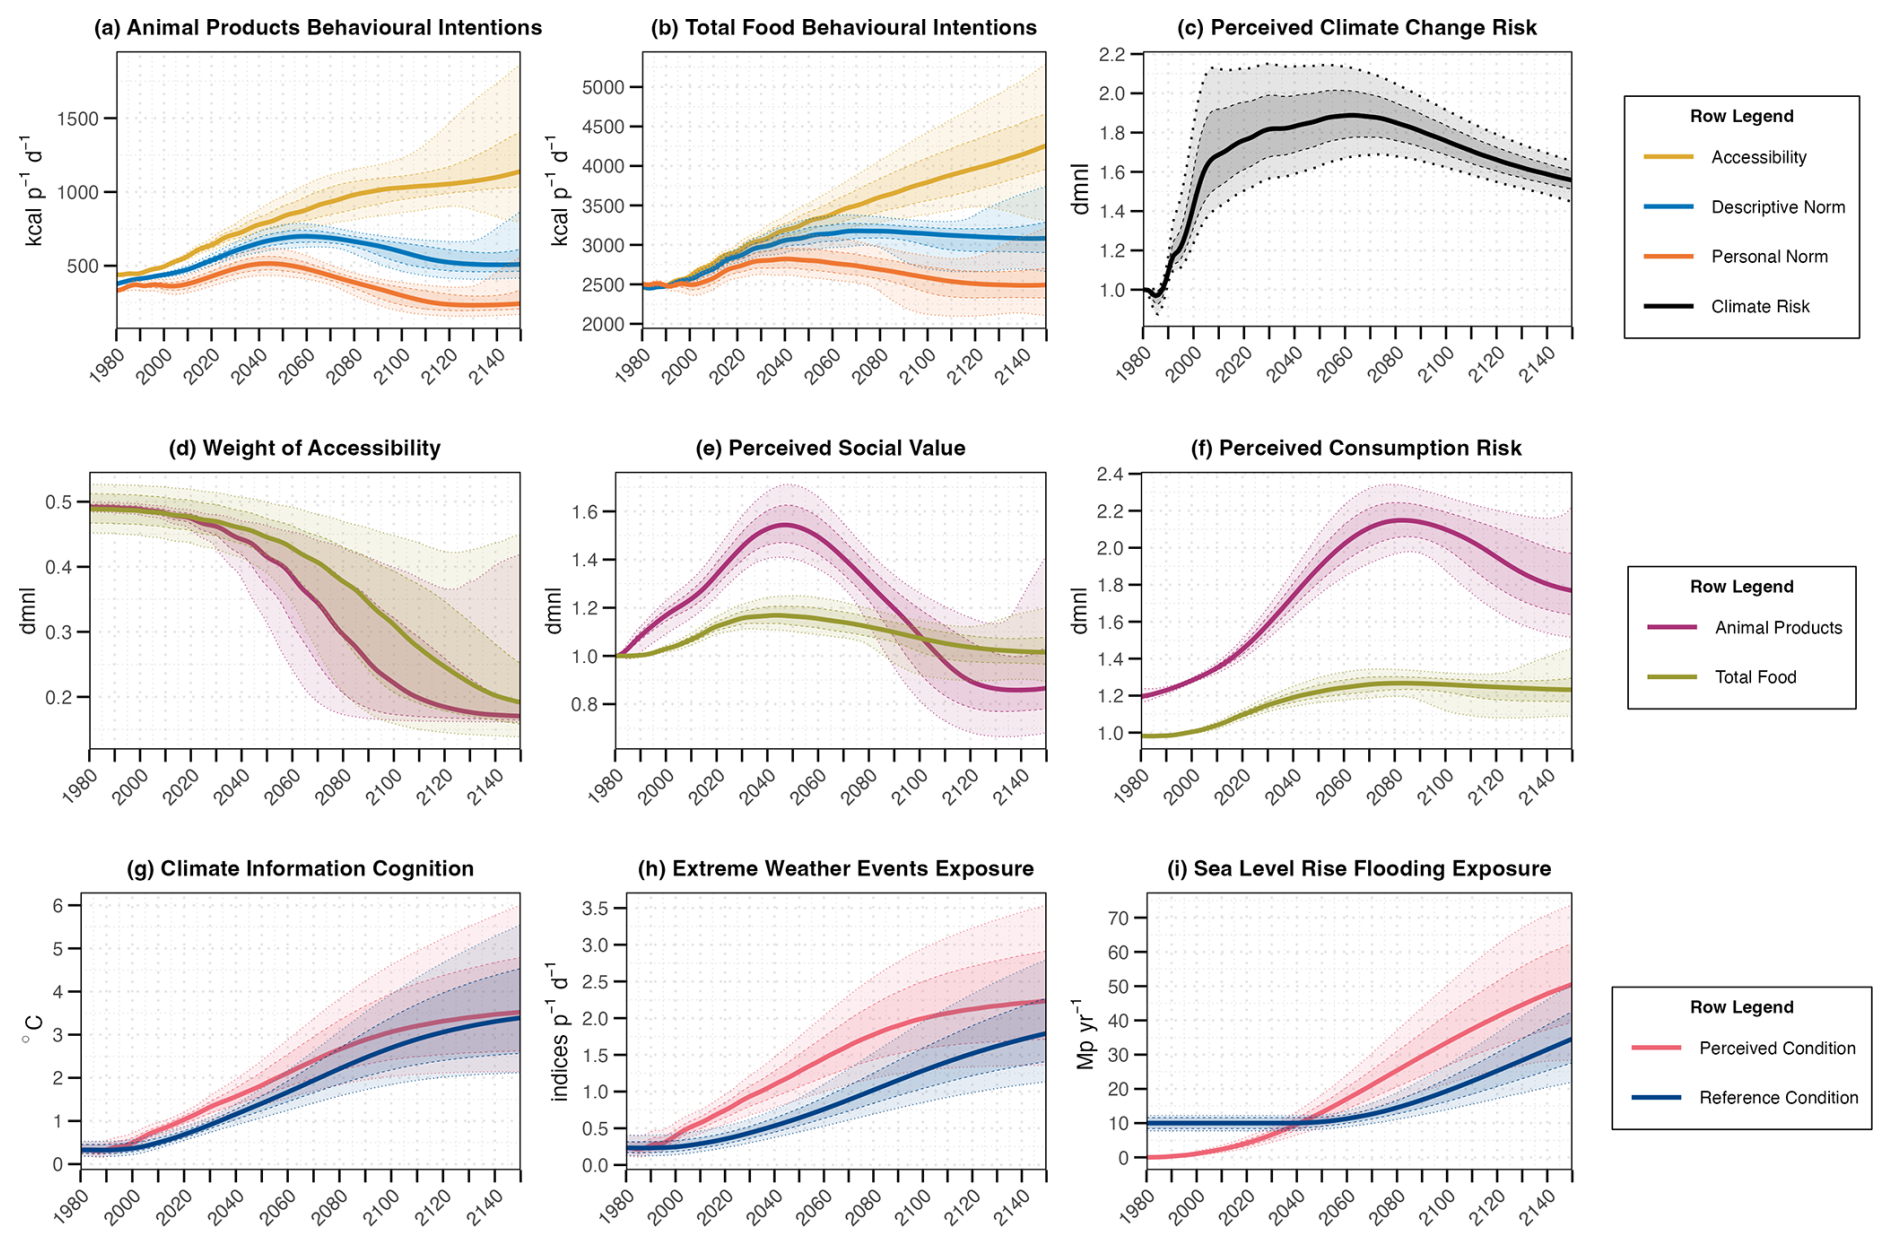
Figure 5Simulation results from the 100 000-member EMB ensemble for key explanatory variables in the Behavioural Change module, with 67 % and 95 % confidence intervals.
For the first half of the simulation, people are most responsive to this perceived accessibility of food products from changing socioeconomic conditions, giving it relatively more weight in their behavioural intentions as shown in Fig. 5d. As income levels in developing regions catch up, more people can increase their food consumption not only to meet nutritional needs but also to signal changes in socioeconomic class. This is reinforced by the descriptive norm process that exerts a conformity pressure to increase consumption. Hence, we observe increased per capita demand during this period of nutrition transition in many parts of the world – i.e., increased caloric intake and higher composition of animal products in diets (Schmidhuber and Shetty, 2005). During this period, the perceived climate change risk (PCCR; Fig. 5c) and perceived consumption risk (PCR; Fig. 5f) exert a downward pressure on personal norms and therefore behavioural intentions. While these balancing feedback loops dampen the rate of growth of in demand, they are weaker than the more dominant reinforcing socio-cultural process that assigns more perceived social value (PSV) to the food product (Fig. 5e) as it is consumed more.
At this juncture, it is important to reiterate that PCCR, PCR and PSV are not independent factors; rather they interact multiplicatively to shape personal norms and, by extension, dietary intentions. While the feedback effects are interdependent, the calibrated weights offer insight into the relative influence of each feedback process. For total food demand, the median sensitivity to PSV is estimated at 0.936, while sensitivities to PCR and PCCR are −0.798 and −0.138, respectively. In the case of animal products demand, the corresponding median estimates are 0.974 for PSV, −0.724 for PCR, and −0.407 for PCCR. These figures highlight the dominant role of perceived social value in shaping demand, while also illustrating the moderating effects of perceived consumption risk and climate change risk. On average, individuals are least responsive to PCCR, with this effect being more pronounced for total food demand than for animal products demand. This pattern reflects real-world dynamics, as climate change is more strongly associated with meat consumption; that is, people are likely to reduce their animal products demand more than their overall caloric intake.
As income increases beyond a threshold, socioeconomic considerations wane and people become less bounded by perceived accessibility, as described in Sect. 3. Therefore, in the latter half of the simulation, more people act upon their moral and social motivations, giving more weight to their personal norms and descriptive norm. In extreme conditions, where GDP declines in the 95 % CI from inflation, we observe that more weight is given to accessibility once again as shown in Fig. 5d. Nevertheless, during this period the balancing feedback from perceived risks from climate change and overconsumption, particularly for animal products, is strengthened as conditions get progressively worse. In turn, these loops can effectively counteract the reinforcing processes related to descriptive norm and social value perception, turning them from a vicious cycle to a virtuous one from a mitigation perspective. The descriptive norm process is adaptable, adjusting the current desired demand upwards or downwards depending on the directionality of changing social trends. Similarly, a sustained reduction in consumption would reinforce lower assigned social value to the consumption practice – albeit gradually, given the stickiness of culture. The net effect is the second nutrition transition (Vranken et al., 2014), where more people substitute their animal products consumption and reduce their caloric intake in response to heightened perceived threats as well as changing social-cultural processes.
Importantly, this second nutrition transition may not be an enduring phenomenon since the balancing feedback processes weaken over time. First, the perceived consumption risk corrects itself as shown in Fig. 5f. The threat of overconsumption alleviates as people reduce their consumption, particularly for animal products. Second, the desensitization and gradual psychophysical adaptation in climate risk perception, as shown in Fig. 5g–i, create reinforcing processes that actively work against the balancing effect of PCCR. These processes push the reference conditions for what are considered “normal” in the evaluation process. Hence, we observe PCCR (Fig. 5c) reaches a maximum before gradually declining over time – especially due the quick adaptation in climate information and slowing frequency of extreme events frequency. Therefore, towards the end of the simulation, the net effect is a shift in dominance back to the reinforcing loops that are part of descriptive and personal norms. As threat perceptions wane, people are more sensitive to these processes that not only make rising consumption relatively more common, but also more valued. In turn, we observe the reversal in dietary behavioural change within the uncertainty range.
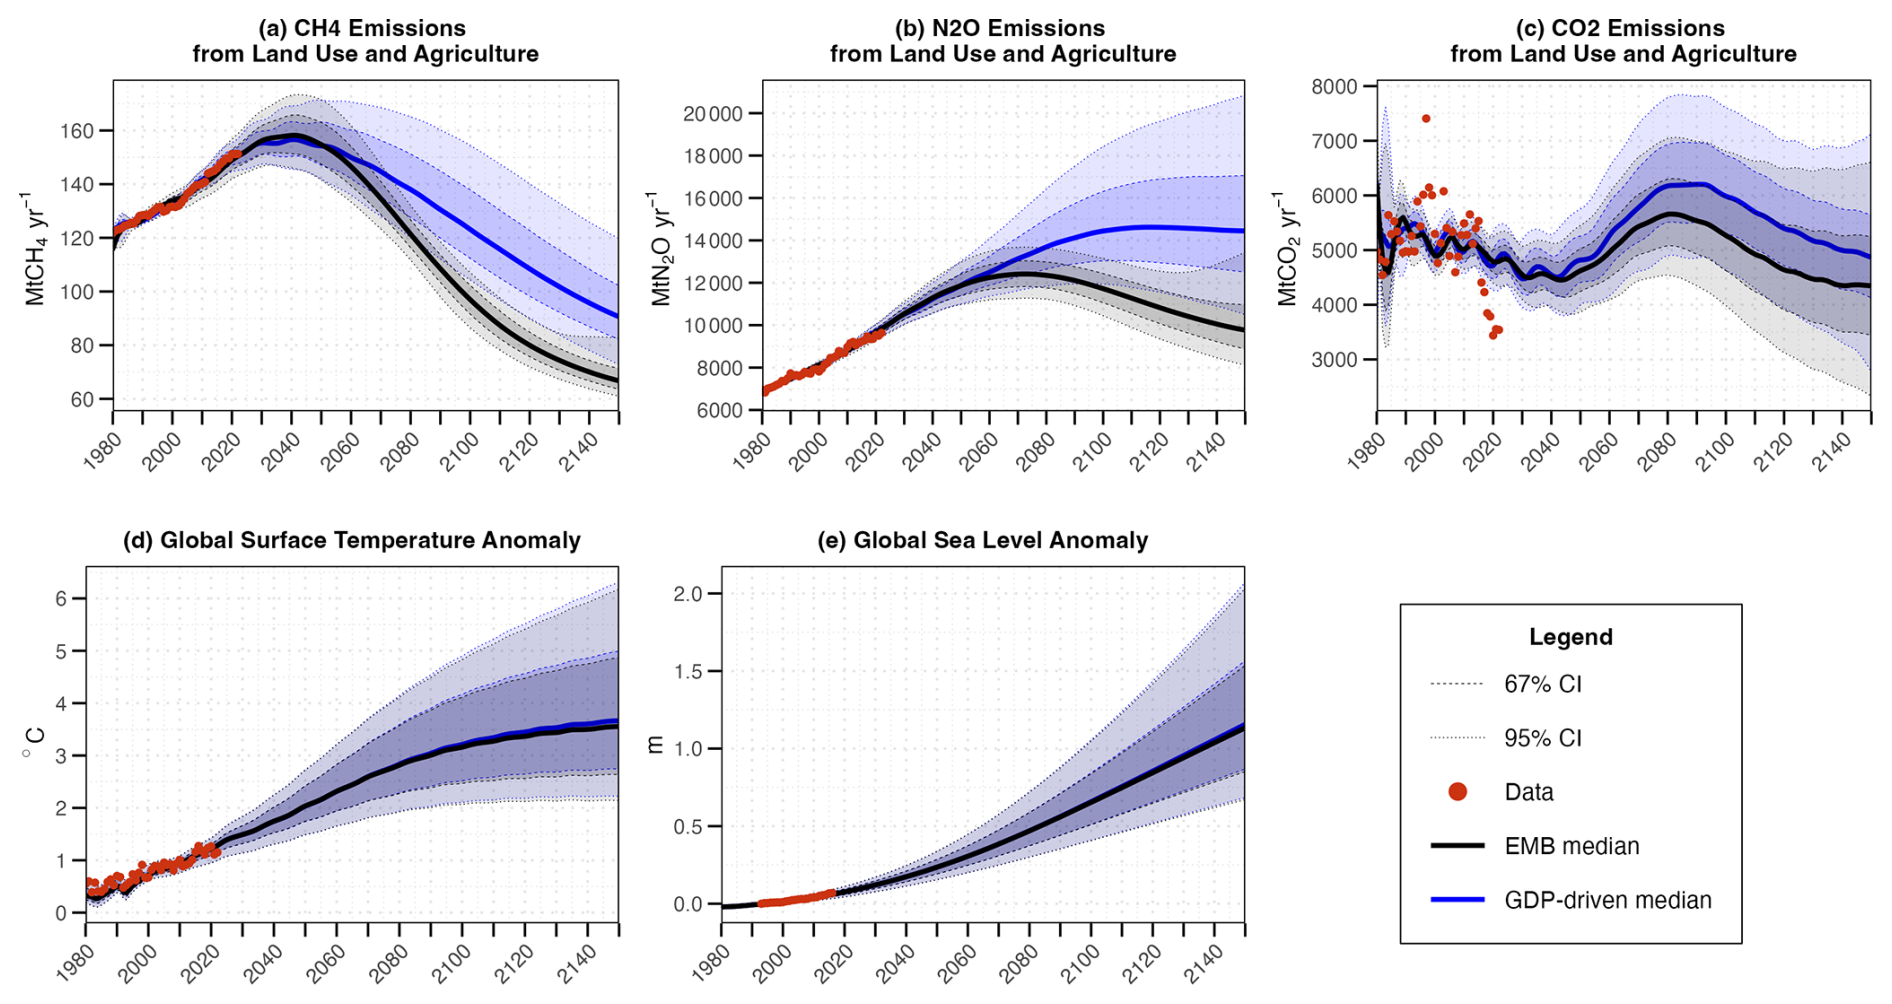
Figure 6Comparison of simulation results for EMB (in black) and GDP-driven (in blue) 100 000-member ensembles across key performance indicators in the climate system with confidence intervals.
Downstream dietary behaviour at the per capita level propagates upstream to determine total demand, which is also affected by population changes. In general, a declining population could result in a decline in total demand despite individual behavioural changes. The total vegetal products demand (Fig. 4e) therefore declines in the latter half of the simulation even though per capita demand increases. However, the reversal in diet shifts offsets the decline in population for both animal products and vegetal products demand, leading to increasing total demand within the upper bound of the EMB 95 % CI (see Fig. 4d and e). Animal products production (Fig. 4g) responds to changes in demand and therefore follows a similar development. Animal production then affects the climate system through CH4 and N2O emissions as well as land use changes for grazing. Crop production, however, is not solely determined by vegetal products demand; it also responds to other crop uses including bioenergy and, importantly, animal feed to support intensified animal products production. As a result, crop production (Fig. 4h) does not decline despite decreasing vegetal products demand. Crop production affects the climate system through land use changes for cropland as well as N2O emissions from fertilizer use. Even with reversals in behavioural change within the uncertainty range, we observe that baseline projections for total demand and production are still lower in the EMB compared to GDP-driven behaviour.
As mentioned, production dynamics have consequences for climate projections, as depicted in Fig. 6. CH4 and N2O emissions are directly influenced by animal products production and crop production; while land use transitions for food production affect CO2 emissions (Friedlingstein et al., 2025). After 2060, greenhouse gases emission rates from Land Use and Agriculture (Fig. 6a–c) are projected to be considerably lower in the EMB. In turn, we project a slightly cooler climate baseline in the future, as shown in Fig. 6d: EMB median STA of 3.16 [2.07, 4.83] °C in 2100 and 3.56 [2.14, 6.17] °C in 2150, compared to the projected 3.21 [2.11, 4.90] °C in 2100 and 3.67 [2.22, 6.31] °C in 2150 from the GDP-driven model. Similarly, we observe a slightly lower EMB median SLR of 0.65 [0.41, 1.05] m in 2100 and 1.13 [0.67, 2.03] m in 2150, compared to the GDP-driven 0.66 [0.41, 1.06] m in 2100 and 1.16 [0.68, 2.07] m in 2150 (Fig. 6e). There is considerable overlap in the confidence bounds for STA and SLR, as dietary behaviour only contributes a fraction of total emissions. Other high-impact behaviours influencing energy demand are still modelled as functions of GDP in FRIDA v2.1 (for more details, see Schoenberg et al., 2025b). Including endogenous behavioural change for these other sources of human behaviour could result in more significant differences in STA and SLR projections between the EMB and GDP-driven simulations.
In this paper, we have documented the conceptualization and quantification of our endogenous behavioural change modelling framework. This framework models dietary behaviour, specifically daily average food demand and consumption, as a function of complex social-economic-cultural-environmental feedback processes related to perceived accessibility, descriptive norms, and personal norms, constrained by accessibility and past behaviour. In doing so, we close one human-climate feedback loop that captures the dynamic human behavioural response to changing climatic conditions, addressing a current gap in most state-of-the-art IAMs.
To evaluate the performance of our endogenous modelling approach, we compared the results of our baseline EMB against the baseline produced by the more common GDP-driven approach. Our findings indicate that while both approaches can acceptably reproduce historical data, our approach results in considerably lower future projections across key human-climate system indicators. As explained in the previous section, our endogenous framework captures how individuals adapt to their changing social-ecological environments such as improved socioeconomic conditions, shifting norms, and changing risk perceptions. In response, people may alter their dietary behaviours favourably from a climate mitigation perspective – even in the absence of targeted policies for facilitating pro-environmental behavioural change. We consequently observe relatively cooler future baseline climate projections by endogenizing human behaviour. In contrast to our endogenous behavioural change framework, GDP-driven models assume that human consumption increases proportionally with income, largely ignoring the complex feedback dynamics internal to the human system. Since most IAMs project rising real GDP over the simulation horizon, models using the GDP-driven approach may result in systematically inflated demand projections that do not account for behavioural changes. Such inflated projections feed into the climate system and result in relatively warmer climate futures and potentially overstating mitigation challenges. By demonstrating how complex behavioural feedback can dampen future demand trajectories, our results lend further support to calls for incorporating endogenous behavioural responses into climate modelling and IAMs (e.g., Beckage et al., 2020, 2022).
Recognizing this potential overestimation problem, others have tweaked the GDP-driven model for more realistic projections. For instance, Bijl et al. (2017, p. 48) state that “Since real income can increase dramatically over long time periods, decreasing income elasticities are an essential part of our long-term food demand model.” Not only do they decrease the elasticities, but they also set a maximum intake of 3500 kcal p−1 d−1. While this formulation can reproduce the inverted-u relationship between income and demand, it does not provide a process-based explanation for this phenomenon. Our framework explains this as part of the socioeconomic process, where certain food products become commodified and lose their symbolic significance as they become more affordable. In turn, other sources of behavioural motivations become more salient determinants in dietary decisions, allowing demand to be effectively moderated without including arbitrary bounds.
Using an uncertainty approach, our simulation results account for a range of plausible behaviours within the 95 % confidence bounds. This allows for probabilistic scenario analyses that cannot be achieved with the externally imposed socioeconomic narratives used in the Shared Socioeconomic Pathways (SSP) framework. Several process-based IAMs (e.g., IMAGE, GCAM, MESSAGE-GLOBIOM, REMIND-MAgPIE) use the SSPs to parameterize future scenarios in model runs. While SSPs provide a useful framework for consistency across climate models, such scenarios are non-probabilistic and treat human behaviour as exogenous and static, limiting the ability to capture human-climate feedback dynamics (Beckage et al., 2022). Moreover, while IAMs used for economic optimization (e.g., DICE, MIND, ReMIND) can be run probabilistically, these models do not model human behaviour in a process-based manner. Rather, behavioural outcomes are the result of optimization (typically for cost minimization or utility maximization), which reflect the best possible outcomes achievable under the assumption of full behavioural control. Consequently, these models do not generate probabilistic scenarios for human behavioural choices or the associated climate outcomes. In contrast, our fully coupled endogenous modelling approach allows us to explore a range of simulated probabilistic futures within a process-based IAM framework without relying on external scenarios nor optimization.
Beckage et al. (2022) contend that the increased input uncertainty space from endogenizing human behaviour may not necessarily increase output uncertainty since behavioural responses create balancing feedback. While we do not disagree with this premise, our results suggest that this is only the case if the balancing loops dominate the model behaviour. Compared to the GDP-driven model, our endogenous framework results in tighter confidence bounds since we account for important balancing loops. However, we also observe an expanding uncertainty space (e.g., see animal products demand) towards the end of the simulation due to the shift in dominance from balancing to reinforcing processes, as explained in Sect. 5. This highlights the need for sufficient dynamic complexity in any representation of behavioural processes to fully account for output uncertainty. Nevertheless, we agree that endogenizing human behaviour provides a tighter constraint on the input uncertainty space (and possibly the output space) compared to exogenous imposed behavioural scenarios that typically cover a much wider input space (Beckage et al., 2022).
Our uncertainty analysis further shows that while climate-friendly behavioural change may occur in the future, this shift may not endure. While the second nutrition transition (cf. Vranken et al., 2014) occurs as more people become responsive to the downward pressures from personal and social norms, embedded reinforcing social-cultural processes may facilitate a third unfavourable transition from the system's resistance. As emphasized, the strength of balancing feedback loops weakens over time: reducing consumption alleviates the risk of overconsumption, while desensitization or adaptation reduces the perceived climate risk. In turn, social-cultural processes could work to reinforce increasing consumption trends once again. Such reversals in behaviour change have not been reported in existing models, likely due to their lower dynamic complexity. Beckage et al. (2018) represent the behavioural response as a single major balancing loop driven by frequency of extreme events. Apart from exogenous variations in associated parameters, an increasing frequency over the simulation horizon would always create a strong downward pressure since people do not adapt to worse conditions. In Eker et al. (2019), the endogenous behavioural processes only act on the fractional rate of meat-eaters shifting to vegetarianism, while the fractional rate of vegetarians becoming meat-eaters is dependent only on income. Further, changes in the average composition of each dietary type are externally imposed under different scenarios. These structures restrict the model's ability to capture more complex behavioural shifts. In contrast, the increased dynamic complexity in our framework creates more nonlinearities and allows for a wider range of plausible behaviours, including runs where climate-friendly behavioural change reverses over time.
Our modelling framework is not without limitations. It is primarily designed to be embedded in FRIDA and thus is bounded by FRIDA's level of aggregation and specificity, especially at the supply-side. For instance, modelling prices for aggregate food (vegetal and animal) products was deemed impractical at the global scale, thereby necessitating a simplification to scarcity. Modelling relative price/scarcity was also challenging without disaggregation of appropriate meat-alternatives as well as the vegetal-products-demand satisficing assumption. Consequently, we used the overall crop supply-demand balance (including feed, biofuel etc.) instead of only vegetal food products balance to approximate scarcity of meat-alternatives. This ensures that we account for newer sources of crop demand, including novel plant-based meat-alternatives, that compete with traditional crop farming (Newton and Blaustein-Rejto, 2021). Such simplifications for relative prices can be addressed in more disaggregated models.
Similarly, FRIDA does not explicitly model the concept of food waste as a separate process. As a result, waste is included in both food production and demand figures. This simplification reflects the current lack of consistent time-series data on actual household demand and consumption, which limits the ability to calibrate the model to waste-adjusted consumption levels. Consequently, there is a discrepancy between the consumption rate (which includes waste) and target healthy reference level (which excludes waste). This reference level is not scaled with a waste multiplier to avoid embedding waste as a normative component of a healthy diet. This modelling choice ensures that the benchmark remains waste-free and motivates the reduction of demand, whether through lower actual consumption or reduced waste. Future work could address this limitation by explicitly modelling food waste as a distinct, endogenously evolving quantity. That is, the behavioural feedback processes would influence both actual consumption and food waste separately, enabling a more nuanced representation of dietary behaviours.
We have modelled the aggregate per capita demand, while noting variation in behaviours among individuals (across and within regions) around the average values. Heterogenous socio-demographic factors and value orientations are, instead, implicitly captured in the calibrated estimates of weights and sensitivities given to endogenous factors or processes. Further work is underway for policy analysis, including varying these parameters to simulate scenarios with shifting values and social identities over time. Future work could also complement this framework by modelling endogenous value shifts to influence such parameters. For instance, the recent development in modelling lifestyle shifts (Pettifor et al., 2023, 2024) could be a potential avenue. While psychologists warn that pro-environmental behavioural propensities should not be used to infer behaviours that occur in in a dynamic context (Lange and Dewitte, 2019), lifestyle shifts can be used to approximate shifts in values and social identities at the population-level. In turn, these dynamics could endogenously influence relevant sensitivity parameters in our context-specific behavioural model.
Our endogenous behavioural change modelling can be further adapted and applied to energy-related high-impact behaviours such as heating/cooling energy demand and transportation energy demand in future versions of FRIDA. The various energy demands in the present version are modelled primarily as functions of GDP per capita. This has consequences for future projections more broadly, and the simulation results presented here. For instance, climate impacts in terms of STA and SLR could be overestimated due to potentially inflated energy demand projections. If we were to fully endogenize energy demand, the lower simulated climate baseline would also influence behavioural responses in dietary behaviour. Therefore, expanding the scope of the Behavioural Change module in FRIDA is necessary to more robustly assess climate impacts and demand-side mitigation.
Future research could also explore the applicability of our framework to other models beyond FRIDA. For models operating at the national or regional spatial resolutions, the structures presented in our endogenous behavioural model could be easily adapted and calibrated using appropriate time-series data. In such cases, particular attention should be given to the demand-supply dynamics that shape consumer behaviour. Specifically, localized supply needs to encompass both domestic production and imports. For models that disaggregate food products (e.g., by crop and animal type), more extensive adaptation would be required. Beyond arraying the structures for each food category, additional components must be introduced to capture the matrix of within- and across-type relative scarcity/accessibility and diet substitution (e.g., beef to poultry vs. beef to soy). Despite such structural modifications, we anticipate that the core behavioural feedback processes described in this paper would remain applicable, offering a foundation for modelling dietary behaviours across diverse food system contexts.
Ultimately, by endogenizing behavioural feedbacks within a dynamic modelling framework, we provide a pathway for more robust and responsive representations of behavioural change and human-climate interactions, addressing a critical gap in IAMs and advancing the potential for demand-side assessments.
Table A1Documentation of uncertain parameters with estimated values and ranges. Values rounded to nearest integer for reference values; three significant figures for others.
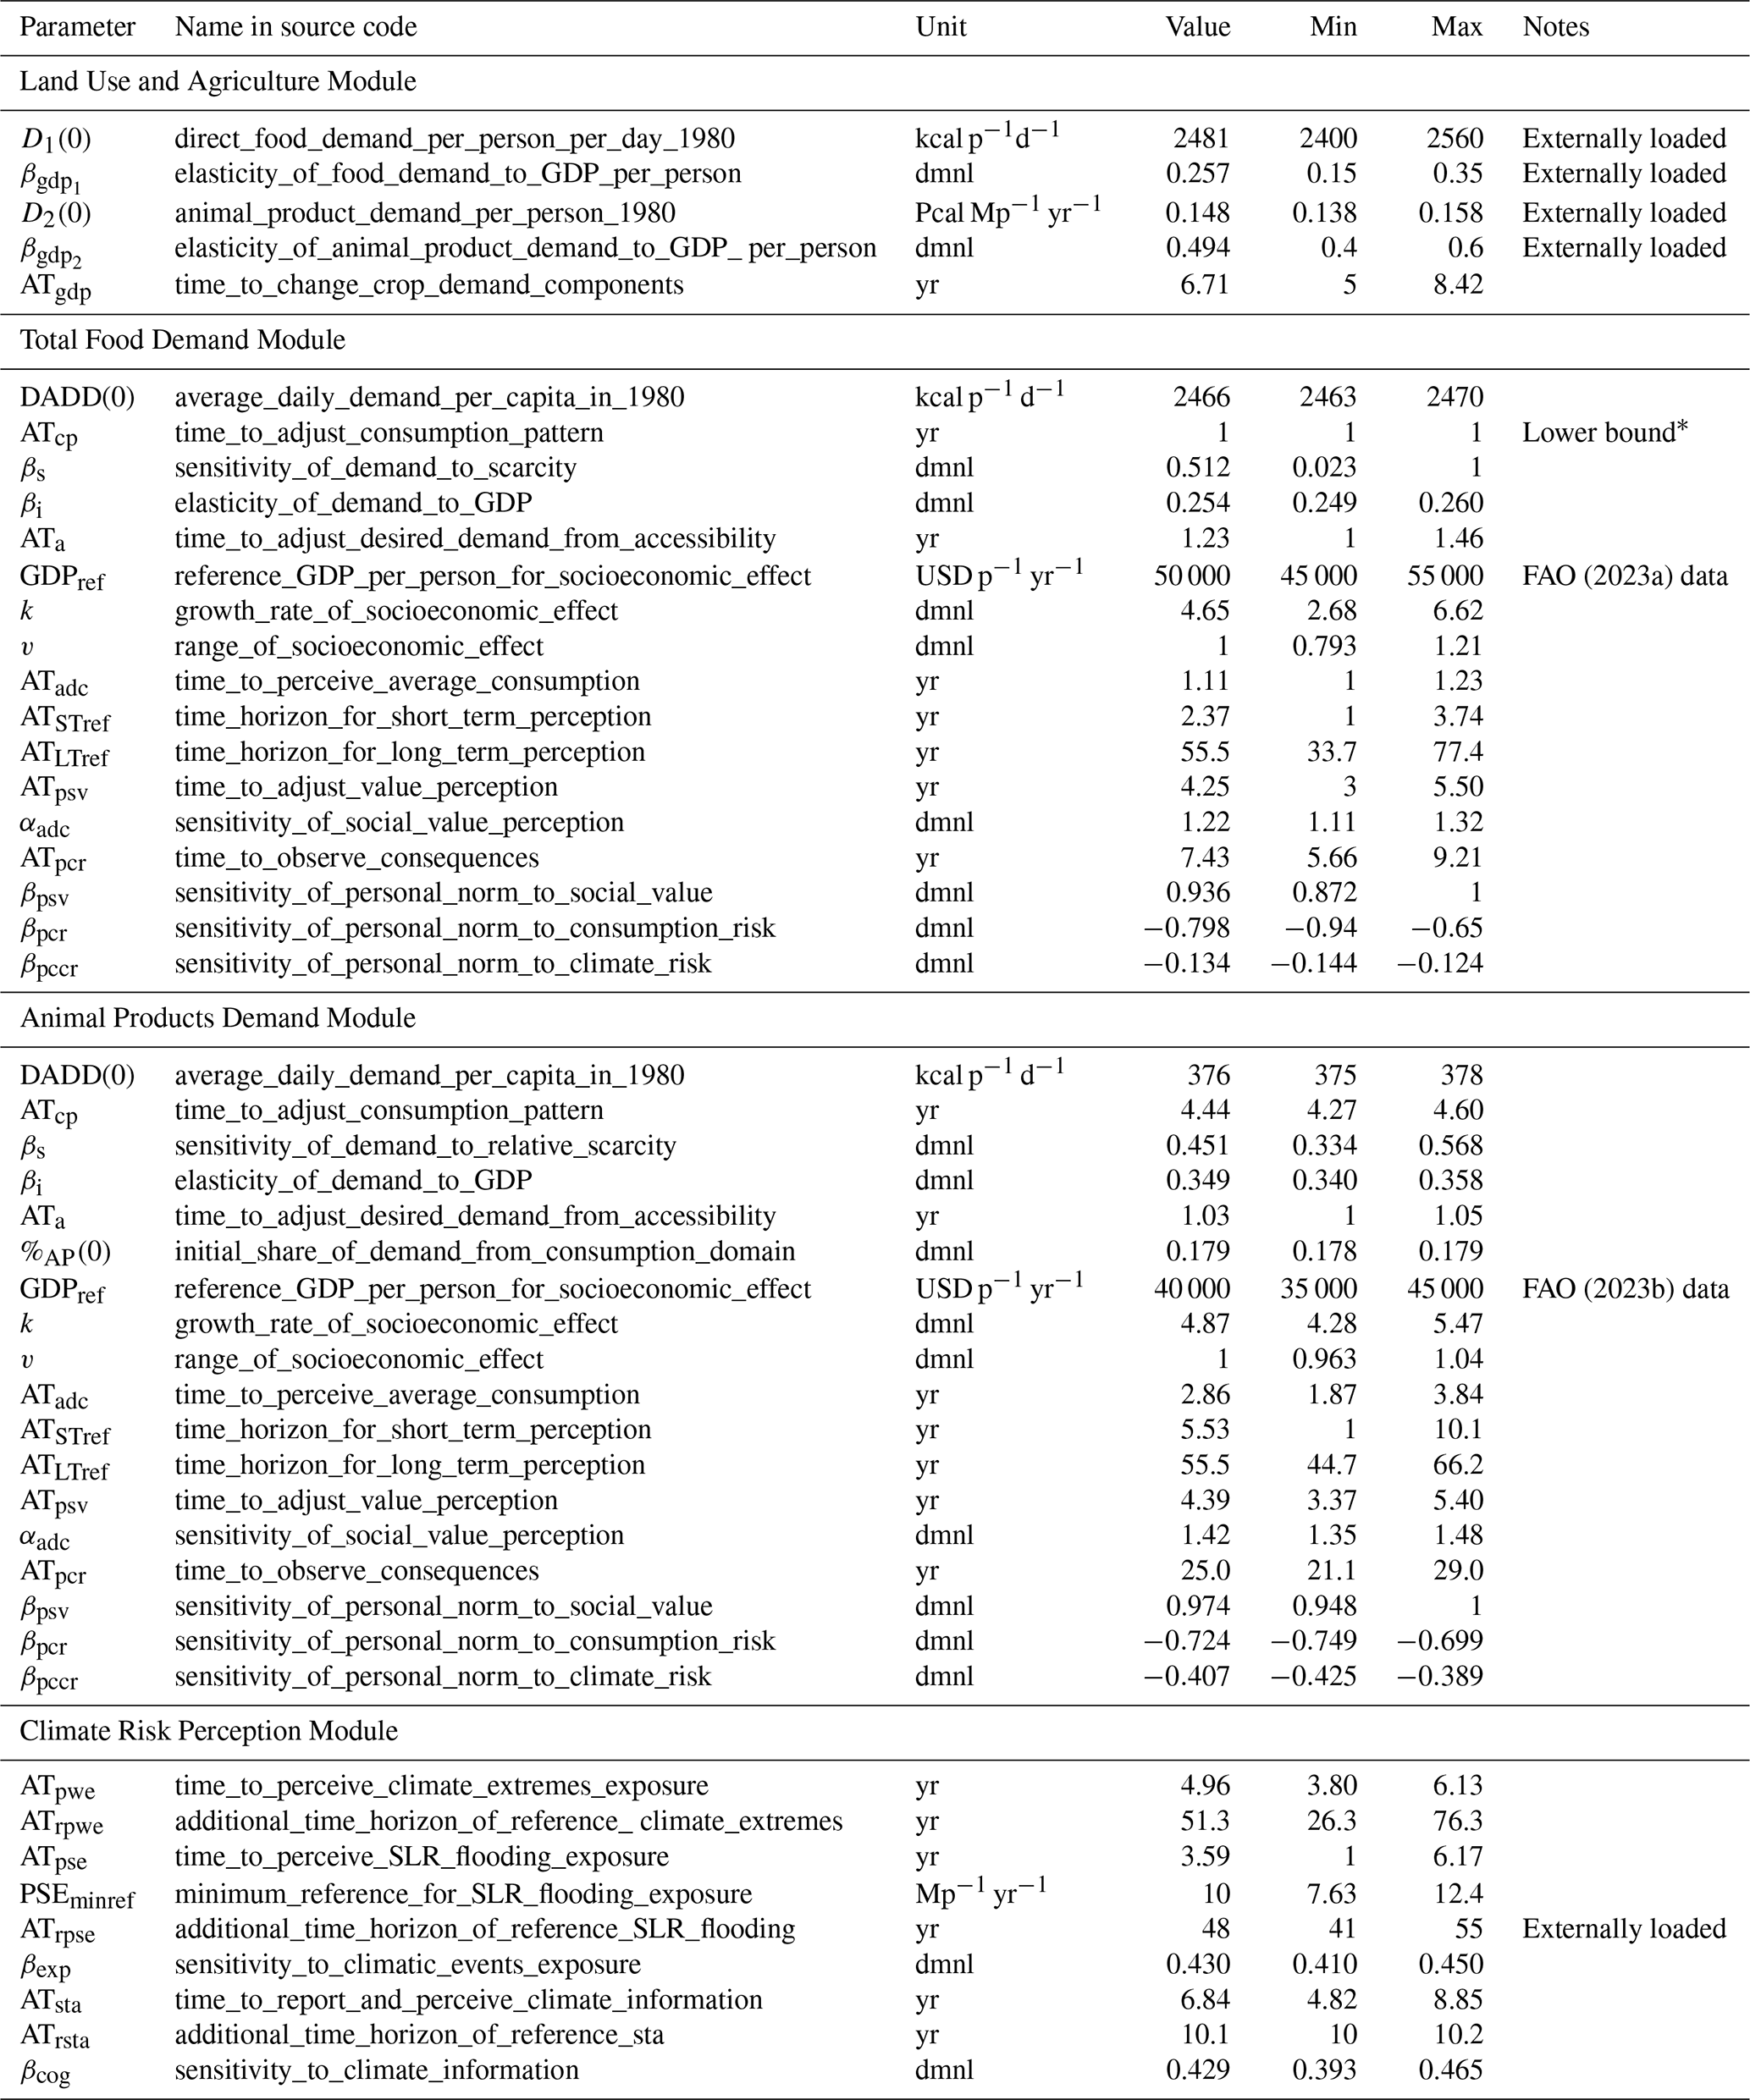
* The time constant was constrained to its lower bound of 1 year during calibration to match the model's annual time unit and avoid numerical instability from sub-annual dynamics.
The output data presented in this paper as well as the codes used for reproducing the figures can be retrieved from the FRIDA Behavioral Change Module repository on Zenodo at https://doi.org/10.5281/zenodo.15397824 (Rajah, 2025). The FRIDA v2.1 model code and its input data are open-source and can be downloaded from https://doi.org/10.5281/zenodo.15310859 (Schoenberg et al., 2025a).
Conceptualization: JKR, BK. Formal analysis: JKR. Funding acquisition: BK, WS. Investigation: JKR. Methodology: JKR, WS. Software: BB, WS. Supervision: BK, WS. Validation: JKR, BB, WS. Visualization: JKR, BB. Writing – original draft: JKR. Writing – review and editing: JKR, BB, BK, WS.
The contact author has declared that none of the authors has any competing interests.
Publisher's note: Copernicus Publications remains neutral with regard to jurisdictional claims made in the text, published maps, institutional affiliations, or any other geographical representation in this paper. While Copernicus Publications makes every effort to include appropriate place names, the final responsibility lies with the authors. Also, please note that this paper has not received English language copy-editing. Views expressed in the text are those of the authors and do not necessarily reflect the views of the publisher.
The authors would like to thank Benedikt Tusch and Gard Hammerseng for assisting with earlier research that informed this modelling framework; Chris Wells for input on extreme events representation; Alex Koberle for insights on the SSP framework; and other WorldTrans members who provided constructive feedback in consortium meetings. The uncertainty analysis ensembles were run using resources of the German Climate Computing Centre (DKRZ) with support from Lennart Ramme.
This research has been supported by the HORIZON EUROPE Climate, Energy and Mobility (grant no. 101081661).
This paper was edited by Roslyn Henry and reviewed by Kaia Waxenberg and one anonymous referee.
Ajzen, I.: The theory of planned behavior, Organiz. Behav. Hum. Decis. Process., 50, 179–211, https://doi.org/10.1016/0749-5978(91)90020-T, 1991.
Akerlof, K., Maibach, E. W., Fitzgerald, D., Cedeno, A. Y., and Neuman, A.: Do people “personally experience” global warming, and if so how, and does it matter?, Global Environ. Change, 23, 81–91, https://doi.org/10.1016/j.gloenvcha.2012.07.006, 2013.
Akerlof, K., Covi, M., and Rohring, E.: Communicating Sea Level Rise, in: Oxford Research Encyclopedia of Climate Science, Oxford University Press, https://doi.org/10.1093/acrefore/9780190228620.013.417, 2017.
Bagnoli, F., Borkmann, D., Guazzini, A., Massaro, E., and Rudolph, S.: Modeling Epidemic Risk Perception in Networks with Community Structure, in: Bio-Inspired Models of Network, Information, and Computing Systems, vol. 134, edited by: Di Caro, G. A. and Theraulaz, G., Springer International Publishing, Cham, 283–295, https://doi.org/10.1007/978-3-319-06944-9_20, 2014.
Bamberg, S. and Möser, G.: Twenty years after Hines, Hungerford, and Tomera: A new meta-analysis of psycho-social determinants of pro-environmental behaviour, J. Environ. Psychol., 27, 14–25, https://doi.org/10.1016/j.jenvp.2006.12.002, 2007.
Beckage, B., Gross, L. J., Lacasse, K., Carr, E., Metcalf, S. S., Winter, J. M., Howe, P. D., Fefferman, N., Franck, T., Zia, A., Kinzig, A., and Hoffman, F. M.: Linking models of human behaviour and climate alters projected climate change, Nat. Clim. Change, 8, 79–84, https://doi.org/10.1038/s41558-017-0031-7, 2018.
Beckage, B., Lacasse, K., Winter, J. M., Gross, L. J., Fefferman, N., Hoffman, F. M., Metcalf, S. S., Franck, T., Carr, E., Zia, A., and Kinzig, A.: The Earth has humans, so why don't our climate models?, Climatic Change, 163, 181–188, https://doi.org/10.1007/s10584-020-02897-x, 2020.
Beckage, B., Moore, F. C., and Lacasse, K.: Incorporating human behaviour into Earth system modelling, Nat. Hum. Behav., 6, 1493–1502, https://doi.org/10.1038/s41562-022-01478-5, 2022.
Berndsen, M. and van der Pligt, J.: Risks of meat: the relative impact of cognitive, affective and moral concerns, Appetite, 44, 195–205, https://doi.org/10.1016/j.appet.2004.10.003, 2005.
Bertoldo, R. and Castro, P.: The outer influence inside us: Exploring the relation between social and personal norms, Resour. Conserv. Recycl., 112, 45–53, https://doi.org/10.1016/j.resconrec.2016.03.020, 2016.
Bijl, D. L., Bogaart, P. W., Dekker, S. C., Stehfest, E., De Vries, B. J. M., and Van Vuuren, D. P.: A physically-based model of long-term food demand, Global Environ. Change, 45, 47–62, https://doi.org/10.1016/j.gloenvcha.2017.04.003, 2017.
Capstick, S., Whitmarsh, L., Poortinga, W., Pidgeon, N., and Upham, P.: International trends in public perceptions of climate change over the past quarter century, WIREs Clim. Change, 6, 35–61, https://doi.org/10.1002/wcc.321, 2015.
Chan, E. Y. and Zlatevska, N.: Jerkies, tacos, and burgers: Subjective socioeconomic status and meat preference, Appetite, 132, 257–266, https://doi.org/10.1016/j.appet.2018.08.027, 2019.
Cialdini, R. B.: Descriptive Social Norms as Underappreciated Sources of Social Control, Psychometrika, 72, 263–268, https://doi.org/10.1007/s11336-006-1560-6, 2007.
Cialdini, R. B., Kallgren, C. A., and Reno, R. R.: A Focus Theory of Normative Conduct: A Theoretical Refinement and Reevaluation of the Role of Norms in Human Behavior, in: Advances in Experimental Social Psychology, vol. 24, Elsevier, 201–234, https://doi.org/10.1016/S0065-2601(08)60330-5, 1991.
Cole, J. R. and McCoskey, S.: Does global meat consumption follow an environmental Kuznets curve?, Sustainability, 9, 26–36, https://doi.org/10.1080/15487733.2013.11908112, 2013.
Creutzig, F., Fernandez, B., Haberl, H., Khosla, R., Mulugetta, Y., and Seto, K. C.: Beyond Technology: Demand-Side Solutions for Climate Change Mitigation, Annu. Rev. Environ. Resour., 41, 173–198, https://doi.org/10.1146/annurev-environ-110615-085428, 2016.
Creutzig, F., Roy, J., Lamb, W. F., Azevedo, I. M. L., Bruine De Bruin, W., Dalkmann, H., Edelenbosch, O. Y., Geels, F. W., Grubler, A., Hepburn, C., Hertwich, E. G., Khosla, R., Mattauch, L., Minx, J. C., Ramakrishnan, A., Rao, N. D., Steinberger, J. K., Tavoni, M., Ürge-Vorsatz, D., and Weber, E. U.: Towards demand-side solutions for mitigating climate change, Nat. Clim. Change, 8, 260–263, https://doi.org/10.1038/s41558-018-0121-1, 2018.
Creutzig, F., Roy, J., Devine-Wright, P., Díaz-José, J., Geels, F. W., Grubler, A., Mazi, N., Masanet, E., Mulugetta, Y., Onyige, C. D., Perkins, P. E., Sanches-Pereira, A., and Weber, E. U.: Demand, Services and Social Aspects of Mitigation, in: Climate Change 2022 – Mitigation of Climate Change, edited by: Intergovernmental Panel On Climate Change (Ipcc), Cambridge University Press, 503–612, https://doi.org/10.1017/9781009157926.007, 2023.
De Groot, J. I. M. and Steg, L.: Mean or green: which values can promote stable pro-environmental behavior?, Conserv. Lett., 2, 61–66, https://doi.org/10.1111/j.1755-263X.2009.00048.x, 2009.
Demski, C., Butler, C., Parkhill, K. A., Spence, A., and Pidgeon, N. F.: Public values for energy system change, Global Environ. Change, 34, 59–69, https://doi.org/10.1016/j.gloenvcha.2015.06.014, 2015.
Doyle, J. and Richardson, A.: The moderating role of post-materialism in the relationship between income and red meat consumption, Int. J. Sociol., 1–19, https://doi.org/10.1080/00207659.2025.2473207, 2025.
Eker, S., Reese, G., and Obersteiner, M.: Modelling the drivers of a widespread shift to sustainable diets, Nat. Sustainabil., 2, 725–735, https://doi.org/10.1038/s41893-019-0331-1, 2019.
FAO: Daily per capita supply of calories vs. GDP per capita, 2021, processed by Our World in Data, https://ourworldindata.org/grapher/daily-per-capita-supply-of-calories-vs-gdp-per-capita (last access: 18 April 2025), 2023a.
FAO: Share of total calories from animal protein – FAO, Data processed by Our World in Data, https://ourworldindata.org/grapher/share-of-calories-from-animal-protein-vs-gdp-per-capita, (last access: 18 April 2025), 2023b.
FAO: FAOSTAT: Food Balances, https://www.fao.org/faostat/en/#data/FBS (last access: 12 December 2024), 2024.
Fetherstonhaugh, D., Slovic, P., Johnson, S., and Friedrich, J.: Insensitivity to the Value of Human Life: A Study of Psychophysical Numbing, J. Risk Uncert., 14, 283–300, https://doi.org/10.1023/A:1007744326393, 1997.
Fischer, R. and Schwartz, S.: Whence Differences in Value Priorities?: Individual, Cultural, or Artifactual Sources, J. Cross-Cult. Psychol., 42, 1127–1144, https://doi.org/10.1177/0022022110381429, 2011.
Forrester, J. W.: Principles of systems, Pegasus Communications, Inc., Waltham, MA, ISBN 978-1-883823-41-2, 1968.
Friedlingstein, P., O'Sullivan, M., Jones, M. W., Andrew, R. M., Hauck, J., Landschützer, P., Le Quéré, C., Li, H., Luijkx, I. T., Olsen, A., Peters, G. P., Peters, W., Pongratz, J., Schwingshackl, C., Sitch, S., Canadell, J. G., Ciais, P., Jackson, R. B., Alin, S. R., Arneth, A., Arora, V., Bates, N. R., Becker, M., Bellouin, N., Berghoff, C. F., Bittig, H. C., Bopp, L., Cadule, P., Campbell, K., Chamberlain, M. A., Chandra, N., Chevallier, F., Chini, L. P., Colligan, T., Decayeux, J., Djeutchouang, L. M., Dou, X., Duran Rojas, C., Enyo, K., Evans, W., Fay, A. R., Feely, R. A., Ford, D. J., Foster, A., Gasser, T., Gehlen, M., Gkritzalis, T., Grassi, G., Gregor, L., Gruber, N., Gürses, Ö., Harris, I., Hefner, M., Heinke, J., Hurtt, G. C., Iida, Y., Ilyina, T., Jacobson, A. R., Jain, A. K., Jarníková, T., Jersild, A., Jiang, F., Jin, Z., Kato, E., Keeling, R. F., Klein Goldewijk, K., Knauer, J., Korsbakken, J. I., Lan, X., Lauvset, S. K., Lefèvre, N., Liu, Z., Liu, J., Ma, L., Maksyutov, S., Marland, G., Mayot, N., McGuire, P. C., Metzl, N., Monacci, N. M., Morgan, E. J., Nakaoka, S.-I., Neill, C., Niwa, Y., Nützel, T., Olivier, L., Ono, T., Palmer, P. I., Pierrot, D., Qin, Z., Resplandy, L., Roobaert, A., Rosan, T. M., Rödenbeck, C., Schwinger, J., Smallman, T. L., Smith, S. M., Sospedra-Alfonso, R., Steinhoff, T., Sun, Q., Sutton, A. J., Séférian, R., Takao, S., Tatebe, H., Tian, H., Tilbrook, B., Torres, O., Tourigny, E., Tsujino, H., Tubiello, F., van der Werf, G., Wanninkhof, R., Wang, X., Yang, D., Yang, X., Yu, Z., Yuan, W., Yue, X., Zaehle, S., Zeng, N., and Zeng, J.: Global Carbon Budget 2024, Earth Syst. Sci. Data, 17, 965–1039, https://doi.org/10.5194/essd-17-965-2025, 2025.
Godfray, H. C. J., Aveyard, P., Garnett, T., Hall, J. W., Key, T. J., Lorimer, J., Pierrehumbert, R. T., Scarborough, P., Springmann, M., and Jebb, S. A.: Meat consumption, health, and the environment, Science, 361, eaam5324, https://doi.org/10.1126/science.aam5324, 2018.
Hammerseng, G.: A Systematic Mapping of Meat Consumption Behaviours: Socio-Cultural Dimensions, MS Thesis, University of Bergen, Bergen, Norway, https://hdl.handle.net/11250/3175908 (last access: 12 March 2025), 2024.
Hulme, M., Dessai, S., Lorenzoni, I., and Nelson, D. R.: Unstable climates: Exploring the statistical and social constructions of `normal' climate, Geoforum, 40, 197–206, https://doi.org/10.1016/j.geoforum.2008.09.010, 2009.
Kahneman, D.: Thinking, fast and slow, Farrar, Straus and Giroux, New York, ISBN 978-0-374-27563-1, 2011.
Kahneman, D. and Tversky, A.: Prospect Theory: An Analysis of Decision under Risk, Econometrica, 47, 263, https://doi.org/10.2307/1914185, 1979.
Kaiser, F. G., Hübner, G., and Bogner, F. X.: Contrasting the Theory of Planned Behavior With the Value-Belief-Norm Model in Explaining Conservation Behavior, J. Appl. Social Psychol., 35, 2150–2170, https://doi.org/10.1111/j.1559-1816.2005.tb02213.x, 2005.
Kendal, D. and Raymond, C. M.: Understanding pathways to shifting people's values over time in the context of social–ecological systems, Sustain. Sci., 14, 1333–1342, https://doi.org/10.1007/s11625-018-0648-0, 2019.
Lange, F. and Dewitte, S.: Measuring pro-environmental behavior: Review and recommendations, J. Environ. Psychol., 63, 92–100, https://doi.org/10.1016/j.jenvp.2019.04.009, 2019.
Leiserowitz, A.: Climate Change Risk Perception and Policy Preferences: The Role of Affect, Imagery, and Values, Climatic Change, 77, 45–72, https://doi.org/10.1007/s10584-006-9059-9, 2006.
Li, B., Liu, K., Wang, M., Wang, Q., He, Q., and Li, C.: Future Global Population Exposure to Record-Breaking Climate Extremes, Earth's Future, 11, e2023EF003786, https://doi.org/10.1029/2023EF003786, 2023.
Libarkin, J. C., Gold, A. U., Harris, S. E., McNeal, K. S., and Bowles, R. P.: A new, valid measure of climate change understanding: associations with risk perception, Climatic Change, 150, 403–416, https://doi.org/10.1007/s10584-018-2279-y, 2018.
Linder, N., Giusti, M., Samuelsson, K., and Barthel, S.: Pro-environmental habits: An underexplored research agenda in sustainability science, Ambio, 51, 546–556, https://doi.org/10.1007/s13280-021-01619-6, 2022.
Manfredo, M. J., Bruskotter, J. T., Teel, T. L., Fulton, D., Schwartz, S. H., Arlinghaus, R., Oishi, S., Uskul, A. K., Redford, K., Kitayama, S., and Sullivan, L.: Why social values cannot be changed for the sake of conservation, Conserv. Biol., 31, 772–780, https://doi.org/10.1111/cobi.12855, 2017.
Mathematical builtins: Mathematical Builtins, https://www.iseesystems.com/resources/help/v3/Content/08-Reference/07-Builtins/Mathematical_builtins.htm#MAXSOFT (last access: 5 April 2025), 2025.
Mathias, J., Debeljak, M., Deffuant, G., Diemer, A., Dierickx, F., Donges, J. F., Gladkykh, G., Heitzig, J., Holtz, G., Obergassel, W., Pellaud, F., Sánchez, A., Trajanov, A., and Videira, N.: Grounding Social Foundations for Integrated Assessment Models of Climate Change, Earth's Future, 8, https://doi.org/10.1029/2020EF001573, 2020.
Milford, A. B., Le Mouël, C., Bodirsky, B. L., and Rolinski, S.: Drivers of meat consumption, Appetite, 141, 104313, https://doi.org/10.1016/j.appet.2019.06.005, 2019.
Newton, P. and Blaustein-Rejto, D.: Social and Economic Opportunities and Challenges of Plant-Based and Cultured Meat for Rural Producers in the US, Front. Sustain. Food Syst., 5, 624270, https://doi.org/10.3389/fsufs.2021.624270, 2021.
Nielsen, K. S., Cologna, V., Lange, F., Brick, C., and Stern, P. C.: The case for impact-focused environmental psychology, J. Environ. Psychol., 74, 101559, https://doi.org/10.1016/j.jenvp.2021.101559, 2021.
Niemiec, R. M., Champine, V., Vaske, J. J., and Mertens, A.: Does the Impact of Norms Vary by Type of Norm and Type of Conservation Behavior? A Meta-Analysis, Society Nat. Resour., 33, 1024–1040, https://doi.org/10.1080/08941920.2020.1729912, 2020.
Noyes, W.: COVID's Dynamic Impact on Consumer Behavior in the US: A System Dynamics Approach to Understanding People's Perception, Cognition, and Reaction to COVID-19, MS Thesis, University of Bergen, Bergen, Norway, https://hdl.handle.net/11250/2761420 (last access: 3 March 2025), 2021.
Ogunbode, C. A., Demski, C., Capstick, S. B., and Sposato, R. G.: Attribution matters: Revisiting the link between extreme weather experience and climate change mitigation responses, Global Environ. Change, 54, 31–39, https://doi.org/10.1016/j.gloenvcha.2018.11.005, 2019.
Osberghaus, D.: Prospect theory, mitigation and adaptation to climate change, J. Risk Res., 20, 909–930, https://doi.org/10.1080/13669877.2015.1121907, 2017.
Pettifor, H., Agnew, M., and Wilson, C.: A framework for measuring and modelling low-carbon lifestyles, Global Environ. Change, 82, 102739, https://doi.org/10.1016/j.gloenvcha.2023.102739, 2023.
Pettifor, H., Mastrucci, A., Wilson, C., Van Ruijven, B., Agnew, M., and Gallic, T. L.: Endogenous simulation of low-carbon lifestyle change in global climate mitigation pathways, Environ. Res. Lett., 19, 014016, https://doi.org/10.1088/1748-9326/acf6d6, 2024.
Powell, M. J.: The BOBYQA algorithm for bound constrained optimization without derivatives, University of Cambridge, Cambridge, UK, https://www.damtp.cam.ac.uk/user/na/NA_papers/NA2009_06.pdf (last access: 12 March 2025), 2009.
Prentice-Dunn, S. and Rogers, R. W.: Protection Motivation Theory and preventive health: beyond the Health Belief Model, Health Educ. Res., 1, 153–161, https://doi.org/10.1093/her/1.3.153, 1986.
Rajah, J. K.: FRIDA Behavioral Change Module – Output Data Repository (1.1.0), Zenodo [data set], https://doi.org/10.5281/zenodo.15397823, 2025.
Rajah, J. K. and Kopainsky, B.: Human behavioural drivers of meat consumption: Using group model building to capture lived realities, in: Proceedings of the 2024 International System Dynamics Conference, International System Dynamics Conference 2024, Bergen, Norway, https://proceedings.systemdynamics.org/2024/papers/T1103.pdf (last access: 12 March 2025), 2024.
Rajah, J. K. and Kopainsky, B.: A systematic method to integrate co-produced causal loop diagrams based on feedback stories, Syst. Dynam. Rev., 41, e1794, https://doi.org/10.1002/sdr.1794, 2025.
Rajah, J. K., Tusch, B., Hammerseng, G., and Kopainsky, B.: Conceptualising an endogenous representation of human behaviour change in a feedback-based, global-scale integrated assessment model, 17th IAMC Annual Meeting, Seoul, Korea, Zenodo, https://doi.org/10.5281/zenodo.14202786, 2024.
Ramme, L., Blanz, B., Wells, C., Wong, T. E., Schoenberg, W., Smith, C., and Li, C.: Feedback-based sea level rise impact modelling for integrated assessment models with FRISIAv1.0, EGUsphere [preprint], https://doi.org/10.5194/egusphere-2025-1875, 2025.
Riahi, K., Van Vuuren, D. P., Kriegler, E., Edmonds, J., O'Neill, B. C., Fujimori, S., Bauer, N., Calvin, K., Dellink, R., Fricko, O., Lutz, W., Popp, A., Cuaresma, J. C., Kc, S., Leimbach, M., Jiang, L., Kram, T., Rao, S., Emmerling, J., Ebi, K., Hasegawa, T., Havlik, P., Humpenöder, F., Da Silva, L. A., Smith, S., Stehfest, E., Bosetti, V., Eom, J., Gernaat, D., Masui, T., Rogelj, J., Strefler, J., Drouet, L., Krey, V., Luderer, G., Harmsen, M., Takahashi, K., Baumstark, L., Doelman, J. C., Kainuma, M., Klimont, Z., Marangoni, G., Lotze-Campen, H., Obersteiner, M., Tabeau, A., and Tavoni, M.: The Shared Socioeconomic Pathways and their energy, land use, and greenhouse gas emissions implications: An overview, Global Environ. Change, 42, 153–168, https://doi.org/10.1016/j.gloenvcha.2016.05.009, 2017.
Rogers, R. W.: A Protection Motivation Theory of Fear Appeals and Attitude Change, J. Psychol., 91, 93–114, https://doi.org/10.1080/00223980.1975.9915803, 1975.
Schmidhuber, J. and Shetty, P.: The nutrition transition to 2030. Why developing countries are likely to bear the major burden, Food Economics – Acta Agriculturae Scandinavica, Section C, 2, 150–166, https://doi.org/10.1080/16507540500534812, 2005.
Schoenberg, W., Blanz, B., Ramme, L., Wells, C., Grimeland, M., Callegari, B., Breier, J., Rajah, J., Nicolaidis Lindqvist, A., Mashhadi, S., Muralidhar, A., and Eriksson, A.: FRIDA: Feedback-based knowledge Repository for IntegrateD Assessments (v2.1), Zenodo [code and data set], https://doi.org/10.5281/zenodo.15310859, 2025a.
Schoenberg, W., Blanz, B., Rajah, J. K., Callegari, B., Wells, C., Breier, J., Grimeland, M. B., Lindqvist, A. N., Ramme, L., Smith, C., Li, C., Mashhadi, S., Muralidhar, A., and Mauritzen, C.: Introducing FRIDA v2.1: A feedback-based, fully coupled, global integrated assessment model of climate and humans, EGUsphere [preprint], https://doi.org/10.5194/egusphere-2025-2599, 2025b.
Schwartz, S. H.: Normative Influences on Altruism, in: Advances in Experimental Social Psychology, vol. 10, Elsevier, 221–279, https://doi.org/10.1016/S0065-2601(08)60358-5, 1977.
Shove, E.: Beyond the ABC: Climate Change Policy and Theories of Social Change, Environ. Plan. A, 42, 1273–1285, https://doi.org/10.1068/a42282, 2010.
Slovic, P.: “If I look at the mass I will never act”: Psychic numbing and genocide, Judgm. Decis. Make., 2, 79–95, https://doi.org/10.1017/S1930297500000061, 2007.
Sobol', I. M. and Levitan, Yu. L.: A pseudo-random number generator for personal computers, Comput. Math. Appl., 37, 33–40, https://doi.org/10.1016/S0898-1221(99)00057-7, 1999.
Sparkman, G. and Walton, G. M.: Dynamic Norms Promote Sustainable Behavior, Even if It Is Counternormative, Psychol. Sci., 28, 1663–1674, https://doi.org/10.1177/0956797617719950, 2017.
Sterman, J.: Business dynamics: systems thinking and modeling for a complex world, Irwin/McGraw-Hill, Boston, 982 pp., ISBN 978-0-07-231135-8, 2000.
Sterman, J. D.: Systems Simulation: Expectation formation in behavioral simulation models, Syst. Res., 32, 190–211, https://doi.org/10.1002/bs.3830320304, 1987.
Stevens, S. S.: Psychophysics: Introduction to Its Perceptual, Neural, and Social Prospects, edited by: Stevens, G., Wiley, New York, 329 pp., ISBN 978-0-471-82437-4, 1975.
Tilman, D. and Clark, M.: Global diets link environmental sustainability and human health, Nature, 515, 518–522, https://doi.org/10.1038/nature13959, 2014.
Tilman, D., Balzer, C., Hill, J., and Befort, B. L.: Global food demand and the sustainable intensification of agriculture, P. Natl. Acad. Sci. USA, 108, 20260–20264, https://doi.org/10.1073/pnas.1116437108, 2011.
Tomek, W. G.: Commodity Prices Revisited, Agricult. Resour. Econ. Rev., 29, 125–137, https://doi.org/10.22004/AG.ECON.31309, 2000.
Tusch, B.: Modelling Endogenized Human Behavior: A System Dynamics Based Integration of Pro-Environmental Intention in Integrated Assessment Modelling, MS Thesis, University of Bergen, Bergen, Norway, https://hdl.handle.net/11250/3152641 (last access: 12 March 2025), 2024.
van Beek, L., Hajer, M., Pelzer, P., van Vuuren, D., and Cassen, C.: Anticipating futures through models: the rise of Integrated Assessment Modelling in the climate science-policy interface since 1970, Global Environ. Change, 65, 102191, https://doi.org/10.1016/j.gloenvcha.2020.102191, 2020.
van den Berg, N. J., Hof, A. F., Akenji, L., Edelenbosch, O. Y., Van Sluisveld, M. A. E., Timmer, V. J., and Van Vuuren, D. P.: Improved modelling of lifestyle changes in Integrated Assessment Models: Cross-disciplinary insights from methodologies and theories, Energ. Strateg. Rev., 26, 100420, https://doi.org/10.1016/j.esr.2019.100420, 2019.
van den Berg, N. J., Hof, A. F., Timmer, V., Akenji, L., and Van Vuuren, D. P.: (Path)ways to sustainable living: The impact of the SLIM scenarios on long-term emissions, Global Environ. Change, 84, 102774, https://doi.org/10.1016/j.gloenvcha.2023.102774, 2024.
van der Linden, S.: The social-psychological determinants of climate change risk perceptions: Towards a comprehensive model, J. Environ. Psychol., 41, 112–124, https://doi.org/10.1016/j.jenvp.2014.11.012, 2015.
van Valkengoed, A. M., Steg, L., and Perlaviciute, G.: The psychological distance of climate change is overestimated, One Earth, 6, 362–391, https://doi.org/10.1016/j.oneear.2023.03.006, 2023.
van Valkengoed, A. M., Perlaviciute, G., and Steg, L.: Representing the drivers of lifestyle change in Integrated Assessment Models using theories from environmental psychology: introducing the Motivation, Agency, and Past Behaviour (MAP) framework, Environ. Res. Commun., 7, 032001, https://doi.org/10.1088/2515-7620/adb9bf, 2025.
Villacis, A. H., Alwang, J. R., and Barrera, V.: Linking risk preferences and risk perceptions of climate change: A prospect theory approach, Agricult. Econ., 52, 863–877, https://doi.org/10.1111/agec.12659, 2021.
Vranken, L., Avermaete, T., Petalios, D., and Mathijs, E.: Curbing global meat consumption: Emerging evidence of a second nutrition transition, Environ. Sci. Policy, 39, 95–106, https://doi.org/10.1016/j.envsci.2014.02.009, 2014.
Wells, C., Blanz, B., Ramme, L., Breier, J., Callegari, B., Muralidhar, A., Rajah, J. K., Lindqvist, A. N., Eriksson, A. E., Schoenberg, W. A., Köberle, A. C., Wang-Erlandsson, L., Mauritzen, C., and Smith, C.: The Representation of Climate Impacts in the FRIDAv2.1 Integrated Assessment Model, EGUsphere [preprint], https://doi.org/10.5194/egusphere-2025-2756, 2025.
Willett, W., Rockström, J., Loken, B., Springmann, M., Lang, T., Vermeulen, S., Garnett, T., Tilman, D., DeClerck, F., Wood, A., Jonell, M., Clark, M., Gordon, L. J., Fanzo, J., Hawkes, C., Zurayk, R., Rivera, J. A., Vries, W. D., Sibanda, L. M., Afshin, A., Chaudhary, A., Herrero, M., Agustina, R., Branca, F., Lartey, A., Fan, S., Crona, B., Fox, E., Bignet, V., Troell, M., Lindahl, T., Singh, S., Cornell, S. E., Reddy, K. S., Narain, S., Nishtar, S., and Murray, C. J. L.: Food in the Anthropocene: the EAT–Lancet Commission on healthy diets from sustainable food systems, Lancet, 393, 447–492, https://doi.org/10.1016/S0140-6736(18)31788-4, 2019.
Wohlgezogen, F., McCabe, A., Osegowitsch, T., and Mol, J.: The wicked problem of climate change and interdisciplinary research: Tracking management scholarship's contribution, J. Manage. Organiz., 26, 1048–1072, https://doi.org/10.1017/jmo.2020.14, 2020.
Wong-Parodi, G. and Berlin Rubin, N.: Exploring how climate change subjective attribution, personal experience with extremes, concern, and subjective knowledge relate to pro-environmental attitudes and behavioral intentions in the United States, J. Environ. Psychol., 79, 101728, https://doi.org/10.1016/j.jenvp.2021.101728, 2022.
Xie, B., Brewer, M. B., Hayes, B. K., McDonald, R. I., and Newell, B. R.: Predicting climate change risk perception and willingness to act, J. Environ. Psychol., 65, 101331, https://doi.org/10.1016/j.jenvp.2019.101331, 2019.
- Abstract
- Introduction
- Existing behavioural change models
- Model description
- Model calibration and uncertainty analysis
- Simulation results and discussion
- Conclusions
- Appendix A: Uncertain parameters
- Code and data availability
- Author contributions
- Competing interests
- Disclaimer
- Acknowledgements
- Financial support
- Review statement
- References