the Creative Commons Attribution 4.0 License.
the Creative Commons Attribution 4.0 License.
ISWNM-NSCS v2.0: advancing the internal solitary wave numerical model with background currents and horizontally inhomogeneous stratifications
Yankun Gong
Xueen Chen
Jiexin Xu
Zhiwu Chen
Qingyou He
Ruixiang Zhao
Xiao-Hua Zhu
Shuqun Cai
A new version of an internal solitary wave (ISW) model, Internal Solitary Wave Numerical Model-Northern South China Sea version 2.0 (ISWNM-NSCS v2.0), is presented. Background currents and horizontally inhomogeneous stratifications are implemented in ISWNM-NSCS v2.0 to better reproduce ISW properties, including arrival time, mode-1 wave amplitude, wave-induced velocity, characteristic half-width, and propagation direction. Optimized viscosity and diffusivity coefficients (i.e., 1.0 × 10⁻² m2 s−1 in the horizontal and 1.0 × 10⁻⁵ m2 s−1 in the vertical) are also introduced to maintain stable stratifications within the model domain, thereby prolonging the model's valid forecasting period. A mooring station around the Dongsha Atoll is used for model evaluation and numbers of sensitivity experiments are implemented to illustrate the individual effect of the major updates. In comparison with ISWFM-NSCS v1.0, ISWNM-NSCS v2.0 significantly enhances model accuracy in forecasting ISW characteristics, with a 37 % improvement in arrival time, a 34 % improvement in mode-1 wave amplitude, a 25 % improvement in wave-induced velocity, and an 85 % improvement in half-width.
- Article
(26273 KB) - Full-text XML
- BibTeX
- EndNote
Internal solitary wave (ISW) research has historically relied on theoretical frameworks to describe non-linear wave dynamics. Weakly non-linear theories, epitomized by the Korteweg–de Vries (KdV) equation (Benney, 1966) and its extensions (Grimshaw et al., 2010), employ asymptotic expansions to decouple vertical structure from horizontal evolution. While providing valuable conceptual insights, these approximations exhibit systematic quantitative deficiencies for large-amplitude ISWs, particularly in the northern South China Sea (NSCS), where vertical displacements of ISWs exceed 200 m (Huang et al., 2017; Alford et al., 2015). Specifically, KdV-type theories might overestimate phase speeds and underestimate wave widths (Lamb, 1999; Stastna and Lamb, 2008), limiting their utility as predictive tools. Concurrently, the exact Dubreil–Jacotin–Long (DJL) theory emerged as a mathematically complete alternative, solving the stratified Euler equations without amplitude or wavelength approximations (Stastna and Legare, 2024). The DJL equation computes ISW structure and propagation speed through an eigenvalue problem that intrinsically accounts for isopycnal displacement effects, providing high-fidelity solutions even for complex stratifications. Nevertheless, both KdV and DJL approaches share inherent constraints, in that they describe steady-state waves or slow shoaling dynamics (Lamb and Xiao, 2014) but cannot resolve transient 3D processes and define entire ISW life cycles in realistic oceans.
To overcome these limitations, high-resolution numerical solvers have become indispensable for simulating ISW dynamics. By the early 21st century, two-layer analytical models (Holloway et al., 1997) and depth-averaged 2D hydrostatic approaches (Du et al., 2008) proved inadequate for capturing non-hydrostatic effects and strong non-linearity in regions like the NSCS. This spurred development of high-resolution 3D non-hydrostatic solvers capable of resolving critical processes, including generation, propagation, and dissipation of ISWs (Simmons et al., 2011). Contemporary open-source frameworks like SUNTANS (Zhang et al., 2011), MITgcm (Vlasenko et al., 2005; Alford et al., 2015), and FVCOM (Lai et al., 2019) now enable realistic simulations of ISW generation, propagation, and dissipation through advanced numerical schemes validated against modern observational arrays. These advances form the foundation for our ISWFM-NSCS model, which bridges the gap between theoretical paradigms and operational forecasting in the NSCS basin.
ISWFM-NSCS v1.0 (Gong et al., 2023) is one of the realistic 3D ISW forecasting models in the NSCS, developed by a primitive equation ocean solver (MITgcm, Marshall et al., 1997). ISWFM-NSCS v1.0 employs a high horizontal resolution of 500 m and 90 vertical layers, designed to resolve large amplitudes and short wavelengths of ISWs observed in the NSCS. ISWFM-NSCS v1.0 has demonstrated robust performance in characterizing small-scale dynamics within 15 modal days, as evidenced by comparisons with field observations and satellite images. However, as discussed in Gong et al. (2023), there remains potential for enhancement in the coefficient configurations, initial conditions, and boundary conditions.
Firstly, the valid forecasting period in ISWFM-NSCS v1.0 is limited to 15 d, as the stratifications significantly weaken beyond this time frame. Viscosity and diffusivity parameters determine the extent of mixing and dissipation of energy in the model. Higher coefficients increase the damping of internal waves, leading to smoother wave fields and reduced wave amplitudes. This can help in preventing numerical instabilities but might underestimate the wave energy and dynamics (Legg and Huijts, 2006). In contrast, low-valued coefficients might lead to numerical noise and spurious oscillations (Álvarez et al., 2019). Therefore, optimizing the settings for viscosity and diffusivity coefficients is essential for maintaining numerical stability in high-resolution models (Nagai and Hibiya, 2015; Stewart et al., 2017) and extending the valid forecasting period (e.g., 30 d or more).
Secondly, initial stratification profiles (temperature and salinity) in ISWFM-NSCS v1.0 are horizontally homogeneous. However, previous studies (e.g., Centurioni et al., 2004; Chao et al., 2007) have observed that the thermocline in the Luzon Strait rises in the west due to the influence of the northward-flowing Kuroshio. Zheng et al. (2007) suggested that the deepening of the thermocline toward the east could hinder the development of eastward-moving solitons in the Pacific. Additionally, idealized 2D model simulations by Shaw et al. (2009) and Buijsman et al. (2010) demonstrated that a sharper and shallower thermocline on the western side of the Luzon Strait, compared with the eastern side, leads to the generation of larger westward-propagating solitons. While these studies shed light on how horizontally inhomogeneous stratification affects the east–west asymmetry of internal solitary waves, their findings have yet to be verified using a realistic 3D model.
Thirdly, ISWFM-NSCS v1.0 does not account for background currents, which are a crucial factor in ISW dynamics. While it is well-established that background stratification and currents significantly affect the characteristics and behavior of ISWs (DeCarlo et al., 2015; Li et al., 2016), the effects of more complex dynamic motions, such as oceanic currents and mesoscale eddies, remain inadequately explored. Specifically, the effects of the Kuroshio (Caruso et al., 2006) and mesoscale eddies (Xie et al., 2015) on ISWs have not yet been examined using a realistic 3D model. The absence of such considerations in ISWFM-NSCS v1.0 suggests a gap in our understanding, as incorporating these dynamic elements could provide deeper insights into how ISWs interact with background currents.
In this work, we present an updated version of a high-performance numerical model for predicting ISWs in the NSCS (called ISWNM-NSCS v2.0 hereafter) and evaluate the roles of optimized turbulence configurations, horizontally inhomogeneous stratifications, and background currents in precisely forecasting ISWs through numerical sensitivity experiments. The structure of the manuscript is outlined as follows. A description of the model is given and the major updates made from ISWFM-NSCS v1.0 to ISWNM-NSCS v2.0 are summarized in Sect. 2. The updated model results and corresponding calibrations are detailed in Sect. 3. Moreover, we provide a quantitative analysis to demonstrate the roles of optimized viscosity and diffusivity, horizontally inhomogeneous stratifications, and background currents in the ISWNM-NSCS v2.0 in Sect. 4. Turbulence configurations are further discussed in Sect. 5. Conclusions follow in Sect. 6.
As ISWFM-NSCS v1.0 has been described in Gong et al. (2023), only the main concepts are reviewed here. In ISWNM-NSCS, a realistic 3D non-hydrostatic oceanic solver, MITgcm (Marshall et al., 1997; Adcroft et al., 2008), is employed to reproduce generation, propagation, and dissipation processes of ISWs in the NSCS. As discussed in Gong et al. (2023), in ISWFM-NSCS v1.0 the horizontal cell size is set to 500 m, providing approximately six to eight grid points per characteristic half-width for typical ISWs in the NSCS, aligning with established resolution standards for internal wave process studies (e.g., Zhang et al., 2011; Lai et al., 2019), with 90 vertical layers (i.e., from 5 m at the sea surface to 120 m at the bottom). The configuration presents an optimal balance between computational efficiency and dynamic precision for regional-scale forecasting. More detailed sensitivity analyses of resolution thresholds are available in Gong et al. (2023).
A time step of 10 s ensures compliance with the Courant–Friedrichs–Lewy (CFL) conditions. Horizontally homogeneous temperature and salinity profiles are initialized by using the climatology WOA 2018 dataset (https://www.ncei.noaa.gov/access/world-ocean-atlas-2018/, last access: 10 July 2024) and the model bathymetry is obtained by interpolating the GEBCO dataset (https://www.gebco.net/data_and_products/gridded_bathymetry_data, last access: 10 July 2024). Eight primary barotropic tidal constituents, extracted from the TPXO8-atlas dataset (Egbert and Erofeeva, 2002), are applied at each lateral boundary, with a 25 km wide sponge layer absorbing internal wave energy (Zhang et al., 2011). However, background currents and eddies have not been taken into account in ISWFM-NSCS v1.0. To mitigate grid-scale instability, constant turbulent parameters (including viscosity and diffusivity) are applied as follows: Ah=0.5 m2 s−1; Av=5.0 × 10⁻³ m2 s−1; Kh=0.5 m2 s−1; Kv=5.0 × 10⁻³ m2 s−1.
In comparison with field observations and satellite imagery, a test case applying the ISWFM-NSCS v1.0 shows good performance in reproducing ISW properties within the first 10 model days. Specifically, the root mean square deviations (RMSDs) of arrival time, maximum vertical wave amplitude, and baroclinic velocity are 0.71 h, 37.27 m, and 0.41 m s−1, respectively. However, the stratification profiles gradually weaken with descending thermocline depth after the 10th model day, limiting the effective duration of the forecasting model. As discussed in ISWFM-NSCS v1.0, the prediction accuracy may be improved to take account of background currents (Xie et al., 2015) and horizontally inhomogeneous stratifications (Buijsman et al., 2010). This section describes the major updates in comparison with ISWFM-NSCS v1.0 (marked in red in Fig. 1).
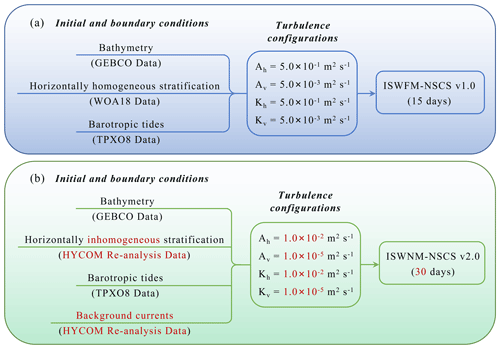
Figure 1(a) Configuration and implementation of ISWFM-NSCS v1.0, which includes initial and boundary conditions. (b) Same as (a) but for ISWNM-NSCS v2.0. Note that the major model updates are marked in red in (b).
2.1 Optimizations of viscosity and diffusivity
In ISWFM-NSCS v1.0, high values of eddy viscosity and diffusivity coefficients (i.e., 0.5 m2 s−1 in the horizontal and 5.0 × 10⁻³ m2 s−1 in the vertical) are empirically selected to be sufficient to eliminate grid-scale noise in the velocity and mixing fields (Legg and Huijts, 2006). However, these values generally weaken the background stratifications within the entire model domain, in particular after 2 weeks, potentially dampening ISW amplitudes and underestimating the wave non-linearity. Hence, the valid forecasting duration of ISWFM-NSCS v1.0 is less than 15 d, due to the weakening stratification. Therefore, we optimize the eddy viscosity and diffusivity coefficients to extend the valid forecasting duration. The specific parameter updates are detailed below.
Vertical diffusivity in ISWNM-NSCS v2.0 is set to 1.0 × 10⁻⁵ m2 s−1 (Fig. 1), consistent with microstructure measurements of background diapycnal mixing in the summer NSCS (Shang et al., 2017). A horizontal tracer diffusivity of 1.0 × 10⁻² m2 s−1 is adopted, following established subgrid-scale parameterizations for mesoscale-resolving models (Large et al., 1994). While transient events (e.g., internal tide breaking) elevate diffusivity to O(10−5–10−4 m2 s−1) (Sun et al., 2016; Yang et al., 2016), our constant coefficients represent baseline values. Sensitivity analyses confirmed that such diffusivity magnitudes preserved large-scale internal wave energetics, despite minor impacts on short-wavelength features (Jachec, 2007; Vlasenko et al., 2010). For momentum closure, horizontal eddy viscosity (Ah=1.0 × 10⁻² m2 s−1) parameterizes unresolved lateral dissipation from inertial ranges and mesoscale processes (Smagorinsky, 1963), while vertical eddy viscosity (Av=1.0 × 10⁻² m2 s−1) represents turbulence from shear instabilities and internal wave breaking (Mellor and Yamada, 1982). This configuration aligns with implementations for the China Seas using MITgcm (Min et al., 2023; Vlasenko et al., 2018).
To establish physical robustness, we further validate these values through systematic sensitivity experiments (Sect. 5.1), demonstrating that horizontal and vertical viscosities/diffusivities of 1.0 × 10⁻² and 1.0 × 10⁻⁵ m2 s−1 optimally reproduce observed ISW properties in the NSCS while maintaining numerical stability.
2.2 Horizontally inhomogeneous stratifications
Numerous satellite images revealed the east–west asymmetric characteristics of ISWs in the Luzon Strait in the NSCS (e.g., Jackson and Apel, 2004; Alford et al., 2015). In previous literature, the asymmetry of ISWs is described as a multifaceted phenomenon influenced by asymmetric barotropic tides, water depth differences between the NSCS and Pacific Ocean, westward thermocline shoaling related to the Kuroshio Current, and internal tide resonance in a double ridge configuration. In ISWFM-NSCS v1.0, three factors have been considered, besides the east–west gradients in the thermocline.
The westward shoaling of the thermocline is associated with the northward-flowing Kuroshio Current, which is centered between the west and east ridges, as evidenced by drifter observations (Centurioni et al., 2004) and model results (Chao et al., 2007). Based on a non-hydrostatic ROMS model, Buijsman et al. (2010) demonstrated that westward-propagating solitons are 28 % larger than eastward-propagating solitons, due to the inhomogeneous thermocline, which is secondary to the effect of a deeper Pacific Ocean. In addition, Zheng et al. (2007) argued that the eastward deepening of the thermocline might inhibit the formation of eastward-propagating solitons in the Pacific.
Aforementioned evidence highlights the significant role of thermocline structure in shaping the east–west asymmetric characteristics of ISWs in the Luzon Strait. Therefore, horizontally inhomogeneous stratifications are conducted as the initial conditions (Fig. 2a and b) in ISWNM-NSCS v2.0. Temperature and salinity profiles are both extracted from the global HYCOM reanalysis dataset (https://www.hycom.org/, last access: 12 July 2024).
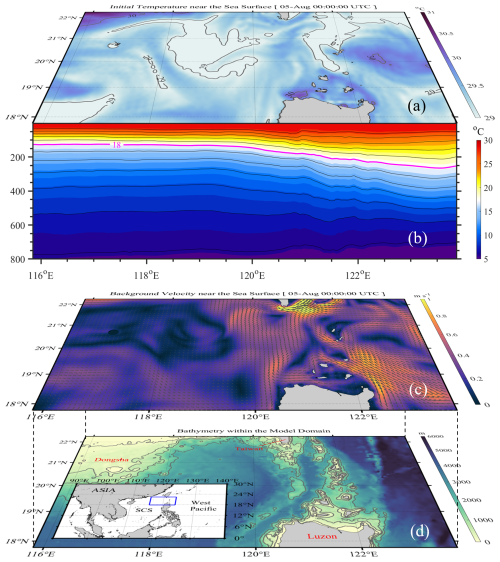
Figure 2(a) Horizontally inhomogeneous temperature near the sea surface at the initial conditions (00:00 UTC 5 August 2014), derived from the HYCOM reanalysis dataset. (b) Meridionally averaged temperature profile through the entire model domain, showing west–east asymmetry of thermoclines. (c) Background velocity near the sea surface at the initial conditions, derived from the HYCOM reanalysis dataset. (d) Model bathymetry, obtained using the GEBCO dataset.
2.3 Background currents and eddies
In the NSCS, background circulations such as the Kuroshio Current play a crucial role in influencing the behavior and characteristics of ISWs (DeCarlo et al., 2015; Li et al., 2016). The Kuroshio, a major western boundary current, brings warm and salty waters into the NSCS, thereby significantly affecting the local hydrography and stratification (Hu et al., 2020). When ISWs encounter the Kuroshio, the interaction can alter the propagation speed and direction of ISWs (Alford et al., 2010). Specifically, a strong northwestward flow of the Kuroshio (looping or leaking type) can accelerate ISWs traveling in the same direction, enhancing their amplitude and non-linearity. Conversely, ISWs moving against the Kuroshio Current can experience deceleration and reduced amplitude, affecting their arrival time and energy. This dynamic interaction affects temporal and spatial characteristics of ISWs, impacting the mixing processes and energy distribution in the NSCS (Xie et al., 2021).
Mesoscale eddies are another ubiquitous phenomenon (Chelton et al., 2011), which are dynamically important in modulating currents and temperature in the NSCS. Their interaction with ISWs can be expected to happen frequently in the deep basin (Liu et al., 2000; Liu et al., 2008; Huang et al., 2017). Numerical simulations by Xie et al. (2015) demonstrated that mesoscale eddies can redistribute the energy of ISWs along their wave fronts. In regions where energy is focused, the amplitudes of ISWs tend to increase, while in spreading regions they decrease. Previous observational studies (Park and Farmer, 2013; Li et al., 2016) also showed that mesoscale structures can substantially distort the propagation paths of ISWs in the NSCS, leading to dramatic changes in wave amplitude at fixed locations.
Given the importance of background circulations and mesoscale eddies to ISW properties, background currents are not only added as the initial condition (Fig. 2c), but also continuously imposed at the four lateral boundaries (Fig. 3) over time in ISWNM-NSCS v2.0. The background zonal and meridional velocity fields, associated with the corresponding temperature and salinity fields, are directly derived from the global HYCOM reanalysis dataset (https://www.hycom.org/, last access: 12 July 2024). These three-dimensional datasets are linearly interpolated onto the model grid to initialize the baseline dynamic conditions, while the time-varying velocity fields from the HYCOM dataset are imposed as lateral boundary forcing across all four domain edges, thereby continuously driving the internal circulation patterns through dynamic coupling.
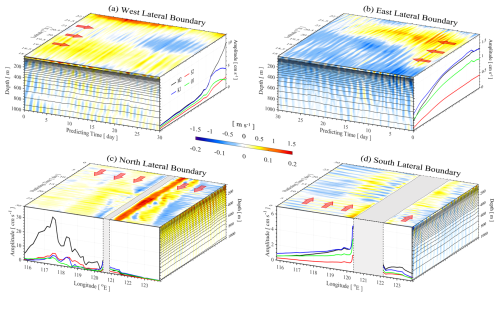
Figure 3(a) Background currents and tidal forcing at the west lateral boundary, including x–t diagram of background zonal velocities at the sea surface (top surface), latitudinal averaged zonal velocity in the upper 1000 m (front side), and tidal amplitudes of four primary constituents (right side). Note that color ranges are −1.5 to 1.5 and −0.2 to 0.2 m s−1 for the top surface and front panels, respectively. Panels (b)–(d) are as (a) but for the east, north, and south lateral boundaries, respectively.
Following the aforementioned updates, a reference test case (i.e., control run, EXP. 1) was launched on 5 August 2014 and run for 30 d, including two spring–neap cycles. The model runs with a sampling interval of 1 h in the whole domain, and also a sampling interval of 1 min at a targeted location, for comparison with field observations.
Next, the model performance was evaluated in three stages: first, by comparing the background current field with the HYCOM reanalysis dataset; second, by comparing the spatial characteristics of ISWs with satellite imagery; and third, by comparing five wave properties (arrival time, maximum vertical amplitudes, baroclinic velocities, propagation direction, and characteristic half-widths) of 28 ISWs with field observational data from the targeted mooring station (Dongsha).
3.1 Comparison with HYCOM reanalysis dataset
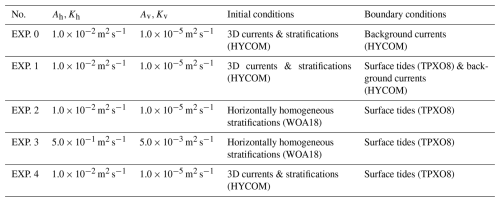
To evaluate the model accuracy in reproducing the correct background current field, we ran an extra 3D model (EXP. 0) with the same configurations as EXP. 1, but excluding the surface tide forcing at four lateral boundaries (see details in Table 1). Furthermore, both the horizontal resolution (reduced from 500 m to °) and the vertical resolution (reduced from 90 layers to 40 layers) are adjusted downward in EXP. 0 to maintain consistency with the HYCOM reanalysis dataset.
Fig. 4 depicts four snapshots, at 10 d intervals, from 5 August to 4 September, for the HYCOM reanalysis dataset and the EXP. 0 model results, respectively. Note that main flow patterns are marked with red arrows. It is clear that, in both the HYCOM reanalysis dataset and the EXP. 0 results, the Kuroshio flows northward from the east side of the Philippines to the east side of Taiwan Island (Fig. 4a and b), with a leaking-pattern intrusion after 20 d (Fig. 4c and g). In addition, an anticyclonic eddy is also reproduced in the model at the east side of Luzon Strait after 10 d (Fig. 4b and f). However, the model (EXP. 0) might omit a small eddy at the west side of Taiwan Island near the north boundary at the end (Fig. 4h), which is likely to generate remotely and propagate into the model domain. But, overall, the model can correctly reproduce background current fields in the NSCS, including the Kuroshio and mesoscale eddies.
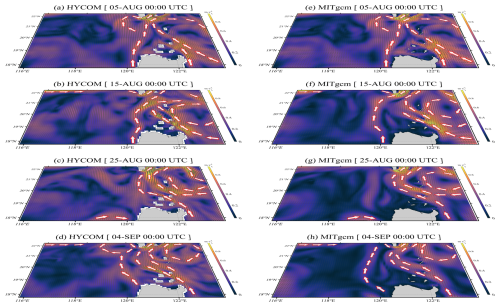
Figure 4(a–d) Background currents and eddies at the sea surface from 5 August to 4 September in 2014, with a time interval of 10 d, derived from the global HYCOM reanalysis dataset (https://www.hycom.org/, last access: 27 August 2025). Panels (e)–(h) are the same as (a)–(d) but derived from the model results of EXP. 0.
3.2 Comparison with satellite images
In addition to validating the model's ability in the background current regime, we subsequently examined the control run (EXP. 1) in the ISW field via a comparison between the model and MODIS imagery (available in the NASA Worldview website, https://worldview.earthdata.nasa.gov, last access: 19 July 2024). Given the model's 1 h sampling interval, we chose the four closest snapshots of sea surface height gradient for comparison with MODIS imagery (Fig. 5). Note that detailed approaches to compute sea surface height gradient can be found in Gong et al. (2023).
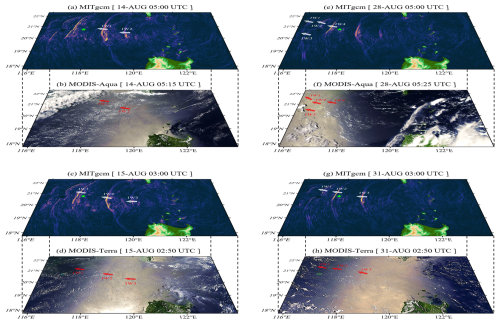
Figure 5(a) Horizontal gradients of sea surface heights induced by internal solitary waves (ISWs) at 05:00 UTC on 14 August 2014 and (b) corresponding MODIS-Aqua image captured at 05:15 UTC on 14 August 2014. Panels (c), (e), and (g) are the same as (a) but at 03:00 UTC on 15 August, 05:00 UTC on 28 August, and 03:00 UTC on 31 August 2014, respectively. Panels (d), (f), and (h) are the same as (b) but with MODIS-Terra imagery at 02:50 UTC on 15 August, MODIS-Aqua imagery at 05:25 UTC on 28 August, and MODIS-Terra imagery at 02:50 UTC on 31 August 2014, respectively. Note that the MODIS images were freely accessible at the NASA Worldview website (https://worldview.earthdata.nasa.gov, last access: 27 August 2025, open source).
Figure 5a (05:00 UTC, 14 August) and b (05:15 UTC, 14 August) both illustrate two consecutive ISWs (labeled IW1 and IW2) separated by approximately 120 km. The predicted curvatures, lengths, and positions of IW1 and IW2 exhibit a high degree of consistency with the corresponding features observed in the satellite imagery. Nevertheless, the numerical simulations also reveal two additional ISWs on the continental slope (Fig. 5a), which are obscured in the MODIS-Aqua image from 14 August due to cloud cover (Fig. 5b). On 15 August, the cloud cover cleared, allowing the MODIS-Terra image to capture a clearer depiction of the ISWs (Fig. 5d). The three ISWs shown in Fig. 5c and d are located in close proximity and exhibit similar wave crest line lengths, extending from the Luzon Strait to the continental slope. Additionally, in shallower waters, the simulated IW1 shows an ISW packet with secondary waves, a feature also observed in the satellite imagery.
Throughout the extended 15 d forecast period in ISWNM-NSCS v2.0, EXP. 1 continues to demonstrate strong performance in depicting spatial distributions of ISWs (Fig. 5e–h). Specifically, satellite-observed shallowing and diffracting processes around the Dongsha Atoll at 05:25 UTC on 28 August (Fig. 5f) are clearly captured by the model at 05:00 UTC on 28 August (Fig. 5e). After ISWs impact the Dongsha Atoll (IW4), their wave crests are divided into two branches (IW2 and IW3). The lengths of the wave crests shorten as they bypass the atoll and continue to propagate westward, eventually reconverging behind the island (IW1). It is worth mentioning that the model and the satellite observations remain consistent even on the 25th day of the forecast period (31 August, Fig. 5g and h).
Given that the control run does not account for wind effects above the sea surface, some subtle differences in wave characteristics remain. Nevertheless, the model effectively illustrates the spatial features of ISWs in the NSCS, as evidenced by comparisons with the MODIS imagery.
3.3 Comparison with field observations
To conduct a more detailed evaluation of the model's accuracy in predicting ISWs, we incorporate field observations from the Dongsha (hereafter DS) mooring station (117°44.7′ E, 20°44.2′ N; deployed from 1 August to 6 September 2014). The mooring included acoustic Doppler current profilers (ADCPs) (2 min sampling; m vertical bins) and distributed temperature, CTD, and CT sensors (10–15 s sampling). More details can be found in Gong et al. (2023). We examine the vertical structure and arrival time of ISWs after their passage through the deep basin by plotting temperature and baroclinic velocities (or wave-induced velocities) for the periods 8–14 August and 25–31 August, respectively. For clarity, Fig. 6 only displays the comparison for the upper 900 m, encompassing the primary wave-induced temperature fluctuations.
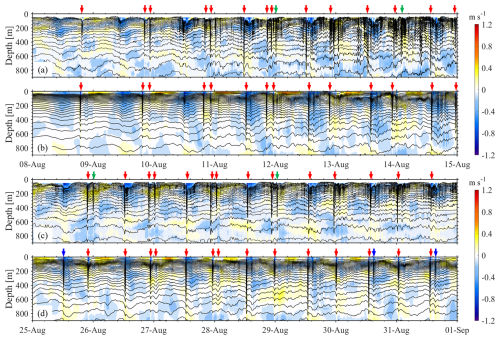
Figure 6(a) Temperature and wave-induced (or baroclinic) velocities along the main propagation directions of ISWs from 8 August to 15 August, based on field observations at the DS station. (b) Same as (a) but for the standard experiment (EXP. 1). (c, d) Same as (a, b) but from 25 August to 31 September. Red arrows highlight ISWs correctly captured by the model, while blue and green arrows denote false positive and false negative results, respectively.
Throughout the initial 15 d period, both the forecasting model and in situ observations capture individual solitons and ISW packets (Fig. 6a and b). From 8 to 14 August, there is a notable increase in wave amplitude and non-linearity, reflecting the transition from neap to spring barotropic tides. The model's predictions show consistent arrival times, baroclinic velocities (as indicated by color shades in Fig. 6), and maximum amplitudes (represented by contours in Fig. 6) with those observed in the in situ data. Although the model omits some small trailing waves (indicated by green arrows in Fig. 6a) in the observations, it nonetheless demonstrates strong performance in forecasting ISWs in the initial 15 d.
Throughout the second 15 d period, Fig. 6c and d continue to exhibit high consistency in predicting arrival times of ISWs. However, the rates of false positives (simulated ISWs that are not observed, indicated by blue arrows in Fig. 6) and false negatives (observed ISWs that are not reproduced, indicated by green arrows in Fig. 6) are relatively higher than those observed during the initial 15 d. By considering all ISWs captured at the DS station in EXP. 1, the false positive rate is 8.6 % (3 out of 35) and the false negative rate is 11.4 % (4 out of 35).
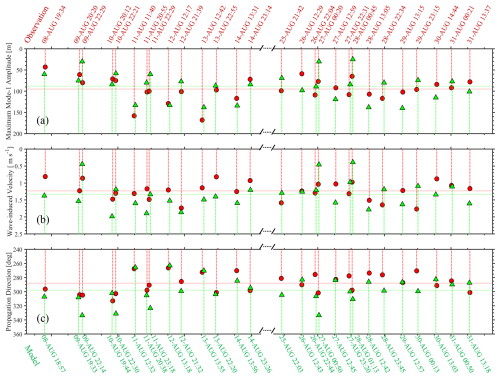
To assess the model's accuracy more quantitatively, we have identified 28 well-predicted ISWs (indicated by red arrows in Fig. 6). We extract their ISW characteristic parameters, such as arrival time, maximum vertical amplitudes, baroclinic velocities, and wave direction, and compare them with field data (see red circles and green triangles in Fig. 7). Note that detailed approaches to extract wave properties can be found in Gong et al. (2023). To evaluate the significance of the difference between in situ observational wave properties and those in ISWNM-NSCS v2.0, we further conduct independent two-sample t tests. Firstly, the arrival times of ISWs are displayed at the top and bottom of Fig. 7. The discrepancy between the model results and observations is consistently less than 1.5 h, with an RMSD of 0.64 h (p=0.11), suggesting that the control run (EXP. 1) accurately captures arrival times of ISWs. Secondly, the model's average maximum vertical amplitude (≈88 m) is comparable to the observed value (≈95 m), though the RMSD for the amplitude is 26.51 m (p=0.21). Thirdly, the average maximum baroclinic velocities are 1.34 m s−1 in the model and 1.23 m s−1 in the observations, with an RMSD of 0.39 m s−1 (p=0.17). Finally, the average wave propagation directions are approximately 298° in the model and 288° in the observations, with an RMSD of 13.74° (p=0.03). Overall, EXP. 1 successfully reproduces the four key wave features of ISWs observed near the Dongsha Atoll.
Building on the standard experiment (EXP. 1, CTRL), we modify its initial and boundary conditions to individually assess the impact of turbulence parameter optimization, horizontally inhomogeneous stratifications, and background currents on the prediction accuracy of the ISW model in the NSCS. Details of configuration modifications are as follows (also see Table 1).
-
EXP. 2: Compared with EXP. 1, initial stratification profiles are horizontally homogeneous, derived from the seasonal-averaged WOA18 dataset. Moreover, background currents are excluded at both the initial conditions and boundary conditions.
-
EXP. 3: Compared with EXP. 2, mixing coefficients (i.e., viscosity and diffusivity) are imposed as Ah=0.5 m2 s−1; Av=5.0 × 10⁻³ m2 s−1; Kh=0.5 m2 s−1; Kv=5.0 × 10⁻³ m2 s−1 in the horizontal and vertical, respectively. Note that the setups in EXP. 3 are identical to those in ISWFM-NSCS v1.0, with the exception of the extended forecasting time (30 d).
-
EXP. 4: Compared with EXP. 1, background currents are only configured as initial conditions and are no longer continuously imposed at four lateral boundaries.
4.1 Roles of optimized viscosity and diffusivity
Various three-dimensional models employing different viscosity and diffusivity configurations have been applied to simulate internal solitary waves (ISWs) in the northern South China Sea (e.g., Alford et al., 2015; Lai et al., 2019). However, determining optimal turbulence coefficients for accurate extended-range ISW prediction remains challenging. To address this, we conduct sensitivity experiments (EXPs. 2 and 3), differing by two orders of magnitude in viscosity/diffusivity values.
Analysis of horizontally averaged buoyancy frequency profiles (Fig. 8) reveals fundamental differences in stratification stability. EXP. 3 (higher coefficients) exhibits progressive weakening of stratification over 30 d, with thermocline depth descending and maximum buoyancy frequency halving from 0.018 to 0.01 s−1. Conversely, EXP. 2 (lower coefficients) maintains stable stratification, showing only a modest reduction from 0.018 to 0.015 s−1. This degradation in EXP. 3 directly impacts forecast capability, as evidenced by ISW evolution patterns (Fig. 9). While both experiments accurately reproduce westward-propagating ISWs (individual solitons and wave packets) during the first 15 d, significant deviations emerge thereafter. Beyond 15 d, EXP. 3 develops spurious small-scale eddies, due to accumulated boundary energy flux, and is unable to accurately forecast ISW properties. Consequently, the valid forecast period in ISWFM-NSCS v1.0 is 15 d rather than 30 d.
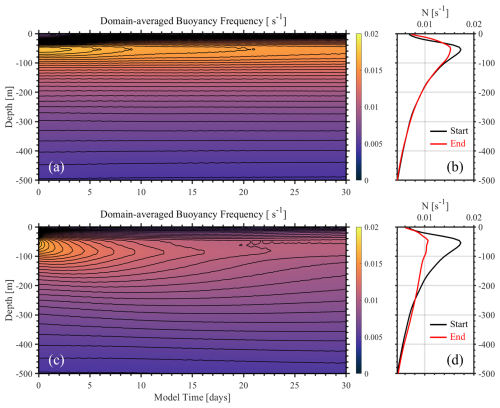
Figure 8(a) Time series of horizontally averaged background buoyancy frequency in the upper 500 m through the entire model domain in EXP. 2. (b) Black and red lines represent the averaged buoyancy frequency profiles at the beginning and at the ending of the model, respectively. (c, d) Same as (a, b) but in EXP. 3.
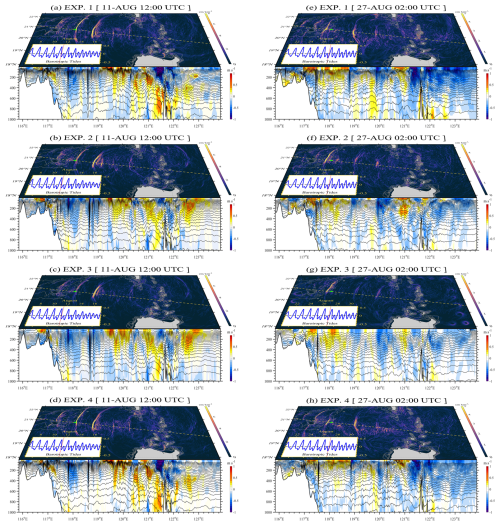
Figure 9Sea surface height gradients and temperature and baroclinic velocities along the transect (marked by a dashed line) at 12:00 UTC on 11 August 2014 for (a) EXP. 1, (b) EXP. 2, (c) EXP. 3, and (d) EXP. 4. Panels (e)–(h) are the same as (a)–(d) but at 02:00 UTC on 27 August 2014. Small panels in the bottom left display the zonal barotropic velocity (in m s−1) in the Luzon Strait. Solid lines represent the barotropic tidal conditions at the specified times.
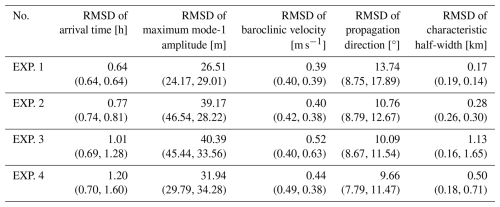
Validation against DS station observations (Fig. 10) confirms superior vertical structure representation in EXP. 2. Over the second 15 d period, EXP. 2 maintains narrower characteristic half-widths (indicating higher non-linearity) and stronger stratification than EXP. 3. Statistical analysis reveals comparable initial error rates (5.9 %–17.7 % false positives/negatives), though EXP. 3 degrades more rapidly over time. Quantitative assessment of 28 ISWs (Fig. 11, Table 2) further demonstrates EXP. 2's advantages: arrival time biases remain below 1.5 h (RMSD=0.77 h, p<0.01) versus growing >2 h errors in EXP. 3 (RMSD=1.01 h, p<0.01). While both experiments show amplitude overestimation initially and underestimation later, EXP. 2 achieves better baroclinic velocity accuracy (RMSD=0.40 m s−1 vs. 0.52 m s−1) and significantly superior half-width reproduction (RMSD=0.28 km, p<0.01, vs. 1.13 km, p=0.01). Performance degradation correlates strongly with stratification loss in both experiments.
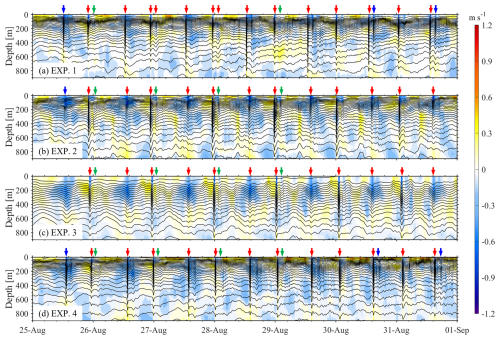
Figure 10Time series of temperature and baroclinic velocities at station DS from 25 August to 1 September 2014 for model runs (a) EXP. 1, (b) EXP. 2, (c) EXP. 3, and (d) EXP. 4. Red arrows highlight ISWs detected by the model, while blue and green arrows denote false positive and false negative results, respectively.
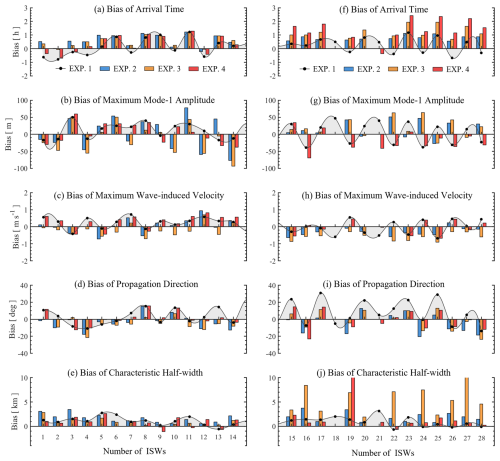
Figure 11Bias in (a) arrival time, (b) maximum mode-1 amplitude, (c) wave-induced velocity, (d) propagation direction, and (e) half-width for 14 ISWs in the first 15 prediction days at station DS. Panels (f)–(j) are the same as (a)–(e) but for the remaining 14 ISWs during the final 15 predicting days. The control run (EXP. 1) is depicted by black lines and dots, while the three sensitivity experiments are shown as histograms in different colors (EXPs. 2–4).
Table 2Root mean square deviation (RMSD) of five wave properties obtained by comparing different sensitivity experiments with field observations at the DS station. Note that the values in parentheses denote the RMSDs of the ISWs during the initial and final 15 d periods, respectively.
In summary, EXP. 3 (ISWFM-NSCS v1.0) achieves reliable 15 d forecasts of ISWs in the NSCS. However, EXP. 2's reduced viscosity and diffusivity extend the valid forecasting window to 30 d while better preserving wave non-linearity and vertical structure, establishing optimized turbulence parameters for extended-range prediction. Building on these findings, we further systematically examine ISWNM-NSCS v2.0's sensitivity to mixing parameters through a series of sensitivity coefficient values (from 0.01 × CTRL to 100 × CTRL) in the following and compare constant turbulent coefficients against dynamic closure schemes to evaluate ISW model performance.
4.2 Roles of horizontally inhomogeneous stratification
The westward shoaling of the thermocline, driven by the northward-flowing Kuroshio, has been identified as a critical factor contributing to the west–east asymmetry of ISWs in the Luzon Strait (e.g., Zheng et al., 2007; Buijsman et al., 2010). However, the significant role of horizontally inhomogeneous stratification in this process has yet to be validated by a realistic ISW model. Here, we compare two sensitivity experiments (EXPs. 2 and 4) with different initial conditions, namely EXP. 2 with horizontally homogeneous stratifications from the WOA18 dataset and EXP. 4 with horizontally inhomogeneous stratifications from the HYCOM reanalysis dataset.
First, we examine the effects of horizontally inhomogeneous stratifications on the spatial characteristics of ISWs and review Fig. 9. In EXP. 4, ISW crest lines are longer and more prone to distortion by background processes (Fig. 9d and h), closely replicating the ISW scenario simulated in the control run (EXP. 1). Additionally, spurious eastward-propagating ISWs from the Luzon Strait appear in EXP. 2 (Fig. 9b), which are not reproduced in EXP. 4 (Fig. 9d). This discrepancy arises because the control run, initialized with the HYCOM reanalysis dataset, accounts for the east–west asymmetric thermocline associated with the Kuroshio. Moreover, the southern portion of the ISW crest lines is much more distinct in EXP. 4 (Fig. 9h) in comparison with EXP. 2 (Fig. 9f), especially as the ISWs approach the Dongsha Atoll and bifurcate into two branches.
Next, we analyze the differences in ISW vertical structure between EXPs. 2 and 4 using data from the selected transect and the DS station. During the initial 15 d, successive westward-propagating internal solitons and ISW packets are captured along the transect in both EXPs. 2 and 4 (Fig. 9b and d), as the stratifications remain stable. In contrast, during the second 15 d, EXP. 2 tends to underestimate the ISW non-linearity, consequently missing an ISW in the deep basin (Fig. 9f), whereas EXP. 4 continues to reproduce it, albeit with a less significant amplitude (Fig. 9h). Given that the primary differences manifest during the final 15 d, we further compare the single-point outputs in EXPs. 2 and 4. It is evident that EXP. 4 (Fig. 10d) captures more ISWs with narrower characteristic half-widths than EXP. 2 (Fig. 10b) at the DS station.
Finally, we conduct a quantitative assessment of the sensitivity models' ability to replicate ISWs by calculating the biases and RMSDs for five key wave properties (Fig. 11 and Table 2) in cases with and without horizontally inhomogeneous stratification. Figure 11f illustrates that the bias of arrival time in EXP. 4 significantly exceeds that in EXP. 2, resulting in an RMSD of 1.20 h (p<0.01) in EXP. 4, compared with 0.77 h (p<0.01) in EXP. 2. This may be due to the omission of the lateral boundary forcing in EXP. 4, resulting in the inability to continuously maintain horizontally inhomogeneous stratification. The RMSDs of maximum wave-induced velocities are very close in the two experiments (see Table 2), namely 0.40 m s−1 (p=0.20) in EXP. 2 versus 0.44 m s−1 (p=0.10) in EXP. 4. Nonetheless, EXP. 4 demonstrates superior performance in reproducing mode-1 wave amplitude, with an RMSD of 31.94 m (p=0.27) versus 39.17 m (p=0.29) in EXP. 2, as well as in accurately capturing propagation direction, with an RMSD of 9.66° (p=0.97) versus 10.76° (p=0.04) in EXP. 2.
In summary, horizontally inhomogeneous stratification is essential in the initial conditions of ISWNM-NSCS v2.0, particularly during the first 15 d. However, to sustain the west–east asymmetric stratification within the model domain, it is necessary to impose time-variable background currents at the four lateral boundaries.
4.3 Roles of background currents
As inferred from Sect. 4.2, time-variable boundary conditions are crucial for maintaining horizontally inhomogeneous stratification within the model domain. Here, we extract the background currents (including temperature, salinity, and velocities) from the HYCOM reanalysis dataset and impose them at the four lateral boundaries in the control run (EXP. 1). Then, we compare the model results from EXP. 1 with those from EXP. 4, which is solely initialized with 3D stratification and currents but does not include continuous lateral boundary forcing.
Regarding the spatial distribution of ISWs, horizontal gradients of sea surface heights in EXP. 1 (Fig. 9a) exhibit a pattern analogous to that observed in EXP. 4 (Fig. 9d) at 12:00 UTC on 11 August. However, a notable difference emerges at 02:00 UTC on 27 August, wherein the ISW crest lines in EXP. 1 are longer and more susceptible to distortion by background processes than those in EXP. 4. We subsequently examine the differences in the vertical structures of ISWs between two cases along the selected transect and over a 15 d time series at the DS station (Fig. 10a and d) during the extended 15 d. Although both cases successfully reproduce distinct vertical structures of ISWs along the transect, ISWs in EXP. 1 (Fig. 9e) exhibit greater non-linearity than those in EXP. 4 (Fig. 9h), particularly within the deep basin. Figure 10 illustrates that the rate of false positives is 8.6 % (3 out of 35) both in EXP. 1 and EXP. 4, but the rate of false negatives (11.4 %, 4 out of 35) in EXP. 1 is lower than that (17.1 %, 6 out of 35) in EXP. 4.
From a quantitative perspective, EXP. 1 demonstrates superior precision (47 %) in predicting the arrival time of ISWs, as evidenced by an RMSD of 0.64 h (p=0.11), compared with an RMSD of 1.20 h (p<0.01) in EXP. 4. This improved precision is attributed to the presence of time-variable boundary conditions in EXP. 1, which results in a stable stratification. Conversely, in EXP. 4, the bias in arrival time progressively exceeds 1.5 h during the final 15 d (Fig. 11f). Additionally, the control run (EXP. 1) exhibits superior performance to EXP. 4 in reproducing maximum amplitudes, baroclinic velocities, and half-widths (see black circles and red histograms in Fig. 11b, c, and e). Specifically, the RMSDs in EXP. 1 are 26.51 m (p=0.21), 0.39 m s−1 (p=0.17), and 0.17 km (p<0.01), whereas in EXP. 4 the RMSDs are 31.94 m (p=0.27), 0.44 m s−1 (p=0.10), and 0.50 km (p=0.04), respectively.
To sum up, by incorporating time-variable background currents at the lateral boundaries, the effects of background flows and mesoscale eddies on the propagation processes of ISWs are more accurately represented. This improvement enhances the model's accuracy in forecasting key wave features, such as arrival time, baroclinic velocities, maximum vertical amplitudes, and characteristic half-widths.
5.1 Sensitivity of ISWNM-NSCS v2.0 to viscosity and diffusivity
In order to examine the sensitivity of the ISWNM-NSCS v2.0 results to the horizontal and vertical eddy viscosity and diffusivity coefficients, a set of numerical experiments (CTRL, EXPs. A1–A8, K1–K8) were carried out in the NSCS for 30 d. For each experiment, we compared RMSDs for the five ISW properties with the field observations at the DS mooring station. The configurations and results are summarized in Table 3.
Table 3Same as Table 2 but for sensitivity experiments with varying viscosities and diffusivities. Note that bold values indicate experiments performing >5 % better (worse) than CTRL (EXP. 1) in the RMSD metrics. Percentages in brackets indicate the magnitude of RMSD change relative to CTRL, with ↑ (↓) denoting degradation (improvement).
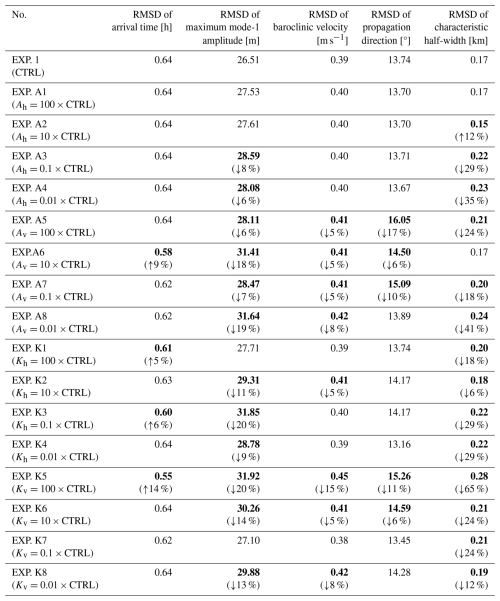
In EXPs. A1–A4, the horizontal viscosity coefficient (Ah) ranges from 100 × CTRL (1.0 × 100 m2 s−1) to 0.01 × CTRL (1.0 × 10⁻⁴ m2 s−1). As a result, EXPs. A1–A4 reveal exceptional stability in four key ISW properties across different scaling factors. Specifically, the arrival time (0.64 h), baroclinic velocity (≈ 0.40 m s−1), and propagation direction (13.67–13.74°) show negligible RMSD variations in EXPs. A1–A4. Only maximum mode-1 amplitude exhibits mild degradation (i.e., 27.53–28.59 m vs. 26.51 m in CTRL), while characteristic half-width shows marginal improvement in EXP. A2 (i.e., 0.15 km vs. 0.17 km in CTRL). Conversely, EXPs. A5–A8 show greater sensitivity for vertical eddy viscosity. In detail, EXP. A5 significantly degrades propagation direction (16.05° vs. 13.74° in CTRL), and most sensitivity experiments for Av reproduce maximum wave amplitudes more poorly. Although EXP. A6 slightly improves arrival time (0.58 h vs. 0.64 h in CTRL), no sensitivity experiment achieves >5 % improvement across multiple ISW properties.
However, in EXPs. K1–K4, modifications to horizontal diffusivity (Kh) yield mixed results. While arrival time and baroclinic velocity remain stable (±0.04 h and ±0.02 m s−1), EXP. K3 () substantially degrades maximum wave amplitude predictions (31.85 m vs. 26.51 m in CTRL). Characteristic half-width consistently worsens (0.18–0.22 km vs. 0.17 km in CTRL), though EXP. K4 slightly improves the prediction of propagation direction (13.16° vs. 13.74° in CTRL). For vertical diffusivity (EXPs. K5–K8), extreme scaling causes pronounced effects. Specifically, although EXP. K5 () shows a slight improvement in arrival time (0.55 h vs. 0.64 in CTRL), it significantly degrades four other wave properties simultaneously, namely maximum amplitude (31.92 m vs. 26.51 m in CTRL), baroclinic velocity (0.45 m s−1 vs. 0.39 m s−1 in CTRL), propagation direction (15.26° vs. 13.74° in CTRL), and characteristic half-width (0.28 km vs. 0.17 km in CTRL). Conversely, EXP. K7 () improves maximum amplitude (27.10 m vs. 26.51 m in CTRL) and baroclinic velocity (0.38 m s−1 vs. 0.39 m s−1 in CTRL) but this is offset by half-width degradation (0.21 km vs. 0.17 km in CTRL).
Overall, no sensitivity experiment outperforms CTRL across all five ISW properties but only isolated cases (e.g., arrival time in the EXP. A6) show >5 % improvement in single metrics. The CTRL run maintains the most balanced performance, with all RMSDs within intermediate ranges. The fluctuations in ISW properties across all 16 sensitivity experiments confirm that viscosity and diffusivity configurations appear robust in the CTRL run (EXP. 1).
5.2 Application of the K-profile parameterization (KPP) scheme in ISWNM-NSCS v2.0
Strong dissipation was observed in the northern region west of the Luzon Strait, extending across the NSCS, driven by wave–wave interactions, direct breaking of internal tides during shoaling, and scattering by abyssal hills (Jiang et al., 2025). However, the control simulation (EXP. 1), which employs constant eddy viscosity and diffusivity values, probably introduces artifacts in the stability of the upper thermocline, thereby distorting the representation of ISW dynamics. While adaptive turbulent closure schemes, such as the Mellor–Yamada hierarchy (Mellor and Yamada, 1982) and K-profile parameterization (KPP; Large et al., 1994), have proven effective in simulating ISW dynamics in stratified shelf seas (e.g., Vlasenko et al., 2005), recent work by Thakur et al. (2022) challenges this paradigm. Their findings suggest that excluding KPP background mixing better preserves vertical velocity gradients and aligns kinetic energy spectra with observations. To reconcile these insights with regional NSCS dynamics, we integrated the KPP scheme in ISWNM-NSCS v2.0 in EXP. 5 to evaluate its influence on ISW dynamics. Results are depicted as green histograms in Fig. 12, revealing the comparative performance of this approach.
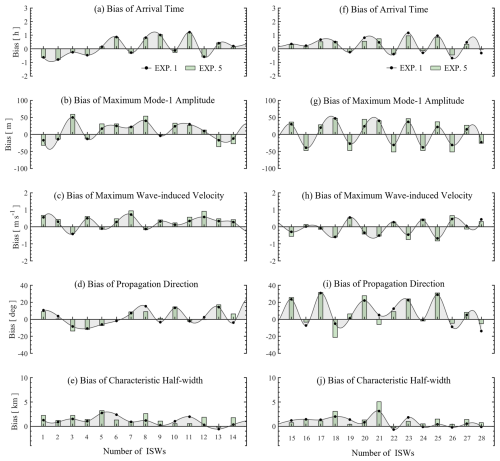
Figure 12Same as Fig. 11 but for the sensitivity experiment (EXP. 5) considering the K-profile parameterization (KPP) scheme.
Qualitatively, both EXP. 1 (control run) and EXP. 5 (KPP scheme) clearly reproduce the spatial evolution of internal solitons and wave packets from generation to dissipation (not shown). Quantitatively, however, their performance diverges. EXP. 5 shows marginally better precision in predicting ISW arrival times (RMSD=0.58 h, p=0.11 vs. 0.63 h in EXP. 1, p=0.11), probably due to the KPP scheme's enhanced representation of stable stratification. Conversely, EXP. 1 outperforms EXP. 5 in capturing maximum wave amplitudes (RMSD=26.51 m vs. 37.22 m, p=0.21), baroclinic velocities (0.39 m s−1 vs. 0.52 m s−1, p=0.17), propagation direction (13.74° vs. 14.46°, p=0.03–0.04), and half-widths (0.17 km vs. 0.25 km, p<0.01), respectively, as shown in Fig. 12 (black lines: EXP. 1; green histograms: EXP. 5). These results suggest that, while the KPP scheme improves arrival time accuracy, it degrades predictions of other critical ISW properties. Thus, integrating vertical turbulence parameterizations like KPP into ISWNM-NSCS v2.0 may not universally enhance model skill in the NSCS. Future work should explore hybrid or dynamically adaptive closure schemes to better balance stratification effects with ISW-specific dynamics, ensuring robust predictions across all wave properties.
5.3 Comparison with General Estuarine Transport Model-General Ocean Turbulence Model (GETM-GOTM)
While constant eddy viscosities and diffusivities demonstrate robust ISW simulation capability in basin-scale applications, this simplified approach fundamentally differs from advanced turbulence closures in coastal models like GETM-GOTM (Burchard et al., 2004). Notably, our choice of constant coefficients represents a pragmatic operational trade-off rather than a physical optimum. While ISWNM-NSCS v2.0 effectively captures ISW dynamics in the NSCS, it cannot resolve scale-dependent turbulence interactions like dynamic schemes. In comparison, GETM-GOTM employs a hydrostatic solver optimized for shallow systems (<100 m depth), incorporating scale-aware turbulence closures (k––ω), sediment-coupled biogeochemistry, and wetting–drying schemes essential for coastal processes. These capabilities enable it to resolve stratified shear flows with small errors in regions like the Baltic Sea and Wadden Sea (Stips et al., 2004, 2008; Tiessen et al., 2012).
Conversely, ISWNM-NSCS v2.0 leverages the non-hydrostatic core of MITgcm to capture vertical accelerations governing large-amplitude ISWs in deep basins (>2000 m), where non-hydrostatic pressure gradients dominate local non-linear wave evolution (Vlasenko et al., 2005). Consequently, GETM-GOTM's turbulence closures address sediment-induced mixing absent in our deep-water domain, while our simplified viscosity scheme aligns with operational constraints when validated against observed ISW decay rates. Crucially, this functional specialization highlights how turbulence parameterizations must correspond to hydrodynamic solvers and target phenomena, where GETM-GOTM excels in coastal ecological processes, whereas ISWNM-NSCS v2.0 prioritizes abyssal wave dynamics.
In future work, we will implement and benchmark k–ε and k–ω closures within ISWNM-NSCS to quantify performance trade-offs across scales. Systematic comparisons against GETM-GOTM across shelf-break zones (e.g., continental shelf and slope in the NSCS) will evaluate whether dynamic schemes improve representation of wave–sediment interactions and turbulent dissipation while maintaining computational viability for forecasting.
A robust 3D non-hydrostatic model ISWNM-NSCS v2.0 for forecasting ISWs in the NSCS is presented. A reference test case was launched from 5 August 2014 and run for 30 d, during which time in situ observations were made. Various wave properties are better characterized with ISWNM-NSCS v2.0 than with ISWFM-NSCS v1.0. The major updates and findings are as follows.
-
Optimized viscosity and diffusivity coefficients (i.e., m2 s−1, m2 s−1) contribute to the stabilization of stratification profiles within the model domain, thereby extending the valid forecasting period to 30 d. By comparing the biases between sensitivity model results with in situ observations at the DS station, we found that ISWFM-NSCS v1.0 gradually loses forecast precision regarding wave non-linearities after 15 d. Specifically, the RMSD of ISW characteristic half-widths is 1.13 km in ISWFM-NSCS v1.0 (EXP. 3), compared with 0.28 km with the optimized turbulence coefficients (EXP. 2).
-
Horizontally inhomogeneous stratifications are implemented as the initial conditions in ISWNM-NSCS v2.0, resulting in west–east asymmetric thermoclines on either side of the Luzon Strait. Considering these horizontally inhomogeneous stratifications, mode-1 wave amplitudes are more accurately reproduced, with an RMSD of 31.94 m in EXP. 4 versus 39.17 m in EXP. 2. Similarly, the propagation direction is better represented, with an RMSD of 9.66° in EXP. 4 versus 10.76° in EXP. 2.
-
Time-variable background currents at four lateral boundaries are essential for maintaining the horizontally inhomogeneous stratification within the model domain. Additionally, background circulations, such as the Kuroshio Current and mesoscale eddies, have been shown to significantly impact the behaviors and characteristics of ISWs in the NSCS. As compared with EXP. 4 (with RMSDs of 31.94 m, 0.44 m s−1, and 0.50 km), applying the background currents could enhance the performance of ISWNM-NSCS v2.0 in reproducing maximum vertical amplitudes, baroclinic velocities, and characteristic half-widths, resulting in improved RMSDs of 26.51 m, 0.39 m s−1, and 0.17 km.
In summary, ISWNM-NSCS v2.0 incorporates optimized turbulence coefficients, horizontally inhomogeneous stratifications, and background currents, compared with ISWFM-NSCS v1.0. As a result, ISWNM-NSCS v2.0 demonstrates considerable improvements in the model's ability to accurately predict a range of wave properties, achieving a 37 % improvement in arrival time, a 34 % improvement in mode-1 wave amplitude, a 25 % improvement in wave-induced velocity, and an 85 % improvement in characteristic half-width.
The MODIS satellite imagery can be freely downloaded from the NASA Worldview website (NASA Worldview: https://worldview.earthdata.nasa.gov, last access: 2 July 2025, Plato et al., 2019). The code of the Massachusetts Institute of Technology general circulation model for ISWNM-NSCS v2.0 can be accessed at https://doi.org/10.5281/zenodo.14847454 (Gong, 2025a). The input files, including initial and boundary conditions, as well as the corresponding output data for ISWNM-NSCS v2.0, are freely accessible through an open-access data repository available at https://doi.org/10.5281/zenodo.14842090 (Gong, 2025b).
YG, XC, ZC, QH, and SC developed the software. JX, RZ, and XZ provided guidance on the processing of observational data. YG conducted the numerical model. YG wrote the draft of the manuscript with the help of all the co-authors. All authors reviewed the final manuscript. YG, XC, ZC, and SC were responsible for conceptualization, and for the workshop and training in the use of the software.
The contact author has declared that none of the authors has any competing interests.
Publisher’s note: Copernicus Publications remains neutral with regard to jurisdictional claims made in the text, published maps, institutional affiliations, or any other geographical representation in this paper. While Copernicus Publications makes every effort to include appropriate place names, the final responsibility lies with the authors.
We thank the High-Performance Computing Division and HPC managers Wei Zhou and Dandan Sui at the South China Sea Institute of Oceanology for the provision of computing resources. Also, we thank all data providers for their invaluable input, without which we would not be able to develop the ISWNM-NSCS v2.0 model. Finally, we would like to thank all reviewers for their careful reviews and concrete suggestions to improve the paper.
This work was jointly supported by the National Natural Science Foundation of China (NSFC) under contract nos. 42130404, 42206012, 42276022, 42176025, 42276011, and U23A2032; the Natural Science Foundation of Guangdong Province (grant nos. 2024A1515012703, 2024A1515012549); the State Key Laboratory of Satellite Ocean Environment Dynamics, SIO, MNR (grant no. QNHX2308); the Science and Technology Projects of Guangzhou (grant nos. 2024A04J3587, 2024A04J9022); the South China Sea Institute of Oceanology (grant nos. SCSIO2023QY02, LTOZZ2205); and the Strategic Priority Research Program of the Chinese Academy of Sciences (grant no. XDA0370304). Yankun Gong is supported by the CAS Cultivating Young Scientists Foundation.
This paper was edited by Riccardo Farneti and reviewed by Marek Stastna and two anonymous referees.
Adcroft, A., Campin, J. M., Dutkiewicz, S., Evangelinos, C., Ferreira, D., Forget, G., Fox-Kemper, B., Heimbach, P., Hill, C., Hill, E., Hill, H., Jahn, O., Losch, M., Marshall, J., Maze, G., Menemenlis, D., and Molod, A.: MITgcm user manual, Massachusetts Institute of Technology, http://hdl.handle.net/1721.1/117188 (last access: 27 August 2025), 2008.
Alford, M. H., Lien, R. C., Simmons, H., Klymak, J., Ramp, S., Yang, Y. J., Tang, D., and Chang, M. H.: Speed and evolution of nonlinear internal waves transiting the South China Sea, J. Phys. Oceanogr., 40, 1338–1355, https://doi.org/10.1175/2010JPO4388.1, 2010.
Alford, M. H., Peacock, T., MacKinnon, J. A., Nash, J. D., Buijsman, M. C., Centurioni, L. R., Chao, S. Y., Chang, M. H., Farmer, D. M., Fringer, O. B., Fu, K. H., Gallacher, P. C., Graber, H. C., Helfrich, K. R., Jachec, S. M., Jackson, C. R., Klymak, J. M., Ko, D. S., Jan, S., Shaun Johnston, T. M., Legg, S., Lee, I. H., Lien, R. C., Mercier, M. J., Moum, J. N., Musgrave, R., Park, J. H., Pickering, A. I., Pinkel, R., Rainville, L., Ramp, S. R., Rudnick, D. L., Sarkar, S., Scotti, A., Simmons, H. L., St Laurent, L. C., Venayagamoorthy, S. K., Wang, Y. H., Wang, J., Yang, Y. J., Paluszkiewicz, T., and Tang, T. Y.: The formation and fate of internal waves in the South China Sea, Nature, 521, 65–69, https://doi.org/10.1038/nature14399, 2015.
Álvarez, Ó., Izquierdo, A., González, C. J., Bruno, M., and Mañanes, R.: Some considerations about non-hydrostatic vs. hydrostatic simulation of short-period internal waves. A case study: The Strait of Gibraltar, Cont. Shelf Res.,181, 174–186, https://doi.org/10.1016/j.csr.2019.05.016, 2019.
Benney, D. J.: Long non-linear waves in fluid flows, Journal of Mathematics and Physics, 45, 52–63, https://doi.org/10.1002/sapm196645152, 1966.
Buijsman, M. C., McWilliams, J. C., and Jackson, C. R.: East-west asymmetry in nonlinear internal waves from Luzon Strait, J. Geophys. Res.-Oceans, 115, C10057, https://doi.org/10.1029/2009JC006004, 2010.
Burchard, H., Bolding, K., and Villarreal, M. R.: Three-dimensional modelling of estuarine turbidity maxima in a tidal estuary, Ocean Dynam., 54, 250–265, https://doi.org/10.1007/s10236-003-0073-4, 2004.
Caruso, M., Gawarkiewicz, G. G., and Beardsley, R.: Interannual variability of the Kuroshio Current intrusion in the South China Sea, J. Oceanogr., 62, 559–575, https://doi.org/10.1007/s10872-006-0076-0, 2006.
Centurioni, L. R., Niiler, P. P., and Lee, D. K.: Observations of inflow of Philippine Sea surface water into the South China Sea through the Luzon Strait, J. Phys. Oceanogr., 34, 113–121, https://doi.org/10.1175/1520-0485(2004)034<0113:OOIOPS>2.0.CO;2, 2004.
Chao, S. Y., Ko, D. S., Lien, R. C., and Shaw, P. T.: Assessing the west ridge of Luzon Strait as an internal wave mediator, J. Oceanogr., 63, 897–911, https://doi.org/10.1007/s10872-007-0076-8, 2007.
Chelton, D. B., Schlax, M. G., and Samelson, R. M.: Global observations of nonlinear mesoscale eddies, Prog. Oceanogr., 91, 167–216, https://doi.org/10.1016/j.pocean.2011.01.002, 2011.
DeCarlo, T. M., Karnauskas, K. B., Davis, K. A., and Wong, G. T. F.: Climate modulates internal wave activity in the Northern South China Sea, Geophys. Res. Lett., 42, 831–838, https://doi.org/10.1002/2014gl062522, 2015.
Du, T., Tseng, Y. H., and Yan, X. H.: Impacts of tidal currents and Kuroshio intrusion on the generation of nonlinear internal waves in Luzon Strait, J. Geophys. Res.-Oceans, 113, https://doi.org/10.1029/2007JC004294, 2008.
Egbert, G. D. and Erofeeva, S. Y.: Efficient inverse modeling of barotropic ocean tides, J. Atmos. Ocean. Tech., 19, 183–204, https://doi.org/10.1175/1520-0426(2002)019<0183:EIMOBO>2.0.CO;2, 2002.
Grimshaw, R., Pelinovsky, E., Talipova, T., and Kurkina, O.: Internal solitary waves: propagation, deformation and disintegration, Nonlin. Processes Geophys., 17, 633–649, https://doi.org/10.5194/npg-17-633-2010, 2010.
Gong, Y.: MITgcm code for ISWFM v2.0, Zenodo [code], https://doi.org/10.5281/zenodo.14847454, 2025a.
Gong, Y.: ISWFM v2.0: An updated three-dimensional MITgcm model of Internal solitary waves in the northern South China Sea, Zenodo [data set], https://doi.org/10.5281/zenodo.14842090, 2025b.
Gong, Y., Chen, X., Xu, J., Xie, J., Chen, Z., He, Y., and Cai, S.: An internal solitary wave forecasting model in the northern South China Sea (ISWFM-NSCS), Geosci. Model Dev., 16, 2851–2871, https://doi.org/10.5194/gmd-16-2851-2023, 2023.
Holloway, P. E., Pelinovsky, E., Talipova, T., and Barnes, B.: A nonlinear model of internal tide transformation on the Australian North West Shelf, J. Phys. Oceanogr., 27, 871–896, https://doi.org/10.1175/1520-0485(1997)027<0871:ANMOIT>2.0.CO;2 , 1997.
Hu, S., Sprintall, J., Guan, C., McPhaden, M. J., Wang, F., Hu, D., and Cai, W.: Deep-reaching acceleration of global mean ocean circulation over the past two decades, Science Advances, 6, eaax7727, https://doi.org/10.1126/sciadv.aax7727, 2020.
Huang, X., Zhang, Z., Zhang, X., Qian, H., Zhao, W., and Tian, J.: Impacts of a mesoscale eddy pair on internal solitary waves in the northern South China Sea revealed by mooring array observations, J. Phys. Oceanogr., 47, 1539–1554, https://doi.org/10.1175/JPO-D-16-0111.1, 2017.
Jachec, S. M.: Understanding the evolution and energetics of internal tides within Monterey Bay via numerical simulations, PhD thesis, Stanford University, https://searchworks.stanford.edu/view/6970615 (last access: 27 August 2025), 2007.
Jackson, C. R. and Apel, J.: An atlas of internal solitary-like waves and their properties, Contract, 14(03-C), 0176, https://www.internalwaveatlas.com/Atlas2_PDF/IWAtlas2_FrontMatter.pdf (last access: 27 August 2025), 2004.
Jiang, S., Dai, D., Wang, D., Wang, S., Li, Y., Guo, J., and Qiao, F.: Inferring diapycnal mixing using the internal wave continuum from the high resolution ocean model, Ocean Model., 195, 102525, https://doi.org/10.1016/j.ocemod.2025.102525, 2025.
Lai, Z., Jin, G., Huang, Y., Chen, H., Shang, X., and Xiong, X.: The generation of nonlinear internal waves in the South China Sea: A three-dimensional, nonhydrostatic numerical study, J. Geophys. Res.-Oceans, 124, 8949–8968, https://doi.org/10.1029/2019JC015283, 2019.
Lamb, K. G.: Theoretical descriptions of shallow-water solitary internal waves: Comparisons with fully nonlinear waves, in The 1998 WHOI/IOSA/ONR Internal Solitary Wave Workshop: Contributed Papers, Tech. Rep. WHOI-99-07, edited by T. F. Duda and D. M. Farmer, Woods Hole Oceanogr. Inst., Woods Hole, Mass, https://apps.dtic.mil/sti/tr/pdf/ADA368664.pdf#page=208 (last access: 27 August 2025), 1999.
Lamb, K. G. and Xiao, W.: Internal solitary waves shoaling onto a shelf: Comparisons of weakly-nonlinear and fully nonlinear models for hyperbolic-tangent stratifications, Ocean Model., 78, 17–34, https://doi.org/10.1016/j.ocemod.2014.02.005, 2014.
Large, W. G., McWilliams, J. C., and Doney, S. C.: Oceanic vertical mixing: A review and a model with a nonlocal boundary layer parameterization, Rev. Geophys., 32, 363–403, https://doi.org/10.1029/94RG01872, 1994.
Legg, S. and Huijts, K. M.: Preliminary simulations of internal waves and mixing generated by finite amplitude tidal flow over isolated topography, Deep-Sea Res. Pt. II, 53, 140–156, https://doi.org/10.1016/j.dsr2.2005.09.014, 2006.
Li, Q., Wang, B., Chen, X., Chen, X., and Park, J.-H.: Variability of nonlinear internal waves in the South China Sea affected by the Kuroshio and mesoscale eddies, J. Geophys. Res.-Oceans, 121, 2098–2118, https://doi.org/10.1002/2015jc011134, 2016.
Liu, Y., Yuan, Y., Su, J., and Jiang, J.: Circulation in the South China Sea in summer of 1998, Chinese Sci. Bull., 45, 1648–1655, https://doi.org/10.1007/BF02898979, 2000.
Liu, Y., Weisberg, R. H., and Yuan, Y.: Patterns of upper layer circulation variability in the South China Sea from satellite altimetry using the self-organizing map, Acta Oceanol. Sin., 27, 129–144, https://digitalcommons.usf.edu/msc_facpub/332/ (last access: 27 August 2025), 2008.
Marshall, J., Hill, C., Perelman, L., and Adcroft, A.: Hydrostatic, quasi-hydrostatic, and nonhydrostatic ocean modelling, J. Geophys. Res.-Oceans, 102, 5733–5752, https://doi.org/10.1029/96JC02776, 1997.
Mellor, G. L. and Yamada, T.: Development of a turbulence closure model for geophysical fluid problems, Rev. Geophys., 20, 851–875, https://doi.org/10.1029/RG020i004p00851, 1982.
Min, W., Li, Q., Xu, Z., Wang, Y., Li, D., Zhang, P., Robertson, R., and Yin, B.: High-resolution, non-hydrostatic simulation of internal tides and solitary waves in the southern East China Sea, Ocean Model., 181, 102141, https://doi.org/10.1016/j.ocemod.2022.102141, 2023.
Nagai, T. and Hibiya, T.: Internal tides and associated vertical mixing in the Indonesian Archipelago. J. Geophys. Res.-Oceans, 120, 3373–3390, https://doi.org/10.1002/2014JC010592, 2015.
Park, J.-H. and Farmer, D.: Effects of Kuroshio intrusions on nonlinear internal waves in the South China Sea during winter, J. Geophys. Res.-Oceans, 118, 7081–7094, https://doi.org/10.1002/2013jc008983, 2013.
Plato, E. A., Boller, R. A., Baynes, K., Wong, M. M., Rice, Z., Mc-Gann, M., King, B. A., and Pressley, N. N.: Highlighting Recent Uses of the NASA Worldview Mapping Application, in: AGU Fall Meeting, No. GSFC-E-DAA-TN76137-1, https://ui.adsabs.harvard.edu/abs/2019AGUFMIN21B..04P/abstract, 2019 (data available at: https://worldview.earthdata.nasa.gov, last access: 27 August 2025).
Simmons, H., Chang, M. H., Chang, Y. T., Chao, S. Y., Fringer, O., Jackson, C. R., and Ko, D. S.: Modeling and prediction of internal waves in the South China Sea, Oceanography, 24, 88–99, 2011.
Shang, X.-D., Liang, C.-R., and Chen, G.-Y.: Spatial distribution of turbulent mixing in the upper ocean of the South China Sea, Ocean Sci., 13, 503–519, https://doi.org/10.5194/os-13-503-2017, 2017.
Shaw, P. T., Ko, D. S., and Chao, S. Y.: Internal solitary waves induced by flow over a ridge: With applications to the northern South China Sea, J. Geophys. Res.-Oceans, 114, C02019, https://doi.org/10.1029/2008JC005007, 2009.
Smagorinsky, J.: General circulation experiments with the primitive equations: I. The basic experiment, Mon. Weather Rev., 91, 99–164, https://doi.org/10.1175/1520-0493(1963)091<0099:GCEWTP>2.3.CO;2, 1963.
Stastna, M. and Lamb, K. G.: Sediment resuspension mechanisms associated with internal waves in coastal waters, J. Geophys. Res.-Oceans, 113, C10016, https://doi.org/10.1029/2007JC004711, 2008.
Stastna, M. and Legare, S.: Simulations of shoaling large-amplitude internal waves: perspectives and outlook, Flow, 4, E11, https://doi.org/10.1017/flo.2024.9, 2024.
Stewart, K. D., Hogg, A. M., Griffies, S. M., Heerdegen, A. P., Ward, M. L., Spence, P., and England, M. H.: Vertical resolution of baroclinic modes in global ocean models, Ocean Model., 113, 50–65, https://doi.org/10.1016/j.ocemod.2017.03.012, 2017.
Stips, A., Bolding, K., Pohlmann, T., and Burchard, H.: Simulating the temporal and spatial dynamics of the North Sea using the new model GETM (general estuarine transport model), Ocean Dynam., 54, 266–283, https://doi.org/10.1007/s10236-003-0077-0 , 2004.
Stips, A. K., Bolding, K., and Lilover, M.: Scenario simulations of recent Baltic Sea inflows using the hydrodynamic transport model GETM, in: 2008 IEEE/OES US/EU-Baltic International Symposium, Tallinn, Estonia, 27 May 2008, 1–6, https://doi.org/10.1109/BALTIC.2008.4625527 , 2008.
Sun, H., Yang, Q., Zhao, W., Liang, X., and Tian, J.: Temporal variability of diapycnal mixing in the northern South China Sea, J. Geophys. Res.-Oceans, 121, 8840–8848, https://doi.org/10.1002/2016JC012044, 2016.
Thakur, R., Arbic, B. K., Menemenlis, D., Momeni, K., Pan, Y., Peltier, W. R., Skitka, J., Alford, M. H., and Ma, Y.: Impact of vertical mixing parameterizations on internal gravity wave spectra in regional ocean models, Geophys. Res. Lett., 49, e2022GL099614, https://doi.org/10.1029/2022GL099614, 2022.
Tiessen, M., Nauw, J., Ruardij, P., and Gerkema, T.: Numerical modeling of physical processes in the North Sea and Wadden Sea with GETM/GOTM, University of Twente, https://doi.org/10.3990/2.197, 2012.
Vlasenko, V., Stashchuk, N., and Hutter, K.: Baroclinic tides: theoretical modeling and observational evidence, Cambridge University Press, https://doi.org/10.1017/CBO9780511535932, 2005.
Vlasenko, V., Stashchuk, N., Guo, C., and Chen, X.: Multimodal structure of baroclinic tides in the South China Sea, Nonlin. Processes Geophys., 17, 529–543, https://doi.org/10.5194/npg-17-529-2010, 2010.
Vlasenko, V., Stashchuk, N., and Nimmo-Smith, W. A. M.: Three-dimensional dynamics of baroclinic tides over a seamount, J. Geophys. Res.-Oceans, 123, 1263–1285, https://doi.org/10.1002/2017JC013287, 2018.
Xie, J., He, Y., Chen, Z., Xu, J., and Cai, S.: Simulations of internal solitary wave interactions with mesoscale eddies in the northeastern South China Sea, J. Phys. Oceanogr., 45, 2959–2978, https://doi.org/10.1175/jpo-d-15-0029.1, 2015.
Xie, J., Fang, W., He, Y., Chen, Z., Liu, G., Gong, Y., and Cai, S.: Variation of internal solitary wave propagation induced by the typical oceanic circulation patterns in the northern South China Sea deep basin, Geophys. Res. Lett., 48, e2021GL093969, https://doi.org/10.1029/2021GL093969, 2021.
Yang, Q., Zhao, W., Liang, X., and Tian, J.: Three-dimensional distribution of turbulent mixing in the South China Sea, J. Phys. Oceanogr., 46, 769–788, https://doi.org/10.1175/JPO-D-14-0220.1, 2016.
Zhang, Z., Fringer, O. B., and Ramp, S. R.: Three-dimensional, nonhydrostatic numerical simulation of nonlinear internal wave generation and propagation in the South China Sea, J. Geophys. Res.-Oceans, 116, C05022, https://doi.org/10.1029/2010JC006424, 2011.
Zheng, Q., Susanto, R. D., Ho, C. R., Song, Y. T., and Xu, Q.: Statistical and dynamical analyses of generation mechanisms of solitary internal waves in the northern South China Sea, J. Geophys. Res.-Oceans, 112, C03021, https://doi.org/10.1029/2006JC003551, 2007.
- Abstract
- Introduction
- Description of the model and major updates
- Model results and calibrations
- Sensitivity experiments to evaluate model updates
- Discussion of turbulence configurations
- Conclusions
- Code and data availability
- Author contributions
- Competing interests
- Disclaimer
- Acknowledgements
- Financial support
- Review statement
- References


