the Creative Commons Attribution 4.0 License.
the Creative Commons Attribution 4.0 License.
 | 08 Jul 2025
Assessing the climate impact of an improved volcanic sulfate aerosol representation in E3SM
Jean-Christophe Golaz
Xiaohong Liu
Hailong Wang
Accurately simulating historical surface temperature variations is essential for evaluating climate models, yet many struggle to reproduce the mid-20th-century temperature trends associated with significant volcanic eruptions. This study examines the impact of volcanic sulfate aerosol representation on these biases using the Energy Exascale Earth System Model (E3SM). The standard CMIP6 protocol prescribes volcanic forcing through radiative perturbations, omitting volcanic aerosol–cloud interactions (VACIs). Here, we implement an emission-based approach with an updated volcanic eruption inventory that directly incorporates volcanic sulfur dioxide (SO2) emissions, enabling a more process-based representation of volcanic forcing. This approach leads to improved surface temperature variability and a modest reduction in cold biases between 1940 and 1980 compared to the CMIP6 setup. Additionally, we assess cloud property responses to a more realistic volcanic sulfate aerosol representation, which weakens cloud-induced cooling during periods of lower volcanic activity. However, despite these refinements, a significant temperature cold bias remains, indicating that further improvements in atmospheric chemistry, aerosol microphysics, cloud processes, and model parameterizations are needed to fully resolve this issue in E3SM.
- Article
(10504 KB) - Full-text XML
-
Supplement
(305 KB) - BibTeX
- EndNote


Volcanic eruptions play a crucial role in modulating climate changes (e.g., Chim et al., 2023; Hegerl et al., 2003). Numerous studies have demonstrated their significant impacts on Earth's climate. For example, the eruption of Tambora (Indonesia) in April 1815 led to the “Year Without a Summer” of 1816 in Europe and North America – which extended to several years in China – as well as severe disruptions to the Indian monsoon and to other global climate patterns (Raible et al., 2016). The 1991 eruption of Mt. Pinatubo resulted in a peak top-of-the-atmosphere radiative forcing of roughly 3–4 W m−2 and cooled global temperatures up to 0.4 °C (e.g., Dhomse et al., 2014; Mills et al., 2017; Ramachandran et al., 2000; Rieger et al., 2020).
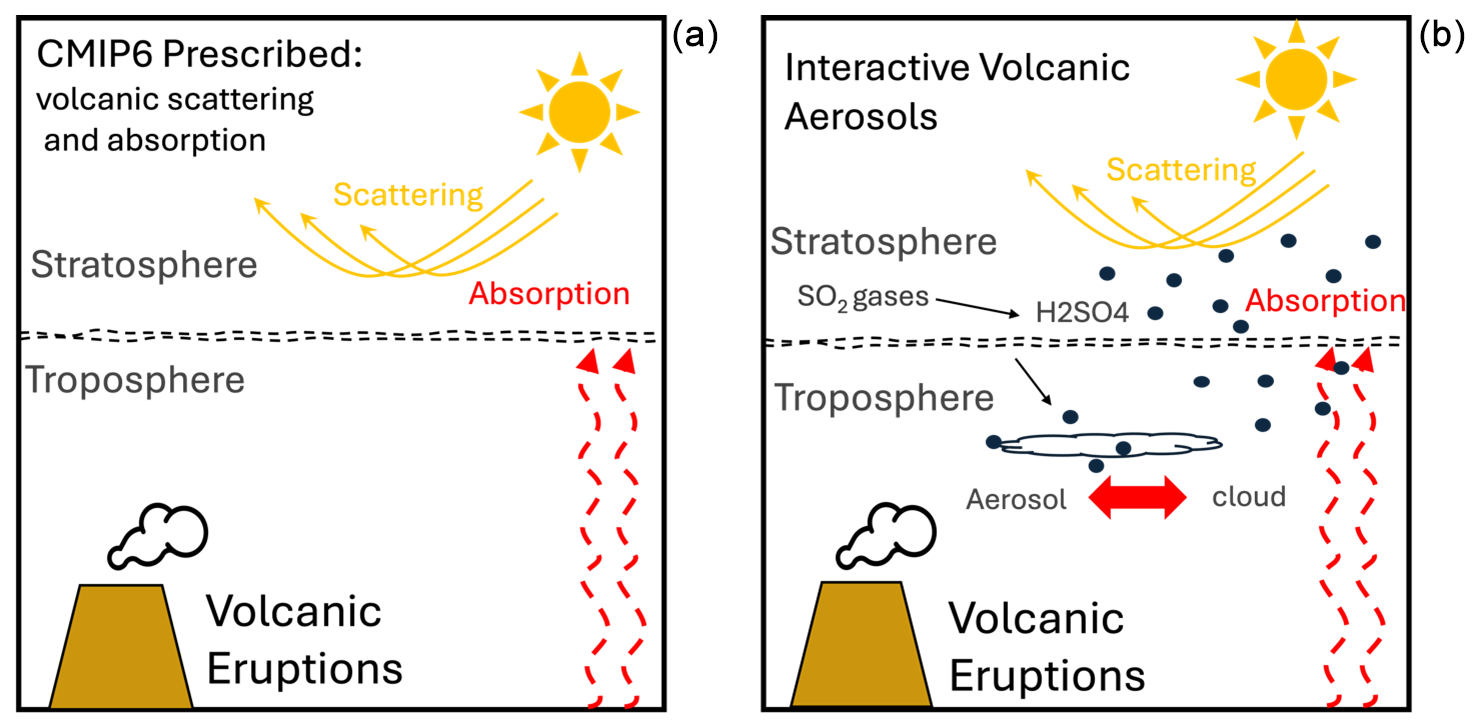
Figure 1Volcanic forcing representations in E3SM: prescribed stratospheric scattering and absorption following CMIP6 protocol (a) and the interactive volcanic sulfate aerosols used in this study (b).
Intensive volcanic eruptions emit a variety of gases and particles into the stratosphere. The emitted sulfur dioxide (SO2) forms sulfate aerosols through atmospheric chemical reactions, which are the primary drivers of climate perturbation (i.e., Dhomse et al., 2014; Mills et al., 2016). As there is a lack of wet removal in the water-scarce stratosphere, sulfate aerosols can persist for months to years compared to days in the troposphere (Mills et al., 2017). By scattering incoming solar radiation, these sulfate aerosols induce cooling at the Earth surface while simultaneously absorbing longwave radiation, thereby warming the surrounding air (Schmidt et al., 2018). This effect caused specifically by volcanic sulfate aerosol is volcanic sulfate aerosol–radiation interactions (VARIs). Additionally, akin to anthropogenic sulfate aerosols, volcanic sulfate particles can act as cloud condensation nuclei (CCN), facilitating the formation of cloud droplets and change in cloud albedo properties (Schmidt et al., 2012), resulting in cloud forcing enhancement. This is volcanic sulfate aerosol–cloud interactions (VACIs). The impact of VACIs on cloud properties depends significantly on background aerosol conditions and regional meteorology. Chen et al. (2024) found that volcanic eruptions in Hawaii led to a significant increase in cloud cover, enhancing reflected sunlight and contributing to a substantial cooling effect. In contrast, Malavelle et al. (2017) examined volcanic sulfate aerosols near Iceland and found that while cloud brightness increased, changes in cloud cover and liquid cloud water were minimal. These differences highlight the complex interplay between volcanic sulfate injection, background cloud droplet number concentration (CDNC), and regional cloud microphysics.
In the CMIP6 simulations, many climate models exhibit a mid-20th-century surface temperature cold bias, primarily due to the excessive cloud cooling effect associated with aerosol–cloud interactions (Flynn and Mauritsen, 2020; Zhang et al., 2021). In the Energy Exascale Earth System Model version 2 (E3SMv2), this temperature bias becomes evident around 1940 and intensifies following the 1963 Mt. Agung eruption (Golaz et al., 2022). The correlation between volcanic events and temperature bias motivates our investigation into whether the model's volcanic sulfate aerosol treatment contributes to this issue.
The CMIP6 protocol represents VARIs in the stratosphere using prescribed stratospheric aerosol optic properties (Fig. 1, left panel). During the satellite era, this approach blends multi-satellite observations, providing relatively accurate representations of VARIs. However, it neglects VACIs, which can significantly influence cloud albedo and radiative forcing. To address this limitation, we implement an emission-based approach, replacing prescribed stratospheric aerosol optic properties with explosive volcanic SO2 emissions (Fig. 1, right panel). This method, which captures both VARIs and VACIs, has been validated in previous studies of volcano eruption events (e.g., Brown et al., 2024; Mills et al., 2016).
To improve model initialization, we incorporate historical average volcanic SO2 emissions into preindustrial (PI) control simulations, establishing a different base line for subsequent historical transient simulations (1850–2014). CMIP6 guidelines recommend including averaged natural forcing in PI control simulations (Eyring et al., 2016). Schmidt et al. (2012) demonstrated that adding natural aerosols in PI and subsequent historical transient simulations could potentially dampen the magnitude of the increase in aerosol–cloud interactions in the historical transient period. Without volcanic sulfate aerosols, the ratio (R0) of historical aerosol increases (Aa), which is mainly driven by anthropogenic emissions, relative to the PI average level (API) is expressed as Eq. (1).
When volcanic sulfate aerosols (Av) are included, the new historical aerosol increase ratio, Rv, can be expressed as Eq. (2), where is the historical average of volcanic sulfate aerosols.
This simple algebraic relationship shows that the Rv is smaller than R0. Since these ratios largely determine historical cloud albedo change, a lower ratio suggests a weaker aerosol–cloud interaction and reduced cloud cooling in historical transient simulations (Schmidt et al., 2012).
Furthermore, volcanic sulfate aerosols fluctuate over time, and their effects on aerosol–cloud interaction and cloud albedo also vary as a function of time. During periods of low volcanic activity, volcanic sulfate aerosols remain below the historical average (), leading to a reduced Rv and a relative dimmed cloud cooling. Conversely, active volcanic periods result in increased volcanic SO2 emissions (strengthens Av), resulting in larger Rv and amplifying aerosol–cloud interactions. These variations highlight the necessity of accurately representing volcanic aerosols in climate simulations.
To evaluate this improved volcanic forcing treatment, we conducted new E3SMv2 simulations, including PI control and transient simulations (1850–2014). The experimental setup is detailed in Sect. 2, results are presented in Sect. 3, and conclusions follow in Sect. 4.
2.1 E3SM and its aerosol and cloud parameterizations
E3SMv2 is a state-of-the-art Earth system model including an atmosphere model at 110 km horizontal resolution, a land model at 165 km horizontal resolution, a 0.5° horizontal resolution river routing model, and an ocean and sea ice model with mesh spacing ranging from 60 km in midlatitudes to 30 km at the Equator and poles. The atmosphere component, E3SM Atmosphere Model (EAM) v2, comprises 72 vertical layers extending to approximately 60 km. Within EAMv2, the Cloud Layers Unified By Binormals (CLUBB) parameterization (Guo et al., 2015) handles the subgrid turbulent transport and the macrophysics of stratiform and shallow cumulus clouds, while the planetary boundary layer (PBL) depth is diagnosed following the scheme by Holtslag and Boville (1993). Deep convection is represented by a scheme developed by Zhang and McFarlane (1995), with an improved trigger function combining the dynamic convective available potential energy (dCAPE) trigger (Wang et al., 2020) and the unrestricted air parcel launch level (ULL). Grid-scale cloud microphysical processes are parameterized using the version of the Morrison and Gettelman (2008) microphysics scheme. E3SMv2 demonstrates enhanced performance compared to E3SMv1, with nearly double the computational speed and improvements in various metrics such as precipitation and cloud representation. Notably, its climate sensitivity is substantially lower, with an equilibrium climate sensitivity of 4.0 K, as opposed to the less plausible value of 5.3 K in E3SMv1. However, similar to many other CMIP6 models E3SMv2 simulates a low surface temperature bias in the middle of the 20th century, primarily due to excessive aerosol radiative forcing (Golaz et al., 2022).
Zhang et al. (2022) characterized the aerosol and cloud schemes in the Energy Exascale Earth System Model (E3SM). E3SM represents aerosol processes using the four-mode Modal Aerosol Module (MAM4), which includes major aerosol species such as sulfate, black carbon, organic matter, dust, sea salt, and marine organic aerosols. MAM4 tracks both interstitial and cloud-borne aerosols across four lognormal modes, assuming internal mixing within each mode and external mixing between modes. Aerosol optical properties are parameterized based on mode radius and refractive index, while water uptake follows Köhler theory with a relative humidity ceiling of 98 %.
Cloud droplet activation in E3SM follows the Abdul-Razzak and Ghan (2000) scheme, which determines aerosol activation based on subgrid updraft velocity and aerosol properties such as dry size and hygroscopicity. Instead of using a spectrum of updraft velocities as in previous schemes, E3SMv2 applies a characteristic subgrid updraft velocity, parameterized as a function of turbulent kinetic energy (TKE) from CLUBB. To account for unresolved turbulence effects, including cloud-top radiative cooling, a lower bound of 0.2 m s−1 – adapted from CAM5.4 – is imposed. The activation process is coupled with an explicit vertical diffusion scheme with dynamical sub-stepping, which regulates the vertical transport of aerosols and cloud droplet number concentrations. E3SMv2 enforces a minimum cloud droplet number concentration threshold at 10 cm−3 (Golaz et al., 2022).
For mixed-phase clouds, E3SM employs a classical nucleation theory (CNT)-based parameterization, where dust immersion freezing is the dominant mechanism for ice formation (Wang et al., 2014). Cirrus clouds, on the other hand, use the Liu and Penner (2005) scheme to simulate both homogeneous and heterogeneous ice nucleation. Sulfate aerosols in the Aitken mode serve as ice-nucleating particles for homogeneous freezing, with a 50 nm size threshold, which has been tuned to optimize cloud fraction and radiative forcing consistency.
2.2 The volcanic forcing representation in E3SMv2
Following the CMIP6 protocol, E3SMv2 employs prescribed volcanic shortwave extinction and longwave absorption above the tropopause (Golaz et al., 2022; Zanchettin et al., 2016). This CMIP6 stratospheric aerosol dataset (SAD) v3 can be found at https://doi.org/10.22033/ESGF/input4MIPs.1681 (ETHZ, 2017). Particularly, the stratospheric aerosol extinction and absorption are overwritten by prescribed values at each time step. For the period spanning 1979–2014, data predominantly rely on assimilated satellite data from sources like the Stratospheric Aerosol and Gas Experiment (SAGE), SAGEII, the Stratospheric Aerosol Measurement (SAM), the Cloud–Aerosol Lidar and Infrared Pathfinder Satellite Observation (CALIPSO), and the Optical Spectrograph and InfraRed Imager System (OSIRIS), with the Cryogenic Limb Array Etalon Spectrometer (CLAES) data utilized for gap-filling in cases of missing data (Rieger et al., 2020; Thomason et al., 2018). During the period from 1850 to 1978, particularly during volcanically quiescent periods, the monthly mean background aerosol data measured by SAGE II (during the volcanic quiescent period of 1996–2005) are utilized. The volcanic eruption contribution is then calculated using the two-dimensional sulfate aerosol model developed at Atmospheric and Environmental Research Inc., Lexington, MA, USA (AER-2-D). The AER-2-D model has sulfuric acid aerosol microphysics in a global domain with 9.5° horizontal resolution and 1.2 km vertical resolution. The aerosol microphysics scheme has 40 size bins spanning the range 0.4 nm to 3.2 µm. There is no interaction between aerosols, radiation forcings, and dynamics, and the dynamical fields, such as U, V, and T, for all simulated cases are based on Pinatubo eruption climatology (1991). Additionally, stratospheric aerosol optical depth (AOD) is calibrated using the photometer data whenever available; otherwise, the best estimate of sulfur ejection is utilized for the volcanic contribution, often estimated from proxies such as ice core data (Arfeuille et al., 2014). For the PI control simulation, the volcanic quiescent background values are used.
This study focuses on volcanic activities during the 1940–1979 period (the reason will be described in Sect. 2.2). During this period, Arfeuille et al. (2014) recorded two volcanic eruptions (Table 1). For the Agung (1963) eruption, the AER-2-D model evenly injected SO2 in the 15–0° S and 0–15° N regions of the Southern Hemisphere and Northern Hemisphere, respectively. For the Fuego (1974) eruption, SO2 was injected evenly in the 0–15° N band only (Arfeuille et al., 2014). Compared to injecting emissions at limited grids, evenly distributing the emission in a broad latitude band dilutes the SO2 concentration and consequently results in smaller particle sizes and thus higher efficiency of scattering the solar radiation and prolonged aerosol lifetime (Niemeier et al., 2019; Timmreck et al., 2010).
2.3 The interactive volcanic sulfate aerosol treatment
In E3SMv2, the aerosol process is represented by the four-mode version of the Modal Aerosol Module (MAM4) (Liu et al., 2012; Wang et al., 2019), which is a comprehensive approach to simulate aerosol particles in the Earth system. It encompasses four distinct aerosol modes representing different aerosol types and sizes: Aitken mode, accumulation mode, coarse mode, and primary carbon mode for black carbon and primary organic carbon particles emitted directly into the atmosphere. This model accounts for aerosol processes such as emissions, transport, chemical transformation, and removal.
In the current version of MAM4, there are six aerosol species represented: sulfate, black carbon, organic carbon, dust, sea salt, and secondary organic aerosols. In E3SMv2, sulfate aerosols primarily originate from the condensation of H2SO4 gas- and aqueous-phase production in cloud water. The model utilizes a simple gas-phase chemistry package to calculate the formation of H2SO4, incorporating a prescribed oxidant, hydroxyl radical (OH), to oxidize SO2 and dimethyl sulfide (DMS) gases in the atmosphere.
It is worth noting that the MAM4 in E3SMv2 has not been designed to accurately reproduce the volcanic sulfate aerosol direct effect caused by volcanic eruptions. Modifications are needed to reproduce the Mt. Pinatubo's (1991) aerosol direct impact on shortwave forcing well compared to observations (Brown et al., 2024; Mills et al., 2016). But such modifications caused unexpected drawbacks of ice cloud formations over the upper troposphere and lower stratosphere (Visioni et al., 2017). The remedy efforts for both CESM and E3SM will be represented in a follow-up paper that documents a new development of adding a stratospheric sulfate mode on top of MAM4. Furthermore, it is important to use unchanged MAM4 and E3SMv2 configurations to provide an apple-to-apple comparison to evaluate the impacts of the change in volcanic sulfate aerosol representation on simulated aerosol direct and indirect effects during the middle of the 20th century.
To introduce interactive volcanic sulfate aerosols into E3SMv2, we utilize the Volcanic Emissions from Earth System Models (volcanEESM) dataset, which serves as a source of volcanic SO2 emissions (Danabasoglu et al., 2020; Neely and Schmidt, 2016). This dataset, funded by the NCAR/UCAR Atmospheric Chemistry and Modeling Visiting Scientist Program and the University of Leeds School of Earth and Environment, provides detailed information on historical volcanic eruptions, including dates, locations, injection height ranges, and SO2 emission amounts. Given that E3SMv2 lacks comprehensive stratospheric chemistry for processing SO2 gas, we employ the simplified chemistry package where volcanic SO2 is oxidized using prescribed OH concentrations derived from the historical monthly mean from the CESM-WACCM simulations. Past research has demonstrated that this approach yields reasonable results with high efficiency compared to models employing comprehensive stratospheric chemistry (Smith et al., 2014). We validate this approach by comparing the simulated interactive stratospheric aerosol optical depth (SAOD) in E3SMv2 with SAOD produced using the default method (see Fig. 2).
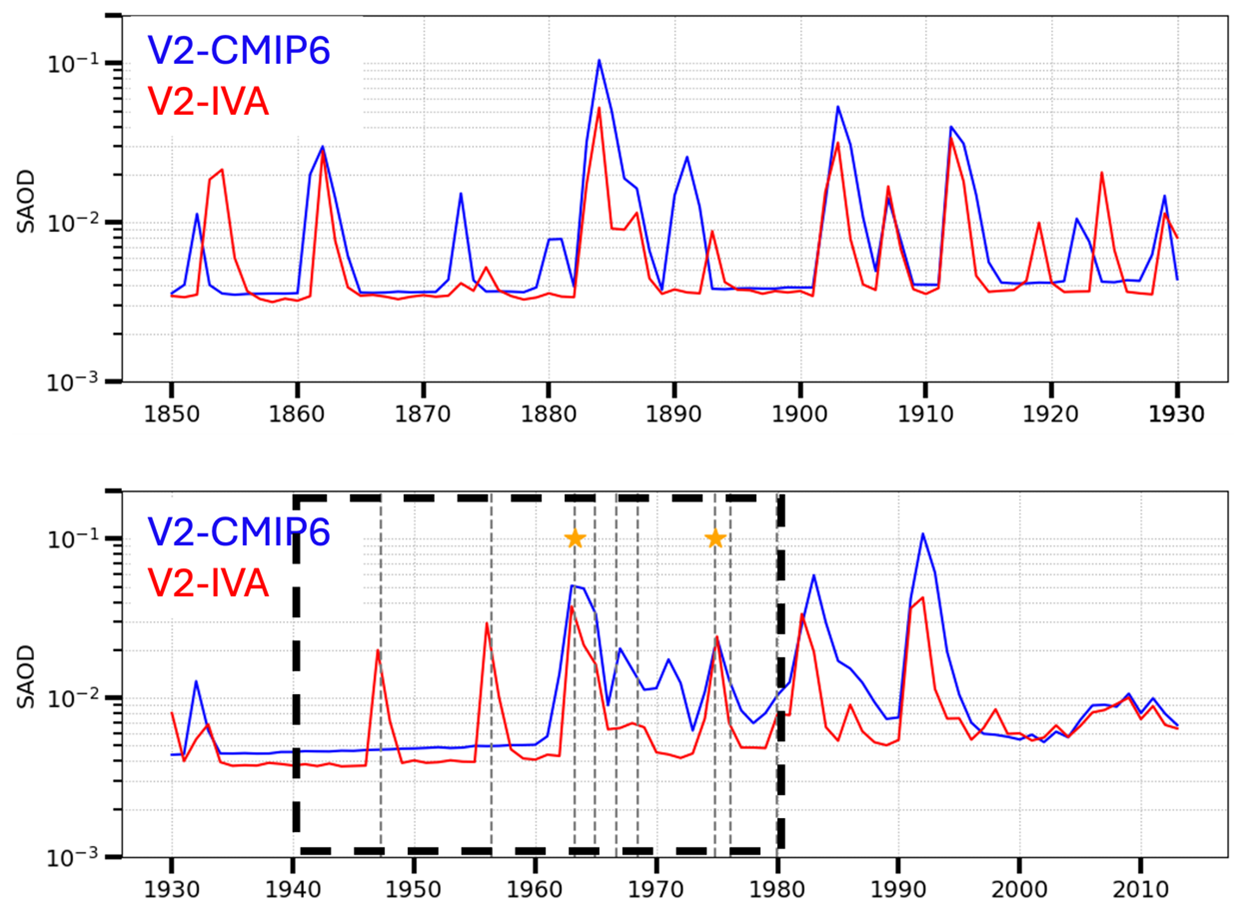
Figure 2The simulated stratospheric AOD (SAOD) by E3SMv2 using different volcanic representations. The E3SMv2 with CMIP6 prescribed volcanic scattering (V2-CMIP6) is shown as the blue line, while the E3SMv2 with interactive volcanic sulfate aerosol treatment (V2-IVA) is shown as the red line. During the 1940–1980 period, the volcanic eruptions recorded by CMIP6 data are marked by orange stars, while the eruptions recorded by volcanEESM are marked by dashed gray lines.
Figure 2 depicts the simulated SAOD based on the volcanEESM dataset and CMIP6 default method. Generally, the two simulated SAOD curves align closely in terms of eruption timing and intensity. However, notable discrepancies emerge between 1940 and 1980 (dashed black box). Specifically, volcanEESM records two moderate-intensity eruptions during 1940 to 1950, whereas no eruptions are recorded in the CMIP6 volcanic dataset for this period. Additionally, the CMIP6 shows higher SAOD values than those predicted from the volcanEESM for the Mt. Agung (1963) eruption and the two subsequent eruptions, which were not recorded in the CMIP6 document (Table 1; Arfeuille et al., 2014). These significant disparities motivate our study to investigate the impact of the volcanEESM inventory on simulated climate compared to that using the default E3SMv2 model with the CMIP6 volcanic dataset. The volcanic eruptions during 1940 to 1980 from CMIP6 and volcanEESM are presented in Tables 1 and 2, respectively. Table 2 lists the recorded explosive eruptions from the volcanEESM dataset for the period 1940–1979. In Sect. 3.1, we compare the simulated Agung eruption with results from other studies, demonstrating that the new approach better captures volcanic sulfate aerosol–radiation interactions in terms of both magnitude and spatial distribution than the CMIP6 prescribed stratospheric forcing. This comparison supports the validity of the emission-based approach in improving the representation of volcanic aerosol forcing.
Table 1Recorded explosive eruptions based on Arfeuille et al. (2014) (CMIP6). NH and SH signify Northern Hemisphere and Southern Hemisphere, respectively.
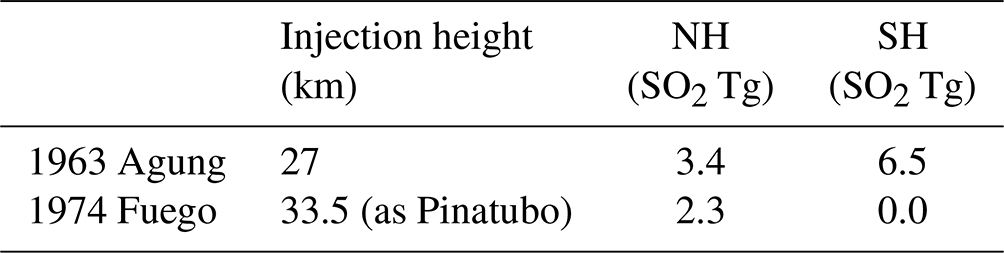
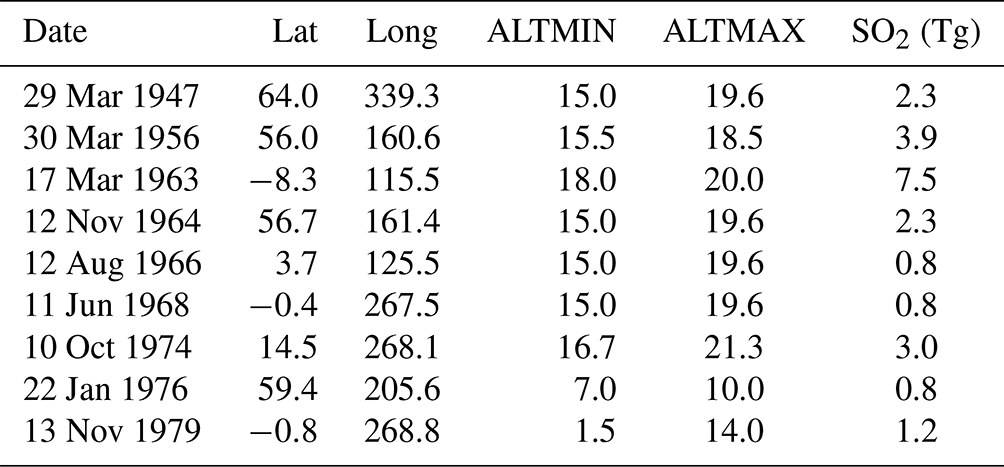
Table 2Recorded explosive eruptions from volcanEESM during 1940–1979. ALTMIN and ALTMAX signify minimum and maximum altitudes, respectively.
In summary, during the SAGE period, the original method (prescribed stratospheric forcing) incorporates observed aerosol extinctions, which likely provides a more accurate representation of stratospheric aerosol–radiation interactions compared to the SO2-emission-based approach – assuming that stratospheric aerosol sedimentation into the troposphere does not significantly affect radiative forcing. However, for the mid-century period, both methods rely on SO2 emission estimates, which are inherently uncertain. The key improvements in our approach stem from (1) the inclusion of updated explosive SO2 injection events, ensuring a more physically consistent representation of volcanic forcing, and (2) the incorporation of aerosol–cloud interactions through the cloud condensation nuclei (CCN) effect from volcanic sulfate aerosols, which was absent in the original approach.
2.4 The experimental design
2.4.1 Averaged volcanic emission in preindustrial control simulation
The CMIP6 protocol recommends using averaged volcanic forcing in the historical period in the PI control simulations. The average volcanic SO2 emission is Tg s−1, equivalent to 0.7 Tg yr−1, calculated by averaging emissions from all eruptions between 1850 and 2014. To determine the horizontal emission distribution, we assume a normal distribution along latitude and even distribution along longitude. Using each eruption amount as a weight, the weighted mean emission latitude is 20.67° N, with a standard deviation of 28.83°. Vertically, the mean injection height has an upper limit of 18 km and a lower limit of 14 km. The impact of PI control aerosols on simulated transient climate is discussed in the Supplement (Sect. S1 and Table S1).
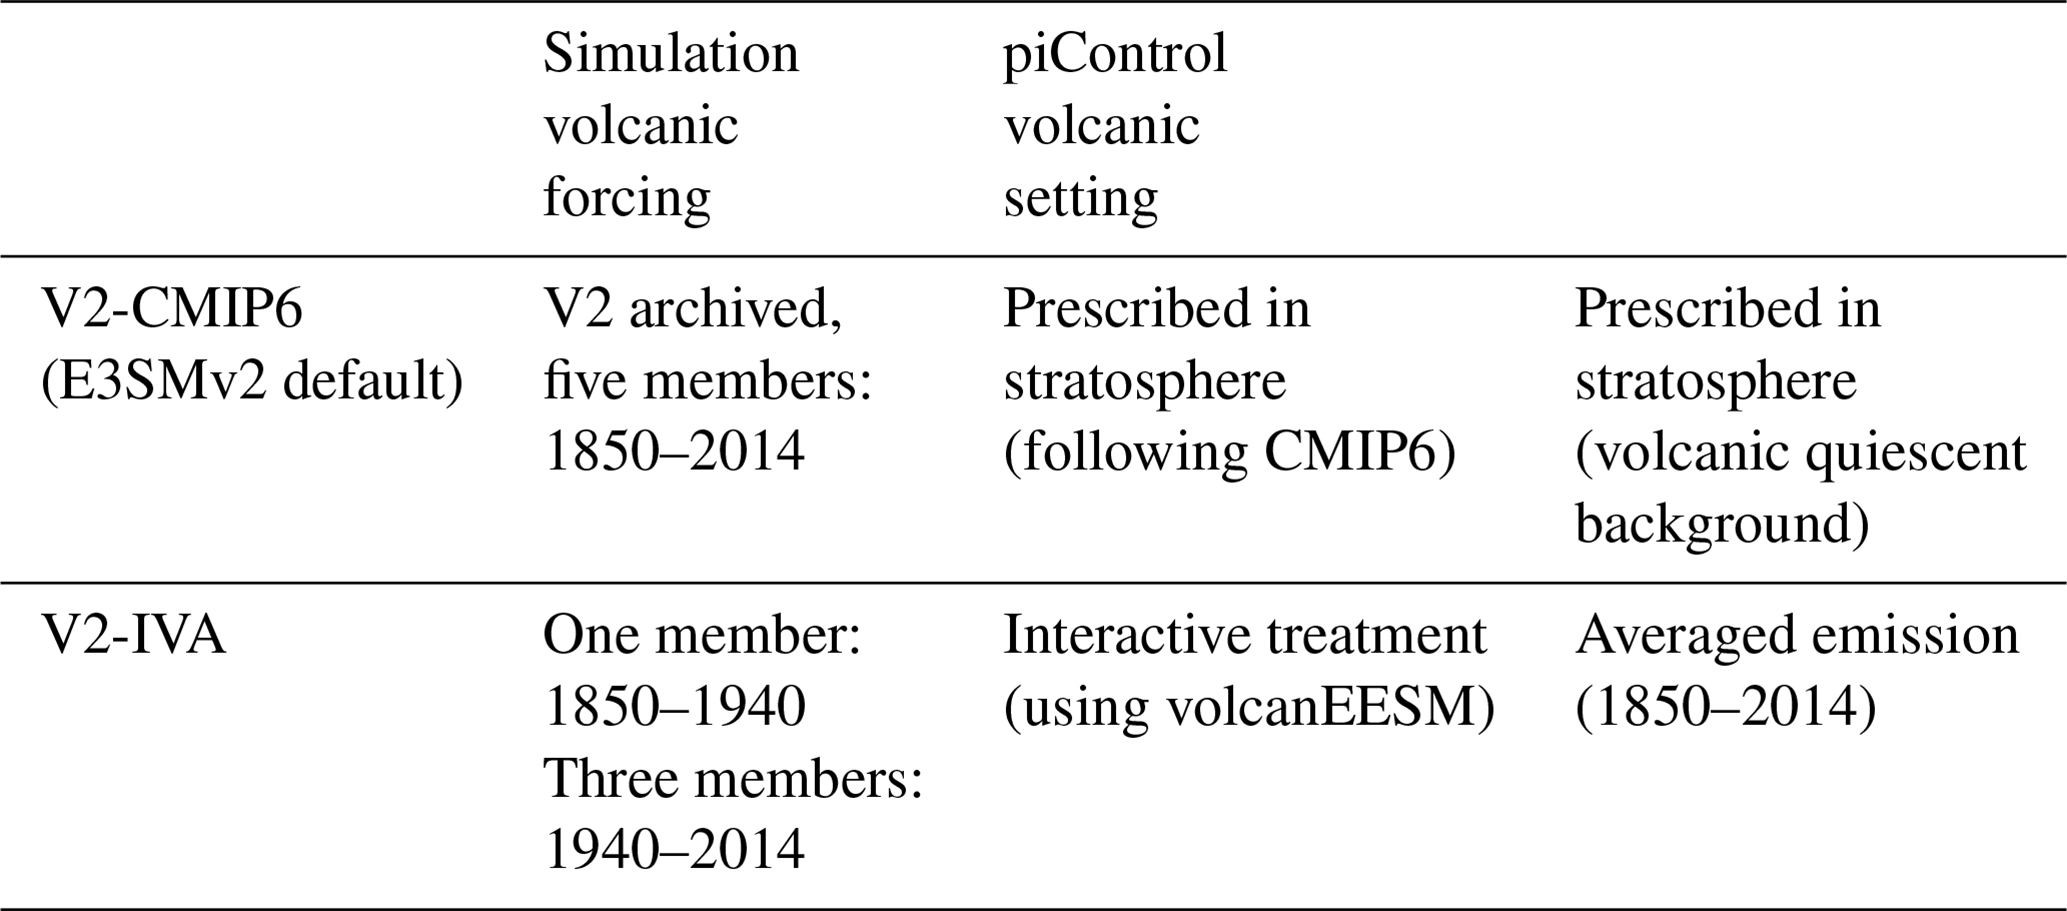
2.4.2 Simulation design
The V2-CMIP6 (control) run comprises a five-member ensemble of E3SMv2 coupled historical transient simulations spanning 1850 to 2014, conducted and archived by Golaz et al. (2022). In contrast, the V2-IVA experiment investigates the influence of interactive volcanic sulfate aerosols on historical transient simulations by replacing the default prescribed volcanic stratospheric forcing with volcanic SO2 emissions in E3SMv2. This experiment underwent a 100-year spinup under the same preindustrial (PI) control configuration as V2-CMIP6, except with interactive volcanic treatment, utilizing averaged volcanic emissions from 1850 to 2014 (see Sect. 2.4.1). Following the model spinup, one member simulation is conducted from 1850 to 2014, with an additional two members conducted from 1940 to 2014 to minimize noise in coupled simulations. By comparing V2-IVA to V2-CMIP6 (Table 3), the impact of volcanic treatments on simulated climate can be assessed.
3.1 Simulated sulfate aerosols
VolcanEESM recorded eight eruptions during the years spanning 1940–1979 (see Table 2). These eruptions are directly reflected in sulfate aerosol concentrations simulated by the V2-IVA experiment (see Fig. 3a). Prior to these eruptions, the background sulfate aerosol concentration between 100 and 50 hPa was approximately 0.1 µg kg−1. Hekla (1947) and Bezymianny (1956), emitting 2.3 and 3.9 Tg SO2 gas, respectively, induced spikes in sulfate aerosol concentrations, with global mean concentration peaks reaching up to 7 and 12 µg kg−1 in the stratosphere, respectively. The eruption of Mt. Agung in 1963 with an SO2 emission of 7.5 Tg caused a peak global mean concentration of up to 20 µg kg−1 between 100 and 10 hPa. Subsequent to the Mt. Agung (1963) eruption, three eruptions resulted in high aerosol concentrations lingering in the stratosphere until 1972, with eruptions in 1974 and 1976 sustaining global mean concentrations above 0.5 µg kg−1 for an additional 4 years.
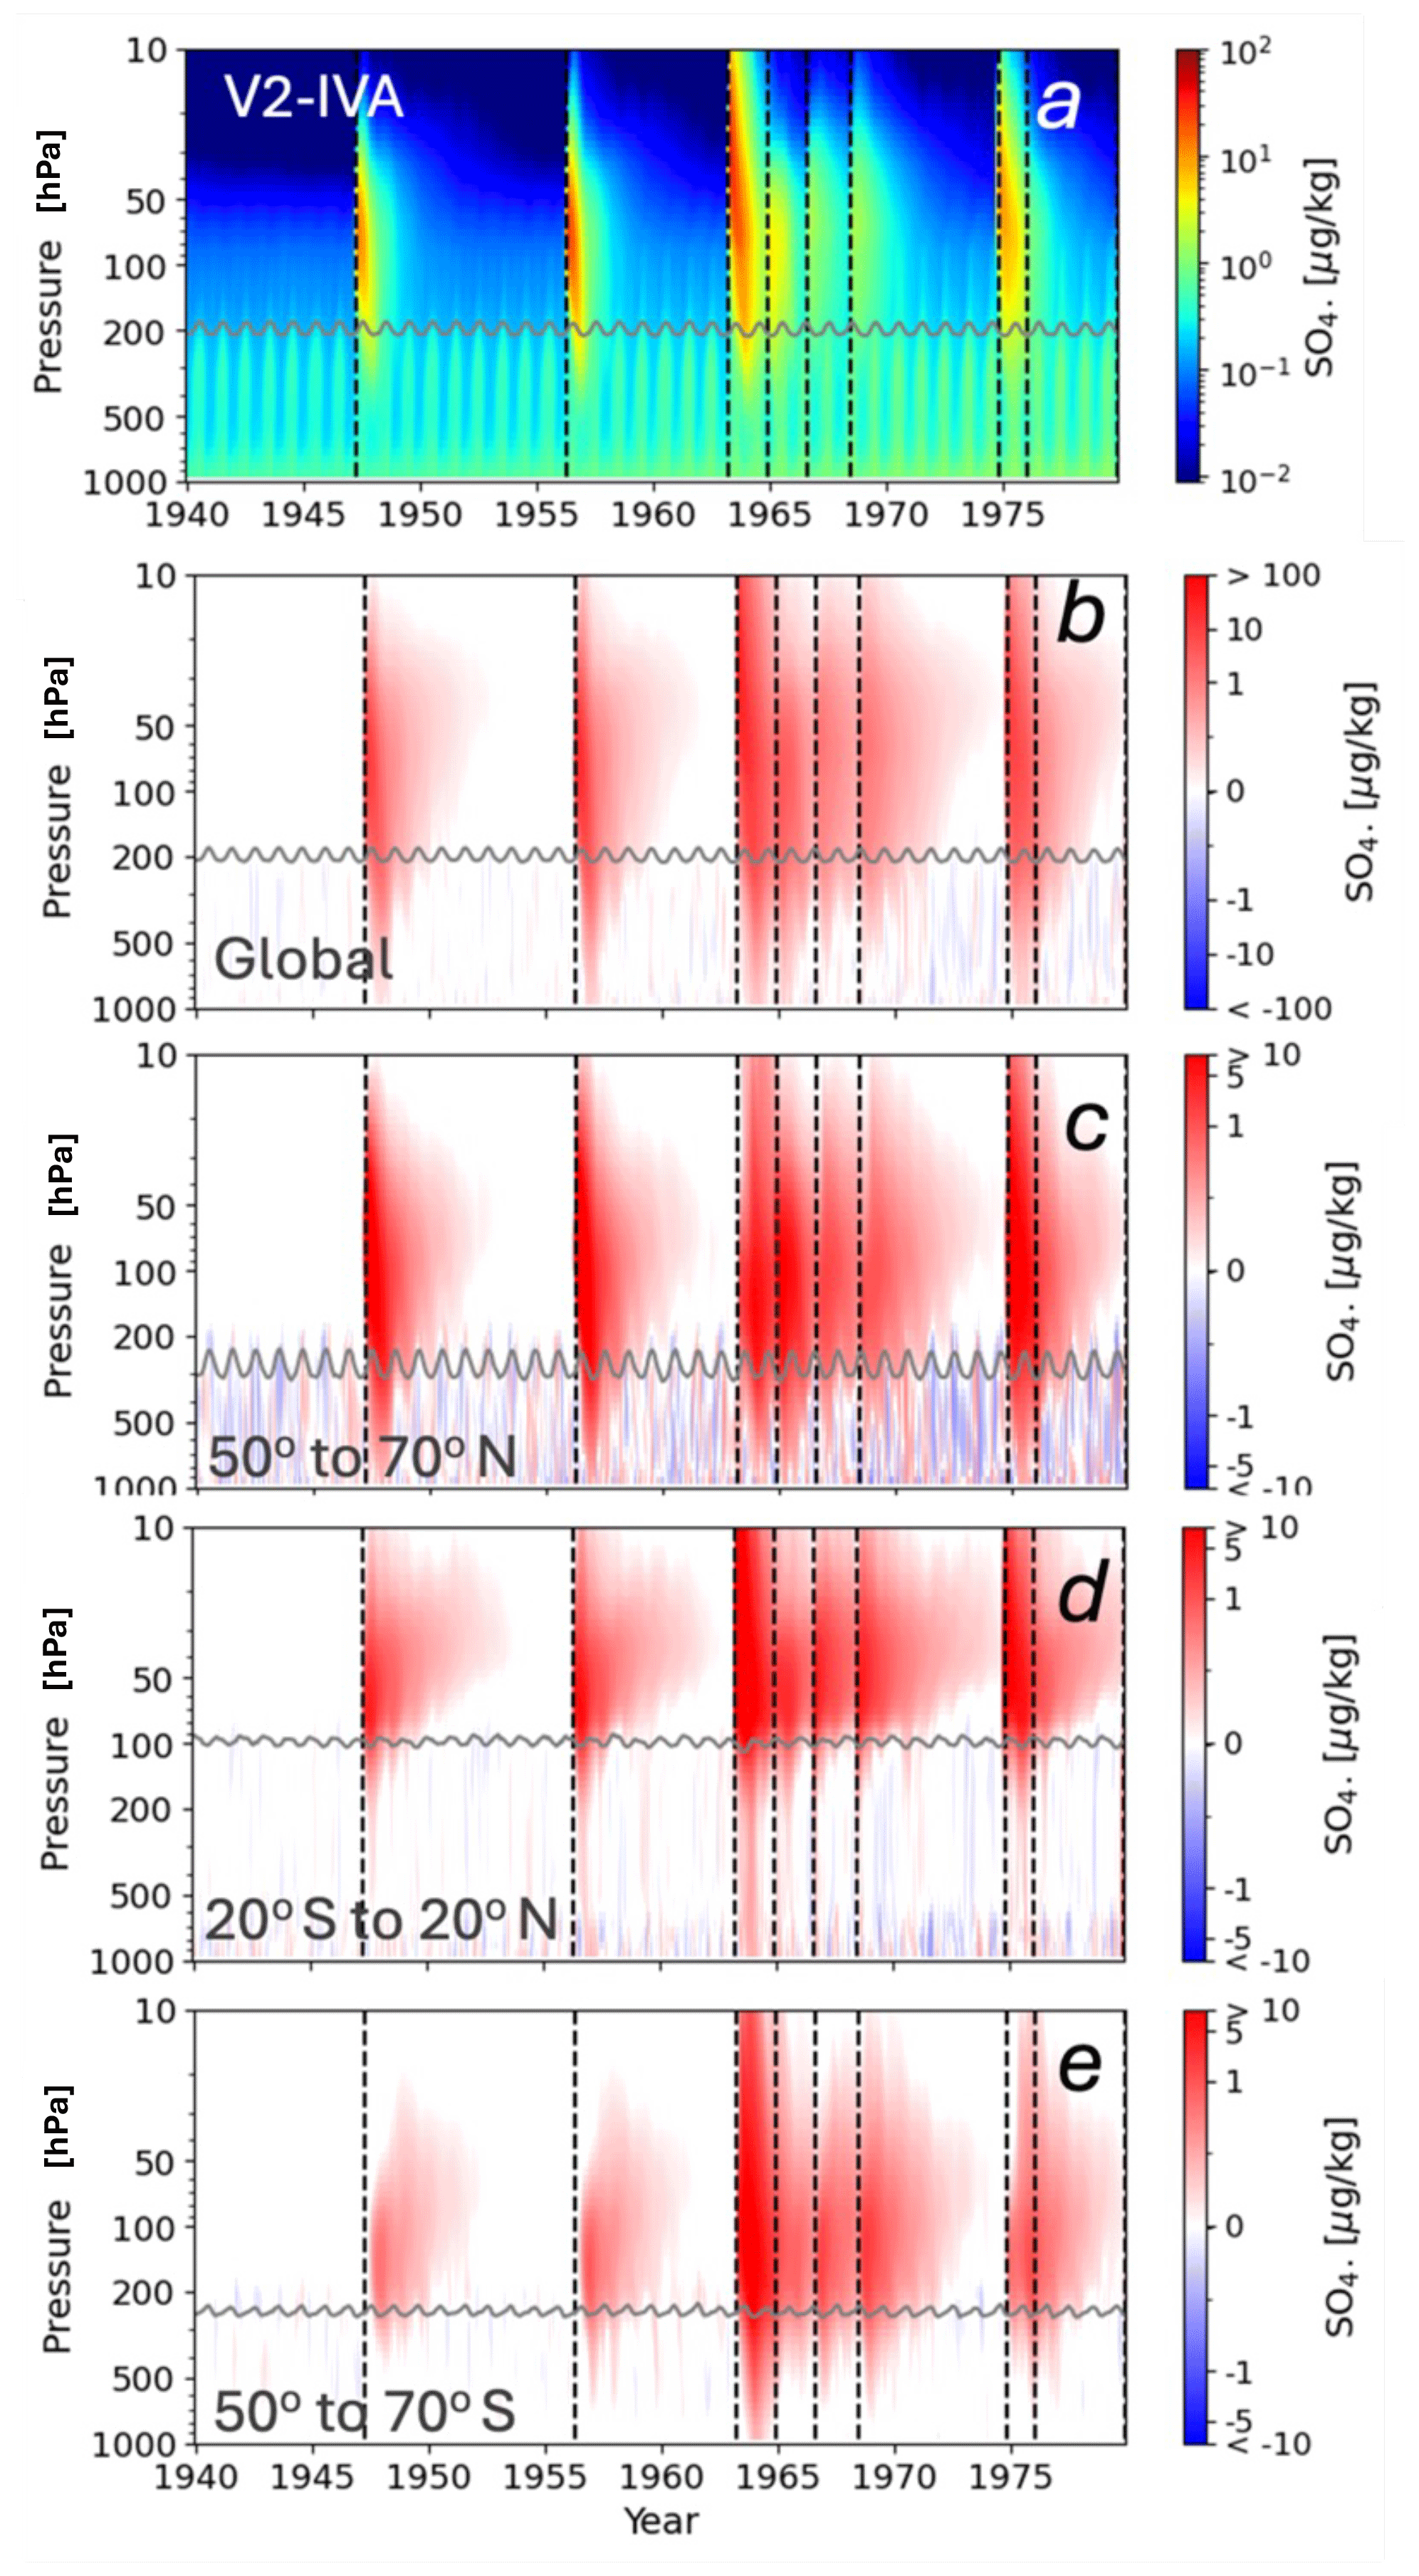
Figure 3Simulated sulfate (SO4) aerosol concentrations or differences (µg kg−1). The x axis represents time in years, while the y axis represents pressure levels (in hPa). The global averaged sulfate aerosol concentrations from V2-IVA are shown in panel (a). Panels (b)–(e) show the SO4 concentration differences between experiments V2-IVA and V2-CMIP6 over different latitude bands. The eruptions recorded by volcanEESM are marked by dashed gray lines (see Table 2).
In addition to their significant amounts in the stratosphere, volcanic sulfate aerosols gradually descended into the troposphere. As V2-CMIP6 did not account for volcanic sulfate aerosols, the sulfate aerosol difference between V2-IVA and V2-CMIP6 illustrates the descent of these aerosols into the troposphere, which is depicted in Fig. 4b–e. Four out of the eight eruptions recorded by volcanEESM (1947, 1956, 1964, 1976) occurred in Northern Hemisphere high latitudes (above 50° N), while the other four occurred in the tropical regions (20° S to 20° N; see Table 2). Strong sulfate aerosol footprints were observed in the troposphere (below the tropopause, gray lines) in northern high latitudes (Fig. 3c) compared to the tropics (Fig. 3d) and southern high latitudes (Fig. 3e). Despite no eruptions occurring in Southern Hemisphere high latitudes, volcanic sulfate aerosols tended to descend more over these regions compared to tropical regions due to the Brewer–Dobson circulation. Overall, a substantial amount of sulfate aerosols reached the troposphere from the stratosphere, highlighting the potential aerosol–cloud interactions.
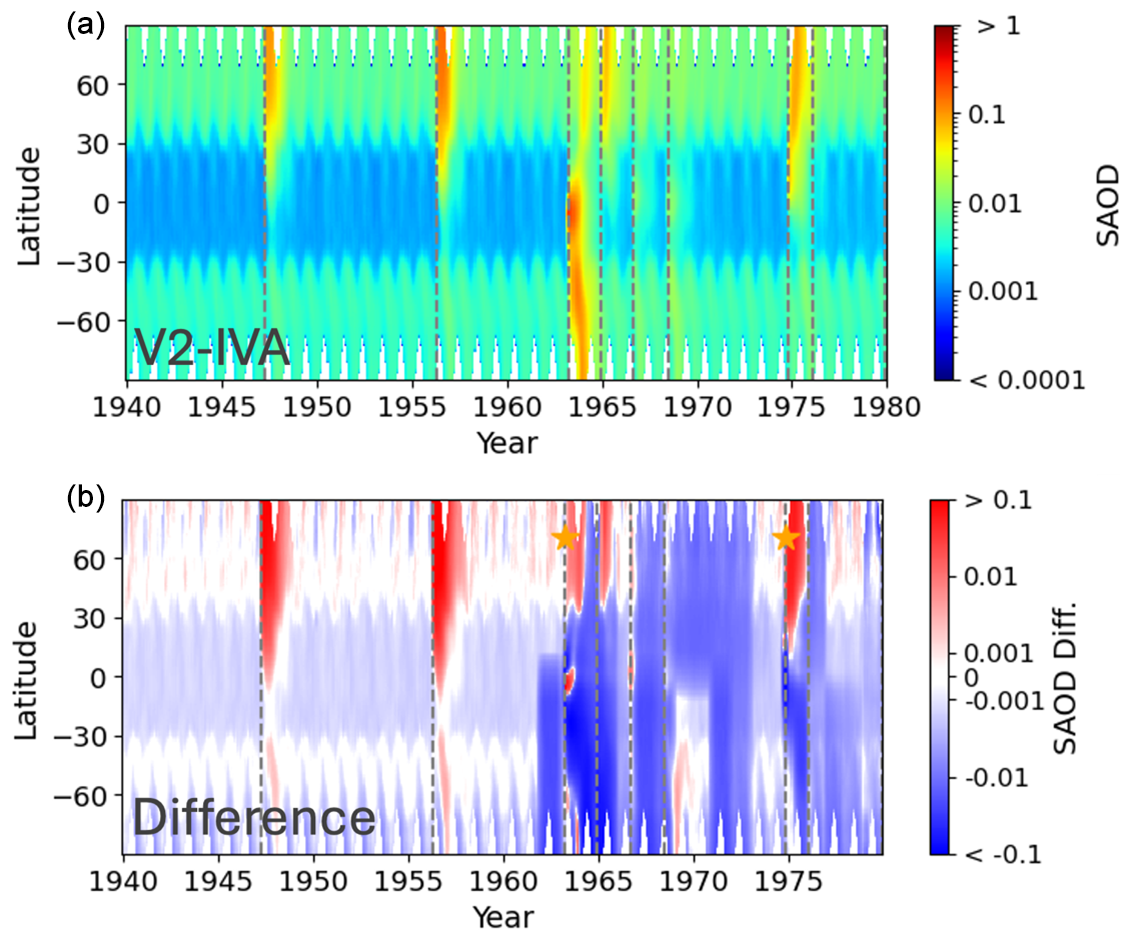
Figure 4Simulated time (in year) and latitude (in degree) variations in SAOD from V2-IVA ensemble (a) and the SAOD difference between V2-IVA and V2-CMIP6 (b). The dashed lines represent volcanic eruptions in volcanEESM (Table 2), while the stars indicate volcanic eruptions in the CMIP6 documentation (Table 1).
SAOD describes the impact of aerosols on the optical properties of the atmosphere in the stratosphere. The simulated SAOD from the V2-IVA ensemble is shown in Fig. 4a. Prior to eruptions, the background SAOD values were approximately 0.008 over high latitudes and 0.002 over the tropics. The volcanic eruptions of Hekla (1947) and Bezymianny (1956) elevated SAOD to 0.06 and 0.13 over Northern Hemisphere high latitudes (compared to Fig. 4 in Danabasoglu et al., 2020). Since these two volcanic eruptions were absent in V2-CMIP6, the two red spikes emerged when comparing V2-IVA with V2-CMIP6 (Fig. 4, lower panel). Despite their relatively small magnitudes, the impact of these two volcanoes was limited to 2 years and north of 30° in the Northern Hemisphere.
For the Mt. Agung eruption in 1963, V2-IVA SAOD displayed a clear spike spreading from the tropics to the South Pole, with peak values exceeding 0.2, consistent with previous studies (Dhomse et al., 2020; Niemeier et al., 2019). Due to a lower strength recorded by volcanEESM, the simulated SAOD in V2-IVA was approximately 0.03 lower than in V2-CMIP6 (Fig. 4, lower panel). Additionally, the V2-CMIP6 simulation indicated three events with slightly higher SAOD than V2-IVA in 1967, 1972, and 1974, spanning the tropics to the Southern Hemisphere high latitudes, while V2-IVA recorded an extra eruption in 1976 in Northern Hemisphere high latitudes. Consequently, V2-IVA simulated two moderate volcanic eruptions during the 1940–1959 period and a relatively dimmer volcanic impact over the 1960–1979 period.
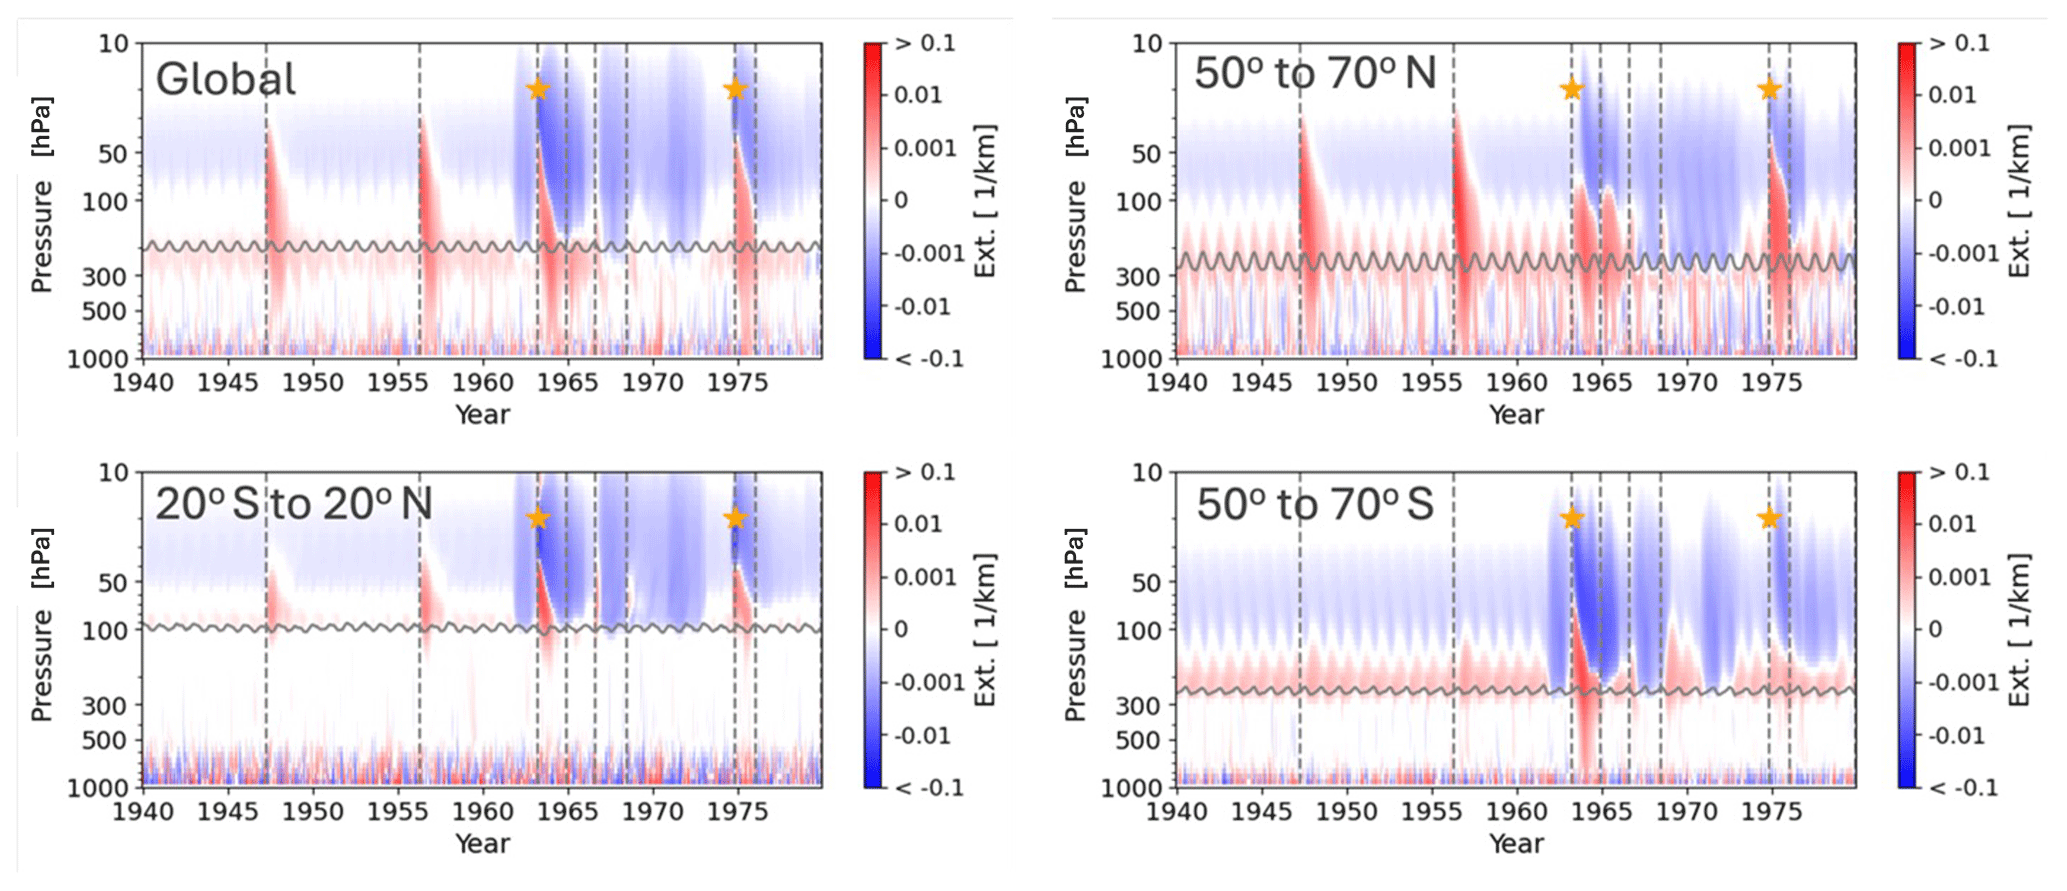
Figure 5Difference in mean extinction between V2-IVA and V2-CMIP6 over the entire globe and at different latitude bands. The x axis represents time in years, and the y axis represents pressure level (in hPa). The vertical dashed lines represent volcanic eruptions in volcanEESM (Table 2), while the stars indicate volcanic eruptions in the CMIP6 documentation (Table 1). The solid gray curves represent tropopause simulated by model.
Aerosol extinction vertical profiles measure the scattering and absorption of solar radiation by aerosols. Figure 5 examines the difference in simulated extinction between V2-IVA and V2-CMIP6 across time and pressure levels. In the V2-IVA simulation, extinction resulted from simulated aerosol scattering and absorption effects, including volcanic sulfate aerosols, whereas in V2-CMIP6, the extinction caused by volcanic eruptions was prescribed. In the panel for the global mean, distinct red stripes caused by the Hekla (1947) and Bezymianny (1956) eruptions extend from the stratosphere into the upper troposphere, coinciding with the comparison of sulfate aerosol concentrations (Fig. 3). This is attributed to V2-IVA's interactive treatment of volcanic sulfate aerosols, allowing for their aerosol extinction effect to penetrate below the stratosphere as particles descend into the troposphere, a more realistic representation compared to the prescribed treatment in V2-CMIP6. The aerosol extinction of the Hekla (1947) and Bezymianny (1956) eruptions is primarily observed between 50 and 350 hPa globally. In northern high latitudes, the impact of the Bezymianny (1956) eruption could extend to the middle-to-lower troposphere below 500 hPa, whereas its impact over the tropics was relatively weaker.
Regarding the Mt. Agung eruption, V2-IVA simulated a weaker extinction above 100 hPa compared to V2-CMIP6, resulting in negative values. However, V2-IVA simulated stronger extinction between 100 and 300 hPa compared to V2-CMIP6, as the injection was concentrated in the middle-to-lower stratosphere (18–20 km) in V2-IVA (see Table 2). For the eruptions subsequent to Mt. Agung, V2-IVA simulated weaker eruptions compared to V2-CMIP6 on a global average. In detail, V2-IVA simulated slightly stronger extinctions over northern high latitudes while showing reduced scattering over the tropics and the Southern Hemisphere.
3.2 Simulated radiative forcings
Figure 6 presents the radiative forcing anomalies from the V2-IVA and V2-CMIP6 ensembles, calculated as deviations from the corresponding 1850–1900 climatological mean. These anomalies provide insight into how volcanic eruptions influenced the radiative budget during the 1940–1980 period.
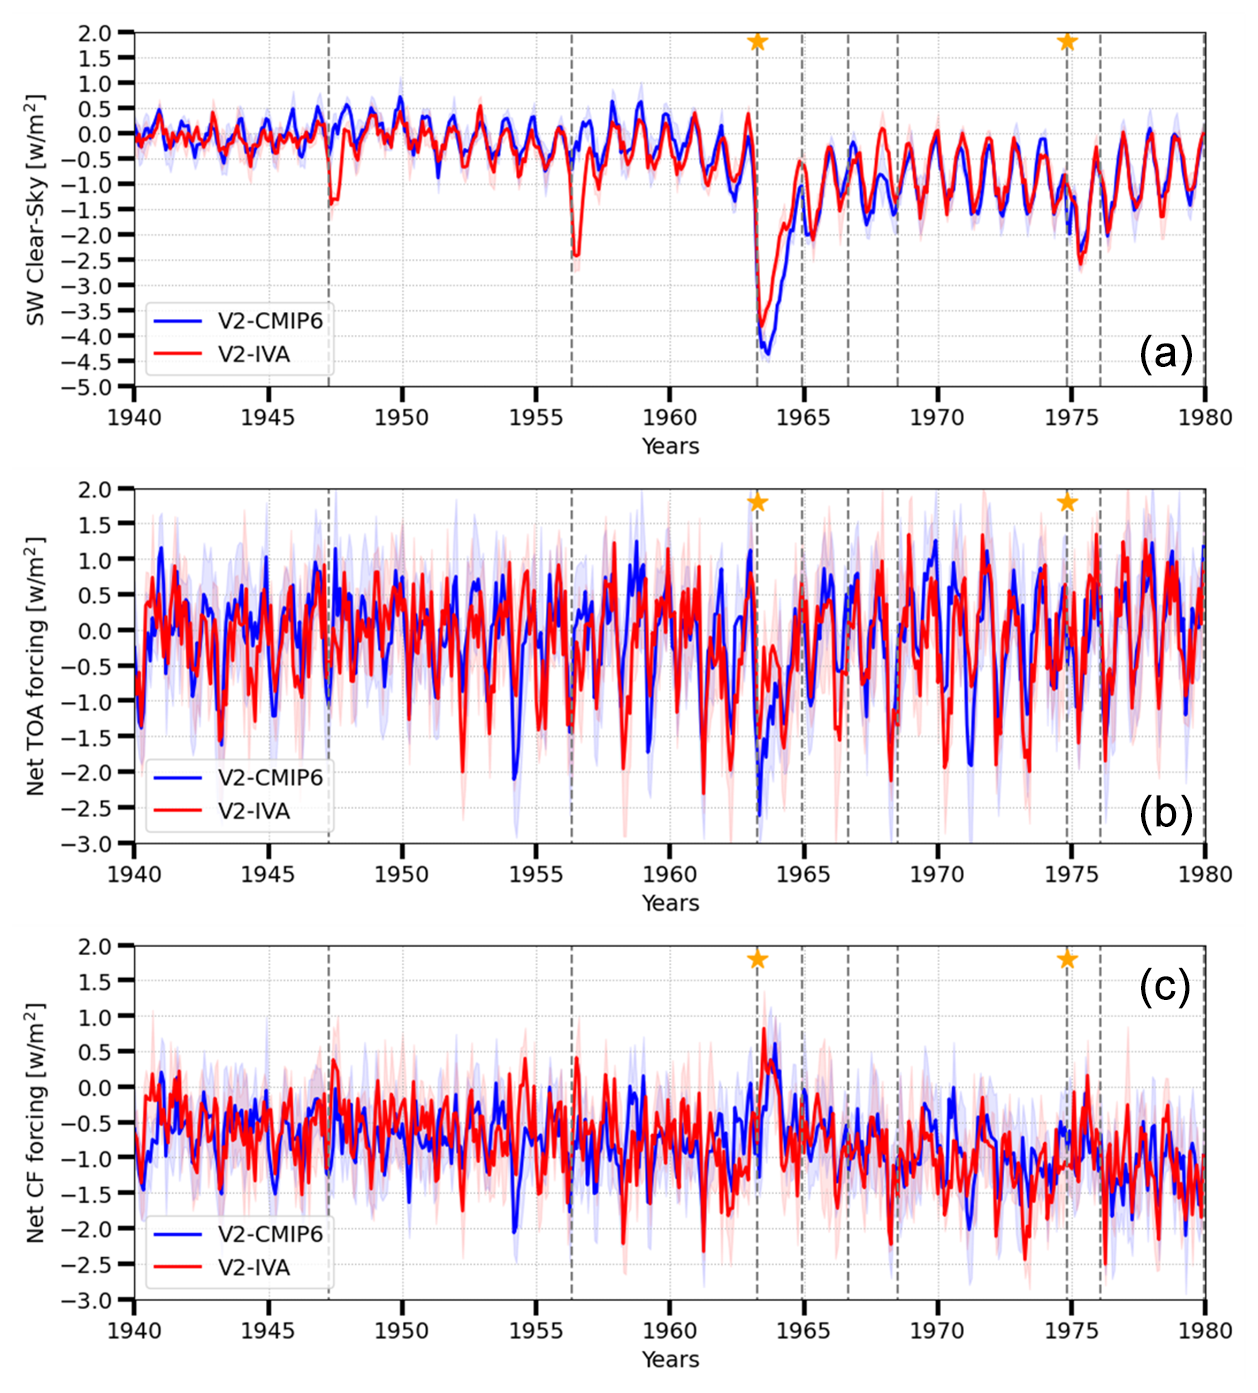
Figure 6Time series of simulated global mean radiative forcings anomalies by V2-IVA and V2-CMIP6 ensembles, including the clear-sky shortwave forcing (a), net forcing at TOA (b), and net cloud forcing at TOA (c). The ensemble means of forcings are shown as solid lines, with the 1-standard-deviation range represented as color shading to indicate uncertainty. The vertical dashed lines represent volcanic eruptions in volcanEESM (Table 2), while the stars indicate volcanic eruptions in the CMIP6 documentation (Table 1).
Figure 6a shows the shortwave radiative forcing anomaly at the top of the atmosphere (TOA) under clear-sky conditions, which primarily reflects the direct radiative effect of volcanic sulfate aerosols. As expected, the 1947 Hekla and 1956 Bezymianny eruptions caused clear-sky cooling effects in the V2-IVA simulations, with global mean radiative forcing drops of approximately 1.2 and 2.3 W m−2, respectively. These signals persisted for several months before recovering, while no such effects were observed in the V2-CMIP6 simulations. The 1963 Mt. Agung eruption led to a 3.7 W m−2 decrease in shortwave radiative forcing in V2-IVA, compared to a 4.3 W m−2 drop in V2-CMIP6. By 1966, both simulations showed similar forcing levels, with slight discrepancies appearing in subsequent years due to differences in volcanic forcing representation. The relatively weaker initial forcing in V2-IVA is consistent with prior studies suggesting that the CMIP6 prescribed stratospheric forcing for Mt. Agung may be overestimated (Chylek et al., 2020; Dhomse et al., 2020; Niemeier et al., 2019). These results demonstrate that the emission-based approach in V2-IVA provides a reasonable representation of volcanic sulfate aerosol–radiation interactions (VARIs), capturing the expected radiative response to major eruptions.
Figure 6c presents the cloud radiative forcing anomaly at TOA, which is critical for understanding the role of volcanic sulfate aerosols in modifying cloud properties. The V2-IVA and V2-CMIP6 simulations exhibit distinct cloud forcing responses due to their respective volcanic aerosol treatments. During the 1940–1959 period, the V2-IVA ensemble mean anomaly is −0.61 W m−2, which is 0.11 W m−2 higher (less cooling) than the V2-CMIP6 mean anomaly of −0.72 W m−2. This difference is statistically significant at the 95 % confidence level. In the 1960–1980 period, the V2-IVA ensemble mean anomaly is −0.98 W m−2, compared to −0.91 W m−2 in V2-CMIP6, indicating a stronger cooling effect in V2-IVA by −0.07 W m−2, which is also statistically significant. The V2-CMIP6 cloud forcing values are in line with Golaz et al. (2022) and comparable to values from other models during the similar period (Bauer et al., 2020; Flynn and Mauritsen, 2020; Zhang et al., 2021), which contributes to the simulated surface temperature low bias by E3SMv2 (Golaz et al., 2022).
These differences in cloud forcing anomalies between two ensembles align with expectations based on the inclusion of volcanic sulfate aerosols in the preindustrial (PI) background in V2-IVA. As discussed in the Introduction, incorporating historical average volcanic sulfate emissions into PI control simulations alters the baseline for aerosol–cloud interactions, (Eq. 2). During the 1940–1959 period, characterized by relatively low volcanic activity, the low volcanic sulfate aerosols (Av) in V2-IVA with large baseline aerosols () and the same other aerosol increase (Aa) resulted in a lower aerosol relative increase (Rv) compared to the V2-CMIP6 aerosol increase ratio during the same period. In contrast, the 1960–1980 period, marked by more frequent and intense volcanic eruptions, saw additional sulfate aerosols injected into the atmosphere, indicating larger Av, enhancing aerosol–cloud interactions and leading to stronger cloud cooling in V2-IVA. This effect is evident in the lower (more negative) cloud forcing anomaly compared to the 1940–1960 period, confirming that volcanic sulfate aerosol variability plays a crucial role in modulating cloud radiative effects.
Figure 6b shows the net radiative forcing anomaly at TOA, which integrates both shortwave and longwave contributions. The Mt. Agung eruption in 1963 is the only event in the 1940–1980 period that produces a clear negative forcing signal. The V2-CMIP6 simulation exhibits a maximum radiative forcing drop of 3.5 W m−2, which takes approximately 3 years to recover, while V2-IVA simulates a smaller initial drop of 2.5 W m−2. Apart from Mt. Agung, no significant changes in TOA net radiative forcing are evident for other volcanic events, highlighting the dominance of anthropogenic aerosol trends in shaping the overall radiative balance during this period.
3.3 Simulated cloud changes with volcanic activities
This section examines cloud property changes over time to support the cloud forcing differences discussed in Sect. 3.2. The difference in net cloud forcing anomalies between the V2-IVA and V2-CMIP6 ensembles is 0.11 W m−2 (warming effect) for the 1940–1959 period and −0.08 W m−2 (cooling effect) for the 1960–1979 period. These changes align with variations in volcanic activity levels during these periods, with relatively low volcanic emissions in 1940–1959 and elevated emissions in 1960–1979. The shortwave cloud forcing exhibits a similar pattern (Table 4).
Table 4Differences in global mean cloud property anomalies between V2-IVA and V2-CMIP6. The numbers in the parentheses are anomalies resulting from, in order, V2-IVA and V2-CMIP6 ensembles. Values with * represent statistically significant values at the 95 % confidence level.
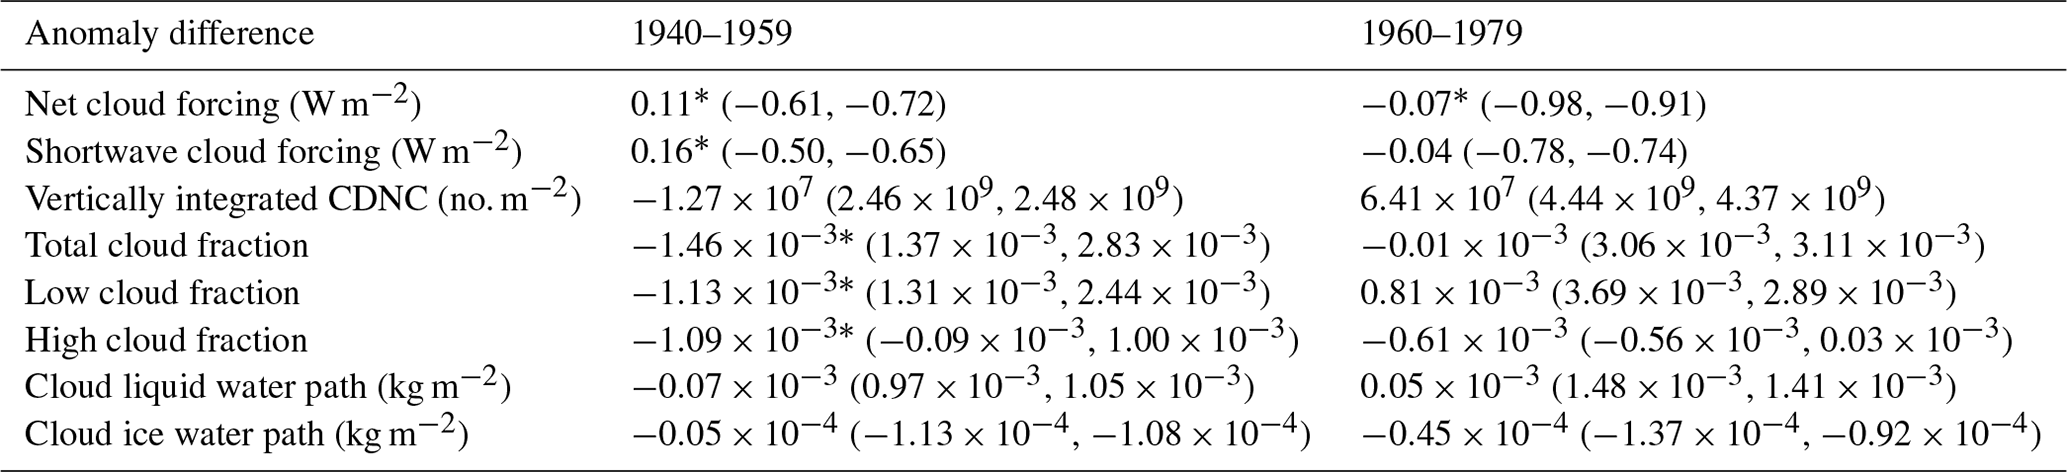
In the V2-IVA experiment, volcanic sulfate aerosols (Av) actively participate in aerosol–cloud interactions, modifying cloud properties in response to fluctuations in volcanic emissions. During 1940–1959, the volcanEESM inventory recorded two moderate eruptions, Hekla (1947) and Bezymianny (1956), contributing a total of 6.2 Tg of SO2 emissions or an average of 3.1 Tg per decade. This is lower than both the historical average (7.0 Tg per decade) and the 1850–1899 climatology (6.5 Tg per decade), indicating a reduction in volcanic sulfate emissions during this period. Since the total aerosol burden in the atmosphere is determined by both historical aerosol increase (Aa) and volcanic aerosols (Av), a lower Av value in this period partially compensates for the Aa increase and lowers the aerosol increase ratio Rv (Eq.2) compared to the V2-CMIP6 experiment. This lower Rv results in relatively lower cloud droplet number concentration (CDNC), cloud cover, and cloud liquid water content, leading to weaker aerosol–cloud interactions in the historical transient simulation (Fig. 7, left column). These reductions occur relatively uniformly across latitudes rather than being concentrated in specific regions.
In contrast, the 1960–1979 period experienced significantly higher volcanic SO2 emissions, totaling 16.4 Tg or 8.2 Tg per decade (Table 2), which exceeds the 1850–1899 climatology of 6.5 Tg per decade. The larger Av value during this period lowers the Rv ratio, meaning that volcanic aerosols contribute more to the total aerosol burden, as well as the other aerosol increase. The increase in volcanic sulfate aerosols results in a 28 % increase in low cloud fraction anomaly, a 5 % increase in cloud liquid water path anomaly, and a 1 % increase in vertically integrated CDNC in V2-IVA compared to V2-CMIP6 (Fig. 7, right column, and Table 4). These cloud property changes support a cooling effect on net cloud forcing of −0.08 W m−2. The simulated cloud fraction anomaly values are reasonable and in line with the study that evaluates CMIP6 cloud fraction variations across different climate models (Vignesh et al., 2020).
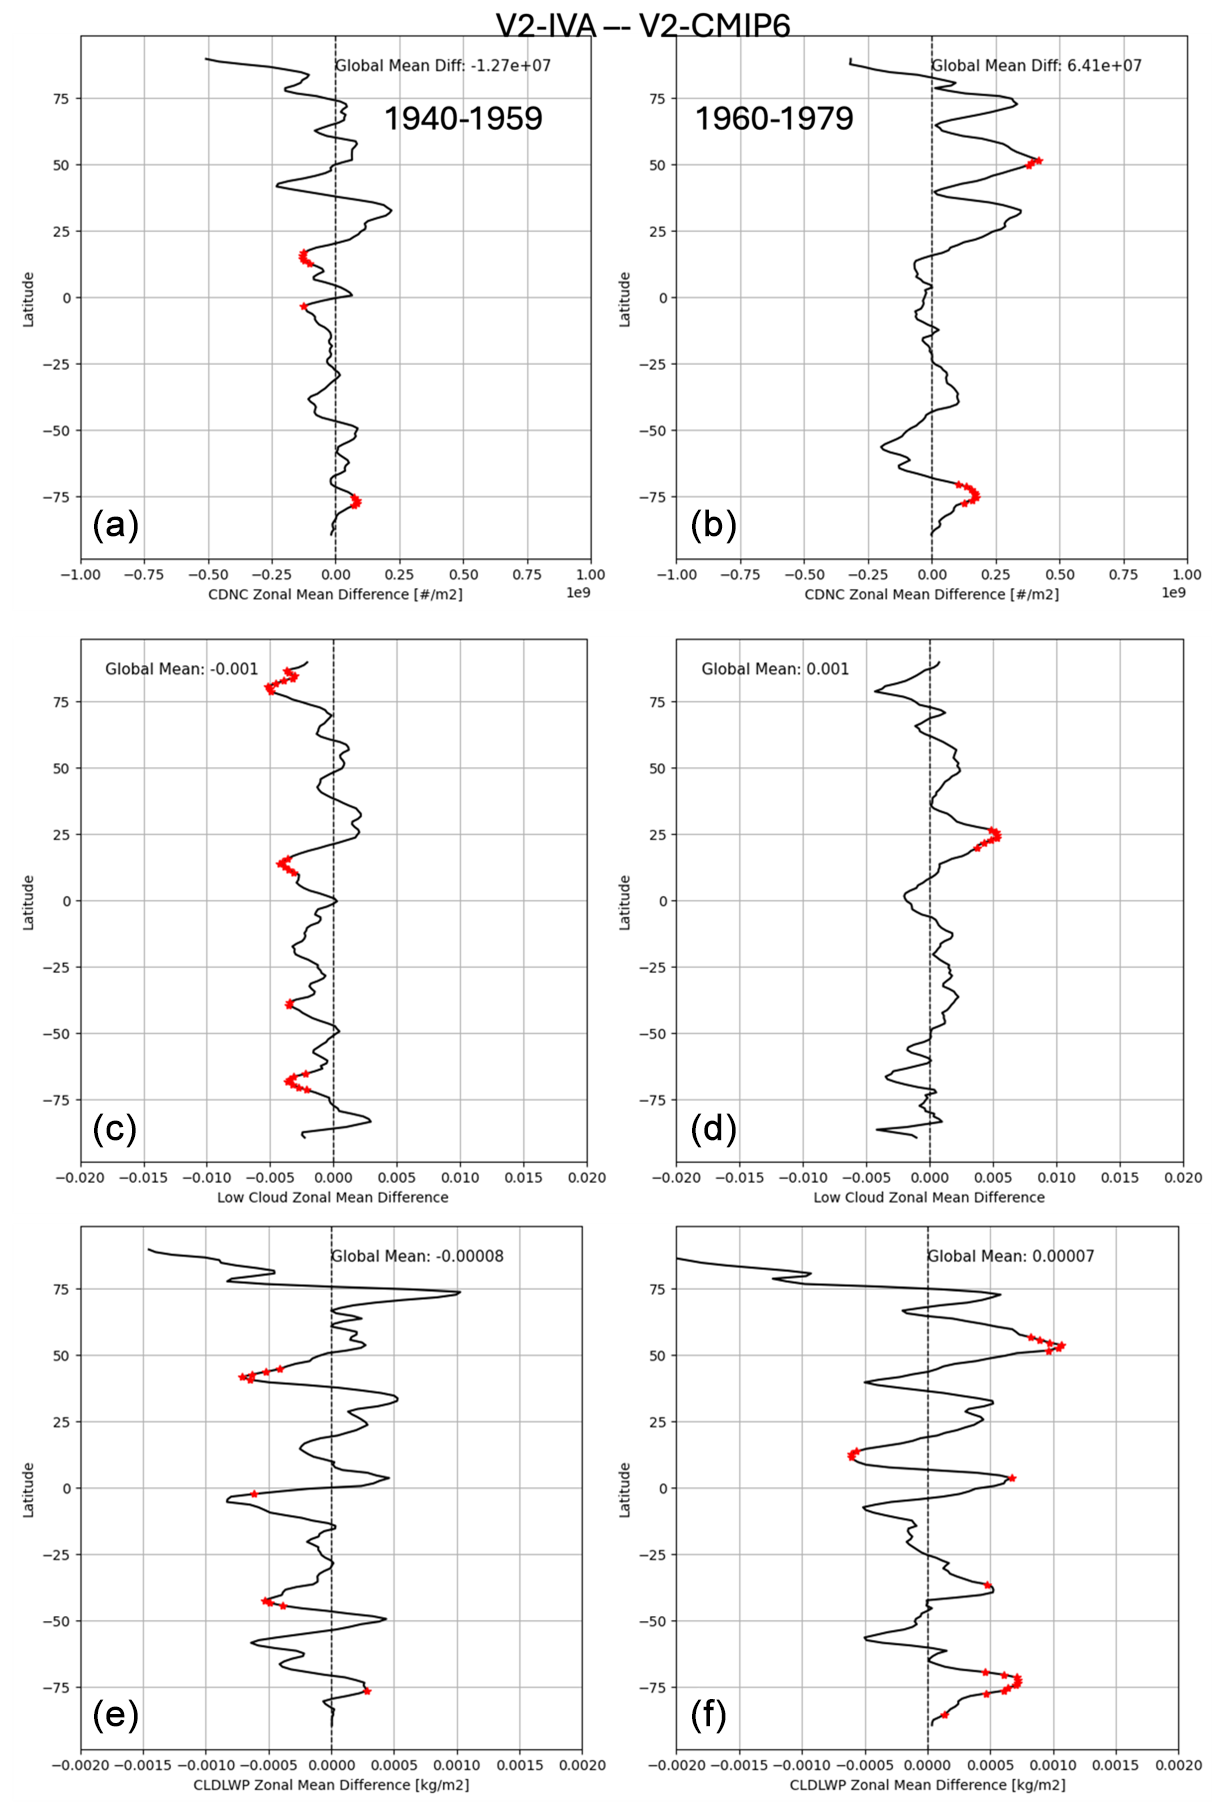
Figure 7Simulated difference in cloud property anomalies between V2-IVA and V2-CMIP6 ensembles for the 1940–1959 period (a, c, e) and the 1960–1979 period (b, d, f). The comparison includes (a, b) zonal mean vertical integrated cloud droplet number concentration (CDNC) (in units of no. m−2), (c, d) low cloud cover, and (e, f) cloud liquid water path (LWP) (in units of kg m−2). The y axis in each panel represents latitude (degree). The dotted red points represent the differences that are significant at the 95 % confidence level.
3.4 Simulated historical temperature
Since each historical experiment began with a different baseline derived from distinct PI control simulations, directly comparing simulated temperatures across ensembles is not meaningful. Instead, it is more appropriate to compare temperature anomalies from ensemble means, which represent temperature departures from its 1850–1899 climatology. For instance, the temperature anomaly for V2-CMIP6 during the 1940–1979 period was calculated by the V2-CMIP6 ensemble mean temperature during the 1940–1979 period subtracting the V2-CMIP6 ensemble climatology during the 1850–1899 period. This approach intends to evaluate the changes relative to the climate before anthropogenic emissions took off.
Figure 8 illustrates the difference in temperature anomalies between V2-IVA and V2-CMIP6. During the 1940–1959 period, the eruptions of Hekla (1947) and Bezymianny (1956) lead to brief stratospheric warming. However, V2-IVA shows cooler temperatures in the troposphere shortly after these eruptions compared to V2-CMIP6, particularly over northern high latitudes. This contrast becomes more pronounced when examining temperature anomalies at different pressure levels in Fig. 9. At the 200 hPa level, V2-IVA exhibits higher temperature anomalies than V2-CMIP6 after these two eruptions, whereas the situation has been reversed at 500 hPa and the surface. Notably, eruptions only cause short-lived cooling in the troposphere. In general, V2-IVA simulated a warmer troposphere than V2-CMIP6 during the 1940–1959 period.
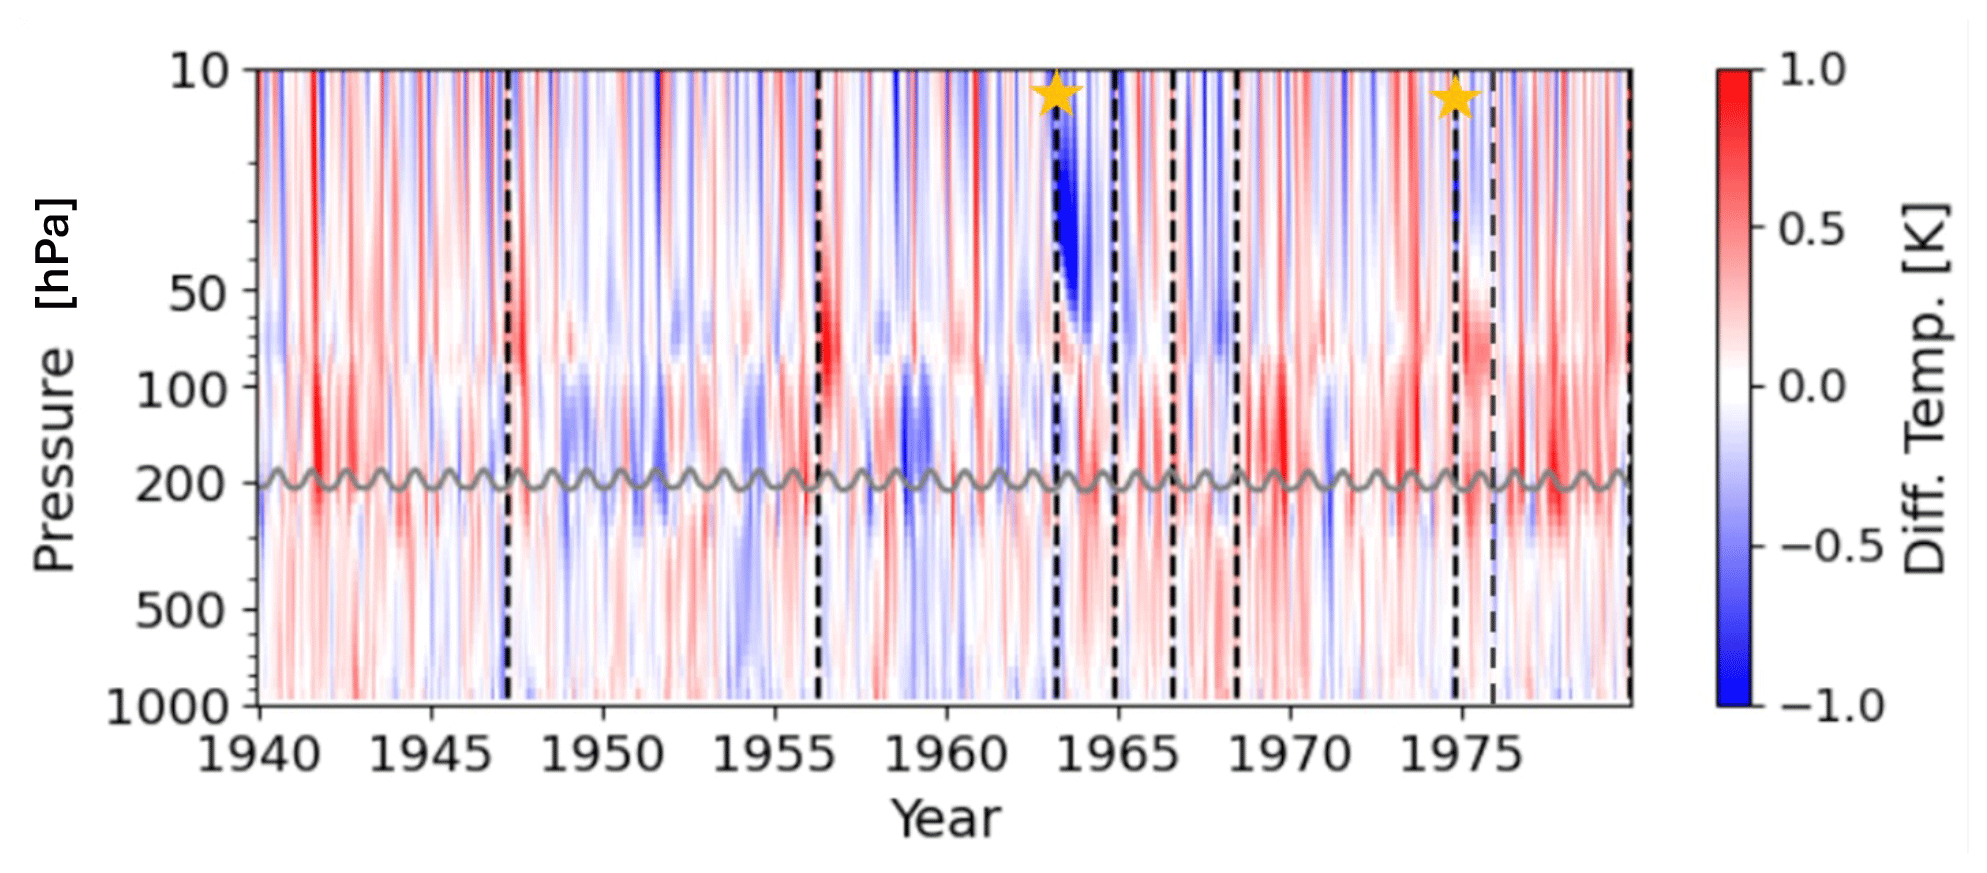
Figure 8Time–pressure cross section of global mean temperature difference (K) between V2-IVA and V2-CMIP6 ensembles. The vertical dashed lines represent volcanic eruptions in volcanEESM (Table 2), while the stars indicate volcanic eruptions in the CMIP6 documentation (Table 1). The solid gray curves represent tropopause simulated by model.
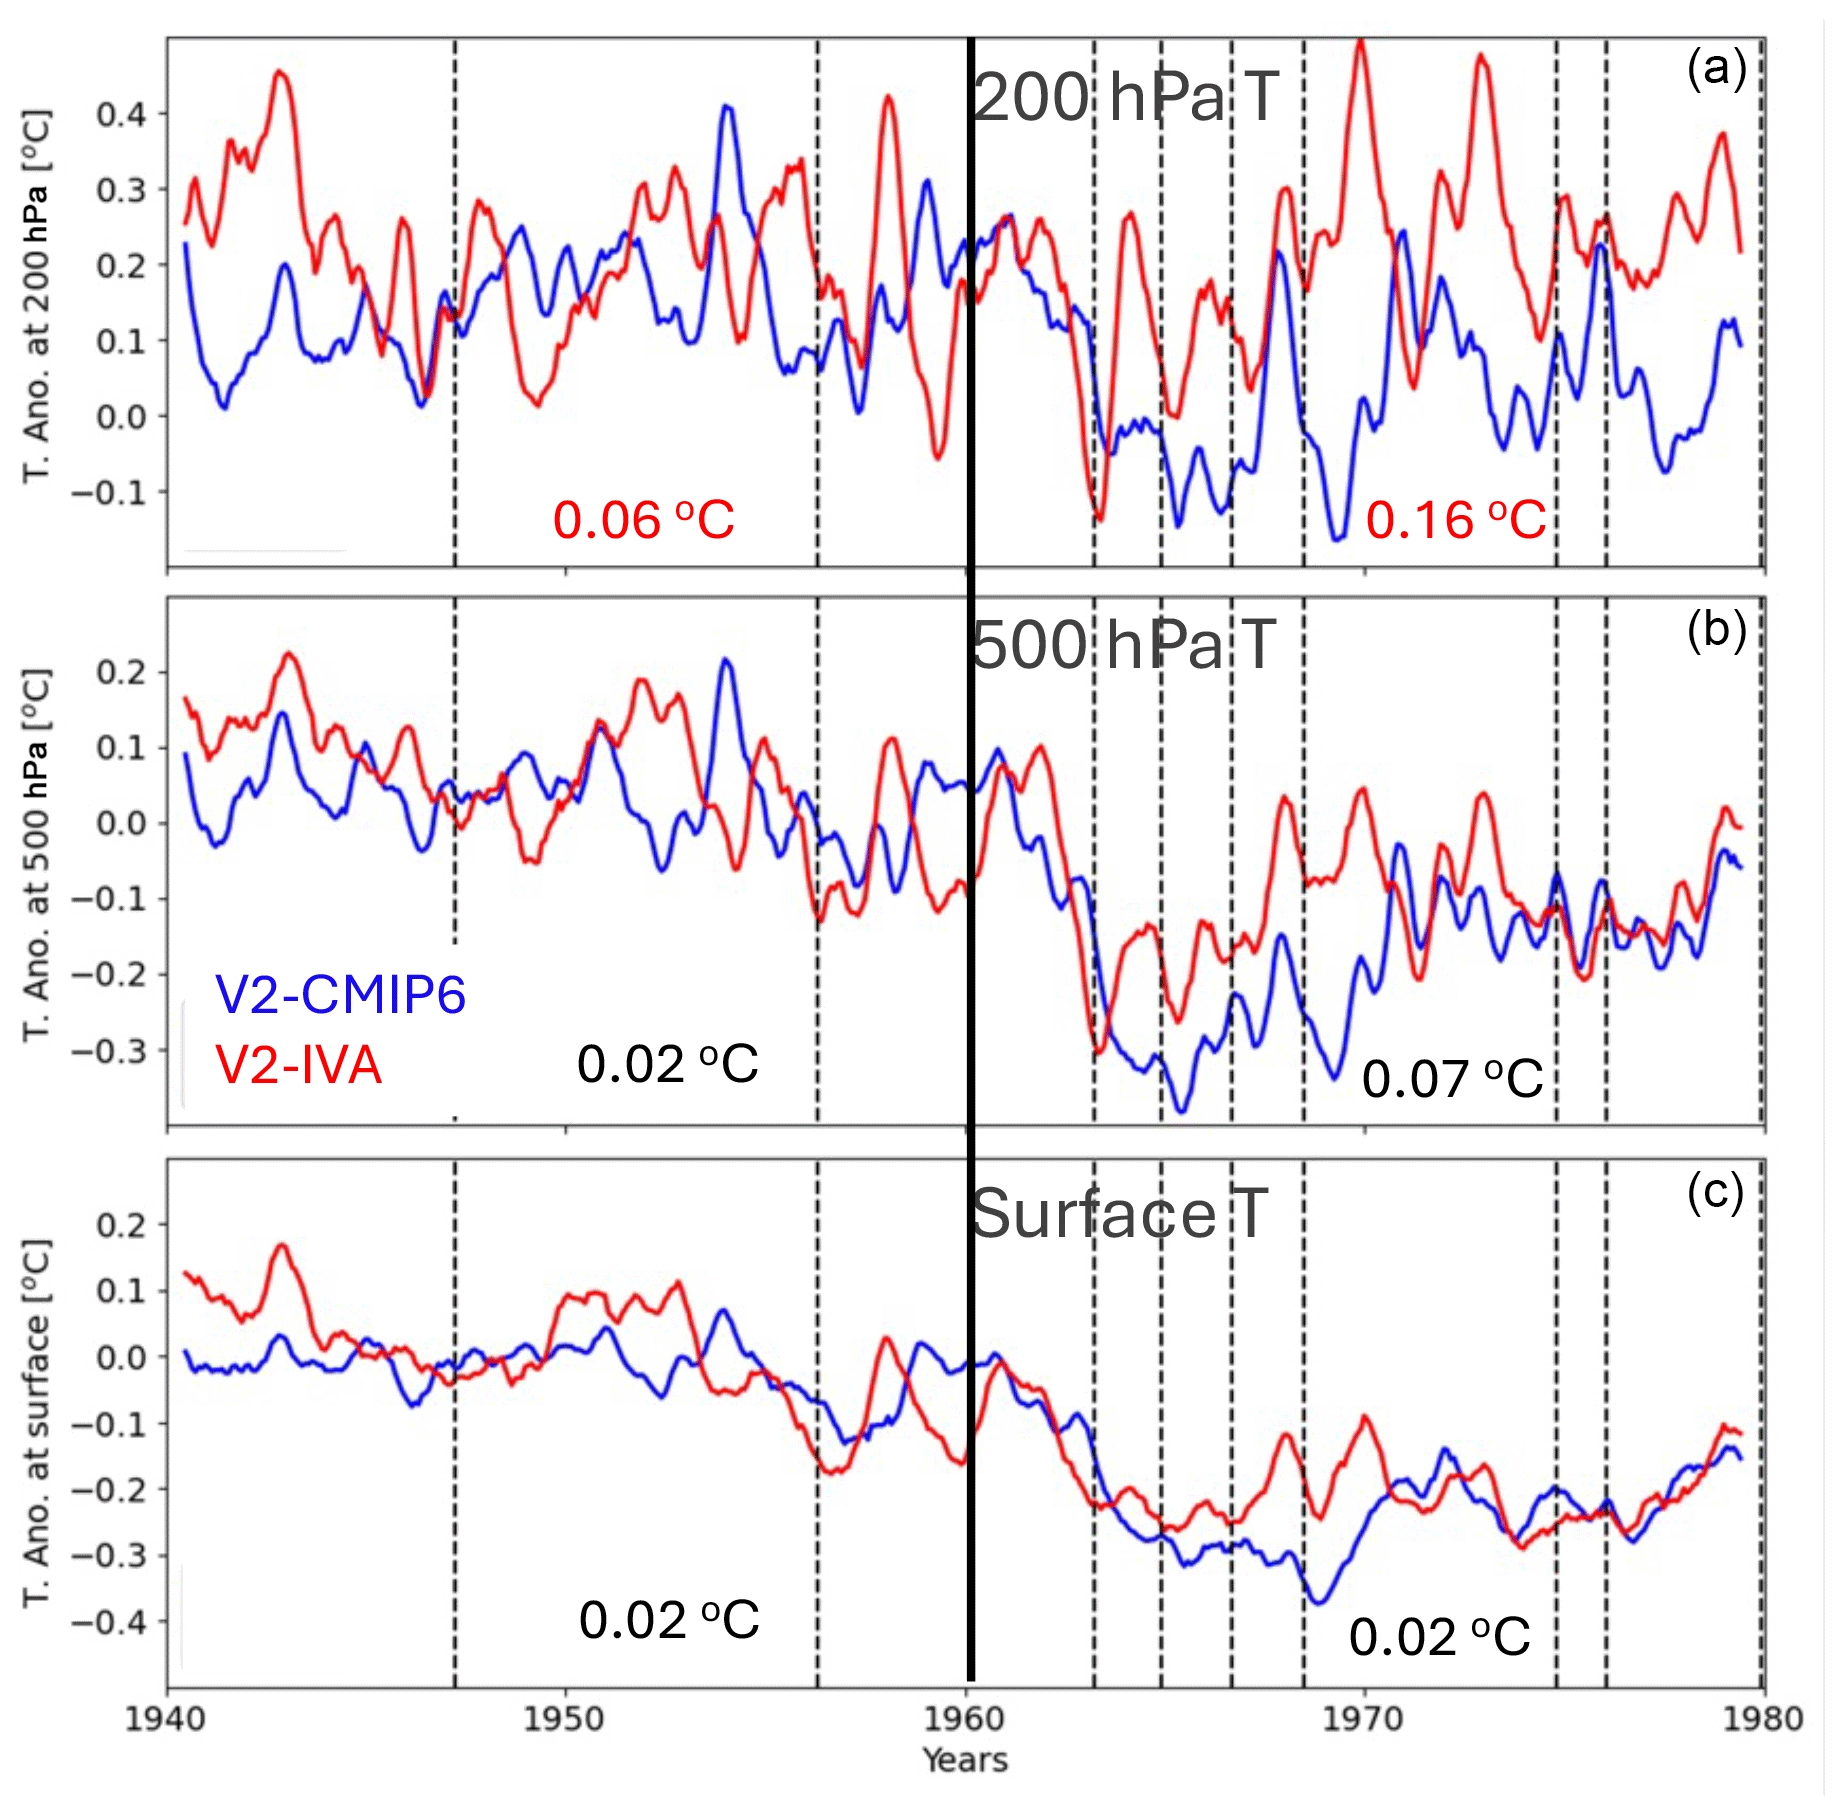
Figure 9Time series of temperature anomalies at 200 hPa (a), 500 hPa (b), and the surface (c). The dashed lines represent volcanic eruptions in volcanEESM (Table 2). The mean temperature differences during the 1940–1959 period between V2-IVA and V2-CMIP6 are shown as text on the left side of all panels, while the differences during the 1960–1979 period are shown on the right side of all panels. The temperature difference in the red color means it is significant at the 95 % confidence interval.
During the 1963–1972 period, updated volcanic eruptions resulted in a cooler middle-to-upper stratosphere in V2-IVA due to reduced aerosol absorption (Fig. 5). Consequently, temperatures at the 200 hPa level to the surface are moderately warmer in the V2-IVA ensemble compared to the V2-CMIP6 ensemble. Figure 9 shows that V2-IVA-simulated temperature anomalies are greater than V2-CMIP6-simulated ones at all three levels. By 1968, the temperature difference between V2-IVA and V2 reaches 0.16 °C at the surface, 0.21 °C at 500 hPa, and 0.22 °C at 200 hPa. These findings highlight how differences in the volcanic representation impact interannual temperature changes. In general, V2-IVA simulates a slightly warmer troposphere than that simulated by V2-CMIP6 during the 1960–1979 period mainly due to warmer clear-sky shortwave forcing, 0.13 W m−2, resulting from less volcanic sulfate aerosol radiation interaction from volcanic eruptions, which agrees with previous studies (Chylek et al., 2020). Previous studies (Dhomse et al., 2020; Niemeier et al., 2019) indicated that the smaller Mt. Agung (1963) emission, around 7 Tg SO2, should be used in climate models compared to the 9.9 Tg SO2 used in CMIP6 volcanic forcing simulations (Arfeuille et al., 2014).
Figure 10 presents the simulated surface temperature anomalies compared to observations, with three observational datasets shown as solid gray to black lines. We select the HadCRUT5-Analysis product (Morice et al., 2021), NOAA's National Climatic Data Center (NCDC) National Centers for Environmental Prediction (NCEP) reanalysis dataset, and the NASA Goddard Institute Surface Temperature (GISTEMP) dataset (Hansen et al., 2010). Between 1940 and 1959, observations exhibit interannual variability of up to 0.25 °C, along with a moderate cooling trend. In contrast, V2-CMIP6 produces a nearly flat temperature curve during this period. V2-IVA improves the interannual variability by incorporating two additional volcanic eruptions, Hekla (1947) and Bezymianny (1956), which introduce episodic cooling events. As a result, the correlation coefficient between the simulated and observed temperature anomalies increases from 0.15 in V2-CMIP6 to 0.38 in V2-IVA, suggesting an improved representation of temperature temporal variability. However, the mean surface temperature anomaly simulated by V2-IVA is only slightly warmer (by 0.02 °C) than that of V2-CMIP6, indicating that the main cold bias remains largely unchanged.
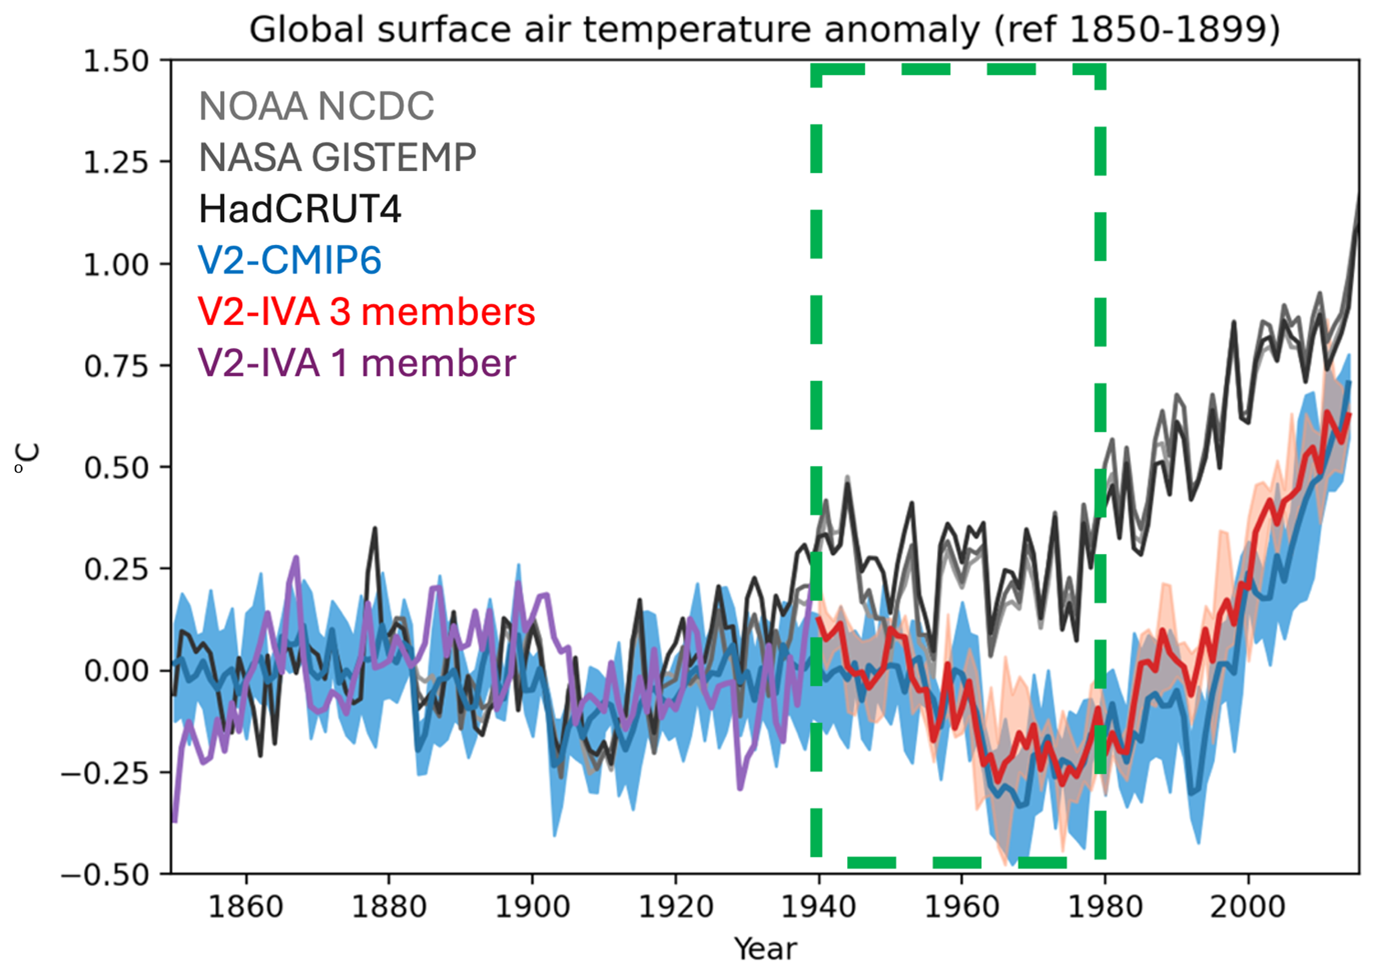
Figure 10Temperature anomaly trends from 1850 to 2014. Black and gray lines represent observational data. The blue line represents the V2-CMIP6 ensemble mean, while the red line represents the V2-IVA ensemble mean during 1940–1980. The purple line represents the single-member results of V2-IVA from 1850 to 1940.
Between 1960 and 1979, the observations show a moderate temperature drop (up to 0.3 °C) following the Mt. Agung eruption, but temperatures quickly recover to pre-eruption levels in the early 1970s, with an overall weak warming trend. In contrast, while V2-IVA simulates a slightly warmer temperature anomaly after Mt. Agung compared to V2-CMIP6, the model does not capture the observed temperature rebound. Instead, both simulations exhibit a continued cooling trend over this 2-decade period. This result suggests that while the revised volcanic forcing in V2-IVA slightly moderates the excessive cooling seen in V2-CMIP6, it does not clearly correct the underlying bias, indicating that additional factors beyond volcanic forcing may contribute to the mid-20th-century temperature discrepancies.
This study evaluates the impact of an improved volcanic sulfate aerosol representation in E3SM version 2 on mid-20th-century climate simulations. By implementing an emission-based approach that accounts for both volcanic sulfate aerosol–radiation interactions (VARIs) and volcanic sulfate aerosol–cloud interactions (VACIs), we aimed to address the substantial surface temperature cold bias observed in E3SM historical simulations. The revised model (V2-IVA) exhibits moderate improvements in surface temperature variability and a slightly warmer simulated climate compared to the default CMIP6 volcanic forcing treatment (V2-CMIP6). The inclusion of additional volcanic events, such as Hekla (1947) and Bezymianny (1956), enhances the representation of temperature fluctuations, while the revised Mt. Agung eruption (1963) intensity and the more realistic treatment of VACIs contribute to the slightly warmer climate simulated in V2-IVA. However, despite these improvements, the cold bias in historical simulations remains largely uncorrected.
One key finding is that cloud forcing anomalies in V2-IVA are more consistent with expected aerosol–cloud interaction processes. During the 1940–1959 period, when volcanic sulfate emissions (Av) were below the historical average, cloud forcing anomalies were reduced relative to V2-CMIP6, leading to a warmer cloud cooling effect (0.11 W m−2). Conversely, during the 1960–1979 period, elevated volcanic sulfate emissions strengthened aerosol–cloud interactions, resulting in a colder cooling effect (−0.07 W m−2). This aligns with theoretical expectations based on the aerosol increase ratio (Rv), as described in Eq. (2). While these cloud forcing changes help explain some differences in the temperature response, they are not sufficient to fully resolve the cold bias.
Several factors may explain why the temperature cold bias remains substantial. First, the overall aerosol cooling effect in E3SM is approximately twice as strong as the CMIP6 multi-model mean (Golaz et al., 2022). This discrepancy could be attributed to an overestimation of the aerosol burden. The E3SM development has incorporated the interactive tropospheric chemistry to constrain sulfate aerosol production (Tang et al., 2025) and enhanced aerosol wet removal processes (Shan et al., 2021, 2024) for better scavenging. Additionally, while E3SMv2 implements the interactive stratospheric ozone (O3v2) module to better represent stratospheric ozone (Tang et al., 2021), its treatment of tropospheric ozone lacks historical variability, potentially missing a warming contribution from tropospheric ozone changes (Tang et al., 2025). Another limitation is the use of the Liu and Penner (2005) scheme for homogeneous and heterogeneous ice nucleation in cirrus clouds, which considers only sulfate aerosol particles in the Aitken mode, potentially underestimating the impact on high clouds. Volcanic aerosols in the stratosphere rapidly grow from Aitken to accumulation and even coarse mode when large eruptions occur, suggesting that ice nucleation from these larger particles should be considered, as implemented in CESM2 (Visioni et al., 2017). Furthermore, one important source of background stratospheric sulfate, carbonyl sulfide (OCS), is not included in the current study. Missing this source may lead to an underestimation of stratospheric sulfate aerosol levels, particularly during periods of low volcanic activity, accounting for as much as one-third of the background sulfate burden in the stratosphere (Mills et al., 2016). Addressing these limitations in future model versions could further improve the representation of aerosol–climate interactions and help reduce the persistent temperature bias.
The datasets analyzed in this study are available at https://doi.org/10.5281/zenodo.11246313 (Ke, 2024a), the E3SMv2 source code at https://doi.org/10.5281/zenodo.11403736 (Ke, 2024b), and the E3SMv2 run script at https://doi.org/10.5281/zenodo.11403988 (Ke, 2024c). The E3SM project, code, simulation configurations, model output, and tools to work with the output are described on the E3SM website (https://e3sm.org, E3SM Project, 2025). Instructions on how to get started running E3SM and its components are available on the E3SM website (https://e3sm.org/model/running-e3sm/e3sm-quick-start, E3SM Guide, 2025).
The supplement related to this article is available online at https://doi.org/10.5194/gmd-18-4137-2025-supplement.
All co-authors designed the experiments, and ZK carried out the V2-IVA and V2-IVA-NPI experiments. The V2-CMIP6 results were provided by JCG from the Golaz et al. (2022) study. ZK performed the data analysis, and all co-authors provided contributions. ZK prepared the manuscript with XL providing significant revisions. All co-authors contributed to the final manuscript revisions.
At least one of the (co-)authors is a member of the editorial board of Geoscientific Model Development. The peer-review process was guided by an independent editor, and the authors also have no other competing interests to declare.
Publisher's note: Copernicus Publications remains neutral with regard to jurisdictional claims made in the text, published maps, institutional affiliations, or any other geographical representation in this paper. While Copernicus Publications makes every effort to include appropriate place names, the final responsibility lies with the authors.
Any opinions, findings, and conclusions or recommendations expressed in this material are those of the author(s) and do not necessarily reflect the views of the National Science Foundation.
The authors are grateful to two anonymous reviewers for their constructive suggestions, which significantly improved the manuscript. This research was supported as part of the Energy Exascale Earth System Model (E3SM) project, funded by the US Department of Energy (DOE), Office of Science, Office of Biological and Environmental Research (BER). Lawrence Livermore National Laboratory (LLNL) is operated by Lawrence Livermore National Security, LLC, for the US DOE, National Nuclear Security Administration, under contract no. DEAC52-07NA27344. Publication release no. LLNL-JRNL-864575. Support was received from the LLNL LDRD project 22-ERD-008, “Multiscale Wildfire Simulation Framework and Remote Sensing”. The Pacific Northwest National Laboratory (PNNL) is operated for DOE by Battelle Memorial Institute under contract DE-AC05-76RLO1830. E3SM production simulations were performed on a high-performance computing cluster provided by the BER ESM program and operated by the Laboratory Computing Resource Center at Argonne National Laboratory. Developmental simulations were also performed using BER ESM program's Compy computing cluster located at Pacific Northwest National Laboratory. Additional developmental simulations, as well as post-processing and data archiving of production simulations, used resources of the National Energy Research Scientific Computing Center (NERSC), a DOE Office of Science User Facility supported by the Office of Science of the US Department of Energy under contract no. DE-AC02-05CH11231. This study was partially supported by the National Science Foundation under grant no. OIA-2148788. We thank Paul J. Durack and Jiwoo Lee from LLNL for helping with the manuscript discussion. E3SM version 2.0 has been used in this study.
This research was supported as part of the Energy Exascale Earth System Model (E3SM) project, funded by the US Department of Energy (DOE), Office of Science, Office of Biological and Environmental Research (BER). Support was received from the LLNL LDRD project 22-ERD-008, “Multiscale Wildfire Simulation Framework and Remote Sensing”. This material is based upon work supported in part by the National Science Foundation under grant no. OIA-2148788.
This paper was edited by Tatiana Egorova and reviewed by two anonymous referees.
Abdul-Razzak, H. and Ghan, S. J.: A parameterization of aerosol activation: 2. Multiple aerosol types. J. Geophys. Res.-Atmos., 105, 6837–6844, 2000.
Arfeuille, F., Weisenstein, D., Mack, H., Rozanov, E., Peter, T., and Brönnimann, S.: Volcanic forcing for climate modeling: a new microphysics-based data set covering years 1600–present, Clim. Past, 10, 359–375, https://doi.org/10.5194/cp-10-359-2014, 2014.
Bauer, S. E., Tsigaridis, K., Faluvegi, G., Kelley, M., Lo, K. K., Miller, R. L., Nazarenko, L., Schmidt, G. A., and Wu, J.: Historical (1850–2014) Aerosol Evolution and Role on Climate Forcing Using the GISS ModelE2.1 Contribution to CMIP6, J. Adv. Model. Earth Syst., 12, e2019MS001978, https://doi.org/10.1029/2019MS001978, 2020.
Brown, H. Y., Wagman, B., Bull, D., Peterson, K., Hillman, B., Liu, X., Ke, Z., and Lin, L.: Validating a microphysical prognostic stratospheric aerosol implementation in E3SMv2 using observations after the Mount Pinatubo eruption, Geosci. Model Dev., 17, 5087–5121, https://doi.org/10.5194/gmd-17-5087-2024, 2024.
Chen, Y., Haywood, J., Wang, Y., Malavelle, F., Jordan, G., Peace, A., Partridge, D. G., Cho, N., Oreopoulos, L., Grosvenor, D., Field, P., Allan, R. P., and Lohmann, U.: Substantial cooling effect from aerosol-induced increase in tropical marine cloud cover, Nat. Geosci., 17, 404–410, https://doi.org/10.1038/s41561-024-01427-z, 2024.
Chim, M. M., Aubry, T. J., Abraham, N. L., Marshall, L., Mulcahy, J., Walton, J., and Schmidt, A.: Climate Projections Very Likely Underestimate Future Volcanic Forcing and Its Climatic Effects, Geophys. Res. Lett., 50, e2023GL103743, https://doi.org/10.1029/2023GL103743, 2023.
Chylek, P., Folland, C., Klett, J. D., and Dubey, M. K.: CMIP5 Climate Models Overestimate Cooling by Volcanic Aerosols, Geophys. Res. Lett., 47, e2020GL087047, https://doi.org/10.1029/2020GL087047, 2020.
Danabasoglu, G., Lamarque, J. -F., Bacmeister, J., Bailey, D. A., DuVivier, A. K., Edwards, J., Emmons, L. K., Fasullo, J., Garcia, R., Gettelman, A., Hannay, C., Holland, M. M., Large, W. G., Lauritzen, P. H., Lawrence, D. M., Lenaerts, J. T. M., Lindsay, K., Lipscomb, W. H., Mills, M. J., Neale, R., Oleson, K. W., Otto-Bliesner, B., Phillips, A. S., Sacks, W., Tilmes, S., Kampenhout, L., Vertenstein, M., Bertini, A., Dennis, J., Deser, C., Fischer, C., Fox-Kemper, B., Kay, J. E., Kinnison, D., Kushner, P. J., Larson, V. E., Long, M. C., Mickelson, S., Moore, J. K., Nienhouse, E., Polvani, L., Rasch, P. J., and Strand, W. G.: The Community Earth System Model Version 2 (CESM2), J. Adv. Model. Earth Syst., 12, e2019MS001916, https://doi.org/10.1029/2019MS001916, 2020.
Dhomse, S. S., Emmerson, K. M., Mann, G. W., Bellouin, N., Carslaw, K. S., Chipperfield, M. P., Hommel, R., Abraham, N. L., Telford, P., Braesicke, P., Dalvi, M., Johnson, C. E., O'Connor, F., Morgenstern, O., Pyle, J. A., Deshler, T., Zawodny, J. M., and Thomason, L. W.: Aerosol microphysics simulations of the Mt. Pinatubo eruption with the UM-UKCA composition-climate model, Atmos. Chem. Phys., 14, 11221–11246, https://doi.org/10.5194/acp-14-11221-2014, 2014.
Dhomse, S. S., Mann, G. W., Antuña Marrero, J. C., Shallcross, S. E., Chipperfield, M. P., Carslaw, K. S., Marshall, L., Abraham, N. L., and Johnson, C. E.: Evaluating the simulated radiative forcings, aerosol properties, and stratospheric warmings from the 1963 Mt Agung, 1982 El Chichón, and 1991 Mt Pinatubo volcanic aerosol clouds, Atmos. Chem. Phys., 20, 13627–13654, https://doi.org/10.5194/acp-20-13627-2020, 2020.
E3SM Guide: E3SM Quick Start Guide, https://e3sm.org/model/running-e3sm/e3sm-quick-start (last access: 27 June 2025), 2025.
E3SM Project: Energy Exascale Earth System Model (E3SM), https://e3sm.org (last access: 27 June 2025), 2025.
ETHZ: input4MIPs.IACETH.aerosolProperties.CMIP, Version 2017, Earth System Grid Federation, https://doi.org/10.22033/ESGF/input4MIPs.10447, 2017.
Eyring, V., Bony, S., Meehl, G. A., Senior, C. A., Stevens, B., Stouffer, R. J., and Taylor, K. E.: Overview of the Coupled Model Intercomparison Project Phase 6 (CMIP6) experimental design and organization, Geosci. Model Dev., 9, 1937–1958, https://doi.org/10.5194/gmd-9-1937-2016, 2016.
Flynn, C. M. and Mauritsen, T.: On the climate sensitivity and historical warming evolution in recent coupled model ensembles, Atmos. Chem. Phys., 20, 7829–7842, https://doi.org/10.5194/acp-20-7829-2020, 2020.
Golaz, J., Van Roekel, L. P., Zheng, X., Roberts, A. F., Wolfe, J. D., Lin, W., Bradley, A. M., Tang, Q., Maltrud, M. E., Forsyth, R. M., Zhang, C., Zhou, T., Zhang, K., Zender, C. S., Wu, M., Wang, H., Turner, A. K., Singh, B., Richter, J. H., Qin, Y., Petersen, M. R., Mametjanov, A., Ma, P., Larson, V. E., Krishna, J., Keen, N. D., Jeffery, N., Hunke, E. C., Hannah, W. M., Guba, O., Griffin, B. M., Feng, Y., Engwirda, D., Di Vittorio, A. V., Dang, C., Conlon, L. M., Chen, C., Brunke, M. A., Bisht, G., Benedict, J. J., Asay-Davis, X. S., Zhang, Y., Zhang, M., Zeng, X., Xie, S., Wolfram, P. J., Vo, T., Veneziani, M., Tesfa, T. K., Sreepathi, S., Salinger, A. G., Reeves Eyre, J. E. J., Prather, M. J., Mahajan, S., Li, Q., Jones, P. W., Jacob, R. L., Huebler, G. W., Huang, X., Hillman, B. R., Harrop, B. E., Foucar, J. G., Fang, Y., Comeau, D. S., Caldwell, P. M., Bartoletti, T., Balaguru, K., Taylor, M. A., McCoy, R. B., Leung, L. R., and Bader, D. C.: The DOE E3SM Model Version 2: Overview of the Physical Model and Initial Model Evaluation, J. Adv. Model. Earth Syst., 14, e2022MS003156, https://doi.org/10.1029/2022MS003156, 2022.
Guo, H., Golaz, J.-C., Donner, L. J., Wyman, B., Zhao, M., and Ginoux, P.: CLUBB as a unified cloud parameterization: Opportunities and challenges, Geophys. Res. Lett., 42, 4540–4547, https://doi.org/10.1002/2015GL063672, 2015.
Hansen, J., Ruedy, R., Sato, M., and Lo, K.: Global surface temperature change, Rev. Geophys., 48, RG4004, https://doi.org/10.1029/2010RG000345, 2010.
Hegerl, G. C., Crowley, T. J., Baum, S. K., Kim, K.-Y., and Hyde, W. T.: Detection of volcanic, solar and greenhouse gas signals in paleo-reconstructions of Northern Hemispheric temperature, Geophys. Res. Lett., 30, 1242, https://doi.org/10.1029/2002GL016635, 2003.
Holtslag, A. a. M. and Boville, B. A.: Local Versus Nonlocal Boundary-Layer Diffusion in a Global Climate Model, J. Climate, 6, 1825–1842, https://doi.org/10.1175/1520-0442(1993)006<1825:LVNBLD>2.0.CO;2, 1993.
Ke, Z.: Enhancing Climate Model Performance through Improving Volcanic Aerosol Representation Dataset, Zenodo [data set], https://doi.org/10.5281/zenodo.11246313, 2024a.
Ke, Z.: Enhancing Climate Model Performance through Improving Volcanic Aerosol Representation Dataset and model source codes, Zenodo [code], https://doi.org/10.5281/zenodo.11403736, 2024b.
Ke, Z.: Enhancing Climate Model Performance through Improving Volcanic Aerosol Representation Dataset and model source codes, Zenodo [code], https://doi.org/10.5281/zenodo.11403988, 2024c.
Liu, X. and Penner, J. E.: Ice nucleation parameterization for global models, Meteorol. Z., 14, 499–514, https://doi.org/10.1127/0941-2948/2005/0059, 2005.
Liu, X., Easter, R. C., Ghan, S. J., Zaveri, R., Rasch, P., Shi, X., Lamarque, J.-F., Gettelman, A., Morrison, H., Vitt, F., Conley, A., Park, S., Neale, R., Hannay, C., Ekman, A. M. L., Hess, P., Mahowald, N., Collins, W., Iacono, M. J., Bretherton, C. S., Flanner, M. G., and Mitchell, D.: Toward a minimal representation of aerosols in climate models: description and evaluation in the Community Atmosphere Model CAM5, Geosci. Model Dev., 5, 709–739, https://doi.org/10.5194/gmd-5-709-2012, 2012.
Malavelle, F. F., Haywood, J. M., Jones, A., Gettelman, A., Clarisse, L., Bauduin, S., Allan, R. P., Karset, I. H. H., Kristjánsson, J. E., Oreopoulos, L., Cho, N., Lee, D., Bellouin, N., Boucher, O., Grosvenor, D. P., Carslaw, K. S., Dhomse, S., Mann, G. W., Schmidt, A., Coe, H., Hartley, M. E., Dalvi, M., Hill, A. A., Johnson, B. T., Johnson, C. E., Knight, J. R., O'Connor, F. M., Partridge, D. G., Stier, P., Myhre, G., Platnick, S., Stephens, G. L., Takahashi, H., and Thordarson, T.: Strong constraints on aerosol–cloud interactions from volcanic eruptions, Nature, 546, 485–491, https://doi.org/10.1038/nature22974, 2017.
Mills, M. J., Schmidt, A., Easter, R., Solomon, S., Kinnison, D. E., Ghan, S. J., Neely, R. R., Marsh, D. R., Conley, A., Bardeen, C. G., and Gettelman, A.: Global volcanic aerosol properties derived from emissions, 1990–2014, using CESM1(WACCM): volcanic aerosols derived from emissions, J. Geophys. Res.-Atmos., 121, 2332–2348, https://doi.org/10.1002/2015JD024290, 2016.
Mills, M. J., Richter, J. H., Tilmes, S., Kravitz, B., MacMartin, D. G., Glanville, A. A., Tribbia, J. J., Lamarque, J.-F., Vitt, F., Schmidt, A., Gettelman, A., Hannay, C., Bacmeister, J. T., and Kinnison, D. E.: Radiative and Chemical Response to Interactive Stratospheric Sulfate Aerosols in Fully Coupled CESM1 (WACCM), J. Geophys. Res.-Atmos., 122, 13061–13078, https://doi.org/10.1002/2017JD027006, 2017.
Morice, C. P., Kennedy, J. J., Rayner, N. A., Winn, J. P., Hogan, E., Killick, R. E., Dunn, R. J. H., Osborn, T. J., Jones, P. D., and Simpson, I. R.: An updated assessment of near‐surface temperature change from 1850: The HadCRUT5 data set, J. Geophys. Res.-Atmos., 126, e2019JD032361, https://doi.org/10.1029/2019JD032361, 2021.
Morrison, H. and Gettelman, A.: A New Two-Moment Bulk Stratiform Cloud Microphysics Scheme in the Community Atmosphere Model, Version 3 (CAM3). Part I: Description and Numerical Tests, J. Climate, 21, 3642–3659, https://doi.org/10.1175/2008JCLI2105.1, 2008.
Neely III, R. R. and Schmidt, A.: VolcanEESM: Global volcanic sulphur dioxide (SO2) emissions database from 1850 to present, Centre for Environmental Data Analysis [data set] https://doi.org/10.5285/76ebdc0b-0eed-4f70-b89e-55e606bcd568, 2016.
Niemeier, U., Timmreck, C., and Krüger, K.: Revisiting the Agung 1963 volcanic forcing – impact of one or two eruptions, Atmos. Chem. Phys., 19, 10379–10390, https://doi.org/10.5194/acp-19-10379-2019, 2019.
Raible, C. C., Brönnimann, S., Auchmann, R., Brohan, P., Frölicher, T. L., Graf, H.-F., Jones, P., Luterbacher, J., Muthers, S., Neukom, R., Robock, A., Self, S., Sudrajat, A., Timmreck, C., and Wegmann, M.: Tambora 1815 as a test case for high impact volcanic eruptions: Earth system effects, WIREs Clim. Change, 7, 569–589, https://doi.org/10.1002/wcc.407, 2016.
Ramachandran, S., Ramaswamy, V., Stenchikov, G. L., and Robock, A.: Radiative impact of the Mount Pinatubo volcanic eruption: Lower stratospheric response, J. Geophys. Res.-Atmos., 105, 24409–24429, https://doi.org/10.1029/2000JD900355, 2000.
Rieger, L. A., Cole, J. N. S., Fyfe, J. C., Po-Chedley, S., Cameron-Smith, P. J., Durack, P. J., Gillett, N. P., and Tang, Q.: Quantifying CanESM5 and EAMv1 sensitivities to Mt. Pinatubo volcanic forcing for the CMIP6 historical experiment, Geosci. Model Dev., 13, 4831–4843, https://doi.org/10.5194/gmd-13-4831-2020, 2020.
Schmidt, A., Carslaw, K. S., Mann, G. W., Rap, A., Pringle, K. J., Spracklen, D. V., Wilson, M., and Forster, P. M.: Importance of tropospheric volcanic aerosol for indirect radiative forcing of climate, Atmos. Chem. Phys., 12, 7321–7339, https://doi.org/10.5194/acp-12-7321-2012, 2012.
Schmidt, A., Mills, M. J., Ghan, S., Gregory, J. M., Allan, R. P., Andrews, T., Bardeen, C. G., Conley, A., Forster, P. M., Gettelman, A., Portmann, R. W., Solomon, S., and Toon, O. B.: Volcanic Radiative Forcing From 1979 to 2015, J. Geophys. Res.-Atmos., 123, 12491–12508, https://doi.org/10.1029/2018JD028776, 2018.
Shan, Y., Liu, X., Lin, L., Ke, Z., and Lu, Z.: An improved representation of aerosol wet removal by deep convection and impacts on simulated aerosol vertical profiles, J. Geophys. Res.-Atmos., 126, e2020JD034173, https://doi.org/10.1029/2020JD034173, 2021.
Shan, Y., Fan, J., Zhang, K., Shpund, J., Terai, C., Zhang, G. J., Song, X., Chen, C.-C.-J., Lin, W., Liu, X., Shrivastava, M., Wang, H., and Xie, S.: Improving Aerosol Radiative Forcing and Climate in E3SM: Impacts of New Cloud Microphysics and Improved Wet Removal Treatments, J. Adv. Model. Earth Syst., 16, e2023MS004059, https://doi.org/10.1029/2023MS004059, 2024.
Smith, K. L., Neely, R. R., Marsh, D. R., and Polvani, L. M.: The Specified Chemistry Whole Atmosphere Community Climate Model (SC-WACCM), J. Adv. Model. Earth Syst., 6, 883–901, https://doi.org/10.1002/2014MS000346, 2014.
Tang, Q., Prather, M. J., Hsu, J., Ruiz, D. J., Cameron-Smith, P. J., Xie, S., and Golaz, J.-C.: Evaluation of the interactive stratospheric ozone (O3v2) module in the E3SM version 1 Earth system model, Geosci. Model Dev., 14, 1219–1236, https://doi.org/10.5194/gmd-14-1219-2021, 2021.
Tang, Q., Prather, M. J., Ke, Z., Xie, J., Lee, H. H., Wu, M., Cameron-Smith, P. J., Wang, H., Lin, W., and Xie, S.: Interactive atmospheric chemistry for enhanced science capabilities of the Energy Exascale Earth System Model version 3, J. Adv. Model. Earth Syst., in review, 2025.
Thomason, L. W., Ernest, N., Millán, L., Rieger, L., Bourassa, A., Vernier, J.-P., Manney, G., Luo, B., Arfeuille, F., and Peter, T.: A global space-based stratospheric aerosol climatology: 1979–2016, Earth Syst. Sci. Data, 10, 469–492, https://doi.org/10.5194/essd-10-469-2018, 2018.
Timmreck, C., Graf, H.-F., Lorenz, S. J., Niemeier, U., Zanchettin, D., Matei, D., Jungclaus, J. H., and Crowley, T. J.: Aerosol size confines climate response to volcanic super-eruptions, Geophys. Res. Lett., 37, L24705, https://doi.org/10.1029/2010GL045464, 2010.
Vignesh, P. P., Jiang, J. H., Kishore, P., Su, H., Smay, T., Brighton, N., and Velicogna, I.: Assessment of CMIP6 Cloud Fraction and Comparison with Satellite Observations, Earth Space Sci., 7, e2019EA000975, https://doi.org/10.1029/2019EA000975, 2020.
Visioni, D., Pitari, G., Aquila, V., Tilmes, S., Cionni, I., Di Genova, G., and Mancini, E.: Sulfate geoengineering impact on methane transport and lifetime: results from the Geoengineering Model Intercomparison Project (GeoMIP), Atmos. Chem. Phys., 17, 11209–11226, https://doi.org/10.5194/acp-17-11209-2017, 2017.
Wang, H., Wu, M., Liu, X., Yang, K., Shi, Y., Darmenov, A., Yu, H., Wang, Z., Luo, T., and Feng, Y.: Evaluation of dust emission and transport simulated by global climate models with satellite observations from CALIOP, MODIS, and MISR, in: AGU Fall Meeting Abstracts, December 2019, A31R-2752, 2019.
Wang, Y., Liu, X., Hoose, C., and Wang, B.: Different contact angle distributions for heterogeneous ice nucleation in the Community Atmospheric Model version 5, Atmos. Chem. Phys., 14, 10411–10430, https://doi.org/10.5194/acp-14-10411-2014, 2014.
Wang, Y.-C., Xie, S., Tang, S., and Lin, W.: Evaluation of an Improved Convective Triggering Function: Observational Evidence and SCM Tests, J. Geophys. Res.-Atmos., 125, e2019JD031651, https://doi.org/10.1029/2019JD031651, 2020.
Zanchettin, D., Khodri, M., Timmreck, C., Toohey, M., Schmidt, A., Gerber, E. P., Hegerl, G., Robock, A., Pausata, F. S. R., Ball, W. T., Bauer, S. E., Bekki, S., Dhomse, S. S., LeGrande, A. N., Mann, G. W., Marshall, L., Mills, M., Marchand, M., Niemeier, U., Poulain, V., Rozanov, E., Rubino, A., Stenke, A., Tsigaridis, K., and Tummon, F.: The Model Intercomparison Project on the climatic response toVolcanic forcing (VolMIP): experimental design and forcing input data for CMIP6, Geosci. Model Dev., 9, 2701–2719, https://doi.org/10.5194/gmd-9-2701-2016, 2016.
Zhang, G. J. and McFarlane, N. A.: Sensitivity of climate simulations to the parameterization of cumulus convection in the Canadian climate centre general circulation model, Atmos.-Ocean, 33, 407–446, https://doi.org/10.1080/07055900.1995.9649539, 1995.
Zhang, J., Furtado, K., Turnock, S. T., Mulcahy, J. P., Wilcox, L. J., Booth, B. B., Sexton, D., Wu, T., Zhang, F., and Liu, Q.: The role of anthropogenic aerosols in the anomalous cooling from 1960 to 1990 in the CMIP6 Earth system models, Atmos. Chem. Phys., 21, 18609–18627, https://doi.org/10.5194/acp-21-18609-2021, 2021.
Zhang, K., Zhang, W., Wan, H., Rasch, P. J., Ghan, S. J., Easter, R. C., Shi, X., Wang, Y., Wang, H., Ma, P.-L., Zhang, S., Sun, J., Burrows, S. M., Shrivastava, M., Singh, B., Qian, Y., Liu, X., Golaz, J.-C., Tang, Q., Zheng, X., Xie, S., Lin, W., Feng, Y., Wang, M., Yoon, J.-H., and Leung, L. R.: Effective radiative forcing of anthropogenic aerosols in E3SM version 1: historical changes, causality, decomposition, and parameterization sensitivities, Atmos. Chem. Phys., 22, 9129–9160, https://doi.org/10.5194/acp-22-9129-2022, 2022.