the Creative Commons Attribution 4.0 License.
the Creative Commons Attribution 4.0 License.
 | 19 Jun 2025
A novel method for quantifying the contribution of regional transport to PM2.5 in Beijing (2013–2020): combining machine learning with concentration-weighted trajectory analysis
Hong Liao
Dantong Liu
Jianbing Jin
Lei Chen
Siyuan Li
Yangzhou Wu
Changhao Wu
Shitong Zhao
Xiaotong Jiang
Ping Tian
Kai Bi
Ye Wang
Delong Zhao
Fine particulate matter (PM2.5) is closely linked to human health, with its sources generally divided into local emissions and regional transport. This study combined concentration-weighted trajectory (CWT) analysis with the HYSPLIT trajectory ensemble to obtain hourly resolution pollutant source results. The Extreme Gradient Boosting (XGBoost) model was then employed to simulate local emissions and ambient PM2.5 in Beijing from 2013 to 2020. The results revealed that clean air masses influencing the Beijing area mainly originated from the north and east regions, exhibiting a strong winter and weak summer pattern. Following the implementation of the Air Pollution Prevention and Control Action Plan (Action Plan) by the Chinese government in 2017, pollution in Beijing decreased significantly, with the most substantial reduction in regional transport pollution events occurring in the west region during summer. Regional transport pollution events were most frequent in spring, up to 1.8 times higher than in winter. Pollutants mainly originated from the west and south regions, while polluted air masses from the east showed the least reduction, and the proportion of pollution sources from this region was gradually increasing. The COVID-19 restrictions might have reduced PM2.5 concentrations in 2020. From 2013 to 2020, local emissions were the main contributors to pollution events in Beijing. The Action Plan has more effectively reduced pollution caused by regional transport, particularly during autumn and winter. This finding underscores the importance of Beijing prioritizing local emission reduction while also considering potential contributions from the east region to effectively mitigate pollution events.
- Article
(4281 KB) - Full-text XML
-
Supplement
(1173 KB) - BibTeX
- EndNote


Ambient fine particulate matter (PM2.5, with particle aerodynamic diameter ≤2.5 µm) is influenced by both natural sources, such as dust, volcanic eruptions, tsunamis, and forest fires, and anthropogenic emissions, including fuel combustion, transportation, and industrial production. Anthropogenic emissions dominate the long-term trend of air pollution (Zhang et al., 2019; Cheng et al., 2019). Numerous epidemiological studies have found that PM2.5 can significantly damage human health by exacerbating respiratory and cardiovascular diseases (Bartell et al., 2013; Brauer et al., 2012; Pascal et al., 2014) and also has an impact on weather and climate change (Wang et al., 2014; Smith et al., 2020; Kalisoras et al., 2024). China's rapid and energy-intensive development over the past several decades has led to severe air pollution and negative public health impacts (Huang et al., 2014; Geng et al., 2021). Consequently, controlling pollution and reducing PM2.5 concentrations have become urgent issues in China. While meteorological variations caused about 16 % of the ambient PM2.5 decline during 2013–2017 (Zhang et al., 2019), the uncertainty in reducing PM2.5 through meteorological conditions is substantial, and the magnitude of the decrease is not dominated by human actions. Thus, the primary means of controlling PM2.5 relies on reducing anthropogenic emissions. To address this issue, the Chinese government implemented the Air Pollution Prevention and Control Action Plan (denoted “Action Plan”) from 2013 to 2017 and the Blue-Sky Protection Campaign from 2018 to 2020, which effectively controlled anthropogenic emissions and reduced ambient PM2.5 concentrations (Zhang et al., 2019; Du et al., 2022).
The concentration of PM2.5 can be attributed to local emissions and regional transport. Several methods, such as the HYSPLIT model (Draxler and Rolph, 2010), can be used to distinguish pollutant sources. Wu et al. (2021) used the HYSPLIT model to simulate the 24 h backward trajectory in Zhoushan and identified continental air masses that spent more than 5 % of the previous 24 h over the continent region, while the remaining air masses were identified as oceanic-influenced air masses. Ding et al. (2019) employed a backward trajectory ensemble to analyze the sources of air masses in Beijing during the study period, finding that air masses with high concentrations of black carbon (BC) mass mainly came from the south and southeast regions. Cluster analysis on backward trajectories can be used to obtain the main direction of aerosols over a period of time, allowing for the analysis and determination of dominant air mass directions. For instance, Li et al. (2022) divided the sources of air masses in the Wuhan area from October to November 2019 into short transport distance, northbound air masses, and regional transport from the northeast and some coastal areas.
The HYSPLIT model results are mainly used to view air mass trajectories, making it difficult to directly determine the sources of pollutants. Potential source contribution function (PSCF) and concentration-weighted trajectory (CWT) analyses based on backward trajectories can be used to identify the sources of pollutants through conditional probability results. Hu et al. (2020) used weighted PSCF to analyze the sources of air masses with different levels of pollution in Beijing and found that polluted air masses from the southwest were an important source of high-level advection during the study period, while light pollution was often accompanied by the regional transport originating from the northeast region. Wu et al. (2025) used CWT to analyze the sources of pollution in Zhoushan and found that pollutants in Zhoushan are influenced by both local emissions and regional transport. There are no obvious high pollution areas, while in other seasons, PM2.5 mainly originates from southern Jiangsu and Shanghai. However, these studies relied on standard HYSPLIT trajectory results, which have lower temporal resolution, limiting the accuracy of pollutant source identification.
The Lagrangian air pollution dispersion model, Numerical Atmospheric-dispersion Modelling Environment (NAME) (Jones et al., 2007), can determine the source of polluted air masses by simulating particulate concentrations within each grid point using Monte Carlo methods, followed by 3-D trajectories of plume basins. Liu et al. (2020) used the NAME model to study the sources of air masses in Beijing during the winter of 2019 and divided them into local emissions and regional transport to analyze the convective mixing process of BC under the influence of local emissions. However, due to limitations in computing resources, the NAME model is difficult to use for obtaining long-term emission source analysis results.
Multiple methods can be used to predict PM2.5 concentrations, such as statistical models (e.g., linear mixed-effect models and generalized additive models) (Fang et al., 2016; Ma et al., 2016); chemical transport model (CTM)-based algorithms (Geng et al., 2015; Kong et al., 2021); physical models (Lin et al., 2018); and recently emerging machine learning models, including Extreme Gradient Boosting (XGBoost) and random forest (Liang et al., 2020; Wei et al., 2021; Xiao et al., 2018; Xue et al., 2019; Huang et al., 2021). Geng et al. (2021) used satellite observations of aerosol optical depth (AOD) and meteorological data combined with the XGBoost model to explore the long-term variations of PM2.5 caused by changes in meteorological conditions from 2000 to 2018. Kleine Deters et al. (2017) demonstrated the relevance of statistical models based on machine learning for predicting PM2.5 concentrations from meteorological data. This method of predicting aerosol concentrations using only meteorological data has been widely used (Asadollahfardi et al., 2016; Zeng et al., 2021). For instance, Grange et al. (2018) used meteorological data, synoptic-scale weather patterns, and time variables to explain daily PM10 concentrations in Switzerland. In summary, machine learning models have achieved high accuracy in estimating and predicting PM2.5 concentrations and have high use value, and the rise of machine learning methods has also provided feasibility for quantifying the contribution of regionally transported air masses.
In this study, we combined CWT analysis with the HYSPLIT trajectory ensemble to obtain hourly resolution PM2.5 source results and used this approach to distinguish between local emissions and regional transport. This approach addresses the limitations of CWT methods combined with standard HYSPLIT trajectory results, which are unable to achieve hourly time resolution, and models such as NAME, which require significant computational resources. Predictive XGBoost models were developed for Beijing using meteorological data and time variables to explain PM2.5 concentrations. By training the XGBoost model with PM2.5 dominated by local emissions, which are separately distinguished by CWT, and generalizing the findings to all study periods, the concentration of locally emitted PM2.5 (local) can be obtained. Similarly, ambient observed PM2.5 (ambient) can be determined by training the XGBoost model with ambient PM2.5 data. The contribution of regional transport to PM2.5 in Beijing can be quantified by comparing the ambient and local PM2.5 concentrations.
2.1 Site and instrumentation
The PM2.5 data (Fig. 1a) were obtained from in situ air quality monitoring conducted by the China National Environmental Monitoring Center from 2013 to 2020. The monitoring station is located in Haidian Wanliu (39.96° N, 116.29° E), situated in the central urban area of Beijing. Meteorological data, including temperature, relative humidity, pressure, precipitation, wind speed, and planetary boundary layer height (PBLH), were sourced from the European Centre for Medium-Range Weather Forecasts (ECMWF) ERA5 hourly reanalysis dataset (https://cds.climate.copernicus.eu/datasets, last access: 13 June 2025). In this study, a year was divided into four quarters: spring (March, April, and May), summer (June, July, and August), autumn (September, October, and November), and winter (December, January, and February).
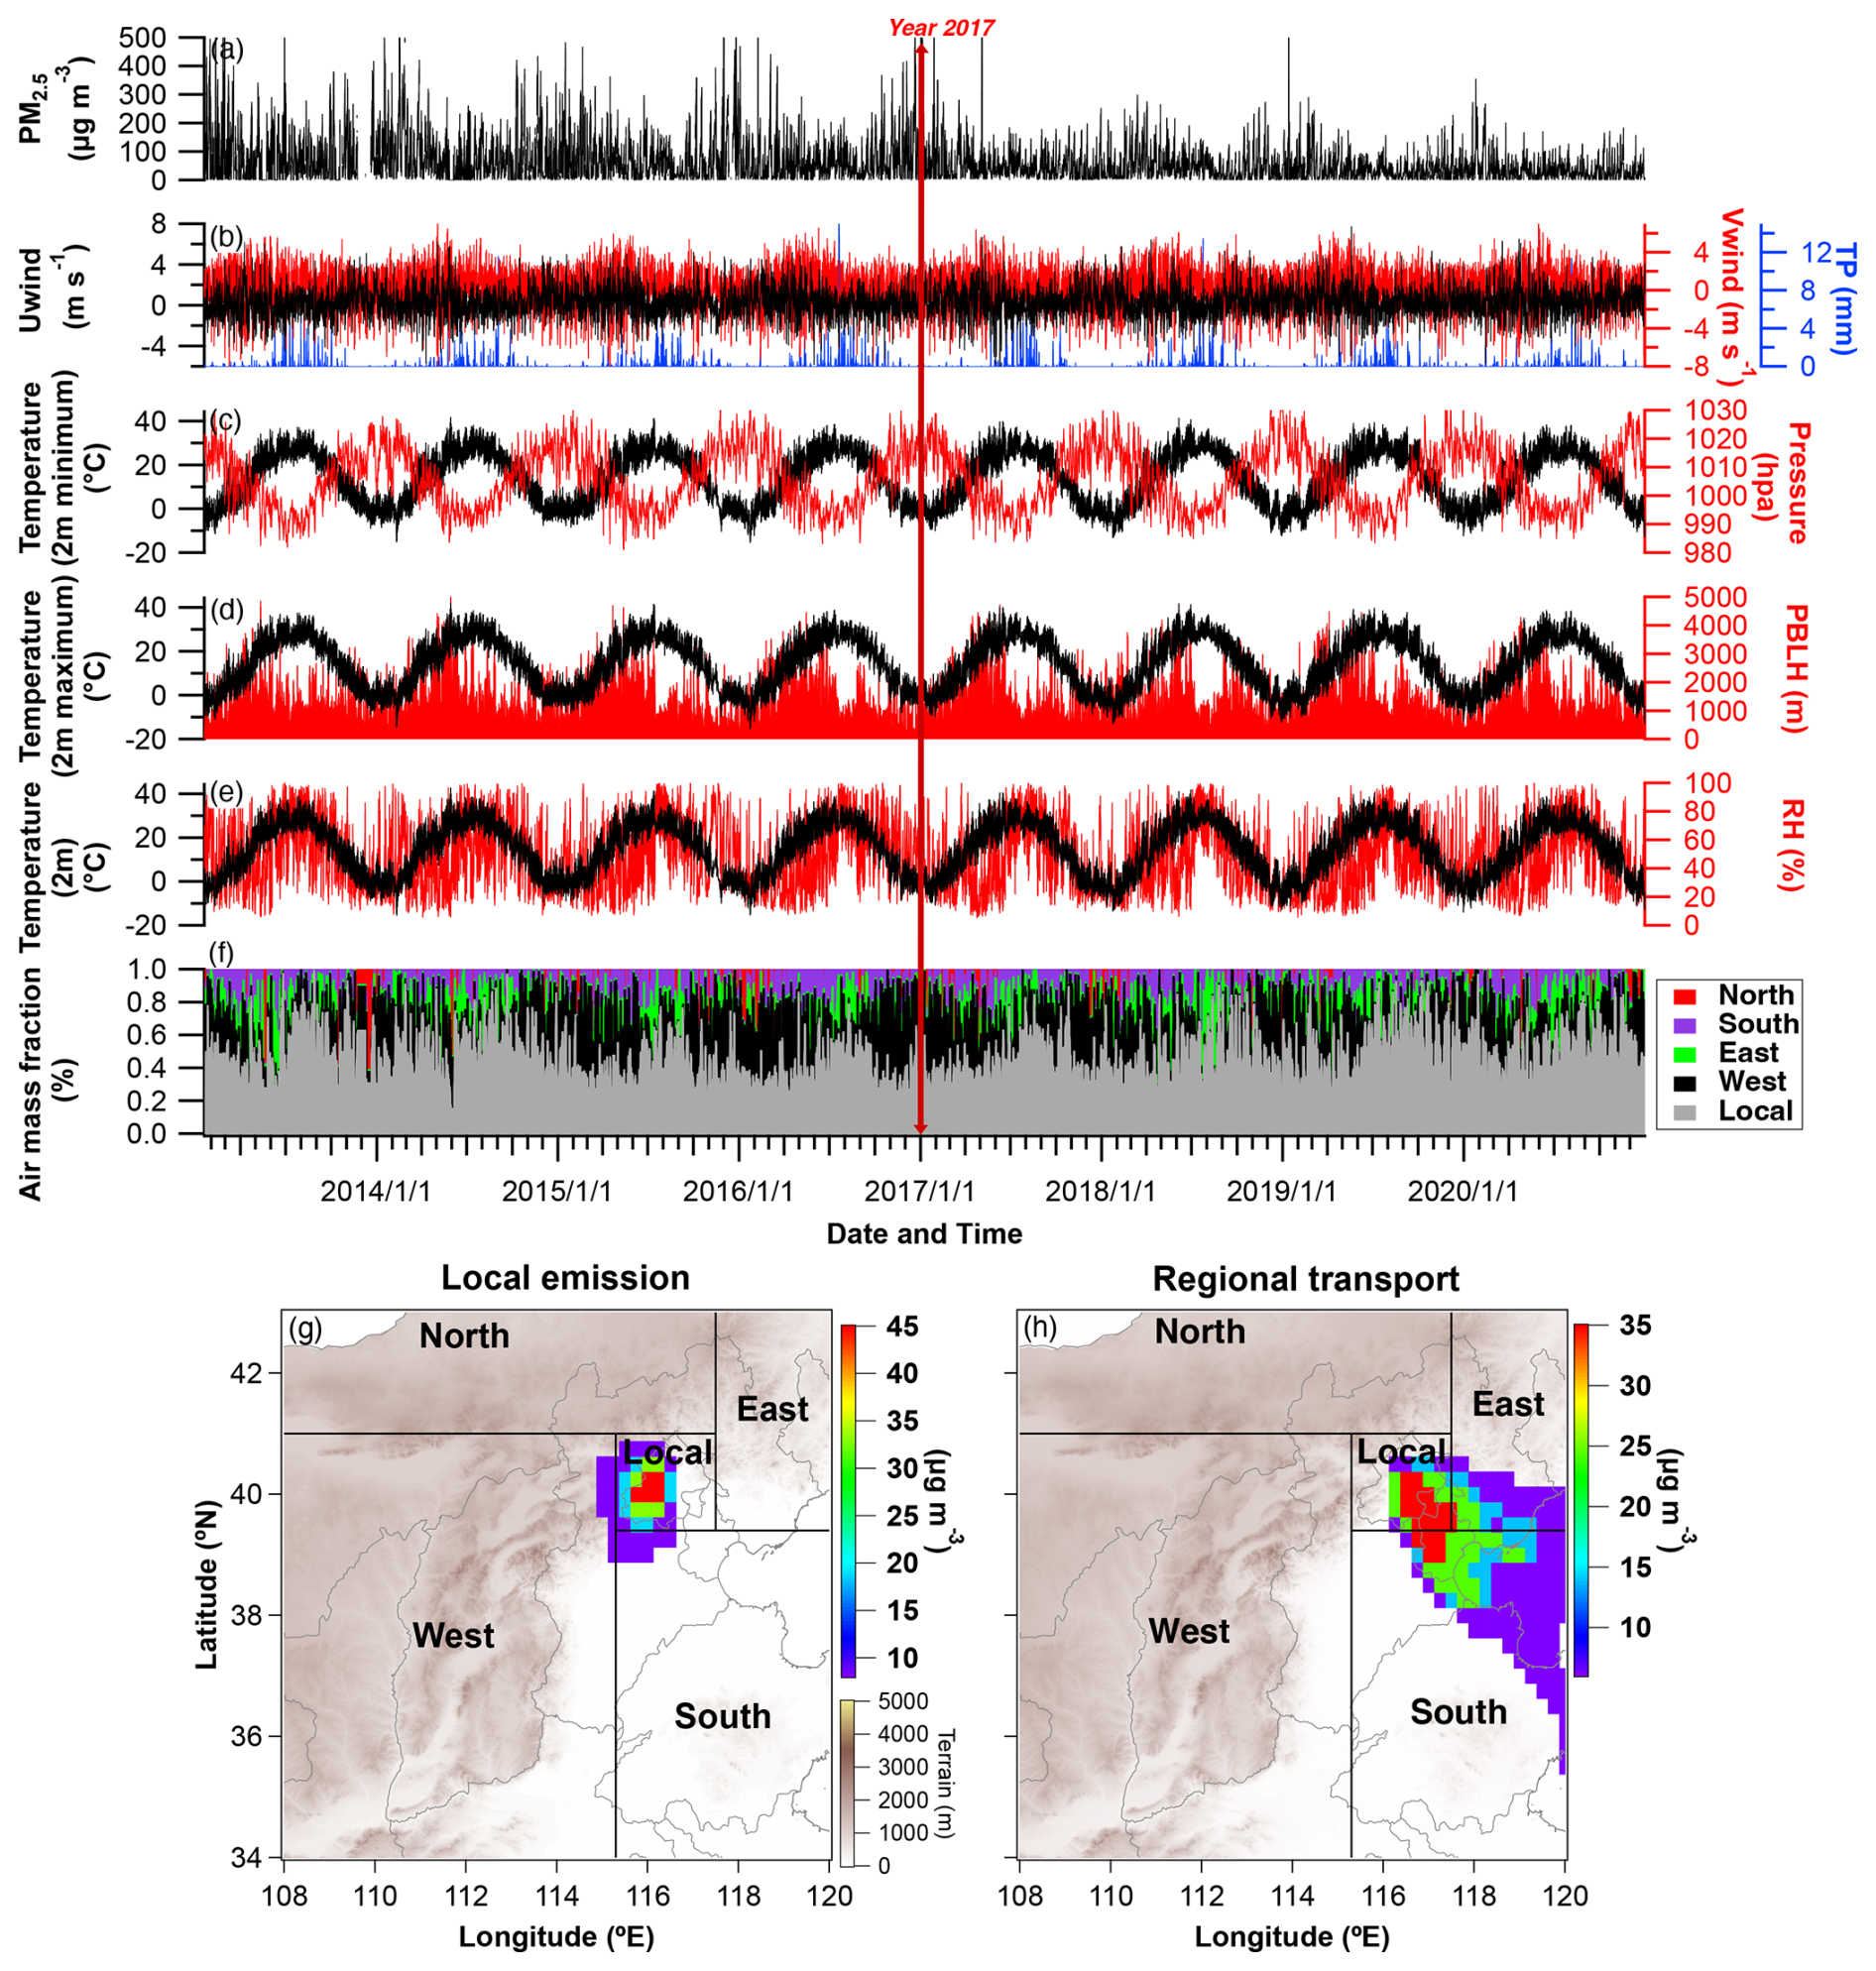
Figure 1Temporal evolution of parameters used in the XGBoost model: (a) PM2.5; (b) U-wind, V-wind, and total precipitation; (c) 2 m minimum temperature and surface pressure; (d) 2 m maximum temperature and planetary boundary layer height; (e) 2 m temperature and relative humidity; (f) air mass fraction in contributing sources derived from the concentration-weighted trajectory (CWT) model for a 1 d backward trajectory. The red vertical line with arrows indicates the implementation of environmental regulations. Typical examples of the CWT model analysis are shown for (g) a local emission period (25 August 2013) and (h) a regional transport period (15 July 2013).
2.2 Air mass source
The air mass trajectory data were obtained from the 1°×1° horizontal and vertical wind fields of the Global Data Assimilation System (GDAS) reanalysis products (ftp://arlftp.arlhq.noaa.gov/pub/archives/gdas1, last access: 13 June 2025), which are available every 3 h. The HYSPLIT trajectory ensemble was used to generate 27 equally probable 24 h backward air mass trajectories for the target point (39.96° N, 116.29° E; 250 m a.s.l.) in every hour using PySplit (Cross, 2015). Given the equal probability of air masses being transported to the target point for each trajectory in the HYSPLIT trajectory ensemble, a conditional probability CWT analysis was applied to determine the hourly source area of pollution.
In the CWT analysis method, each grid point is assigned a weight, and the contribution of each grid point to the pollutant concentration at the target site is calculated using the air mass residence time and pollutant concentration (Hopke et al., 1993; Polissar et al., 1999; Xu and Akhtar, 2010) (Eq. 1). The grid point resolution was set to 0.25°×0.25° for this study. In Eq. (1), Cij is the average weighted concentration at grid point (i,j), l is the trajectory index, M represents the total number of trajectories, Cl is the PM2.5 concentration corresponding to the target site, and τijl is the residence time of trajectory l passing through the grid point. In calculation, the number of trajectories falling on each grid point is used instead of the residence time.
To reduce the effect of small values of nij, the CWT values were multiplied by an arbitrary weight function W(ni,j) to better reflect the uncertainty in the values for these grids (Eq. 2).
where nij represents the number of trajectories that fall within the grid point, and nave represents the average number of trajectories passing through each grid point.
The potential source contribution to PM2.5 at the target site was investigated by categorizing the backward air masses into five different source regions centered around Beijing: local (which is a region around central Beijing, 39.4–41° N, 115.3–117.5° E), north region (the northern plateau at 41–43° N, 108–117.5° E), west region (the western plateau at 34–41° N, 108–115.3° E), south region (the southern plain at 34–39.4° N, 115.3–120° E), and east region (the eastern plain at 39.4–43° N, 117.5–120° E). The concentration is integrated over each grid point in each segregated region obtained from the CWT analysis, and the contributions of each air mass fraction are obtained. The region with the highest contribution is used to determine the dominant source of air masses in Beijing at each time, classifying the overall air mass sources into local emissions (Fig. 1g) and regional transport (Fig. 1h). It is important to note that local emission periods were also influenced by persistent regional transport, and vice versa.
2.3 Deriving the long-term local emission and ambient PM2.5
An XGBoost model is employed to derive the local and ambient PM2.5 results. The hyperparameters used in the model for local (ambient) conditions include a maximum number of boosting iterations of 6067 (13 421), a learning rate of 0.1, a maximum tree depth of 7 (11), a minimum sum of instance weight needed in a child of 5 (3), a subsampling ratio of 0.8 (0.6) for training instances, and a subsampling ratio of 0.8 for columns when constructing each tree. The input parameters for the XGBoost model comprise meteorological variables (temperature, relative humidity, wind speed, surface pressure, and precipitation) and temporal parameters (year, month, day of the week, and day of the year), as referenced from Xu et al. (2023). Additionally, PBLH, which has been shown to significantly impact pollutant concentrations in previous observational (Su et al., 2018; Miao and Liu, 2019; Miao et al., 2019) and machine learning studies (Xiao et al., 2021; Li et al., 2017b; Shen et al., 2018), was included as an input parameter. Based on the XGBoost learning results, the most sensitive parameters for both local and ambient PM2.5 are RH, wind field, surface pressure, and PBLH (Fig. S1 in the Supplement). For the machine learning process, data from 2013 to 2019 were used for training the XGBoost models, while the 8613 data points measured from 1 January to 31 December 2020 were used for model testing (Fig. S2). Note that the 2020 analysis results may contain some uncertainties due to the impact of COVID-19.
The relatively small proportion of high-concentration PM2.5 can lead to underestimation of high-concentration events in the model results (Wei et al., 2020). To address this issue, a high PM2.5 indicator was defined as a daily average PM2.5 concentration exceeding the monthly average plus twice the standard deviation. In this study, original high PM2.5 indicators accounted for 6 % of the data points during the period dominated by local and ambient PM2.5. To balance the proportion of high-concentration PM2.5 in the entire database, the Synthetic Minority Over-sampling Technique (SMOTE) (Torgo, 2011) was applied during data preprocessing. SMOTE artificially generates new synthetic samples along the line between high-concentration data points and their selected nearest neighbors, effectively oversampling the high-concentration data. As a result, the proportion of high PM2.5 indicators increased to 21 % and 22 % for local and ambient PM2.5, respectively.
Hyperparameter optimization and performance evaluation of the model were conducted using 5-fold cross-validation (CV), while early stopping with a patience of 10 rounds was employed to prevent overfitting (Akritidis et al., 2021; Zhang et al., 2020). In this approach, 20 % of the data is randomly selected for model validation, while the remaining 80 % is used for training. This process is repeated five times, ensuring that each record is used once as validation data. The coefficient of determination (r2) was employed to assess the correlation between the XGBoost model predictions and observed values, while the root mean square error (RMSE) was used as a performance evaluation statistic. After obtaining the relation between the input parameters and PM2.5, we are able to derive the hourly local and ambient PM2.5 once all long-term parameters are input (Fig. S4).
3.1 Evaluation of the XGBoost PM2.5 prediction model
During the model testing process, the XGBoost model results for ambient PM2.5 (Fig. 2a2) demonstrated an r2 of 0.74 and an RMSE of 20 µg m−3 when compared to observations. The XGBoost model results for local PM2.5 exhibited an r2 of 0.78 and an RMSE of 21 µg m−3. An analysis of the PM2.5 frequency distribution in Beijing revealed an agreement between the XGBoost model results and observations for both ambient and local PM2.5. The error between XGBoost learning results and actual observed PM2.5 values is mainly concentrated in the low concentration stage. This may be attributed to the significant reduction in anthropogenic activities during the COVID-19 lockdown periods, which led to a decrease in actual PM2.5 levels, making it challenging for XGBoost to learn (Fig. 2b1 and b2). As illustrated in Fig. S3, local and ambient PM2.5 in Beijing display a distinct seasonal variation, with higher values in winter and lower values in summer. However, the transport of clean air masses from the north diminishes the seasonal variation characteristics of ambient PM2.5 in Beijing, making winter pollution less prominent compared to other seasons.
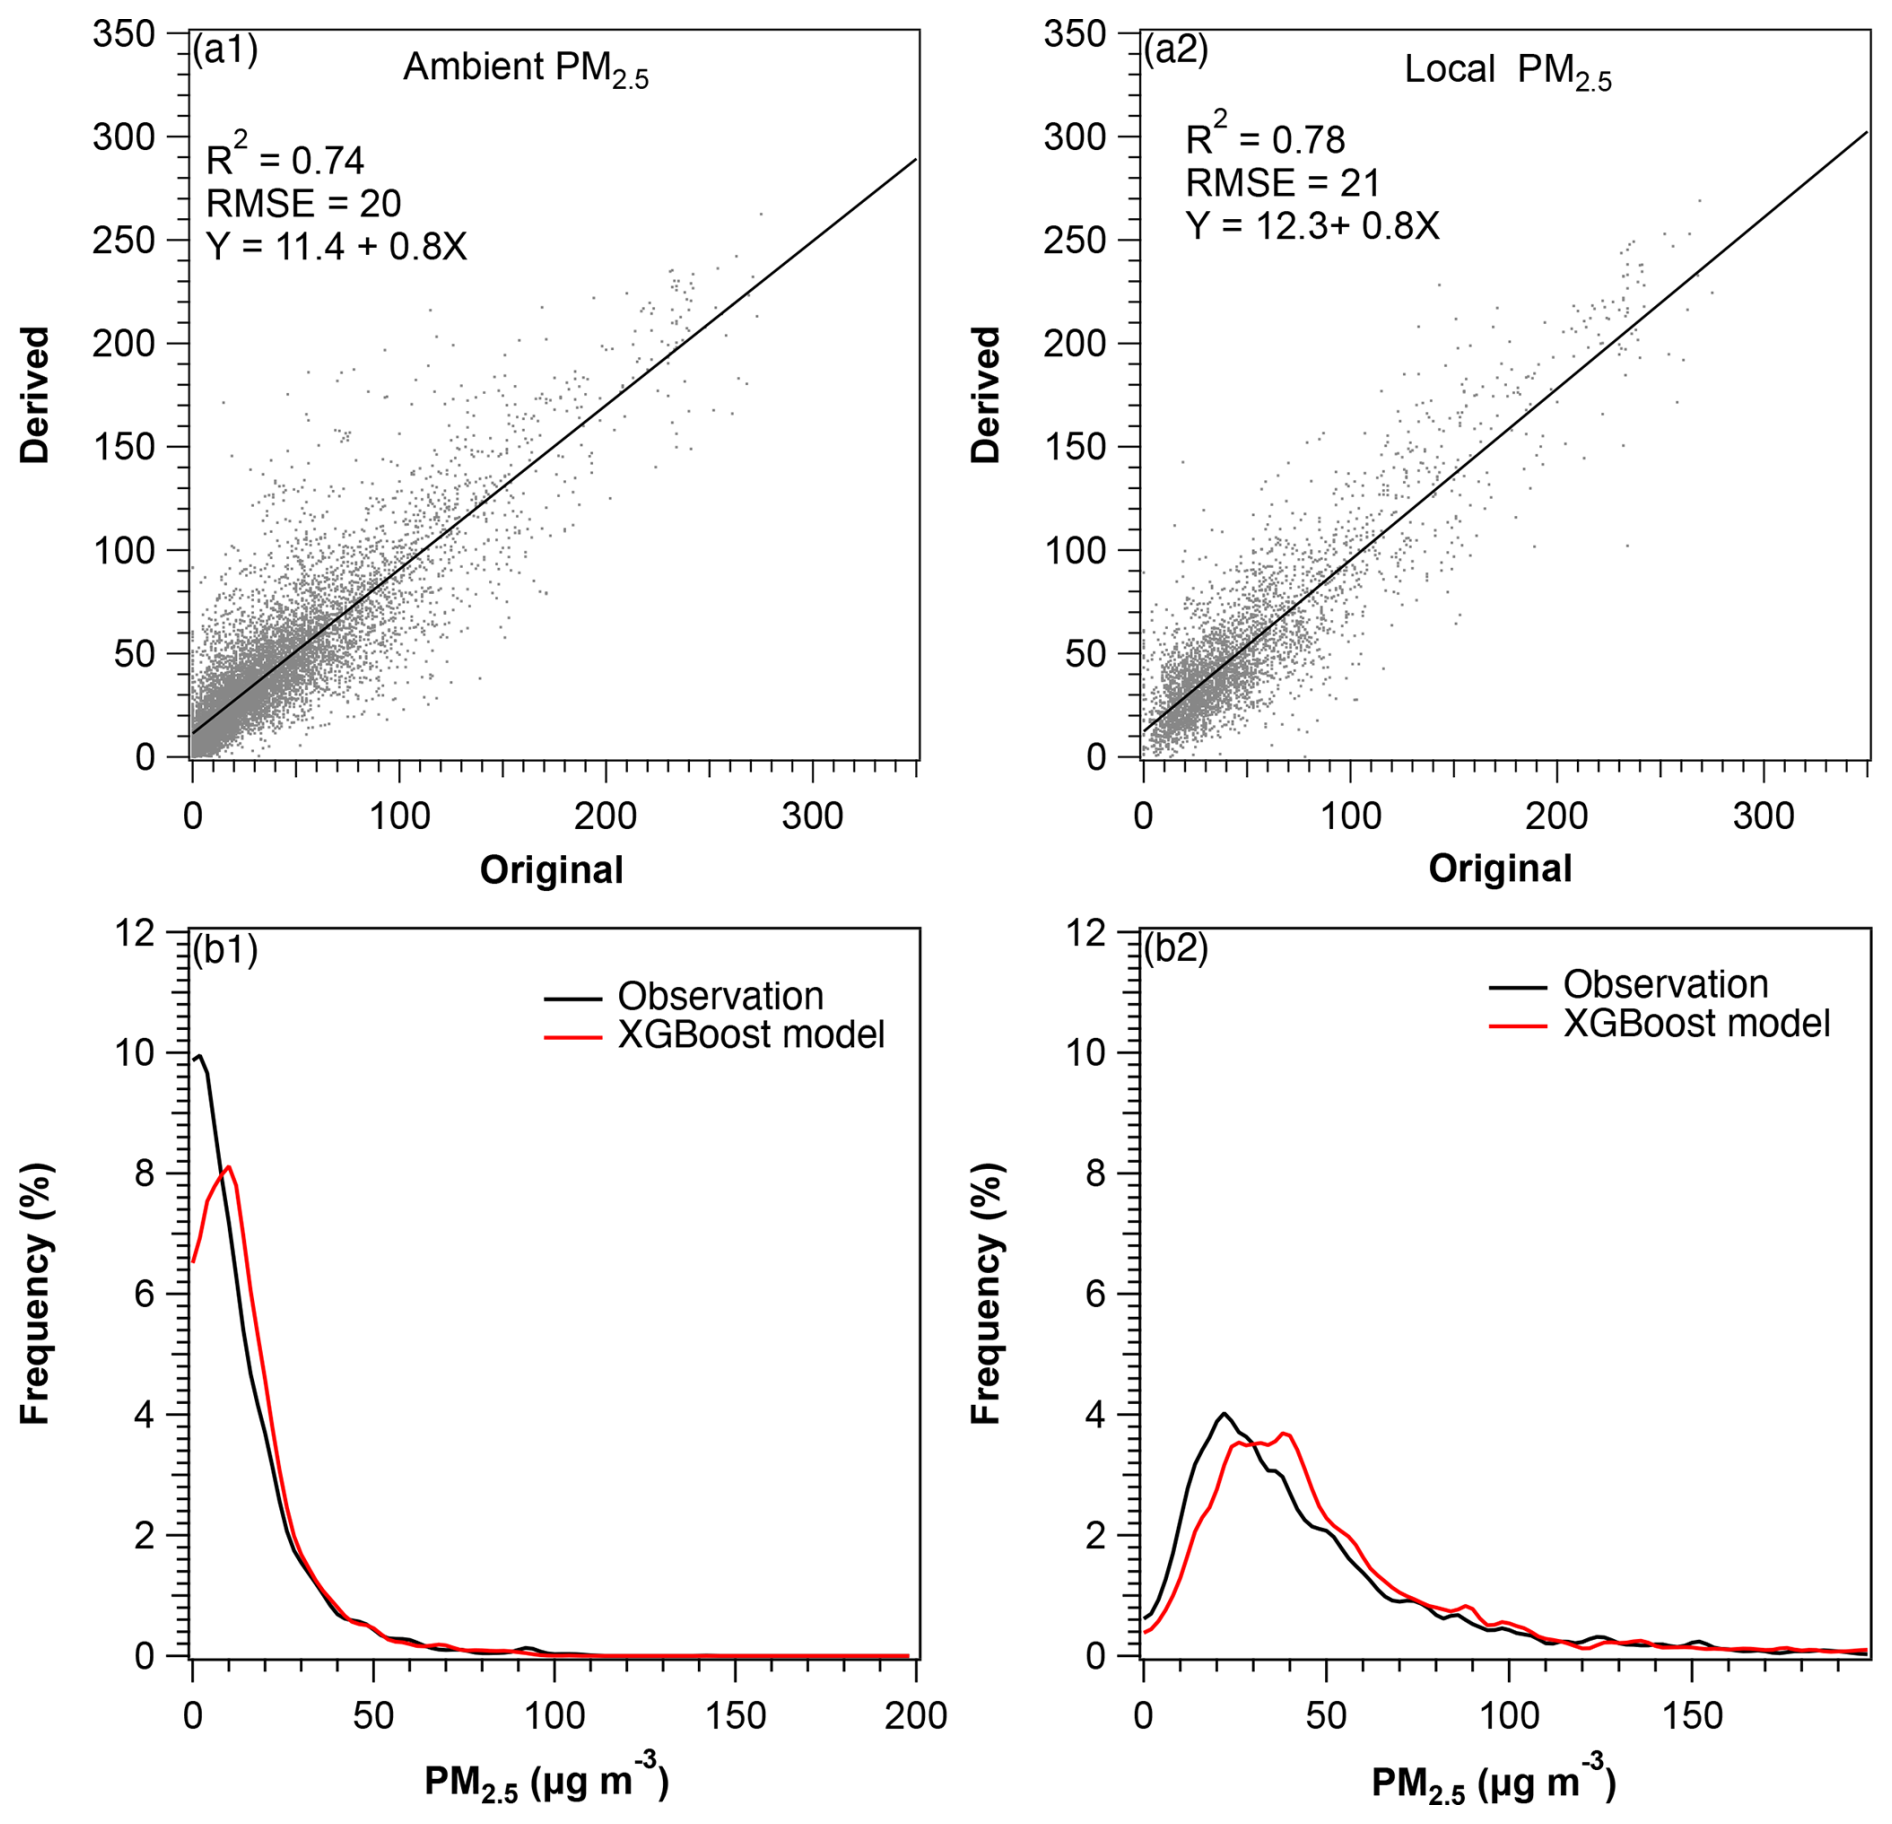
Figure 2Comparison of XGBoost model estimates and observations for (a1) ambient PM2.5 and (a2) local PM2.5 using testing data. Frequency distributions of PM2.5 observations (black lines) and XGBoost model predictions (red lines) for (b1) ambient PM2.5 and (b2) local PM2.5 using testing data.
Figure S4 reveals that ambient pollution events (PM2.5>75 µg m−3) in Beijing are primarily influenced by air masses originating from the south and west, particularly under the control of westward air masses. Numerous studies have indicated that air masses originating from the western region significantly contribute to regional pollution events in Beijing (Streets et al., 2007; Tian et al., 2019; Liu et al., 2020). With the exception of December (Fig. 3b1), westward air masses often bring higher monthly average PM2.5 to Beijing. Air masses originating from the south region can also transport more pollutants to Beijing (Fig. S4). However, unlike the high-frequency polluted air masses from the west, southward air masses are associated with higher PM2.5 concentrations, particularly during autumn and winter (Fig. 3c1). This phenomenon can be attributed to the higher pollution levels in Hebei and Shandong provinces compared to Beijing during these seasons, as verified by AOD observations from the Moderate Resolution Imaging Spectroradiometer (MODIS) on the Aqua satellites over eastern China (Zhang and Reid, 2010; Hu et al., 2018) (Fig. S5). Notably, in contrast to westward transport, air masses from the south region in February predominantly exhibited a cleaning effect on Beijing, even before 2017 (Fig. S4b). This can be explained by the occurrence of these transport processes during or shortly after the Spring Festival, a period characterized by extremely low anthropogenic emissions, resulting in lower ambient PM2.5 compared to local emissions in the megacity of Beijing. Following the implementation of the Action Plan, the polluted air masses from the south region transitioned from carrying higher PM2.5 to levels close to local emission concentrations in Beijing, leading to a more equal contribution to pollution and clean events in the area (Fig. S6c1).
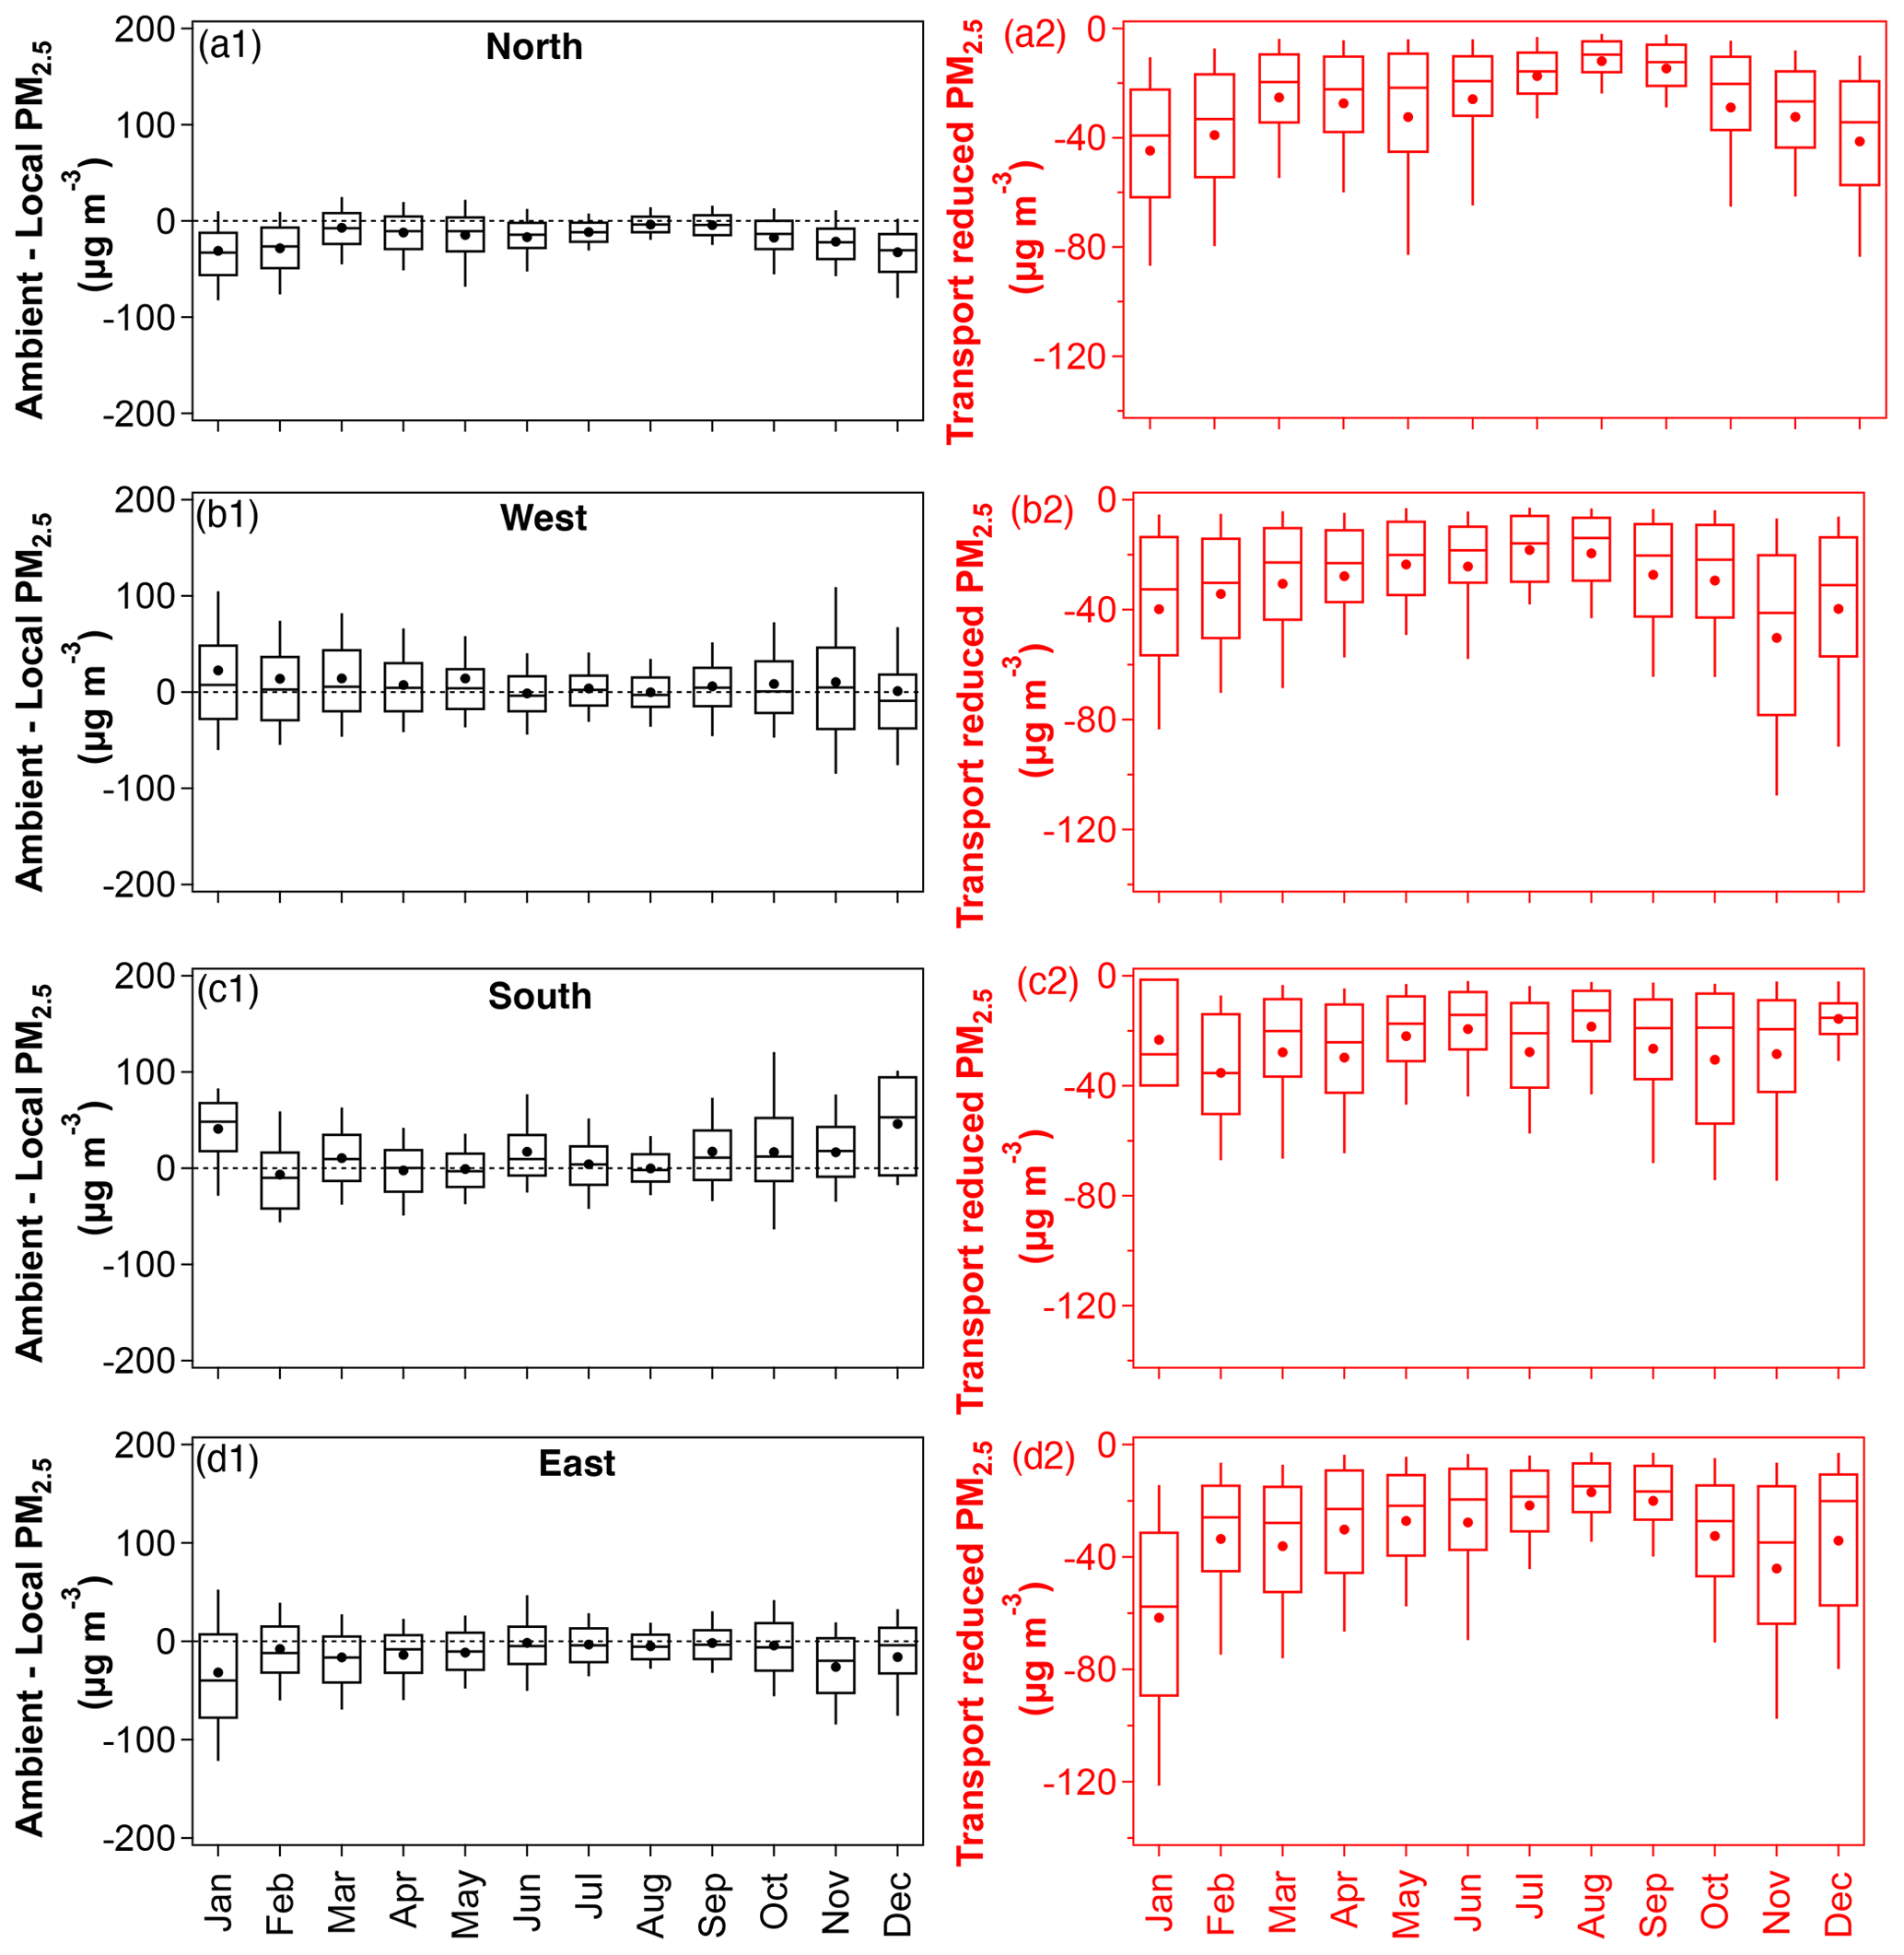
Figure 3Monthly variations of the difference between ambient and local PM2.5 from the (a1) north, (b1) west, (c1) south, and (d1) east regions. Right panels (a2–d2) show monthly variations of PM2.5 reductions caused by regional transport for the corresponding source regions in the left panels (a1–d1). The upper and lower boundaries represent the 75th and 25th percentiles, respectively, while the solid origin represents the average value.
3.2 Impact of clean air masses from transported regions on PM2.5 in Beijing
In this study, clean air masses are defined as those associated with ambient PM2.5 in the Beijing area that are lower than the concentrations resulting from local emissions, as illustrated below the dashed line in Fig. 3a1–d1. This study reveals that clean air masses predominantly originate from the east and north regions during the period 2013–2020, which is consistent with previous studies (Zhang et al., 2018; Hu et al., 2020). Clean air masses from different directions exhibit similar seasonal variations in their ability to reduce locally emitted pollution in Beijing, with a strong reduction effect in winter and a weaker effect in summer (Fig. 3a2–d2). This phenomenon is closely related to the seasonal variations in pollutant emissions. Due to the combined influence of increased residential emissions from heating activities and meteorological conditions in Beijing during autumn and winter, local PM2.5 in Beijing presents higher concentrations. Consequently, the influx of clean air masses results in a more pronounced reduction in PM2.5 during these seasons. The weaker attenuation effect of PM2.5 transported from the south region during December and January can be attributed to the high-frequency and high-concentration pollution contributions from air masses originating in this region during this period.
Due to a significant reduction in anthropogenic emissions after 2017, the attenuation of PM2.5 concentrations by clean air masses from all directions was significantly lower than before 2017 (Fig. S7a2–d2). Compared to the period prior to 2017, the mean attenuation of PM2.5 concentrations in Beijing decreased by 3, 10, 3, and 7 µg m−3 (p<0.01) for air masses originating from the north, west, south, and east regions, respectively.
3.3 Variations in Beijing PM2.5 concentrations under transport-induced pollution events
Transport-induced pollution events in Beijing are defined as the occurrence of ambient PM2.5 exceeding both local PM2.5 and the light pollution standard (75 µg m−3). Figure 4a1–d1 demonstrate that the monthly variation of PM2.5 in Beijing generally follows a unimodal pattern, with higher values in winter and lower values in summer, except when under the influence of eastern air mass transport. This phenomenon is closely related to the seasonal variations in anthropogenic emissions in China and the characteristics of climate change (Renhe et al., 2014; Li et al., 2017a; Zhang et al., 2015). The overall PM2.5 in Beijing under the influence of eastward pollution air masses exhibits a bimodal distribution, with frequent high-concentration pollution events occurring in January and October. Even after the effective control of anthropogenic emissions in 2017, a second peak of high-concentration pollution persists in October (Fig. 4d2). Figure 4a2–d2 illustrate the effectiveness of the Action Plan in controlling pollutant concentrations in the Beijing area. Since 2017, PM2.5 in Beijing has been significantly lower than the values observed before 2017 during transport-induced pollution events. Moreover, during January and from June to September, there were periods when the regional transport of polluted air masses from a fixed direction did not contribute to pollution events in Beijing.
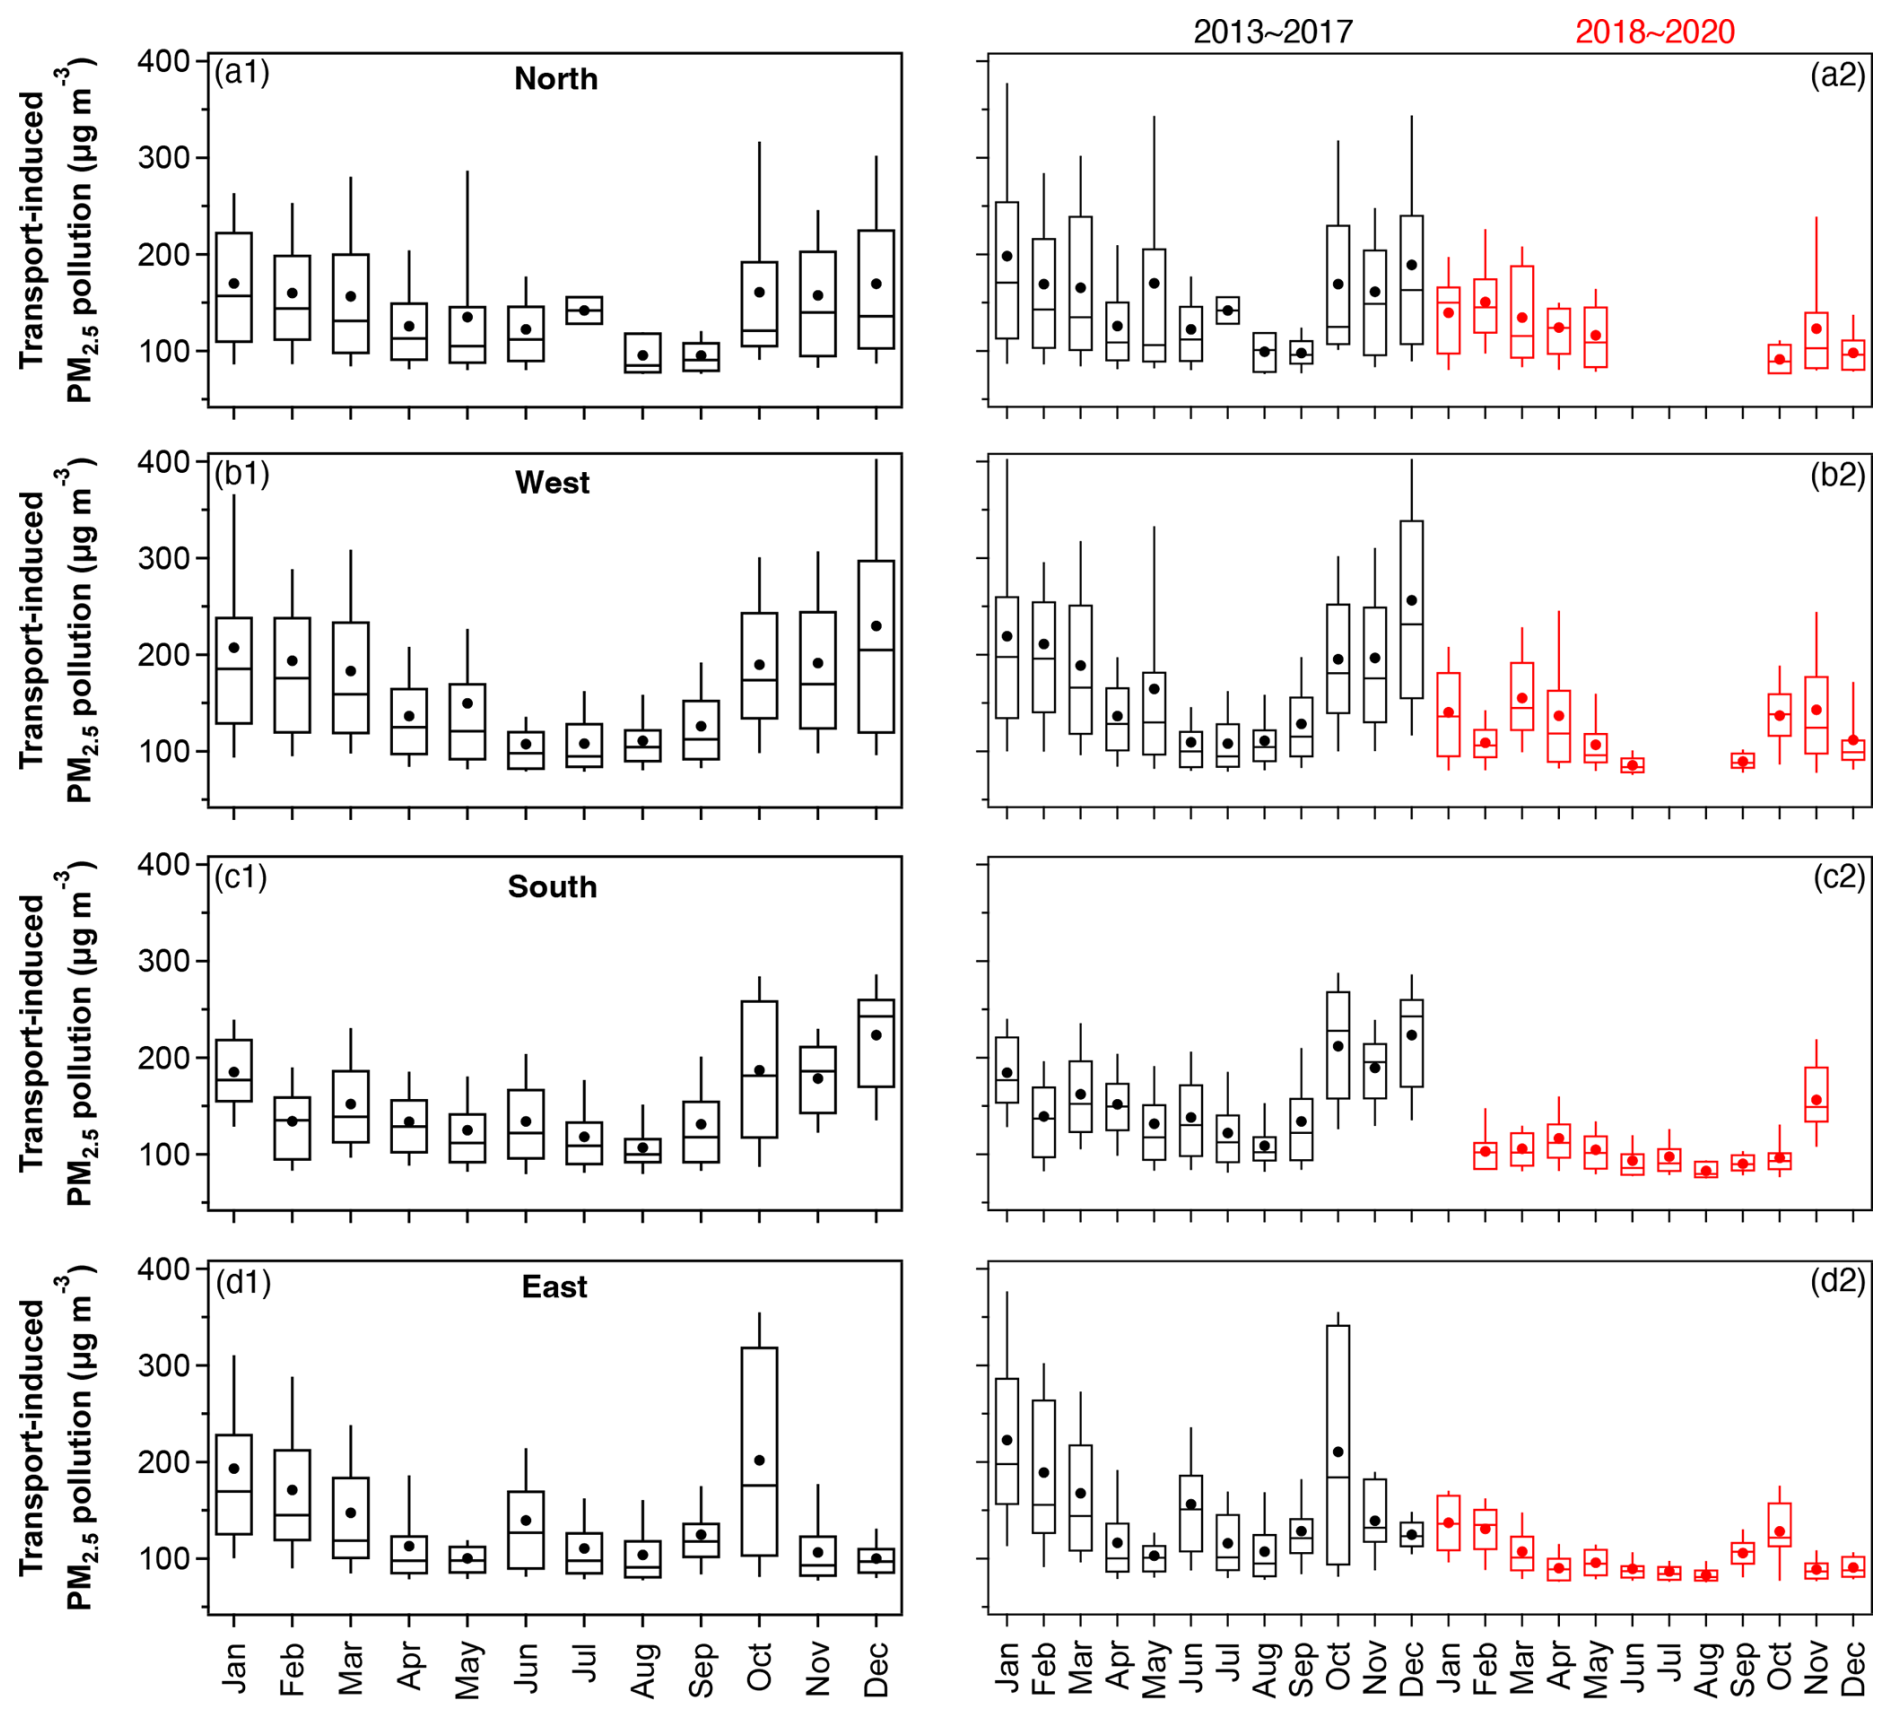
Figure 4Monthly variations of transport-induced PM2.5 pollution (ambient PM2.5 exceeding local PM2.5 and 75 µg m−3) from the (a1) north, (b1) west, (c1) south, and (d1) east regions. Right panels (a2–d2) show monthly variations of transport-induced PM2.5 pollution before (black) and after (red) 2017 for the corresponding source regions in the left panels (a1–d1). The upper and lower boundaries represent the 75th and 25th percentiles, respectively, while the solid origin represents the average result.
An analysis of the proportion of transport-induced pollution events from different regions to Beijing (Fig. 5) shows that after the implementation of the Action Plan in 2017, the number of pollution events dominated by regional transport decreased significantly. From spring to winter, the largest decrease in transport-induced pollution events occurred in the north, west, west, and south regions in each season, with the lowest decrease occurring in the east region during winter.
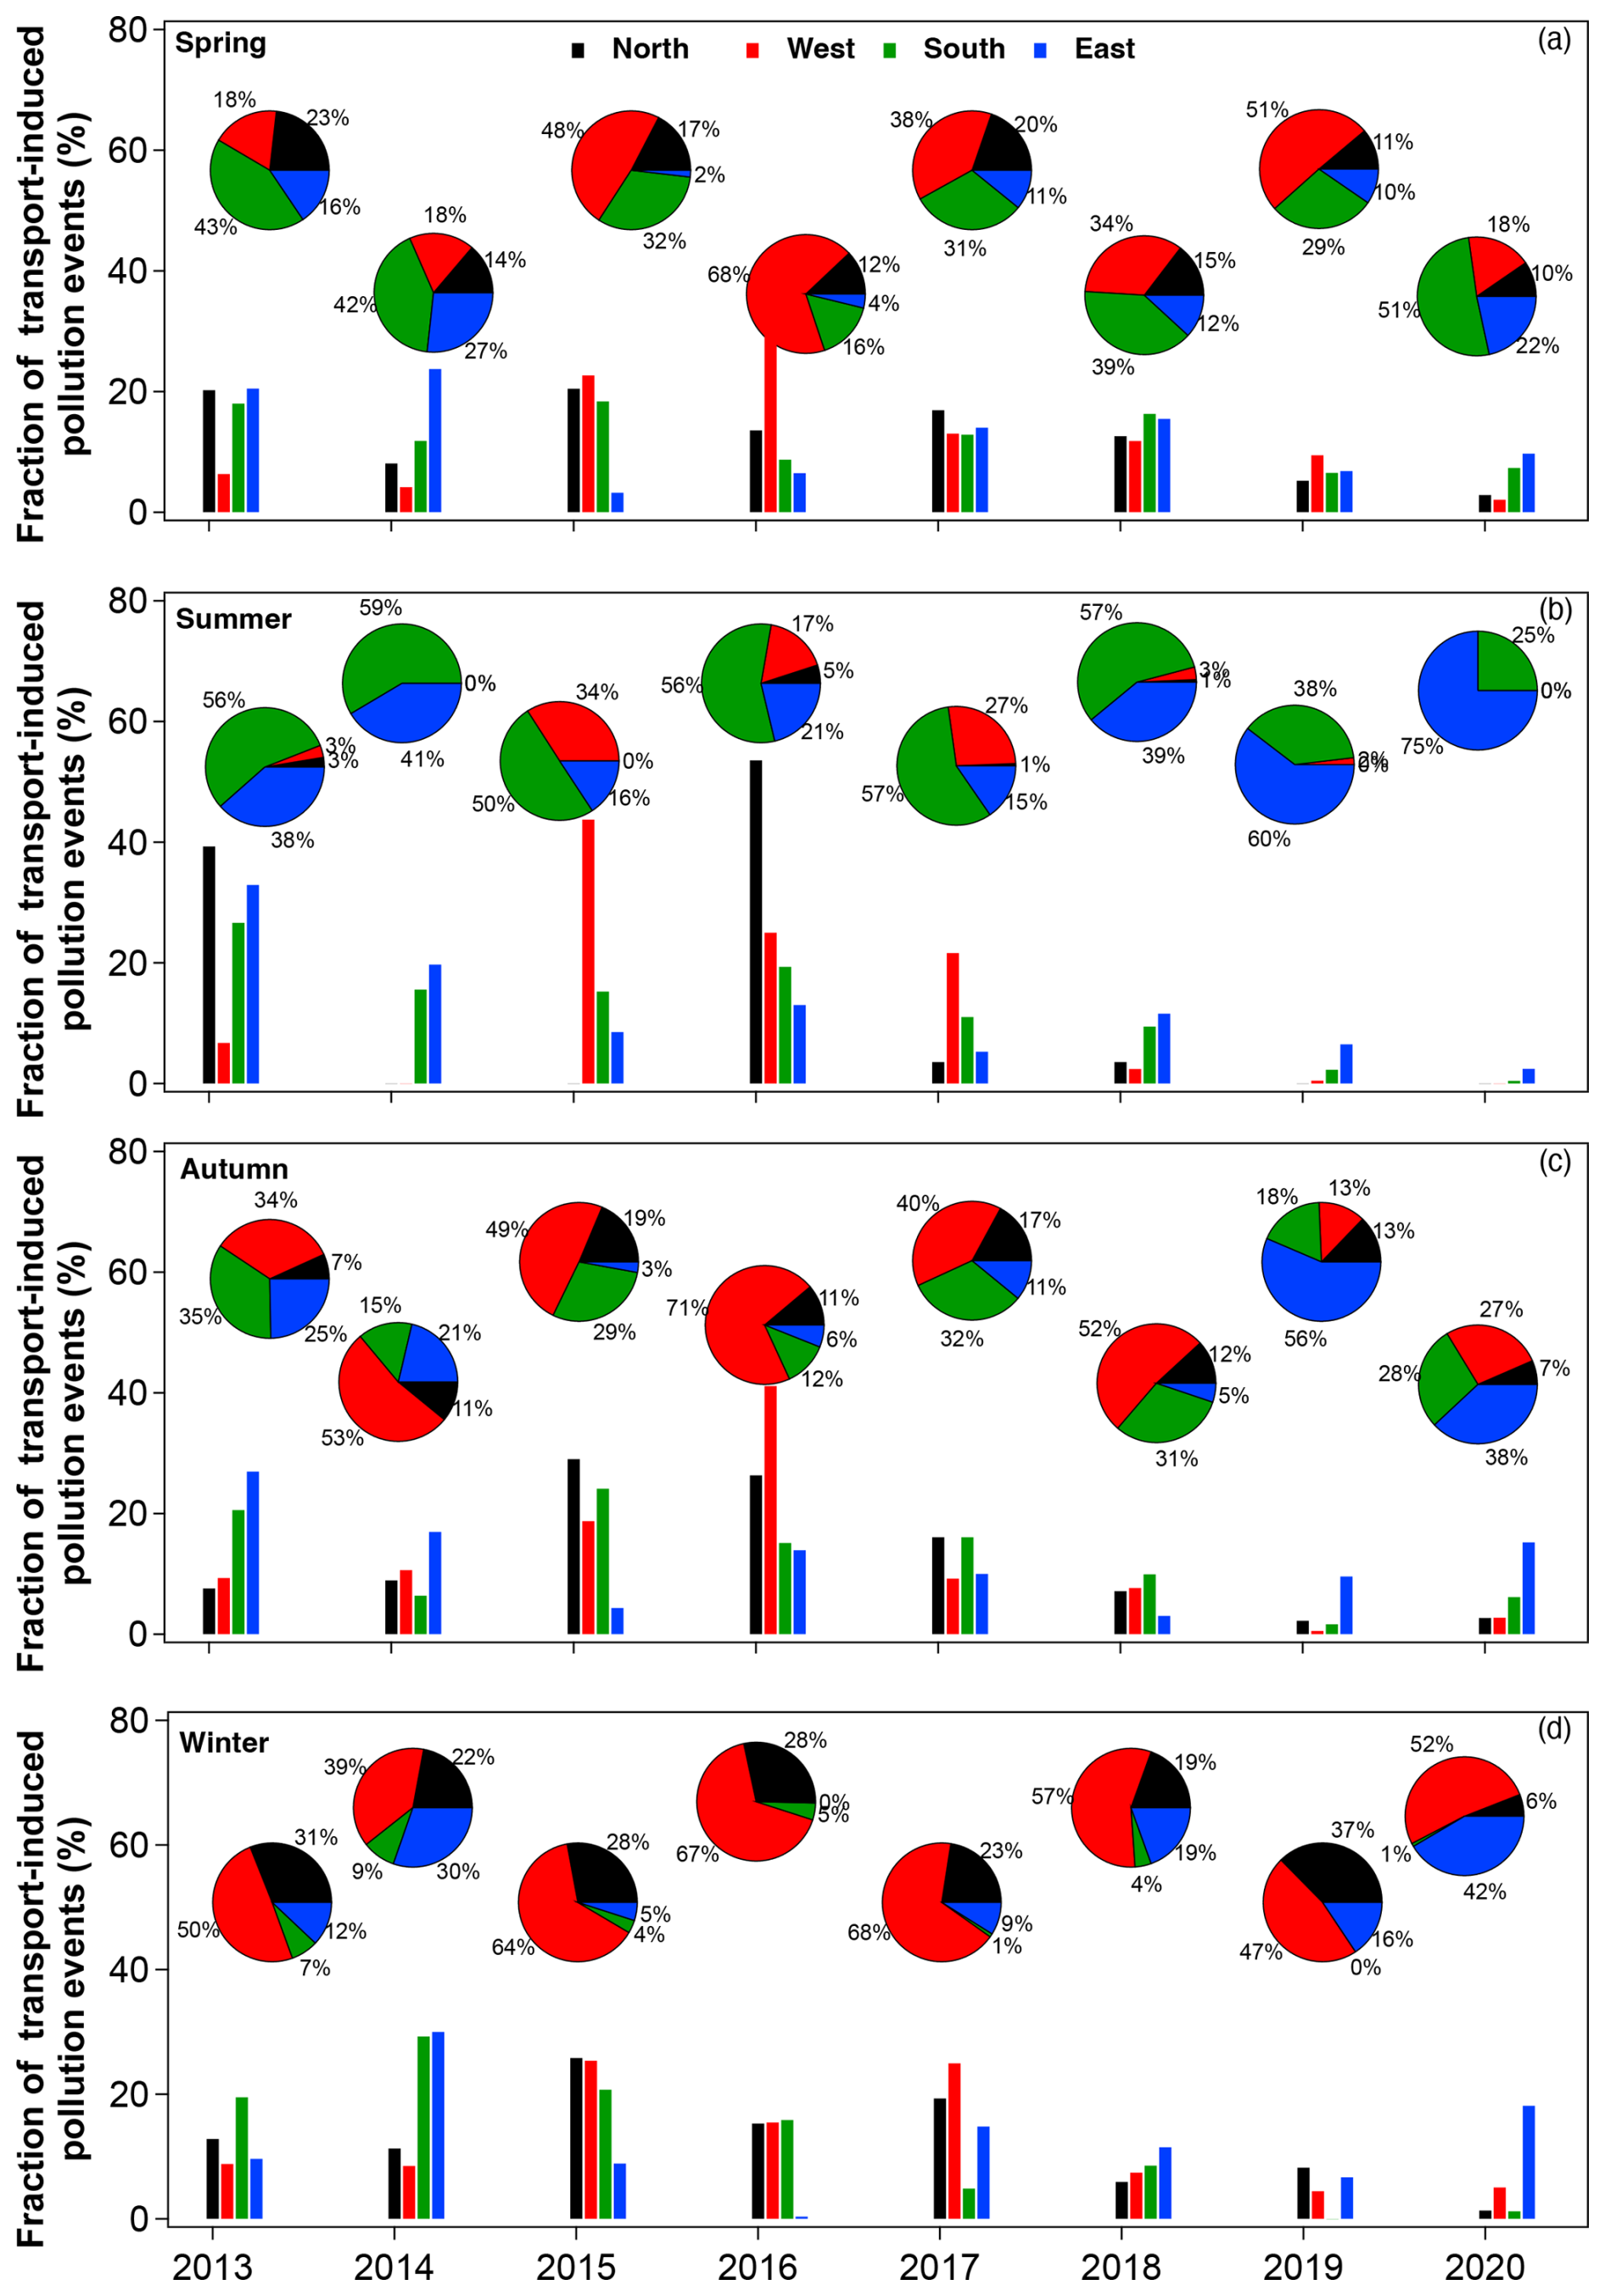
Figure 5Histograms depict the annual fraction of transport-induced pollution events in each direction relative to the total number of occurrences from 2013 to 2020 during (a) spring, (b) summer, (c) autumn, and (d) winter. Pie charts illustrate the proportion of transport-induced pollution events in each direction for each year within the corresponding seasons.
The temporal variation in the number of transport-induced pollution events from different regions (Fig. S8) revealed that air masses transported from the west region contributed to the most frequent pollution events in each season except summer. The highest number of events occurred in spring 2016 (322), autumn 2016 (375), and winter 2017 (308). Summer transport-induced pollution events were mainly influenced by polluted air masses transported from the south, with a gradual decrease in the number of events over the years. Although pollution events in Beijing primarily occur in autumn and winter, this study found that after 2017, the season when Beijing was most affected by transport-induced pollution events was spring, contributing a total of 685 pollution events, while autumn and winter contributed 266 and 392 events, respectively. The impact of polluted air masses on summer transport was minimal, with only 215 occurrences.
Figure 5a shows that in spring, transport-induced pollution events in Beijing were mainly dominated by polluted air masses transported from the west and south. The highest proportion of regional transport events from the west occurred in 2016, reaching 68 %, while the highest proportion of southward transport-induced pollution events occurred in 2017 (with the exception of 2020, which may have been influenced by the COVID-19 pandemic). The increased frequency of pollution air masses transported from the south after 2017 can be attributed to the effective control of anthropogenic emissions, resulting in a decrease in PM2.5 transported from various regions, especially from westward sources (Fig. S8a). The decrease in the proportion of pollution events transported from the west, which originally accounted for a large proportion, led to an increase in the contribution of remaining incoming air masses to Beijing.
Before 2017, transport-induced pollution events in Beijing during summer were mainly affected by polluted air masses from the south region. Even in 2015, when the proportion of transport-induced pollution events from the south region was lowest during the entire period, it still accounted for 50 % of the total number of transport-induced pollution events that year. However, after the implementation of the Action Plan, the proportion of transport-induced pollution events from the south region gradually decreased to 38 %. In 2020, this proportion further declined to 25 %, but this may have been affected by the COVID-19 pandemic. Meanwhile, pollution air masses originating from the east increasingly dominated the occurrence of pollution events in Beijing.
Transport-induced pollution events in Beijing mainly originated from the west and had the highest contribution proportion in autumn before 2019 (except for 2013, when the contribution proportion was 34 %, second only to southward air masses at 35 %). After 2019, the contribution of eastward air masses became dominant in autumn. In winter, polluted air masses from the west were the main source of transport-induced pollution events. Overall, as the Action Plan gradually improved, the transport-induced pollution from the east did not decrease significantly compared to other air mass sources. This may be because the eastward air masses are mostly clean. However, as the concentration of polluted air masses from other sources decreases, the potential impact of eastward air masses on Beijing's transport-induced pollution events increases. This finding may prompt Beijing to prioritize emission reduction in the east region when implementing future joint prevention and control measures.
This study combined a machine learning method and concentration-weighted trajectory (CWT) analysis to derive local emissions and ambient observed PM2.5 in Beijing from 2013 to 2020; thus the contribution of regional transport to PM2.5 in Beijing can be quantified. The impact of clean air masses (defined as those with ambient PM2.5 concentrations lower than local emissions) mainly originated from the east and north regions. These clean air masses from different directions exhibited similar seasonal variations in their ability to reduce ambient pollution in Beijing, with a stronger reduction effect in winter and a weaker reduction effect in summer. In addition to clean air masses, COVID-19 restrictions might have contributed to the reduction of PM2.5 in 2020.
Except for the regional transport from the east region, the seasonal variation of PM2.5 in Beijing under the influence of transport-induced pollution events (ambient PM2.5 exceeding both local PM2.5 and 75 µg m−3) shows a general trend of high concentrations in winter and low concentrations in summer. The main reason for this phenomenon is related to the seasonal emissions of pollutants in China and the characteristics of climate change. Before 2019, the west region was the primary source of pollution events during autumn and winter. However, starting from 2019, the east region became the main contributor of polluted air masses in autumn. Additionally, among all regions, the east region exhibited the smallest decrease in transport-induced pollution events after 2017.
From 2013 to 2020, local emissions were the main contributors to pollution events in Beijing. However, the Air Pollution Prevention and Control Action Plan, implemented by the Chinese government in 2017, more effectively mitigated pollutants caused by regional transport compared to local emissions, particularly during autumn and winter. This finding suggests that Beijing should prioritize reducing local emissions while also accounting for potential contributions from the east region in its future pollution prevention and control strategies.
The codes used in this study are archived on Zenodo: the machine learning code at https://doi.org/10.5281/zenodo.14677125 (Hu, 2025), the CWT code at https://doi.org/10.5281/zenodo.13994400 (Hu, 2024a), ECMWF data at https://doi.org/10.5281/zenodo.14353871 (Hu, 2024b), GDAS data at https://doi.org/10.5281/zenodo.14347277 (Hu, 2024c), HySplit Trajectory Ensemble at https://doi.org/10.5281/zenodo.14375567 (Hu, 2024d), and PySPLIT at https://doi.org/10.5281/zenodo.14354765 (Hu, 2024e; Cross, 2015). The meteorology and PM2.5 data used in this study can be accessed at https://doi.org/10.17632/bhfktx3kz8.2 (Hu, 2024f).
The supplement related to this article is available online at https://doi.org/10.5194/gmd-18-3623-2025-supplement.
KH, HL, and DL designed and carried out the experiments. KH wrote the code and final paper with contributions from all other authors. HL, DL, LC, and JJ reviewed and edited the paper.
The contact author has declared that none of the authors has any competing interests.
Publisher's note: Copernicus Publications remains neutral with regard to jurisdictional claims made in the text, published maps, institutional affiliations, or any other geographical representation in this paper. While Copernicus Publications makes every effort to include appropriate place names, the final responsibility lies with the authors.
This research was supported by the China Postdoctoral Science Foundation (2023M741773), the Postdoctoral Fellowship Program of CPSF (GZC20231150), and the National Natural Science Foundation of China (42021004, 42405192).
This paper was edited by Klaus Klingmüller and reviewed by two anonymous referees.
Akritidis, D., Zanis, P., Georgoulias, A. K., Papakosta, E., Tzoumaka, P., and Kelessis, A.: Implications of COVID-19 restriction measures in urban air quality of Thessaloniki, Greece: A machine learning approach, Atmosphere-Basel, 12, 1500, https://doi.org/10.3390/atmos12111500, 2021.
Asadollahfardi, G., Madinejad, M., Aria, S. H., and Motamadi, V.: Predicting Particulate Matter (PM2.5) Concentrations in the Air of Shahr-e Ray City, Iran, by Using an Artificial Neural Network, Environmental Quality Management, 25, 71–83, 2016.
Bartell, S. M., Longhurst, J., Tjoa, T., Sioutas, C., and Delfino, R. J.: Particulate air pollution, ambulatory heart rate variability, and cardiac arrhythmia in retirement community residents with coronary artery disease, Environ. Health Persp., 121, 1135–1141, 2013.
Brauer, M., Amann, M., Burnett, R. T., Cohen, A., Dentener, F., Ezzati, M., Henderson, S. B., Krzyzanowski, M., Martin, R. V., and Van Dingenen, R.: Exposure assessment for estimation of the global burden of disease attributable to outdoor air pollution, Environ. Sci. Technol., 46, 652–660, 2012.
Cheng, N., Cheng, B., Li, S., and Ning, T.: Effects of meteorology and emission reduction measures on air pollution in Beijing during heating seasons, Atmos. Pollut. Res., 10, 971–979, 2019.
Cross, M.: PySPLIT: a Package for the Generation, Analysis, and Visualization of HYSPLIT Air Parcel Trajectories, SciPy, 133–137, https://proceedings.scipy.org/articles/Majora-7b98e3ed-014.pdf (last access: 13 June 2025), 2015.
Ding, S., Zhao, D., He, C., Huang, M., He, H., Tian, P., Liu, Q., Bi, K., Yu, C., and Pitt, J.: Observed interactions between black carbon and hydrometeor during wet scavenging in mixed-phase clouds, Geophys. Res. Lett., 46, 8453–8463, 2019.
Draxler, R. and Rolph, G.: HYSPLIT (HYbrid Single-Particle Lagrangian Integrated Trajectory) model access via NOAA ARL READY website (http://ready.arl.noaa.gov/HYSPLIT.php, last access: 13 June 2025), NOAA Air Resources Laboratory, Silver Spring, MD, 25, 2010.
Du, H., Li, J., Wang, Z., Chen, X., Yang, W., Sun, Y., Xin, J., Pan, X., Wang, W., and Ye, Q.: Assessment of the effect of meteorological and emission variations on winter PM2.5 over the North China Plain in the three-year action plan against air pollution in 2018–2020, Atmos. Res., 280, 106395, https://doi.org/10.1016/j.atmosres.2022.106395, 2022.
Fang, X., Zou, B., Liu, X., Sternberg, T., and Zhai, L.: Satellite-based ground PM2.5 estimation using timely structure adaptive modeling, Remote Sens. Environ., 186, 152–163, 2016.
Geng, G., Zhang, Q., Martin, R. V., van Donkelaar, A., Huo, H., Che, H., Lin, J., and He, K.: Estimating long-term PM2.5 concentrations in China using satellite-based aerosol optical depth and a chemical transport model, Remote Sens. Environ., 166, 262–270, 2015.
Geng, G., Xiao, Q., Liu, S., Liu, X., Cheng, J., Zheng, Y., Xue, T., Tong, D., Zheng, B., and Peng, Y.: Tracking air pollution in China: near real-time PM2.5 retrievals from multisource data fusion, Environ. Sci. Technol., 55, 12106–12115, 2021.
Grange, S. K., Carslaw, D. C., Lewis, A. C., Boleti, E., and Hueglin, C.: Random forest meteorological normalisation models for Swiss PM10 trend analysis, Atmos. Chem. Phys., 18, 6223–6239, https://doi.org/10.5194/acp-18-6223-2018, 2018.
Hopke, P. K., Gao, N., and Cheng, M.-D.: Combining chemical and meteorological data to infer source areas of airborne pollutants, Chemometr. Intell. Lab., 19, 187–199, 1993.
Hu, K.: The CWT model combined with the HYSPLIT trajectory ensemble, Zenodo [code], https://doi.org/10.5281/zenodo.13994400, 2024a.
Hu, K.: The ECMWF data of “A Novel Method for Quantifying the Contribution of Regional Transport to PM2.5 in Beijing (2013–2020): Combining Machine Learning with Concentration-Weighted Trajectory Analysis”, Zenodo [data set], https://doi.org/10.5281/zenodo.14353871, 2024b.
Hu, K.: The GDAS data of “A Novel Method for Quantifying the Contribution of Regional Transport to PM2.5 in Beijing (2013–2020): Combining Machine Learning with Concentration-Weighted Trajectory Analysis”, Zenodo [data set], https://doi.org/10.5281/zenodo.14347277, 2024c.
Hu, K.: The HYSPLIT trajectory ensemble data of “A Novel Method for Quantifying the Contribution of Regional Transport to PM2.5 in Beijing (2013–2020): Combining Machine Learning with Concentration-Weighted Trajectory Analysis”, Zenodo [data set], https://doi.org/10.5281/zenodo.14375567, 2024d.
Hu, K.: The PySPLIT model was used in the paper titled “A Novel Method for Quantifying the Contribution of Regional Transport to PM2.5 in Beijing (2013–2020): Combining Machine Learning with Concentration-Weighted Trajectory Analysis”, Zenodo [code], https://doi.org/10.5281/zenodo.14354765, 2024e.
Hu, K.: The meteorology and PM2.5 data of “A Novel Method for Quantifying the Contribution of Regional Transport to PM2.5 in Beijing (2013–2020): Combining Machine Learning with Concentration-Weighted Trajectory Analysis”, Zenodo [data set], https://doi.org/10.17632/bhfktx3kz8.2, 2024f.
Hu, K.: The XGBoost model system, Zenodo [code], https://doi.org/10.5281/zenodo.14677125, 2025.
Hu, K., Kumar, K. R., Kang, N., Boiyo, R., and Wu, J.: Spatiotemporal characteristics of aerosols and their trends over mainland China with the recent Collection 6 MODIS and OMI satellite datasets, Environ. Sci. Pollut. R., 25, 6909–6927, 2018.
Hu, K., Zhao, D., Liu, D., Ding, S., Tian, P., Yu, C., Zhou, W., Huang, M., and Ding, D.: Estimating radiative impacts of black carbon associated with mixing state in the lower atmosphere over the northern North China Plain, Chemosphere, 252, 126455, https://doi.org/10.1016/j.chemosphere.2020.126455, 2020.
Huang, C., Hu, J., Xue, T., Xu, H., and Wang, M.: High-resolution spatiotemporal modeling for ambient PM2.5 exposure assessment in China from 2013 to 2019, Environ. Sci. Technol., 55, 2152–2162, 2021.
Huang, R.-J., Zhang, Y., Bozzetti, C., Ho, K.-F., Cao, J.-J., Han, Y., Daellenbach, K. R., Slowik, J. G., Platt, S. M., and Canonaco, F.: High secondary aerosol contribution to particulate pollution during haze events in China, Nature, 514, 218–222, 2014.
Jones, A., Thomson, D., Hort, M., and Devenish, B.: The UK Met Office's next-generation atmospheric dispersion model, NAME III, in: Air pollution modeling and its application XVII, edited by: Borrego, C. and Norman, A.-L., Springer, 580–589, https://doi.org/10.1007/978-0-387-68854-1_62, 2007.
Kalisoras, A., Georgoulias, A. K., Akritidis, D., Allen, R. J., Naik, V., Kuo, C., Szopa, S., Nabat, P., Olivié, D., van Noije, T., Le Sager, P., Neubauer, D., Oshima, N., Mulcahy, J., Horowitz, L. W., and Zanis, P.: Decomposing the effective radiative forcing of anthropogenic aerosols based on CMIP6 Earth system models, Atmos. Chem. Phys., 24, 7837–7872, https://doi.org/10.5194/acp-24-7837-2024, 2024.
Kleine Deters, J., Zalakeviciute, R., Gonzalez, M., and Rybarczyk, Y.: Modeling PM2.5 urban pollution using machine learning and selected meteorological parameters, Journal of Electrical and Computer Engineering, 2017, 5106045, https://doi.org/10.1155/2017/5106045, 2017.
Kong, L., Tang, X., Zhu, J., Wang, Z., Li, J., Wu, H., Wu, Q., Chen, H., Zhu, L., Wang, W., Liu, B., Wang, Q., Chen, D., Pan, Y., Song, T., Li, F., Zheng, H., Jia, G., Lu, M., Wu, L., and Carmichael, G. R.: A 6 year-long (2013–2018) high-resolution air quality reanalysis dataset in China based on the assimilation of surface observations from CNEMC, Earth Syst. Sci. Data, 13, 529–570, https://doi.org/10.5194/essd-13-529-2021, 2021.
Li, M., Zhang, Q., Kurokawa, J.-I., Woo, J.-H., He, K., Lu, Z., Ohara, T., Song, Y., Streets, D. G., Carmichael, G. R., Cheng, Y., Hong, C., Huo, H., Jiang, X., Kang, S., Liu, F., Su, H., and Zheng, B.: MIX: a mosaic Asian anthropogenic emission inventory under the international collaboration framework of the MICS-Asia and HTAP, Atmos. Chem. Phys., 17, 935–963, https://doi.org/10.5194/acp-17-935-2017, 2017a.
Li, S., Liu, D., Kong, S., Wu, Y., Hu, K., Zheng, H., Cheng, Y., Zheng, S., Jiang, X., Ding, S., Hu, D., Liu, Q., Tian, P., Zhao, D., and Sheng, J.: Evolution of source attributed organic aerosols and gases in a megacity of central China, Atmos. Chem. Phys., 22, 6937–6951, https://doi.org/10.5194/acp-22-6937-2022, 2022.
Li, T., Shen, H., Yuan, Q., Zhang, X., and Zhang, L.: Estimating ground-level PM2.5 by fusing satellite and station observations: a geo-intelligent deep learning approach, Geophys. Res. Lett., 44, 11985–11993, 2017b.
Liang, F., Xiao, Q., Huang, K., Yang, X., Liu, F., Li, J., Lu, X., Liu, Y., and Gu, D.: The 17-y spatiotemporal trend of PM2.5 and its mortality burden in China, P. Natl. Acad. Sci. USA, 117, 25601–25608, 2020.
Lin, C., Liu, G., Lau, A. K. H., Li, Y., Li, C., Fung, J. C. H., and Lao, X. Q.: High-resolution satellite remote sensing of provincial PM2.5 trends in China from 2001 to 2015, Atmos. Environ., 180, 110–116, 2018.
Liu, D., Hu, K., Zhao, D., Ding, S., Wu, Y., Zhou, C., Yu, C., Tian, P., Liu, Q., and Bi, K.: Efficient vertical transport of black carbon in the planetary boundary layer, Geophys. Res. Lett., 47, e2020GL088858, https://doi.org/10.1029/2020GL088858, 2020.
Ma, Z., Hu, X., Sayer, A. M., Levy, R., Zhang, Q., Xue, Y., Tong, S., Bi, J., Huang, L., and Liu, Y.: Satellite-based spatiotemporal trends in PM2.5 concentrations: China, 2004–2013, Environ. Health Persp., 124, 184–192, 2016.
Miao, Y. and Liu, S.: Linkages between aerosol pollution and planetary boundary layer structure in China, Sci. Total Environ., 650, 288–296, 2019.
Miao, Y., Li, J., Miao, S., Che, H., Wang, Y., Zhang, X., Zhu, R., and Liu, S.: Interaction between planetary boundary layer and PM2.5 pollution in megacities in China: a Review, Current Pollution Reports, 5, 261–271, 2019.
Pascal, M., Falq, G., Wagner, V., Chatignoux, E., Corso, M., Blanchard, M., Host, S., Pascal, L., and Larrieu, S.: Short-term impacts of particulate matter (PM10, PM10−2.5, PM2.5) on mortality in nine French cities, Atmos. Environ., 95, 175–184, 2014.
Polissar, A., Hopke, P., Paatero, P., Kaufmann, Y., Hall, D., Bodhaine, B., Dutton, E., and Harris, J.: The aerosol at Barrow, Alaska: long-term trends and source locations, Atmos. Environ., 33, 2441–2458, 1999.
Renhe, Z., Li, Q., and Zhang, R.: Meteorological conditions for the persistent severe fog and haze event over eastern China in January 2013, Sci. China Earth Sci., 57, 26–35, 2014.
Shen, H., Li, T., Yuan, Q., and Zhang, L.: Estimating regional ground-level PM2.5 directly from satellite top-of-atmosphere reflectance using deep belief networks, J. Geophys. Res.-Atmos., 123, 13875–13886, 2018.
Smith, C. J., Kramer, R. J., Myhre, G., Alterskjær, K., Collins, W., Sima, A., Boucher, O., Dufresne, J.-L., Nabat, P., Michou, M., Yukimoto, S., Cole, J., Paynter, D., Shiogama, H., O'Connor, F. M., Robertson, E., Wiltshire, A., Andrews, T., Hannay, C., Miller, R., Nazarenko, L., Kirkevåg, A., Olivié, D., Fiedler, S., Lewinschal, A., Mackallah, C., Dix, M., Pincus, R., and Forster, P. M.: Effective radiative forcing and adjustments in CMIP6 models, Atmos. Chem. Phys., 20, 9591–9618, https://doi.org/10.5194/acp-20-9591-2020, 2020.
Streets, D. G., Fu, J. S., Jang, C. J., Hao, J., He, K., Tang, X., Zhang, Y., Wang, Z., Li, Z., and Zhang, Q.: Air quality during the 2008 Beijing Olympic games, Atmos. Environ., 41, 480–492, 2007.
Su, T., Li, Z., and Kahn, R.: Relationships between the planetary boundary layer height and surface pollutants derived from lidar observations over China: regional pattern and influencing factors, Atmos. Chem. Phys., 18, 15921–15935, https://doi.org/10.5194/acp-18-15921-2018, 2018.
Tian, P., Liu, D., Huang, M., Liu, Q., Zhao, D., Ran, L., Deng, Z., Wu, Y., Fu, S., and Bi, K.: The evolution of an aerosol event observed from aircraft in Beijing: An insight into regional pollution transport, Atmos. Environ., 206, 11–20, 2019.
Torgo, L.: Data mining with R: learning with case studies, Chapman and Hall/CRC, https://doi.org/10.1201/9780429292859, 2011.
Wang, Y., Wang, M., Zhang, R., Ghan, S. J., Lin, Y., Hu, J., Pan, B., Levy, M., Jiang, J. H., and Molina, M. J.: Assessing the effects of anthropogenic aerosols on Pacific storm track using a multiscale global climate model, P. Natl. Acad. Sci. USA, 111, 6894–6899, 2014.
Wei, J., Li, Z., Cribb, M., Huang, W., Xue, W., Sun, L., Guo, J., Peng, Y., Li, J., Lyapustin, A., Liu, L., Wu, H., and Song, Y.: Improved 1 km resolution PM2.5 estimates across China using enhanced space–time extremely randomized trees, Atmos. Chem. Phys., 20, 3273–3289, https://doi.org/10.5194/acp-20-3273-2020, 2020.
Wei, J., Li, Z., Lyapustin, A., Sun, L., Peng, Y., Xue, W., Su, T., and Cribb, M.: Reconstructing 1 km-resolution high-quality PM2.5 data records from 2000 to 2018 in China: spatiotemporal variations and policy implications, Remote Sens. Environ., 252, 112136, https://doi.org/10.1016/j.rse.2020.112136, 2021.
Wu, Y., Liu, D., Wang, X., Li, S., Zhang, J., Qiu, H., Ding, S., Hu, K., Li, W., and Tian, P.: Ambient marine shipping emissions determined by vessel operation mode along the East China Sea, Sci. Total Environ., 769, 144713, https://doi.org/10.1016/j.scitotenv.2020.144713, 2021.
Wu, Y., Liu, D., Xu, H., Shan, M., Li, S., Tian, P., Hu, K., and Wang, J.: Analysis of Atmospheric Pollutant Characteristics and Regional Transport in Coastal Area Along the East China Sea, J. Environ. Sci., 156, 225–238, https://doi.org/10.1016/j.jes.2024.06.040, 2025.
Xiao, Q., Chang, H. H., Geng, G., and Liu, Y.: An ensemble machine-learning model to predict historical PM2.5 concentrations in China from satellite data, Environ. Sci. Technol., 52, 13260–13269, 2018.
Xiao, Q., Zheng, Y., Geng, G., Chen, C., Huang, X., Che, H., Zhang, X., He, K., and Zhang, Q.: Separating emission and meteorological contributions to long-term PM2.5 trends over eastern China during 2000–2018, Atmos. Chem. Phys., 21, 9475–9496, https://doi.org/10.5194/acp-21-9475-2021, 2021.
Xu, R., Ye, T., Yue, X., Yang, Z., Yu, W., Zhang, Y., Bell, M. L., Morawska, L., Yu, P., and Zhang, Y.: Global population exposure to landscape fire air pollution from 2000 to 2019, Nature, 621, 521–529, 2023.
Xu, X. and Akhtar, U. S.: Identification of potential regional sources of atmospheric total gaseous mercury in Windsor, Ontario, Canada using hybrid receptor modeling, Atmos. Chem. Phys., 10, 7073–7083, https://doi.org/10.5194/acp-10-7073-2010, 2010.
Xue, T., Zheng, Y., Tong, D., Zheng, B., Li, X., Zhu, T., and Zhang, Q.: Spatiotemporal continuous estimates of PM2.5 concentrations in China, 2000–2016: A machine learning method with inputs from satellites, chemical transport model, and ground observations, Environ. Int., 123, 345–357, 2019.
Zeng, Z., Gui, K., Wang, Z., Luo, M., Geng, H., Ge, E., An, J., Song, X., Ning, G., and Zhai, S.: Estimating hourly surface PM2.5 concentrations across China from high-density meteorological observations by machine learning, Atmos. Res., 254, 105516, https://doi.org/10.1016/j.atmosres.2021.105516, 2021.
Zhang, J. and Reid, J. S.: A decadal regional and global trend analysis of the aerosol optical depth using a data-assimilation grade over-water MODIS and Level 2 MISR aerosol products, Atmos. Chem. Phys., 10, 10949–10963, https://doi.org/10.5194/acp-10-10949-2010, 2010.
Zhang, L., Wang, T., Lv, M., and Zhang, Q.: On the severe haze in Beijing during January 2013: Unraveling the effects of meteorological anomalies with WRF-Chem, Atmos. Environ., 104, 11–21, 2015.
Zhang, L., Zhao, T., Gong, S., Kong, S., Tang, L., Liu, D., Wang, Y., Jin, L., Shan, Y., Tan, C., Zhang, Y., and Guo, X.: Updated emission inventories of power plants in simulating air quality during haze periods over East China, Atmos. Chem. Phys., 18, 2065–2079, https://doi.org/10.5194/acp-18-2065-2018, 2018.
Zhang, Q., Zheng, Y., Tong, D., Shao, M., Wang, S., Zhang, Y., Xu, X., Wang, J., He, H., and Liu, W.: Drivers of improved PM2.5 air quality in China from 2013 to 2017, P. Natl. Acad. Sci. USA, 116, 24463–24469, 2019.
Zhang, Q., Wu, S., Wang, X., Sun, B., and Liu, H.: A PM2.5 concentration prediction model based on multi-task deep learning for intensive air quality monitoring stations, J. Clean. Prod., 275, 122722, https://doi.org/10.1016/j.jclepro.2020.122722, 2020.