the Creative Commons Attribution 4.0 License.
the Creative Commons Attribution 4.0 License.
 | 06 May 2025
China Wildfire Emission Dataset (ChinaWED v1) for the period 2012–2022
Zhengyang Lin
Ling Huang
Hanqin Tian
Anping Chen
Xuhui Wang
During the past decades, wildfires have undergone rapid changes while both the extent of fire activities and the resulting greenhouse gas (GHG) emissions from wildfires in China have remained inadequately quantified. We established a wildfire emission model to generate the China Wildfire Emission Dataset (ChinaWED), which can be used to explore the recent dynamics at a national scale. This dataset is constructed at a monthly and kilometer scale under a consistent and quantifiable calculation framework, providing average annual estimates of wildfire-induced GHG emissions of 78.13 ± 22.46 Tg CO2, 279.47 ± 82.01 Gg CH4, and 6.26 ± 1.67 Gg N2O (Tg denotes teragrams and Gg gigagrams) for the past decade. We observed significant decreases in both wildfire occurrences and emissions within forests and grasslands. This trend, however, is counteracted by variations in agricultural fires, which constitute the primary type of fire, accounting for at least half of the national total fire emissions. The seasonal cycle of wildfire GHG emissions shows an evident apex that occurs during the transition from mid-spring to early summer. At the regional scale, northeast China, southwest China, and east China emerge as hotspots of wildfire-induced emissions. Our study offers new insights into China's wildfire dynamics and provides a detailed regional model for wildfire greenhouse gas emissions over China.
- Article
(3541 KB) - Full-text XML
-
Supplement
(2209 KB) - BibTeX
- EndNote


Wildfires exert a substantial impact on landscape vegetation and influence the biogeochemical cycle through the emissions of greenhouse gases (GHGs) (Bauters et al., 2021; Guo et al., 2024; Rodríguez Vásquez et al., 2021). Approximately 2.1 × 10¹⁵ g (2.1 Pg; Pg denotes petagrams) of carbon was emitted globally through biomass burning, representing about 22 % of all fossil fuel emissions, in 2021 (Friedlingstein et al., 2022; van Wees et al., 2022; van der Werf et al., 2017). Biomass burning constitutes a crucial component of the global and regional GHG budget (carbon dioxide (CO2), methane (CH4), and nitrous oxide (N2O)), which is of particular concern given that 120 countries have pledged to achieve net-zero GHG emissions. China, in particular, have announced and initiated long-term climate plans, aiming for carbon peaking by 2030 and carbon neutrality by 2060 (Liu et al., 2022). Additionally, over the past decade in China, climate-driven fire weather, expanding vegetation-based fuel loadings, and anthropogenic activities have led to rapidly changing fire dynamics (Wang et al., 2023a; Wiedinmyer et al., 2023; Ying et al., 2018). To address the challenge and achieve the climate goals, one key step is to establish a national-scale dataset that reflects recent wildfire emission dynamics and contributes to the domestic GHG budget (Friedlingstein et al., 2022).
Currently, there are different studies working on estimates of China wildfire emissions that include contributions from some global products. One of the most widely used approaches take the product of emission factors, fuel loadings, burned area, and combustion efficiency as the estimate of emissions. It should be noted that limitations stem from various aspects during the calculation steps. For example, these studies may use the universal parameters (e.g., land cover types, emission factors) that do not match characteristics of local fuels and further estimates (van Wees et al., 2022; Wiedinmyer et al., 2023). Uncertainty also arises from estimates of burned area due to remote-sensing-based fire datasets with different emphases (e.g., active-fire products and burned-area products) (Chen et al., 2020; Giglio et al., 2018; Schroeder et al., 2014). Some other research has focused on agricultural fire emissions adopted traditional crop-yield-based approaches (CYBAs), primarily relying on provincial statistical data and field-reported measurements such as crop production and estimates of burned crop residues (Hong et al., 2023; Li et al., 2016). These parts are hard to verify and can only be measured within administrative boundaries. In addition, the estimates from CYBAs typically have relatively long updating cycles, often on a yearly scale. These approaches form the fundamental framework of emission estimates, yet various input parameters have been incorporated and the emissions of GHGs may not be consistent even within products.
Here, we present the China Wildfire Emission Dataset (ChinaWED v1) for the period from 2012 to 2022 at a monthly and kilometer scale. We focused on the limitations existing in current studies and products and refined the estimates of calculation components. Emission factors that are specifically suited for evaluating wildfire emissions in China retrieved from previous studies conducted domestically and in neighboring countries were collected. Previous studies have reported a majority of wildfire occurrences in croplands, highlighting the need for improved burned-area estimates that incorporate small-sized fire activities (Ying et al., 2021; Zhang et al., 2015). The newly developed product is easy to update with only 1-month to 2-month lags and provides consistent results for all three GHGs under the same calculation framework. With the support of this ChinaWED product, we can also capture and explore the magnitude, patterns, trends, and drivers of the wildfire occurrences and the wildfire-induced emissions in China within the past decade.
2.1 Emission estimation
In this study, we adopted the wildfire emission estimation method based on the combination of four components – burned area, fuel load, emission factor, and combustion completeness – calculated by the following equation:
where the subscript i represents specific emission types, j represents different vegetated cover types, and x and t stand for spatial and temporal information; hence is the estimated amount of emission type i in location x and month t, BAt,x is the total aggregated burned area derived from multisource satellite-based products in location x and month t, FLx is fuel load in location x, EFi,j is the emission factor of specific emission type i for vegetated cover type j, and CCx,j is defined as combustion completeness in location x for vegetated cover type j.
2.2 Burned-area calculation
Satellite-based thermal anomalies include burned-area and active-fire products, equipping researchers with the capability to observe these distinctive signatures across extensive spatial and temporal ranges. Burned areas are determined by analyzing the disparities in visible and near-infrared channels between pre- and post-fire satellite images. One of the most common limitations in burned-area products is the exclusion of small-sized or smoldering fires. In contrast, active-fire detection is capable of sensing these fires, benefitting from the use of the thermal-sensitive mid-infrared channel. Here we use the MODIS Burned Area product and FIRMS VIIRS S-NPP Active Fire records as the main input datasets (Giglio et al., 2018; Schroeder et al., 2014).
MCD64A1 provides burned-area classification at 500 m spatial resolution and monthly temporal resolution. VIIRS S-NPP provides daily active-fire detection at 375 m spatial resolution. Given active-fire detection's capability to identify fires occupying 5 % or less of a pixel, the S-NPP Active Fire records can provide more detailed information, particularly in regions like China where much crop residue burning occurs. Current models and studies count the active-fire points located outside the existing burned area directly as supplementary sources for fire activities. To avoid potential excessive measurement, a reanalysis system combining both burned area and active fire was designed and is demonstrated in Fig. S1 in the Supplement. We reconstructed the external burned area derived from circular kernels centered on those active-fire records. The aggregated burned area is calculated as below:
where the left part of the equation is the same as in Eq. (1), BAmain(t,x) represents the burned-area cells in location x and month t, and the sum of represents potential burned area determined through the counting of decomposed small pixels from circular kernels centered on those active-fire records (Figs. S1 and S2).
Additionally, we incorporated an independent inventory of fixed-location heat sources. This inventory features continuously operating heat-source objects and spatiotemporal-aggregation characteristics in thermal anomalies. It encompasses heat-source objects including active volcanos and industrial heat sources (e.g., coal-related plants, nonmetal mineral production, ferrous-metal-related plants) (Liu et al., 2018). We utilized this inventory as a filter to exclude false active-fire detection pixels that are not caused by wildfires. Finally, the processed burned-area results were resampled to a 1 km spatial resolution to match the fuel load and land cover mapping. In general, nearly three-quarters (76.2 %) of the total burned area is derived directly from the MCD64 Burned Area product, while 24.5 % is supplemented by information from VIIRS S-NPP 375 m Active Fire records. Through the incorporation of an independent fixed-heat-source dataset, we were able to filter out 0.7 % of the burned area.
2.3 Calculation of other components
Prior studies integrated upscaled systematic field investigations and regional or national censuses to map fuel load. Recent results have shown that aboveground biomass (AGB) can serve as a proxy observation, enabling indirect estimations of dry matter. Remotely sensed biomass carbon density maps aimed at limited vegetation types have been widely used. Here we used the newly developed dataset with 300 m spatial resolution from Spawn et al. (2020), which incorporates a previously presented multisource biomass map and harmonizes AGB from different vegetation types (Noon et al., 2022; Spawn et al., 2020).
We used the land cover product from the ESA Climate Change Initiative to describe the different vegetation types (Li et al., 2018). This product has identical spatial resolution to that of the harmonized AGB dataset. We further aggregated the initial 37 classes into three major vegetated categories, namely forest, herbaceous, and cropland. To refine the estimation of crop residue burning, several independent datasets of high-resolution crop-type mapping were utilized as well. These datasets contain spatial distributions of double-season paddy rice (Pan et al., 2021), single-season rice (Shen et al., 2023), maize (Shen et al., 2022), winter wheat (Dong et al., 2020a), and sugarcane (Zheng et al., 2022) with 10 or 20 m spatial resolution.
It should be noted that the resolutions of all these datasets mentioned were downscaled to 1 km. AGB was calculated by summing all pixels, land cover was determined based on the mode value of vegetated categories, and detailed crop types were identified by counting classified pixels. AGB provided consistent and seamless estimations of biomass carbon density globally for the fixed year of 2010. Land cover data were computed from 2001 to 2020, while crop-type mapping was primarily calculated between 2017 and 2020. We utilize annual land cover data associated with the burned area for the corresponding year (mapping the burned area in 2020 for the period from 2020 to 2022). For distinct crop types, we specifically employ the results obtained during their respective growing seasons, coupled with the monthly burned-area data. The averaged multiyear crop-type mapping was harmonized into land cover data where agricultural land use pixels were present.
Different previous studies applied constant thresholds, which is considered a major bias in emission estimation (Zhang et al., 2008). We adopted a method based on the combination of land cover types and fraction of burned area (FB) assigned as a function of tree cover (Wiedinmyer et al., 2023; Wu et al., 2018; Zhang et al., 2011). Agricultural land use was set to a fixed combustion completeness value of 0.93. The herbaceous category had similarly high CC values defined by the fraction of tree coverage, while forests had much lower CC values. Detailed values are listed in Table S1.
Emission factors for different vegetation and emission types are summarized in Table S2. As well as the studies that introduce global fire emissions, we selected publications that focused on affected burned areas in China and neighboring countries. Obtaining detailed emission factors of different crop types was one of our primary objectives, and they were used in this study to help improve our burned-area-based emission estimation. Forests were divided into tropical, temperate, and boreal types, identified by the updated digital Köppen–Geiger world map of climatic classification (Beck et al., 2018).
3.1 Characteristics of China wildfires and emissions
ChinaWED was calculated based on a burned-area-based approach. We integrated different remotely sensed datasets that map regions affected by wildfires and detect active-fire spots to reconstruct the burned area. From 2012 to 2022, the total burned area in China amounted to 5.31 ± 1.70 Mha yr−1 (megahectares per year) (Fig. 1). More than four-fifths of the total burned area was located in croplands, equivalent to the land area of Switzerland. Of the burned area, 11.0 % occurred in various types of forests, while less than 6 % of the burned area occurred in grasslands or other herbaceous-dominated regions. Based on these burned-area estimates and calculation of other components (emission factors, fuel loads, etc.; see Methods), our results showed that annual wildfire-induced GHG emissions in China amounted to 78.13 ± 22.46 Tg CO2, 279.47 ± 82.01 Gg CH4, and 6.26 ± 1.67 Gg N2O (Tg denotes teragrams and Gg gigagrams; Fig. 1). Although the majority of all wildfire-induced GHG emissions were still caused by cropland fires, the proportions were quite different from those of burned areas. A fifth of CO2 (21.1 %) and CH4 (19.9 %) emissions were caused by forest fires, which was almost double the contribution of this type measured in area. This comes from the differences in background fuel loads as measured in carbon pools between forests and cropland, reported by research on China's terrestrial ecosystems (Tang et al., 2018). An even more substantial proportion of national N2O emissions came from forest fires, reaching 37.1 % of the total (Fig. 1). Wildfire-induced N2O emissions are highly dependent on the ratio of carbon to nitrogen in vegetation fuels, which was higher in woody areas (Vernooij et al., 2021). In comparison to wildfires on other land cover types, grassland fires played a comparatively minor role in wildfire dynamics and emissions.
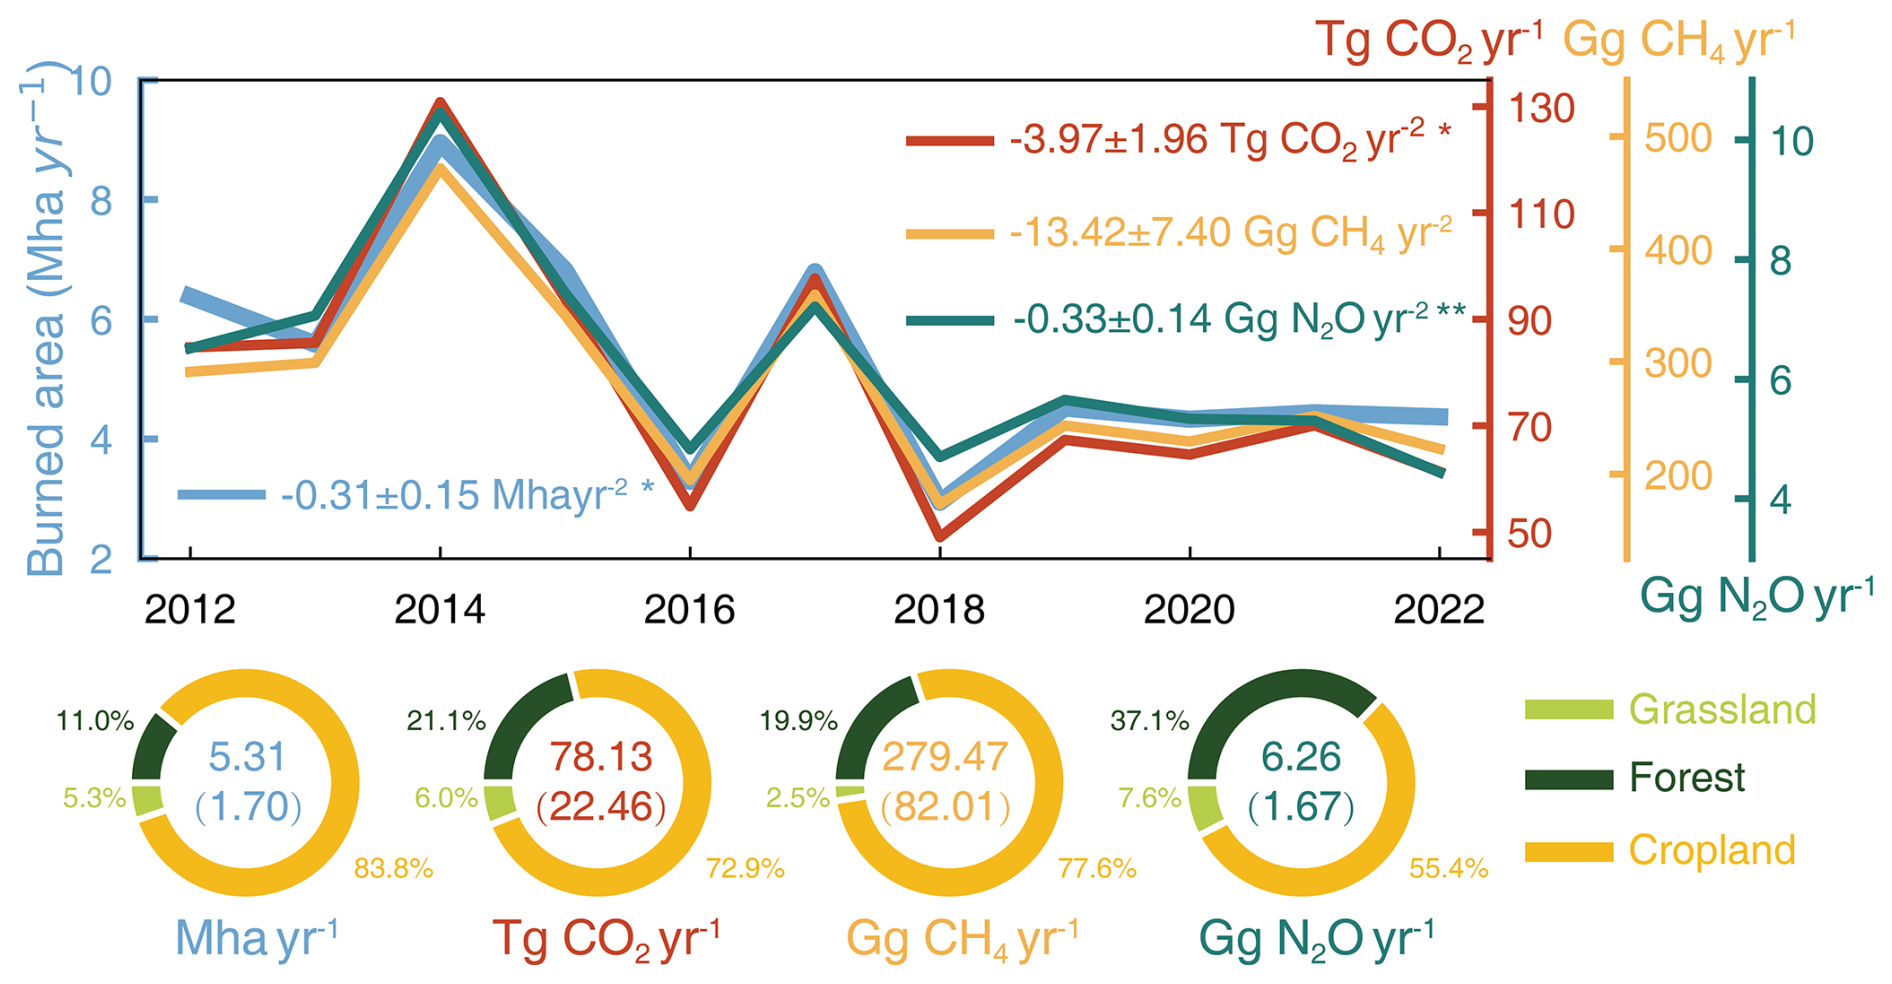
Figure 1The time series and trends of the China burned area and wildfire-induced emissions (CO2, CH4, N2O). The bottom pie charts show the annual averages (standard deviation within the parentheses) and the proportions of different land cover types during the study period. Note that significant trends are denoted by asterisks (* p < 0.1 and p < 0.05).
During this period, the dataset recorded a declining trend of −0.31 ± 0.15 Mha yr−2 (p < 0.1) (Fig. 1). All vegetation wildfires decreased at different magnitudes, resulting in pervasive and slightly different declines in the three greenhouse gases. Agricultural fires were gradually limited and demonstrated a decline in burned area of −0.26 ± 0.14 Mha yr−2. Affected by the variations in agricultural fires, our dataset exhibited a statistically insignificant decline during the study period, with rates of −2.41 ± 1.81 Tg CO2 yr−2, −8.97 ± 6.96 Gg CH4 yr−2, and −0.15 ± 0.11 Gg N2O yr−2 during the study period. Compared with cropland, burned area and all three types of wildfire-induced greenhouse gases in forests and grasslands dropped significantly and rapidly. The decline in forest fires contributed to nearly a third (CO2 at −1.22 ± 0.36 Tg yr−2, p < 0.01, and CH4 at −3.93 ± 1.21 Gg yr−2, p < 0.05) and a half (N2O at −0.15 ± 0.05 Gg yr−2, p < 0.05) of the total trends of emissions (Fig. S3). The grassland contributed to a smaller degree for all these GHGs (CO2 at −0.34 ± 0.08 Tg yr−2, p < 0.01; CH4 at −0.51 ± 0.13 Gg yr−2, p < 0.01; and N2O at −0.03 ± 0.01 Gg yr−2, p < 0.01) within the past decade.
The outcomes derived from diverse regions and land cover types underscored the finding that those fires originating within cropland significantly dominated the overarching dynamics of national wildfires and emissions. A spatiotemporal association was assumed to exist between agricultural activities, particularly those related to planting and harvesting preparations, and the incidence of wildfires. Throughout our study period, the majority of all three types of GHG were concentrated in the first half of the year. More than half of the annual CO2 emissions from wildfires were observed from late winter to the middle of spring (February to April), with nearly identical relative proportions of CH4 and N2O. A secondary seasonal peak of wildfire-induced emissions occurred in the harvest seasons in autumn (September to November), accounting for nearly 20 % of the annual total (Fig. 2a). We divided six specific wildfire-induced emissions regions depending on their geographical location and environmental characteristics (Fig. S4 and Table S3). The patterns of double peaks in agricultural fire emissions in northeast China had a significant impact on national emission levels. During the major emission season, three-quarters of the region's total annual amount was emitted. It is important to note that the temporal patterns are closely associated with the local sowing and harvesting seasons (Fig. 2b) (Cheng et al., 2022; Wang et al., 2020). Similarly in north China, the major peak occurred in early summer (May and June), while the secondary peak was in mid-autumn (September and October). Totals of 2.75 and 1.65 Tg of annual CO2 emissions induced by agricultural fires were concentrated during these respective time periods. East China displayed disparate seasonal patterns, with the majority of agricultural fires occurring during the summer, when the planting and harvesting were carried out in double-season paddy rice fields in this area (Fig. 2b) (Pan et al., 2021; Wu et al., 2023). Approximately one-third of the annual regional emissions induced by wildfires were concentrated in June. Consequently, this correlation is validated through the examination of seasonal cycles in wildfire occurrences, which constitute a prominent temporal feature that drives the dynamics of national-scale wildfire-induced emissions (Zhang et al., 2015).
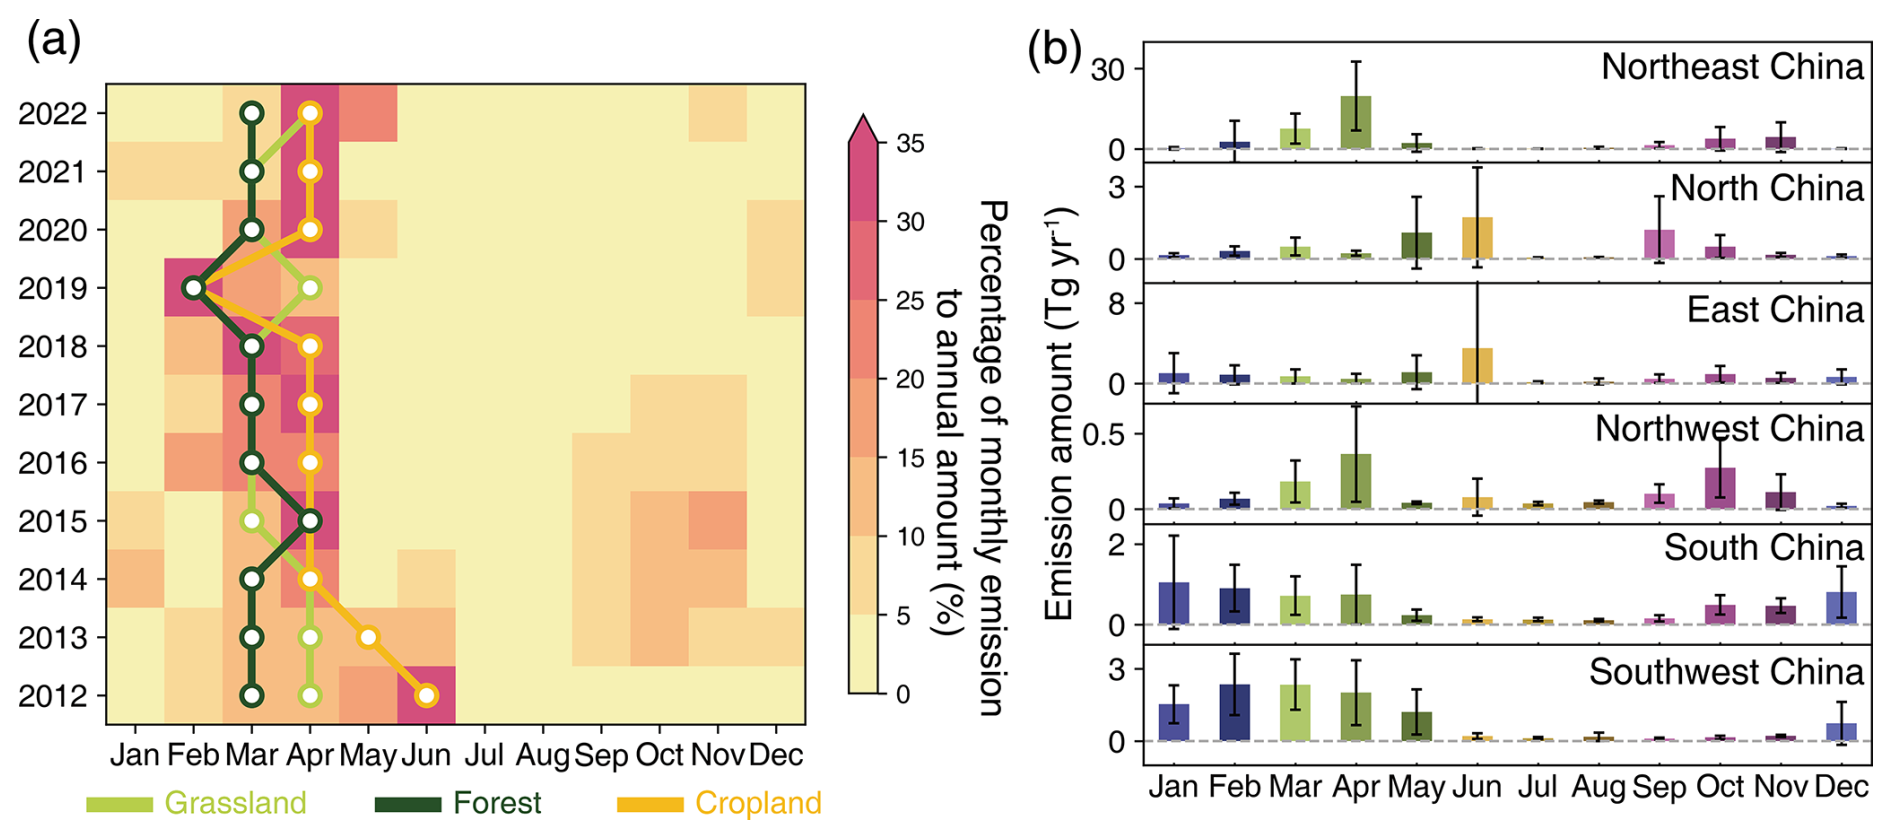
Figure 2(a) Seasonal cycle of national and regional wildfire-induced CO2 emissions. Monthly emission patterns from various land cover types: grassland (green), forest (dark green), and cropland (yellow). The data points connected by lines for different land cover types indicate the peak emission month for each year. The heatmap illustrates emission intensity (unit: arbitrary scale), with redder colors denoting higher emission levels. (b) Average monthly CO2 emissions across six regions of China: northeast China, north China, east China, northwest China, south China, and southwest China. Each region is plotted on distinct y axes to highlight seasonal variations. Four sets of colors represent the four seasons. Detailed regional divisions are introduced in Fig. S4 and their patterns in Fig. 3. Seasonal and interannual patterns for wildfire-induced CH4 and N2O emissions are illustrated in Figs. S5 and S6.
3.2 Spatiotemporal patterns of wildfire and its GHG emissions
To further explore the fire emission dynamics, we calculated the provincial and monthly burned areas and emissions, which were then aggregated to obtain regional and seasonal statistics. The results showed that the national wildfire-induced emissions shared similar patterns for all three GHG types in spite of their large disparities at both spatial and temporal scales. More than four-fifths of the total of domestic wildfire-induced GHG emissions (82.8 % for CO2, 83.2 % for CH4, and 83.6 % for N2O) were located in three primary peaks – in northeast, southwest, and east China, respectively (Fig. 3) – which will be introduced in detail in the upcoming sections.
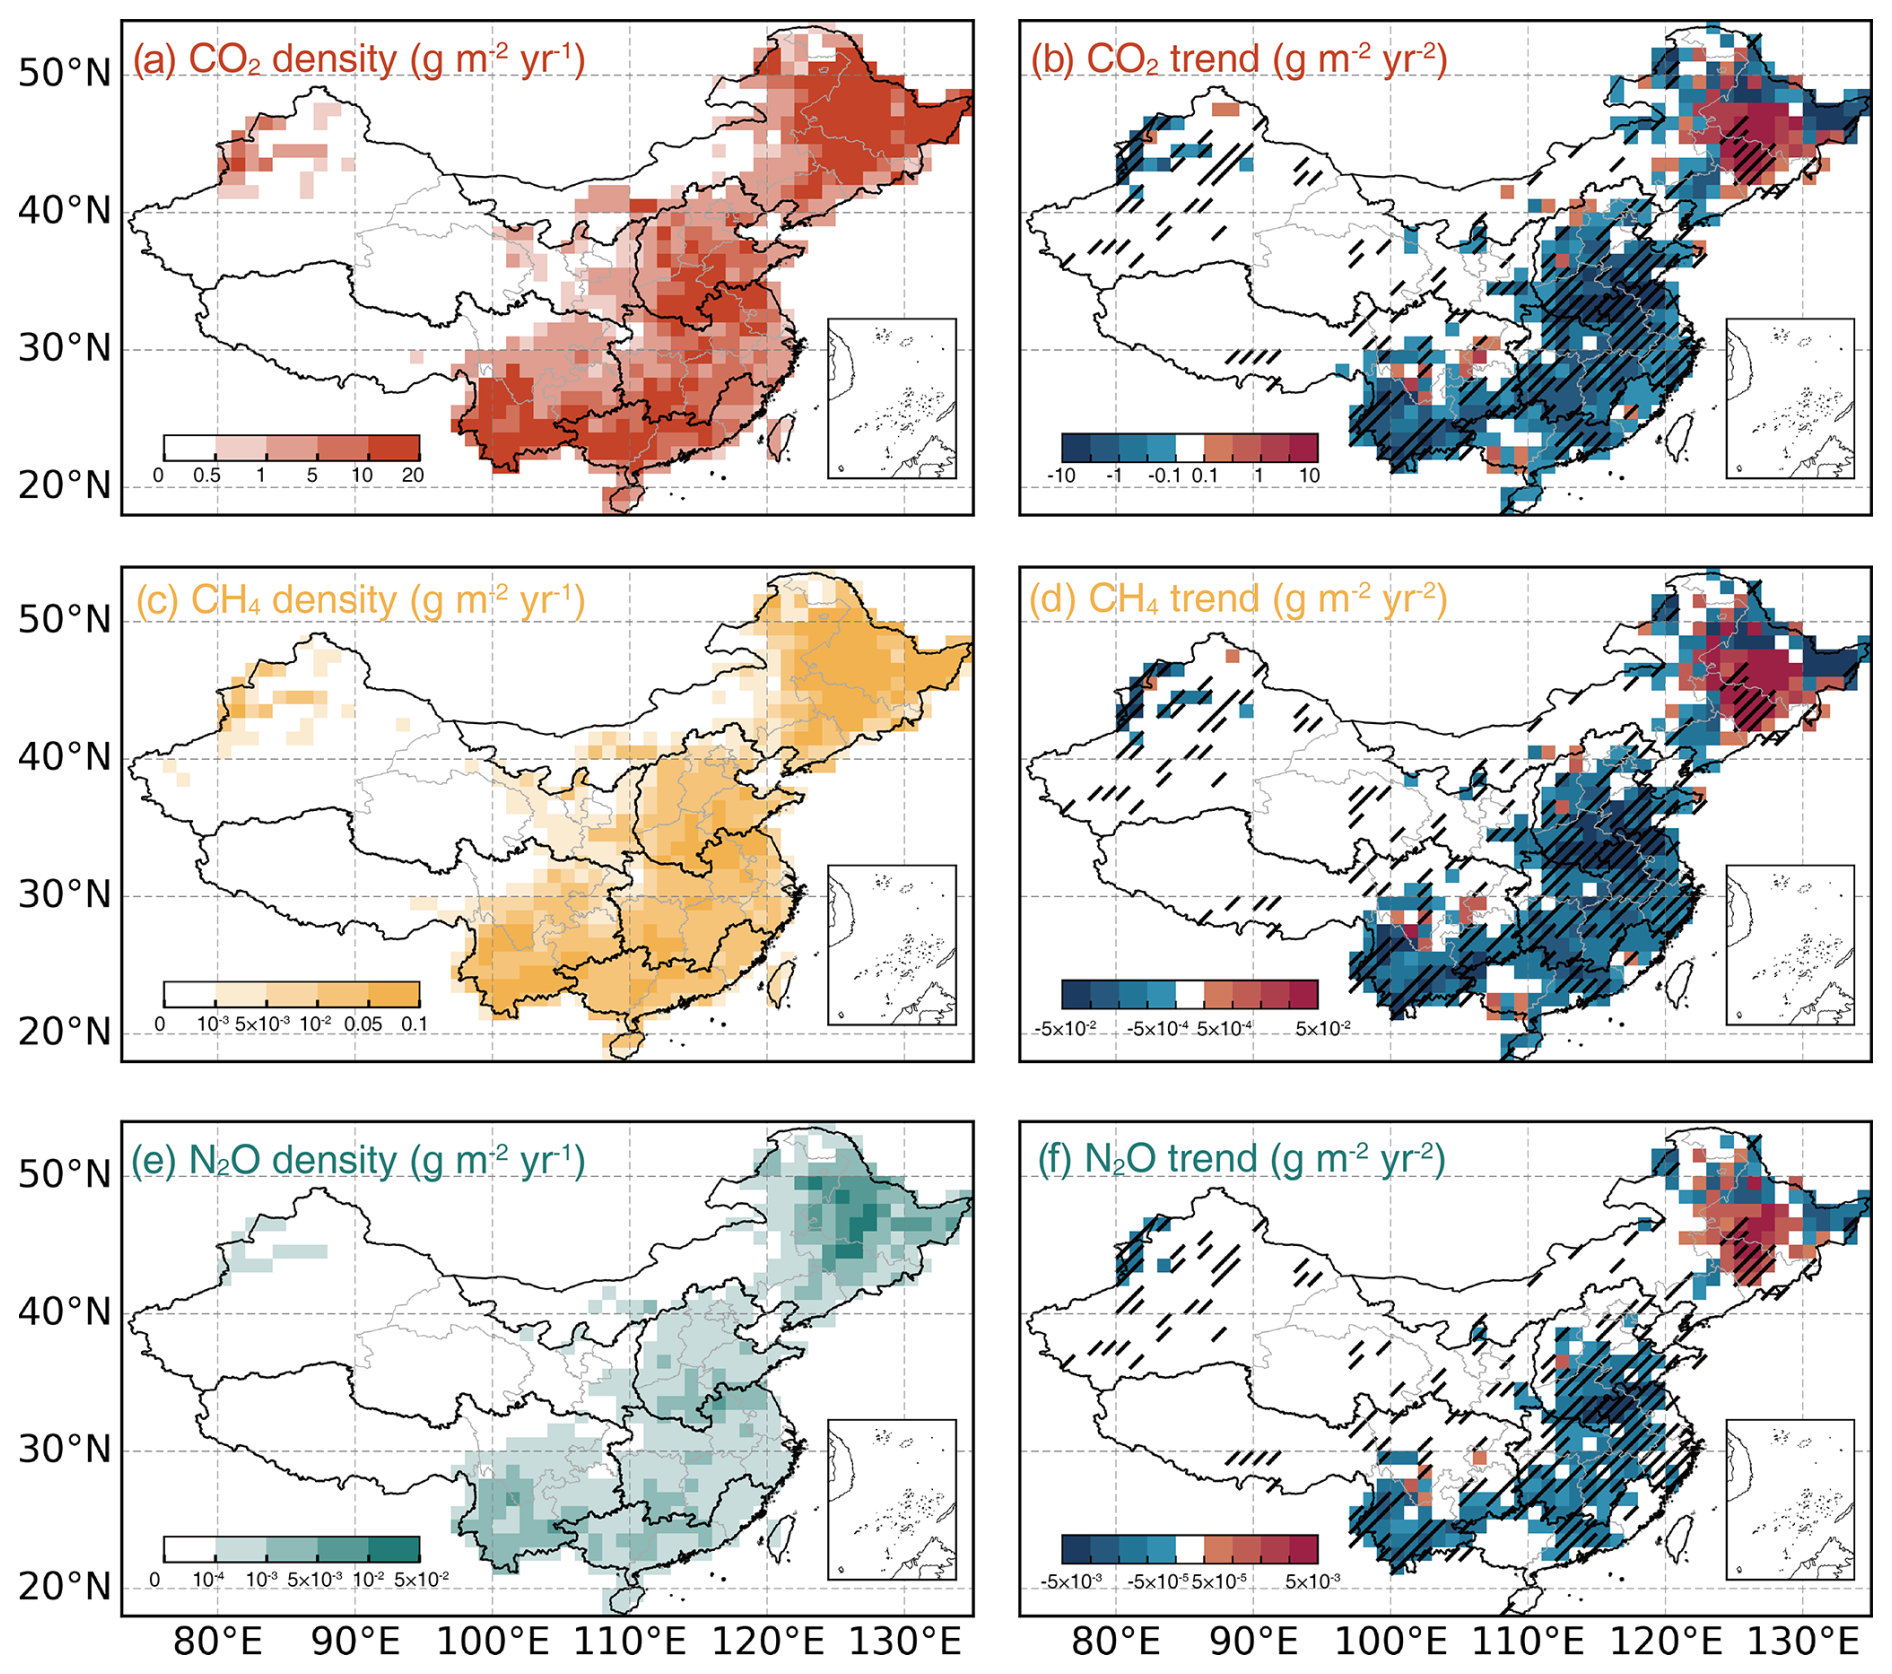
Figure 3Spatial distributions of the density and the trends of wildfire-induced emissions (CO2, CH4, and N2O). Panels (a), (c), and (e) show the density patterns, and panels (b), (d), and (f) show the trends. Their colors correspond to those in Fig. 1. To achieve better visual performance, the maps demonstrate the density patterns and trends in 1° grids, where hatched area indicate significant trends (p < 0.05). Locations of the provinces and regions are described in Fig. S4. Publisher's remark: please note that the above figure contains disputed territories.
Of all six regions, northeast China (Heilongjiang, Jilin, Liaoning, and Inner Mongolia) was affected by the highest wildfire emissions. Heilongjiang and Jilin were the top two provinces not only within the region but also nationwide. Many of the burned areas and emissions were located in vast plains (Songnen, Liaohe, and Sanjiang plains) of northeast China. The vegetation-sourced fire emissions from these two provinces contributed to nearly and of the total domestic emissions, respectively. Moreover, they exhibited a mild increasing trend compared to the national pattern, registering non-significant trends of 0.14 ± 0.15 Mha yr−2 for the burned area and 1.92 ± 1.92 Tg yr−2, 6.94 ± 7.34, and 0.11 ± 0.13 Gg yr−2 for CO2, CH4, and N2O, respectively (Fig. 4). According to data from the National Bureau of Statistics, the four provinces of northeast China have collectively accounted for a quarter of the sown area and grain production over the past decade. The extensive grain cultivation areas, coupled with the widespread practice of burning crop residues for land clearing, have significantly contributed to the high levels of wildfire-induced emissions associated with agricultural land use in northeast China. CO2 emissions from crop residue burning accounted for 82.7 % of the regional total wildfire-induced emissions and 62.5 % of the domestic emissions for this type of burning. The rising trends of agricultural fires constitute the majority of regional wildfire dynamics.
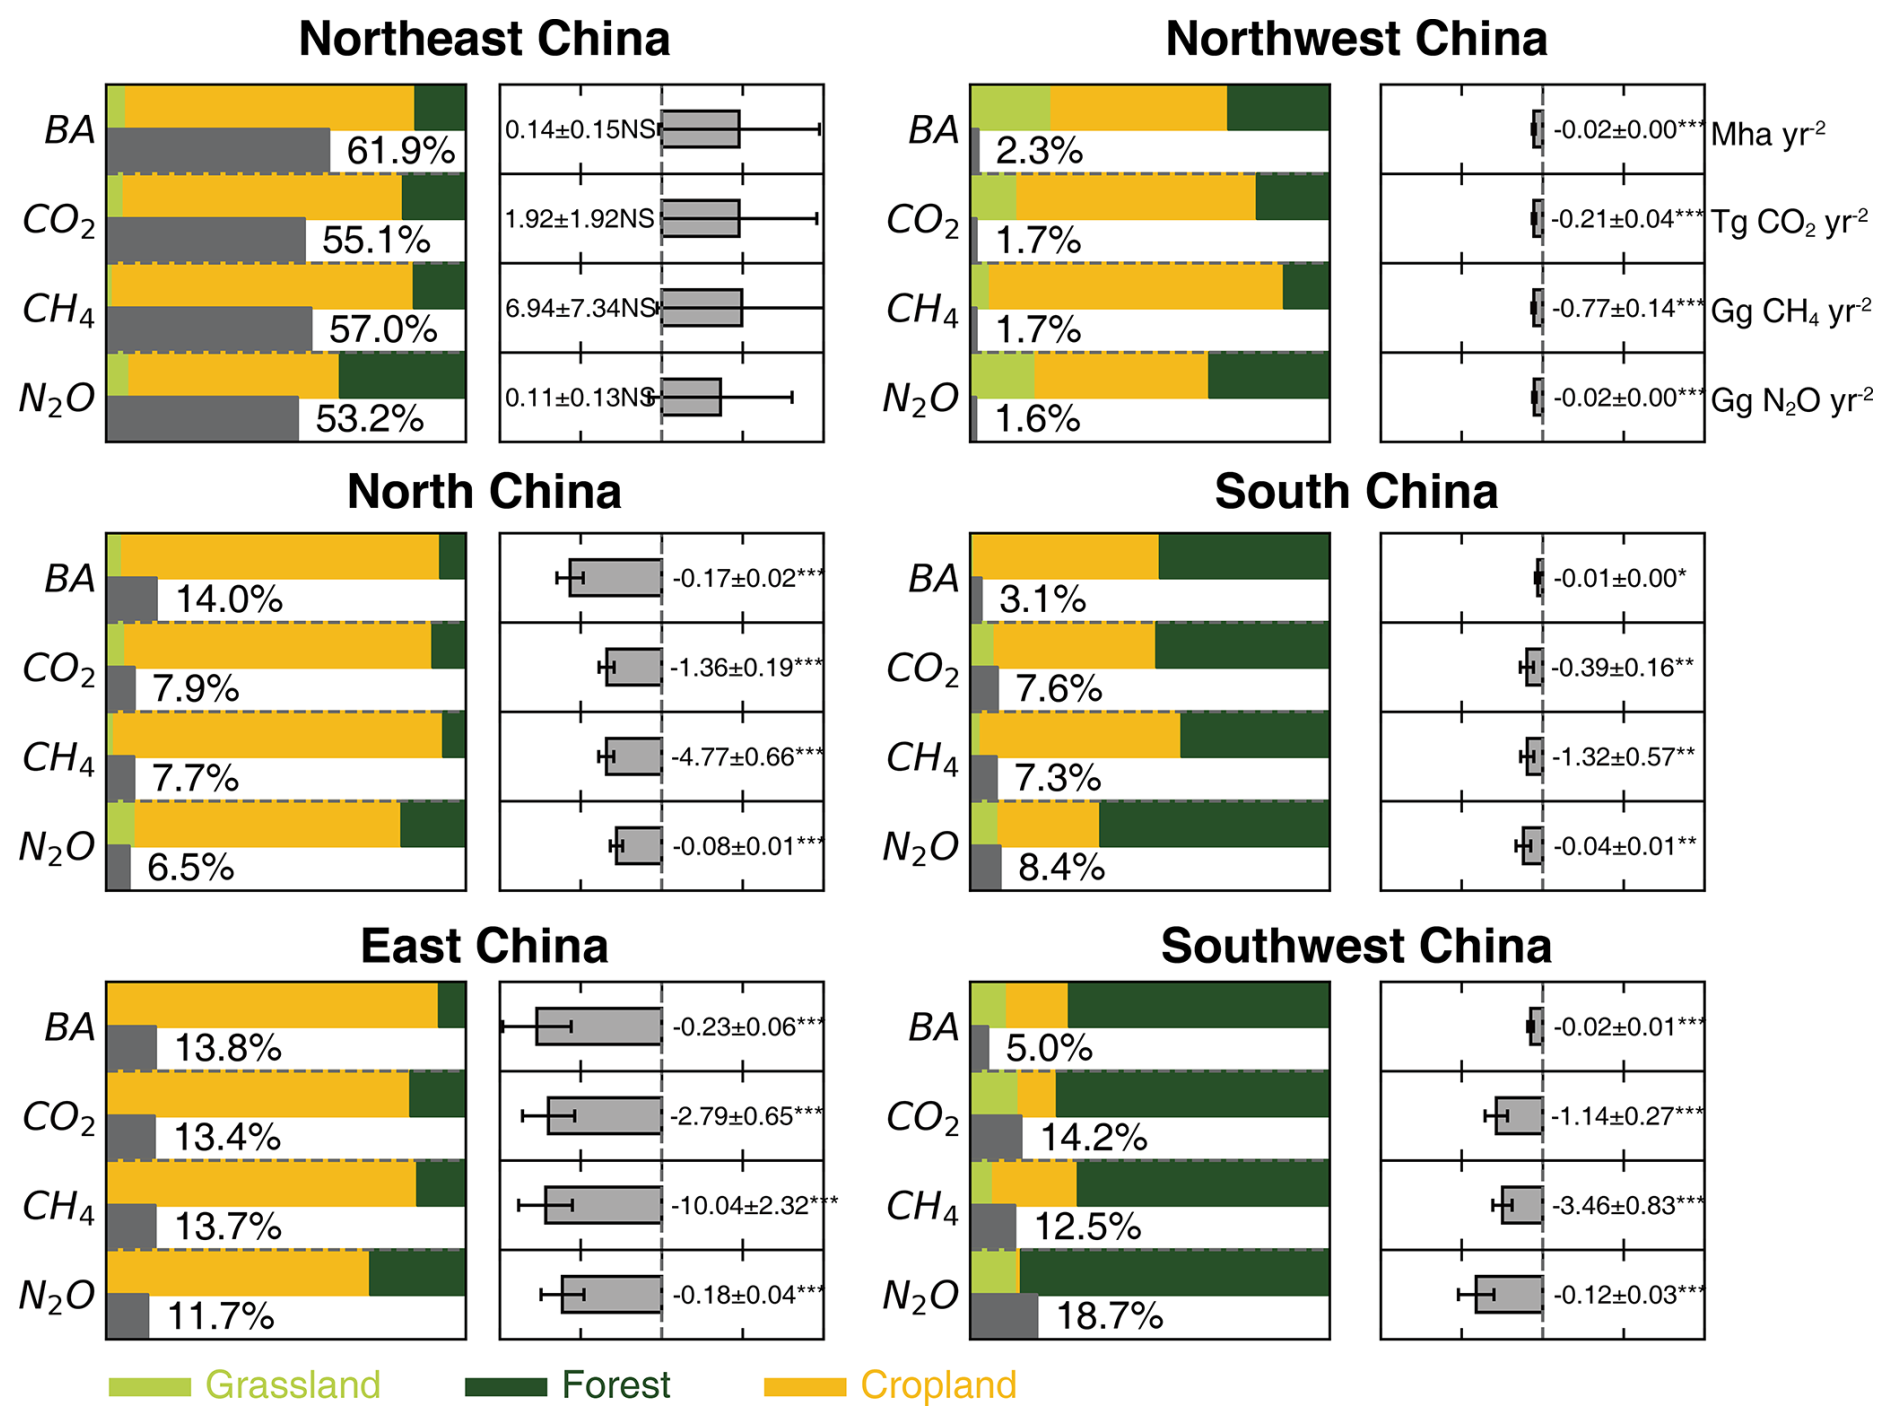
Figure 4Regional quantities of and trends in wildfire occurrences and GHG emissions. The y axes of these subplots represent the four wildfire-related metrics calculated in our study: burned area (BA) and CO2, CH4, and N2O emissions. The colored bars indicate the relative contributions from different land cover types within the regions. The dark-gray bars represent the proportions relative to the national total, with the corresponding values labeled to the side of the bars. Error bars in the right panels of each subplot depict the trends over the period from 2012 to 2022. Significant trends are denoted by asterisks (* p < 0.1, p < 0.05, p < 0.01; NS indicates non-significant trends).
Fires have been controlled over an average of 0.27 Mha of burned area per year through systematic fire and forest management in northeast China (Figs. 3 and 4). For comparison, a single fire event, namely the 1987 Great Black Dragon Fire, destroyed 1.33 Mha of forests and resulted in nearly 200 fatalities (Zhao et al., 2020; Zong et al., 2022). Boreal forest wildfires led to emissions of 5.28 Tg CO2, 19.44 Gg CH4, and 0.94 Gg N2O, constituting 12.3 % of the total wildfire-induced emissions of this region. This amount was also equivalent for nearly 90 % of the boreal forest wildfire emissions nationwide. Grassland fires in northeast China, specifically in the Hulun Buir and Xilingol grasslands, attracted national attention, accounting for a significant proportion of the total burned area (67.2 %) and wildfire-induced emissions (46.7 %).
Southwest China, covering five provincial administrative areas (Yunnan, Sichuan, and Guizhou provinces; Chongqing; and the Xizang Autonomous Region), was the second-largest regional-scale emitter of fire-sourced greenhouse gases (Fig. 3). This region stands out as the only area where agricultural wildfires did not dominate; instead, temperate forest fires emitted more than all the other vegetation fires in this region (Fig. 4) (Cui et al., 2022; Ying et al., 2021). Yunnan Province, a pivotal player in shaping the wildfire dynamics of this region, contributed substantially, with an annual burned area of 0.16 Mha, emitting 7.57 Tg CO2, 23.13 Gg CH4, and 0.81 Gg N2O. These figures accounted for over 60 % of the regional burned area and wildfire-induced emissions. From the perspective of recent trends, this province contributed to 82.4 % of the regional decrease in burned area and an even larger share of the reduction in wildfire-induced emissions. The border fires showed some shared similarities in fire-spreading mechanisms and environmental factors between this region and the adjoining area of mainland Southeast Asia, a global wildfire hotspot. However, in comparison to Southeast Asian countries, southwest China had fewer and weaker fire activities related to rapid land cover changes and massive relevant wildfires, involving activities such as slash-and-burn agriculture, commercial forest loss, and drainage in peatlands (Curtis et al., 2018; Page et al., 2022). The occurrences of forest fires usually arose from occasional personal activities or fire-related cultural traditions (Ying et al., 2021). On the other hand, due to recent implementations of fire policies and long-standing efforts from firefighting teams, southwest China has experienced a significant decline in forest fires, with a decrease of −0.02 ± 0.00 Mha yr−2 (p < 0.01) for burned area and −0.74 ± 0.23 Tg yr−2 (p < 0.05), −2.38 ± 0.74 Gg yr−2 (p < 0.05) for CO2, CH4, and N2O, respectively. This reduction accounts for more than 65 % of national declines in forest fires.
East China is another peak region of fire activities in terms of both burned area and wildfire-induced emissions in our study. This region contains six provinces or municipalities – Anhui, Jiangsu, Zhejiang, Hunan, Hubei, and Shanghai – where more than 70 % CO2 wildfire emissions came from crop residue burning except for in Zhejiang Province. Similarly to north China (Hebei, Henan, Shandong, Beijing, and Tianjin), wildfire patterns in east China feature high intensity in agriculturally sourced fire emissions, with a total amount of more than 10 Tg of wildfire-emitted CO2, especially concentrated in the Huanghuai Plain, namely the connected area of Shandong, Henan, Jiangsu, and Anhui. Together, these two regions (east China and north China) contain half of the national sown area and grain production and account for 30.8 % of cropland burned area and 25.4 % of wildfire-induced CO2 emissions (Fig. 4). During our study period, both regions had significant declines in agricultural fires, at more than −0.22 ± 0.06 Mha yr−2 (p < 0.01) and −0.17 ± 0.02 Mha yr−2 (p < 0.01) for east and north China, respectively. The decreasing burned area for cropland led to emissions of −2.52 ± 0.64 Tg CO2 yr−2 (p<0.01), −9.17 ± 2.28 Gg CH4 yr−2 (p < 0.01), and 0.15 ± 0.04 Gg N2O yr−2 (p < 0.01) in east China. By contrast, there was an average of 0.59 Mha yr−1 burned area because of forest fires in east China, 3 times higher than that in north China. This further contributed to significantly higher wildfire-induced emission reductions, reaching −1.57 Tg CO2 yr−1, −5.03 Gg CH4 yr−1, and −0.19 Gg N2O yr−1.
3.3 Comparison with other results
To assess the outcomes of our dataset, we conducted a comparative analysis by juxtaposing our estimations with those from different studies or products. Our overall emission estimates demonstrate moderate values, where the amount attributed to agricultural fires was notably lower compared to former estimates. On average, the quantities reported in regional- to national-scale studies were at least 3 times higher than our results (Hong et al., 2023; Li et al., 2022; Wu et al., 2018). As previously mentioned, these studies employed CYBAs, whereby the estimates of burned crop residues are calculated by multiplying the crop production derived from statistical data, the grain-to-straw ratio from field-based analysis, and the proportion of crop residues burned in the field using empirical summaries. Previous studies have found that the use of very high residue burning ratios could be the reason for overestimates when compared with results based on categorized cropland maps (Zhang et al., 2020). Directly utilizing active-fire pixels as proxies for the effects of fire activities can lead to higher values, thereby contributing to an increase in emission estimates. To address this, we employed an advanced satellite active-fire dataset for crucial supplementary observations. This dataset allowed us to refine burned-area estimates by reconstructing external burned regions outside the area of the original burned-area data. We achieved this using circular kernels centered on active-fire records, aligning with national wildfire dynamics and the dominance of agricultural or small-sized fires. Two independent active-fire products and the MCD64 Burned Area product were incorporated as a baseline to make intercomparisons (Fig. 5). The sum of the pixel area from MOD14 and VIIRS S-NPP active-fire products was translated into 6.77 ± 1.60 and 8.20 ± 2.07 Mha yr−1 (Giglio et al., 2018, p. 6; Schroeder et al., 2014). As a result, the burned-area calculation by directly counting all active-fire pixels was at least 27.5 % higher than our result.
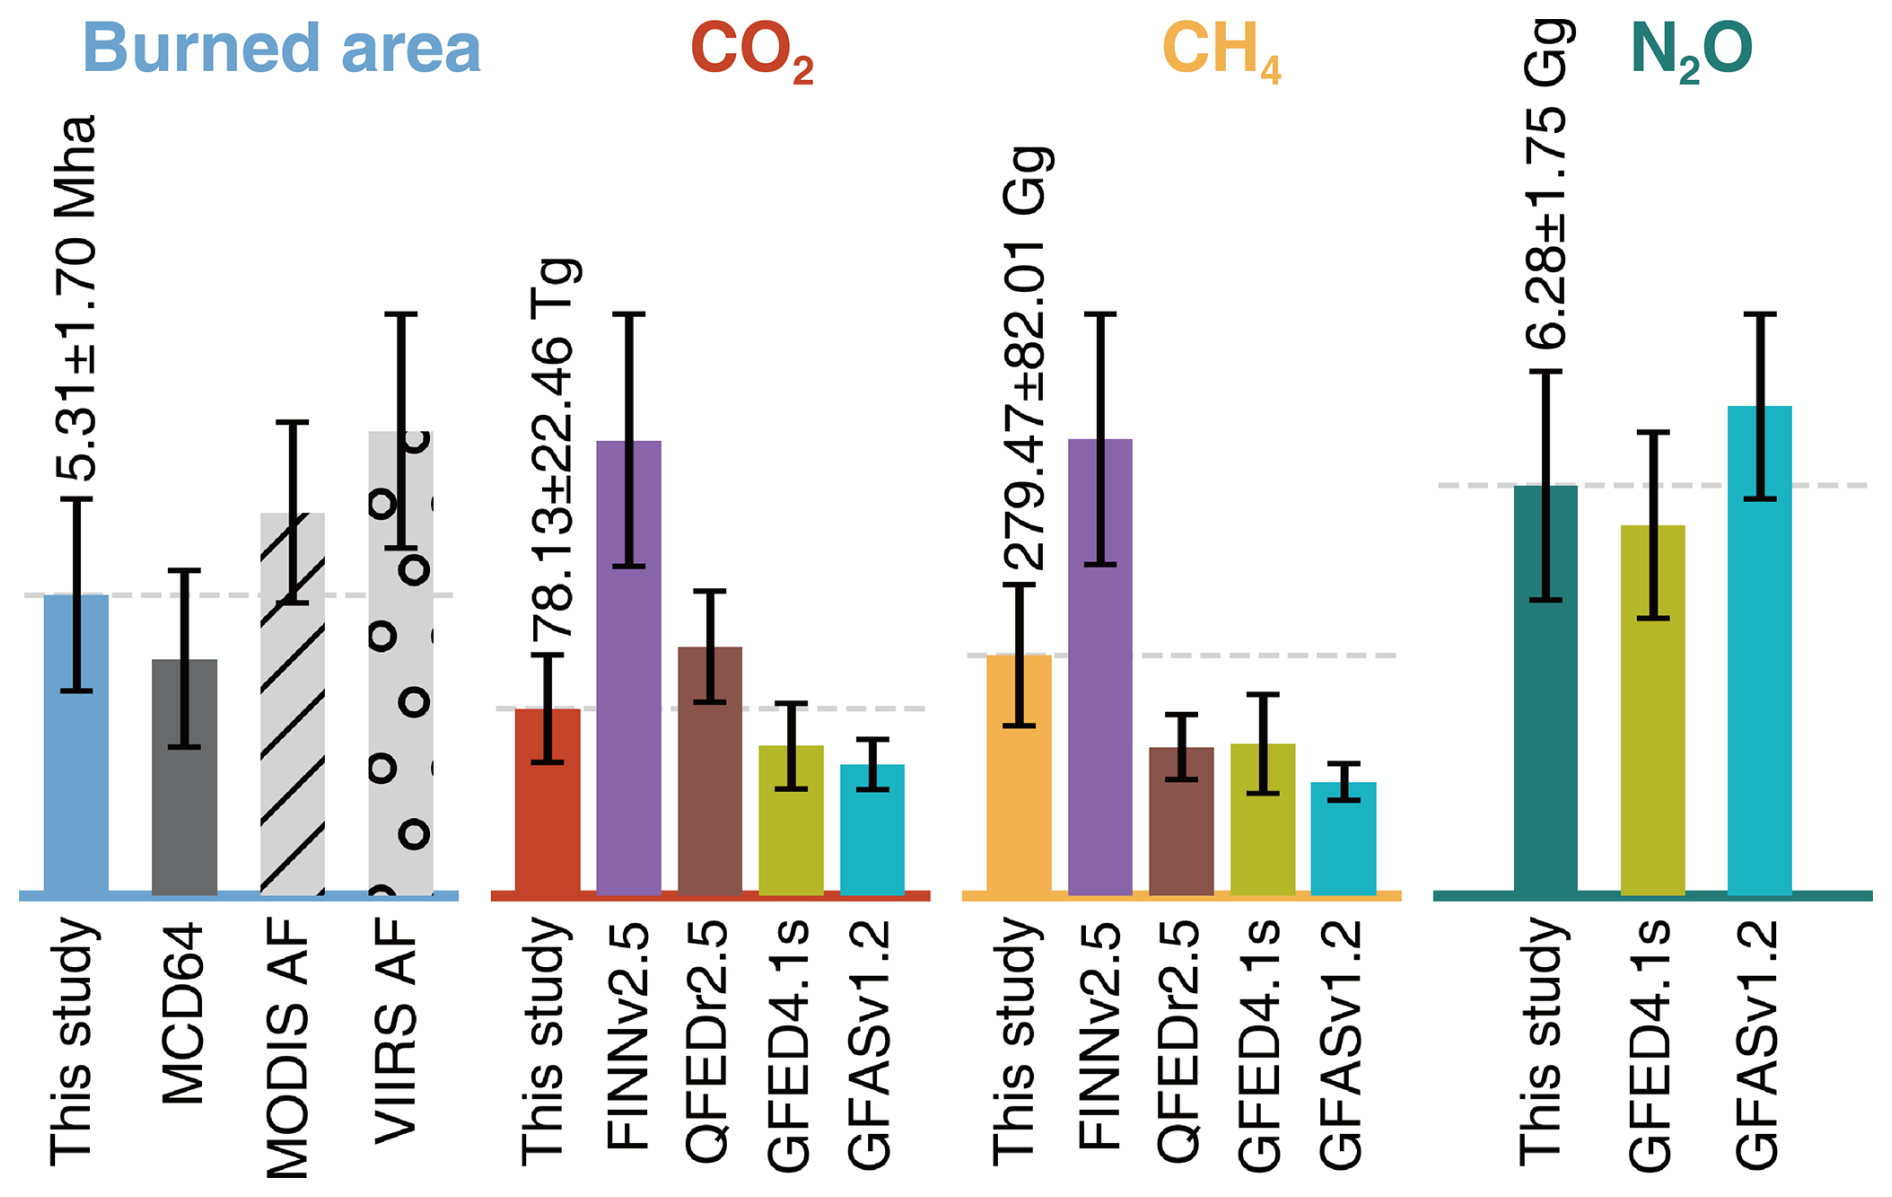
Figure 5Comparisons with global fire emission products as well as the burned-area baseline calculation with the direct use of satellite datasets. The categories and the products are marked in titles and on the x axis, respectively.
Expanding to a broader scope, various global fire emission inventories have been developed using different model settings. We selected four widely used products: (1) the Global Fire Emissions Database (GFED version 4.1s with small fire boosting) (van der Werf et al., 2017), (2) the Fire INventory from NCAR (FINN version 2.5) (Wiedinmyer et al., 2023), (3) the Global Fire Assimilation System (GFAS version 1.2) (Kaiser et al., 2012), and (4) the Quick Fire Emissions Dataset (QFED version 2.5) (Koster et al., 2015). They employ either burned-area-based approaches (GFED and FINN) or fire-energy-based approaches (QFED and GFAS). Our results maintain ranges similar to those of other global products (Fig. 5). The refined calculation for burned-area estimates yielded higher values than the sole use of burned-area products and lower values than those only consisting of active-fire products (see details in Methods). Correspondingly, the GHG emissions were different as well when the active-fire-dominated product FINN had higher estimates than ours. GFED demonstrated 64.3 % to 90.3 % of the results from ChinaWED in the emissions from the three GHGs.
4.1 Factors influencing the changes in wildfire seasonal cycles
In China, regulations and policies substantially impact anthropogenic activities and thus the spatiotemporal distribution of the occurrences of wildfires and emissions. In the agricultural department, policies have addressed the issue of straw burning due to its extensive aerosol and greenhouse gas emissions. In the early 21st century, a specific law for the prevention of air pollution was published, followed by the releases of regulations on the comprehensive utilization of straw (Wu et al., 2018; Zhang et al., 2015). The national-scale Air Pollution Prevention and Control Action Plan was initiated in 2013, with regional amendments progressively moving from a “legitimate burning” policy to “strict prohibition” (Geng et al., 2021). Since the enactment of stricter regulations on straw burning under the framework of the second revision of the Atmospheric Pollution Prevention and Control Law in 2016, significant progress has been made in controlling agricultural fires. Comprehensive control measures, especially in the agricultural sector, have substantially contributed to a rapid decline in the estimated burned area at the national scale. Between 2012 and 2016, the annual burned area decreased dramatically from 6.46 Mha yr−1 before 2016 to 3.89 Mha yr−1 after 2016. Another consequential effect of the implementation of these banning policies has been shifts in burning seasons (Ding et al., 2019; Zhang et al., 2020). Despite northeast China being the only region with trends contrary to the national declines, a shift in the primary burning season from autumn to spring was also observed in this area after 2013 due to the implementation of straw-burning bans (Cheng et al., 2022; Wang et al., 2020).
It has been reported that there has been a noticeable decline in the global burned area, driven by the expansion and intensified capital management of agricultural land use (Andela et al., 2017). Since the beginning of the 21st century, there has also been a growing emphasis on fire management from both administrative bodies and scientific communities in China. This evolution has contributed to the more stringent implementation of measures, particularly in controlling ignition sources in agricultural practices and forest and grassland areas. From local fire suppression measures to national ignition-proof initiatives, efforts have been progressively employed to bring forest fires under control (Chen et al., 2019; Ying et al., 2018). In comparison with forest fire dynamics reported in previous studies that focused on the first decade of this century, the southern part of China has experienced a significant decline in burned area as well as in wildfire-induced emissions (Wang et al., 2023b; Ying et al., 2018; Zong et al., 2022), but the establishment and improvement of legal systems and infrastructure for forest and grassland fire prevention dealing with uncontrolled transboundary fires remain challenging. Nationally, an area of 0.07 Mha yr−1 has been affected within a 10 km buffer zone near the borders with neighboring countries. This accounted for 1.3 % of the domestic burned area and contributed to emissions of 1.03 Tg yr−1 CO2, 3.35 Gg yr−1 CH4, and 0.09 Gg yr−1 N2O.
4.2 Improvements of ChinaWED compared to previous studies
As described already, we refined our estimates of emission factors, fuel loadings, and burned area, mainly with a set of more localized parameters and advanced satellite-based observations. Fuel loadings in these previous global products are mainly derived from biogeochemical models. According to recent studies, the use of aboveground biomass (AGB) as a proxy for fuel loadings can enable indirect estimations of dry matter and improve fire emission estimates (Di Giuseppe et al., 2021). We thus used a high-resolution harmonized carbon density map that was consistently and seamlessly reported across a wide range of vegetation types based on the relative spatial extent of each type. The emission factor is a scalar that evaluates the ratio between emissions and the total amount of dry matter that was consumed during burning processes. In this study, in addition to the previously summarized emission factors, we collected field-based research in China and neighboring countries and recompiled values into a new table of wildfire emission factors for different land cover types. A detailed selection of these components can be found in Table S2. Although the use of AGB as a fuel load proxy has demonstrated superior performance compared to vegetation models or estimations derived from fire radiative power (FRP; Di Giuseppe et al., 2021), it is crucial to highlight that our current model relies entirely on a static AGB dataset. This limitation creates a scenario where fuel loads have few impacts on the variability in emission estimates. Future improvements could be achieved by integrating dynamic input products and enhancing the precision of AGB estimations in croplands.
Additionally, in the estimates of burned area, ChinaWED leveraged the sensitivity of active-fire products with higher spatial resolution and developed a new set of calculation methods that were suitable for smaller fires. The global products had different frameworks. FINN focuses on active-fire detection clusters joined for the determination of extended burned areas, and the burned area from GFED is mainly derived based on a linear combination of the distribution of active-fire and original burned-area data. QFED and GFAS utilize fire energy as the intermediate product to represent the effects of fires for estimating wildfire-induced emissions. These models employ empirical continuous functions to incorporate discrete observations and calculate the temporal integral of fire radiative power (FRP). Furthermore, ChinaWED is designed for the analysis of wildfire-induced GHG emissions. Most products reported wildfire-induced CO2 and CH4 emissions, while only two of them provided N2O emission estimates (Fig. 5).
Wildfire is one of the most common land-surface disturbances to ecological and socioeconomic processes. It combusts vegetation and releases greenhouse gases and aerosols. Employing a burned-area-based approach, we featured multisource fire locations, updated emission factors, and high-resolution fuel load maps to generate a new China wildfire emission dataset. The wildfire dynamics showed that during the past decade, an average of 5.31 ± 1.70 Mha of burned area and emissions of 78.13 ± 22.46 Tg CO2 yr−1, 279.47 ± 82.01 Gg CH4 yr−1, and 6.26 ± 1.67 Gg N2O yr−1 were observed. At the national scale, the spatiotemporal characteristics of fire occurrences were markedly influenced by agricultural activities, which contributed to more than four-fifths of burned area and at least half of greenhouse gas emissions. Extensive agricultural fires played an important role in shaping the seasonal cycle of wildfire emissions (Hong et al., 2023; Xu et al., 2023). Northeast, north, and east China emerged as hotspots for this type of fire, with a major peak in emissions occurring in mid-spring to early summer. We observed a rapid and significant decline in burned area and wildfire-induced emissions in vast areas in China, which may be largely attributed to the implementation of fire prevention and bans on straw burning. Notably, the relative declining rate of burned area, translating into around 5.8 % yr−1, was 4 times higher than the global average (Andela et al., 2017). Northeast China was the only region with an opposite trend, suggesting a situation that requires more adaptive policies rather than mandatory bans. Compared with estimations by other studies and global products, our results have moderate values, largely caused by the mismatches in burned area and estimates of burned crop residues. Overall, the calculation of burned area for small-sized fire activities and the recalibrated emission factors, tailored for wildfires in China, contribute to the findings of this study. These results offer new insights into the spatiotemporal patterns of China's wildfire-induced greenhouse gas emissions and provide important estimates as a part of the budget for national terrestrial ecosystems. Future updates will focus on integrating additional field-based studies and refining the estimates of various burning processes.
Python code for this model can be obtained from https://doi.org/10.5281/zenodo.13800556 (Lin and Wang, 2024) (Python version 3.11.6). Key packages used in the code include rasterio (version 1.3.9), NumPy (version 1.25.2), pandas (version 2.1.3), and SciPy (version 1.10.1). Fire products include MCD64A1.061 (https://doi.org/10.5067/MODIS/MCD64A1.061, Giglio et al., 2021) and VIIRS S-NPP Active Fire (https://doi.org/10.1016/j.rse.2013.12.008, Schroeder et al., 2014). Aboveground biomass data are available from https://doi.org/10.1038/s41597-020-0444-4 (Spawn et al., 2020). Different crop types are available from double-season paddy rice (https://doi.org/10.3390/rs13224609, Pan et al., 2021), single-season rice (https://doi.org/10.57760/sciencedb.06963, Shen et al., 2025), maize (https://doi.org/10.6084/m9.figshare.17091653.v4, Shen et al., 2021), winter wheat (https://doi.org/10.6084/m9.figshare.12003990.v2, Dong et al., 2020b), and sugarcane (https://doi.org/10.3390/rs14051274, Zheng et al., 2022).
The supplement related to this article is available online at https://doi.org/10.5194/gmd-18-2509-2025-supplement.
ZL and XW designed the experiments, and ZL carried them out. ZL developed the model code and performed the calculation. ZL, LH, and XW validated the results. ZL prepared the manuscript, with contributions from all co-authors.
The contact author has declared that none of the authors has any competing interests.
Publisher’s note: Copernicus Publications remains neutral with regard to jurisdictional claims made in the text, published maps, institutional affiliations, or any other geographical representation in this paper. While Copernicus Publications makes every effort to include appropriate place names, the final responsibility lies with the authors.
This research has been supported by the National Natural Science Foundation of China (grant no. 42171096) and the Ministry of Education's Scientific Research Innovation Capability Support Project for Young Faculty (ZYGXQNJSKYCXNLZCXM-S2). Support has also been provided by the High-Performance Computing Platform of Peking University.
This paper was edited by Yilong Wang and reviewed by two anonymous referees.
Andela, N., Morton, D. C., Giglio, L., Chen, Y., van der Werf, G. R., Kasibhatla, P. S., DeFries, R. S., Collatz, G. J., Hantson, S., Kloster, S., Bachelet, D., Forrest, M., Lasslop, G., Li, F., Mangeon, S., Melton, J. R., Yue, C., and Randerson, J. T.: A human-driven decline in global burned area, Science, 356, 1356–1362, https://doi.org/10.1126/science.aal4108, 2017.
Bauters, M., Drake, T. W., Wagner, S., Baumgartner, S., Makelele, I. A., Bode, S., Verheyen, K., Verbeeck, H., Ewango, C., Cizungu, L., Van Oost, K., and Boeckx, P.: Fire-derived phosphorus fertilization of African tropical forests, Nat. Commun., 12, 5129, https://doi.org/10.1038/s41467-021-25428-3, 2021.
Beck, H. E., Zimmermann, N. E., McVicar, T. R., Vergopolan, N., Berg, A., and Wood, E. F.: Present and future Köppen-Geiger climate classification maps at 1-km resolution, Scientific Data, 5, 180214, https://doi.org/10.1038/sdata.2018.214, 2018.
Chen, A., Tang, R., Mao, J., Yue, C., Li, X., Gao, M., Shi, X., Jin, M., Ricciuto, D., Rabin, S., Ciais, P., and Piao, S.: Spatiotemporal dynamics of ecosystem fires and biomass burning-induced carbon emissions in China over the past two decades, Geography and Sustainability, 1, 47–58, https://doi.org/10.1016/j.geosus.2020.03.002, 2020.
Chen, C., Park, T., Wang, X., Piao, S., Xu, B., Chaturvedi, R. K., Fuchs, R., Brovkin, V., Ciais, P., Fensholt, R., Tommervik, H., Bala, G., Zhu, Z., Nemani, R. R., and Myneni, R. B.: China and India lead in greening of the world through land-use management, Nature Sustainability, 2, 122–129, https://doi.org/10.1038/s41893-019-0220-7, 2019.
Cheng, Y., Cao, X., Liu, J., Yu, Q., Zhong, Y., Geng, G., Zhang, Q., and He, K.: New open burning policy reshaped the aerosol characteristics of agricultural fire episodes in Northeast China, Sci. Total Environ., 810, 152272, https://doi.org/10.1016/j.scitotenv.2021.152272, 2022.
Cui, L., Luo, C., Yao, C., Zou, Z., Wu, G., Li, Q., and Wang, X.: The Influence of Climate Change on Forest Fires in Yunnan Province, Southwest China Detected by GRACE Satellites, Remote Sensing, 14, 712, https://doi.org/10.3390/rs14030712, 2022.
Curtis, P. G., Slay, C. M., Harris, N. L., Tyukavina, A., and Hansen, M. C.: Classifying drivers of global forest loss, Science, 361, 1108–1111, https://doi.org/10.1126/science.aau3445, 2018.
Di Giuseppe, F., Benedetti, A., Coughlan, R., Vitolo, C., and Vuckovic, M.: A Global Bottom-Up Approach to Estimate Fuel Consumed by Fires Using Above Ground Biomass Observations, Geophys. Res. Lett., 48, e2021GL095452, https://doi.org/10.1029/2021gl095452, 2021.
Ding, A., Huang, X., Nie, W., Chi, X., Xu, Z., Zheng, L., Xu, Z., Xie, Y., Qi, X., Shen, Y., Sun, P., Wang, J., Wang, L., Sun, J., Yang, X.-Q., Qin, W., Zhang, X., Cheng, W., Liu, W., Pan, L., and Fu, C.: Significant reduction of PM2.5 in eastern China due to regional-scale emission control: evidence from SORPES in 2011–2018, Atmos. Chem. Phys., 19, 11791–11801, https://doi.org/10.5194/acp-19-11791-2019, 2019.
Dong, J., Fu, Y., Wang, J., Tian, H., Fu, S., Niu, Z., Han, W., Zheng, Y., Huang, J., and Yuan, W.: Early-season mapping of winter wheat in China based on Landsat and Sentinel images, Earth Syst. Sci. Data, 12, 3081–3095, https://doi.org/10.5194/essd-12-3081-2020, 2020a.
Dong, J., Fu, Y., Wang, J., Tian, H., Fu, S., Niu, Z., et al.: 30 m winter wheat distribution map of China for four years (2016–2019), figshare [data set], https://doi.org/10.6084/m9.figshare.12003990.v2, 2020b.
Friedlingstein, P., O'Sullivan, M., Jones, M. W., Andrew, R. M., Gregor, L., Hauck, J., Le Quéré, C., Luijkx, I. T., Olsen, A., Peters, G. P., Peters, W., Pongratz, J., Schwingshackl, C., Sitch, S., Canadell, J. G., Ciais, P., Jackson, R. B., Alin, S. R., Alkama, R., Arneth, A., Arora, V. K., Bates, N. R., Becker, M., Bellouin, N., Bittig, H. C., Bopp, L., Chevallier, F., Chini, L. P., Cronin, M., Evans, W., Falk, S., Feely, R. A., Gasser, T., Gehlen, M., Gkritzalis, T., Gloege, L., Grassi, G., Gruber, N., Gürses, Ö., Harris, I., Hefner, M., Houghton, R. A., Hurtt, G. C., Iida, Y., Ilyina, T., Jain, A. K., Jersild, A., Kadono, K., Kato, E., Kennedy, D., Klein Goldewijk, K., Knauer, J., Korsbakken, J. I., Landschützer, P., Lefèvre, N., Lindsay, K., Liu, J., Liu, Z., Marland, G., Mayot, N., McGrath, M. J., Metzl, N., Monacci, N. M., Munro, D. R., Nakaoka, S.-I., Niwa, Y., O'Brien, K., Ono, T., Palmer, P. I., Pan, N., Pierrot, D., Pocock, K., Poulter, B., Resplandy, L., Robertson, E., Rödenbeck, C., Rodriguez, C., Rosan, T. M., Schwinger, J., Séférian, R., Shutler, J. D., Skjelvan, I., Steinhoff, T., Sun, Q., Sutton, A. J., Sweeney, C., Takao, S., Tanhua, T., Tans, P. P., Tian, X., Tian, H., Tilbrook, B., Tsujino, H., Tubiello, F., van der Werf, G. R., Walker, A. P., Wanninkhof, R., Whitehead, C., Willstrand Wranne, A., Wright, R., Yuan, W., Yue, C., Yue, X., Zaehle, S., Zeng, J., and Zheng, B.: Global Carbon Budget 2022, Earth Syst. Sci. Data, 14, 4811–4900, https://doi.org/10.5194/essd-14-4811-2022, 2022.
Geng, G., Zheng, Y., Zhang, Q., Xue, T., Zhao, H., Tong, D., Zheng, B., Li, M., Liu, F., Hong, C., He, K., and Davis, S. J.: Drivers of PM2.5 air pollution deaths in China 2002–2017, Nat. Geosci., 14, 645–650, https://doi.org/10.1038/s41561-021-00792-3, 2021.
Giglio, L., Boschetti, L., Roy, D. P., Humber, M. L., and Justice, C. O.: The Collection 6 MODIS burned area mapping algorithm and product, Remote Sens. Environ., 217, 72–85, https://doi.org/10.1016/j.rse.2018.08.005, 2018.
Giglio, L., Justice, C., Boschetti, L., and Roy, D.: MODIS/Terra+Aqua Burned Area Monthly L3 Global 500 m SIN Grid 061 [Data set], NASA EOSDIS Land Processes Distributed Active Archive Center [data set], https://doi.org/10.5067/MODIS/MCD64A1.061, 2021.
Guo, J., Feng, H., Peng, C., Du, J., Wang, W., Kneeshaw, D., Pan, C., Roberge, G., Feng, L., and Chen, A.: Fire effects on soil CH4 and N2O fluxes across terrestrial ecosystems, Sci. Total Environ., 948, 174708, https://doi.org/10.1016/j.scitotenv.2024.174708, 2024.
Hong, X., Zhang, C., Tian, Y., Wu, H., Zhu, Y., and Liu, C.: Quantification and evaluation of atmospheric emissions from crop residue burning constrained by satellite observations in China during 2016–2020, Sci. Total Environ., 865, 161237, https://doi.org/10.1016/j.scitotenv.2022.161237, 2023.
Kaiser, J. W., Heil, A., Andreae, M. O., Benedetti, A., Chubarova, N., Jones, L., Morcrette, J.-J., Razinger, M., Schultz, M. G., Suttie, M., and van der Werf, G. R.: Biomass burning emissions estimated with a global fire assimilation system based on observed fire radiative power, Biogeosciences, 9, 527–554, https://doi.org/10.5194/bg-9-527-2012, 2012.
Koster, R. D., Darmenov, A. S., and da Silva, A. M.: The Quick Fire Emissions Dataset (QFED): Documentation of Versions 2.1, 2.2 and 2.4, NASA/TM–2015–104606, Vol. 38., NASA, https://ntrs.nasa.gov/citations/20180005253 (last access: 23 April 2025), 2015.
Li, J., Li, Y., Bo, Y., and Xie, S.: High-resolution historical emission inventories of crop residue burning in fields in China for the period 1990–2013, Atmos. Environ., 138, 152–161, https://doi.org/10.1016/j.atmosenv.2016.05.002, 2016.
Li, R., He, X., Wang, H., Wang, Y., Zhang, M., Mei, X., Zhang, F., and Chen, L.: Estimating Emissions from Crop Residue Open Burning in Central China from 2012 to 2020 Using Statistical Models Combined with Satellite Observations, Remote Sensing, 14, 3682, https://doi.org/10.3390/rs14153682, 2022.
Li, W., MacBean, N., Ciais, P., Defourny, P., Lamarche, C., Bontemps, S., Houghton, R. A., and Peng, S.: Gross and net land cover changes in the main plant functional types derived from the annual ESA CCI land cover maps (1992–2015), Earth Syst. Sci. Data, 10, 219–234, https://doi.org/10.5194/essd-10-219-2018, 2018.
Lin, Z. and Wang, X.: Code for China Wildfire Emission Dataset (ChinaWED) [Data set], Zenodo [code and data set], https://doi.org/10.5281/zenodo.13800556, 2024.
Liu, Y., Hu, C., Zhan, W., Sun, C., Murch, B., and Ma, L.: Identifying industrial heat sources using time-series of the VIIRS Nightfire product with an object-oriented approach, Remote Sens. Environ., 204, 347–365, https://doi.org/10.1016/j.rse.2017.10.019, 2018.
Liu, Z., Deng, Z., He, G., Wang, H., Zhang, X., Lin, J., Qi, Y., and Liang, X.: Challenges and opportunities for carbon neutrality in China, Nat. Rev. Earth Environ., 3, 141–155, https://doi.org/10.1038/s43017-021-00244-x, 2022.
Noon, M. L., Goldstein, A., Ledezma, J. C., Roehrdanz, P. R., Cook-Patton, S. C., Spawn-Lee, S. A., Wright, T. M., Gonzalez-Roglich, M., Hole, D. G., Rockström, J., and Turner, W. R.: Mapping the irrecoverable carbon in Earth's ecosystems, Nature Sustainability, 5, 37–46, https://doi.org/10.1038/s41893-021-00803-6, 2022.
Page, S., Mishra, S., Agus, F., Anshari, G., Dargie, G., Evers, S., Jauhiainen, J., Jaya, A., Jovani-Sancho, A. J., Laurén, A., Sjögersten, S., Suspense, I. A., Wijedasa, L. S., and Evans, C. D.: Anthropogenic impacts on lowland tropical peatland biogeochemistry, Nature Reviews Earth & Environment, 3, 426–443, https://doi.org/10.1038/s43017-022-00289-6, 2022.
Pan, B., Zheng, Y., Shen, R., Ye, T., Zhao, W., Dong, J., Ma, H., and Yuan, W.: High Resolution Distribution Dataset of Double-Season Paddy Rice in China, Remote Sensing, 13, 4609, https://doi.org/10.3390/rs13224609, 2021.
Rodríguez Vásquez, M. J., Benoist, A., Roda, J.-M., and Fortin, M.: Estimating Greenhouse Gas Emissions From Peat Combustion in Wildfires on Indonesian Peatlands, and Their Uncertainty, Global Biogeochem. Cy., 35, e2019GB006218, https://doi.org/10.1029/2019GB006218, 2021.
Schroeder, W., Oliva, P., Giglio, L., and Csiszar, I. A.: The New VIIRS 375 m active fire detection data product: Algorithm description and initial assessment, Remote Sens. Environ., 143, 85–96, https://doi.org/10.1016/j.rse.2013.12.008, 2014.
Shen, R., Jie, D., Yuan, W., Han, W., Ye, T., and Zhao, W.: A 30-m resolution distribution map of maize for China based on Landsat and Sentinel images, figshare [data set], https://doi.org/10.6084/m9.figshare.17091653.v4, 2021.
Shen, R., Dong, J., Yuan, W., Han, W., Ye, T., and Zhao, W.: A 30 m Resolution Distribution Map of Maize for China Based on Landsat and Sentinel Images, J. Remote Sens., 2022, 1–12, https://doi.org/10.34133/2022/9846712, 2022.
Shen, R., Pan, B., Peng, Q., Dong, J., Chen, X., Zhang, X., Ye, T., Huang, J., and Yuan, W.: High-resolution distribution maps of single-season rice in China from 2017 to 2022, Earth Syst. Sci. Data, 15, 3203–3222, https://doi.org/10.5194/essd-15-3203-2023, 2023.
Shen, R., Pan, B., Peng, Q., et al.: High-resolution distribution maps of single-season rice in China from 2017 to 2022[DS/OL], V7, Science Data Bank data set], https://doi.org/10.57760/sciencedb.06963, 2025.
Spawn, S. A., Sullivan, C. C., Lark, T. J., and Gibbs, H. K.: Harmonized global maps of above and belowground biomass carbon density in the year 2010, Sci. Data, 7, 112, https://doi.org/10.1038/s41597-020-0444-4, 2020.
Tang, X., Zhao, X., Bai, Y., Tang, Z., Wang, W., Zhao, Y., Wan, H., Xie, Z., Shi, X., Wu, B., Wang, G., Yan, J., Ma, K., Du, S., Li, S., Han, S., Ma, Y., Hu, H., He, N., Yang, Y., Han, W., He, H., Yu, G., Fang, J., and Zhou, G.: Carbon pools in China's terrestrial ecosystems: New estimates based on an intensive field survey, P. Natl. Acad. Sci. USA, 115, 4021–4026, https://doi.org/10.1073/pnas.1700291115, 2018.
Vernooij, R., Giongo, M., Borges, M. A., Costa, M. M., Barradas, A. C. S., and van der Werf, G. R.: Intraseasonal variability of greenhouse gas emission factors from biomass burning in the Brazilian Cerrado, Biogeosciences, 18, 1375–1393, https://doi.org/10.5194/bg-18-1375-2021, 2021.
Wang, L., Jin, X., Wang, Q., Mao, H., Liu, Q., Weng, G., and Wang, Y.: Spatial and temporal variability of open biomass burning in Northeast China from 2003 to 2017, Atmospheric and Oceanic Science Letters, 13, 240–247, https://doi.org/10.1080/16742834.2020.1742574, 2020.
Wang, S., Zhang, H., Feng, Z., Wang, Y., Su, J., Gao, K., and Li, J.: Dispersal Limitation Dominates the Spatial Distribution of Forest Fuel Loads in Chongqing, China, Ecosystem Health and Sustainability, 9, 0079, https://doi.org/10.34133/ehs.0079, 2023a.
Wang, Z., Huang, R., Yao, Q., Zong, X., Tian, X., Zheng, B., and Trouet, V.: Strong winds drive grassland fires in China, Environ. Res. Lett., 18, 015005, https://doi.org/10.1088/1748-9326/aca921, 2023b.
van Wees, D., van der Werf, G. R., Randerson, J. T., Rogers, B. M., Chen, Y., Veraverbeke, S., Giglio, L., and Morton, D. C.: Global biomass burning fuel consumption and emissions at 500 m spatial resolution based on the Global Fire Emissions Database (GFED), Geosci. Model Dev., 15, 8411–8437, https://doi.org/10.5194/gmd-15-8411-2022, 2022.
van der Werf, G. R., Randerson, J. T., Giglio, L., van Leeuwen, T. T., Chen, Y., Rogers, B. M., Mu, M., van Marle, M. J. E., Morton, D. C., Collatz, G. J., Yokelson, R. J., and Kasibhatla, P. S.: Global fire emissions estimates during 1997–2016, Earth Syst. Sci. Data, 9, 697–720, https://doi.org/10.5194/essd-9-697-2017, 2017.
Wiedinmyer, C., Kimura, Y., McDonald-Buller, E. C., Emmons, L. K., Buchholz, R. R., Tang, W., Seto, K., Joseph, M. B., Barsanti, K. C., Carlton, A. G., and Yokelson, R.: The Fire Inventory from NCAR version 2.5: an updated global fire emissions model for climate and chemistry applications, Geosci. Model Dev., 16, 3873–3891, https://doi.org/10.5194/gmd-16-3873-2023, 2023.
Wu, H., Zhang, J., Zhang, Z., Han, J., Cao, J., Zhang, L., Luo, Y., Mei, Q., Xu, J., and Tao, F.: AsiaRiceYield4km: seasonal rice yield in Asia from 1995 to 2015, Earth Syst. Sci. Data, 15, 791–808, https://doi.org/10.5194/essd-15-791-2023, 2023.
Wu, J., Kong, S., Wu, F., Cheng, Y., Zheng, S., Yan, Q., Zheng, H., Yang, G., Zheng, M., Liu, D., Zhao, D., and Qi, S.: Estimating the open biomass burning emissions in central and eastern China from 2003 to 2015 based on satellite observation, Atmos. Chem. Phys., 18, 11623–11646, https://doi.org/10.5194/acp-18-11623-2018, 2018.
Xu, R., Ye, T., Yue, X., Yang, Z., Yu, W., Zhang, Y., Bell, M. L., Morawska, L., Yu, P., Zhang, Y., Wu, Y., Liu, Y., Johnston, F., Lei, Y., Abramson, M. J., Guo, Y., and Li, S.: Global population exposure to landscape fire air pollution from 2000 to 2019, Nature, 621, 521–529, https://doi.org/10.1038/s41586-023-06398-6, 2023.
Ying, L., Han, J., Du, Y., and Shen, Z.: Forest fire characteristics in China: Spatial patterns and determinants with thresholds, Forest Ecol. Manag., 424, 345–354, https://doi.org/10.1016/j.foreco.2018.05.020, 2018.
Ying, L., Cheng, H., Shen, Z., Guan, P., Luo, C., and Peng, X.: Relative humidity and agricultural activities dominate wildfire ignitions in yunnan, southwest china: patterns, thresholds, and implications, Agr. Forest Meteorol., 307, 108540, https://doi.org/10.1016/j.agrformet.2021.108540, 2021.
Zhang, H., Ye, X., Cheng, T., Chen, J., Yang, X., Wang, L., and Zhang, R.: A laboratory study of agricultural crop residue combustion in china: emission factors and emission inventory, Atmos. Environ., 42, 8432–8441, https://doi.org/10.1016/j.atmosenv.2008.08.015, 2008.
Zhang, H., Hu, D., Chen, J., Ye, X., Wang, S. X., Hao, J. M., Wang, L., Zhang, R., and An, Z.: Particle Size Distribution and Polycyclic Aromatic Hydrocarbons Emissions from Agricultural Crop Residue Burning, Environ. Sci. Technol., 45, 5477–5482, https://doi.org/10.1021/es1037904, 2011.
Zhang, T., Wooster, M. J., Green, D. C., and Main, B.: New field-based agricultural biomass burning trace gas, PM2.5, and black carbon emission ratios and factors measured in situ at crop residue fires in eastern china, Atmos. Environ., 121, 22–34, https://doi.org/10.1016/j.atmosenv.2015.05.010, 2015.
Zhang, T., de Jong, M. C., Wooster, M. J., Xu, W., and Wang, L.: Trends in eastern China agricultural fire emissions derived from a combination of geostationary (Himawari) and polar (VIIRS) orbiter fire radiative power products, Atmos. Chem. Phys., 20, 10687–10705, https://doi.org/10.5194/acp-20-10687-2020, 2020.
Zhao, F., Liu, Y., and Shu, L.: Change in the fire season pattern from bimodal to unimodal under climate change: The case of Daxing'anling in Northeast China, Agr. Forest Meteorol., 291, 108075, https://doi.org/10.1016/j.agrformet.2020.108075, 2020.
Zheng, Y., Li, Z., Pan, B., Lin, S., Dong, J., Li, X., and Yuan, W.: Development of a Phenology-Based Method for Identifying Sugarcane Plantation Areas in China Using High-Resolution Satellite Datasets, Remote Sensing, 14, 1274, https://doi.org/10.3390/rs14051274, 2022.
Zong, X., Tian, X., Yao, Q., Brown, P. M., Zong, X., Tian, X., Yao, Q., and Brown, P. M.: An analysis of fatalities from forest fires in China, 1951–2018, Int. J. Wildland Fire, 31, 507–517, https://doi.org/10.1071/WF21137, 2022.