the Creative Commons Attribution 4.0 License.
the Creative Commons Attribution 4.0 License.
Updates and evaluation of NOAA's online-coupled air quality model version 7 (AQMv7) within the Unified Forecast System
Wei Li
Beiming Tang
Patrick C. Campbell
Youhua Tang
Barry Baker
Zachary Moon
Daniel Tong
Jianping Huang
Kai Wang
Ivanka Stajner
Raffaele Montuoro
The air quality forecasting system is an essential tool widely used by environmental managers to mitigate adverse health effects of air pollutants. This work presents the latest development of the next-generation regional air quality model (AQM) forecast system within the Unified Forecast System (UFS) framework in the National Oceanic and Atmospheric Administration (NOAA). The UFS air quality model incorporates the US Environmental Protection Agency (EPA) Community Multiscale Air Quality (CMAQ) model as its main chemistry component. In this system, CMAQ is integrated as a column model to solve gas and aerosol chemistry, while the transport of chemical species is processed by UFS. The current AQM version 7 (AQMv7) is coupled with an earlier version of CMAQ (version 5.2.1). Here we describe the development of the updated AQMv7 by coupling to a “state-of-the-science” CMAQ version 5.4. The updates include improvements in gas and aerosol chemistry, dry deposition processes, and structural changes to the input/output (I/O) interface, enhancing both computational efficiency and representation of air–surface exchange processes. A simulation was conducted for the period of June–August 2023 to assess the effects of these updates on the forecast performance of ozone (O3) and fine particulate matter (PM2.5), two major air pollutants over the continental United States (CONUS). The results show that the updated model demonstrates an enhanced capability in simulating O3 over the CONUS by reducing the positive bias, leading to a reduction in the mean bias by 3 %–5 % and 8 %–12 % for hourly and the maximum daily 8 h average O3, respectively. Spatially, the updated model lowers the positive bias of hourly O3 in most of the 10 EPA regions, particularly within the central and northwest areas, while amplifying the O3 underestimation over the sites with negative bias. Similarly, the updates induce uniformly lower fine particulate matter (PM2.5) concentrations across the CONUS domain, reducing the positive bias at some sites over the northeast in August and central Great Plains. The updated model does not improve model performance for PM2.5 in the vicinity and downwind of fire emission sources, where AQMv7 shows the highest negative bias, thus indicating a focal point of model uncertainty and needed improvement. Despite these challenges, the study highlights the importance of the ongoing refinements for reliable air quality predictions from the UFS-AQM model, which is a planned future update to NOAA's current operational air quality forecast system.
- Article
(12254 KB) - Full-text XML
-
Supplement
(6131 KB) - BibTeX
- EndNote
Air quality, affected by the amount and type of gaseous and particulate pollutants in the ambient air, has a wide range of impacts on human health, the ecosystem, and the economy. Criteria pollutants, such as ground-level ozone (O3) and particulate matter with an aerodynamic diameter of less than 2.5 µm (PM2.5), can cause cardiovascular and respiratory diseases (Cohen et al., 2005; Lee et al., 2014); worsen symptoms and complications of people with pre-existing health conditions (Balbus and Malina, 2009; Hooper and Kaufman, 2018); and lead to nearly 4.2 million premature deaths worldwide in 2019,e with 89 % of these deaths occurring in low- and middle-income countries (WHO, 2023). Acidic air pollutants, such as sulfur dioxide (SO2) and nitrogen oxides (NOx), can deposit onto soil and watershed and harm plant growth and aquatic life, leading to changes in ecosystems and the loss of biodiversity (Taylor et al., 1994; Lovett et al., 2009). O3 can also damage forest and crop leaves and interfere with photosynthesis, resulting in yield reduction and food quality deteriorating with an estimated economic loss of between USD 14 and 26 billion globally (Van Dingenen et al., 2009; Tai et al., 2014).
To address the global concern of air pollution and alleviate its health and environmental damage, both international and national agencies play essential roles in air quality regulation and monitoring. Internationally, the World Health Organization (WHO) sets global standards for air quality and provides guidance on its health implications (WHO, 2021). The United Nations Environment Programme (UNEP) coordinates global efforts, with a specific focus on reducing short-lived climate pollutants (UNEP, 2021). In Europe, the European Environment Agency (EEA) provides information and supports the European Union's air quality efforts (EEA, 2022). In the United States, the Environmental Protection Agency (EPA) enforces the Clean Air Act and establishes national ambient air quality standards (NAAQS). Additionally, most countries maintain their own national environmental agencies, which set air quality standards and regulations tailored to local conditions. These agencies follow a comprehensive process, which includes establishing air quality standards, regulating emissions from various sources, monitoring air quality through networks of monitoring stations and making data accessible to the public. Stringent enforcement measures are in place to ensure compliance, and research initiatives and public awareness campaigns further contribute to informed decision-making and citizen engagement. Importantly, air quality forecasts issued by some of these agencies are an effective way to combat air pollution because accurate air pollutant predictions can protect public health by offering advance warnings to at-risk individuals and aid in mitigation strategies by guiding industrial activities and urban planning.
The National Oceanic and Atmospheric Administration (NOAA) has taken on the responsibility of providing operational air quality forecast guidance since 2004 through the National Air Quality Forecast Capability (NAQFC) system. The initial development of the NAQFC was based on an offline coupling between NOAA's ETA meteorological model and EPA's Community Multiscale Air Quality (CMAQ) model, which provided O3 forecast guidance over the northeast United States (Otte et al., 2005; Eder et al., 2006). Continued development and evaluation of the NAQFC enabled the system to issue O3, PM2.5, wildfire smoke, and dust forecast guidance for the entire contiguous United States (CONUS), Alaska, and Hawaii in order to protect human health, the environment, and the economy (Mathur et al., 2008; McKeen et al., 2009; Eder et al., 2009; Stajner et al., 2012; Huang et al., 2017; Lee et al., 2017). With the National Weather Service (NWS) transition to use a new Finite-Volume Cubed-Sphere (FV3) dynamical core in the Global Forecast System (GFS) model, in combination with GFS's improvement in data assimilation and physical parameterizations, both short and long weather forecasts have considerably improved (Harris and Lin, 2013; Zhou et al., 2019; Chen et al., 2019), which motivated NOAA to use FV3GFS as the meteorological driver in the NAQFC (Huang et al., 2017, 2019; Chen et al., 2021). A recent version of the NAQFC, offline-coupled between version 16 of the FV3GFS (FV3GFSv16 hereafter) and CMAQv5.3.1, showed significantly different meteorological and chemical predictions and overall improved surface O3 and PM2.5 simulations in a 72 h forecast relative to its previous version (Campbell et al., 2022) and further yields similar results in a historical simulation compared with the commonly used Weather Research & Forecasting Model (WRF; Tang et al., 2022).
In recent years, NOAA has made extensive efforts to develop the next generation weather forecast model, known as the Unified Forecast System (UFS), which is a community-based, coupled, comprehensive Earth modeling system with the capability of integrating a number of common components (e.g., land, ocean, atmosphere, and sea ice) into different applications. The UFS framework allows for predictions that span local to global domains and range from sub-hourly to seasonal timescales (Krishnamurthy et al., 2021; Bai et al., 2023; Zhu et al., 2023). It is designed to be the unified system for NOAA's operational numerical weather prediction applications while enabling more effective collaboration among government, academia, industry, and beyond (https://ufscommunity.org, last access: 30 October 2023).
The Air Quality Model (AQM; https://github.com/NOAA-EMC/AQM, last access: 5 March 2023) is one of UFS's applications that dynamically couples the CMAQ model with the UFS weather model (https://github.com/ufs-community/ufs-weather-model, last access: 5 March 2023) to simulate spatiotemporal variations of atmospheric composition and air quality. The chemical component in the AQM version 7 (AQMv7) is currently based on the CMAQ model version 5.2.1 (CMAQv5.2.1), which was released in 2018. Hence, this version of CMAQ has become scientifically outdated as EPA is continuously advancing the model with both scientific and structural changes as described in Appel et al. (2021) and Murphy et al. (2021), which can potentially lead to higher biases and errors in the air quality forecast. Therefore, there is a need to update the AQMv7 to the latest version, v5.4 (at the time of writing) of the CMAQ model (CMAQv5.4; https://github.com/USEPA/CMAQ/tree/5.4, last access: 30 October 2023).
The main objective of this study is to upgrade the chemical component of the current AQMv7 to the latest CMAQ model (see description in Sect. 2). The simulation design and model inputs are presented in Sect. 3. In Sect. 4, we compare the meteorological and air quality predictive performance between the current and updated AQMv7 (AQMv7_new hereafter) against surface observations in the CONUS. We conclude, in Sect. 5, that the advancement using a closer state-of-the-science chemical transport model will improve the prediction of atmospheric chemical compositions and therefore result in more accurate air quality forecasts and better protect public health across the US.
The AQM component is a dynamic wrapper that links the UFS weather model with CMAQ through the National Unified Operational Prediction Capability (NUOPC) layer based on the Earth System Modeling Framework (ESMF). AQM has its own input and output (AQMIO) layer that can read in the online-coupled meteorology, initial and boundary conditions (IC/BC), and emissions from different sources and then pass the updated prognostic and diagnostic chemical tracer fields back to the UFS weather model with no chemistry/aerosol feedback. CMAQ is treated as a column model for emission mapping, photolysis, gas and aerosol chemistry, dry deposition, and in-cloud wet scavenging at each integration time step, while other transport terms, such as convection, advection, and diffusion, are more appropriately handled in the FV3 dynamics and Common Community Physics Package (CCPP) physics. More details on the AQMv7 structure can be found in Huang et al. (2025).
The updates of AQMv7 are mainly based on the changes from CMAQv5.2.1 to CMAQv5.4 between which there were updates for CMAQ version 5.3 (CMAQv5.3; Appel et al., 2021). The advancements of CMAQv5.3 and CMAQv5.4 are listed in its release notes for each respective version (https://github.com/USEPA/CMAQ, last access: 30 October 2023). Here we only include the features that are used in AQMv7. The newer version usually contains various science, functionality, and computation efficiency upgrades. The following subsections describe the specifics of these changes.
2.1 Chemistry
Of all the three families of gas chemical mechanisms included in CMAQ, the Carbon Bond version 6 (CB6) scheme is the most widely used for regional air quality simulations and thus adopted in AQM. The other two chemical mechanisms currently implemented in CMAQ include Statewide Air Pollution Research Center (SAPRC) and the Regional Atmospheric Chemical Mechanism (RACM). The CB6 mechanism evolved from revision 3 (CB6r3) in CMAQv5.2.1 to revision 5 (CB6r5) in CMAQv5.4 (Yarwood et al., 2010; Emery et al., 2015; Yarwood et al., 2020). The associated aerosol chemistry was also significantly updated from version 6 (AERO6) to version 7 (AERO7).
2.1.1 Gas chemistry
The chlorine chemistry in CB6r3 (Sarwar et al., 2012; Luecken et al., 2019) was updated in the 2019 release of CMAQv5.3, which added five chemical reactions and one new chlorine species compared with the previous CB6r3 mechanism in CMAQv5.2.1 (https://github.com/USEPA/CMAQ/blob/5.3/DOCS/Release_Notes/chlorine_chemistry_CB6r3.md, last access: 21 February 2024). The same chlorine chemistry was kept in the CB6r5 mechanism. Both detailed and simplified bromine and iodine chemistry schemes (Sarwar et al., 2015) are implemented in CMAQ, the latter of which is used in AQMv7 to reduce the computational demand. The simple halogen chemistry uses a first-order constant to calculate the O3 loss rate to seawater as a function of atmospheric pressure. With the updates of the detailed halogen chemistry (Sarwar et al., 2019), the O3 loss rate constant has been recalculated in CMAQv5.3 and further rederived in CMAQv5.4 with an increased and decreased value relative to its previous version, respectively. The final result is a reduction in O3 in the ocean (https://github.com/USEPA/CMAQ/blob/5.3/DOCS/Release_Notes/simple_halogen_chemistry.md, last access: 22 March 2024). Other chemistry changes in CB6r5 (Burkholder et al., 2019) include the updates in reaction rate constants, reaction products and yields, photolysis rates of some species, and addition of new reactions. The overall impacts of the mechanism migration from CB6r3 to CB6r5 are marginal increases in both summer and winter months (https://github.com/USEPA/CMAQ/wiki/CMAQ-Release-Notes:-Chemistry:-Carbon-Bond-6-Mechanism-(CB6), last access: 31 October 2023).
2.1.2 Aerosol chemistry
AERO7 has extensive changes from AERO6, incorporating a number of key improvements, such as updating the yields of monoterpene secondary organic aerosol (SOA) resulting from the photooxidation by hydroxyl radicals (OH) and O3 (Saha and Grieshop, 2016), adding the formation and subsequent partitioning of organic nitrate (Pye et al., 2015), introducing the inclusion of water uptake on hydrophilic organic compounds as described in Pye et al. (2017), accounting for the consumption of inorganic sulfate during the formation of isoprene epoxydiol (IEPOX) organosulfates (Pye et al., 2013; Zhang et al., 2018b), and enhancing computational efficiency by replacing the Odum two-product fit (Odum et al., 1996; Henze and Seinfeld, 2006; Carlton et al., 2010) with a new parameterization of anthropogenic SOA yields through a volatility basis set (VBS) approach (Pye et al., 2010, 2019). The updated monoterpene oxidation yield in the VBS fit and the inclusion of water uptake in AERO7 will generally increase organic aerosol and PM2.5, primarily in the vegetated southeast US during summertime (Xu et al., 2018; Zhang et al., 2018a), the latter of which will also affect deposition and aerosol optical depth (AOD) by modulating aerosol size (Pye et al., 2017).
2.2 Dry deposition
There are two air–surface exchange models starting from CMAQv5.3: the Models-3 dry (M3Dry) deposition model and the Surface Tiled Aerosol and Gaseous Exchange (STAGE) model. Currently, only M3Dry is adopted in AQMv7. Some important updates have been made for O3 and aerosol deposition depending on land use types since the release of CMAQv5.2.1. The O3 dry deposition resistance to snow was raised by 10 times, from 1000 to 10 000 s m−1, following the observed evidence in Helmig et al. (2007), leading to a significant increase in ambient O3 over snow-covered regions. The ground O3 resistance over soil has also been modified to be dependent on soil moisture (Mészáros et al., 2009; Fares et al., 2012) with a generally decreased value relative to the previous dry deposition scheme and thus result in more O3 depositing to the soil surface and less of it remaining in the ambient air.
The aerosol dry deposition scheme has been updated in both CMAQv5.3 and CMAQv5.4. The revised parameterization of aerosol dry deposition in CMAQv5.3 added a leaf area index (LAI) factor in the boundary layer resistance to account for large depositions over forest canopies, which greatly reduces the coarse-mode particle dry deposition velocity (Shu et al., 2022; Appel et al., 2021). The scheme is further improved in CMAQv5.4 by introducing a two-term impaction efficiency to represent macroscale and microscale obstacles, which differ by land use categories, including needleleaf forest, broadleaf forest, and grassland (Pleim et al., 2022). The most significant changes in mass dry deposition velocity are found for the accumulation mode over the forested areas with an increase by almost an order of magnitude, causing overall reduced PM2.5 in the contiguous US relative to CMAQv5.3.
2.3 Structural changes
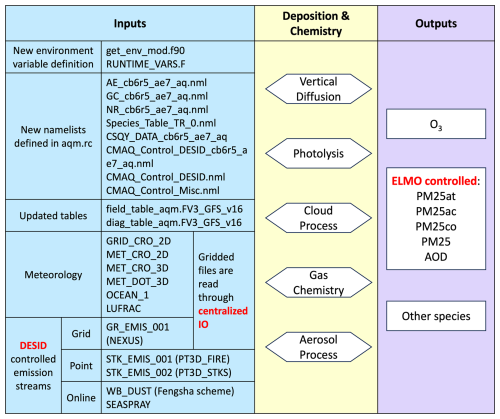
A number of changes have been made to the input/output (I/O) framework of CMAQ (Fig. 1). Emission reading, mapping, and scaling are controlled in the Detailed Emissions Scaling, Isolation, and Diagnostic (DESID) module in CMAQv5.3 and beyond. The module can read any number of offline gridded and point emission files by their sources (defined as streams) and apply scaling factors on a per-species and per-region basis for each stream, allowing users to perform emission scaling and perturbation tests with great ease and flexibility (Murphy et al., 2021). The opening, description, extraction, and interpolation of the meteorological and emission variables are encapsulated in the centralized I/O (CIO) module from CMAQv5.3, lowering computational memory requirements and easing code maintenance. The Introduction of the Explicit and Lumped air quality Model Output (ELMO) module, which can synthesize the definition, calculation, and maintenance of individual or aggregate gas and particulate matter parameters (e.g., PM2.5) online, saving time and storage to run post-processing tools, is included in CMAQv5.4. Implementing these changes requires new control namelists and extensive code updates in AQMv7_new.
Despite the chemistry and dry deposition updates described in the last section, other model components and configurations are the same in order to isolate the model performance changes caused by the updates. Table 1 summarizes the model domain, physical settings, and emission inputs, as well as some additional information.
Table 1UFS-AQM model components and configurations. The abbreviation n/a stands for not applicable in this table.
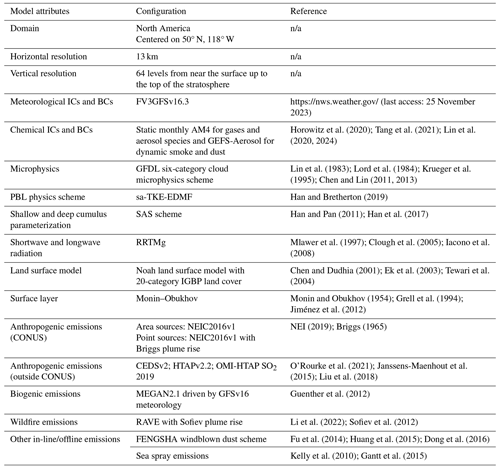
The model domain covers North America (NA) with a horizontal resolution of ∼ 13 km and 64 vertical layers spanning from the surface up to the top of the stratosphere (∼ 0.4 hPa). The CCPP FV3GFSv16.3 physics suite (Heinzeller et al., 2023) is used to provide meteorological conditions, where its physical configurations include the Monin–Obukhov similarity surface layer (Monin and Obukhov, 1954; Grell et al., 1994; Jiménez et al., 2012), the Noah land surface scheme (Chen and Dudhia, 2001; Ek et al., 2003; Tewari et al., 2004), the Rapid Radiative Transfer Model (RRTM) longwave and shortwave radiation schemes (Mlawer et al., 1997; Clough et al., 2005; Iacono et al., 2008), the Simplified Arakawa–Schubert (SAS) cumulus parameterization (Han and Pan, 2011; Han et al., 2017), the Geophysical Fluid Dynamics Laboratory (GFDL) six-category cloud microphysics scheme (Lin et al., 1983; Lord et al., 1984; Krueger et al., 1995; Chen and Lin, 2011, 2013), and the sa-TKE-EDMF planetary boundary layer (PBL) scheme (Han and Bretherton, 2019).
Anthropogenic emissions outside of the CONUS are from CEDSv2-2019 for all gases, except for sulfur dioxide (SO2) only in the ocean, organic carbon (OC), and black carbon (BC) (Table 1). The blended Ozone Monitoring Instrument-HTAP (OMI-HTAP) 2019 dataset (https://so2.gsfc.nasa.gov/measures.html, last access: 15 March 2024) provides SO2 emissions over land, and the emissions of coarse particulate matter (PMC) and PM2.5 are from HTAPv2-2010. Within the CONUS, all gas and aerosol anthropogenic emissions are from the National Emissions Inventory Collaborative (NEIC) 2016 version 1 (2016v1). NEIC2016v1 provides both area and point emissions, the latter of which is further calculated in-line in AQM using the Briggs plume rise method. The same plume rise method is also applied to the wildfire emissions from the Regional ABI and VIIRS fire Emissions version 1 (RAVE1) inventory, in which all gaseous emissions are scaled from CO and speciated particulate matter emissions are scaled from total PM2.5. Both windblown dust and sea salt emissions are calculated in-line. The dust scheme is based on a novel FENGSHA model (Fu et al., 2014; Huang et al., 2015; Dong et al., 2016), which is dependent on the land cover, soil type, soil moisture, and friction velocity. Biogenic emissions are from the Model of Emissions of Gases and Aerosols from Nature version 2.1 (MEGAN2.1) driven by the GFSv16 meteorology. The area source anthropogenic and biogenic emissions are both processed and calculated in-line using the NOAA Emission and eXchange Unified System (NEXUS) component (Campbell et al., 2020), which is based upon the Harmonized Emissions Component (HEMCO) 3.0 (Lin et al., 2021). The chemical initial and boundary conditions (ICs and BCs) are from the monthly mean Atmospheric Model version 4 (AM4) outputs for gas and aerosol species with additional dynamic BCs for dust and smoke aerosols from the aerosol forecast member in the Global Ensemble Forecast System (GEFS-Aerosols), which can better capture the aerosol intrusion events from outside of the domain and thus improve the prediction of air quality (Tang et al., 2021).
The simulations for both AQMv7 and AQMv7_new were performed for 3 months, from June to August of 2023, during which there were extensive wildfire activities over the northwest US and Canada. The air quality observations from the EPA AirNow network are used to evaluate the model performance, and the evaluation is conducted using the publicly available software MELODIES-MONET (Model EvaLuation using Observations, DIagnostics and Experiments Software, MELODIES, with the Model and ObservatioN Evaluation Toolkit; Baker and Pan, 2017; https://melodies-monet.readthedocs.io/en/stable/, last access: 29 October 2024). The software can produce flexible diagnostic assessments by pairing models and observations, plotting spatial maps, and calculating statistics such as mean bias (MB), normalized mean bias (NMB), median bias (MdnB), normalized median bias (NMdnB), mean absolute error (MAE), normalized mean error (NME), coefficient of determination (R2), root-mean-square error (RMSE), and the index of agreement (IOA). A meteorological evaluation was also conducted using the US EPA Atmospheric Model Evaluation Tool (AMET; Appel et al., 2011; https://www.cmascenter.org/amet/, last access: 15 March 2024) against the observations collected from the Surface Weather Observations and Reports for Aviation Routine Weather Reports (METAR) and Earth System Research Laboratory's (ESRL's) Radiosonde Database (RAOB).
In this section, we compare the performance of the current and updated models in their capability of predicting summer season (June, July, and August 2023) O3 and PM2.5 as they are the most important air pollutants of concern. Although both models are driven by the same CCPP GFSv16 physics suite, we first briefly evaluated the simulation of some meteorological factors critical for O3 and PM2.5 formation and transport, which can provide insights into the overall model performance in air quality predictions.
4.1 Meteorology evaluation
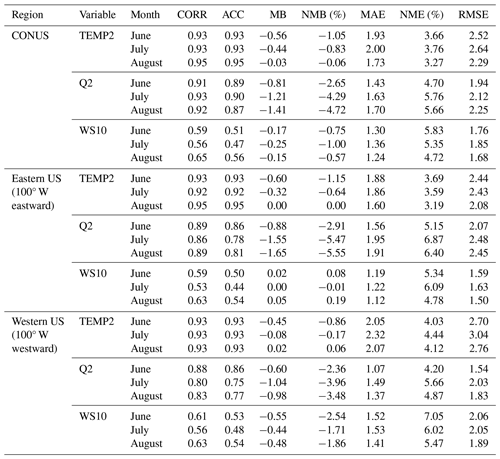
Figure 2 shows the anomaly correlation coefficient (ACC) and mean bias (MB) between four simulated and observed variables at each site in August, including 2 m temperature (TEMP2) and specific humidity (Q2), 10 m wind speed (WS10), and direction (WD10), with more statistics listed in Table 2. Similar spatial patterns of ACC and MB are found for June and July (Figs. S1–S2 in the Supplement). Some diurnal variation and vertical distribution comparisons were also conducted and shown in Figs. S3–S11. TEMP2, Q2, and WS10 in the CONUS are well simulated with high correlation coefficients (CORR) of 0.93–0.95, 0.91–0.93, and 0.56–0.65 and low mean bias of −0.03 to −0.56 °C, −0.81 to −1.41 g kg−1, and −0.15 to −0.25 m s−1, respectively (Table 2). While cold biases are found in the northeastern and western US (Figs. 2 and S1–S2) at the surface mainly driven by nighttime underpredictions (Figs. S3–S8), the vertical distribution shows a nationwide warm bias (Figs. S9–S11). Specific humidity has a universal dry bias within the domain at both the surface and vertically, with the latter showing a higher bias of up to 10 g kg−1 at some sites. Such biases in TEMP2 and Q2 suggest an overly stable atmosphere in the GFSv16 physics during summer, which may influence overpredictions in trace gases in the lowest model layers by suppressing advection and diffusion. The diurnal evaluations also indicate overpredictions in TEMP2 during the daytime in both the western and eastern US, where the warm and dry biases may further exacerbate O3 formation and overpredictions, especially in the eastern US (see Sect. 4.2 below). Furthermore, WS10 is underestimated in the western and part of eastern US by up to 3 m s−1, which also contributes to the overestimation of O3 therein due to reduced dilution. WD10 demonstrated relatively worse predictions, especially in its vertical distributions, with low CORR values smaller than 0.6 and a high mean bias greater than 20° at most sites, adding more uncertainties to the transport of pollutants in addition to those from WS10. AMET accounts for the wind direction vector issue in its calculation of the evaluation statistics.
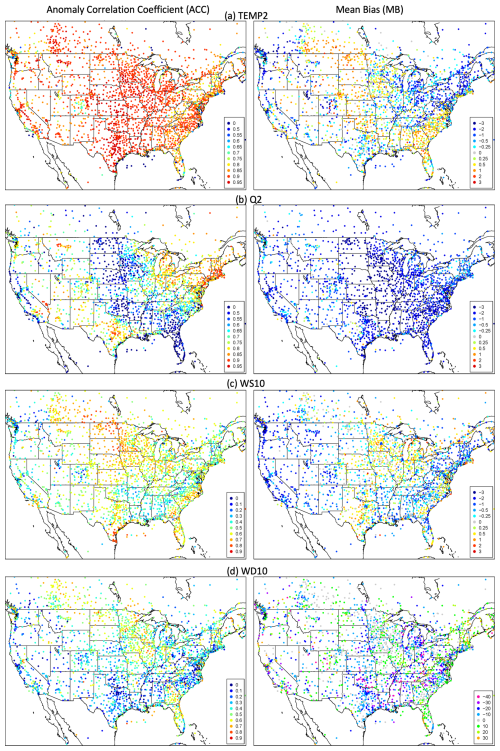
Figure 2Anomaly correlation coefficient (ACC; left column) and mean bias (MB) between GFSv16.3 simulated and observed TEMP2 (a; °C), Q2 (b; g kg−1), WS10 (c; m s−1), and WD10 (d; degree) at the surface in August 2023.
4.2 O3 evaluation
Figure 3 displays the spatial maps of hourly O3 distribution in the CONUS averaged in June–August 2023 from two model simulations and AirNow observations as well as the model mean bias at each site. The western US generally has a higher level of O3 relative to the eastern US, reflecting the overall O3 spatial distribution during summertime. The AQMv7 captures this spatial pattern, yet with a positive bias at the majority of the AirNow sites. A higher positive bias of more than 20 ppb can be found near the west and east coast compared to the smaller or negative bias in other regions for all the months, indicating that the land–sea interactions may not be well represented in the model. The relatively large O3 overestimates are also impacted by the near-surface meteorological biases described previously (i.e., too warm and dry during the day and too cool and dry at night) as well as an overly stable boundary layer. The most noticeable negative bias can be seen in the northeastern US in June, which is attributable to the record-breaking wildfire smoke transported from Quebec. This indicates the contributions from fires to O3 enhancements are underestimated in the model. The AQMv7_new model shows a nationwide decrease in O3 mixing ratios, which reduces the high positive bias over the coastal sites. This reduction, however, also exacerbates the O3 underestimation for the sites with negative bias.
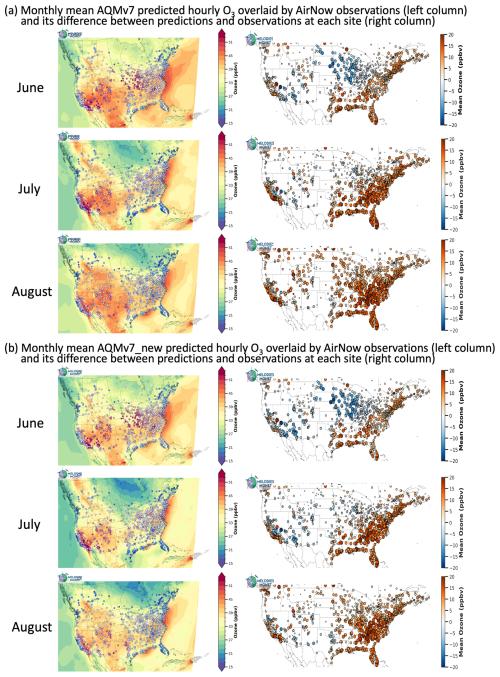
Figure 3Maps of monthly mean hourly O3 in the CONUS predicted by AQMv7 (a) and AQMv7_new (b) overlaid by AirNow observation sites (left column) and its bias between simulations and observations (model – AirNow) at each site (right column).
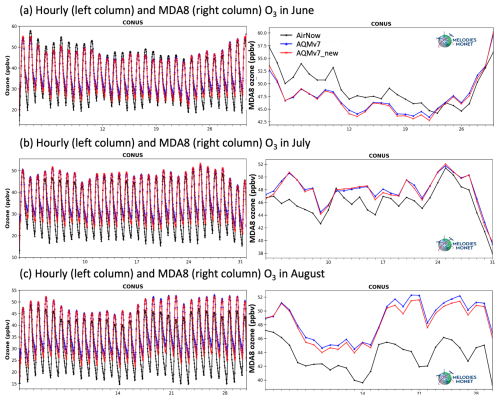
Figure 4Time series of hourly (left column) and MDA8 (right column) O3 in the CONUS from AirNow observations (black line), AQMv7 (blue line) and AQMv7_new (red line) predictions for June (a), July (b), and August (c) 2023.
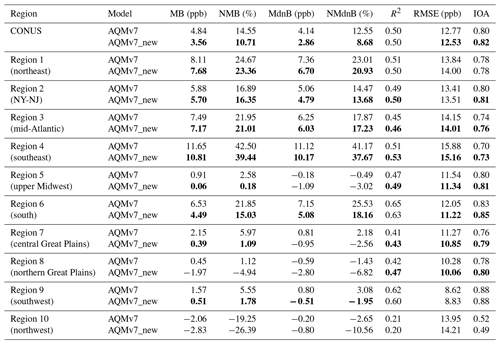
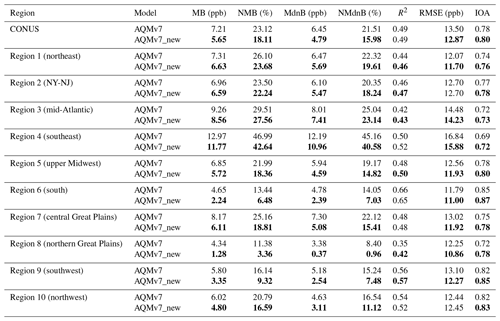
Averaging across the CONUS, the hourly O3 time series from the AQMv7 simulation (blue line in Fig. 4) show that the model captures the temporal variation with an R2 value of 0.44, 0.50, and 0.49 from June to August, respectively (Tables 3–5). However, except for the fire-related O3 underestimation in June, the model overestimates both the peak values at noon and the low values at night with a mean bias of 1.54 ppb (4.23 %) in June, 4.84 ppb (14.55 %) in July, and 7.21 ppb (23.12 %) in August, which explains the high positive bias shown in Fig. 2. Such overestimation of O3 is mitigated, especially during nighttime, by the updated model, reducing the mean bias by 3 %–5 %. The RMSE and IOA values of hourly O3 are also improved by the model updates, indicating an enhanced model performance in simulating O3 in the CONUS overall. We also evaluated the model performance of the maximum daily 8 h average (MDA8) O3 simulation in Fig. 4, with the statistics listed in Tables S1–S3 in the Supplement. The AQMv7 model underestimates MDA8 O3 by 1.87 ppb (3.82 %) in June, while the model overpredicts it by 1.94 ppb (4.21 %) and 5.18 ppb (11.89 %) in July to August, respectively. The reduction effects in AQMv7_new lowers the positive bias in July and August by 0.15 ppb (8 %) and 0.62 (12 %) and amplifies the negative bias in June by 0.23 ppb (12 %). Considering the underestimation of daytime O3 in AQMv7 due to the big impact from fire in June, this may indicate that the model updates can improve summertime MDA8 O3 simulation when influences from fire are small.
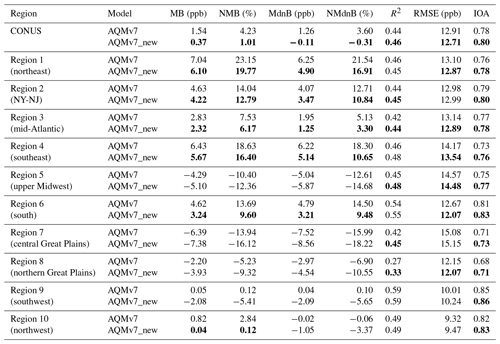
Table 3Hourly O3 evaluation statistics of the AQMv7 and AQMv7_new simulations against the AirNow network in the CONUS and different regions in June 2023. The bold numbers in AQMv7_new indicate an improvement relative to those in AQMv7.
In addition to the statistics listed in Tables 3–5, hit rate, false alarm rate, and critical success index (CSI) are metrics commonly used to evaluate the performance of predictions, providing valuable insights into different aspects of forecast accuracy and reliability. Figure 5 compares these three metrics between AQMv7 and AQMv7_new at different hourly O3 thresholds across the CONUS. Although both models have difficulties in predicting higher levels of O3 indicated by the decrease in hit rate and CSI and the increase in false alarm rate as the threshold changes from 0 to 100 ppbv, the new model yields a higher CSI value when O3 is greater than 60 ppb for the 3 months. However, it also exhibits a slightly lower hit rate and higher false alarm rate at the 60 ppbv threshold, especially for June and July. This suggests that while the new model is more successful in accurately predicting significant ozone events, it does so less frequently, with a higher number of false positives in the upper concentration ranges (e.g., >80 ppb). However, the new model can better capture the moderate O3 concentration ranges near 40 ppb as indicated by the higher hit rate and lower false alarm rate with a similar accuracy (CSI value) for all the months.
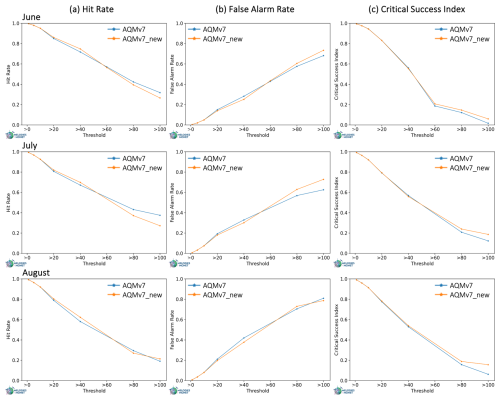
Figure 5Hit rate (a), false alarm rate (b), and critical success index (c) of hourly O3 at different thresholds across the CONUS for June (top row), July (middle row), and August (bottom row) 2023.
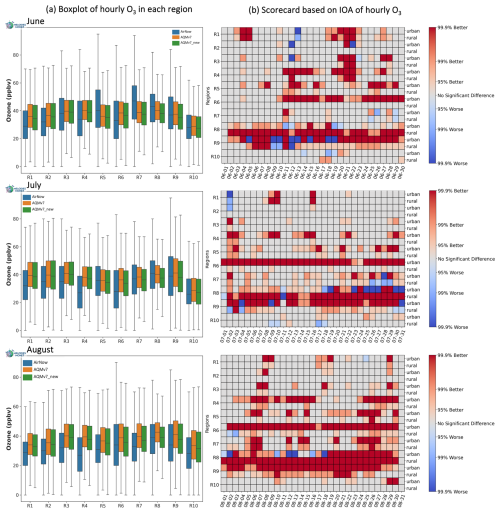
Figure 6(a) Box plot of observed and model-simulated hourly O3 separated by 10 EPA regions. (b) Scorecard plot based on IOA values grouped by urban and rural sites (right axis) within each region (left axis) on each day. Red colors indicate the AQMv7_new model performs better, while blue colors indicate that the AQMv7 model performs better. The saturation of the colors varies by significance levels. Gray color indicate there being no significant difference between two models.
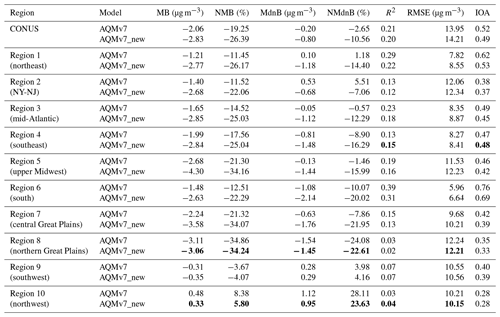
We also assessed the model simulations in each of the 10 EPA regions (R1–R10 hereafter) in Fig. 6a and Tables 3–5 to further examine how the updates will affect the model performance regionally. Except for the underestimation in the upper Midwest (R5) and Great Plains (R7–R8) in June and the northwest (R10) in July, the AQMv7 model overestimates hourly O3 in all regions with the highest mean bias value found in the northeast (R1) for June (7.04 ppb) and the southeast (R4) for July and August (11.65 and 12.97 ppb, respectively). Compared to the AQMv7 model, the statistical distributions of hourly O3 from the AQMv7_new model move to the lower end, which reduces the positive bias in most of the regions by 0.18–3.06 ppb (3.06 %–95.12 %) as indicated by the improved statistics (bold numbers) in Tables 3–5. Interestingly, the central and southwest regions (R6–R9) have a higher sensitivity to the model updates relative to other regions in all 3 months, which is likely due to the combined effects of O3 chemistry and dry deposition. As described in Sect. 2, the halogen chemistry updates reduce O3 over seawater, which can be transported into the central US dominated by southerly winds in summer, such as the Great Plains low-level jet (Zhu and Liang, 2013; Li et al., 2020). In addition, the added dependence of O3 dry deposition velocity to soil moisture leads to more O3 uptake by dry soil than wet soil (Appel et al., 2021), and the central and western US generally have lower soil moisture than the eastern regions. The IOA and RMSE values in most of the regions also improve during the 3 months.
The regional analysis was also conducted by comparing IOA values between these two models on a daily basis, and the results are shown in the scorecard plot (Fig. 6b). The IOA is a standardized measure of the degree of model prediction error and is defined as the ratio of the mean square error to the potential error. The calculation of IOA can be found in the supplementary information. A value of 1 indicates a perfect match between the model and observations, while a value of 0 indicates no agreement at all (Willmott, 1981). The new model has higher IOA values on most of the days from R4 to R9 at a 95 % confidence level, although R1–R3 and R10 only have improved IOA values on individual days. It is noted that there are some days on which the AQMv7_new model performs worse at both urban and rural sites in a specific region (e.g., 9–10 June in R9). The time series focusing on R9 (Fig. S12) reveal that the AQMv7 model generally underestimates O3 on those days and that a further reduction in the new model will make the performance worse.
In summary, we compared the model performance of two models in their capability of predicting the spatiotemporal patterns of O3 in the CONUS and found that the updated AQMv7_new model reduces the positive bias and the RMSE values of both hourly and MDA8 O3, indicating improved model accuracy. The extent of the model performance improvements also differs by region, with the central and southwest areas experiencing the highest enhancement, likely due to contributions from both halogen chemistry and dry deposition.
4.3 PM2.5 evaluation
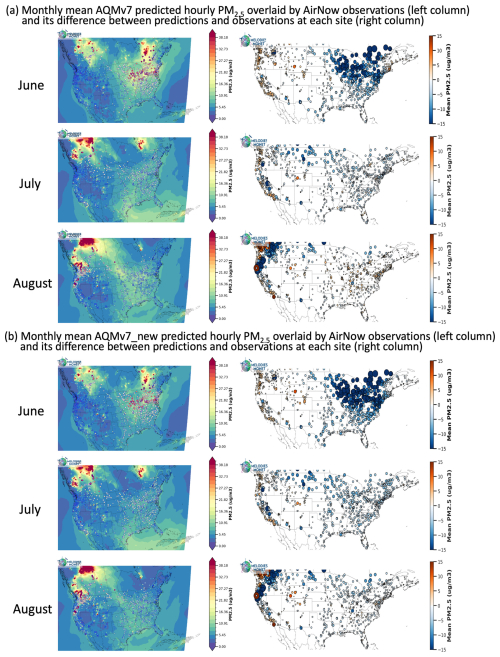
As shown in Fig. 7a, the monthly average of the hourly PM2.5 spatial map from AQMv7 displays extremely high values over eastern and western Canada and the northwestern US due to wildfire emissions. The fire plumes were transported to the northeastern US, especially for the extreme event in June, and led to higher PM2.5 levels compared to those in the central and southwestern regions. The negative mean bias of PM2.5 at the AirNow sites downstream the wildfire plumes is very high, with a value of up to −15 µg m−3, where generally in the west-northwest US, there are PM2.5 overpredictions near fire sources. This result implies that there are substantial uncertainties in wildfire emissions and plume rise, smoke transport, and smoke plume chemistry for AQMv7. Some sites over the Great Plains and the northeast in August have a relatively smaller positive mean bias of less than 10 µg m−3, followed by the close-to-zero mean bias at the sites over the south. The AQMv7_new model also predicts extreme PM2.5 values near the wildfire locations and thus shows comparable positive or negative bias as the AQMv7. However, the positive mean bias in the Great Plains and the northeastern area in August is reduced in AQMv7_new, which implies that the overall effect of the model updates is to reduce PM2.5 in places with less wildfire impact. Such reductions inevitably deteriorate the model performance when AQMv7 is unbiased or already underestimates PM2.5 at the sites in the southern US.
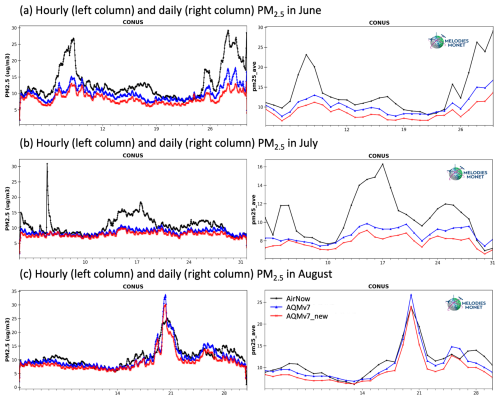
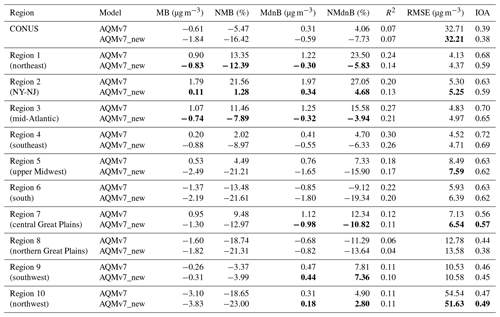
The hourly and daily time series of the CONUS-mean PM2.5 are shown in Fig. 8, and their corresponding statistics are summarized in Tables 6–8 and S4–S6. The two models have similar temporal variations, and they both miss the high PM2.5 episodes on 6–9 and 27–30 June and 4–5, 15–18, and 24–27 July while better capturing the peak during 19–21 August, which are both dominated by enhanced fire sources across the US. The AQMv7 overall shows an underestimated simulation of hourly PM2.5, with a mean bias value of −3.23 µg m−3 (−24.13 %) for June, −2.06 µg m−3 (−19.25 %) for July, and −0.61 µg m−3 (−5.47 %) for August over the CONUS. The higher negative bias in June and July can be explained by the missed fire-induced high PM2.5 values. The AQMv7_new predicts lower PM2.5 values at most hours, which increases the mean bias to −4.85 µg m−3 (−36.24 %), −2.83 µg m−3 (−26.39 %), and −1.84 µg m−3 (−16.42 %) from June to August, respectively. Daily PM2.5 from the AQMv7_new is also lower on all days, increasing the negative bias from −3.37 µg m−3 (−24.74 %) to −5.03 µg m−3 (−36.98 %) for June, from −2.02 µg m−3 (−18.96 %) to −2.78 µg m−3 (−26.07 %) for July, and from −0.62 µg m−3 (−5.52 %) to −1.88 µg m−3 (−16.60 %) for August. Similarly, the hourly and daily IOA values are worsened for all 3 months, with the RMSE value only slightly improved in August.
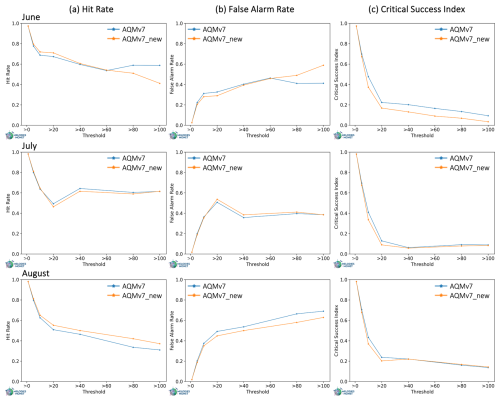
The hit rate, false alarm rate, and CSI for PM2.5 resemble the changes in O3 as the threshold varies from low to high, with a generally decreasing hit rate and CSI and increasing false alarm rate (Fig. 9). The AQMv7_new shows a lower hit rate and CSI and a higher false alarm rate in June and July when PM2.5 is greater than 60 µg m−3, implying an overall worse model performance. As opposed to June and July, although CSI values in August only slightly increase in AQMv7_new when PM2.5 is greater than 40 µg m−3, the values of hit rate and false alarm rate become higher and lower compared to AQMv7, respectively, and the changes are bigger at higher thresholds. This indicates that AQMv7_new can better predict August PM2.5 at most pollution levels, with more improvements found in highly polluted cases. Considering the fire events are better captured in August, the contrasting model performance from our updates between June and July and August highlights the necessity to improve the representation of wildfire processes for future model developments.
Table 6Hourly PM2.5 evaluation statistics of the AQMv7 and AQMv7_new simulations against the AirNow network in the CONUS and different regions in June 2023. The bold numbers in AQMv7_new indicate an improvement relative to those in AQMv7.
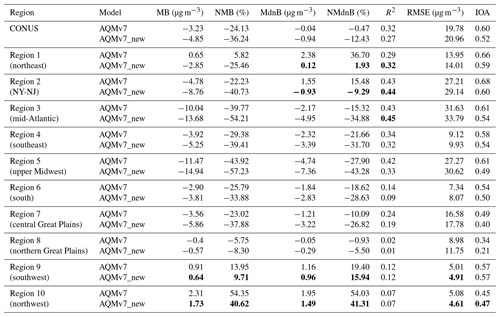
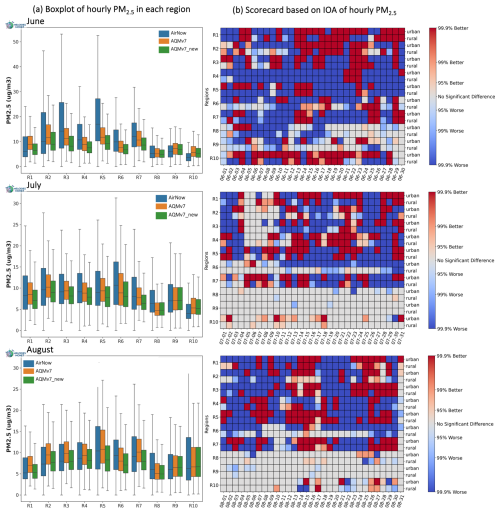
The evaluation by each EPA region is illustrated in Fig. 10 and the corresponding metrics are listed in Tables 6–8. Here, 7 and 9 out of the 10 regions show underestimated PM2.5 values from the AQMv7 simulation for June and July, respectively. The highest negative mean bias is found in the upper Midwest (R5) in June with a value of −11.47 µg m−3 (−43.92 %) and the northern Great Plains (R8) in July with a value of −3.11 µg m−3 (−34.86 %), suggesting a different fire plume transport pathway mainly from eastern and western Canada for June and July, respectively. For August, the AQMv7 shows a general overestimation in the eastern US (R1–R5) and central Great Plains (R7), with the positive bias values ranging from 0.20 µg m−3 (2.02 %) in the southeast (R4) to 1.79 µg m−3 (21.56 %) in the New York–New Jersey area (NY–NJ; R2). Regions in the western US (R6, R8–R10) exhibit an overall underestimation of PM2.5, with the lowest negative bias of −0.26 µg m−3 (−3.37 %) found in the southwest (R9). The highest mean bias of −3.10 µg m−3 (−18.65 %) among all the 10 regions lies in the northwest (R10), which can be attributed to wildfires from local sources and southwest Canada. The RMSE value of 54.54 µg m−3 in the southwest is also much higher than those in other regions, which range from 4.13 to 12.78 µg m−3. From the box plot in Fig. 10a, the AQMv7_new predicts a uniformly reduced PM2.5 level in all regions, except for R8 in July, which is consistent with the time series in Fig. 8. Such effects improve the model performance in regions with a relatively large positive bias, such as R9–R10 in June. However, if the overestimation is small (e.g., R1 in June) or if AQMv7 underestimates PM2.5, a further reduction in AQMv7_new deteriorates the model performance by increasing the mean bias. Unlike O3, PM2.5 experiences a higher level of reduction in the eastern US (R1–R7) for all 3 months, ranging from 0.82 to 3.98 µg m−3. In contrast, the western US areas (R8–R10) witness a lower reduction by 0.11, 0.12, and 0.49 µg m−3 averaging across 3 months, respectively. Since the use of AERO7 generally enhances PM2.5 mass concentrations (Sect. 2), such spatial patterns can be explained by the dominating updates to the dry deposition scheme, which increase the deposition velocity of the accumulation mode aerosol by a factor of 10 in forested areas (Pleim et al., 2022), with less enhancement for low-lying vegetation.
The scorecard plot in Fig. 10b compares the daily values of IOA between the two models in each region. Unlike the considerable differences in the eastern US (R1–R7), positive or negative, most days in the western US (R8–R10) do not have statistically significant changes in July and August. The AQMv7_new seems to only improve IOA on individual days for most of the regions in the 3 months. This is likely due to the frequent impact from wildfire events, which lead to PM2.5 underestimation in the AQMv7 model on the majority of days. Although there are only one to three PM2.5 peaks averaged across the CONUS (time series Fig. 8) from wildfire plumes, some regions may experience more high-PM2.5 episodes spanning different dates from the CONUS-mean results and thus make AQMv7 underestimate PM2.5 on most days. Here we show an example of R5 for the 3 months in Fig. S13 in which several high-PM2.5 episodes with values greater than 15 µg m−3 are missed by both models. The IOA values are improved outside of these episodes, such as 30–31 July, in the AQMv7_new model. The underestimation of PM2.5 from wildfire can be partly attributed to the fact that gaseous (speciated particulates) fire emissions from the RAVE inventory are scaled from CO (PM2.5) and the factors currently used are too small, resulting in lower trace gases and aerosol predictions.
In summary, the AQMv7 demonstrates large bias/error for PM2.5 near and downstream of wildfire sources from Canada and the northwestern US, indicating uncertainties in fire emissions and plume rise, transport, and smoke plume chemistry, while there is an overall smaller PM2.5 bias in the southern US. The AQMv7_new demonstrates a reduced PM2.5 level in all regions, which closes the gap between the model and the observation in the places where positive biases are found, thus improving the PM2.5 predictive accuracy therein. However, the reduction also worsens the model performance in the regions with a negative bias, which becomes more frequent during our study period with the influence from wildfires. The magnitude of the reduction in the AQMv7_new displays an east-to-west discrepancy, which is due to the dependence of the dry deposition velocity on vegetation types introduced by the new scheme.
An updated AQMv7 model (AQMv7_new) within the UFS system was developed to incorporate the recent scientific improvements from CMAQv5.4. The evolution of gas and aerosol chemistry in AQMv7_new is primarily influenced by the changes in the CB6 scheme, introduction of a new aerosol module, and updated air–surface exchange processes. The adoption of CB6r5 in CMAQv5.4 represents an improvement over CB6r3, with updates in halogen chemistry, reaction rates, products, photolysis rates, and addition of new reactions. The aerosol chemistry scheme, AERO7, introduces key improvements, such as the updated monoterpene oxidation yields, organic nitrate formation, water uptake on hydrophilic organic compounds, and new parameterization for anthropogenic SOA yields. Significant updates in dry deposition processes enhance the representation of air–surface exchange in AQMv7_new. Changes in O3 dry deposition dependence on soil moisture contribute to a more accurate simulation of ambient O3 concentrations. The aerosol dry deposition scheme undergoes continuous refinement, incorporating factors like leaf area index (LAI) and impaction efficiency based on land use categories. Structural changes in the I/O framework of CMAQ, such as the DESID and CIO modules contribute to an improved computational efficiency and ease of maintenance. The ELMO module in CMAQv5.4 further streamlines the synthesis of model output parameters, reducing the need for post-processing tools.
To test the performance of AQMv7_new, a 3-month simulation in June–August 2023 was conducted over North America, and an air quality evaluation was performed for the CONUS in comparison to the surface O3 and PM2.5 observations at AirNow sites. AQMv7_new demonstrates an improved simulation of O3 concentrations, reflecting better spatiotemporal agreement of the CONUS-mean with observations. Generally, there is a nation-wise decrease in O3 mixing ratios, mainly reducing the persistent high positive bias observed at coastal sites for AQMv7. Temporally, AQMv7_new addresses the persistent positive bias in peak values at noon and low values at night, leading to a reduction of 8 %–12 % in the overprediction of MDA8 O3. While AQMv7 with CMAQ 5.2.1 chemistry tends to overestimate hourly O3 concentrations in the EPA regions with small or no wildfire influence, AQMv7_new with CMAQ 5.4 exhibits a universal shift in the statistical distribution to the lower end, thus reducing the positive bias across these regions. The central and southwestern regions particularly benefit from the model updates, possibly due to the enhanced O3 dry deposition velocity over dry soil and the increased halogen-mediated O3 loss over the sea.
The spatial distribution of monthly average PM2.5 concentrations reflects extreme values over eastern and western Canada and the northwestern US, which is attributed to wildfire emissions, and this introduces substantial uncertainties in the model as indicated by the high mean bias values at the AirNow sites close to and downwind of wildfire sources. AQMv7_new generally predicts lower PM2.5 values averaged across the CONUS domain, which reduces the positive bias in the northeast for August. Improvements are also found in August for the hit rate and false alarm rate at high thresholds, suggesting a better predictive accuracy of PM2.5, particularly in highly polluted scenarios when wildfire events are captured by the model. By contrast, the generally worse performance in June and July is likely a result of missing the full extent of fire events in both models. The region-specific evaluation highlights a general underestimation over most of the areas in June and July, while it shows an overestimation in the eastern US and an underestimation in the western US by AQMv7 in August, with the AQMv7_new uniformly reducing PM2.5 levels across all regions. This reduction improves the predictive accuracy in regions with a positive bias but exacerbates the negative bias in regions where AQMv7 already underestimated PM2.5. Furthermore, the magnitude of the reduction displays an east-to-west discrepancy: higher reduction in the east and lower in the west. This spatial pattern can be attributed to the changes in the dry deposition scheme, which greatly increases the dry deposition rate over forests for the accumulation mode aerosol.
The NMB of AQMv7_new simulated MDA8 O3 and daily PM2.5 over the CONUS are −4.28 %, 3.89 %, and 10.75 % and −36.98 %, −26.07 %, and −16.60 % from June to August, respectively. Except for the high negative PM2.5 bias in June, these values fall in the benchmark criteria of ±15 % for MDA8 O3 and ±30 % for daily PM25 as suggested by Emery et al. (2017) by summarizing the model performance statistics reported from 2005 to 2015 in the CONUS. This highlights the challenges and uncertainties persisting in accurately capturing the complex dynamics of wildfire emissions and their influence on air quality. The AQMv7_new model cannot improve upon the exacerbated PM2.5 predictions near and downstream of wildfire sources (e.g., the northeast and west-northwest US), partly due to its current small factors, to scale fire-related emission species from CO and total PM2.5 in the simulations. Continuous efforts should be made to reduce the uncertainties of wildfire emissions, and test cases can be conducted to adjust the RAVE emission factors based on more intensive field campaigns and measurements within smoke plumes. The current UFS-AQM system has limited capabilities in diagnostics and can only write out species concentrations and AOD. This limits our current study to only a qualitative inference that the performance changes are driven by lumped updates to the chemistry and/or dry deposition schemes based on the CMAQ release notes. However, the verification results in this study showed that the changes from AQM_v7 to AQMv7_new behave similarly to that of the WRF-CMAQ version 5.2.1 versus 5.4. More process-related diagnostics and tools are currently being added to UFS-AQM to better interpret the performance changes by quantitatively attributing them to various processes, such as chemical productions and destructions, dry deposition, and transport. In addition, longer simulations covering multiple seasons and a more comprehensive evaluation with different observational platforms (e.g., surface sites, ozonesondes, aircraft, lidar, and satellite) are also ongoing for a more thorough investigation of the AQM and impacts of the model updates described here. Further refinements to the coupled CCPP physics (e.g., GFS) and the critical driving meteorological parameters which inherently interact with natural emissions in addition to wildfire, such as biogenic VOCs, soil NO, windblown dust, oceanic dimethyl sulfide (DMS), and lightning NOx emissions, are also highly needed. This study shows that the UFS-AQM framework can well accommodate the community air quality model, such as CMAQ, as well as its latest upgrade. The results of this upgrade are consistent with those shown in the WRF-CMAQ systems. This method is proven to be viable for ESMF coupling for different dynamics, physics, and chemistry with a hierarchal coding infrastructure linked across authorized repositories at collaborating agencies. Although we did not include some functions of the original CMAQ, such as the decoupled direct method in three dimensions (DDM-3D) (Zhang et al., 2012), Integrated Source Apportionment Method (ISAM) (Kwok et al., 2015) in the UFS-AQM model, due to its novel ESMF coupling, the online CMAQ prediction model within this framework yields overall reasonable results. As the UFS-AQM model is the current operational air quality forecast system of NOAA, this study underscores the importance of ongoing scientific investigations, refinement, and quality assurance processes in atmospheric modeling to ensure reliable predictions and advance our understanding of the intricate interactions driving air quality variability.
The UFS-AQMv7 source codes are available on the following GitHub repository: GitHub – ufs-community/ufs-srweather-app at production/AQM.v7 (https://github.com/ufs-community/ufs-srweather-app/releases, Huang et al., 2025). The AQMv7_new codes are reposited at https://doi.org/10.5281/zenodo.10833128 (Campbell et al., 2024) and can also be downloaded via a GitHub tag: GitHub – noaa-oar-arl/AQM at CMAQ54_Paper (https://github.com/noaa-oar-arl/AQM/tree/CMAQ54_Paper, last access: 15 March 2024). The AirNow data used for evaluation are publicly available at https://files.airnowtech.org/ (US EPA, 2023).
The supplement related to this article is available online at https://doi.org/10.5194/gmd-18-1635-2025-supplement.
WL conducted the model updates and drafted the initial manuscript. BT contributed to model updates, conducted the 3-month model runs, and performed model evaluation for gas and aerosol species. PCC guided BT for model runs and conducted meteorology evaluation. PCC, YT, BB, ZM, KW, JH, and RM contributed to model updates, project methodology, analyses, and evaluation. BB, DT, IS, PCC, and YT contributed to project administration, funding acquisition, and supervision. All authors contributed to the interpretation of the results and revisions of the paper.
The contact author has declared that none of the authors has any competing interests.
Publisher’s note: Copernicus Publications remains neutral with regard to jurisdictional claims made in the text, published maps, institutional affiliations, or any other geographical representation in this paper. While Copernicus Publications makes every effort to include appropriate place names, the final responsibility lies with the authors.
We acknowledge the developers for creating the useful evaluation tools of MELODIES-MONET and AMET.
This study was co-funded by NOAA grant nos. NA24NESX432C0001 and NA19NES4320002 (Cooperative Institute for Satellite Earth System Studies, CISESS) at the University of Maryland/ESSIC and NOAA IIJA (grant no. NA22NES4050024I/121327-Z7648201), DSRA (grant no. NA22NES4050023D/119812-Z7646201). This research has been supported by the National Oceanic and Atmospheric Administration (grant no. 79785-Z7554202) and George Mason University (grant no. NA22NES4050024I).
This paper was edited by Samuel Remy and reviewed by two anonymous referees.
Appel, K. W., Gilliam, R. C., Davis, N., Zubrow, A., and Howard, S. C.: Overview of the atmospheric model evaluation tool (AMET) v1.1 for evaluating meteorological and air quality models, Environ. Modell. Softw., 26, 434–443, https://doi.org/10.1016/j.envsoft.2010.09.007, 2011.
Appel, K. W., Bash, J. O., Fahey, K. M., Foley, K. M., Gilliam, R. C., Hogrefe, C., Hutzell, W. T., Kang, D., Mathur, R., Murphy, B. N., Napelenok, S. L., Nolte, C. G., Pleim, J. E., Pouliot, G. A., Pye, H. O. T., Ran, L., Roselle, S. J., Sarwar, G., Schwede, D. B., Sidi, F. I., Spero, T. L., and Wong, D. C.: The Community Multiscale Air Quality (CMAQ) model versions 5.3 and 5.3.1: system updates and evaluation, Geosci. Model Dev., 14, 2867–2897, https://doi.org/10.5194/gmd-14-2867-2021, 2021.
Bai, H., Li, B., Mehra, A., Meixner, J., Moorthi, S., Ray, S., Stefanova, L., Wang, J., Wang, J., Worthen, D., Yang, F., and Stan, C.: The Impact of Tropical SST Biases on the S2S Precipitation Forecast Skill over the Contiguous United States in the UFS Global Coupled Model, Weather Forecast., 38, 937–952, https://doi.org/10.1175/WAF-D-22-0162.1, 2023.
Baker, B. and Pan, L.: Overview of the Model and Observation Evaluation Toolkit (MONET) Version 1.0 for Evaluating Atmospheric Transport Models, Atmosphere, 8, 210, https://doi.org/10.3390/atmos8110210, 2017.
Balbus, J. M. and Malina, C.: Identifying Vulnerable Subpopulations for Climate Change Health Effects in the United States, J. Occup. Environ. Med., 51, 33–37, https://doi.org/10.1097/JOM.0b013e318193e12e, 2009.
Briggs, G. A.: A Plume Rise Model Compared with Observations, JAPCA J. Air Waste Ma., 15, 433–438, https://doi.org/10.1080/00022470.1965.10468404, 1965.
Burkholder, J. B., Sander, S. P., Abbatt, J. P. D. A. D., Barker, J. R., Huie, R. E., Kolb, C. E., Iii, M. J. K., Orkin, V. L., Wilmouth, D. M., and Wine, P. H.: Chemical Kinetics and Photochemical Data for Use in Atmospheric Studies: Evaluation number 18, JPL Publication 15-10, Jet Propulsion Laboratory, Pasadena, CA, 2019.
Campbell, P. C., Baker, B., Saylor, R., Tong, D., Tang, Y., and Lee, P.: Initial Development of a NOAA Emissions and eXchange Unified System (NEXUS), 100th American Meteorological Society Annual Meeting, 12–16 January 2020, Boston, MA, https://doi.org/10.13140/RG.2.2.21070.20806, 2020.
Campbell, P. C., Tang, Y., Lee, P., Baker, B., Tong, D., Saylor, R., Stein, A., Huang, J., Huang, H.-C., Strobach, E., McQueen, J., Pan, L., Stajner, I., Sims, J., Tirado-Delgado, J., Jung, Y., Yang, F., Spero, T. L., and Gilliam, R. C.: Development and evaluation of an advanced National Air Quality Forecasting Capability using the NOAA Global Forecast System version 16, Geosci. Model Dev., 15, 3281–3313, https://doi.org/10.5194/gmd-15-3281-2022, 2022.
Campbell, P. C., Li, W., and Tang, B.: noaa-oar-arl/AQM: CMAQv5.4 Paper (CMAQ54_Paper), Zenodo [code], https://doi.org/10.5281/zenodo.10833128, 2024.
Carlton, A. G., Bhave, P. V., Napelenok, S. L., Edney, E. O., Sarwar, G., Pinder, R. W., Pouliot, G. A., and Houyoux, M.: Model Representation of Secondary Organic Aerosol in CMAQv4.7, Environ. Sci. Technol., 44, 8553–8560, https://doi.org/10.1021/es100636q, 2010.
Chen, F. and Dudhia, J.: Coupling an Advanced Land Surface–Hydrology Model with the Penn State–NCAR MM5 Modeling System. Part I: Model Implementation and Sensitivity, Mon. Weather Rev., 129, 569–585, https://doi.org/10.1175/1520-0493(2001)129<0569:CAALSH>2.0.CO;2, 2001.
Chen, J.-H. and Lin, S.-J.: The remarkable predictability of inter-annual variability of Atlantic hurricanes during the past decade, Geophys. Res. Lett., 38, L11804, https://doi.org/10.1029/2011GL047629, 2011.
Chen, J.-H. and Lin, S.-J.: Seasonal Predictions of Tropical Cyclones Using a 25-km-Resolution General Circulation Model, J. Climate, 26, 380–398, https://doi.org/10.1175/JCLI-D-12-00061.1, 2013.
Chen, J.-H., Lin, S.-J., Zhou, L., Chen, X., Rees, S., Bender, M., and Morin, M.: Evaluation of Tropical Cyclone Forecasts in the Next Generation Global Prediction System, Mon. Weather Rev., 147, 3409–3428, https://doi.org/10.1175/MWR-D-18-0227.1, 2019.
Chen, X., Zhang, Y., Wang, K., Tong, D., Lee, P., Tang, Y., Huang, J., Campbell, P. C., Mcqueen, J., Pye, H. O. T., Murphy, B. N., and Kang, D.: Evaluation of the offline-coupled GFSv15–FV3–CMAQv5.0.2 in support of the next-generation National Air Quality Forecast Capability over the contiguous United States, Geosci. Model Dev., 14, 3969–3993, https://doi.org/10.5194/gmd-14-3969-2021, 2021.
Clough, S. A., Shephard, M. W., Mlawer, E. J., Delamere, J. S., Iacono, M. J., Cady-Pereira, K., Boukabara, S., and Brown, P. D.: Atmospheric radiative transfer modeling: a summary of the AER codes, J. Quant. Spectrosc. Ra., 91, 233–244, https://doi.org/10.1016/j.jqsrt.2004.05.058, 2005.
Cohen, A. J., Ross Anderson, H., Ostro, B., Pandey, K. D., Krzyzanowski, M., Künzli, N., Gutschmidt, K., Pope, A., Romieu, I., Samet, J. M., and Smith, K.: The Global Burden of Disease Due to Outdoor Air Pollution, J. Toxicol. Env. Heal. A, 68, 1301–1307, https://doi.org/10.1080/15287390590936166, 2005.
Dong, X., Fu, J. S., Huang, K., Tong, D., and Zhuang, G.: Model development of dust emission and heterogeneous chemistry within the Community Multiscale Air Quality modeling system and its application over East Asia, Atmos. Chem. Phys., 16, 8157–8180, https://doi.org/10.5194/acp-16-8157-2016, 2016.
Eder, B., Kang, D., Mathur, R., Yu, S., and Schere, K.: An operational evaluation of the Eta–CMAQ air quality forecast model, Atmos. Environ., 40, 4894–4905, https://doi.org/10.1016/j.atmosenv.2005.12.062, 2006.
Eder, B., Kang, D., Mathur, R., Pleim, J., Yu, S., Otte, T., and Pouliot, G.: A performance evaluation of the National Air Quality Forecast Capability for the summer of 2007, Atmos. Environ., 43, 2312–2320, https://doi.org/10.1016/j.atmosenv.2009.01.033, 2009.
EEA (European Environment Agency): Advancing towards climate resilience in Europe – Status of reported national adaptation actions in 2021, ISBN 978-92-9480-516-4, 2022.
Ek, M. B., Mitchell, K. E., Lin, Y., Rogers, E., Grunmann, P., Koren, V., Gayno, G., and Tarpley, J. D.: Implementation of Noah land surface model advances in the National Centers for Environmental Prediction operational mesoscale Eta model, J. Geophys. Res.-Atmos., 108, 8851, https://doi.org/10.1029/2002JD003296, 2003.
Emery, C., Jung, J., Koo, B., and Yarwood, G.: Improvements to CAMx snow cover treatments and Carbon Bond chemical mechanism for winter ozone, Final report for Utah Department of Environmental Quality, Salt Lake City, UT, prepared by Ramboll Environ, Novato, CA, 2015.
Emery, C., Liu, Z., Russell, A. G., Odman, M. T., Yarwood, G., and Kumar, N.: Recommendations on statistics and benchmarks to assess photochemical model performance, J. Air Waste Manage. Assoc., 67, 582–598, https://doi.org/10.1080/10962247.2016.1265027, 2017.
Fares, S., Weber, R., Park, J.-H., Gentner, D., Karlik, J., and Goldstein, A. H.: Ozone deposition to an orange orchard: Partitioning between stomatal and non-stomatal sinks, Environ. Pollut., 169, 258–266, https://doi.org/10.1016/j.envpol.2012.01.030, 2012.
Fu, X., Wang, S. X., Cheng, Z., Xing, J., Zhao, B., Wang, J. D., and Hao, J. M.: Source, transport and impacts of a heavy dust event in the Yangtze River Delta, China, in 2011, Atmos. Chem. Phys., 14, 1239–1254, https://doi.org/10.5194/acp-14-1239-2014, 2014.
Gantt, B., Kelly, J. T., and Bash, J. O.: Updating sea spray aerosol emissions in the Community Multiscale Air Quality (CMAQ) model version 5.0.2, Geosci. Model Dev., 8, 3733–3746, https://doi.org/10.5194/gmd-8-3733-2015, 2015.
Grell, A., Dudhia, J., and Stauffer, D.: A description of the fifth-generation Penn State/NCAR Mesoscale Model (MM5), NCAR tech, Note NCAR TN-398-1-STR, 117 pp., https://doi.org/10.5065/D60Z716B, 1994.
Guenther, A. B., Jiang, X., Heald, C. L., Sakulyanontvittaya, T., Duhl, T., Emmons, L. K., and Wang, X.: The Model of Emissions of Gases and Aerosols from Nature version 2.1 (MEGAN2.1): an extended and updated framework for modeling biogenic emissions, Geosci. Model Dev., 5, 1471–1492, https://doi.org/10.5194/gmd-5-1471-2012, 2012.
Han, J. and Bretherton, C. S.: TKE-Based Moist Eddy-Diffusivity Mass-Flux (EDMF) Parameterization for Vertical Turbulent Mixing, Weather Forecast., 34, 869–886, https://doi.org/10.1175/WAF-D-18-0146.1, 2019.
Han, J. and Pan, H.-L.: Revision of Convection and Vertical Diffusion Schemes in the NCEP Global Forecast System, Weather Forecast., 26, 520–533, https://doi.org/10.1175/WAF-D-10-05038.1, 2011.
Han, J., Wang, W., Kwon, Y. C., Hong, S.-Y., Tallapragada, V., and Yang, F.: Updates in the NCEP GFS Cumulus Convection Schemes with Scale and Aerosol Awareness, Weather Forecast., 32, 2005–2017, https://doi.org/10.1175/WAF-D-17-0046.1, 2017.
Harris, L. M. and Lin, S.-J.: A Two-Way Nested Global-Regional Dynamical Core on the Cubed-Sphere Grid, Mon. Weather Rev., 141, 283–306, https://doi.org/10.1175/MWR-D-11-00201.1, 2013.
Heinzeller, D., Bernardet, L., Firl, G., Zhang, M., Sun, X., and Ek, M.: The Common Community Physics Package (CCPP) Framework v6, Geosci. Model Dev., 16, 2235–2259, https://doi.org/10.5194/gmd-16-2235-2023, 2023.
Helmig, D., Ganzeveld, L., Butler, T., and Oltmans, S. J.: The role of ozone atmosphere-snow gas exchange on polar, boundary-layer tropospheric ozone – a review and sensitivity analysis, Atmos. Chem. Phys., 7, 15–30, https://doi.org/10.5194/acp-7-15-2007, 2007.
Henze, D. K. and Seinfeld, J. H.: Global secondary organic aerosol from isoprene oxidation, Geophys. Res. Lett., 33, L09812, https://doi.org/10.1029/2006GL025976, 2006.
Hooper, L. G. and Kaufman, J. D.: Ambient Air Pollution and Clinical Implications for Susceptible Populations, Annals ATS, 15, S64–S68, https://doi.org/10.1513/AnnalsATS.201707-574MG, 2018.
Horowitz, L. W., Naik, V., Paulot, F., Ginoux, P. A., Dunne, J. P., Mao, J., Schnell, J., Chen, X., He, J., John, J. G., Lin, M., Lin, P., Malyshev, S., Paynter, D., Shevliakova, E., and Zhao, M.: The GFDL Global Atmospheric Chemistry-Climate Model AM4.1: Model Description and Simulation Characteristics, J. Adv. Model. Earth Sy., 12, e2019MS002032, https://doi.org/10.1029/2019MS002032, 2020.
Huang, J., McQueen, J., Wilczak, J., Djalalova, I., Stajner, I., Shafran, P., Allured, D., Lee, P., Pan, L., Tong, D., Huang, H.-C., DiMego, G., Upadhayay, S., and Monache, L. D.: Improving NOAA NAQFC PM2.5 Predictions with a Bias Correction Approach, Weather Forecast., 32, 407–421, https://doi.org/10.1175/WAF-D-16-0118.1, 2017.
Huang, J., McQueen, J., Yang, B., Shafran, P., Huang, H.-C., Bhattacharjee, P., Tang, Y., Campbell, P. C., Tong, D., Lee, P., Stajner, I., Kain, J. S., Tirado-Delgado, J., and Koch, D. M.: A comparison of global scale FV3 versus regional scale NAM meteorological drivers for regional air quality forecastin, The 100th AGU Fall Meeting, 9–13 December 2019, San Francisco, CA, 2019.
Huang, J., Stajner, I., Raffaele, M., Fanglin, Y., Kai, Y., Huang, H. C., Jeon, C. H., Curtis, B., McQueen, J., Haixia, L., Baker, B., Daniel, T., Tang, Y., Patrick, C., George, G., Frost, G., Rebecca, S., Wang, S., Kondragunta, S., Li, F., and Jung, Y.: Development of the next-generation air quality prediction system in the Unified Forecast System framework: Enhancing predictability of wildfire air quality impacts, B. Am. Meteorol. Soc., https://doi.org/10.1175/BAMS-D-23-0053.1, 2025 (code available at: (https://github.com/ufs-community/ufs-srweather-app/releases, last access: 15 March 2024).
Huang, M., Tong, D., Lee, P., Pan, L., Tang, Y., Stajner, I., Pierce, R. B., McQueen, J., and Wang, J.: Toward enhanced capability for detecting and predicting dust events in the western United States: the Arizona case study, Atmos. Chem. Phys., 15, 12595–12610, https://doi.org/10.5194/acp-15-12595-2015, 2015.
Iacono, M. J., Delamere, J. S., Mlawer, E. J., Shephard, M. W., Clough, S. A., and Collins, W. D.: Radiative forcing by long-lived greenhouse gases: Calculations with the AER radiative transfer models, J. Geophys. Res.-Atmos., 113, D13103, https://doi.org/10.1029/2008JD009944, 2008.
Janssens-Maenhout, G., Crippa, M., Guizzardi, D., Dentener, F., Muntean, M., Pouliot, G., Keating, T., Zhang, Q., Kurokawa, J., Wankmüller, R., Denier van der Gon, H., Kuenen, J. J. P., Klimont, Z., Frost, G., Darras, S., Koffi, B., and Li, M.: HTAP_v2.2: a mosaic of regional and global emission grid maps for 2008 and 2010 to study hemispheric transport of air pollution, Atmos. Chem. Phys., 15, 11411–11432, https://doi.org/10.5194/acp-15-11411-2015, 2015.
Jiménez, P. A., Dudhia, J., González-Rouco, J. F., Navarro, J., Montávez, J. P., and García-Bustamante, E.: A Revised Scheme for the WRF Surface Layer Formulation, Mon. Weather Rev., 140, 898–918, https://doi.org/10.1175/MWR-D-11-00056.1, 2012.
Kelly, J. T., Bhave, P. V., Nolte, C. G., Shankar, U., and Foley, K. M.: Simulating emission and chemical evolution of coarse sea-salt particles in the Community Multiscale Air Quality (CMAQ) model, Geosci. Model Dev., 3, 257–273, https://doi.org/10.5194/gmd-3-257-2010, 2010.
Krishnamurthy, V., Meixner, J., Stefanova, L., Wang, J., Worthen, D., Moorthi, S., Li, B., Sluka, T., and Stan, C.: Sources of Subseasonal Predictability over CONUS during Boreal Summer, J. Climate, 34, 3273–3294, https://doi.org/10.1175/JCLI-D-20-0586.1, 2021.
Krueger, S. K., Fu, Q., Liou, K. N., and Chin, H.-N. S.: Improvements of an Ice-Phase Microphysics Parameterization for Use in Numerical Simulations of Tropical Convection, J. Appl. Meteorol. Clim., 34, 281–287, https://doi.org/10.1175/1520-0450-34.1.281, 1995.
Kwok, R. H. F., Baker, K. R., Napelenok, S. L., and Tonnesen, G. S.: Photochemical grid model implementation and application of VOC, NOx, and O3 source apportionment, Geosci. Model Dev., 8, 99–114, https://doi.org/10.5194/gmd-8-99-2015, 2015.
Lee, B.-J., Kim, B., and Lee, K.: Air Pollution Exposure and Cardiovascular Disease, Toxicol Res., 30, 71–75, https://doi.org/10.5487/TR.2014.30.2.071, 2014.
Lee, P., McQueen, J., Stajner, I., Huang, J., Pan, L., Tong, D., Kim, H., Tang, Y., Kondragunta, S., Ruminski, M., Lu, S., Rogers, E., Saylor, R., Shafran, P., Huang, H.-C., Gorline, J., Upadhayay, S., and Artz, R.: NAQFC Developmental Forecast Guidance for Fine Particulate Matter (PM2.5), Weather Forecast., 32, 343–360, https://doi.org/10.1175/WAF-D-15-0163.1, 2017.
Li, F., Zhang, X., Kondragunta, S., Lu, X., Csiszar, I., and Schmidt, C. C.: Hourly biomass burning emissions product from blended geostationary and polar-orbiting satellites for air quality forecasting applications, Remote Sens. Environ., 281, 113237, https://doi.org/10.1016/j.rse.2022.113237, 2022.
Li, W., Wang, Y., Bernier, C., and Estes, M.: Identification of Sea Breeze Recirculation and Its Effects on Ozone in Houston, TX, During DISCOVER-AQ 2013, J. Geophys. Res.-Atmos., 125, e2020JD033165, https://doi.org/10.1029/2020JD033165, 2020.
Lin, H., Jacob, D. J., Lundgren, E. W., Sulprizio, M. P., Keller, C. A., Fritz, T. M., Eastham, S. D., Emmons, L. K., Campbell, P. C., Baker, B., Saylor, R. D., and Montuoro, R.: Harmonized Emissions Component (HEMCO) 3.0 as a versatile emissions component for atmospheric models: application in the GEOS-Chem, NASA GEOS, WRF-GC, CESM2, NOAA GEFS-Aerosol, and NOAA UFS models, Geosci. Model Dev., 14, 5487–5506, https://doi.org/10.5194/gmd-14-5487-2021, 2021.
Lin, M., Horowitz, L. W., Xie, Y., Paulot, F., Malyshev, S., Shevliakova, E., Finco, A., Gerosa, G., Kubistin, D., and Pilegaard, K.: Vegetation feedbacks during drought exacerbate ozone air pollution extremes in Europe, Nat. Clim. Change, 10, 444–451, https://doi.org/10.1038/s41558-020-0743-y, 2020.
Lin, M., Horowitz, L. W., Zhao, M., Harris, L., Ginoux, P., Dunne, J., Malyshev, S., Shevliakova, E., Ahsan, H., Garner, S., Paulot, F., Pouyaei, A., Smith, S. J., Xie, Y., Zadeh, N., and Zhou, L.: The GFDL Variable-Resolution Global Chemistry-Climate Model for Research at the Nexus of US Climate and Air Quality Extremes, J. Adv. Model. Earth Sy., 16, e2023MS003984, https://doi.org/10.1029/2023MS003984, 2024.
Lin, Y.-L., Farley, R. D., and Orville, H. D.: Bulk Parameterization of the Snow Field in a Cloud Model, J. Appl. Meteorol. Climatol., 22, 1065–1092, https://doi.org/10.1175/1520-0450(1983)022<1065:BPOTSF>2.0.CO;2, 1983.
Liu, F., Choi, S., Li, C., Fioletov, V. E., McLinden, C. A., Joiner, J., Krotkov, N. A., Bian, H., Janssens-Maenhout, G., Darmenov, A. S., and da Silva, A. M.: A new global anthropogenic SO2 emission inventory for the last decade: a mosaic of satellite-derived and bottom-up emissions, Atmos. Chem. Phys., 18, 16571–16586, https://doi.org/10.5194/acp-18-16571-2018, 2018.
Lord, S. J., Willoughby, H. E., and Piotrowicz, J. M.: Role of a Parameterized Ice-Phase Microphysics in an Axisymmetric, Nonhydrostatic Tropical Cyclone Model, J. Atmos. Sci., 41, 2836–2848, https://doi.org/10.1175/1520-0469(1984)041<2836:ROAPIP>2.0.CO;2, 1984.
Lovett, G. M., Tear, T. H., Evers, D. C., Findlay, S. E. G., Cosby, B. J., Dunscomb, J. K., Driscoll, C. T., and Weathers, K. C.: Effects of Air Pollution on Ecosystems and Biological Diversity in the Eastern United States, Ann. NY Acad. Sci., 1162, 99–135, https://doi.org/10.1111/j.1749-6632.2009.04153.x, 2009.
Luecken, D. J., Yarwood, G., and Hutzell, W. T.: Multipollutant modeling of ozone, reactive nitrogen and HAPs across the continental US with CMAQ-CB6, Atmos. Environ., 201, 62–72, https://doi.org/10.1016/j.atmosenv.2018.11.060, 2019.
Mathur, R., Yu, S., Kang, D., and Schere, K. L.: Assessment of the wintertime performance of developmental particulate matter forecasts with the Eta-Community Multiscale Air Quality modeling system, J. Geophys. Res.-Atmos., 113, D02303, https://doi.org/10.1029/2007JD008580, 2008.
McKeen, S., Grell, G., Peckham, S., Wilczak, J., Djalalova, I., Hsie, E.-Y., Frost, G., Peischl, J., Schwarz, J., Spackman, R., Holloway, J., de Gouw, J., Warneke, C., Gong, W., Bouchet, V., Gaudreault, S., Racine, J., McHenry, J., McQueen, J., Lee, P., Tang, Y., Carmichael, G. R., and Mathur, R.: An evaluation of real-time air quality forecasts and their urban emissions over eastern Texas during the summer of 2006 Second Texas Air Quality Study field study, J. Geophys. Res.-Atmos., 114, D00F11, https://doi.org/10.1029/2008JD011697, 2009.
Mészáros, R., Horváth, L., Weidinger, T., Neftel, A., Nemitz, E., Dämmgen, U., Cellier, P., and Loubet, B.: Measurement and modelling ozone fluxes over a cut and fertilized grassland, Biogeosciences, 6, 1987–1999, https://doi.org/10.5194/bg-6-1987-2009, 2009.
Mlawer, E. J., Taubman, S. J., Brown, P. D., Iacono, M. J., and Clough, S. A.: Radiative transfer for inhomogeneous atmospheres: RRTM, a validated correlated-k model for the longwave, J. Geophys. Res.-Atmos., 102, 16663–16682, https://doi.org/10.1029/97JD00237, 1997.
Monin, A. S. and Obukhov, A. M.: Basic laws of turbulent mixing in the surface layer of the atmosphere, Tr. Akad. Nauk SSSR Geophiz. Inst., 24, 163–187, 1954.
Murphy, B. N., Nolte, C. G., Sidi, F., Bash, J. O., Appel, K. W., Jang, C., Kang, D., Kelly, J., Mathur, R., Napelenok, S., Pouliot, G., and Pye, H. O. T.: The Detailed Emissions Scaling, Isolation, and Diagnostic (DESID) module in the Community Multiscale Air Quality (CMAQ) modeling system version 5.3.2, Geosci. Model Dev., 14, 3407–3420, https://doi.org/10.5194/gmd-14-3407-2021, 2021.
NEI (National Emissions Inventory Collaborative): 2016v1 Emissions Modeling Platform [data set], http://views.cira.colostate.edu/wiki/wiki/10202 (last access: 20 February 2024), 2019.
Odum, J. R., Hoffmann, T., Bowman, F., Collins, D., Flagan, R. C., and Seinfeld, J. H.: Gas/Particle Partitioning and Secondary Organic Aerosol Yields, Environ. Sci. Technol., 30, 2580–2585, https://doi.org/10.1021/es950943+, 1996.
O'Rourke, P. R., Smith, S. J., Mott, A., Ahsan, H., McDuffie, E. E., Crippa, M., Klimont, Z., McDonald, B., Wang, S., Nicholson, M. B., Feng, L., and Hoesly, R. M.: CEDS v_2021_02_05 Release Emission Data (v_2021_02_05), Zenodo [data set], https://doi.org/10.5281/zenodo.4509372, 2021.
Otte, T. L., Pouliot, G., Pleim, J. E., Young, J. O., Schere, K. L., Wong, D. C., Lee, P. C. S., Tsidulko, M., McQueen, J. T., Davidson, P., Mathur, R., Chuang, H.-Y., DiMego, G., and Seaman, N. L.: Linking the Eta Model with the Community Multiscale Air Quality (CMAQ) Modeling System to Build a National Air Quality Forecasting System, Weather Forecast., 20, 367–384, https://doi.org/10.1175/WAF855.1, 2005.
Pleim, J. E., Ran, L., Saylor, R. D., Willison, J., and Binkowski, F. S.: A New Aerosol Dry Deposition Model for Air Quality and Climate Modeling, J. Adv. Model. Earth Sy., 14, e2022MS003050, https://doi.org/10.1029/2022MS003050, 2022.
Pye, H. O. T., Chan, A. W. H., Barkley, M. P., and Seinfeld, J. H.: Global modeling of organic aerosol: the importance of reactive nitrogen (NOx and NO3), Atmos. Chem. Phys., 10, 11261–11276, https://doi.org/10.5194/acp-10-11261-2010, 2010.
Pye, H. O. T., Pinder, R. W., Piletic, I. R., Xie, Y., Capps, S. L., Lin, Y.-H., Surratt, J. D., Zhang, Z., Gold, A., Luecken, D. J., Hutzell, W. T., Jaoui, M., Offenberg, J. H., Kleindienst, T. E., Lewandowski, M., and Edney, E. O.: Epoxide Pathways Improve Model Predictions of Isoprene Markers and Reveal Key Role of Acidity in Aerosol Formation, Environ. Sci. Technol., 47, 11056–11064, https://doi.org/10.1021/es402106h, 2013.
Pye, H. O. T., Luecken, D. J., Xu, L., Boyd, C. M., Ng, N. L., Baker, K. R., Ayres, B. R., Bash, J. O., Baumann, K., Carter, W. P. L., Edgerton, E., Fry, J. L., Hutzell, W. T., Schwede, D. B., and Shepson, P. B.: Modeling the Current and Future Roles of Particulate Organic Nitrates in the Southeastern United States, Environ. Sci. Technol., 49, 14195–14203, https://doi.org/10.1021/acs.est.5b03738, 2015.
Pye, H. O. T., Murphy, B. N., Xu, L., Ng, N. L., Carlton, A. G., Guo, H., Weber, R., Vasilakos, P., Appel, K. W., Budisulistiorini, S. H., Surratt, J. D., Nenes, A., Hu, W., Jimenez, J. L., Isaacman-VanWertz, G., Misztal, P. K., and Goldstein, A. H.: On the implications of aerosol liquid water and phase separation for organic aerosol mass, Atmos. Chem. Phys., 17, 343–369, https://doi.org/10.5194/acp-17-343-2017, 2017.
Pye, H. O. T., D'Ambro, E. L., Lee, B. H., Schobesberger, S., Takeuchi, M., Zhao, Y., Lopez-Hilfiker, F., Liu, J., Shilling, J. E., Xing, J., Mathur, R., Middlebrook, A. M., Liao, J., Welti, A., Graus, M., Warneke, C., de Gouw, J. A., Holloway, J. S., Ryerson, T. B., Pollack, I. B., and Thornton, J. A.: Anthropogenic enhancements to production of highly oxygenated molecules from autoxidation, P. Natl. Acad. Sci., 116, 6641–6646, https://doi.org/10.1073/pnas.1810774116, 2019.
Saha, P. K. and Grieshop, A. P.: Exploring Divergent Volatility Properties from Yield and Thermodenuder Measurements of Secondary Organic Aerosol from á-Pinene Ozonolysis, Environ. Sci. Technol., 50, 5740–5749, https://doi.org/10.1021/acs.est.6b00303, 2016.
Sarwar, G., Simon, H., Bhave, P., and Yarwood, G.: Examining the impact of heterogeneous nitryl chloride production on air quality across the United States, Atmos. Chem. Phys., 12, 6455–6473, https://doi.org/10.5194/acp-12-6455-2012, 2012.
Sarwar, G., Gantt, B., Schwede, D., Foley, K., Mathur, R., and Saiz-Lopez, A.: Impact of Enhanced Ozone Deposition and Halogen Chemistry on Tropospheric Ozone over the Northern Hemisphere, Environ. Sci. Technol., 49, 9203–9211, https://doi.org/10.1021/acs.est.5b01657, 2015.
Sarwar, G., Gantt, B., Foley, K., Fahey, K., Spero, T. L., Kang, D., Mathur, R., Foroutan, H., Xing, J., Sherwen, T., and Saiz-Lopez, A.: Influence of bromine and iodine chemistry on annual, seasonal, diurnal, and background ozone: CMAQ simulations over the Northern Hemisphere, Atmos. Environ., 213, 395–404, https://doi.org/10.1016/j.atmosenv.2019.06.020, 2019.
Shu, Q., Murphy, B., Schwede, D., Henderson, B. H., Pye, H. O. T., Appel, K. W., Khan, T. R., and Perlinger, J. A.: Improving the particle dry deposition scheme in the CMAQ photochemical modeling system, Atmos. Environ., 289, 119343, https://doi.org/10.1016/j.atmosenv.2022.119343, 2022.
Sofiev, M., Ermakova, T., and Vankevich, R.: Evaluation of the smoke-injection height from wild-land fires using remote-sensing data, Atmos. Chem. Phys., 12, 1995–2006, https://doi.org/10.5194/acp-12-1995-2012, 2012.
Stajner, I., Davidson, P., Byun, D., McQueen, J., Draxler, R., Dickerson, P., and Meagher, J.: US National Air Quality Forecast Capability: Expanding Coverage to Include Particulate Matter, in: Air Pollution Modeling and its Application XXI, Dordrecht, 379–384, https://doi.org/10.1007/978-94-007-1359-8_64, 2012.
Tai, A. P. K., Martin, M. V., and Heald, C. L.: Threat to future global food security from climate change and ozone air pollution, Nat. Clim. Change, 4, 817–821, https://doi.org/10.1038/nclimate2317, 2014.
Tang, Y., Bian, H., Tao, Z., Oman, L. D., Tong, D., Lee, P., Campbell, P. C., Baker, B., Lu, C.-H., Pan, L., Wang, J., McQueen, J., and Stajner, I.: Comparison of chemical lateral boundary conditions for air quality predictions over the contiguous United States during pollutant intrusion events, Atmos. Chem. Phys., 21, 2527–2550, https://doi.org/10.5194/acp-21-2527-2021, 2021.
Tang, Y., Campbell, P. C., Lee, P., Saylor, R., Yang, F., Baker, B., Tong, D., Stein, A., Huang, J., Huang, H.-C., Pan, L., McQueen, J., Stajner, I., Tirado-Delgado, J., Jung, Y., Yang, M., Bourgeois, I., Peischl, J., Ryerson, T., Blake, D., Schwarz, J., Jimenez, J.-L., Crawford, J., Diskin, G., Moore, R., Hair, J., Huey, G., Rollins, A., Dibb, J., and Zhang, X.: Evaluation of the NAQFC driven by the NOAA Global Forecast System (version 16): comparison with the WRF-CMAQ during the summer 2019 FIREX-AQ campaign, Geosci. Model Dev., 15, 7977–7999, https://doi.org/10.5194/gmd-15-7977-2022, 2022.
Taylor, G. E., Johnson, D. W., and Andersen, C. P.: Air Pollution and Forest Ecosystems: A Regional to Global Perspective, Ecol. Appl., 4, 662–689, https://doi.org/10.2307/1941999, 1994.
Tewari, M., Chen, F., Wang, W., Dudhia, J., LeMone, M., Mitchell, K., Ek, M., Gayno, G., and Wegiel, J.: Implementation and verification of the unified NOAH land surface model in the WRF model (Formerly Paper Number 17.5), in: Proceedings of the 20th conference on weather analysis and forecasting/16th conference on numerical weather prediction, Seattle, WA, USA, https://n2t.org/ark:/85065/d7fb523p (last access: 5 March 2025), 2004.
UNEP (United Nations EnvironmentProgramme): Actions on Air Quality: A Global Summary of Policies and Programmes to Reduce Air Pollution, ISBN 978-92-807-3880-3, 2021.
United States Environmental Protection Agency: AirNow Data Manage Center, AirNow [data set], https://files.airnowtech.org/ (last access: 10 March 2025), 2023.
Van Dingenen, R., Dentener, F. J., Raes, F., Krol, M. C., Emberson, L., and Cofala, J.: The global impact of ozone on agricultural crop yields under current and future air quality legislation, Atmos. Environ., 43, 604–618, https://doi.org/10.1016/j.atmosenv.2008.10.033, 2009.
WHO (World Health Organization): WHO global air quality guidelines: particulate matter (PM2.5 and PM10), ozone, nitrogen dioxide, sulfur dioxide and carbon monoxide, WHO, Geneva, Switzerland, ISBN 978-92-4-003422-8, 2021.
WHO: Ambient (outdoor) air pollution, https://www.who.int/news-room/fact-sheets/detail/ambient-(outdoor)-air-quality-and-health, last access: 10 May 2023.
Willmott, C. J.: On the Validation of Models, Phys. Geogr., 2, 184–194, https://doi.org/10.1080/02723646.1981.10642213, 1981.
Xu, L., Pye, H. O. T., He, J., Chen, Y., Murphy, B. N., and Ng, N. L.: Experimental and model estimates of the contributions from biogenic monoterpenes and sesquiterpenes to secondary organic aerosol in the southeastern United States, Atmos. Chem. Phys., 18, 12613–12637, https://doi.org/10.5194/acp-18-12613-2018, 2018.
Yarwood, G., Whitten, G. Z., Jung, J., Heo, G., and Allen, D. T.: Development, evaluation and testing of version 6 of the carbon Bond chemical mechanism (CB6), Final report to the Texas Commission on Environmental Quality, Work Order No. 582-7-84005-FY10-26, 2010.
Yarwood, G., Shi, Y., and Beardsley, R.: Impact of CB6r5 Mechanism Changes on Air Pollutant Modeling in Texas, Texas Commission on Environmental Quality, Austin, Texas, USA 2020.
Zhang, H., Yee, L. D., Lee, B. H., Curtis, M. P., Worton, D. R., Isaacman-VanWertz, G., Offenberg, J. H., Lewandowski, M., Kleindienst, T. E., Beaver, M. R., Holder, A. L., Lonneman, W. A., Docherty, K. S., Jaoui, M., Pye, H. O. T., Hu, W., Day, D. A., Campuzano-Jost, P., Jimenez, J. L., Guo, H., Weber, R. J., de Gouw, J., Koss, A. R., Edgerton, E. S., Brune, W., Mohr, C., Lopez-Hilfiker, F. D., Lutz, A., Kreisberg, N. M., Spielman, S. R., Hering, S. V., Wilson, K. R., Thornton, J. A., and Goldstein, A. H.: Monoterpenes are the largest source of summertime organic aerosol in the southeastern United States, P. Natl. Acad. Sci., 115, 2038–2043, https://doi.org/10.1073/pnas.1717513115, 2018a.
Zhang, W., Capps, S. L., Hu, Y., Nenes, A., Napelenok, S. L., and Russell, A. G.: Development of the high-order decoupled direct method in three dimensions for particulate matter: enabling advanced sensitivity analysis in air quality models, Geosci. Model Dev., 5, 355–368, https://doi.org/10.5194/gmd-5-355-2012, 2012.
Zhang, Y., Chen, Y., Lambe, A. T., Olson, N. E., Lei, Z., Craig, R. L., Zhang, Z., Gold, A., Onasch, T. B., Jayne, J. T., Worsnop, D. R., Gaston, C. J., Thornton, J. A., Vizuete, W., Ault, A. P., and Surratt, J. D.: Effect of the Aerosol-Phase State on Secondary Organic Aerosol Formation from the Reactive Uptake of Isoprene-Derived Epoxydiols (IEPOX), Environ. Sci. Tech. Let., 5, 167–174, https://doi.org/10.1021/acs.estlett.8b00044, 2018b.
Zhou, L., Lin, S.-J., Chen, J.-H., Harris, L. M., Chen, X., and Rees, S. L.: Toward Convective-Scale Prediction within the Next Generation Global Prediction System, B. Am. Meteorol. Soc., 100, 1225–1243, https://doi.org/10.1175/BAMS-D-17-0246.1, 2019.
Zhu, J. and Liang, X.-Z.: Impacts of the Bermuda High on Regional Climate and Ozone over the United States, J. Climate, 26, 1018–1032, https://doi.org/10.1175/JCLI-D-12-00168.1, 2013.
Zhu, J., Wang, W., Liu, Y., Kumar, A., and DeWitt, D.: Advances in Seasonal Predictions of Arctic Sea Ice With NOAA UFS, Geophys. Res. Lett., 50, e2022GL102392, https://doi.org/10.1029/2022GL102392, 2023.
- Abstract
- Introduction
- Methods: updates to the AQM
- Simulation design and evaluation protocol
- Results: assessment and evaluation of updates
- Conclusion and discussion
- Code and data availability
- Author contributions
- Competing interests
- Disclaimer
- Acknowledgements
- Financial support
- Review statement
- References
- Supplement


