the Creative Commons Attribution 4.0 License.
the Creative Commons Attribution 4.0 License.
 | 06 Mar 2025
Modeling commercial-scale CO2 storage in the gas hydrate stability zone with PFLOTRAN v6.0
Jonah Bartrand
Fawz Naim
Glenn Hammond
Safe and secure carbon dioxide (CO2) storage is likely to be critical for mitigating some of the most dangerous effects of climate change. In the last decade, there has been a significant increase in activity associated with reservoir characterization and site selection for large-scale CO2 storage projects across the globe. These prospective storage sites tend to be selected for their optimal structural, petrophysical, and geochemical trapping potential. However, it has also been suggested that storing CO2 in reservoirs within the CO2 hydrate stability zone (GHSZ), characterized by high pressures and low temperatures (e.g., Arctic or marine environments), could provide a natural thermodynamic barrier to gas leakage. Evaluating the prospect of commercial-scale, long-term storage of CO2 in the GHSZ requires reservoir-scale modeling capabilities designed to account for the unique physics and thermodynamics associated with these systems. We have developed the HYDRATE flow mode and the accompanying fully implicit parallel well model in the massively parallel subsurface flow and reactive transport simulator PFLOTRAN to model CO2 injection into the marine GHSZ. We have applied these capabilities to a set of CO2 injection scenarios designed to reveal the challenges and opportunities for commercial-scale CO2 storage in the GHSZ.
- Article
(2080 KB) - Full-text XML
- BibTeX
- EndNote


Large-scale deployment of carbon capture and storage (CCS) projects is likely to be critical for constraining future global temperature increase due to climate change, yet major uncertainties exist regarding potential injectivity of CO2 in subsurface reservoirs (Lane et al., 2021). Evaluating CO2 storage sites for long-term sequestration requires synthesization of sophisticated laboratory, field, and modeling tools to assess the CO2 trapping potential of a prospective subsurface reservoir during a large-scale injection over a significant post-injection performance period. CO2 trapping in sequestration applications potentially involves both physical and chemical trapping mechanisms, which include structural, solubility, capillary, and mineralization trapping (Al Hameli et al., 2022). Currently, large-scale CCS projects around the globe all store over 400 000 Mt (metric tons) of CO2 annually (Snæbjörnsdóttir et al., 2020); the U.S. Department of Energy's CarbonSAFE initiative aims to develop CO2 storage complexes across the US that would be capable of storing total volumes exceeding 50 MMt (million metric tons) of CO2 each (Sullivan et al., 2020). To achieve this vision, a diverse set of potential reservoir host rocks and environments is being considered. This includes speculation about the feasibility of offshore CO2 sequestration and mineralization, such as in Cascadia Basin basalts offshore from the US Pacific Northwest (Goldberg et al., 2018). Shallow subsea environments are not only isolated from the atmosphere by a large water body, but they can also exist in a unique pressure and temperature regime conducive to forming gas hydrate.
Gas hydrate is a solid-phase, non-stoichiometric mixture of low-molecular-weight gas molecules occupying free spaces in a solid water lattice. Hydrates of several different gases occur abundantly in nature, but since the hydrate phase is only stable at high pressures and low temperatures, it is only found naturally on Earth in the pore space of soils in either permafrost or subsea environments. CH4 hydrate is of interest for its potential as a natural gas energy resource (Collett, 2000; Oyama and Masutani, 2017; Singh et al., 2022), for its potential role in global carbon cycling as the climate changes (Ruppel and Kessler, 2017), and for its role as a geohazard (Zander et al., 2018; Kaminski et al., 2020). On the other hand, CO2 hydrate, which can form at similar pressures and temperatures to CH4 hydrate, is increasingly being explored as a potential means of permanently sequestering CO2 as a climate change mitigation solution that comes with additional safety factors beyond those typically encountered in more conventional CO2 sequestration scenarios. These include the fact that CO2 hydrate is immobile in the sediment pore space, which adds a thermodynamic barrier to gas escape and the ability of the ocean to dissolve leaked CO2 in marine environments, which prevents CO2 release into the atmosphere (Tohidi et al., 2010). An added benefit of CO2 injection into the CH4 hydrate stability zone is that CO2 hydrate can be more thermodynamically favorable than CH4 hydrate, meaning it could theoretically be possible to use CO2 to replace CH4 in the hydrate phase, thus sequestering CO2 while producing natural gas from a CH4 hydrate deposit (Koh et al., 2016).
CO2 sequestration in gas hydrate form can only occur in a finite bounded temperature and pressure range. In terms of a soil column, there exists a depth-bounded gas hydrate stability zone (GHSZ) in the subsurface in which CO2 hydrate can form. In a marine environment, the CO2 GHSZ typically begins several meters above the seafloor, but hydrate does not form freely in the water column (except, e.g., as a gas bubble crust; Fu et al., 2021) because the guest molecule gas (e.g., CO2) typically cannot become concentrated enough in the water to do so. Therefore, the seafloor is typically the shallowest extent of hydrate formation in marine systems. Working downward through the GHSZ, pressure increases roughly hydrostatically and temperature increases along a geothermal gradient. Increases in pressure stabilize hydrate, while increases in temperature destabilize hydrate. The geothermal temperature change effect on hydrate stability outweighs the hydrostatic pressure change effect, so there exists a depth below the seafloor where the temperature is too high to form hydrate, which is known as the base of the gas hydrate stability zone (BHSZ). Overall, the specific thickness of the bulk GHSZ is dependent on pressure, temperature, porewater salinity, and gas composition (Sloan and Koh, 2007).
For a potential host reservoir within the CO2 GHSZ, evaluating the long-term CO2 storage potential of the reservoir would require consideration of the thermodynamic trapping mechanism of solid gas hydrate formation in addition to traditional trapping mechanisms. Several experimental studies have demonstrated the process of CO2 trapping and hydrate conversion in the CO2 GHSZ at the laboratory scale, showing how conversion of CO2 into a solid phase adds an additional safety factor (Gauteplass et al., 2020; Rehman et al., 2021). An experimental study of layered sediments using different injection strategies demonstrated the need to consider thermal management when designing CO2 injection into the GHSZ and suggested that multilateral perforated horizontal wells may achieve the most optimal CO2 conversion efficiency (Pang et al., 2024). However, reservoir-scale modeling studies of the transport and thermodynamic phenomena associated with injection of CO2 in commercial volumes into the GHSZ are lacking.
We present several new capabilities developed in the open-source, massively parallel, multiphase flow, and reactive transport simulator PFLOTRAN (Hammond et al., 2014) to model reservoir-scale injection of CO2 in the CO2 GHSZ. We have extended PFLOTRAN's HYDRATE mode capabilities to model free-phase CO2 flow properties and CO2 hydrate-phase behavior. Additionally, we introduce a fully coupled parallel well model that can be used to model CO2 injection into heterogeneous media and that can adapt to changes in flow properties associated with hydrate formation in the vicinity of the wellbore. Finally, we add a new fully coupled salt mass balance to consider salinity and salt precipitation effects in the GHSZ. We demonstrate these capabilities on a series of test problems designed to elucidate the challenges and opportunities associated with commercial-scale injection of CO2 into the GHSZ.
PFLOTRAN's HYDRATE mode was originally developed to model CH4 generation, transport, and structure-1 (SI) gas hydrate formation in deep marine and Arctic terrestrial reservoirs. PFLOTRAN's HYDRATE mode has been benchmarked against other reservoir simulators to model CH4 gas production from hydrate reservoirs (White et al., 2020). It has been used to predict shallow gas generation and gas hydrate formation offshore from the eastern US (Eymold et al., 2021), to study relationships between gas generation and slope stability along the US Atlantic margin (Carty and Daigle, 2022), and to model gas hydrate accumulation offshore from Norway (Frederick et al., 2021). An extension of HYDRATE mode to include salinity coupling was developed to investigate viscous fingering and convective mixing in layered marine sediments during CH4 hydrate formation over geological time (Fukuyama et al., 2023). Here, we have redeveloped PFLOTRAN's HYDRATE mode to optionally consider CO2 as the working gas, to couple fully implicitly with a new parallel well model, to include a new fully coupled salt mass balance, and to consider variable salinity effects on H2O–CO2–NaCl mixtures and the CO2 hydrate-phase boundary.
2.1 Governing equations
A system of three mass balance equations, one energy balance equation, and one well equation is now solved fully implicitly in PFLOTRAN's HYDRATE mode. The mass conservation equations take the following form:
where phase α can be liquid (l), gas (g), hydrate (h), ice (i), or salt precipitate (s); component j includes water, gas (CO2, CH4, or air), and salt (NaCl); sα is the saturation of phase α; ρα is the density of phase α; is the mole fraction of component j in phase α; ql is the liquid Darcy flux vector; qg is the gas Darcy flux vector; Dl is the liquid-phase diffusivity; Dg is the gas-phase diffusivity; φ is the porosity; Qj includes any non-well sources and sinks of component j; and Qw,j is a source or sink of component j from a well. Solid phases are considered immobile and include the hydrate, ice, and salt precipitate phases. Mole fractions of components in the solid phases are fixed: by the hydration number in the hydrate phase, as pure water in the ice phase, and as pure salt in the salt precipitate phase. Formation of gas hydrate and ice therefore results in salt exclusion and aqueous dissolved salinity enhancement, which affects the hydrate-phase boundary and gas solubility in the brine.
The energy conservation equation takes the form
where Uα is the internal energy of phase α, Hα is the enthalpy of phase α, ρr is the rock density, Cp is the heat capacity of the rock, κ is the composite thermal conductivity of the medium, T is the temperature, Qe includes any non-well heat sources or sinks, and Qw,e is a heat source or sink imposed by the well (e.g., a heater in addition to a fluid injection). Exothermic hydrate formation (and vice versa, i.e., endothermic hydrate dissociation) is captured here by a decrease in the internal energy of the hydrate phase during formation; this typically results in either an increase in system temperature or a change in phase saturations in three-phase systems. As we will show later, this phenomenon is important during CO2 injection in the short term, and it can continue to buffer conversion between phases for hundreds of years; similar effects have been shown for natural CH4 hydrate systems where the base of the gas hydrate stability zone is shifted due to climactic changes (Oluwunmi et al., 2022).
2.2 Well model
A fully implicit, parallel well model has also been incorporated into HYDRATE mode. A well model can more accurately represent the insertion of a (comparably) small cylindrical wellbore into a reservoir grid cell than a standard source or sink term. Given a prescribed surface injection rate of CO2 into the well, the well model solves for pressure variation along a wellbore and dynamically adjusts flow rates into the reservoir in response to changes in reservoir physical properties like permeability. This phenomenon can be critical to capture in a horizontal well or injection into a heterogeneous reservoir in the gas hydrate stability zone, where near-wellbore formation (or dissociation) of gas hydrate can significantly alter reservoir permeability and thus injection behavior. The well model developed for HYDRATE mode is a hydrostatic well model based on the design of White et al. (2013) but with key modifications, including full parallelization to run flexibly on very large, unstructured grids and the addition of a thermal component; as we show here, injection temperature could be one of the most important design considerations for CO2 storage in the gas hydrate stability zone. The well model developed here accounts for the enthalpy of the injected CO2 at the prescribed temperature and wellbore pressure using the same equation of state (EOS) as the reservoir.
Solving a hydrostatic well model involves solving one extra conservation equation per well in addition to the reservoir mass and energy conservation equations. PFLOTRAN uses a fully implicit Newton–Raphson nonlinear solution search method: for each distinct well, only one extra row and one extra column are added to the Jacobian. For each reservoir cell intersected by a well, well pressure is computed at the centroid of the well section crossing through the reservoir. All well pressures are determined from the bottom-hole pressure, a primary variable (see Sect. 2.4). The well model conservation equation is compact and reads as follows:
where i is the discrete reservoir cell index through which the wellbore passes, are the reservoir source and sink terms of phase j associated with a well in reservoir grid cell i, and qw,j is the prescribed surface injection rate of phase j.
The well flux at each reservoir grid cell is computed as a function of the pressure difference between the well and the reservoir cell (free-phase CO2 pressure for gas injection) scaled by the well index as follows:
where Pw is the well node pressure, Pr is the reservoir pressure of phase j in the grid cell associated with a given well node, and Δzw-r is the vertical distance between the well node center and the reservoir cell center. The well can be oriented in any direction in 3D. To account for permeability anisotropy and arbitrary well orientations, the well index, WI, is calculated using a 3D extension of the Peaceman equation (White et al., 2013):
where s is the well skin, rw is the wellbore radius, WIα are well indices, kα are the absolute permeabilities of the medium, Lα are the projections of each well leg, and r0,α are the Peaceman radii in each principal direction .
The bottom-hole pressure of the well is solved as a primary variable as part of a fully coupled system of equations (Sect. 2.4). Pressures of each well segment are then directly calculated as functions of the bottom-hole pressure by a hydrostatic adjustment to the depth of each well segment center, where the density of the gas phase is updated as a function of pressure and injection temperature.
2.3 Constitutive relationships
Diffusive flux is modeled using Fick's law with diffusivities computed as functions of temperature and salinity for CO2 (Cadogan et al., 2014) and NaCl (Poling et al., 2001). Advective fluxes of mobile phases are computed by employing a two-phase Darcy equation:
where k is the intrinsic permeability of the medium, is the relative permeability of phase α, μα is the viscosity of phase α, Pα is the pressure of phase α, g is the gravity vector, and z is the depth. Relative permeability is computed as a function of phase saturations according to one of a suite of standard relative permeability relationships available in PFLOTRAN. Phase densities and viscosities are computed as functions of temperature, pressure, and salinity according to several options in PFLOTRAN (e.g., the Span–Wagner equation of state for CO2 or the IF97 equation of state for water). Salt (NaCl) mass can be distributed in either the aqueous or solid salt precipitate phases, and aqueous dissolved salt mass affects brine flow properties like density (Haas, 1976), viscosity (Phillips et al., 1981), enthalpy, and diffusivity (Cadogan et al., 2014; Belgodere et al., 2015).
Gas-phase pressure and liquid-phase pressure are related as a function of gas-phase saturation through a choice of capillary pressure functions available in PFLOTRAN. When the gas hydrate phase is present, a capillary pressure associated with the hydrate phase is computed using the same capillary pressure function as for the gas phase. This capillary pressure is used in the Gibbs–Thomson equation vis-à-vis the Young–Laplace equation to determine the hydrate three-phase equilibrium temperature depression required to precipitate hydrate in pores as follows:
where ΔTm is the change in the hydrate melting temperature, Pc is the hydrate-phase capillary pressure, Tmb is the bulk melting temperature, ΔHm is the specific enthalpy of the phase transition, and ρh is the density of solid hydrate. A similar method is often used to compute ice freezing temperature depression vis-à-vis the Clausius–Clapeyron equation. This effect is typically only significant in fine-grained sediments and/or at very high effective hydrate-phase saturations (Anderson et al., 2003).
When both gas hydrate and free gas occupy significant fractions of the pore space, as would be likely during CO2 injection, their combined presence in the pore system should be accounted for through an effective saturation that is passed to the capillary pressure function. At three-phase (aqueous, free gas or CO2, and gas hydrate) equilibrium, the chemical potential of CO2 in the gas hydrate phase at a given hydrate capillary pressure must equal that of CO2 in the free gas phase at a different free gas capillary pressure and dissolved CO2. At bulk thermodynamic equilibrium, free gas and gas hydrate are stable together at a single pressure and temperature. In porous media, capillary effects on both the hydrate phase and gas phase lead to a window of possible pressures and temperatures over which three-phase equilibrium can be maintained (Clennell et al., 1999). To incorporate this effect and maintain thermodynamic reversibility, we adopt the approach of Liu and Flemings (2011) and require free gas and gas hydrate to partition the large pore space equally when both are present (Nole et al., 2018). This partitioning scheme results in the following effective saturations of free gas and gas hydrate:
where sα,eff is the effective saturation of the non-wetting phase α and β is the other non-wetting phase in a three-phase system where liquid water is the wetting phase.
The presence of gas hydrate in the pore space of a reservoir decreases the reservoir's permeability below its intrinsic (water-saturated) permeability. We model permeability reduction as a function of hydrate saturation as follows (Dai and Seol, 2014):
where keff is the effective permeability coefficient and is multiplied by the intrinsic permeability to compute the effective absolute permeability.
Heat transfer occurs through mobile fluid-phase flow, phase transitions, thermal conduction, and injection or production. Fluid-phase enthalpies are computed using corresponding equations of state. For the CO2 phase, the Span–Wagner equation of state is recommended (Span and Wagner, 1996), and for water the IF97 equation of state with salinity extensions is available in PFLOTRAN. Enthalpies of the solid gas hydrate (Handa, 1988) and salt (Lide and Kehiaian, 2020) phases are computed as functions of temperature. Several options for composite thermal conductivity can be used; the default thermal conductivity function is a linear scaling function of phase saturations:
where κdry is the dry rock thermal conductivity and κα is the thermal conductivity of phase α.
The presence of salt has several impacts on system behavior. Solid salt precipitation can occur due to near-wellbore dry-out (water evaporating into the free CO2 phase) during the injection period or due to rapid hydrate formation, whereby water and CO2 forming a hydrate exclude salt and thus increase dissolved salt concentrations. Salt precipitation reduces permeability, which affects CO2 injectivity, gas flow, and liquid imbibition. This occurs either at the injection site if enough CO2 is injected to dry out the water or far into the future when free-phase CO2 has undergone conversion into very high hydrate saturations (though at this point permeability reduction due to salt precipitation is dwarfed by the presence of solid hydrate at high saturations). Aqueous dissolved salt concentration affects the density of the aqueous phase; the presence of gradients in salt concentrations drives convective mixing. Salt exclusion during hydrate formation locally increases salt concentrations, which can produce this phenomenon (Fukuyama et al., 2023). Dissolved salt also affects gas solubility and shifts the three-phase equilibrium pressure of gas hydrate.
CO2 equilibrium phase partitioning is computed using the method of Spycher and Pruess (2010): the CO2 hydrate–free-phase CO2–water three-phase equilibrium curve is determined from a polynomial fit of data by Men et al. (2022) up to 283.2 K and then a linear function at higher temperatures (Fig. 1). This three-phase equilibrium boundary is consistent with the CO2 hydrate-phase boundary used in STOMP-HYD up to 100 MPa (McGrail et al., 2007) and is similar to the phase boundary proposed by Garapati et al. (2011), with the exception that here the phase boundary is monotonically increasing.

Figure 1Three-phase equilibrium pressure of CO2 hydrate. At temperatures below 283.2 K, a curve fit of experimental data is used. Above 283.2 K, a line is used that is consistent with STOMP-HYD. The CH4 hydrate-phase boundary is plotted for reference (Moridis, 2003).
2.4 Phase states and primary variables
PFLOTRAN's HYDRATE mode solves mass conservation, energy conservation, and well flux conservation equations for a set of three components (CH4/CO2/air, H2O, and NaCl) over five phases (aqueous, gas-component-rich/gas, gas hydrate, ice, salt precipitate). This results in solving a set of four partial differential equations for all cells in the domain plus one coupled well equation per cell containing the bottom segment of a well. Therefore, PFLOTRAN's fully implicit solution solves for four primary variables everywhere plus one extra primary variable per well in the domain.
Table 1Phase states and primary variable combinations in PFLOTRAN's HYDRATE mode.
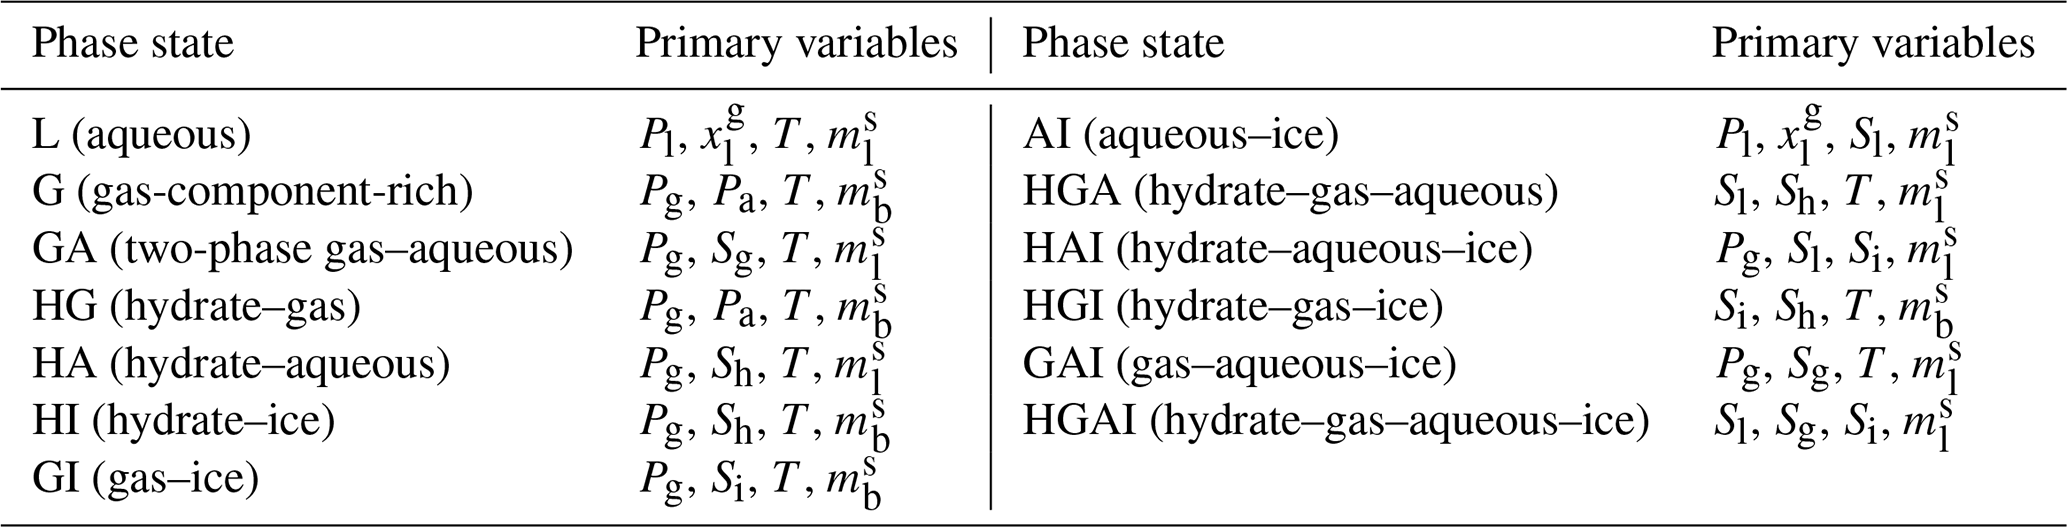
Pl: liquid pressure. Pg: gas pressure. Pa: gas-rich gas (air) component partial pressure. : aqueous dissolved gas mass fraction. T: temperature. : salt mass fraction per unit aqueous mass. : total salt mass per unit bulk volume. Sg: gas saturation. Sh: hydrate saturation. Sl: liquid saturation. Si: ice saturation.
The reservoir (non-well) equations use primary variable switching depending on the thermodynamic state of a grid cell. HYDRATE mode contains 13 phase states with four primary variables per phase state (Table 1). For example, cells in the fully liquid (aqueous) saturated state solve for liquid pressure, dissolved gas mass fraction, temperature, and total salt mass per unit liquid mass as primary variables. Secondary variables like phase densities, viscosities, and enthalpies are computed at equilibrium from the primary variables through use of various equations of state. Precipitated salt saturation is computed by determining whether the bulk salt concentration (total salt mass per mass of the liquid phase) exceeds the dissolved salt solubility and converting the excess salt mass into the solid phase (permeability updates according to Verma and Pruess, 1988). If the dissolved gas mass fraction exceeds the solubility and the aqueous pressure, temperature, and dissolved salt mass fraction lie within the GHSZ, the cell will transition into the hydrate–aqueous state and the primary variables will be updated accordingly. Upon entering the hydrate–aqueous state, PFLOTRAN then switches primary variables and solves for gas pressure, hydrate saturation, temperature, and salt concentration.
For the well equation, the bottom-hole pressure of the well is solved as a primary variable. Given a user-defined well flow rate, each well's bottom-hole pressure is solved fully implicitly as part of the full reservoir flow solution. At a given bottom-hole pressure, the well model solves for all other pressures in the well by working upward and iteratively solving the hydrostatic pressure of the injection fluid where the variable fluid density in the well is updated as a function of pressure and temperature. Once the hydrostatic pressures are determined, mass and energy fluxes between the well and reservoir at the well segment centroids are computed by adding a hydrostatic adjustment to reservoir pressures to align reservoir pressures with well segment centroids and then employing Eq. (4). Fluxes between coupled wells and reservoir cells are therefore functions of the well primary variable (bottom-hole pressure) and reservoir cell primary variables (e.g., gas or liquid pressure).
Using fully implicit coupling and a Newton–Raphson solution search method, insertion of a coupled well into the domain adds additional fill to the Jacobian matrix used to compute solution updates. Critically, the well model adds extra connectivity beyond the typical stencil for two-point flux calculations. Thus, the structure of the Jacobian matrix is altered by introducing wells. This alteration is typically minimal, but it would likely become more computationally demanding as the number of wells in the domain is increased or the number of screened segments per well is increased. The number of wells, the extent to which each well increases the fill of the Jacobian, and the strength of the coupling between the well and reservoir are all likely to affect the overall performance of simulations using the coupled well model. PFLOTRAN uses neighbor cell ghosting to parallelize computations: for a given subset of grid cells in the model domain that are owned by a particular process, e.g., Process “N”, all of the off-process grid cells that border these cells are “ghosted” onto Process N, meaning that copies of state variables for those cells are kept up to date for computing updated flux terms at processor boundaries. Cell ghosting is determined by the numerical stencil and the distribution of cells on processors in parallel. Since adding a well introduces connectivity beyond the original stencil, PFLOTRAN updates the ghosting stencil to include all off-process reservoir cells connected by a given well, allowing for full incorporation of well terms in the Jacobian. When a well is turned off (or well flow rates are set to 0), that well equation is not solved.
We demonstrate our developments by applying the software to a set of two hypothetical CO2 injection scenarios in marine environments within the GHSZ. In the first example, liquid CO2 is injected slowly into a simple 1D homogeneous sediment column through a partially screened well beneath the GHSZ. The second example simulates commercial-scale injection of supercritical CO2 into a 2D radial domain with heterogeneous layering, where a well is screened within and beneath the GHSZ. The CO2 plume in this model is tracked for 10 000 years as it transitions from a supercritical phase to a dense liquid phase and then into the gas hydrate phase.
3.1 One-dimensional liquid CO2 injection into a homogeneous reservoir
In this scenario, a relatively slow injection is designed to illustrate the multiphase and thermodynamic processes associated with injecting CO2 into the GHSZ. A 1D, 1000 m homogeneous domain is initialized to hydrostatic conditions where the top of the domain is held at a seafloor pressure of 10 MPa, a bottom water temperature of 5 °C, and a geothermal gradient of 20 °C km−1. The top Dirichlet boundary condition is set to the initial bottom water temperature, pressure, zero gas mass fraction, and constant salinity (0.035 kg kg−1). The bottom boundary at 1000 m b.s.f. (meters below the seafloor) is a Neumann zero-flux boundary. The domain is discretized into 200 grid cells in the vertical dimension; individual grid cells measure 25 m in the horizontal x dimension by 1 m in the horizontal y dimension by 5 m in the vertical z dimension. A well extends to 500 m b.s.f. and is screened for 25 m from 475 to 500 m b.s.f. Dense liquid-phase CO2 is injected at 20 °C at an injection rate of 15 000 kg yr−1 for 50 years. The pressure of the injection varies along the well, depending on the bottom-hole pressure, but CO2 remains in the liquid phase for the entirety of the injection. Use of the well model will lead to variable CO2 injection rates in each of the screened well segments and correspondingly variable injection enthalpy as a function of well segment pressure; this effect is less noticeable in this homogeneous case than in the heterogeneous case. This simulation is run for 200 years. While it is likely that bottom water temperature would fluctuate over 200 years, bottom water temperature variation is site-specific; PFLOTRAN can apply time-dependent bottom water temperature as a boundary condition, but for this study a constant temperature was used for simplicity. A constant reservoir porosity is set to 0.35, and a constant isotropic permeability is set to . A Van Genuchten capillary pressure function is used, where the Van Genuchten m is set to 0.5, , and Slr=0.05. Corey relative permeability functions are used, where m=0.5, Slr=0.3, and Sgr=0.05.
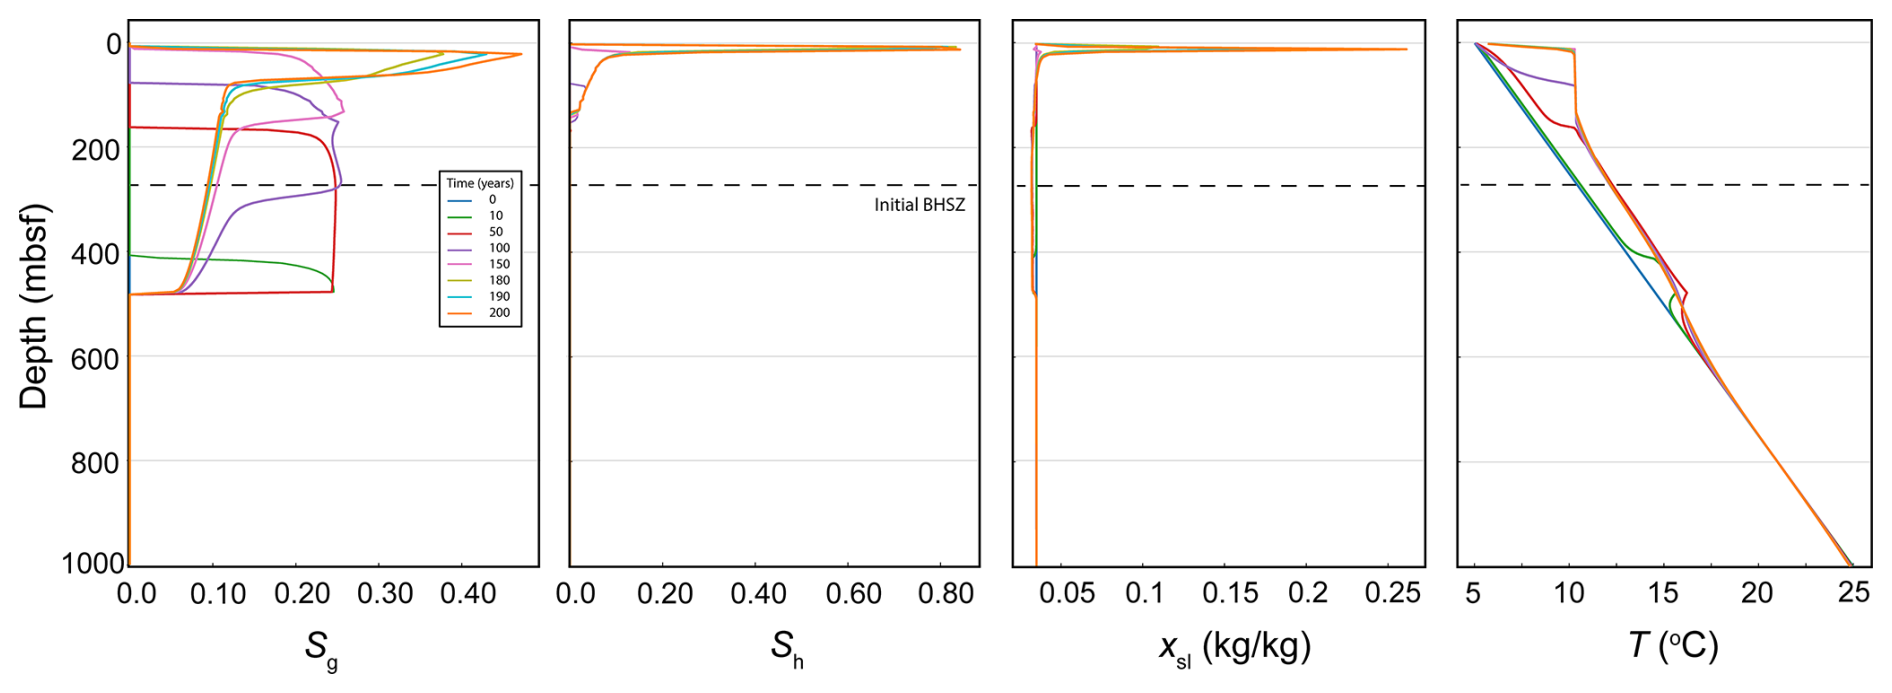
Figure 2Gas saturation (Sg), hydrate saturation (Sh), dissolved salt mass fraction (xsl), and temperature (T) during and after a CO2 injection beneath the GHSZ. The dashed line indicates the initial (pre-injection) BHSZ, though this is perturbed by upward migration of warm gas.
During the 50 years of injection, the injected CO2 remains beneath the base of the CO2 hydrate stability zone (Fig. 2). Therefore, it can only exist as free-phase CO2. CO2 migrates upward in characteristic fashion: buoyancy and pressure forces drive gas (free-phase CO2) saturations exceeding the residual gas saturation to migrate upward in the sediment column. By 100 years, the free-phase CO2 front has reached the base of the GHSZ. At this point, some free-phase CO2 is converted into CO2 hydrate. Exothermic hydrate formation keeps the reservoir temperature at the three-phase equilibrium temperature, while free-phase CO2 and hydrate coexist. As the gas plume migrates upward over time, more gas is converted into gas hydrate. While the gas supply is strong and hydrate is still forming, the temperature of the reservoir is pushed well above the background (initial) geothermal temperature. The CO2 hydrate three-phase equilibrium temperature is approximately 10 °C at this depth, which is why the temperature throughout the three-phase zone remains at roughly 10 °C.
After the injection period ends, hydrate accumulates in high saturations near the top of the domain due to the bottom water temperature and pressure being fixed; the resulting permeability reduction causes gas to pool and salt to concentrate where hydrate is forming, leading to salt precipitation. This kind of scenario is unlikely to occur in a more realistic 2D or 3D reservoir, where permeability reduction would cause gas to migrate laterally and therefore not cause such significant pooling effects. However, this model illustrates how exothermic hydrate formation can lead to a thick (albeit transient) three-phase stability zone throughout which free-phase CO2 can remain mobile. Therefore, the fact that CO2 hydrate is stable in the upper 100 m of sediments at a particular hydrostatic pressure and geothermal temperature is an insufficient condition for ensuring CO2 trapping by hydrate formation. Permeability reduction associated with gas hydrate formation can act to slow free-phase CO2 migration, but, at least at an early time, a combination of thermodynamic and other structural trapping mechanisms is likely necessary to ensure the long-term sequestration of most of the injected CO2 in the subsurface GHSZ.
3.2 Supercritical CO2 injection into a 2D heterogeneous reservoir
In this scenario, a commercial-scale CO2 injection is modeled under more realistic reservoir and injection conditions (Fig. 3). A 2D, heterogeneous cylindrical domain extends from the seafloor down to 600 m b.s.f. with a radius of 3.765 km. The model domain consists of 40 grid cells in the horizontal dimension that increase in thickness from 7.38 m at the model center to 364.36 m at the far edge. The model contains 55 cells in the vertical dimension with varying thicknesses, each corresponding to a different layer in the model. The model consists of interbedded sand and mud units as might be found within the marine GHSZ. High- and low-permeability layers alternate with synthetic heterogeneity; similarly, the model contains heterogeneous porosity and capillary entry pressure. All other physical properties are kept constant between layers. A Brooks–Corey capillary pressure function along with Burdine relative permeability functions for the liquid and gas phases are used for all the layers. For all the layers, Brooks–Corey λ=0.8311 and . The capillary entry pressure (the inverse of which is expressed by the Brooks–Corey α parameter) varies between the reservoir layers (Fig. 4). Rock density is set to 2650 kg m−3, dry rock thermal conductivity is set to 2.0 W m−1 C−1, and soil compressibility is modeled with a linear compressibility function using a soil compressibility of and a reference pressure of 10 MPa. Seafloor pressure is set to 10 MPa, bottom water temperature is 5 °C, and seafloor salinity is 0.035 kg kg−1. The model is initialized at hydrostatic pressure, constant salinity, and a geothermal gradient of 20 °C km−1. The top and outer edges of the domain are kept under the initial conditions. The bottom boundary condition is set to no liquid or gas flux, constant salinity, and a constant heat flux to preserve the geothermal gradient.
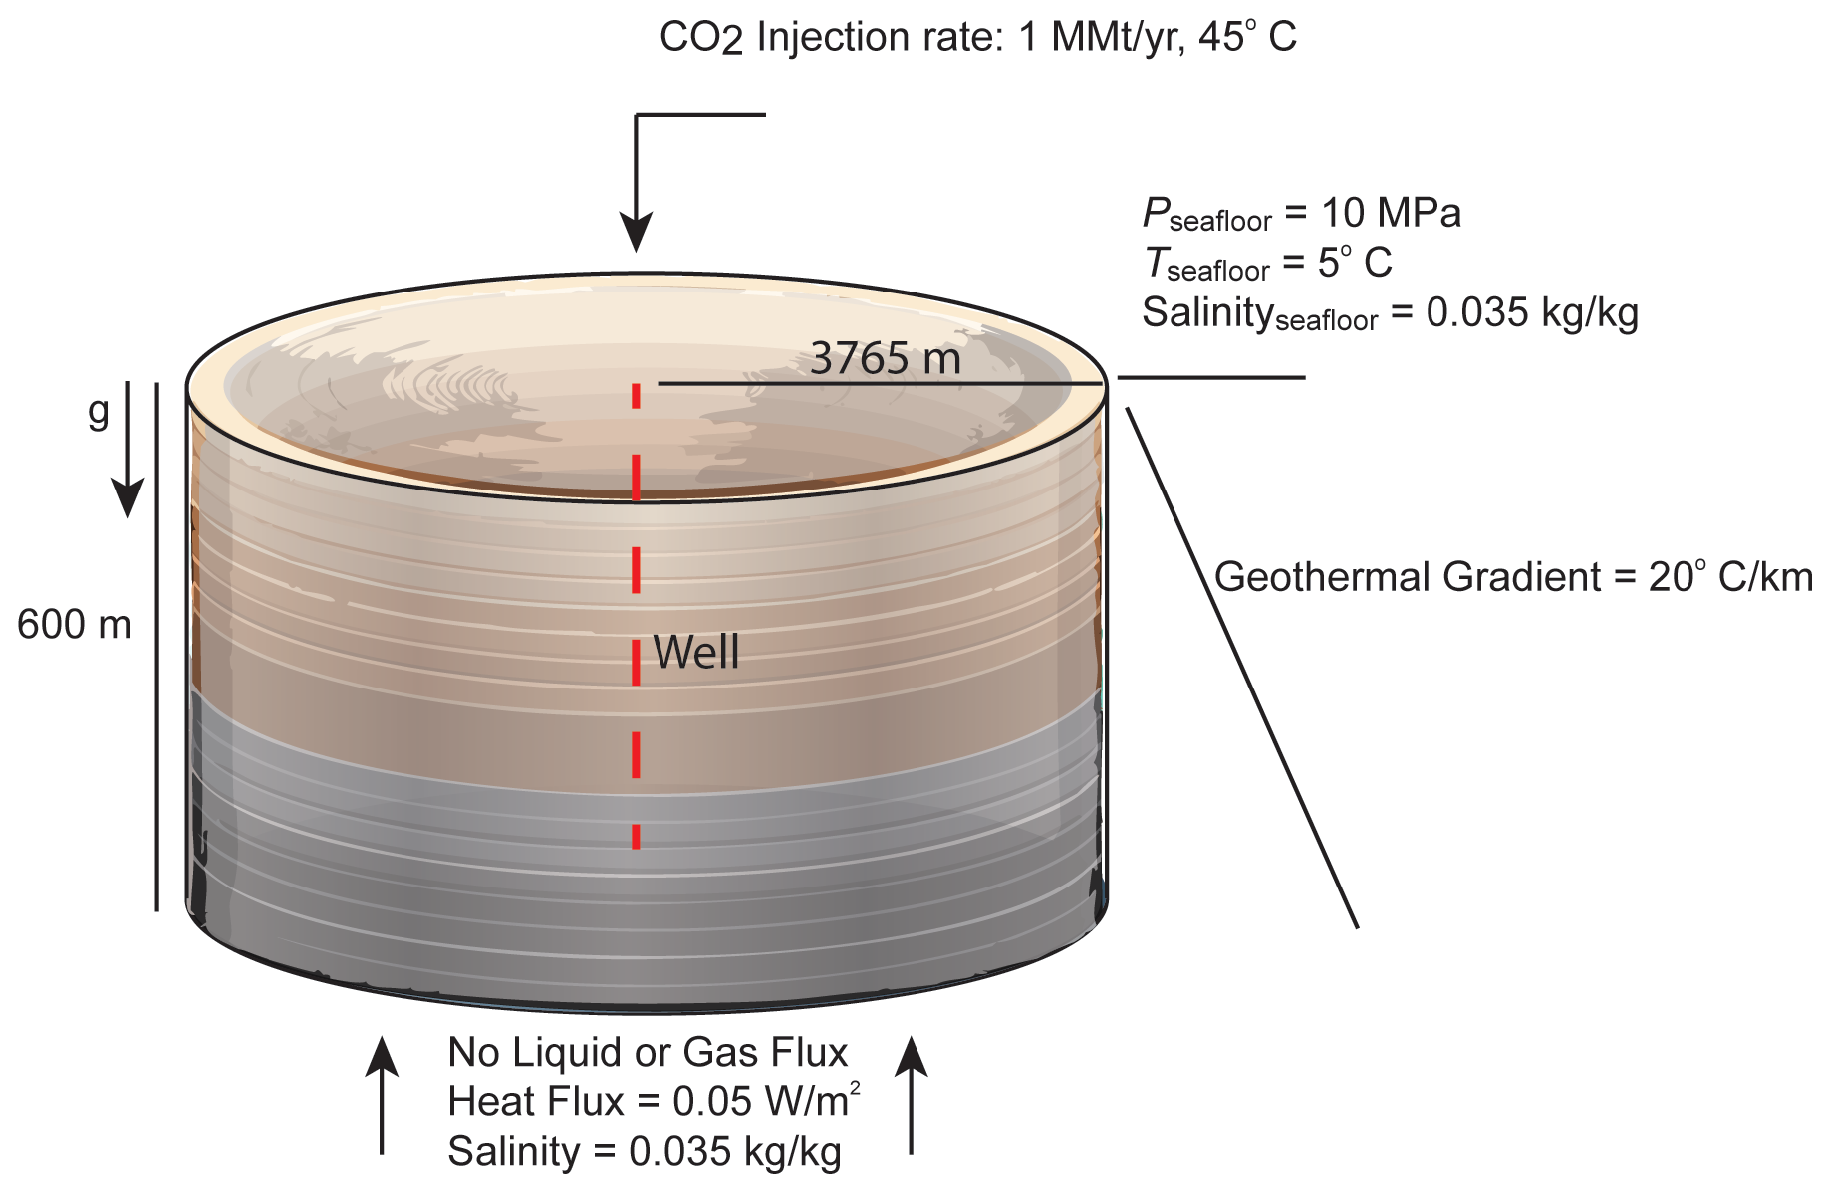
Figure 3Illustration of a heterogeneous layered 2D cylindrical model, with specific model parameters labeled.
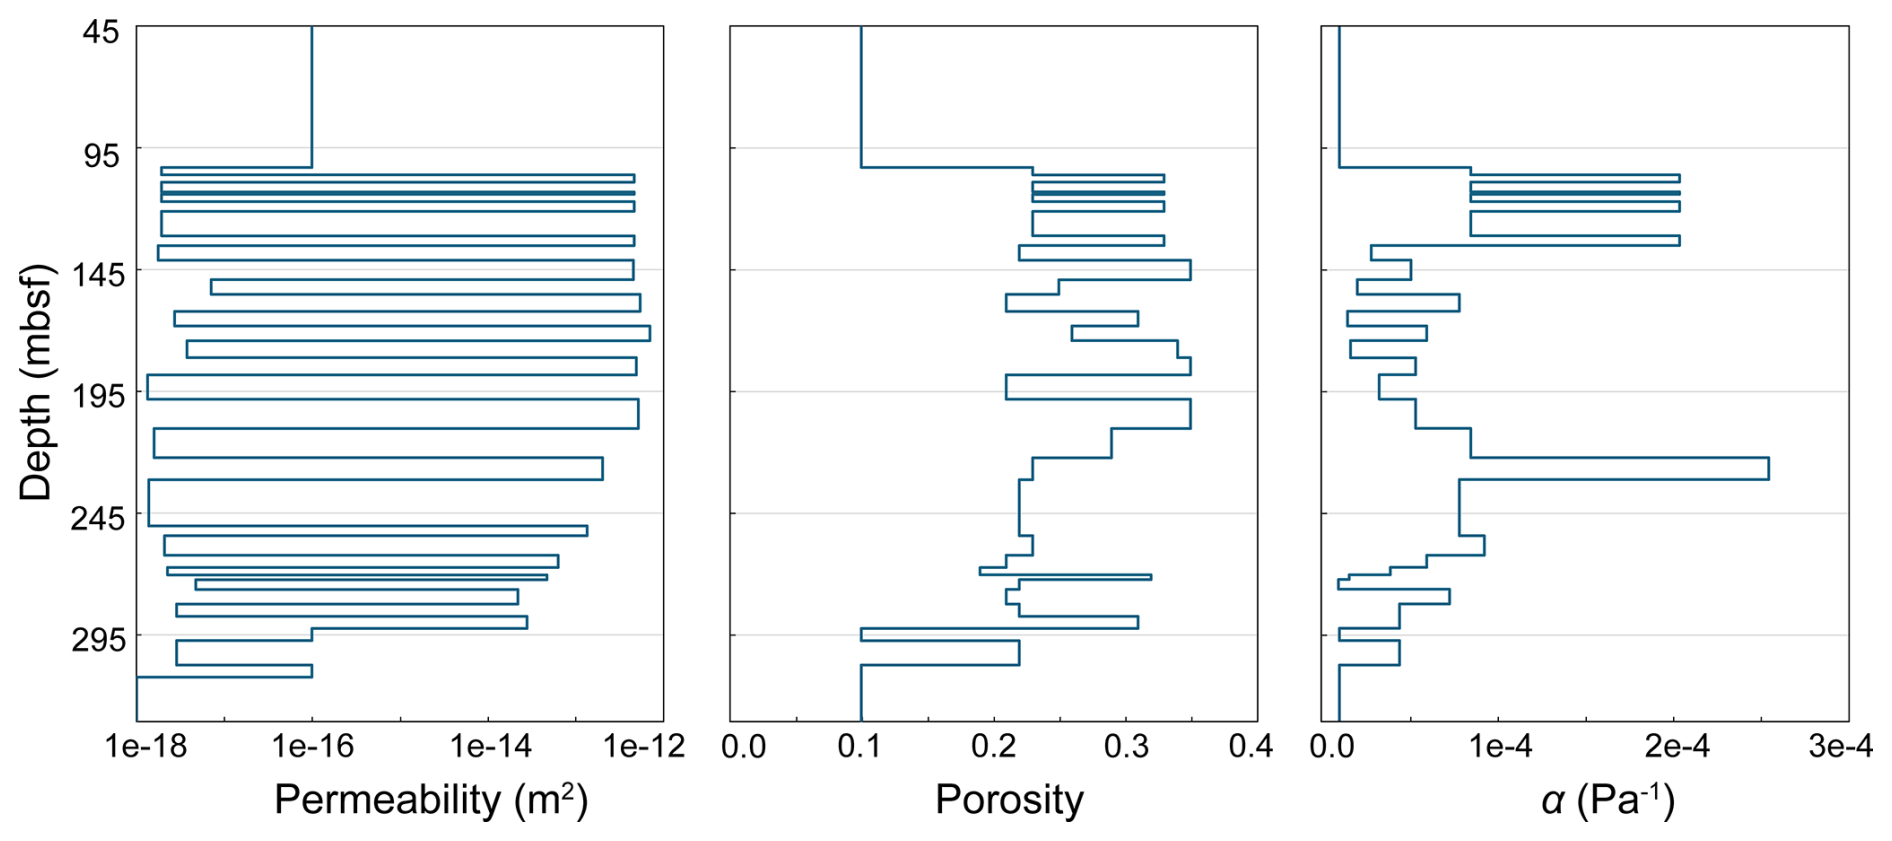
Figure 4Depth-varying physical properties (permeability, porosity, and inverse capillary entry pressure α) of the heterogeneous 2D injection scenario near the injection interval. Physical properties were kept constant above and below these snapshots.
The well used in this scenario extends from the seafloor to 300 m b.s.f. and is cased for the first 100 m. The rest of the well is screened; flow from well to reservoir is possible only in the screened interval. Given the conditions outlined above, the initial BHSZ for CO2 hydrate is at approximately 250 m b.s.f. Therefore, the well in this scenario extends through the GHSZ and 50 m below the initial BHSZ. Care was taken to ensure that the well pressures required to achieve the specified CO2 injection rate were realistic; the 100 m depth of the well casing was chosen so that the well pressures resulting from our prescribed injection rate did not exceed the lithostatic pressure. This calculation is approximate and does not consider the fracture gradient; the fact that well pressures can easily approach the lithostatic pressure in these settings means that reservoir integrity should be rigorously evaluated when performing site-specific evaluations of CO2 injectivity in the shallow subsurface.
The model is run for 10 000 years; CO2 is injected continuously at a rate of 1 MMt per year for 50 years to meet a storage target of 50 MMt of CO2. The CO2 is injected at a constant temperature of 45 °C; the injection pressure will vary along the wellbore, depending on the hydrostatic pressure of the well, and this in turn will affect the enthalpy of the injected gas. After 50 years, the well is shut off; over time, warm supercritical CO2 will cool into a dense liquid CO2 phase and then eventually a gas hydrate phase.
During the 50-year injection interval, gas flows predominantly into the high-permeability reservoir intervals (Figs. 5 and 6). This is because the well model adjusts how the mass of injected CO2 is distributed to each interval in the injection region (Fig. 7) given the total gas injection rate, hydrostatic well pressure, reservoir pressure, and well index, where well index is a function of reservoir permeability. Since early hydrate formation in the reservoir units elicits a permeability and pressure response, the well flow rate into individual units evolves over time during the injection. In some units, the well flow rate drops, and these drops are then compensated for by increases in flow rates in other units. Likewise, the pressure in the well evolves over time in response to the hydrate formation and relative permeability of the mobile fluids.
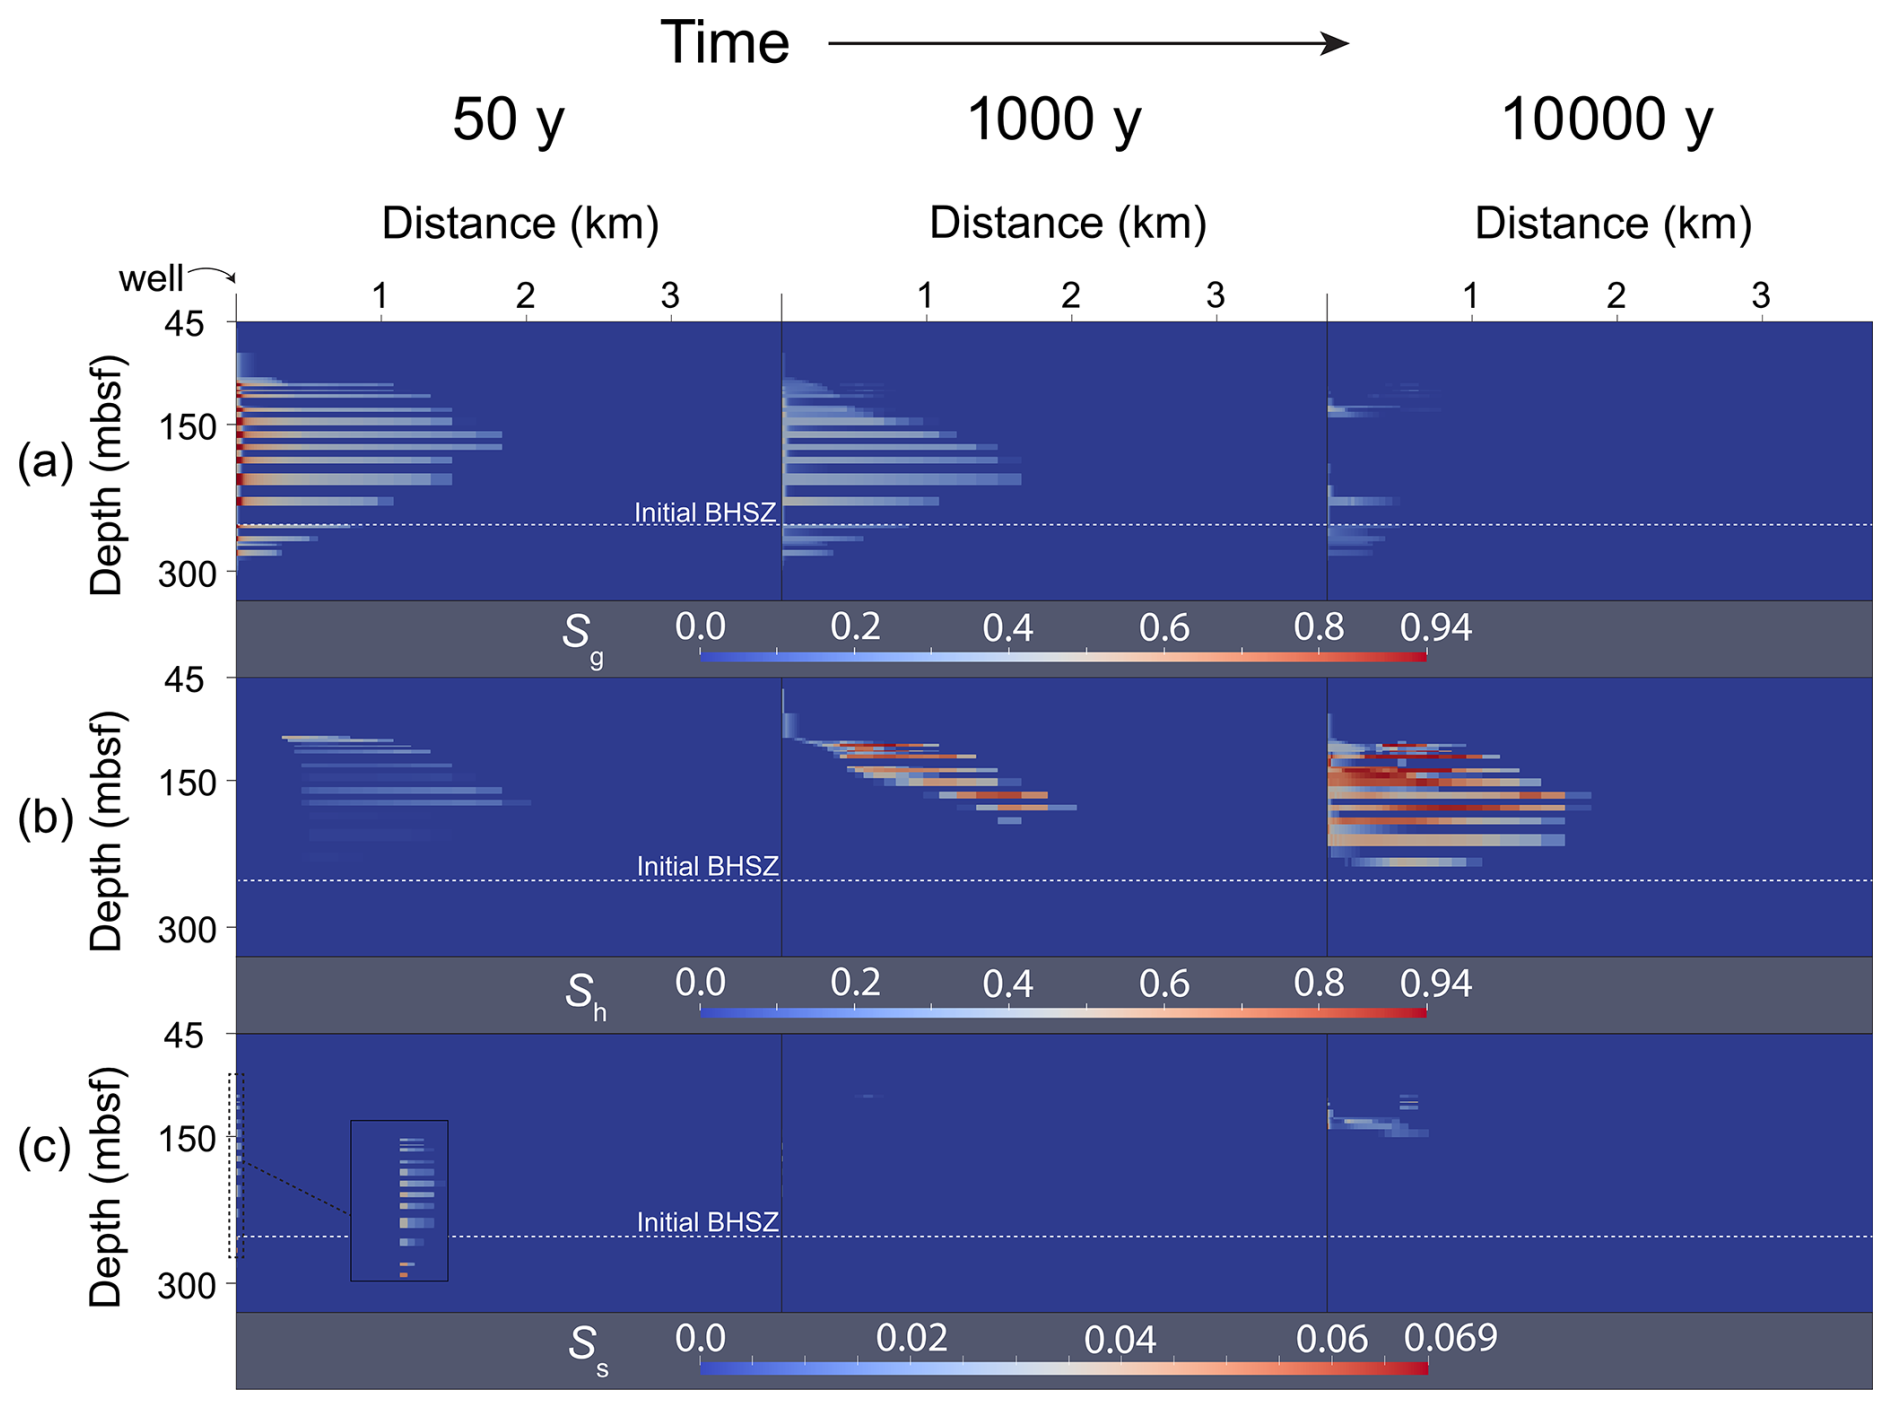
Figure 5Snapshots of saturations over time in the vicinity of the wellbore. Depth is represented by the vertical axis, and radial distance from the well is represented by the horizontal axis. (a) Gas (free-phase CO2) saturation (Sg), (b) hydrate saturation (Sh), and (c) salt precipitate saturation (Ss) distributions at 50, 1000, and 10 000 years of simulation time. A zoomed-in cutout shows near-wellbore salt precipitate saturations at 50 years.
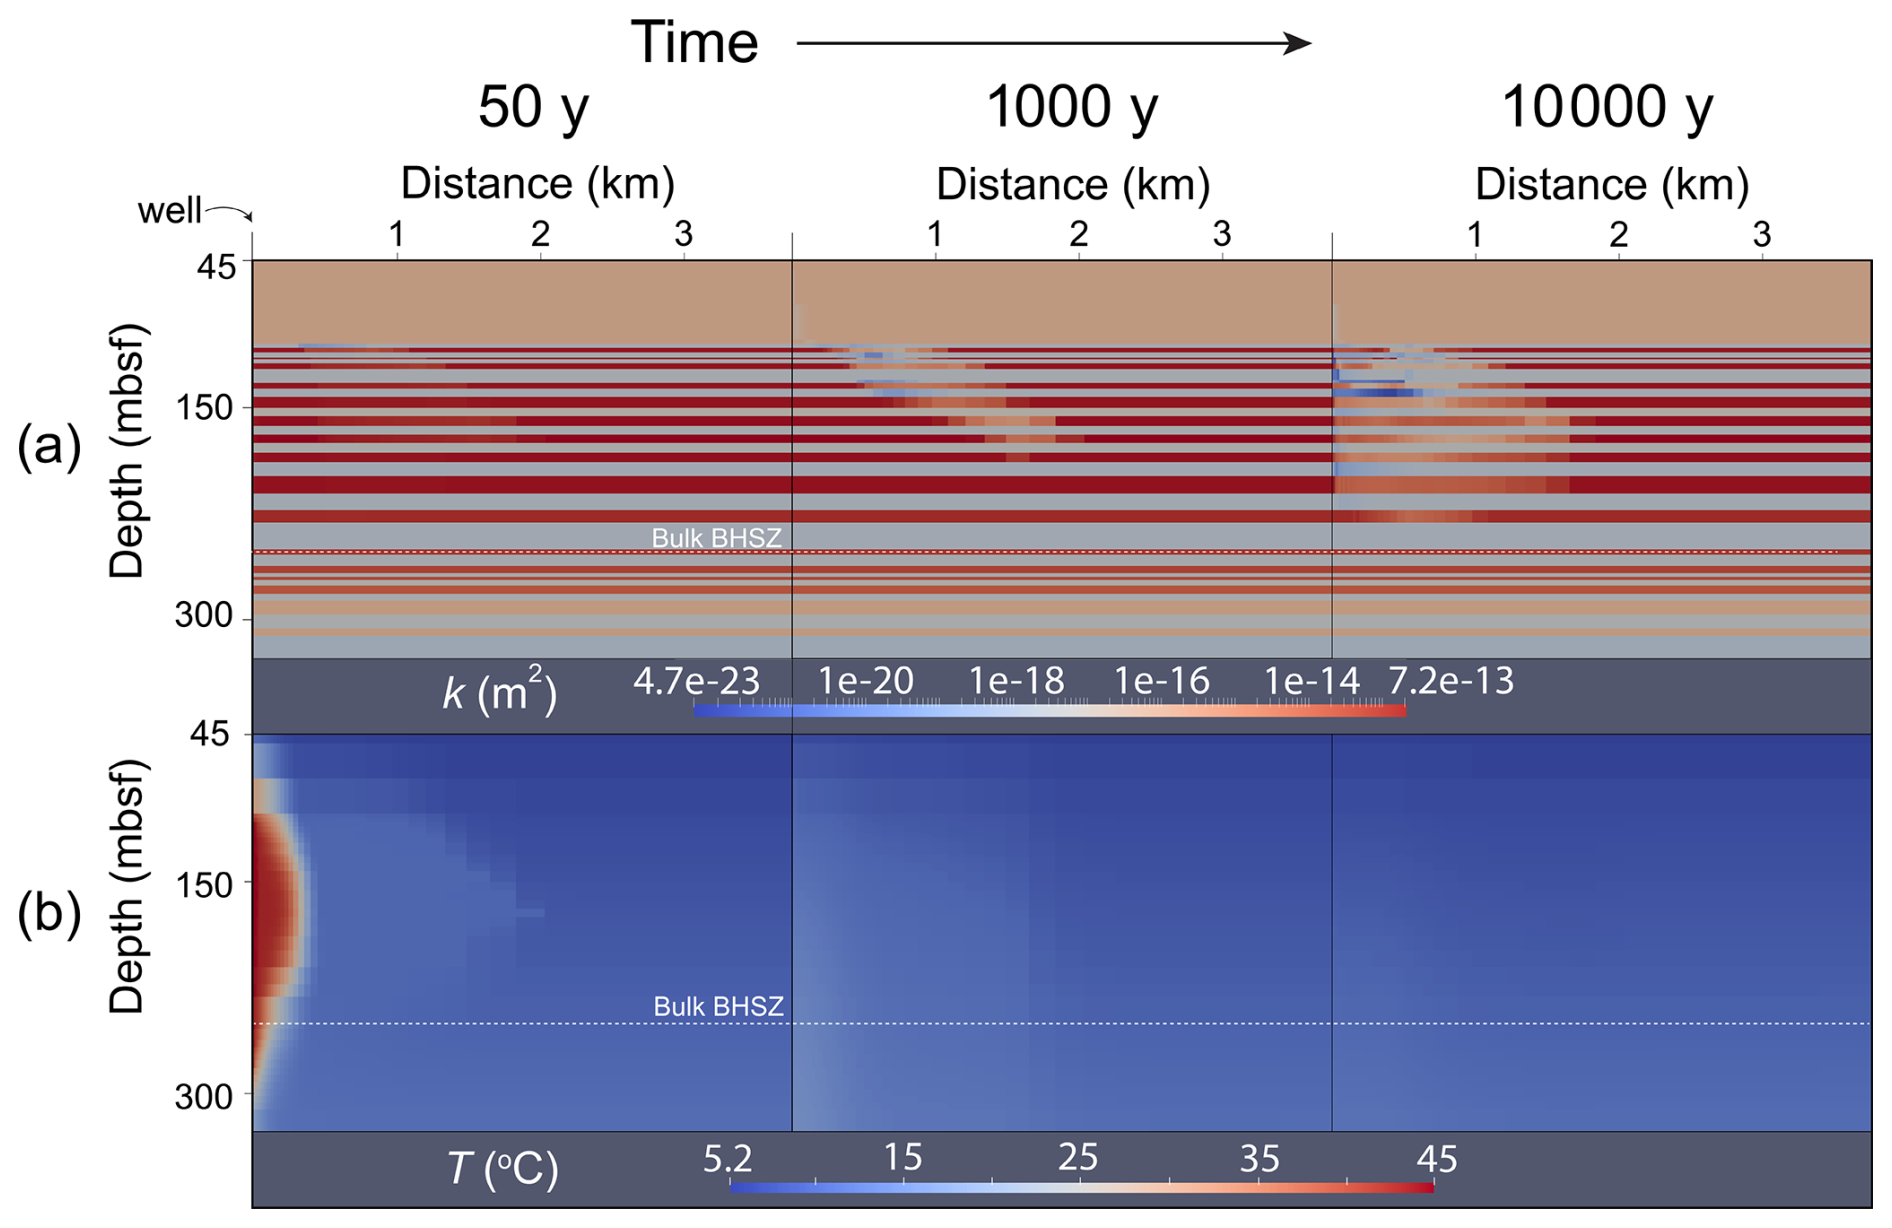
Figure 6(a) Permeability (k) and (b) temperature (T) distributions at 50, 1000, and 10 000 years of simulation time. Depth is represented by the vertical axis, and radial distance from the well is represented by the horizontal axis.
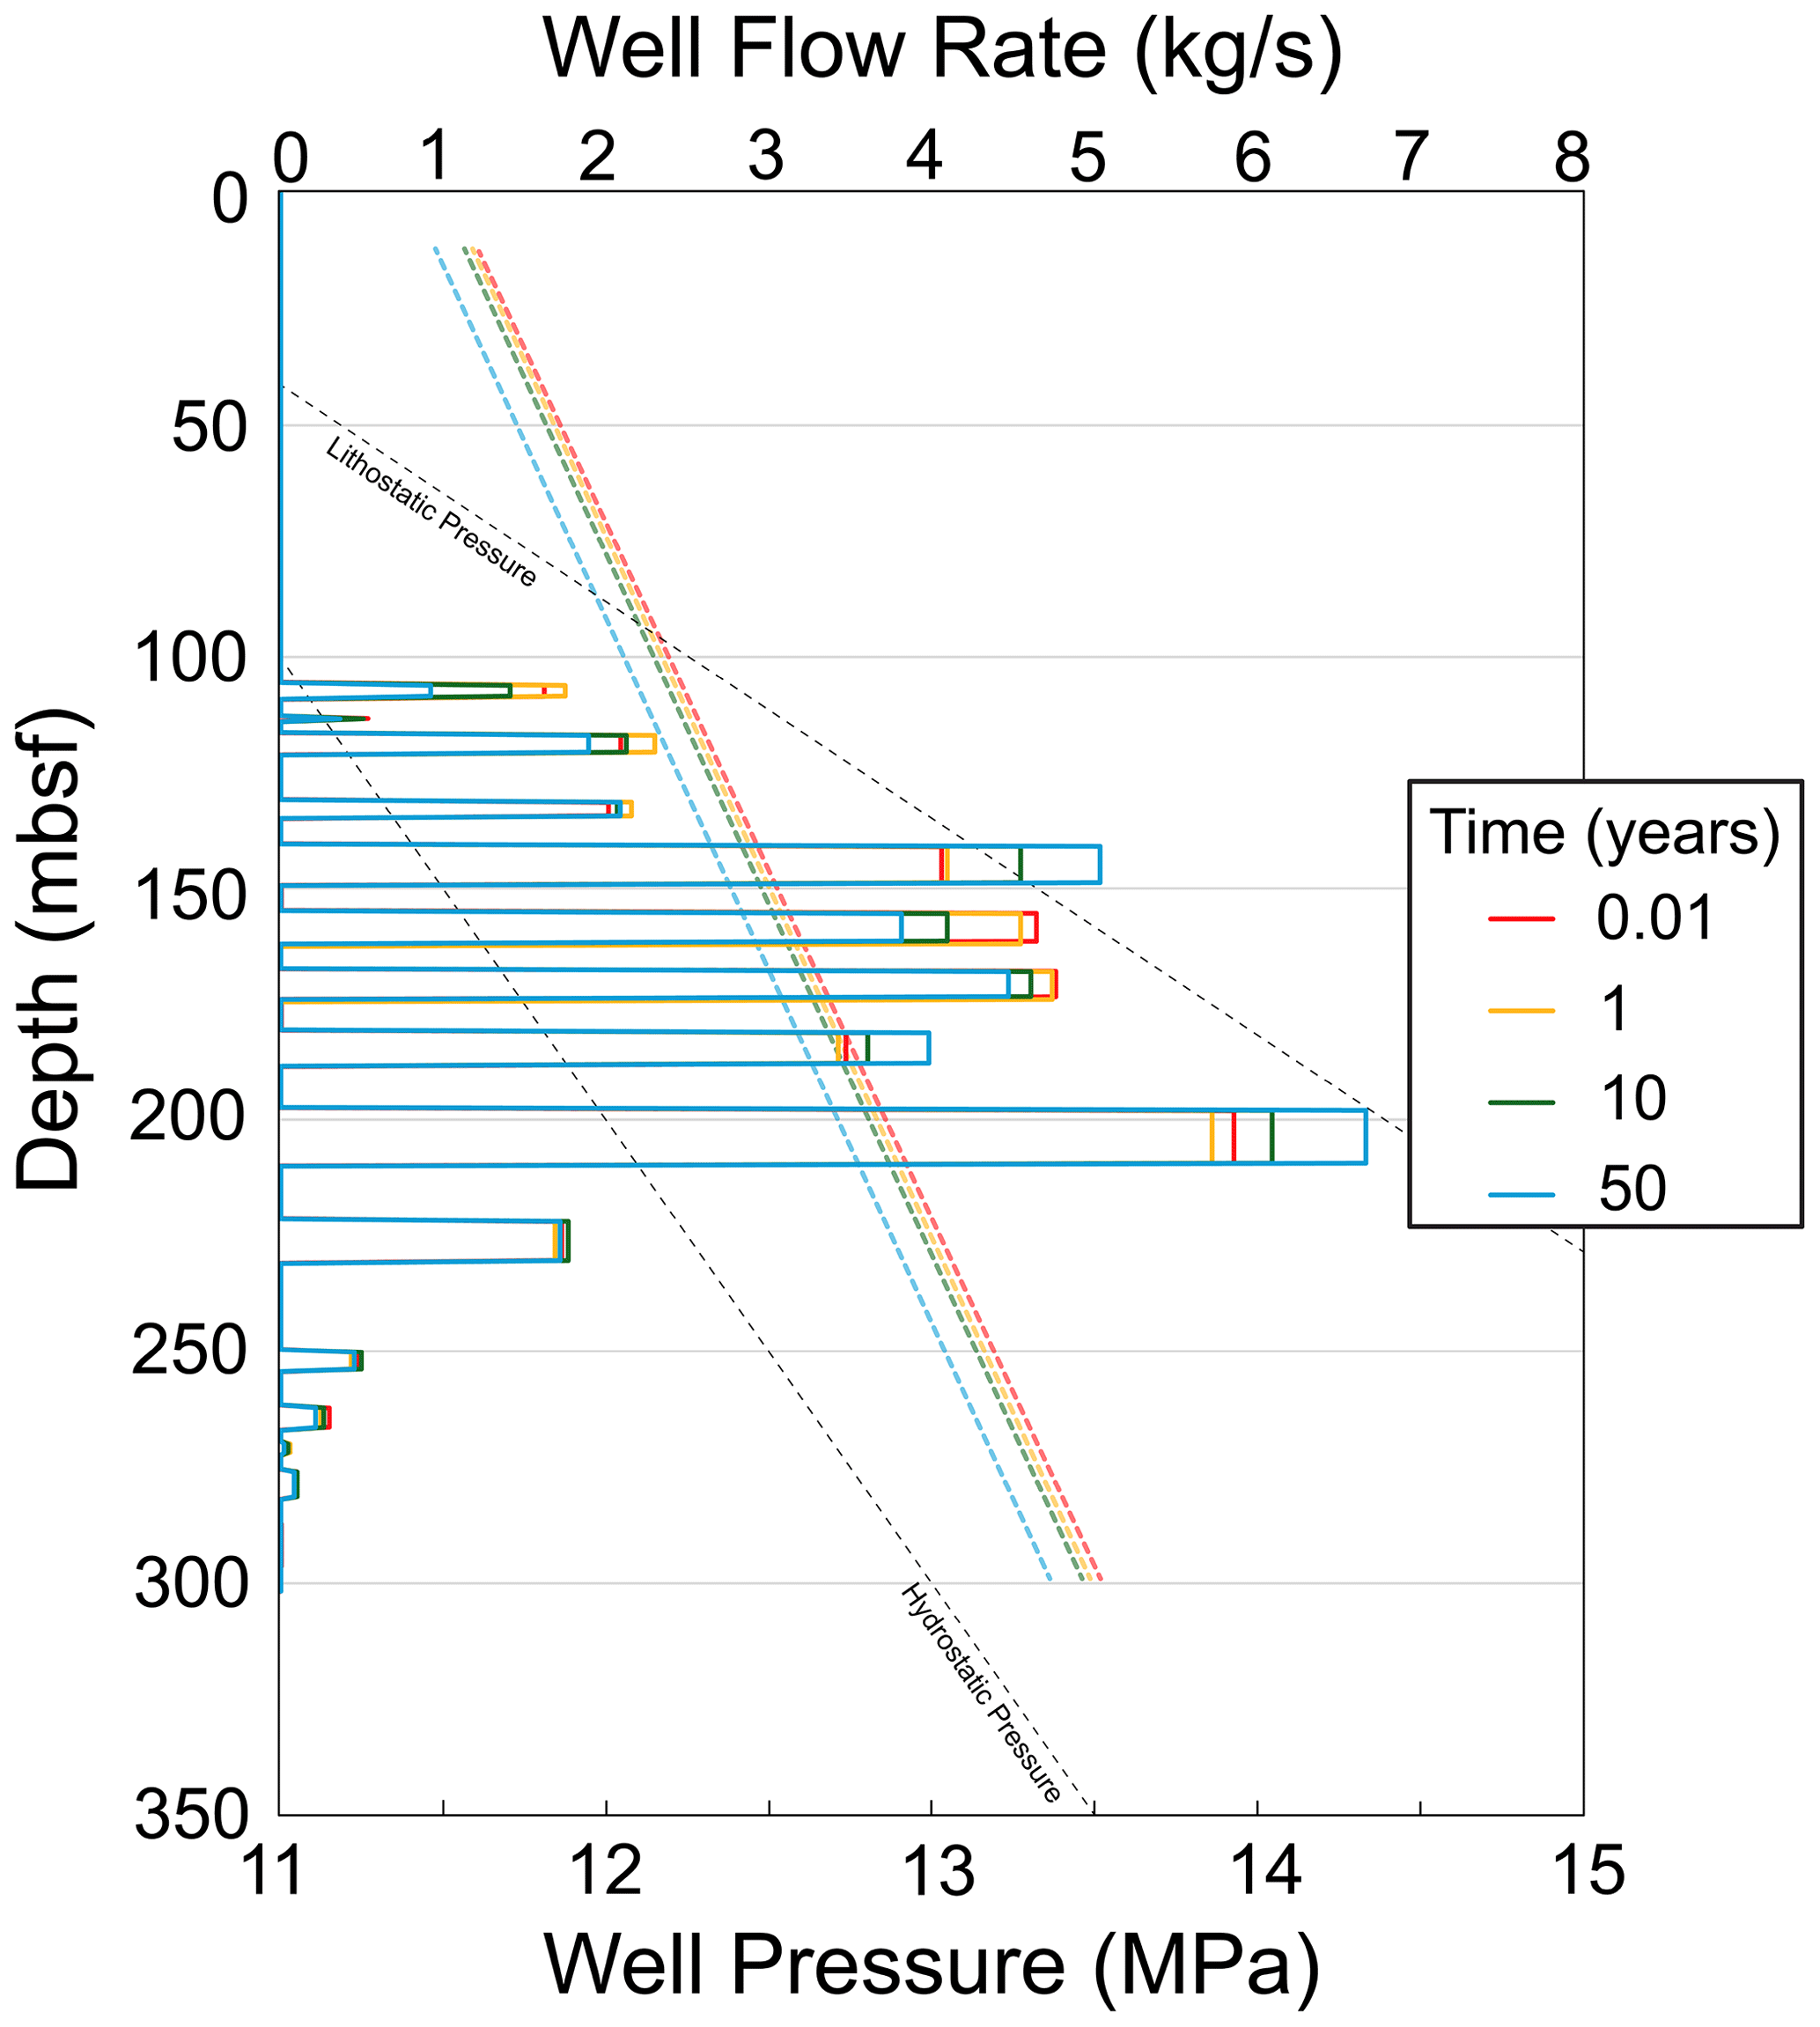
Figure 7CO2 mass flow rate in each well segment (solid lines) and supercritical CO2 phase pressure in the well (dashed lines) during the 50-year injection period.
By the end of the injection period, gas has flowed preferentially in the radial direction along high-permeability flow paths. On the outer edges of the gas plume, free-phase CO2 combines with water to form a gas hydrate phase where pressures and temperatures are within the gas hydrate stability zone. Since pure CO2 is injected through the well and since water is miscible in the CO2 phase, high gas saturations in the near-wellbore cells cause salt concentrations in those cells to increase above salt solubility. This “salting-out” effect results in small amounts of salt precipitate saturation in the pore space at the end of the injection.
As water imbibes back into the near-wellbore cells between 50 and 1000 years, gas saturations in those cells drop and salt redissolves (salt precipitate saturations near the wellbore drop toward 0). During this time, the temperature of the injected fluid drops toward the initial geothermal temperature. As this happens, free-phase CO2 combines with available water to form gas hydrate. Exothermic hydrate formation props up temperatures during hydrate formation and slows the process of CO2 conversion into gas hydrate. In some areas on the upper edges of the CO2 plume, where the system is furthest in the GHSZ, very high conversion of CO2 into gas hydrate is achieved in a relatively short amount of time. Since hydrate formation only involves water and CO2 components, salt exclusion during rapid hydrate formation results in local buildup of salt concentrations. Some cells in the model associated with rapid hydrate formation therefore exhibit some solid salt precipitation by 1000 years.
After 10 000 years, most of the injected CO2 has been converted into gas hydrate. High gas hydrate saturations have built up in the near-wellbore area since the initial temperature of the injection has decayed away toward the steady-state geothermal temperature profile. Hydrate formation has significantly decreased the permeability of the host reservoir, and gas has migrated into the other layers to form hydrate. A region of three-phase coexistence (liquid water, free-phase CO2, and gas hydrate) is still present after 10 000 years because of a combination of exothermic hydrate formation and slow imbibition rates of cool liquid water due to significant permeability reduction.
The two models presented here were selected to demonstrate some of the key dynamic coupled processes associated with CO2 injection into the gas hydrate stability zone. In the 1D homogeneous model, CO2 is injected beneath the GHSZ and forms a free phase which migrates upward due to buoyancy and pressure forces. Once it enters the GHSZ, conversion of CO2 into an immobile hydrate phase is limited by the rate at which heat can diffuse away and the availability of water. When the thermal conduction and liquid water flow are limited, the system can maintain a three-phase equilibrium temperature for decades (or thousands of years, as shown in the 2D model). This thermal buffering phenomenon has been observed in models of natural CH4 hydrate formation and dissociation in marine sediments and can occur on geological timescales depending on the free gas-phase flow rate or the rate of environmental change (You and Flemings, 2018; Oluwunmi et al., 2022). Clearly, such a scenario would not be ideal for permanent CO2 sequestration, as much of the CO2 remains in a free phase and accumulates very close to the seafloor. Permeability reduction due to hydrate formation adds a physical trapping mechanism analogous to a low-permeability sealing facies. The fact that this permeability reduction is the primary mechanism for preventing CO2 flow to the surface in the 1D model suggests that physical or structural trapping should be considered just as important or more important than thermodynamic trapping when evaluating a reservoir within the GHSZ for long-term CO2 storage.
The 2D cylindrical model was designed to incorporate more realistic reservoir physical properties and include an injection rate more viable for commercial-scale CO2 storage in the GHSZ. In this scenario, CO2 was injected into a layered reservoir that is bounded by low-permeability facies that inhibit direct flow of CO2 to the seafloor. Instead of injecting beneath the GHSZ, a high-temperature supercritical CO2 phase is injected directly into and beneath the GHSZ. Near-wellbore gas hydrate formation is prevented by the high temperature of the injection during the injection period. Hydrate formation does occur during the injection period at the edges of the CO2 plume; the associated changes in fluid mobility and permeability alter the pressure in the well and cause the well flow rates to fluctuate layer by layer. Therefore, even if the CO2 injection temperature is designed to prevent near-wellbore hydrate formation, hydrate formation in the far field should be considered when designing a CO2 injection insofar as it could appreciably affect wellbore pressure. Salt precipitation can occur near the wellbore during injection due to salting-out effects of dry CO2 injection. Salt can also precipitate later in time as CO2 is converted into hydrate faster than the porewater can freshen through either aqueous imbibition or salt diffusion. In either case, salt precipitate saturations appear to be minimal for the scenario modeled here, but salt precipitation could appreciably decrease permeability in a configuration with either more rapid CO2 injection or more rapid CO2 conversion into hydrate. In some regions of this model, hydrate saturations become very high at later times and lower the permeability of host reservoir units by several orders of magnitude. This makes for effective sealing of CO2 by conversion to an immobile phase and by impeding the flow of the free CO2 phase. This phenomenon also has the effects of pushing gas into less intrinsically permeable layers and ultimately smoothing the distribution of gas hydrate throughout the model domain.
Potential leakage of CO2 into the ocean at the seafloor is clearly a risk when injecting CO2 into shallow marine reservoirs. In the 2D model, advective leakage of CO2 is prevented by the low permeability of the top facies, but CO2 still migrates upward diffusively, and thus there is some diffusive leakage of CO2 at the seafloor. Beyond just considering the bulk permeability of the top facies, however, care should also be taken to inject CO2 at pressures that remain below the fracture pressure of the overburden. While we do not model permeability evolution due to fracturing in this model, we designed our model scenarios to avoid fracturing (well model pressures in the injection interval were designed to remain below the lithostatic pressure). In a site-specific scenario, the fracture gradient should be characterized well and incorporated into CO2 injection designs.
Although the models presented here only consider injection of CO2 into reservoirs without naturally occurring gas hydrate deposits, the presence of other hydrates (e.g., CH4 hydrate) in a reservoir could affect the injectivity of CO2 by altering the physical properties (e.g., permeability) of the reservoir. The stability of all potential hydrates could be altered by injection of CO2, so site characterization should consider whether and what kinds of hydrates might exist in a potential subsea host reservoir. This information could be used to parameterize heterogeneous initial physical properties of a model, modify phase behavior as a function of gas mixtures, or develop a more sophisticated model of the interactions between multiple gases forming or dissolving multiple hydrates, but such models are beyond the scope of this work.
We present several new developments in PFLOTRAN's HYDRATE mode, including a new option for modeling CO2 as the working gas, a new salt mass balance for considering the effects of salinity gradients and salt precipitation, and a new fully coupled hydrostatic well model. We demonstrate these new capabilities on two test problems designed to explore the coupled processes relevant to CO2 injection into the marine gas hydrate stability zone for the purpose of permanently sequestering CO2. CO2 sequestration in the gas hydrate stability zone is a potentially promising technique for secure storage of CO2 because of the associated favorable conditions for converting injected CO2 into solid gas hydrate form, which is immobile in the pore space. However, no reservoir modeling studies to date have demonstrated what commercial-scale CO2 injection into the gas hydrate stability zone might look like. We show through a 1D homogeneous model that it is critical to consider multiple trapping mechanisms in addition to the thermodynamic trapping accompanied by conversion of CO2 into hydrate form. We then expand this to a 2D heterogeneous cylindrical model with a commercial-scale 1 MMT yr−1 CO2 injection rate to underscore the interplay between structural trapping, thermodynamics, and permeability alteration in the migration and conversion of CO2. We demonstrate how our fully implicit well model adapts to changes in flow properties during CO2 injection and how injection of a warm supercritical CO2 phase can facilitate near-wellbore injectivity but lead to pressure change in the well. In the future, this capability could be used to more rigorously evaluate the potential for secure CO2 storage in greater volumes, at larger (3D) scales, with more site-specific inputs, and with more exotic well designs, including multiple wells or horizontal wells.
The software developments described here were released on 23 August 2024 with PFLOTRAN version 6.0 (http://www.pflotran.org, PFLOTRAN Developers, 2025a). PFLOTRAN is open-source and freely available under a GNU LGPL Version 3 license at https://bitbucket.org/pflotran/pflotran (PFLOTRAN Developers, 2025b). Software inputs and a snapshot of the PFLOTRAN v6.0 Bitbucket repository are available on Zenodo at https://doi.org/10.5281/zenodo.13619874 (Nole et al., 2024). The files on Zenodo include PFLOTRAN input decks for both model scenarios and the associated Span–Wagner EOS database files referenced by those input decks.
MN: software development, model conceptualization, formal analysis, methodology, writing. JB: model conceptualization, writing. FN: model conceptualization, writing. GH: software development, review, editing.
The contact author has declared that none of the authors has any competing interests.
Publisher's note: Copernicus Publications remains neutral with regard to jurisdictional claims made in the text, published maps, institutional affiliations, or any other geographical representation in this paper. While Copernicus Publications makes every effort to include appropriate place names, the final responsibility lies with the authors.
This research was supported by the U.S. Department of Energy (DOE) Office of Fossil Energy and Carbon Management and the National Energy Technology Laboratory (NETL) (grant no. FWP 72688). PNNL is operated for the DOE by Battelle Memorial Institute under contract no. DE-AC05-76RL01830. This paper describes objective technical results and analysis. Any subjective views or opinions that might be expressed in the paper do not necessarily represent the views of the U.S. Department of Energy or the United States Government. Generative AI was used to develop part of the schematic illustration in Fig. 3.
This research has been supported by the Office of Fossil Energy and Carbon Management (grant no. FWP 72688).
This paper was edited by Ludovic Räss and reviewed by Ewa Burwicz-Galerne and one anonymous referee.
Al Hameli, F., Belhaj, H., and Al Dhuhoori, M.: CO2 sequestration overview in geological formations: Trapping mechanisms matrix assessment, Energies, 15, 7805, https://doi.org/10.3390/en15207805, 2022.
Anderson, R., Llamedo, M., Tohidi, B., and Burgass, R. W.: Experimental measurement of methane and carbon dioxide clathrate hydrate equilibria in mesoporous silica, J. Phys. Chem. B, 107, 3507–3514, 2003.
Belgodere, C., Dubessy, J., Vautrin, D., Caumon, M. C., Sterpenich, J., Pironon, J., Robert, P., Randi, A., and Birat, J. P.: Experimental determination of CO2 diffusion coefficient in aqueous solutions under pressure at room temperature via Raman spectroscopy: impact of salinity (NaCl), J. Raman Spectrosc., 46, 1025–1032, 2015.
Cadogan, S. P., Maitland, G. C., and Trusler, J. M.: Diffusion coefficients of CO2 and N2 in water at temperatures between 298.15 and 423.15 K at pressures up to 45 MPa, J. Chem. Eng. Data, 59, 519–525, 2014.
Carty, O. R. and Daigle, H.: Microbial methane generation and implications for stability of shallow sediments on the upper slope, US Atlantic margin, Front. Earth Sci., 10, 835685, https://doi.org/10.3389/feart.2022.835685, 2022.
Clennell, M. B., Hovland, M., Booth, J. S., Henry, P., and Winters, W. J.: Formation of natural gas hydrates in marine sediments: 1. Conceptual model of gas hydrate growth conditioned by host sediment properties, J. Geophys. Res.-Sol. Ea., 104, 22985–23003, 1999.
Collett, T. S.: Natural gas hydrate as a potential energy resource, in: Natural Gas Hydrate in Oceanic and Permafrost Environments, Springer Netherlands, Dordrecht, 123–136, https://doi.org/10.1007/978-94-011-4387-5_10, 2000.
Dai, S. and Seol, Y.: Water permeability in hydrate-bearing sediments: A pore-scale study, Geophys. Res. Lett., 41, 4176–4184, 2014.
Eymold, W. K., Frederick, J. M., Nole, M., Phrampus, B. J., and Wood, W. T.: Prediction of gas hydrate formation at Blake Ridge using machine learning and probabilistic reservoir simulation, Geochem. Geophy. Geosy., 22, e2020GC009574, https://doi.org/10.1029/2020GC009574, 2021.
Frederick, J. M., Eymold, W. K., Nole, M. A., Phrampus, B. J., Lee, T. R., Wood, W. T., Fukuyama, D., Carty, O., Daigle, H., Yoon, H., and Conley, E.: Forecasting marine sediment properties with geospatial machine learning (No. SAND2021-10675), Sandia National Lab.(SNL-NM), Albuquerque, NM, USA, https://doi.org/10.2172/1817972, 2021.
Fu, X., Waite, W. F., and Ruppel, C. D.: Hydrate formation on marine seep bubbles and the implications for water column methane dissolution, J. Geophys. Res.-Oceans, 126, e2021JC017363, https://doi.org/10.1029/2021JC017363, 2021.
Fukuyama, D., Daigle, H. C., Nole, M. A., and Song, W.: Onset of convection from hydrate formation and salt exclusion in marine sands, Earth Planet. Sc. Lett., 605, 118039, https://doi.org/10.1016/j.epsl.2023.118039, 2023.
Garapati, N., Velaga, S., and Anderson, B. J.: Development of a thermodynamic framework for the simulation of mixed gas hydrates: Formation, dissociation, and CO2–CH4 exchange. in: Proceedings of the 7th International Conference on Gas Hydrates (ICGH 2011), Edinburgh, Scotland, UK, 17–21 July 2011, https://citeseerx.ist.psu.edu/document?repid=rep1&type=pdf &doi=e70d8c5b832454d152172b957186225f6542ed02 (last access: 3 March 2025), 2011.
Gauteplass, J., Almenningen, S., Ersland, G., Barth, T., Yang, J., and Chapoy, A.: Multiscale investigation of CO2 hydrate self-sealing potential for carbon geo-sequestration, Chem. Eng. J., 381, 122646, https://doi.org/10.1016/j.cej.2019.122646, 2020.
Goldberg, D., Aston, L., Bonneville, A., Demirkanli, I., Evans, C., Fisher, A., Garcia, H., Gerrard, M., Heesemann, M., Hnottavange-Telleen, K., and Hsu, E.: Geological storage of CO2 in sub-seafloor basalt: the CarbonSAFE pre-feasibility study offshore Washington State and British Columbia, Energy Proced., 146, 158–165, 2018.
Haas, J. L.: Physical properties of the coexisting phases and thermochemical properties of the H2O component in boiling NaCl solution, Geol. Surv. Bull. A, 1421, 1–73, 1976.
Hammond, G. E., Lichtner, P. C., and Mills, R. T.: Evaluating the performance of parallel subsurface simulators: An illustrative example with PFLOTRAN, Water Resour. Res., 50, 208–228, 2014.
Handa, Y. P.: A calorimetric study of naturally occurring gas hydrates, Ind. Eng. Chem. Res., 27, 872–874, 1988.
Kaminski, P., Urlaub, M., Grabe, J., and Berndt, C.: Geomechanical behaviour of gassy soils and implications for submarine slope stability: a literature analysis, vol. 500, Geological Society, London, Special Publications, 277–288, https://doi.org/10.1144/SP500-2019-149, 2020.
Koh, D. Y., Kang, H., Lee, J. W., Park, Y., Kim, S. J., Lee, J., Lee, J. Y., and Lee, H.: Energy-efficient natural gas hydrate production using gas exchange, Appl. Energ., 162, 114–130, 2016.
Lane, J., Greig, C., and Garnett, A.: Uncertain storage prospects create a conundrum for carbon capture and storage ambitions, Nat. Clim. Change, 11, 925–936, 2021.
Lide, D. R. and Kehiaian, H. V.: CRC handbook of thermophysical and thermochemical data, CRC Press, https://doi.org/10.1201/9781003067719, 2020.
Liu, X. and Flemings, P. B.: Capillary effects on hydrate stability in marine sediments, J. Geophys. Res.-Sol. Ea., 116, B07102, https://doi.org/10.1029/2010JB008143, 2011.
McGrail, B. P., Schaef, H. T., White, M. D., Zhu, T., Kulkarni, A. S., Hunter, R. B., Patil, S. L., Owen, A. T., and Martin, P. F.: Using carbon dioxide to enhance recovery of methane from gas hydrate reservoirs: final summary report (No. PNNL-17035), PNNL – Pacific Northwest National Lab., Richland, WA, USA, https://doi.org/10.2172/929209, 2007.
Men, W., Peng, Q., and Gui, X.: Hydrate phase equilibrium determination and thermodynamic modeling of CO2 + epoxy heterocycle + water systems, Fluid Phase Equilibr., 556, 113395, https://doi.org/10.1016/j.fluid.2022.113395, 2022.
Moridis, G. J.: Numerical studies of gas production from methane hydrates, SPE J., 8, 359–370, 2003.
Nole, M., Daigle, H., Cook, A. E., Malinverno, A., and Flemings, P. B.: Burial-driven methane recycling in marine gas hydrate systems, Earth Planet. Sc. Lett., 499, 197–204, 2018.
Nole, M., Bartrand, J., Naim, F., and Hammond, G.: Modeling Commercial-Scale CO2 Storage in the Gas Hydrate Stability Zone: Input Data, Zenodo [code and data set], https://doi.org/10.5281/zenodo.13619874, 2025.
Oluwunmi, P., Pecher, I., Archer, R., Reagan, M., and Moridis, G.: The response of gas hydrates to tectonic uplift, Transport Porous Med., 144, 739–758, 2022.
Oyama, A. and Masutani, S. M.: A review of the methane hydrate program in Japan, Energies, 10, 1447, https://doi.org/10.3390/en10101447, 2017.
Pang, W., Chen, M., Fu, Q., Ge, Y., Zhang, X., Wen, H., Zhou, S., and Li, Q.: A Comparative Study of Hydrate-Based CO2 Sequestration at Different Scales, Energ. Fuel., 38, 16599–16609, https://doi.org/10.1021/acs.energyfuels.4c01941, 2024.
PFLOTRAN Developers: PFLOTRAN Website, http://www.pflotran.org, last access: 3 March 2025a.
PFLOTRAN Developers: PFLOTRAN Repository, PFLOTRAN [code], https://bitbucket.org/pflotran/pflotran, last access: 3 March 2025.
Phillips, S. L., Igbene, A., Fair, J. A., Ozbek, H., and Tavana, M.: A technical databook for geothermal energy utilization, https://escholarship.org/uc/item/2v39z4tw (last access: 3 March 2025), 1981.
Poling, B. E., Prausnitz, J. M., and O'connell, J. P.: The properties of gases and liquids, Vol. 5, New York: Mcgraw-hill, ISBN 978-0070116825, 2001.
Rehman, A. N., Bavoh, C. B., Pendyala, R., and Lal, B.: Research advances, maturation, and challenges of hydrate-based CO2 sequestration in porous media, ACS Sustain. Chem. Eng., 9, 15075–15108, 2021.
Ruppel, C. D. and Kessler, J. D.: The interaction of climate change and methane hydrates, Rev. Geophys., 55, 126–168, 2017.
Singh, R. P., Lall, D., and Vishal, V.: Prospects and challenges in unlocking natural-gas-hydrate energy in India: Recent advancements, Mar. Petrol. Geol., 135, 105397, https://doi.org/10.1016/j.marpetgeo.2021.105397, 2022.
Sloan Jr., E. D. and Koh, C. A.: Clathrate hydrates of natural gases, CRC press, https://doi.org/10.1201/9781420008494, 2007.
Snæbjörnsdóttir, S. Ó., Sigfússon, B., Marieni, C., Goldberg, D., Gislason, S. R., and Oelkers, E. H.: Carbon dioxide storage through mineral carbonation, Nature Reviews Earth and Environment, 1, 90–102, 2020.
Span, R. and Wagner, W.: A new equation of state for carbon dioxide covering the fluid region from the triple-point temperature to 1100 K at pressures up to 800 MPa, J. Phys. Chem. Ref. Data, 25, 1509–1596, 1996.
Spycher, N. and Pruess, K.: A phase-partitioning model for CO2-brine mixtures at elevated temperatures and pressures: application to CO2-enhanced geothermal systems, Transport Porous Med., 82, 173–196, 2010.
Sullivan, M., Rodosta, T., Mahajan, K., and Damiani, D.: An overview of the Department of Energy's CarbonSAFE Initiative: Moving CCUS toward commercialization, AIChE J., 66, e16855, https://doi.org/10.1002/aic.16855, 2020.
Tohidi, B., Yang, J., Salehabadi, M., Anderson, R., and Chapoy, A.: CO2 hydrates could provide secondary safety factor in subsurface sequestration of CO2, Environ. Sci. Technol., 44, 1509–1514, 2010.
Verma, A. and Pruess, K.: Thermohydrological conditions and silica redistribution near high-level nuclear wastes emplaced in saturated geological formations, J. Geophys. Res.-Sol. Ea., 93, 1159–1173, 1988.
Wagner, W. and Kretzschmar, H. J.: IAPWS industrial formulation 1997 for the thermodynamic properties of water and steam, International steam tables: properties of water and steam based on the industrial formulation IAPWS-IF97, 7–150, https://doi.org/10.1007/978-3-540-74234-0_3, 2008.
White, M. D., Bacon, D. H., White, S. K., and Zhang, Z. F.: Fully coupled well models for fluid injection and production, Energy Proced., 37, 3960–3970, 2013.
White, M. D., Kneafsey, T. J., Seol, Y., Waite, W. F., Uchida, S., Lin, J. S., Myshakin, E. M., Gai, X., Gupta, S., Reagan, M. T., and Queiruga, A. F.: An international code comparison study on coupled thermal, hydrologic and geomechanical processes of natural gas hydrate-bearing sediments, Mar. Petrol. Geol., 120, 104566, https://doi.org/10.1016/j.marpetgeo.2020.104566, 2020.
You, K. and Flemings, P. B.: Methane hydrate formation in thick sandstones by free gas flow, J. Geophys. Res.-Sol. Ea., 123, 4582–4600, 2018.
Zander, T., Choi, J. C., Vanneste, M., Berndt, C., Dannowski, A., Carlton, B., and Bialas, J.: Potential impacts of gas hydrate exploitation on slope stability in the Danube deep-sea fan, Black Sea, Mar. Petrol. Geol., 92, 1056–1068, 2018.