the Creative Commons Attribution 4.0 License.
the Creative Commons Attribution 4.0 License.
Simulation of the heat mitigation potential of unsealing measures in cities by parameterizing grass grid pavers for urban microclimate modelling with ENVI-met (V5)
Nils Eingrüber
Alina Domm
Wolfgang Korres
Karl Schneider
Many urban areas are characterized by both a growing population and an intensification of summer heat events in the context of climate change. Thus, more and more people are exposed to heat stress and corresponding health consequences. Measures for climate change adaptation, such as unsealing strategies, are needed in the existing urban fabric to reduce sensible heat flux by increasing latent heat flux to cool down the urban environment without requiring additional space or changing the basic function of the area. Unsealing measures like grass grid pavers (GGPs) can also help to reduce flooding risks due to increased infiltration and water storage capacities. Up to now, a parameterization of GGPs for microclimatic simulations is not available. To fill this research gap, we present a new GGP model parameterization developed for the fluid dynamics microclimate ENVI-met model based on field measurements with double-ring infiltrometers, etc., which can also be implemented in other microscale models in the field of urban climatology. To analyse the microclimatic effects and the cooling potential of this GGP parameterization, scenario analyses were performed using a validated ENVI-met model setup for an urban high-density study area in Cologne, Germany. An extreme scenario was designed to address the maximum cooling potential of the GGPs in comparison to the dominant sealed asphalt surfaces in the study area, along with a more realistic scenario with a usage-compatible installation of GGPs in the model domain only in side streets and inner courtyards while main streets remain sealed. We found a maximum cooling potential of up to −20.1 K for ground surface temperature and up to −7.1 K for air temperature at 1 m above ground level for the hottest hour of a simulated 3 d heat wave in summer 2022, which represents a 20-year heat event in Cologne. On spatial average, a decrease of up to −11.1 K for surface temperature and up to −2.9 K for air temperature was determined. On temporal average for the 3 d heat event, statistically significant mean temperature differences of −5.8 K for surface temperature and −1.1 K for air temperature were simulated. Cooling effects are more pronounced during the daytime for surface temperature, especially in unshaded areas, while cooling effects for air temperature are strongest during the nighttime. Model results also show that the entire air volume in the study area is cooled down due to this adaptation measure, even in areas of the domain where no surfaces have been unsealed in the scenario design. The more realistic GGP scenario shows cooling effects of a comparable magnitude to the extreme GGP scenario. Thus, even partial GGP unsealing is an effective adaptation measure for reducing extreme temperatures in cities if water availability is not limited.
- Article
(7739 KB) - Full-text XML
-
Supplement
(662 KB) - BibTeX
- EndNote
Urban areas are particularly affected by climate change effects such as heat, droughts, or flash floods from high precipitation intensity. The frequency, duration, and intensity of extreme events have significantly increased during the past decades, and negative consequences for urban dwellers will significantly increase in future (Eyring et al., 2021; Kleerekoper et al., 2012). The overheating of urban areas can be attributed to radiation and heat trapping by the urban structures; the high energy storage capacity of building and surface materials; the low albedo of many built surfaces; and a reduced evapotranspiration, infiltration, and water storage capacity due to surface sealing (Tsoka et al., 2020; Parker, 2010). The high percentage of dark and impervious surfaces, typically between 24 % to 45 % of city areas, leads to high radiation absorption and low evaporative cooling (Nwakaire et al., 2020).
The demand for new infrastructure and housing results in an increasing trend in sealed surfaces, which is expected to continue in the next decades in many European agglomerations (Wilke, 2022). Therefore, the potential of climate change adaptation measures in cities has increasingly been investigated in recent years (Balany et al., 2020; Tsoka et al., 2020). As the temperature of sealed surfaces is up to 20 °C higher than that of the surrounding areas (Nwakaire et al., 2020), unsealing strategies are a central adaptation approach. To reconcile the requirements for climate change adaptation and urban development, strategies are needed to increase infiltration and evapotranspiration and to decrease shortwave radiation absorption which at the same time do not require additional space (Mullaney and Lucke, 2014). Compared to asphalt or concrete roads and pavements, unsealed areas can increase the surface albedo and allow evaporation or evapotranspiration if vegetated (Kousis and Pisello, 2023). Thus, the partitioning of the radiation balance into sensible and latent heat flux will be shifted towards latent heat flux, reducing the sensible and ground heat flux (Del Serrone et al., 2022). Furthermore, unsealed urban surfaces increase infiltration and enable a higher storage of water in the city for longer time periods to reduce flooding and drought effects. This buffering effect for extreme heat and flood improves the urban microclimate through more and longer-lasting evapotranspiration from unsealed soil water storages. Adaptation potentials and thermal effects of unsealing measures depend on many factors, such as their size, structure, or physical surface properties (Seifeddine et al., 2023). The area available to implement adaptation measures such as unsealing surfaces is largely limited by urban structural constraints, development, and traffic usage, especially in densely populated cities (Mullaney and Lucke, 2014). Thus, adaptation potentials of unsealing approaches must be assessed based on the given local conditions to achieve the best possible cooling effects during heat and droughts.
Grass grid pavers (GGPs) are an unsealing measure, which on the one hand enables evapotranspirative cooling and on the other hand can still be used for traffic, walking, parking, or other activities. GGPs are a form of evaporative, porous, and vegetative pavements, which increase water storage capacity and latent heat flux and also have a higher reflectivity and emissivity than conventional urban surfaces (Nwakaire et al., 2020; Qin, 2015; Peluso et al., 2022). GGPs show cooling effects not only for surface temperature but also for the surrounding area (Huang and Chen, 2020; Santamouris, 2013). In addition to their temperature-regulating function, GGPs can also increase water availability for the surrounding vegetation, like street trees (Fini et al., 2017; Mullaney and Lucke, 2014), and reduce stormwater flow through a decrease in surface flow due to a higher surface roughness, infiltration, and depression storage. Thus, GGPs contribute to reducing peak discharges and prevent flooding. In addition, they help to improve water quality by filtering pollutants (Bean et al., 2007). GGPs are even suitable for sub-optimal locations with slopes of over 10 % (Pannicke-Prochnow et al., 2021).
There are studies that have measured the air temperature above or the surface temperature of mixed grass and concrete surfaces and found a cooling effect in direct comparison to sealed surfaces (Takebayashi and Moriyama, 2009; Fini et al., 2017). In a modelling analysis by Böttcher (2017) using the METRAS model for the city of Hamburg, interlocking pavers with a grass component have been parameterized and simulated to assess the climatic impacts for the region. The parameterization was conducted for an intra-urban and not obstacle-resolving mesoscale and found a slight cooling effect of 1 to 2 K on the surface and less than 1 K in the air. However, GGPs have not yet been parameterized for microclimate modelling, such as with the established numerical ENVI-met model. Until now, microclimate modelling studies only represented GGPs or similar surfaces as a separate mixture of pure grass and pure concrete in a stripe or chessboard arrangement. Nonetheless, cooling effects for the urban microclimate in terms of air and surface temperature, mean radiant temperature, and physiological equivalent temperature (PET) were found. Those studies using ENVI-met focused on research areas in Italy (Battista et al., 2022; Battisti et al., 2018; Peluso et al., 2022), Malaysia (Saito et al., 2015; Teoh et al., 2022), China (Jia and Wang, 2021), Austria (Rezk, 2021), and Switzerland (Hoffmann and Geissler, 2022). There is no ENVI-met study simulating GGP effects for Germany yet. Teoh et al. (2022) used the surface layer for grass already parameterized in ENVI-met for the GGPs. Rezk (2021) adjusted the albedo and root depth of the pre-parameterized grass. In the study conducted by Battisti et al. (2018), alternating grass and concrete strips were implemented in the model domain to roughly approximate the characteristics of GGPs. Simulated cooling effects of such implementations were more pronounced at the surface than in the atmosphere, and narrow side streets with a width between 6 and 9 m show the strongest cooling effects (Saito et al., 2015). Jia and Wang (2021) also found that the location of adaptation measures can have an important influence on the cooling potential. Unshaded places such as large squares showed clearer cooling effects than shaded areas like street canyons (Battisti et al., 2018). According to Battista et al. (2022), the installation of GGPs on a large square in Rome showed even higher cooling effects than a simulation with a high-albedo surface material or the implementation of shading measures. In many of the previously mentioned studies, GGPs were not analysed as a single adaptation measure in the model setup but are combined with other strategies. Thus, isolated direct cause and effect relationships between GGPs and temperature cannot be determined (Teoh et al., 2022). Our literature review shows that there is a high research interest in the cooling potential of GGP unsealings, but, until now, no combined parameterization of GGPs has been developed for microclimate modelling. Modelling of GGPs in ENVI-met has only been carried out sporadically by a conceptual implementation of separate grass and pavement arrangements, but GGPs have never been parameterized in any study. Thus, microclimate modelling of parameterized GGPs in ENVI-met to analyse cooling effects and adaptation potentials in dense urban environments represents a novelty.
To fill this research gap, this study presents a new parameterization of GGPs based upon in situ measurements. The suitability of the parameterization is tested by analysing the effects of unsealing surfaces by GGPs on the urban microclimate by scenario analyses using the high-resolution, physically based 3D ENVI-met model. Therefore, a parameterized model domain for a high-density residential research area in the city of Cologne, Germany, was used to simulate a 20-year heat event in summer 2022. The study area is particularly exposed to heat stress. In the past, an urban heat island (UHI) effect of up to 10 K was observed in Cologne (LANUV, 2013). Local climate change projections show that not only the frequency but also the intensity of heat events is expected to increase in future. The model simulations are driven by meteorological measurements from our research-grade station in the study area. The model is calibrated and the model results are validated using data from a densely distributed setup and a quality-controlled microclimate sensor network within the study area (Eingrüber et al., 2022b). To evaluate the effects on air temperature and on surface temperature, GGPs are parameterized based on field measurement campaigns in the study area and implemented in the setup model domain according to the given spatial constraints. In relation to a simulation of the current sealed status quo, two scenarios are assessed: (1) GGP implementation for all sealed areas in the model domain to identify the maximum cooling potential and (2) usage-compatible GGP implementation only in private spaces and low-traffic areas (courtyards, unfrequented side streets, parking areas) while the lanes of all main roads remain sealed to identify the realistic cooling potential. Model simulation results of the current situation are compared to the two unsealing scenarios with respect to changes in the simulated air and surface temperatures using statistical analyses and significance tests to reject the hypothesis that the implementation of GGPs has no significant microscale cooling effect.
2.1 Study area and ENVI-met model setup
Model simulations are performed for a 16 ha study area located in the southern part of the inner city of Cologne, Germany (Eingrüber et al., 2021). The study area can be classified as development types 2 and 5 (compact to open medium-high buildings) according to the local climate zone (LCZ) classification (Demuzere et al., 2022). Overall, around 20 % of the study area is characterized by green infrastructure, such as the Volksgarten (a public park) or gardens in inner courtyards of the building blocks. Two main traffic axes run through the study area: Vorgebirgsstraße in a northeast–southwest direction and Volksgartenstraße in a northwest–southeast direction. The lanes of Volksgartenstraße are spatially divided by a double avenue of trees with an unsealed footpath. Furthermore, there are smaller side streets and parking areas and front gardens of various sizes in the study area (Eingrüber et al., 2024d).
A 3D-gridded model domain with 1 m spatial resolution was developed and parameterized for the study area using the ENVI-met model V5.1.2 (Bruse et al., 2022; ENVI-met GmbH, 2023) based on field observations and remote-sensing data. More information on the setup of the ENVI-met model can be found in Eingrüber et al. (2024a). In this way, a real urban environment is represented in the model domain of this physically based, spatially distributed, and continuous time series model with a temporal resolution of 1 s and a spatial resolution of 1 m. The model is driven by measurements from a research-grade meteorological station of the manufacturer Campbell Scientific that we installed in the urban park to define the forced lateral boundary conditions (Eingrüber et al., 2022a).
The model performance was evaluated using sensitivity analyses. A model validation of air temperature using field measurements from a densely distributed network of 39 quality-controlled NETATMO sensors within the study area showed a high accuracy with a mean Nash–Sutcliffe model efficiency coefficient (NSE) of 0.91 for different weather conditions (Eingrüber et al., 2023a).
To analyse the cooling potential of GGPs, a 72 h simulation of an extreme heat event was run using this validated model. The period from 18 to 20 July 2022 represents the 3 hottest consecutive days of the year, with a maximum temperature of up to 40.14 °C (Eingrüber et al., 2023c). This event can be assigned as a 20-year heat event for Cologne when fitting historical measurements of daily maximum temperature at the DWD weather station at Cologne Airport to a Gumbel extreme value distribution (Eingrüber and Korres, 2022). This heat event was characterized by very low wind speeds of maximum 0.386 m s−1 and represents the beginning of a longer extreme drought period in the region.
2.2 Parameterization of grass grid pavers
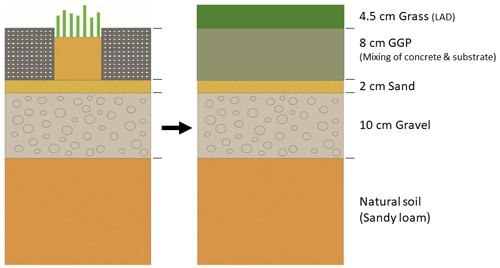
In the ENVI-met Database Manager (DBManager), a new soil profile consisting of different soil and surface materials was parameterized to represent GGPs. Typical GGPs consist of 8 cm thick concrete stones (Hoffmann and Geissler, 2022; Hunt and Collins, 2008; ICPI, 2020; Lin et al., 2013; Starke et al., 2011). A soil profile of GGPs according to Fig. 1 is implemented in ENVI-met. This requires a mixed parameterization of the concrete and substrate and a separate parameterization of the grass growing in the gaps, as ENVI-met does not enable a direct mixing of vegetation and surface materials. Furthermore, sand and gravel are used as bedding layers for the soil profile.
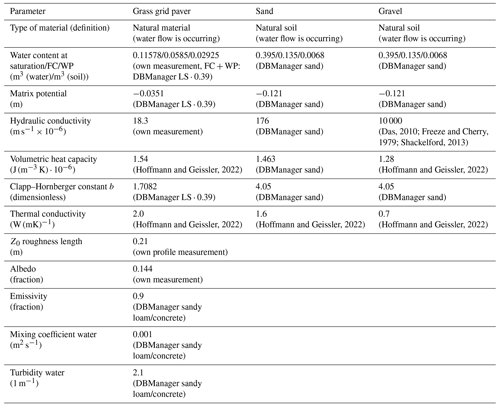
As in the entire study area, sandy loam is the predominant natural soil type, which is already parameterized in the database. Parameters for sand are available in the database, but these had to be adjusted according to the GGP construction materials catalogue by Hoffmann and Geissler (2022) by adjusting the thermal conductivity and heat capacity density. For the typical gravel soil below the GGPs, the heat capacity and the thermal conductivity were parameterized according to Hoffmann and Geissler (2022). The hydraulic conductivity for gravel ranges between 10−1 and 10−3 m s−1, depending on the literature source, which is why a value of 10−2 m s−1 is assumed (Das, 2010; Freeze and Cherry, 1979; Shackelford, 2013). For the water content of a gravel soil, the values of the coarsest-grained parameterized sand soil are assumed.
For the parameterization of the GGPs itself, the heat capacity and conductivity were taken from Hoffmann and Geissler (2022). The saturated hydraulic conductivity, the water content at saturation, and the albedo were measured in situ within the study area for the database parameterization. The matrix potential, the water content at field capacity and wilting point, and the mixing coefficient of water and turbidity are derived according to the substrate in the concrete grid paver and then included as a percentage for the proportion of soil. The Z0 roughness length for concrete is 0.010 m according to the DBManager and 0.015 m for all natural soils except sand. Due to the edge between concrete and the substrate, the Z0 for the GGP is slightly higher than that of pure concrete. Thus, the roughness was also measured in the field.
Grass is already parameterized in ENVI-met and was adapted to the characteristics of grass growing in GGPs. Therefore, the grass height and the leaf area density (LAD) were determined in the field and adjusted according to the ratio of concrete to grass.
2.2.1 Field measurements of the GGP parameters
In situ measurements of saturated hydraulic conductivity, soil moisture at saturation, and albedo were conducted in the northern part of the study area in a GGP parking lot area at Vondelstraße 37 in spring 2023. In addition, the GGP dimensions and the height and LAD of the grass were measured. The substrate in the gaps was sampled to be analysed in the laboratory. The areal substrate–concrete ratio of the GGPs was determined in the field (39 % substrate to 61 % concrete) and is used to compute the combined GGP parameterization of the mentioned parameters taken from the literature or measured on site (see Fig. 2).
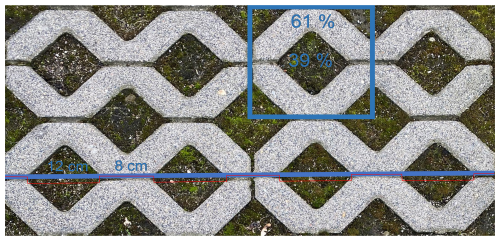
Figure 2Dimensions of the grass grid pavers measured in the study area and location of the profile for roughness determination.
The saturated hydraulic conductivity of the GGPs was determined using infiltration measurements in the parking lot. The infiltration rate was measured using three double-ring infiltrometers. The double-ring infiltrometers consist of two concentric stainless-steel infiltration rings which are filled to equal level with water to avoid lateral flow. The vertical infiltration flux is measured in the inner ring (Eijkelkamp, 2012). As it is not possible to drill the rings into the soil on concrete such as GGPs, the rings were sealed with clay on the ground to prevent lateral leakage. Measurements were carried out at five different test sites in different parking lots in the study area. Water levels for the five tests were measured every 10 min. The final and constant infiltration rate was recorded as saturated hydraulic conductivity after the infiltration rate became constant for at least three consecutive measurements. With 1.2, 1.1, 1.1, 0.8, and 1.3 cm per 10 min, an average constant infiltration rate of 1.1 cm within 10 min was found for the GGPs, which corresponds to 66 mm h−1. This results in a saturated hydraulic conductivity of 18.3 m s to be used for the parameterization in the ENVI-met DBManager.
Soil moisture at saturation of the substrate within the GGPs was measured at four test sites in the GGP parking lots with six repetitions each (24 measurements in total) using a calibrated ThetaProbe ML2x probe connected to an HH2 Moisture Meter and given as volumetric soil moisture content (vol. %) calculated from the changes in the dielectric constant of the soil with an oscillation frequency of 100 MHz. Prior to the measurements, the substrate was fully saturated with water. With 32.4 %, 27.8 %, 29.7 %, and 28.9 % on average for each of the four test sites, an overall average soil moisture at a saturation of 29.7 % was found for the GGP substrate. As the substrate only covers 39 % of the area of the GGPs, and the pavers themselves are not permeable (saturation soil moisture 0 %), the value for the combined GGP parameterization was calculated as a weighted mean. Thus, a mixed soil moisture at a saturation of 0.116 m3 m−3 was used in the ENVI-met DBManager.
In order to address the soil parameters as precisely as possible, substrate samples were taken from paver gaps and dried at 105 °C in the laboratory to fully dry the soil material to be sieved. A 0.063 mm sieve was used to separate the sand from the silt and clay. A mixture of 71 % sand and 29 % silt–clay was found, which corresponds to loamy sand according to the soil type classification. Thus, loamy sand is used as the soil material for parameterization in the DBManager.
To define the Z0 roughness length for the GGP parameterization, a profile measurement was conducted. To describe the extent to which the GGP surface deviates from a completely flat surface by elevations, the number of edges between substrate and concrete and their height were measured in the field, similar to the procedure in Santos and Júlio (2013). A total of 14 substrate/concrete edges are given per profile metre with a height difference of 0.5 to 4.0 cm each (1.5 cm on average), resulting in a Z0 of 0.21 m for the GGP parameterization in the DBManager of ENVI-met (see Fig. 2). As the geometrical structure of the GGPs is evenly repeating parallelograms characterized by full point symmetry in itself, the orientation of the profile metre does not play a role in the number of substrate/concrete edges.
The shortwave albedo of the GGPs was determined using a PYR-BTA pyranometer (from the company Vernier, 2012). The radiation was measured alternately for the incoming solar radiation and the outgoing reflection from the GGPs at a height of 1.5 m above ground level. The albedo was calculated as the division between the incoming and outgoing radiation. The measurements in the study area were conducted during a dry period (several days without any precipitation) on a day with clear-sky conditions in spring 2023. A total of 10 measurement repetitions were implemented. The albedo varied between 0.133 and 0.177 with an average of 0.144 to be used for the GGP parameterization in the ENVI-met DBManager. These measurements represent a more realistic albedo of GGPs exposed to environmental influences after some years of installation in contrast to the albedo values (0.20–0.25) published in the literature, which are based on new (lighter) GGPs after factory production (Battisti et al., 2018; Hoffmann and Geissler, 2022; Peluso et al., 2022).
For grass growing above the GGP layer, the grass profile of the database was modified according to field measurements of the grass growing in the GGPs of the parking lots in the study area. The grass height was determined on site in representative GGPs by measuring the grass stems growing therein and calculating the mean value. The mean height of the grass in the database was adjusted accordingly to 0.045 m, and the mean root depth was changed to 0.053 m. For the leaf area density (LAD) of the grass, the average length of the grass stems with their side stems was multiplied by the average width of the stems to calculate the grass density per GGP gap. As there are 49 grass gaps per square metre, a resulting LAD of 0.9702 m2 m−3 was observed for ideally overgrown GGPs. The LAD is assumed to be uniform for all z-height levels of the grass (see Fig. 4).
2.2.2 Implementation of the GGP parameterization in the soil profile
The parameters for the parameterization of the three soil materials making up the GGP surface (GGPs, sand, and gravel) were directly measured in the field, calculated from the substrate–concrete ratio, or taken from literature are given in Table 1. These three individually developed soil and surface material parameterizations for GGPs, sand, and gravel were then combined into a vertical soil profile according to the structure given in Fig. 1. The final soil profile thus consists of an 8 cm thick GGP layer, which is the combined parameterization of substrate and concrete. This material is defined as a natural material to enable water flow and transportation within the material in the model. This layer is followed by a 2 cm layer of the new parameterized sand and a 10 cm bedding layer of the new parameterized gravel, followed by the ENVI-met DB parameterization for sandy loam as a natural-standing substrate in the study area (see Fig. 3). This soil profile was defined as non-irrigated, and an emissivity of 0.9 was assumed according to the DBManager and in agreement with Peluso et al. (2022). The parameterized grass from Fig. 4 is placed on that soil profile of Fig. 3 to represent the entire GGP structure in the ENVI-met model domain.
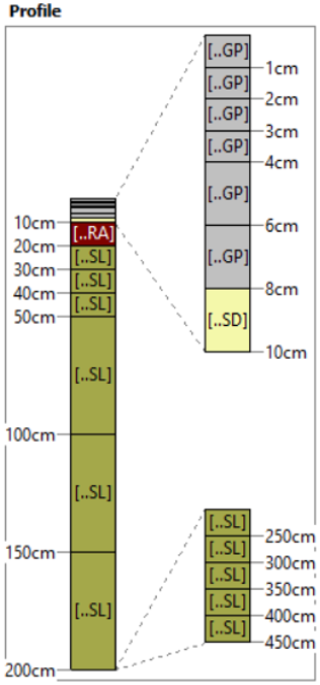
Figure 3Vertical structure of the GGP soil profile in the Database Manager. SL: sandy loam; RA: gravel; SD: sand; GP: grass grid pavers (own illustration in ENVI-met DBManager).
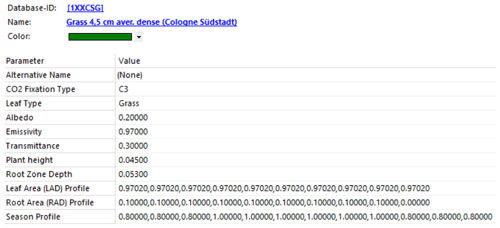
Figure 4Parameterization of the grass growing above the GGPs (own illustration in ENVI-met DBManager).
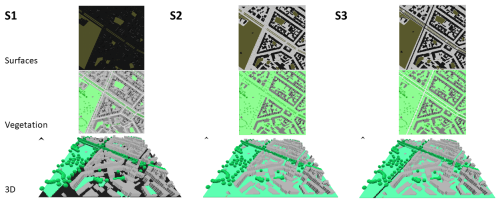
Figure 5Representation of the surfaces, vegetation, and 3D model domain for the designed scenarios (S1: reference run without any GGPs but asphalt on all streets (black surfaces); S2: extreme scenario, GGP implementation on all sealed surfaces (grey surfaces); S3: realistic scenario, usage-compatible GGP implementation in low-traffic areas while lanes of the main traffic roads Volksgartenstraße (W to E) and Vorgebirgsstraße (N to S) are still sealed).
2.3 Scenario design
In this study, two scenarios with GGP implementation are compared to a reference run (Fig. 5). Simulation 1 (S1), the reference run, describes the actual status of the study area, where nearly all surfaces in the urban development are sealed by impermeable asphalt or concrete pavement surfaces and unsealed grass areas can only be found in the urban park, road medians, front gardens of houses, or back gardens in inner courtyards of building blocks. Simulation 2 (S2) represents an extreme scenario in which all sealed surfaces are replaced with GGPs. This scenario aims to quantify the maximum effect to be expected due to GGPs for the given meteorological conditions.
Simulation 3 (S3) is intended to represent a more realistic scenario in the transition between complete sealing and a complete GGP implementation. For this scenario, the limitations of the ground surface and the actual situation in the study area were taken into account. In this usage-compatible scenario, GGP unsealings were only implemented in private spaces and low-traffic areas, such as inner courtyards, unfrequented side streets, or parking areas, while the lanes of all main roads remain sealed as in the reference run. This more realistic scenario encompasses 18 333 GGP grid cells compared to the extreme scenario with 19 958 GGP grid cells. With 0.9702 m2 of grass per cubic metre, this results in around 77 453 m3 of additional green space in S2 and around 71 147 m3 in S3. This means that there is 8.2 % less green space in S3 compared to S2. GGPs are not designed to carry high traffic loads, and the greater roughness causes inconvenience for light vehicles and pedestrians (Moretti et al., 2019; Peluso et al., 2022). It would therefore be advisable to install them on side streets, on pedestrian pathways, in inner courtyards, or in parking lots (Manteghi and Tasneem, 2020). Therefore, for the design of the realistic scenario S3 with a usage-compatible GGP implementation, the lanes of high-traffic roads were kept as asphalt surfaces. While GGPs were set for all side streets, the lane widths of the main traffic axes, Volksgartenstraße (double avenue in the middle of the street) and Vorgebirgsstraße, were measured to determine the number of sealed grid cells in the model domain. For an assumed minimum sealed lane width of 4 m for the main traffic roads, corresponding polygons which are not changed to GGPs are created in QGIS and implemented in the model domain in an INX file using ENVI-met Monde. For all other sealed areas, the predominant asphalt and concrete sealings were replaced by GGPs for the scenario design (see Fig. 5).
2.4 Statistical evaluation methods
Descriptive statistical analyses and significance tests are performed to test these hypotheses:
-
The applied GGPs in the scenarios S2 and S3 do not show a significant microscale cooling effect on surface temperature and air temperature in comparison to the reference run S1.
-
The cooling effect of GGPs is not significantly higher at the surface than in the atmosphere.
-
There are no significant differences in the cooling effect for the scenarios between day and night.
-
The cooling effect of GGPs is not significantly lower in unshaded areas in relation to shaded areas.
For the analyses, the surface temperature and air temperatures at 1, 3, and 5 m above ground level of all GGP pixels of all scenarios were extracted from the EDT/EDX model output files converted into a NetCDF format. To separate nighttime and daytime hours for the third hypothesis, we defined 08:00 to 18:00 LT as daytime because the first GGP pixels are sunny at 08:00 LT and the last ones are sunny at 18:00 LT based on the shadow flag parameter. Nighttime is defined accordingly. For the fourth hypothesis, the shadow flag parameter was used to extract shaded and unshaded areas. The output data of the corresponding pixels were extracted using Python Version 3.9 executed in Leonardo DataStudio (Bruse et al., 2022).
For comparability reasons between the three simulations, exactly the same GGP pixels of S2 were also evaluated for S1 and S3. In this way, data of 19 958 pixels were extracted for all 72 simulation hours for each simulation with Python to be compared. Hourly mean values of all pixels were calculated using R Version R-4.3.0 (R Core Team, 2022), along with frequency distributions and descriptive statistical parameters, namely mean, median, variance, minimum, and maximum. Boxplots were generated for intercomparison of the three simulations. Differences in mean temperature values were checked for statistical significance using a t-test. A significance level of 0.05 was assumed for all statistical tests. The same test procedure was also performed for the selected nighttime and daytime data and for the shaded and unshaded daytime pixels to compare the effects of shaded GGPs with GGPs directly exposed to irradiation. Additionally, NetCDF model output data were loaded into QGIS in order to map mean differences between the scenarios. The hourly layers were averaged using the raster calculator for individual days and for the entire 72 h simulation period.
To analyse, if GGPs not only show a cooling effect on air temperature but also lead to an increase in thermal outdoor comfort, biometeorological indices are calculated. While a decrease in temperature increases thermal outdoor comfort, an increase in relative humidity due to GGP evapotranspiration and an increase in reflected secondary radiation due to the higher albedo of GGPs might reduce thermal comfort. To quantify the overall effects of GGPs on the comfort of humans, the biometeorological indices Universal Thermal Climate Index (UTCI) and Physiological Equivalent Temperature (PET) are determined based on the model outputs of the three simulations for all atmospheric grid cells in the model domain using BIO-met software (Bröde et al., 2011; Höppe, 1999; Bruse et al., 2022).
3.1 Spatial variability in temperature differences
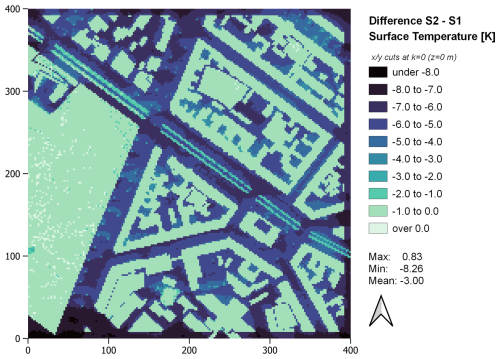
Cooling effects for surface temperature (Ts) from −2.00 K up to −8.26 K can be identified for all grid cells where GGPs have been implemented. Figure 6 maps the absolute difference in Ts between the reference run S1 and the extreme scenario S2 as a mean value per pixel for the 72 h period. In built-up areas and in areas which are already unsealed in the reference run, such as the Volksgarten or other vegetated areas, hardly any Ts differences can be detected. On average for all surface grid cells of the entire 16 ha study area, a cooling effect of −3.00 K in Ts was found. For individual hours, such as 13:00 LT of the hottest day (19 July 2022), Ts was decreased by up to −20.01 K for single GGP grid cells.
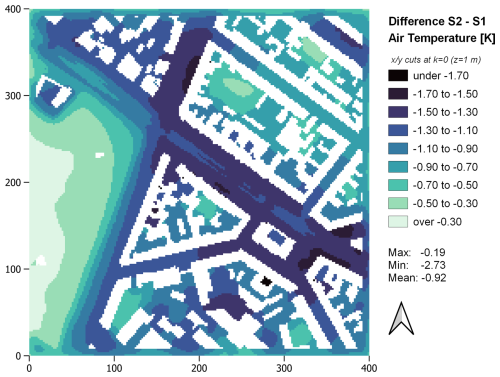
Figure 7Spatial distribution of the mean differences in 1 m air temperature (K) between S1 (reference run) and S2 (extreme scenario) over the entire 72 h simulation period (18–20 July 2022). The x and y axes indicate the spatial distance in the study area (in m).
Figure 7 shows the absolute difference in 1 m air temperature (Ta) between the reference run S1 and the extreme scenario S2 as a mean value per pixel for the 72 h period. In general, Ta differences are much less pronounced than on the ground surface, with changes of −0.19 up to −2.73 K. The areas with GGPs also show clearer cooling effects, but cooling effects can be found throughout the entire study area and thus also in areas where no GGPs have been implemented, such as the urban park or courtyard gardens. This means that the air volume of the entire study area is cooled down in this GGP scenario. The areas in the northern part of Vorgebirgsstraße have a noticeably higher Ta difference. On average, for all 1 m atmosphere grid cells of the study area, a cooling effect of −0.92 K for Ta was found. For individual hours, like for 12:00 LT of the hottest day (19 July 2022), Ta was decreased by up to −7.01 K for single grid cells in the model domain.
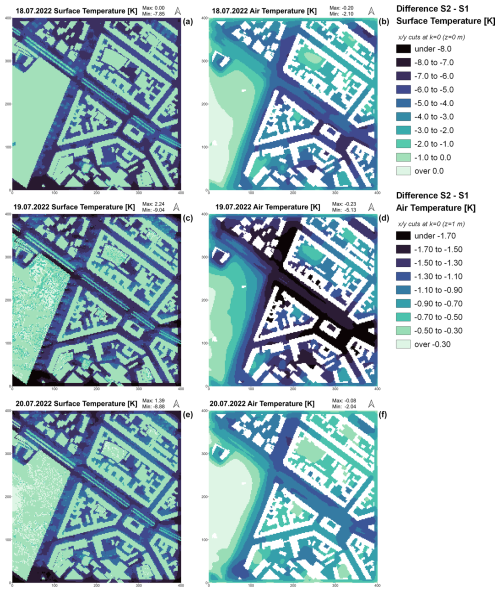
Figure 8Spatial distribution of the mean differences in surface temperature (K) (left) and air temperature (K) (right) between S1 (reference run) and S2 (extreme scenario) for all 3 single days of the study period. The x and y axes indicate the spatial distance in the study area (in m).
In Fig. 8, differences between Ts and Ta are compared for the 3 individual days of the heat event. All days show cooling effects for Ts and Ta. On the hottest day, 19 July, the strongest cooling effects can be observed, with up to −9.04 K for Ts and up to −5.13 K for 1 m Ta. On 18 July, weaker cooling effects can be found under street trees and in the avenue, while, on 19 July, stronger cooling effects occur around the trees. Similarly, weaker effects are observed on 20 July. Although the strongest cooling effects are observed for the hottest day, 19 July, the cooling effects are a little weaker for 20 July than for 18 July despite 20 July being hotter than 18 July. As the difference in the soil water content to the field capacity (FC) continuously increases over the 3 d, the available water for transpiration of the GGPs decreases over time and causes smaller cooling effects on the third day, with a deficit in relation to FC of up to −90 % in relation to the first day, where no soil water content deficit in relation to FC was observed. Although there was a decrease over time, the water content of all GGPs was still sufficient for plant evaporation throughout all 3 d. The soil water content of GGPs decreased much less in shaded areas, such as under street trees.
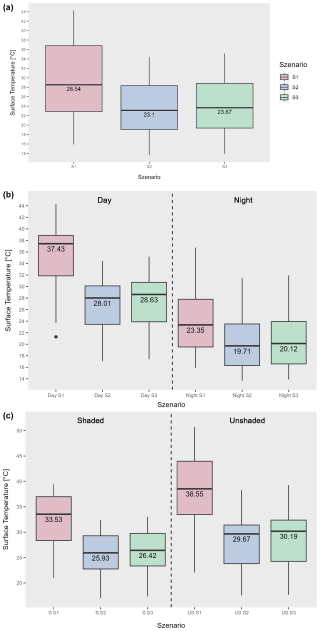
Figure 9(a) Boxplots of the mean surface temperature for the three simulations S1, S2, and S3. Averages of all GGP grid cells for the 72-hourly output values. (b) Boxplots of the mean surface temperature for the three simulations S1, S2 and S3 divided into daytime (left) and nighttime (right). Averages of all GGP grid cells for the 72-hourly output values. (c) Boxplots of the mean surface temperature for the three simulations S1, S2 and S3 divided into shaded areas (left) and unshaded areas (right). Averages of all GGP grid cells for the 72-hourly output values.
3.2 Surface temperature differences
The boxplots in Fig. 9a illustrate the distribution of Ts for the three different scenarios based on the 72-hourly values calculated from the average of all GGP pixels for each hour. For S1, a large interquartile range (IQR) of 13.96 °C can be observed. At 28.54 °C, the median is higher than in the GGP scenarios (23.1 °C for S2). S2 and S3 also show a smaller IQR of 9.27 and 9.47 °C, respectively. For S2, a maximum Ts difference of −11.12 K can be observed on 19 July at noon. On temporal average of the 72-hourly mean values of all GGP pixels, Ts is 5.76 K cooler in S2 and 5.27 K cooler in S3 than in S1. These average cooling effects of GGPs on Ts are statistically significant according to the applied t-test for both scenarios S2 and S3 in relation to S1 but more significant for the extreme scenario S2 (see Fig. S2). In Fig. 10a, an hourly time series of the mean Ts is given for the three scenarios. Maximum Ts differences between the scenarios can be observed during the hottest hours of the day between 12:00 and 19:00 LT, while the smallest Ts differences were simulated between 19:00 and 00:00 LT.
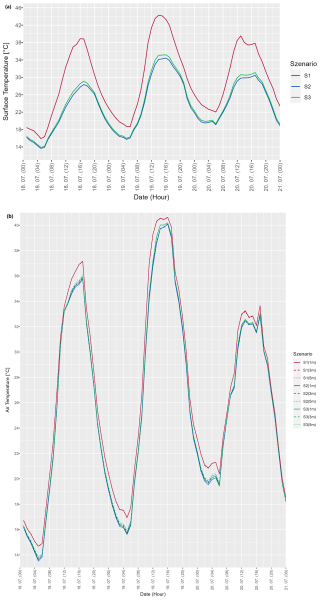
Figure 10(a) Hourly time series of the mean surface temperature of all GGP grid cells in the model domain for the simulations S1, S2, and S3. (b) Hourly time series of the mean air temperature of all atmosphere grid cells in the model domain at 1 m above ground level (solid lines), 3 m above ground level (dashed lines), and 5 m above ground level (dotted lines) for the simulations S1, S2 and S3.
The deviation of the dataset into day and night is illustrated in the boxplots of Fig. 9b. During night hours, smaller deviations in both the maximum and average Ts values for both scenarios S2 and S3 can be found. With −4.4 K on average, daytime cooling effects are much more pronounced than at nighttime for S2 (−4.09 K for S3). Since p values are lower during the day than at night, cooling effects are stronger and more significant during the day but still significant for nighttime. The deviation of the dataset into shaded and unshaded areas is represented in the boxplots of Fig. 9c. The differences in Ts are also significantly higher in unshaded areas than in shaded areas. In scenario S2, a Ts difference of up to −13.43 K can be observed in unshaded areas, whereas this is only −10.85 K in shaded areas. The higher Ts differences in the unshaded areas can primarily be observed in the reduction in the maximum Ts of the days. While significant Ts differences were found between the different scenarios both for shaded and for unshaded areas, p values are lower for unshaded areas; thus, cooling effects are stronger and more significant for direct sunlit surfaces.
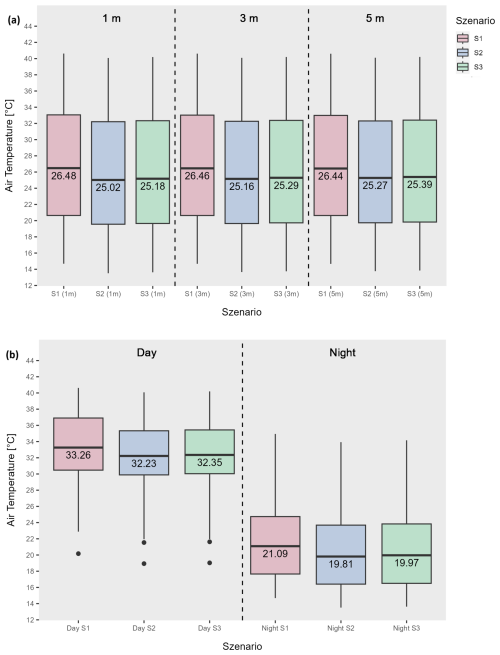
Figure 11(a) Boxplots of the mean air temperature for the three simulations S1, S2, and S3 at 1 m above ground level (left), 3 m above ground level (middle), and 5 m above ground level (right). Averages of all GGP grid cells for the 72-hourly output values. (b) Boxplots of the mean air temperature at 1 m above ground level for the three simulations S1, S2, and S3 divided into daytime (left) and nighttime (right). Averages of all GGP grid cells for the 72-hourly output values.
3.3 Air temperature differences and thermal outdoor comfort
While the cooling effects of GGPs on Ts are highest during the daytime, the cooling effects on Ta are stronger during the night. The boxplots in Fig. 11a illustrate the distribution of Ta for the three different model runs based on the 72-hourly values calculated from the average of all atmosphere grid cells above GGP pixels (for 1, 3, and 5 m above ground level) for each hour. Ta reacts less sensitively to the installation of the GGPs. All boxplots show similar scattering with a similar IQR and standard deviation. The reference run S1 has the warmest Ta at every height level, and the extreme GGP scenario S2 shows the lowest Ta, while the realistic scenario S3 ranges in between. The difference in the cooling effects between the scenarios is strongest at a height of 1 m and decreases with increasing distance to the ground surface. Thus, cooling effects are larger at lower height levels. The strongest cooling effect of −2.89 K on Ta occurs at 1 m height level on 19 July at 11:00 LT for scenario S2. These average cooling effects of GGPs on Ta are statistically significant at 1 m above ground level according to the applied t-test for both scenarios S2 and S3 in relation to S1 but are more significant for the extreme scenario S2. For greater heights, such as 5 m, cooling effects are not statistically significant (see Fig. S2). On temporal average of the 72 -hourly mean values of all atmosphere grid cells 1 m above GGP pixels, Ta is 1.08 K cooler than in S1. In Fig. 10b, an hourly time series of mean Ta is given for the three scenarios and the three height levels above ground surface. During the coldest and warmest hours of the day, Ta is highest at 5 m altitude in S2 and S3 and lowest at 1 m altitude, while, for S1, Ta is sometimes slightly higher at 1 m altitude and smallest at 5 m altitude, and sometimes hardly any differences in Ta with height can been observed for S1. Thus, Ta increases with height for S2 and S3, while it decreases for S1. Greater Ta differences between the scenarios can be observed mainly during the coldest hours of the day between 01:00 and 07:00 LT. The deviation of the dataset into daytime and nighttime is exemplarily illustrated in the boxplots of Fig. 11b for a height level of 1 m above ground surface. It becomes clear that the differences between the scenarios are more pronounced at nighttime. According to the median, there is a slightly higher Ta cooling effect during the night.
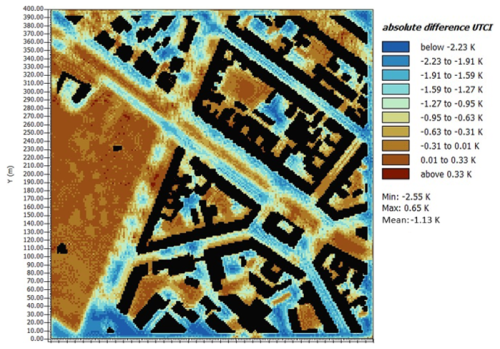
Figure 12Absolute difference in the biometeorological Universal Thermal Climate Index (UTCI) between the reference run S1 and the extreme scenario S2 at a height of 1 m above ground level.
Sensible and soil heat fluxes decreased due to GGP implementation, while reflected radiation and latent heat flux (and thus also relative humidity) increased due to the unsealing, LAD, and different material properties such as the lower heat capacity and higher thermal conductivity of the GGPs. To analyse, if the cooling effect of GGPs on Ta also leads to an increase in thermal outdoor comfort despite relative humidity and reflected secondary radiation increases, thermal comfort indices can be calculated. A map of the absolute difference in the Universal Thermal Climate Index (UTCI) between the reference run S1 and the extreme scenario S2 is shown in Fig. 12. It becomes clear that thermal comfort is significantly increased on areas where GGPs have been implemented; in particular, in the street canyons, a decrease in UTCI by up to −2.6 K was calculated. On temporal and spatial average for all grid cells at 1 m above GGP pixels, an UTCI improvement of −1.7 K was found. In S2, the perceived temperatures drop from very strong heat stress to only strong heat stress on temporal and spatial average for all grid cells at 1 m above GGP pixels. Also, the Physiological Equivalent Temperature (PET) shows a decrease in the perceived temperature on temporal and spatial average of all areas where GGPs have been implemented by −2.6 K and up to −6.8 K. A corresponding map for the absolute difference in PET between S1 and S2 is given in Fig. S1.
The four initially defined hypotheses can all be rejected according to the performed statistical significance t-tests, and the corresponding alternative hypotheses can be accepted as follows:
-
The applied GGPs in the scenarios S2 and S3 show a significant microscale cooling effect on Ts and Ta in comparison to the reference run S1.
-
The cooling effect of GGPs is significantly higher at the surface than in the atmosphere.
-
There are significant differences in the cooling effect for the scenarios between day and night.
-
The cooling effect of GGPs is significantly lower in unshaded areas in relation to shaded areas.
Furthermore, we found that the cooling effects are more pronounced on the hottest day of the 3 d simulation period (19 July with fully autochthonous weather conditions), but, for all days, a temperature reduction was observed. This clearly states that, even on 20 July, where partial cloudiness is pronounced after noon, a significant heat mitigation potential can be concluded for the parameterized GGPs.
The identified significant temperature differences across all GGP pixels indicate the overall cooling effects on average but do not account for spatial variations within the study area. The variety of surfaces and shapes in urban areas exhibit a high diversity of features influencing the urban microclimate. The interaction and interplay of these diverse surfaces contribute to the complexity of the urban environment and must be considered. The intrinsic characteristics of surfaces are additionally influenced by external factors such as radiation, geometry, position within the flow field, and immediate surroundings (Oke, 1982). For Ta at 1 m above ground level, particularly between the Volksgarten and the adjacent tree-lined double avenue, the strongest cooling effects might occur, as combinations of various adaptation strategies usually yield the best results. In this context, both the nearby park and the tree-lined avenue, in combination with the GGPs, are likely to be most effective. In a study by Peluso et al. (2022), the combination of cool surfaces, hedges, and trees achieved the best cooling effects, as Ta could be reduced by over 3 K. Battisti et al. (2018) also concluded that combining GGPs with trees and green roofs leads to the best results. In the same way, the high cooling effects along the eastern section of Volksgartenstraße and the northern part of Vorgebirgsstraße in our study area can be explained. Numerous trees have been planted at these locations, which noticeably reduce Ta even at heights of 5 m above ground level. The identified significant cooling effects of GGPs on Ts are strongest during the hottest hours, which can be explained by the thermal properties of the GGPs. Ta, on the other hand, is indirectly reduced by lower sensible heat flux of the ground surface, which leads to smaller cooling effects of Ta.
Measurement and simulation studies are in agreement with the magnitude of the cooling effect of the newly developed GGP parameterization for ENVI-met in this paper, such as the analyses for Rome and Fondi, Italy, of Battista et al. (2022) and Peluso et al. (2022). The results from Ipoh and Malacca, Malaysia, show very similar maximum Ts effects but only about half of the cooling effect for maximum Ta (Saito et al., 2015; Teoh et al., 2022). It should be noted that the analyses in Ipoh only examined the joint effect of GGPs with roadside trees. In many of the studies mentioned, it is therefore difficult to determine the isolated effect of GGPs, as different adaptation measures were often combined with each other. Results for Ta in Vienna are significantly lower than in this study, although GGPs were represented by pure grass there (Rezk, 2021). A simulation in Hong Kong also concludes weaker cooling effects for Ta (Jia and Wang, 2021). Results cannot directly be compared due to the hotter and drier climatic conditions. At the same time, it needs to be taken into account that all of these studies have not applied a specific parameterization for GGPs; thus, transferability is highly limited. Our findings of significant differences in the cooling effect with increasing height above ground surface are also in agreement with theoretical studies and can be explained by the mixing of warmer and cooler vortices in the air at higher altitudes (Oke et al., 2017).
The observed significant differences in the Ts cooling effects between day and night, which are greater during the daytime in our simulations, can be traced back to the fact that the sensible heat flux was reduced by approx. 130 to around just 10 W m−2 in S3. Takebayashi and Moriyama (2009) performed tests on various parking lot surfaces, also including concrete–grass mixtures, and compared them with each other and with an asphalt parking lot. Ts of grass areas also showed a stronger cooling effect during the daytime compared to the asphalted parking areas due to a reduction in sensible heat flux ranging between 100 and 150 W m−2. This change in sensible heat flux agrees well with the magnitude of the change in sensible heat flux of our study, while absolute values differ due to other surface material and vegetation properties. In addition, a lower absorption of heat by GGPs can be explained by the thermal material properties. Increasing the thermal inertia and minimizing the ratio between net radiation and heat conduction into the ground can reduce Ts (Wang et al., 2021). A smaller proportion of heat is dissipated into the ground despite the higher thermal conductivity of the GGPs, as a higher proportion of energy is directly transferred into latent heat flux. In addition, the high thermal conductivity in deeper layers of the ground reduces Ts during the day. The thermal inertia of the soil can be reduced by the lower volumetric heat capacity of the GGPs, resulting in a lower heat storage during the day, especially during the hottest hours (Peluso et al., 2022). According to Gui et al. (2007), heat conduction and heat capacity only cause a reduction in maximum temperatures. The results of our study therefore contradict the statement by Manteghi and Tasneem (2020) that porous surfaces only have a marginal cooling effect when filled with soil. With the substrate assumed in our study, this also causes an average of 35 % of the cooling effect.
Although the albedo of the GGPs and the grass (0.144 and 0.2) is smaller than that of the mean pavements in S1 (0.35), resulting in a higher energy input, cooling through evapotranspiration compensates and even exceeds this effect, which is also proven by Lee et al. (2016), who found a cooling effect for Ta of up to 3.4 K and an average of 1.1 K during the course of the day, similar to our simulations. At nighttime, cooling effects of GGPs on Ts are significantly smaller than during the daytime, while more significant cooling effects on Ta occur during the nighttime in both S2 and S3. The process of heat dissipation during the night can be reduced by installing GGPs. On the one hand, the lower volumetric heat capacity results in lower storage of solar energy during the day. On the other hand, nocturnal cooling is also controlled by the process of evaporation of the surface. This means that the surface and especially the air layers close to the ground are cooled at night. This can explain why delta Ta in S2 and S3 was on average around 11 % to 16 % smaller during the daytime compared to the nighttime. In a study in Basel at 04:00 LT, a lower Ta was also found over GGPs compared to other surfaces, such as asphalt, concrete, stone slabs, and gravel (Hoffmann and Geissler, 2022). In the study by Takebayashi and Moriyama (2009), more significant differences were also found for Ta at nighttime. Gui et al. (2007) also observed a higher reduction in minimum Ta than in maximum Ta. In agreement with our determined significant differences in the cooling effects between shaded and unshaded GGP areas being more pronounced over sunny areas, higher Ta differences on unshaded surfaces were also found in Battisti et al. (2018). A study in the Palazzo Mancini in Rome also demonstrated that GGPs have the strongest cooling effects, especially in the centre of the square without any shade. Locations at the edge of the square next to a building and in an adjacent street under trees showed significantly lower cooling effects (Battista et al., 2022). The positioning of the GGP is therefore of central importance.
On unshaded surfaces, lower p-values, and thus greater Ts differences, were found in our study, as more energy is absorbed in unshaded areas, which leads to higher Ts. A greater reduction in Ts can then be achieved by installing GGPs in unshaded areas. On the other hand, grass growing in unshaded areas can die earlier during extreme drought events. This could cause smaller cooling effects in unshaded areas in relation to shaded areas when the evapotranspiration of the dead grass reaches zero, and, due to the smaller albedo of that surface in contrast to the sealed surfaces of S1, all irradiated energy is then transferred into sensible and ground heat flux. The soil water content had already decreased slightly within the 3 simulated days and caused smaller cooling effects on the third day. The smaller simulated cooling effects on 20 July than on 18 July despite 20 July being hotter than 18 July can be attributed to a limitation of the cooling effects of the GGPs due to a lack of plant-available water. After several days without any precipitation and artificial irrigation, the effect of evaporative cooling could therefore become negligible in unshaded areas, while grass can survive for longer periods on shaded surfaces, such as under street trees with higher water availability. Our results also clearly show that water availability is higher in the direct vicinity of trees. Irrigation of GGPs during particularly dry phases could therefore maintain the cooling function permanently. The combined implementation of GGPs and urban trees can make GGPs more resilient even during prolonged drought periods. Some studies also showed that permeable pavements in combination with urban trees improve water availability for both trees and GGPs (Fini et al., 2017; Mullaney and Lucke, 2014).
It was shown in this study that the cooling effects of the GGPs are highest on the hottest simulation day, 19 July, and higher for the extreme scenario S2 than for the more usage-compatible scenario S3. Also, GGPs not only cool down the air above the surfaces where GGPs have been implemented, but Ta was also decreased in other parts of the study area where no GGPs were set in the scenarios, such as in the urban park or in inner courtyard gardens. Thus, the GGPs are able to cool down the air volume of the entire study area. As the strongest cooling effects occur during the midday hours, GGPs are an effective measure to minimize peak temperatures, which are particularly harmful to human health. The calculated biometeorological indices PET and UTCI prove that thermal stress can significantly be reduced by the parameterized GGPs, especially during the hottest hours of the simulated days.
The identification and expression of cooling effects in the context of urban heat mitigation is complex and largely depends on the crucial selection of thermal metrics which are not generalizable (Middel et al., 2021). While metrics such as Ts can directly represent the physical processes at energy conversion surfaces, resulting in the greatest effects, Ta as an integrative energy description of a volume is less sensitive due to external effects like wind flow but is more relevant for pedestrians and better describes the overall cooling effects for an urban environment. The mean radiant temperature and thermal comfort indices, such as UTCI or PET, are well suited for describing the heat perception and stress of human individuals and take into account parameters such as clothing and metabolism parameters and personal characteristics such as body mass index. Nevertheless, comfort indices have limitations with regard to generalization and transferability for people of different ages, sizes, gender, and weight, and they are therefore subject to assumed standardizations. Quantification of cooling effects should therefore always use different metrics instead of single ones to describe the direct physical causalities, the integrative effects, and the consequences for perception (Anders et al., 2023).
Besides the significant cooling effects of GGPs and other benefits such as water filtration and storage, we should not neglect the fact that GGPs also present particular challenges. These include the potential for damage if traffic volumes are too high, as the stones are not designed to bear high loads, and for the reduction in infiltration performance due to compaction and clogging of the pores after some time (Pannicke-Prochnow et al., 2021). Therefore, GGPs require regular maintenance. GGP albedo can also be further reduced while ageing. Another key challenge is the death of the grass in extremely dry and hot regions, which is why the implementation of GGPs should always be examined on a site-specific basis (Mullaney and Lucke, 2014). Furthermore, accessibility for cyclists, pedestrians, and people with walking disabilities must be guaranteed (Takebayashi and Moriyama, 2009). In reality, further sealed strips would be needed for users such as cyclists, and possibly a partial sealing of side streets would still be necessary. Thus, the more usage-compatible scenario S3 is still not a realistic one. However, although S3 includes 8.2 % less GGP implementation than S2, cooling effects are only slightly smaller. This demonstrates that there is no linear relationship and that even smaller GGP implementations (percentages) can have significant cooling effects in comparison to S1. Particular attention should be paid to water availability in the overall context of neighbourhood planning. In terms of water management, GGPs can be a central strategy for flood protection measures due to increased infiltration and water storage for reducing surface runoff and thus peak flows (Bean et al., 2007).
The results of this study prove the suitability of the newly developed parameterization of GGPs for microclimate modelling in ENVI-met to fill the identified research gap, which could also be used in the broader field of urban microclimate modelling and implemented in models on a similar scale, such as PALM-4U or MITRAS (Maronga et al., 2020; Salim et al., 2018). The simulations showed that partial unsealing with GGPs is a suitable climate change adaptation measure. Full unsealing scenarios could have even stronger cooling effects. Even higher adaptation potentials can also be expected when combining GGP unsealings with further technical solutions and nature-based solutions, such as with blue or green roofs (Eingrüber et al., 2023b, 2024c). Overall, our findings can have important implications for decision-making in urban planning aiming to mitigate future heat stress, droughts, and flooding and improve thermal outdoor comfort. Thus, these climate adaptation pathways can contribute to several sustainable development goals (SDGs) of the United Nations (UN), especially goals 3, 11, and 13.
As GGPs have never been parameterized for microclimate modelling with ENVI-met before, a new parameterization was developed using in situ measurements to fill this research gap, which can also be implemented in other urban microclimate models. Based on measurements of saturated hydraulic conductivity with double-ring infiltrometers, of soil moisture at saturation point using frequency domain reflectometry (FDR) probes, and of surface albedo using pyranometers, as well as many other measurements of the substrate and vegetation of GGPs, a new database profile for ENVI-met was parameterized. To analyse the cooling potential of the GGPs, scenario analyses were performed for an urban high-density study area in Cologne, Germany, using a validated ENVI-met model. An extreme scenario with hypothetical GGP installation on all sealed surfaces and a more usage-compatible scenario, where GGPs were not installed on main traffic roads, were implemented in the model domain to investigate the microclimatic effects of this parameterization. The GGP unsealings are highly effective in mitigating urban heat stress in the entire city quarter to adapt to the negative effects of anthropogenic climate change, as they significantly reduce Ts and Ta. During the hottest hours, differences of up to −20.1 K were found for Ts, while differences of up to −7.1 K were identified for Ta at 1 m above ground level. On spatial average for the entire model domain, cooling effects of up to −11.1 K for Ts and up to −2.9 K for 1 m Ta were simulated during this 20-year heat event in Cologne in summer 2022. On temporal average for the 3 d heat event, statistically significant mean differences of −5.8 K for Ts and −1.1 K for 1 m Ta were concluded.
Cooling effects are more pronounced during the daytime for Ts, especially in unshaded areas, while cooling effects on Ta are strongest during the nighttime, as the GGPs store less thermal energy during the day and therefore emit less into the atmosphere at night. While Ts is only decreased in areas with GGP installations, Ta indicates that the entire air volume in the study area is cooled, even in areas of the model domain where no surfaces have been unsealed in relation to the reference run, such as in the urban park or inner courtyard gardens. The cooling effect of the GGPs on Ta decreases with the distance from the ground surface as a cooling source. As the more usage-compatible GGP scenario shows cooling effects of nearly the same magnitude as the extreme GGP scenario, even partial GGP implementations represent an effective adaptation measure for temperature regulation in dense urban environments. Based on the model outputs, it was also found that the thermal material properties of the GGPs cause about one-third of Ts differences, while the evapotranspiration is the main cooling-process driver. Within the study area, a high spatial variability in cooling effects was found. Thus, adaptation potentials of GGPs must be assessed by urban planners based on the given local conditions to achieve the best possible cooling effects, including factors such as radiation, geometry, position within the flow field, and immediate surroundings. Our results also showed that GGPs not only reduce Ta but also increase thermal outdoor comfort, as the indices PET and UTCI also quantify a significant reduction in heat stress for humans in the study area. The adaptation potential of the GGPs is largely limited by water availability. Our simulations demonstrated that the effect of evaporative cooling reduced during the 3 d heat period, especially in unshaded areas, while water availability is higher in the direct vicinity of street trees.
In further research, combinations of this new GGP parameterization with other technical and nature-based adaptation strategies, such as roof and facade greening or shade sails, should be investigated to identify potential reinforcing effects. A combination of GGPs with street trees could be an especially reliable approach to increasing water availability for during both extreme, prolonged heat and drought periods to increase resilience by reducing urban heat stress and health risks in a changing climate. It would also be interesting to analyse the microclimatic effects of GGPs which are designed using water-permeable concrete or which are made of surface materials with an even higher albedo. Further research could also analyse more specifically which of the parameters of the new GGP parameterization, such as the albedo of the GGP surface, the heat conductivity and heat storage capacity of the applied materials, or the evapotranspiration of the GGP vegetation, cause the highest percentage contribution to the overall cooling effect simulated in this study. In this way, it could also be identified if GGPs still have a cooling potential when fully dried. To optimize the performance of this climate change adaptation strategy in urban areas, further research could also intercompare the cooling effects of this GGP parameterization in our mid-latitude study area to study areas with different climatic conditions, such as semiarid climates, or to other cities with different urban geometries and arrangements to better evaluate the usability of GGPs for future urban planning.
The exact version (V 5.1.2 Compatibility Release) of the ENVI-met model used for this paper, the parameterizations and the input data to run the ENVI-met model and to reproduce the model outputs of all the performed scenario simulations shown in this paper, and all the scripts for post-processing of the model output data needed to derive the results presented in this paper are permanently archived as supplementary material files in the Zenodo repository at https://doi.org/10.5281/zenodo.10966370 (Eingrüber et al., 2024b).
The supplement related to this article is available online at: https://doi.org/10.5194/gmd-18-141-2025-supplement.
NE developed the model domain and set up the ENVI-met microclimate model for the study area. AD performed the field measurements in the study area for the GGP parameterization and statistically analysed the simulation outputs. KS and WK supported in the implementation of the modelling concept and data analyses. NE and AD prepared the draft of the article. KS and WK participated in writing and supervising the work. All authors read and accepted the article for submission.
The contact author has declared that none of the authors has any competing interests.
Publisher's note: Copernicus Publications remains neutral with regard to jurisdictional claims made in the text, published maps, institutional affiliations, or any other geographical representation in this paper. While Copernicus Publications makes every effort to include appropriate place names, the final responsibility lies with the authors.
We would like to thank all citizen scientists and local cooperation partners within the study area who made it possible to carry out our measurements in private spaces. We acknowledge partial financial support for the project from the Gesellschaft für Erdkunde zu Köln (GfE) and financing of the article processing charge from the German Research Foundation (DFG; grant no. 491454339).
We received partial financial support for the project from the Gesellschaft für Erdkunde zu Köln (GfE) and financing of the article processing charge from the German Research Foundation (DFG; grant no. 491454339).
This open-access publication was funded by Universität zu Köln.
This paper was edited by Mohamed Salim and reviewed by three anonymous referees.
Anders, J., Schubert, S., Sauter, T., Tunn, S., Schneider, C., and Salim, M.: Modelling the impact of an urban development project on microclimate and outdoor thermal comfort in a mid-latitude city, Energ. Buildings, 296, 113324, https://doi.org/10.1016/j.enbuild.2023.113324, 2023.
Balany, F., Ng, A. W. M., Muttil, N., Muthukumaran, S., and Wong, M. S.: Green Infrastructure as an Urban Heat Island Mitigation Strategy – A Review, Water, 12, 3577, https://doi.org/10.3390/w12123577, 2020.
Battista, G., de Lieto Vollaro, E., Evangelisti, L., and de Lieto Vollaro, R.: Urban Overheating Mitigation Strategies Opportunities: A Case Study of a Square in Rome (Italy), Sustainability, 14, 16939, https://doi.org/10.3390/su142416939, 2022.
Battisti, A., Laureti, F., Zinzi, M., and Volpicelli, G.: Climate Mitigation and Adaptation Strategies for Roofs and Pavements: A Case Study at Sapienza University Campus, Sustainability, 10, 3788, https://doi.org/10.3390/su10103788, 2018.
Bean, E. Z., Hunt, W. F., and Bidelspach, D. A.: Evaluation of Four Permeable Pavement Sites in Eastern North Carolina for Runoff Reduction and Water Quality Impacts, J. Irrig. Drain. E., 133, 583–592, https://doi.org/10.1061/(ASCE)0733-9437(2007)133:6(583), 2007.
Böttcher, M.: Selected climate mitigation and adaptation measures and their impact on the climate of the region of Hamburg, Doctoral dissertation, Staats-und Universitätsbibliothek Hamburg Carl von Ossietzky, 2017.
Bröde, P., Fiala, D., Blazejczyl, K., Holmer, I., Jendritzky, G., Kampmann, B., Tinz, B., and Havenith, G.: Deriving the operational procedure for the Universal Thermal Climate Index (UTCI), Int. J. Biometeorol., 56, 481–494, 2011.
Bruse, M., Simon, H. and Sinsel, T.: ENVI-met 5.0: updated model overview, University of Bochum, http://www.envi-met.com (last access: 30 April 2024), 2022.
Das, B. M.: Hydraulic conductivity, in: Principles of Geotechnical Engineering, 7th edn., Cengage Learning, Stamford, ISBN-13 978-0-495-41130-7, 2010.
Del Serrone, G., Peluso, P., and Moretti, L.: Evaluation of Microclimate Benefits Due to Cool Pavements and Green Infrastructures on Urban Heat Islands, Atmosphere, 13, 1586, https://doi.org/10.3390/atmos13101586, 2022.
Demuzere, M., Kittner, J., Martilli, A., Mills, G., Moede, C., Stewart, I. D., van Vliet, J., and Bechtel, B.: A global map of local climate zones to support earth system modelling and urban-scale environmental science, Earth Syst. Sci. Data, 14, 3835–3873, https://doi.org/10.5194/essd-14-3835-2022, 2022.
Eijkelkamp: 09.04 Doppelring-Infiltrometer Gebrauchsanweisung, Eijkelkamp, Giesbeek, https://geotechnik-shop.de/WebRoot/Store22/Shops/48ba4854-b193-4bce-af16-f28523b06652/MediaGallery/Gebrauchsanweisungen/Doppel-Ringinfiltrometer.pdf (last access: 30 April 2024), 2012.
Eingrüber, N. and Korres, W.: Climate change simulation and trend analysis of extreme precipitation and floods in the mesoscale Rur catchment in western Germany until 2099 using Statistical Downscaling Model (SDSM) and the Soil & Water Assessment Tool (SWAT model), Sci. Total Environ., 838P1, 155775, https://doi.org/10.1016/j.scitotenv.2022.155775, 2022.
Eingrüber, N., Korres, W., and Schneider, K.: Pathways for climate change adaptation in urban areas – first results from field measurements and ENVI-met modeling, EMS Annual Meeting 2021, online, 6–10 September 2021, EMS2021-374, https://doi.org/10.5194/ems2021-374, 2021.
Eingrüber, N., Korres, W., and Schneider, K.: Microclimatic field measurements to support microclimatological modelling with ENVI-met for an urban study area in Cologne, Adv. Sci. Res., 19, 81–90, https://doi.org/10.5194/asr-19-81-2022, 2022a.
Eingrüber, N., Schneider, K., Korres, W., and Löhnert, U.: Sensitivity analyses and validation of an ENVI-met microclimate model for a greened urban study area in Cologne Südstadt under various typical weather conditions, EMS Annual Meeting 2022, Bonn, Germany, 5–9 September 2022, EMS2022-42, https://doi.org/10.5194/ems2022-42, 2022b.
Eingrüber, N., Korres, W., Löhnert, U., and Schneider, K.: Investigation of the ENVI-met model sensitivity to different wind direction forcing data in a heterogeneous urban environment, Adv. Sci. Res., 20, 65–71, https://doi.org/10.5194/asr-20-65-2023, 2023a.
Eingrüber, N., Krekeler, C., Korres, W., Löhnert, U., and Schneider, K.: High-Resolution Microclimate Modelling to Evaluate Urban Heat Mitigation Potentials of Rainfed Climate Change Adaptation Measures on Buildings under Various Climatic Conditions, AGU Fall Meeting 2023, San Francisco, CA, USA, 11–15 December 2023, H23V-1850, https://doi.org/10.22541/essoar.171052572.20758573/v1, 2023b.
Eingrüber, N., Schneider, K., and Korres, W.: Evaluation of microclimatic variations and adaptation effects in a central European city during the most excessive heat wave in summer 2022 by ENVI-met modelling, EGU General Assembly 2023, Vienna, Austria, 24–28 April 2023, EGU23-11806, https://doi.org/10.5194/egusphere-egu23-11806, 2023c.
Eingrüber, N., Berg, P., Korres, W., Löhnert, U., and Schneider, K: Parameterization and Validation of a High-Resolution Microclimate Model to Identify Temperature Patterns in a Climate Change Adapted Urban High-Density Area, available at SSRN, 4912045, https://doi.org/10.2139/ssrn.4912045, 2024a.
Eingrüber, N., Domm, A., Korres, W., and Schneider, K.: Parameterization of grass grid pavers for urban microclimate modelling to simulate the heat mitigation potential of unsealing measures in cities (1.1), Zenodo [code and data set], https://doi.org/10.5281/zenodo.10966370, 2024b.
Eingrüber, N., Korres, W., and Schneider, K.: Comparison of heat mitigation effects of blue roofs and green roofs on building wall temperature and thermal outdoor comfort based on scenario analyses using 3D microclimate modelling for a dense urban district , EGU General Assembly 2024, Vienna, Austria, 14–19 April 2024, EGU24-9967, https://doi.org/10.5194/egusphere-egu24-9967, 2024c.
Eingrüber, N., Schneider, K., Nehren, U., and Dlugoß, V.: Climate change adaptation through citizen participation: Simulation of the effect of willingness to act on the heat mitigation potential in urban neighborhoods with different social milieu composition , EMS Annual Meeting 2024, Barcelona, Spain, 1–6 September 2024, EMS2024-547, https://doi.org/10.5194/ems2024-547, 2024d.
ENVI-met GmbH: ENVI_MET Software Versions, https://envi-met.info/doku.php?id=files:downloadv4 (last access: 30 April 2024), 2023.
Eyring, V., Gilette, N. P., Achuta Rao, K. M., Barimalala, R., Barreiro Parrillo, M., Bellouin, N., Cassou, C., Durack, P. J., Kosaka, Y., McGregor, S., Min, S., Morgenstern, O., and Sun, Y.: Human Influence on the Climate System, in: Climate Change 2021 – The Physical Science Basis: Working Group I Contribution to the Sixth Assessment Report of the Intergovernmental Panel on Climate Change, Cambridge University Press, 423–552, https://doi.org/10.1017/9781009157896.005, 2021.
Fini, A., Frangi, P., Mori, J., Donzelli, D., and Ferrini, F.: Nature based solutions to mitigate soil sealing in urban areas: Results from a 4-year study comparing permeable, porous, and impermeable pavements, Environ. Res., 156, 443–454, https://doi.org/10.1016/j.envres.2017.03.032, 2017.
Freeze, A. and Cherry, J.: Groundwater, Prentice-Hall, Englewood Cliffs, Jersey, ISBN-13 9780133653120, 1979.
Gui, J., Phelan, P. E., Kaloush, K. E., and Golden, J. S.: Impact of Pavement Thermophysical Properties on Surface Temperatures, J. Mater. Civil Eng., 19, 683–690, https://doi.org/10.1061/(ASCE)0899-1561(2007)19:8(683), 2007.
Hoffmann, C. and Geissler, A.: Baumaterialien für Städte im Klimawandel Materialkatalog mit Empfehlungen, Bundesamt für Wohnungswesen, Basel, https://www.bwo.admin.ch/bwo/de/home/wie-wir-wohnen/umwelt/publikationen-bwo/baumaterialien.html (last access: 30 April 2024), 2022.
Höppe, P.: The physiological equivalent temperature – a universal index for the biometeorological assessment of the thermal environment, Int. J. Biometeorol., 43, 71–75, 1999.
Huang, J.-M. and Chen, L.-C.: A Numerical Study on Mitigation Strategies of Urban Heat Islands in a Tropical Megacity: A Case Study in Kaohsiung City, Taiwan, Sustainability, 12, 3952, https://doi.org/10.3390/su12103952, 2020.
Hunt, W. F. and Collins, K. A.: Permeable Pavement: Research Update and Design Implications, Urban Waterways, North Carolina Cooperative Extension Service, https://nacto.org/docs/usdg/urban_waterways_permeable_pavement_hunt.pdf (last access: 30 April 2024), 2008.
ICPI: Tech Spec 8, Concrete Grid Pavements, Interlocking Concrete Pavement Institute (ICPI), https://www.orco.com/wp-content/uploads/2020/05/ICPI_Tech_Spec_8_Feb_20.pdf (last access: 30 April 2024), 2020.
Jia, S. and Wang, Y.: Effect of heat mitigation strategies on thermal environment, thermal comfort, and walkability: A case study in Hong Kong, Build. Environ., 201, 107988, https://doi.org/10.1016/j.buildenv.2021.107988, 2021.
Kleerekoper, L., van Esch, M., and Salcedo, T. B.: How to make a city climate-proof, addressing the urban heat island effect, Resour. Conserv. Recy., 64, 30–38, https://doi.org/10.1016/j.resconrec.2011.06.004, 2012.
Kousis, I. and Pisello, A. L.: Evaluating the performance of cool pavements for urban heat island mitigation under realistic conditions: A systematic review and meta-analysis, Urb. Clim., 49, 101470, https://doi.org/10.1016/j.uclim.2023.101470, 2023.
LANUV: Klimawandelgerechte Metropole Köln. Abschlussbericht, Landesamt für Natur, Umwelt und Verbraucherschutz Nordrhein-Westfalen, Recklinghausen, https://www.lanuv.nrw.de/fileadmin/lanuvpubl/3_fachberichte/30050.pdf (last access: 30 April 2024), 2013.
Lee, H., Mayer, H., and Chen, L.: Contribution of trees and grasslands to the mitigation of human heat stress in a residential district of Freiburg, Southwest Germany, Landscape Urban Plan., 148, 37–50, https://doi.org/10.1016/j.landurbplan.2015.12.004, 2016.
Lin, J. D., Hsu, C. Y., Citraningrum, A., and Adhitana, P.: The Impact of Different Types of Permeable Pavement Utilization on Air Temperature above the Pavement, Adv, Mater, Res,, 723, 678–685, https://doi.org/10.4028/www.scientific.net/AMR.723.678, 2013.
Manteghi, G. and Tasneem, M.: Evaporative Pavements as an Urban Heat Island (UHI) Mitigation Strategy: A Review, International Transaction Journal of Engineering, Management, & Applied Sciences & Technologies, 11, 1–15, https://doi.org/10.14456/ITJEMAST.2020.17, 2020.
Maronga, B., Banzhaf, S., Burmeister, C., Esch, T., Forkel, R., Fröhlich, D., Fuka, V., Gehrke, K. F., Geletič, J., Giersch, S., Gronemeier, T., Groß, G., Heldens, W., Hellsten, A., Hoffmann, F., Inagaki, A., Kadasch, E., Kanani-Sühring, F., Ketelsen, K., Khan, B. A., Knigge, C., Knoop, H., Krč, P., Kurppa, M., Maamari, H., Matzarakis, A., Mauder, M., Pallasch, M., Pavlik, D., Pfafferott, J., Resler, J., Rissmann, S., Russo, E., Salim, M., Schrempf, M., Schwenkel, J., Seckmeyer, G., Schubert, S., Sühring, M., von Tils, R., Vollmer, L., Ward, S., Witha, B., Wurps, H., Zeidler, J., and Raasch, S.: Overview of the PALM model system 6.0, Geosci. Model Dev., 13, 1335–1372, https://doi.org/10.5194/gmd-13-1335-2020, 2020.
Middel, A., Al Khaled, S., Schneider, F. A., Hagen, B., and Coseo, P.: 50 grades of shade, B. Am. Meteorol. Soc., 102, E1805–E1820, https://doi.org/10.1175/BAMS-D-20-0193.1, 2021.
Moretti, L., Di Mascio, P., and Fusco, C.: Porous Concrete for Pedestrian Pavements, Water, 11, 2105, https://doi.org/10.3390/w11102105, 2019.
Mullaney, J. and Lucke, T.: Practical Review of Pervious Pavement Designs, Clean Soil Air Water, 42, 111–124, https://doi.org/10.1002/clen.201300118, 2014.
Nwakaire, C., Onn, C., Soon Poh, Y., Yuen, C. W., and Onodagu, P.: Urban Heat Island Studies with emphasis on urban pavements: A review, Sustain. Cities Soc., 63, 102476, https://doi.org/10.1016/j.scs.2020.102476, 2020.
Oke, T. R.: The energetic basis of the urban heat island, Q. J. Roy. Meteor. Soc., 108, 1–24, https://doi.org/10.1002/qj.49710845502, 1982.
Oke, T. R., Mills, G., Christen, A., and Voogt, J. A.: Urban Climates, Cambridge University Press, Cambridge, https://doi.org/10.1017/9781139016476, 2017.
Pannicke-Prochnow, N., Krohn, C., Albrecht, D. J., and Thinius, K.: Bessere Nutzung von Entsiegelungspotenzialen zur Wiederherstellung von Bodenfunktionen und zur Klimaanpassung, Umweltbundesamt, Dessau-Roßlau, https://www.umweltbundesamt.de/sites/default/files/medien/479/ publikationen/texte_141-2021_bessere_nutzung_von_ entsiegelungspotenzialen_zur_wiederherstellung_von_boden funktionen_und_zur_klimaanpassung.pdf (last access: 30 April 2024), 2021.
Parker, D. E.: Urban heat island effects on estimates of observed climate change, WIREs Climate Change, 1, 123–133, https://doi.org/10.1002/wcc.21, 2010.
Peluso, P., Persichetti, G., and Moretti, L.: Effectiveness of Road Cool Pavements, Greenery, and Canopies to Reduce the Urban Heat Island Effects, Sustainability, 14, 16027, https://doi.org/10.3390/su142316027, 2022.
Qin, Y.: A review on the development of cool pavements to mitigate urban heat island effect, Renewable and Sustainable Energy Reviews, 52, 445–459, https://doi.org/10.1016/j.rser.2015.07.177, 2015.
R Core Team: R: A language and environment for statistical computing. R Foundation for Statistical Computing, Version R-4.3.0, https://www.r-project.org/ (last access: 30 April 2024), 2022.
Rezk, K.: Computational Parametric Assessment of Desealing Measures in the Urban Domain, Technische Universität Wien, https://doi.org/10.34726/hss.2021.85327, 2021.
Saito, K., Said, I., and Shinozaki, M.: Scenario-based application of neighborhood greening methods towards mitigating urban heat environment in a world heritage site – Malacca, Malaysia, The 13th International Congress of Asian Planning Schools Association (APSA), 12–14 August 2015, Universiti Teknologi Malaysia, Johor Bahru, http://eprints.utm.my/61439/1/Scenario-BasedApplicationOfNeighborhoodIsmailSaid2015_GreeningMethodsTowardsMitigatingUrbanHeatEnvironment.pdf (last access: 27 January 2024), 2015.
Salim, M. H., Schlünzen, K. H., Grawe, D., Boettcher, M., Gierisch, A. M. U., and Fock, B. H.: The microscale obstacle-resolving meteorological model MITRAS v2.0: model theory, Geosci. Model Dev., 11, 3427–3445, https://doi.org/10.5194/gmd-11-3427-2018, 2018.
Santamouris, M.: Using cool pavements as a mitigation strategy to fight urban heat island – A review of the actual developments, Renewable and Sustain. Energ. Rev., 26, 224–240, https://doi.org/10.1016/j.rser.2013.05.047, 2013.
Santos, P. M. D. and Júlio, E. N. B. S.: A state-of-the-art review on roughness quantification methods for concrete surfaces, Construct. Build. Mater., 38, 912–923, https://doi.org/10.1016/j.conbuildmat.2012.09.045, 2013.
Shackelford, C. D.: Geoenvironmental Engineering, in: Reference Module in Earth Systems and Environmental Sciences, Elsevier, ISBN 9780124095489, 2013.
Seifeddine, K., Amziane, S., Toussaint, E., and Ouldboukhitine, S. E.: Review on thermal behavior of cool pavements, Urban Climate, 51, 101667, https://doi.org/10.1016/j.uclim.2023.101667, 2023.
Starke, P., Göbel, P., and Coldewey, W.: Effects on evaporation rates from different water-permeable pavement designs, Water Sci. Technol., 63, 2619–2627, https://doi.org/10.2166/wst.2011.168, 2011.
Takebayashi, H. and Moriyama, M.: Study on the urban heat island mitigation effect achieved by converting to grass-covered parking, Solar Energy, 83, 1211–1223, https://doi.org/10.1016/j.solener.2009.01.019, 2009.
Teoh, M.-Y., Shinozaki, M., Saito, K., and Said, I.: Developing climate-led landscapes and greenery in urban design: a case study at Ipoh, Malaysia, J. Asian Archit. Build., 21, 1640–1656, https://doi.org/10.1080/13467581.2021.1942881, 2022.
Tsoka, S., Tsikaloudaki, K., Theodosiou, T., and Bikas, D.: Urban Warming and Cities' Microclimates: Investigation Methods and Mitigation Strategies – A Review, Energies, 13, 1414, https://doi.org/10.3390/en13061414, 2020.
Vernier: Pyranometer (PYR-BTA), Vernier, Beaverton, https://www.vernier.com/files/manuals/pyr-bta.pdf (last access: 30 April 2024), 2012.
Wang, C., Wang, Z.-H., Kaloush, K. E., and Shacat, J.: Cool pavements for urban heat island mitigation: A synthetic review, Renew. Sustain. Energ. Rev., 146, 111171, https://doi.org/10.1016/j.rser.2021.111171, 2021.
Wilke, S.: Bodenversiegelung, Umweltbundesamt, https://www.umweltbundesamt.de/daten/flaeche-boden-land-oekosysteme/boden/bodenversiegelung (last access: 30 April 2024), 2022.


