the Creative Commons Attribution 4.0 License.
the Creative Commons Attribution 4.0 License.
 | 03 Mar 2025
T&C-CROP: representing mechanistic crop growth with a terrestrial biosphere model (T&C, v1.5) – model formulation and validation
Jordi Buckley Paules
Simone Fatichi
Bonnie Warring
Athanasios Paschalis
Cropland cultivation is fundamental to food security and plays a crucial role in the global water, energy, and carbon cycles. However, our understanding of how climate change will impact cropland functions is still limited. This knowledge gap is partly due to the simplifications made in terrestrial biosphere models (TBMs), which often overlook essential agricultural management practices such as irrigation and fertilizer application and simplify critical physiological crop processes.
Here, we demonstrate how, with minor, parsimonious enhancements to the TBM T&C, it is possible to accurately represent a complex cropland system. Our modified model, T&C-CROP, incorporates realistic agricultural management practices, including complex crop rotations and irrigation and fertilization regimes, along with their effects on soil biogeochemical cycling. We successfully validate T&C-CROP across four distinct agricultural sites, encompassing diverse cropping systems such as multi-crop rotations, monoculture, and managed grassland.
A comprehensive validation of T&C-CROP was conducted, encompassing water, energy, and carbon fluxes; leaf area index (LAI); and organ-specific yields. Our model effectively captured the heterogeneity in daily land surface energy balances across crop sites, achieving coefficients of determination of 0.77, 0.48, and 0.87 for observed versus simulated net radiation (Rn), sensible heat flux (H), and latent heat flux (LE), respectively. Seasonal, crop-specific gross primary production (GPP) was simulated with an average absolute bias of less than 10 %. Peak-season LAI was accurately represented, with an r2 of 0.67. Harvested yields (above-ground biomass, grain, and straw) were generally simulated within 10 %–20 % accuracy of observed values, although inter-annual variations in crop-specific growth were difficult to capture.
- Article
(2882 KB) - Full-text XML
-
Supplement
(943 KB) - BibTeX
- EndNote


1.1 Climate change, food security, and the need for process-based crop models
Understanding the impact of weather and field management on cropland productivity is critical, not least in the face of mounting challenges such as anthropogenic climate change and shifting socio-demographics (Godfray et al., 2010; Foley et al., 2011; FAO et al., 2022; Cammarano et al., 2022; Wang et al., 2022). The effects of climate change on both local and global agri-food systems are expected to increase, with shifts in the frequency, intensity, and timing of droughts and heatwaves, all of which pose real threats to crop growth (Dury et al., 2019; Ortiz-Bobea et al., 2021; FAO et al., 2022; Kim and Mendelsohn, 2023). The effects of climate change on agriculture are set to vary spatially, with a large degree of heterogeneity between regions (Semenov, 2009; Waha et al., 2013; Ukkola et al., 2020; Moustakis et al., 2021; Slater et al., 2022). Therefore, mitigation efforts will demand a nuanced understanding of processes; causes; and, ultimately, effects. For example, as a function of anthropogenic emissions, global CO2 is rising roughly uniformly; however, its effect on crop growth dynamics, termed the CO2 fertilization effect, is likely to vary regionally (McGrath and Lobell, 2013), likely due to complex non-linear interactions between CO2, temperature, water, and nutrient availability. Processes such as the above make the study of climate–crop interactions particularly interesting and complex (Lawlor and Mitchell, 1991; Polley, 2002; Fatichi et al., 2016; Cernusak, 2020; Hussain et al., 2021).
One way to address the challenges climate change poses to crops is to deepen our understanding of climate–crop interactions and their interface with field management practices through the development of process-based models. A particular strength of this approach is its potential to enhance our understanding and forecasting capabilities beyond current or past observations (Boote et al., 2013; Muller and Martre, 2019). Such research is vital to align agronomic strategies with societal food demands, all whilst promoting environmental sustainability, as emphasized by Cassman and Grassini (2020).
1.2 Crop model diversity, strengths, and limitations
A vast array of models have been developed to capture the interactions between soil, crops, climate, and field management practices. It is possible to lump these models into one of three categories; statistical, conceptual, or physics-based. Statistical models are entirely data driven and contain little to no pre-conceived representation of physical processes; they rely on historical data to establish statistical relationships between crop yield and climate variables (e.g. Lobell and Burke, 2010; Gaupp et al., 2019; Van Klompenburg et al., 2020; Ansarifar et al., 2021; Slater et al., 2022). Conceptual models represent key physical processes in a simplified fashion which can then be parameterized or calibrated to best fit observational data; an example is AquaCrop (Steduto et al., 2009), but many other crop models have been developed with this approach (Di Paola et al., 2016). Physics-based models codify state-of-the-art understanding of physical laws, such as conservation of energy, water, carbon, and momentum, into a crop modelling framework. Examples of this include CLM-CROP (Drewniak et al., 2013; Bilionis et al., 2014; Sheng et al., 2018; Boas et al. 2021), JULES-crop (Osborne et al., 2015; Williams et al., 2017), GECROS (Ingwersen et al., 2018), or ORCHIDEE-CROP (Wu et al., 2016). These physics-based models are built on the latest scientific understanding of soil–plant–atmosphere interactions. They start by resolving photosynthesis and plant energy budgets and incorporate key processes such as water and nutrient uptake, crop phenology, and carbon allocation schemes (Fatichi et al., 2019; He et al., 2021; Wiltshire et al., 2021). A comprehensive review on the respective limitations of different modelling frameworks is provided by Roberts et al. (2017). Comparative studies have shown that, in terms of yield prediction, process-based models are currently less effective than their statistical counterparts (Leng and Hall, 2020). This may be attributed to the higher complexity of physics-based models, where yield is the by-product of multiple processes, and to current data limitations that hinder the proper parameterization and calibration of these models (He et al., 2017).
The following question thus arises: why prioritize further development of physics-based models in agricultural research? Firstly, physics-based models address several limitations inherent to statistical crop models. These limitations include issues such as multicollinearity between climate variables and yield, as well as lack of potential generalizability beyond their calibration envelope. This latter point is crucial as statistical models rely on historical climate–yield relationships which may not hold true under future climates (Sheehy et al., 2006; Boote et al 2013; Lobell and Asseng, 2017). Secondly, physics-based models offer explicit representation of coupled dynamics, including water, carbon, and nutrient cycles. These dynamics are expected to be significantly impacted by climate change, making our understanding of them crucial for accurate crop yield projections and sustainable agricultural management. Lastly, whilst physics-based models do currently face challenges due to data requirements, such as climate forcing and crop-specific traits, this obstacle is expected to diminish over time. The integration of evolving plant databases, such as the TRY database (Kattge et al., 2020), and advancements in remote sensing technologies (Khanal et al., 2020; Wu et al., 2023) are anticipated to yield more comprehensive datasets. This increasing availability of data is likely to enhance the effectiveness and reliability of future physics-based crop models.
1.3 Space for a new TBM crop model – needed developments
In a bid to better capture the intricacies of cropland dynamics, various previous studies have further developed existing terrestrial biosphere models (TBMs) akin to T&C (Fatichi et al., 2012, 2019). Examples include JULES-crop (Osborne et al., 2015), CLM-Crop (Drewniak et al., 2013; Bilionis et al., 2015; Sheng et al., 2018; Boas et al., 2021), ORCHIDEE-Crop (Wu et al., 2016), and CARAIB DGVM (Jacquemin et al., 2021). Commonly, model developments in the context of TBMs centre on the introduction of new crop-specific modules, which incorporate crop-specific carbon pools and dynamics alongside harvest indexes and management options. While these past endeavours represent a significant step forward, they often introduce multiple modifications that may not generalize well.
Despite these advancements, there remains a need to improve the integration of crop management practices such as sowing, harvesting, irrigation, and fertilizer application within TBMs. This would more comprehensively capture the coupled dynamics of plant growth and soil biogeochemical cycles, as influenced by crop nutrient uptake and the timing and quantity of NPK fertilizer application. For example, previous work with JULES-crop (2014) omitted nutrient limitations, while ORCHIDEE-Crop (Wu et al., 2016) addressed nutrient limitation via a simple empirical 0–1 index limiting crop growth. Furthermore, irrigation practices need better incorporation; ORCHIDEE-Crop (Wu et al., 2016) omitted irrigation, while JULES-crop (Williams et al., 2017) assumed perfect irrigation, neglecting soil moisture as a crop growth stress factor. Additionally, there is a need to transition from empirical harvest indices or harvest-specific carbon pools to a fully integrated mechanistic approach, whereby crop yield is derived from generalizable organ-specific carbon pools being harvested.
Most importantly, the goal of introducing crops into terrestrial biosphere models (TBMs) should be to do so with minimal changes to the existing model structure for natural vegetation as most physical and biophysical processes are similar. We argue that this can be accomplished without adding additional carbon pools and/or without extensive model modifications and parameter additions. The aim is to demonstrate that accurate crop representation within a TBM can be achieved in a parsimonious manner, avoiding the need for crop-specific parameterizations that are difficult to generalize. This approach differentiates our model from previous formulations.
Our study introduces T&C-CROP to address the aforementioned challenges, building on the success of previous terrestrial biosphere models (TBMs). Previous developments to T&C (Fatichi et al., 2012, 2019) have ensured that an effective representation of crops, irrigation, and fertilizer application can now be seamlessly integrated into the established vegetation carbon pool dynamics. This integration links agricultural practices with water and energy budgets, plant growth development, and soil biogeochemical cycling. All enhancements of the original T&C model, made to better represent crop processes, revolve around minimal structural changes. Specifically, only three new parameters are added to the original model, along with prescribed irrigation, fertilizer, and sowing and/or harvesting dates.
To assess the effectiveness of T&C-CROP, we evaluated model performance in terms of energy, water, and carbon fluxes with on-site eddy covariance data and benchmarked it against other TBMs with dedicated crop-specific modules at the same sites. We also assessed T&C-CROP's skill in predicting crop yields, specifically examining carbon allocation to various pools, making good use of detailed harvest data available across the selected sites. The evaluation covers four fields which employ varied management strategies and operate in diverse climates.
2.1 Overview of T&C
T&C is a state-of-the-art terrestrial biosphere model (Fatichi et al., 2012, 2019) which resolves the land surface energy balance, water balance, and soil C–N–P–K dynamics. T&C has been successfully used in several ecosystems globally, covering a wide range of scenarios – for example, assessing the impacts of fertilization on grassland productivity in the European Alps (Botter et al., 2021) or assessing ecohydrological changes after tropical conversion to oil palm (Manoli et al., 2018). T&C operates across various timescales, tailoring its resolution to the specific process being resolved. Specifically, the energy budget is resolved at hourly scales; water and photosynthesis are computed at the hourly scale, with the exception of soil water flow, which uses an adaptive sub-hourly step; and vegetation carbon pools and soil C–N–P–K dynamics are resolved at the daily scale. Inputs consist of hourly meteorological data (precipitation, temperature, wind speed, atmospheric pressure, relative humidity, shortwave and longwave radiation, atmospheric CO2 concentration). Site parameterization requires site-specific information, including soil texture, and plant-specific traits for tailoring the dynamic vegetation component. T&C does not use predefined plant functional types but rather focuses on specific vegetation types (e.g. conifer, oak, grassland, palm) and thus requires the model user to input parameter values based on the particular vegetation type being simulated. T&C can be run as a plot-scale version, i.e. without an explicit treatment of the topography and lateral fluxes (e.g. Paschalis et al., 2017; Manoli et al., 2018, and this study), or, alternatively, in a spatially explicit manner (i.e. as a fully distributed model defined on a regular 2D mesh), which accounts for complex topography by considering local and remote solar radiation shading effects and lateral transfer of water in the surface and subsurface (e.g. Paschalis et al., 2017; Mastrotheodoros et al., 2020; Paschalis et al., 2022).
The hydrological module of T&C is physics-based and models interception, throughfall, canopy water storage, runoff, and soil water dynamics, as well as snow and ice hydrology. Soil water dynamics are represented in the point-scale simulations via the 1-D Richards equation. In this study, soil hydraulic conductivity and the shape of the water retention curve are estimated based on user-defined soil texture following the Saxton and Rawls pedotransfer function (Saxton and Rawls, 2006; Paschalis et al., 2022). However, T&C can also use custom water retention curves, including the van Genuchten model, and more complex soil hydraulic functions accounting for soil structural effects (Fatichi et al., 2020). Plant water uptake is simulated using a sink term, with plant transpiration uptake thus being proportional to root biomass, which decays exponentially with soil depth. Both saturation and infiltration excess mechanisms are used for runoff generation (Fatichi et al., 2012).
The surface energy balance is resolved by balancing net radiation with latent, sensible, and ground heat fluxes. In T&C, we use the two-stream approximation for estimating net shortwave radiation, with a canopy being split into a sun fraction and a shaded fraction (de Pury and Farquhar, 1997; Wang and Leuning, 1998; Dai et al., 2004). Latent and sensible heat fluxes are parameterized using the resistance analogue, with aerodynamic, leaf boundary layer, stomatal, and under-canopy air resistances, as well as soil resistance, all included (e.g. Leuning, 1995; Niyogi and Raman, 1997; Haghighi et al., 2013; Paschalis et al., 2017).
Plant carbon dynamics in T&C are inspired by Friedlingstein et al. (1998) and Krinner et al. (2005). Vegetation is conceptualized using seven carbon pools for woody vegetation (leaves, living sapwood, heartwood, dead leaves, roots, carbohydrate reserves, and fruits and flowers) and five pools for herbaceous species, with the sapwood and hardwood carbon pools suppressed. Carbon allocation is governed by phenology; environmental stresses; and stoichiometric constraints for C:N, C:P, and C:K ratios across all tissues, which, in turn, depend on the potential of plants to acquire necessary macronutrients (NPK) from the ground via root uptake and mycorrhiza symbiosis. In T&C, for extratropical climates, we have four phenological stages (dormant, maximum and normal growth, and senescence) defined by temperature, day length, water stress, and leaf age. Initially, carbon is assimilated via photosynthesis, which is based on Farquhar et al. (1980) for C3 plants and on Collatz et al. (1991, 1992) for C4 plants, with subsequent adjustments (Bonan et al., 2011), and then scales from the leaf to canopy scale according to a two-big-leaves approach (Wang and Leuning, 1998; Dai et al., 2004). This approach has the benefit of taking into account the vertical distribution of nitrogen and therefore also of photosynthetic capacity. The CAM photosynthetic pathway is currently not considered. Stomatal conductance follows Leuning (1990, 1995) and has recently been adapted to consider plant hydraulics (Paschalis et al., 2024), although this scheme is not considered here. Any assimilated carbon which is not respired via maintenance and growth respiration is subsequently partitioned into one of five carbon pools (foliage, living sapwood, roots, carbohydrate reserves, or fruits and flowers) via an empirical allocation scheme largely based on phenological stages and light and water availability. The translocation of carbon between pools is also considered, enabling the depletion of carbon stored as reserves. This better represents the responses of vegetation to stress and changes in phenological stages. Details of plant phenology dynamics are outlined in the Supplement of Fatichi et al. (2012).
The latest version of T&C includes soil carbon and nutrient (nitrogen, phosphorus, and potassium) dynamics (Fatichi et al., 2019). Options for anthropogenic nutrient application (fertilizer) in both mineral and organic forms have been added (Botter et al., 2021). Leaching of dissolved nutrients is also computed by coupling soil biogeochemistry with T&C's soil hydrology module. Specifically, the biogeochemistry module separates plant litter into different pools based on decomposability recalcitrance and accounts for different soil organic carbon functional pools as mineral-associated, particulate, and dissolved organic carbon. Its decomposition and/or mineralization depend on the activities of microbial biomass separated between bacteria, fungi, and macrofauna in the soil. NPK cycles (including fertilizer application) are linked to microbial dynamics and, naturally, plant growth. A comprehensive outline of T&C soil biogeochemistry is provided by Fatichi et al. (2019) and Botter et al. (2021).
2.2 From T&C to T&C-CROP
T&C-CROP adds parameterizations designed to enhance the representation of crops within the T&C model, improving its ability to simulate crop vegetation dynamics. Our approach aimed to be as parsimonious as possible, limiting complexities which are often part of crop implementations in process-based models (e.g. Ingwersen et al., 2018). The T&C model structure was modified to better tailor the specific leaf area, carbon allocation, leaf turnover, and photosynthetic efficiency of senesced leaves to crop conditions. It was possible to achieve this by only adding three new crop-specific parameters (outlined below). Model developments are visually outlined in Fig. 1 and are further discussed in this section.
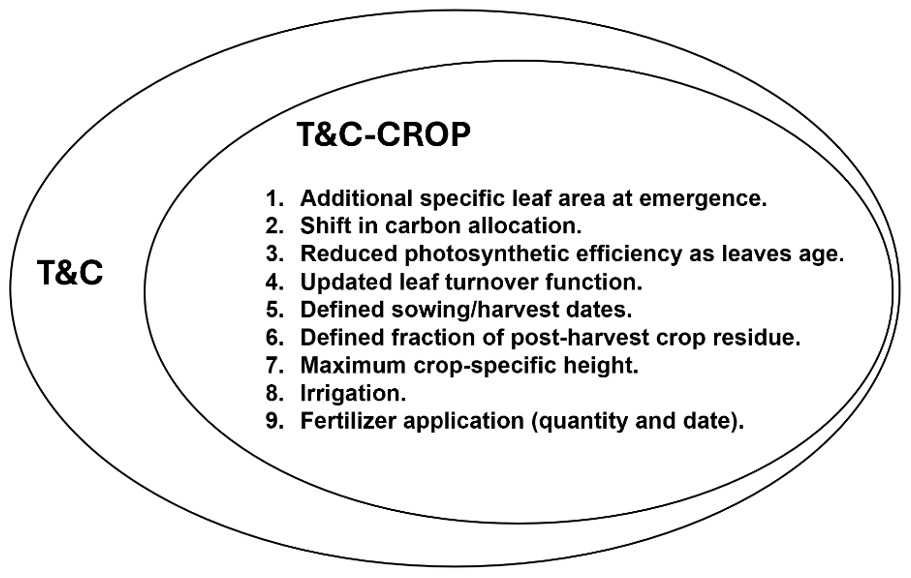
Figure 1Illustrating model developments implemented into the pre-existing T&C model structure in order to develop T&C-CROP.
Crops, like many plants, exhibit changes in their specific leaf area (SLA) over time (Amanullah, 2015; Li et al., 2023), defined as the leaf area divided by its dry weight (m2 kg−1). Early in their growth stages, leaves tend to have a higher SLA, indicating thinner and cheaper leaves that facilitate rapid expansion of the leaf canopy and higher photosynthetic rates for invested carbon, essential for early plant growth post-germination. However, as leaves age, they typically become thicker, resulting in a lower SLA. To better capture this phenomenon and align with observed trends, we have implemented a dynamic SLA in T&C-CROP. This dynamic SLA is modelled with a linearly decaying rate from an initial maximum SLA until the leaf age reaches the value of the phenological stage of maximum growth, beyond which SLA retains a constant value.
Here, SLA represents the fully grown crop's static specific leaf area (m2 gC−1); ageL denotes the age of the leaf in days; SLemercrop is a new parameter representing the additional SLA at emergence, which can be crop-dependent; and dmg signifies the days of maximum leaf growth during the phenology stage, which is a model parameter. Variable names are intentionally kept identical to model parameters in T&C, which can be accessed from our repository (see “Code and data availability” section).
We also aimed to enhance the portrayal of the initial leaf-flushing period. At the onset of crop growth, carbon allocation to fruits and flowers is impeded, with newly assimilated carbon instead being directed towards leaf development. As the initial leaf flush concludes, carbon allocation shifts predominantly towards the fruit and flower pool, with a reference value allocation fraction ffr (–) to this pool, which is significantly higher than for natural vegetation, while allocation to living sapwood is reduced or nullified if the crop does not have a stem component through the use of a new crop-specific parameter socrop (–), which is the carbon allocation fraction to the stem. These values can be user-defined and crop-specific, but generally, for crops, ffr is on the order of 0.2–0.5, and socrop is on the order of 0.0–0.1.
Typically, photosynthetic efficiency decreases as leaves age. For example, this is the case with wheat (Suzuki et al., 1987). To replicate the rapid drop in late-season photosynthesis of senesced leaves, once a leaf's age exceeds a critical threshold (age_cr), the photosynthetic efficiency is reduced as a power law (power of minus 8) of the relative age (rage), where rage is the relative time from leaf onset taken to exceed age_cr.
Additionally, we updated the leaf turnover function, which represents the rate of leaf mortality due to ageing. Our update is illustrated below in Eq. (2), where dla is the leaf death rate (d−1) due to age, age_cr is the critical leaf age (a crop-specific parameter), and AgeL (d) is the current average age of the leaf (a prognostic variable). Previously, T&C applied a linear relation for grass and extratropical evergreen trees and a power law for deciduous tree leaves (Fatichi et al., 2012, 2019). Our modification, in the form of a sigmoidal function (Fig. S1 in the Supplement), ensures that the majority of leaf turnover occurs as leaf age approaches the critical age and completely suppresses leaf mortality in the early phases, which is more realistic for crops.
To enable crop representation in T&C-CROP, we have introduced the option of user-defined sowing and harvesting dates. In the model, sowing is conceptualized by introducing an initial carbon stock for fine-root biomass and non-structural carbohydrates, comparable to typical seed applications, from which the crops evolve post-germination. Root depth can be parameterized as a function of fine-root biomass and fine-root growth if allometric relationships are available, or it can be kept constant if such knowledge is unavailable. After crop establishment, leaf age or environmental stress can trigger crop senescence before harvesting. Additionally, to accommodate multiple crop management practices, users can define the fraction of the crop left in the field post-harvest. This feature can be tailored to specific crops or management practices, such as leaving stems behind while harvesting only grains. This flexibility allows for a more nuanced representation of different cropping systems and practices within the model.
2.3 Simulation setup
T&C-CROP was run at a plot scale (i.e. neglecting topographic features) and used site-specific hourly meteorological data, re-timed from the half-hourly data available from local weather observations (Table 2). In T&C-CROP, the partitioning of shortwave radiation to direct or diffuse radiation and to different wavelengths, such as photosynthetic active radiation (PAR), was done using REST2, as implemented in AWEGEN (Fatichi et al., 2011; Peleg et al., 2017). Site-specific data, such as the dates of planting, sowing, irrigation, and fertilizer application and soil type, were obtained either from the available literature (references in Table 2) or directly from the site's principal investigator (PI). To balance the soil carbon and nitrogen pools, an appropriate spin-up was run; the length required to reach a dynamic steady state was site-dependent but normally on the order of 200 years.
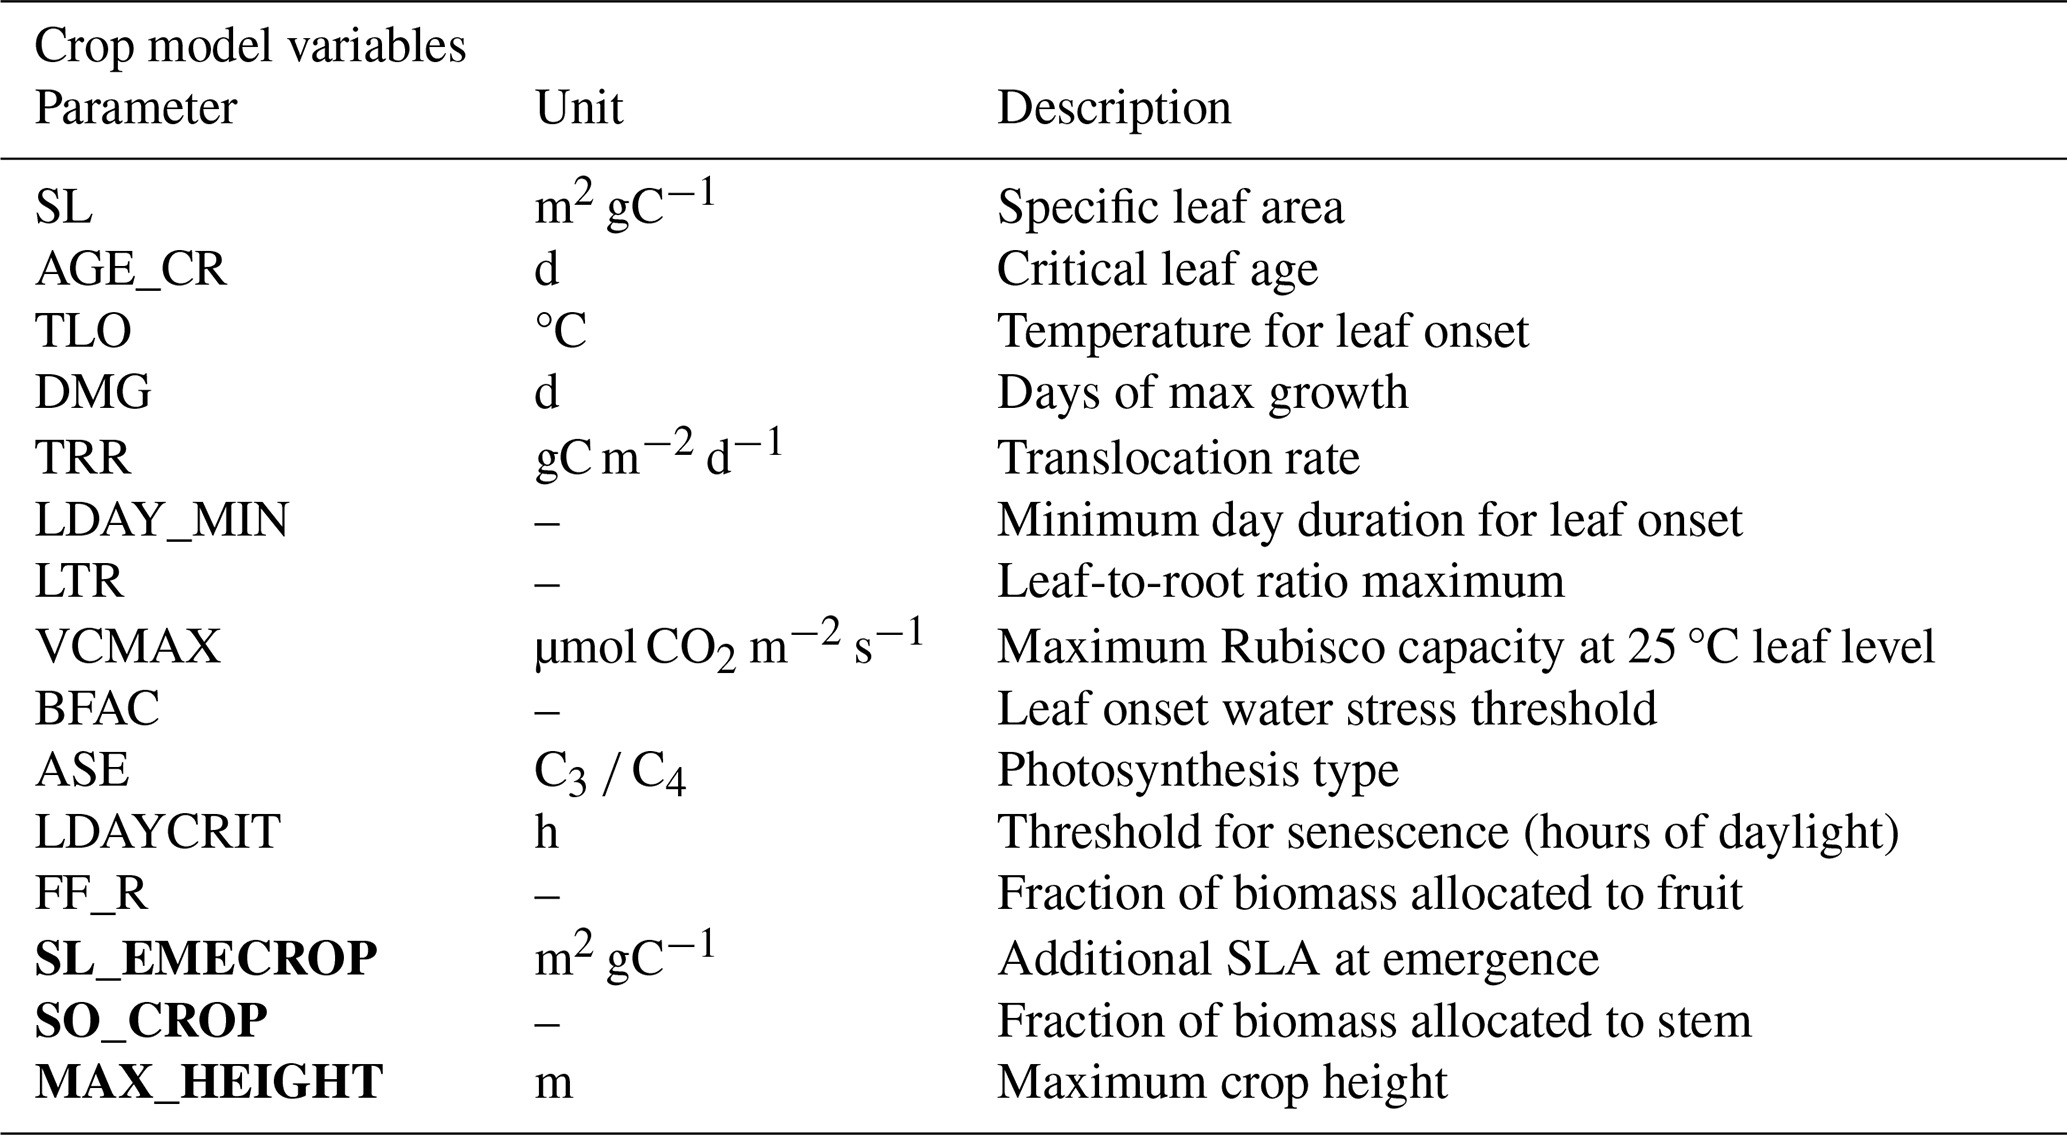
T&C-CROP, like T&C, does not use generic plant functional types, meaning the user must input plant- or crop-specific parameters, the most important of which are illustrated in Table 1. These were obtained from the literature and the TRY database (Kattge et al., 2020; Fraser, 2020). However, the final values used in the model runs were adjusted to be within a ± 30 % range of the reported values as part of a manual trial-and-error calibration, necessary to best fit the cultivar type being sown on each site (File S2 in the Supplement). Therefore, the model needs to be re-parameterized for certain parameters for each site. Temperature and day length thresholds for phenological changes were retrieved with expert knowledge and manual calibration at each site, matching leaf area observations. Furthermore, in T&C-CROP, the user inputs the date of sowing; therefore, the start date for crop growth is largely prescribed through crop management. Other models, such as AquaCrop (Steduto et al., 2009), calculate the sowing date dynamically based on local environmental conditions. This is also possible in T&C-CROP, but for this study, as sowing dates were available at all sites (Table S1 in the Supplement), for the best realism, they were prescribed. Following emergence, plant growth is purely dependent on local climate and environmental conditions. Inputs regarding fertilizer and/or irrigation application are inputted based on the management log shared by the PI (e.g. Table S2 in the Supplement), or, where not available, we used typical values for the region and crop type.
Table 1Illustrating some of the most important crop-specific parameters necessary to run T&C-CROP. The last three parameters in bold are the new parameters introduced with this study.
2.4 Description of selected sites and validation data
It is crucial to model agricultural fields which experience both monocropping and crop rotations as these practices are significant and widespread (Eurostat, 2020). This modelling approach also serves as an excellent benchmark for complex mechanistic crop models such as T&C-CROP. An important objective was to select sites with on-site observational records that could demonstrate T&C-CROP's capability to continuously simulate field growth across various rotation and management practices within a single simulation. This contrasts with the common practice of starting a new simulation for each crop individually. The benefit of a continuous model simulation is that this allows T&C-CROP to account for legacy soil conditions, including soil moisture and soil carbon, based on historical management practices – such as crop residue management, fertilizer application, and irrigation. This approach ensures that our model accurately reflects the cumulative impact of past agricultural practices on current and future crop performance.
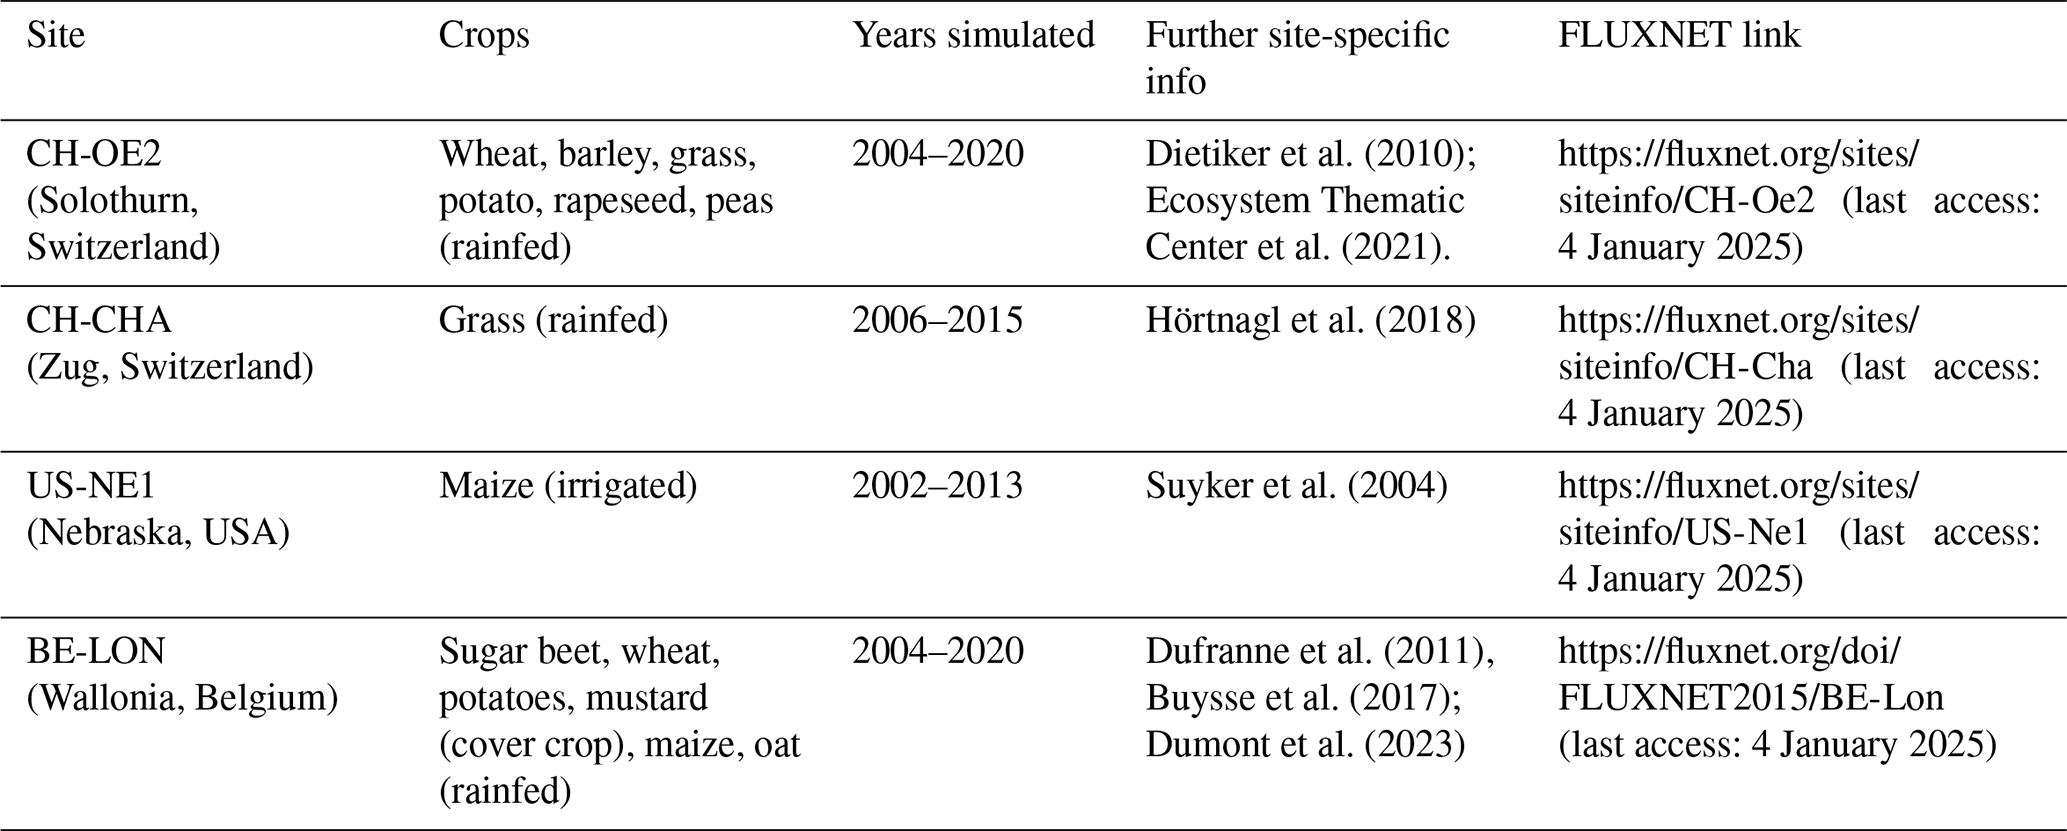
To showcase T&C-CROP's capabilities, we selected four well-monitored agricultural sites, all characterized by a temperate climate but featuring diverse cropping systems and management practices. These sites are affiliated with FLUXNET (Heinesch et al., 2021) and have been previously utilized for model evaluations (e.g. Boas et al., 2021), making them ideal for model intercomparison and benchmarking. Further details about the selected sites are provided in Table 2.
Table 2Information regarding the agricultural sites used in this study.
2.5 Model intercomparison
The performance of T&C-CROP was compared with that of three other similar leading models which have been previously validated on the same sites. Specifically, JULES-crop was evaluated based on the US-NE1 site for maize; CLM-CROP was evaluated based on the BE-LON site for sugar beet, potatoes, and wheat; and ORCHIDEE-CROP was evaluated based on the BE-LON site for wheat. The data for this comparison were extracted from published works: Williams et al. (2017) for JULES-crop, Boas et al. (2021) for CLM-CROP, and Wu et al. (2016) for ORCHIDEE-CROP. An open-source web-based tool, WebPlotDigitizer (see Acknowledgements) was used to extract numerical data from the plot images provided in the publications. Minor discrepancies due to the accuracy of the graph digitizer are expected.
JULES-crop was run under conditions of sufficient irrigation (no water stress) and no nitrogen limitation. Two model runs were conducted: one where LAI and crop height were prescribed from observations and another where they were not. To ensure a fairer comparison, we used results from the latter. In JULES-crop, input parameters were tuned based on site observations. In the case of CLM-CROP, the default parameter set for winter wheat was found to perform poorly in representing crop phenology across the evaluated sites. Therefore, new parameter values were adopted based on the literature or site-specific observations. For instance, adjustments were made to the growing-season length and minimum LAI parameter according to field data. All three models – JULES-crop, CLM-CROP, and ORCHIDEE-CROP – used prescribed sowing and harvest dates, except for ORCHIDEE-CROP, where harvest timing was determined by crop development processes. Notably, the ORCHIDEE-CROP model was not calibrated for each site individually but was tested for improvements in a more generic manner. Full details regarding the respective model simulation setups and crop parameter selection can be found in the published works as referenced above.
3.1 Land surface energy balance
Across the four selected sites, the model captured the monthly trends in energy fluxes, as illustrated in Fig. 2. The mean monthly r2 across sites for net radiation (Rn) and sensible (H) and latent heat (QE) was 0.97, 0.85, and 0.96, respectively (see Table S3 in the Supplement). Unpacking this further, the Rn, H, and QE joint mean daily r2 was 0.68, which is commendable given potential discrepancies in the energy budget closure of flux tower measurements.
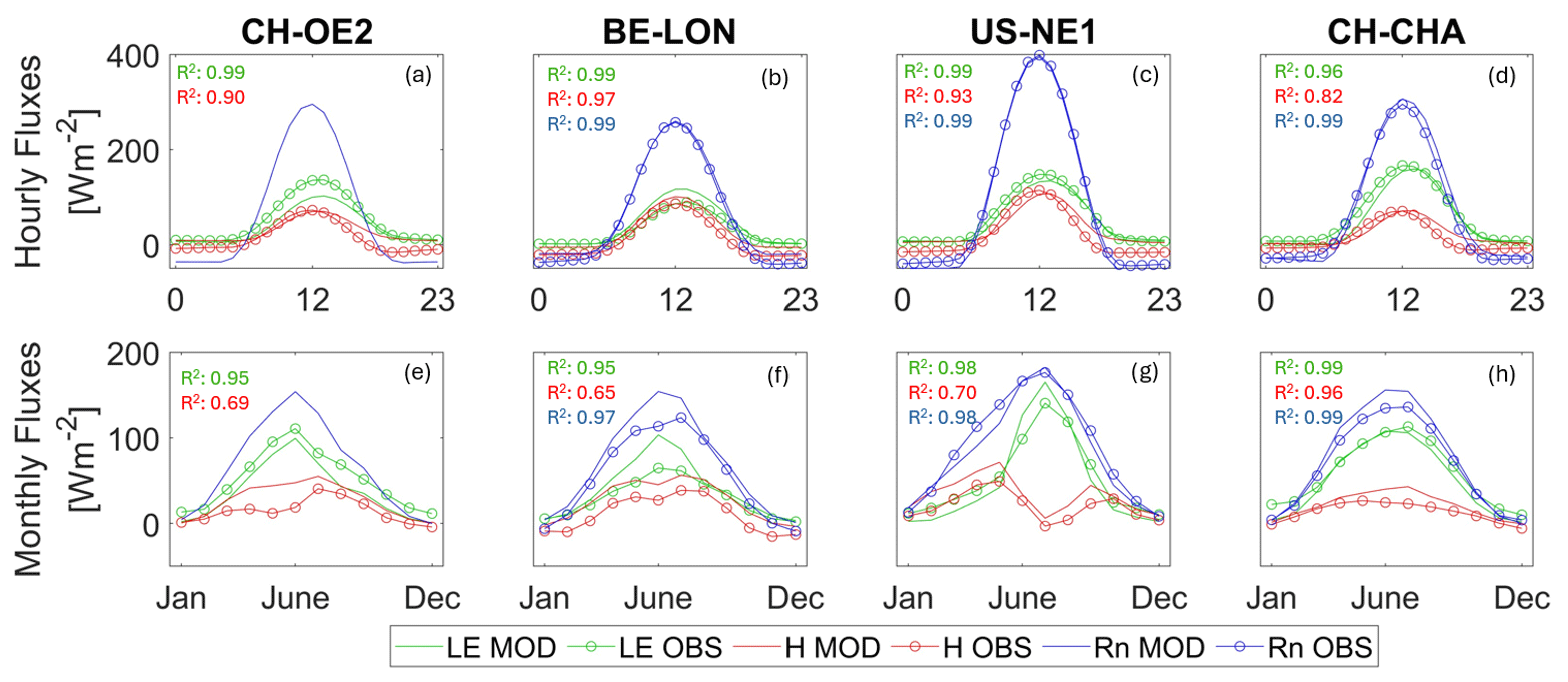
Figure 2This graph illustrates the comparison between modelled and observed energy fluxes across various sites: CH-CHA (grassland), US-NE1 (maize), CH-OE2, and BE-LON (both with complex crop rotations). The hourly fluxes, representing the average diurnal cycle, are depicted with different colours: green for latent heat flux (LE), red for sensible heat flux (H), and blue for net radiation (Rn).
3.2 Gross primary productivity, ecosystem respiration, net ecosystem exchange, and soil moisture
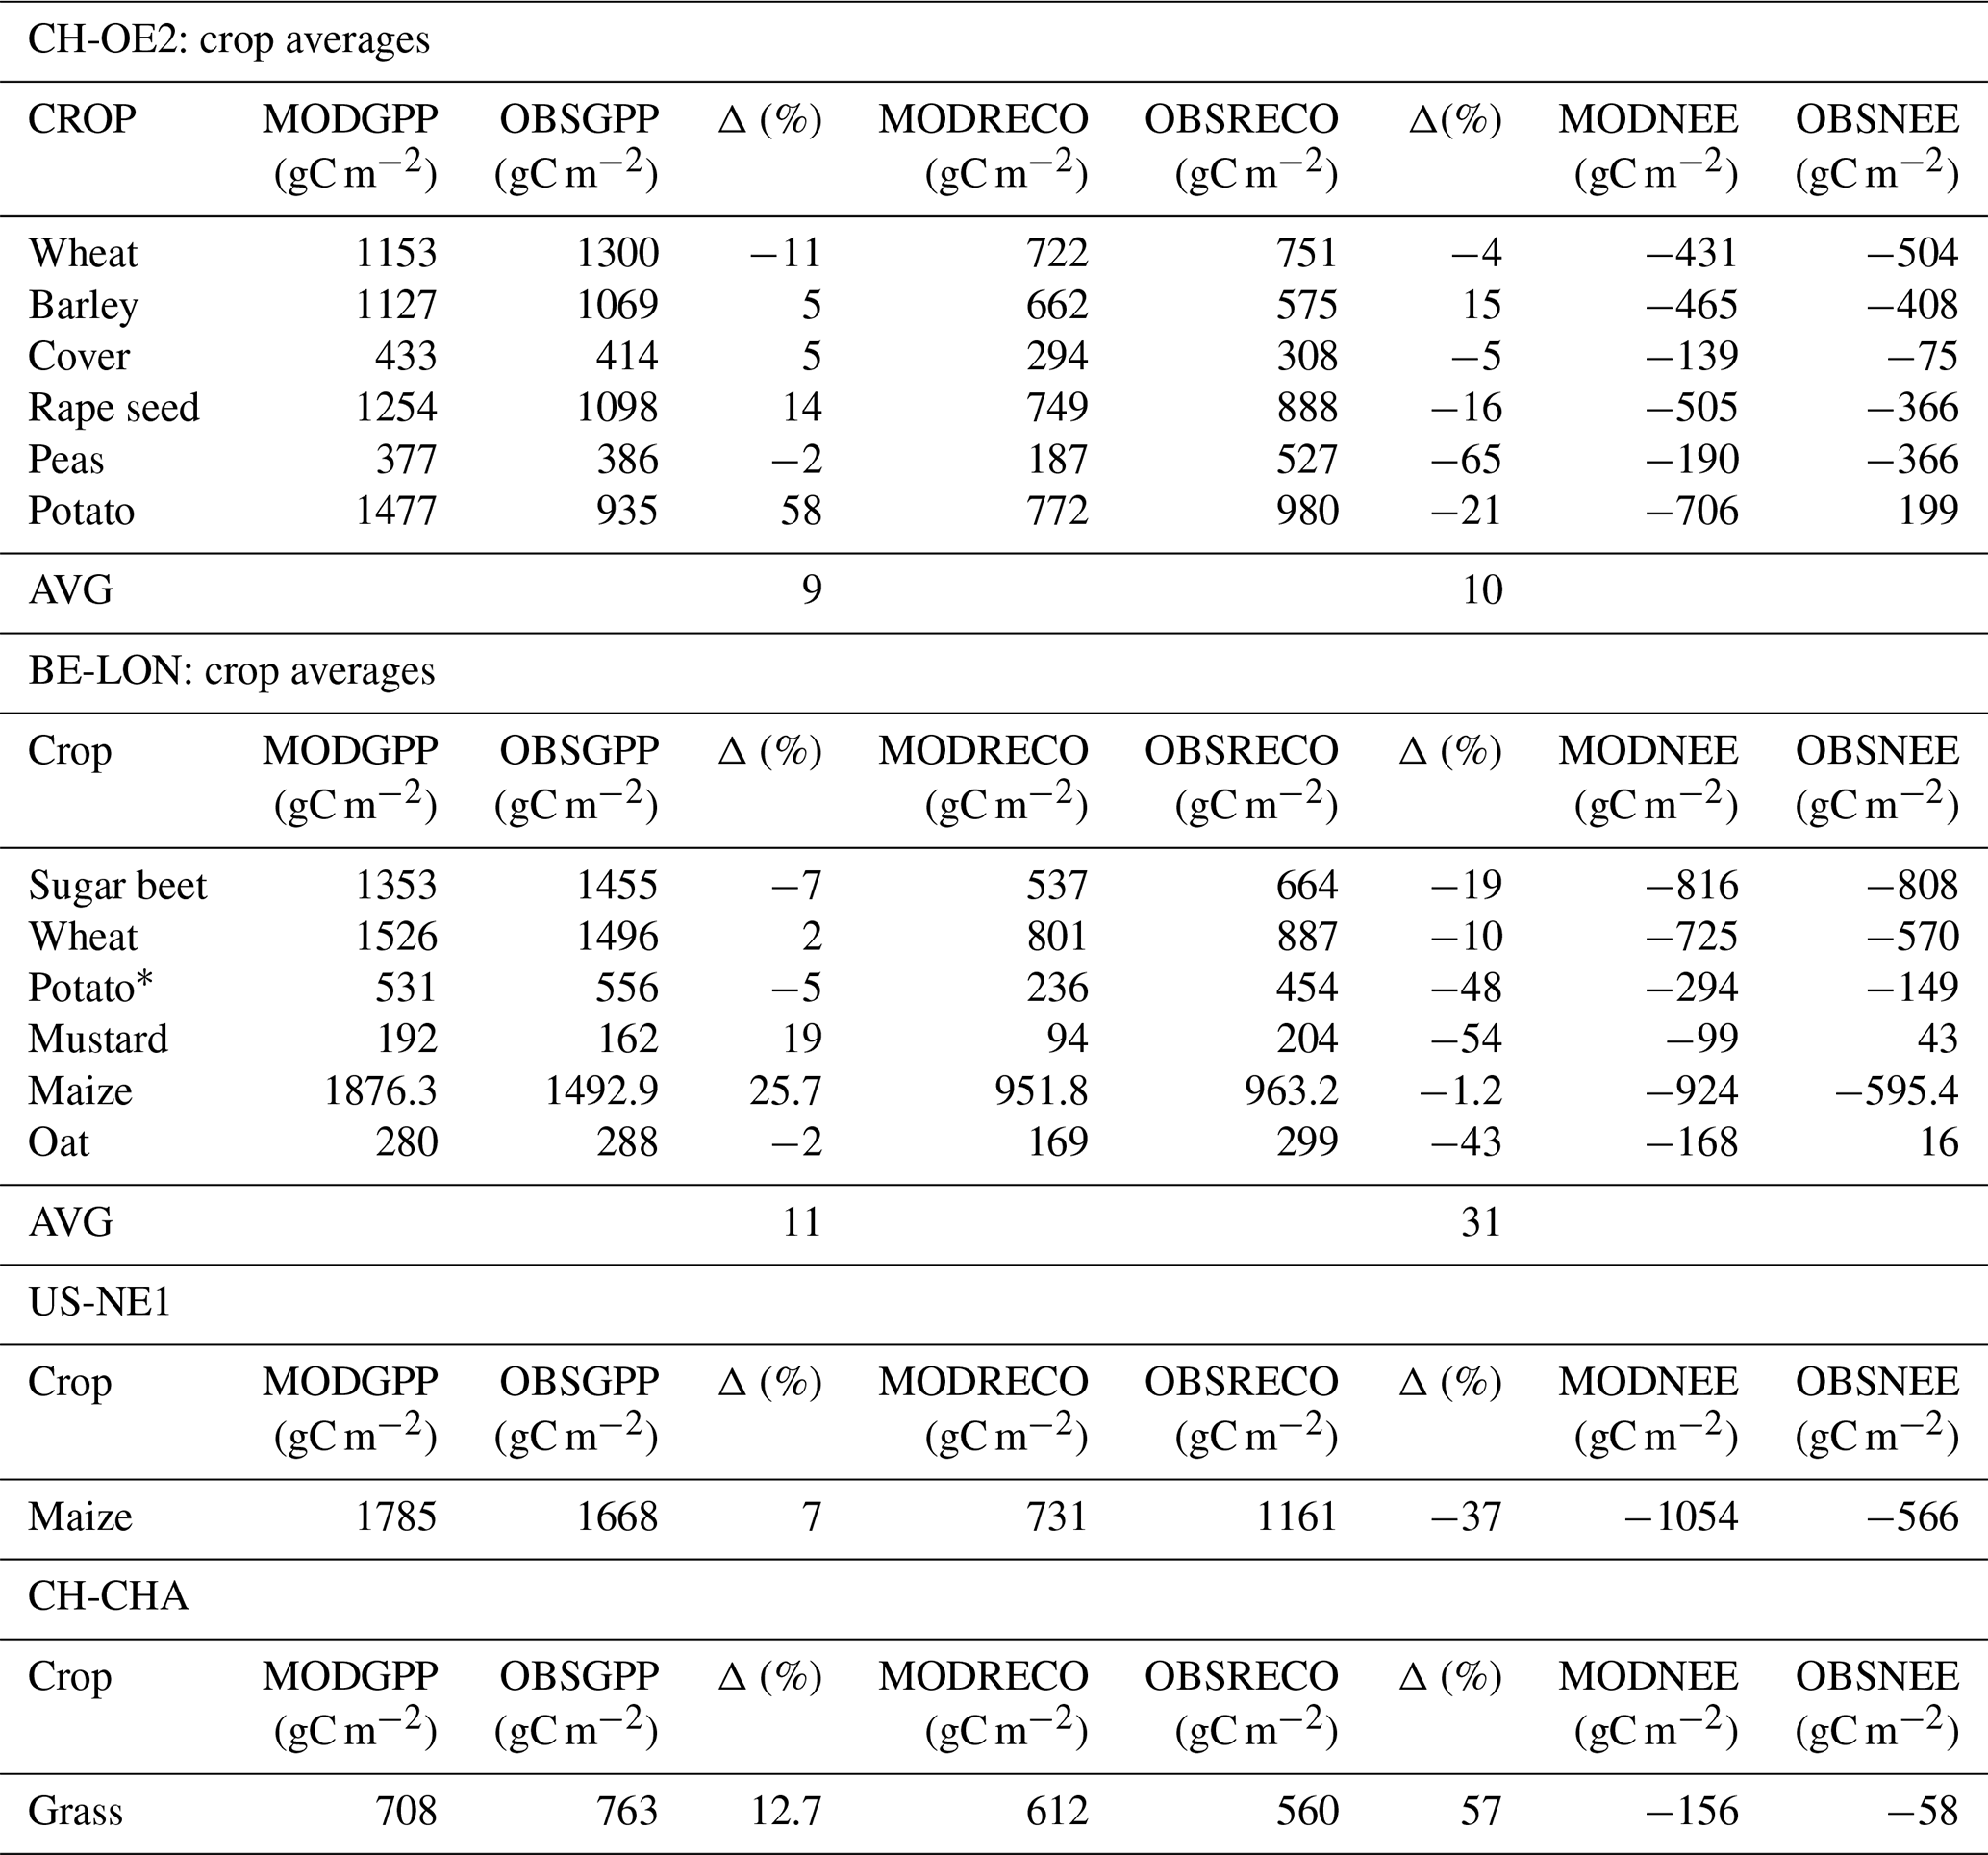
We found that, to capture the correct timing of gross primary productivity (GPP) fluxes for each crop (Fig. 3), it was imperative to draw on a trait-based approach as lumping different crops into PFTs (plant functional types) showed significantly worse performance. As illustrated in Fig. 3, the magnitude and timings of the GPP fluxes are correctly captured, as are the differences between crops and, to a lesser extent, between seasons (same crop, different year). Additionally, in Table 3, the modelled and observed seasonal sums of gross primary productivity (GPP), ecosystem respiration (RECO), and their difference, along with net ecosystem exchange (NEE), are presented; a season is defined as the period between crop emergence to harvest. T&C-CROP was able to capture the seasonality of GPP across crops, roughly within a 10 % range of observed values, as depicted in Table 3. However, it did slightly less well at capturing seasonal RECO (Table 3), possibly due to the lack of knowledge regarding post-harvest management, ploughing, crop residue, etc., and, of course, there sometimes exists notable uncertainty in observed fluxes (Hollinger and Richardson, 2005).
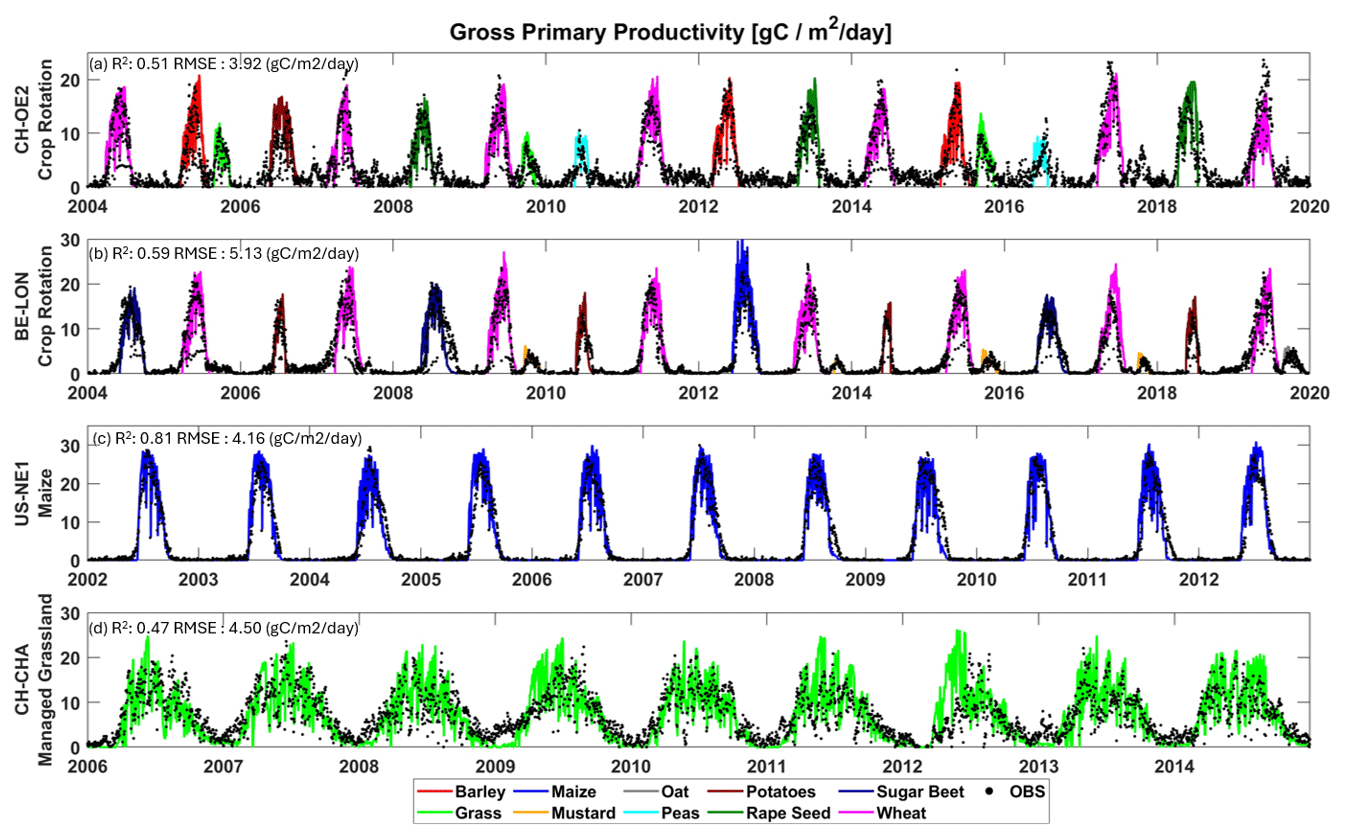
Figure 3Validation of gross primary productivity (GPP) across the four simulated sites, covering a total of 10 different crops.
Table 3Illustrating seasonal cumulative sum (sowing-harvest) of T&C-CROP flux estimates (MOD) compared to eddy-covariance-derived data (OBS) across sites and crops. Note that we have also included percentage MOD-OBS differences (Δ). The AVG value corresponds to an absolute average. Note that potatoes in CH-OE2 were a crop failure event due to hail, which is a phenomenon we currently do not simulate; therefore, we discarded this from computed averages. At the BE-LON site, defoliant was applied to potatoes mid-season, a management practice which was incorporated into T&C-CROP. At the US-NE1 site, presented values are the average of all seasons (sowing–harvest) across 2002–2012. At CH-CHA, the presented values are the average of all periods (sowing–harvest) for which we had available site data, covering 2006–2020.
T&C-CROP's skill in simulating soil water content (SWC) is illustrated in Fig. 4. The maize monoculture site (US-NE1) and the crop rotation site (BE-LON) were chosen for this illustration due to their long observational SWC record. At a depth of 25 cm, a correlation coefficient of r2=0.64 was achieved between daily observed and modelled SWC at the US-NE1 site; a similar value of 0.62 is achieved at the BE-LON site (if we only include data until the sensor change in 2015).
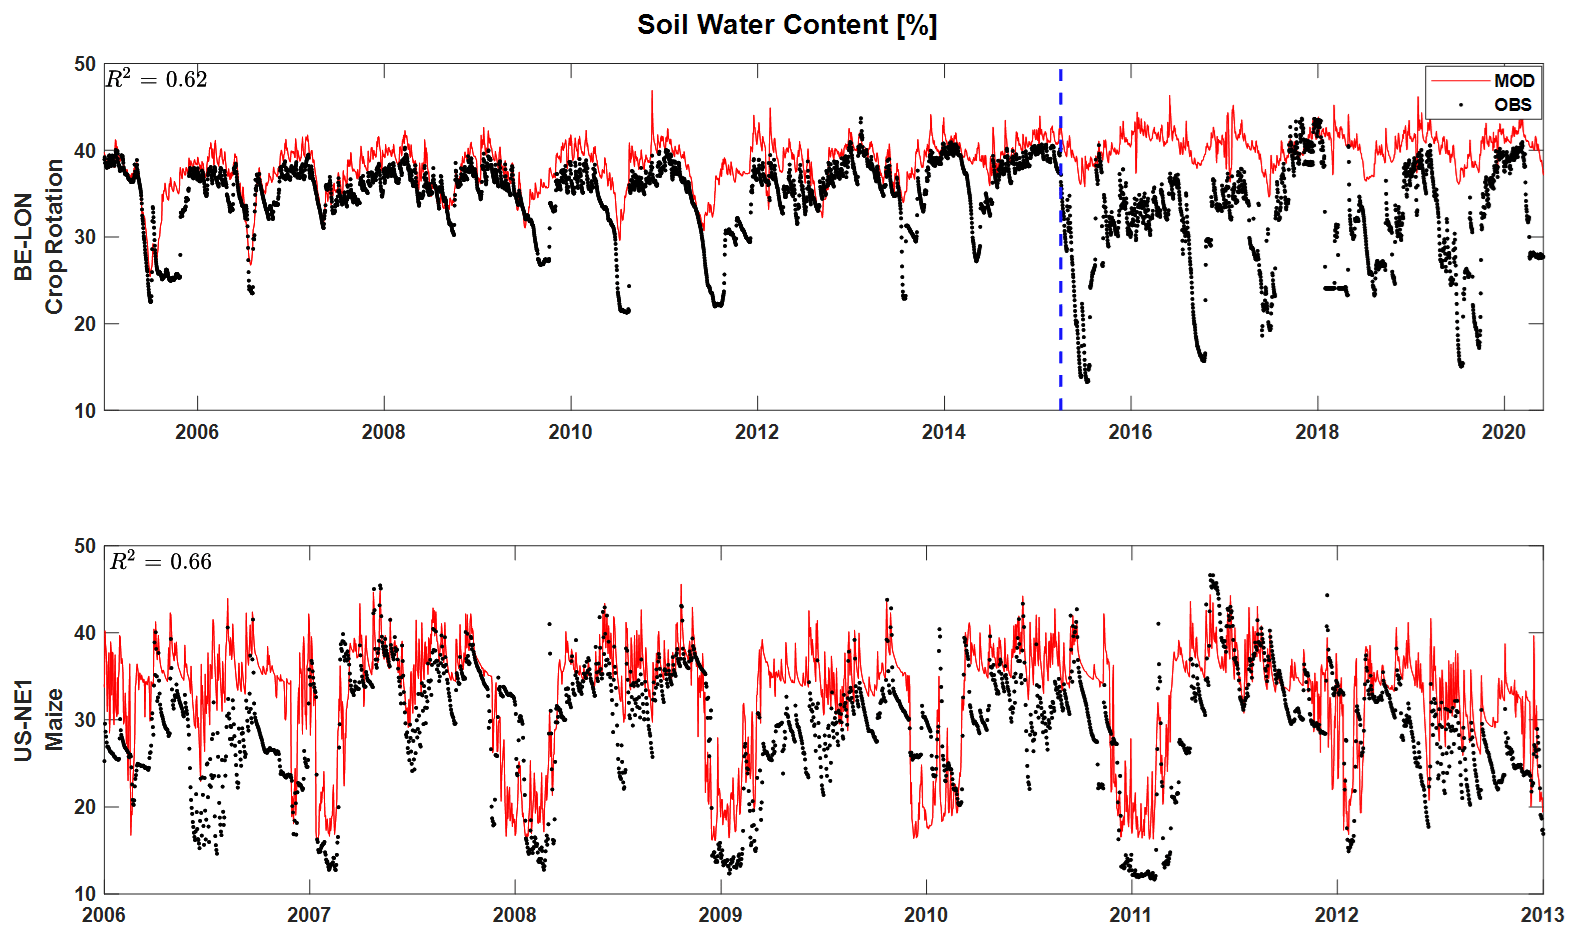
Figure 4Validation of soil water content (SWC) across BE-LON (complex crop rotation) and US-NE1 (maize monoculture). Both sites represent modelled and observed SWC at a depth of 25 cm. The dashed blue line represents the date of a sensor change.
3.3 Crop development: LAI and biomass growth
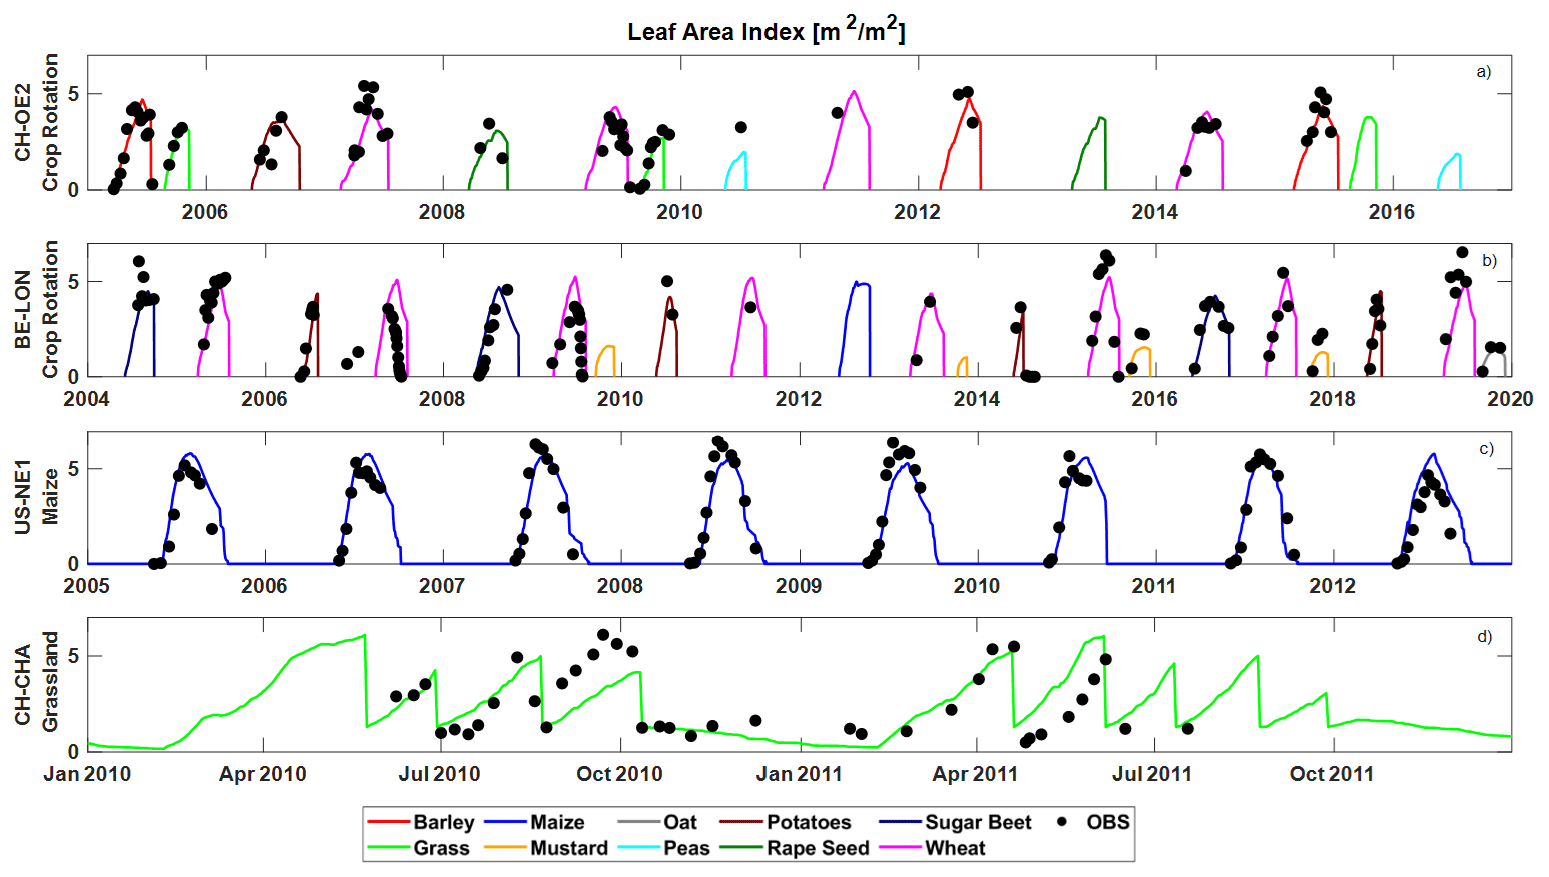
T&C-CROP was able to capture the timing of leaf flushing and growing-season length across various simulated sites and crop types (Fig. 5). The model demonstrated considerable skill in reproducing peak-season leaf area index (LAI), indicated by a correlation coefficient (r2) of 0.75, 0.66, and 0.61 for CH-OE2, BE–LON, and USNE1, respectively. However, at CH-CHA, a grassland site, whilst the leaf growth pattern was clearly captured, there was no significant correlation between observed and simulated peak LAI, likely due to the spread in recorded LAI values on each date. Importantly, T&C-CROP successfully captured most differences in LAI among different crops, most clearly depicted with mustard and wheat at the BE-LON site (Fig. 5b). The model's strongest performance was in replicating LAI dynamics at the US-NE1 site (maize monoculture), achieving an r2 of 0.77, a satisfactory result considering the limited developments in T&C-CROP and the inherent heterogeneity in field-based LAI sampling and in the different cultivars sown.
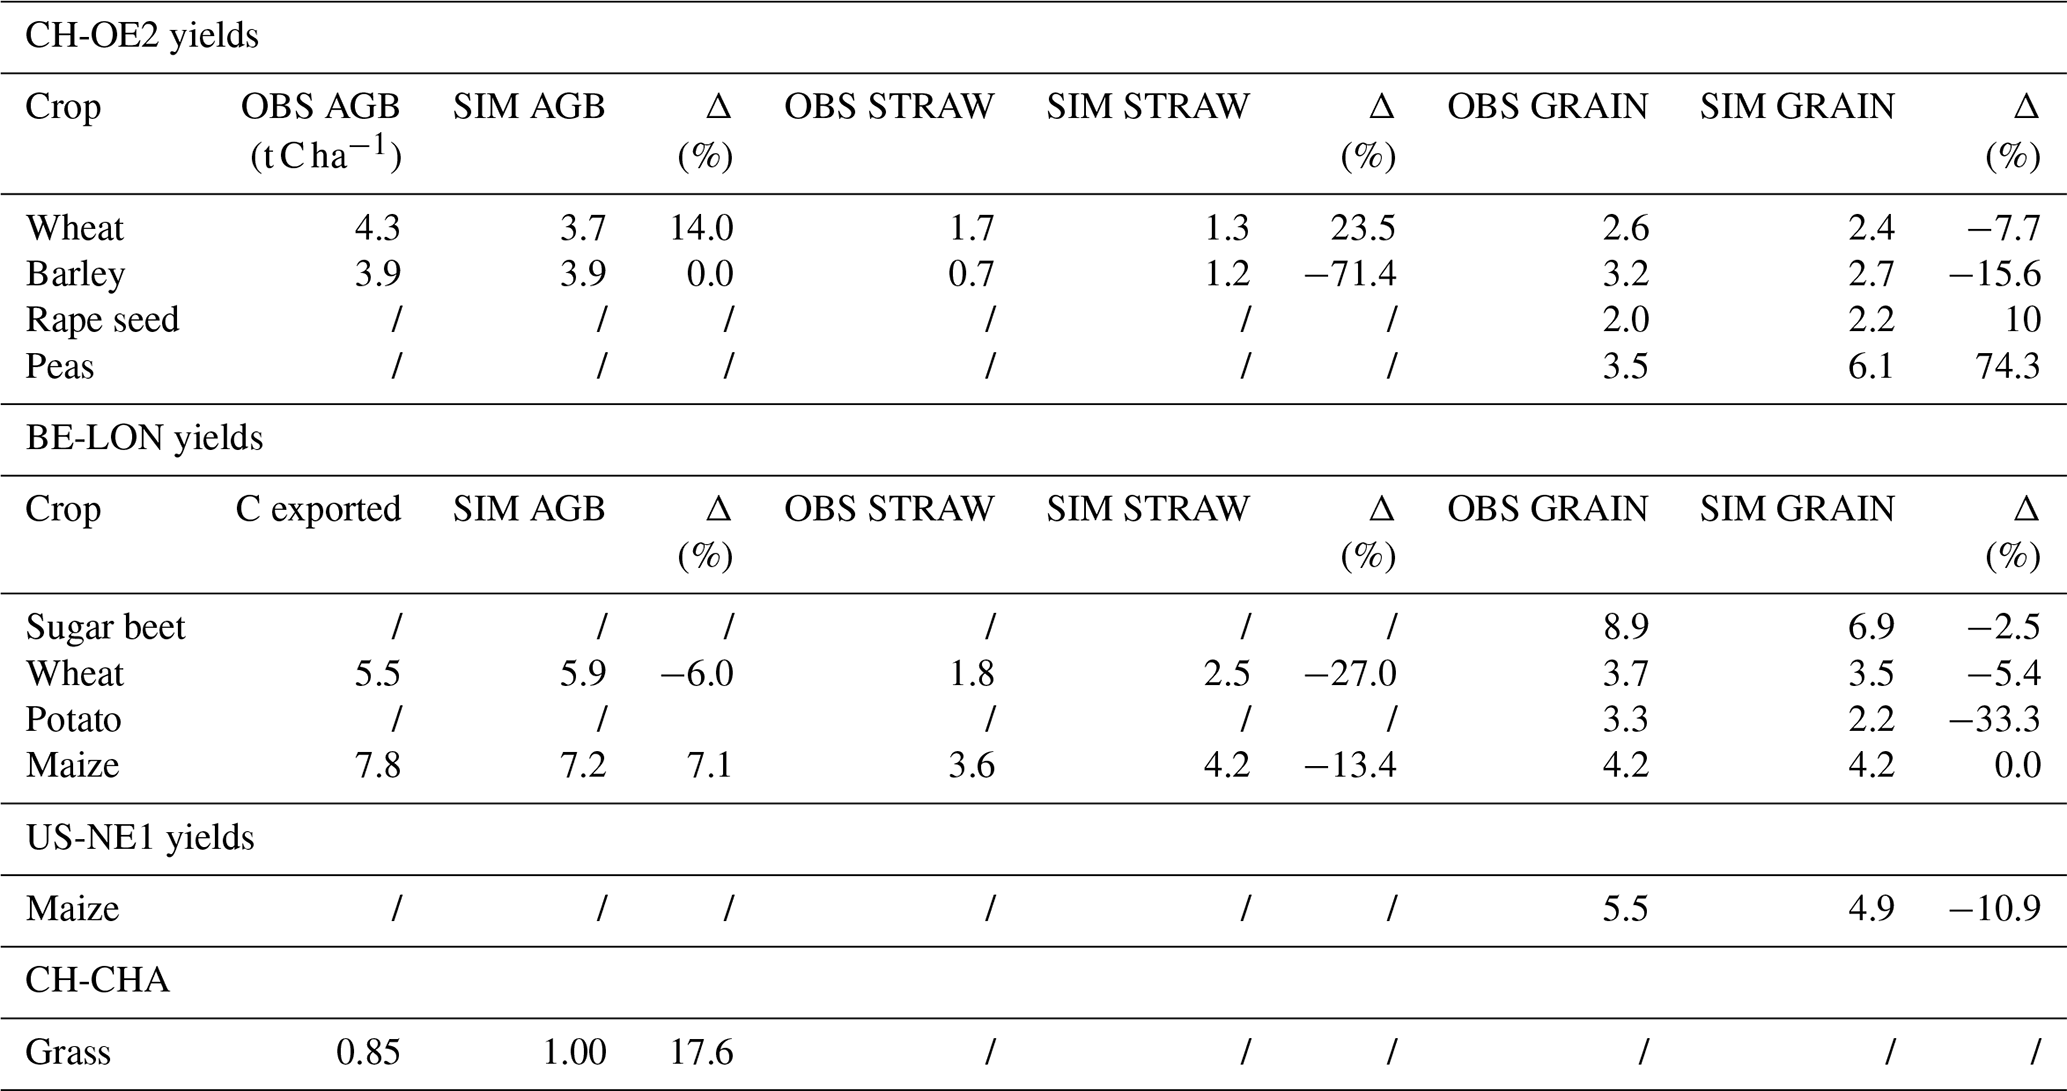
The validation of T&C-CROP against observed crop harvests (Table 4) demonstrates the model's ability to accurately capture biomass differences at harvest time among various crops and to effectively partition assimilated carbon into different crop components, such as stems and grains. Across the four simulated sites, T&C-CROP successfully predicted the annual harvested above-ground biomass (AGB) within approximately 20 % of the observed values, with a few exceptions (Table 4).
We also assessed dynamic carbon allocation mechanisms throughout the growing season at the US-NE1 site using published observations (Peng et al., 2018) as a reference (Fig. 6). Our findings indicate that T&C-CROP effectively captures the overall trend and magnitude of carbon allocation to specific crop components such as leaves, stems, and grains. This underscores the model's promising ability to represent the dynamic processes that drive crop growth and development. Regarding Fig. 6, it is important to note that, in 2007, at the US-NE1 site, our modelled above-ground carbon (AGC) was slightly lower than observed, peaking at 9.5 t C ha−1 compared to the observed 11.34 t C ha−1 (Fig. 7a).
We analysed crop rotations at two sites, CH-OE2 and BE-LON, and also evaluated T&C-CROP's performance on maize at the US-NE1 site and on grassland at the CH-CHA site. At the CH-OE2 site, we simulated 19 crop cycles over 15 years (2004–2019). On average, the harvested above-ground biomass (AGB) was simulated within 10 % of recorded values. Grain and straw were simulated within 13 % and 30 % of recorded values, respectively. However, inter-annual variations in crop growth and carbon allocation to different pools (grain or straw) were difficult to capture.
At the BE-LON site, we simulated 21 crop cycles over 16 years (2004–2020). Winter wheat and maize were well simulated, with AGB and grain values being, on average, within 10 % of observations. Straw was slightly overestimated by 27 % for wheat and by 13 % for maize. If we account for crop residues, particularly the first few centimetres of straw, our simulated values could align more closely with observed values. Additionally, including the belowground component of sapwood, which is currently excluded, would likely bring simulated AGB values even closer to observations. For wheat, the average residue at BE-LON was 26 % of AGB, with a standard deviation of 4 %. Potatoes at BE-LON were more challenging to simulate accurately, partly due to the defoliant treatment applied in mid-August, which is not currently included in our model. This resulted in simulated tuber biomass (daughter tubers) being about 50 % lower than observed.
Over 11 years (2002–2012) at the US-NE1 site, simulated maize yield (kernel) was within 8 % of recorded values on average. For the grassland site CH-CHA, harvest data were available for eight cuts from 2008 to 2010. Here, simulated harvested biomass was within 20 % of recorded values on average. Full results in a tabular format are included in Tables S4–S7 in the Supplement.

Figure 6Total fraction of above-ground biomass in leaves, stems, and grain at the maize site (US-NE1), illustrating the partitioning of assimilated carbon by T&C. Leaves are represented by the foliage pool, stems include sapwood and dead-sapwood pools, and grain consists of carbohydrate reserves and fruit and flower pools. Observed values are derived from the graphs in the supplementary material of Peng et al. (2018).
Table 4In T&C-Crop, crop carbon is distributed across six distinct biomass carbon pools: B1 denotes foliage, B2 denotes living sapwood, B3 denotes fine roots, B4 denotes carbohydrate reserves, B5 denotes fruit and flowers, and B6 denotes standing dead foliage. In Table 4, simulated above ground biomass (AGB) corresponds to the sum of all T&C-Crop's biomass pools excluding B3 (fine roots); we assume that all sapwood is above-ground, an approximation which is reasonable for most crops. Simulated grain is represented by the sum of B5 (fruit and flowers) and B4 (carbohydrate reserves), which are expected to be contained mostly within the fruits of a crop, and simulated straw is derived from the sum of B1 (foliage), B2 (living sapwood), and B6 (standing dead foliage). Validation for below-ground biomass (roots) was not possible due to the absence of on-site data. Note that, for US-NE1, a value of 43 %, as suggested by the PI, was used to translate t ha−1 to t C ha−1. For CH-CHA, grass yields are annual, covering the period 2008–2010. * Note that, at CH-OE2, OBS AGB refers to the total AGB at the time of harvest, whereas, at BE-LON, C exported refers to the harvested component of the AGB. All values are in t C ha−1.
3.4 Model intercomparison
T&C-CROP simulations were compared to those of JULES-crop (Williams et al., 2017). Figures 7 and 8 illustrate how both models, relative to each other, represent AGB and LAI over a course of 8 years at the maize (US-NE1) site. Despite T&C-CROP being arguably more process-based and more parameter parsimonious, both models did a comparable job at capturing the correct magnitude and timing of LAI and AGB, while neither model correctly simulated inter-annual variations in peak LAI or AGB.
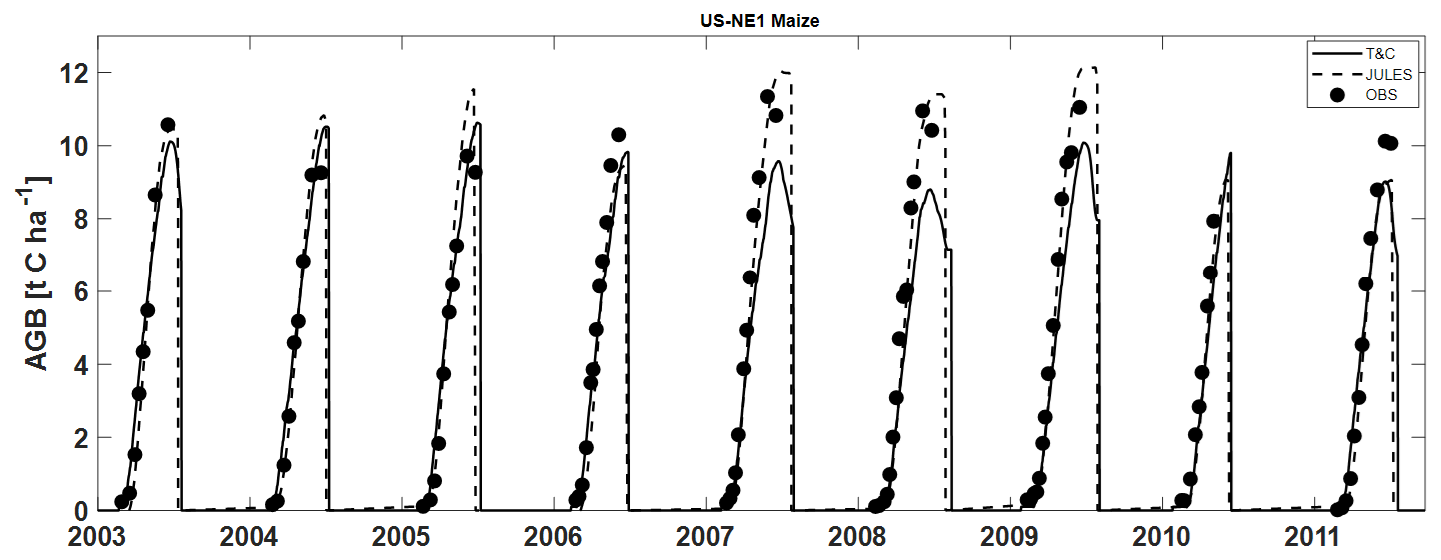
Figure 7Simulation of above-ground biomass by both T&C-CROP and JULES-crop models compared to observations at the US-NE1 (maize) site.
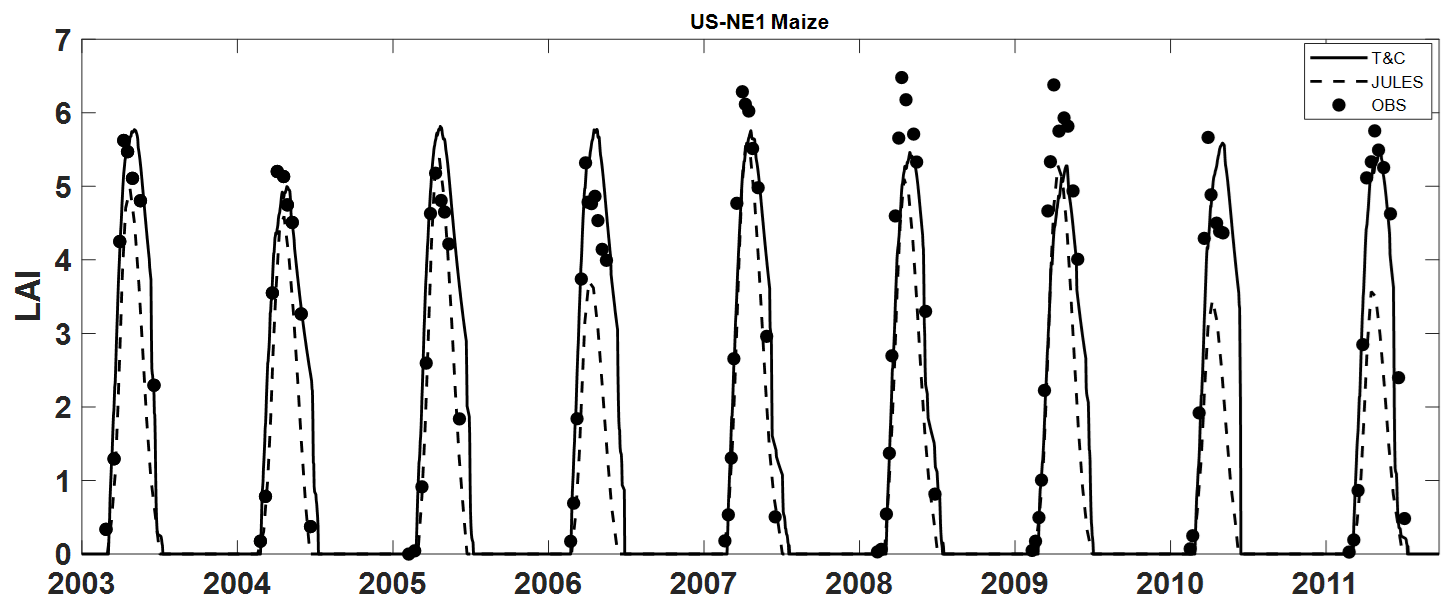
Figure 8Simulation of LAI by both T&C-CROP and JULES-crop models compared to observations at the US-NE1 (maize) site.
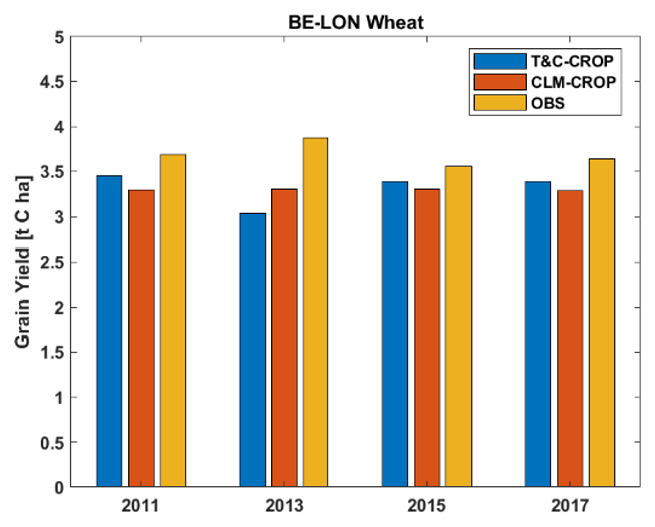
T&C-CROP simulations conducted over the crop rotation site BE-LON were compared to those of CLM-CROP (Boas et al. (2021). Figure 9 illustrates how both models simulate grain yields for winter wheat across the four years which were presented in the CLM-CROP paper. To produce this comparison, we converted CLM-CROPS's modelled values, which are reported in T DM ha−1, to T C ha−1 using the average site-reported C content per unit of dry mass for wheat grain during these 4 years, which was 40.5 %; there was little inter-annual variation in this value (< 3 %). Unfortunately, there is not sufficient data or variation in grain yield to truly assess the efficacy of either model; however, based on the presented observations, both capture the correct magnitude, but neither captures the inter-annual observations of yield. Figure 10 illustrates how both models successfully represent LAI, as well as key land surface fluxes, over the years during which sugar beet and potatoes were sown. Note that a defoliant was applied to potatoes at the BE-LON site (Aubinet et al., 2009). To replicate this in T&C-CROP, we simulated a sudden “cut” on the recorded date of defoliant application.
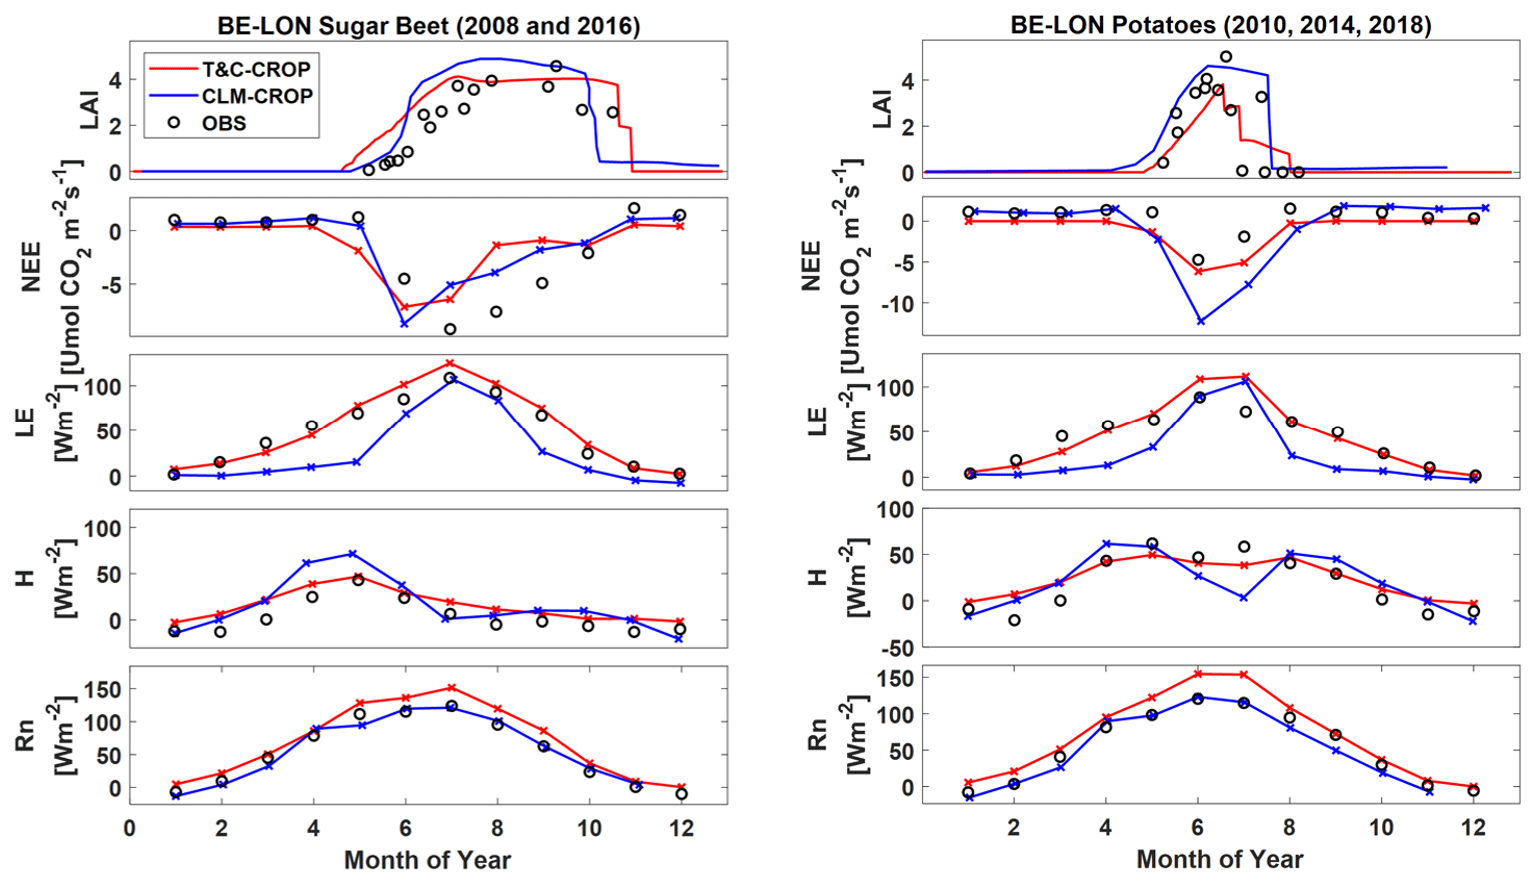
Figure 10Simulation of leaf area index (LAI), net ecosystem exchange (NEE), latent heat flux (LE), sensible heat flux (HE), and net radiation (Rn) across both T&C-CROP and CLM-CROP for sugar beet and potatoes cultivated at the BE-LON site.
Lastly, T&C-CROP was evaluated against results from ORCHIDEE-CROP (Wu et al., 2016) for the winter wheat season at the BE-LON site in 2006 (Fig. 11). ORCHIDEE-CROP (Wu et al., 2016) undershoots above-ground biomass (AGB) by about 50 %, whilst T&C-CROP does a much better job, albeit overshooting AGB by just under 10 %. More specifically, T&C-CROP achieved a correlation coefficient of r2=0.94 between simulated and observed AGB, whilst this was 0.2 for ORCHIDEE-CROP.

Figure 11Illustrating a comparison of ORCHIDEE-CROP outputs from Wu et al. (2016) and T&C-CROP outputs from this paper for winter wheat sown at BE-LON. Note that both latent (QE) and sensible heat (H) were smoothed using a weekly time step to improve graph readability. Note that, here, AGB refers to total AGB and not only harvestable AGB.
The integration of three new crop-specific parameters, combined with streamlined model developments, has significantly enhanced the representation of cropland sites in T&C-CROP. Our findings include the successful validation of over 10 different crops sown in four heterogeneous agricultural fields, varying in terms of both management practices and climate conditions. Results also demonstrate that T&C-CROP performs comparably to other leading terrestrial biosphere models (TBMs) without having to increase model complexity or introduce crop-specific carbon pools. This underscores the effectiveness of T&C-CROP as a highly parameter-efficient and process-based model for future studies.
This improved incorporation of croplands into T&C opens new avenues for modelling land–surface interactions, hydrology, carbon fluxes, and crop yields. For instance, the enhanced representation of sensible heat (H), latent heat (LE), and net radiation (Rn) facilitates more detailed research on land–surface interactions. Similarly, improved modelling of evapotranspiration (ET) and leaf area index (LAI) supports hydrological and water sustainability studies (e.g. Bonetti et al., 2022). Additionally, greater accuracy in terms of net ecosystem exchange (NEE) and soil carbon storage could aid contemporary carbon emission mitigation efforts.
The hydrological and carbon storage implications of land use transitions – such as the conversion of crops, forests, and pastures – are among the key applications foreseen for T&C-CROP. Further studies could also focus on optimizing field management practices, building on prior work with models like the DNDC biogeochemical model (Zhang et al., 2019). Applications might include investigating irrigation strategies and fertilizer use under changing climatic conditions (e.g. Botter et al 2021). These research directions align with efforts to assess climate risk in agriculture and, ultimately, to develop climate-smart agricultural practices.
Additionally, beyond the biomass, hydrological, and energy balance metrics validated in the Results section, T&C-CROP can also simulate below-ground soil biogeochemical dynamics (Fatichi et al., 2019). We have included some outputs for illustrative purposes (Fig. S2 in the Supplement). T&C-CROP captures changes in nutrient leakage as a function of local weather, crop type, fertilizer regime, and legacies. Using the biogeochemistry module, we identified a boost in microbial carbon post-harvest and in nutrient flushing following fertilization, predominantly after rainfall events.
Whilst we remain confident in T&C-CROP's strength at the field scale, particularly as we move toward an increasingly data-rich future, where the integration of data-driven and process-based approaches into crop modelling will enhance predictive capabilities, the utility or potential of a versatile tool like T&C-CROP presently lies in its ability to perform at the regional scale. However, validating its efficacy at this level presents significant challenges due to sparse comprehensive data and the multitude of factors influencing crop growth, including socio-economic variables.
Many of the issues we encountered during site-level validations are expected to diminish at broader scales as local variations average out and climatic variables assume greater importance. For instance, representing microscale field management proved to be challenging during validation efforts. Accounting for different cultivar types; accurately determining crop-specific carbon allocation parameters; and incorporating practices such as the use of growth regulators, the application of defoliant or fungicide treatments (e.g. at sites like BE-LON; Dufranne et al., 2011), or addressing hail damage (e.g. at CH-OE2; Revill et al., 2019) proved to be difficult. Moreover, T&C-CROP struggled to simulate post-harvest processes, likely due to insufficient knowledge regarding practices such as residue management and soil preparation or tillage. These factors, while critical at the field scale, are likely to exert less influence on crop growth across larger spatial scales, where climatic conditions are expected to dominate. Nonetheless, addressing these challenges could improve model performance at all scales. It is also worth noting that our manual trial-and-error calibration of crop parameters (within a ±30 % range of literature values) could likely be improved using systematic calibration techniques to achieve more robust validation. However, this was beyond the scope of this introductory paper due to the substantial computational resources required, particularly given the high dimensionality of T&C-CROP. Advancing in this direction would significantly enhance the precision of model outputs and remains an important objective for future work.
T&C-CROP was introduced to enhance T&C's representation of croplands and associated carbon, energy, and nutrient fluxes. In this study, we have assessed the extent to which T&C-CROP accurately depicts crop growth and associated land surface fluxes across four distinct agricultural sites, CH-OE2, BE-LON, CH-CHA, and US-NE1. Each site was subject to varying management practices such as irrigation, fertilizer, and defoliant application and had several types of crops, either as a monoculture or as a crop rotation scheme. Our model validation covers over 50 years and 61 crop cycles, encompassing more than nine staple crops, and also includes a comparison with results from other leading TBMs.
This study demonstrates how, with minimal model structural changes and only three additional parameters, it is possible to accurately represent gross primary productivity (GPP), LAI (leaf area index), and organ-specific harvests not only in monocultures but also in sites with complex crop rotations and diverse management practices. Of particular novelty is that we adapted the carbon allocation scheme for crops and implemented a novel routine which allowed for multiple cropping cycles within 1 calendar year within the same model run. This enhancement enables more realistic simulations of field dynamics.
Our approach with T&C-CROP is grounded in practical utility. While our validation efforts were thorough, they were not overly fixated on meticulously simulating variables such as yield considering the fact that this is only one of the many model outputs. We were realistic with limitations in terms of parameter constraints as a high-level granularity was not a primary objective. We prioritized broad applicability over micro-management details, such as cultivar choice, which are unlikely to be available at larger scales.
T&C-CROP's research horizon is to explore, in a single model, the concurrent effects of various crops on yields, energy dynamics, and carbon fluxes, as well as to assess how major climatic factors (temperature, precipitation, CO2, relative humidity, etc.) interact with management practices (fertilizer, irrigation) to influence crop yields but also by-products such as nutrient runoff, soil degradation, and carbon sequestration.
Future studies with T&C-CROP are envisioned to be conducted over broader spatial scales, where detailed management practices or specific cultivar information are less important. T&C-CROP's ability to capture geographical differences induced by climate and soil properties are expected to overshadow local variations due to specific cultivars or management practices. This capability makes it an invaluable tool for understanding and predicting large-scale environmental patterns and their implications.
The model used to generate the results presented in this paper, T&C-CROP, is archived on Zenodo (https://doi.org/10.5281/zenodo.13343701, Buckley, 2024). The archive also includes the input data and scripts required to run the model and to reproduce the plots for all simulations discussed in this paper.
The supplement related to this article is available online at https://doi.org/10.5194/gmd-18-1287-2025-supplement.
JBP and AP designed the project and carried out the simulations. SF and AP are the main developers behind T&C, with modifications for T&C-CROP having been made by JBP, SF, and AP. JBP prepared the paper with contributions from all the co-authors.
The contact author has declared that none of the authors has any competing interests.
Publisher’s note: Copernicus Publications remains neutral with regard to jurisdictional claims made in the text, published maps, institutional affiliations, or any other geographical representation in this paper. While Copernicus Publications makes every effort to include appropriate place names, the final responsibility lies with the authors.
Thank you to the respective PIs and data management teams across the four sites who made data available. We also give thanks to the developers of WebPlotDigitizer, an open-sourced web-based tool to obtain data from plots (https://github.com/ankitrohatgi/WebPlotDigitizer, last access: 1 January 2025).
This paper was edited by Roslyn Henry and reviewed by two anonymous referees.
Amanullah: Specific leaf area and specific leaf weight in small grain crops wheat, rye, barley, and oats differ at various growth stages and NPK source, J. Plant Nutr., 38, 1694–1708, https://doi.org/10.1080/01904167.2015.1017051, 2015.
Ansarifar, J., Wang, L., and Archontoulis, S. V.: An interaction regression model for crop yield prediction, Sci. Rep., 11, 17754, https://doi.org/10.1038/s41598-021-97221-7, 2021.
Aubinet, M., Moureaux, C., Bodson, B., Dufranne, D., Heinesch, B., Suleau, M., Vancutsem, F., and Vilret, A.: Carbon sequestration by a crop over a 4-year sugar beet/winter wheat/seed potato/winter wheat rotation cycle, Agr. Forest Meteorol., 149, 407–418, https://doi.org/10.1016/j.agrformet.2008.09.003, 2009.
Bilionis, I., Drewniak, B. A., and Constantinescu, E. M.: Crop physiology calibration in the CLM, Geosci. Model Dev., 8, 1071–1083, https://doi.org/10.5194/gmd-8-1071-2015, 2015.
Boas, T., Bogena, H., Grünwald, T., Heinesch, B., Ryu, D., Schmidt, M., Vereecken, H., Western, A., and Hendricks Franssen, H.-J.: Improving the representation of cropland sites in the Community Land Model (CLM) version 5.0, Geosci. Model Dev., 14, 573–601, https://doi.org/10.5194/gmd-14-573-2021, 2021.
Bonan, G. B., Lawrence, P. J., Oleson, K. W., Levis, S., Jung, M., Reichstein, M., and Swenson, S. C.: Improving canopy processes in the Community Land Model version 4 (CLM4) using global flux fields empirically inferred from FLUXNET data, J. Geophys. Res.-Biogeo., 116, G02014, 116, https://doi.org/10.1029/2010JG001593, 2011.
Bonetti, S., Sutanudjaja, E. H., Mabhaudhi, T., Slotow, R., and Dalin, C.: Climate change impacts on water sustainability of South African crop production, Environ. Res. Lett., 17, 084017, https://doi.org/10.1088/1748-9326/ac80cf, 2022.
Boote, K. J., Jones, J. W., White, J. W., Asseng, S., and Lizaso, J. I.: Putting mechanisms into crop production models, Plant Cell Environ., 36, 1658–1672, https://doi.org/10.1111/pce.12119, 2013.
Botter, M., Zeeman, M., Burlando, P., and Fatichi, S.: Impacts of fertilization on grassland productivity and water quality across the European Alps under current and warming climate: insights from a mechanistic model, Biogeosciences, 18, 1917–1939, https://doi.org/10.5194/bg-18-1917-2021, 2021.
Buckley, J.: Model and Data for the T&C-CROP Validation Paper: T&C-CROP: Representing mechanistic crop growth with a terrestrial biosphere model (T&C,v1.5): Model formulation and validation, Zenodo [data set], https://doi.org/10.5281/zenodo.13343701, 2024.
Buysse, P., Bodson, B., De Debacq, A., Ligne, A., Heinesch, B., Manise, T., Moureaux, C., and Aubinet, M.: Carbon budget measurement over 12 years at a crop production site in the silty-loam region in Belgium, Agr. Forest Meteorol., 246, 241–255, https://doi.org/10.1016/j.agrformet.2017.07.004, 2017.
Cammarano, D., Jamshidi, S., Hoogenboom, G., Ruane, A. C., Niyogi, D., and Ronga, D.: Processing tomato production is expected to decrease by 2050 due to the projected increase in temperature, Nat. Food, 3, 437–444, https://doi.org/10.1038/s43016-022-00521-y, 2022.
Cassman, K. G. and Grassini, P.: A global perspective on sustainable intensification research, Nat. Sustain., 3, 262–268, https://doi.org/10.1038/s41893-020-0507-8, 2020.
Cernusak, L. A.: Gas exchange and water-use efficiency in plant canopies, Plant Biol., 22, 52–67, https://doi.org/10.1111/plb.12939, 2020.
Collatz, G. J., Ball, J. T., Grivet, C., and Berry, J. A.: Physiological and environmental regulation of stomatal conductance, photosynthesis and transpiration — a model that includes a laminar boundary-layer, Agr. Forest Meteorol., 54, 107–136, https://doi.org/10.1016/0168-1923(91)90002-8, 1991.
Collatz, G. J., Ribas-Carbo, M., and Berry, J. A.: Coupled photosynthesis-stomatal conductance model for leaves of C4 plants, Funct. Plant Biol., 19, 519–538, https://doi.org/10.1071/PP9920519, 1992.
Dai, Y., Dickinson, R. E., and Wang, Y.-P.: A two-big-leaf model for canopy temperature, photosynthesis, and stomatal conductance, J. Climate, 17, 2281–2299, https://doi.org/10.1175/1520-0442(2004)017<2281>2.0.CO;2, 2004.
de Pury, D. G. G. and Farquhar, G. D.: Simple scaling of photosynthesis from leaves to canopies without the errors of big-leaf models, Plant Cell Environ., 20, 537–557, https://doi.org/10.1111/j.1365-3040.1997.00094.x, 1997.
Dietiker, D., Buchmann, N., and Eugster, W.: Testing the ability of the DNDC model to predict CO2 and water vapour fluxes of a Swiss cropland site, Agr. Ecosyst. Environ., 139, 396–401, https://doi.org/10.1016/j.agee.2010.09.002, 2010.
Di Paola, A., Valentini, R., and Santini, M.: An overview of available crop growth and yield models for studies and assessments in agriculture, J. Sci. Food Agric., 96, 709–714, https://doi.org/10.1002/jsfa.7359, 2016.
Drewniak, B., Song, J., Prell, J., Kotamarthi, V. R., and Jacob, R.: Modeling agriculture in the Community Land Model, Geosci. Model Dev., 6, 495–515, https://doi.org/10.5194/gmd-6-495-2013, 2013.
Dufranne, D., Moureaux, C., Vancutsem, F., Bodson, B., and Aubinet, M.: Comparison of carbon fluxes, growth, and productivity of a winter wheat crop in three contrasting growing seasons, Agr. Ecosyst. Environ., 141, 133–142, https://doi.org/10.1016/j.agee.2011.02.023, 2011.
Dumont, B., Heinesch, B., Bodson, B., Bogaerts, G., Chopin, H., De Ligne, A., Demoulin, L., Douxfils, B., Engelmann, T., Faurès, A., Longdoz, B., Manise, T., Orgun, A., Piret, A., and Thyrion, T.: ETC L2 Fluxnet (half-hourly), Lonzee, 2017-12-31–2022-12-31, ICOS RI, https://meta.icos-cp.eu/resources/stations/ES_BE-Lon (last access: 26 Febuary 2025), 2023.
Dury, S., Bendjebbar, P., Hainzelin, E., Giordano, T., and Bricas, N. (Eds.): Food Systems at Risk: New Trends and Challenges, FAO, CIRAD, and European Commission, Rome, Montpellier, Brussels, https://doi.org/10.19182/agritrop/00080, 2019.
Ecosystem Thematic Centre, Buchmann, N., Emmel, C., Eugster, W., and Maier, R.: Fluxnet Product, Oensingen crop, 2003-12-31–2020-12-31, Miscellaneous, Ecosystem Thematic Centre [data set], https://doi.org/10.18160/1Y8J-NKQ3, 2021.
Eurostat: Agriculture, forestry and fishery statistics, 2020 edition, European Union, https://ec.europa.eu/eurostat/web/products-statistical-books/-/ks-fk-20-001 (last access: 27 February 2025), 2020.
FAO, IFAD, UNICEF, WFP, and WHO: The State of Food Security and Nutrition in the World 2022, Repurposing Food and Agricultural Policies to Make Healthy Diets More Affordable, FAO, Rome, https://doi.org/10.4060/cc0639en, 2022.
Farquhar, G. D., von Caemmerer, S. V., and Berry, J. A.: A biochemical model of photosynthetic CO2 assimilation in leaves of C3 species, Planta, 149, 78–90, https://doi.org/10.1007/BF00386231, 1980.
Fatichi, S., Ivanov, V. Y., and Caporali, E.: Simulation of future climate scenarios with a weather generator, Adv. Water Resour., 34, 448–467, https://doi.org/10.1016/j.advwatres.2010.12.013, 2011.
Fatichi, S., Ivanov, V. Y., and Caporali, E.: A mechanistic ecohydrological model to investigate complex interactions in cold and warm water-controlled environments: 1. Theoretical framework and plot-scale analysis, J. Adv. Model. Earth Sy., 4, M05002, https://doi.org/10.1029/2011MS000086, 2012.
Fatichi, S., Leuzinger, S., Paschalis, A., Langley, J. A., Donnellan Barraclough, A., and Hovenden, M. J.: Partitioning direct and indirect effects reveals the response of water-limited ecosystems to elevated CO2, P. Natl. Acad. Sci. USA, 113, 12757–12762, https://doi.org/10.1073/pnas.1605036113, 2016.
Fatichi, S., Manzoni, S., Or, D., and Paschalis, A.: A mechanistic model of microbially mediated soil biogeochemical processes: A reality check, Global Biogeochem. Cy., 33, 620–648, https://doi.org/10.1029/2018GB006077, 2019.
Fatichi, S., Or, D., Walko, R., Vereecken, H., Young, M. H., Ghezzehei, T., Hengl, T., Kollet, S., Agam, N., and Avissar, R.: Soil structure – an important omission in Earth System Models, Nat. Commun., 11, 522, https://doi.org/10.1038/s41467-020-14411-z, 2020.
Foley, J. A., Ramankutty, N., Brauman, K. A., Cassidy, E. S., Gerber, J. S., Johnston, M., Mueller, N. D., O'Connell, C., Ray, D. K., West, P. C., and Balzer, C.: Solutions for a cultivated planet, Nature, 478, 337–342, https://doi.org/10.1038/nature10452, 2011.
Fraser, L. H.: TRY—A plant trait database of databases, Glob. Change Biol., 26, 189–190, https://doi.org/10.1111/gcb.14869, 2020.
Friedlingstein, P., Joel, G., Field, C. B., and Fung, I.: Toward an allocation scheme for global terrestrial carbon models, Glob. Change Biol., 5, 755–770, https://doi.org/10.1046/j.1365-2486.1999.00269.x, 1998.
Gaupp, F., Hall, J., Mitchell, D., and Dadson, S.: Increasing risks of multiple breadbasket failure under 1.5 and 2 °C global warming, Agric. Syst., 175, 34–45, https://doi.org/10.1016/j.agsy.2019.05.010, 2019.
Godfray, H. C. J., Beddington, J. R., Crute, I. R., Haddad, L., Lawrence, D., Muir, J. F., Pretty, J., Robinson, S., Thomas, S. M., and Toulmin, C.: Food security: The challenge of feeding 9 billion people, Science, 327, 812–818, https://doi.org/10.1126/science.1185383, 2010.
Haghighi, E., Shahraeeni, E., Lehmann, P., and Or, D.: Evaporation rates across a convective air boundary layer are dominated by diffusion, Water Resour. Res., 49, 1602–1610, https://doi.org/10.1002/wrcr.20166, 2013.
He, D., Wang, E., Wang, J., and Robertson, M. J.: Data requirement for effective calibration of process-based crop models, Agr. Forest Meteorol., 234, 136–148, https://doi.org/10.1016/j.agrformet.2016.12.015, 2017.
He, L., Lipson, D. A., Mazza Rodrigues, J. L., Mayes, M., Björk, R. G., Glaser, B., Thornton, P., and Xu, X.: Dynamics of fungal and bacterial biomass carbon in natural ecosystems: Site-level applications of the CLM-microbe model, J. Adv. Model. Earth Sy., 13, e2020MS002283, https://doi.org/10.1029/2020MS002283, 2021.
Heinesch, B., Bodson, B., Chopin, H., De Ligne, A., Demoulin, L., Douxfils, B., Engelmann, T., Faurès, A., Longdoz, B., Manise, T., Piret, A., and Thyrion, T.: Fluxnet Product, Lonzee, 2003-12-31–2020-12-31, https://hdl.handle.net/11676/ql2ZkJ2Xx4a4yOyG3cd5lsBS (last access: 26 February 2025), 2021.
Hollinger, D. Y. and Richardson, A. D.: Uncertainty in eddy covariance measurements and its application to physiological models, Tree Physiol., 25, 873–885, https://doi.org/10.1093/treephys/25.7.873, 2005.
Hörtnagl, L., Barthel, M., Buchmann, N., Eugster, W., Butterbach-Bahl, K., Díaz-Pinés, E., Zeeman, M., Klumpp, K., Kiese, R., Bahn, M., and Hammerle, A.: Greenhouse gas fluxes over managed grasslands in Central Europe, Glob. Change Biol., 24, 1843–1872, https://doi.org/10.1111/gcb.14079, 2018.
Hussain, S., Ulhassan, Z., Brestic, M., Zivcak, M., Zhou, W., Allakhverdiev, S. I., Yang, X., Safdar, M. E., Yang, W., and Liu, W.: Photosynthesis research under climate change, Photosynth. Res., 150, 5–19, https://doi.org/10.1007/s11120-021-00861-z, 2021.
Ingwersen, J., Högy, P., Wizemann, H. D., Warrach-Sagi, K., and Streck, T.: Coupling the land surface model Noah-MP with the generic crop growth model Gecros: Model description, calibration and validation, Agr. Forest Meteorol., 262, 322–339, https://doi.org/10.1016/j.agrformet.2018.06.023, 2018.
Jacquemin, I., Berckmans, J., Henrot, A. J., Dury, M., Tychon, B., Hambuckers, A., Hamdi, R., and François, L.: Using the CARAIB dynamic vegetation model to simulate crop yields in Belgium: Validation and projections for the 2035 horizon, Geo-Eco-Trop, 44, https://hdl.handle.net/2268/256139 (last access: 26 February 2025), 2021.
Kattge, J., Bönisch, G., Díaz, S., Lavorel, S., Prentice, I. C., Leadley, P., Tautenhahn, S., Werner, G. D., Aakala, T., Abedi, M., and Acosta, A. T.: TRY plant trait database – enhanced coverage and open access, Glob. Change Biol., 26, 119–188, https://doi.org/10.1111/gcb.14904, 2020.
Khanal, S., Kc, K., Fulton, J. P., Shearer, S., and Ozkan, E.: Remote sensing in agriculture – accomplishments, limitations, and opportunities, Remote Sens., 12, 3783, https://doi.org/10.3390/rs12223783, 2020.
Kim, S. M. and Mendelsohn, R.: Climate change to increase crop failure in US, Environ. Res. Lett., 18, 014014, https://doi.org/10.1088/1748-9326/acac41, 2023.
Krinner, G., Viovy, N., de Noblet-Ducoudré, N., Ogée, J., Polcher, J., Friedlingstein, P., Ciais, P., Sitch, S., and Prentice, I. C.: A dynamic global vegetation model for studies of the coupled atmosphere-biosphere system, Global Biogeochem. Cy., 19, GB1015, https://doi.org/10.1029/2003GB002199, 2005.
Lawlor, D. W. and Mitchell, R. A. C.: The effects of increasing CO2 on crop photosynthesis and productivity: A review of field studies, Plant Cell Environ., 14, 807–818, https://doi.org/10.1111/j.1365-3040.1991.tb01444.x, 1991.
Leng, G. and Hall, J. W.: Predicting spatial and temporal variability in crop yields: An inter-comparison of machine learning, regression, and process-based models, Environ. Res. Lett., 15, 044027, https://doi.org/10.1088/1748-9326/ab7b24, 2020.
Leuning, R.: Modelling stomatal behaviour and photosynthesis of Eucalyptus grandis, Aust. J. Plant Physiol., 17, 159–175, https://doi.org/10.1071/PP9900159, 1990.
Leuning, R.: A critical appraisal of a combined stomatal-photosynthesis model for C3 plants, Plant Cell Environ., 18, 357–364, https://doi.org/10.1111/j.1365-3040.1995.tb00370.x, 1995.
Li, Z., Zhan, C., Hu, S., Ning, L., Wu, L., and Guo, H.: Implementation of a dynamic specific leaf area (SLA) into a land surface model (LSM) incorporated crop-growth model, Comput. Electron. Agric., 213, 108238, https://doi.org/10.1016/j.compag.2023.108238, 2023.
Lobell, D. B. and Asseng, S.: Comparing estimates of climate change impacts from process-based and statistical crop models, Environ. Res. Lett., 12, 015001, https://doi.org/10.1088/1748-9326/aa518a, 2017.
Lobell, D. B. and Burke, M. B.: On the use of statistical models to predict crop yield responses to climate change, Agr. Forest Meteorol., 150, 1443–1452, https://doi.org/10.1016/j.agrformet.2010.07.008, 2010.
Manoli, G., Meijide, A., Huth, N., Knohl, A., Kosugi, Y., Burlando, P., Ghazoul, J., and Fatichi, S.: Ecohydrological changes after tropical forest conversion to oil palm, Environ. Res. Lett., 13, 064035, https://doi.org/10.1088/1748-9326/aac54e, 2018.
Mastrotheodoros, T., Pappas, C., Molnar, P., Burlando, P., Manoli, G., Parajka, J., Rigon, R., Szeles, B., Bottazzi, M., Hadjidoukas, P., and Fatichi, S.: More green and less blue water in the Alps during warmer summers, Nat. Clim. Change, 10, 155–161, https://doi.org/10.1038/s41558-019-0676-5, 2020.
McGrath, J. M. and Lobell, D. B.: Regional disparities in the CO2 fertilization effect and implications for crop yields, Environ. Res. Lett., 8, 014054, https://doi.org/10.1088/1748-9326/8/1/014054, 2013.
Moustakis, Y., Papalexiou, S. M., Onof, C. J., and Paschalis, A.: Seasonality, intensity, and duration of rainfall extremes change in a warmer climate, Earth's Future, 9, e2020EF001824, https://doi.org/10.1029/2020EF001824, 2021.
Muller, B. and Martre, P.: Plant and crop simulation models: powerful tools to link physiology, genetics, and phenomics, J. Exp. Bot., 70, 2339–2344, https://doi.org/10.1093/jxb/erz175, 2019.
Niyogi, D. S. and Raman, S.: Comparison of four different stomatal resistance schemes using FIFE observations, J. Appl. Meteorol., 36, 903–917, https://doi.org/10.1175/1520-0450(1997)036<0903:COFDSR>2.0.CO;2, 1997.
Ortiz-Bobea, A., Ault, T. R., Carrillo, C. M., Chambers, R. G., and Lobell, D. B.: Anthropogenic climate change has slowed global agricultural productivity growth, Nat. Clim. Change, 11, 306–312, https://doi.org/10.1038/s41558-021-01000-1, 2021.
Osborne, T., Gornall, J., Hooker, J., Williams, K., Wiltshire, A., Betts, R., and Wheeler, T.: JULES-crop: a parametrisation of crops in the Joint UK Land Environment Simulator, Geosci. Model Dev., 8, 1139–1155, https://doi.org/10.5194/gmd-8-1139-2015, 2015.
Paschalis, A., Katul, G. G., Fatichi, S., Palmroth, S., and Way, D.: On the variability of the ecosystem response to elevated atmospheric CO2 across spatial and temporal scales at the Duke Forest FACE experiment, Agr. Forest Meteorol., 232, 367–383, https://doi.org/10.1016/j.agrformet.2016.09.003, 2017.
Paschalis, A., Bonetti, S., Guo, Y., and Fatichi, S.: On the uncertainty induced by pedotransfer functions in terrestrial biosphere modeling, Water Resour. Res., 58, e2021WR031871, https://doi.org/10.1029/2021WR031871, 2022.
Paschalis, A., De Kauwe, M. G., Sabot, M., and Fatichi, S.: When do plant hydraulics matter in terrestrial biosphere modelling?, Glob. Change Biol., 30, e17022, https://doi.org/10.1111/gcb.17022, 2024.
Peleg, N., Fatichi, S., Paschalis, A., Molnar, P., and Burlando, P.: An advanced stochastic weather generator for simulating 2-D high-resolution climate variables, J. Adv. Model. Earth Syst., 9, 1595–1627, https://doi.org/10.1002/2016MS000854, 2017.
Peng, B., Guan, K., Chen, M., Lawrence, D. M., Pokhrel, Y., Suyker, A., and Lu, Y.: Improving maize growth processes in the Community Land Model: Implementation and evaluation, Agr. Forest Meteorol., 250, 64–89, https://doi.org/10.1016/j.agrformet.2017.11.012, 2018.
Polley, H. W.: Implications of atmospheric and climatic change for crop yield and water use efficiency, Crop Sci., 42, 131–140, https://doi.org/10.2135/cropsci2002.1310, 2002.
Revill, A., Emmel, C., D’Odorico, P., Buchmann, N., Hörtnagl, L., and Eugster, W.: Estimating cropland carbon fluxes: A process-based model evaluation at a Swiss crop-rotation site, Field Crops Res., 234, 95–106, https://doi.org/10.1016/j.fcr.2019.02.006, 2019.
Roberts, M. J., Braun, N. O., Sinclair, T. R., Lobell, D. B., and Schlenker, W.: Comparing and combining process-based crop models and statistical models with some implications for climate change, Environ. Res. Lett., 12, 095010, https://doi.org/10.1088/1748-9326/aa7f33, 2017.
Saxton, K. E. and Rawls, W. J.: Soil water characteristic estimates by texture and organic matter for hydrologic solutions, Soil Sci. Soc. Am. J., 70, 1569–1578, https://doi.org/10.2136/sssaj2005.0117, 2006.
Semenov, M. A.: Impacts of climate change on wheat in England and Wales, J. Roy. Soc. Int., 6, 343–350, https://doi.org/10.1098/rsif.2008.0285, 2009.
Sheehy, J. E., Mitchell, P. L., and Ferrer, A. B.: Decline in rice grain yields with temperature: Models and correlations can give different estimates, Field Crops Res., 98, 151–156, https://doi.org/10.1016/j.fcr.2006.01.001, 2006.
Sheng, M., Liu, J., Zhu, A. X., Rossiter, D. G., Zhu, L., and Peng, G.: Evaluation of CLM-Crop for maize growth simulation over Northeast China, Ecol. Model., 377, 26–34, https://doi.org/10.1016/j.ecolmodel.2018.03.005, 2018.
Slater, L. J., Huntingford, C., Pywell, R. F., Redhead, J. W., and Kendon, E. J.: Resilience of UK crop yields to compound climate change, Earth Syst. Dynam., 13, 1377–1396, https://doi.org/10.5194/esd-13-1377-2022, 2022.
Steduto, P., Hsiao, T. C., Raes, D., and Fereres, E.: AquaCrop – The FAO crop model to simulate yield response to water: I. Concepts and underlying principles, Agron. J., 101, 426–437, https://doi.org/10.2134/agronj2008.0139s, 2009.
Suyker, A., Verma, S., Burba, G., Arkebauer, T., Walters, D., and Hubbard, K.: Growing season carbon dioxide exchange in irrigated and rainfed maize, Agr. Forest Meteorol., 124, 1–13, https://doi.org/10.1016/j.agrformet.2004.01.011, 2004.
Suzuki, S., Nakamoto, H., Ku, M. S., and Edwards, G. E.: Influence of leaf age on photosynthesis, enzyme activity, and metabolite levels in wheat, Plant Physiol., 84, 1244–1248, https://doi.org/10.1104/pp.84.4.1244, 1987.
Ukkola, A. M., De Kauwe, M. G., Roderick, M. L., Abramowitz, G., and Pitman, A. J.: Robust future changes in meteorological drought in CMIP6 projections despite uncertainty in precipitation, Geophys. Res. Lett., 47, e2020GL087820, https://doi.org/10.1029/2020GL087820, 2020.
Van Klompenburg, T., Kassahun, A., and Catal, C.: Crop yield prediction using machine learning: A systematic literature review, Comput. Electron. Agric., 177, 105709, https://doi.org/10.1016/j.compag.2020.105709, 2020.
Waha, K., Müller, C., and Rolinski, S.: Separate and combined effects of temperature and precipitation change on maize yields in sub-Saharan Africa for mid-to late-21st century, Global Planet. Change, 106, 1–12, https://doi.org/10.1016/j.gloplacha.2013.02.009, 2013.
Wang, W., Pijl, A., and Tarolli, P.: Future climate-zone shifts are threatening steep-slope agriculture, Nat. Food, 3, 193–196, https://doi.org/10.1038/s43016-021-00454-y, 2022.
Wang, Y.-P. and Leuning, R.: A two-leaf model for canopy conductance, photosynthesis and portioning of available energy I: Model description and comparison with a multi-layered model, Agr. Forest Meteorol., 91, 89–111, https://doi.org/10.1016/j.agrformet.1998.01.004, 1998.
Williams, K., Gornall, J., Harper, A., Wiltshire, A., Hemming, D., Quaife, T., Arkebauer, T., and Scoby, D.: Evaluation of JULES-crop performance against site observations of irrigated maize from Mead, Nebraska, Geosci. Model Dev., 10, 1291–1320, https://doi.org/10.5194/gmd-10-1291-2017, 2017.
Wiltshire, A. J., Burke, E. J., Chadburn, S. E., Jones, C. D., Cox, P. M., Davies-Barnard, T., Friedlingstein, P., Harper, A. B., Liddicoat, S., Sitch, S., and Zaehle, S.: JULES-CN: a coupled terrestrial carbon–nitrogen scheme (JULES vn5.1), Geosci. Model Dev., 14, 2161–2186, https://doi.org/10.5194/gmd-14-2161-2021, 2021.
Wu, B., Zhang, M., Zeng, H., Tian, F., Potgieter, A. B., Qin, X., Yan, N., Chang, S., Zhao, Y., Dong, Q., and Boken, V.: Challenges and opportunities in remote sensing-based crop monitoring: A review, Nat. Sci. Rev., 10, nwac290, https://doi.org/10.1093/nsr/nwac290, 2023.
Wu, X., Vuichard, N., Ciais, P., Viovy, N., de Noblet-Ducoudré, N., Wang, X., Magliulo, V., Wattenbach, M., Vitale, L., Di Tommasi, P., Moors, E. J., Jans, W., Elbers, J., Ceschia, E., Tallec, T., Bernhofer, C., Grünwald, T., Moureaux, C., Manise, T., Ligne, A., Cellier, P., Loubet, B., Larmanou, E., and Ripoche, D.: ORCHIDEE-CROP (v0), a new process-based agro-land surface model: model description and evaluation over Europe, Geosci. Model Dev., 9, 857–873, https://doi.org/10.5194/gmd-9-857-2016, 2016.
Zhang, W., Liu, C., Zheng, X., Wang, K., Cui, F., Wang, R., Li, S., Yao, Z., and Zhu, J.: Using a modified DNDC biogeochemical model to optimize field management of a multi-crop (cotton, wheat, and maize) system: a site-scale case study in northern China, Biogeosciences, 16, 2905–2922, https://doi.org/10.5194/bg-16-2905-2019, 2019.