the Creative Commons Attribution 4.0 License.
the Creative Commons Attribution 4.0 License.
 | 05 Feb 2024
SAMM version 1.0: a numerical model for microbial- mediated soil aggregate formation
Sergey Blagodatsky
Marijn Van de Broek
Samuel Schlichenmaier
Benjapon Kunlanit
Johan Six
Patma Vityakon
Georg Cadisch
Maintaining soil organic matter (SOM) is crucial for healthy and productive agricultural soils and requires understanding at the process level, including the role of SOM protection by soil aggregates and the connection between microbial growth and aggregate formation. We developed the Soil Aggregation through Microbial Mediation (SAMM) model, to represent this important connection. The pools of SAMM are fully measurable, and we calibrated and evaluated it against data from a long-term bare fallow experiment in a tropical sandy soil. This experiment received additions of plant litter of different compositions, which resulted in twice the soil carbon stocks in the best treatment compared to the control (about 8 vs. 4 t C ha−1 in 0–15 cm soil depth) after 25 years. As hypothesized, the SAMM model effectively represented the microbial growth response after the addition of litter and the subsequent formation and later destabilization of aggregates. The low correlations between different calibrated model parameters (r<0.5 for all parameters; r>0.4 for only 4 of 22) showed that SAMM is parsimonious. SAMM was able to capture differences between treatments in soil organic carbon (Nash–Sutcliffe modeling efficiency (EF) of 0.68), microbial nitrogen (EF of 0.24), and litter carbon (EF of 0.80). The amount of carbon within the aggregates (EF of 0.60) and in the free silt and clay fraction (EF of 0.24) was also simulated very well to satisfactorily. Our model results suggested that in spite of the sandy soil, up to 50 % of carbon stocks were stabilized through aggregate protection mechanisms; and that microbial and physical aggregate formation coexists. A version of the SAMM model without aggregate protection (SAMMnoAgg) initially failed to stabilize soil organic carbon (EF decreased to −3.68) and the simulation of microbial nitrogen worsened (EF of 0.13). By recalibrating SAMMnoAgg, it was possible to partially correct for the lack of aggregate protection by reducing the rate of mineral-attached carbon decomposition by about 85 % (EF of 0.68, 0.75, and 0.18 for SOC, litter carbon, and microbial nitrogen, respectively). However, the slightly better evaluation statistics of SAMM (e.g., Akaike information criterion of 5351 vs. 5554) suggest that representing aggregate dynamics in SOM models can be beneficial and necessary to understand the mechanism behind SOM dynamics. Our results indicate that current models without aggregate formation partly compensate for the absence of aggregate protection by lowering the turnover rates of other pools. Thus, they remain suitable options where data on aggregate associated carbon are not available.
Please read the corrigendum first before continuing.
-
Notice on corrigendum
The requested paper has a corresponding corrigendum published. Please read the corrigendum first before downloading the article.
-
Article
(9179 KB)
-
The requested paper has a corresponding corrigendum published. Please read the corrigendum first before downloading the article.
- Article
(9179 KB) - Full-text XML
- Corrigendum
- BibTeX
- EndNote


Soil aggregates play a crucial role in the context of soil carbon sequestration because soil organic matter (SOM) that is stabilized in aggregates is a fraction of SOM that is strongly affected by human activities (Six and Paustian, 2014). There is evidence that the particulate organic matter (POM) stored within the aggregates may be the fraction of SOM that saturates the least if carbon inputs are increased (Castellano et al., 2015), and thus may be a suitable fraction to target for the accumulation of SOM. However, exactly this intra-aggregate POM becomes relatively easily available to decomposers upon disruption of aggregates (Six et al., 2000) and may therefore be considered to be labile. Mineral-associated organic matter (MAOM), on the other hand, is considered to have slower turnover rates, but the pathways upon which it is formed are not completely clear. For example, the concepts of Kallenbach et al. (2016) and Cotrufo et al. (2013) suggest that most of the stable MAOM is of microbial origin, while Angst et al. (2021) recently estimated that about half of MAOM is formed through direct adsorption of dissolved organic matter to soil minerals. As a result, we need a better understanding of the relative importance of the different processes of SOM stabilization, such as MAOM formation and POM protection within aggregates.
Numerical models are a good way to test our mechanistic understanding of complex systems, such as soils, and to improve knowledge of interconnected processes by testing different hypotheses about the system. They allow us to quantify fluxes which are not directly measurable and to test one or several conceptual structures of a system against measured data (Necpálová et al., 2015). Thus, they represent an elegant way to test research hypotheses. Despite the existence of conceptual models, the central role of microbial growth in aggregate formation is still incompletely understood and is only poorly represented in current SOM research models that are developed for the field scale. The initial attempts of Segoli et al. (2013), for example, modeled the formation and destruction of micro- and macroaggregates by including a simple microbial activity factor. However, the model was not further developed into an ecosystem model and therefore is only applicable to shorter-term incubation experiments. The Millennial model (Abramoff et al., 2018, 2022) has a specific microbial biomass pool and distinguishes between aggregated and non-aggregated carbon, but its temporal dynamics have not been evaluated against long-term experiments and it does not simulate the effect of nitrogen on the dynamics of SOM.
In the sense of using models to test important research hypotheses, three important concepts and/or processes related to aggregate formation should therefore be included into models. The first important process is the effect that the composition of the plant residue and the elemental stoichiometry (Sinsabaugh et al., 2013) have on the carbon use efficiency (CUE) of the microbes. It is considered a key factor in stabilizing SOC (Cotrufo et al., 2013). For example, Lavallee et al. (2018) showed that shoot material leads to more stabilized MAOM than root material, which they attributed to a higher CUE for the shoot material due to higher quality (i.e., low and lignin; Cotrufo et al., 2013). Also Laub et al. (2022), in a long-term field experiment, found differences in aggregate dynamics between the additions of different types of litter and suggested that these were the result of different CUE that depended on the composition of the litter. Secondly, the effect of microbial activity on aggregate formation must be considered. Many studies in the literature have shown the direct link between aggregate dynamics and microbial functioning. For example, Bucka et al. (2019) showed, under incubation conditions, that microbial activity associated with dissolved organic matter and POM formed aggregates rapidly. Third, measurable pools. It has been suggested numerous times that next-generation SOM models should model carbon pools that are directly measurable (Segoli et al., 2013; Wang et al., 2013; Wieder et al., 2014). However, when doing so, one should adhere as much as possible to the principle of distinct structural identity (e.g., Oldfield et al., 2018; Wang et al., 2022; de Aguiar et al., 2022). Thus, in an optimal model based on measurable pools, any quantity of carbon should maintain its structural identity until it is subject to an actual molecular change. This means that if carbon transfers from one modeled pool to another, this should correspond not only to a transfer of matter between the pools but also to a chemical or physical reaction (e.g., depolymerization, anabolic microbial growth, or adsorption to minerals). As such, MAOM and POM have been identified as possible modellable pools of relative distinct structural identities (e.g., Segoli et al., 2013; Lavallee et al., 2020) and are commonly accepted as the main building blocks of aggregates (Totsche et al., 2018). Furthermore, they can be derived from established soil fractionation schemes and differ strongly in average turnover times and properties (Lavallee et al., 2020; Schrumpf et al., 2013). While POM consists mostly of undecomposed plant material, stabilized MAOM originates either from microbial residues (Kallenbach et al., 2016; Six et al., 2006) or from dissolved organic matter (Angst et al., 2021).
Here, we present an approach to include all the aforementioned concepts into a model of Soil Aggregation through Microbial Mediation (SAMM). SAMM is based on the foundations introduced by mechanistic SOM models, such as simulating measurable fractions and aggregates (Abramoff et al., 2018, 2022; Segoli et al., 2013) and the decomposition of plant-derived carbon to low-molecular-weight carbon, before consumption by microbes (Tang and Riley, 2015; Wang et al., 2013; Zhang et al., 2021). It enriches these concepts by (1) the central role of microbes in soil aggregate formation and (2) a consistent structural identity of POM and MAOM within aggregates. We applied the model to simulate data from a long-term SOM formation experiment in a tropical sandy soil in northeast Thailand, which included inputs of litter of different compositions and a non-amended control. SAMM was tested against measured data of microbial biomass, SOC, and carbon in different soil fractions. To better understand the model and its uncertainty, a Bayesian calibration of the model parameters was performed. The calibrated model was then used to test three main hypotheses:
-
Simulating the connection between microbial growth and aggregate formation with SAMM helps to quantify the relative importance of different SOM stabilizing processes.
-
Including this connection in SOM models is essential to accurately represent the dynamics of SOM formation. Therefore, a model that explicitly simulates aggregate formation as a result of microbial growth will outperform a model of similar structure that does not include aggregate formation.
-
The dynamics of microbial activity, which are linked to temperature, moisture, and litter composition, help to explain dynamics in aggregate formation. Thus, we expect that aggregates can be simulated with model performance similar to that of microbial biomass.
Table 1Chemical characteristics of applied organic residues/litter. Total carbon was measured by Walkley–Black wet digestion; total nitrogen by micro-Kjeldahl; lignin and cellulose by the acid detergent lignin method (Van Soest and Wine, 1968); polyphenols were determined according to Anderson and Ingram (1993). Values within the same column that share the same uppercase letter are not significantly different (p<0.05). The table is adopted from Laub et al. (2022) under creative common license 4: http://creativecommons.org/licenses/by/4.0/ (last access: 31 January 2024).
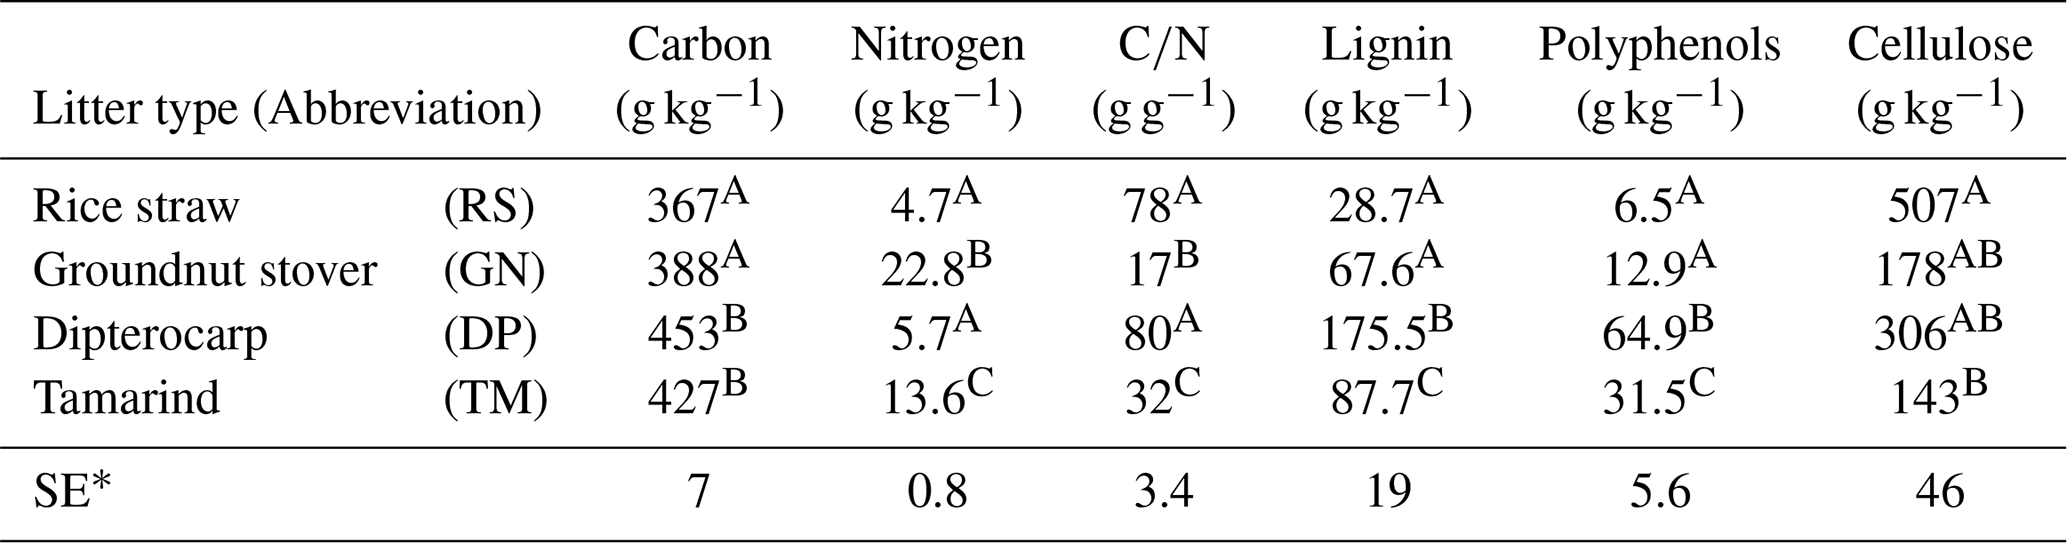
∗ Standard error
2.1 Description of the experiment
We tested the capability of SAMM in a long-term bare fallow experiment, which was established on a degraded tropical sandy soil in 1995 (Vityakon et al., 2000; Puttaso et al., 2011, 2013; Laub et al., 2022). In brief, the experiment was initiated to study the effects of annual additions of organic material (at a rate of 10 t dry matter ha−1 yr−1) of different compositions on the dynamics of soil organic matter. The experiment is located within the research station of the Office of Agriculture and Cooperatives of the Northeast, Khon Kaen province (16∘20′ N; 102∘49′ E, https://goo.gl/maps/uCjHzoDNG2fSRXNZ9, last access: 31 January 2024) in northeast Thailand. The soil is a Khorat sandy loam (Typic Kandiustult in USDA, Acrisol in WRB classification) with 90 % sand and 5 % clay (Puttaso et al., 2013). At the start of the experiment, the bulk density was 1.45 g cm−3, the pH was 5.5 and the CEC 3.53 cmol kg−1 in the 0–15 cm topsoil (Vityakon et al., 2000). Later measurements did not find significant changes in bulk density attributable to treatments (Fig. A5), and thus we assumed a constant bulk density of 1.45 g cm−3 throughout the period for all treatments in this study. The site has a savanna-type climate with a wet period from April to September with approximately 1200 mm annual precipitation and a mean temperature of 28 ∘C (Puttaso et al., 2013). The experiment was a randomized complete block design with three replicated plots of 4×4 m size. The annual litter application of 10 t ha−1 dry matter at the beginning of the rainy season around May supplied about 4 t carbon ha−1 yr−1. Next to an unamended control (CT), the litter treatments were rice (Oryza sativa) straw (RS; high , low lignin and polyphenol contents), groundnut (Arachis hypogaea) stover (GN; low , low lignin and polyphenol contents), tamarind (Tamarindus indica) litter (TM; medium , medium lignin and polyphenol contents) with a leaf to petiole litter ratio of 7:1, and dipterocarp (Dipterocarpus tuberculatus; DP; high , high lignin and polyphenol contents) leaf litter (Table 1). The applied litter was manually incorporated into the topsoil to a depth of approximately 15–20 cm using hand hoes. Hand weeding was conducted to keep the plots free of vegetation. This was done about once a month during the rainy season and every second month for the rest of the year, attempting to have as little as possible additional organic matter input from weeds. However, despite the best efforts it was not possible to keep the plots completely free of vegetation at all times. The experimental data covered a period from the establishment of the experiment in 1995 to December 2019.
Table 2Overview of all measurements from the Khon Kaen long-term experiment that were used in this study.
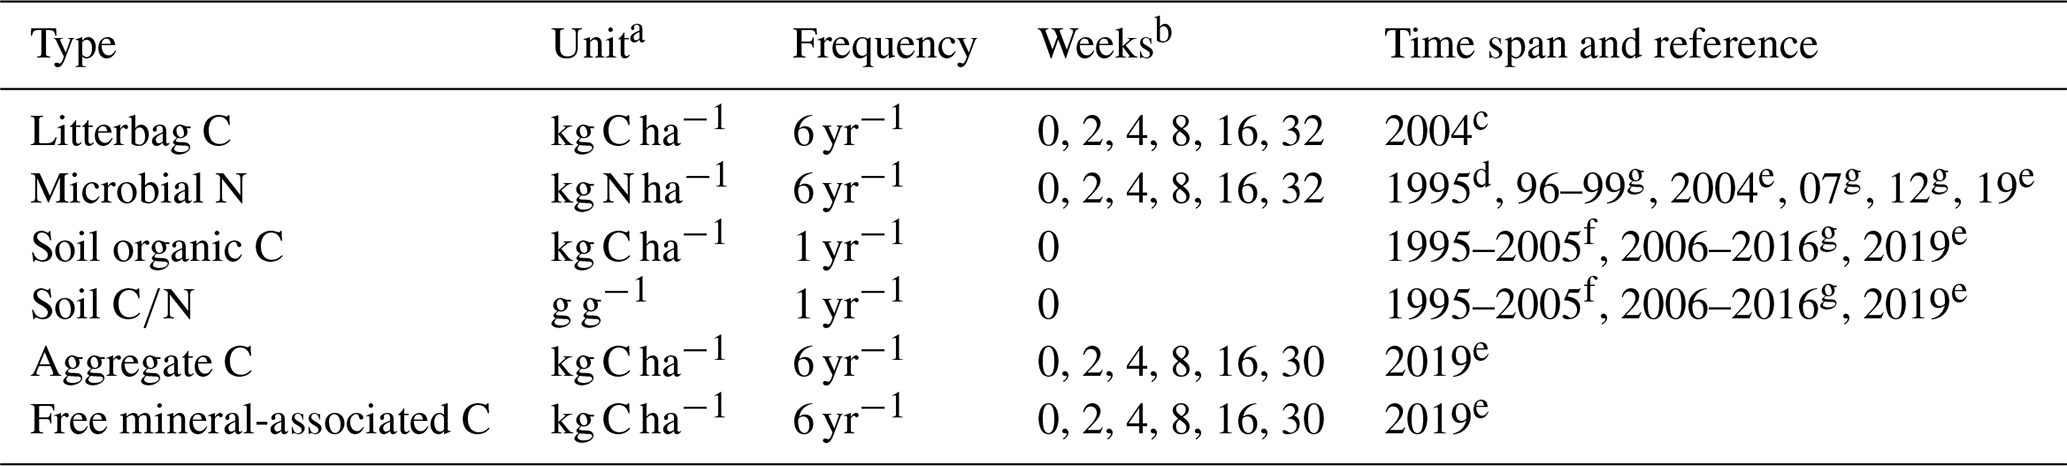
a Data rescaled to kg ha−1 using 15 cm soil depth and a bulk density of 1.45 g cm−3; b Weeks after residue addition (0 = prior); References: c Puttaso et al. (2011), d Vityakon et al. (2000), e Laub et al. (2022), f Vityakon (2007), g Unpublished
2.2 Available long-term experiment data that were simulated with SAMM
Carbon and nitrogen data from soil microbial biomass were available from most years and were always measured prior to the incorporation of litter and at weeks 2, 4, 8, 16, and 32 after the addition of litter (Puttaso et al., 2011; Vityakon et al., 2000; Vityakon, 2007; Laub et al., 2022, and unpublished data in Table 2). Litterbag decomposition experiments were conducted to elucidate differences in litter decomposition rates as a function of litter composition, measuring ash-free dry weight remaining at the same points in time (Puttaso et al., 2011). The soil microbial biomass was measured by chloroform fumigation extraction (see Puttaso et al., 2011, for more details). Because microbial carbon and nitrogen are usually correlated, we only used microbial nitrogen data, which were of higher quality (fewer negative values than carbon, lower variability within treatments). Annual measurements of soil organic carbon and soil data, measured by the Walkley–Black method (Walkley and Black, 1934), were available from Vityakon et al. (2000) and from additional annual measurements until 2016 and from 2019. Furthermore, there were measurements of carbon in aggregates (carbon in small macroaggregates, 2–0.25 mm; and microaggregates, 0.25–0.053 mm; combined) and the free silt and clay faction (MAOC) throughout the year 2019 at weeks 0, 2, 4, 8, 16, and 30 (Laub et al., 2022).
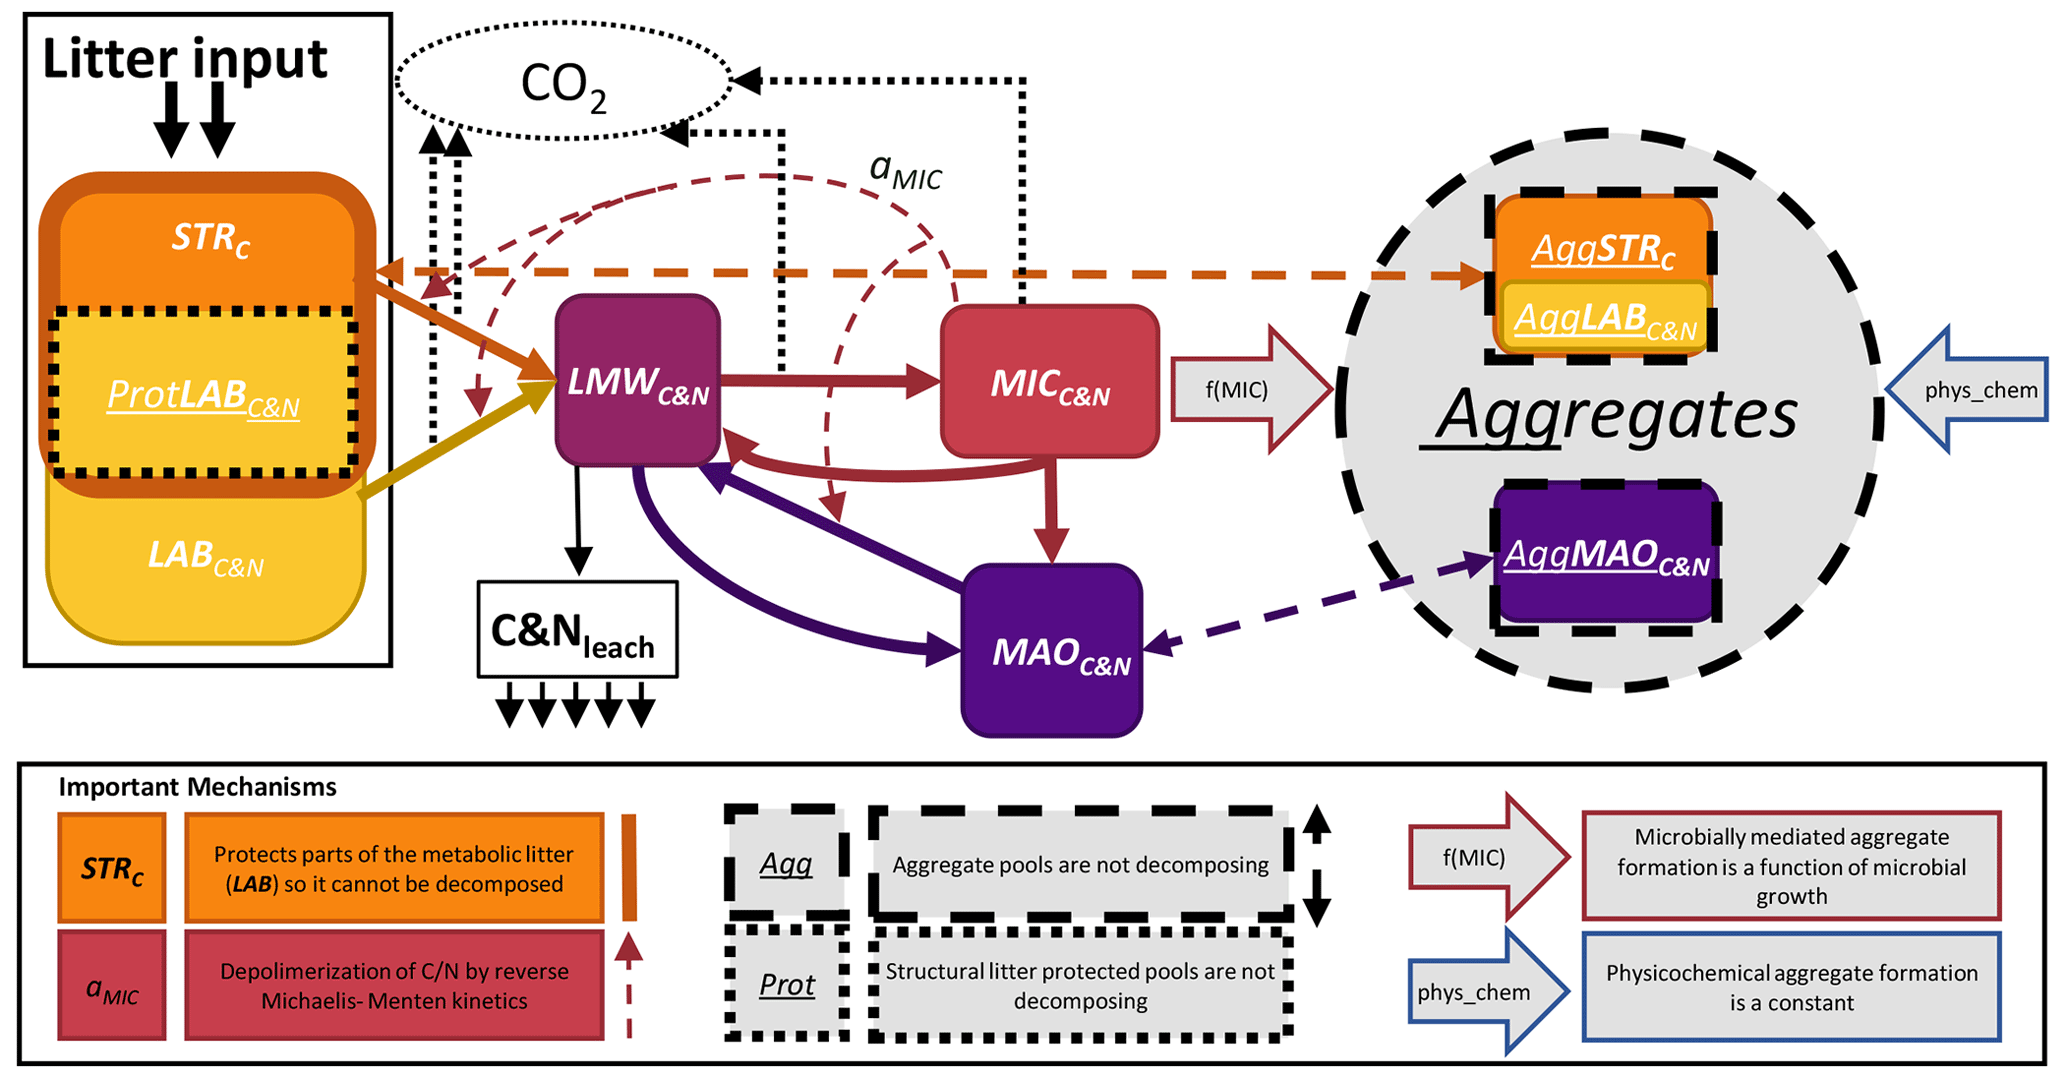
Figure 1Conceptual model of SAMM. The carbon and nitrogen in the pools are represented as PoolC&N or PoolC for the pools only with carbon. The following pools exist: STRC, structural litter; LABC&N, labile litter; LMWC&N, low molecular weight; MICC&N, microbial; MAOC&N, mineral-associated. Thick solid arrows represent flows of carbon and nitrogen between pools that include a change in structural identity. The thick dashed arrows represent aggregate protection and deprotection, which does not change the structural identity. The effect of MICC&N on pool decomposition by reverse Michaelis–Menten kinetics (aMIC parameter) is represented by the thin dashed arrow. The two large arrows with a colored outline represent the factors that influence the rate of aggregate formation. Losses from the system are represented by thin dotted arrows (CO2) and solid arrows (leaching). Further abbreviations: Prot, protected by structural litter; Agg, aggregate-protected pools.
2.3 SAMM model version 1.0: core concepts and model description
The core concepts of SAMM are (1) all pools are measurable entities that adhere to the concept of structural carbon identity (Wang et al., 2022), which they maintain within the aggregates and along the gradient of increased decomposition status, (2) linking the formation of the aggregates with the microbial life cycle, and (3) simulating aggregates in a coupled soil carbon and nitrogen model. For brevity, we only explain the central concepts of SAMM and the flow of carbon and nitrogen in the main text, while the Appendix hosts a detailed description of model pools (Appendix A1) and the differential equations comprising the SAMM model (Sect. A3). A list of all model pools is given in Table 3, while all parameters and their calibrated values are given in Table 4.
To achieve complete measurability, the simulated fresh litter was divided into two pools: structural litter measured as lignin and polyphenols (similar to Campbell et al., 2016), and labile (metabolic) litter representing the carbon and nitrogen of the remaining litter, thus allowing for different CUE and decomposition rates resulting in differences in microbial growth. By simulating both carbon and nitrogen, the model further allows for a ratio-dependent CUE at microbial uptake. The carbon and nitrogen cycles are coupled (Fig. 1 and Table 3), but the structural litter pool is defined as a carbon-only pool. This is indicated in the following by the subscripts next to the pool names (i.e., PoolC for carbon-only, and PoolC&N for carbon- and nitrogen-containing pools).
Table 3Overview of all SAMM model pools and their units.
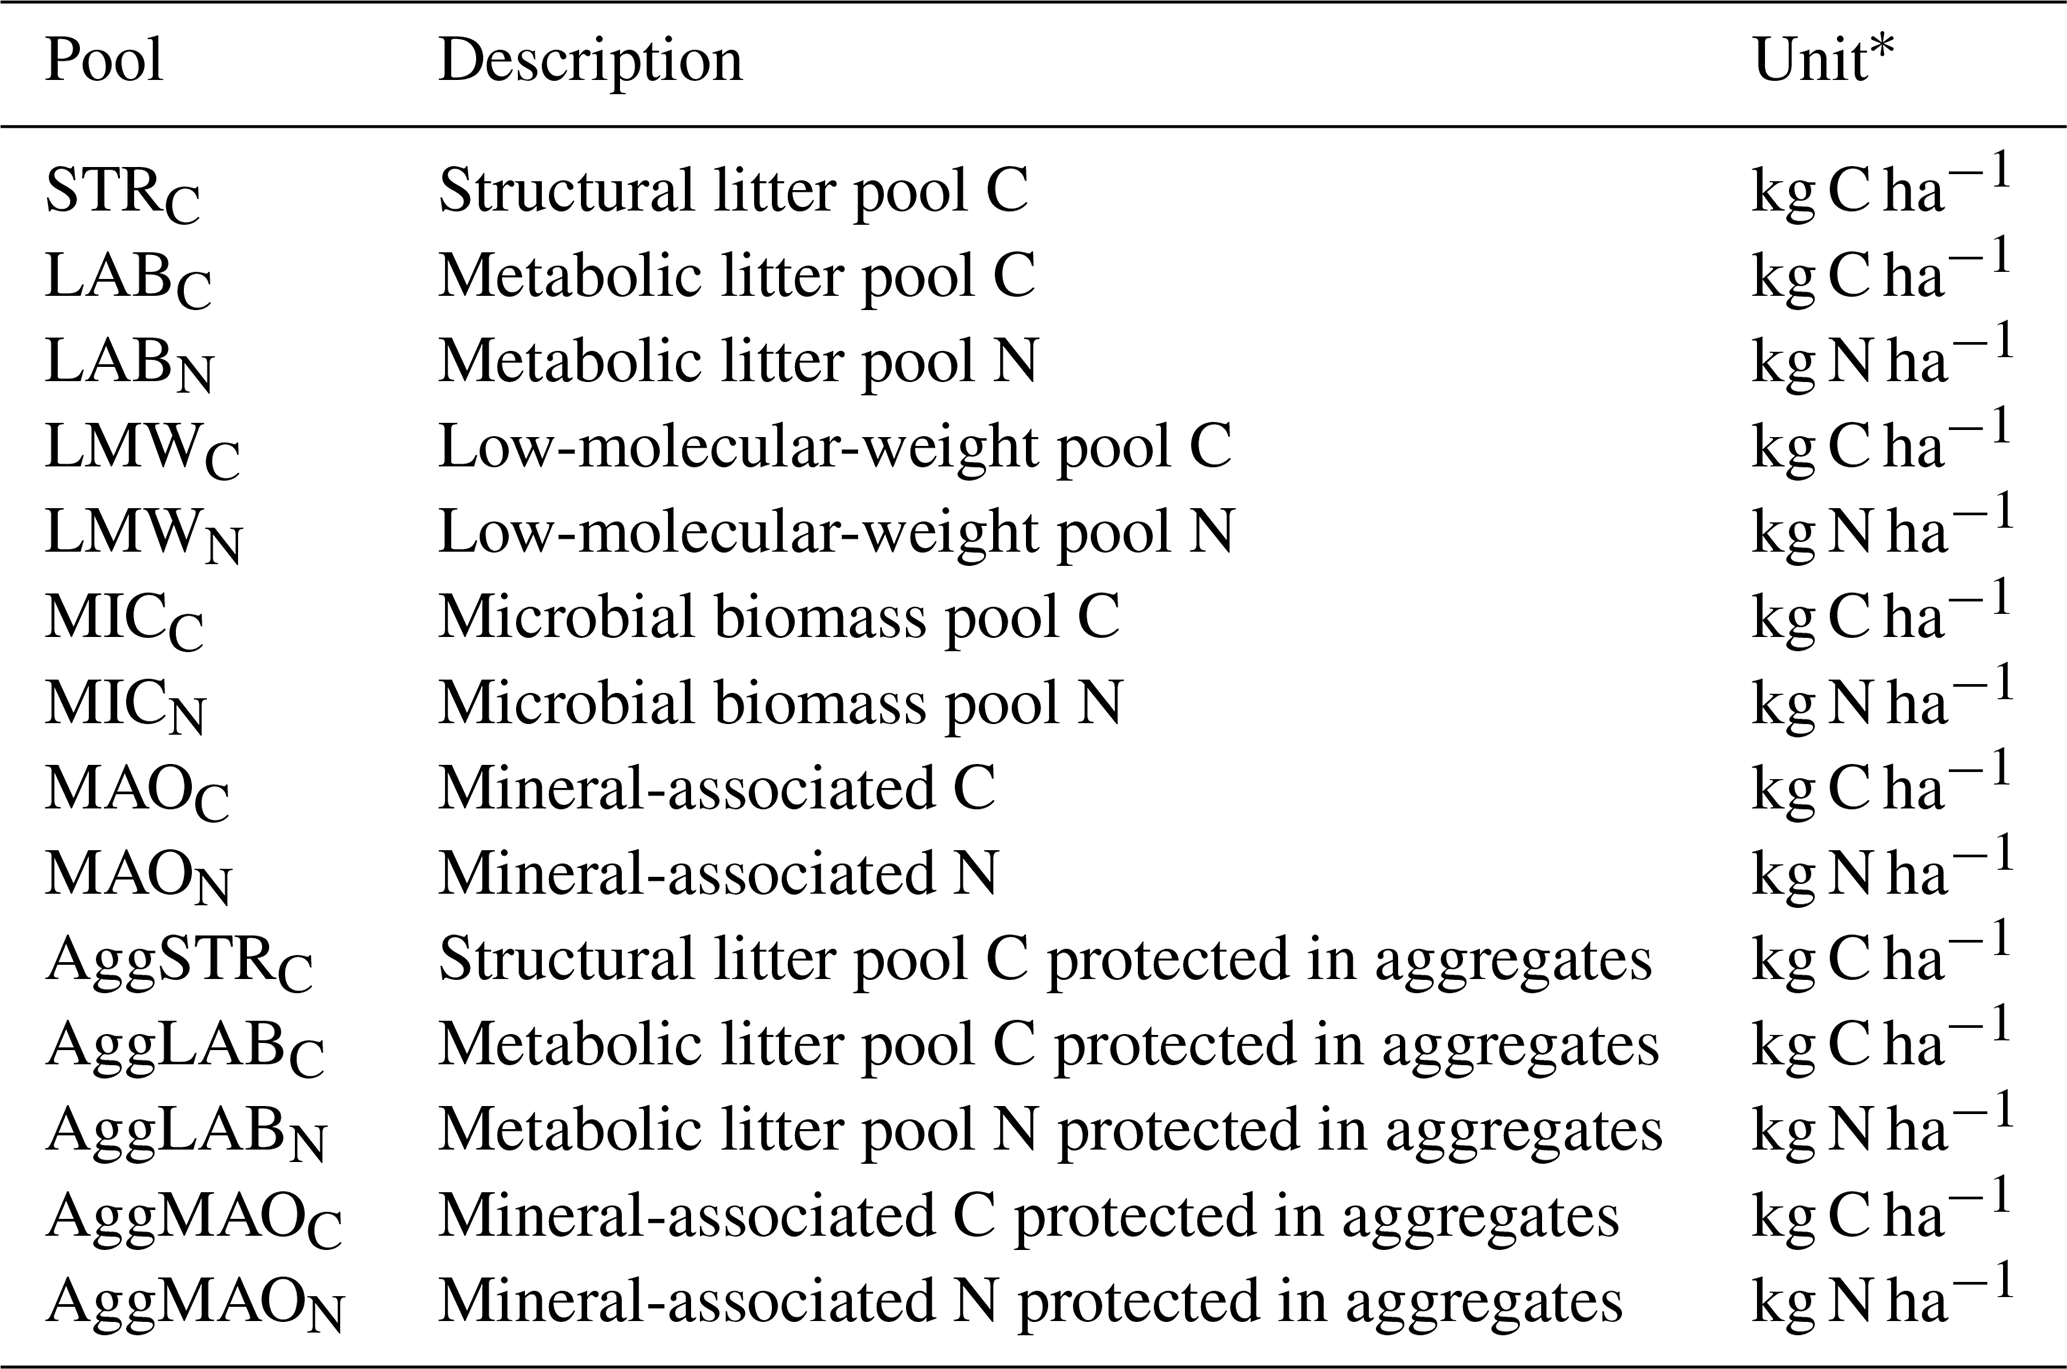
∗ For a defined depth interval (here 0–15 cm).
The organic matter decomposition process in the SAMM model starts with undecomposed plant material, consisting of structural litter (STRC), and the labile/metabolic litter pool (LABC&N). To distinguish between the cell walls and the interior part of LABC&N, the STRC protects part of LABC&N from decomposition (ProtLAB pool; see Appendix A1), mimicking that part of LABC&N is interviewed with STRC in the cell walls. Upon depolymerization, the carbon and nitrogen of any pool enters the easily soluble low-molecular-weight (LMWC&N) pool. This LMWC&N is the only pool that contains molecules that are small enough to be incorporated by the microbial biomass (MICC&N). Extracellular enzyme production consumes energy, which is indirectly accounted for by a pool-dependent carbon use efficiency (CUE), leading to CO2 respiration in the amount of (1-CUE) during the transition from any litter pool to LMWC&N. When the MICC&N pool consumes LMWC&N, a portion of the consumed carbon is respired as growth respiration, the rest is used for anabolism. The amount of growth respiration of MICC&N depends on a variable stoichiometric CUE, which is a function of the ratio of LMWC&N. MICC&N is subject to microbial death and microbes also have maintenance respiration. Parts of death microbes (cell walls) are attached to minerals, creating mineral-associated carbon and nitrogen (MAOC&N), the rest (cell internal content) is transferred back into the LMWC&N pool. Furthermore, MICC&N can immobilize or release N, to maintain their ratio (see Appendix A1.4). Direct adsorption of LMWC&N to MAOC&N is also possible. Carbon and nitrogen from the primary constituents (i.e., LABC&N, STRC, MAOC&N) are protected by integration into aggregates as a byproduct of microbial growth; i.e., the amount of aggregate formation is a function of microbial growth. There is also a physicochemical aggregate formation, which for simplicity is assumed to be constant in version 1.0 of SAMM. Inside the aggregates, there is no decomposition, a concept proposed by Luo et al. (2017) as a way to reduce the number of parameters in aggregation models. The carbon of all pools outside of aggregates is subject to decomposition by MICC&N following reverse Michaelis–Menten kinetics, a good approximation of enzymatic depolymerization (Abramoff et al., 2022; Tang and Riley, 2019). Thus, the speed of decomposition depends on the amount of substrate and the amount of MICC&N. Aggregate disruption is simulated as a first-order kinetic process.
Table 4Overview of all SAMM model parameters (top), further computed helper variables (middle), and external model drivers and site conditions needed (bottom). The calibrated values are the best parameter set from the independent Bayesian calibration for the SAMM model and the recalibrated non-aggregate model (SAMMnoAgg).
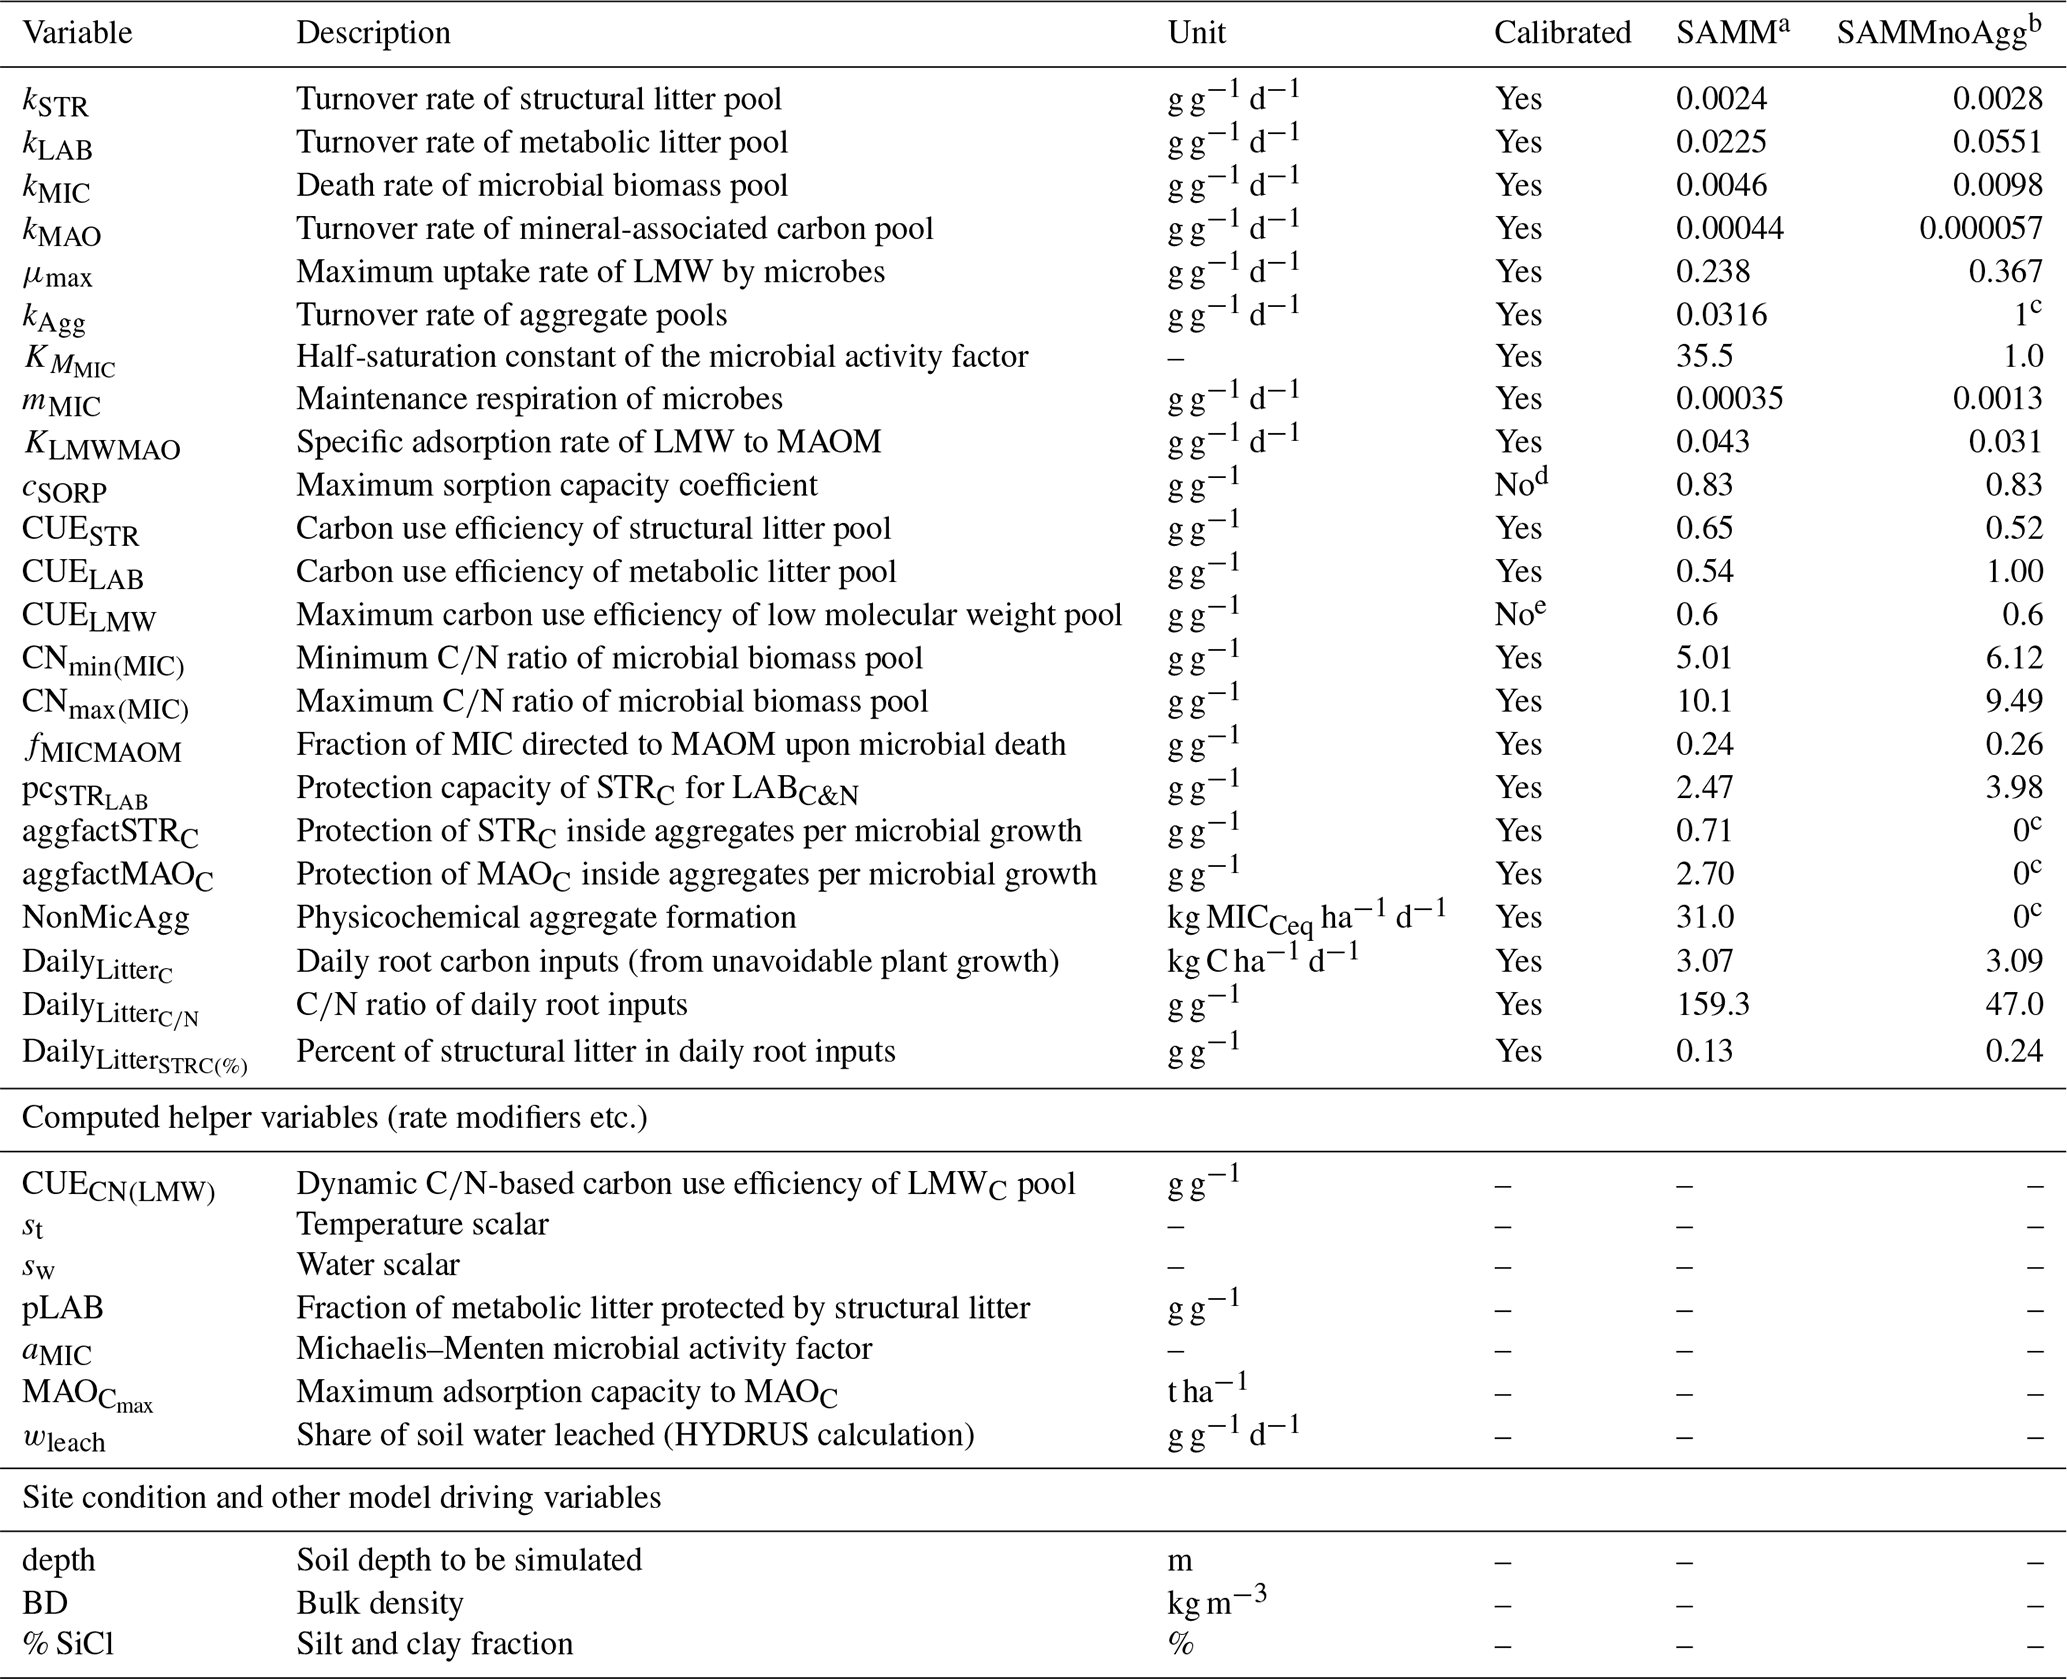
a Model version including soil aggregates; b recalibrated model version without soil aggregates; c set to 0/1 in model version without soil aggregates to deactivate them; d from Abramoff et al. (2022); e established maximum (Sinsabaugh et al., 2013; Manzoni et al., 2012).
2.4 SAMM setup and Bayesian calibration
For the technical implementation of SAMM version 1.0, we used the R programming language (R Core Team, 2020). Details are described in the Appendix A2. As SAMM is a new model, we added a mass balance equation to stop the model with an error message if the mass balance was not closed. Further, most model parameters had to be calibrated. In addition to typical parameters of a SOM model representing pool turnover, SAMM contains some unique parameters, such as the protection capacity that STRC exhibits on LABC&N, the rate of aggregate formation per microbial growth, and the rate of physicochemical aggregate formation (Table 4). Additionally, the amount and composition of carbon and nitrogen entering the soil through plant roots were calibrated parameters. These were necessary because, despite the best efforts to keep the experiment completely fallow, it was not possible to fully eliminate plant growth in the plots. Two model parameters were fixed on the basis of the literature. The first uncalibrated parameter was the maximum CUE for LMWC, which was fixed at 0.6 (Sinsabaugh et al., 2013; Manzoni et al., 2012). The second uncalibrated parameter was cSORP, the maximum sorption capacity of the fine fraction, which was taken from Abramoff et al. (2022). To initialize the pools, we used the mean of the measured SOC fractions in the rice straw treatment in 2019, which had not experienced major changes in SOC since the start of the experiment. In the absence of fractionation data from the start of the experiment and historic plant input quantities and qualities, this was considered the best option. Ideally, SOC fractions would be measured at the beginning of any experiment. However, sensitivity analyses, perturbing the distribution of initial SOC between MAOC and litter pools from 80 % to 120 % of our initial assumptions confirmed a very limited effect (any visible differences in simulated SOC and aggregate C disappeared within less than 10 and less than 3 years, respectively; see response to referee comments https://doi.org/10.5194/egusphere-2023-1414-AC1, Laub, 2023a).
To test our hypotheses about the importance of aggregates in carbon stabilization and the need to simulate this process, we also created a SAMM version without aggregate formation (SAMMnoAgg). By setting the turnover of aggregates (kAgg) to 1 d−1 and the aggregate formation parameters to 0, all aggregate protection was effectively removed from the model. We evaluated the difference in simulated stabilized SOC in SAMM and SAMMnoAgg, using the parameters calibrated for SAMM, to gain insight into the importance of aggregate protection for SOC stabilization. SAMMnoAgg was further recalibrated to test our hypothesis of the need to simulate aggregates to represent SOM dynamics. Note that measurements of carbon in aggregates and in silt and clay fractions of 2019 were not used to recalibrate SAMMnoAgg.
As a starting point for the model parameters, an initial model calibration was performed using a genetic algorithm (GA package of R; Scrucca, 2013). To explore the uncertainty associated with the two different versions (i.e., SAMM and SAMMnoAgg), this initial calibration was followed by a Bayesian calibration applying the sampling importance resampling (SIR) method. This method was used by Gurung et al. (2020) to calibrate the SOM module of DayCent and is described in detail in their article. Briefly, the SIR method uses the Bayes theorem to derive the posterior distribution of model parameters and model output based on assumed prior and available data. We assumed normally distributed broad priors centered around the initial calibrated model parameters, i.e., the mean parameter values from SAMM and SAMMnoAgg, to have the same priors for both (except for the values only calibrated in the aggregate version). To calibrate SAMM and SAMMnoAgg, we used all available data of litterbag C, microbial N, and SOC, while data of aggregate C and free MAOC were only used to calibrate SAMM. In the next step of SIR, the posteriors are derived by filtering the prior using importance weights to sample individual parameter sets from the prior. The importance weights are proportional to the simulation likelihoods (i.e., of observing the data, given the model), which are computed using the data, the simulated values, and the variance–covariance matrices of data (Wallach et al., 2019). As is common practice, we assumed that the covariances were 0, and hence we only used the variances for each type of measurement (taking the median variance computed for each type of data from the three experimental repetitions). Then, by dividing the likelihood of each simulation by the mean likelihood of all simulations, standardized importance weights were computed. The prior parameter set was then resampled without replacement and the importance weights taken as sampling probability. Overall, a total of 200 000 simulations were performed, of which 200 parameter sets were drawn in the resampling.
2.5 Model evaluation
The following standard evaluation statistics were used for model evaluation, as defined by Loague and Green (1991):
Here, MSEy is the mean square error and RMSE is its root. EFy is the Nash–Sutcliffe modeling efficiency, Oyz stands for the measured value of the zth measurement of the yth type of measurement. Furthermore, is the mean of measured values of the yth type of measurement and Pyz is the model-predicted value corresponding to Oyz. As suggested by Gauch et al. (2003) to gain better insight into the nature of model errors, we further divided MSEy into squared bias (SB), nonunity slope (NU), and lack of correlation (LC). We expressed them in relative terms, by dividing them by MSEy:
Here, is the mean predicted value of the yth measurement type, and b the slope of the regression of P on O. Finally, r is the correlation coefficient between O and P. The relative LC, SB, and NU provide information on whether the model errors are mostly random (high LC) or whether there is a systematic bias (high SB). A high relative NU indicates that the sensitivity of the model is wrong (either too low or too high). The SB can be interpreted as the intercept of a regression between predictions and measured values, while the NU is the slope of this regression (Gauch et al., 2003). Finally, the Akaike information criterion (AIC) was computed to compare different model versions:
Here, k is the number of model parameters that were estimated (23 for SAMM and 19 SAMMnoAgg) and is the likelihood.
Because SAMM is a new model, we first describe its behavior and illustrate the development of pools (Fig. 2) using the treatment with the highest microbial activity, the groundnut stover treatment. It is important to note that our results cover a period where the model has not yet reached a new steady state. Second, the performance of the calibrated model is evaluated against the measured data, and posterior parameter distributions are discussed. Third, we test the importance of aggregate protection in SAMM, by assessing how much the simulation performance decreases for different types of measurements when aggregate formation is not simulated (SAMMnoAgg). Finally, we try to assess to which extent simulating aggregate formation is necessary to correctly simulate microbial biomass and SOC, by recalibrating the SAMMnoAgg version and comparing it with SAMM.
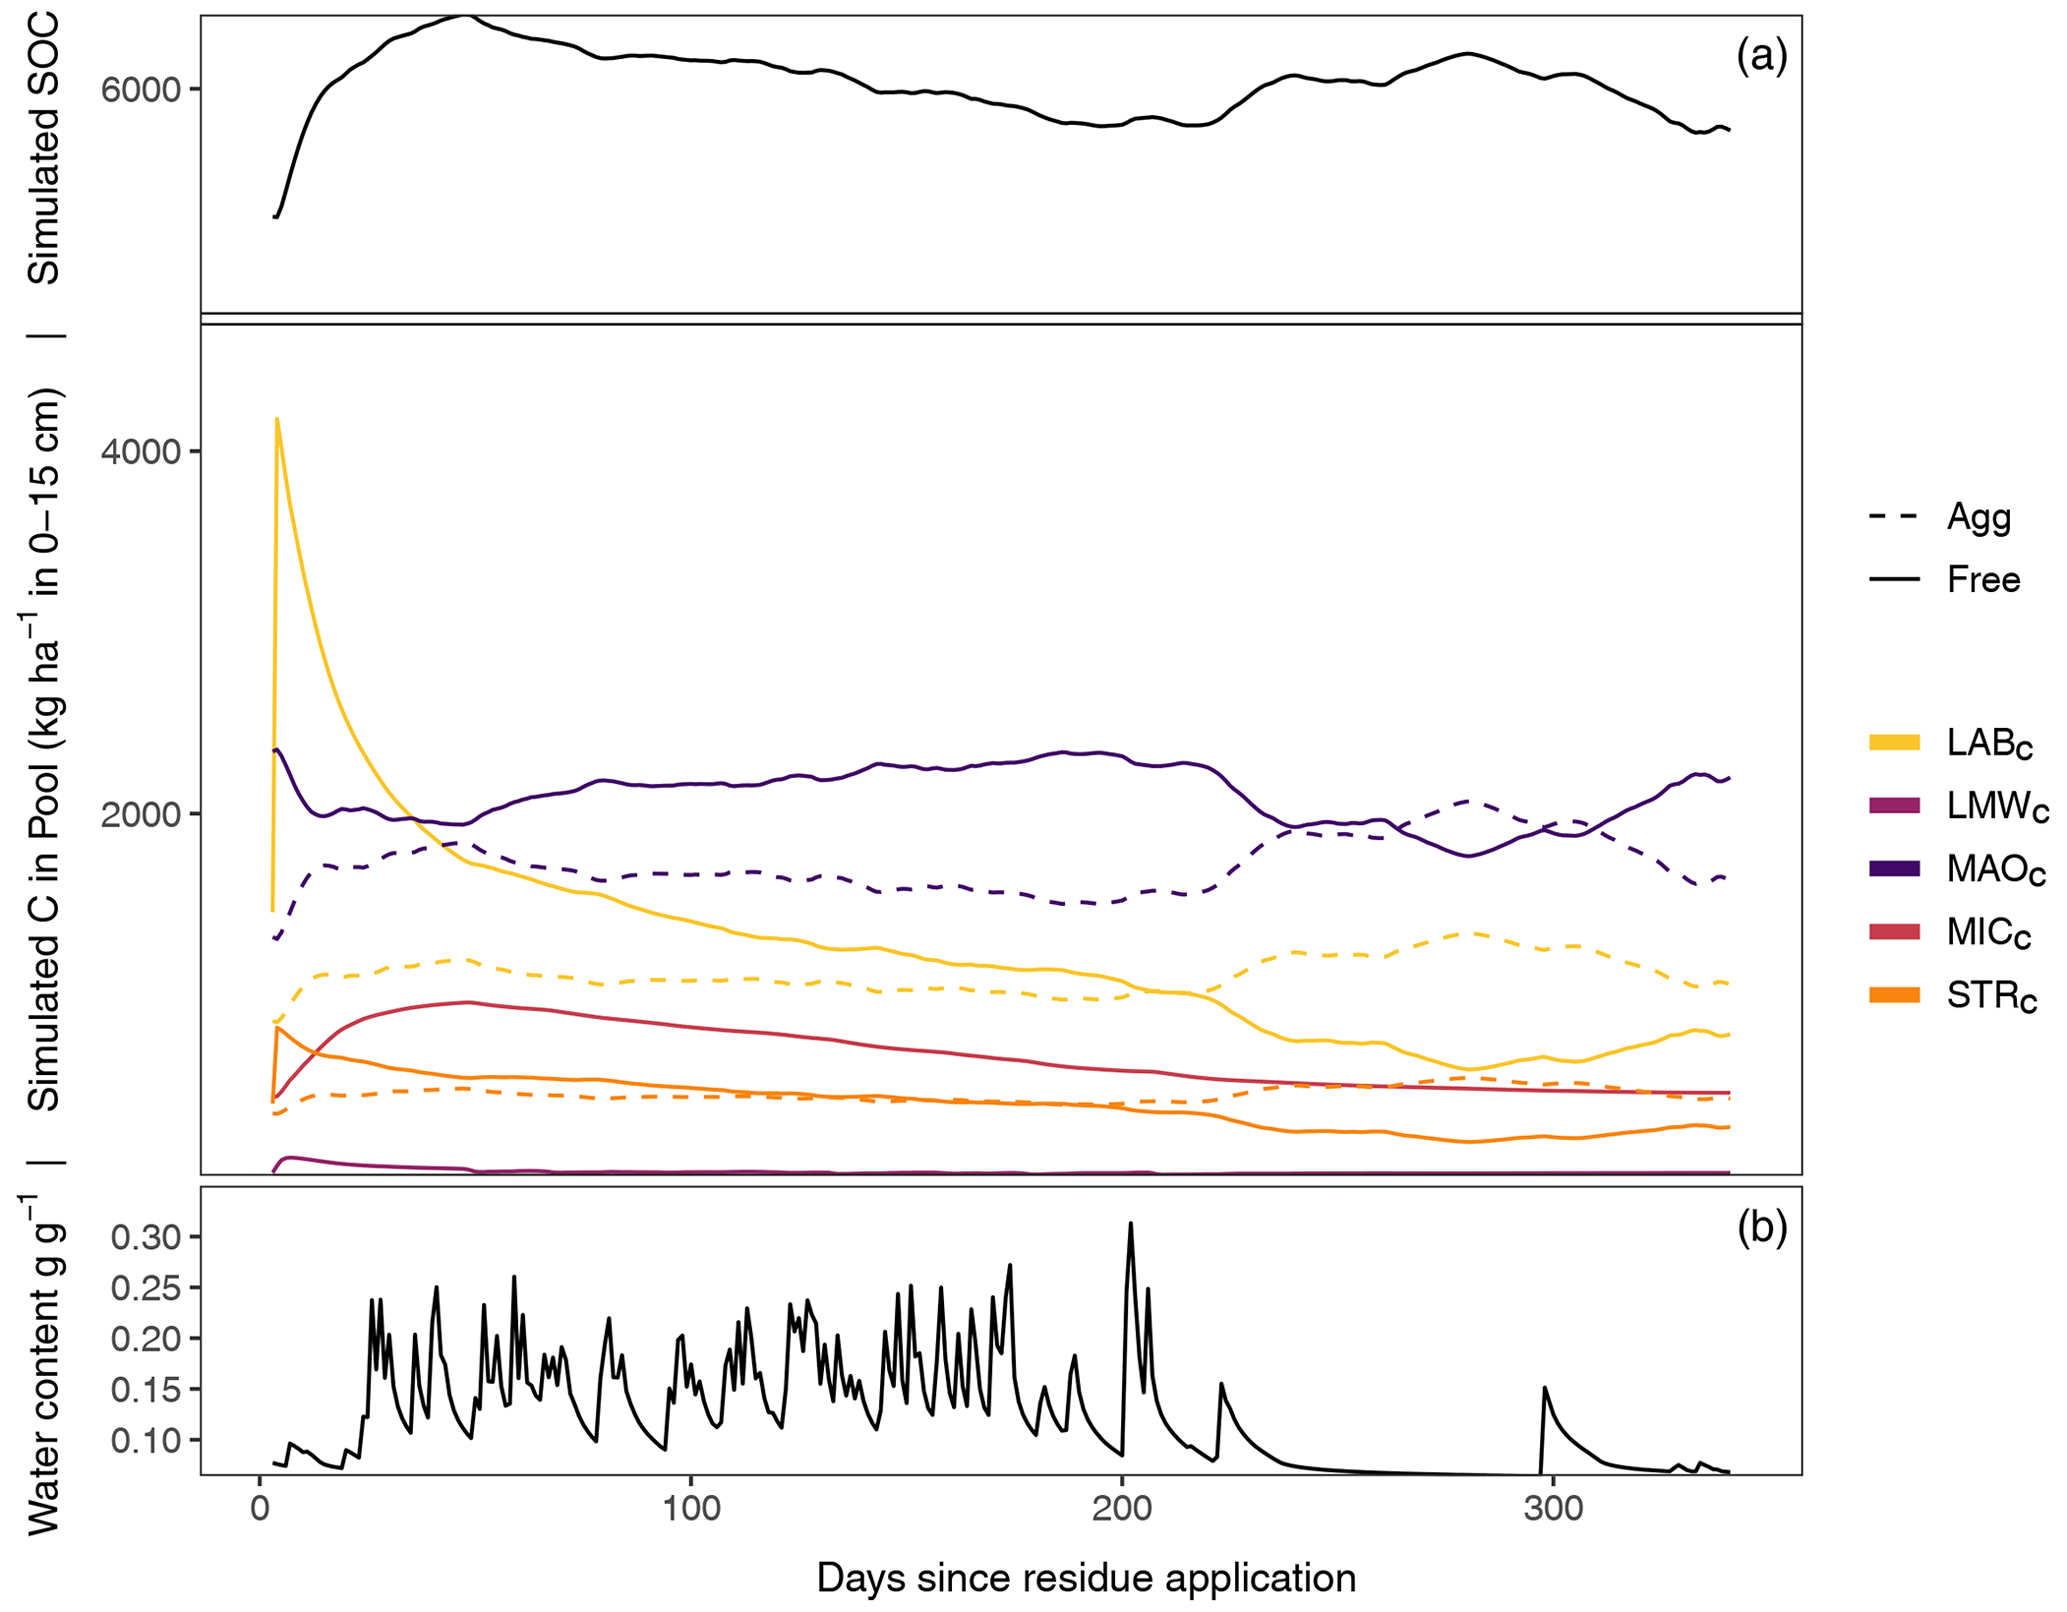
Figure 2Exemplary SAMM model behavior and carbon pool dynamics of the groundnut treatment in the period 2001–2002 starting 1 d before the addition of litter. The top panel displays all carbon pools inside and outside of aggregates, while the bottom panel displays the soil water content (model driver, simulated by HYDRUS 1D). In the two panels, aggregate-protected pools (Agg) are represented by a dashed line, decomposable (Free) pools by a solid line. STRC, structural litter; LABC, labile litter; LMWC, low molecular weight; MICC, microbial; MAOC, mineral-associated.
3.1 SAMM model behavior: the connection between microbes and aggregate formation
After the groundnut stover application in 2001, a rapid depolymerization of the part of LABC that is not protected by STRC is simulated (Fig. 2). The depolymerized material is transferred to the LMWC pool. This increase in LMWC feeds the growth of MICC, which almost triples in biomass. The MICC growth slows down once the unprotected part of LABC is fully decomposed. However, the peak of LMWC availability is within 1–2 weeks after litter addition, while the peak of MICC is about 1–2 months after litter addition and maximum LMWC availability. The increase in microbial growth is accompanied by an increase in the formation of new aggregate-protected carbon. Unprotected MAOC and litter are thereby protected in aggregates, increasing the amount of aggregate-protected MAOC and litter by approximately 30 %. Because the formation of aggregates is linked to microbial growth, the peak of aggregate-protected pools (MAOC, LABC and STRC) occurs simultaneously with the peak of MICC. Subsequently, the amount of aggregate carbon starts to decrease again, which becomes visible in the increase of unprotected MAOC, LABC, and STRC. During the dry season about 250 d after residue application, another increase in aggregate formation occurs, this time driven by the physicochemical aggregate formation that continues while aggregate turnover is reduced due to limiting water availability. After a full year, just before the next addition of litter, most of the newly added litter of the previous year is decomposed and increased moisture availability increases aggregate disruption again. However, a higher amount of MAOC compared to the beginning of the year and a slightly higher amount of aggregate-protected MAOC, STRC, and LABC leads to an increased amount of SOC compared to the previous year.
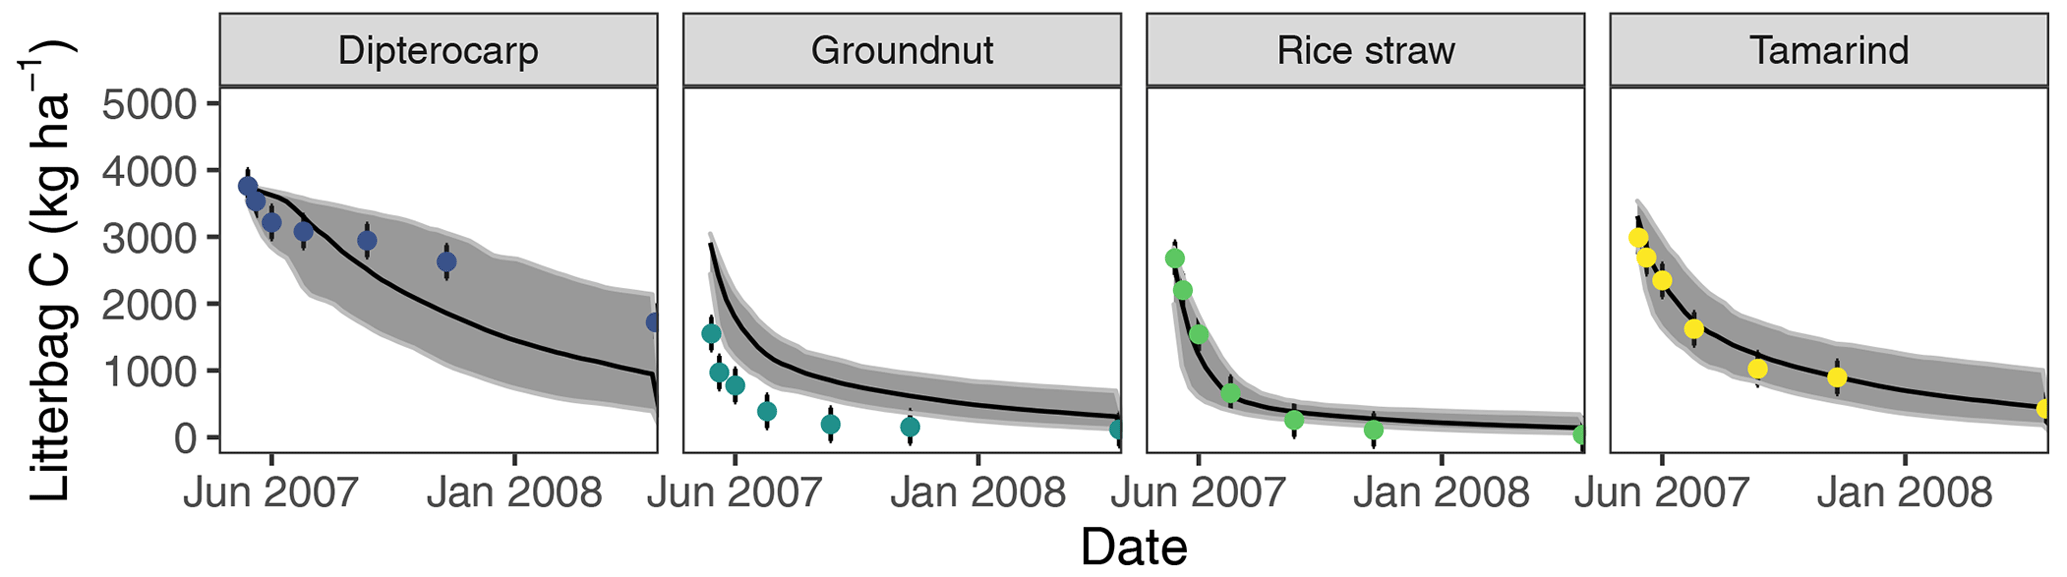
Figure 3Simulation of incubated litterbag residue-C dynamics from different litter materials (buried at 15 cm depth). Dots with error bars indicate the mean and 95 % credibility interval of measured values. The black line and gray band indicate the best simulation and the 95 % credibility interval of the Bayesian calibration posterior, respectively.
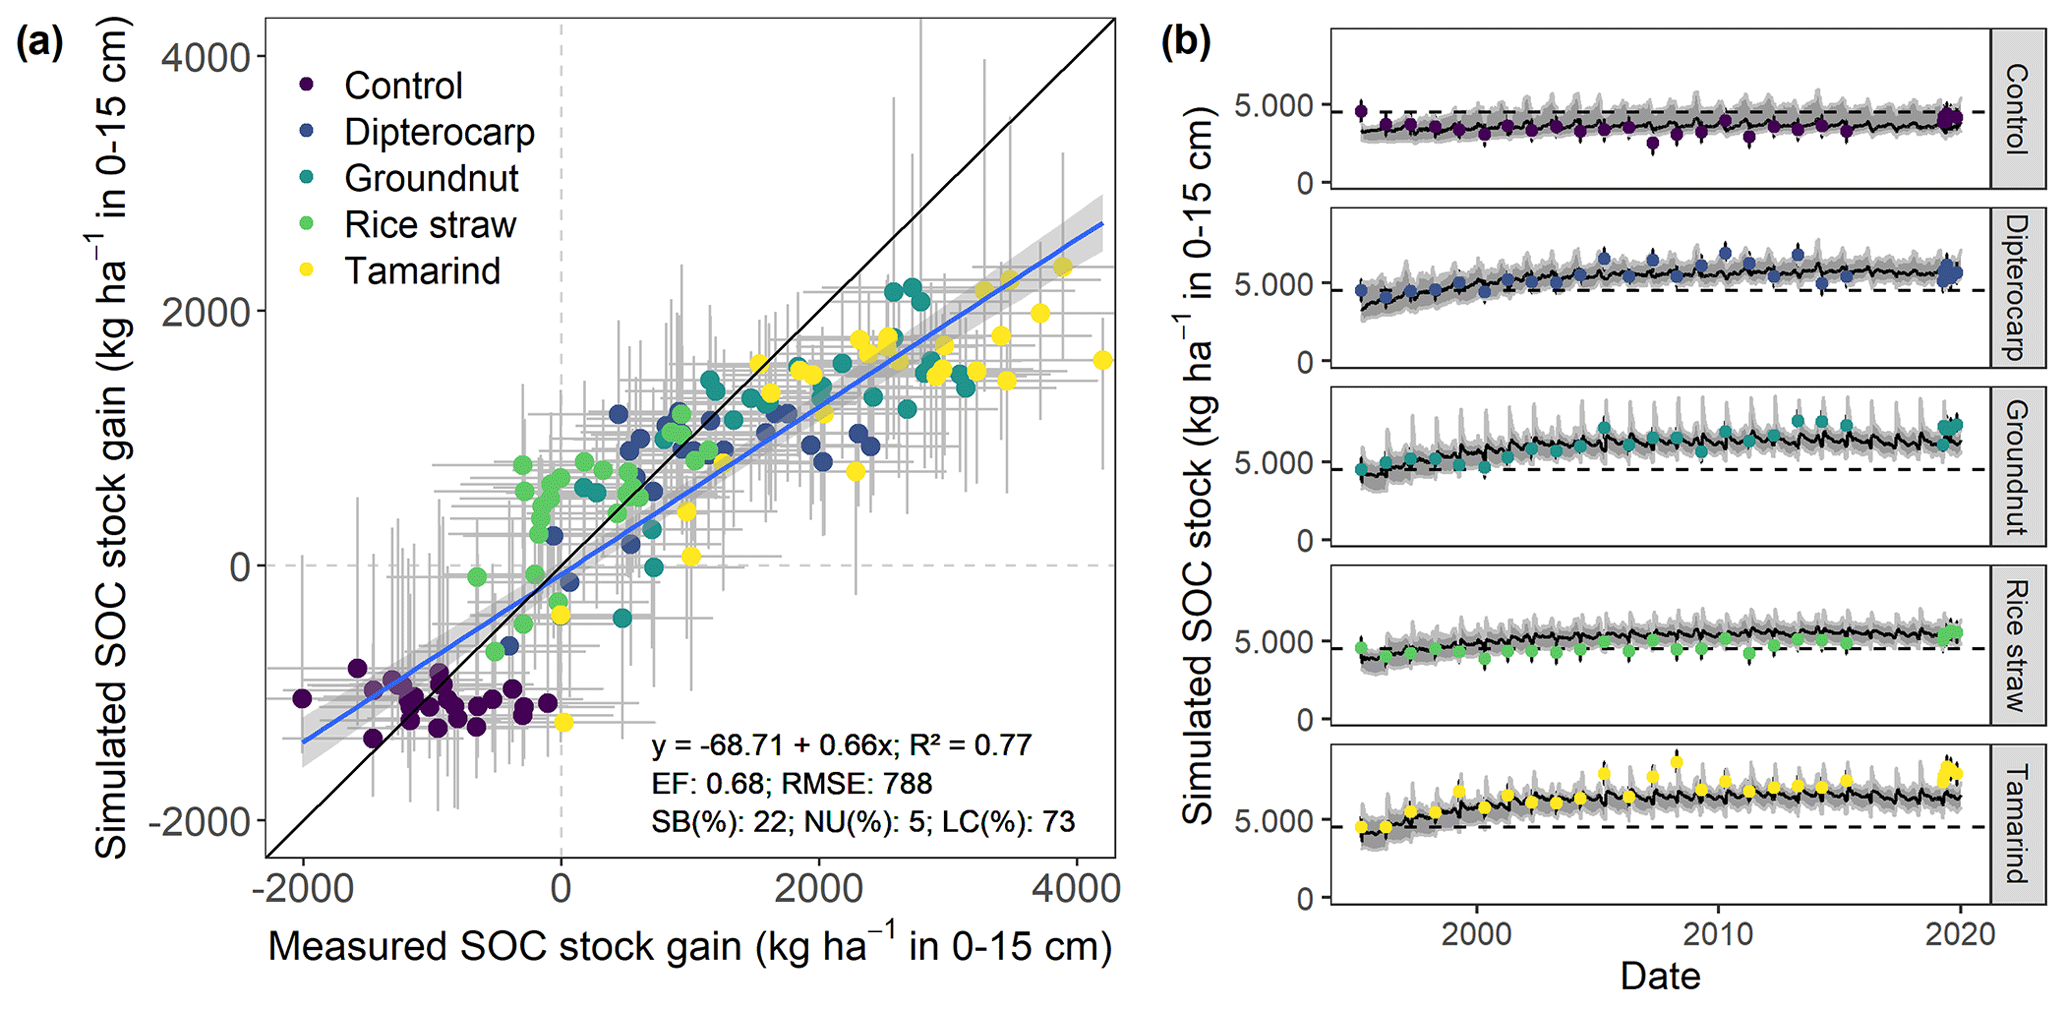
Figure 4Measured and simulated development of SOC stocks in the top 15 cm of soil from all residue addition treatments. Displayed are (a) the measured versus modeled gain in SOC stocks since the onset of the experiment, with gray bars indicating 95 % credibility interval. Additionally, (b) shows the results for simulated versus measured SOC over time for different residues. Dots with error bars indicate the mean and 95 % credibility interval of measured values and simulations. The black line and gray band indicate the best simulation and the 95 % credibility interval of the Bayesian calibration posterior, respectively.
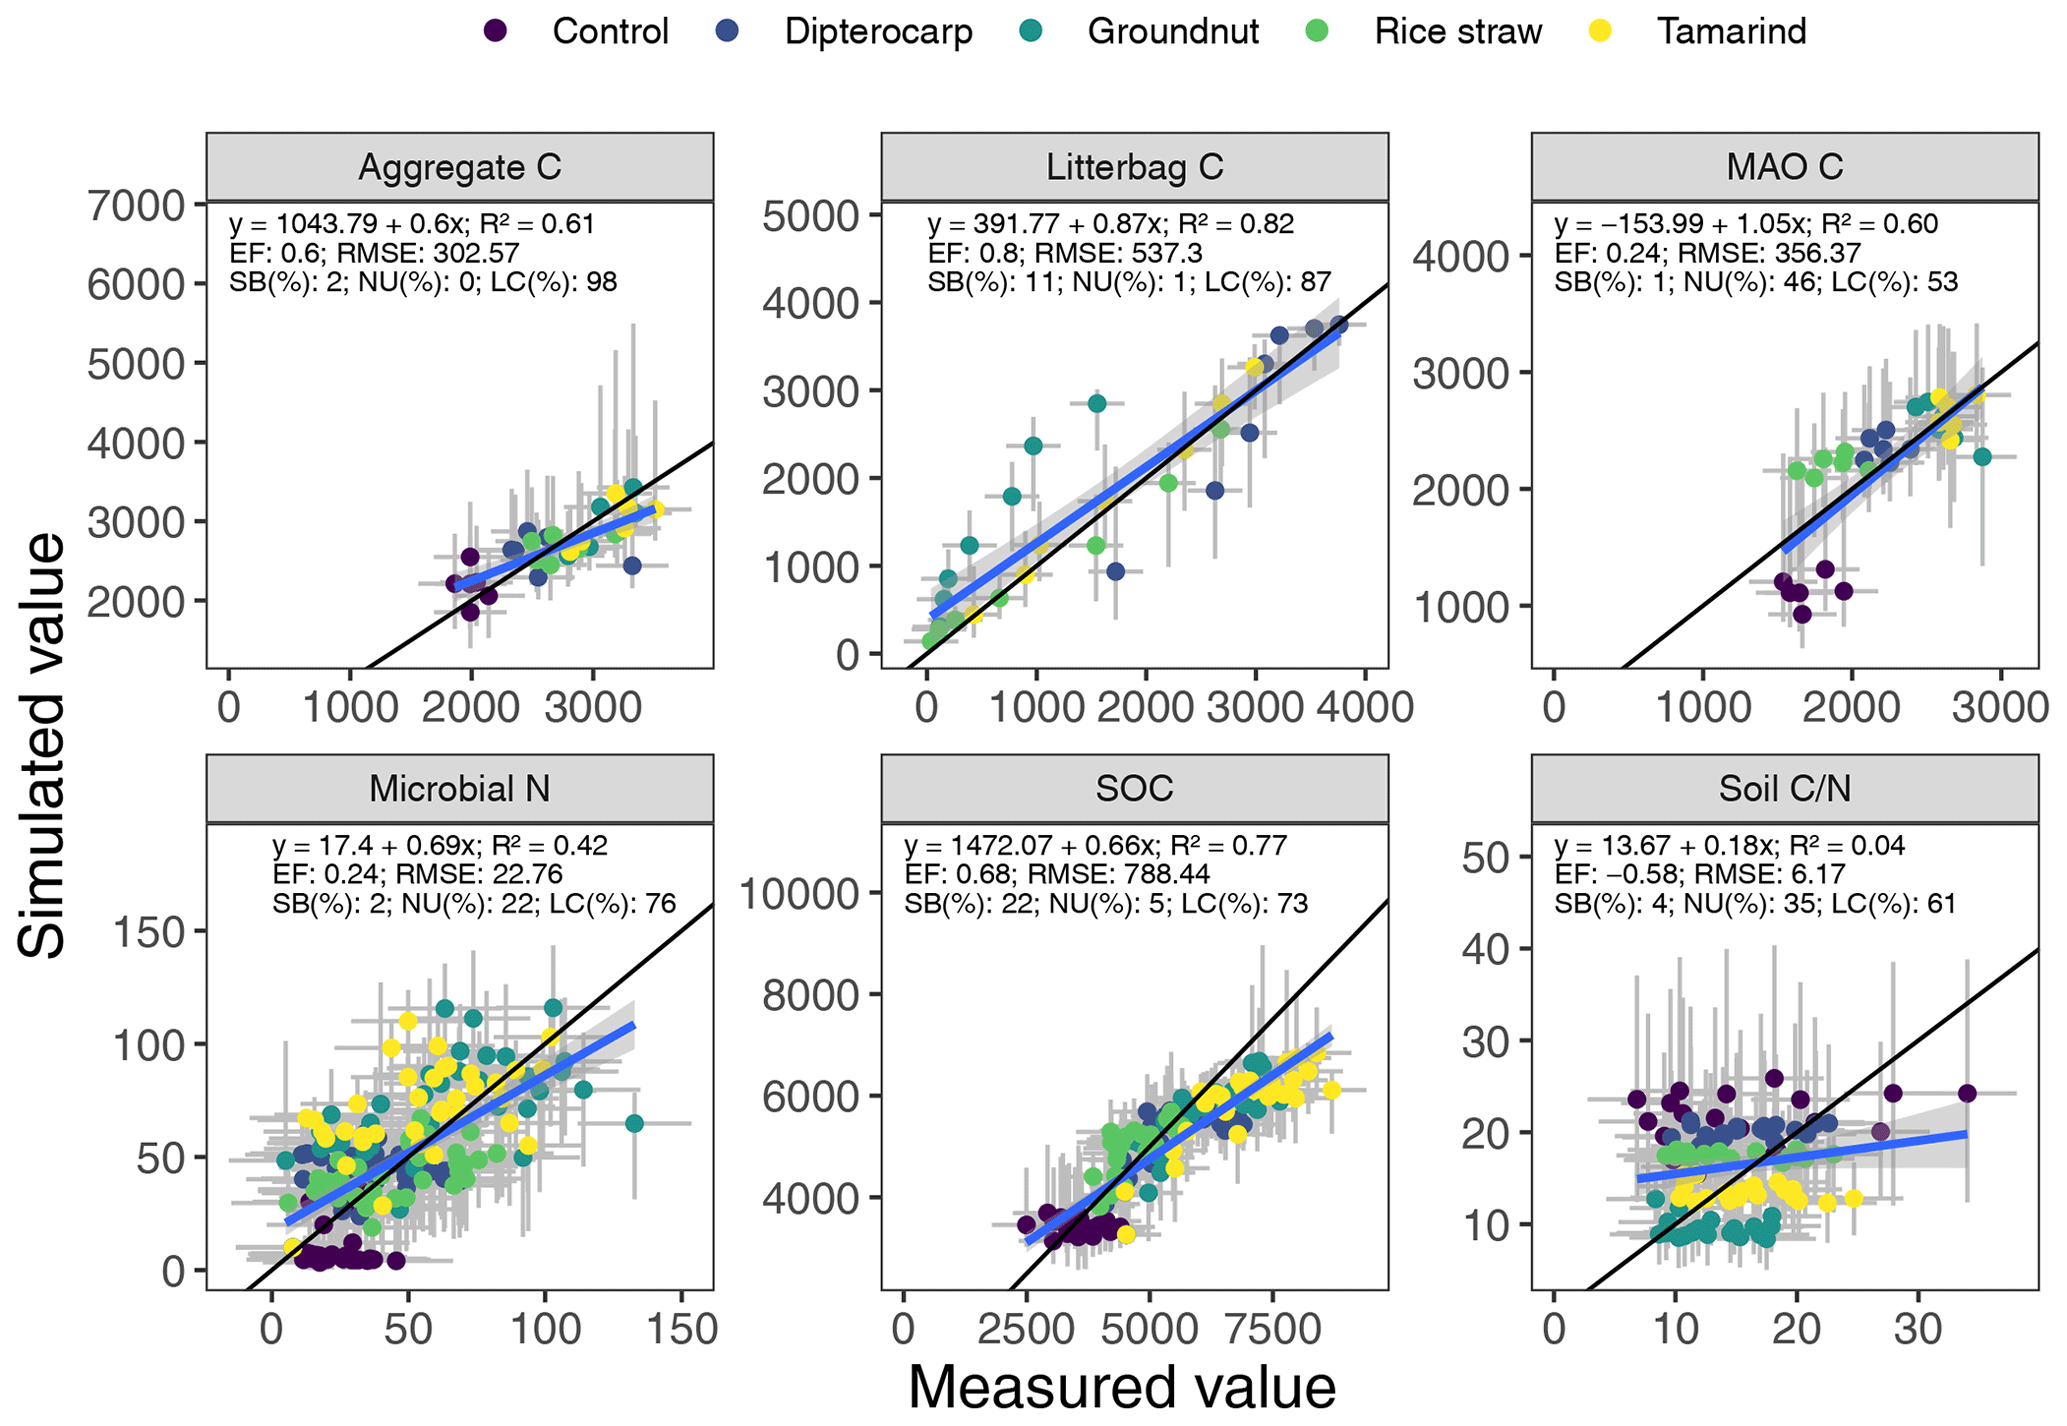
Figure 5Simulated versus measured values of aggregate carbon, litter carbon, mineral-associated organic carbon (MAOC), microbial biomass nitrogen, soil organic carbon (SOC) and soil ratio. The gray bars indicate the 95 % credibility interval. The black line marks the 1:1 line, the blue line the regression of simulated on measured values.
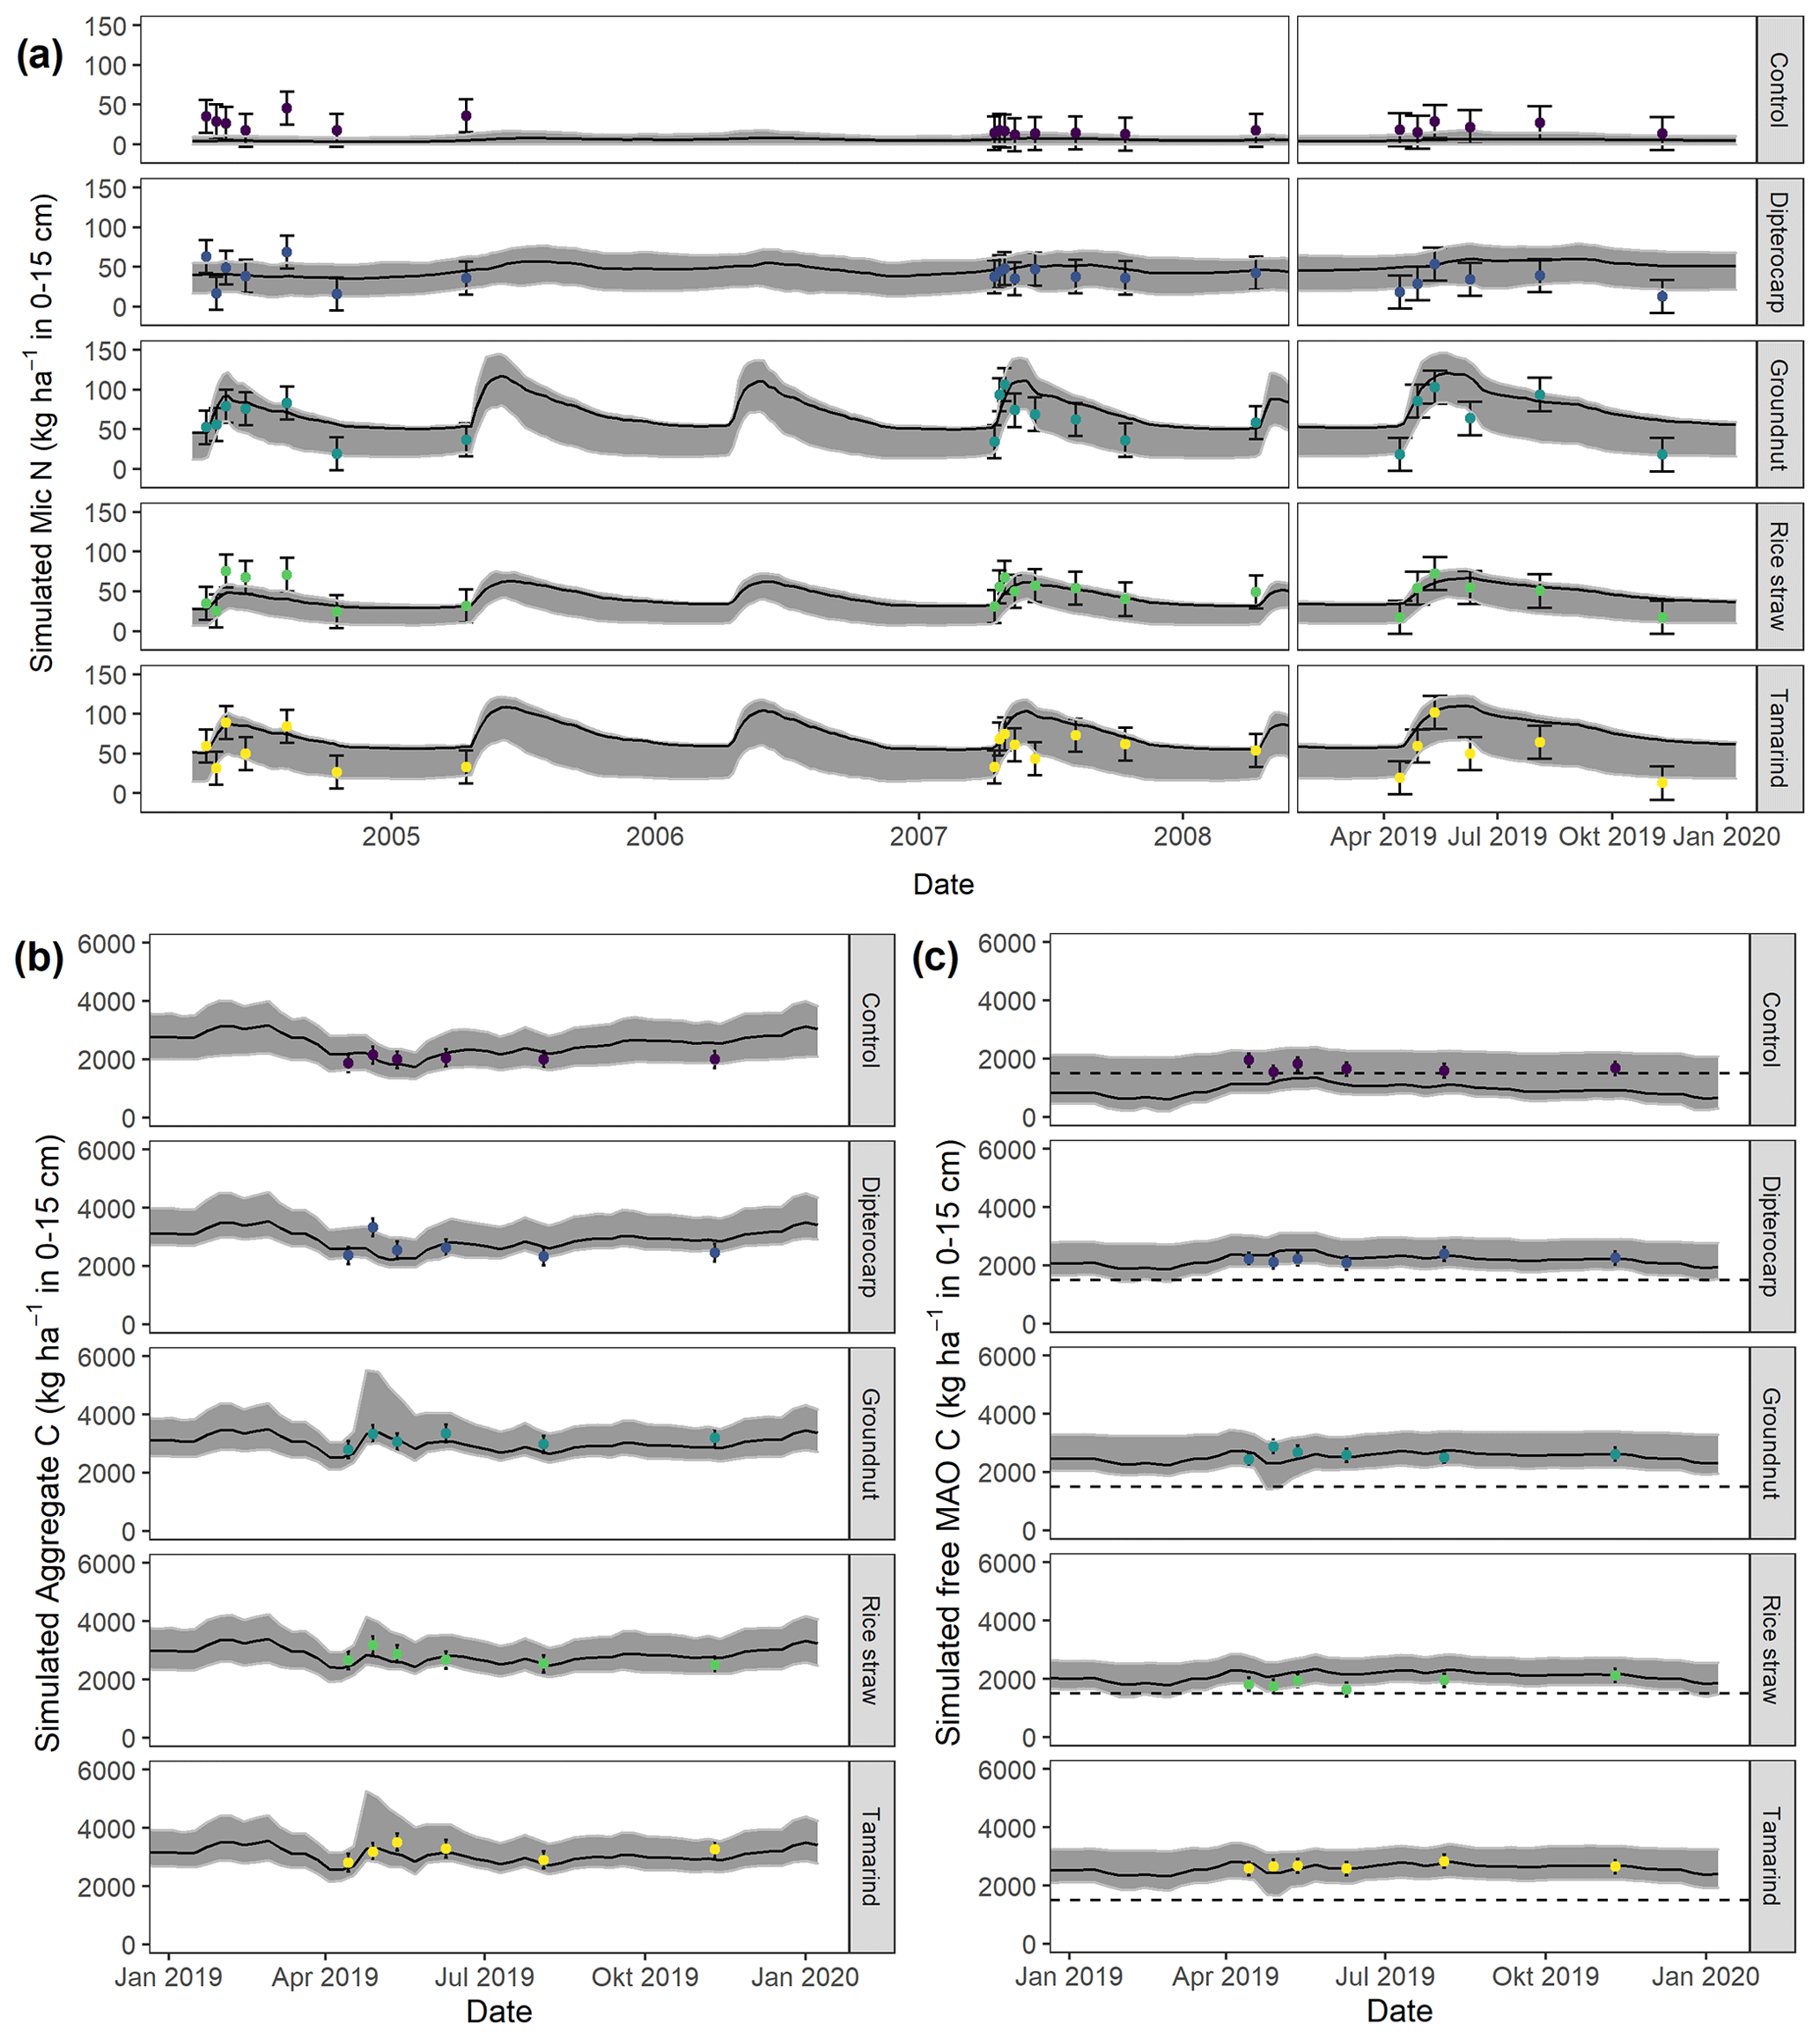
Figure 6Simulation of (a) microbial nitrogen (MICN) in 2005, 2008, and 2019 (top); of (b) aggregate-protected C (AggC) and of (c) free mineral-associated C (MAOC) of different residues in 2019. Dots with error bars indicate the mean and 95 % credibility intervals of measured values. The black line and gray band indicate the best simulation and the 95 % credibility intervals of the Bayesian calibration posterior, respectively. The dashed line indicates the mean free MAOC in the control in 2019.
3.2 Evaluating SAMM against measured data
Overall, the SAMM model was able to simulate the different types of available measurements, as indicated by positive modeling efficiencies for all of them (Table 5a; soil was the only exception). The best representation of the measured values by the model was that of residue-C in litterbags (Fig. 3; EF 0.80) and, interestingly, the measured decomposition of groundnut stover was so fast (>50 % in the first week) that the model could not capture it. Furthermore, the measured values of the SOC of the top soil were well represented by SAMM (Figs. 4 and 5; EF 0.68), with a tendency of the model to overestimate SOC in the rice straw treatment and underestimate SOC in the tamarind and groundnut treatments. Further, microbial nitrogen (MICN; EF 0.24) and carbon in the free silt and clay fraction (MAOC; EF 0.24) were simulated with acceptable accuracy (Figs. 5 and 6). The temporal trend of microbial nitrogen was also well captured for all litter treatments with the exception of the control, in which there was almost no simulated microbial growth response over the year (Fig. 6). For free MAOC, the differences between treatments were captured, the temporal dynamic was low, both in measured and modeled values, and the model could overall capture the treatment differences (EF 0.24). It could also capture very well the temporal dynamics of aggregate C in the groundnut, rice straw, and tamarind treatments, as well as the absence of major temporal dynamics in the other two treatments (Fig. 6; EF 0.60). Despite the dynamic CUE function of SAMM, the SOC content of the high ratio residue treatments (rice straw the most strongly and dipterocarp to some extent) tended to be overestimated while tamarind tended to be underestimated, leading to poor model performance for the soil ratio (EF −0.58; Fig. 5).
3.3 Model behavior when aggregate formation was removed
Removing the aggregate protection from the calibrated SAMM model to derive SAMMnoAgg showed that the model assigned a high importance to aggregate protection for the process of SOC stabilization. Without aggregate protection, the simulated SOC of all treatments was reduced to approximately half compared to the measured values (Fig. 7; Table 5b). As a result, all litter addition treatments had approximately the same amount of simulated SOC (excluding litter) in SAMMnoAgg, despite their difference in ratios, lignins, and polyphenols (Fig. 7). Hence, removing aggregate protection led to a significantly reduced and now negative modeling efficiency (−3.68) for SOC (Table 5). In addition, the simulation of microbial nitrogen was negatively affected by the removal of aggregate protection. Due to the absence of aggregate protection of LABC and STRC (i.e., POM), simulated microbial growth became too high after litter addition. However, it still had a positive modeling efficiency (reduction of EF to 0.13 from 0.24, initially) and the temporal trend of the strongest microbial growth occurring after litter addition was still represented (simulation not shown). By contrast, removing aggregate protection had little effect on the simulation of litterbag carbon (EF was 0.79) and the increase in model error was minor because litterbag carbon is not protected by aggregates. Overall, the dipterocarp treatment was simulated to have the highest carbon storage of litter and SOC combined without aggregate protection. This was mainly because not all dipterocarp litter decomposed within 1 year.
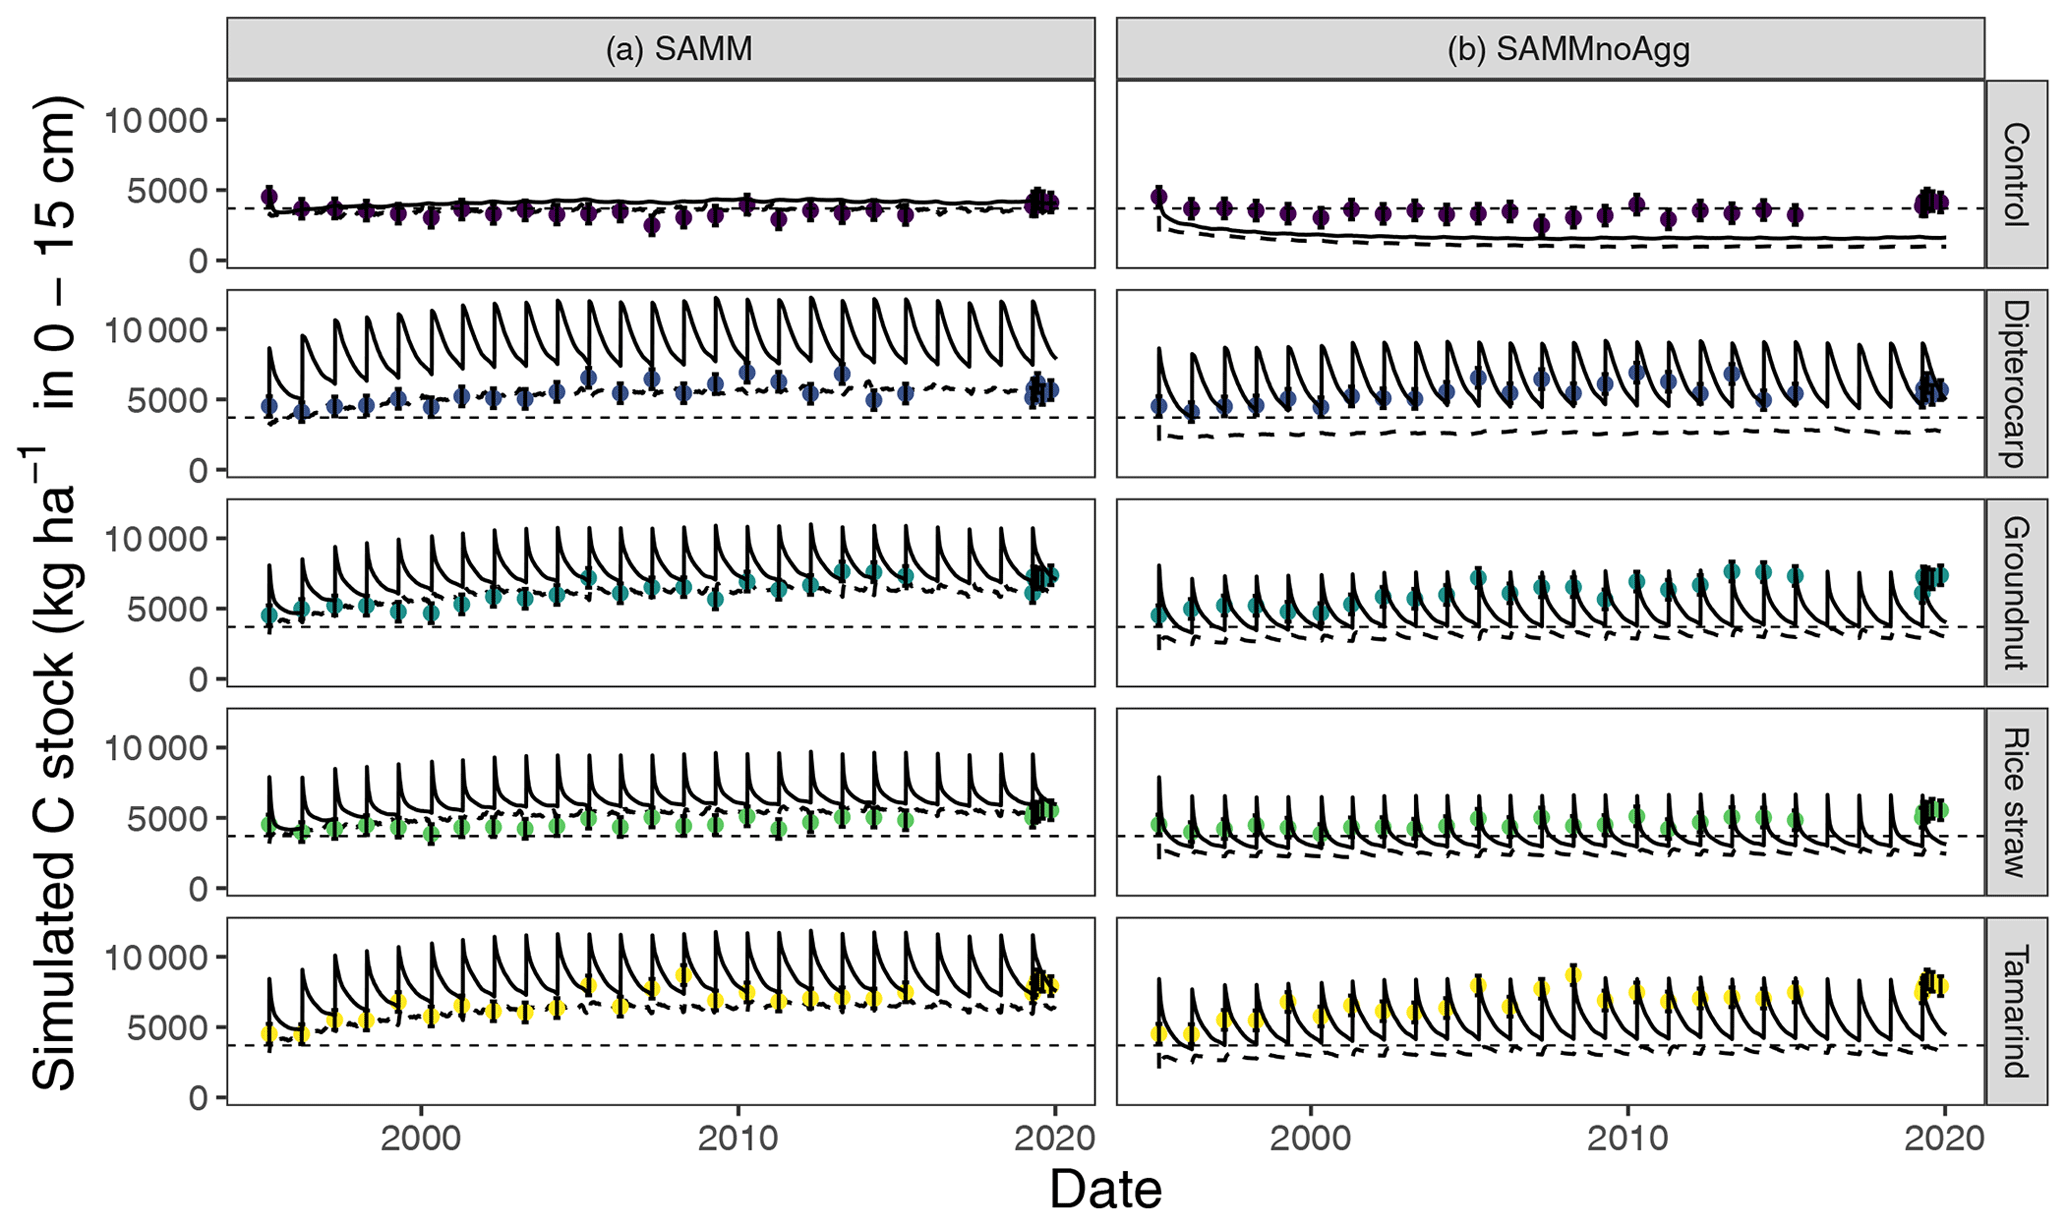
Figure 7Results for the simulation of carbon stocks with the model version including aggregates (SAMM, a) and when aggregate protection is removed without recalibration (SAMMnoAgg, b). The solid line indicates all carbon including litter, the dynamic dashed line indicates the combined soil carbon stocks stored in MAOC, AggC and MICC. The horizontal thin dashed line indicates the mean measured SOC in the control. Dots with error bars indicate the mean and 95 % credibility intervals of measured values (excluding litter).
Table 5Model evaluation statistics of (a) the default SAMM model (with aggregate protection), (b) the SAMM model without aggregate protection (SAMMnoAgg), and (c) the recalibrated SAMM model without aggregate protection (SAMMnoAgg). The RMSE and the width of 95 % credibility intervals (w95 % CI) are in kg ha−1. Evaluation statistics are from the Bayesian calibration. Abbreviations: EF, Nash–Sutcliffe modeling efficiency; (R)MSE, (root) mean square error; LC, lack of correlation; NU, nonunity slope; SB, squared bias; AIC, Akaike information criterion. Data rows in brackets were not used in the calculation of the overall model AIC.
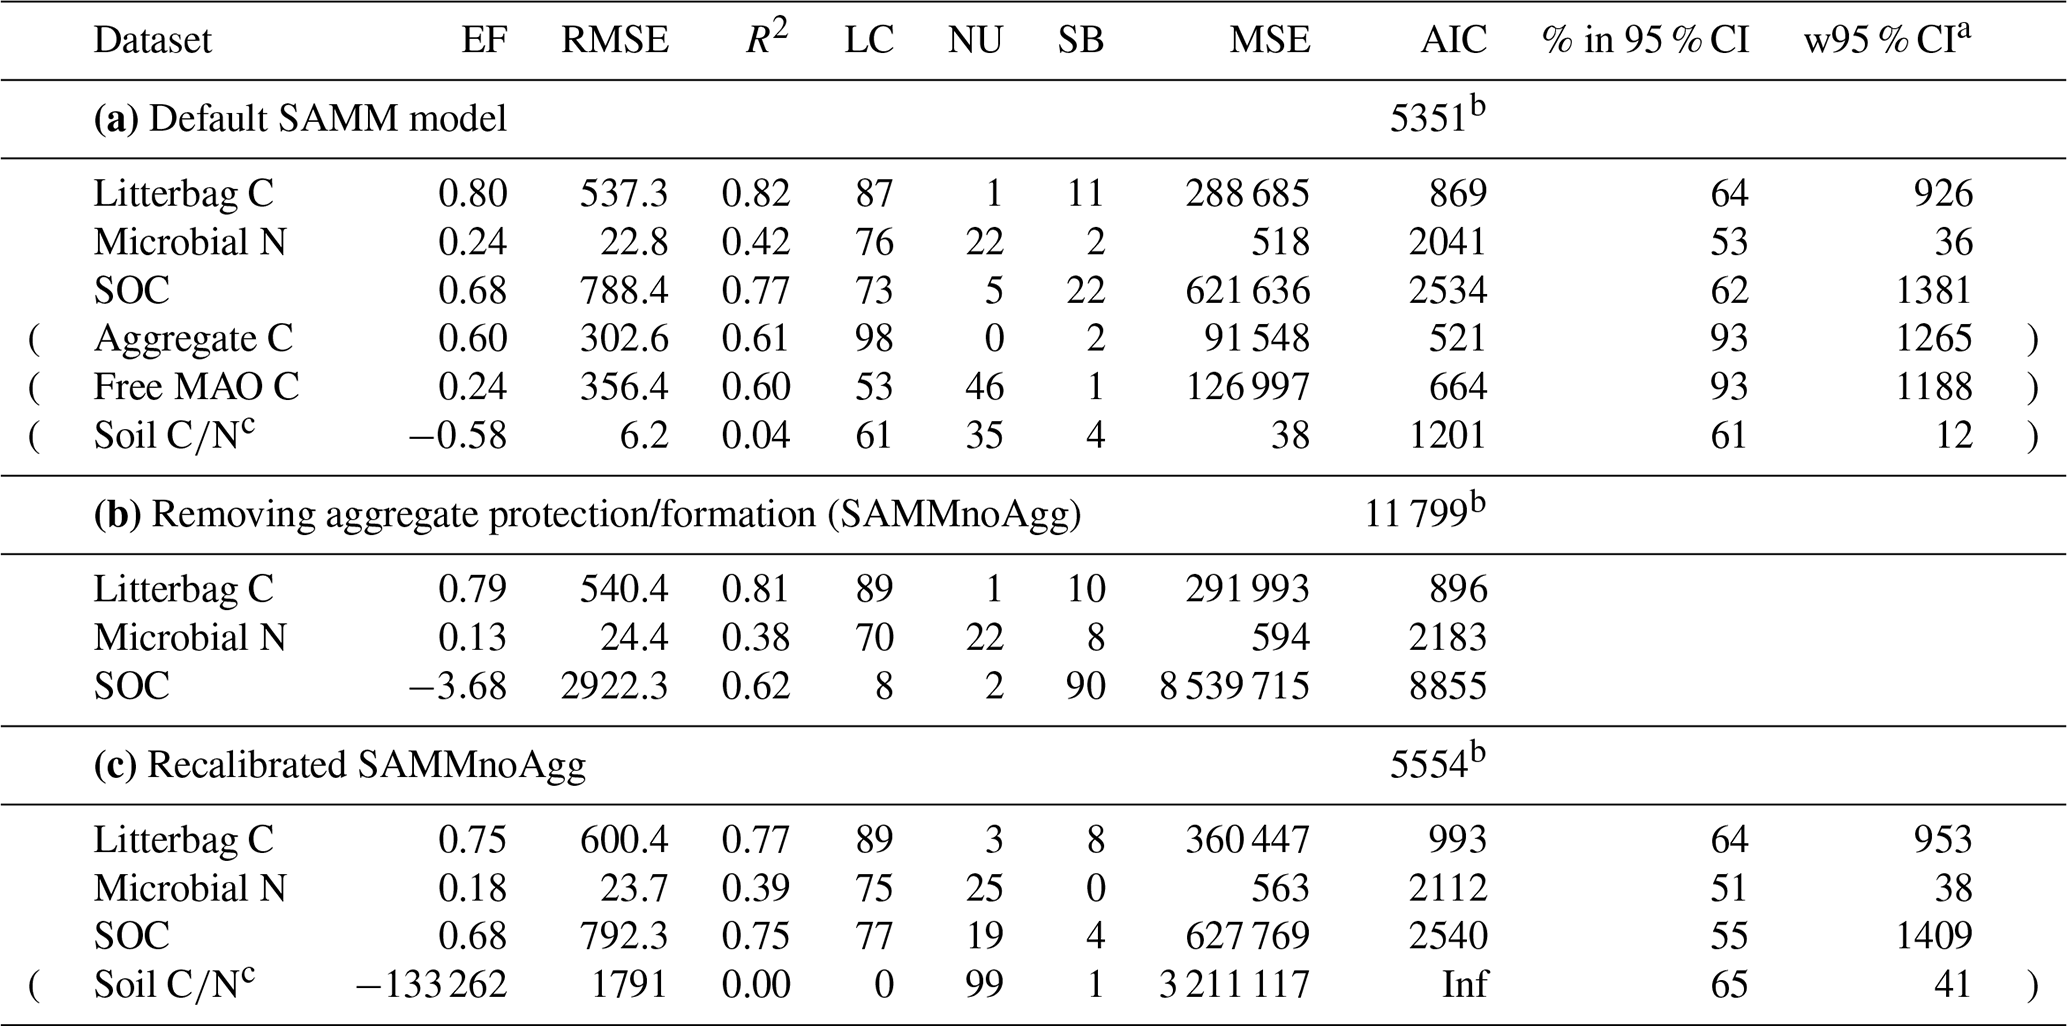
a 95 % width of the credibility interval from the Bayesian calibration posterior; b overall model AIC. For comparability of model versions this was computed without Aggregate and MAO C and soil . c Not used in calibration.
3.4 Comparison of SAMM separately calibrated with and without the aggregate protection mechanism
When the SAMM model without aggregate formation (SAMMnoAgg) was recalibrated, the poor model performance was largely resolved (Table 5c). For example, the model performance for SOC was the same for the two models (EF of 0.68). However, some notable difference between SAMM and recalibrated SAMMnoAgg remained for the microbial nitrogen and litter carbon. Their dynamics were simulated slightly worse in recalibrated SAMMnoAgg compared to SAMM (EF of 0.80 vs. 0.75 for litterbag C and EF of 0.24 vs. 0.18 for microbial nitrogen; Table 5c). Consequently, the overall model AIC, considering, for comparability, only litterbag carbon, microbial nitrogen, and SOC, was slightly lower for SAMM versus recalibrated SAMMnoAgg (5351 vs. 5554).
When comparing the posterior distributions of both model versions, it became evident that the recalibration of SAMMnoAgg counteracted the loss of aggregate protection by lowering the turnover of MAOM by almost 1 order of magnitude (about 85 %; Fig. A1). This indicates that the representation of aggregate protection on SOC was changed from explicit to implicit. Also, the recalibrated SAMMnoAgg version had a lower half saturation constant for direct adsorption of LMWC&N to MAOM in tendency, allowing for a faster direct adsorption (Table 4). However, the removal of aggregate protection did not affect most other model parameters, which were similar in their posterior distributions between SAMM and recalibrated SAMMnoAgg. Interestingly, the 95 % posterior credibility intervals were smaller for SAMM than for recalibrated SAMMnoAgg and at the same time covered a higher proportion of measurements of microbial nitrogen and SOC, indicating that they were more accurate for the aggregate version of SAMM.
3.5 Analysis of model parameter behavior
In both calibrated model versions, SAMM and SAMMnoAgg showed a clear distinction between the turnover of different carbon pools (Fig. A1). The highest likelihood turnover rates of MAOM, structural and metabolic litter differed by a factor of 5–10 (e.g., around 0.0004, 0.002, and 0.02 for SAMM, respectively; Table 4). The breakdown of aggregates, with around 3 % per day, and the physicochemical aggregate formation, equivalent to a MICC growth of 31 kg ha−1 per day, were high in SAMM. This indicated a highly dynamic aggregate fraction and a high importance assigned to physicochemical aggregate formation. At the same time, few strong parameter correlations of r>0.4 were present in the posterior parameters set for the SAMM (Fig. A2) and the parameter correlations in the recalibrated SAMMnoAgg were of similar magnitude (Fig. A3). First, structural litter turnover and structural protection capacity for labile litter were correlated (r=0.48). Then, there was a negative correlation between the aggregate protection of POM by microbial growth and the rate of formation of physicochemical aggregates (). Furthermore, the adsorption speed of LMWC to MAOC and the turnover of MAOM were correlated (r=0.40). Finally, the turnover of MAOM was correlated with microbial death (r=0.42).
4.1 SAMM as a state-of-the-art soil model with measurable pools
With SAMM, we present a state-of-the-art microbe-driven coupled model that is suitable for field-scale application. It simulates the effect of residue stoichiometry on microbial CUE (Sinsabaugh et al., 2016) and the role of microbial growth in aggregate formation (Laub et al., 2022; Bucka et al., 2021). It contains measurable pools, is well able to simulate aggregate formation resulting from microbial growth, maintains carbon and nitrogen identity (Wang et al., 2022) within the aggregates, and can easily be converted into a lower-complexity model without aggregates (i.e., SAMMnoAgg). The model evaluation statistics (Table 5) showed that SAMM, with its representation of carbon and nitrogen in measurable pools (including litter as measurable structural and metabolic pools), is capable of capturing the relevant processes in a long-term experiment of litter addition in a tropical sandy soil and of handling the complexity of microbial driven aggregate formation for different chemical compositions of litter. As demonstrated, SAMM captures the differences between treatments, the temporal development of microbial biomass, and the connection between microbial growth and aggregate formation. To our knowledge, apart from an early attempt to model in situ aggregate stability without considering aggregate stored carbon (Abiven et al., 2008), SAMM is the first model to demonstrate this capability in a field experiment with different litter qualities.
The fact that the parameter correlations were low (maximum r=0.48) compared to calibration exercises with established models such as DayCent (Necpálová et al., 2015, showed parameter correlations between turnover times of different pools of up to r=0.9), Daisy (Laub et al., 2020, had parameter correlations between turnover of fast and slow pools of up to r=0.8), or ICBM (Ahrens et al., 2014, had correlations between pools up to r=0.7), gives some indication that the structure of the SAMM model with measurable pools has a clear advantage compared to models with theory-based conceptual pools. It could, however, also be due to the superiority of Michaelis–Menten over first-order kinetics. Furthermore, the fact that all pools can be measured facilitates calibration, as was recently shown on a global scale with Millennial compared to Century (Abramoff et al., 2022). However, the data needed to constrain models with measurable pools at the global scale may not be readily available. For example, we are not aware of other field experiments that include different litter types and follow microbial biomass, SOC, and aggregate carbon simultaneously over time. Therefore, this version of SAMM was tested only at one site, and it remains to be evaluated for larger spatial scales and with a range of experiments with different-quality organic amendments. It is likely that across a range of sites, SAMM model performance will be lower and that the calibration to the single site of this study resulted in an overfitting of some parameters.
We posit that maintaining the carbon identity inside aggregates represents the next logical step for aggregate models, but we are aware of the fact that the marginally better performance of SAMM versus recalibrated SAMMnoAgg only provides initial evidence. Hence, we invite others to test the concept against further datasets with SAMM or with their own model. By maintaining the carbon identity, aggregate models can help answer important scientific questions, such as how important stabilization of carbon in aggregates is for the global carbon cycle. As shown by the deactivation of aggregates in SAMMnoAgg, SAMM can also provide novel insights into the relative importance of different processes, such as the importance of aggregate protection for carbon stabilization versus protection by attachment to minerals (Angst et al., 2021). In this calibration exercise, the model estimate was that only half of the carbon is protected as MAOC and that about half of the carbon is protected inside aggregates (Fig. 7). However, because we had no measurements of POM versus MAOM in the aggregates, we cannot evaluate this by measurements, and it is based on the assumption of complete protection of POM and MAOM inside the aggregates. Another interesting process insight was that the calibration of SAMM assigned a similar importance to physicochemical aggregate formation and microbial aggregate formation and that both processes probably happen in parallel, especially in tropical soils, as tested here. However, it is clear that our data did not provide enough information to clearly distinguish between both processes, which can be seen by the wide posterior credibility intervals of physicochemical aggregate formation. Despite this, the fact that SAMM could simulate the observed increase in aggregate C in the dry season toward the end of 2019 (Fig. 6) indicates that this process needs to be included.
4.2 Is aggregate protection necessary to better simulate microbial and SOC dynamics?
It has been postulated that because a substantial portion of soil carbon is located within soil aggregates, soil aggregation needs to be included in models in order to accurately capture reality (Segoli et al., 2013; Abramoff et al., 2018). In this paper we followed this hypothesis and explicitly tested it by comparing the performance of SAMM with and without aggregate formation in simulating litter carbon, microbial nitrogen, and SOC across the different treatments (Table 5). Since clear connections between microbial growth and aggregate formation have been demonstrated (Laub et al., 2022; Bucka et al., 2021; Bossuyt et al., 2001; Denef et al., 2001), including aggregate formation in SAMM is a more realistic process representation. In alignment with our second hypothesis, removing the soil aggregate formation did, even after recalibration of SAMMnoAgg, reduce model performance of the non-aggregated pools, albeit not strongly. This suggests that simulation of aggregate formation and disruption can be useful to understand the overall dynamics of SOC, but that SAMMnoAgg was able to artificially compensate for the missing aggregate protection mechanism (which, as shown by crushed aggregates incubation, e.g., Kpemoua et al., 2022; Puttaso et al., 2011; Six et al., 2002, clearly exists) by reducing turnover of MAOM. What also speaks for this effect are the smaller posterior credibility intervals of SOC, microbial nitrogen, and litter carbon of the aggregate version of SAMM compared to recalibrated SAMMnoAgg (Table 5) and that they still covered a higher percentage of measured values.
The fact that the recalibrated SAMMnoAgg model still seems to implicitly account for the aggregate protection of SOC by reducing the turnover of MAOM (Fig. A1) could suggest that aggregate formation does not need to be included in models to accurately capture differences in SOC formation at large scales. Despite being a better process representation, limited data availability of aggregate and microbial dynamics may make a non-aggregate model more feasible. However, for a mechanistic understanding, i.e., using the model as a research tool to test hypotheses, it is arguably better to include aggregate formation and carbon protection in aggregates. By contrast, simulating aggregate protection may not be necessary to assess the carbon sequestration potential of different management strategies. On the one hand, many processes that are relevant for soil formation and SOC stabilization and occur inside aggregates may be irrelevant at the field scale (Yudina and Kuzyakov, 2019) if they are implicitly included by adjusting other model parameters. On the other hand, we only had data to test SAMM with one long-term experiment in a single soil type. Model parsimony and equifinality often depend on how many data are available (Marschmann et al., 2019). Hence, it is possible that across sites, the interaction of factors such as differences in texture, litter composition, and different climates on SOC protection may be best represented by a model that includes the mechanism of aggregate protection. For example, the better model performance of Millennial compared to Century only became evident when looking at the global distribution of soil carbon (i.e., only at high latitudes is Millennial better; Abramoff et al., 2022). Clearly, a range of field experiments that measured the temporal dynamics of aggregates together with microbial biomass and SOC would be needed to better test and hence understand the relevance of aggregate formation to simulate SOC dynamics across scales.
4.3 Potential limitations and open questions
An interesting observation is that the model assumes a rather high amount of daily carbon input through roots (about 3 kg C ha−1 d−1 for both SAMM and SAMMnoAgg) in addition to the litter that is added annually through the treatment. However, this additional material is expected to have a rather high ratio. The parameter of daily carbon input was included for two reasons: (1) we observed weed growth in the plots, despite regular weeding, and hence assuming no additional inputs did not seem reasonable, and (2) model runs with carbon inputs only from litter addition could not maintain any microbial activity in the control, further corroborating the validity for these inputs (simulations not shown). The fact that the calibration assumed rather high root inputs is potentially due to the absence of more complex microbial traits in SAMM, such as dormancy, which some other models include (Wang et al., 2015; Blagodatsky and Richter, 1998). In fact, the estimation of microbial biomass via chloroform fumigation extraction does not separate between dormant and active microbes. While Wang et al. (2015) suggested that a model that includes dormancy can better represent the total magnitude of microbial biomass, an important concept of SAMM was the measurability of all pools and the inclusion of dormancy would thus need data on dormancy, which were not available in this trial. Ideally, only the non-dormant microbes should be considered in the microbial activity factor (aMIC). Since , which determines aMIC, is a calibrated parameter, this discrepancy does not drastically alter model behavior. However, it means that the microbial activity factor of SAMM cannot be directly compared with measurements of microbial activity, and it implicitly assumes that the fraction of dormant microbes is constant. Since the water and temperature rate modifiers indirectly account for differences in microbial activity between optimal and poor conditions, the use of chloroform fumigation extraction data is most likely, in the absence of data on dormancy, the best way to represent a single microbial biomass pool while maintaining structural identity.
Furthermore, CUE is only a function of litter and not of the microbial community. An earlier study showed that the different treatments led to different microbial communities (Kamolmanit et al., 2013), and communities of minimal inputs usually become more efficient at recycling carbon and nitrogen (Dijkstra et al., 2022). The lower ratio of daily root carbon inputs in SAMMnoAgg compared to SAMM in that regard could be interpreted as aggregate formation within a model that helps simulate microbial biomass patterns. In fact, aggregate formation, linked to both microbial growth and physicochemical formation, was very fast. Additionally, turnover rates were high (almost as fast as metabolic litter decomposition). This is in alignment with a recent model of aggregation on the micro-scale (Zech et al., 2022). Yet, it is difficult to distinguish between the different pathways of aggregate formation. Finally, the question is to what extent POM and MAOM are effectively protected inside aggregates. In this version of SAMM, we simulated the most extreme case of complete protection of carbon inside aggregates, which in future versions should most likely be replaced by a decomposition reduction factor because we know that aggregates do not completely protect carbon. Yet, it will be very difficult to measure carbon turnover inside aggregates and hence to constrain such a reduction factor. Finally, the next logical step would be to include multiple soil layers in SAMM, provided a suitable water leaching function is included. The LMW leaching to deeper soil layers, feeding aggregate formation there should, in theory, help to explain SOC depth gradients.
We presented and evaluated the SAMM model, a state-of-the-art soil organic matter research model with measurable pools that can simulate the formation and turnover of aggregates under different organic amendment treatments. Overall, good model evaluation statistics (EF 0.2–0.8, depending on observation type) and low parameter correlations (r<0.48) suggested that the current structure of SAMM is valuable, clearly identifiable in calibration and hence parsimonious. The results suggested that aggregate protection plays a crucial role for SOC stabilization, i.e., in the model simulations about 50 % of soil carbon was protected in aggregates, even in the sandy soil of the long-term experiment studied. While for basic research, aggregate formation should be included into models, our results indicate that with model recalibration, the absence of aggregate protection in SOM models is partly compensated by reducing turnover of the MAOM pool. Hence, if the sole goal is to represent SOM, microbial nitrogen, and litter carbon well, aggregate formation may be omitted in SOM models, especially if there are insufficient data on aggregates. However, it is possible that this compensation in our study was only possible because the data originated from a single site. For further evidence, studies would be needed in a variety of soils and climates, which calls for more long-term studies to include repeated measurements of aggregate and microbe dynamics.
A1 Detailed description of the SAMM model pools
A1.1 Structural litter pool – STRC
To make the structural litter pool (STRC) fully measurable, it consists of lignin and polyphenols, the parts of litter which stabilize the cell wall and are processed by microbes with a low CUE. STRC is assumed to have a carbon content of 65 %, representing a lignin-typical ratio of (Gargulak et al., 2015). Through this definition, the structural litter pool is measurable as acid detergent lignin (Van Soest and Wine, 1968) and polyphenols (Anderson and Ingram, 1993), and it does not contain nitrogen.
A1.2 Metabolic litter pool – LABC and LABN
The metabolic litter pool contains all parts of the litter which are not part of STRC. This includes cellulose, hemicellulose, intracellular carbon, and nitrogen. Because plant cell walls are a mixture of structural components with celluloses and hemicelluloses (Alberts et al., 2002), there needs to be a distinction between the non-lignin components of the cell wall and the easily available cell interior. While others have solved this by creating three litter pools, containing the soluble part, the non-lignin structural part, and the lignin part (Campbell et al., 2016), we wanted to be parsimonious and have only two litter pools. We therefore linked the decomposition speed of the non-lignin cell wall components to the decomposition speed of lignin by adding a simulated protection capacity of the structural litter pool on the metabolic litter pool. This mimics that the parts of the cellulose, hemicellulose, and lignin of the cell wall are tightly interwoven (Alberts et al., 2002). The amount of protected metabolic carbon (ProtLABC&N) is not a real pool but a linear function of carbon in the structural pool (fixed ratio). This approach implicitly assumes that non-lignin and lignin cell wall components decompose together and that the decomposition speed of the lignin components is the rate-limiting factor. All components that are not protected by STRC are considered to be easily available for microbial uptake and, due to the lower cost of depolymerization, microbes usually process them with a higher CUE.
A1.3 Low-molecular-weight carbon and nitrogen pools – LMWC and LMWN
The low-molecular-weight pool contains depolymerized carbon and nitrogen which easily enters the soil solution. All decomposed plant and microbial residues, as well as MAOM, end up in this pool. The pool of LMWC&N can be measured by extraction using a K2SO4 solution. Microbes, similar to other established models, such as MEND (Wang et al., 2013) and Millennial (Abramoff et al., 2018), can only consume carbon and nitrogen in the LMWC&N pool. When consumed by microbes, LMWC is subject to a dynamic CUE. This dynamic CUE is a function of the ratio of LMWC&N, thus accounting for a -dependent growth respiration and spilling (Sinsabaugh et al., 2013). We used the linear function of -dependent CUE (Fig. A6) based on Campbell et al. (2016, equation 16B), which they based on Sinsabaugh et al. (2013). Additionally, the LMWC&N pool is the only pool that can be leached. Finally, direct adsorption of LMWC and LMWN to particles from the silt and clay fraction is possible. This was simulated using a Langmuir-type relationship, as in Wang et al. (2013), with values for this relationship estimated by Abramoff et al. (2022).
A1.4 Microbial pools – MICC and MICN
The MICC&N pool comprises the living soil microbial biomass that actively influences the decomposition of all other pools. MICC&N can be measured using various techniques, such as substrate-induced respiration (Kandeler et al., 1999), or the more common chloroform fumigation extraction (Vance et al., 1987), but all of these are subject to considerable uncertainty. In SAMM, the MICC&N pool actively contributes to the decomposition of other pools through a microbial activity factor (aMIC). Because the uptake of LMWC and LMWN by microbes only depends on the availability and on aMIC, the ratio of microbes is not fixed. We included indirect limits to microbial through a -dependent CUE and a direct limit through nitrogen immobilization if microbial surpasses an upper boundary and a spilling of nitrogen occurs for very low ratios at a lower boundary. If the ratio of microbes becomes smaller than a minimum , the excess nitrogen is released by the microbes to avoid unrealistically low ratios of the microbes (maximally half of the excess nitrogen per day). Both maximum and minimum microbial are calibrated parameters. The microbial pool is subject to maintenance respiration and microbial death. The carbon and nitrogen of dead microbes are divided between the LMWC&N and the mineral-associated pool, representing the soluble cell constituents entering LMWC&N and cell wall structures, which are assumed to be attached directly to the minerals (Krause et al., 2019).
A1.5 Mineral-associated organic carbon and nitrogen pools – MAOC and MAON
This pool consists of all carbon and nitrogen which is attached to silt and clay. It has long been suggested that this is a form of carbon and nitrogen with slower average turnover than total SOM (Christensen, 2001) with a residence time of decades to millennia (Kögel-Knabner et al., 2008). There are two ways in which carbon and nitrogen can enter the MAOC&N pools: first, microbial cell walls that attach to minerals after microbial death and, second, the adsorption of LMWC&N. As in many models, we allow for an attachment of SOM to MAOC&N in the form of microbial residues that is only limited by a partitioning constant as one process. The adsorption of LMWC&N to MAOC&N, as the other process, follows a Langmuir-type relationship, where the limit is determined by the amount of silt and clay in a soil (Abramoff et al., 2022). The differences between LMWC&N and MICC&N attachment to MAOC&N follow recent studies that demonstrated that N-rich microbial products preferentially attach to new mineral surfaces (Kopittke et al., 2018, 2020), while the direct sorption of LMWC&N depends on the amount of fine particles (Georgiou et al., 2022).
A1.6 Aggregate pools – AggC and AggN
To adhere to the concept of structural carbon identities, the carbon and nitrogen in aggregates does not represent a single pool. Instead, the aggregates consist of the primary constituents STRC, LABC&N, and MAOC&N pools, which inside aggregates are protected from decomposition (AggSTRC, AggLABC&N and AggMAOC&N). In alignment with recent studies showing that the presence of microbially produced binding agents stabilizes aggregates (Bettermann et al., 2021; Crouzet et al., 2019), the rate of aggregate formation in SAMM (amounts of primary constituents entering the aggregate-protected pools) is a function of microbial growth. Furthermore, SAMM allows for physicochemical aggregate formation at a constant rate (currently defined as daily microbial growth equivalent). This physicochemical aggregate formation represents all abiotic aggregate formation processes. Hence, SAMM allows for both important processes of aggregate formation, biological and physicochemical (Six et al., 2002), while within the aggregates there is no decomposition, a concept proposed by Luo et al. (2017) as a way to reduce the number of parameters in aggregation models and represent aggregate protection in a parsimonious way. Each carbon identity is transferred back into the pool from which it originated without any loss of matter during aggregate turnover.
A2 Technical implementation of SAMM
The SAMM model was written in the R programming language (R Core Team, 2020), and differential equations were solved using the deSolve package with the rk4 solver (Soetaert et al., 2010). Thus, it can be run at any time step. We used a daily time step with the optimized rk4() solver, after confirming that the results for this were the same as using an ode() solver, which makes time steps infinitely small and has no numerical errors. Simulations of carbon and nitrogen dynamics are performed for the topsoil layer (0–15 cm). While all flows of carbon and nitrogen between pools were simulated within the SAMM model, the soil water status, water leaching, and temperature needed to drive SAMM are currently external inputs. Climatic data and soil temperature measurements were available from a station located close to the experiment, and soil water content and leaching of water from the soil were simulated with the HYDRUS 1D model (Šimůnek et al., 2005) based on climatic data and soil texture. Measurements conducted with moisture sensors during 2019 showed that the simulated HYDRUS water content matched the moisture levels and the dynamical pattern of the measured water content (Fig. A4). To be able to calibrate SAMM for litter decomposition from a litterbag experiment, we created litterbag carbon and nitrogen pools, which were reinitialized with each yearly litter addition and did not flow into any other pools. They decomposed at the same turnover as the normal STRC and LABC&N litter pools, but could not be protected in aggregates. Note that SOC was defined to correspond all pools combined, excluding the free STRC and LABC pools.
A3 SAMM model equations and additional model graphs
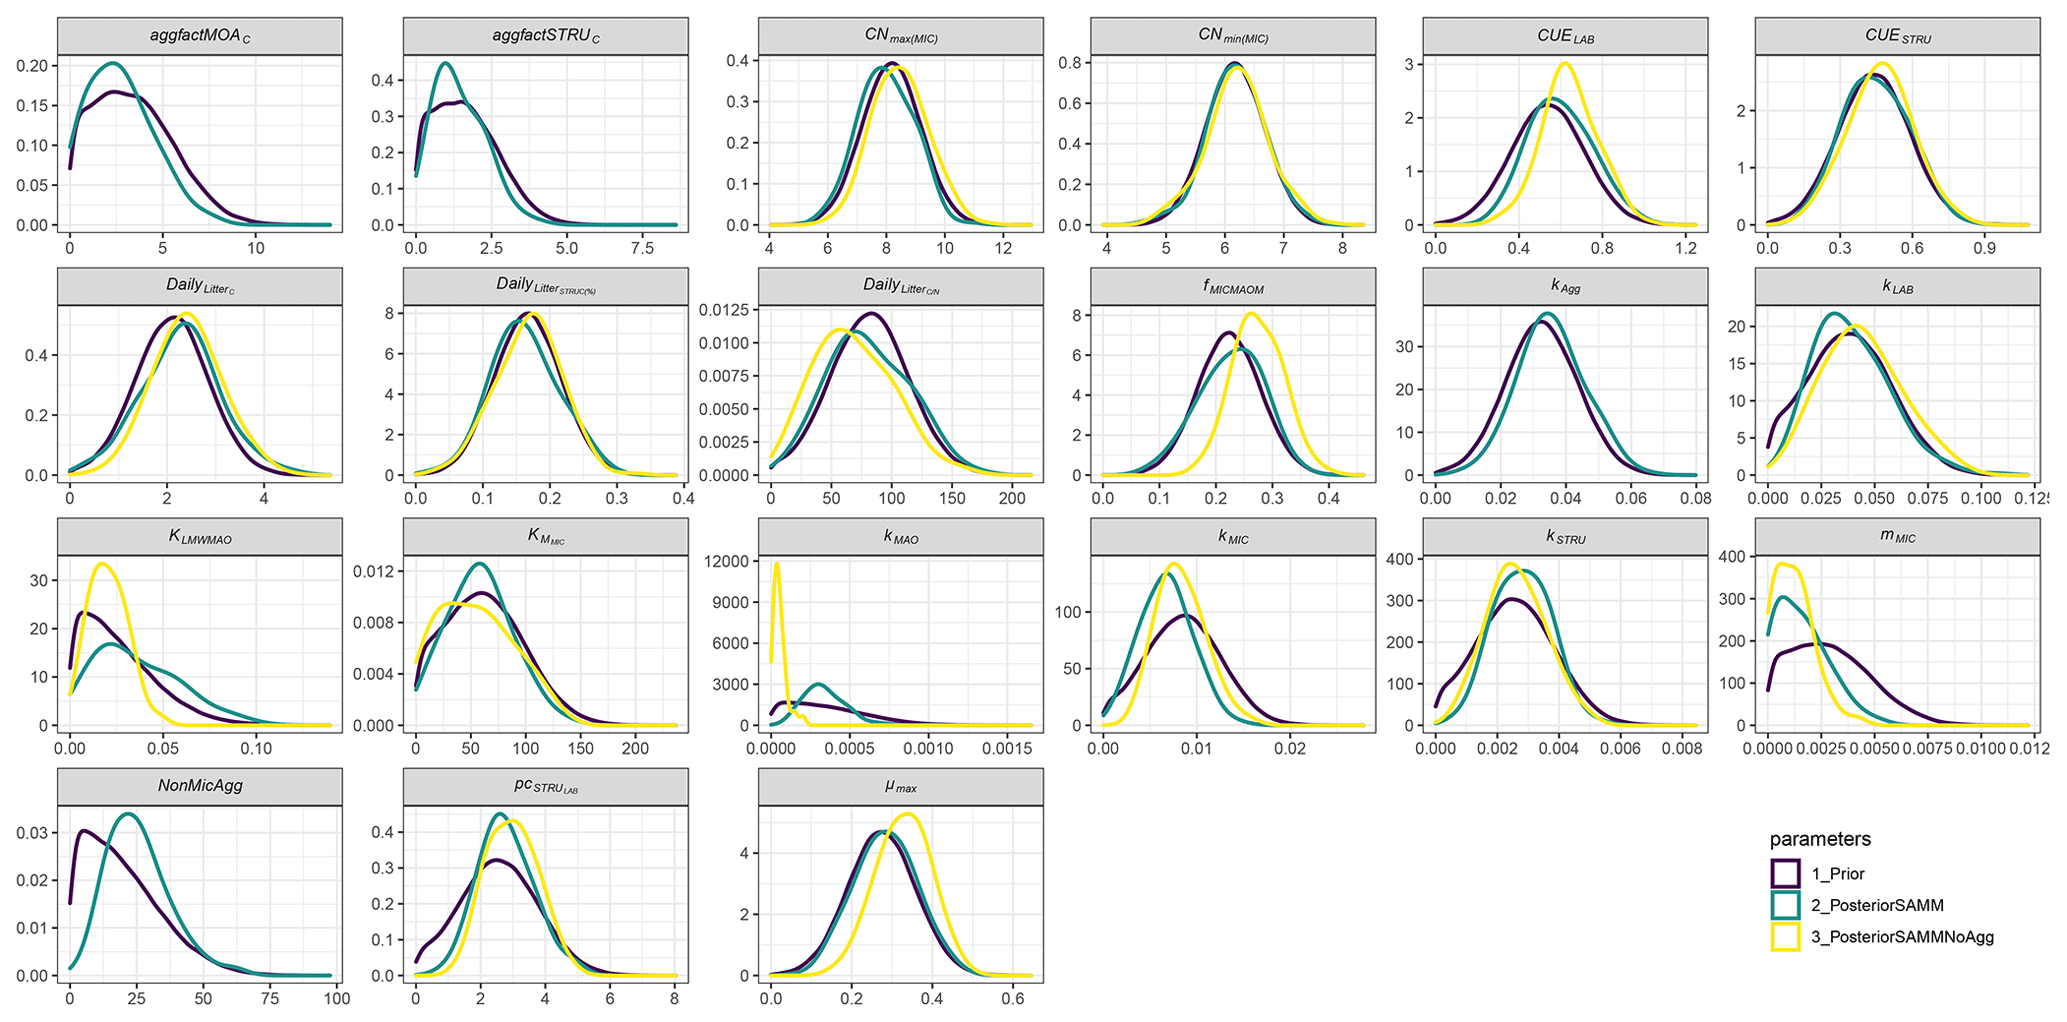
Figure A1Prior and posterior parameter distributions of SAMM and the version without aggregates (SAMMnoAgg) for all model parameters that were calibrated. Priors were the mean of SAMM and SAMMnoAgg from an initial calibration of both model versions with a genetic algorithm. The width of the distribution was manually chosen and based on the range given by the genetic algorithm. Negative values were excluded.
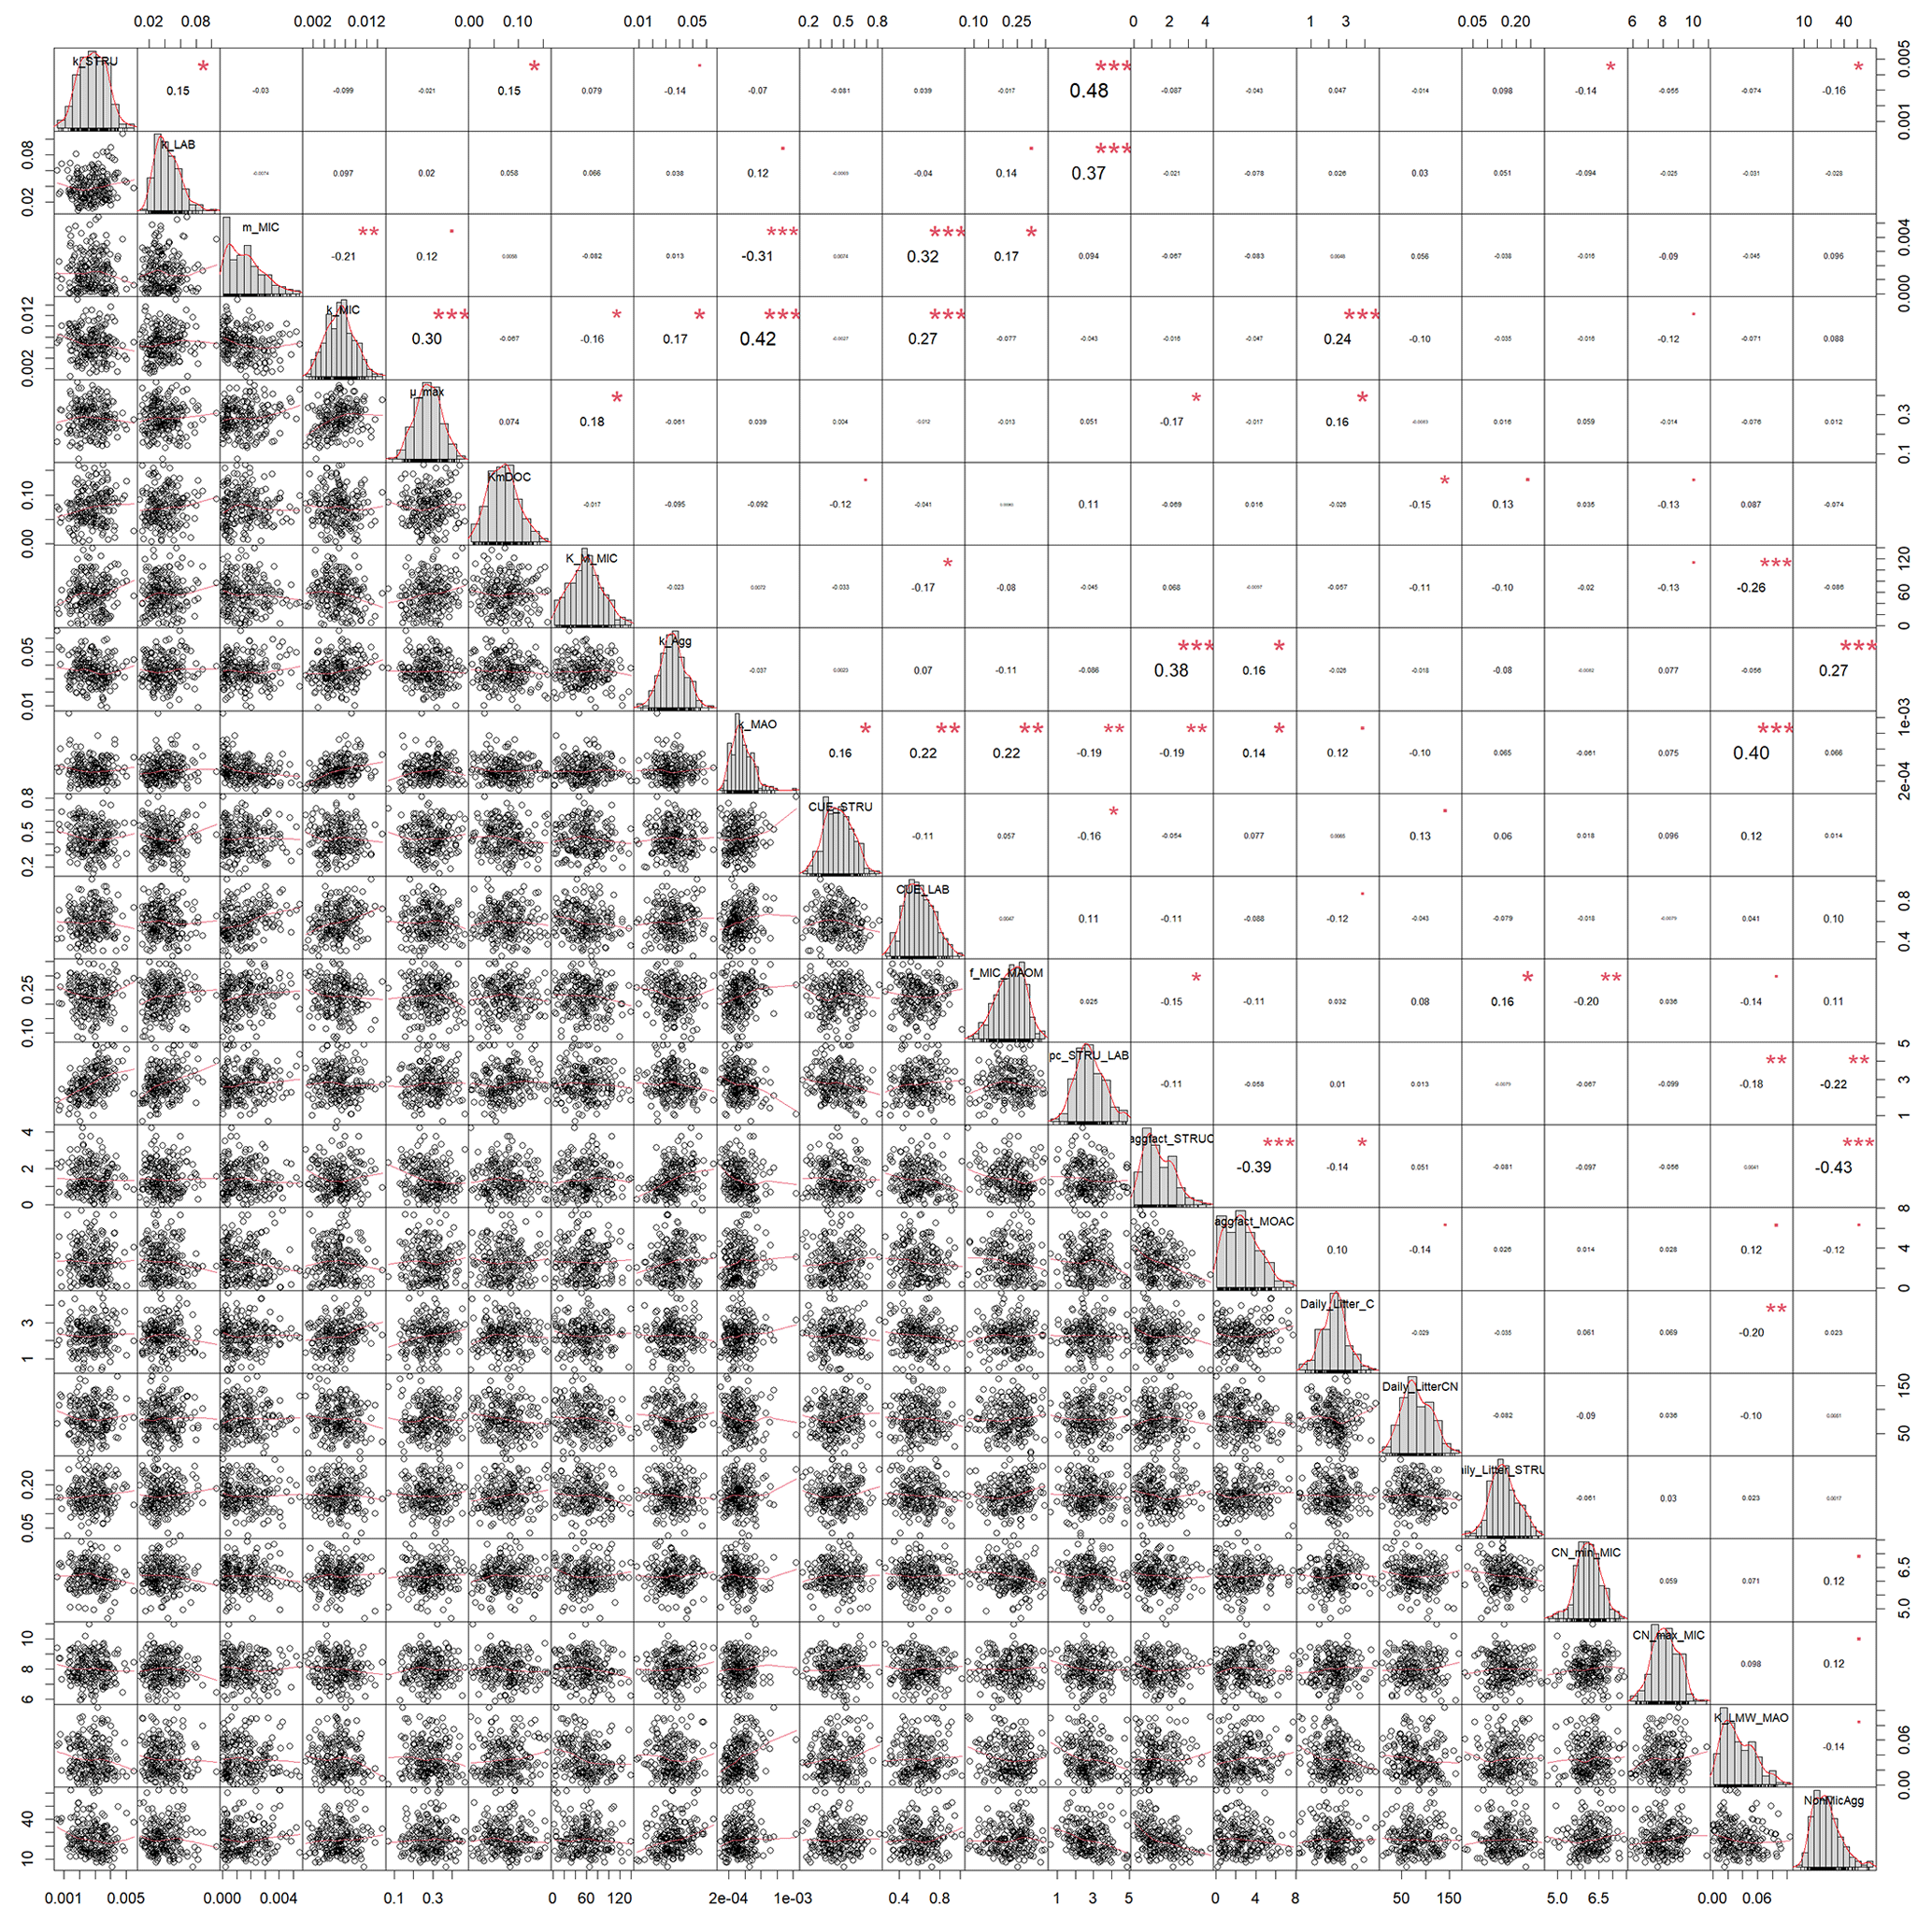
Figure A2Correlation matrix between all calibrated parameters of the SAMM model. The parameter values are from the posterior distribution of the Bayesian calibration using the SIR method. The level of significance for parameter correlations is indicated by red stars (p<0.05, 0.01, and 0.001 for 1 to 3 stars, respectively).
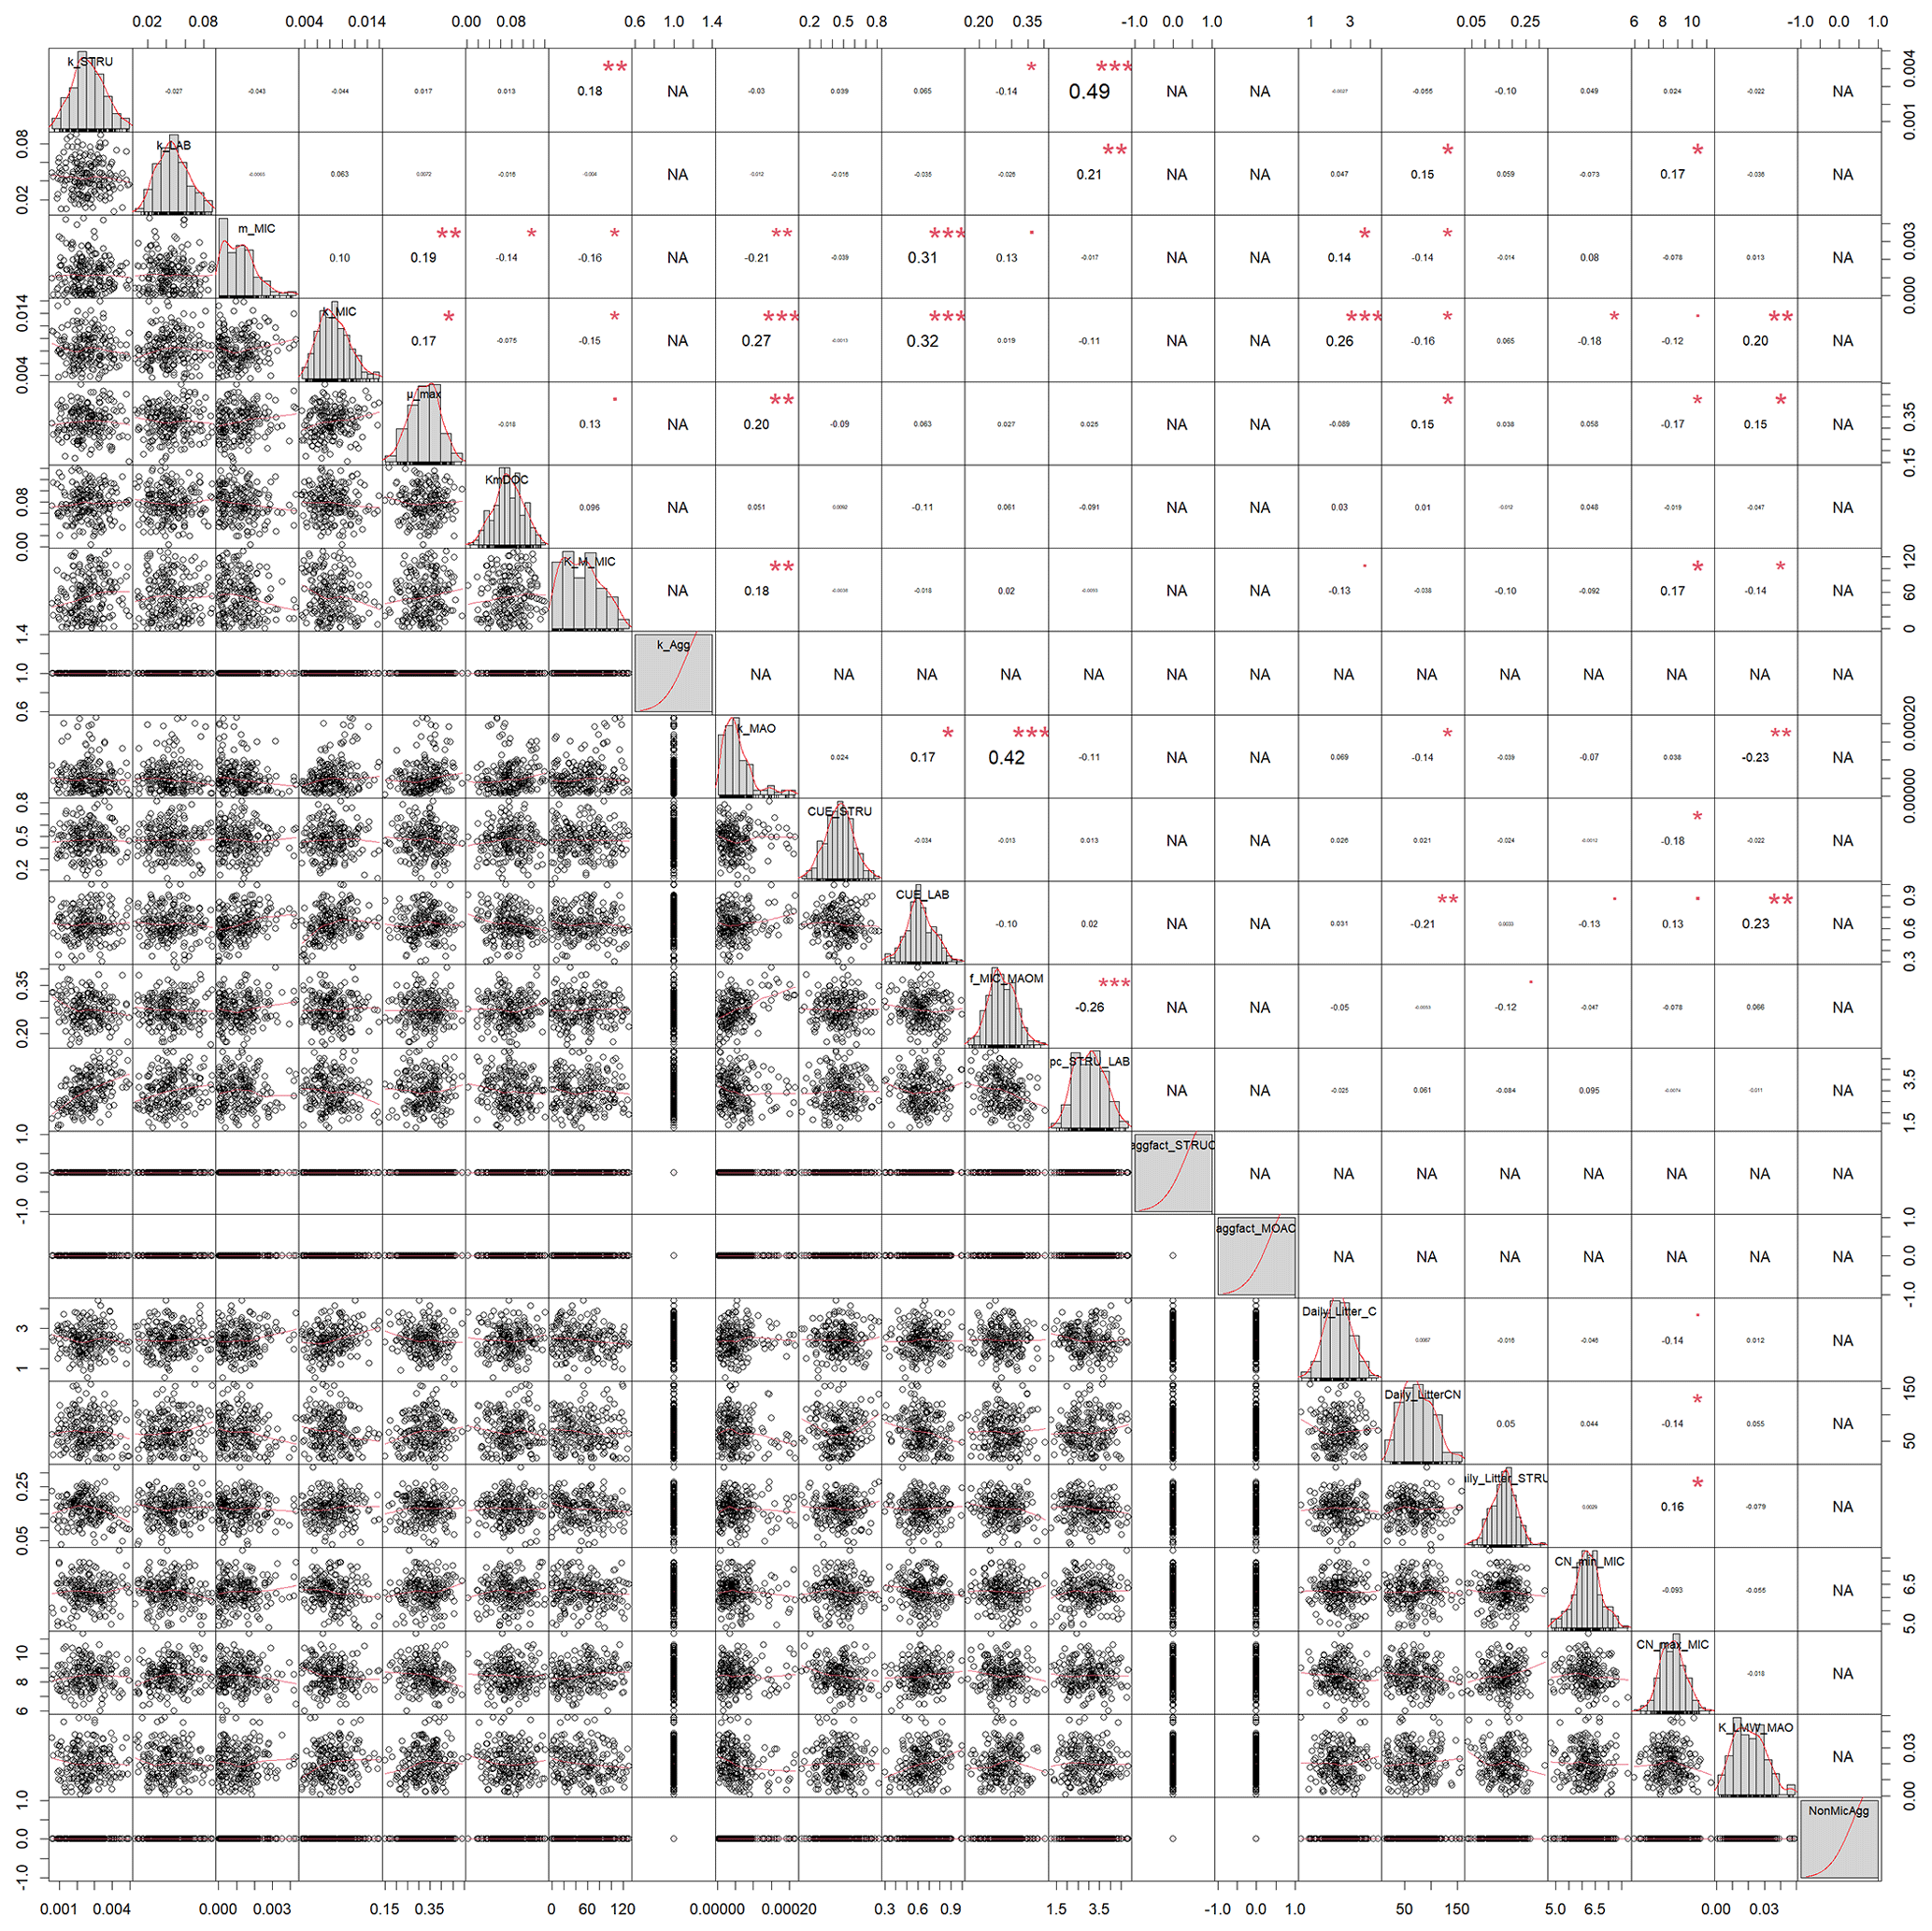
Figure A3Correlation matrix between all calibrated parameters of the model without aggregates (SAMMnoAgg). The parameter values are from the posterior distribution of the Bayesian calibration using the SIR method. Aggregate related parameters were fixed to deactivate the aggregate formation.The level of significance for parameter correlations is indicated by red stars (p<0.05, 0.01, and 0.001 for 1 to 3 stars, respectively). NA corresponds to parameters that were fixed for SAMMnoAgg and thus have no correlation.
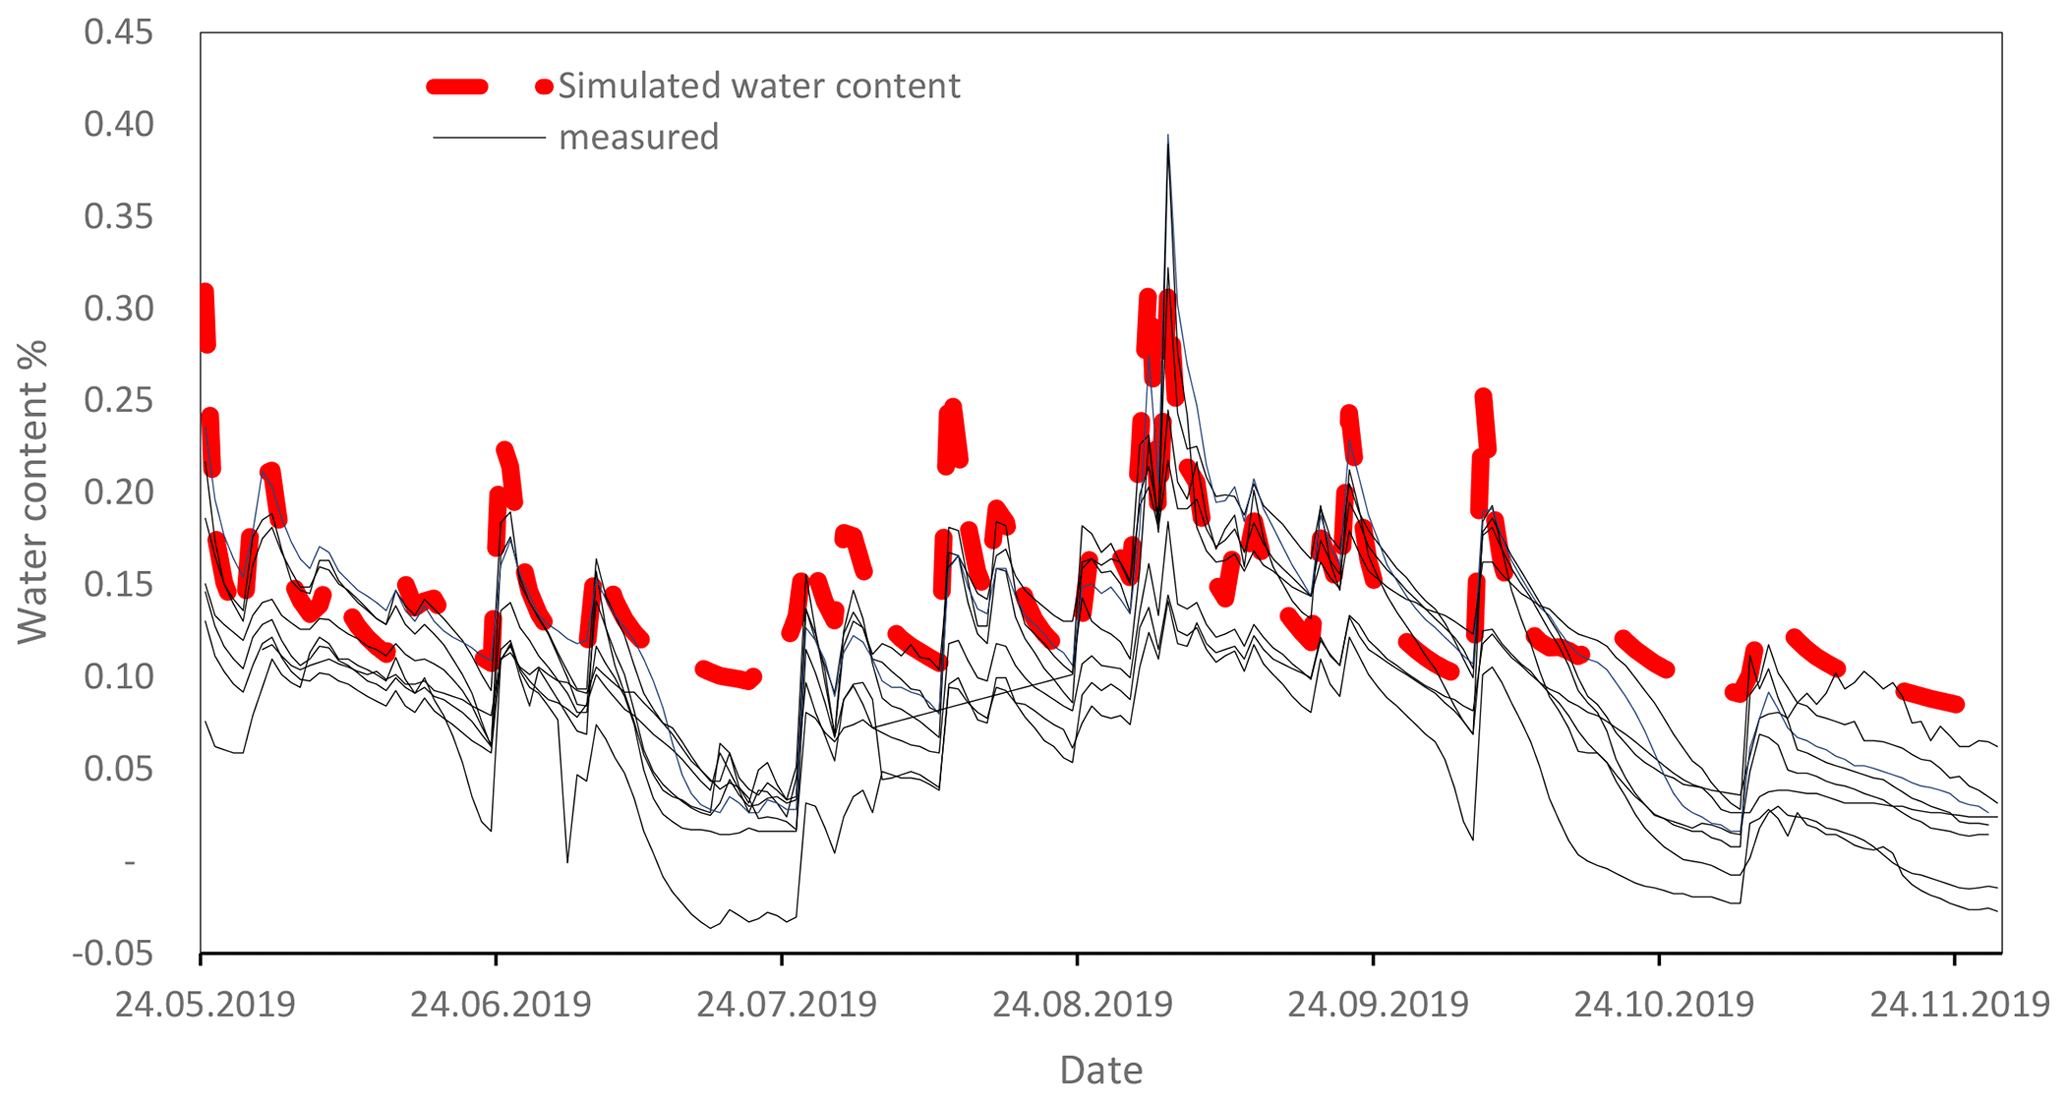
Figure A4Comparison of measured water contents by moisture sensors (ECH2O EC-5, METER Group, Inc. USA; solid lines) with simulated water content by HYDRUS 1D (dashed red line). Sensors were installed in different plots of the long-term experiment in Khon Kaen.
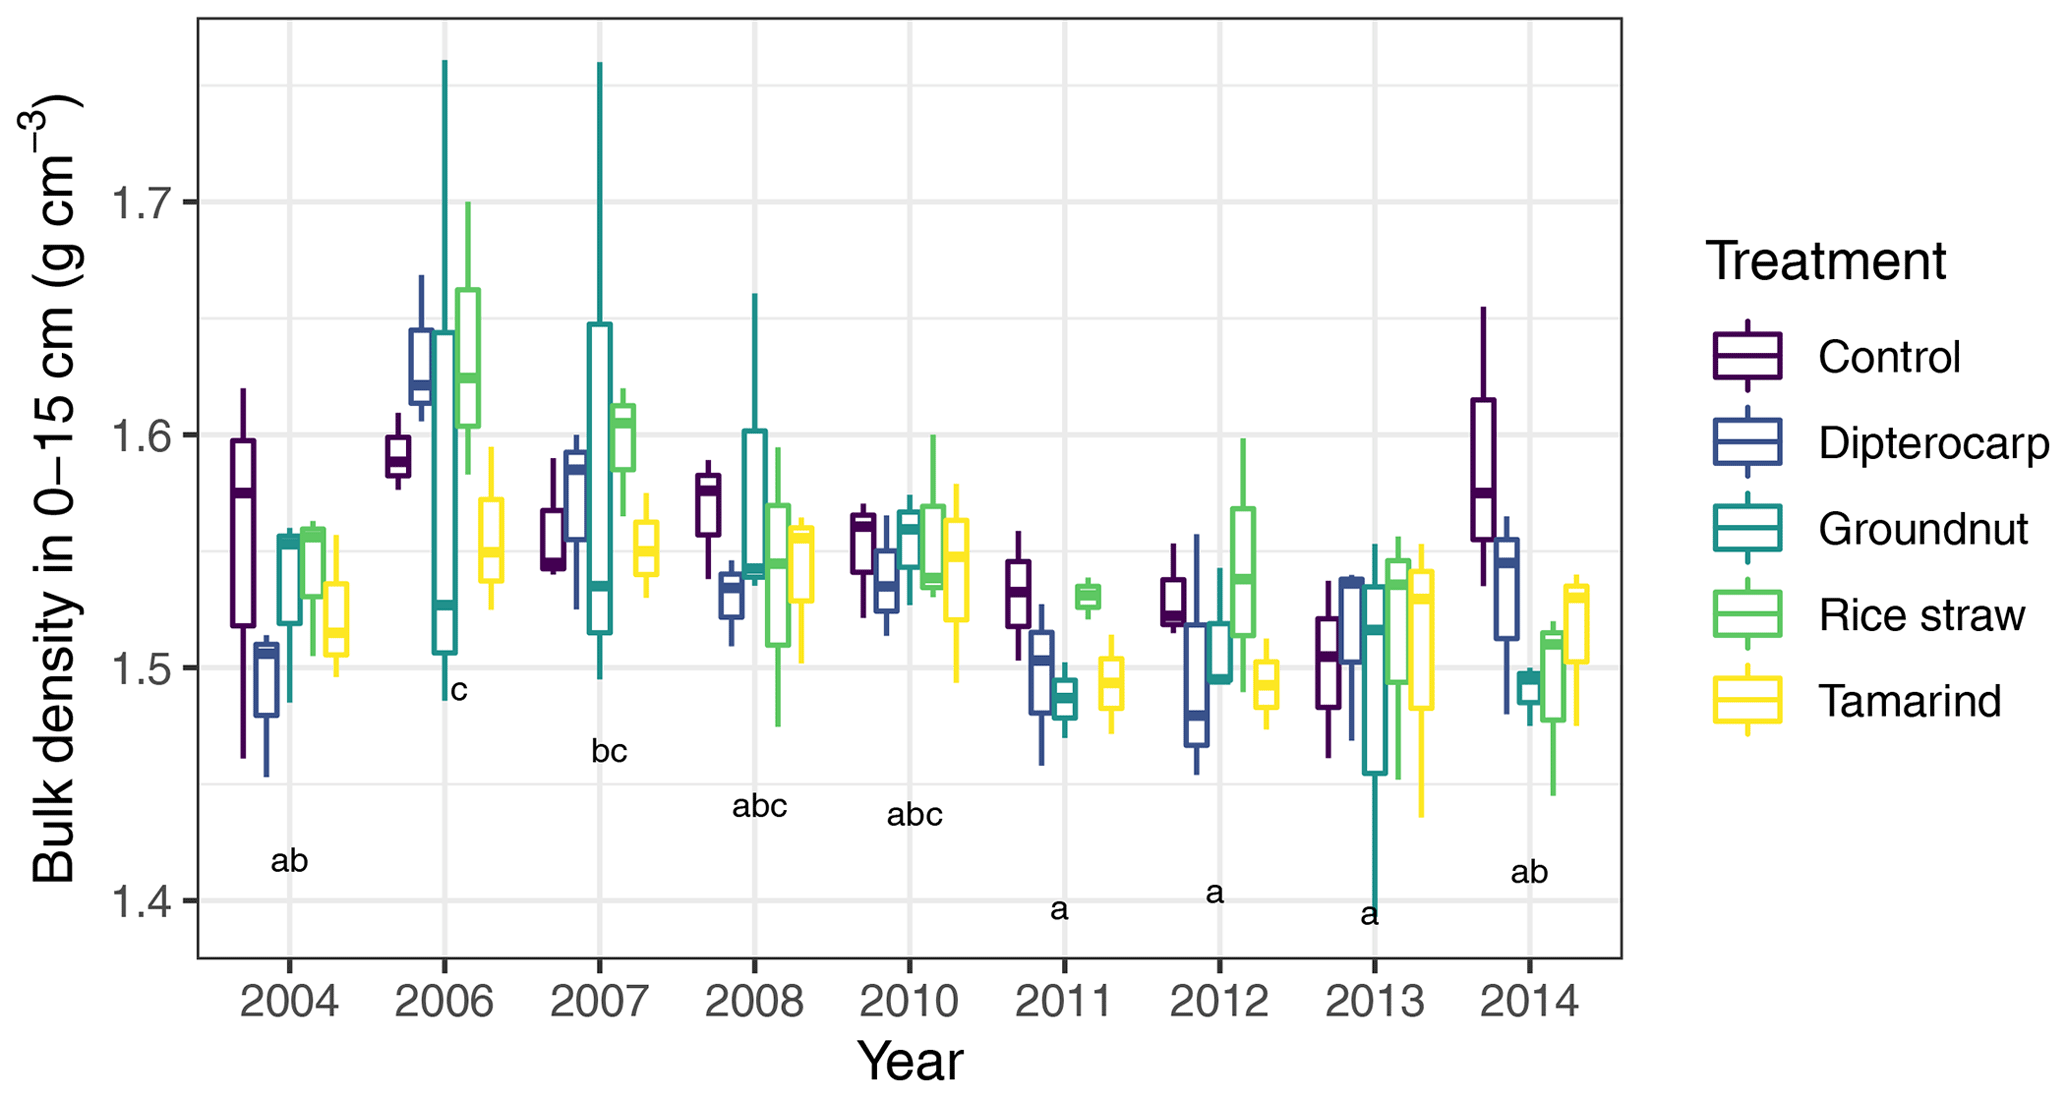
Figure A5Comparison of measured bulk densities in 0–15 cm in the years with available data. Treatment differences were not significant but a significant effect of year existed. This was, however, not considered to be any temporal trend but rather an effect arising from different people conducting the sampling. All statistical tests were conducted with a mixed linear effects model, containing a random intercept per subplot nested in the experimental block.
The following section describes the differential equations of the SAMM model that govern the changes of pool sizes (Table 3) over time. Inputs into the system are only in the form of litter ( and ). The flows between pools are displayed as flows () from the donor pool (X1) to the receiving pool (X2) as follows:
Respired (CO2) and leached (Cleach) carbon are permanently lost from the system.
The flows of carbon between pools, as described above, are computed from the state variables of each pool XC, the protection capacity for the LABC pool (pLAB), carbon use efficiencies for each pool (CUEX) and their standard turnover rates (kX) or maximum microbial uptake for LMWC (μmax). Apart from LMWC, the CUEX, are not directly measurable, but represent a proxy for depolymerization cost. The decomposition speed of all pools outside aggregates is influenced by a reverse Michaelis–Menten microbial activity factor (aMIC), and a temperature (st) and a moisture rate modifier (sw) influences all pools. Partitioning coefficients (fX) are further used, where one pool feeds into several pools.
The protection and disruption of aggregates are formulated as follows:
Adsorption to MAOC is formulated as follows:
For leaching, which was externally calculated using the HYDRUS 1D model (Šimůnek et al., 2005), it is assumed that LMWC&N are equally mixed with the soil solution and thus lost at the same rate as leached water.
The reverse Michaelis–Menten microbial activity factor (aMIC), which influences the decomposition speed of most pools, and the ratio of STRC, LABC&N, and MAOCC&N protected in aggregates are calculated as follows:
It was defined as never being lower than 0.05, so that microbes in low organic matter input treatments would not completely die off.
The maximum adsorption capacity of a soil depends on the modeled depth, the bulk density (BD), and the amount of silt and clay particles (SiCl):
The temperature (st) and a moisture scalar (sw) and the dynamic CUE were adopted from established models and not subject to further modification (Fig. A6). For the temperature scalar, an exponential equation was chosen as is common in many models (e.g., Daisy; Mueller et al., 1997). In this context it is important to note that different temperature rate modifiers have a different temperature at which they set the temperature scalar to 1. Here 20 ∘C was chosen to be representative for the tropical climates. Many temperate models use a value of 10 ∘C for the scalar (Daisy, RothC), whereas Century and Millennial use a scalar that has a maximum value of 1 at 40 ∘C but only 0.5 at 20 ∘C. This difference in temperature scalar functions needs to be considered, e.g., when adopting turnover rates from one model to another. In that case, rates need to be adjusted accordingly (e.g., in the case of SAMM multiplying them by 2 for models that define the scalar to be 1 at 10 ∘C and use an exponential temperature function with a Q10 value of 2).
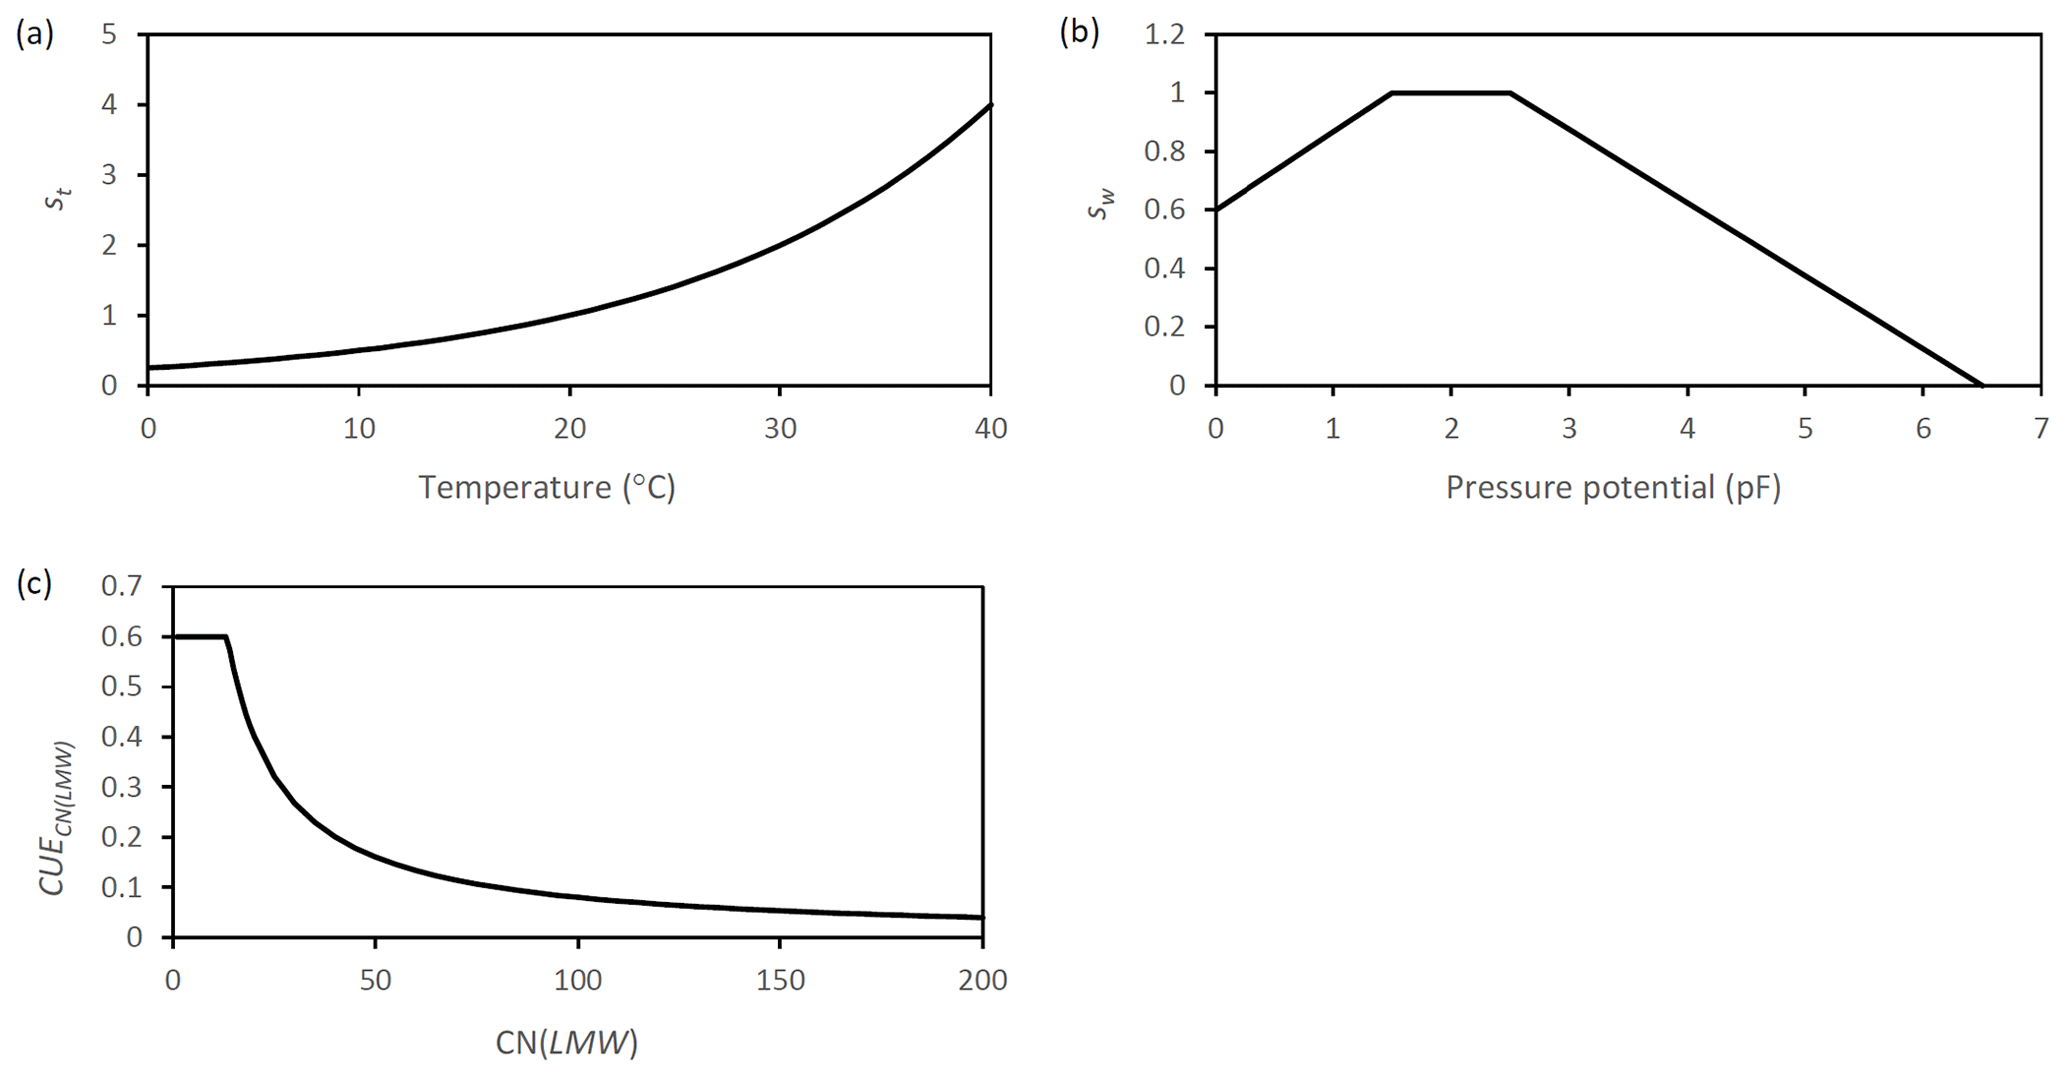
Figure A6Graphic representation of the scalar functions which are applied in SAMM to represent the effect of (a) temperature (b) moisture. Additionally the function that represents (c) the dynamic CUE based on the ratio of LMWC&N is displayed.
The flow of nitrogen between the different pools is simulated in a way that is similar to the carbon pools:
To calculate the flows of nitrogen, the same scalars, ratios of protected STRC, LABC&N, and MAOCC&N in aggregates, and turnover rates are used. Additionally, the microbes can immobilize nitrogen (IM) from LMWN, if their ratio gets too wide, or spillover nitrogen to the DON pool (OS), if their ratio gets too narrow:
The full dataset used for this study, as well as the R code of SAMM version 1.0, is provided on Github via Zenodo (https://doi.org/10.5281/zenodo.8086828; Laub, 2023b). It may be adapted for further use or integrated into full ecosystem models that allow for interchanging of the SOM part of the model.
PV and GC designed the long-term experiment and acquired funding throughout. PV maintained the experiment and supervised data generation. BK was involved in data generation for many years. SaS with help from ML generated the detailed 2019 data of aggregate dynamics. ML, GC, and SB jointly developed the conceptual model, JS and MVdB gave critical feedback on it. ML developed the model equations from the conceptual model, wrote the model code, and implemented the model–data fusion, MVdB helped ML in revising the model code. ML wrote the initial draft. All coauthors were involved in refining the initial draft to the submitted version.
The contact author has declared that none of the authors has any competing interests.
Publisher's note: Copernicus Publications remains neutral with regard to jurisdictional claims made in the text, published maps, institutional affiliations, or any other geographical representation in this paper. While Copernicus Publications makes every effort to include appropriate place names, the final responsibility lies with the authors.
The AI language model “Writefull for Overleaf” has been used to improve the grammar of the manuscript.
This research has been supported by the Royal Golden Jubilee (RGJ) PhD Programme (grant no. PHD/0157/2556).
This paper was edited by Christian Folberth and reviewed by Dan Zhu and one anonymous referee.
Abiven, S., Menasseri, S., Angers, D. A., and Leterme, P.: A Model to Predict Soil Aggregate Stability Dynamics following Organic Residue Incorporation under Field Conditions, Soil Sci. Soc. Am. J., 72, 119–125, https://doi.org/10.2136/sssaj2006.0018, 2008. a
Abramoff, R., Xu, X., Hartman, M., O’Brien, S., Feng, W., Davidson, E., Finzi, A., Moorhead, D., Schimel, J., Torn, M., and Mayes, M. A.: The Millennial model: in search of measurable pools and transformations for modeling soil carbon in the new century, Biogeochemistry, 137, 51–71, https://doi.org/10.1007/s10533-017-0409-7, 2018. a, b, c, d
Abramoff, R. Z., Guenet, B., Zhang, H., Georgiou, K., Xu, X., Viscarra Rossel, R. A., Yuan, W., and Ciais, P.: Improved global-scale predictions of soil carbon stocks with Millennial Version 2, Soil Biol. Biochem., 164, 108466, https://doi.org/10.1016/j.soilbio.2021.108466, 2022. a, b, c, d, e, f, g, h, i
Ahrens, B., Reichstein, M., Borken, W., Muhr, J., Trumbore, S. E., and Wutzler, T.: Bayesian calibration of a soil organic carbon model using Δ14C measurements of soil organic carbon and heterotrophic respiration as joint constraints, Biogeosciences, 11, 2147–2168, https://doi.org/10.5194/bg-11-2147-2014, 2014. a
Alberts, B., Johnson, A., Lewis, J., Raff, M., Roberts, K., and Walter, P.: Molecular Biology of the Cell, Garland Science, 4th edn., ISBN 978-0-8153-3218-3 978-0-8153-4072-0, 2002. a, b
Anderson, J. M. and Ingram, J. S. I.: Tropical Soil Biology and Fertility: A Handbook of Methods., CAB international, Wallingford, 2nd edn., ISBN 0-85198-821-0, https://doi.org/10.2307/2261129, 1993. a, b
Angst, G., Mueller, K. E., Nierop, K. G. J., and Simpson, M. J.: Plant- or microbial-derived? A review on the molecular composition of stabilized soil organic matter, Soil Biol. Biochem., 156, 108189, https://doi.org/10.1016/j.soilbio.2021.108189, 2021. a, b, c
Bettermann, A., Zethof, J. H. T., Babin, D., Cammeraat, E. L. H., Solé-Benet, A., Lázaro, R., Luna, L., Nesme, J., Sørensen, S. J., Kalbitz, K., Smalla, K., and Vogel, C.: Importance of microbial communities at the root-soil interface for extracellular polymeric substances and soil aggregation in semiarid grasslands, Soil Biol. Biochem., 159, 108301, https://doi.org/10.1016/j.soilbio.2021.108301, 2021. a
Blagodatsky, S. A. and Richter, O.: Microbial growth in soil and nitrogen turnover: a theoretical model considering the activity state of microorganisms, Soil Biol. Biochem., 30, 1743–1755, https://doi.org/10.1016/S0038-0717(98)00028-5, 1998. a
Bossuyt, H., Denef, K., Six, J., Frey, S. D., Merckx, R., and Paustian, K.: Influence of microbial populations and residue quality on aggregate stability, Appl. Soil Ecol., 16, 195–208, https://doi.org/10.1016/S0929-1393(00)00116-5, 2001. a
Bucka, F. B., Kölbl, A., Uteau, D., Peth, S., and Kögel-Knabner, I.: Organic matter input determines structure development and aggregate formation in artificial soils, Geoderma, 354, 113881–113881, https://doi.org/10.1016/j.geoderma.2019.113881, 2019. a
Bucka, F. B., Felde, V. J. M. N. L., Peth, S., and Kögel-Knabner, I.: Disentangling the effects of OM quality and soil texture on microbially mediated structure formation in artificial model soils, Geoderma, 403, 115213, https://doi.org/10.1016/j.geoderma.2021.115213, 2021. a, b
Campbell, E. E., Parton, W. J., Soong, J. L., Paustian, K., Hobbs, N. T., and Cotrufo, M. F.: Using litter chemistry controls on microbial processes to partition litter carbon fluxes with the Litter Decomposition and Leaching (LIDEL) model, Soil Biol. Biochem., 100, 160–174, https://doi.org/10.1016/j.soilbio.2016.06.007, 2016. a, b, c
Castellano, M. J., Mueller, K. E., Olk, D. C., Sawyer, J. E., and Six, J.: Integrating plant litter quality, soil organic matter stabilization, and the carbon saturation concept, Global Change Biol., 21, 3200–3209, https://doi.org/10.1111/gcb.12982, 2015. a
Christensen, B. T.: Physical fractionation of soil and structural and functional complexity in organic matter turnover, Eur. J. Soil Sci., 52, 345–353, https://doi.org/10.1046/j.1365-2389.2001.00417.x, 2001. a
Cotrufo, M. F., Wallenstein, M. D., Boot, C. M., Denef, K., and Paul, E.: The Microbial Efficiency-Matrix Stabilization (MEMS) framework integrates plant litter decomposition with soil organic matter stabilization: do labile plant inputs form stable soil organic matter?, Global Change Biol., 19, 988–995, https://doi.org/10.1111/gcb.12113, 2013. a, b, c
Crouzet, O., Consentino, L., Pétraud, J.-P., Marrauld, C., Aguer, J.-P., Bureau, S., Le Bourvellec, C., Touloumet, L., and Bérard, A.: Soil Photosynthetic Microbial Communities Mediate Aggregate Stability: Influence of Cropping Systems and Herbicide Use in an Agricultural Soil, Front. Microbiol., 10, 1319, https://doi.org/10.3389/fmicb.2019.01319, 2019. a
de Aguiar, T. C., de Oliveira Torchia, D. F., van Tol de Castro, T. A., Tavares, O. C. H., de Abreu Lopes, S., de Souza da Silva, L., Castro, R. N., Berbara, R. L. L., Pereira, M. G., and García, A. C.: Spectroscopic–chemometric modeling of 80 humic acids confirms the structural pattern identity of humified organic matter despite different formation environments, Sci. Total Environ., 833, 155133, https://doi.org/10.1016/j.scitotenv.2022.155133, 2022. a
Denef, K., Six, J., Bossuyt, H., Frey, S. D., Elliott, E. T., Merckx, R., and Paustian, K.: Influence of dry–wet cycles on the interrelationship between aggregate, particulate organic matter, and microbial community dynamics, Soil Biol. Biochem., 33, 1599–1611, https://doi.org/10.1016/S0038-0717(01)00076-1, 2001. a
Dijkstra, P., Martinez, A., Thomas, S. C., Seymour, C. O., Wu, W., Dippold, M. A., Megonigal, J. P., Schwartz, E., and Hungate, B. A.: On maintenance and metabolisms in soil microbial communities, Plant Soil, 476, 385–396, https://doi.org/10.1007/s11104-022-05382-9, 2022. a
Gargulak, J. D., Lebo, S. E., and McNally, T. J.: Lignin, in: Kirk-Othmer Encyclopedia of Chemical Technology, 1–26, John Wiley & Sons, Ltd, ISBN 978-0-471-23896-6, https://doi.org/10.1002/0471238961.12090714120914.a01.pub3, 2015. a
Gauch, H. G., Hwang, J. T. G., and Fick, G. W.: Model Evaluation by Comparison of Model-Based Predictions and Measured Values, Agronomy J., 95, 1442–1442, https://doi.org/10.2134/agronj2003.1442, 2003. a, b
Georgiou, K., Jackson, R. B., Vindušková, O., Abramoff, R. Z., Ahlström, A., Feng, W., Harden, J. W., Pellegrini, A. F. A., Polley, H. W., Soong, J. L., Riley, W. J., and Torn, M. S.: Global stocks and capacity of mineral-associated soil organic carbon, Nat. Commun., 13, 3797, https://doi.org/10.1038/s41467-022-31540-9, 2022. a
Gurung, R. B., Ogle, S. M., Breidt, F. J., Williams, S. A., and Parton, W. J.: Bayesian calibration of the DayCent ecosystem model to simulate soil organic carbon dynamics and reduce model uncertainty, Geoderma, 376, 114529, https://doi.org/10.1016/j.geoderma.2020.114529, 2020. a
Kallenbach, C. M., Frey, S. D., and Grandy, A. S.: Direct evidence for microbial-derived soil organic matter formation and its ecophysiological controls, Nat. Commun., 7, 1–10, https://doi.org/10.1038/ncomms13630, 2016. a, b
Kamolmanit, B., Vityakon, P., Kaewpradit, W., Cadisch, G., and Rasche, F.: Soil fungal communities and enzyme activities in a sandy, highly weathered tropical soil treated with biochemically contrasting organic inputs, Biol. Fert. Soils, 49, 905–917, https://doi.org/10.1007/s00374-013-0785-7, 2013. a
Kandeler, E., Tscherko, D., and Spiegel, H.: Long-term monitoring of microbial biomass, N mineralisation and enzyme activities of a Chernozem under different tillage management, Biol. Fert. Soils, 28, 343–351, https://doi.org/10.1007/s003740050502, 1999. a
Kögel-Knabner, I., Guggenberger, G., Kleber, M., Kandeler, E., Kalbitz, K., Scheu, S., Eusterhues, K., and Leinweber, P.: Organo-mineral associations in temperate soils: Integrating biology, mineralogy, and organic matter chemistry, J. Plant Nutr. Soil Sci., 171, 61–82, https://doi.org/10.1002/jpln.200700048, 2008. a
Kopittke, P. M., Hernandez-Soriano, M. C., Dalal, R. C., Finn, D., Menzies, N. W., Hoeschen, C., and Mueller, C. W.: Nitrogen-rich microbial products provide new organo-mineral associations for the stabilization of soil organic matter, Global Change Biol., 24, 1762–1770, https://doi.org/10.1111/gcb.14009, 2018. a
Kopittke, P. M., Dalal, R. C., Hoeschen, C., Li, C., Menzies, N. W., and Mueller, C. W.: Soil organic matter is stabilized by organo-mineral associations through two key processes: The role of the carbon to nitrogen ratio, Geoderma, 357, 113974–113974, https://doi.org/10.1016/j.geoderma.2019.113974, 2020. a
Kpemoua, T. P. I., Barré, P., Chevallier, T., Houot, S., and Chenu, C.: Drivers of the amount of organic carbon protected inside soil aggregates estimated by crushing: A meta-analysis, Geoderma, 427, 116089, https://doi.org/10.1016/j.geoderma.2022.116089, 2022. a
Krause, L., Biesgen, D., Treder, A., Schweizer, S. A., Klumpp, E., Knief, C., and Siebers, N.: Initial microaggregate formation: Association of microorganisms to montmorillonite-goethite aggregates under wetting and drying cycles, Geoderma, 351, 250–260, https://doi.org/10.1016/j.geoderma.2019.05.001, 2019. a
Laub, M.: Author Comment 1, https://doi.org/10.5194/egusphere-2023-1414-AC1, 2023a. a
Laub, M.: mol4ub/SAMM_model: SAMM model v1.0 including data used in the calibration and evaluation process. (v1.0), Zenodo [code], https://doi.org/10.5281/zenodo.8086828, 2023b. a
Laub, M., Demyan, M. S., Nkwain, Y. F., Blagodatsky, S., Kätterer, T., Piepho, H.-P., and Cadisch, G.: DRIFTS band areas as measured pool size proxy to reduce parameter uncertainty in soil organic matter models, Biogeosciences, 17, 1393–1413, https://doi.org/10.5194/bg-17-1393-2020, 2020. a
Laub, M., Schlichenmeier, S., Vityakon, P., and Cadisch, G.: Litter Quality and Microbes Explain Aggregation Differences in a Tropical Sandy Soil, J. Soil Sci. Plant Nutr., 22, 848–860, https://doi.org/10.1007/s42729-021-00696-6, 2022. a, b, c, d, e, f, g, h
Lavallee, J. M., Conant, R. T., Paul, E. A., and Cotrufo, M. F.: Incorporation of shoot versus root-derived 13C and 15N into mineral-associated organic matter fractions: results of a soil slurry incubation with dual-labelled plant material, Biogeochemistry, 137, 379–393, https://doi.org/10.1007/s10533-018-0428-z, 2018. a
Lavallee, J. M., Soong, J. L., and Cotrufo, M. F.: Conceptualizing soil organic matter into particulate and mineral-associated forms to address global change in the 21st century, Global Change Biol., 26, 261–273, https://doi.org/10.1111/gcb.14859, 2020. a, b
Loague, K. and Green, R. E.: Statistical and graphical methods for evaluating solute transport models: Overview and application, J. Contam. Hydrol., 7, 51–73, https://doi.org/10.1016/0169-7722(91)90038-3, 1991. a
Luo, Z., Baldock, J., and Wang, E.: Modelling the dynamic physical protection of soil organic carbon: Insights into carbon predictions and explanation of the priming effect, Global Change Biol., 23, 5273–5283, https://doi.org/10.1111/gcb.13793, 2017. a, b
Manzoni, S., Taylor, P., Richter, A., Porporato, A., and Ågren, G. I.: Environmental and stoichiometric controls on microbial carbon-use efficiency in soils, New Phytologist, 196, 79–91, https://doi.org/10.1111/j.1469-8137.2012.04225.x, 2012. a, b
Marschmann, G. L., Pagel, H., Kügler, P., and Streck, T.: Equifinality, sloppiness, and emergent structures of mechanistic soil biogeochemical models, Environ. Model. Softw., 122, 104518, https://doi.org/10.1016/j.envsoft.2019.104518, 2019. a
Mueller, T., Jensen, L. S. S., Magid, J., and Nielsen, N. E. E.: Temporal variation of C and N turnover in soil after oilseed rape straw incorporation in the field: simulations with the soil-plant-atmosphere model DAISY, Ecol. Model., 99, 247–262, https://doi.org/10.1016/S0304-3800(97)01959-5, 1997. a
Necpálová, M., Anex, R. P., Fienen, M. N., Del Grosso, S. J., Castellano, M. J., Sawyer, J. E., Iqbal, J., Pantoja, J. L., and Barker, D. W.: Understanding the DayCent model: Calibration, sensitivity, and identifiability through inverse modeling, Environ. Model. Softw., 66, 110–130, https://doi.org/10.1016/j.envsoft.2014.12.011, 2015. a, b
Oldfield, E. E., Crowther, T. W., and Bradford, M. A.: Substrate identity and amount overwhelm temperature effects on soil carbon formation, Soil Biol. Biochem., 124, 218–226, https://doi.org/10.1016/j.soilbio.2018.06.014, 2018. a
Puttaso, A., Vityakon, P., Saenjan, P., Trelo-ges, V., and Cadisch, G.: Relationship between residue quality, decomposition patterns, and soil organic matter accumulation in a tropical sandy soil after 13 years, Nutr. Cycl. Agroecosyst., 89, 159–174, https://doi.org/10.1007/s10705-010-9385-1, 2011. a, b, c, d, e, f
Puttaso, A., Vityakon, P., Rasche, F., Saenjan, P., Treloges, V., and Cadisch, G.: Does Organic Residue Quality Influence Carbon Retention in a Tropical Sandy Soil?, Soil Sci. Soc. Am. J., 77, 1001–1001, https://doi.org/10.2136/sssaj2012.0209, 2013. a, b, c
R Core Team: R: A Language and Environment for Statistical Computing, https://www.r-project.org/ (last access: 31 January 2024), 2020. a, b
Schrumpf, M., Kaiser, K., Guggenberger, G., Persson, T., Kögel-Knabner, I., and Schulze, E.-D.: Storage and stability of organic carbon in soils as related to depth, occlusion within aggregates, and attachment to minerals, Biogeosciences, 10, 1675–1691, https://doi.org/10.5194/bg-10-1675-2013, 2013. a
Scrucca, L.: GA: A Package for Genetic Algorithms in R, J. Stat. Softw., 53, 1–37, https://doi.org/10.18637/jss.v053.i04, 2013. a
Segoli, M., De Gryze, S., Dou, F., Lee, J., Post, W., Denef, K., and Six, J.: AggModel: A soil organic matter model with measurable pools for use in incubation studies, Ecol. Model., 263, 1–9, https://doi.org/10.1016/j.ecolmodel.2013.04.010, 2013. a, b, c, d, e
Šimůnek, J., van Genuchten, M. T., and Šejna, M.: The HYDRUS-1D Software Package for Simulating the Movement of Water, Heat, and Multiple Solutes in Variably Saturated Media, Version 3.0, HYDRUS Software Series 1, Department of Environmental Sciences, University of California Riverside, Riverside, California, USA, https://www.ars.usda.gov/ARSUserFiles/20360500/software/97/HYDRUS1D_3.pdf (last access: 31 January 2024), 2005. a, b
Sinsabaugh, R. L., Manzoni, S., Moorhead, D. L., and Richter, A.: Carbon use efficiency of microbial communities: stoichiometry, methodology and modelling, Ecol. Lett., 16, 930–939, https://doi.org/10.1111/ele.12113, 2013. a, b, c, d, e
Sinsabaugh, R. L., Turner, B. L., Talbot, J. M., Waring, B. G., Powers, J. S., Kuske, C. R., Moorhead, D. L., and Follstad Shah, J. J.: Stoichiometry of microbial carbon use efficiency in soils, Ecol. Monogr., 86, 172–189, https://doi.org/10.1890/15-2110.1, 2016. a
Six, J. and Paustian, K.: Aggregate-associated soil organic matter as an ecosystem property and a measurement tool, Soil Biol. Biochem., 68, A4–A9, https://doi.org/10.1016/j.soilbio.2013.06.014, 2014. a
Six, J., Elliott, E., and Paustian, K.: Soil macroaggregate turnover and microaggregate formation: a mechanism for C sequestration under no-tillage agriculture, Soil Biol. Biochem., 32, 2099–2103, https://doi.org/10.1016/S0038-0717(00)00179-6, 2000. a
Six, J., Feller, C., Denef, K., Ogle, S. M., Sa, J. C. d. M., and Albrecht, A.: Soil organic matter, biota and aggregation in temperate and tropical soils - Effects of no-tillage, Agronomie, 22, 755–775, https://doi.org/10.1051/agro:2002043, 2002. a, b
Six, J., Frey, S. D., Thiet, R. K., and Batten, K. M.: Bacterial and Fungal Contributions to Carbon Sequestration in Agroecosystems, Soil Sci. Soc. Am. J., 70, 555–569, https://doi.org/10.2136/sssaj2004.0347, 2006. a
Soetaert, K., Petzoldt, T., and Setzer, R. W.: Solving Differential Equations in R: Package deSolve, J. Stat. Softw., 33, 1–25, https://doi.org/10.18637/jss.v033.i09, 2010. a
Tang, J. and Riley, W. J.: Weaker soil carbon–climate feedbacks resulting from microbial and abiotic interactions, Nat. Clim. Change, 5, 56–60, https://doi.org/10.1038/nclimate2438, 2015. a
Tang, J. and Riley, W. J.: Competitor and substrate sizes and diffusion together define enzymatic depolymerization and microbial substrate uptake rates, Soil Biol. Biochem., 139, 107624, https://doi.org/10.1016/j.soilbio.2019.107624, 2019. a
Totsche, K. U., Amelung, W., Gerzabek, M. H., Guggenberger, G., Klumpp, E., Knief, C., Lehndorff, E., Mikutta, R., Peth, S., Prechtel, A., Ray, N., and Kögel-Knabner, I.: Microaggregates in soils, J. Plant Nutr. Soil Sci., 181, 104–136, https://doi.org/10.1002/jpln.201600451, 2018. a
Vance, E., Brookes, P., and Jenkinson, D.: An extraction method for measuring soil microbial biomass C, Soil Biol. Biochem., 19, 703–707, https://doi.org/10.1016/0038-0717(87)90052-6, 1987. a
Van Soest, P. J. and Wine, R. H.: Determination of Lignin and Cellulose in Acid-Detergent Fiber with Permanganate, J. AOAC Int., 51, 780–785, https://doi.org/10.1093/jaoac/51.4.780, 1968. a, b
Vityakon, P.: Degradation and restoration of sandy soils under different agricultural land uses in northeast Thailand: A review, Land Degrad. Develop., 18, 567–577, https://doi.org/10.1002/ldr.798, 2007. a, b
Vityakon, P., Meepech, S., Cadisch, G., and Toomsan, B.: Soil organic matter and nitrogen transformation mediated by plant residues of different qualities in sandy acid upland and paddy soils, NJAS – Wageningen Journal of Life Sciences, 48, 75–90, https://doi.org/10.1016/S1573-5214(00)80006-8, 2000. a, b, c, d, e
Walkley, A. and Black, I. A.: An examination of the degtjareff method for determining soil organic matter, and a proposed modification of the chromic acid titration method, Soil Sci., 37, 29–38, https://doi.org/10.1097/00010694-193401000-00003, 1934. a
Wallach, D., Makowski, D., Jones, J. W., and Brun, F.: Chapter 8 - Parameter Estimation With Bayesian Methods, in: Working with Dynamic Crop Models (Third Edition), edited by: Wallach, D., Makowski, D., Jones, J. W., and Brun, F., 275–309, Academic Press, ISBN 978-0-12-811756-9, https://doi.org/10.1016/B978-0-12-811756-9.00008-3, 2019. a
Wang, G., Post, W. M., and Mayes, M. A.: Development of microbial-enzyme-mediated decomposition model parameters through steady-state and dynamic analyses, Ecol. Appl., 23, 255–272, https://doi.org/10.1890/12-0681.1, 2013. a, b, c, d
Wang, G., Jagadamma, S., Mayes, M. A., Schadt, C. W., Megan Steinweg, J., Gu, L., and Post, W. M.: Microbial dormancy improves development and experimental validation of ecosystem model, The ISME J., 9, 226–237, https://doi.org/10.1038/ismej.2014.120, 2015. a, b
Wang, S., Redmile-Gordon, M., Shahbaz, M., Ge, T., Zhang, M., Wu, Y., Liu, J., Huang, Q., and Cai, P.: Microbial formation and stabilisation of soil organic carbon is regulated by carbon substrate identity and mineral composition, Geoderma, 414, 115762, https://doi.org/10.1016/j.geoderma.2022.115762, 2022. a, b, c
Wieder, W. R., Grandy, A. S., Kallenbach, C. M., and Bonan, G. B.: Integrating microbial physiology and physio-chemical principles in soils with the MIcrobial-MIneral Carbon Stabilization (MIMICS) model, Biogeosciences, 11, 3899–3917, https://doi.org/10.5194/bg-11-3899-2014, 2014. a
Yudina, A. and Kuzyakov, Y.: Saving the face of soil aggregates, Global Change Biology, 25, 3574–3577, https://doi.org/10.1111/gcb.14779, 2019. a
Zech, S., Schweizer, S. A., Bucka, F. B., Ray, N., Kögel-Knabner, I., and Prechtel, A.: Explicit spatial modeling at the pore scale unravels the interplay of soil organic carbon storage and structure dynamics, Global Change Biol., 28, 4589–4604, https://doi.org/10.1111/gcb.16230, 2022. a
Zhang, Y., Lavallee, J. M., Robertson, A. D., Even, R., Ogle, S. M., Paustian, K., and Cotrufo, M. F.: Simulating measurable ecosystem carbon and nitrogen dynamics with the mechanistically defined MEMS 2.0 model, Biogeosciences, 18, 3147–3171, https://doi.org/10.5194/bg-18-3147-2021, 2021. a
The requested paper has a corresponding corrigendum published. Please read the corrigendum first before downloading the article.
- Article
(9179 KB) - Full-text XML