the Creative Commons Attribution 4.0 License.
the Creative Commons Attribution 4.0 License.
 | 26 Jan 2024
Modeling below-cloud scavenging of size-resolved particles in GEM-MACHv3.1
Roya Ghahreman
Wanmin Gong
Paul A. Makar
Alexandru Lupu
Amanda Cole
Kulbir Banwait
Colin Lee
Ayodeji Akingunola
Below-cloud scavenging (BCS) is the process of aerosol removal from the atmosphere between cloud base and the ground by precipitation (e.g., rain or snow), and affects aerosol number or mass concentrations, size distribution, and lifetime. An accurate representation of precipitation phases is important in treating BCS as the efficiency of aerosol scavenging differs significantly between liquid and solid precipitation. The impact of different representations of BCS on existing model biases was examined through implementing a new aerosol BCS scheme in the Environment and Climate Change Canada (ECCC) air quality prediction model GEM-MACH and comparing it with the existing scavenging scheme in the model. Further, the current GEM-MACH employs a single-phase precipitation for BCS: total precipitation is treated as either liquid or solid depending on a fixed environment temperature threshold. Here, we consider co-existing liquid and solid precipitation phases as they are predicted by the GEM microphysics. GEM-MACH simulations, in a local-area domain over the Athabasca oil sands areas, Canada, are compared with observed precipitation samples, with a focus on the particulate base cation NH; acidic anions NO, SO, HSO in precipitation; and observed ambient particulate sulfate, ammonium, and nitrate concentrations.
Overall, the introduction of the multi-phase approach and the new scavenging scheme enhances GEM-MACH performance compared to previous methods. Including a multi-phase approach leads to altered SO scavenging and impacts the BCS of SO2 into the aqueous phase over the domain. Sulfate biases improved from +46 % to −5 % relative to Alberta Precipitation Quality Monitoring Program wet sulfate observations. At Canadian Air and Precipitation Monitoring Network stations the biases became more negative, from −10 % to −30 % for the tests carried out here. These improvements contrast with prior annual average biases of +200 % for SO, indicating enhanced model performance. Improvements in model performance (via scores for correlation coefficient, normalized mean bias, and/or fractional number of model values within a factor of 2 of observations) could also be seen between the base case and the two simulations based on multi-phase partitioning for NO, NH, and SO. Whether or not these improvements corresponded to increases or decreases in NO and NH wet deposition varied over the simulation region. The changes were episodic in nature – the most significant changes in wet deposition were likely at specific geographic locations and represent specific cloud precipitation events. The changes in wet scavenging resulted in a higher formation rate and larger concentrations of atmospheric particle sulfate.
- Article
(43114 KB) - Full-text XML
-
Supplement
(960 KB) - BibTeX
- EndNote


Atmospheric aerosols impact air quality and influence climate directly by absorbing and scattering sunlight and indirectly by modifying cloud properties (e.g., Haywood and Boucher, 2000). Aerosol number and mass concentration, lifetime, and distribution are regulated by the removal processes such as wet scavenging (Pruppacher and Klett, 1997).
Wet scavenging, including in-cloud and below-cloud scavenging (BCS), is defined as the removal of both aerosol particles and gases from the atmosphere by different hydrometeors such as rain or snow. Scavenging of pollutants by cloud droplets and by removal due to precipitation formation (also known as “rainout”) occurs as a result of the solubility of gases and via aerosol activation. BCS is also known as the “washout” process, in which atmospheric material is exposed to falling hydrometeors and hence may be subject to collection and removal (e.g., Rogers and Yau, 1989). Ryu and Min (2022) study reevaluated aerosol deposition in WRF-Chem using observation results. Below-cloud scavenging was found to play a more significant role (50 %–60 %) in wet deposition than traditionally understood, while in-cloud scavenging was revised up to 34 %–37 %. Their updated model improved wet deposition accuracy for various aerosols, particularly SO4 and NH4, enhancing surface PM2.5 and PM10 concentration predictions. Wet scavenging is the dominant removal pathway of aerosol particles at the global scale (Stier et al., 2005); however, it is worth noting that recent observational studies, such as Emerson et al. (2020), highlighted the significance of aerosol dry deposition. In general, the study of the wet deposition process requires an understanding of cloud processes, including the chemical reactions occurring within hydrometeor. Details of these processes underlie some of the major sources of uncertainty in wet deposition modeling (Tost et al., 2006; Kajino and Aikawa, 2015). To study the BCS, it is necessary to consider some of the physical processes, such as condensation, Brownian motion, thermophoresis, diffusiophoresis, turbulent inertial interception, rear-capture, and gravitational or electric forces (Lemaitre, et al., 2017; Pruppacher and Klett, 1978; Gong et al., 2003, 2011). Brownian motion is more important for scavenging particles smaller than 0.1 µm, while the gravitational forces are more efficient to remove particles larger than 1 µm. Collision efficiency of hydrometeors with particles has a minimum for particles in the size range of 0.1–2 µm. This region of low collection efficiency due to Brownian motion and gravitational settling, with its minima in this size range, is referred to as the Greenfield gap (Greenfield, 1957; Slinn and Hales, 1971; Andronache et al., 2006; Ladino et al., 2011). The size distributions of aerosol particles and the diffusivity or solubility of gases also need to be specified in order to accurately represent the collection kernel for hydrometeor–aerosol collision efficiency (cf. Cherrier et al., 2017). In this study, we focus on BCS of aerosols.
The BCS of particles is more efficient in the cold months due to snow scavenging, while gas scavenging is more efficient during the warm months (Cheng et al., 2017). Snow scavenging is an important removal mechanism at midlatitudes, in polar regions and in mountainous areas. Snow and ice crystals are more efficient scavengers than water drops, due to their larger surface-to-volume ratio (Wang et al., 2014). The study of snow scavenging is more complicated than rain scavenging, due to the wide variety of snow particle shapes, sizes and densities, which results in different fall speeds, cross-sectional areas and flow patterns around snow particles (Pruppacher and Klett, 1997; Jylhä, 1999; Wang et al., 2014), whereas it has been a common practice to assume spherical shapes for rain droplets. However, it is important to note that this assumption can introduce inaccuracies. This is particularly evident for larger raindrops, which often deviate from perfect spherical shapes and exhibit more oblate forms. The modeling study of Croft et al. (2009) estimated around 30 % of BCS of sulfate particles are due to snow scavenging globally.
Some studies indicate a tendency of the precipitation phase to be moving towards the liquid (rain) due to the global warming (Trenberth, 2011). It is important to differentiate precipitation phases in model simulations, as scavenging efficiency differs between rain and snow (examples of aerosol scavenging coefficients for rain and snow are shown in Fig. 3). The temperature cross-over characterizing the transition point between equal contributions of rain and snow towards particle collection also varies significantly, between −0.4 and 2.4 ∘C (a 29-year Northern Hemisphere observational dataset demonstrating this range may be found in Jennings et al., 2018). Despite this temperature variation, and the importance of precipitation phase on wet scavenging and wet fluxes, some scavenging models use partition precipitation phase based on a simple, uniform air temperature threshold (Harpold et al., 2017; Feiccabrino et al., 2015; Jennings et al., 2018).
The rate of change (loss) of aerosol mass concentrations due to BCS by precipitation (rain and snow) is referred as the scavenging coefficient Λ (s−1) (Seinfeld and Pandis, 2006):
In Eq. (1), C(t) is the mass concentration of aerosol at time t, and the scavenging coefficient Λ is the loss frequency (s−1) of mass concentration per unit time; their product in Eq. (1) is the rate of mass concentration loss per unit time associated with scavenging. In Eq. (2), dp, Dp and N(Dp) refer to aerosol diameter, droplet diameter and droplet number density at given droplet size, respectively. In this equation, Λ(dp) is expressed as a function of the particle collection efficiency, E(dp,Dd) and the hydrometeor's fall speed Ut(Dd).
Equation (1) is also dependent on the size of the aerosol (via dp), hence requiring the aerosol size distribution to be incorporated into the equations.
Here, a semi-empirical, size-resolved Λ parameterization from Wang et al. (2014) was implemented in the Environment and Climate Change Canada (ECCC) air quality prediction model GEM-MACH v3.1 (Global Environmental Multi-scale model–Modeling Air quality and Chemistry). The Λ parameterization in the Wang et al. (2014) study was developed based on the uncertainty analyses and follows power law relationships with precipitation intensity R (Wang et al., 2014). Furthermore, it is applicable to BCS of the rain and snow and over a wide range of particle sizes and precipitation intensities. The default GEM-MACH scavenging scheme is based on Slinn (1984), and its collection efficiency is formulated as a linear combination of the collection efficiencies due to Brownian motion, interception and impaction. Therefore, the Slinn parameterization misses important processes in the Greenfield gap, such as thermophoresis and electrostatic forces, which are included implicitly in the Wang et al. (2014) model. The semi-empirical Wang et al. (2014) scheme was developed to provide an optimization of all available theoretical formulations of scavenging coefficients in comparison with available observations at the time.
In the present study, we determine the impact of precipitation phase partitioning on aerosol BCS, and compare the Wang et al. (2014) scavenging scheme with the previous GEM-MACH scavenging scheme (based on Slinn 1984). The implementation details of both schemes are described below.
In what follows, BCS in the GEM-MACH model and the simulation setup are described (Sect. 2.1–2.3), followed by a brief description of the measurement data used for model evaluation (Sect. 2.4). Section 3 presents the results including (1) GEM-MACH BCS tests to examine the impact of precipitation partitioning and of the Wang et al. (2014) scheme and (2) comparison of GEM-MACH simulations with observations. The latter work has a focus on the particulate base cation NH; acidic anions NO, SO, and HSO; and particulate sulfate, ammonium, and nitrate. The summary and conclusions of our work are reported in Sect. 4.
2.1 GEM-MACH model
The GEM-MACH base model consists of an online tropospheric chemistry module embedded within ECCC's GEM numerical weather forecast model (Côté et al., 1998a, b; Charron et al., 2012; Moran et al., 2013). A fully coupled version of GEM-MACH is used for this study; “fully coupled” here refers to the aerosol chemistry and meteorology coupling; i.e., this version allows for the model to include the influence of online aerosols on modeled meteorology through radiation and cloud microphysics (Makar et al., 2015a, b, 2021; Gong et al., 2015). The aerosols predicted by the chemistry module are used to calculate aerosol extinction in the GEM radiation code and droplet nucleation in the GEM microphysics code, with the resulting cloud liquid water content and cloud droplet number concentration (CDNC) in turn affecting aqueous-phase chemical processes within the model's chemistry modules.
The GEM-MACH chemistry module includes a comprehensive representation of air quality processes, such as gas-phase, aqueous-phase, and heterogeneous chemistry and aerosol processes (e.g., Moran et al., 2013; Makar et al., 2015a, b; Gong et al., 2015). The default gas-phase chemistry of GEM-MACH was based on the ADOM-II mechanism with 47 species and 114 reactions (Lurmann et al., 1986; Stockwell and Lurmann, 1989). In the current study, we use gas-phase chemistry parameterized by the SAPRC 11 mechanism with 175 species and 837 reactions (Carter and Heo, 2013); inorganic heterogeneous chemistry represented by a modified version of ISORROPIA algorithm of Nenes et al. (1999), as described in Makar et al. (2003); secondary organic aerosol (SOA) formation parameterized using a two-product, overall, or instantaneous aerosol yield formation (Odum et al., 1996; Jiang, 2003; Stroud et al., 2018); aerosol microphysical processes, including nucleation and condensation (sulfate and SOA), hygroscopic growth, coagulation, and dry deposition and sedimentation parameterized based on Gong et al. (2003); and the representation of cloud processing of gases and aerosols including uptake and activation, aqueous-phase chemistry, and wet removal (Gong et al., 2006, 2015). The default GEM-MACH model includes eight internally mixed aerosol components: sulfate, nitrate, ammonium, primary organic aerosol, secondary organic aerosol, elemental carbon, crustal material, and sea salt. For this study, crustal material is further speciated into six elements: calcium, magnesium, sodium, potassium, iron and manganese. A sectional approach is used for representing aerosol size distribution with a 12-bin (between 0.01 and 40.96 µm, logarithmically spaced) configuration.
2.2 Below-cloud scavenging
In the GEM-MACH model, the default wet BCS schemes of aerosol by rain and snow are based on Slinn (1984). Wet scavenging is a removal process for the atmospheric tracers and describes the uptake of gases and aerosols into cloud hydrometeors. Partial or complete hydrometeor evaporation subsequent to that uptake may result in the release of captured particles back to the atmosphere. In such cases, rather than a net removal (wherein the captured material reaches the ground within precipitation), the captured material may instead be transported to a different vertical level in the atmosphere from the point where the uptake occurred. The wet deposition flux of tracer i at a given level in a vertical column is calculated by Eq. (3) in GEM-MACH (Gong et al., 2006):
where fevp is the fraction (0 to 1) of precipitation loss by evaporation, ΔFi(z) is the input flux of aerosols to the hydrometeors at level z due to either precipitation production (e.g., cloud-to-rain) or precipitation scavenging and Fi(z+1) is the flux arriving at that level from above.
Slinn (1984) formulations are parameterizations of the scavenging coefficient theoretically described in Eq. (2). Based on laboratory experiments and dimensional analyses, Slinn (1984) presented separate BCS schemes for rain and snow as functions of precipitation rate (P) and mean collection efficiency (E) (Gong et al., 2003, 2011). For rain this is as follows:
where the empirical constant c is 0.5 and Rm is the mean drop size. The precipitation rate P is also used to obtain the mean drop radius Rm. For snow this is as follows:
where λ is the characteristic capture length, Dm is the characteristic length, and γ, the empirically derived collision efficiency, is 0.6. The values of λ and Dm vary depending on temperature and snow type. The temperature dependence of Slinn's collection efficiency E for snow (solid precipitation) includes the consideration of hydrometeor forms (or shapes), which determine the characteristic capture length, settling velocity, etc. The different forms of precipitation are found in certain temperature ranges, e.g., needle snow (−8 ∘C 0 ∘C), stellar snow (−25 ∘C ∘C), and graupel ( ∘C). The characteristic capture length, settling velocity, etc., are assigned with different values based on the types of solid hydrometeors (hence the temperature ranges). For both rain and snow, collection efficiency E is a linear combination of three processes: Brownian diffusion, interception and impaction (Slinn, 1984).
In the pre-existing, base-case, GEM-MACH setup, the liquid and solid precipitation fluxes predicted from the GEM meteorological module are combined and a single phase (either liquid or solid) is determined by a uniform environment temperature threshold, T=0 ∘C (e.g., rain occurs for temperatures >0 ∘C and snow for temperatures <0 ∘C). In this study, a multi-phase partitioning is tested by taking into account the liquid and solid hydrometeor phases predicted by the microphysics in the meteorological module of GEM-MACH. Using this multi-phase partitioning approach, consistent with the GEM microphysics employed here, the co-existence of both liquid and solid phases can be treated (more information on this new scheme appears in Sect. 2.3).
In addition to the above in-cloud scavenging parameterization comparisons, we compared the existing BCS methodology (Slinn, 1984) to a more recent semi-empirical methodology (Wang et al., 2014). In contrast to Eqs. (4) and (5), Wang et al. (2014) proposed separate formulae of Λ for rain and snow, as a function of aerosol diameter and rain rate:
where Ai and Bi are empirical parameters and are polynomial functions of aerosol diameter and the subscript i denotes a given particle size bin. R is the precipitation rate (Wang et al., 2014).
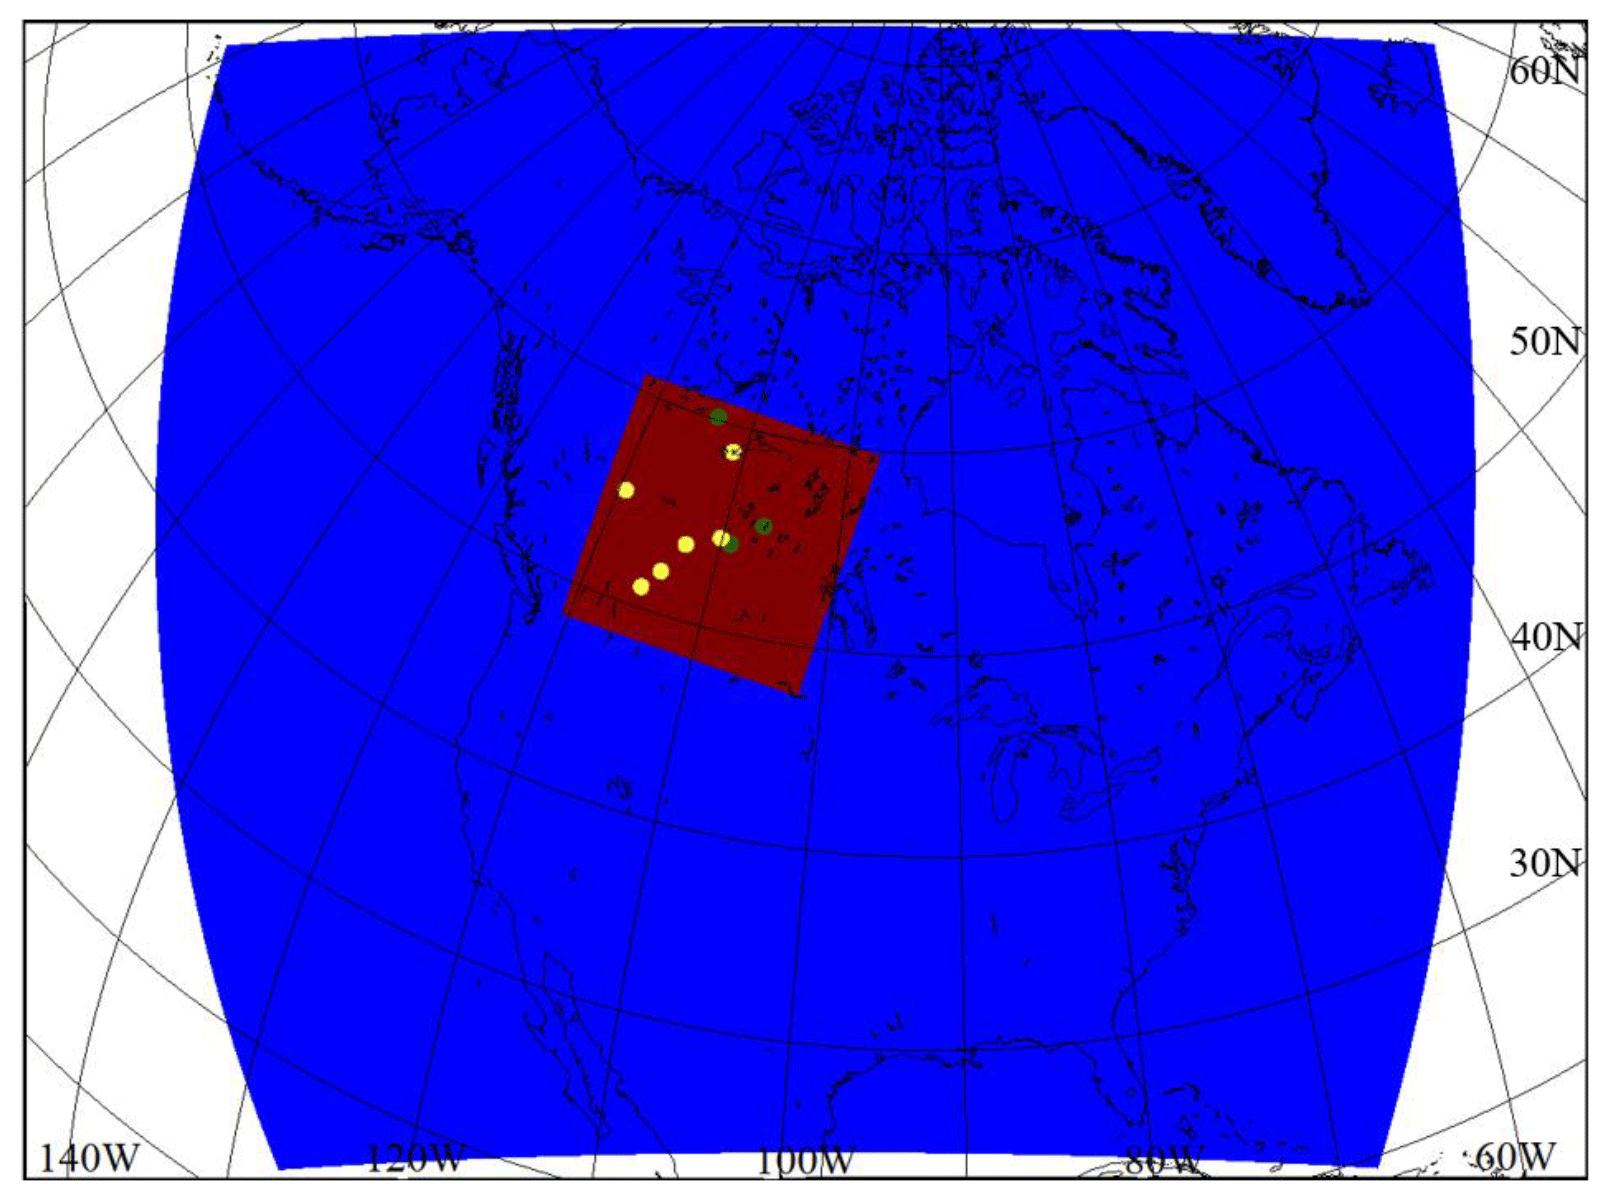
Figure 1Model domains, with 2.5 km ×2.5 km in red and 10 km ×10 km in blue. CAPMoN and APQMP observation stations are shown with green and yellow dots, respectively.
2.3 Model setup
This study focuses on the Oil Sands (OS) region, Alberta, Canada. Figure 1 shows the model domains and Canadian Air and Precipitation Monitoring Network (CAPMoN) and Alberta Precipitation Quality Monitoring Program (APQMP) observation stations used for model wet deposition evaluation. GEM-MACH simulations were carried out on a limited-area model (LAM) domain with 2.5 km ×2.5 km (red) resolution, nested from a 10 km ×10 km (blue) horizontal resolution, for the months of April and July 2018 (Fig. 1). The simulations incorporated a 1-week “spin-up” period prior to April and 1 July 2018 to allow the model cloud fields to reach a steady state prior to the month-long simulations used for model comparison and evaluation. The model driving meteorology was updated every 24 h, with each high-resolution run duration of 30 h incorporating a 6 h spin-up for the same reason. The model setup with regards to meteorological piloting; chemical lateral boundary condition; anthropogenic, biogenic, and wildfire emissions are similar to those presented in Makar et al. (2018, 2021), with the underlying version of GEM being updated to v5.0. The meteorology is piloted by the global GEM model and initialized daily (at 06:00 UTC) using the Canadian Meteorological Centre's regional objective analysis. A total of 80 vertical, unevenly spaced, hybrid coordinate levels were used to cover between the surface and 0.1 hPa, with the lowest terrain-following model layer located about 20 m above the surface. The feedbacks between chemistry and meteorology were enabled so that the aerosols predicted by the chemistry module were allowed to influence the model radiative transfer (through aerosol extinction) and cloud microphysics (through droplet nucleation), as described above (further details can be found in Makar et al., 2015a, b, 2021; Gong et al., 2015).
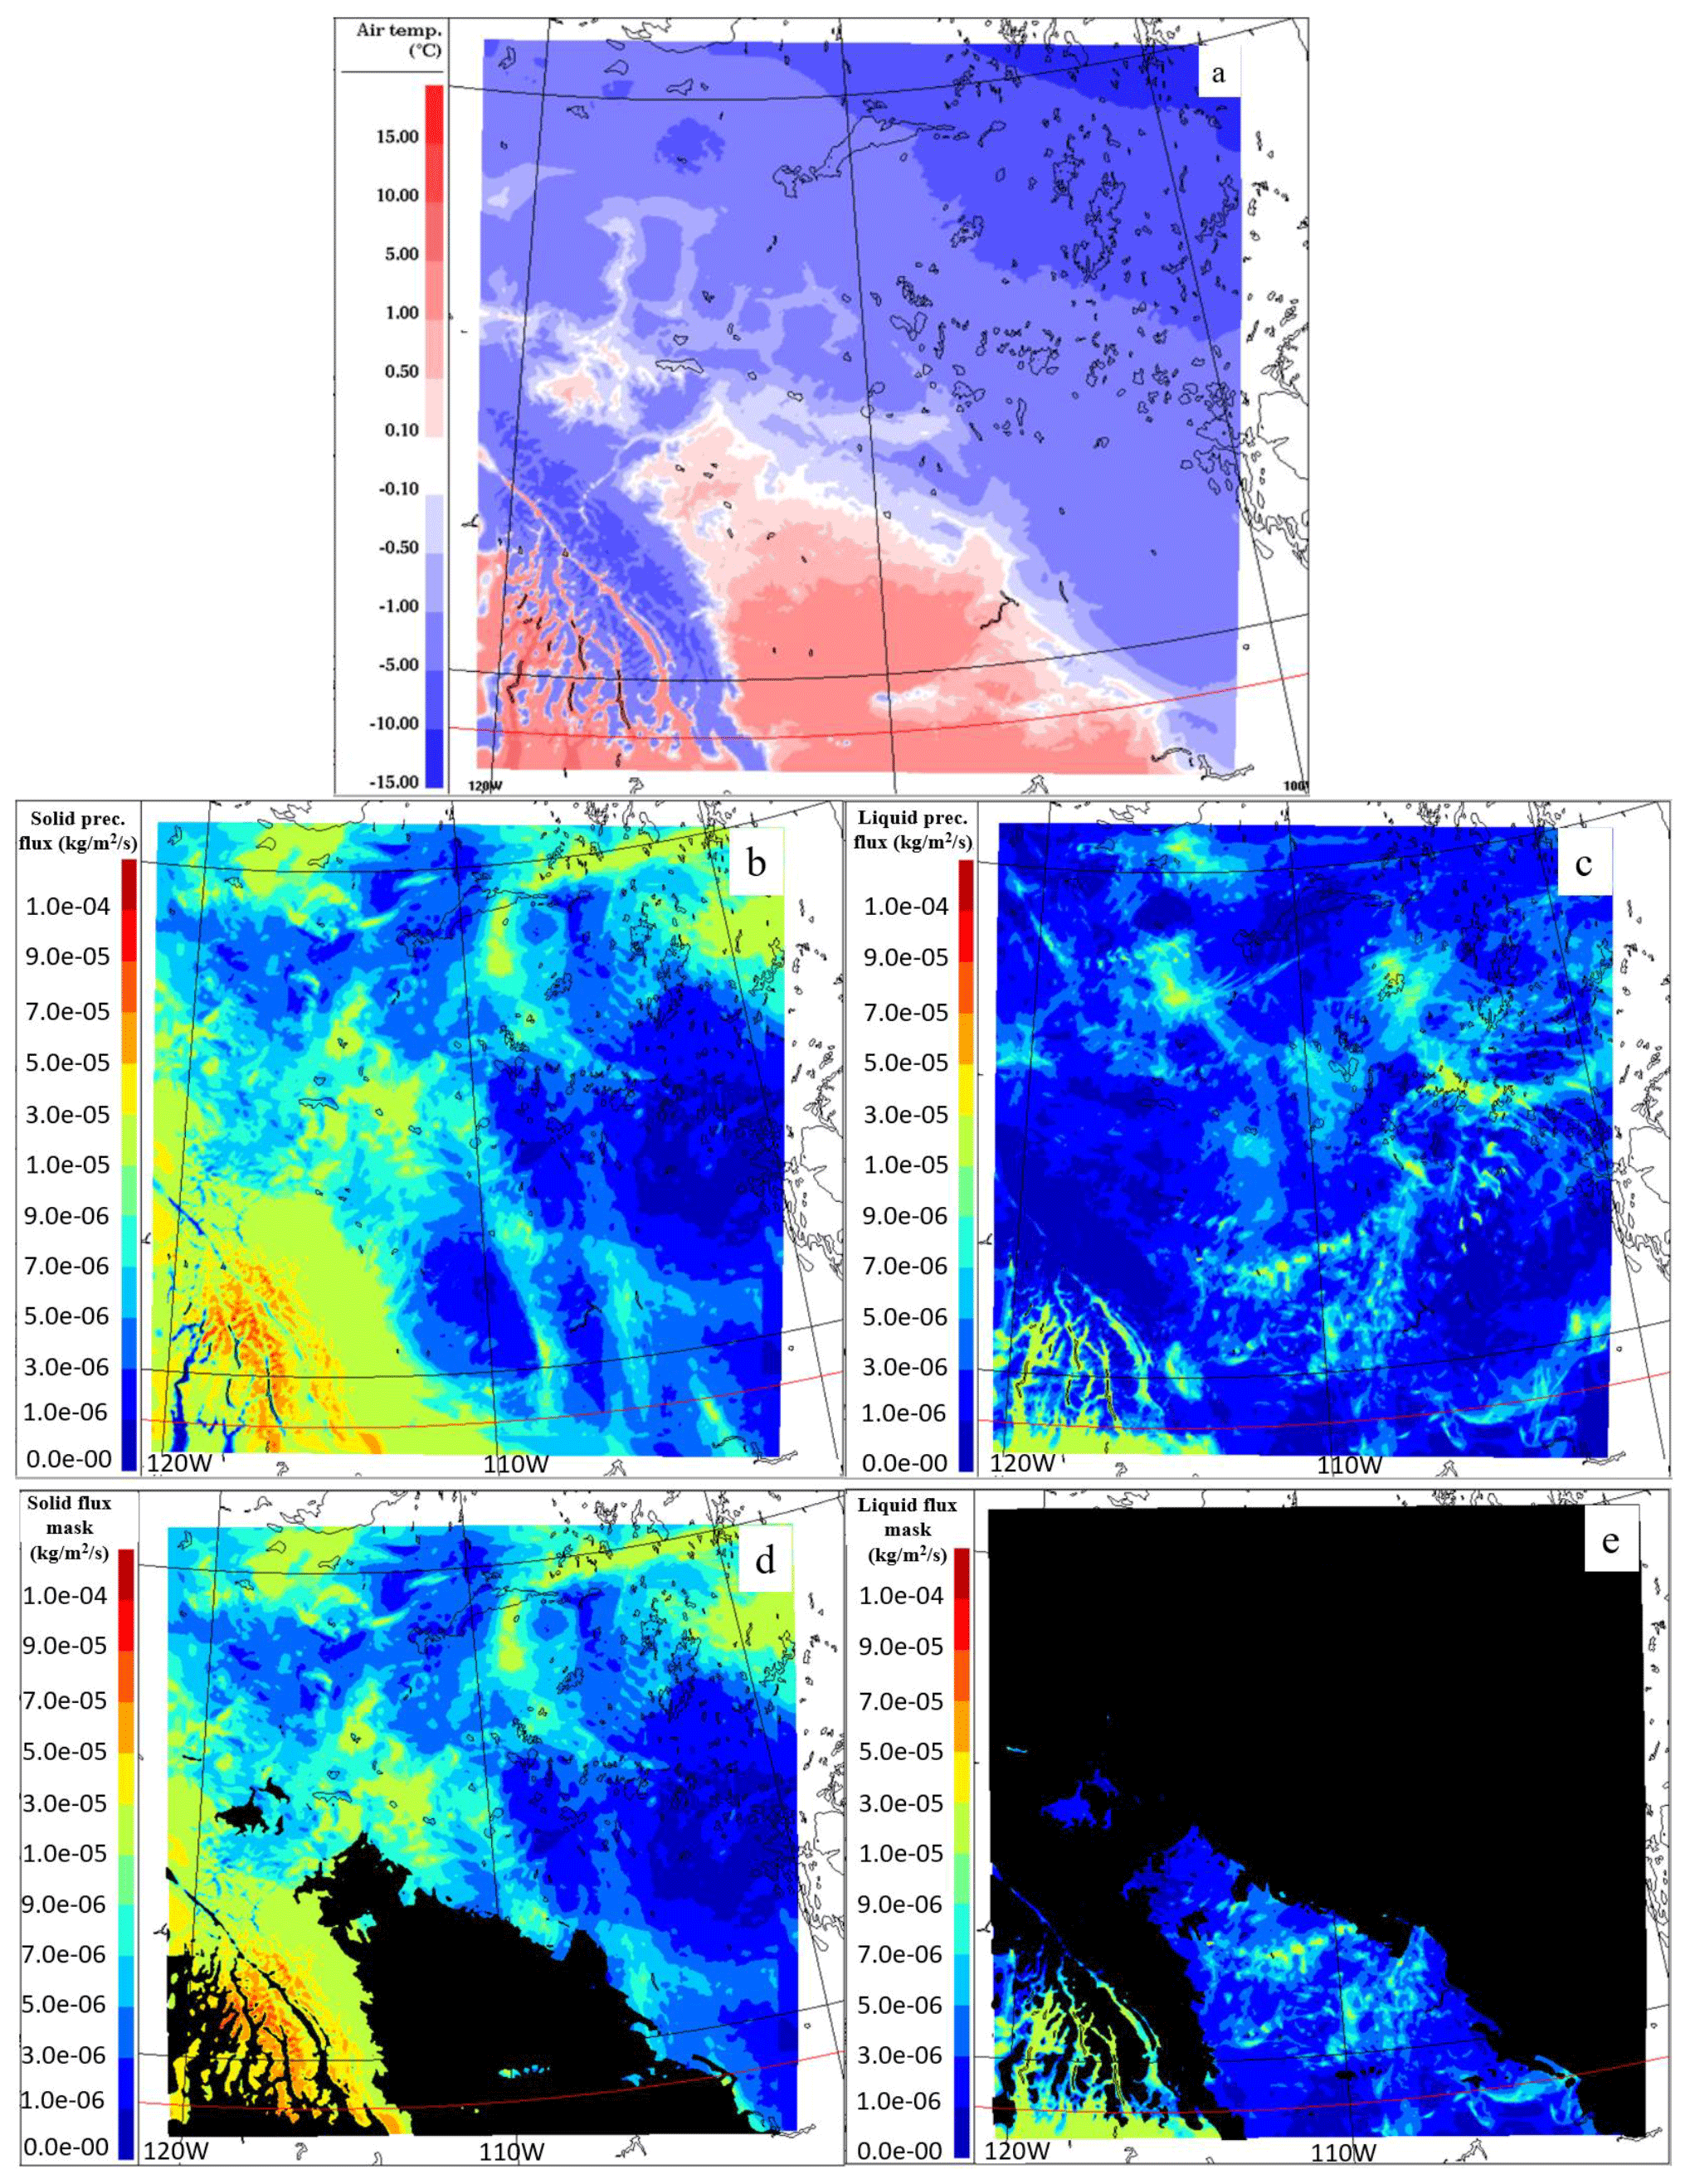
Figure 2Mean April (a) temperature, (b) solid precipitation flux and (c) liquid precipitation flux at the model hybrid level of 0.98 (e.g., at ∼980 mb). Panels (d) and (e) are as in (a) and (b) but showing approximate limits masking out the predominantly snow flux (d) and predominantly rain flux (e). The black masked regions are the portion of the solid precipitation that would be treated as liquid in the base case due to the above-zero environment temperature (c), and the portion of the liquid precipitation that would be treated as solid in the base case due to sub-zero environment temperature (e).
For this study, three model runs were conducted:
-
Base case – the existing GEM-MACH setup (“base case”). The BCS of aerosol is parameterized based on Slinn (1984) (“Slinn1984”) as described in Sect. 2.2. A single-phase precipitation was employed at a given model grid cell: the liquid and solid precipitation fluxes at a given model grid cell are combined to a total precipitation flux, and a uniform environment temperature threshold (T=0 ∘C) is used to determine the precipitation phase, liquid or solid, for BCS (e.g., >0 ∘C rain and <0 ∘C snow).
-
Multi-phase partitioning approach (or “multi-phase”). For this experiment, the BCS of aerosol is also based on Slinn (1984); however, coexisting multi-phase precipitation at a given model grid is considered. In contrast to the base case, the liquid and solid precipitation fluxes are not combined prior to the BCS calculation. Instead, the predicted liquid and solid precipitation fluxes by the GEM microphysics are used in separate BCS calculations (according to the predicted phase), allowing for the co-existence of liquid and solid precipitation at a given model grid cell for the treatment of BCS.
-
Wang et al. (2014) scavenging scheme (“Wang2014”). This simulation also uses coexisting multi-phase precipitation similar to case 2 above, with the difference being the replacement of the Slinn (1984) formulation for the BCS coefficient for aerosols with the semi-empirical formulation from Wang et al. (2014).
In both the base case and the multi-phase approach, the formulae of Slinn (1984; Eqs. 4 and 5) are used to determine the scavenging coefficient (for liquid and solid precipitation, respectively). The main difference between the base case and multi-phase approach lies in whether a precipitation is treated as a single phase (base case) or multiple phases of precipitation (multi-phase) are considered model grid cells containing clouds. The approaches consequently differ in how the precipitation phase is determined for BCS, i.e., through the use of a uniform temperature threshold that determines whether the precipitation is in the form of rain or snow (base case) or through the use of meteorological model (or parameterized) rain and snow (multi-phase). Note also that both methodologies make use of Eq. (3) to describe the flux between model layers. Figure 2 shows the average temperature and the rain and snow fluxes predicted by the GEM-MACH meteorological module for April 2018 at the model hybrid level of 0.98 (e.g., the level near the surface and at ∼980 mb atmospheric pressure). The study area was relatively cold, and the average temperature is in the range −15 to 15 ∘C. The model predicted both solid and liquid precipitation during the month of April, with solid precipitation dominating. There are areas (model grid cells) where coexisting liquid and solid precipitation were predicted. With the base-case approach, all precipitation (liquid + solid) in the area where temperature was below 0 ∘C was treated as solid phase for BCS. Similarly, all precipitation in the area where temperature was above 0 ∘C was treated as liquid phase. This is illustrated in the lower panels of Fig. 2 (Fig. 2d and e) by masking the areas with no liquid and solid precipitation. In contrast, the new multi-phase approach treats the liquid and solid precipitation as they are predicted in the GEM microphysics when applying the Slinn parameterization for liquid and solid precipitation scavenging coefficients. The comparison between the average temperature (Fig. 2a) and the solid and liquid fluxes (Fig. 2b and c) from these two approaches illustrates the difference between the assigned solid and liquid precipitation based on a uniform temperature (Fig. 2d and e – liquid precipitation for T>0 ∘C and solid for T<0 ∘C) and the revised approach using the predicted solid and liquid phases from the GEM microphysics module (Fig. 2b and c). These results indicate the possible inconsistency between the model hydrometeor distributions generated with the use of a temperature threshold versus the “actual” precipitation phases, which may further impact the aerosol scavenging and concentration and wet fluxes. Note that Fig. S1 in the Supplement, the same plot as Fig. 2 but for July 2018, shows the existence of solid-phase precipitation at high altitudes.
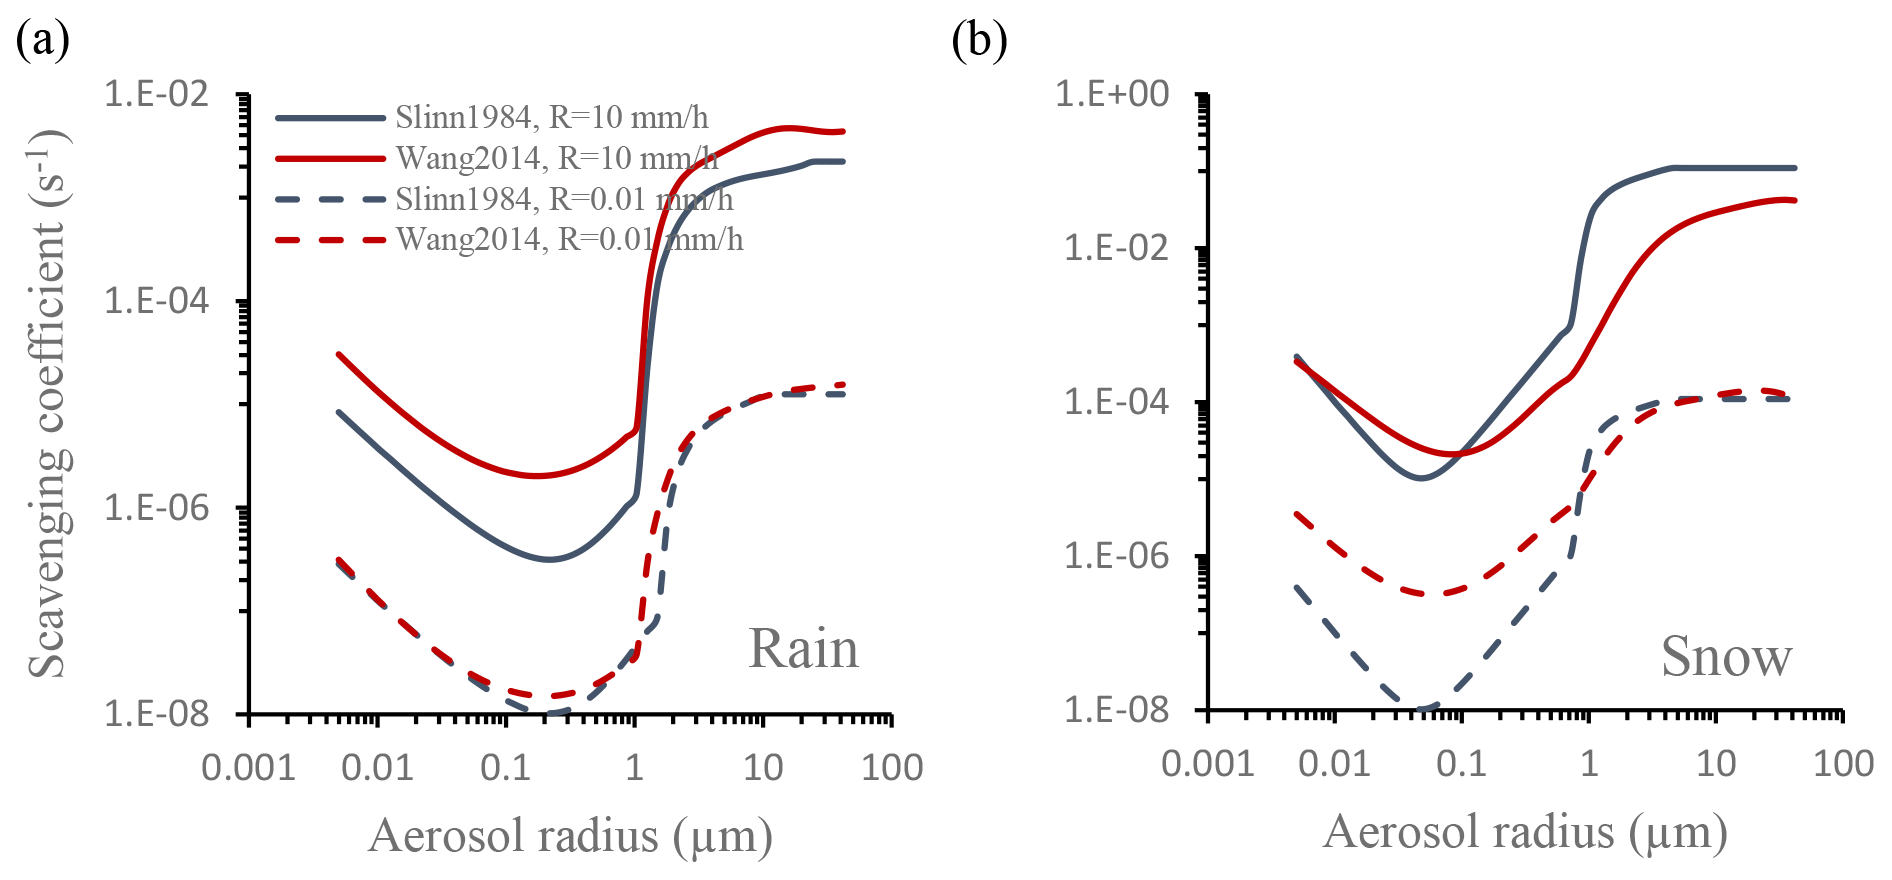
Figure 3Slinn (1984) and Wang (2014) rain (a) and snow (b) scavenging coefficients (s−1) versus the aerosol sizes and different precipitation intensities (R).
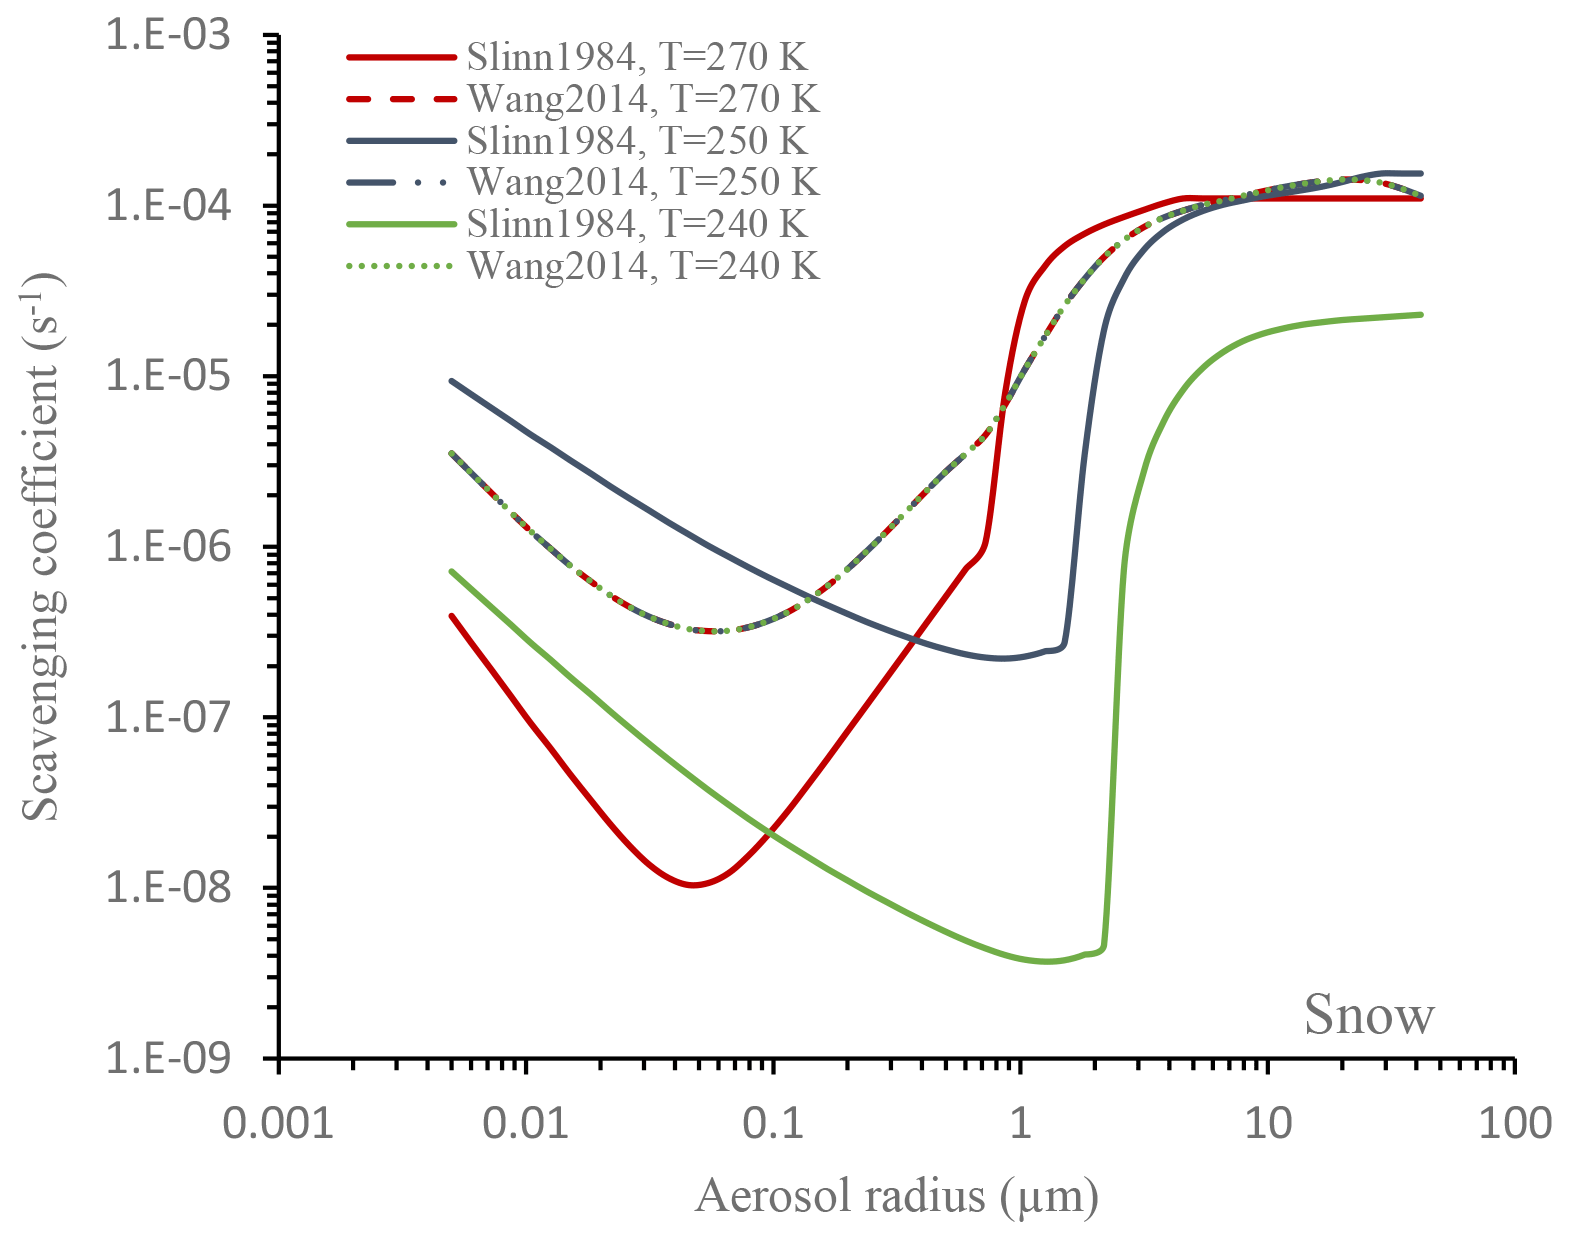
Figure 4Slinn (1984) and Wang et al. (2014a) snow scavenging coefficient versus aerosol size distribution with the intensity of 0.01 mm h−1 at three different ambient atmospheric temperatures (T=240, 250 and 270 K). Note that the three curves associated with Wang et al. (2014a) collapse into a single curve due to their independence to temperature.
Figure 3 compares the Slinn1984 and Wang2014 scavenging coefficients as a function of aerosol size. For liquid precipitation (Fig. 3a), the difference between the Slinn1984 and Wang2014 scavenging coefficients increases with increasing precipitation intensity. The two schemes differ the most for aerosol sizes between 0.1 to 1 µm, particularly at high-precipitation intensity (Fig. 3b). For the solid precipitation at lower intensity (R=0.01 mm h−1), the two schemes diverge for aerosols smaller than 1 µm, while at higher precipitation intensities (R=10 mm h−1) the two schemes show higher disparity for aerosols larger than 1 µm. Collection efficiency in the Slinn formula includes the effects of the processes of Brownian diffusion, interception and impaction. However, Slinn's formulae do not include representation of some processes such as thermophoresis or diffusiophoresis, both of which may increase the collection efficiency for particles in the size range of 0.01–1 µm (e.g., Slinn and Hales, 1971; Wang and Pruppacher, 1977; McGann and Jennings, 1991; Byrne and Jennings, 1993; Pranesha and Kamra, 1997; Tripathi and Harrison, 2002; Tinsley, 2000; Andronache, 2004; Andronache et al., 2006; Wang et al., 2010). Wang2014 includes the consideration for these two additional processes. Jones et al. (2022) showed that the thermophoresis mostly enhances the collection of accumulation mode particles (0.1–1 µm). This may explain the underestimation of scavenging coefficient by Slinn1984 in comparison to Wang2014 for particles below 1 µm diameter. Figure 4 shows snow scavenging coefficient magnitude versus aerosol size distribution with the intensity of 0.01 mm h−1 and different ambient atmospheric temperatures. In the Slinn (1984) Eq. (5) (for snow or solid precipitation), collection efficiency E, characteristic capture length =λ and characteristic length Dm vary with temperature. This temperature dependence is related to the assumption of the temperature regimes associated with types of hydrometeors and their shapes and sizes. However, the Wang2014 parameterization was developed assuming ambient temperatures of 15 ∘C for rain scavenging and −10 ∘C for snow scavenging and an ambient pressure of 1013.5 hPa for both rain and snow scavenging. This introduces some uncertainties in the Wang et al. (2014) approach, when the atmospheric conditions differ from these assumptions.
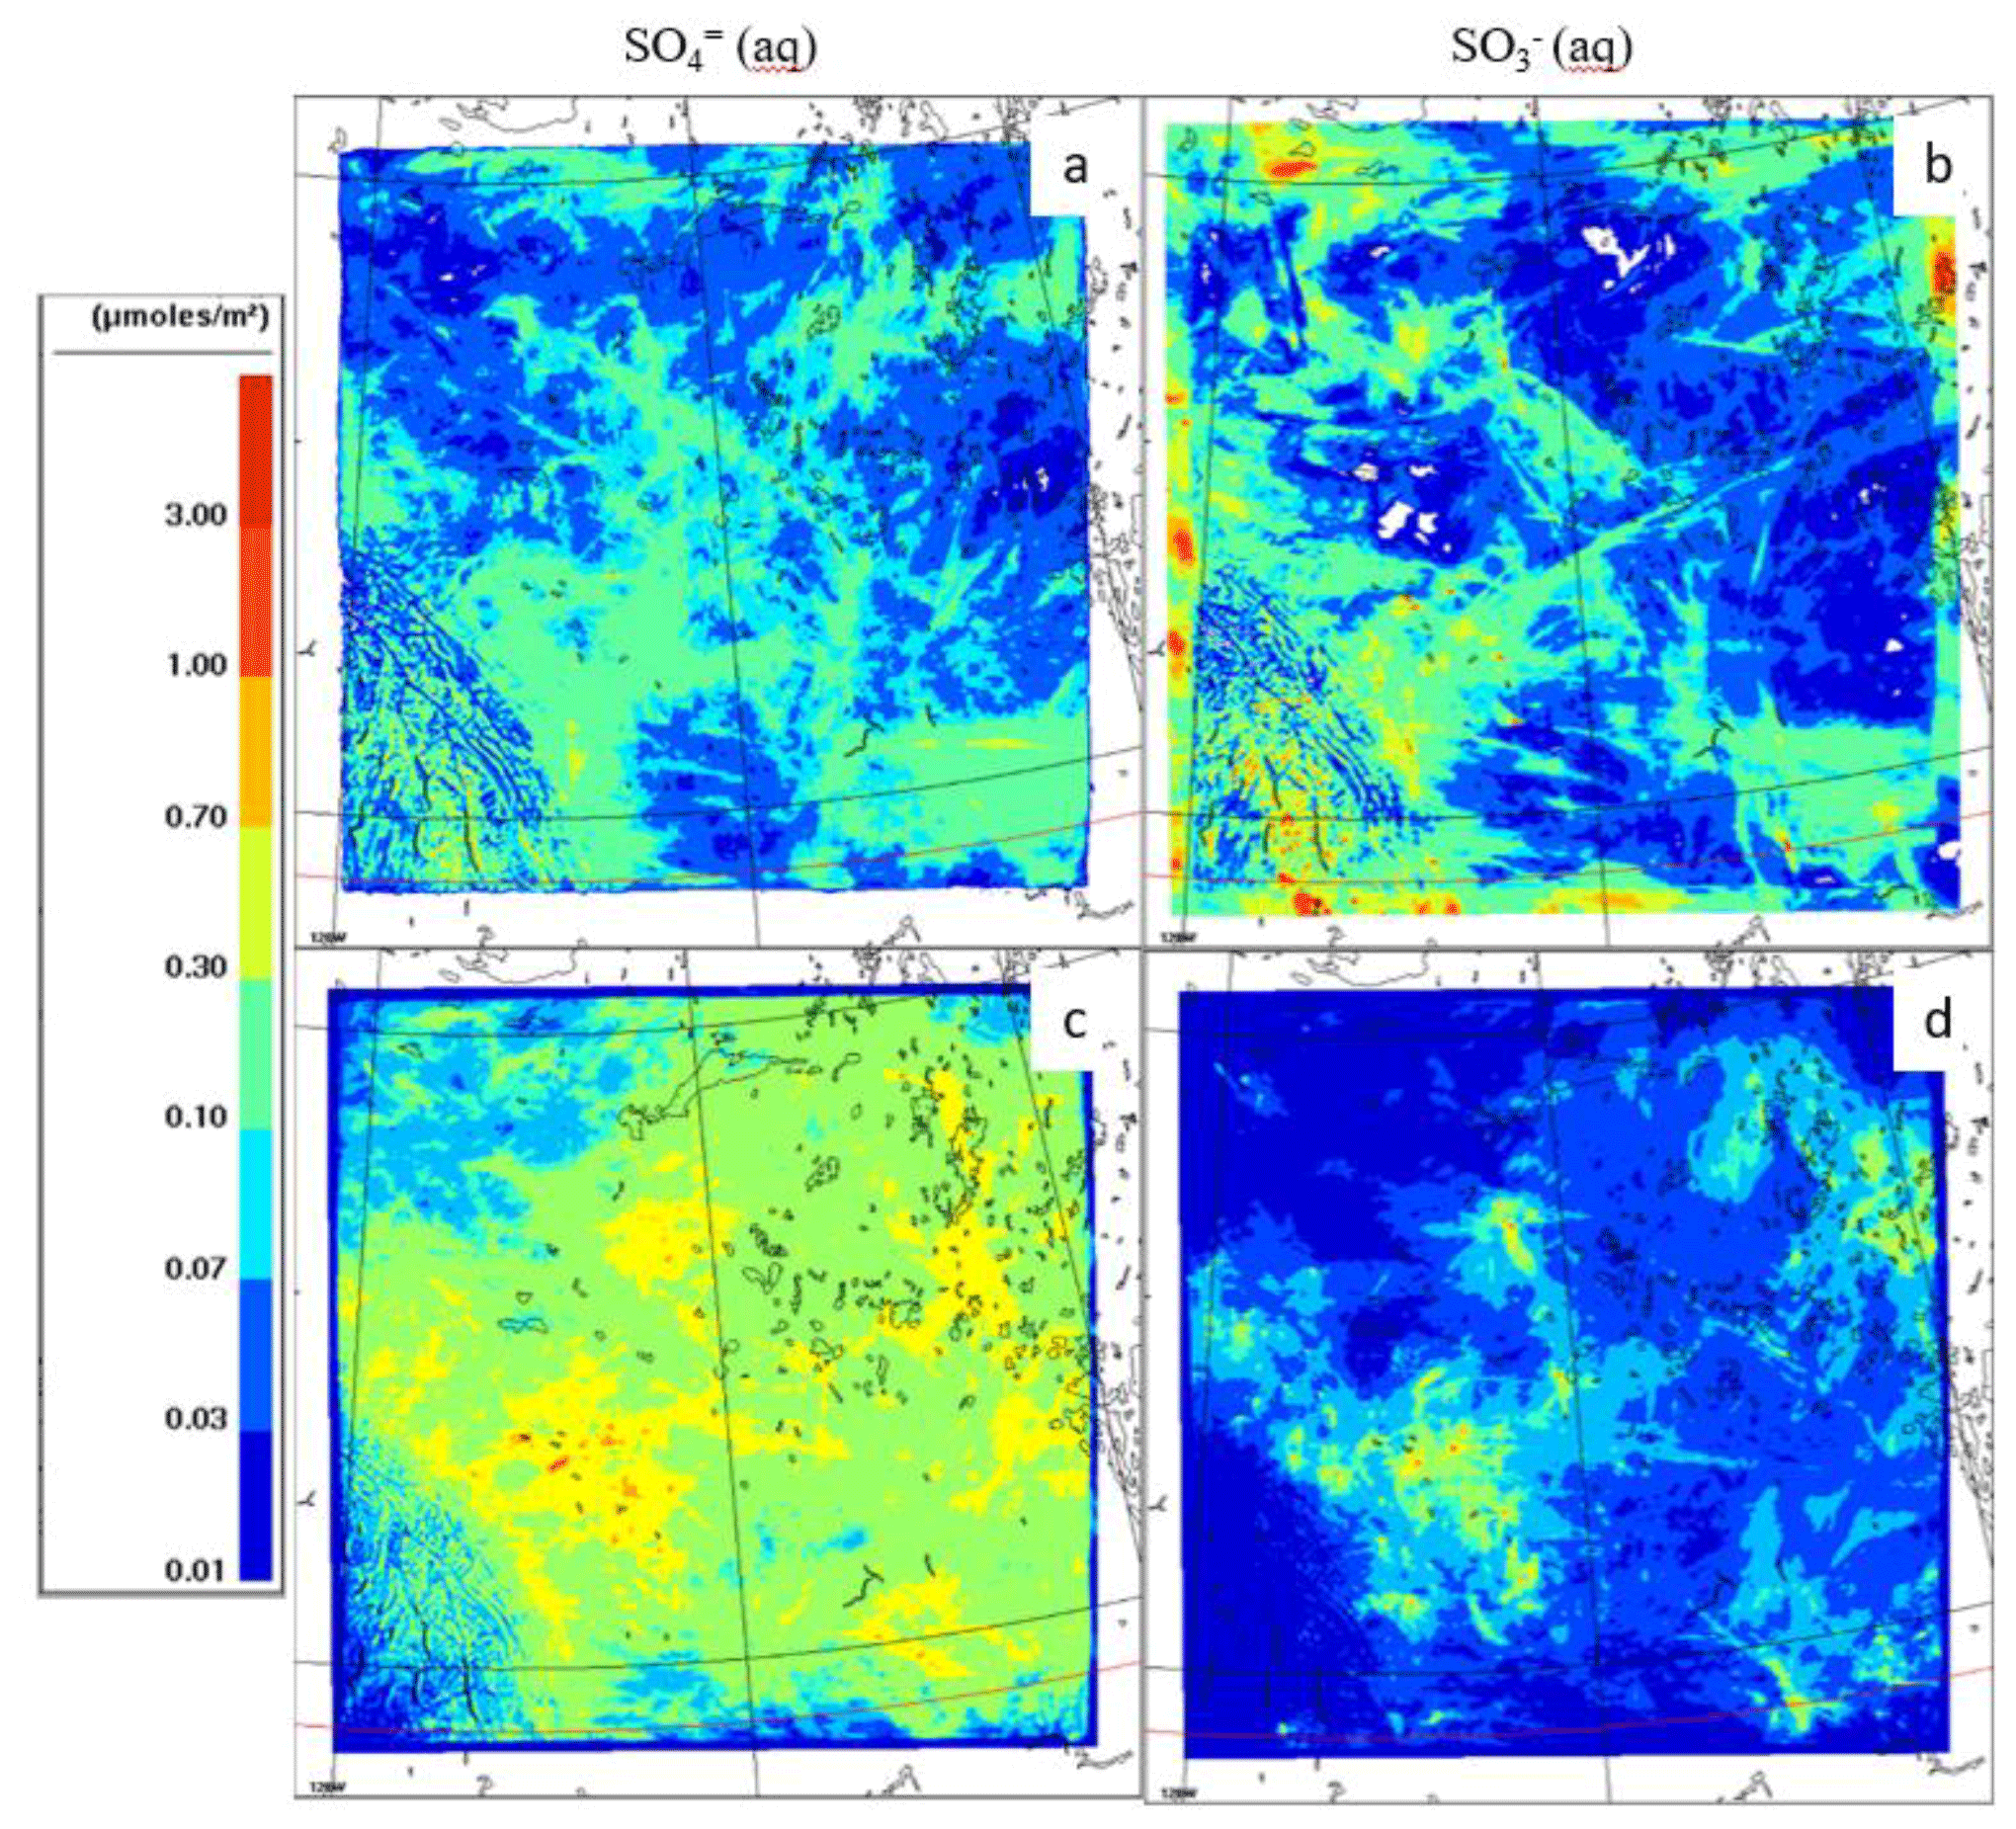
Figure 5Hourly accumulated sulfur component deposition flux (µmol m−2) from the base-case experiment, averaged over April 2018 (a, b) and July 2018 (c, d) for SO (a, c) and SO (b, d). Domain-mean deposition values are SO (9.84) and SO (7.97) µmol m−2 (µg m−2) for April and SO (2.16) and SO (17.95) µmol m−2 (µg m−2) for July.
2.4 Observation for model evaluation
The observation data used for model evaluation are from several surface monitoring networks, namely, precipitation chemistry data from the Canadian Air and Precipitation Monitoring Network (CAPMoN) and Alberta Precipitation Quality Monitoring Program (APQMP) and air concentration of PM2.5 and speciated PM2.5 data from National Air Pollution Surveillance (NAPS).
2.4.1 Precipitation samples
Precipitation samples were collected at five sites by APQMP, and at three sites by CAPMoN (https://www.canada.ca/en/environment-climate-change/services/air-pollution/monitoring-networks-data/canadian-air-precipitation.html, last access: 25 January 2024). Measurement locations are shown in Fig. 1. These samples are collected using wet-only precipitation samplers. The samplers are designed to be operated only during precipitation; the sampling container lids open when the precipitation is detected by the heated precipitation sensors. The primary goal of the precipitation sample collection is analysis of the major ions. For the CAPMoN samples, the collector container was lined with a polyethylene bag which was removed, sealed, weighed, refrigerated and shipped to the laboratory for major ion analysis. For the APQMP samples, the samples were transferred from the clean collection container to a smaller sample bottle, capped, refrigerated if stored on site and shipped to the laboratory for analysis. The collection frequency varied between sites, with some sites collecting daily samples, and others collecting weekly samples.
Using recommended methods and completeness criteria of WMO/GAW (2004, updated 2015), quality control procedures were performed by the collecting networks, and precipitation-weighted mean concentrations of SO, NO and NH were calculated from the samples.
Overall, the collecting method described above tends to underestimate the total precipitation amount due to wind and evaporative loss and delay in lid opening relative to the commencement of precipitation, and thus the flux of ions derived from the samples must be corrected using independent observations of total precipitation values. CAPMoN sites were equipped with separate standard rain and snow gauges for measuring the precipitation amounts in order to carry out this correction. These standard gauges were not available on APQMP sites, and hence deposition fluxes precipitation corrections were calculated using daily precipitation depth data from the nearest meteorological station (ECCC, 2022; AAF, 2022).
2.4.2 Speciated and total aerosol concentrations
The PM2.5 speciation program of NAPS network includes the measurement of PM2.5 mass and speciated PM2.5 (e.g., sulfate, nitrate and ammonium) at the existing Canada-wide air quality monitoring sites (https://www.canada.ca/en/environment-climate-change/services/air-pollution/monitoring-networks-data/national-air-pollution-program.html, last access: 25 January 2024). Speciated PM2.5 samples were collected using Partisol-Plus Model 2025-D sequential dichotomous particle samplers by splitting the incoming PM10 sample stream into fine and coarse fractions with a virtual impactor. The mass flow rates of the fine- and coarse-particle streams were maintained at 15 and 1.7 L min−1, respectively. PM2.5 speciation samples were collected using a Partisol Model 2300 sequential speciation samplers, equipped with three Harvard-designed, Thermo Scientific ChemComb® cartridges. The cartridges were designed to separate PM2.5 impactor inlets and maintain a constant flow rate of 10 L min−1. More information regarding the data collection and analysis by NAPS is available from Dabek-Zlotorzynska et al. (2011).
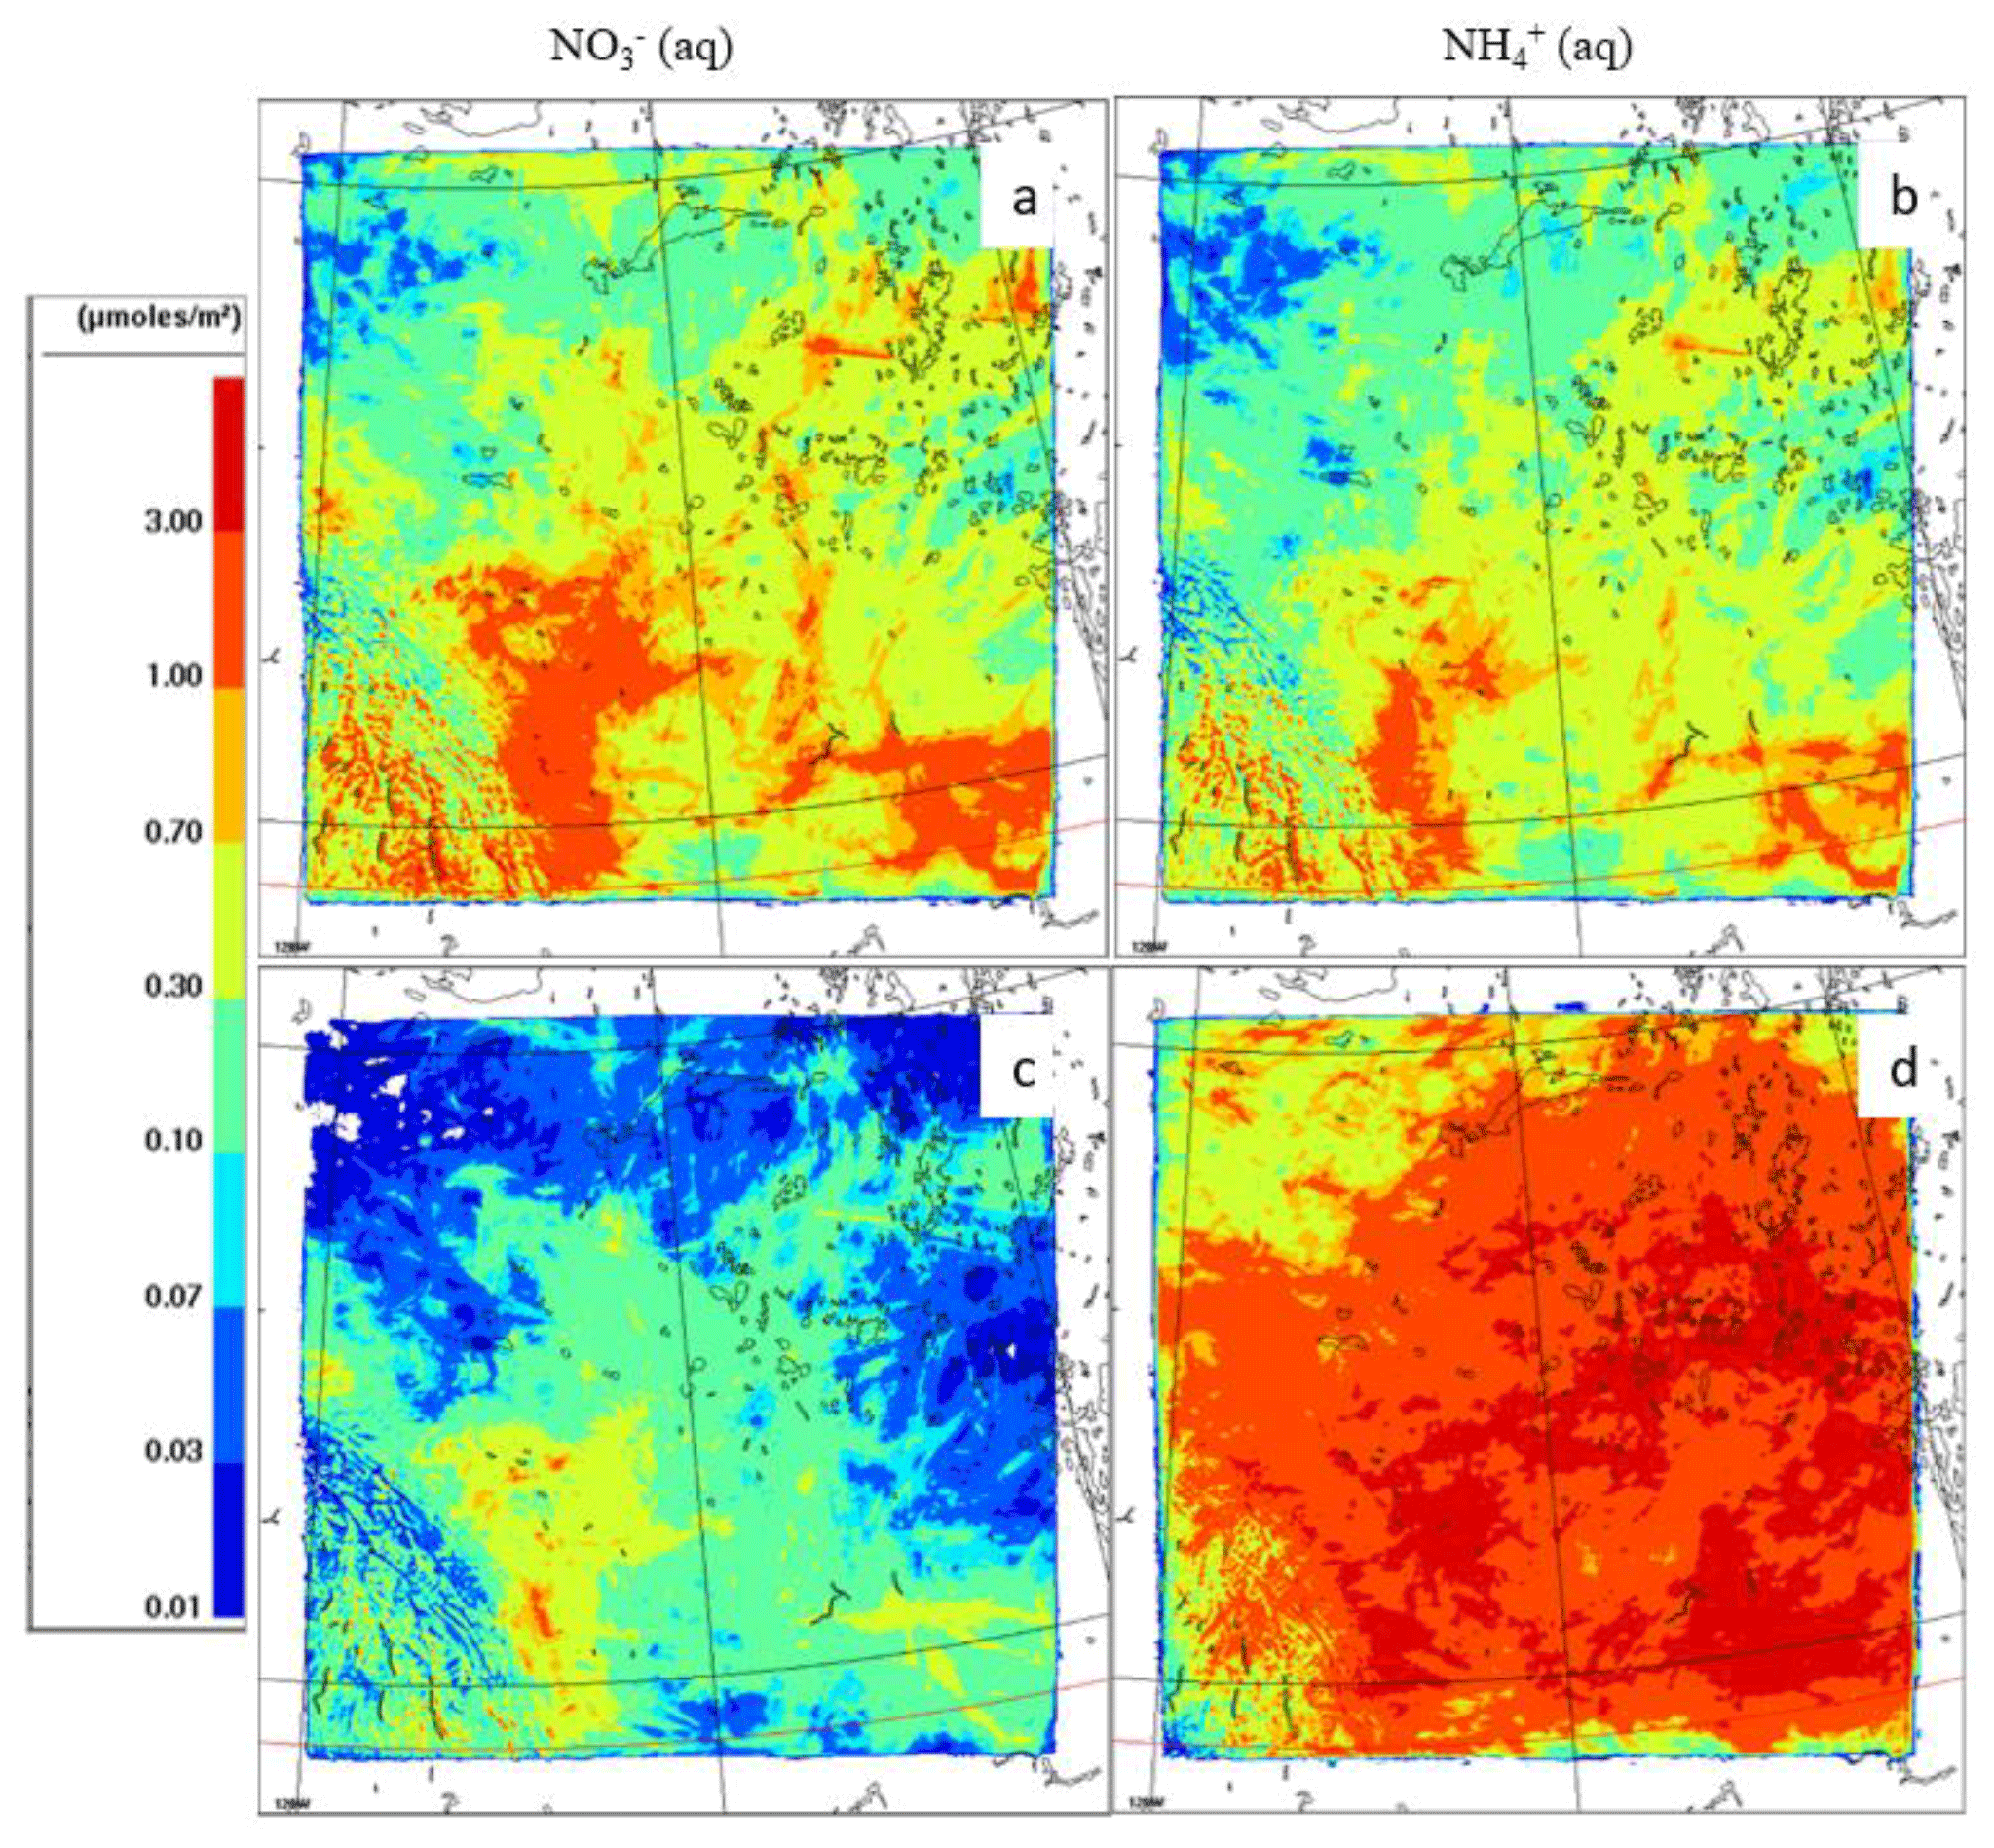
Figure 6Hourly accumulated nitrogen components deposition flux (µmol m−2) from the base-case experiment, averaged over April 2018 (a, b) and July 2018 (c, d): NO (a, c) and NH (b, d). Domain-mean deposition values are NO (7.65) and NH (4.15) µmol m−2 (µg m−2) for April and NO (9.295) and NH (21.45) µmol m−2 (µg m−2) for July.
3.1 Modeled wet deposition
Makar et al. (2018) evaluated the model total (wet and dry) deposition against observed precipitation data from the Athabasca oil sands region, and concluded that wet deposition dominates based on an earlier version of the GEM-MACH model. The contribution to April and July 2018 mean wet deposited flux for different components of sulfur and nitrogen for the base-case experiment are shown in Figs. 5 and 6, respectively (the domain-average values are shown in figure captions). The wet deposition fluxes include both in-cloud scavenging and BCS. The wet scavenging of sulfate aerosol is lower during the cold season than in the warm season. HSO deposition mostly occurs close to the SO2 emission sources as it is associated with wet scavenging of gas-phase SO2, while the wet deposition of the oxidized form, SO, extends to a broader area downwind from the emission sources. Shown in Fig. S2 are maps of modeled average SO2 concentration at the model hybrid level of 0.98 over the region for the periods of our simulations. The “hotspots” of SO2 indicate the locations of major SO2 emission sources in the oil sands area. The higher monthly total precipitation in July (Fig. 7) affects the SO deposition fluxes in July (Fig. 5). Furthermore, deposition of N species is higher in July than April due to higher total precipitation (Fig. 7), agricultural activities and increased contributions of bi-directional fluxes when the ground is unfrozen. The comparison between wet deposition of N components (Fig. 6) shows higher contributions of NH scavenging, especially in agriculture-rich areas during July, where reduced N is deposited closer to the emission source. The higher NO flux in winter (cold season) is likely driven by the uptake into cloud water of higher particulate nitrate concentrations. Both the temperature dependence of particle nitrate formation (which favors colder temperatures) and the shallower boundary layer in the winter lead to higher particulate nitrate in wintertime, which may then be scavenged below clouds. This is further influenced by the elevated NOx emissions during the winter due to increased energy demand. Note that the NH wet flux includes contributions from scavenging of particulate NH and gaseous ammonia (NH3) and NO wet fluxes from both scavenging of particulate nitrate and gaseous nitric acid (HNO3).
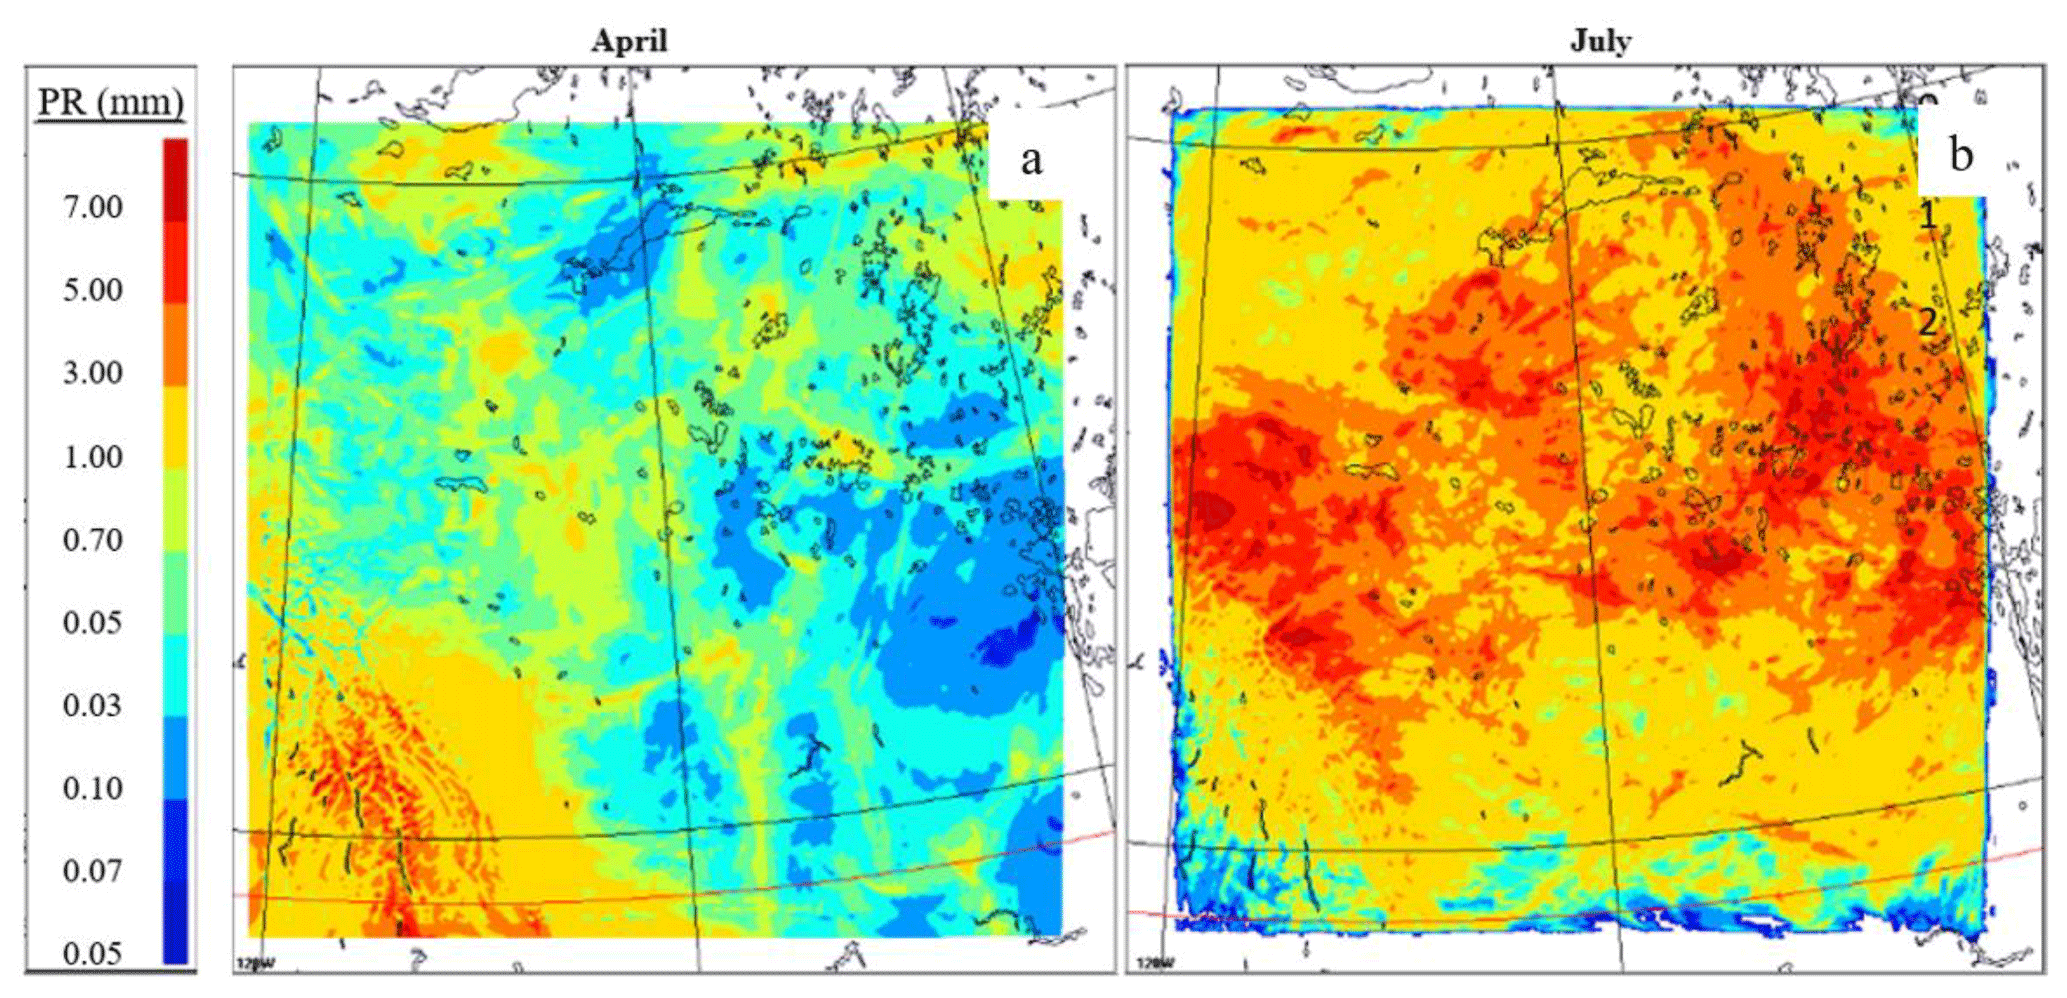
Figure 7Daily accumulated precipitation (PR) averaged over April and July 2018. Domain-mean values of PR are 0.90 and 3.00 mm for April and July, respectively.
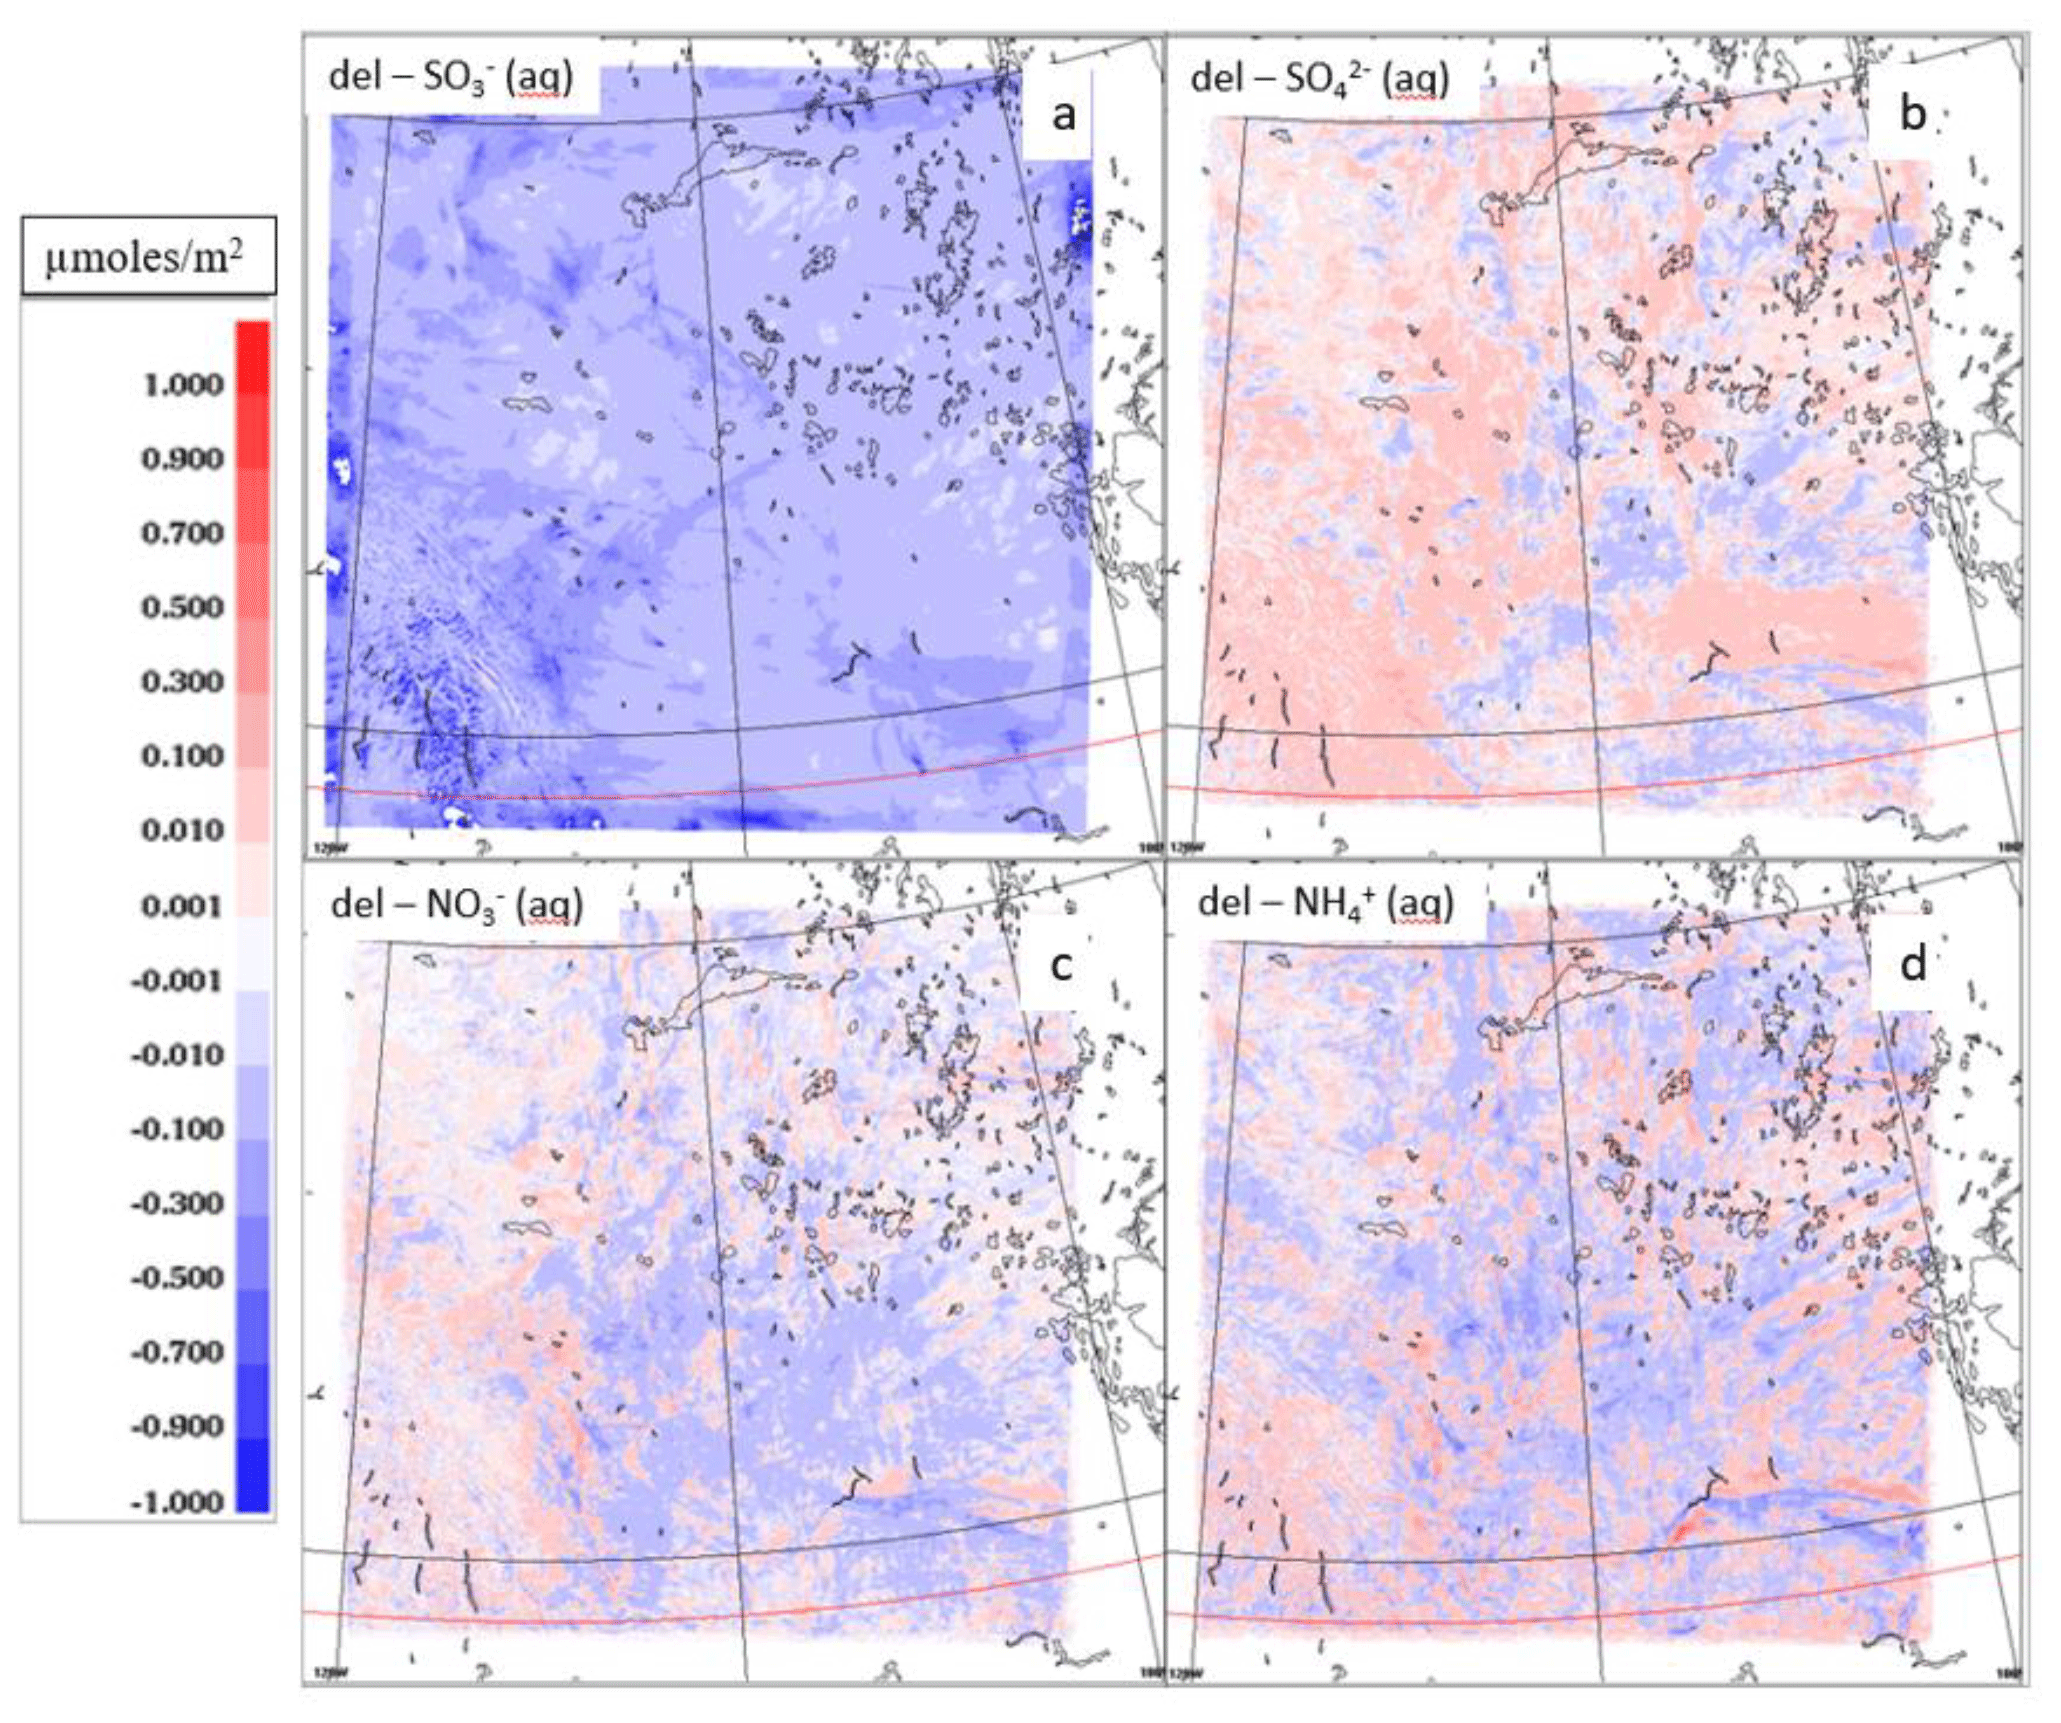
Figure 8The net differences in hourly accumulated mean deposited flux of SO, SO, NH and NO for the multi-phase and base-case experiments (e.g., multi-phase – base case) over April 2018. Domain-mean deposition values are SO (9.84), SO (7.970), NO 0.139 (7.645), and NH7 (4.147) µmol m−2 (µg m−2) for the base case and SO (1.20), SO (8.54), NO (7.42), and NH (4.081) µmol m−2 (µg m−2) for the multi-phase experiment.
Figure 8 shows the differences in wet deposition flux between the base and multi-phase experiments for SO, SO, NO and NH, respectively. We computed the 90 % confidence interval scores for each of the fields examined. The approach follows Makar et al. (2021) and Geer (2016), using a 90 % confidence level in model predictions, with the statistical measures considered different at the 90 % confidence level when the 90 % confidence ranges do not overlap. The 90 % confidence interval scores for each of these difference fields are shown in Fig. 9. Figure 8 shows a decrease in wet deposition of HSO when multi-phase partitioning is included. Although the mean wet deposition of SO is decreased for some areas, Fig. 8 indicates overall enhancement of the scavenged sulfate particles mostly by precipitation partitioning (e.g., for multi-phase experiments). When multi-phase partitioning is included explicitly in the cloud processing parts of the model, a larger amount of solid-phase precipitation occurs than would be the case using a temperature threshold. These changes in phase may result in an increase and decrease in SO and HSO, respectively. In the model, HSO is formed from SO2 dissolved into liquid water (cloud droplets or rain droplet), and it is assumed that ice particles (cloud ice or snow) do not take up SO2. If solid precipitation dominates, there will be less uptake (or scavenging) of SO2 into precipitation. This is in contrast to the case of particle SO – the process of particle scavenging (including particle sulfate) by precipitation is more efficient for solid precipitation (snow) than liquid precipitation (rain), as illustrated in Fig. 2. NO and NH do not experience uniform changes and indicate both increases and decreases in wet scavenging, depending on location. The 90 % confidence intervals show that the largest geographical area of the results between the two models differing at greater than 90 % confidence is for HSO, with almost all of the difference field being significant above the 90 % confidence level. Amongst SO, NO and NH, the areas of confidence level above 90 % for SO are relatively extensive and consistent with the areas of increased wet deposition in Fig. 8, while the areas of confidence level above 90 % for the other two ions are small, suggesting that these differences are occurring more sporadically, probably linked to differences in temperature and rainfall rates, as described above.
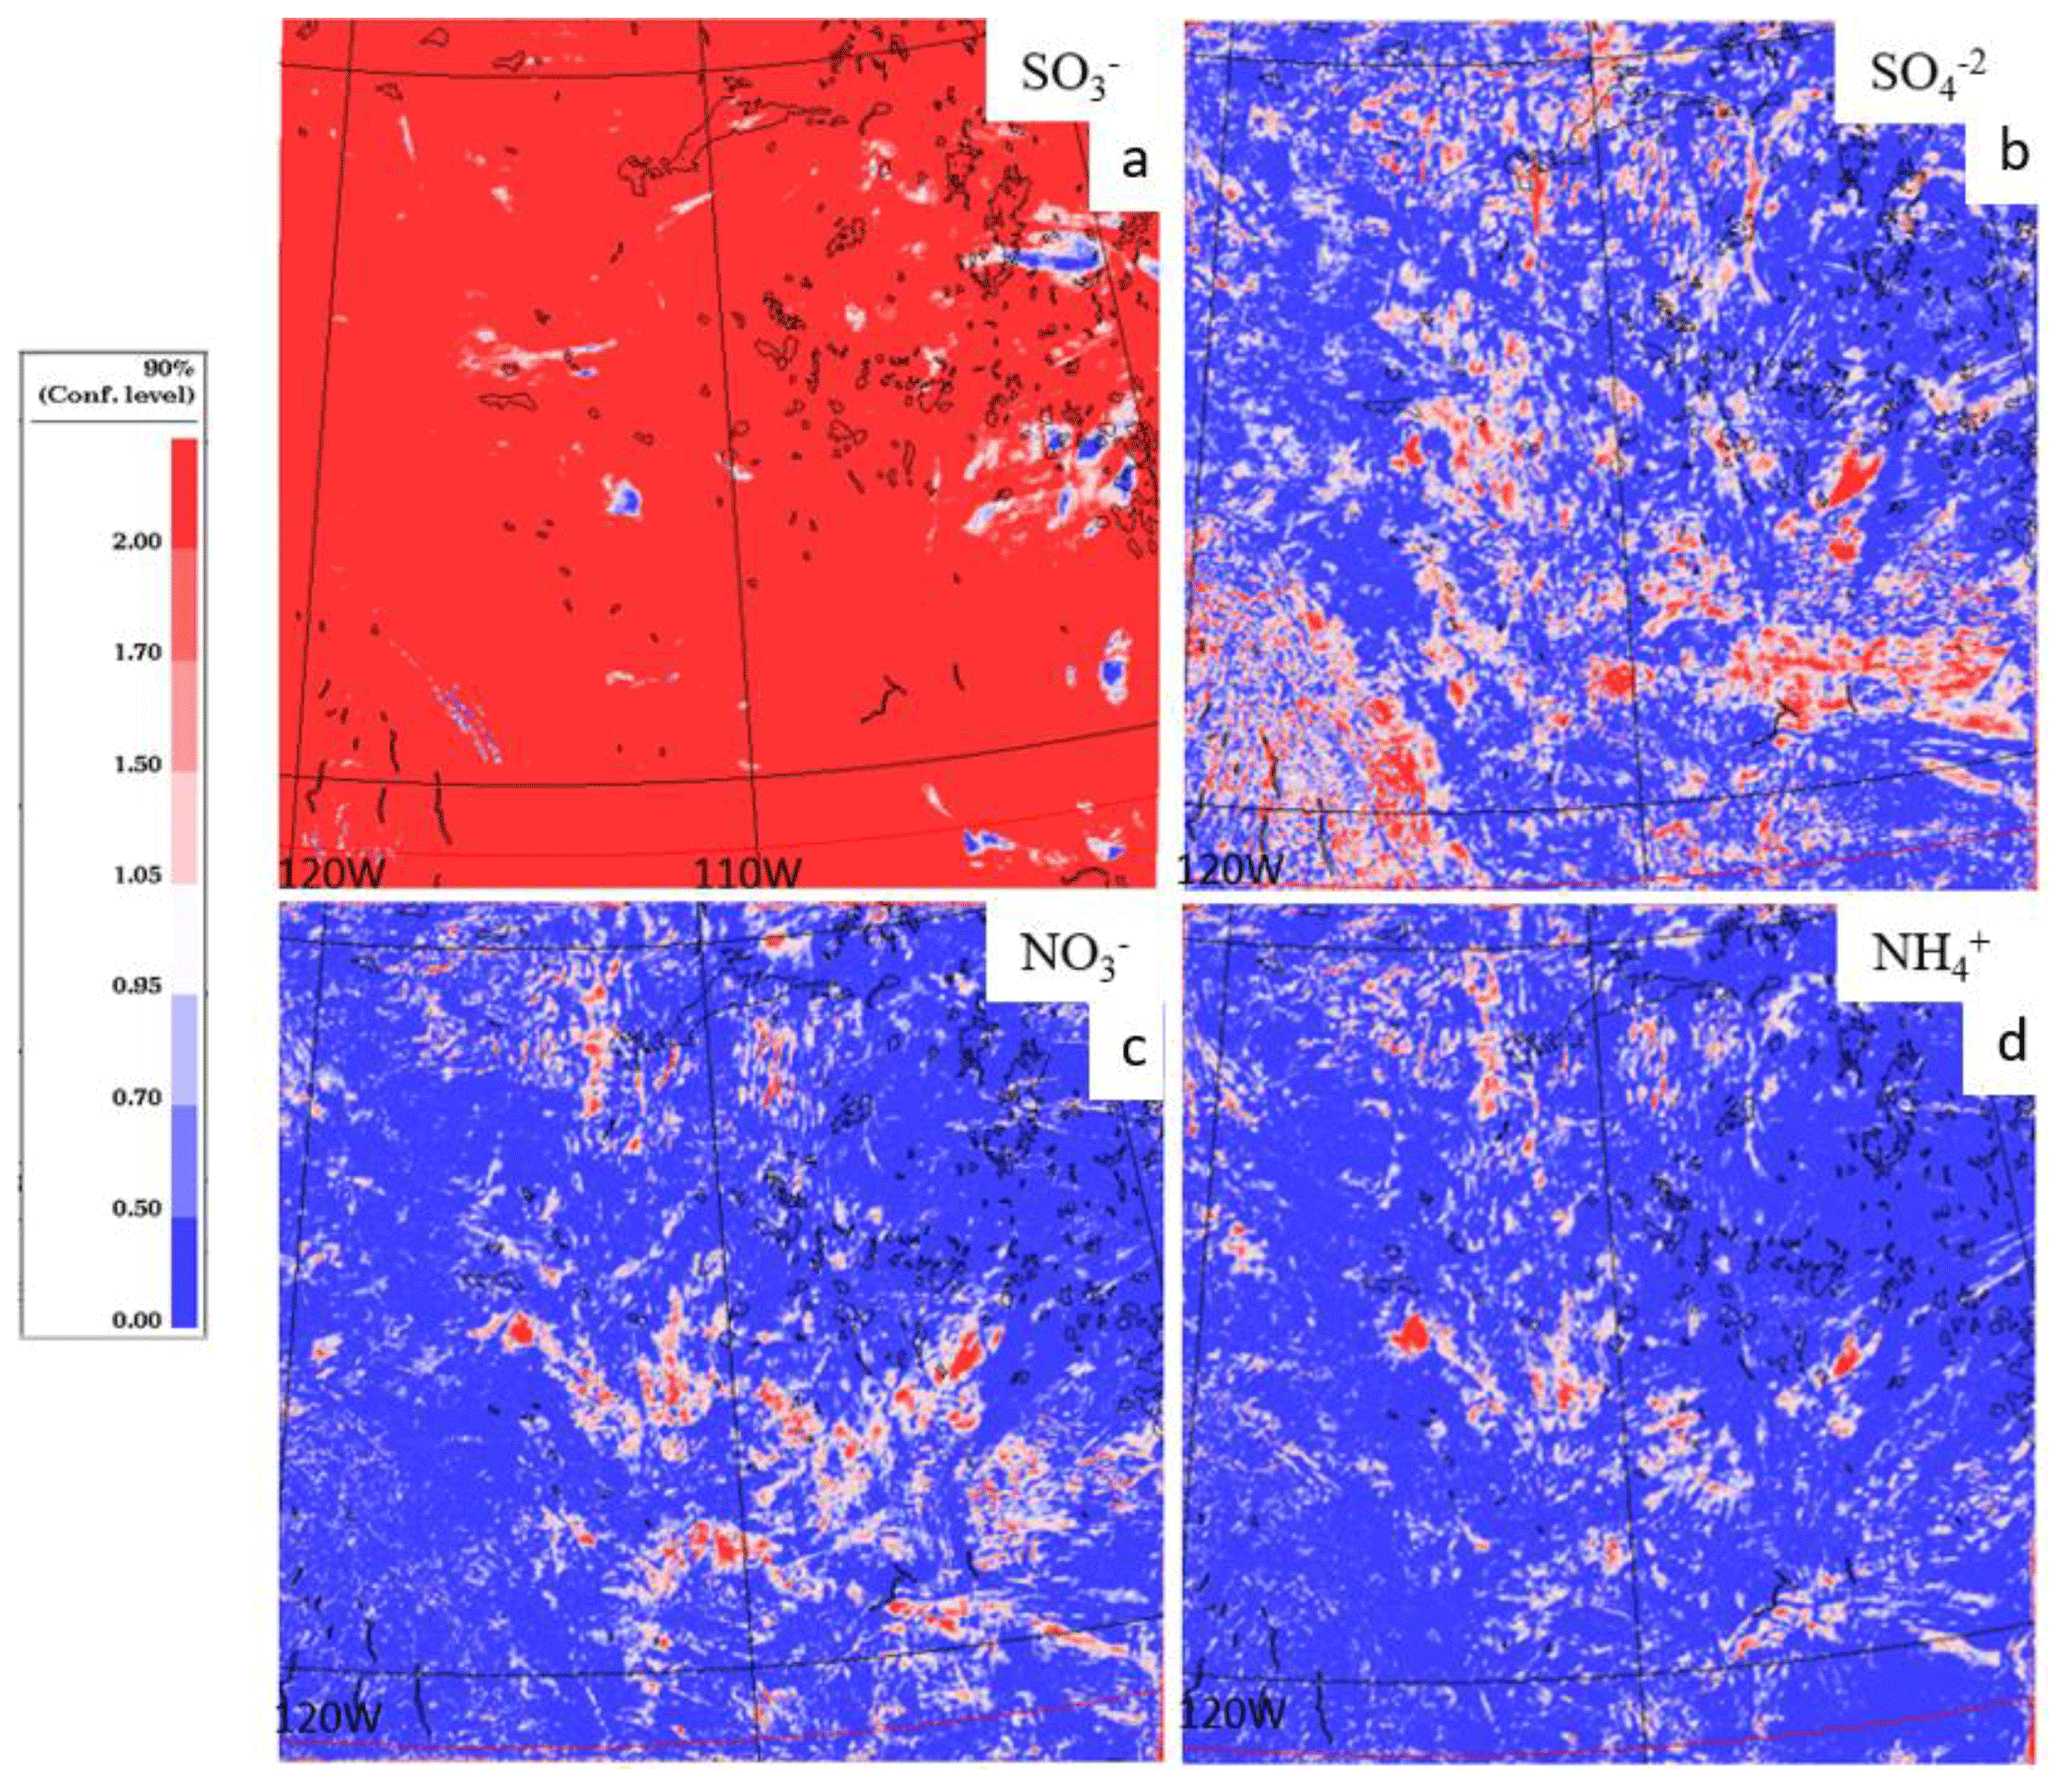
Figure 9The corresponding 90 % confidence interval scores for Fig. 8 (following Makar et al., 2021, the differences are significant at or above the 90 % confidence level when the score ≥1; red regions identify >90 % confidence differences).
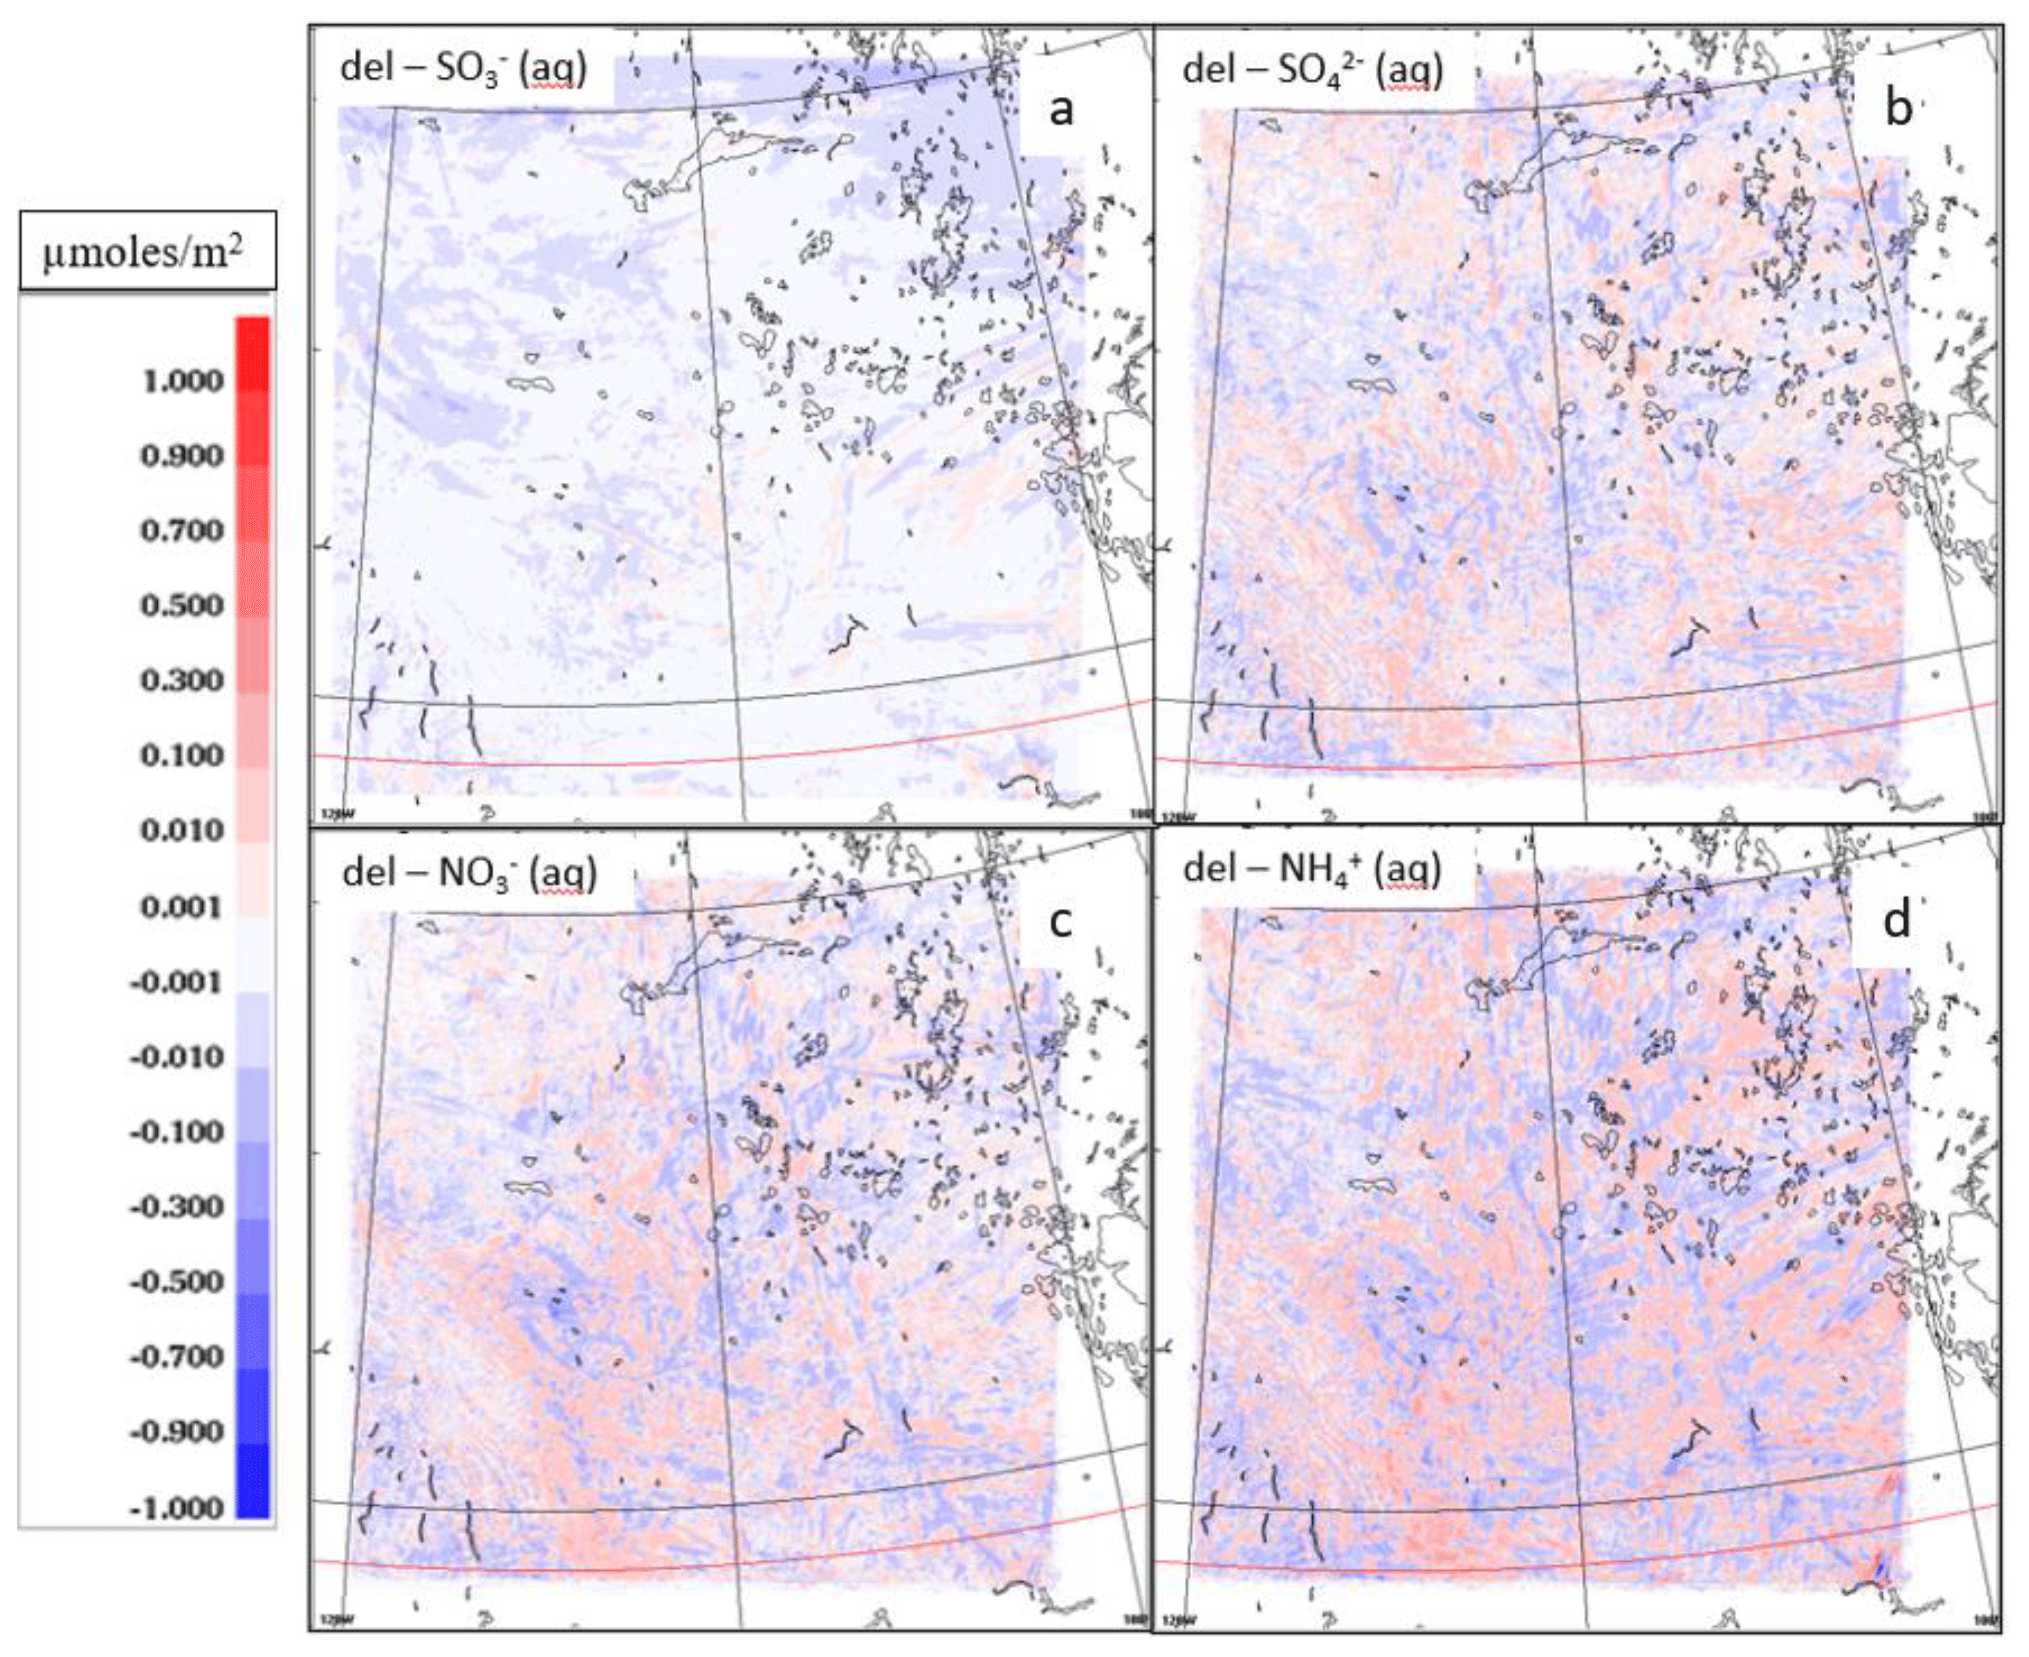
Figure 10The net differences in hourly accumulated mean deposited flux of SO, SO, NH and NO for the Wang2014 and multi-phase experiments (e.g., Wang2014 – multi-phase) for April 2018. Domain-mean deposition values are SO (1.120), SO (8.540), NO (7.425), and NH (4.081) µmol m−2 (µg m−2) for Wang2014 and SO (1.20), SO (8.544), NO (7.425), and NH (4.081) µmol m−2 (µg m−2) for the multi-phase experiment.
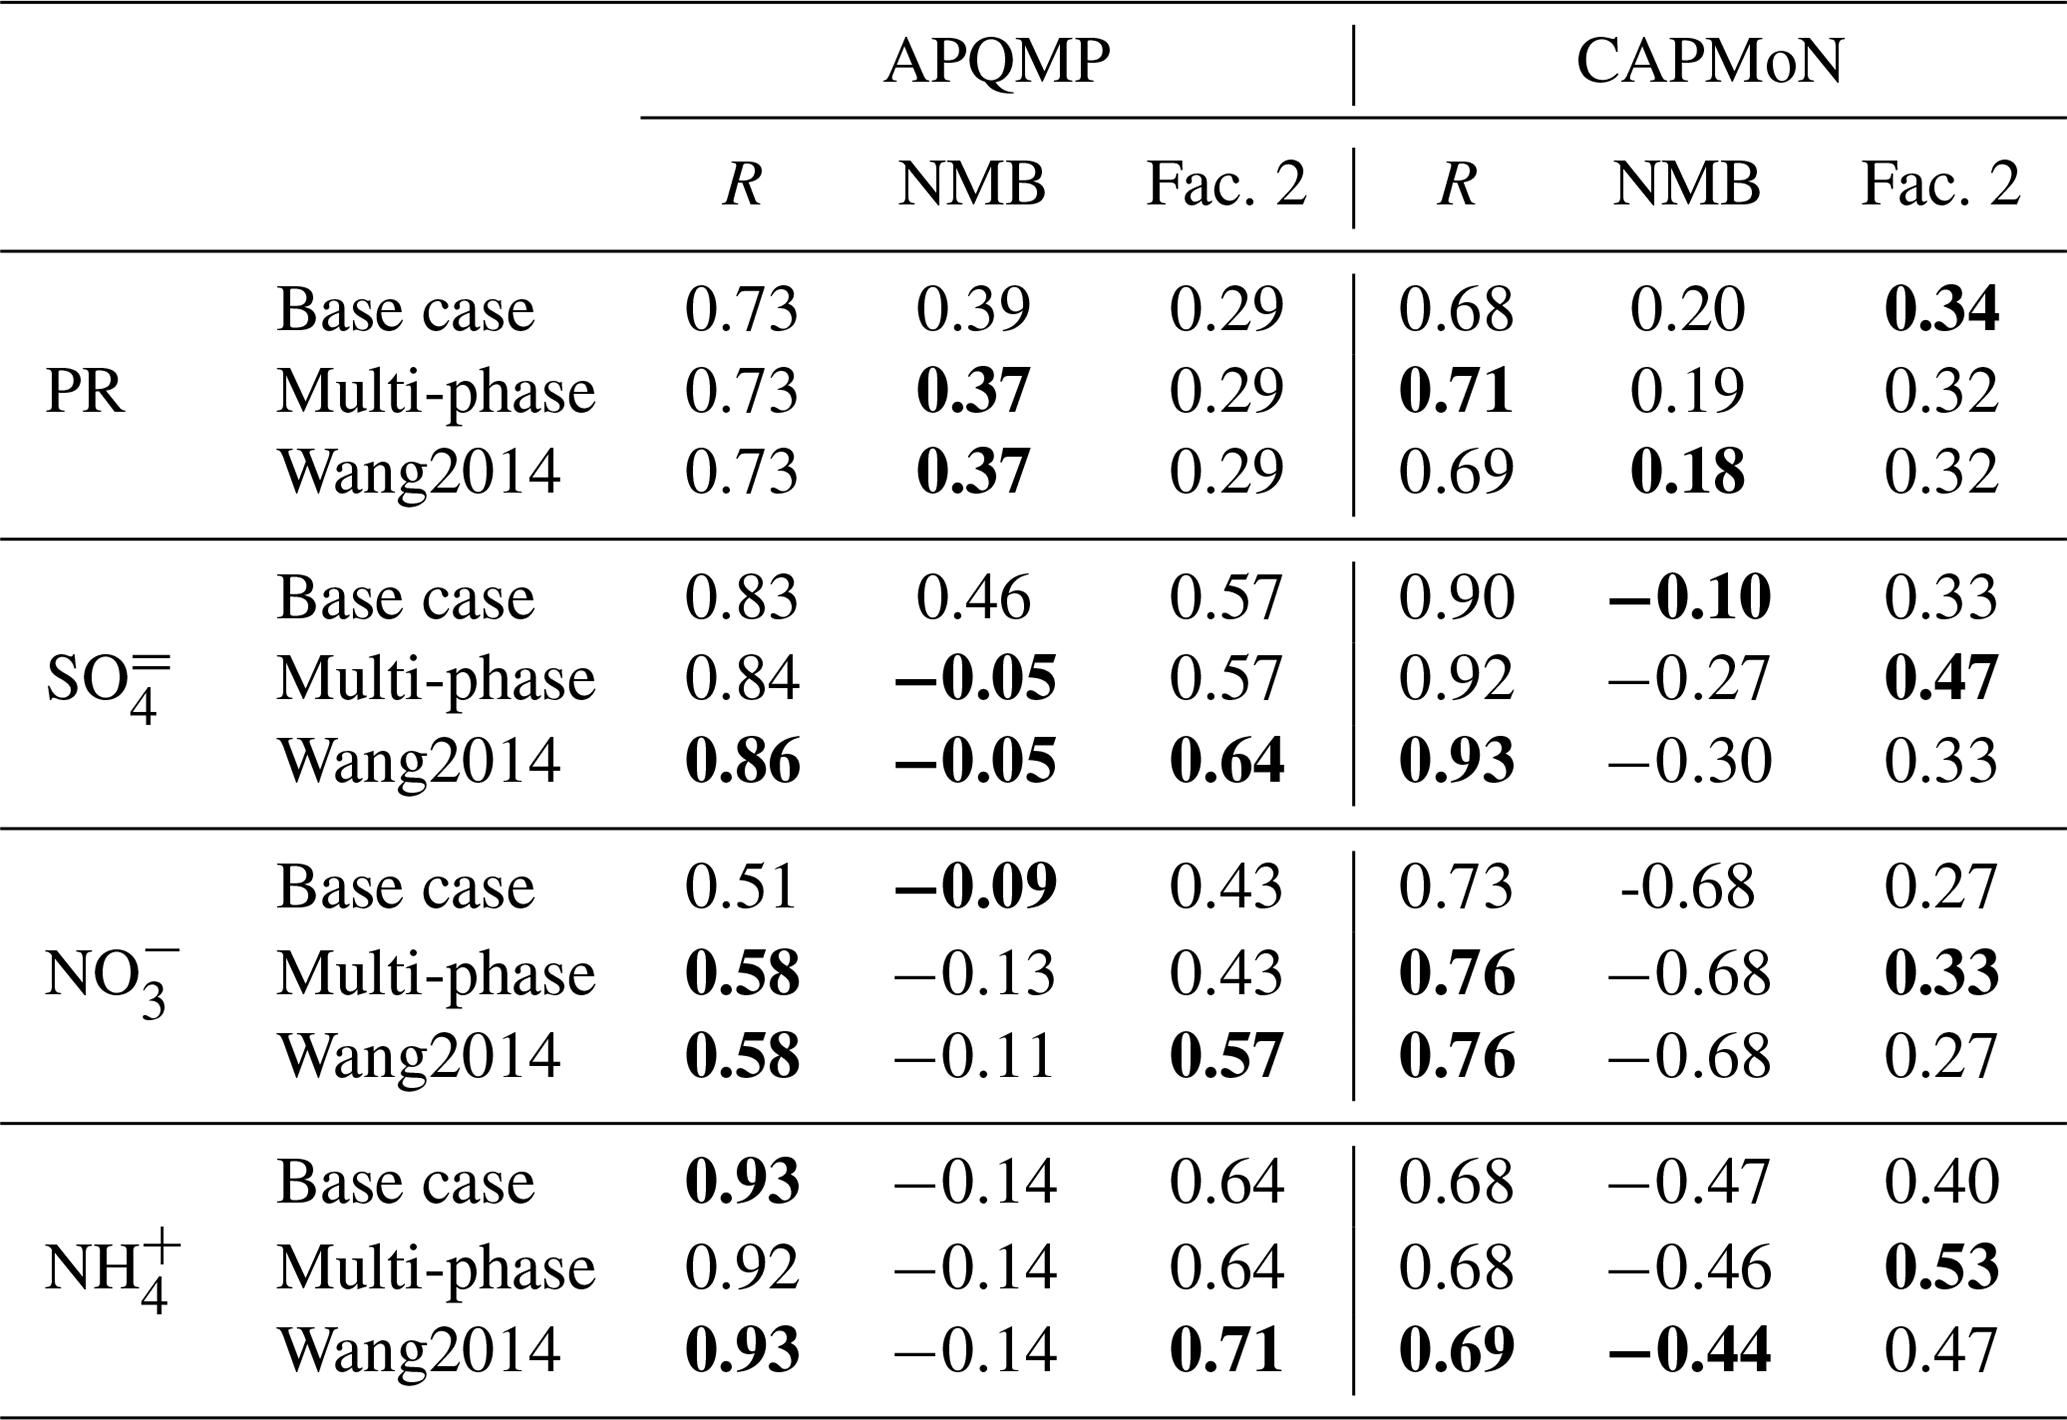
Table 1Performance scores for PR and deposited SO, NO and NH with the different scavenging approaches showing the comparisons between the measured and modeled precipitation amounts and wet deposition fluxes of SO, NO and NH. The highest scores are indicated in bold.
The comparison between the multi-phase and Wang2014 runs for April 2018 shows the impact of using different BCS parameterizations, i.e., Slinn1984 versus Wang2014 (Fig. 10). The corresponding 90 % confidence interval scores are shown in Fig. 11. Both formulations treat SO2 scavenging in the same manner; differences are associated only with particle scavenging methodology. The differences in wet deposition flux of HSO between the two runs are due in part to the response of the meteorological system to changes in CDNC location and amount and aerosol radiative properties (i.e., to the aerosols and meteorology feedbacks). Overall, the Wang2014 scheme has slightly lower HSO caused by the feedback in the model and mixed changes in SO, NO and NH. These changes are not significant (refer to the mean domain values in the figures captions). July 2018 plots (Figs. S3 and S4) show generally similar patterns to the April plots (Figs. 8 and 10) where the multi-phase and Wang2014 scheme are compared.
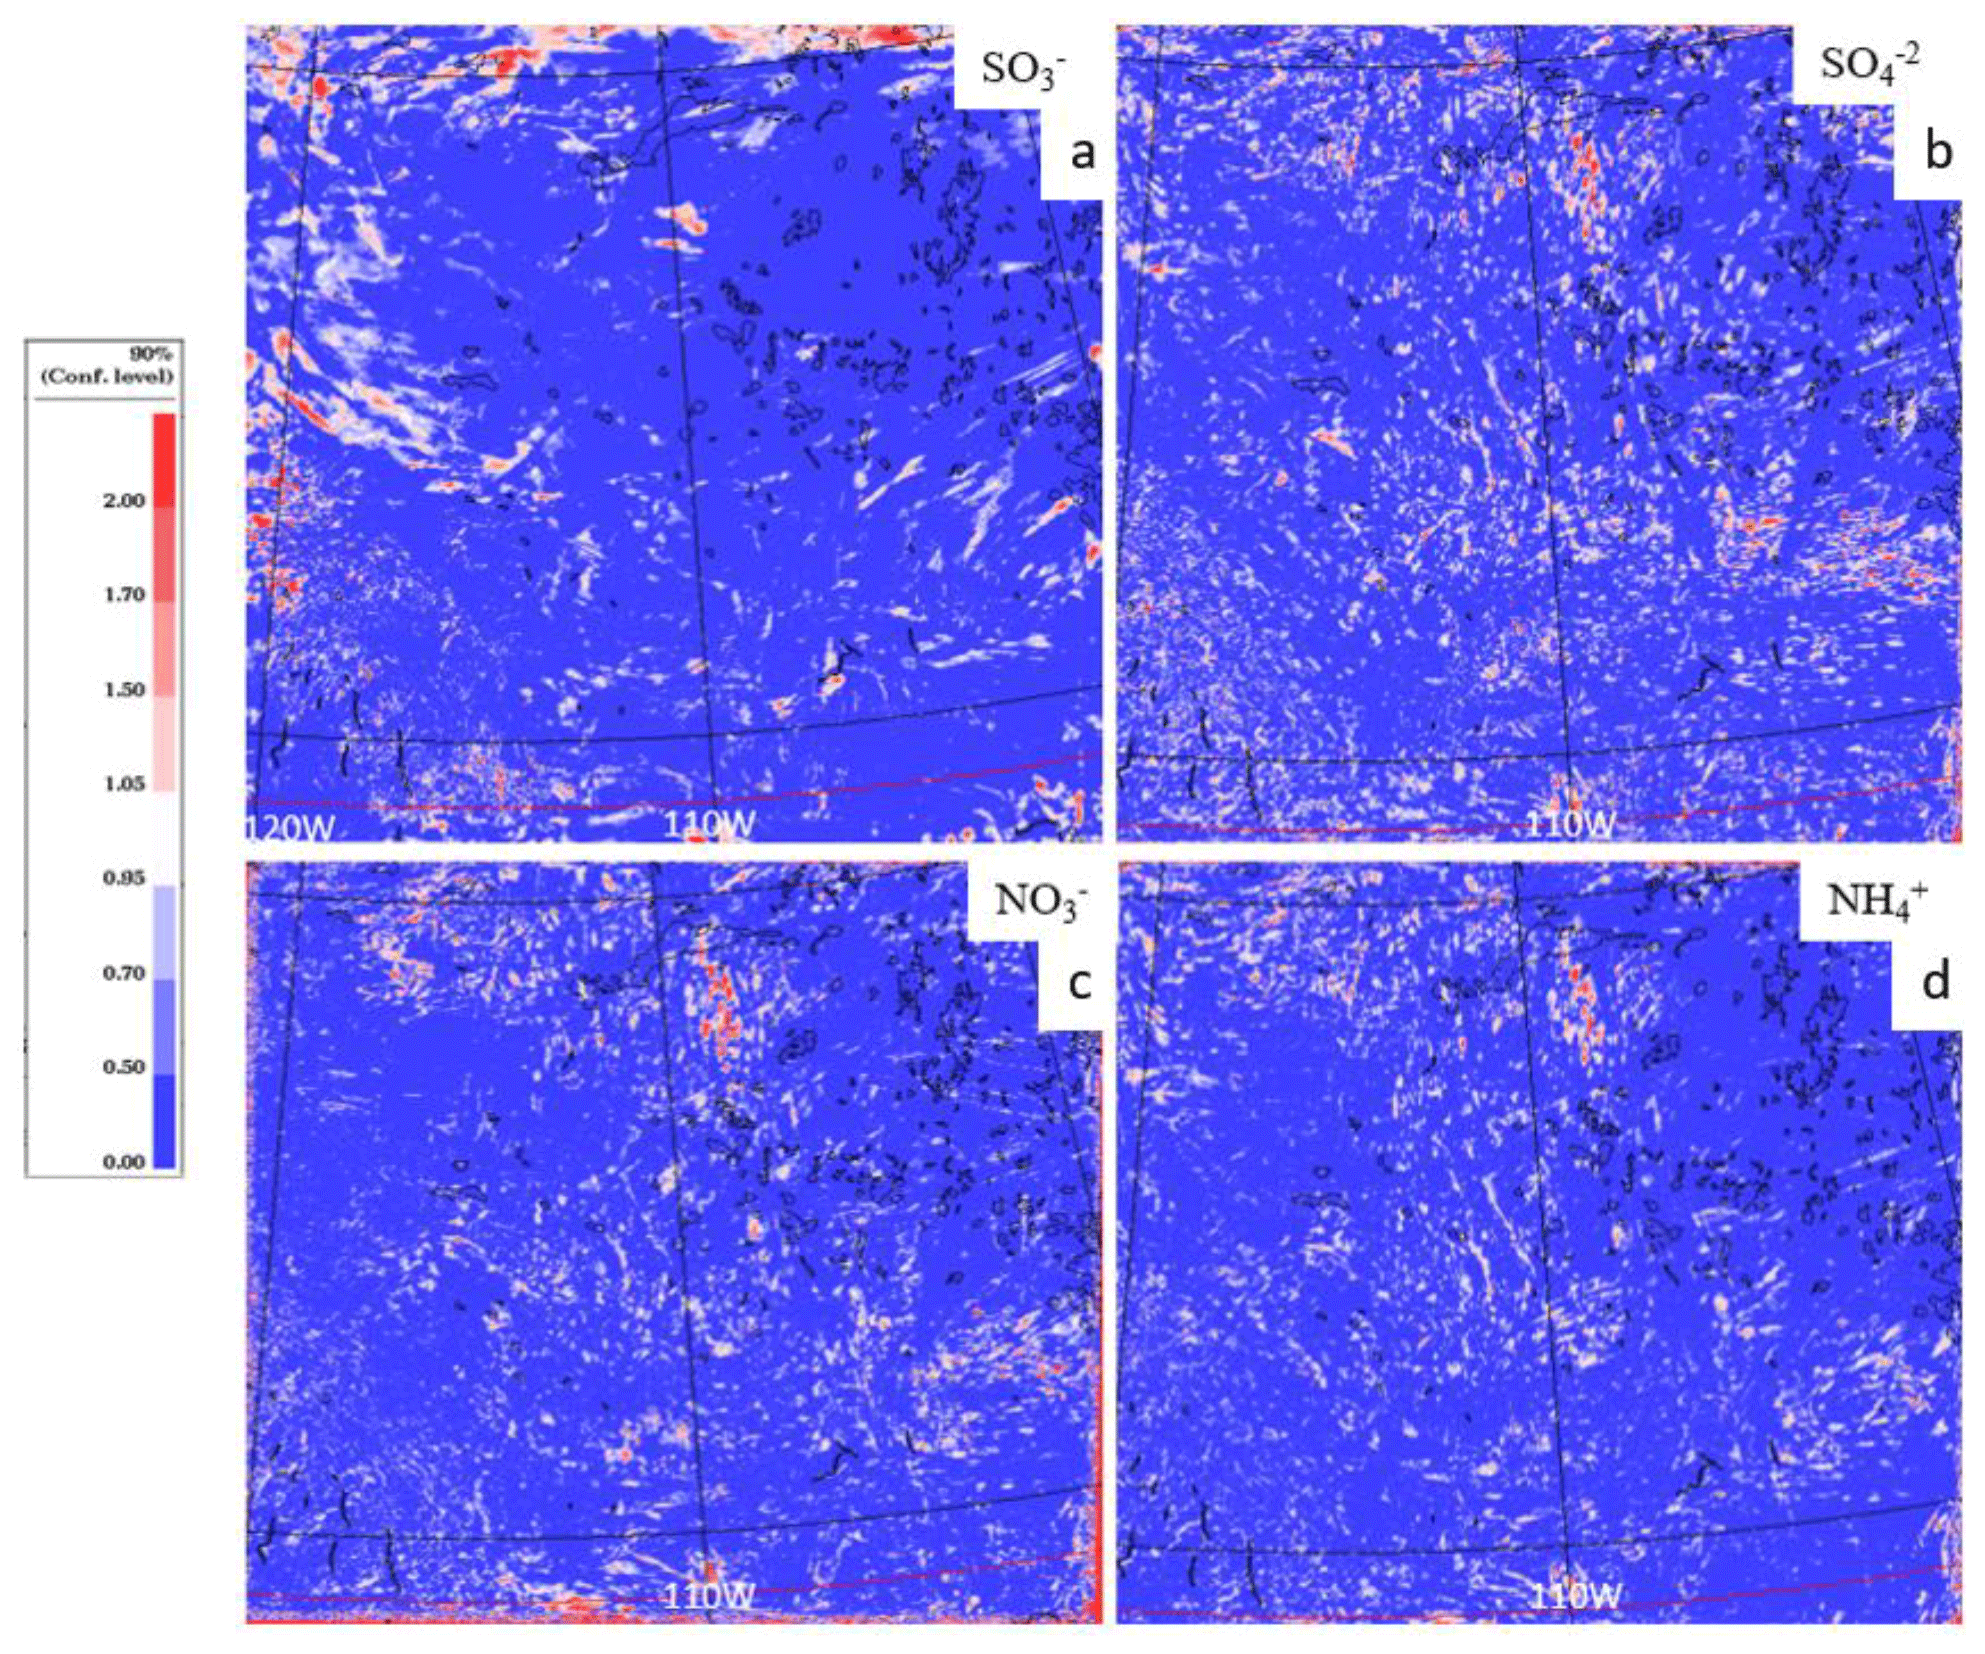
Figure 11The corresponding 90 % confidence interval scores for Fig. 10 (following Makar et al., 2021, the differences are significant at or above the 90 % confidence level when the score ≥1).
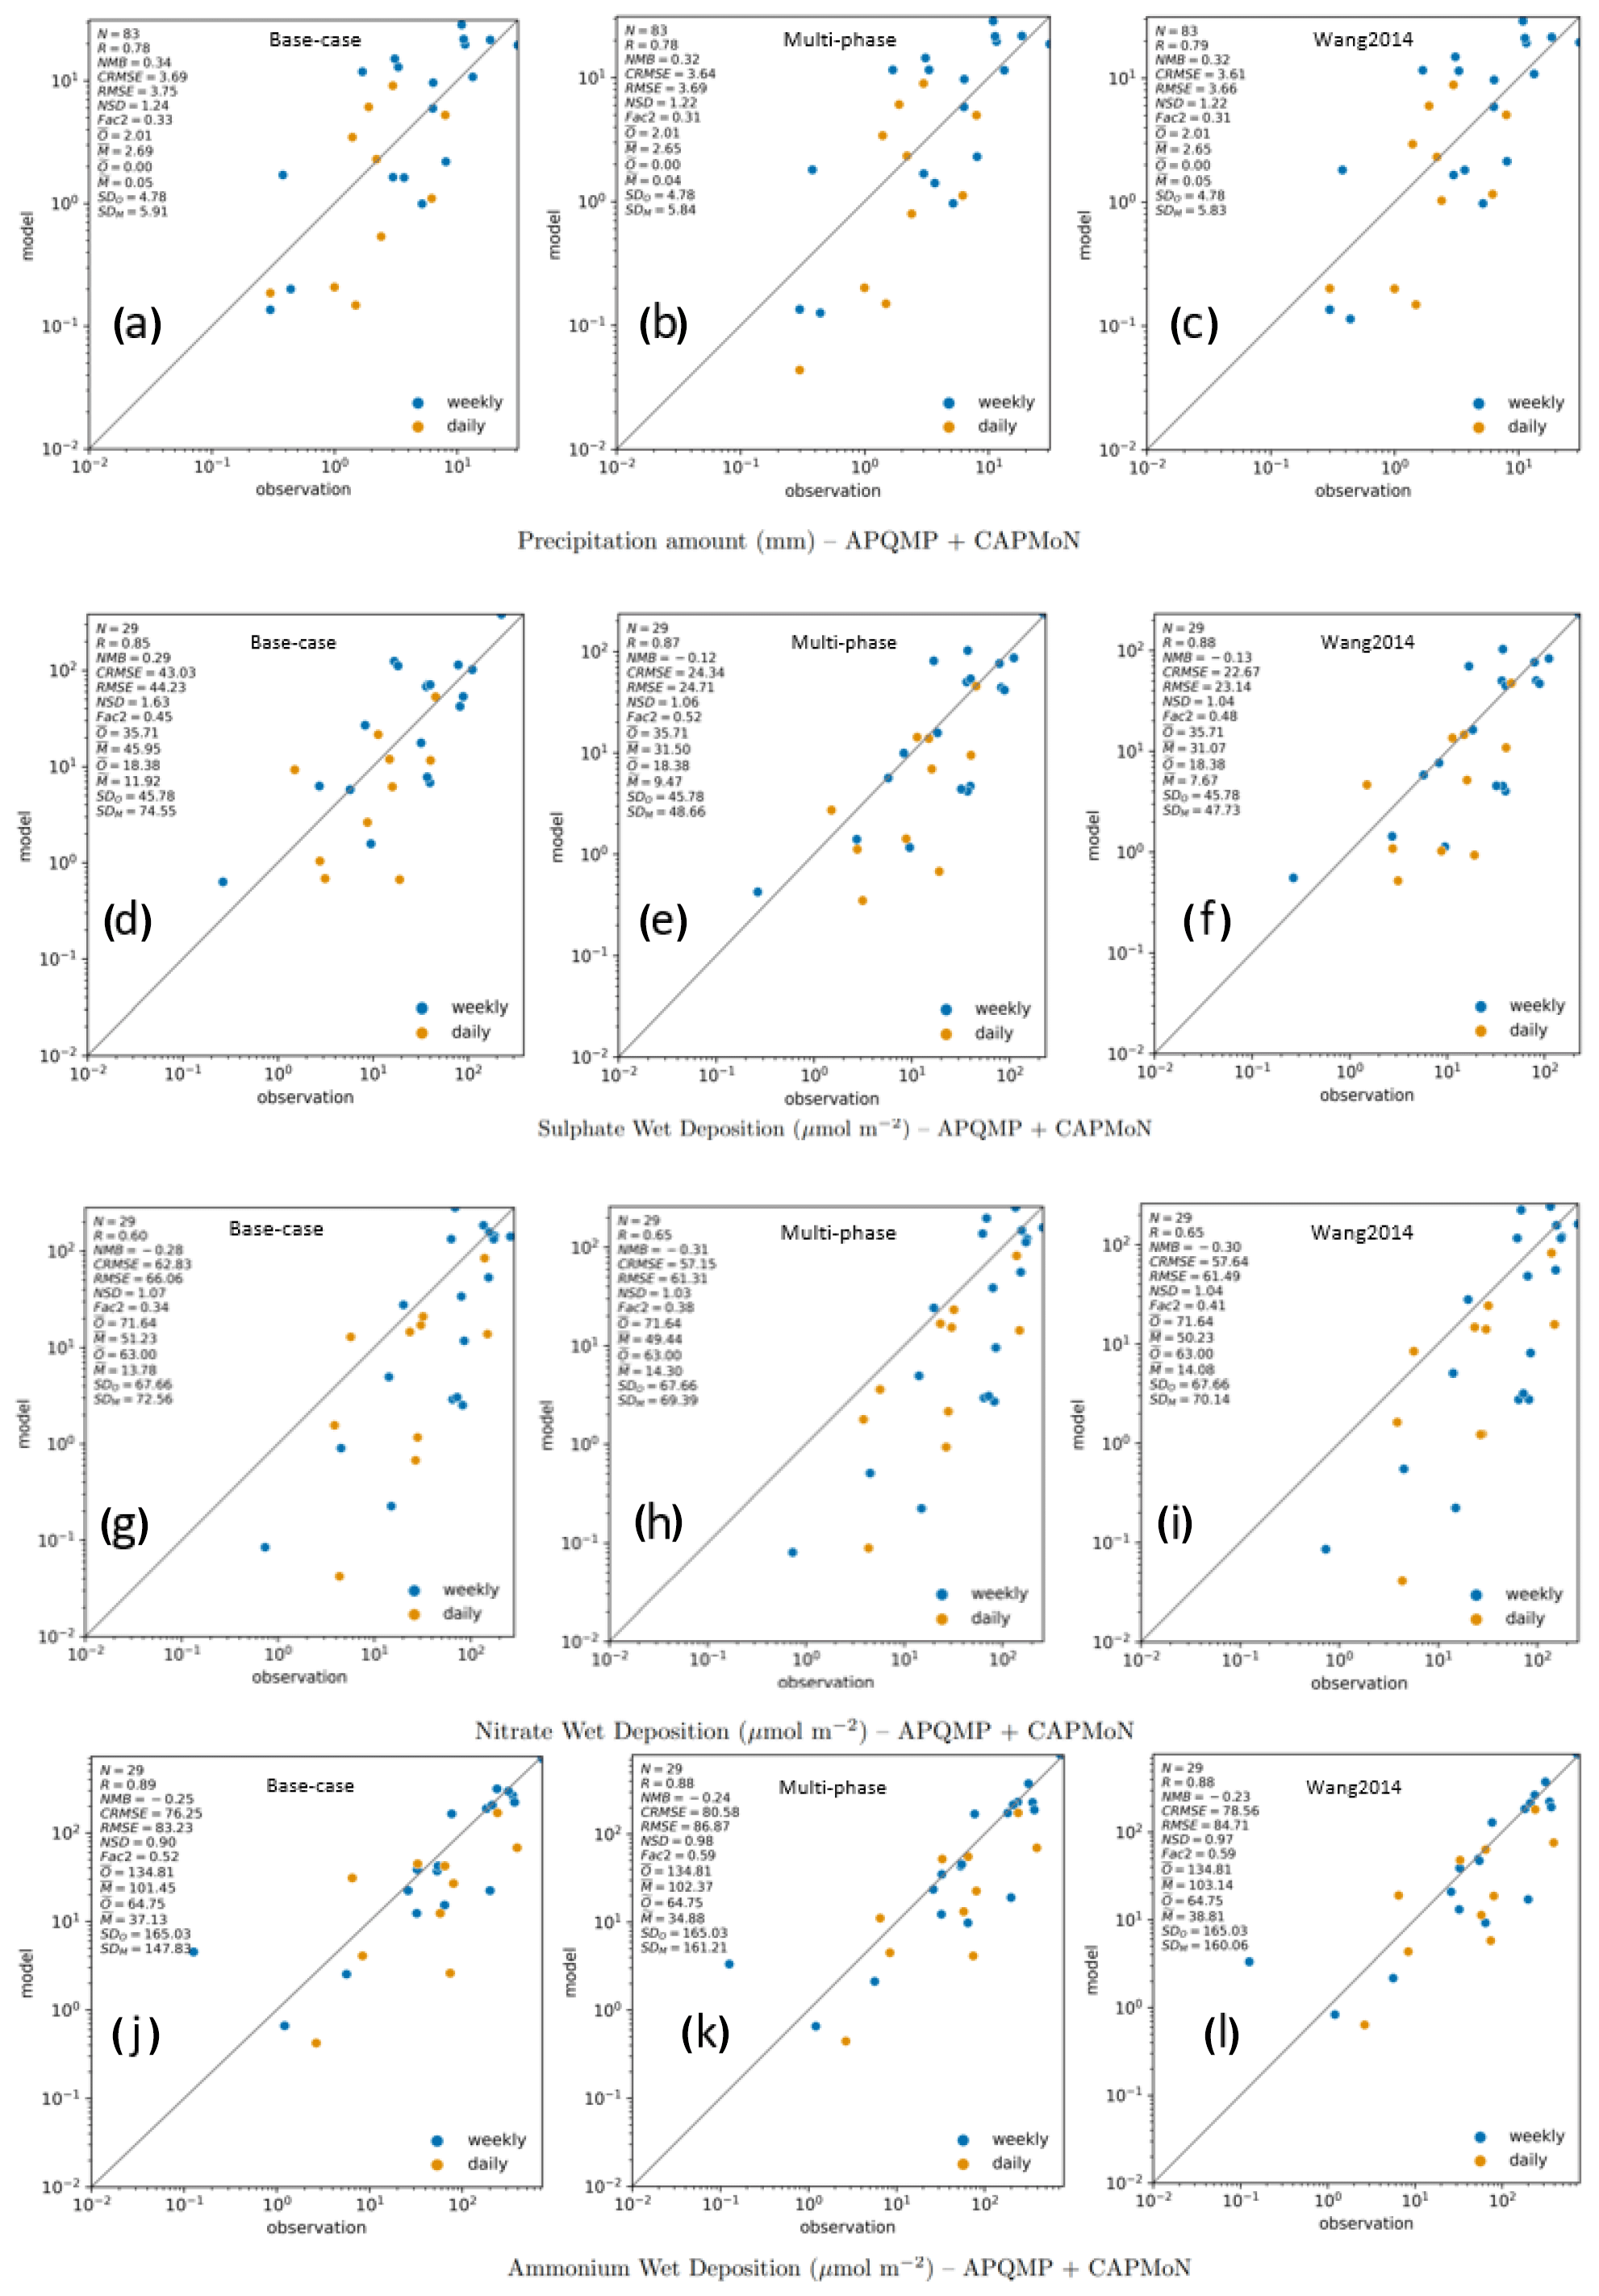
Figure 12Scatter plots for the precipitation amounts (a–c), SO (d–f), NO (g–i) and NH (j–l) wet deposition fluxes (µmol m−2) for April. The pairs given are CAPMoN and APQMP versus GEM-MACH simulations: base case versus observation (left panels), multi-phase versus observation (middle panels) and Wang2014 versus observation (right panels).
To illustrate the distinction between the Slinn1984 and Wang2014 schemes and to explain the differences shown in Fig. 10, the scavenging coefficients based on the domain averaged precipitation intensity from the two schemes are compared in Fig. S5. In Figure S5a (rain scavenging), two different schemes (Slinn1984 and Wang2014) have relatively similar scavenging coefficients during April, but the scavenging coefficients are more different during July, especially for aerosols at the size range of 0.1–1 µm. The lower scavenging of the Slinn's scheme can be explained by its lack of processes such as thermophoresis in the Greenfield gap, as discussed in Sect. 2.3. For snow scavenging, Fig. S5b shows a significant difference between the two schemes for particles smaller than 1 µm, the Wang2014 scavenging coefficient being considerably higher than Slinn1984. Given the fact that the solid precipitation is dominating in the April precipitation, we expect to see higher particle wet deposition fluxes by using Wang2014 than by using Slinn1984 scheme (refer to Figs. 2 and S1).
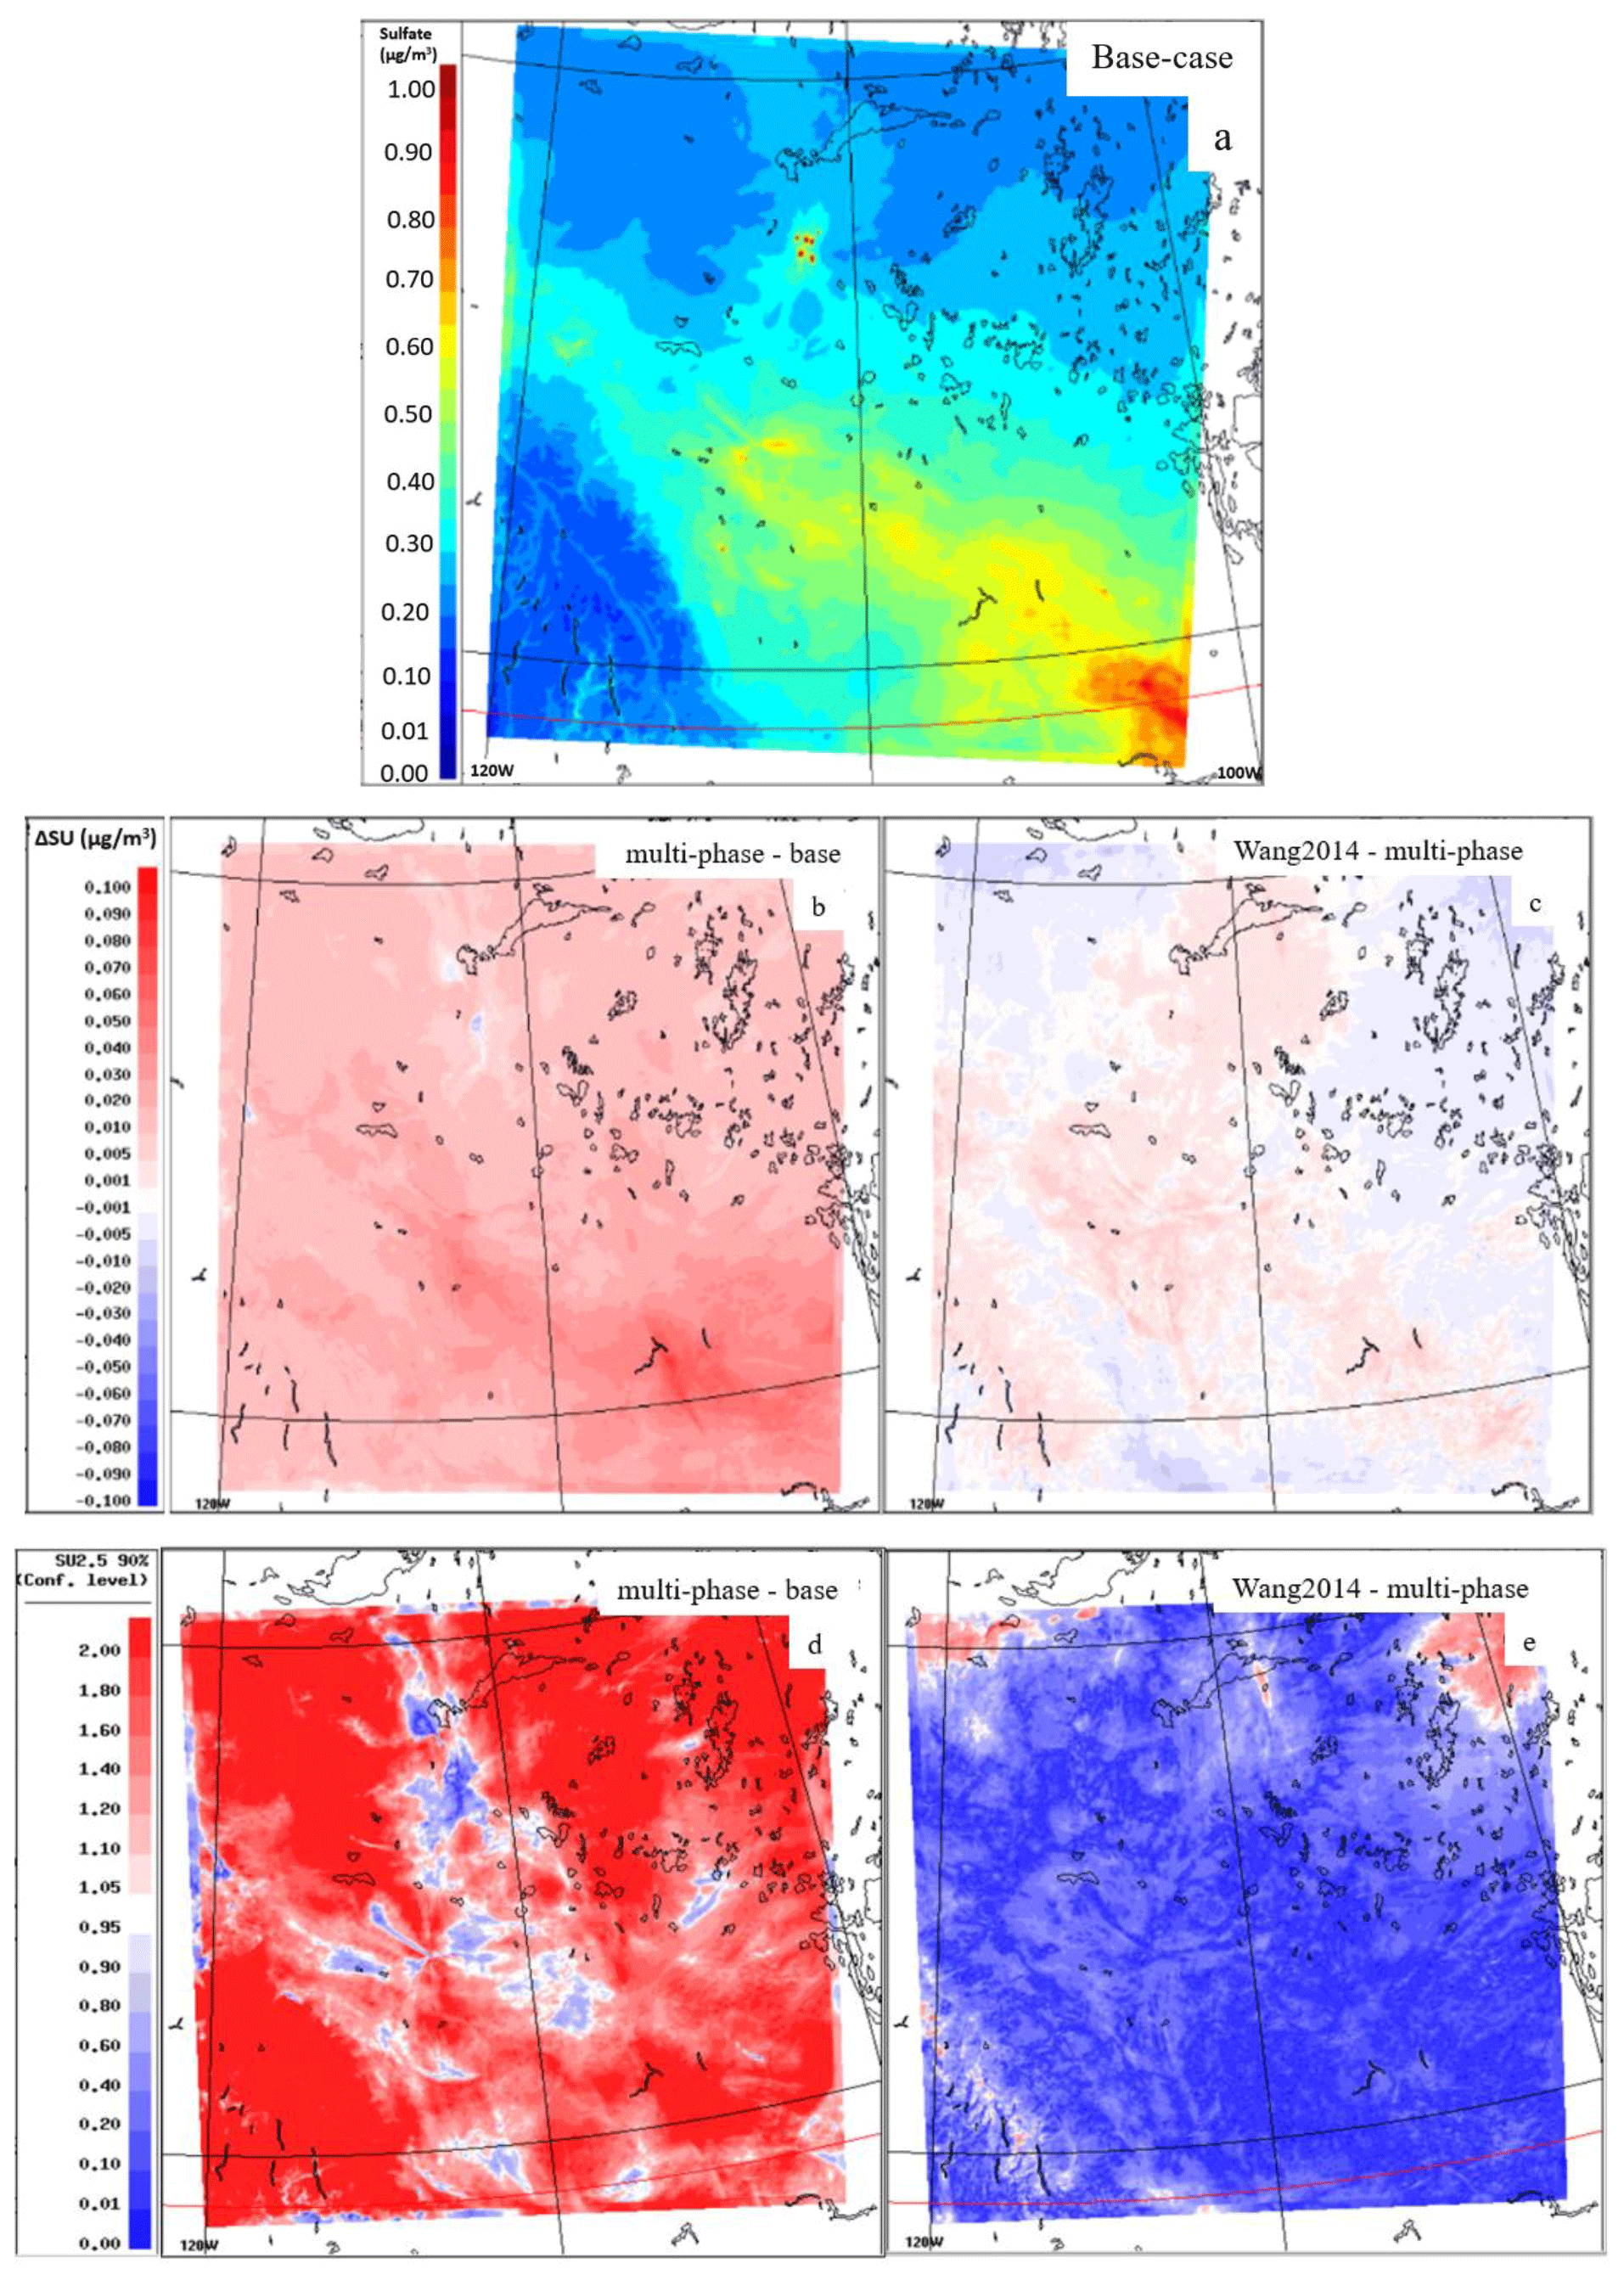
Figure 13April 2018 mean fine particulate sulfate (SU2.5) concentration near the surface (a). The net difference between multi-phase and base case (b) and the net difference between Wang2014 and multi-phase (c). The corresponding 90 % confidence interval scores are shown in the lower panels.
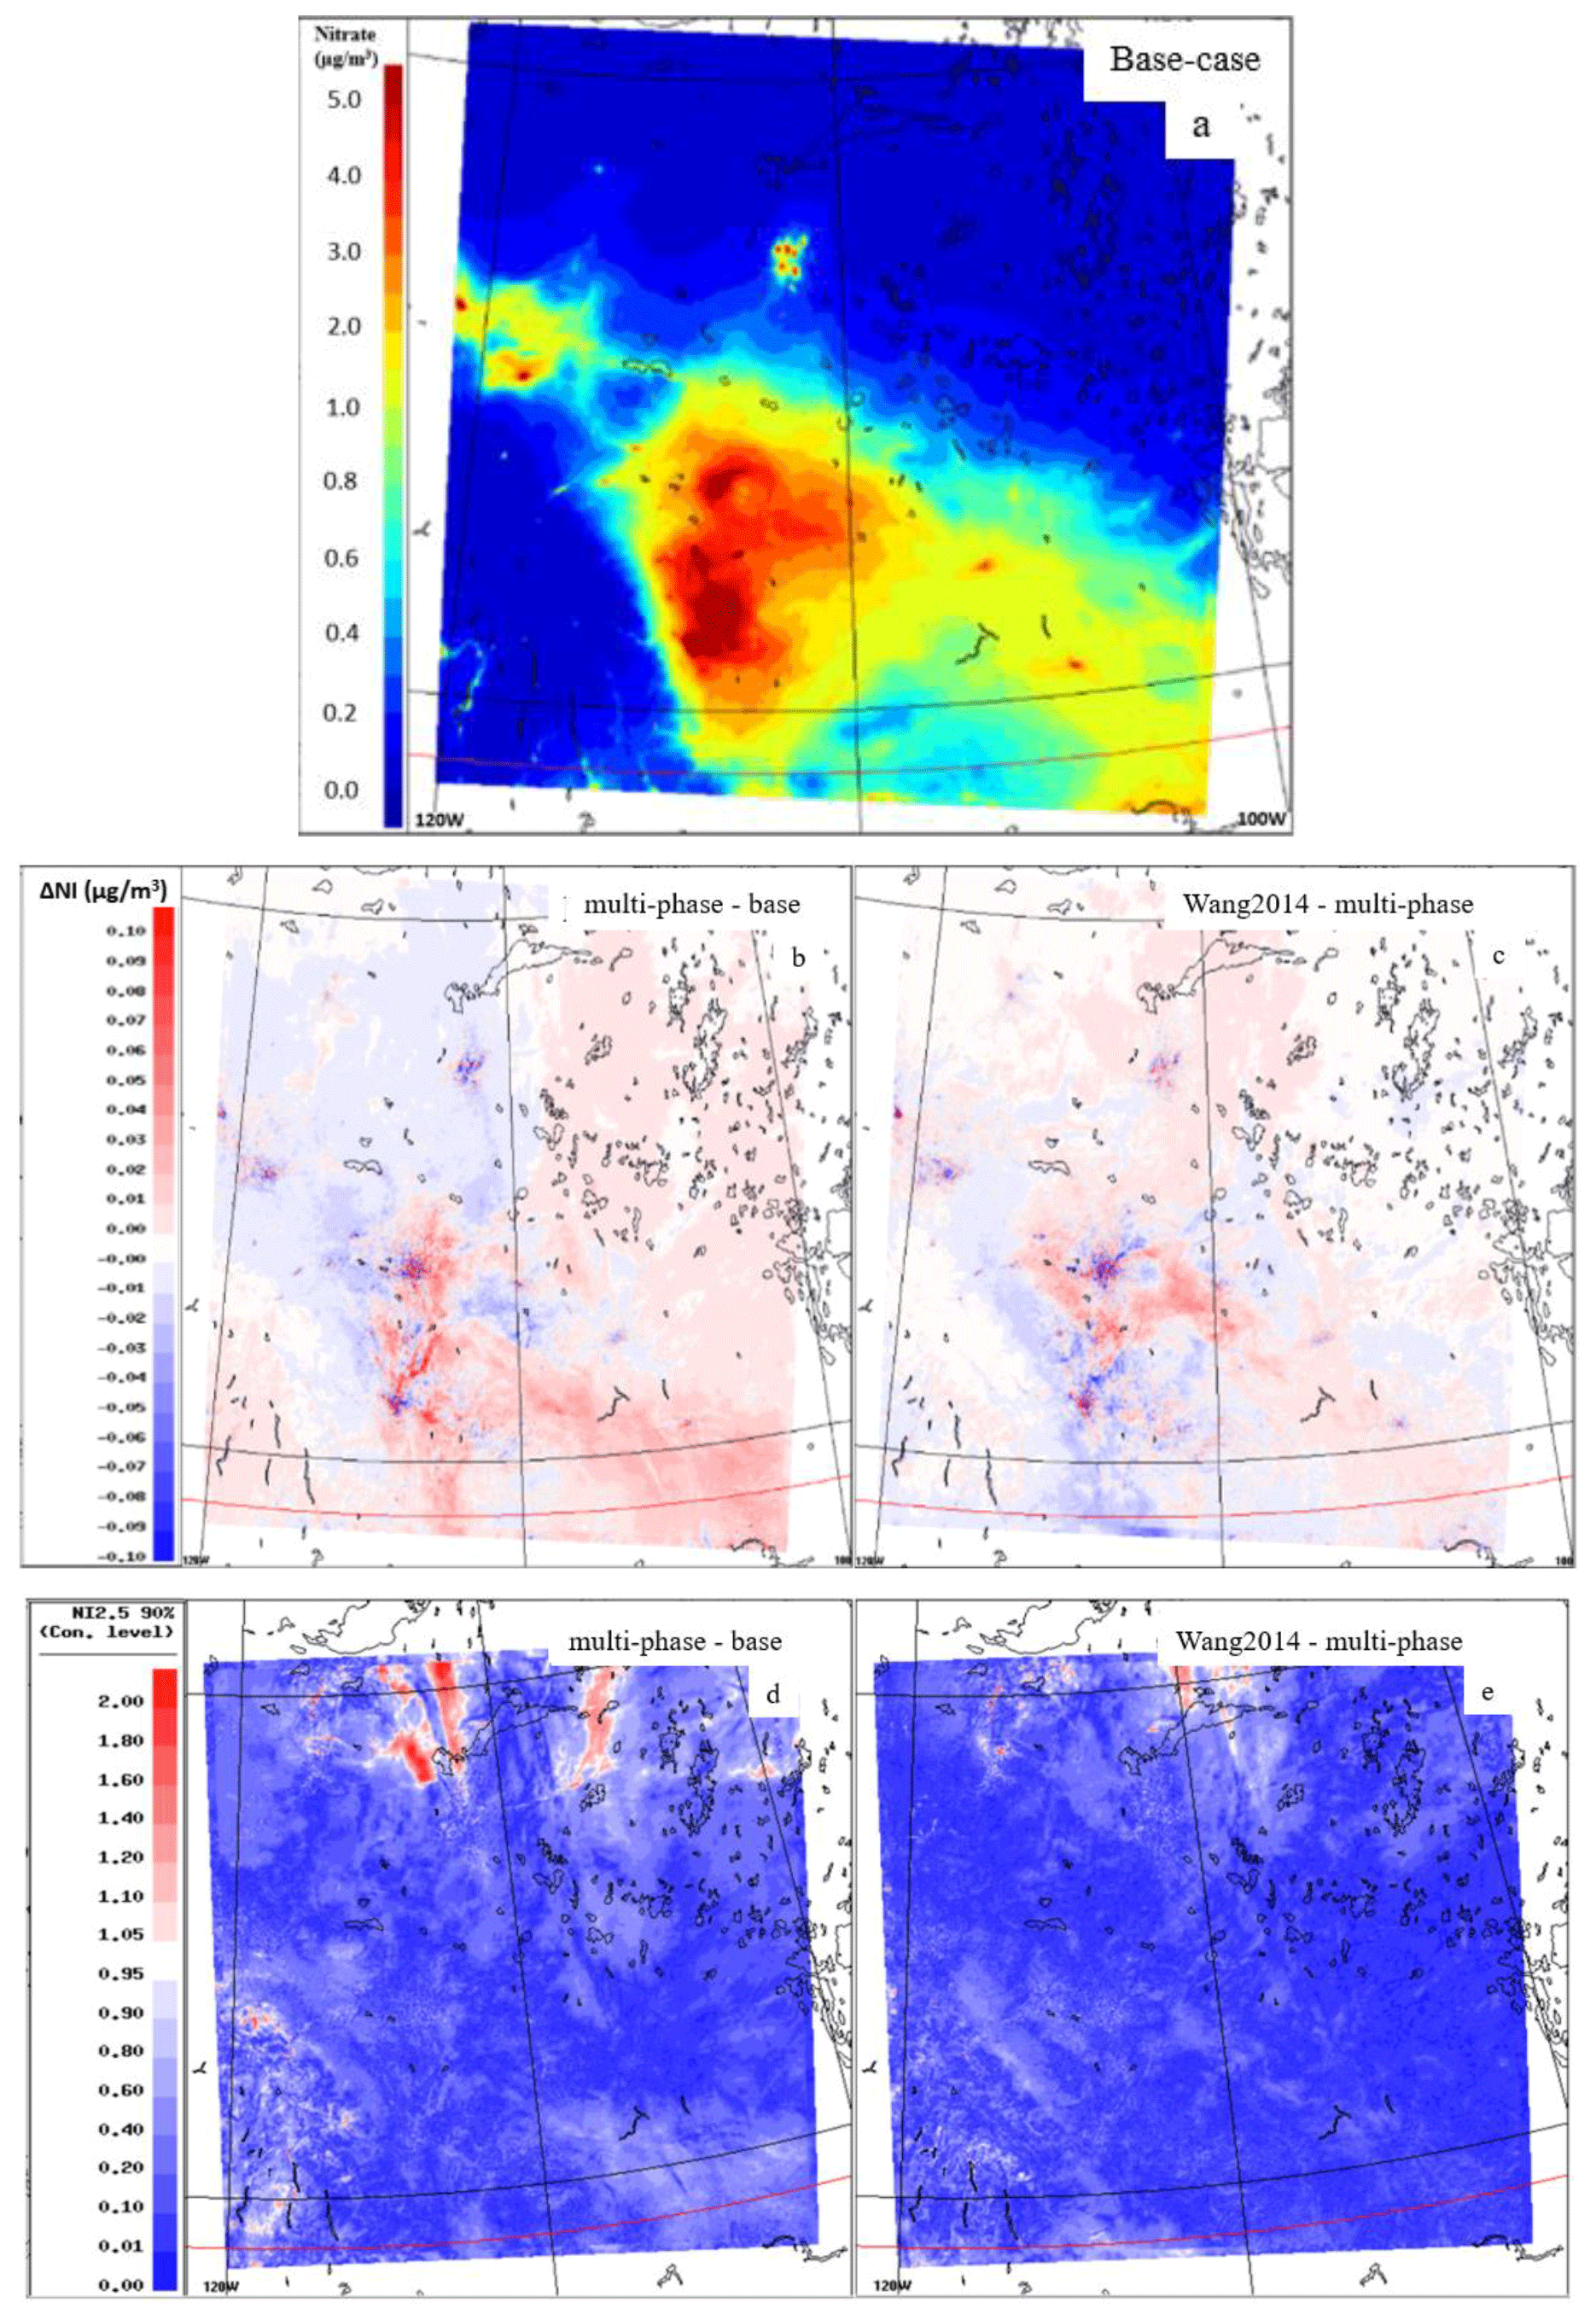
Figure 14April 2018 mean fine particulate nitrate (NI2.5) concentration near the surface (a). The net difference between multi-phase and base case (b) and the net difference between Wang2014 and multi-phase (c). The corresponding 90 % confidence interval scores are shown in the lower panels.
3.2 Comparison with observations (precipitation chemistry)
Figure 12 shows the comparisons between measured and modeled precipitation amounts and wet deposition fluxes of SO, NO and NH, from the three different GEM-MACH experiments (i.e., base case, multi-phase and Wang2014) for April. The statistical evaluations are also summarized in Fig. 12 for the model versus observation and in Table 1 for the model versus APQMP and CAPMoN sites. Sample collection occurred daily at CAPMoN sites and weekly at the APQMP sites separately (given the difference in sample collection frequency and protocols). GEM-MACH captures the precipitation events and amounts well. The precipitation partitioning and the Wang2014 scheme do not directly affect model simulation of precipitation values. Some changes (especially local changes) are expected due to the aerosol feedbacks included in the model; however, the different GEM-MACH experiments show relatively similar precipitation amounts overall (Fig. 12a–c and Table 1). The slight distinction between the precipitation amounts of three experiments is due to the feedbacks between modeled aerosols and cloud microphysics.
Comparison of the observed SO data with the simulation results (Fig. 12d–f), suggests an overall better agreement with observations by including the multi-phase partitioning, and further improvement in agreement associated with the use of the Wang et al. (2014) scavenging scheme. As shown in Table 1, the normalized mean bias (NMB) values of SO for the multi-phase and Wang2014 experiments are improved compared to the base case (from 0.46 to −0.05) due to precipitation partitioning, and the Wang2014 experiment has the best correlation (R=0.86, compared to 0.83 for base run and 0.84 for multi-phase) and the best factor 2 score (0.64, compared to 0.57 for both the base run and multi-phase experiment) at APQMP sites (Table 1). For the CAPMoN sites, the correlation values for SO are slightly better for the multi-phase and Wang2014 experiments (R=0.92 and 0.93); however, the NMB value is smaller for the base experiment (NMB = 0.10, compared to 0.27 and 0.30 for the other two runs). All of these NMB values are improved compared to the earlier study of Makar et al. (2018) using a previous version of GEM-MACH, wherein wet sulfate precipitation fluxes were biased high (the slope of the linear fit of 2.2), although the low bias for the base experiment suggests this overall improvement may be due to other changes aside from wet scavenging. The latter reference suggested the high bias may reflect an underestimation of the SO2 dry deposition flux closer to the oil sands sources, and a corresponding overestimation of in sulfate particles downwind. More recent work (Hayden et al., 2021) suggests that an underestimate in modeled SO2 dry deposition fluxes relative to observations may be due to previously missing impacts of co-deposition of base cations on surface pH and hence SO2 dry deposition velocity. Although CAPMoN and APQMP sites are located far from the oil sands SO2 emission sources; the plots seem to indicate a positive bias only in modeled S wet flux from the base case experiment at the APQMP sites, which has diminished in the other two experiments. Biases in S wet deposition were negative at the CAPMoN sites. We note that the current model emissions year (2018) has lower reported SO2 emissions than the 2013 emissions year simulated in Makar et al. (2018), though discrepancies between reported and satellite-derived SO2 emissions have been noted (McLinden et al., 2021). The current model version also has higher particle dry deposition velocities than in Makar et al. (2018), following Emerson et al. (2020), hence results in less particle sulfate being available for wet scavenging near the surface.
Overall, GEM-MACH estimates of wet deposited nitrogen are slightly biased low relative to observations. For both APQMP and CAPMoN, NO has better correlation values (R=0.58 and 0.76, respectively) for the multi-phase and Wang2014 experiments relative to the base case. GEM-MACH experiments have relatively similar statistical scores for the APQMP NH results, with the highest factor 2 value for the Wang2014 (Fac2 =0.71). CAPMoN NH shows slightly a better correlation (R=0.69) and a better NMB for the Wang2014 experiment.
Table 2Performance scores for the near-surface concentrations of speciated aerosols, sulfate, nitrate and ammonium in the 2.5 km domain compared with the daily NAPS observation data for April 2018.
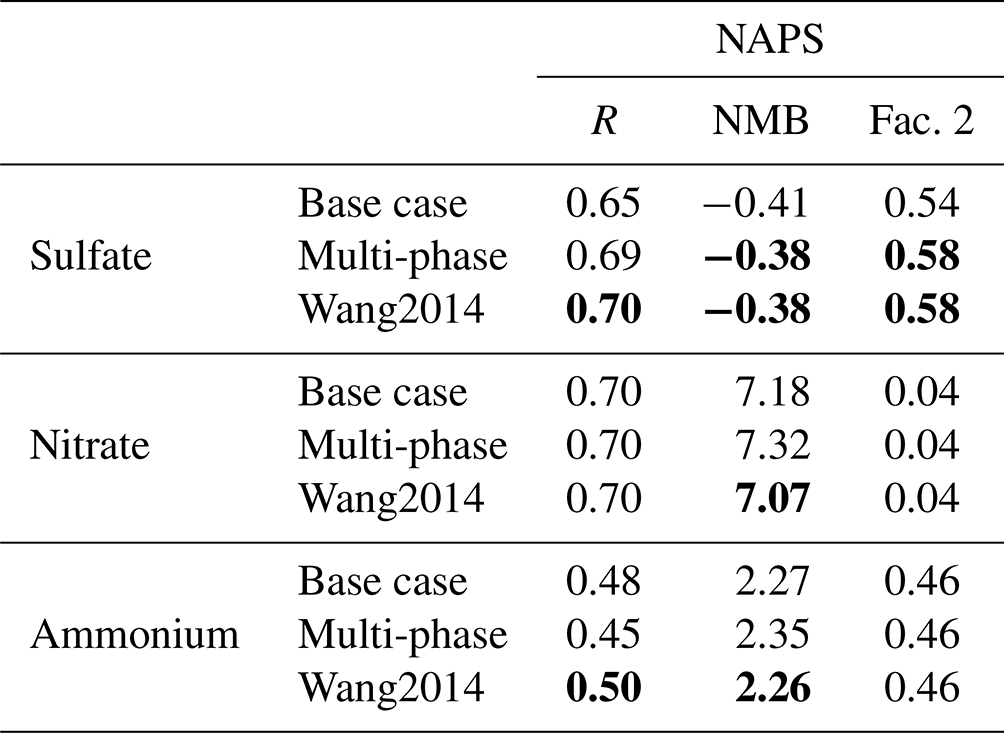
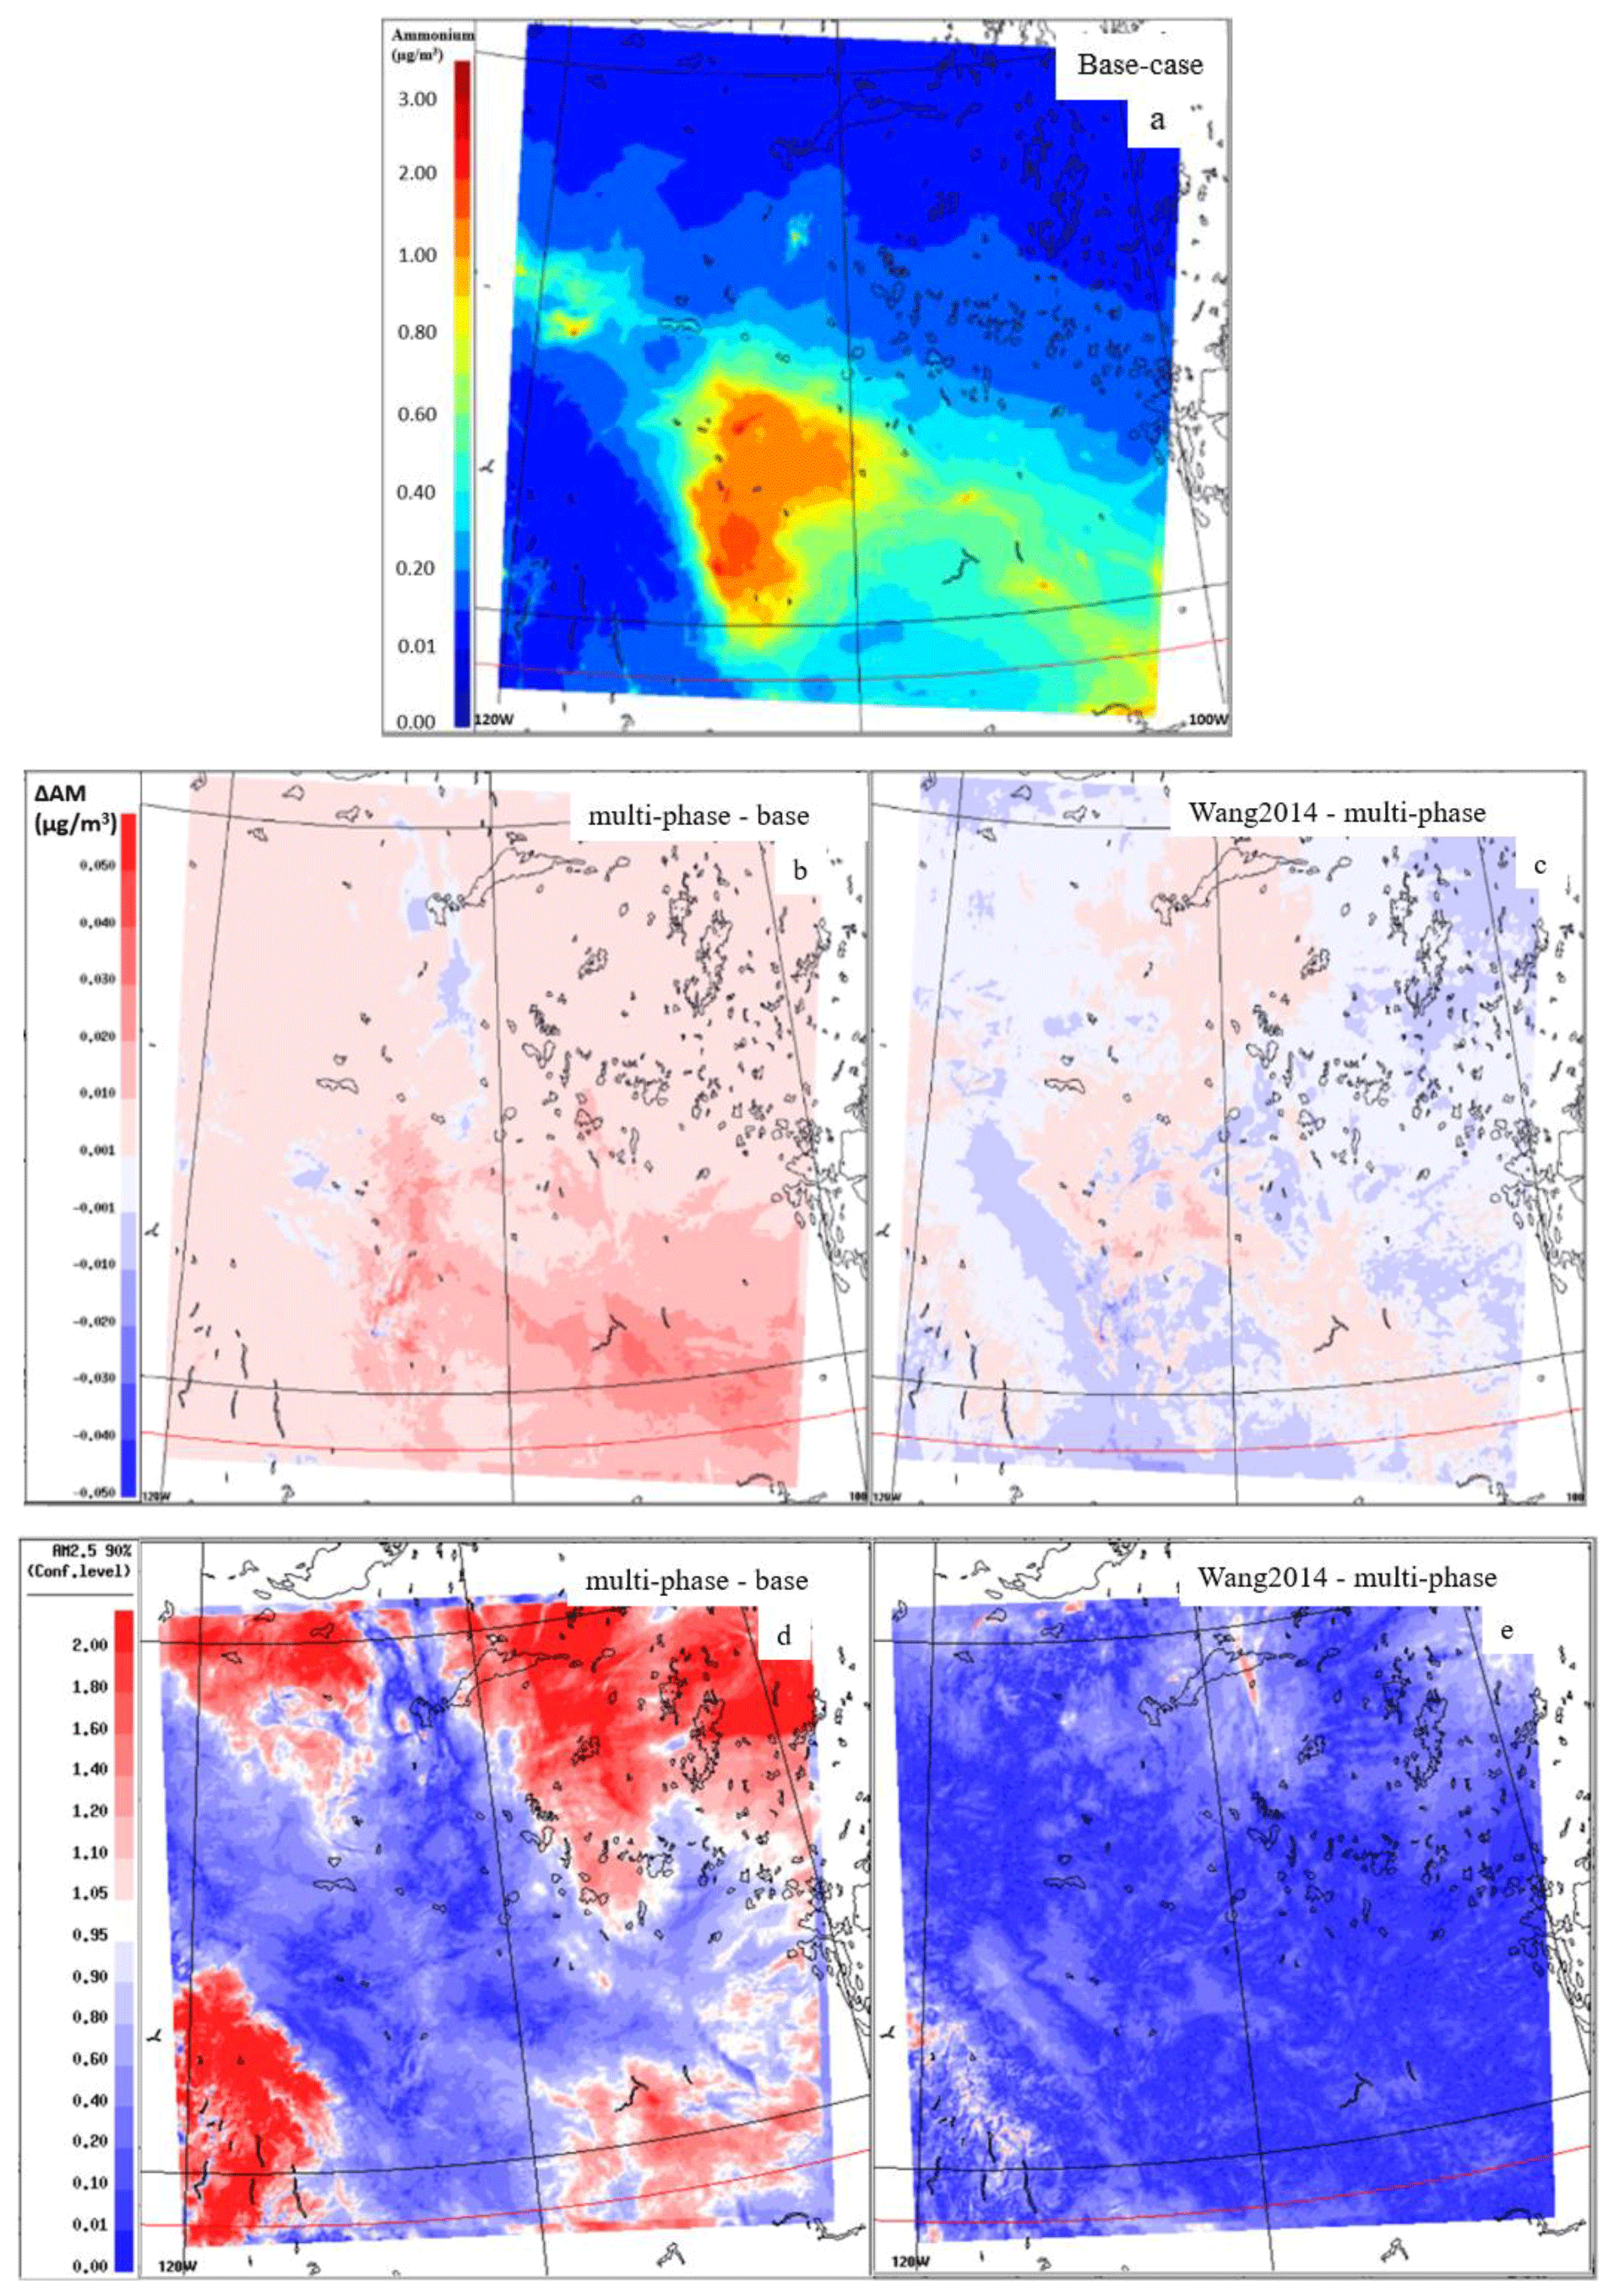
Figure 15April 2018 mean fine particulate ammonium (AM2.5) concentration near the surface (a). The net difference between multi-phase and base case (b) and the net difference between Wang2014 and multi-phase (c). The corresponding 90 % confidence interval scores are shown in the lower panels.
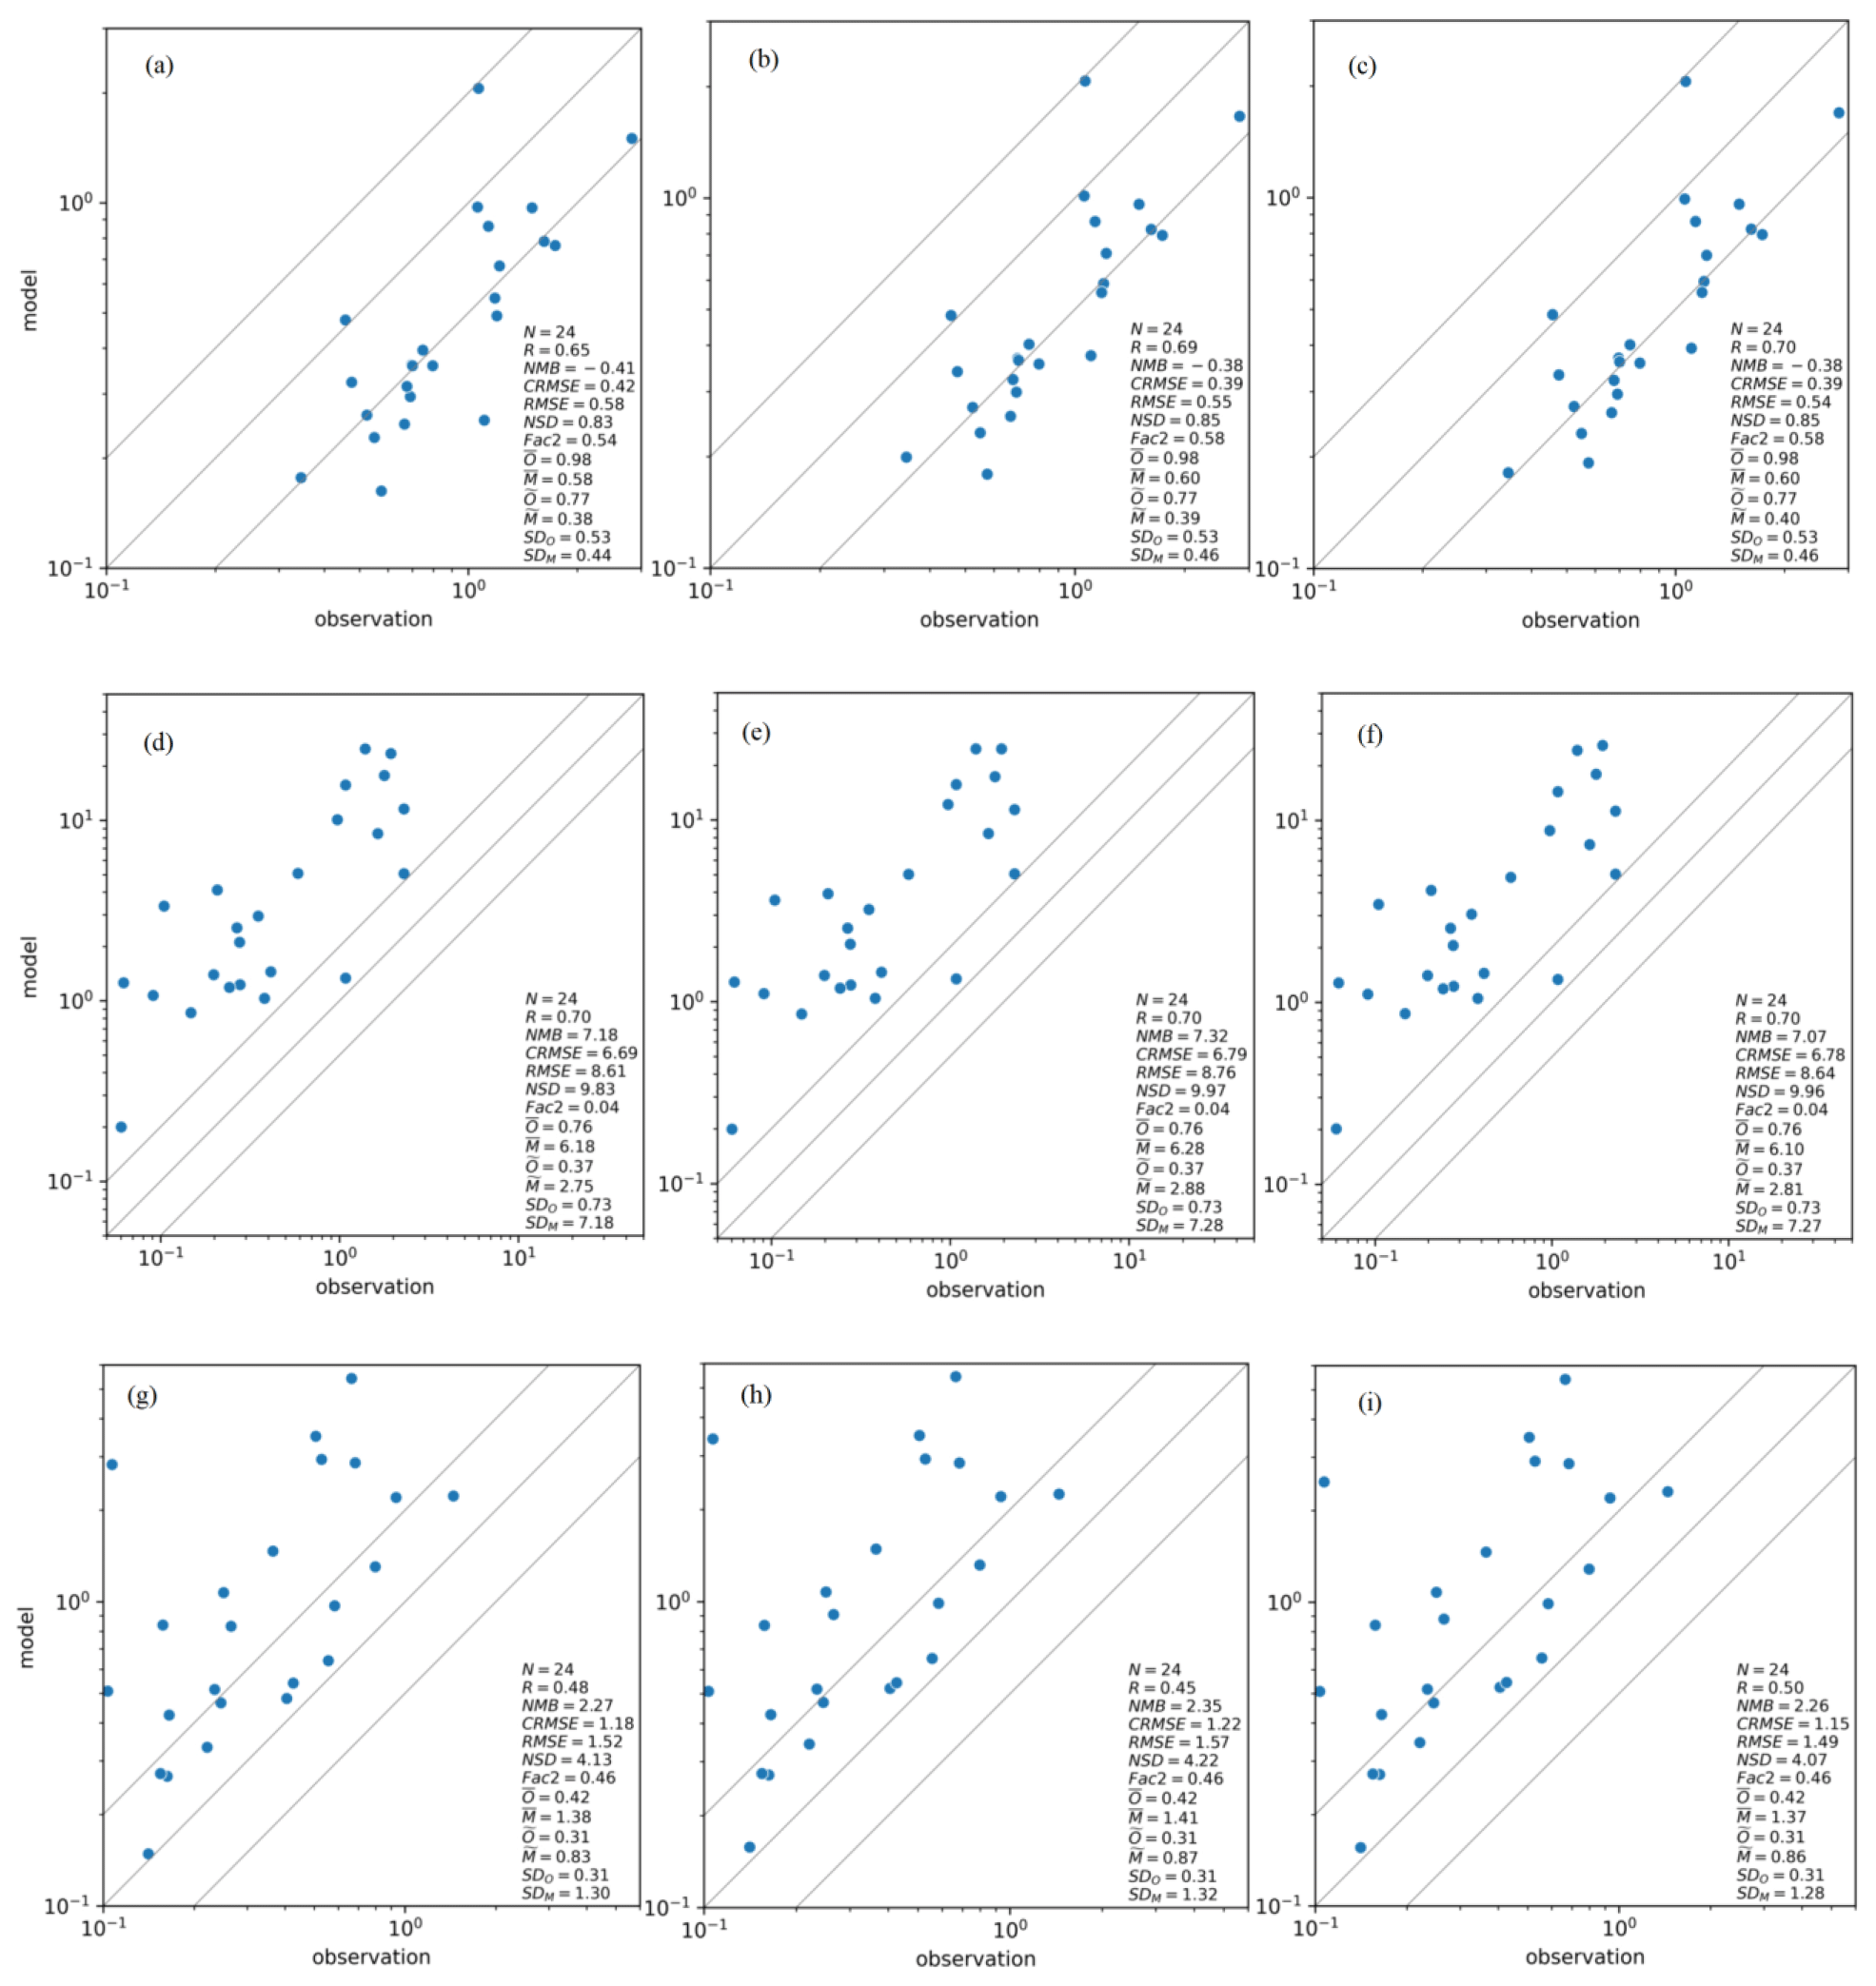
Figure 16GEM-MACH simulation results of speciated aerosols, sulfate (a–c), nitrate (d–f) and ammonium (g–i), compared with the daily NAPS observation data for April 2018. Base case (or Slinn, 1984 scheme) versus observation (a, d, g), multi-phase versus observation (b, c, h) and Wang2014 versus observation (c, f, i).
3.3 Comparison with speciated PM data (NAPS)
The impacts of partitioning and Wang2014 scavenging on modeled ambient concentrations of speciated PM2.5 (sulfate (SU), nitrate (NI) and ammonium (AM)) near the surface for April 2018 are shown in Figs. 13, 14 and 15, respectively. The upper panels are the April mean of SU2.5, NI2.5, and AM2.5 for the base case; the middle left panels show the net difference between multi-phase and base-case Slinn1984 experiments; and the middle right panels show the net difference between Wang2014 and multi-phase experiments. Corresponding 90 % confidence interval scores for the difference plots are shown in the lower panels. Multi-phase partitioning leads to a higher modeled concentration of particulate sulfate in the atmosphere, and the increases are statistically significant at the 90 % confidence level. For particulate nitrate, partitioning leads to both increased and decreased concentrations, depending on location. However, based on the confidence level panels, the overall increase in particulate nitrate over the OS source area and downwind is not significant at the 90 % confidence level. For particulate ammonium, the increase in the concentration associated with the partitioning approaches is the dominant change over the entire region, while a decrease occurs near the oil sands emissions sources.
Figure 16 and Table 2 show GEM-MACH simulation results of speciated aerosols in the 2.5 km domain compared with the daily NAPS observation data for April 2018. For particulate sulfate, both multi-phase and Wang2014 experiments have lower NMB compared to the base case, and the correlation value is improved for the Wang2014. Particulate nitrate model outputs show almost the same statistical evaluation results for all three experiments, and the correlation between the measured and model using Wang2014 scheme is the highest for the ammonium. Overall, the results show enhanced performance in the multi-phase experiment particularly over the source area and downwind. Model simulations making use of Wang2014 show mostly enhanced performance over OS facilities area and downwind and a reduction over the area upwind of the OS, and these results are consistent with the changes in the wet scavenging.
To examine cloud processes and precipitation chemistry, we considered the co-existence of multi-phase precipitation, as predicted by the GEM microphysics, in GEM-MACH's BCS representation. Further, we implemented a new aerosol BCS scheme (Wang et al., 2014) and compared it with the GEM-MACH's existing scavenging scheme, based on Slinn (1984). An accurate representation of the precipitation phase is important in modeling the wet scavenging of atmospheric tracers, particularly in cold environments. Considering the coexistence of multi-phase precipitation in BCS has a more consistent impact on the precipitation scavenging of SO2. Here we have noted overall improvements in model performance based on the model–observation performance scores associated with multi-phase partitioning and in comparison to wet deposition evaluations carried out in the region in previous work (Makar et al., 2018). For example, the multi-phase approach resulted in the most significant improvement in modeled SO wet deposition flux over Alberta (at APQMP sites, reducing NMB from 0.46 to −0.05), as well as improvement in modeled ambient particulate sulfate concentration at NAPS sites.
As shown in this study and other existing studies, there is a considerable uncertainty in the various existing parameterizations for BCS of aerosol particles. Of the two schemes examined, the Slinn (1984) parameterization is theoretically based and lacks representation of several physical processes involved in the particle scavenging by falling hydrometeors (such as thermophoresis and diffusiophoresis). The Wang et al. (2014) scheme is based on a semi-empirical approach and implicitly accounts for electrostatic forces, which are shown to be more important than diffusiophoresis in Jones et al. (2022). This scheme provided an overall best fit to an ensemble of existing models, although there is still a significant disparity between the scavenging coefficients based on Wang et al. (2014) and some of the observation-based scavenging coefficients (e.g., Jones et al. 2022). The resulting scavenging coefficients from the two schemes (Slinn1984 and Wang2014) show the greatest difference for aerosol sizes between 0.1 to 1 µm, particularly at high precipitation intensity. For the solid precipitation at lower intensity, the two schemes diverge for aerosols smaller than 1 µm, while at higher precipitation intensities the two schemes show higher disparity for aerosols larger than 1 µm. This resulted in the varied differences in modeled wet deposition (April – winter, July – summer), and an especially high Wang2014 scavenging coefficient for particles smaller than 1 µm during April and higher particle wet deposition fluxes from using Wang2014 than using Slinn1984.
The model evaluation against observations (precipitation chemistry and ambient air concentration of speciated PM) seems to indicate that the use of Wang2014 parameterization along with the consideration for co-existence of multi-phase precipitation results in the best scores overall, with the most significant improvement from the multi-phase partitioning in BCS. The multi-phase partitioning and Wang2014 scheme improve the comparison between observation and modeled results. Comparison of the SO data from the APQMP sites with the simulation results suggests better agreement by including the multi-phase partitioning and further improvement in agreement associated with the Wang et al. (2014) scavenging scheme. GEM-MACH estimates of wet deposited nitrogen are biased slightly low, and the simulated results improve by adding the partitioning and Wang2014 scheme (relative to the base case). GEM-MACH experiments have relatively similar statistical scores for NH results. Including the partitioning and Wang2014 scavenging impacts the modeled ambient concentration of speciated PM2.5 (sulfate, nitrate and ammonium). It leads to improvements in the model performance scores, with higher modeled concentration of particulate sulfate, and both increase and decrease in particulate nitrate concentration – with an overall increase over, the OS source area and downwind. For particulate ammonium, the increase in the concentration is the dominant change over the entire region.
The GEM-MACH code can be downloaded from the following Zenodo site: https://doi.org/10.5281/zenodo.10563851 (Ghahreman, 2024). GEM-MACH model output data are available via email request from Roya Ghahreman: roya.ghahreman@ec.gc.ca. The model output requires a large amount of storage space and is in a binary format specific to Environment and Climate Change Canada's modeling systems. Conversion to other formats may be possible upon request via email.
The supplement related to this article is available online at: https://doi.org/10.5194/gmd-17-685-2024-supplement.
WG and RG designed the study. RG implemented the new scavenging scheme in the model, ran the experiments, and analyzed the output under the supervision of WG and PM and with assistance from AL, CL and AA. AC and KB provided the measurement data. RG prepared the paper with contributions from all co-authors.
The contact author has declared that none of the authors has any competing interests.
Publisher's note: Copernicus Publications remains neutral with regard to jurisdictional claims made in the text, published maps, institutional affiliations, or any other geographical representation in this paper. While Copernicus Publications makes every effort to include appropriate place names, the final responsibility lies with the authors.
This work was funded under the Oil Sands Monitoring (OSM) Program. It is independent of any position of the OSM Program.
This research has been partially supported by the Oil Sands Monitoring (OSM) Program, Integrated Atmospheric Deposition Monitoring project (A-PD-6).
This paper was edited by Samuel Remy and reviewed by two anonymous referees.
AAF: Alberta Agriculture and Forestry, Alberta Climate Information Service (ACIS), https://agriculture.alberta.ca/acis (last access: 25 January 2024), 2022.
Abdul-Razzak, H. and Ghan, S. J.: A parameterization of aerosol activation, 3, Sectional representation, J. Geophys. Res., 107, 4026, https://doi.org/10.1029/2001JD000483, 2022.
Andronache, C.: Estimates of sulphate aerosol wet scavenging coefficient for locations in the Eastern United States, Atmos. Environ., 38, 795–804, https://doi.org/10.1016/j.atmosenv.2003.10.035, 2004.
Andronache, C., Grönholm, T., Laakso, L., Phillips, V., and Venäläinen, A.: Scavenging of ultrafine particles by rainfall at a boreal site: observations and model estimations, Atmos. Chem. Phys., 6, 4739–4754, https://doi.org/10.5194/acp-6-4739-2006, 2006.
Berthet, S., Leriche, M., Pinty, J.-P., Cuesta, J., and Pigeon, G.: Scavenging of aerosol particles by rain in a cloud resolving model, Atmos. Res., 96, 325–336, 2010.
Binkowski, F. S. and Shankar, U.: The regional particulate matter model: 1. Model description and preliminary results, J. Geophys. Res., 100, 26191–26209, 1995.
Byun, D. and Schere, K. L.: Review of the governing equations, computational algorithms, and other components of the Models-3 Community Multiscale Air Quality (CMAQ) modeling system, Appl. Mech. Rev., 59, 51–77, 2006.
Byrne, M. A. and Jennings, S. G.: Scavenging of sub-micrometre aerosol particles by water drops, Atmos. Environ., 27, 2099–2105, 1993.
Carter, W. P. L. and Heo, G.: Development of revised SAPRC aromatics mechanisms, Atmos. Environ., 77, 404–414, https://doi.org/10.1016/j.atmosenv.2013.05.021, 2013.
Charron, M., Polavarapu, S., Buehner, M., Vaillancourt, P. A., Charette, C., Roch, M., Morneau, J., Garand, L., Aparicio, J., MacPherson, S., Pellerin, S., St-James, J., and Heilliette, S.: The stratospheric extension of the Canadian global deterministic medium-range weather forecasting system and its impact on tropospheric forecasts, Mon. Weather Rev., 140, 1924–1944, https://doi.org/10.1175/MWR-D-11-00097.1, 2012.
Cherrier, G., Belut, E., Gerardin, F., Taniere, A., and Rimbert, N.: Aerosol particles scavenging by a droplet: microphysical modeling in the Greenfield gap, Atmos. Res., 166, 519–530, https://doi.org/10.1016/j.atmosenv.2017.07.052, 2017.
Cheng, I. and Zhang, L.: Long-term air concentrations, wet deposition, and scavenging ratios of inorganic ions, HNO3, and SO2 and assessment of aerosol and precipitation acidity at Canadian rural locations, Atmos. Chem. Phys., 17, 4711–4730, https://doi.org/10.5194/acp-17-4711-2017, 2017.
Croft, B., Lohmann, U., Martin, R. V., Stier, P., Wurzler, S., Feichter, J., Posselt, R., and Ferrachat, S.: Aerosol size-dependent below-cloud scavenging by rain and snow in the ECHAM5-HAM, Atmos. Chem. Phys., 9, 4653–4675, https://doi.org/10.5194/acp-9-4653-2009, 2009.
Côté, J., Gravel, S., Méthot, A., Patoine, A., Roch, M., and Staniforth, A.: The operational CMC–MRB Global Environmental Multiscale (GEM) model, Part I: Design considerations and formulation, Mon. Weather Rev., 126, 1373–1395, 1998a.
Côté, J., Desmarais, J.-G., Gravel, S., Méthot, A., Patoine, A., Roch, M., and Staniforth, A.: The operational CMC–MRB Global Environmental Multiscale (GEM) model, Part II: Results, Mon. Weather Re., 126, 1397–1418, 1998b.
Dabek-Zlotorzynska, E., Dann, T. F., Kalyani Martinelango, P., Celo, V., Brook, J. R., Mathieu, D., Ding, L., and Austin, C. C.: Canadian National air Pollution Surveillance (NAPS) PM2.5 speciation program: methodology and PM2.5 chemical composition for the years 2003–2008, Atmos. Environ., 45, 673–686, https://doi.org/10.1016/j.atmosenv.2010.10.024, 2011.
ECCC: Environment and Climate Change Canada, http://climate.weather.gc.ca/ (last access: 25 January 2024), 2022.
Emerson, E. W., Hodshire, A. L., DeBolt, H. M., Bilsback, K. R., Pierce, J. R., McMeeking, G. R., and Farmer, D. K.: Revisiting particle dry deposition and its role in radiative effect estimates, P. Natl. Acad. Sci. USA, 117, 26076–26082, https://doi.org/10.1073/pnas.2014761117, 2020.
Feiccabrino, J., Graff, W., Lundberg, A., Sandström, N., and Gustafsson, D.: Meteorological knowledge useful for the improvement of snow rain separation in surface based models, Hydrology, 2, 266–288, 2015.
Geer, A. J.: Significance of changes in medium-range forecast scores, Tellus A, 68, 30229, https://doi.org/10.3402/tellusa.v68.30229, 2016.
Ghahreman, R.: Modeling below-cloud scavenging of size-resolved particles in GEM-MACHv3.1. In Geoscientific Model Development (GMD), Zenodo [code], https://doi.org/10.5281/zenodo.10563851, 2024.
Greenfield, S.: Rain scavenging of radioactive particulate matter from the atmosphere, J. Atmos. Sci., 14, 115–125, 1957.
Gong, W., Dastoor, A. P., Bouchét, V. B., Gong, S., Makar, P. A., Moran, M. D., and Pabla, B.: Cloud processing of gases and aerosols in a regional air quality model (AURAMS) and its evaluation against precipitation-chemistry data, Proceedings of the Fifth Conference on Atmospheric Chemistry: Gases, Aerosols, and Clouds, 2.3 (CD-ROM), American Meteorological Society, Boston, 2003.
Gong, W., Bouchet, V. S., Makar, P. A., Moran, M. D., Gong, S., and Leaitch, W. R.: Cloud Processing of Gases and Aerosols in a Regional Air Quality Model (AURAMS): Evaluation Against Aircraft Data, in: Air Pollution Modeling and Its Application XVII, edited by: Borrego, C. and Norman, A. L., Springer, Boston, MA, https://doi.org/10.1007/978-0-387-68854-1_59, 2007.
Gong, W., Stroud, C., and Zhang, L.: Cloud Processing of Gases and Aerosols in Air Quality Modeling, Atmosphere, 2, 567–616, https://doi.org/10.3390/atmos2040567, 2011.
Gong, S. L., Barrie, L. A., and Lazare, M.: Canadian Aerosol Module (CAM): A size-segregated simulation of atmospheric aerosol processes for climate and air quality models 2, Global sea-salt aerosol and its budgets, J. Geophys. Res., 107, 4779, https://doi.org/10.1029/2001JD002004, 2003.
Gong,W., Dastoor, A. P., Bouchet, V. S., Gong, S.-L., Makar, P. A., Moran, M. D., Pabla, B., Ménard, S., Crevier, L.-P., Cousineau, S., and Venkatesh, S.: Cloud processing of gases and aerosols in a regional air quality model (AURAMS), Atmos. Res., 82, 248–275, https://doi.org/10.1016/j.atmosres.2005.10.012, 2006.
Gong, W., Makar, P. A., Zhang, J., Milbrandt, J., Gravel, S., Hayden, K. L., Macdonald, A. M., and Leaitch, W. R.: Modelling aerosolcloud- meteorology interaction: A case study with a fully coupled air quality model (GEM-MACH), Atmos. Environ., 115, 695–715, https://doi.org/10.1016/j.atmosenv.2015.05.062, 2015.
Harpold, A. A., Rajagopal, S., Crews, J. B., Winchell, T., and Schumer, R.: Relative humidity has uneven effects on shifts from snow to rain over the Western U.S., Geophys. Res. Lett., 44, 9742–9750, 2017.
Hayden, K., Li, S.-M., Makar, P., Liggio, J., Moussa, S. G., Akingunola, A., McLaren, R., Staebler, R. M., Darlington, A., O'Brien, J., Zhang, J., Wolde, M., and Zhang, L.: New methodology shows short atmospheric lifetimes of oxidized sulfur and nitrogen due to dry deposition, Atmos. Chem. Phys., 21, 8377–8392, https://doi.org/10.5194/acp-21-8377-2021, 2021.
Haywood, J. and Boucher, O.: Estimates of the Direct and Indirect Radiative Forcing Due to Tropospheric Aerosols: A review, Rev. Geophys., 38, 515–543, 2000.
Jennings, K. S., Winchell, T. S., Livneh, B., and Molotch, N. P.: Spatial variation of the rain–snow temperature threshold across the Northern Hemisphere, Nat. Commun., 9, 1148, https://doi.org/10.1038/s41467-018-03629-7, 2018.
Jiang, W.: Instantaneous secondary organic aerosol yields and their comparison with overall aerosol yields for aromatic and biogenic hydrocarbons, Atmos. Environ., 37, 5439–5444, 2003.
Jones, A. C., Hill, A., Hemmings, J., Lemaitre, P., Quérel, A., Ryder, C. L., and Woodward, S.: Below-cloud scavenging of aerosol by rain: a review of numerical modelling approaches and sensitivity simulations with mineral dust in the Met Office's Unified Model, Atmos. Chem. Phys., 22, 11381–11407, https://doi.org/10.5194/acp-22-11381-2022, 2022.
Jung, C. H., Kim, Y. P., and Lee, K. W.: A moment model for simulating raindrop scavenging of aerosols, J. Aerosol Sci., 34, 1217–1233, 2003.
Jylhä, K.: Relationship between the Scavenging Coefficient for Pollutants in Precipitation and the Radar Reflectivity Factor. Part II: Applications, J. Appl. Meteorol., 38, 1435–1447, https://doi.org/10.1175/1520-0450(1999)038<1435:RBTSCF>2.0.CO;2, 1999.
Kajino, M. and Aikawa, M.: A model validation study of the washout/rainout contribution of sulphate and nitrate in wet deposition compared with precipitation chemistry data in Japan, Atmos. Environ., 117, 124–134, 2015.
Kukkonen, J., Olsson, T., Schultz, D. M., Baklanov, A., Klein, T., Miranda, A. I., Monteiro, A., Hirtl, M., Tarvainen, V., Boy, M., Peuch, V.-H., Poupkou, A., Kioutsioukis, I., Finardi, S., Sofiev, M., Sokhi, R., Lehtinen, K. E. J., Karatzas, K., San José, R., Astitha, M., Kallos, G., Schaap, M., Reimer, E., Jakobs, H., and Eben, K.: A review of operational, regional-scale, chemical weather forecasting models in Europe, Atmos. Chem. Phys., 12, 1–87, https://doi.org/10.5194/acp-12-1-2012, 2012.
Ladino, L., Stetzer, O., Hattendorf, B., Günther, D., Croft, B., and Lohmann, U.: Experimental study of collection efficiencies between sub-micrometer aerosols and cloud droplets, J. Atmos. Sci., 68, 1853–1864, https://doi.org/10.1175/JAS-D-11-012.1, 2011.
Lemaitre, P., Querel, A., Monier, M., Menard, T., Porcheron, E., and Flossmann, A. I.: Experimental evidence of the rear capture of aerosol particles by raindrops, Atmos. Chem. Phys., 17, 4159–4176, https://doi.org/10.5194/acp-17-4159-2017, 2017.
Lurmann, F., Lloyd, A. C., and Atkinson, R.: A chemical mechanism for use in long-range transport/acid deposition computer modeling, J. Geophys. Res., 91, 10905–10936, https://doi.org/10.1029/jd091id10p10905, 1986.
Makar, P. A., Gong, W., Milbrandt, J., Hogrefe, C., Zhang, Y., Curci, G., Žabkar, R., Im, U., Balzarini, A., Baró, R., Bianconi, R., Cheung, P., Forkel, R., Gravel, S., Hirtl, M., Honzak, L., Hou, A., Jiménez-Guerrero, P., Langer, M., Moran, M. D., Pabla, B., Pérez, J. L., Pirovano, G., San José, R., Tuccella, P., Werhahn, J., Zhang, J., and Galmarini, S.: Feedbacks between air pollution and weather, part 1: Effects on weather, Atmos. Environ., 115, 442–469, https://doi.org/10.1016/j.atmosenv.2014.12.003, 2015.
Makar, P. A., Gong, W., Hogrefe, C., Zhang, Y., Curci, G., Zabkar, R., Milbrandt, J., Im, U., Balzarini, A., Baró, R., Bianconi, R., Cheung, P., Forkel, R., Gravel, S., Hirtl, M., Honzak, L., Hou, A., Jiménez-Guerrero, P., Langer, M., Moran, M. D., Pabla, B., Pérez, J. L., Pirovano, G., San José, R., Tuccella, P., Werhahn, J., Zhang, J., and Galmarini, S.: Feedbacks between air pollution and weather, part 2: Effects on chemistry, Atmos. Environ., 115, 499–526, https://doi.org/10.1016/j.atmosenv.2014.10.021, 2015.
Makar, P. A., Bouchet, V. S., and Nenes, A.: Inorganic chemistry calculations using HETV–A vectorized solver for the SO –NO –NH system based on the ISORROPIA algorithms, Atmos. Environ., 37, 2279–2294, https://doi.org/10.1016/s1352-2310(03)00074-8, 2003.
Makar, P. A., Akingunola, A., Aherne, J., Cole, A. S., Aklilu, Y.-A., Zhang, J., Wong, I., Hayden, K., Li, S.-M., Kirk, J., Scott, K., Moran, M. D., Robichaud, A., Cathcart, H., Baratzedah, P., Pabla, B., Cheung, P., Zheng, Q., and Jeffries, D. S.: Estimates of exceedances of critical loads for acidifying deposition in Alberta and Saskatchewan, Atmos. Chem. Phys., 18, 9897–9927, https://doi.org/10.5194/acp-18-9897-2018, 2018.
Makar, P. A., Akingunola, A., Chen, J., Pabla, B., Gong, W., Stroud, C., Sioris, C., Anderson, K., Cheung, P., Zhang, J., and Milbrandt, J.: Forest-fire aerosol–weather feedbacks over western North America using a high-resolution, online coupled air-quality model, Atmos. Chem. Phys., 21, 10557–10587, https://doi.org/10.5194/acp-21-10557-2021, 2021.
McGann, B. T. and Jennings, S. G.: The efficiency with which drizzle and precipitation sized drops collide with aerosol particles, Atmos. Environ., 25, 791–799, 1991.
McLinden, C., Adams, C. L. F., Fioletov, V., Griffin, D., Makar, P. A., Zhao, X., Kovachik, A., Dickson, N., Brown, C., and Krotkov, N.: Inconsistencies in sulfur dioxide emissions from the Canadian oil sands and potential implications, Environ. Res. Lett., 16, 014012, https://doi.org/10.1088/1748-9326/abcbbb, 2021.
Moran, M., Menard, S., Gravel, S., Pavlovic, R., and Anselmo, D.: RAQDPS versions 1.5.0 and 1.5.1: Upgrades to the CMC operational regional air quality deterministic prediction. System Released in October 2012 and February 2013, Technical report, Canadian Meteorological Centre, http://collaboration.cmc.ec.gc.ca/cmc/cmoi/product_guide/docs/lib/op_systems/doc_opchanges/technote_raqdps_20130226_e.pdf (last access: 25 January 2024), 2013.
Nenes, A., Pilinis, C., and Pandis, S. N.: Continued development and testing of a new thermodynamic aerosol module for urban and regional air quality models, Atmos. Environ., 33, 1533–1560, https://doi.org/10.1016/s1352-2310(98)00352-5, 1999.
Odum, J. R., Hoffmann, T., Bowman, F., Collins, D., Flagan, R. C., and Seinfeld, J. H.: Gas/particle partitioning and secondary organic aerosol yields, Environ. Sci. Technol., 30, 2580–2585, https://doi.org/10.1021/es950943, 1996.
Pranesha, T. S. and Kamra, A. K.: Scavenging of aerosol particles by large water drops 3. Washout coefficients, half-lives, and rainfall depths, J. Geophys. Res., 1022, 23947–23954, https://doi.org/10.1029/97JD01835 1997.
Pruppacher, H. R. and Klett, J. D.: Microphysics of Clouds and Precipitation, D. Reidel Publishing Company, 714 pp., https://doi.org/10.1007/978-94-009-9905-3, 1978.
Pruppacher, H. R. and Klett, J. D.: Microstructure of Atmospheric Clouds and Precipitation, in: Microphysics of Clouds and Precipitation, Springer, Dordrecht, https://doi.org/10.1007/978-94-009-9905-3_2, 1997.
Rogers, R. R. and Yau, M. K.: A Short Course in Cloud Physics, 3rd ed., 12–27, Pergamon, Tarrytown, N.Y., 1989.
Ryu, Y.-H. and Min, S.-K.: Improving wet and dry deposition of aerosols in WRF-Chem: updates to below-cloud scavenging and coarse-particle dry deposition, J. Adv. Model. Earth Sy., 14, e2021MS002792, https://doi.org/10.1029/2021MS002792, 2022.
Seigneur, C., Hudischewskyj, A. B., Seinfeld, J. H., Whitby, K. T., Whitby, E. R., Brock, J. R., and Barnes, H. M.: Simulation of aerosol dynamics: A comparative review of mathematical models, Aerosol. Sci. Technol., 5, 205–222, 1986.
Seinfeld, J. H. and Pandis, S. N.: Atmospheric Chemistry and Physics, Wiley, New York, USA, 1998.
Seinfeld, J. H. and Pandis, S. N.: Atmospheric Chemistry and Physics: From Air Pollution to Climate Change, 2nd Edition, John Wiley & Sons, New York, 2006.
Slinn, W. G. N. and Hales, J. M.: A reevaluation of the role of thermophoresis as a mechanism of in- and BCS, J. Atmos. Sci., 28, 1465–1471, 1971.
Slinn, W. G. N.: Precipitation Scavenging in Atmospheric Science and Power Production, 11, edited by: Randerson, D., Tech. Inf. Cent., Off. of Sci. and Techn. Inf., Dep. of Energy, Washington DC, USA, 466–532, 1984.
Stier, P., Feichter, J., Kinne, S., Kloster, S., Vignati, E., Wilson, J., Ganzeveld, L., Tegen, I., Werner, M., Balkanski, Y., Schulz, M., Boucher, O., Minikin, A., and Petzold, A.: The aerosol-climate model ECHAM5-HAM, Atmos. Chem. Phys., 5, 1125–1156, https://doi.org/10.5194/acp-5-1125-2005, 2005.
Stockwell, W. R. and Lurmann, F. W.: Intercomparison of the ADOM and RADM gas-phase chemical mechanisms, in: Electrical Power Research Institute Topical Report, EPRI, p. 254, 1989.
Stroud, C. A., Makar, P. A., Zhang, J., Moran, M. D., Akingunola, A., Li, S.-M., Leithead, A., Hayden, K., and Siu, M.: Improving air quality model predictions of organic species using measurement-derived organic gaseous and particle emissions in a petrochemical-dominated region, Atmos. Chem. Phys., 18, 13531–13545, https://doi.org/10.5194/acp-18-13531-2018, 2018.
Textor, C., Schulz, M., Guibert, S., Kinne, S., Balkanski, Y., Bauer, S., Berntsen, T., Berglen, T., Boucher, O., Chin, M., Dentener, F., Diehl, T., Easter, R., Feichter, H., Fillmore, D., Ghan, S., Ginoux, P., Gong, S., Grini, A., Hendricks, J., Horowitz, L., Huang, P., Isaksen, I., Iversen, I., Kloster, S., Koch, D., Kirkevåg, A., Kristjansson, J. E., Krol, M., Lauer, A., Lamarque, J. F., Liu, X., Montanaro, V., Myhre, G., Penner, J., Pitari, G., Reddy, S., Seland, Ø., Stier, P., Takemura, T., and Tie, X.: Analysis and quantification of the diversities of aerosol life cycles within AeroCom, Atmos. Chem. Phys., 6, 1777–1813, https://doi.org/10.5194/acp-6-1777-2006, 2006.
Tinsley, B. A.: Influence of the solar wind on the global electric circuit and inferred effects on cloud microphysics, temperature and dynamics of the troposphere, Space Sci. Rev., 94, 231–258, 2000.
Trenberth, K.: Changes in precipitation with climate change, Clim. Res., 47, 123–138, 2011.
Tripathi, S. and Harrison, R. G.: Enhancement of contact nucleation by scavenging of charged aerosol particles, Atmos. Res., 62, 57–70, https://doi.org/10.1016/S0169-8095(02)00020-0, 2002.
Tost, H., Jöckel, P., Kerkweg, A., Sander, R., and Lelieveld, J.: Technical note: A new comprehensive SCAVenging submodel for global atmospheric chemistry modelling, Atmos. Chem. Phys., 6, 565–574, https://doi.org/10.5194/acp-6-565-2006, 2006.
Vignati, E., Wilson, J., and Stier, P.: M7: An efficient size-resolved aerosol microphysics module for large-scale aerosol transport models, J. Geophys. Res., 109, D22202, https://doi.org/10.1029/2003JD004485, 2004.
Wang, P. K. and Pruppacher, H.: An experimental determination of the efficiency with which aerosol particles are collected by water drops in subsaturated air, J. Atmos. Sci., 34, 1664–1669, 1977.
Wang, X., Zhang, L., and Moran, M. D.: Uncertainty assessment of current size-resolved parameterizations for below-cloud particle scavenging by rain, Atmos. Chem. Phys., 10, 5685–5705, https://doi.org/10.5194/acp-10-5685-2010, 2010.
Wang, X., Zhang, L., and Moran, M. D.: On the discrepancies between theoretical and measured below-cloud particle scavenging coefficients for rain – a numerical investigation using a detailed one-dimensional cloud microphysics model, Atmos. Chem. Phys., 11, 11859–11866, https://doi.org/10.5194/acp-11-11859-2011, 2011.
Wang, X., Zhang, L., and Moran, M. D.: Development of a new semi-empirical parameterization for below-cloud scavenging of size-resolved aerosol particles by both rain and snow, Geosci. Model Dev., 7, 799–819, https://doi.org/10.5194/gmd-7-799-2014, 2014.
Wang, X., Zhang, L., and Moran, M. D.: Bulk or modal parameterizations for BCS of fine, coarse, and giant particles by both rain and snow, J. Adv. Model. Earth Sy., 6, 1301–1310, https://doi.org/10.1002/2014MS000392, 2014b.
Whitby, E. R. and McMurry, P. H.: Modal aerosol dynamics modeling, Aerosol Sci. Technol., 27, 673–688, 1997.
WMO/GAW: Manual for the GAW Precipitation Chemistry Programme: Guidelines, Data Quality Objectives and Standard Operating Procedures, No. 160, edited by: Allen, M. A., World Meteorological Organization/Global Atmosphere Watch, Geneva, Switzerland, 170 pp., 2004 (updated 2015).
Zhang, Y., Seigneur, C., Seinfeld, J. H., Jacobson, M. Z., and Binkowski, F. S.: Simulation of aerosol dynamics: A comparative review of algorithms used in air quality models, Aerosol Sci. Technol., 31, 487–514, 1999.
Zhang, Y.: Online-coupled meteorology and chemistry models: history, current status, and outlook, Atmos. Chem. Phys., 8, 2895–2932, https://doi.org/10.5194/acp-8-2895-2008, 2008.