the Creative Commons Attribution 4.0 License.
the Creative Commons Attribution 4.0 License.
 | 20 Jun 2024
Modeling biochar effects on soil organic carbon on croplands in a microbial decomposition model (MIMICS-BC_v1.0)
Mengjie Han
Qing Zhao
Xili Wang
Ying-Ping Wang
Philippe Ciais
Haicheng Zhang
Daniel S. Goll
Zhe Zhao
Zhixuan Guo
Chen Wang
Wei Zhuang
Fengchang Wu
Biochar (BC) application to croplands aims to sequester carbon and improve soil quality, but its impact on soil organic carbon (SOC) dynamics is not represented in most land models used for assessing land-based climate change mitigation; therefore, we are unable to quantify the effects of biochar application under different climate or land management conditions. Here, to fill this gap, we implement a submodel to represent biochar in a microbial decomposition model named MIMICS (MIcrobial-MIneral Carbon Stabilization). We first calibrate and validate MIMICS with new representations of the density-dependent microbial turnover rate, adsorption of available organic carbon on mineral soil particles, and soil moisture effects on decomposition using global field-measured cropland SOC at 285 sites. We further integrate biochar in MIMICS by accounting for its effect on microbial decomposition and SOC sorption/desorption and optimize two biochar-related parameters in these processes using 134 paired SOC measurements with and without biochar addition. The MIMICS-biochar version can generally reproduce the short-term (≤ 6 years) and long-term (8 years) SOC changes after adding (mean addition rate of 25.6 t ha−1) biochar (R2= 0.79 and 0.97, respectively) with a low root-mean-square error (RMSE = 3.73 and 6.08 g kg−1, respectively). Our study incorporates sorption and soil moisture processes into MIMICS and extends its capacity to simulate biochar decomposition, providing a useful tool to couple with dynamic land models to evaluate the effectiveness of biochar application with respect to removing CO2 from the atmosphere.
- Article
(6022 KB) - Full-text XML
-
Supplement
(2258 KB) - BibTeX
- EndNote


Soil organic carbon (SOC) is the largest terrestrial carbon pool, and increasing soil respiration in response to global warming can cause large carbon emissions to the atmosphere (Bond-Lamberty et al., 2018). On the other hand, SOC sequestration through improved land management practices has the potential to mitigate climate change by increasing soil carbon accumulation, as is the focus of initiatives such as the “4 per 1000” project (Minasny et al., 2017). Due to the limited temporal and spatial coverage of field SOC measurements, soil biogeochemical models have been widely applied to simulate SOC and its response to climate change and human activities (Eglin et al., 2010). Soil carbon models are evolving from first-order kinetics-based models with a simple representation of pool sizes and their turnover rates to microbial models with explicit representation of microbial roles in SOC decomposition and stabilization (Manzoni and Porporato, 2009; Sulman et al., 2018). For example, the MIcrobial-MIneral Carbon Stabilization (MIMICS) model is a process-based soil carbon model with explicit representations of nonlinear SOC decomposition dynamics related to microbial physiology, substrate quality, and the physical protection of SOC (Wieder et al., 2014, 2015). This model has been calibrated with global SOC data, can represent the current understanding of SOC decomposition and formation well (Wieder et al., 2015), and outperforms conventional first-order decomposition models with respect to simulating the spatial variation in SOC stocks in forest ecosystems on the continental scale (Zhang et al., 2020). However, the model has not been evaluated for agricultural sites or misses processes that theoretically should influence SOC dynamics.
Microbial interactions at the community level (e.g., competition) play a crucial role in controlling SOC dynamics, but they are usually omitted in microbial models (Georgiou et al., 2017), resulting in the unrestricted growth of the microbial community with increasing carbon input, which is unrealistic (Buchkowski et al., 2017; Wieder et al., 2013). In addition, field experiments show that physicochemical adsorption plays a more important role in controlling dissolved organic carbon (DOC) fluxes than the biodegradation process (Kalbitz et al., 2005). Although the adsorption mechanism is complex, depending on various factors such as pH, clay content, and the destruction and formation of soil aggregates (Mayes et al., 2012), some soil carbon models have implemented dynamic adsorption and desorption processes controlled by the DOC concentration and available mineral surface sites for binding (G. Wang et al., 2020, 2013). The availability of SOC is influenced by the adsorption process (Michalzik et al., 2003). Some adsorption kinetic equations, such as the Langmuir isotherm, have commonly been employed to depict the adsorption/desorption process. However, the MIMICS model lacks consideration of the adsorption process, thus not effectively elucidating its role in stabilizing SOC. Furthermore, the effect of soil moisture on SOC cannot be ignored, as soil moisture controls microbial activity, substrate availability, and further influences soil respiration and nitrogen mineralization (Manzoni et al., 2012; Schimel et al., 2007). A set of empirical functions for the soil moisture effects have been proposed for use in Earth system models (ESMs) (Moyano et al., 2013; Camino-Serrano et al., 2018), and a mechanistic moisture function that incorporates physicochemical and biological processes has also recently been developed (Yan et al., 2018). In previous MIMICS versions, an implicit or explicit density-dependent microbial turnover has been introduced (Wieder et al., 2015; Kyker-Snowman et al., 2020; Zhang et al., 2020; Georgiou et al., 2017), which causes an increase in microbial biomass turnover with increasing microbial community size, reflecting increasing pressure from competition for resources other than carbon (e.g., space) and from viral infections (Jansson and Wu, 2023), and a water scalar has been used to represent the soil moisture effects (Wieder et al., 2019). The inclusion of a density-dependent microbial turnover rate improved the accuracy of SOC prediction at the global scale, compared with MIMICS without this inclusion, and eliminated the correlation between simulated biases and the input of annual litterfall (Zhang et al., 2020). MIMICS with soil water modifications showed comparable predicted global soil carbon stocks compared to other models, but the extent to which soil water influences SOC turnover remains uncertain (Wieder et al., 2019). Therefore, based on these theories and model limitations, it is necessary to integrate the three aspects (density-dependent microbial turnover rate, adsorption processes, and soil moisture impacts) into one model version to improve the prediction accuracy of SOC dynamics. For agricultural lands, modeling the SOC decomposition processes is more challenging due to management practices, such as tillage and fertilization, that can significantly interrupt the carbon cycle and require specific parameterizations.
Biochar application to croplands as a soil amendment can improve the soil quality and increase crop production (Smith, 2016; Woolf et al., 2010). Moreover, as biochar is produced from biomass through pyrolysis processes and is recalcitrant to decomposition, it is also considered to be a promising negative-emission technology (NET) with respect to climate change mitigation (Fuss et al., 2018; Minx et al., 2018). The carbon dioxide removal (CDR) potential of biochar is estimated to be 0.5–2 Gt CO2e yr−1 (where CO2e denotes CO2 equivalent) (Fuss et al., 2018; Minx et al., 2018). However, biochar application affects SOC mineralization through various processes (Palansooriya et al., 2019; Luo et al., 2017), resulting in positive or negative priming effects (PEs, changes in native SOC mineralization) (Zimmerman et al., 2011). A recent meta-analysis showed that biochar induced negative PEs on average (−3.8 %), but the 95 % confidence interval (CI) of −8.1 % to 0.8 % also covered positive values (Wang et al., 2016). Biochar may induce positive PEs via the stimulation of microbial activity by providing additional nutrients for soil microbes (El-Naggar et al., 2019; Li et al., 2019). Positive PEs usually occurred over the shorter term (< 2 years) and then decreased or became negative over the longer term (Luo et al., 2011; Singh and Cowie, 2014; Ding et al., 2017). For example, biochar can reduce the SOC available for microbes by enhancing soil aggregate stability via associations between soil minerals and biochar (Zheng et al., 2018). Its porous structure and high surface area with a strong adsorption affinity for SOC can, thus, cause negative PEs (Zimmerman et al., 2011; Lehmann et al., 2021). PEs are also impacted by the properties of biochar (e.g., feedstock type and pyrolysis temperature) and soil climate (e.g., soil moisture) (Ding et al., 2017). Therefore, soil moisture could be closely related to the adsorption capacity of biochar and, thus, needs to be included in the model for predicting the PEs of biochar on SOC changes. The biochar decomposition and impacts on native SOC via PEs are important for the CDR potential of biochar, but these processes are not represented in most land carbon models (Lehmann et al., 2021), precluding the model capacity to fully assess the effectiveness of the large-scale application of biochar as a NET as well as its environmental impacts.
2.1 Modifications of the MIMICS model
2.1.1 The default version of MIMICS (MIMICS-def)
There are seven carbon pools in MIMICS: two litter pools, two microbial biomass pools, and three SOC pools (Fig. 1). The litter inputs (LIT) are divided into metabolic (LITm) and structural (LITs) pools according to the litter quality (fmet, i.e., fraction of litter to LITm), which is linearly related to the lignin-to-nitrogen ratio (lignin:N; Table S1 in the Supplement). Microbial growth efficiency (MGE) determines the carbon fluxes from the two litter pools and the available SOC pool (SOCa) for microbial biomass pools and heterotrophic respiration. The turnover of microbial biomass (τ) depends on the functional types of soil microbes (MICr and MICk for the r- and k-strategy, respectively). Three SOC pools represent the available (SOCa), physically protected (SOCp), and chemically recalcitrant SOC (SOCc). SOC in the protected pools (i.e., SOCp and SOCc) is released to the available SOC pool (SOCa) over time. A more detailed description of the model parameters and carbon fluxes can be found in Table S1 in the Supplement and in Wieder et al. (2015). The carbon decomposition rate (mg C cm−3 h−1) of the litter and SOC pools is based on temperature-sensitive Michaelis–Menten kinetics (Allison et al., 2010; Schimel and Weintraub, 2003):
where Cs (mg C cm−3) is the size of a substrate carbon pool (LIT or SOC) and MIC (mg C cm−3) is the size of the microbial carbon pool (MICr or MICk). Vmax and Km are the microbial maximum reaction velocity (mg C (mg MIC)−1 h−1) and the half-saturation constant (mg C cm−3), respectively, which depend on temperature, T (in °C).
Here, Vmod and Kmod represent the modifications of Vmax and Km, respectively, based on their dependence on litter quality, microbial functional type, and soil texture; av and ak are the tuning coefficients of Vmax and Km, respectively; Vslope and Kslope are the regression coefficients; and Vint and Kint are the regression intercepts.
The turnover of MICr and MICk (MICτ, mg C cm−3 h−1) at each time step depends on their specific turnover rate (kmic, h−1), annual total litter input (LITtot, g C m−2 yr−1), and fmet:
where aτ (=1.0, dimensionless) is the tuning coefficient of kmic and c is the regression coefficient of MICr (0.3) and MICk (0.1). The carbon inputs from microbial biomass to SOC pools are determined by the microbial biomass turnover.
The carbon transfer from SOCp to SOCa (D, mg C cm−3 h−1) represents the desorption of SOCp from mineral surfaces or the breakdown of aggregates, calculated as a function of soil clay content (fclay):
where kd (=1.0, dimensionless) is a tuning coefficient of the desorption rate. The parameter values of the default MIMICS version can be found in Table S1.
2.1.2 MIMICS considering the density-dependent microbial turnover rate (MIMICS-T)
Similar to the logistic growth model in population ecology, various regulatory mechanisms (e.g., competition and viruses) can limit the microbial population size (Buchkowski et al., 2017; Jansson and Wu, 2023). The absence of restrictions other than carbon on population size results in predictions of microbial biomass that increase indefinitely with carbon input. Consequently, the response of predicted SOC to changes in carbon inputs is close to zero, which contradicts field observations (Georgiou et al., 2017). A density-dependent microbial turnover rate with β>1 was adopted to regulate the responses of soil microbial biomass to external environmental variations, such as carbon input, and thus SOC dynamics in previous microbial models (Georgiou et al., 2017; Zhang et al., 2020). We incorporated the density-dependent microbial turnover rate into MIMICS following Zhang et al. (2020). In the MIMICS-T version, we modified Eq. (4) to represent the increased microbial turnover rate with growing microbial biomass density (MIC, mg C cm−3):
where β is the density-dependent exponent.
2.1.3 MIMICS-T with the additional representation of sorption (MIMICS-TS)
Although the MIMICS model can simulate the desorption process (yellow arrow from SOCp to SOCa in Fig. 1), the adsorption process is still missing. In the original version of MIMICS, fixed fractions of litter and microbial turnover are transferred to the physically protected SOC pool (SOCp in Fig. 1); the SOCp is then unprotected from mineral surfaces or the breakdown of aggregates using a desorption rate which is a function of the clay fraction. Therefore, we do not think that the original MIMICS model actually simulates sorption as a process, as sorption is dependent on the substrate concentration; therefore, the sorption rate should vary with the dissolved organic carbon concentration, rather than being proportional to the microbial carbon turnover rate as assumed in the original MIMICS. Thus, we further added the adsorption of available SOC to MIMICS, following Wang et al. (2013) and Mayes et al. (2012). The MIMICS-TS version includes a new sorption process (purple arrow from SOCa to SOCp in Fig. 1), but the original desorption process (i.e., yellow arrow from SOCp to SOCa in Fig. 1) remains unchanged. The sorption capacity of SOCa (Qmax) increases with increasing clay content, and the carbon flux of the sorption process is calculated as follows:
where Fads is the carbon flux from SOCa to SOCp (mg C cm−3 h−1); kba is the binding affinity; Kads is the sorption rate of SOCp, which is associated with the desorption rate (kd); Qmax is the maximum sorption capacity of SOCp (mg C cm−3 soil); and c1 and c2 are the coefficients for estimating Qmax from Mayes et al. (2012).
2.1.4 MIMICS-TS with soil moisture effects (MIMICS-TSM)
Finally, based on MIMICS-TS, we added soil moisture effects on decomposition into MIMICS. We tested two empirical functions for soil moisture used in the CENTURY model (Eq. 10; Parton et al., 2000) and the ORCHIDEE-SOM model (Eq. 11; Camino-Serrano et al., 2018), respectively. We also attempted to implement one mechanism-based function that captures the main physicochemical and biological processes of soil moisture in regulating soil respiration from Yan et al. (2018) (Eq. 12). The three functions of soil moisture are illustrated in Fig. S1.
where fmi (, unitless value in range from 0 to 1) is the response factor to soil moisture; w is the soil moisture indicator (AI, mm mm−1); p1 and p2 are empirical parameters of the soil moisture scalar with values of p1=30 and , respectively (Parton et al., 2000); θ is soil moisture (m3 m−3); k1, k2, and k3 are soil moisture coefficients with values of 1.1, 2.4, and 0.29, respectively (Camino-Serrano et al., 2018); φ is the soil porosity related to soil bulk density; is the relative water content in soil pores; θop is an optimum soil moisture content parameter at which the heterotrophic respiration rate peaks; Kθ is moisture constant depending on organic–mineral associations; ns is a saturation exponent depending on soil structure and texture; and a and b are respective SOC–microbial collocation and oxygen supply restriction factors (Yan et al., 2018).
We assumed that the kinetic parameters Vmax and Km respond to soil moisture, similarly to temperature in the Michaelis–Menten equation, by affecting enzyme activity and enzyme–substrate affinity, respectively. The soil enzyme–substrate affinity was found to increase with soil moisture due to the increased diffusion and movement of substrate, but the affinity may also decrease due to decreased substrate concentrations (Zhang et al., 2009). Thus, we translated the impacts of soil moisture on the enzyme–substrate affinity to changes in Km. In MIMICS-TSM, the effects of soil moisture on the SOC decomposition rate are represented by multiplying the response factor by Vmax and Km as follows (Eqs. 13, 14):
The MIMICS models with three soil moisture functions – fm1 (Eq. 10), fm2 (Eq. 11), and fm3 (Eq. 12) – are referred to as MIMICS-TSMa, MIMICS-TSMb, and MIMICS-TSMc, respectively. The modifications in all MIMICS versions are summarized in Table 1.
2.1.5 Adjusted parameters for cropland SOC
Crop net primary productivity (NPP) at each site was used as the litter input to soil, but different crop types (e.g., maize, rice, and wheat) were not specified in the model. The leaf, root, and stem litter values were assumed as a fixed fraction of crop NPP. The ratio of carbon to nitrogen (C:N) and the ratio of lignin to carbon (lignin:C) of the leaf, root, and stem (Table S2) were used to calculate the metabolic fraction in the total crop litter (fmet); it was calculated as the mean metabolic fractions in the leaf, root, and stem weighted by the NPP in the three parts. In order to adapt MIMICS to simulate cropland SOC, we modified C:N and lignin:C in the three parts based on field measurements of the main crop types (Table S2; Abiven et al., 2005). A harvest index (HI) of 0.45 (Hicke and Lobell, 2004) was also applied to remove the harvested part of crop and obtain the litter input to soil (calculated as the crop aboveground NPP × (1-HI)).
2.2 Implementing biochar modeling in MIMICS
When applying biochar in croplands, a fraction of biochar was assumed to be lost during application (floss=2 %; Archontoulis et al., 2016). Although biochar is recalcitrant to decomposition with a long turnover time (556 ± 484 years) in general, it contains a labile fraction (108 ± 196 d), and its stability varies with different biochar feedstocks, pyrolysis temperatures, and soil properties (Wang et al., 2016). Because the sizes of the SOCp and SOCc pools in MIMICS are not measured directly in the field studies, the 98 % remaining fraction of added biochar is partitioned into three MIMICS SOC pools by assuming that 60 % goes to SOCp, based on the measured proportions of added biochar within aggregates (Yoo et al., 2017); 20 % goes to SOCa, according to the labile C portion in biochar (Roberts et al., 2010); and 20 % goes to SOCc (Fig. 1). Note that biochar is not treated as a separate carbon pool but is rather assumed to mix with other carbon in the existing pools (Fig. 1). In addition to the increase in total SOC, some important processes controlling SOC accumulation and decomposition are affected by biochar addition. Thus, we modified the parameters related to decomposition and desorption of SOC (Fig. 1). The associated rationales, equations, and parameters are described in the following sections.
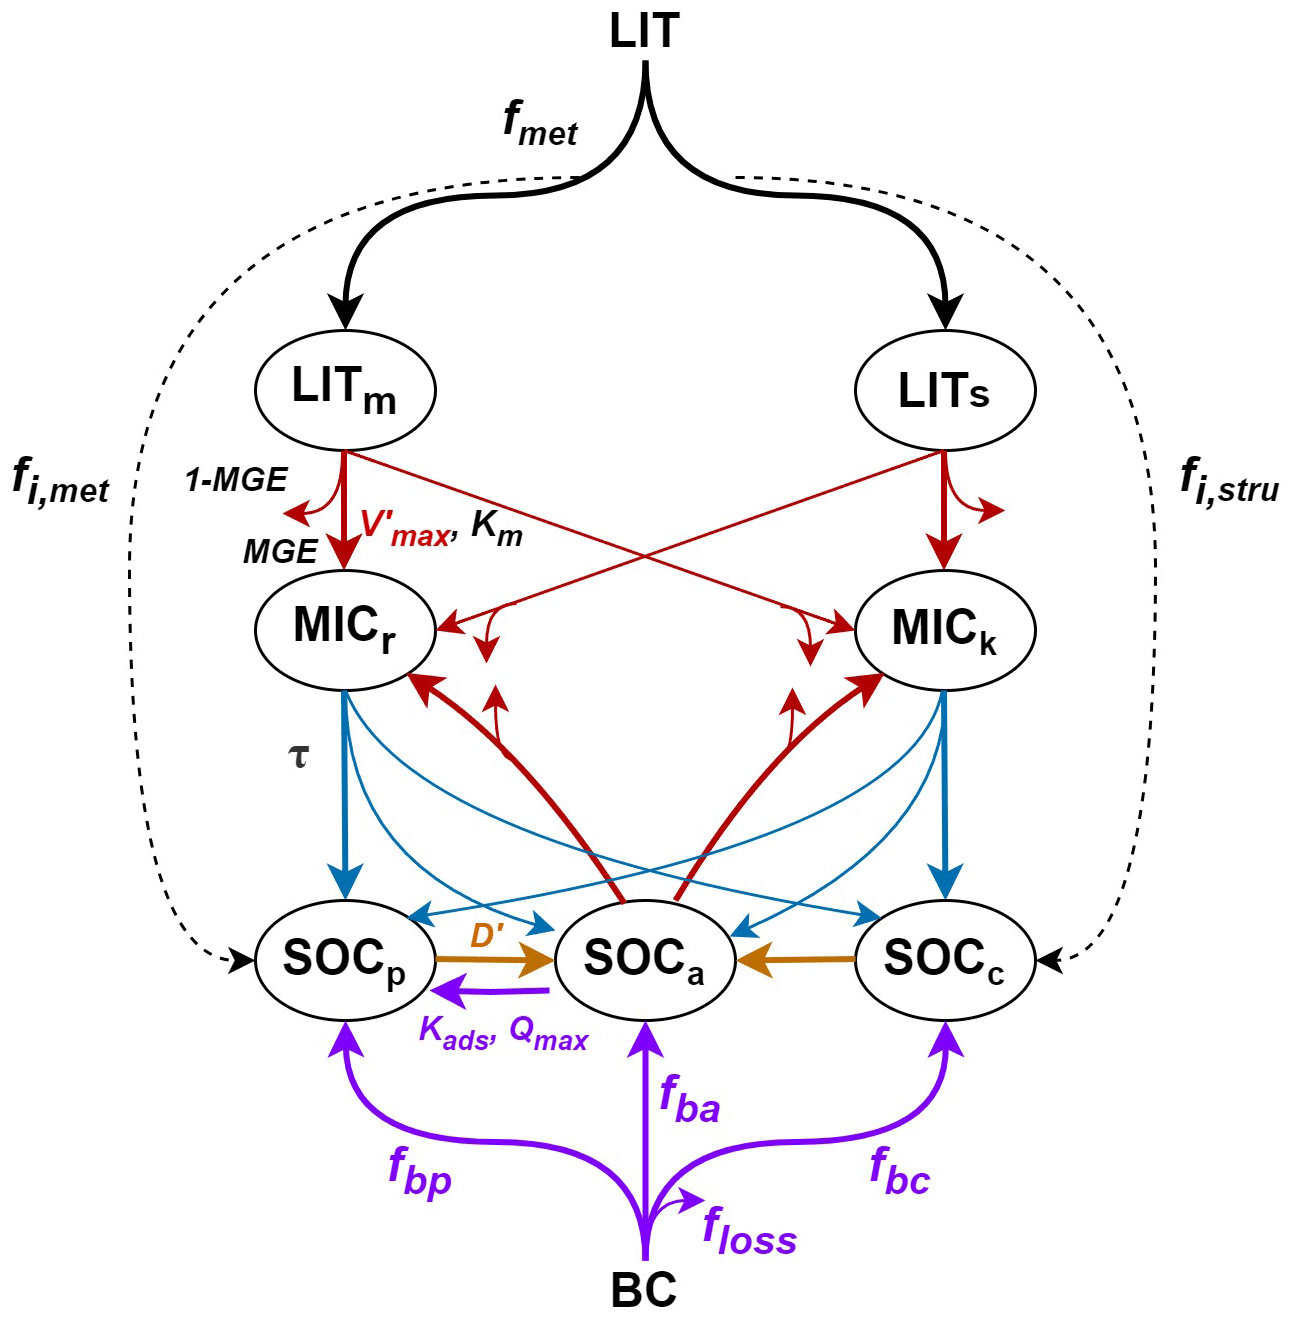
Figure 1Framework of the MIMICS model with biochar addition (MIMICS-BC; adapted from Wieder et al., 2015). The turnover of microbial biomass (τ, blue arrows) is modified with the density-dependent microbial turnover rate (MIMICS-T; Eq. 6). The adsorption process of SOCp to SOCa (purple arrow) is newly added and is associated with the adsorption rate (Kads) and the maximum sorption capacity (Qmax) (MIMICS-TS; Eqs. 7–9). The carbon decomposition processes (red arrows) are modified further with three soil moisture scalers that are applied to the microbial maximum reaction velocity (Vmax) and the half-saturation constant (Km) (MIMICS-TSMa, MIMICS-TSMb, and MIMICS-TSMc; Eqs. 10–12). When biochar is added to soil, the biochar (BC) carbon with an assumed fraction loss (floss) is partitioned into SOCp, SOCa, and SOCc based on fbp, fba, and fbc, respectively (purple arrows from the BC to SOC pools). The desorption process (orange arrow from SOCp to SOCa) is modified through changes in the desorption rate of SOCp (D′) with biochar addition. The carbon decomposition processes (red arrows) are modified by adjusting the microbial maximum reaction velocity () with biochar addition.
The negative PEs of biochar addition on SOC may be caused by (1) the inhibition of microbial activity via changes in the soil environment due to biochar or (2) by SOC protection against microbial utilization through mineral adsorption or aggregates (Zimmerman et al., 2011). We assumed that biochar addition decreased the mineralization of native SOC (negative PE) because of its porous structure and strong adsorption affinity to organic matter (Kasozi et al., 2010), which was reported to have significantly contributed to the negative PE mechanism due to biochar addition (Zheng et al., 2018; Zimmerman et al., 2011). A desorption coefficient (fd, ha t−1 C) was defined as a function of the biochar application rate (Rate_BC) based on Woolf and Lehmann (2012) and Archontoulis et al. (2016); thus, Eq. (5) was modified as follows:
where D′ (mg C cm−3 h−1) is the new desorption rate of SOCp with biochar addition, and a negative value of fd indicates a negative PE. The Rate_BC is the application rate of biochar (t BC ha−1) and BC_C is the carbon content in biochar (tons of carbon per ton of BC). Because the adsorption and desorption of SOC are interrelated dynamic process, modification of the desorption process with biochar addition also impacts the adsorption process. Therefore, we only modified fd in Eq. (15) to represent the negative PE of biochar.
We also assumed that biochar stimulated microbial growth and activity through its nutrient input, inducing a positive PE to SOC (El-Naggar et al., 2019). We defined a new decomposition rate coefficient (fv, ha t−1 C), which is a function of Rate_BC, and included it in MIMICS by modifying Eq. (2):
where is the new microbial maximum reaction velocity (mg C (mg MIC)−1 h−1) with biochar addition.
Biochar may also have a positive PE on SOC by increasing the degradation rate of available SOC by microbes (i.e., SOCa in MIMICS). Therefore, we added a test through modifying the Vmax as a function of the biochar addition rate only in the fluxes from SOCa to MICr and MICk, instead of in all fluxes of decomposition (Eq. 16; red arrows in Fig. 1).
2.3 Model calibration and evaluation
2.3.1 Observational data collection
We collected 387 paired field measurements of SOC concentrations (g kg−1) in croplands with or without biochar (BC) addition from 58 locations (see the site map in Fig. 2) from the published literature. Soil properties (clay content, Clay; bulk density, BD; and soil moisture, SM), climatic conditions (mean annual temperature, MAT, and mean annual precipitation, MAP), a biological variable (net primary productivity, NPP), and biochar-related characteristics (application rate, Rate_BC; the interval between biochar application and soil sampling, Age_BC; feedstock type, Feedstock_BC; and pyrolysis temperature, Temp_BC) were also collected when available. Auxiliary information (e.g., location, management, and crop type) and more detailed information can be found in Han et al. (2021).
Because some sites have multiple biochar addition experiments (e.g., pyrolysis temperature × aging time of biochar), the control SOC concentrations at the same site were averaged, and the SOC concentrations with biochar addition for a given rate (Rate_BC) were also averaged, omitting other characteristics of the biochar (like pyrolysis temperature). In total, 134 paired SOC data were used for model calibration and validation (Fig. 2). The depth of soil sampled varies among sites but is less than 30 cm in general. The biochar application rate varies from 0.9 to 120 t ha−1 with a median value of 20 t ha−1 (Fig. S2a). Most biochar addition experiments are short-term experiments, with a median Age_BC of 1.2 years (Fig. S2b). The main types of cultivated crop are maize, rice, and wheat.
There are SOC measurements on cropland sites from 58 control treatments (no BC application) and 134 measurements from biochar treatments at the 58 sites. One control treatment may correspond to multiple biochar treatments with different applied biochar rates at a single site. Considering that the 58 site observations may be inadequate to constrain all of the new features in the revised model, we also collected SOC data on croplands (no biochar addition) from three other published global datasets (227 sites in total; Sun et al., 2020; Geisseler et al., 2017; M. Zhou et al., 2017). Therefore, a total of 285 sites were used to calibrate and evaluate the model performance for simulating cropland SOC without biochar addition (Fig. 2). The MIMICS model can run for each site; however, to be consistent with the model input resolution of daily temperature in the transient simulation (Sect. 2.3.3), the resolution of 0.5° was used for site aggregation. In detail, all sites within a given 0.5° × 0.5° grid cell were aggregated on average, and the average value was used to compare the model result in this grid cell.
The stabilizing processes of SOC after biochar addition are usually slow, and the long-term impacts of biochar addition on SOC may be different from the short-term impacts (Ding et al., 2011). Therefore, long-term SOC observations with biochar addition are needed to validate possible mechanisms and evaluate the model performance of simulating SOC stability with biochar addition. However, the duration of most biochar addition experiments is short (74.2 % of data < 3 years); thus, we extended our collected control SOC data to 8 years according to the decomposition curve of biochar in soil fitted by a double first-order exponential decay model (Fig. S4; Wang et al., 2016). Note that the double exponential decay function is only applied to the observational records of measurement data, and this function is not used in the MIMICS model. Specifically, the 8 years of SOC data with biochar addition is the sum of field control SOC observations (short term) and the residual biochar carbon in soil after 8 years. These extended long-term data were also used for model calibration and model evaluation.
Soil properties that are not reported in the literature were extracted from gridded datasets using the coordinates of the sites: clay content was taken from the Global Soil Dataset for Earth System Models (GSDE; Shangguan et al., 2014), whereas SM was obtained from observations of the Soil Moisture Active Passive (SMAP) satellite (Entekhabi et al., 2010). Missing soil BD information in control treatments was filled according to the relationship between SOC and bulk density based on 4765 cultivated soil data from the second national soil survey (Song et al., 2005), and a decrease of 7.6 % (Omondi et al., 2016) from the control soil BD was assumed to fill the missing BD values in the biochar addition experiments. The climate variable MAT was extracted from WorldClim (Fick and Hijmans, 2017), whereas the mean annual aridity index (AI, i.e., the ratio of precipitation to potential evapotranspiration) used in the soil moisture equation (Eq. 10) was obtained from the Global Aridity Index and Potential Evapotranspiration Database (Zomer et al., 2022). The biological variable (i.e., NPP) was taken from the MODIS NPP dataset (Zhao and Running, 2010).
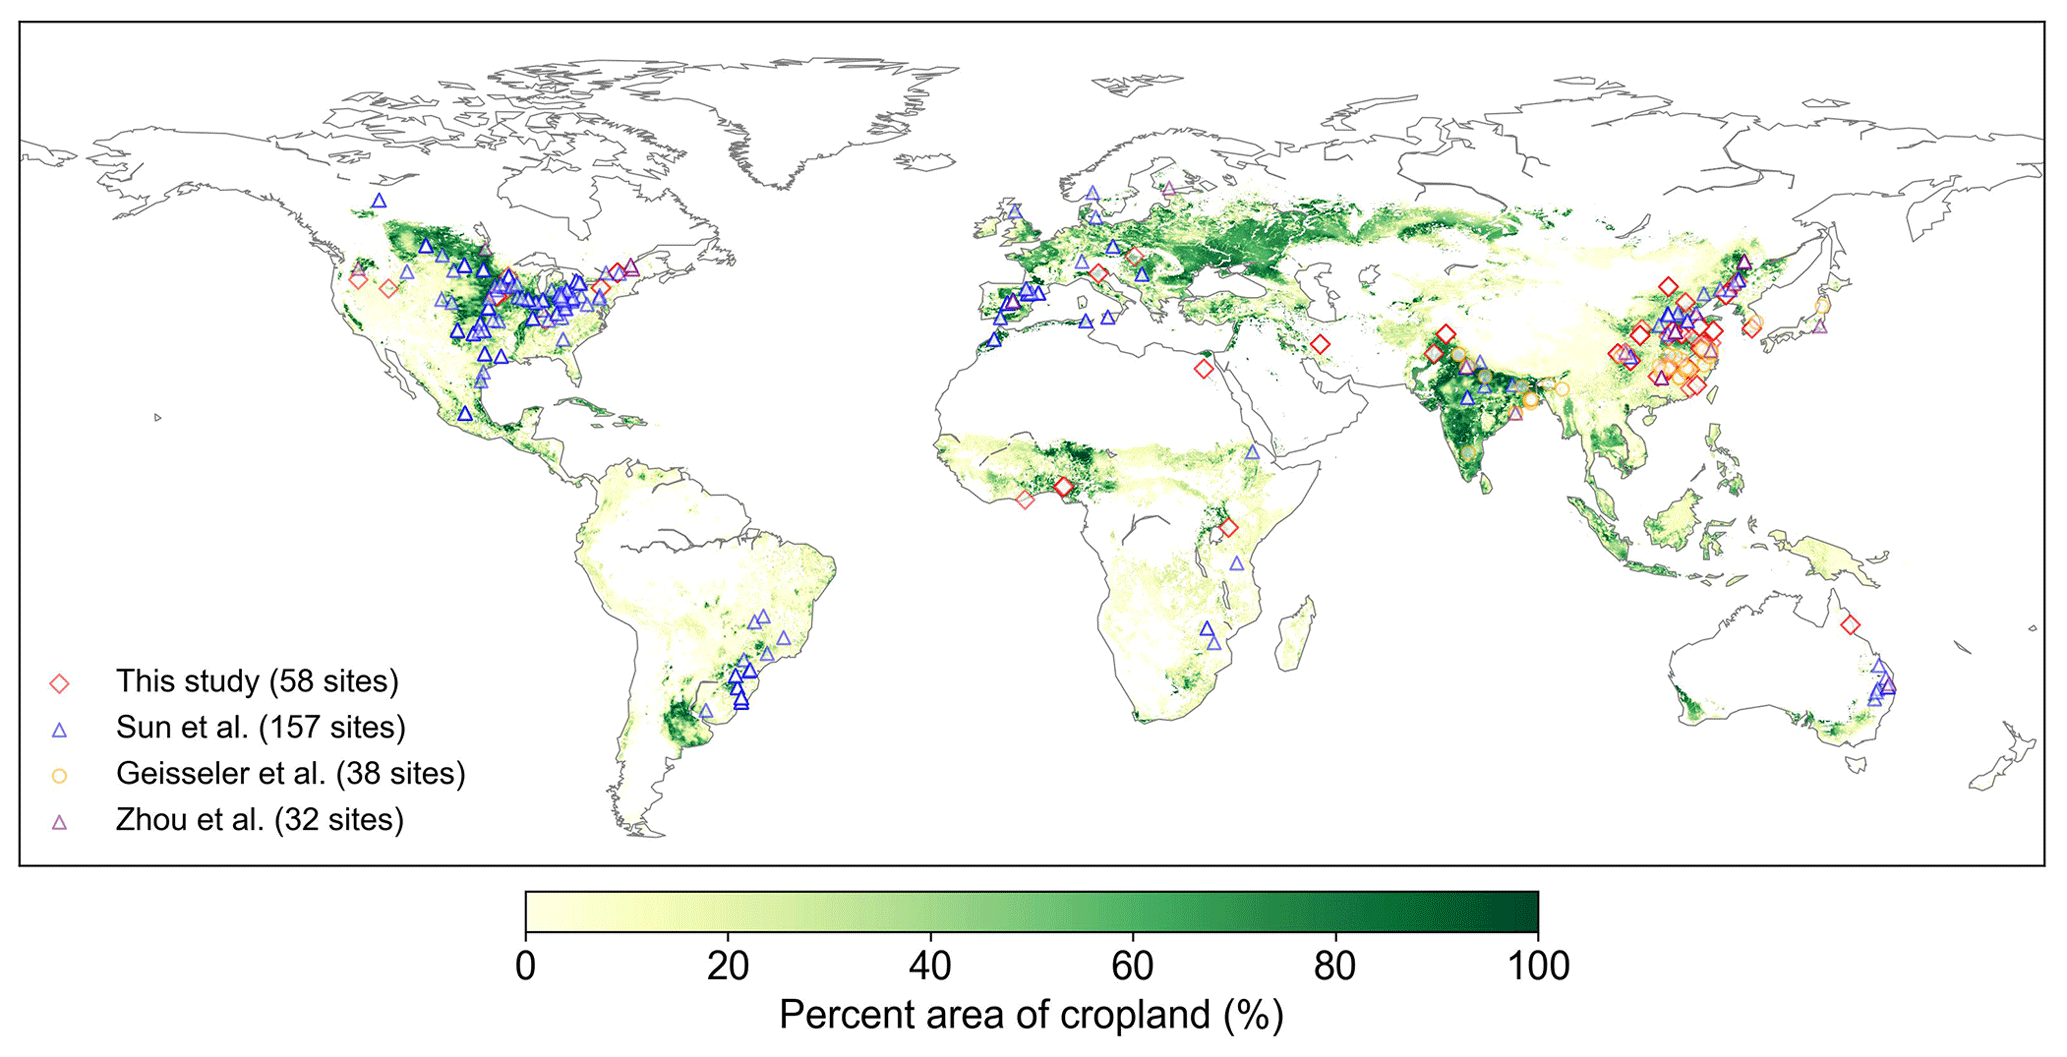
Figure 2Locations of the field cropland SOC measurements with or without biochar addition collected in this study and SOC measurements without biochar addition from Sun et al. (2020), Geisseler et al. (2017), and M. Zhou et al. (2017). The number of sites is also shown in the legend. Note that one site may have multiple paired SOC data due to the various experimental conditions of biochar addition at our 58 collection sites. The cropland area percentage in each 10 km × 10 km grid cell is derived from EarthStat (http://www.earthstat.org, last access: 7 June 2024; Ramankutty et al., 2008).
2.3.2 Calibration and validation for MIMICS versions without biochar
All field SOC observations in the control treatments (without biochar) from the paired measurements and SOC from the other three global datasets (Fig. 2) were assumed to be in a steady state: under present climate and continuous input of crop NPP after 45 % removal of grain with a specific crop litter quality (Sect. 2.1.5, Table S2). SOC pools in MIMICS reached an equilibrium state after about 200 years of simulation (Fig. S3). To accelerate this process, we used the Newton–Raphson method (Press et al., 2007) to obtain the steady SOC state with the site-level inputs of annual mean crop NPP, MAT, Clay, SM, and BD in the parameter optimization. This approach is constructed based on the fundamental principles governing biogeochemical cycle processes in terrestrial ecosystems (e.g., respiration and carbon distribution). A set of ordinary differential equations were built to express the dynamics of carbon flows in soil over time, and these equations can be solved numerically to obtain steady carbon pool sizes. The solver of “mnewt” is used to solve equations by iteratively calculating the values of model function “modelx” and its Jacobian matrix “modeljacx” (see the codes for details in the “Code and data availability” section). The Shuffled Complex Evolution Algorithm (SCE-UA) has been proven to be a robust method for parameter optimization (Duan et al., 1994; Muttil and Jayawardena, 2008), and the SCE-UA method from the “spotpy” package in Python (Houska et al., 2015; https://pypi.org/project/spotpy/, last access: 7 June 2024) was applied here. Parameters are optimal when the root-mean-square error (RMSE; Eq. 17) between the simulated SOC and observed SOC concentrations is minimized. The Akaike information criterion (AIC; Eq. 18; Akaike, 1974), which considers both the model error and the number the model parameters, was also calculated to evaluate different MIMICS versions.
Here, SOCobs,i and SOCsim,i are the observed and simulated SOC at each i site, respectively; n is the number of observations; and p is the number of model parameters to be optimized.
We randomly separated 80 % of the 285 sites for the MIMICS versions' (MIMICS-def, MIMICS-T, MIMICS-TS, and MIMICS-TSM) calibration, and we used the remaining 20 % for model validation. The R2, RMSE, and AIC were calculated by comparing simulated SOC with the observed SOC in training and test datasets. The parameters optimized in different MIMICS versions are shown in Table S3. Soil depth was not explicitly considered in this study, and we assumed that the soil carbon concentrations (g kg−1) are similar within the top 30 cm. Note that the parameters of soil moisture functions (Eqs. 10–12) are directly derived from the original literature (Parton et al., 2000; Camino-Serrano et al., 2018; Yan et al., 2018) and not optimized in MIMICS-TSM. We calibrated the models against our datasets including SOC and auxiliary information (Fig. 2) for the main crop types (maize, rice, and wheat), and the relationships between SOC in these crop types and model input variables (i.e., NPP, MAT, and Clay) were analyzed.
To explore possible soil moisture effects on SOC, we also tried a test assuming that soil moisture affects the microbial growth rate by regulating microbial growth (Vmax) and turnover (τ) of MICr and MICk (Wieder et al., 2019); thus, we added a soil moisture factor (i.e., f(θ) in Eq. 11) on Vmax and τ. We also conducted a sensitivity test of MIMICS input variables (i.e., MAT, Clay, NPP, SM, and BD) with four perturbation levels of −50 %, −25 %, 25 %, and 50 % to explore the effects of possible underrepresented processes on the cropland steady SOC.
2.3.3 Calibration and validation for MIMICS versions with biochar (MIMICS-BC)
For the version of MIMICS with biochar addition, for each site, we ran simulations with a control (without biochar addition) and experimental (with biochar addition) simulation for Age_BC year at hourly time steps, restarted from the previous SOC equilibrium. Note that these simulations for biochar addition are transient runs; thus, SOC is not in a steady state. In order to meet the daily time step of transient runs required by MIMICS, the two model runs are forced by 6 h surface temperature from Climatic Research Unit and Japanese reanalysis data (CRU-JRA; Kobayashi et al., 2015; Harris et al., 2014). Therefore, the climate forcing data are different from those from WorldClim used for the steady runs (Sect. 2.3.2), as hourly climate data are not available in WorldClim. The soil-related inputs of Clay, SM, and BD were assumed to be invariant in time and consistent with input data for the steady SOC runs. The absolute SOC changes (ΔSOC, g kg−1; Eq. 19) in the simulated and observed SOC concentrations were compared after BC addition. The RMSE between simulated and observed ΔSOC was minimized using SCE-UA for parameter optimization. AIC and the slopes of regression lines between the simulated and observed SOC changes were analyzed.
where Xt and Xc are the observed (or simulated) SOC concentrations with and without biochar addition, respectively.
The 134 paired observations were randomly split into training samples for parameter optimization (80 % of the data) and test samples for model validation (20 % of the data). Four tests were conducted to evaluate the performance of MIMICSTSMb-BC with respect to simulating SOC changes after biochar addition using the optimized parameter values in MIMICS-TSMb (i.e., av, ak, kd, β, kba, c1, and c2; Table S3):
-
without biochar-related parameters (MIMICSTSMb-BCdef);
-
with only one new biochar-related parameter (i.e., the desorption coefficient, fd; Eq. 15) optimized (MIMICSTSMb-BCD);
-
with a further one new biochar-related parameter (i.e., the decomposition rate coefficient, fv; Eq. 16) optimized and fv included in all decomposition processes (MIMICSTSMb-BCDV);
-
same as (3) but fv only included in the fluxes from SOCa to the MIC pools (MIMICSTSMb-BCDV-SOCa).
Although MIMICS-TSMb is not the model with the highest R2 and lowest RMSE and AIC, the differences in the R2, RMSE, and AIC among various versions are relatively small (Fig. S5). The new processes (density-dependent processes, sorption, and soil moisture scalars) are based on a theoretical understanding and have been shown to improve predictions of soil carbon in previous studies (Zhang et al., 2020; Liang et al., 2019; Abramoff et al., 2022). Thus, this version was used for further development of biochar processes in MIMICS. As an alternative model version, we also tested the implementation of biochar processes in MIMICS-T, which has the highest R2 and lowest RMSE and AIC in model validation (Fig. S5b). The model versions and simulation settings are shown in Table 1 and Fig. 3, and the optimized parameters values in these tests are shown in Table S3.
The relationships between observed ΔSOC and model input variables and the partial correlations between biases (simulated minus observed ΔSOC) from the four tests and model input variables (soil-, climate-, biology-, and biochar-related variables) were also analyzed to detect the possible missing processes. The availability of carbon in biochar may affect the magnitude of PEs. Thus, we tested the MIMICSTSMb-BC versions using a different initial value of the partitioning coefficient from biochar carbon to SOCa (fba) (2 % according to Lychuk et al., 2014, compared with the original value of 20 % in Sect. 2.2). The partitioning coefficients of fbp and fba were also optimized to evaluate the model performance. Considering the uncertainties in the MIMICS-BC parameters, we conducted a sensitivity test of biochar-related parameters (i.e., fd, fv, fbp, and fba), microbe-related parameters (MGE and τ), and input variables (i.e., Rate_BC, Age_BC, NPP, Clay, and SM) by perturbing one parameter at a time while keeping all others unchanged for each site. Four perturbation levels of −50 %, −25 %, 25 %, and 50 % were set.
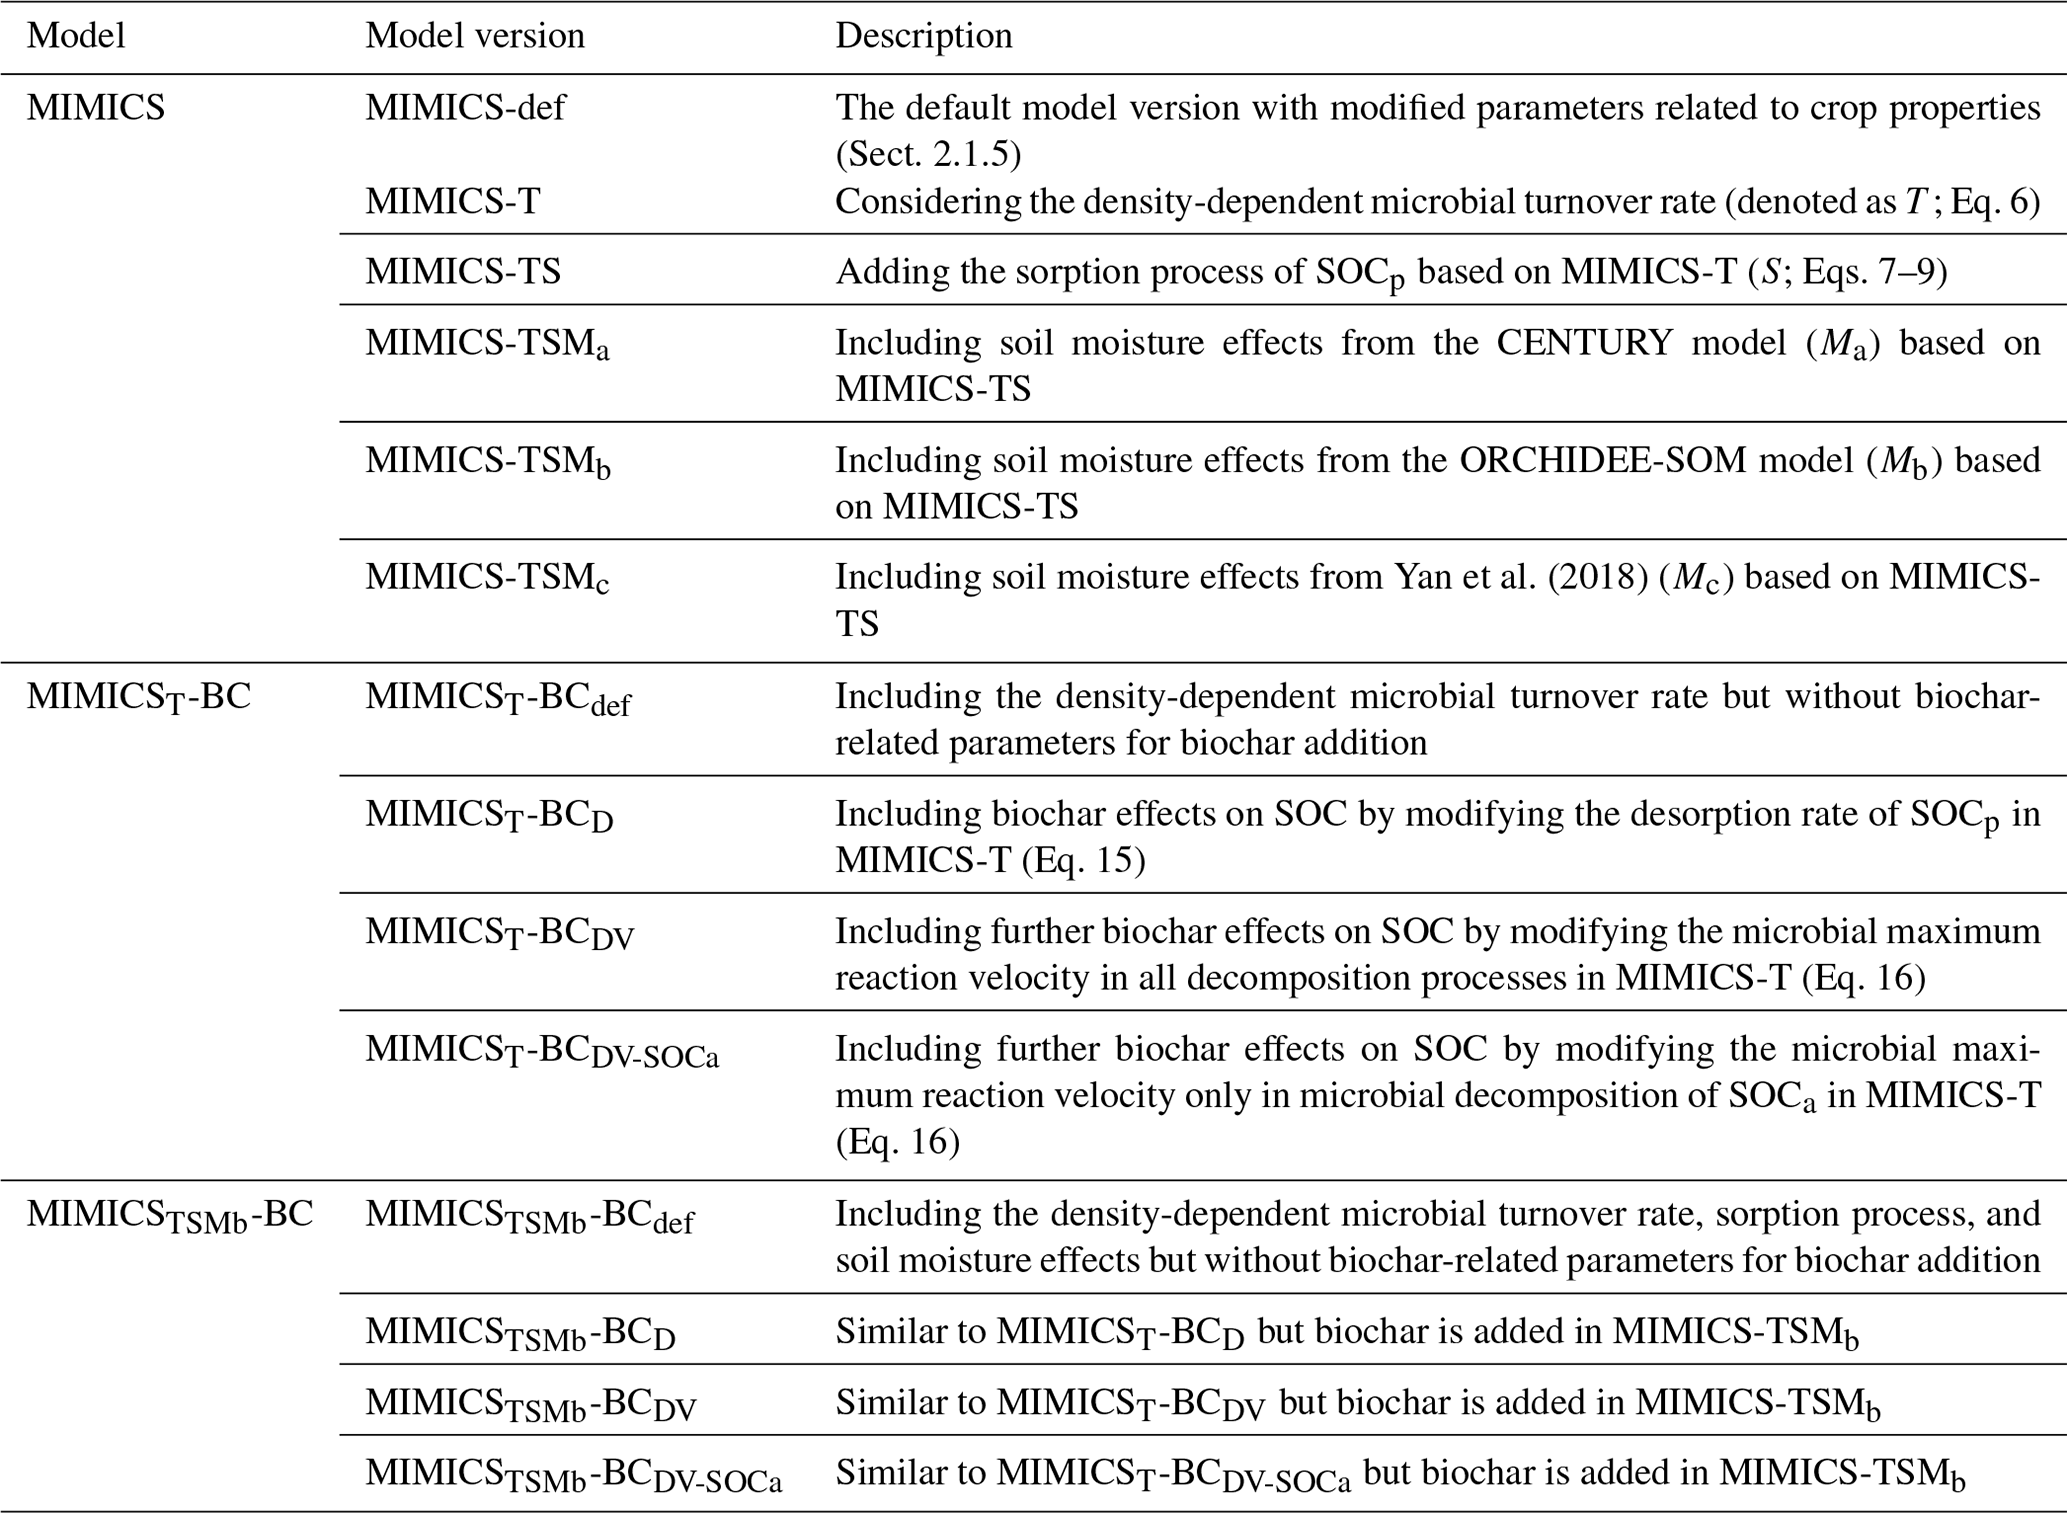
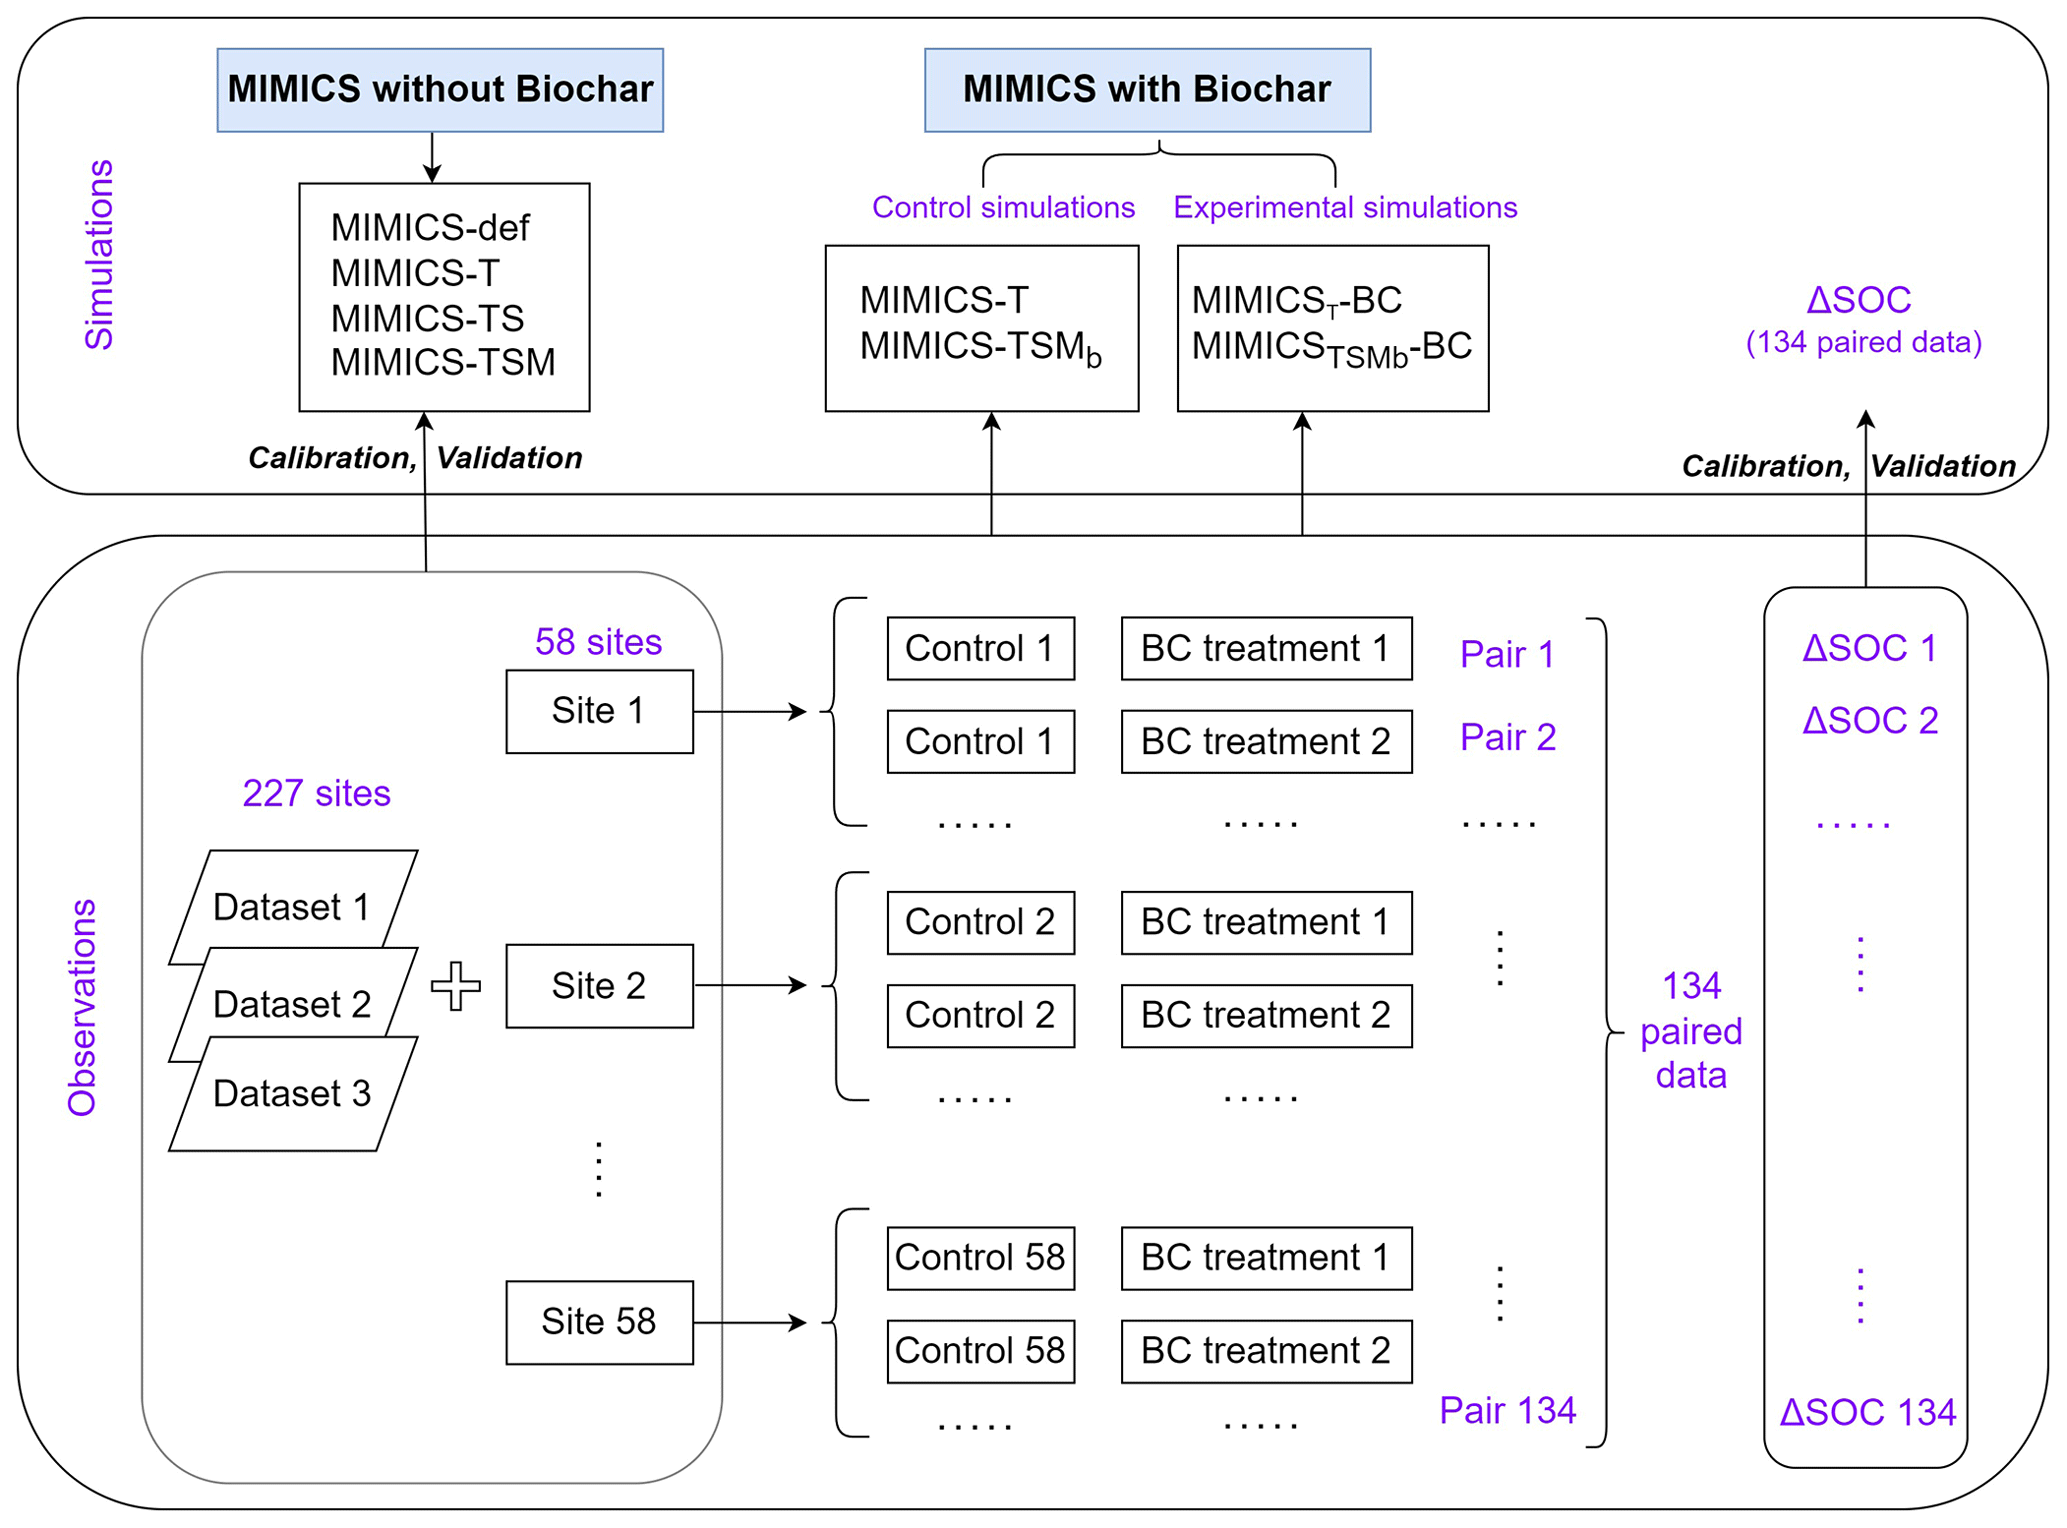
Figure 3Diagram of field measurement SOC data and the model simulation settings. The simulated or observed ΔSOC is equal to SOC with the biochar addition treatment minus that in the control treatment (without biochar addition). Note that one control treatment may correspond to multiple BC treatments with different applied BC rates at one single site.
3.1 Performance of different MIMICS versions without biochar for simulating cropland SOC
3.1.1 Calibration and validation for MIMICS versions without biochar
We split the data for calibration (80 %) and validation (20 %) of MIMICS versions without biochar-related processes. When using 20 % of the data for the independent model validation, MIMICS-T also performs best, with the highest accuracy (R2=0.56), the lowest RMSE (4.82 g kg−1), and the lowest AIC (187.2) among all model versions (Figs. 4, S5b). Compared with MIMICS-def (R2=0.51, RMSE = 4.97 g kg−1, AIC = 188.8) (Figs. 4e, S5b), MIMICS-TS and MIMICS-TSMb have a better correlation (R2=0.52 and 0.52) but a higher RMSE (RMSE = 5.01 and 5.05 g kg−1) and AIC (AIC = 197.7 and 198.6) between the observed and simulated cropland SOC concentration. The R2 of the MIMICS-TSM versions ranges from 0.46 to 0.52, and R2 of MIMICS-TSMb is the highest among the model versions. We also evaluated the performance of the MIMICS-TSMb version calibrated with cropland SOC data under different crop types. The model performance varies among different crop types (i.e., maize, rice, and wheat). The R2 between the simulated SOC concentrations by MIMICS-TSMb and observations is higher for maize and wheat (0.84 and 0.74, respectively; Fig. S6a, c) but lowest for rice (0.38; Fig. S6b). This is probably because the flooded condition in the paddy field limits SOC decomposition, which is partly supported by the weaker correlation between SOC and NPP for rice (R2=0.06; Fig. S7d) than that for maize and wheat (R2=0.77 and 0.54; Fig. S7a, g). Although MIMICS-TSMb has the soil moisture processes (Sect. 2.1.4), the flooding conditions in the paddy field are not available and are not explicitly forced in these rice sites.
To align with the resolution of climate input variables used in the transient simulations (Sect. 2.3.1), we tested MIMICS after aggregating cropland SOC sites within each 0.5° × 0.5° grid cell instead of using each site directly, and the model can reproduce about 45 %–55 % of the SOC spatial variation (Fig. S8), slightly lower than that using site-specific data (R2=0.51–0.56; Fig. 4e). This shows that site-specific data are more accurate for model simulation, but the small difference also suggests that using grid climate data (0.5° × 0.5°) to drive the model has a relatively small impact on predicting SOC in the transient simulations.
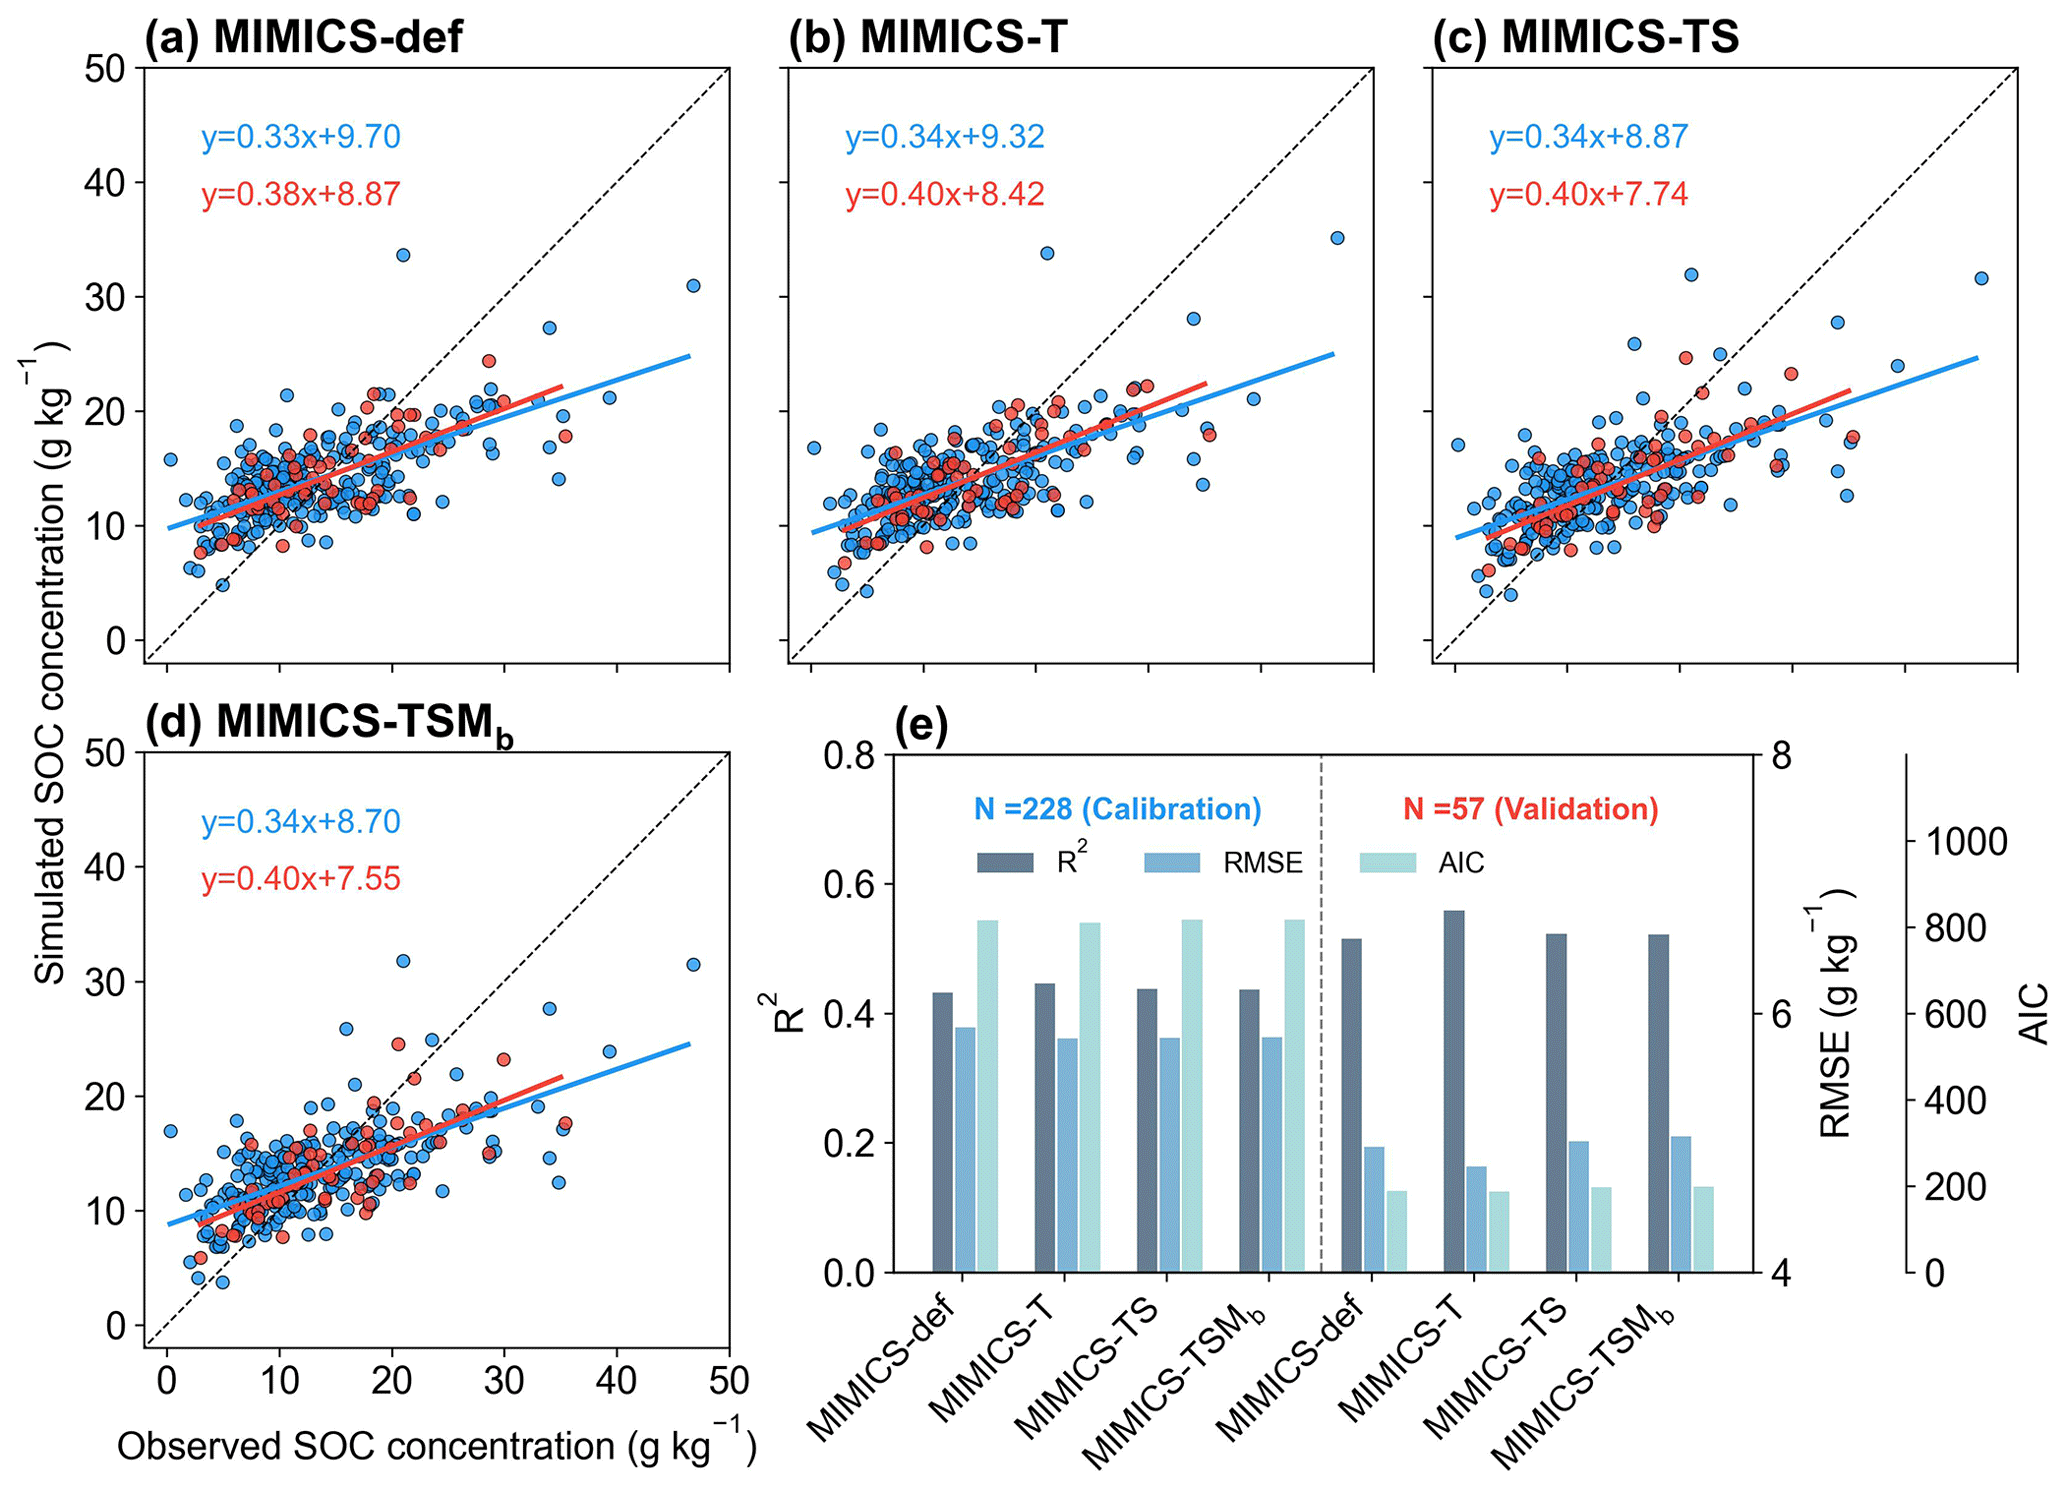
Figure 4Comparison between the observed and simulated SOC concentrations by (a) MIMICS-def, (b) MIMICS-T, (c) MIMICS-TS, and (d) MIMICS-TSMb. Blue and red dots in panels (a)–(d) represent observation sites for model calibration (80 % sites) and validation (20 % sites), respectively. Panel (e) presents the R2, root-mean-square error (RMSE), and Akaike information criterion (AIC) from the model calibration (left) and validation (right) for the four MIMICS versions. The values for the bar graphs in Fig. 4e can be found in Fig. S5. Relationships for the other MIMICS versions can be found in Fig. S9.
3.1.2 Sensitivity analyses for MIMICS versions without biochar
To explore the possible effects of soil moisture on SOC dynamics by affecting different processes (Sect. 2.3.2), we assumed that the microbial turnover (τ) was also affected by soil moisture in addition to the microbial reaction velocity (Vmax). The model with the soil moisture effects does not predict SOC concentrations more accurately (R2=0.46, RMSE = 5.06 g kg−1, AIC = 198.9; Fig. S10b) than the MIMICS-TSMb version in which Vmax and Km are affected (R2=0.52, RMSE = 5.05 g kg−1, AIC = 198.6; Figs. 4d, S5b). This may be because the inclusion of soil moisture effects on Vmax and τ complicates the model processes, and other microbe-related observations, such as soil microbial carbon and soil heterotrophic respiration, are needed to further constrain these processes in MIMICS.
We analyzed the responses of the MIMICS model to changes in input variables, in order to identify the important variables and explore possible missing processes related to these variables (Sect. 2.3.2). The perturbation of MIMICS input variables shows that the size of the steady SOC pool is positively correlated with NPP and Clay but negatively correlated with MAT and BD. The responses of steady SOC to the perturbation of BD, MAT, and NPP are relatively large (Fig. 5). Improving processes associated with these variables in MIMICS will enhance the prediction accuracy of the model.
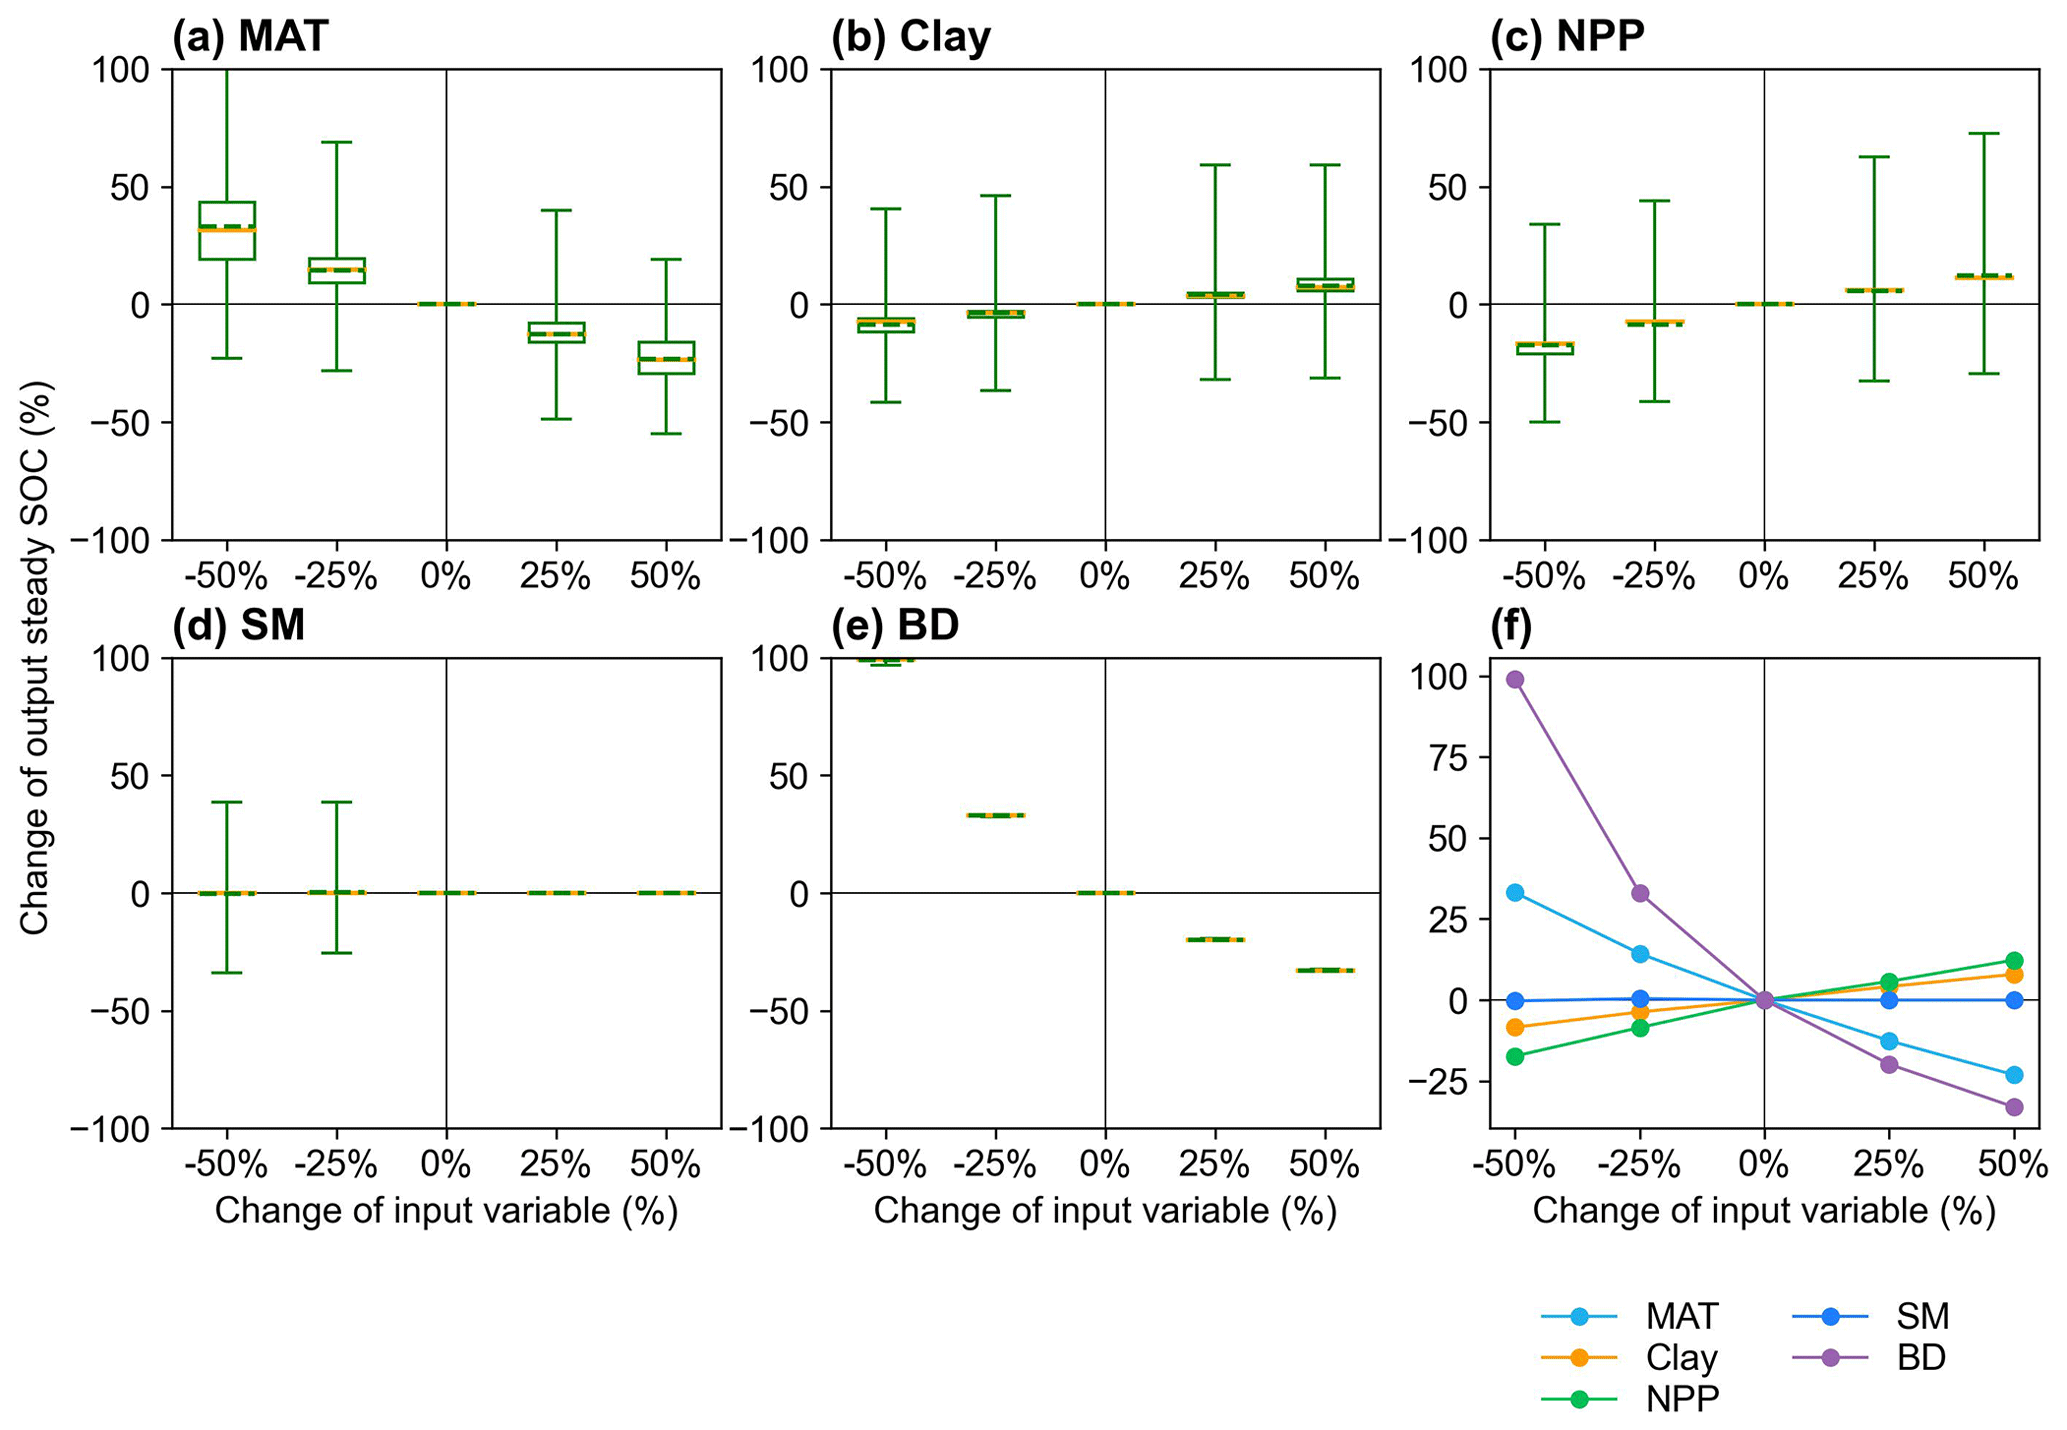
Figure 5Sensitivity analysis of responses of the steady SOC simulated by MIMICS to the input variables (a) MAT, (b) Clay, (c) NPP, (d) SM, and (e) BD with different perturbation levels. The yellow lines and the dotted green lines in the box plots are the respective median and mean values of the output steady SOC changes at calibrated sites. The average SOC changes at calibrated sites for the four perturbation levels are shown in panel (f).
3.2 Calibration and evaluation of MIMICS-BC
3.2.1 Calibration and validation for MIMICS-BC versions
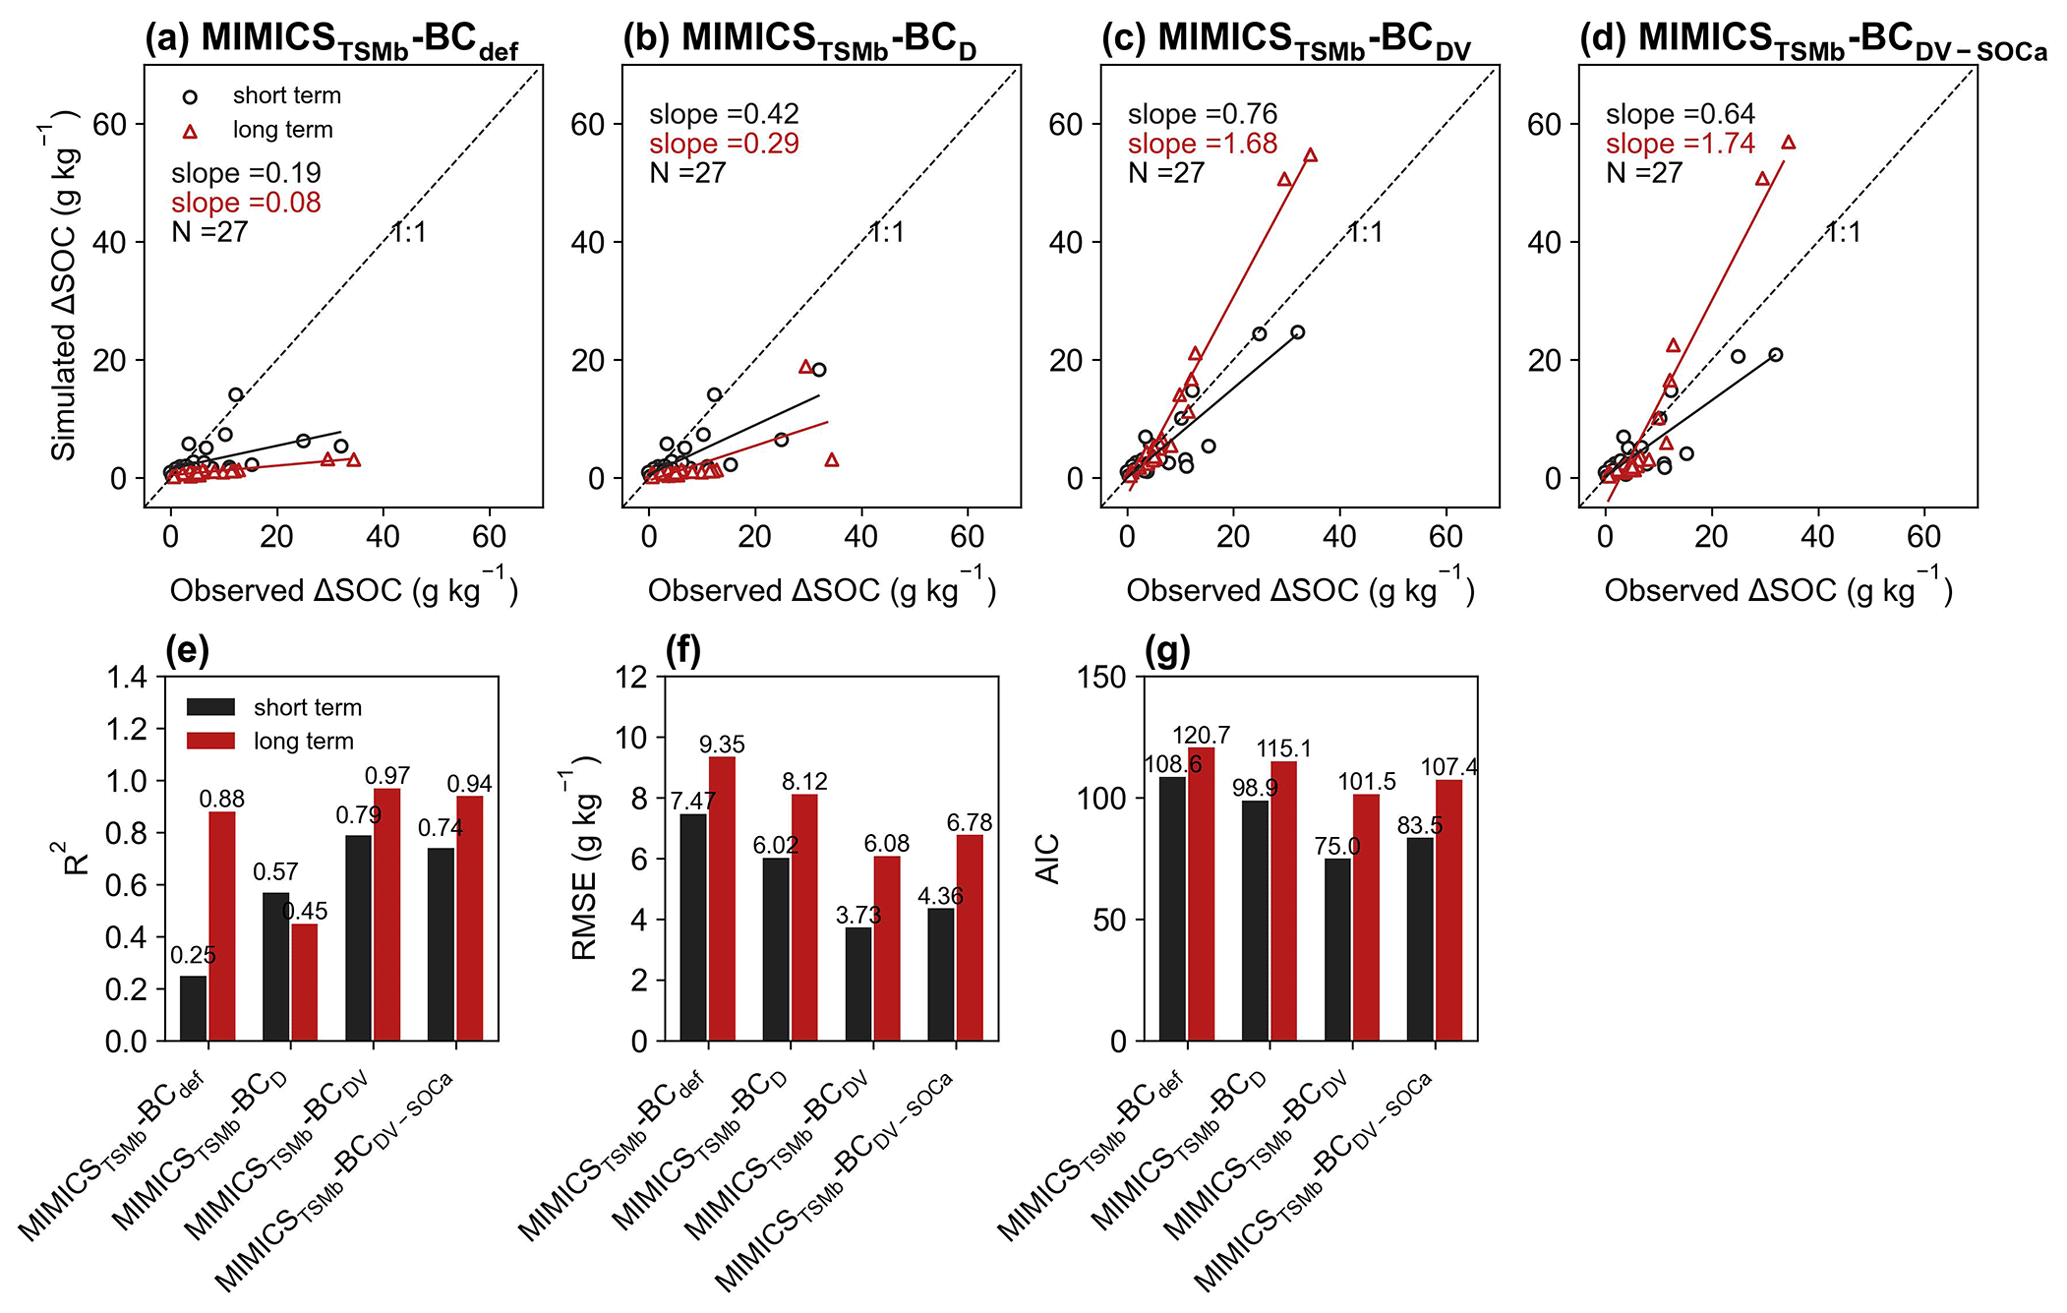
For the model validation using short-term observation data that were not used for calibration (Figs. 6, 7, S11, S12), the performance of MIMICST-BCDV-SOCa (R2=0.80, RMSE = 3.38 g kg−1, AIC = 69.8; Fig. 6e–g) is slightly better than MIMICST-BCD (R2=0.79, RMSE=3.43 g kg−1, AIC = 68.5) and MIMICST-BCDV (R2=0.76, RMSE = 3.66 g kg−1, AIC=74.1), except that the AIC (69.8) is higher than that of MIMICST-BCD (68.5) (Fig. 6). By comparison, the performance of MIMICST-BCdef is poorer than these three versions. Among the MIMICSTSMb-BC versions, MIMICSTSMb-BCDV performs best with respect to reproducing SOC changes with biochar addition, with the highest R2 (0.79), the lowest RMSE (3.73 g kg−1), and AIC (75.0) (Fig. 7e–g).
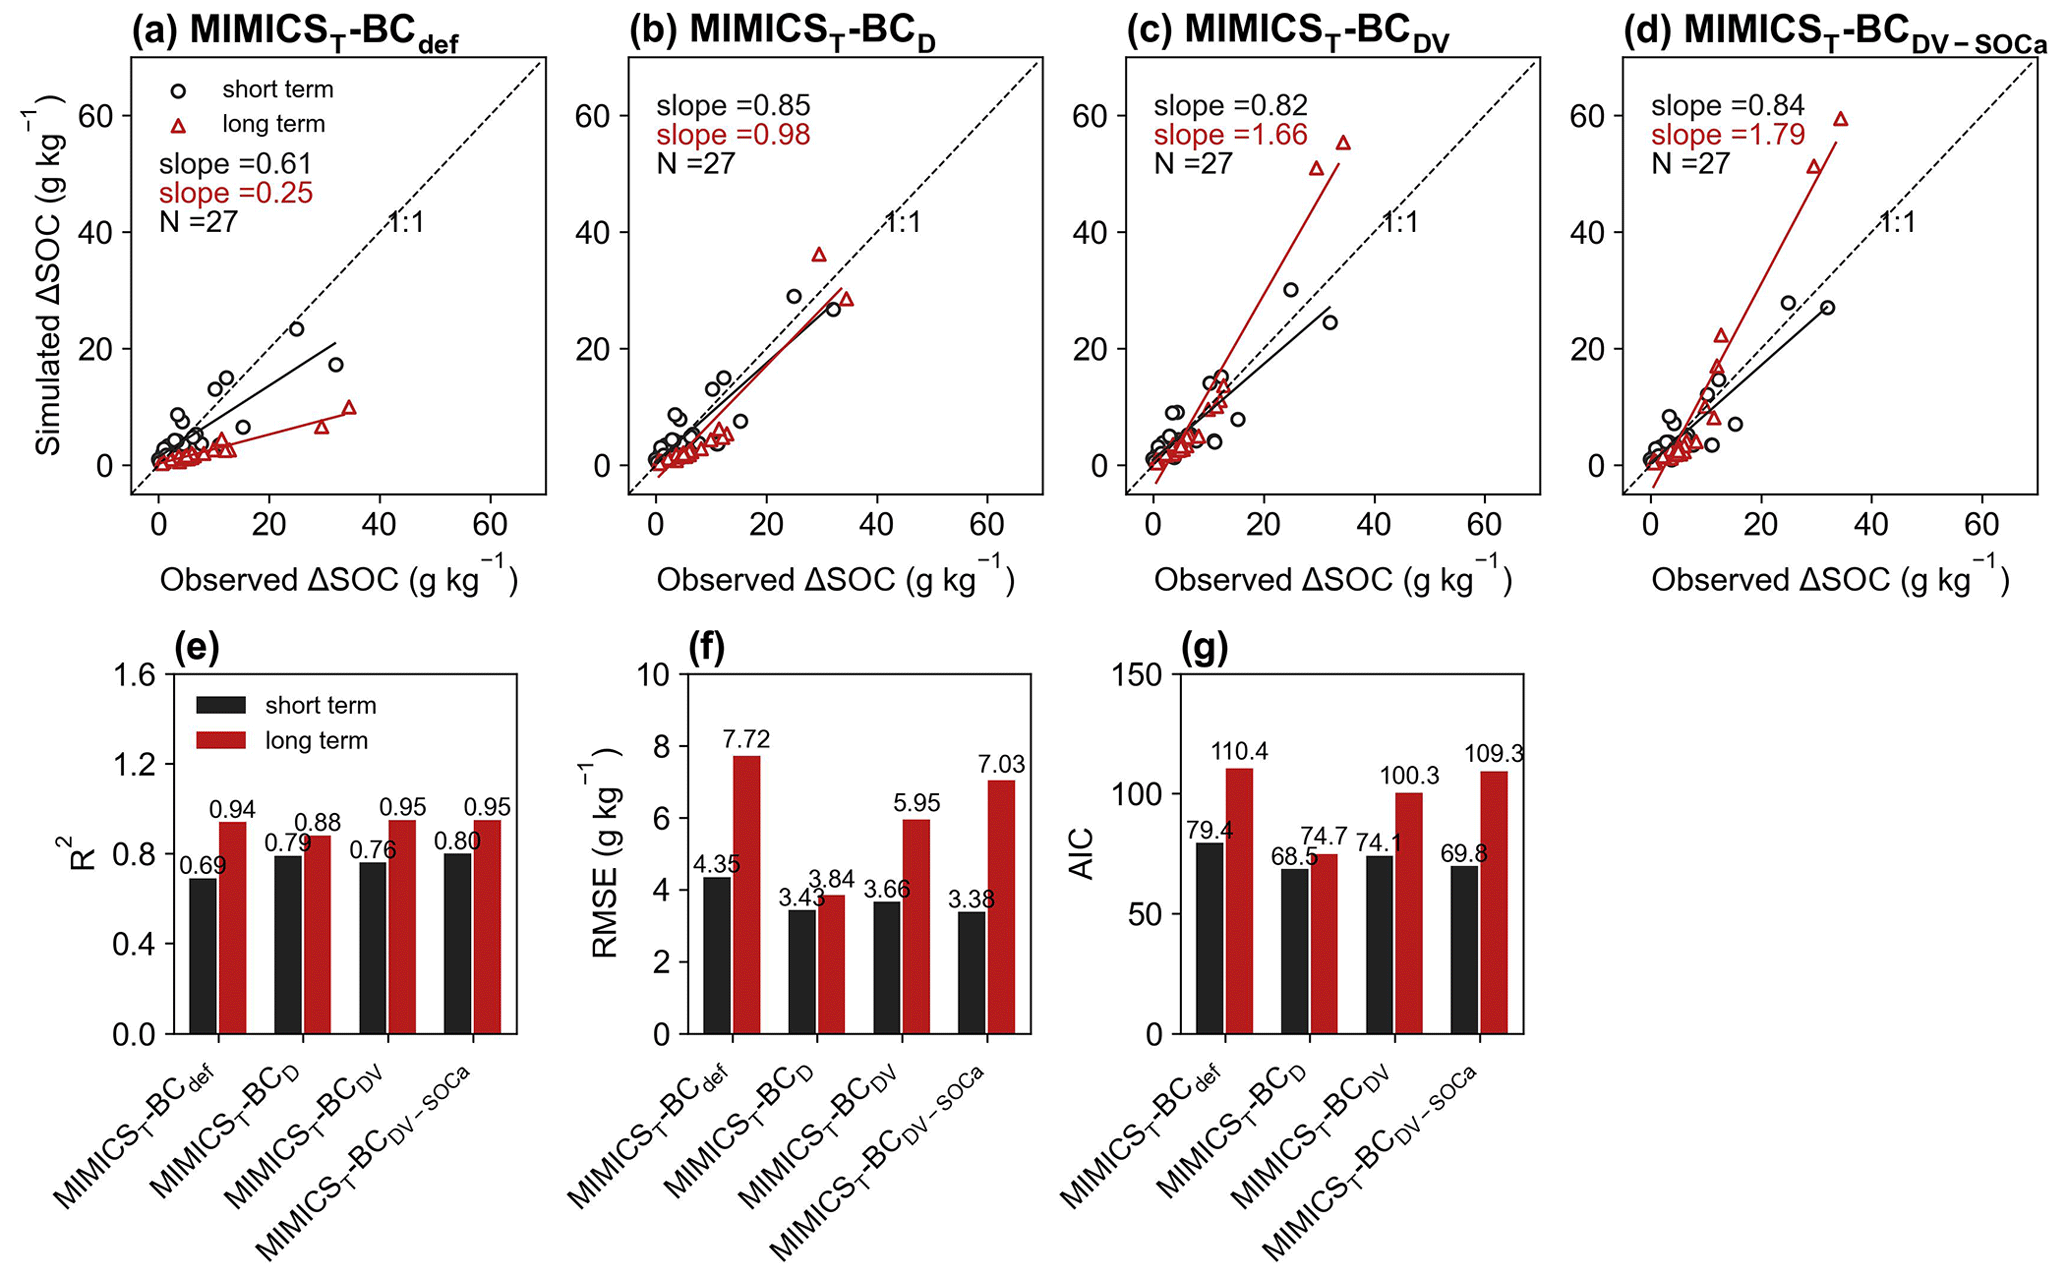
Figure 6Relationships of short-term (≤ 6 years; black) and long-term (i.e., extended to 8 years; red) SOC changes after biochar addition (ΔSOC) between observations and models in the validation dataset. The MIMICS versions used include MIMICST-BCdef (a), MIMICST-BCD (b), MIMICST-BCDV (c), and MIMICST-BCDV-SOCa (d). Comparisons of R2 (e), the root-mean-square error (RMSE, f), and the Akaike information criterion (AIC, g) among the four MIMICST-BC versions are shown separately. For information on the model versions, the reader is referred to Table 1.
For the model validation using the long-term (extended to 8 years based on biochar decomposition curve; Wang et al., 2016) SOC changes after biochar addition, MIMICST-BCdef and MIMICSTSMb-BCdef underestimate the extrapolated observations of SOC change (Figs. 6a, 7a). MIMICST-BCD shows the best performance, with the lowest RMSE (3.84 g kg−1) and AIC (74.7), among all of the MIMICST-BC versions (Fig. 6). Compared with MIMICSTSMb-BCdef (R2=0.88, RMSE = 9.35 g kg−1, slope = 0.08, AIC =120.7; Fig. 7a, e, f, g), predictions of MIMICSTSMb-BCD, MIMICSTSMb-BCDV, and MIMICSTSMb-BCDV-SOCa are more accurate, with a smaller RMSE (8.12, 6.08 and 6.78 g kg−1; Fig. 7f), a smaller AIC (115.1, 101.5 and 107.4; Fig. 7g), a linear slope closer to 1 (0.29, 1.68 and 1.74; Fig. 7a–d), and a reasonable R2 accuracy (0.45, 0.97 and 0.94; Fig. 7e). Among the different MIMICSTSMb-BC versions, MIMICSTSMb-BCDV shows the best performance (Fig. 7). When assuming that biochar produces a PE only through affecting the utilization rate of SOCa by microbes (MIMICSTSMb-BCDV-SOCa), the model accuracy is slightly poorer, with a lower R2 (= 0.94), a higher RMSE (= 6.78 g kg−1), and a higher AIC (= 107.4) than MIMICSTSMb-BCDV which assumes that all decomposition processes are affected (Fig. 7).
3.2.2 Error analysis for MIMICS-BC versions
The biases between the simulated and observed short-term SOC changes with biochar addition are significantly correlated with Rate_BC and Clay (p<0.05), but they only vary marginally with SM, MAT, and NPP when additional parameters are optimized (Fig. S13). The biases between long-term observations and simulations by MIMICSTSMb-BCdef are significantly correlated with Rate_BC () (Fig. 8), suggesting that the model may underrepresent processes related to Rate_BC. By considering biochar effects on the SOC desorption (MIMICSTSMb-BCD), the correlations of model biases with Rate_BC, BD, SM, and NPP become weaker (Fig. 8). MIMICSTSMb-BCDV, which incorporates the biochar impacts on the microbial decomposition rate, further reduces the correlations between model biases and the variables of Rate_BC, Age_BC, and BD, but it increases biases related to SM. MIMICSTSMb-BCDV-SOCa, which includes the impacts on microbial decomposition rate only in the fluxes from the SOCa to MIC pools, can also reduce the correlations between model biases and the variables of Rate_BC and BD, but the correlations change little with Clay and Age_BC (Fig. 8).
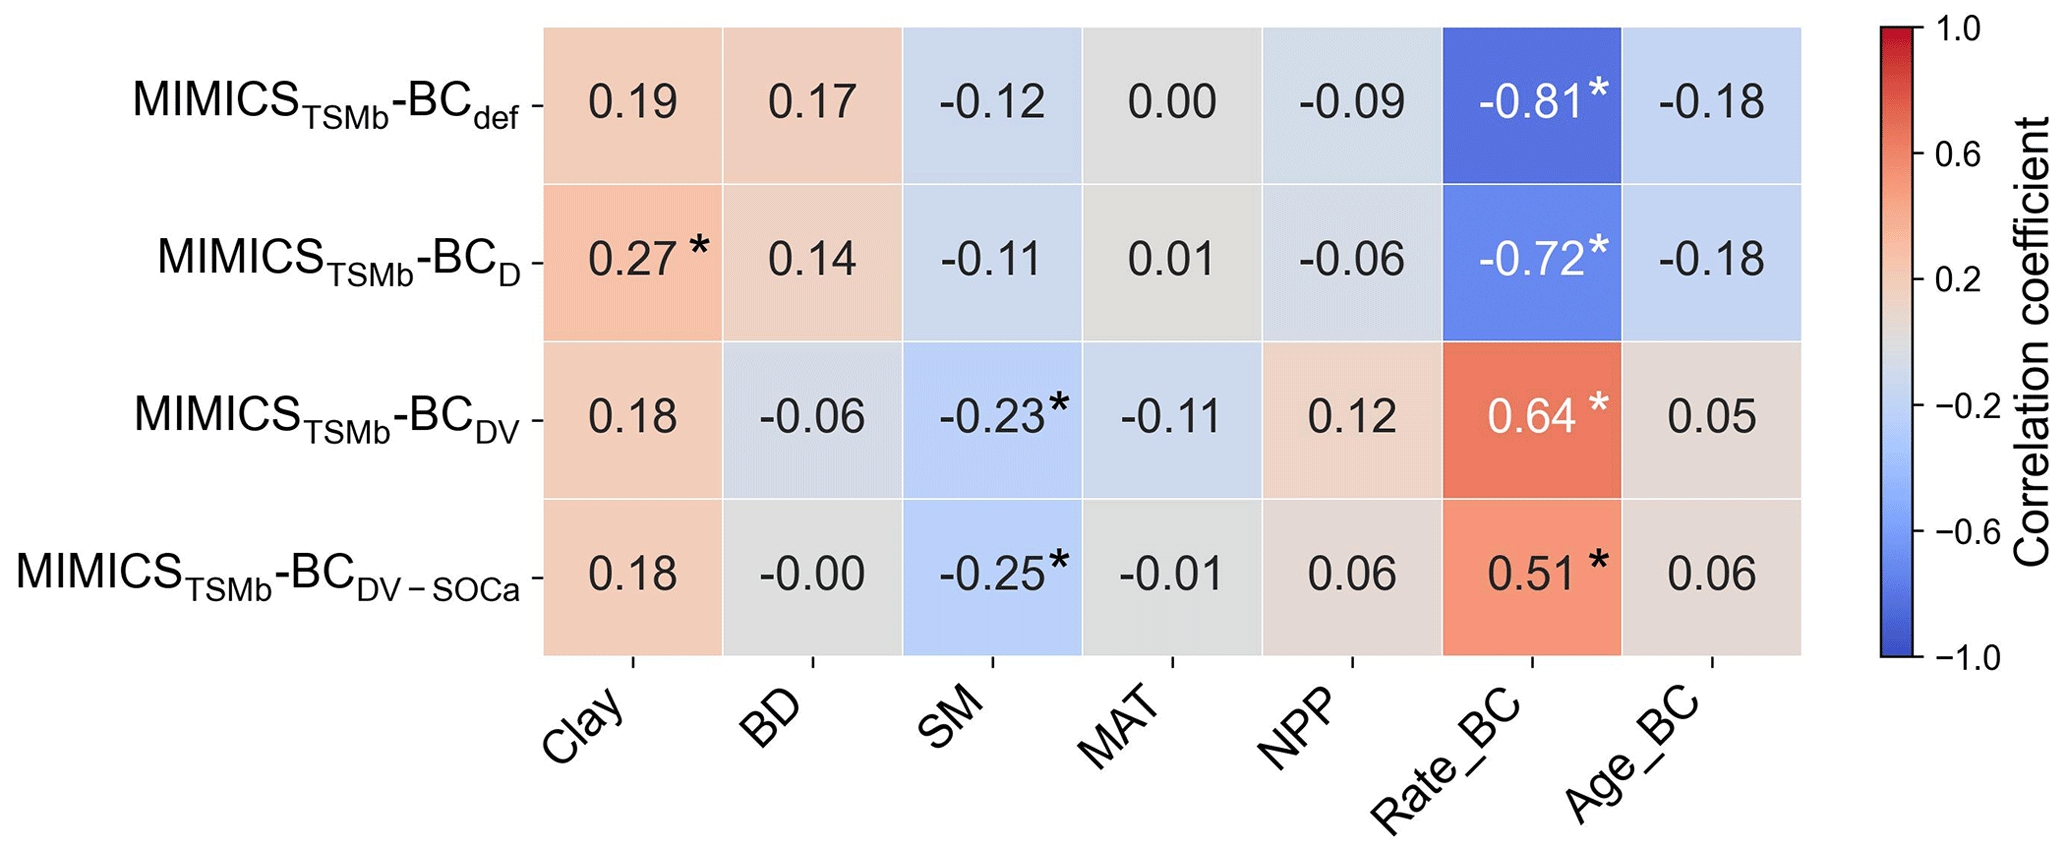
Figure 8Correlations between the MIMICSTSMb-BC biases (i.e., simulated long-term ΔSOC minus observed ΔSOC) and input soil-related (Clay, BD, and SM), climate-related (MAT), biology-related (NPP), and biochar-related (Rate_BC and Age_BC) variables for MIMICSTSMb-BCdef, MIMICSTSMb-BCD, MIMICSTSMb-BCDV, and MIMICSTSMb-BCDV-SOCa. Asterisks indicate significant correlations (p<0.05).
3.2.3 Sensitivity analyses for MIMICS-BC versions
The test of the partitioning coefficient from biochar to SOCa (fba) with 2 % for the MIMICSTSMb-BC model (Sect. 2.3.3) shows a similar R2 (0.35–0.79; Fig. S14) to that from fba=20 % in the short term (0.25–0.79; Fig. 7). The optimization of the partitioning coefficient from biochar carbon to SOCp (fbp) and fba shows a better performance (R2=0.80, RMSE = 3.44 g kg−1, AIC = 66.7; Fig. S15) than MIMICSTSMb-BCDV without these two parameters optimized (Fig. 7).
The responses of ΔSOC to parameter perturbations show that fv and fd affect ΔSOC with biochar addition in the opposite directions and that ΔSOC is more sensitive to the partitioning coefficient fbp than to fd, fv, and fba (Fig. 9). ΔSOC is more sensitive to Rate_BC than Age_BC. The sensitivity of the ΔSOC to τ is greater than that to MGE (Fig. S16), and the two parameters may be influenced by biochar but are not considered in the current MIMICS-BC versions. The sensitivity tests for the model input variables, i.e., crop net primary productivity (NPP), soil clay content (Clay), and soil moisture (SM), show that Clay is very important to the model outputs, while the impacts of NPP and SM are relatively smaller (Fig. S16).
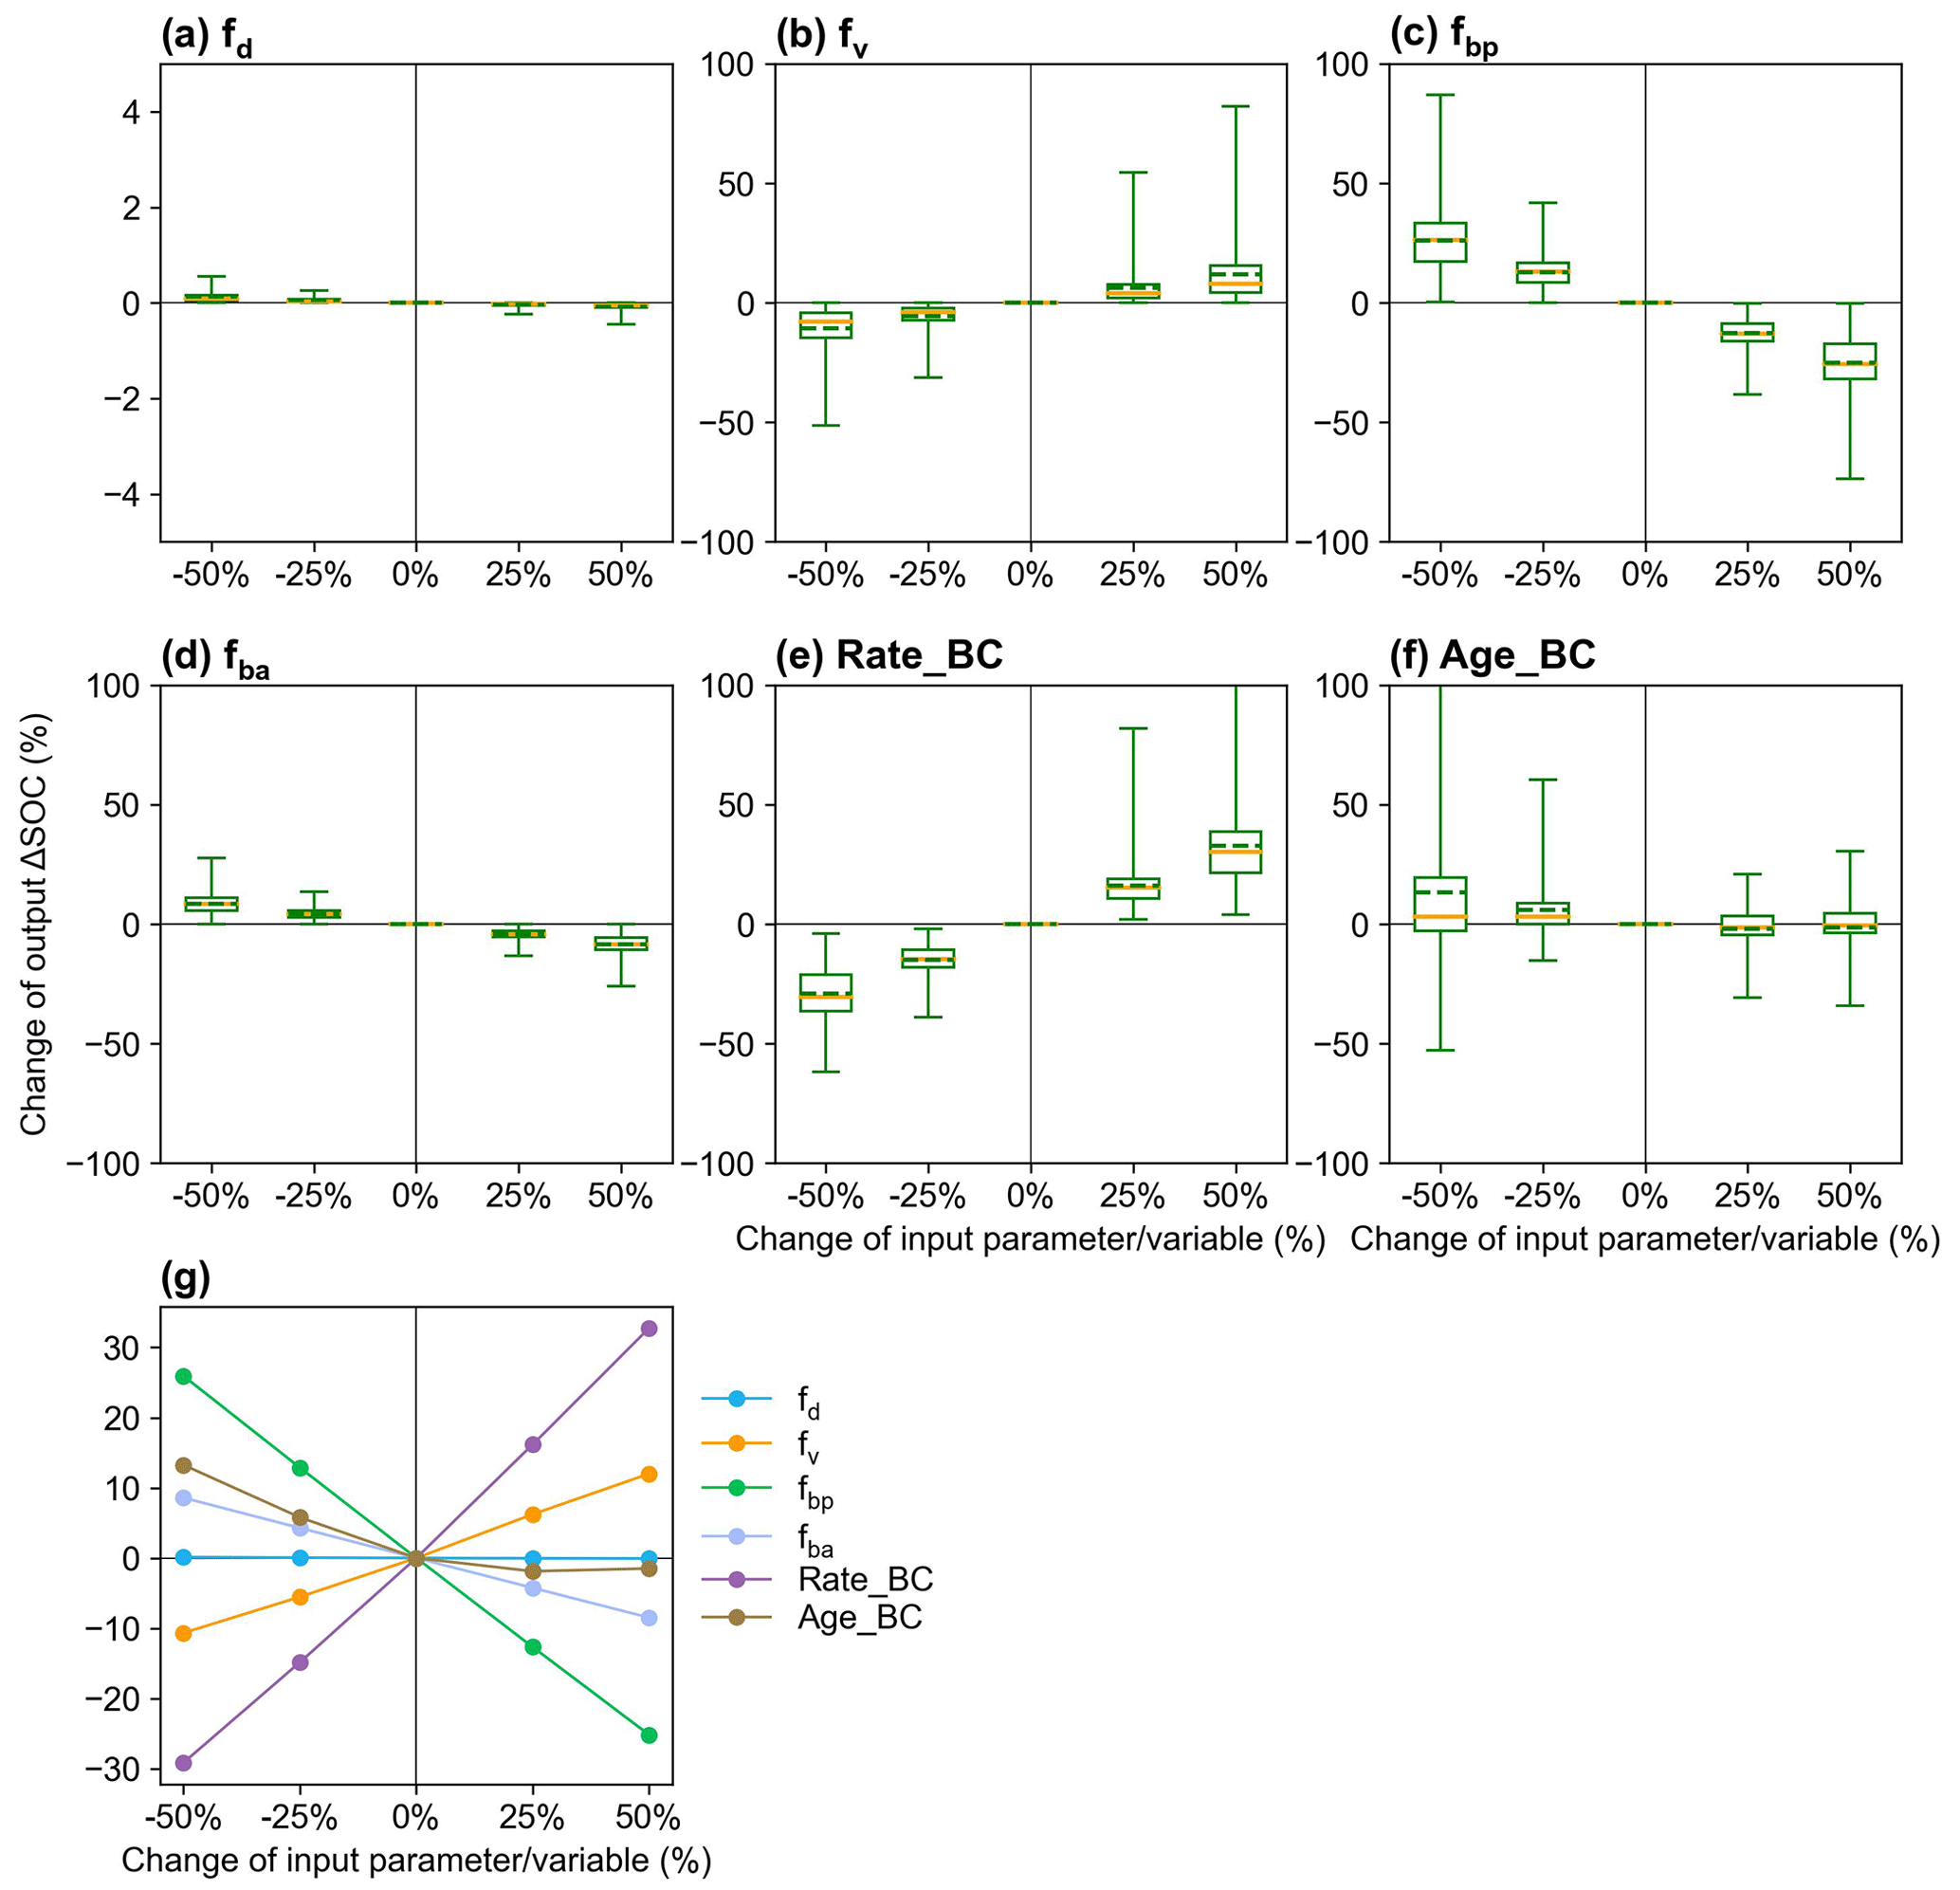
Figure 9Sensitivity analysis of MIMICS-BC model parameters of (a) fd (desorption coefficient; Eq. 15), (b) fv (decomposition rate coefficient; Eq. 16), (c) fbp (partitioning coefficient from biochar carbon to SOCp; Fig. 1), (d) fba (partitioning coefficient from biochar carbon to SOCa; Fig. 1), and the biochar-related input variables of (e) Rate_BC and (f) Age_BC. The yellow lines and the dotted green line in the box plots are the respective median and mean values of the changes in model output (i.e., change in ΔSOC; Eq. 19). The mean values of change in output ΔSOC at calibrated sites are shown in panel (g).
4.1 Cropland SOC-related processes
4.1.1 Missing processes in the MIMICS model
We presented a framework to quantify the impact of density-dependent microbial turnover, sorption, and soil moisture effects on cropland SOC dynamics. Regulatory mechanisms (e.g., competition) may limit microbial population sizes, and neglecting this process could lead to indefinite microbial biomass growth with increasing litter inputs (Georgiou et al., 2017). Our analysis demonstrates that restricting microbial biomass size through density-dependent microbial turnover (MIMICS-T) slightly improves the model performance (Fig. 4), but further including sorption and soil moisture effects (MIMICS-TS and MIMICS-TSM) has a negligible contribution to the model performance. One possible reason for this is that the inclusion of these new processes greatly increases model complexity; however, in the parameter calibrations, SOC is still the only observational variable to constrain all of the newly added processes. Therefore, the model parameters may not be fully constrained due to the lack of direct observations of these new processes.
Another reason is that some other possibly important processes are missing from the model. For example, the MIMICS-TS version considers the impacts of soil clay on the adsorption capacity of SOCa, but soil pH, ionic strength, and mineral content are also found to be important to the sorption–desorption of SOC (Kothawala et al., 2009; Mayes et al., 2012). The metal ion Ca2+ can form bonds between negatively charged clay minerals and available SOC via cation bridging, enhancing the adsorption of available SOC by soil clay minerals (Roychand and Marschner, 2014; Setia et al., 2013). Soil pH can also impact SOC sorption by altering the ionization degree and the surface change in SOC molecules (Shen, 1999). Moreover, iron minerals can preferentially bind to lignin components through sorption and coprecipitation, protecting them from microbial degradation and, consequently, increasing SOC (Liao et al., 2022). In addition to the sorption–desorption process that is associated with microbial accessibility to SOC, other factors that influence microbial activity are also underrepresented in MIMICS, such as the soil nutrient availability (e.g., nitrogen), which greatly impacts microbial use efficiency and growth rate (Manzoni et al., 2017). These processes improve our understanding of the mechanisms of SOC dynamics and should be incorporated in the model to represent the microbe–mineral processes realistically and mechanistically.
However, as shown in our results, without further observational constraints on each respective process, the model performance only relying on calibrations against total SOC contents may not improve. Therefore, various versions of MIMICS, representing different levels of our understanding of microbe–mineral processes, are retained in our study for further calibrations when sufficient observations emerge.
4.1.2 Cropland management impacts
Cropland management disturbs soils frequently, and the assumed equilibrium state of SOC may not be realistic, which also partly explains the mismatch between simulated and observed SOC. Agricultural management (e.g., irrigation and tillage) is an important factor that affects SOC decomposition and accumulation in croplands. The poor performance of MIMICS for rice is probably due to the inability of MIMICS to simulate SOC dynamics under anaerobic conditions stemming from the irrigation practice (Figs. S6–S7). Tillage may disrupt soil aggregates and release physically protected SOC, which is more susceptible to decomposition than that protected by soil aggregates (Six et al., 1999). Juice et al. (2022) modeled tillage effects on SOC loss via the transfer of protected SOC into unprotected pools, i.e., from SOCp to SOCa in this study, and the model can well capture the historical SOC dynamics in the agricultural system with intensive managements, such as different crop types, tillage, or fertilization. Our results from variable perturbation suggest that BD is the key driver of SOC changes, followed by MAT and crop NPP (Fig. 5), suggesting that processes related to these variables have a great effect on the SOC. The soil BD was also found to be affected by tillage practices (Osunbitan et al., 2005), and crop NPP may vary due to crop rotation and fallow practice, which are missing in the model.
In addition, managements such as fertilizer application and possible residue retention can increase SOC stock. Previous evidence indicates that SOC is increased by 11.3 % with residue return (X. Wang et al., 2020) and by 13.3 % with straw return and balanced nitrogen–phosphorus–potassium (NPK) fertilizer (Islam et al., 2023) compared with residue removal. However, these management processes of fertilization and residue retention are not represented in the MIMICS model due to the absence of quantitative management data and the poor understanding of the mechanisms. This may explain the underestimation of SOC by the calibrated MIMICS models at sites with a high carbon density (Fig. 4). Therefore, field measurements of the effects of agricultural practices on SOC dynamic are urgently needed to further improve the model processes (Campbell et al., 2007; Congreves et al., 2015).
4.2 Biochar-related processes
4.2.1 Tested processes in the MIMICS-BC model
Biochar can absorb SOC due to its large specific surface area, high porosity, and further promotion of soil macroaggregate formation (Han et al., 2020; Huang et al., 2018). Consistently, the optimized desorption coefficient ( and −0.0122 for the short term and long term, respectively; Table S3) in MIMICSTSMb-BCD is negative, indicating that the carbon desorption from SOCp to SOCa is reduced with biochar addition. Incorporating the biochar impacts on microbial decomposition velocity in MIMICSTSMb-BCDV further improved the model with biochar addition, but the correlations between model–observation biases and the input variables of biochar application rate (Rate_BC) and soil moisture (SM) are still significant in the long term (p<0.05; Fig. 8), implying that some processes related to these variables are not well represented in the model. For example, biochar addition could increase soil moisture (Razzaghi et al., 2020) and further alter the composition and activity of soil microbial communities (Lehmann et al., 2011). Moreover, the direction and magnitude of biochar effects on SOC are dependent on the biochar addition rate and Age_BC (Ding et al., 2017). Compared with MIMICST-BCDV, MIMICST-BCDV-SOCa performed better with respect to the short-term SOC response to biochar addition but worse in the long-term response (Fig. 6). When biochar is applied, the labile carbon fraction may be immediately utilized by microbes; thus, including the biochar effects on the SOCa process is important for the short-term response. In the long term, the SOC mineralization may be gradually suppressed via physical protection (Zimmerman et al., 2011), but both MIMICST-BCDV and MIMICST-BCDV-SOCa do not include the adsorption process. In the MIMICSTSMb-BC versions, which include the adsorption process, the available SOC may be partly adsorbed by soil minerals and become physically protected. This could lead to the positive PE of biochar on SOC being less evident (Fig. 7).
4.2.2 Missing processes in current MIMICS-BC model
The effects of biochar on SOC are controlled by various factors, such as soil physicochemical and biological properties (e.g., clay, pH, and microbial activity), biochar properties (e.g., feedstock and pyrolysis temperature), and incubation conditions (e.g., periods and crop types) (Ding et al., 2017; Han et al., 2020). Some of these effects are not explicitly considered in the MIMICS biochar version. Biochar addition may change the composition of microbial community, and a previous study reported increased copiotrophic bacteria with a higher growth rate and decreased oligotrophic bacteria in acidic soils with biochar addition (Sheng and Zhu, 2018). This is related to the competition between r- and k-strategy microbes in MIMICS. Microbial carbon use efficiency (CUE) determines the relational proportions of microbial carbon uptake between growth and respiration (H. Zhou et al., 2017), and an increased CUE and reduced turnover time () of microbial biomass were found with biochar addition, although the changes depended on the soil texture (Pei et al., 2021). This is consistent with our results that the ΔSOC is more sensitive to changes in τ and soil clay than other parameters and variables (Fig. S16). Therefore, processes and parameters related to τ and soil clay need to be accounted for in future with additional evidence.
In the MIMICS-BC version, we assumed that biochar, with a longer turnover time (about 1000 years; Schmidt et al., 2002) than SOC, is evenly mixed with SOC and is treated as a homogenous pool without an explicit vertical profile, which may also introduce uncertainties. In addition, due to the lack of long-term biochar addition experiments, the extended long-term SOC concentrations with biochar addition are calculated as the sum of SOC at the control site without biochar addition and the remaining biochar carbon based on the biochar degradation curve (Fig. S4; Wang et al., 2016). Although they are not direct observations and may induce uncertainty, the long-term model validation is important to assess the model ability to simulate the SOC stability with biochar addition. Therefore, long-term and comprehensive field measurements of SOC and other soil and microbe properties after biochar addition are urgently needed to understand the underlying mechanisms of biochar impacts on SOC changes, all of which will help improve the model performance.
Our study shows that the updated MIMICS versions with new processes (e.g., adsorption and soil moisture) improves the model performance with respect to simulating SOC dynamics on croplands. The model versions implemented with biochar processes can generally capture the SOC changes after biochar application from observations. Biochar is believed to have a large CDR potential, and its application on soils would affect the soil carbon and nutrient cycles. These impacts need to be incorporated ESMs to accurately simulate the mitigation potential of biochar under future climate change.
The codes for this model version and the simulation data are available from https://doi.org/10.5281/zenodo.11065423 (Han et al., 2024).
The supplement related to this article is available online at: https://doi.org/10.5194/gmd-17-4871-2024-supplement.
MH collected the site measurement data for model evaluation, performed the simulations, optimized the model code, and prepared the manuscript. QZ and WL conceived of the study and designed the experiments. WL, XW, YPW, PC, HZ, DSG, CW, and WZ guided and improved the manuscript with respect to technology, logic, and detail. LZ, ZZ, and ZG assisted with the technical aspects regarding data acquisition and analysis. XW and FW reviewed and revised the manuscript.
The contact author has declared that none of the authors has any competing interests.
Publisher’s note: Copernicus Publications remains neutral with regard to jurisdictional claims made in the text, published maps, institutional affiliations, or any other geographical representation in this paper. While Copernicus Publications makes every effort to include appropriate place names, the final responsibility lies with the authors.
We thank Sam Rabin, William Wieder, and the anonymous reviewer for their constructive reviews that improved the quality of this paper.
This paper was edited by Sam Rabin and reviewed by William Wieder and one anonymous referee.
This study was funded by the Yunnan Provincial Science and Technology project at the Southwest United Graduate School (grant no. 202302AO370001), the National Natural Science Foundation of China (grant nos. 42192574, 42022056, 42377417, and 42175169), the Tsinghua University Initiative Scientific Research Program (grant no. 20223080041), the Guangdong Major Project of Basic and Applied Basic Research (grant no. 2023B0303000006), and the Guangdong Academy of Sciences (GDAS) Science and Technology Development project (grant nos. 2020GDASYL-20200101002, 22022GDASZH-2022020402-01, and 2022GDASZH-2022020402-02).
Abiven, S., Recous, S., Reyes, V., and Oliver, R.: Mineralisation of C and N from root, stem and leaf residues in soil and role of their biochemical quality, Biol. Fert. Soils, 42, 119–128, https://doi.org/10.1007/s00374-005-0006-0, 2005.
Abramoff, R. Z., Guenet, B., Zhang, H., Georgiou, K., Xu, X., Rossel, R. A. V., Yuan, W., and Ciais, P.: Improved global-scale predictions of soil carbon stocks with Millennial Version 2, Soil Biol. Biochem., 164, 108466, https://doi.org/10.1016/j.soilbio.2021.108466, 2022.
Akaike, H.: A new look at the statistical model identification, IEEE T. Automat. Contr., 19, 716–723, 1974.
Allison, S. D., Wallenstein, M. D., and Bradford, M. A.: Soil-carbon response to warming dependent on microbial physiology, Nat. Geosci., 3, 336–340, https://doi.org/10.1038/ngeo846, 2010.
Archontoulis, S. V., Huber, I., Miguez, F. E., Thorburn, P. J., Rogovska, N., and Laird, D. A.: A model for mechanistic and system assessments of biochar effects on soils and crops and trade-offs, GCB Bioenergy, 8, 1028–1045, https://doi.org/10.1111/gcbb.12314, 2016.
Bond-Lamberty, B., Bailey, V. L., Chen, M., Gough, C. M., and Vargas, R.: Globally rising soil heterotrophic respiration over recent decades, Nature, 560, 80–83, https://doi.org/10.1038/s41586-018-0358-x, 2018.
Buchkowski, R. W., Bradford, M. A., Grandy, A. S., Schmitz, O. J., and Wieder, W. R.: Applying population and community ecology theory to advance understanding of belowground biogeochemistry, Ecol. Lett., 20, 231–245, https://doi.org/10.1111/ele.12712, 2017.
Camino-Serrano, M., Guenet, B., Luyssaert, S., Ciais, P., Bastrikov, V., De Vos, B., Gielen, B., Gleixner, G., Jornet-Puig, A., Kaiser, K., Kothawala, D., Lauerwald, R., Peñuelas, J., Schrumpf, M., Vicca, S., Vuichard, N., Walmsley, D., and Janssens, I. A.: ORCHIDEE-SOM: modeling soil organic carbon (SOC) and dissolved organic carbon (DOC) dynamics along vertical soil profiles in Europe, Geosci. Model Dev., 11, 937–957, https://doi.org/10.5194/gmd-11-937-2018, 2018.
Campbell, C. A., VandenBygaart, A. J., Zentner, R. P., McConkey, B. G., Smith, W., Lemke, R., Grant, B., and Jefferson, P. G.: Quantifying carbon sequestration in a minimum tillage crop rotation study in semiarid southwestern Saskatchewan, Can. J. Soil Sci., 87, 235–250, https://doi.org/10.4141/s06-018, 2007.
Congreves, K. A., Grant, B. B., Campbell, C. A., Smith, W. N., VandenBygaart, A. J., Kröbel, R., Lemke, R. L., and Desjardins, R. L.: Measuring and Modeling the Long-Term Impact of Crop Management on Soil Carbon Sequestration in the Semiarid Canadian Prairies, Agron. J., 107, 1141–1154, https://doi.org/10.2134/agronj15.0009, 2015.
Ding, F., Van Zwieten, L., Zhang, W., Weng, Z., Shi, S., Wang, J., and Meng, J.: A meta-analysis and critical evaluation of influencing factors on soil carbon priming following biochar amendment, J. Soils Sediments, 18, 1507–1517, https://doi.org/10.1007/s11368-017-1899-6, 2017.
Duan, Q. Y., Sorooshian, S., and Gupta, V. K.: Optimal use of the SCE-UA global optimization method for calibrating watershed models, J. Hydrol., 158, 265–284, https://doi.org/10.1016/0022-1694(94)90057-4, 1994.
Eglin, T., Ciais, P., Piao, S. L., Barre, P., Bellassen, V., Cadule, P., Chenu, C., Gasser, T., Koven, C., Reichstein, M., and Smith, P.: Historical and future perspectives of global soil carbon response to climate and land-use changes, Tellus B, 62, 700–718, https://doi.org/10.1111/j.1600-0889.2010.00499.x, 2010.
El-Naggar, A., El-Naggar, A. H., Shaheen, S. M., Sarkar, B., Chang, S. X., Tsang, D. C. W., Rinklebe, J., and Ok, Y. S.: Biochar composition-dependent impacts on soil nutrient release, carbon mineralization, and potential environmental risk: A review, J. Environ. Manage., 241, 458–467, https://doi.org/10.1016/j.jenvman.2019.02.044, 2019.
Entekhabi, D., Njoku, E. G., O'Neill, P. E., Kellogg, K. H., Crow, W. T., Edelstein, W. N., Entin, J. K., Goodman, S. D., Jackson, T. J., Johnson, J., Kimball, J., Piepmeier, J. R., Koster, R. D., Martin, N., McDonald, K. C., Moghaddam, M., Moran, S., Reichle, R., Shi, J. C., Spencer, M. W., Thurman, S. W., Tsang, L., and Van Zyl, J.: The Soil Moisture Active Passive (SMAP) Mission, P. IEEE, 98, 704–716, https://doi.org/10.1109/jproc.2010.2043918, 2010.
Fick, S. E. and Hijmans, R. J.: WorldClim 2: new 1 km spatial resolution climate surfaces for global land areas, Int. J. Climatol., 37, 4302–4315, https://doi.org/10.1002/joc.5086, 2017.
Fuss, S., Lamb, W. F., Callaghan, M. W., Hilaire, J., Creutzig, F., Amann, T., Beringer, T., de Oliveira Garcia, W., Hartmann, J., Khanna, T., Luderer, G., Nemet, G. F., Rogelj, J., Smith, P., Vicente, J. L. V., Wilcox, J., del Mar Zamora Dominguez, M., and Minx, J. C.: Negative emissions – Part 2: Costs, potentials and side effects, Environ. Res. Lett., 13, 063002, https://doi.org/10.1088/1748-9326/aabf9f, 2018.
Geisseler, D., Linquist, B. A., and Lazicki, P. A.: Effect of fertilization on soil microorganisms in paddy rice systems – A meta-analysis, Soil Biol. Biochem., 115, 452–460, https://doi.org/10.1016/j.soilbio.2017.09.018, 2017.
Georgiou, K., Abramoff, R. Z., Harte, J., Riley, W. J., and Torn, M. S.: Microbial community-level regulation explains soil carbon responses to long-term litter manipulations, Nat. Commun., 8, 1223, https://doi.org/10.1038/s41467-017-01116-z, 2017.
Han, L., Sun, K., Yang, Y., Xia, X., Li, F., Yang, Z., and Xing, B.: Biochar's stability and effect on the content, composition and turnover of soil organic carbon, Geoderma, 364, 114184, https://doi.org/10.1016/j.geoderma.2020.114184, 2020.
Han, M., Zhao, Q., Li, W., Ciais, P., Wang, Y. P., Goll, D. S., Zhu, L., Zhao, Z., Wang, J., Wei, Y., and Wu, F.: Global soil organic carbon changes and economic revenues with biochar application, GCB Bioenergy, 14, 364–377, https://doi.org/10.1111/gcbb.12915, 2021.
Han, M., Li, W., Zhang, H., and Wang, Y.-P.: MIMICS-BC_v1.0: Modeling biochar effects on soil organic carbon on croplands in a microbial decomposition model, Zenodo [data set], https://doi.org/10.5281/zenodo.11065423, 2024.
Harris, I., Jones, P. D., Osborn, T. J., and Lister, D. H.: Updated high-resolution grids of monthly climatic observations – the CRU TS3.10 Dataset, Int. J. Climatol., 34, 623–642, https://doi.org/10.1002/joc.3711, 2014.
Hicke, J. A. and Lobell, D. B.: Spatiotemporal patterns of cropland area and net primary production in the central United States estimated from USDA agricultural information, Geophys. Res. Lett., 31, L20502, https://doi.org/10.1029/2004GL020927, 2004.
Houska, T., Kraft, P., Chamorro-Chavez, A., and Breuer, L.: SPOTting Model Parameters Using a Ready-Made Python Package, PLoS One, 10, e0145180, https://doi.org/10.1371/journal.pone.0145180, 2015.
Huang, R., Tian, D., Liu, J., Lv, S., He, X., and Gao, M.: Responses of soil carbon pool and soil aggregates associated organic carbon to straw and straw-derived biochar addition in a dryland cropping mesocosm system, Agriculture, Ecosyst. Environ., 265, 576–586, https://doi.org/10.1016/j.agee.2018.07.013, 2018.
Islam, M. U., Jiang, F., Halder, M., Liu, S., and Peng, X.: Impact of straw return combined with different fertilizations on soil organic carbon stock in upland wheat and maize croplands in China: A meta-analysis, Crop Environ., 2, 233–241, 2023.
Jansson, J. K. and Wu, R.: Soil viral diversity, ecology and climate change, Nat. Rev. Microbiol., 21, 296–311, https://doi.org/10.1038/s41579-022-00811-z, 2023.
Juice, S. M., Walter, C. A., Allen, K. E., Berardi, D. M., Hudiburg, T. W., Sulman, B. N., and Brzostek, E. R.: A new bioenergy model that simulates the impacts of plant-microbial interactions, soil carbon protection, and mechanistic tillage on soil carbon cycling, GCB Bioenergy, 14, 346–363, https://doi.org/10.1111/gcbb.12914, 2022.
Kalbitz, K., Schwesig, D., Rethemeyer, J., and Matzner, E.: Stabilization of dissolved organic matter by sorption to the mineral soil, Soil Biol. Biochem., 37, 1319–1331, https://doi.org/10.1016/j.soilbio.2004.11.028, 2005.
Kasozi, G. N., Zimmerman, A. R., Nkedi-Kizza, P., and Gao, B.: Catechol and humic acid sorption onto a range of laboratory-produced black carbons (biochars), Environ. Sci. Technol., 44, 6189–6195, 2010.
Kobayashi, S., Ota, Y., Harada, Y., Ebita, A., Moriya, M., Onoda, H., Onogi, K., Kamahori, H., Kobayashi, C., Endo, H., Miyaoka, K., and Takahashi, K.: The JRA-55 Reanalysis: General Specifications and Basic Characteristics, J. Meteorol. Soc. Jpn. Ser. II, 93, 5–48, https://doi.org/10.2151/jmsj.2015-001, 2015.
Kothawala, D., Moore, T., and Hendershot, W.: Soil properties controlling the adsorption of dissolved organic carbon to mineral soils, Soil Sci. Soc. Am. J., 73, 1831–1842, 2009.
Kyker-Snowman, E., Wieder, W. R., Frey, S. D., and Grandy, A. S.: Stoichiometrically coupled carbon and nitrogen cycling in the MIcrobial-MIneral Carbon Stabilization model version 1.0 (MIMICS-CN v1.0), Geosci. Model Dev., 13, 4413–4434, https://doi.org/10.5194/gmd-13-4413-2020, 2020.
Lehmann, J., Rillig, M. C., Thies, J., Masiello, C. A., Hockaday, W. C., and Crowley, D.: Biochar effects on soil biota – A review, Soil Biol. Biochem., 43, 1812–1836, https://doi.org/10.1016/j.soilbio.2011.04.022, 2011.
Lehmann, J., Cowie, A., Masiello, C. A., Kammann, C., Woolf, D., Amonette, J. E., Cayuela, M. L., Camps-Arbestain, M., and Whitman, T.: Biochar in climate change mitigation, Nat. Geosci., 14, 883–892, https://doi.org/10.1038/s41561-021-00852-8, 2021.
Li, Z., Song, Z., Singh, B. P., and Wang, H.: The impact of crop residue biochars on silicon and nutrient cycles in croplands, Sci. Total Environ., 659, 673–680, https://doi.org/10.1016/j.scitotenv.2018.12.381, 2019.
Liang, J., Wang, G., Ricciuto, D. M., Gu, L., Hanson, P. J., Wood, J. D., and Mayes, M. A.: Evaluating the E3SM land model version 0 (ELMv0) at a temperate forest site using flux and soil water measurements, Geosci. Model Dev., 12, 1601–1612, https://doi.org/10.5194/gmd-12-1601-2019, 2019.
Liao, C., Huang, W., Wells, J., Zhao, R., Allen, K., Hou, E., Huang, X., Qiu, H., Tao, F., Jiang, L., Aguilos, M., Lin, L., Huang, X., and Luo, Y.: Microbe-iron interactions control lignin decomposition in soil, Soil Biol. Biochem., 173, 108803, https://doi.org/10.1016/j.soilbio.2022.108803, 2022.
Luo, Y., Durenkamp, M., De Nobili, M., Lin, Q., and Brookes, P. C.: Short term soil priming effects and the mineralisation of biochar following its incorporation to soils of different pH, Soil Biol. Biochem., 43, 2304–2314, https://doi.org/10.1016/j.soilbio.2011.07.020, 2011.
Luo, Y., Zang, H., Yu, Z., Chen, Z., Gunina, A., Kuzyakov, Y., Xu, J., Zhang, K., and Brookes, P. C.: Priming effects in biochar enriched soils using a three-source-partitioning approach: 14C labelling and 13C natural abundance, Soil Biol. Biochem., 106, 28–35, 2017.
Lychuk, T. E., Izaurralde, R. C., Hill, R. L., McGill, W. B., and Williams, J. R.: Biochar as a global change adaptation: predicting biochar impacts on crop productivity and soil quality for a tropical soil with the Environmental Policy Integrated Climate (EPIC) model, Mitig. Adapt. Strat. Gl., 20, 1437–1458, https://doi.org/10.1007/s11027-014-9554-7, 2014.
Manzoni, S. and Porporato, A.: Soil carbon and nitrogen mineralization: Theory and models across scales, Soil Biol. Biochem., 41, 1355–1379, https://doi.org/10.1016/j.soilbio.2009.02.031, 2009.
Manzoni, S., Schimel, J. P., and Porporato, A.: Responses of soil microbial communities to water stress: results from a meta-analysis, Ecology, 93, 930–938, https://doi.org/10.1890/11-0026.1, 2012.
Manzoni, S., Capek, P., Mooshammer, M., Lindahl, B. D., Richter, A., and Santruckova, H.: Optimal metabolic regulation along resource stoichiometry gradients, Ecol. Lett., 20, 1182–1191, https://doi.org/10.1111/ele.12815, 2017.
Mayes, M. A., Heal, K. R., Brandt, C. C., Phillips, J. R., and Jardine, P. M.: Relation between Soil Order and Sorption of Dissolved Organic Carbon in Temperate Subsoils, Soil Sci. Soc. Am. J., 76, 1027–1037, https://doi.org/10.2136/sssaj2011.0340, 2012.
Michalzik, B., Tipping, E., Mulder, J., Lancho, J. G., Matzner, E., Bryant, C., Clarke, N., Lofts, S., and Esteban, M. V.: Modelling the production and transport of dissolved organic carbon in forest soils, Biogeochemistry, 66, 241–264, 2003.
Minasny, B., Malone, B. P., McBratney, A. B., Angers, D. A., Arrouays, D., Chambers, A., Chaplot, V., Chen, Z.-S., Cheng, K., Das, B. S., Field, D. J., Gimona, A., Hedley, C. B., Hong, S. Y., Mandal, B., Marchant, B. P., Martin, M., McConkey, B. G., Mulder, V. L., O'Rourke, S., Richer-de-Forges, A. C., Odeh, I., Padarian, J., Paustian, K., Pan, G., Poggio, L., Savin, I., Stolbovoy, V., Stockmann, U., Sulaeman, Y., Tsui, C.-C., Vågen, T.-G., van Wesemael, B., and Winowiecki, L.: Soil carbon 4 per mille, Geoderma, 292, 59–86, https://doi.org/10.1016/j.geoderma.2017.01.002, 2017.
Minx, J. C., Lamb, W. F., Callaghan, M. W., Fuss, S., Hilaire, J., Creutzig, F., Amann, T., Beringer, T., de Oliveira Garcia, W., Hartmann, J., Khanna, T., Lenzi, D., Luderer, G., Nemet, G. F., Rogelj, J., Smith, P., Vicente Vicente, J. L., Wilcox, J., and del Mar Zamora Dominguez, M.: Negative emissions – Part 1: Research landscape and synthesis, Environ. Res. Lett., 13, 063001, https://doi.org/10.1088/1748-9326/aabf9b, 2018.
Moyano, F. E., Manzoni, S., and Chenu, C.: Responses of soil heterotrophic respiration to moisture availability: An exploration of processes and models, Soil Biol. Biochem., 59, 72–85, https://doi.org/10.1016/j.soilbio.2013.01.002, 2013.
Muttil, N. and Jayawardena, A. W.: Shuffled Complex Evolution model calibrating algorithm: enhancing its robustness and efficiency, Hydrol. Process., 22, 4628–4638, https://doi.org/10.1002/hyp.7082, 2008.
Omondi, M. O., Xia, X., Nahayo, A., Liu, X., Korai, P. K., and Pan, G.: Quantification of biochar effects on soil hydrological properties using meta-analysis of literature data, Geoderma, 274, 28–34, https://doi.org/10.1016/j.geoderma.2016.03.029, 2016.
Osunbitan, J., Oyedele, D., and Adekalu, K.: Tillage effects on bulk density, hydraulic conductivity and strength of a loamy sand soil in southwestern Nigeria, Soil Till. Res., 82, 57–64, 2005.
Palansooriya, K. N., Wong, J. T. F., Hashimoto, Y., Huang, L., Rinklebe, J., Chang, S. X., Bolan, N., Wang, H., and Ok, Y. S.: Response of microbial communities to biochar-amended soils: a critical review, Biochar, 1, 3–22, https://doi.org/10.1007/s42773-019-00009-2, 2019.
Parton, W. J., Morgan, J. A., Kelly, R. H., and Ojima, D.: Modeling soil C responses to environmental change in grassland systems, in: The potential of US grazing lands to sequester carbon and mitigate the greenhouse effect, edited by: Follett, R. F. and Kimble, J. M., CRC Press, Boca Raton, 371–398, https://doi.org/10.1201/9781420032468, 2000.
Pei, J., Li, J., Mia, S., Singh, B., Wu, J., and Dijkstra, F. A.: Biochar aging increased microbial carbon use efficiency but decreased biomass turnover time, Geoderma, 382, 114710, https://doi.org/10.1016/j.geoderma.2020.114710, 2021.
Press, W. H., Teukolsky, S. A., Vetterling, W. T., and Flannery, B. P.: Numerical Recipes. The arts of Scientific Computing, 3rd Edn., New York, Cambridge University Press, ISBN 9780521880688, 2007.
Ramankutty, N., Evan, A. T., Monfreda, C., and Foley, J. A.: Farming the planet: 1. Geographic distribution of global agricultural lands in the year 2000, Global Biogeochem. Cy., 22, GB1003, https://doi.org/10.1029/2007gb002952, 2008.
Razzaghi, F., Obour, P. B., and Arthur, E.: Does biochar improve soil water retention? A systematic review and meta-analysis, Geoderma, 361, 114055, https://doi.org/10.1016/j.geoderma.2019.114055, 2020.
Roberts, K. G., Gloy, B. A., Joseph, S., Scott, N. R., and Lehmann, J.: Life Cycle Assessment of Biochar Systems: Estimating the Energetic, Economic, and Climate Change Potential, Environ. Sci. Technol., 44, 827–833, https://doi.org/10.1021/es902266r, 2010.
Roychand, P. and Marschner, P.: Respiration and sorption of water-extractable organic carbon as affected by addition of Ca2+, isolated clay or clay-rich subsoil to sand, Pedosphere, 24, 98–106, 2014.
Schimel, J., Balser, T. C., and Wallenstein, M.: Microbial stress-response physiology and its implications for ecosystem function, Ecology, 88, 1386–1394, https://doi.org/10.1890/06-0219, 2007.
Schimel, J. P. and Weintraub, M. N.: The implications of exoenzyme activity on microbial carbon and nitrogen limitation in soil: a theoretical model, Soil Biol. Biochem., 35, 549–563, 2003.
Schmidt, M. W., Skjemstad, J. O., and Jäger, C.: Carbon isotope geochemistry and nanomorphology of soil black carbon: Black chernozemic soils in central Europe originate from ancient biomass burning, Global Biogeochem. Cy., 16, 1123, https://doi.org/10.1029/2002GB001939, 2002.
Setia, R., Rengasamy, P., and Marschner, P.: Effect of exchangeable cation concentration on sorption and desorption of dissolved organic carbon in saline soils, Sci. Total Environ., 465, 226–232, 2013.
Shangguan, W., Dai, Y., Duan, Q., Liu, B., and Yuan, H.: A global soil data set for earth system modeling, J. Adv. Model. Earth Sy., 6, 249–263, https://doi.org/10.1002/2013ms000293, 2014.
Shen, Y.-H.: Sorption of natural dissolved organic matter on soil, Chemosphere, 38, 1505–1515, 1999.
Sheng, Y. and Zhu, L.: Biochar alters microbial community and carbon sequestration potential across different soil pH, Sci. Total Environ., 622–623, 1391–1399, https://doi.org/10.1016/j.scitotenv.2017.11.337, 2018.
Singh, B. P. and Cowie, A. L.: Long-term influence of biochar on native organic carbon mineralisation in a low-carbon clayey soil, Sci. Rep., 4, 1–9, 2014.
Six, J., Elliott, E., and Paustian, K.: Aggregate and soil organic matter dynamics under conventional and no-tillage systems, Soil Sci. Soc. Am. J., 63, 1350–1358, 1999.
Smith, P.: Soil carbon sequestration and biochar as negative emission technologies, Glob. Change Biol., 22, 1315–1324, https://doi.org/10.1111/gcb.13178, 2016.
Song, G., Li, L., Pan, G., and Zhang, Q.: Topsoil organic carbon storage of China and its loss by cultivation, Biogeochemistry, 74, 47–62, https://doi.org/10.1007/s10533-004-2222-3, 2005.
Sulman, B. N., Moore, J. A. M., Abramoff, R., Averill, C., Kivlin, S., Georgiou, K., Sridhar, B., Hartman, M. D., Wang, G., Wieder, W. R., Bradford, M. A., Luo, Y., Mayes, M. A., Morrison, E., Riley, W. J., Salazar, A., Schimel, J. P., Tang, J., and Classen, A. T.: Multiple models and experiments underscore large uncertainty in soil carbon dynamics, Biogeochemistry, 141, 109–123, https://doi.org/10.1007/s10533-018-0509-z, 2018.
Sun, W., Canadell, J. G., Yu, L., Yu, L., Zhang, W., Smith, P., Fischer, T., and Huang, Y.: Climate drives global soil carbon sequestration and crop yield changes under conservation agriculture, Glob. Change Biol., 26, 3325–3335, https://doi.org/10.1111/gcb.15001, 2020.
Wang, G., Post, W. M., and Mayes, M. A.: Development of microbial-enzyme-mediated decomposition model parameters through steady-state and dynamic analyses, Ecol. Appl., 23, 255–272, https://doi.org/10.1890/12-0681.1, 2013.
Wang, G., Huang, W., Zhou, G., Mayes, M. A., and Zhou, J.: Modeling the processes of soil moisture in regulating microbial and carbon-nitrogen cycling, J. Hydrol., 585, 124777, https://doi.org/10.1016/j.jhydrol.2020.124777, 2020.
Wang, J., Xiong, Z., and Kuzyakov, Y.: Biochar stability in soil: meta-analysis of decomposition and priming effects, Glob. Change Biol. Bioenerg., 8, 512–523, https://doi.org/10.1111/gcbb.12266, 2016.
Wang, X., He, C., Liu, B., Zhao, X., Liu, Y., Wang, Q., and Zhang, H.: Effects of Residue Returning on Soil Organic Carbon Storage and Sequestration Rate in China's Croplands: A Meta-Analysis, Agronomy-Basel, 10, 691, https://doi.org/10.3390/agronomy10050691, 2020.
Wieder, W. R., Bonan, G. B., and Allison, S. D.: Global soil carbon projections are improved by modelling microbial processes, Nat. Clim. Change, 3, 909–912, 2013.
Wieder, W. R., Grandy, A. S., Kallenbach, C. M., and Bonan, G. B.: Integrating microbial physiology and physio-chemical principles in soils with the MIcrobial-MIneral Carbon Stabilization (MIMICS) model, Biogeosciences, 11, 3899–3917, https://doi.org/10.5194/bg-11-3899-2014, 2014.
Wieder, W. R., Grandy, A. S., Kallenbach, C. M., Taylor, P. G., and Bonan, G. B.: Representing life in the Earth system with soil microbial functional traits in the MIMICS model, Geosci. Model Dev., 8, 1789–1808, https://doi.org/10.5194/gmd-8-1789-2015, 2015.
Wieder, W. R., Sulman, B. N., Hartman, M. D., Koven, C. D., and Bradford, M. A.: Arctic soil governs whether climate change drives global losses or gains in soil carbon, Geophys. Res. Lett., 46, 14486–14495, 2019.
Woolf, D. and Lehmann, J.: Modelling the long-term response to positive and negative priming of soil organic carbon by black carbon, Biogeochemistry, 111, 83–95, https://doi.org/10.1007/s10533-012-9764-6, 2012.
Woolf, D., Amonette, J. E., Street-Perrott, F. A., Lehmann, J., and Joseph, S.: Sustainable biochar to mitigate global climate change, Nat. Commun., 1, 56, https://doi.org/10.1038/ncomms1053, 2010.
Yan, Z., Bond-Lamberty, B., Todd-Brown, K. E., Bailey, V. L., Li, S., Liu, C., and Liu, C.: A moisture function of soil heterotrophic respiration that incorporates microscale processes, Nat. Commun., 9, 2562, https://doi.org/10.1038/s41467-018-04971-6, 2018.
Yoo, G., Kim, H., and Choi, J. Y.: Soil Aggregate Dynamics Influenced by Biochar Addition using the13C Natural Abundance Method, Soil Sci. Soc. Am. J., 81, p. 612, https://doi.org/10.2136/sssaj2016.09.0313, 2017.
Zhang, H., Goll, D. S., Wang, Y. P., Ciais, P., Wieder, W. R., Abramoff, R., Huang, Y., Guenet, B., Prescher, A. K., Viscarra Rossel, R. A., Barre, P., Chenu, C., Zhou, G., and Tang, X.: Microbial dynamics and soil physicochemical properties explain large-scale variations in soil organic carbon, Glob. Change Biol., 26, 2668–2685, https://doi.org/10.1111/gcb.14994, 2020.
Zhang, Y., Sun, C. X., Chen, L., and Duan, Z.: Catalytic potential of soil hydrolases in northeast China under different soil moisture conditions, Rev. Cienc. Suelo Nutr., 9, 116–124, 2009.
Zhao, M. and Running, S. W.: Drought-induced reduction in global terrestrial net primary production from 2000 through 2009, Science, 329, 940–943, https://doi.org/10.1126/science.1192666, 2010.
Zheng, H., Wang, X., Luo, X., Wang, Z., and Xing, B.: Biochar-induced negative carbon mineralization priming effects in a coastal wetland soil: Roles of soil aggregation and microbial modulation, Sci. Total Environ., 610–611, 951–960, https://doi.org/10.1016/j.scitotenv.2017.08.166, 2018.
Zhou, H., Zhang, D., Wang, P., Liu, X., Cheng, K., Li, L., Zheng, J., Zhang, X., Zheng, J., and Crowley, D.: Changes in microbial biomass and the metabolic quotient with biochar addition to agricultural soils: A Meta-analysis, Agr. Ecosyt. Environ., 239, 80–89, https://doi.org/10.1016/j.agee.2017.01.006, 2017a.
Zhou, M., Zhu, B., Wang, S., Zhu, X., Vereecken, H., and Bruggemann, N.: Stimulation of N2O emission by manure application to agricultural soils may largely offset carbon benefits: a global meta-analysis, Glob. Change Biol., 23, 4068–4083, https://doi.org/10.1111/gcb.13648, 2017b.
Zimmerman, A. R., Gao, B., and Ahn, M.-Y.: Positive and negative carbon mineralization priming effects among a variety of biochar-amended soils, Soil Biol. Biochem., 43, 1169–1179, https://doi.org/10.1016/j.soilbio.2011.02.005, 2011.
Zomer, R. J., Xu, J., and Trabucco, A.: Version 3 of the Global Aridity Index and Potential Evapotranspiration Database, Sci. Data, 9, 409, https://doi.org/10.1038/s41597-022-01493-1, 2022.