the Creative Commons Attribution 4.0 License.
the Creative Commons Attribution 4.0 License.
 | 09 Apr 2024
G6-1.5K-SAI: a new Geoengineering Model Intercomparison Project (GeoMIP) experiment integrating recent advances in solar radiation modification studies
Alan Robock
Jim Haywood
Matthew Henry
Simone Tilmes
Douglas G. MacMartin
Ben Kravitz
Sarah J. Doherty
John Moore
Chris Lennard
Shingo Watanabe
Helene Muri
Ulrike Niemeier
Olivier Boucher
Abu Syed
Temitope S. Egbebiyi
Roland Séférian
Ilaria Quaglia
The Geoengineering Model Intercomparison Project (GeoMIP) has proposed multiple model experiments during phases 5 and 6 of the Climate Model Intercomparison Project (CMIP), with the latest set of model experiments proposed in 2015. With phase 7 of CMIP in preparation and with multiple efforts ongoing to better explore the potential space of outcomes for different solar radiation modifications (SRMs) both in terms of deployment strategies and scenarios and in terms of potential impacts, the GeoMIP community has identified the need to propose and conduct a new experiment that could serve as a bridge between past iterations and future CMIP7 experiments. Here we report the details of such a proposed experiment, named G6-1.5K-SAI, to be conducted with the current generation of scenarios and models from CMIP6 and clarify the reasoning behind many of the new choices introduced. Namely, compared to the CMIP6 GeoMIP scenario G6sulfur, we decided on (1) an intermediate emission scenario as a baseline (the Shared Socioeconomic Pathway 2-4.5), (2) a start date set in the future that includes both considerations for the likelihood of exceeding 1.5 °C above preindustrial levels and some considerations for a likely start date for an SRM implementation, and (3) a deployment strategy for stratospheric aerosol injection that does not inject in the tropical pipe in order to obtain a more latitudinally uniform aerosol distribution. We also offer more details regarding the preferred experiment length and number of ensemble members and include potential options for second-tier experiments that some modeling groups might want to run. The specifics of the proposed experiment will further allow for a more direct comparison between results obtained from CMIP6 models and those obtained from future scenarios for CMIP7.
- Article
(2378 KB) - Full-text XML
- BibTeX
- EndNote


The Geoengineering Model Intercomparison Project (GeoMIP) was set up in 2011 (Kravitz et al., 2011) as a way to standardize climate model experiments of solar radiation modification (SRM), a form of climate intervention (or geoengineering) that aims to reduce surface temperatures by means of preventing a portion of the incoming solar radiation from reaching the surface. This could be achieved by a variety of proposed techniques, many of which have been explored through GeoMIP (Visioni et al., 2023b). Standardized experiments help diagnose the potential sources of differences between model responses to SRM and are therefore a necessary step to better identify areas of agreement and disagreement and areas where models can be improved. This has been done in general for experiments related to climate change since the Coupled Model Intercomparison Project (CMIP; Meehl et al., 2005). For CMIP, this standardization takes the form of prescribing the same concentrations or emissions of greenhouse gases and other climate-altering factors (such as land use changes and aerosols) for both historical conditions and future ones through the Scenario Model Intercomparison Project (ScenarioMIP; Meinshausen et al., 2020). For SRM, the underlying emission scenario is one of the things that needs to be prescribed, but on top of that, the specifics of the climate intervention need to be specified as well. This implies deciding on the way in which radiation is altered (from the simplest reduction in the top-of-atmosphere solar constant, to the injection of SO2 in the stratosphere, to a prescribed increase in ice crystal fall velocities to reduce cirrus cloud optical depth), the SRM strategy; when to start the simulated intervention and how much radiation to alter; and eventually when to stop the SRM scenario.
In Visioni et al. (2023b), we took stock of the previous decade and more of GeoMIP experiments, reviewing both official tier-1 experiments that were part of phases 5 and 6 of CMIP and also parallel experiments produced by the GeoMIP community, in order to better identify some sources of uncertainty for SRM and to explore potential scenarios other than those prescribed in CMIP5 and CMIP6. The discussion continued during the annual GeoMIP meeting held in Exeter during the summer of 2023 (with a summary of the meeting presented in Visioni et al., 2023c) and mostly focused on potential future experiments that will need to be run as part of the next, seventh iteration of CMIP (CMIP7). During such discussions, the community identified some pressing needs that have to be considered when thinking about future experiments and that will constitute the target for the experiment we are proposing here.
-
They should have simple traceable experiments that can remain consistent across different iterations in order to understand changes and improvements in Earth system models (ESMs) and how model differences evolve over time and as ESMs become more complex. For instance, the experiment G1 is a very simple experiment that involves reducing the solar constant in order to prevent temperatures from changing under a 4 × CO2 scenario and has been successfully performed across various generations of ESMs (Kravitz et al., 2021), using models with very different resolutions and characteristics (Virgin and Fletcher, 2022).
-
They should consider novel experiments that build on past gathered knowledge (gained through GeoMIP experiments or through other related experiments) to improve, clarify and expand the potential space of SRM scenarios. For instance, experiments G3 and G4 in CMIP5 for stratospheric aerosol injection (SAI) considered equatorial injections of SO2 in order to more closely mimic the 1991 Mount Pinatubo volcanic eruption (Kravitz et al., 2011; Berdahl et al., 2014), while G6sulfur in CMIP6 considered injections between 10° N and 10° S uniformly (Kravitz et al., 2015; Visioni et al., 2021b). Subsequent research has highlighted that extra-tropical injections have different impacts than those of tropical injections and specifically avoid some of the identified negative climate responses to tropical injections (Kravitz et al., 2019; Visioni et al., 2021a). Similarly, for marine cloud brightening (MCB), multiple lines of research have been pursued after the G4sea-salt and G4cdnc experiments (Alterskjaer et al., 2013; Ahlm et al., 2017) that moved away from broad injections over entire latitudinal bands and towards the injection of sea salt over specific susceptible areas (Haywood et al., 2023b).
-
They should have experiments that are up to date in terms of policy relevance, in the sense of considering SRM under future scenarios that are of interest to the scientific community, informative and plausible (MacMartin et al., 2022), which means keeping up to date with current emission or concentration scenarios as considered by ScenarioMIP (Meinshausen et al., 2020, 2023). This is also relevant when discussing efforts aimed at considering local impacts of interest for different communities, for instance, in terms of ecological impacts (Zarnetske et al., 2021) or regional climatic changes (Kuswanto et al., 2022).
Different parts of the community might give more or less weight to such needs, especially to the tension between process understanding and policy relevance, but a balance needs to be found if future devised experiments are to remain, in the broadest sense, useful. During the meeting, a proposal was put forward for an experiment that is capable of addressing some of these needs and whose protocol we set out to describe in this paper. Namely, this experiment is to be conducted with the current generation of Earth system models and scenarios that participated in CMIP6 but builds upon novel findings around SRM to constitute an intermediate experiment capable of informing upcoming decisions around CMIP7 experiments. As we will discuss, such an experiment also ensures a high degree of comparability with future CMIP7 scenarios.
CMIP6 GeoMIP experiments were originally proposed in 2015 (Kravitz et al., 2015). Eight years later, it is useful to reconsider and potentially update the scenario choices that were performed at the time. In the intervening years, there have been multiple discussions in the climate science community with regard to the plausibility of some specific future climate scenarios such as SSP5-8.5, on which G6sulfur is based (Burgess et al., 2020). Furthermore, G6sulfur had a set start date in 2020, which has passed and so is clearly unrealistic. Finally, the scenario choices are contemporaries of the decisions taken in the Paris Agreement and precede the Intergovernmental Panel on Climate Change (IPCC) special report on 1.5 °C (Masson-Delmotte et al., 2018). It is useful to reiterate that these observations alone do not discount or invalidate completed or in-progress research using such scenarios. Interesting and useful research can be done, and is still being done, even with older scenarios like G4 (Chen et al., 2020; Kuswanto et al., 2022). Nonetheless, a scenario that might be considered more realistic in terms of those factors (scenario choice, starting year and SRM target) might be of use to many. Members of the GeoMIP community have also contributed to international reports such as the IPCC Sixth Assessment Report (AR6; Chen et al., 2021) and the World Meteorological Organization (WMO) 2022 Ozone Assessment (Haywood et al., 2023a) using GeoMIP results, leading to numerous insights into what constitutes a useful scenario.
Since 2015, there have also been multiple advances in terms of our understanding of the potential impacts of different forms of SRM. For SAI, there have been multiple investigations highlighting the importance of injection location (Tilmes et al., 2017; Kravitz et al., 2019; Visioni et al., 2021a) and cooling target (Irvine et al., 2019; Lee et al., 2021) in the determination of the impacts. For MCB, there have been multiple advances in terms of where to brighten clouds and which size is necessary for the injected particles (Wood, 2021; Haywood et al., 2023b). Such new knowledge should be integrated into the future set of GeoMIP experiments.
Both of these points could lead to the conclusion that such decisions should be deferred to the next set of GeoMIP experiments for CMIP7; however, there is one main reason why we are proposing this intermediate experiment now. It is extremely likely, based on timelines provided by CMIP in the summer of 2023, that the next set of scenario forcings from ScenarioMIP will not be available before early 2026, meaning that the first set of CMIP7 GeoMIP results might come as late as 2028, given priorities from the modeling centers. This would mean a gap of almost 10 years between when GeoMIP CMIP6 simulations were released and the CMIP7 ones will be released, which would be a large gap based on the numerous calls for more research into SRM from national and international organizations (National Academies of Sciences Engineering and Medicine, 2021). An intermediate experiment to be performed over late 2023 and 2024 with multiple models could fill this gap and allow for more informed decisions moving towards CMIP7.
In this section we aim to list all aspects that need to be decided when constructing a new GeoMIP experiment. Multiple discussions of scenario building and of the relevance of scenarios, in the context of climate change and of SRM, are available in the literature (Parson, 2008; Bellamy et al., 2013; O'Neill et al., 2016; MacMartin et al., 2022; Diamond et al., 2022), and past experimental protocols from GeoMIP also include the explicit mention of some of these decisions (Kravitz et al., 2011, 2015). In the following list, however, we give an overview of a more conclusive list of all the decisions that need to be made, particularly in the context of multi-model experiments, with a list of potential different choices, while in the next section we will explain why we made the particular choices for this specific experiment.
-
Metrics. Deciding on a metric means selecting a target quantity of the simulated deployment of SRM around which to base decisions. Not all SRM simulations necessarily have a target metric; for instance, the experiment G4 injected a fixed amount of SO2 for a number of years. However, most simulations do: the various generations of GeoMIP experiments have used either global mean surface air temperature (GMSAT) or top-of-atmosphere radiative forcing (TOARF) as the metric against which SRM is assessed. Originally, G6sulfur aimed to reduce radiative forcing from SSP5-8.5 to a SSP2-4.5 target, but practicalities in simulations meant that this was soon modified from radiative forcing to a temperature target, which was defined as achieving the target temperature of ±0.2 K within a decadal mean. Therefore, a successful G6sulfur simulation was one in which the GMSAT was the same as that in the SSP2-4.5 target within those limits, and other global or regional quantities could be compared against it. GMSAT and TOARF are easy metrics to compute and are directly related either to the idea of SRM itself (for TOARF) or to climatic targets as defined in the Paris Agreement (for GMSAT), with a robust scientific basis behind them (Knutti et al., 2016); they are by no means the only possible metrics. Global precipitation-based metrics have been proposed (Lee et al., 2021) and so have the metrics that are behind global mean values, for instance those also targeting interhemispheric and Equator-to-pole temperature gradients (Kravitz et al., 2016). It would also be legitimate to choose metrics that are regionally based (for instance, precipitation changes over a specific region), that are more directly based on agricultural or economic metrics (Clark et al., 2023), or that integrate multiple quantities in a more comprehensive way (for instance, Song et al., 2022, discussed the concept of a surface-equivalent potential temperature metric for global warming). More studies focusing on those other metrics could be useful to inform future decisions with regard to GeoMIP experiments. Lastly, it is useful to note that a similar framework to G6sulfur could be harder to achieve in CMIP7 if models move to emission-driven scenarios (Meinshausen et al., 2023) in which CO2 concentrations (and therefore forcing) are harder to compare across underlying scenarios, i.e., if the carbon cycle is allowed to change due to warming or cooling. Therefore, for future simulations, a target that is not related to other scenarios (for instance, 1.5 or 2 °C above preindustrial, PI, GMSAT) would be much easier to implement.
-
Underlying emission scenario. Choosing an underlying emission scenario implies choosing the degree of intervention, which is also connected to the chosen target. For instance, G6sulfur used SSP5-8.5, with the main aim to obtain a good signal-to-noise ratio in order to achieve better process understanding. However, choosing a non-idealized emission scenario (that is, a specific SSP as opposed to a 1 % CO2 increase) means sometimes having to contextualize SRM in that scenario. For instance, the SSP5-8.5 emission pathway has been criticized in the literature for being unrealistic in many respects (Burgess et al., 2020). It is also not a preferable scenario under which one should imagine a climate intervention strategy due to the lack of emission abatement and risks of termination shocks (Zarnetske et al., 2021). Finally, an emission scenario similar to SSP5-8.5 is unlikely to be repeated for CMIP7 (Meinshausen et al., 2023). Therefore, selecting a new underlying emission scenario that will be repeated (at least in a similar form) in CMIP7 would be preferable.
-
SRM start date. The date when SRM starts in a GeoMIP experiment should not be interpreted as a prediction or a recommendation of when SRM will start. As noted before, G6sulfur considered a date of 2020 for its start, which has now passed. Nonetheless, at least two of the models that participated in G6sulfur did not start injections until 2030 or 2040 (Visioni et al., 2021b), given that GMSAT between SSP2-4.5 and SSP5-8.5 was indistinguishable until later decades. A new starting date for future experiments that moves away from specific years and that takes into account information such as the likelihood of crossing 1.5 or 2 °C above preindustrial levels, while also taking into account the feasibility of a given implementation being scaled up as specified in the simulation, would remove some ambiguity.
-
SRM strategy. Since 2015, many studies of SAI have shown that strategies that move away from equatorial injections, as were used for G6sulfur, might be preferable. Recently, Henry et al. (2023) have compared two models using a controller (Kravitz et al., 2016) to manage four injection locations (30° N, 15° N, 15° S and 30° S). However, this would be hard to achieve in models that have not implemented a feedback controller. Furthermore, Zhang et al. (2024) pointed out that a four-location controller-managed injection strategy might provide similar outcomes to a simpler 30° N and 30° S symmetrical strategy. Questions remain as to whether such an experiment (in terms of temperature targets) should also be performed through GeoMIP for MCB, as the residual climate response for currently proposed MCB simulations is likely to be very much less homogeneous than for that of SAI (e.g., Haywood et al., 2023b). Furthermore, there are many more degrees of freedom in how MCB could be implemented and very different cloud fractions and cloud albedo susceptibilities across different models, showing that much work needs to be done to figure out how to specify an MCB scenario that can be uniformly implemented across models. At this point, there is probably little value in running another solar-dimming-like experiment, as the specific dynamical feedback, impacts on stratospheric ozone, and differences in response of crops and natural vegetation to direct and diffuse radiation appear important for stratospheric aerosols (e.g., Jones et al., 2021; Visioni et al., 2021a), and this is clearly not a good proxy for MCB, which would have very regionally focused forcings. As for the start date, for any specific SRM strategy there are questions regarding feasibility, in a technological or geopolitical sense, in terms of injection location, targets, injection altitude and scalability.
-
Length of experiment. The G6sulfur simulations were run out to 2100 mainly because that was the end date for most CMIP6 forcing datasets. Decisions around simulation length should account for the crucial question of what the actual point of the experiment is. If the purpose is to detect the time of emergence of the SRM signal (which could be on the order of a decade, globally or more regionally, depending on the magnitude of the forcing; Keys et al., 2022), prioritizing ensemble size over length would be preferable. If it is to understand the long-term Earth system model response to SRM and issues related to reversibility and climate sensitivity, then one should prioritize longer runs (decade to century timescales). If it is to understand near-term climate change (within a few decades) for climate policy decision-making, a mix of the two priorities may be appropriate. A good way to frame the question should be, “If a modeling center only has 100 years of simulation time available, how should they preferentially be used?” For example, one could prefer three ensemble members for 35 years (as suggested in MacMartin et al., 2022) rather than one ensemble member for 100 years. Some precedent for running longer simulations exists from the CMIP6 simulations; for example, many climate modeling centers ran the overshoot scenario SSP5-3.4OS with multiple ensemble members until 2100 but with a single member until 2300. The results show significant differences from the simplified representation of overshoot expressed in many studies (e.g., Geden and Löschel, 2017) and would suggest that SRM may need to be maintained for long periods of time in order to achieve temperature targets such as 1.5 or 2 °C above PI (Baur et al., 2023).
-
Signal-to-noise ratio. Simulations with higher forcings and thus higher signal-to-noise ratio can be considered preferable when trying to determine statistical significance (see our discussion of this in Visioni et al., 2023b). In our framework of scenario choices, this is a combination of the choice of targets and of the underlying emission scenario ultimately determining how large the SRM intervention would be. A “peak-shaving” scenario can still have higher forcing if a lower temperature target is selected, and similarly, as with G6sulfur, a high-emission scenario like SSP5-8.5 can still yield a small forcing if the target is only to halve the warming to SSP2-4.5 temperatures.
All of these necessary choices have been summarized in Fig. 1. In the figure we have included multiple potential tiers of experiments (intending tier-2 as lower-priority ones) in order to be as generic as possible, to suggest a flexibility in the framework to allow a subset of groups to run variants that can leverage specific tools or capabilities in individual models.
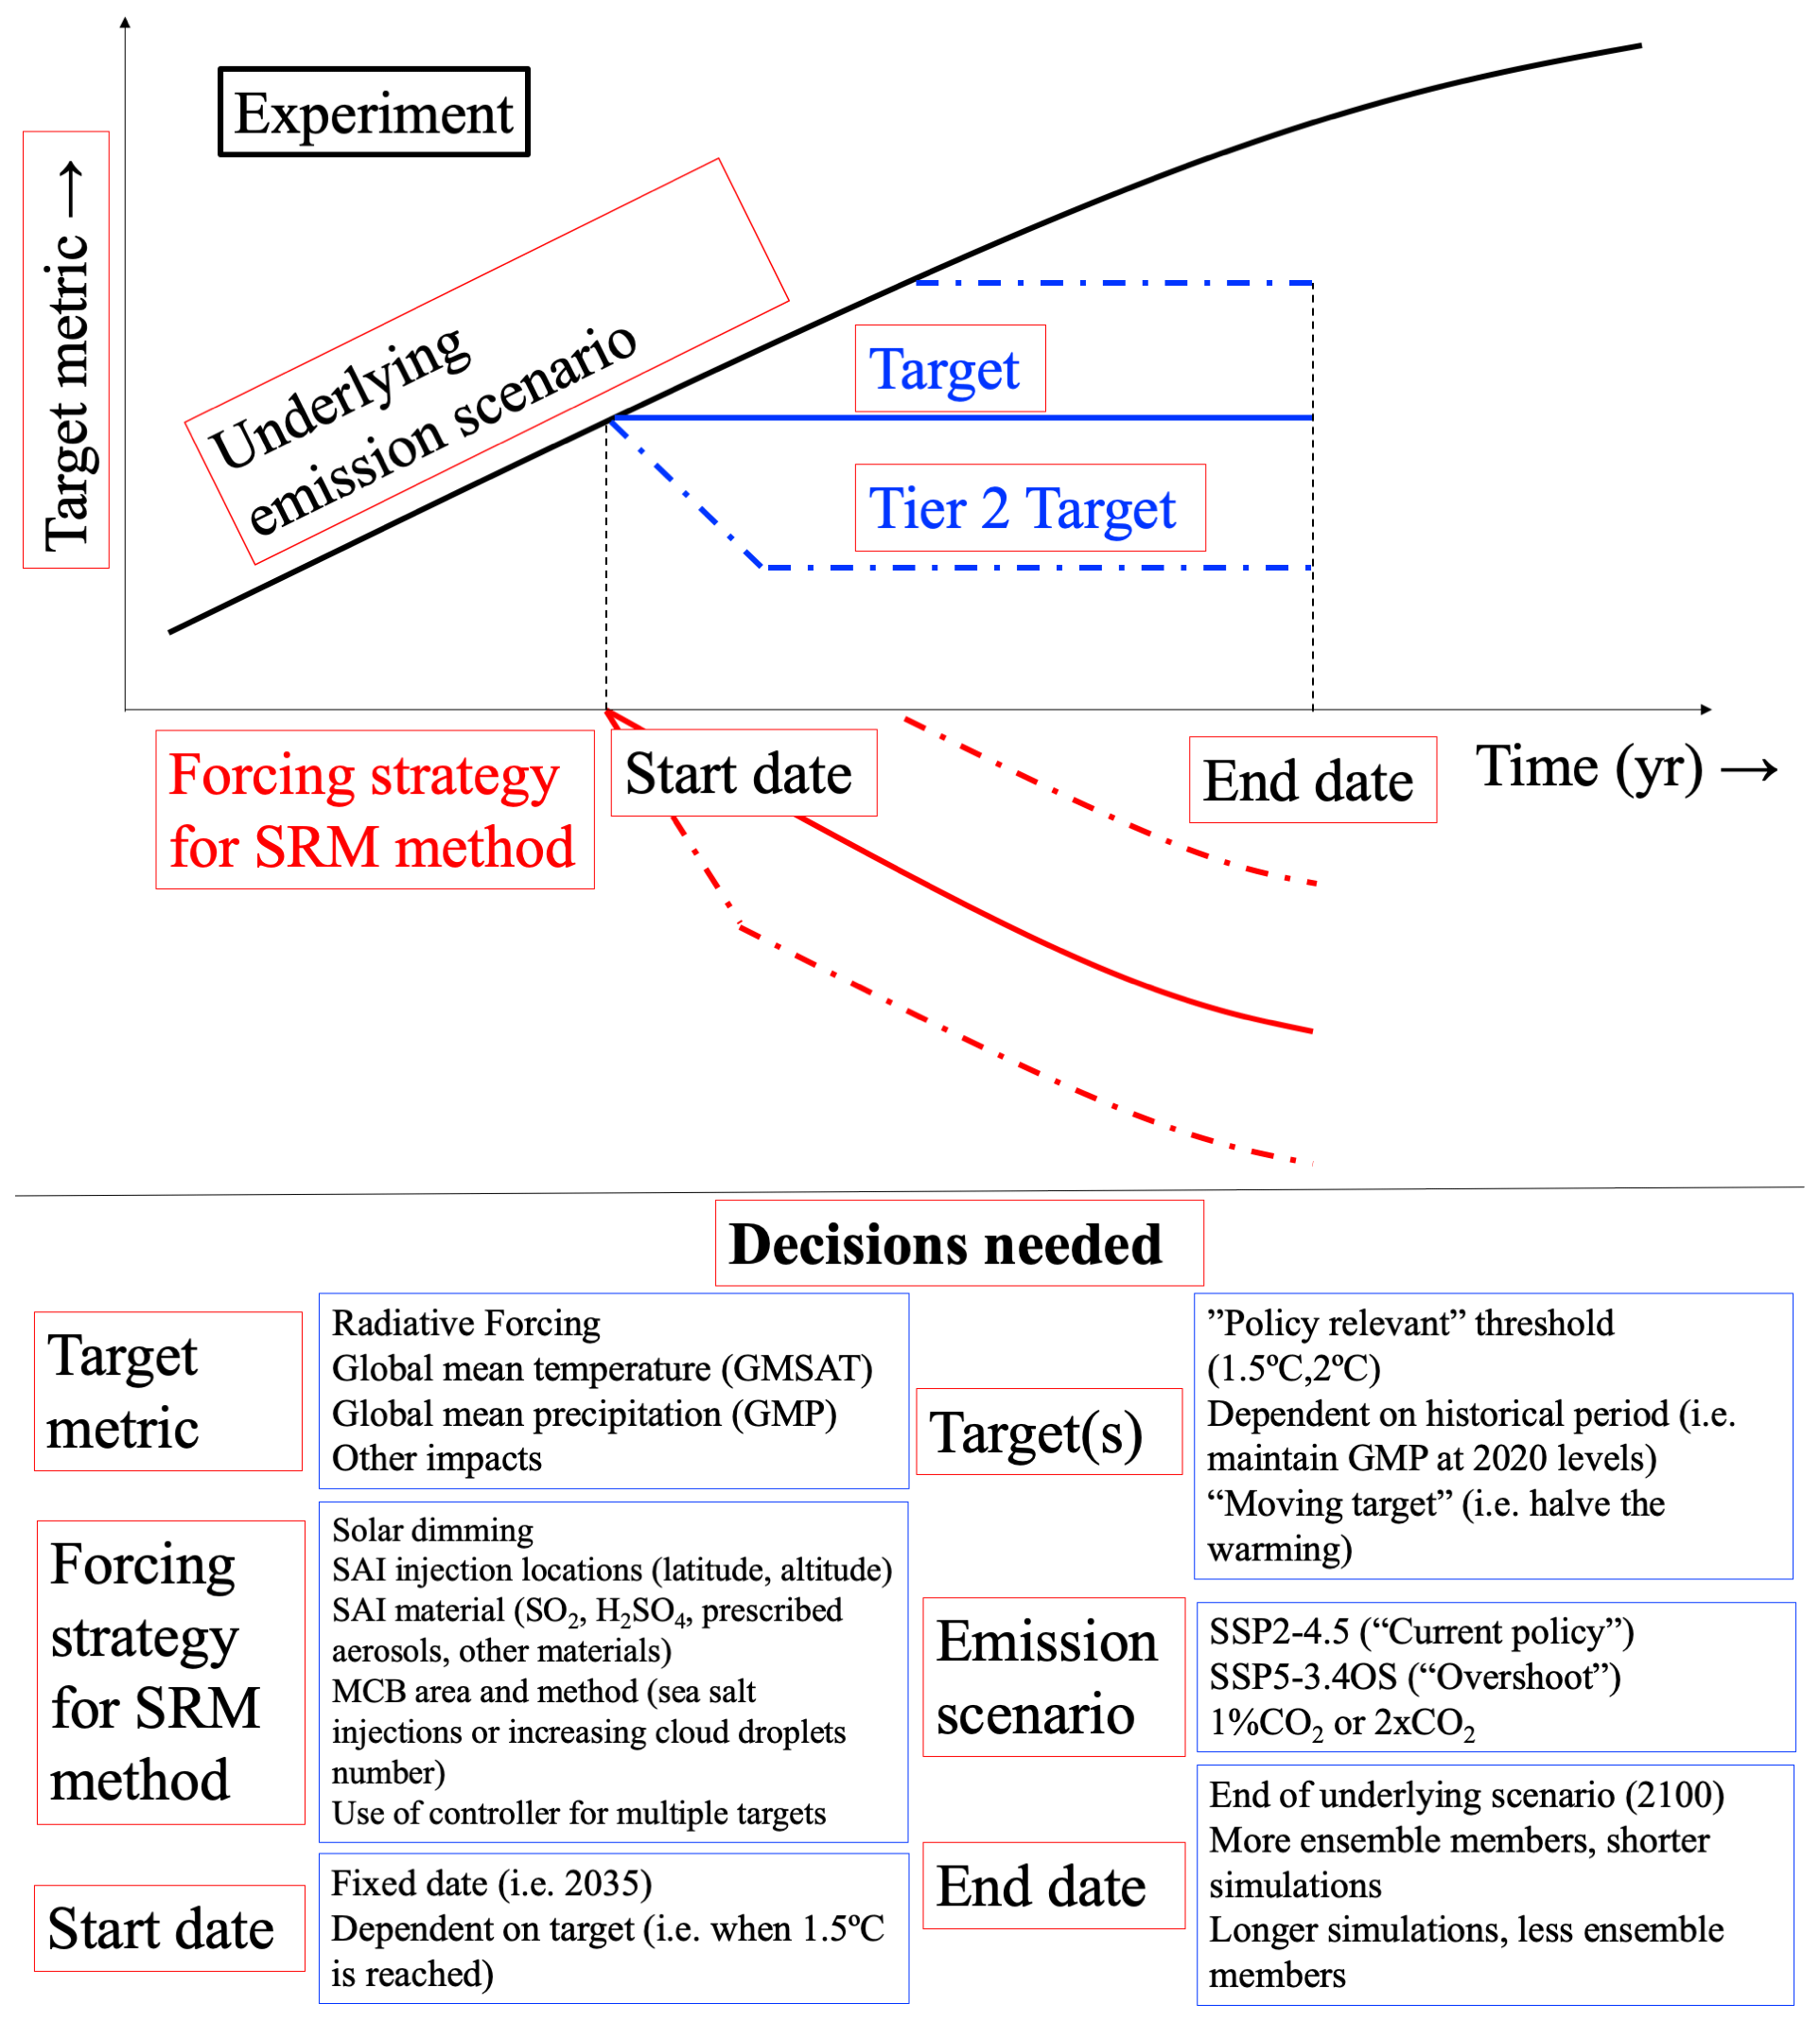
Figure 1A summary of necessary decisions for the new proposed experiments. The black line represents the underlying emission scenario (e.g., SSP2-4.5); the blue lines represent the potential targets (which depend on the chosen target metric and do not have to be constant). The red lines represent the forcing that needs to be applied based on the underlying emission scenario and the targets. At the bottom, key decisions are listed (red boxes) followed by more concrete examples of choices as provided in the text as well.
3.1 Reflections on community engagement and how to make scenario-related decisions in GeoMIP
The large attendance at the 13th GeoMIP meeting highlighted the extent to which the core group of climate modelers who originally devised GeoMIP has expanded to many more interested users and parties, including researchers interested in ecological and societal impacts, researchers from the Global South concerned with specific regional impacts, and researchers interested in climate emulators. Hence, finding common ground for a scenario on which everyone agrees is difficult. For example, designing an emulator would require a multitude of simulations to provide training data – such an approach has been taken in emulating explosive volcanic eruptions (Aubry et al., 2020). On the other hand, understanding regional impacts such as precipitation changes over south Asia or Africa requires a more policy-relevant scenario. Importantly, a scenario that part of the community might find interesting might not be a scenario that climate modelers themselves find desirable to prioritize. All these reflections have been expanded upon in the related meeting report (Visioni et al., 2023c).
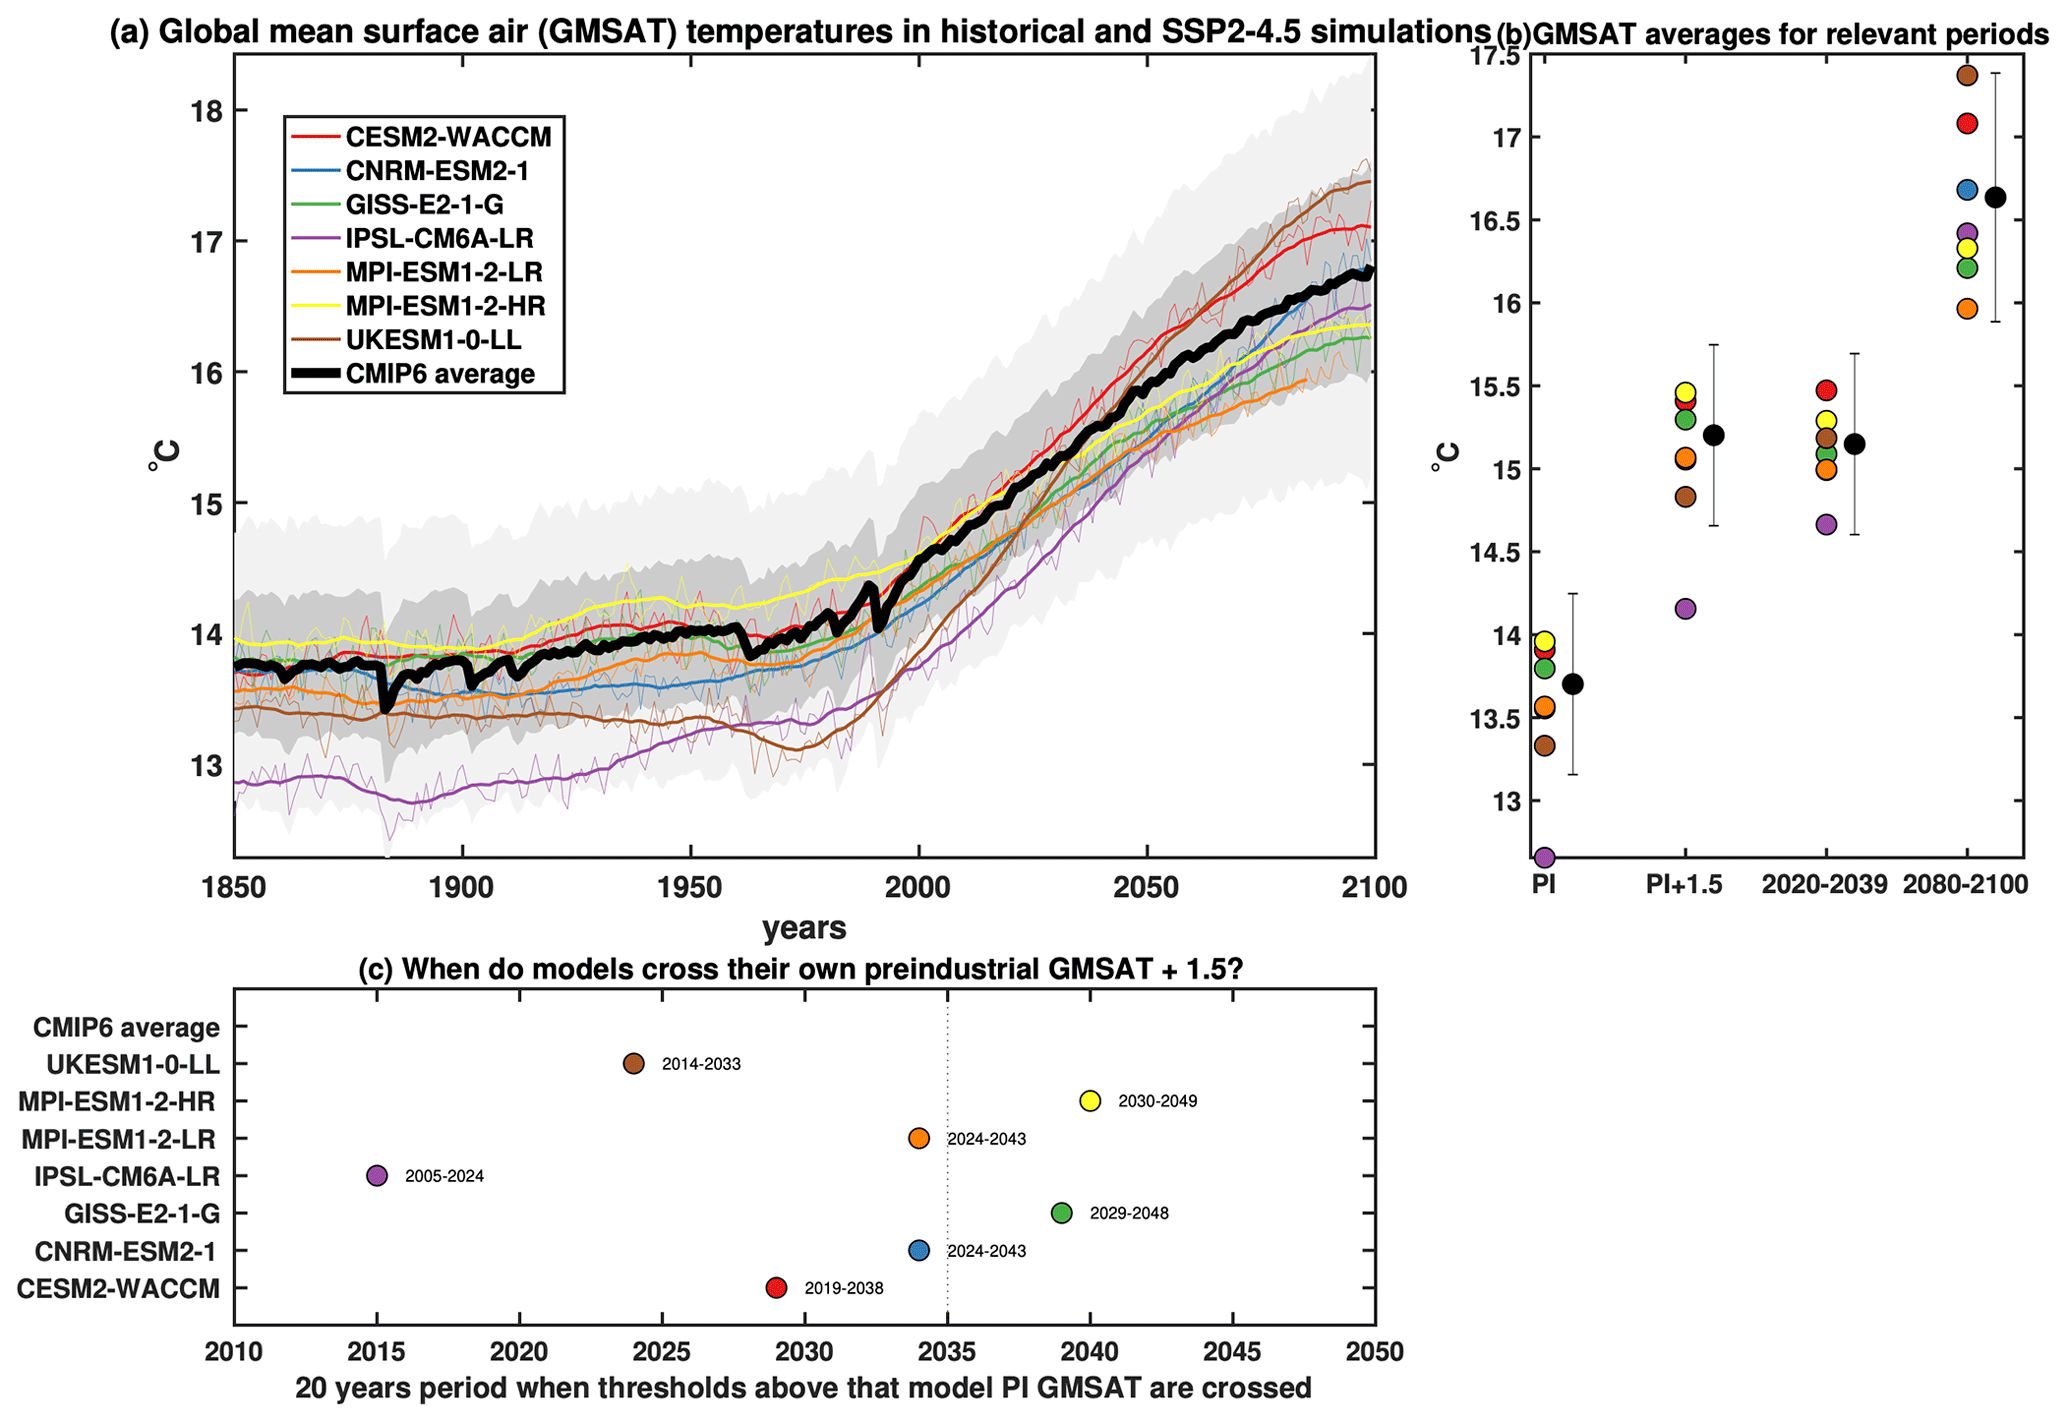
Figure 2(a) Global mean surface air temperature (GMSAT) in models participating in the sixth phase of GeoMIP for the historical (1850–2014) and SSP2-4.5 (2015–2100) periods, showing annual means (thin lines) and 20-year running means (thick lines). The black line represents the CMIP6 average, with dark and light shading representing 1 and 2 standard deviations, respectively. (b) GMSAT averages for periods relevant to the question of start and end dates for SRM experiments. PI is defined as the average for each model over all simulated PI control simulations. Black circles and error bars indicate the CMIP6 averages and standard deviations, respectively. (c) Time periods in which each model's SSP2-4.5 simulation reaches PI+1.5° C (considering a 20-year running average). The year 2035 (the proposed start date for PI+1.5° C not considering the model PI) is indicated with a dashed vertical line. For this figure, only the first ensemble member for each model has been used for consistency.
What follows is the initial proposal for a new GeoMIP experiment, hereby named G6-1.5K-SAI, selecting choices for all the open questions in Fig. 1. Close to each decision (in italics) there is an explanation for why that decision might be optimal from the point of view of GeoMIP and an exploration of other potential choices and why we did not take them. A summary figure is provided in Fig. 3 below.
-
Target metric: GMSAT. The Paris Agreement is defined in terms of breaching a GMSAT metric or not; many parts of the latest IPCC reports (Masson-Delmotte et al., 2018; Chen et al., 2021) discuss changes in regional climate and in impacts with respect to global mean temperature, and many of those scale linearly with GMSAT increases (Knutti et al., 2016; Seneviratne et al., 2016). Other proposed metrics, such as global mean precipitation (GMP), might be easily derived from GMSAT. For instance, in the ARISE simulations (Richter et al., 2022) the target for SAI was 1.5 °C, which corresponded to the 2020–2039 average. The corresponding GMP for that intervention during the 2050–2069 period (2.94 mm d−1) was only slightly below the value for the 2020–2039 average (2.95 mm d−1), while the corresponding value for the same future period under the underlying emission scenario was 3.01 mm d−1 (all values calculated over the whole ensemble of 10 simulation members considering total annual precipitation rates over every grid box). In general and also for larger cooling values, the warming-driven precipitation increase is larger than the SRM-specific precipitation decrease (Visioni et al., 2023a) in a global sense. While the two cannot be controlled simultaneously (Lee et al., 2021), there is always a relationship between global mean temperature changes and global mean precipitation changes (hydrological sensitivity; Pendergrass, 2020), meaning that based on simulations that target GMSAT, the equivalent results for hypothetical simulations that target GMP can easily be found by scaling the GMSAT results. The same error margins as G6sulfur (±0.2 K in the decadal mean) should be considered.
-
Underlying emission scenario: SSP2-4.5. Of all the current CMIP6 scenarios, SSP2-4.5 is the one understood to be closest to current emission pledges, especially in the medium term (see discussions in MacMartin et al., 2022, and Plummer et al., 2021). Therefore, it might be considered one of the most policy-relevant scenarios for the purposes of understanding SRM impacts. It is also worth considering that in the pre-2050 time frame, all SSP emission scenarios look very similar globally as a consequence and so does the resulting GMSAT from most climate models (Tebaldi et al., 2021). A scenario similar to SSP2-4.5 is also expected to be central to CMIP7 (Meinshausen et al., 2023). During the 13th GeoMIP meeting, the question of the potential use of an overshoot scenario in GeoMIP simulations was also discussed (see Visioni et al., 2023c). The current overshoot scenario that has been performed under CMIP6 – SSP5-3.4OS – is a possibility, as described in Tilmes et al. (2020). Currently, four out of the six models that participated in G6 have also simulated SSP5-3.4OS; of these four, only a fraction of the variables provided for SSP2-4.5 are available (from 40 % for CESM2-WACCM and the UK Earth System Model, UKESM1, to 10 % for the Institut Pierre-Simon Laplace model, IPSL). Therefore, it might be challenging for modeling centers that need to rerun the simulations, and the climate impact community might have problems finding the data it needs. Finally, if short-term simulations are considered, SSP5-3.4OS does not look that much different from SSP5-8.5 in Tilmes et al. (2020): in 2050, the SAI injection rate needed to stay at 1.5 °C is 12 Tg SO2 yr−1 in both scenarios.
-
1.5 °C above preindustrial levels (using definition 3 below). The Paris Agreement indicated a target of 1.5 °C, which has been widely used in the latest simulations (i.e., Tilmes et al., 2020; Richter et al., 2022; MacMartin et al., 2022). It also allows for different lower-priority tiers with higher (2.0 °C) or lower (1.0 °C) temperature targets. There are many ways one could define “above preindustrial (PI) levels” in an operative way. Here we outline three possibilities: (1) use the model PI control values (which can vary), with consequences for how intermodel comparisons would be conducted since some models reach 1.5 °C much faster than others; (2) use an externally measured value for PI to have an external and common base for all models, with similar consequences to (1) in that different models still reach 1.5 °C at different dates; or (3) use the 2020–2039 average as the definition of 1.5 °C as described in MacMartin et al. (2022) so that, given the same starting date, all models can start ramping up the SRM amount independently of how fast they were at warming in the historical period. As noted by Henry et al. (2023), the choice of both 2035 and defining 1.5 °C compared to the model PI period may mean relatively rapid deployment of SAI in models that have already exceeded the 1.5 °C target. If the start date is also changed in each model dependent on when that model reaches 1.5 °C, this may result in implausible start dates, as well as make intermodel comparisons more difficult based on our collective experience. Some of these differences are evident in Fig. 2, as model PI temperatures can vary by over 1.5 °C. On the other hand, global model spread in 2020–2039 GMSAT is much smaller (1 K) due to model behavior being tied to constraints in the historical periods. Therefore, we conclude that option (3) is the best basis upon which to define the starting date across different models – even if it might not necessarily be ideal when considering experiments with one single model such as Tilmes et al. (2020), which used option (1). It is useful to note how this choice mirrors recent discussions around when, exactly, the world will agree that we have reached 1.5 °C (Betts et al., 2023), which reinforces our choice to use a future projection rather than tying it to an abstract preindustrial value. Different temperature targets can still be considered and included as secondary tiers for interested modeling centers. For some, given the fact that observed GMSAT may exceed the 1.5 °C target in the next decade and considering the significant development times for any practical deployment of SAI, a GMSAT target of 2 °C might be more pragmatic. This may address the request put forward during the latest meeting to have multiple scenarios to compare when doing SAI assessments.
-
Start date of simulation and SRM implementation: 2035. This start date is easier to justify if the 2020–2039-based definition of 1.5 °C, option (3) above, is used; a time frame of over 10 years before a deployment could also be a reasonable guess for when a scaled-up deployment may conceivably start. Combined, the two choices allow for a slower ramping up of injections as opposed to lower temperature targets (Visioni et al., 2023a), which requires much more cooling at the beginning. Later dates could be considered, but then the speed of cooling would need to be properly defined as well: MacMartin et al. (2022) selected a 10-year period, but this is arbitrary, and for climate velocities in relation to ecosystem resilience, it might be too high (Trisos et al., 2018).
-
End date of simulation: 2085 (50 years after beginning). As described in the previous section, the appropriate end date strongly depends on research priorities. If the community is more interested in signal emergence and the modeling groups have limited computational capabilities, then 50 years should be prioritized to run three shorter ensemble members of 50 years (rather than one for 150 years). If modeling teams have more computer time, one ensemble member could be extended to 2100 to explore longer-term impacts like sea level rise and tipping points. At the end of the decided time frame, some modelers might be interested in looking at the effects of a “phase down” (MacMartin et al., 2022) or a termination, as was done in the experiments G2 (Jones and Haywood, 2012) and G4 (Trisos et al., 2018). This should not be included in the tier-1 experiment, which should end in 2085, but should be treated as a tier-2 branch run with different conditions from the main one and with a different name for the experiment.
-
Forcing strategy for the SRM method: SAI at 30° N and 30° S, symmetrical at 21 km. As of now, not many models are able to include a controller for SAI capable of managing multiple injection locations and targets; therefore, a symmetric injection strategy at 30° N and 30° S (one longitudinal box and one vertical layer) seems the most feasible to avoid problems with overcooling the tropics while performing comparatively reasonably at as many metrics as more complex injection strategies. Injection should be of SO2 with an option to prescribe optical depth. As shown for G6sulfur results (Visioni et al., 2021b), there is no functional difference if, in order to achieve the desired temperature targets in the models, the injection amounts are changed every 1 or every 10 years, but for consistency with more recent simulations a yearly update to the injection rates should be considered when possible. The choice of altitude, similar to other recent experiments (Richter et al., 2022) but narrower than G6sulfur (between 19 and 21 km), offers a good compromise between lifetime (Lee et al., 2023b) and technical constraints around deployment (Smith et al., 2022). For this experiment, we have decided to not include an MCB option: currently, there is ongoing research towards better defining the potential areas for applying local forcing and how to control for different targets, as has been done with SAI previously, and the community is working towards a set of experiments that might help clarify the path forward for the next GeoMIP iterations.
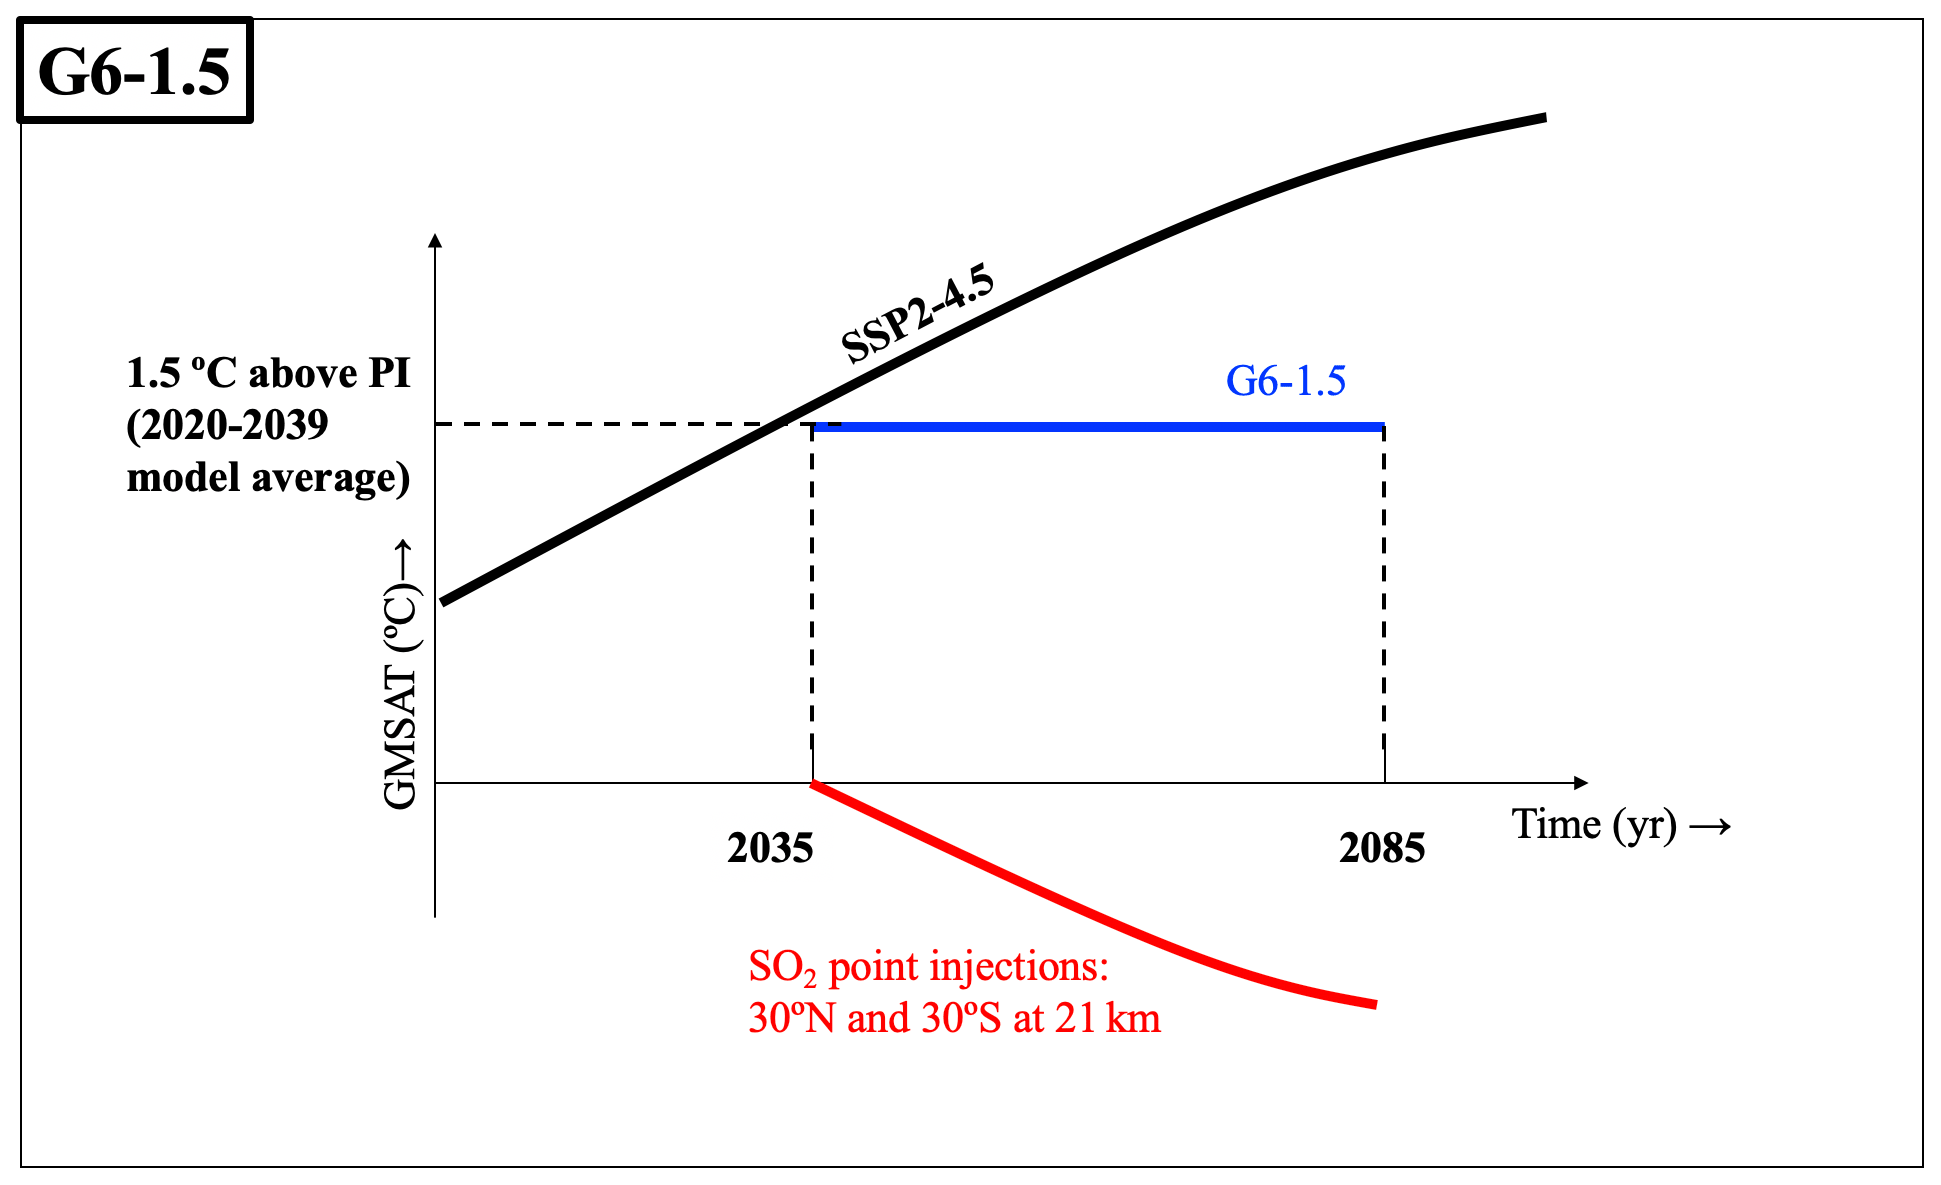
Figure 3A summary of the proposal for the new experiment G6-1.5. The black line represents the global mean surface air temperature (GMSAT) under the underlying emission scenario SSP2-4.5. The blue line represents the temperature under the proposed G6-1.5 experiment. The red line represents the amount of cooling over time. PI is preindustrial values.
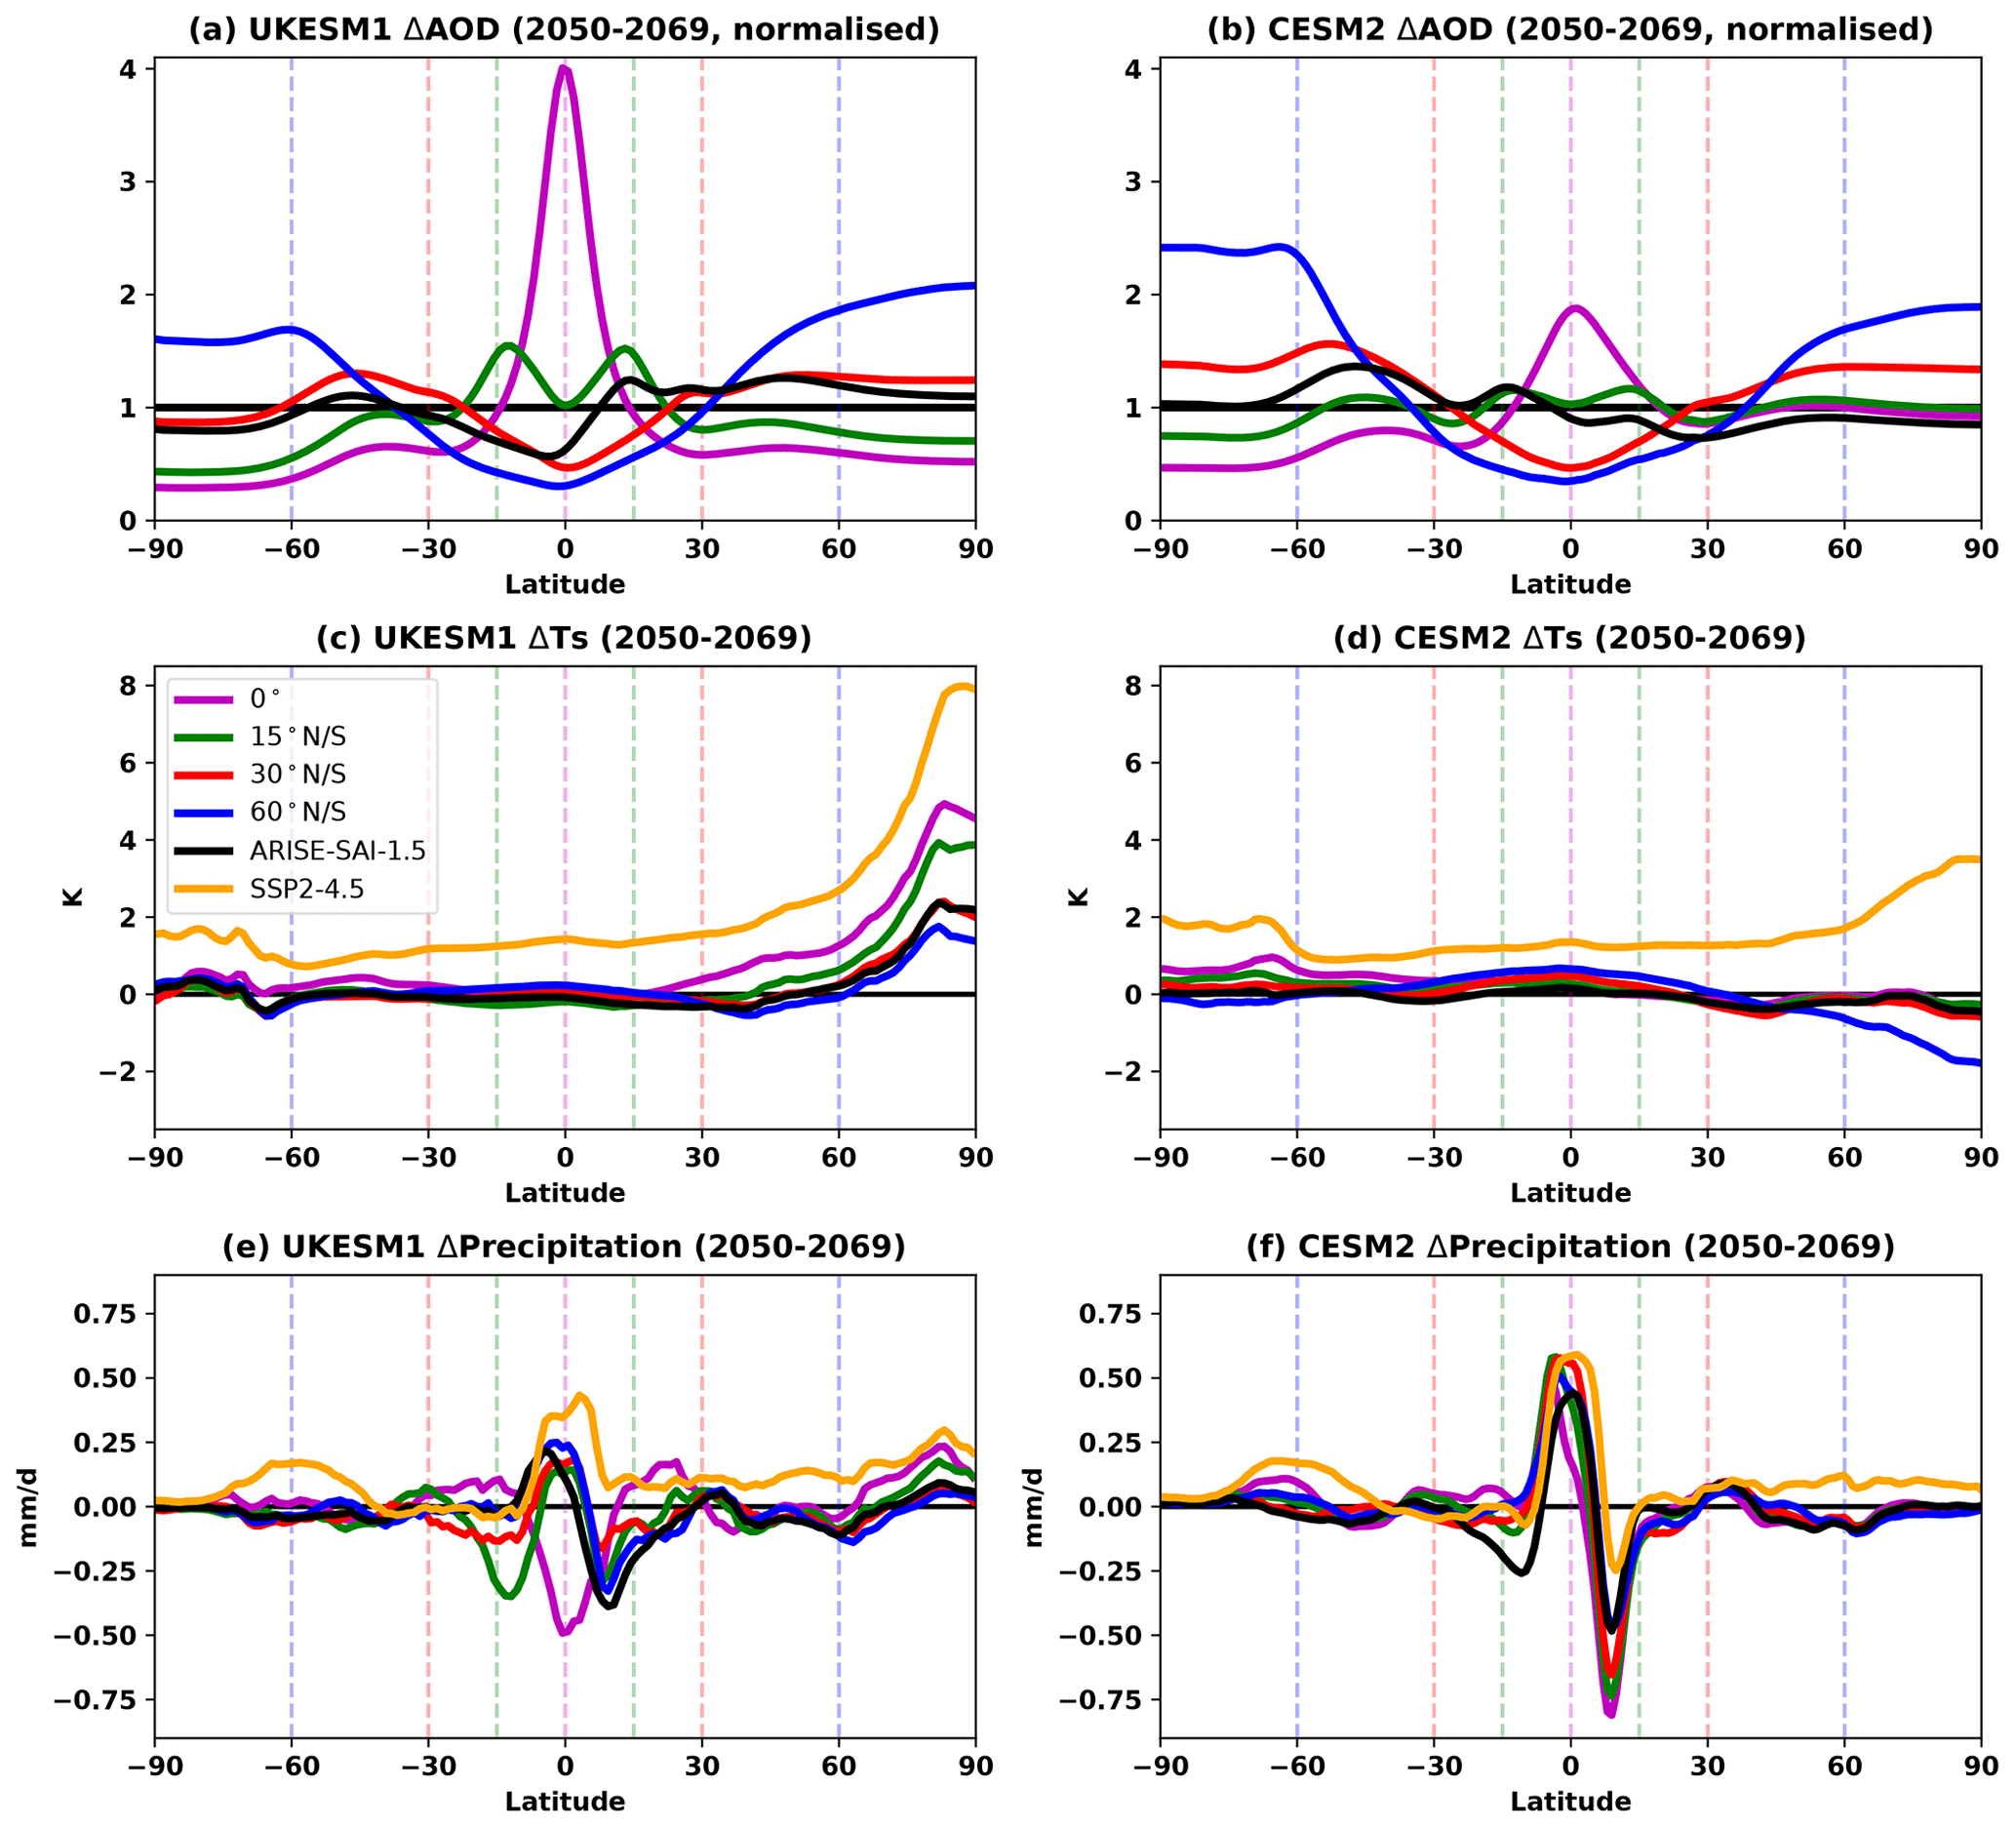
Figure 4A comparison of aerosol optical depth (at 550 nm), surface air temperature change and precipitation change for two Earth system models (UKESM1, left, and CESM2, right) using different latitudes: injecting everything at the Equator (0°); symmetric injection in both hemispheres (15, 30 and 60° N or S); or injection at 15° N, 30° N, 15° S and 30° S with the objective of maintaining the Equator-to-pole and interhemispheric differences in temperature at their reference levels (ARISE-SAI-1.5; Richter et al., 2022; Henry et al., 2023). The target for CESM2 is 0.5 °C below its reference period (2020–2039), whereas the target for UKESM1 is 1.5 °C above its preindustrial temperature, which is reached in 2014–2033. Shown are the temperature and precipitation changes with respect to each model's reference period. UKESM1 has one ensemble member per experiment, whereas CESM2 has three ensemble members per experiment.
In Fig. 4 we replicate some results from Zhang et al. (2024), where they are discussed more in depth, showing the differences between more complicated injection strategies in CESM2 and the one we propose here: as already reported in that work, the figure shows the benefits of an injection strategy that is simpler while still retaining most of the characteristics of an injection strategy using a controller that tries to maintain multiple degrees of freedom. Here, we also include results partially shown in Henry et al. (2023) comparing the CESM2 results with UKESM while also adding the additional strategies from Zhang et al. (2024). Future works, including additional models that will run the experiment we discussed here, will dig deeper into model differences and outcomes.
Multiple groups at the latest GeoMIP meetings have highlighted the need for specific data to be uploaded to be able to understand some impacts. In this section we give a brief overview of the variables in particular that should be provided by the modeling centers in order to conduct some of the analyses of interest to the community.
-
Ocean and cryosphere. Changes in 3D ocean currents, heat content and tropospheric wind fields are extremely important when considering change in regional sea levels, hurricane potential and teleconnection patterns. Similarly, given the polar amplification underway, changes in snow and sea ice cover, surface runoff, soil temperatures, and measures of biological activity are also valuable to understand the behavior of potential feedback in the context of SRM, such as that related to carbon release from permafrost thawing (Chen et al., 2020; Lee et al., 2023a).
-
Compound indices for health, well-being and urban planning. Daily minimum and maximum surface air temperature and precipitation and also possibly wind speeds and humidity can be used to construct compound indices, can provide valuable inputs to human health impact models (Song et al., 2022) and are valuable in evaluating potential urban planning scenarios dealing with, for example, flood risk. Such daily data are also necessary to build indices such as the Expert Team of Climate Change Detection Indices (ETCDDI) for climatic extreme analysis (Tye et al., 2022; Tan et al., 2023; Patel et al., 2023) and to inform hydrological models such as the Soil and Water Assessment Tool (SWAT; Tan et al., 2023).
-
Agricultural and ecological modeling. To better understand SRM impacts on crops and ecological systems, daily (and sometimes sub-daily) data related to changes in solar radiation (such as direct and diffuse changes) can also be of relevance, together with temperature and precipitation (Zarnetske et al., 2021). Other variables might include those necessary to calculate sulfate deposition rates for SAI (Visioni et al., 2020), as not every model for G6sulfur uploaded them.
Here we have described a new GeoMIP experiment to be run with the current Earth system model generation (i.e., with models that are participating in CMIP6). This new experiment proposes some novel advances in experimental design compared to the last iteration of GeoMIP experiments such as G6sulfur (Kravitz et al., 2015), particularly those related to start date, injection strategy for SO2 and considerations of recent policy-relevant targets such as those from the Paris Agreement. Furthermore, we have clearly outlined all the necessary choices that need to be made when considering an SRM modeling experiment and openly explained each decision in relation to the scenario selected in order to facilitate future discussions about scenarios in GeoMIP as we move towards deciding experiments for CMIP7.
The scenario choice, in terms of the chosen target described above, offers a way to maintain more consistency between CMIP6 and CMIP7 model experiments, given the direction of basing CMIP7 models on emission-driven rather than concentration-driven scenarios. Comparison across model generations is a very useful exercise to understand sources of uncertainty and model disagreement, which is what made a simple experiment like G1 so successful (Kravitz et al., 2021). The current G6sulfur experiment might be harder to compare against any CMIP7 experiment given its reliance on two SSP scenarios, one of which most likely will not be repeated (SSP5-8.5), while the new experiment we proposed might more easily be reproduced in CMIP7 given the middle-of-the-road scenario selected (SSP2-4.5) and temperature target independent of scenario choices. Further, a direct comparison of G6-1.5K-SAI with the future CMIP7 emission-driven scenario would also allow for better analyses of the responses of the carbon cycle, and ultimately of the radiative forcing differences, to SRM.
As mentioned in Visioni et al. (2023b), GeoMIP experiments do not need to encompass all potential SRM applications, and therefore we are not claiming our scenario choices indicate the only, or the optimal, scenario under which SRM should be considered or studied: the main focus of GeoMIP remains to offer a robust framework for model intercomparison through standardized experiments, which means they need to remain somewhat simple compared to the complexities of any given realistic SRM application in the real world in order to understand the underlying processes determining climatic impacts. More complex injection strategies than the one we proposed here or less-than-ideal scenarios with one or multiple actors are still an important area of research, and G6-1.5 should be considered a useful common benchmark against which other scenarios can be tested, for instance, by a single model.
Data for Fig. 4 are available at https://doi.org/10.5281/zenodo.8430485 (Henry, 2023). Data for Fig. 2 are available from the Earth System Grid Federation at https://esgf-node.llnl.gov/search/cmip6/ (WCRP, 2024). No original data have been produced for this paper.
The contact author has declared that none of the authors has any competing interests.
Publisher's note: Copernicus Publications remains neutral with regard to jurisdictional claims made in the text, published maps, institutional affiliations, or any other geographical representation in this paper. While Copernicus Publications makes every effort to include appropriate place names, the final responsibility lies with the authors.
Daniele Visioni is supported by the Cornell Atkinson Center for Sustainability. Alan Robock is supported by NSF grant AGS-2017113 and by a gift from the SilverLining Safe Climate Research Initiative. Matthew Henry is funded by the Natural Environment Research Council Exeter–NCAR (EXTEND) collaborative development grant (NE/W003880/1) and by SilverLining through the Safe Climate Research Initiative. Shingo Watanabe is supported by the Japan Society for the Promotion of Science (grant no. JP2103668). Support for Ben Kravitz was provided in part by the National Science Foundation through agreement SES-1754740; the NOAA's Climate Program Office, Earth's Radiation Budget (ERB; grant NA22OAR4310479) and the Indiana University Environmental Resilience Institute. The Pacific Northwest National Laboratory is operated for the US Department of Energy by Battelle Memorial Institute under contract DE-AC05-76RL01830. Douglas G. MacMartin is partially supported by the National Science Foundation through agreement CBET-2038246. Sarah J. Doherty's contribution was funded in part by the Cooperative Institute for Climate, Ocean, & Ecosystem Studies (CICOES) under NOAA Cooperative Agreement NA20OAR4320271, contribution no. 2024-1339.
This paper was edited by Tatiana Egorova and reviewed by two anonymous referees.
Ahlm, L., Jones, A., Stjern, C. W., Muri, H., Kravitz, B., and Kristjánsson, J. E.: Marine cloud brightening – as effective without clouds, Atmos. Chem. Phys., 17, 13071–13087, https://doi.org/10.5194/acp-17-13071-2017, 2017. a
Alterskjaer, K., Kristjánsson, J. E., Boucher, O., Muri, H., Niemeier, U., Schmidt, H., Schulz, M., and Timmreck, C.: Sea-salt injections into the low-latitude marine boundary layer: The transient response in three Earth system models, J. Geophys. Res.-Atmos., 118, 12195–12206, https://doi.org/10.1002/2013JD020432, 2013. a
Aubry, T. J., Toohey, M., Marshall, L., Schmidt, A., and Jellinek, A. M.: A New Volcanic Stratospheric Sulfate Aerosol Forcing Emulator (EVA_H): Comparison With Interactive Stratospheric Aerosol Models, J. Geophys. Res.-Atmos., 125, e2019JD031303, https://doi.org/10.1029/2019JD031303, 2020. a
Baur, S., Nauels, A., Nicholls, Z., Sanderson, B. M., and Schleussner, C.-F.: The deployment length of solar radiation modification: an interplay of mitigation, net-negative emissions and climate uncertainty, Earth Syst. Dynam., 14, 367–381, https://doi.org/10.5194/esd-14-367-2023, 2023. a
Bellamy, R., Chilvers, J., Vaughan, N. E., and Lenton, T. M.: “Opening up” geoengineering appraisal: multi-criteria mapping of options for tackling climate change, Global Environ. Chang., 23, 926–937, 2013. a
Berdahl, M., Robock, A., Ji, D., Moore, J. C., Jones, A., Kravitz, B., and Watanabe, S.: Arctic cryosphere response in the Geoengineering Model Intercomparison Project G3 and G4 scenarios, J. Geophys. Res.-Atmos., 119, 1308–1321, https://doi.org/10.1002/2013JD020627, 2014. a
Betts, R. A., Belcher, S. E., Hermanson, L., Tank, A. K., Lowe, J. A., Jones, C. D., Morice, C. P., Rayner, N. A., Scaife, A. A., and Stott, P. A.: Approaching 1.5 °C: how will we know we've reached this crucial warming mark?, Nature, 624, 33–35, https://doi.org/10.1038/d41586-023-03775-z, 2023. a
Burgess, M. G., Ritchie, J., Shapland, J., and Pielke, R.: IPCC baseline scenarios have over-projected CO2 emissions and economic growth, Environ. Res. Lett., 16, 014016, https://doi.org/10.1088/1748-9326/abcdd2, 2020. a, b
Chen, D., Rojas, M., Samset, B. H., Cobb, K., Diongue Niang, A., Edwards, P., Emori, S., Faria, S. H., Hawkins, E., Hope, P., Huybrechts, P., Meinshausen, M., Mustafa, S. K., Plattner, G. K., and Tréguier, A. M.: Framing, Context, and Methods, in: Climate Change 2021: The Physical Science Basis. Contribution of Working Group I to the Sixth Assessment Report of the Intergovernmental Panel on Climate Change, edited by: Masson-Delmotte, V., Zhai, P., Pirani, A., Connors, S. L., Péan, C., Berger, S., Caud, N., Chen, Y., Goldfarb, L., Gomis, M. I., Huang, M., Leitzell, K., Lonnoy, E., Matthews, J. B. R., Maycock, T. K., Waterfield, T., Yelekçi, O., Yu, R., and Zhou, B., book section 1, Cambridge University Press, Cambridge, United Kingdom and New York, NY, USA, https://www.ipcc.ch/report/ar6/wg1/downloads/report/IPCC_AR6_WGI_Chapter_01.pdf (last access: 3 April 2024), 2021. a, b
Chen, Y., Liu, A., and Moore, J. C.: Mitigation of Arctic permafrost carbon loss through stratospheric aerosol geoengineering, Nat. Commun., 11, 2430, https://doi.org/10.1038/s41467-020-16357-8, 2020. a, b
Clark, B., Xia, L., Robock, A., Tilmes, S., Richter, J. H., Visioni, D., and Rabin, S. S.: Optimal climate intervention scenarios for crop production vary by nation, Nature Food, 4, 902–911, https://doi.org/10.1038/s43016-023-00853-3, 2023. a
Diamond, M. S., Gettelman, A., Lebsock, M. D., McComiskey, A., Russell, L. M., Wood, R., and Feingold, G.: To assess marine cloud brightening's technical feasibility, we need to know what to study – and when to stop, P. Natl. Acad. Sci. USA, 119, e2118379119, https://doi.org/10.1073/pnas.2118379119, 2022. a
Geden, O. and Löschel, A.: Define limits for temperature overshoot targets, Nat. Geosci., 10, 881–882, https://doi.org/10.1038/s41561-017-0026-z, 2017. a
Haywood, J., Tilmes, S., Keutsch, F., Niemeier, U., Schmidt, A., Visioni, D., and Yu, P.: Stratospheric Aerosol Injection and its Potential Effect on the Stratospheric Ozone Layer, Chapter 6 in Scientific Assessment of Ozone Depletion: 2022, Tech. Rep. GAW Report No. 278, World Meteorological Organization, https://library.wmo.int/idurl/4/42105 (last access: 3 April 2024), 2023a. a
Haywood, J. M., Jones, A., Jones, A. C., Halloran, P., and Rasch, P. J.: Climate intervention using marine cloud brightening (MCB) compared with stratospheric aerosol injection (SAI) in the UKESM1 climate model, Atmos. Chem. Phys., 23, 15305–15324, https://doi.org/10.5194/acp-23-15305-2023, 2023b. a, b, c
Henry, M.: UKESM1 data for “G6-1.5” a new Geoengineering Model Intercomparison Project (GeoMIP) experiment integrating recent advances in sunlight reflection methods studies, Zenodo [data set], https://doi.org/10.5281/zenodo.8430485, 2023. a
Henry, M., Haywood, J., Jones, A., Dalvi, M., Wells, A., Visioni, D., Bednarz, E. M., MacMartin, D. G., Lee, W., and Tye, M. R.: Comparison of UKESM1 and CESM2 simulations using the same multi-target stratospheric aerosol injection strategy, Atmos. Chem. Phys., 23, 13369–13385, https://doi.org/10.5194/acp-23-13369-2023, 2023. a, b, c
Irvine, P., Emanuel, K., He, J., Horowitz, L. W., Vecchi, G., and Keith, D.: Halving warming with idealized solar geoengineering moderates key climate hazards, Nat. Clim. Change, 9, 295–299, https://doi.org/10.1038/s41558-019-0398-8, 2019. a
Jones, A. and Haywood, J. M.: Sea-spray geoengineering in the HadGEM2-ES earth-system model: radiative impact and climate response, Atmos. Chem. Phys., 12, 10887–10898, https://doi.org/10.5194/acp-12-10887-2012, 2012. a
Jones, A., Haywood, J. M., Jones, A. C., Tilmes, S., Kravitz, B., and Robock, A.: North Atlantic Oscillation response in GeoMIP experiments G6solar and G6sulfur: why detailed modelling is needed for understanding regional implications of solar radiation management, Atmos. Chem. Phys., 21, 1287–1304, https://doi.org/10.5194/acp-21-1287-2021, 2021. a
Keys, P. W., Barnes, E. A., Diffenbaugh, N. S., Hurrell, J. W., and Bell, C. M.: Potential for perceived failure of stratospheric aerosol injection deployment, P. Natl. Acad. Sci. USA, 119, e2210036119, https://doi.org/10.1073/pnas.2210036119, 2022. a
Knutti, R., Rogelj, J., Sedláček, J., and Fischer, E. M.: A scientific critique of the two-degree climate change target, Nat. Geosci., 9, 13–18, https://doi.org/10.1038/ngeo2595, 2016. a, b
Kravitz, B., Robock, A., Boucher, O., Schmidt, H., Taylor, K. E., Stenchikov, G., and Schulz, M.: The Geoengineering Model Intercomparison Project (GeoMIP), Atmos. Sci. Lett., 12, 162–167, https://doi.org/10.1002/asl.316, 2011. a, b, c
Kravitz, B., Robock, A., Tilmes, S., Boucher, O., English, J. M., Irvine, P. J., Jones, A., Lawrence, M. G., MacCracken, M., Muri, H., Moore, J. C., Niemeier, U., Phipps, S. J., Sillmann, J., Storelvmo, T., Wang, H., and Watanabe, S.: The Geoengineering Model Intercomparison Project Phase 6 (GeoMIP6): simulation design and preliminary results, Geosci. Model Dev., 8, 3379–3392, https://doi.org/10.5194/gmd-8-3379-2015, 2015. a, b, c, d
Kravitz, B., MacMartin, D. G., Wang, H., and Rasch, P. J.: Geoengineering as a design problem, Earth Syst. Dynam., 7, 469–497, https://doi.org/10.5194/esd-7-469-2016, 2016. a, b
Kravitz, B., MacMartin, D. G., Tilmes, S., Richter, J. H., Mills, M. J., Cheng, W., Dagon, K., Glanville, A. S., Lamarque, J.-F., Simpson, I. R., Tribbia, J., and Vitt, F.: Comparing Surface and Stratospheric Impacts of Geoengineering With Different SO2 Injection Strategies, J. Geophys. Res.-Atmos., 124, 7900–7918, https://doi.org/10.1029/2019JD030329, 2019. a, b
Kravitz, B., MacMartin, D. G., Visioni, D., Boucher, O., Cole, J. N. S., Haywood, J., Jones, A., Lurton, T., Nabat, P., Niemeier, U., Robock, A., Séférian, R., and Tilmes, S.: Comparing different generations of idealized solar geoengineering simulations in the Geoengineering Model Intercomparison Project (GeoMIP), Atmos. Chem. Phys., 21, 4231–4247, https://doi.org/10.5194/acp-21-4231-2021, 2021. a, b
Kuswanto, H., Kravitz, B., Miftahurrohmah, B., Fauzi, F., Sopahaluwaken, A., and Moore, J.: Impact of solar geoengineering on temperatures over the Indonesian Maritime Continent, Int. J. Climatol., 42, 2795–2814, https://doi.org/10.1002/joc.7391, 2022. a, b
Lee, W. R., MacMartin, D. G., Visioni, D., and Kravitz, B.: High-Latitude Stratospheric Aerosol Geoengineering Can Be More Effective if Injection Is Limited to Spring, Geophys. Res. Lett., 48, e2021GL092696, https://doi.org/10.1029/2021GL092696, 2021. a, b, c
Lee, W. R., MacMartin, D. G., Visioni, D., Kravitz, B., Chen, Y., Moore, J. C., Leguy, G., Lawrence, D. M., and Bailey, D. A.: High-Latitude Stratospheric Aerosol Injection to Preserve the Arctic, Earth's Future, 11, e2022EF003052, https://doi.org/10.1029/2022EF003052, 2023a. a
Lee, W. R., Visioni, D., Bednarz, E. M., MacMartin, D. G., Kravitz, B., and Tilmes, S.: Quantifying the Efficiency of Stratospheric Aerosol Geoengineering at Different Altitudes, Geophys. Res. Lett., 50, e2023GL104417, https://doi.org/10.1029/2023GL104417, 2023b. a
MacMartin, D. G., Visioni, D., Kravitz, B., Richter, J., Felgenhauer, T., Lee, W. R., Morrow, D. R., Parson, E. A., and Sugiyama, M.: Scenarios for modeling solar radiation modification, P. Natl. Acad. Sci. USA, 119, e2202230119, https://doi.org/10.1073/pnas.2202230119, 2022. a, b, c, d, e, f, g, h
Masson-Delmotte, V., Zhai, P., Pörtner, H.-O., Roberts, D., Skea, J., Shukla, P. R., Pirani, A., Moufouma-Okia, W., Péan, C., Pidcock, R., Connors, S., Matthews, J. B. R., Chen, Y., Zhou, X., Gomis, M. I., Lonnoy, E., Maycock, T., Tignor, M., Waterfield, T., Pirani, A., Moufouma-Okia, W., Péan, C., Pidcock, R., Connors, S., Matthews, J. B. R., Chen, Y., Zhou, X., Gomis, M. I., Lonnoy, E., Maycock, T., Tignor, M., and Waterfield, T. (Eds.): Global Warming of 1.5°C: An IPCC Special Report on the impacts of global warming of 1.5°C above pre-industrial levels and related global greenhouse gas emission pathways, in the context of strengthening the global response to the threat of climate change, sustainable development, and efforts to eradicate poverty, World Meteorological Organization, Geneva, Switzerland, ISBN 978-92-9169-151-7, https://www.ipcc.ch/sr15/ (last access: 3 April 2024), 2018. a, b
Meehl, G. A., Covey, C., McAvaney, B., Latif, M., and Stouffer, R. J.: Overview of the coupled model intercomparison project, B. Am. Meteorol. Soc., 86, 89–93, 2005. a
Meinshausen, M., Nicholls, Z. R. J., Lewis, J., Gidden, M. J., Vogel, E., Freund, M., Beyerle, U., Gessner, C., Nauels, A., Bauer, N., Canadell, J. G., Daniel, J. S., John, A., Krummel, P. B., Luderer, G., Meinshausen, N., Montzka, S. A., Rayner, P. J., Reimann, S., Smith, S. J., van den Berg, M., Velders, G. J. M., Vollmer, M. K., and Wang, R. H. J.: The shared socio-economic pathway (SSP) greenhouse gas concentrations and their extensions to 2500, Geosci. Model Dev., 13, 3571–3605, https://doi.org/10.5194/gmd-13-3571-2020, 2020. a, b
Meinshausen, M., Schleussner, C.-F., Beyer, K., Bodeker, G., Boucher, O., Canadell, J. G., Daniel, J. S., Diongue-Niang, A., Driouech, F., Fischer, E., Forster, P., Grose, M., Hansen, G., Hausfather, Z., Ilyina, T., Kikstra, J. S., Kimutai, J., King, A., Lee, J.-Y., Lennard, C., Lissner, T., Nauels, A., Peters, G. P., Pirani, A., Plattner, G.-K., Pörtner, H., Rogelj, J., Rojas, M., Roy, J., Samset, B. H., Sanderson, B. M., Séférian, R., Seneviratne, S., Smith, C. J., Szopa, S., Thomas, A., Urge-Vorsatz, D., Velders, G. J. M., Yokohata, T., Ziehn, T., and Nicholls, Z.: A perspective on the next generation of Earth system model scenarios: towards representative emission pathways (REPs), Geosci. Model Dev. Discuss. [preprint], https://doi.org/10.5194/gmd-2023-176, in review, 2023. a, b, c, d
National Academies of Sciences Engineering and Medicine: Reflecting Sunlight: Recommendations for Solar Geoengineering Research and Research Governance, The National Academies Press, Washington, DC, ISBN 978-0-309-67605-2, https://doi.org/10.17226/25762, 2021. a
O'Neill, B. C., Tebaldi, C., van Vuuren, D. P., Eyring, V., Friedlingstein, P., Hurtt, G., Knutti, R., Kriegler, E., Lamarque, J.-F., Lowe, J., Meehl, G. A., Moss, R., Riahi, K., and Sanderson, B. M.: The Scenario Model Intercomparison Project (ScenarioMIP) for CMIP6, Geosci. Model Dev., 9, 3461–3482, https://doi.org/10.5194/gmd-9-3461-2016, 2016. a
Parson, E. A.: Useful global-change scenarios: current issues and challenges, Environ. Res. Lett., 3, 045016, https://doi.org/10.1088/1748-9326/3/4/045016, 2008. a
Patel, T. D., Odoulami, R. C., Pinto, I., Egbebiyi, T. S., Lennard, C., Abiodun, B. J., and New, M.: Potential impact of stratospheric aerosol geoengineering on projected temperature and precipitation extremes in South Africa, Environ. Res. Clima., 2, 035004, https://doi.org/10.1088/2752-5295/acdaec, 2023. a
Pendergrass, A. G.: The Global-Mean Precipitation Response to CO2-Induced Warming in CMIP6 Models, Geophys. Res. Lett., 47, e2020GL089964, https://doi.org/10.1029/2020GL089964,, 2020. a
Plummer, D., Nagashima, T., Tilmes, S., Archibald, A., Chiodo, G., Fadnavis, S., Garny, H., Josse, B., Kim, J., Lamarque, J.-F., Morgenstern, O., Murray, L., Orbe, C., Tai, A., Chipperfield, M., Funke, B., Juckes, M., Kinnison, D., Kunze, M., Luo, B., Matthes, K., Newman, P. A., Pascoe, C., and Peter, T.: CCMI-2022: A new set of Chemistry-Climate Model Initiative (CCMI) Community Simulations to Update the Assessment of Models and Support Upcoming Ozone Assessment Activities, Newsletter no. 57, July 2021, p. 22, https://www.sparc-climate.org/publications/newsletter/ (last access: 3 April 2024), 2021. a
Richter, J. H., Visioni, D., MacMartin, D. G., Bailey, D. A., Rosenbloom, N., Dobbins, B., Lee, W. R., Tye, M., and Lamarque, J.-F.: Assessing Responses and Impacts of Solar climate intervention on the Earth system with stratospheric aerosol injection (ARISE-SAI): protocol and initial results from the first simulations, Geosci. Model Dev., 15, 8221–8243, https://doi.org/10.5194/gmd-15-8221-2022, 2022. a, b, c
Seneviratne, S. I., Donat, M. G., Pitman, A. J., Knutti, R., and Wilby, R. L.: Allowable CO2 emissions based on regional and impact-related climate targets, Nature, 529, 477–483, https://doi.org/10.1038/nature16542, 2016. a
Smith, W., Bhattarai, U., Bingaman, D. C., Mace, J. L., and Rice, C. V.: Review of possible very high-altitude platforms for stratospheric aerosol injection, Environ. Res. Commun., 4, 031002, https://doi.org/10.1088/2515-7620/ac4f5d, 2022. a
Song, F., Zhang, G. J., Ramanathan, V., and Leung, L. R.: Trends in surface equivalent potential temperature: A more comprehensive metric for global warming and weather extremes, P. Natl. Acad. Sci. USA, 119, e2117832119, https://doi.org/10.1073/pnas.2117832119, 2022. a, b
Tan, M. L., Juneng, L., Kuswanto, H., Do, H. X., and Zhang, F.: Impacts of Solar Radiation Management on Hydro-Climatic Extremes in Southeast Asia, Water, 15, 1089, https://doi.org/10.3390/w15061089, 2023. a, b
Tebaldi, C., Debeire, K., Eyring, V., Fischer, E., Fyfe, J., Friedlingstein, P., Knutti, R., Lowe, J., O'Neill, B., Sanderson, B., van Vuuren, D., Riahi, K., Meinshausen, M., Nicholls, Z., Tokarska, K. B., Hurtt, G., Kriegler, E., Lamarque, J.-F., Meehl, G., Moss, R., Bauer, S. E., Boucher, O., Brovkin, V., Byun, Y.-H., Dix, M., Gualdi, S., Guo, H., John, J. G., Kharin, S., Kim, Y., Koshiro, T., Ma, L., Olivié, D., Panickal, S., Qiao, F., Rong, X., Rosenbloom, N., Schupfner, M., Séférian, R., Sellar, A., Semmler, T., Shi, X., Song, Z., Steger, C., Stouffer, R., Swart, N., Tachiiri, K., Tang, Q., Tatebe, H., Voldoire, A., Volodin, E., Wyser, K., Xin, X., Yang, S., Yu, Y., and Ziehn, T.: Climate model projections from the Scenario Model Intercomparison Project (ScenarioMIP) of CMIP6, Earth Syst. Dynam., 12, 253–293, https://doi.org/10.5194/esd-12-253-2021, 2021. a
Tilmes, S., Richter, J. H., Mills, M. J., Kravitz, B., Macmartin, D. G., Vitt, F., Tribbia, J. J., and Lamarque, J. F.: Sensitivity of aerosol distribution and climate response to stratospheric SO2 injection locations, J. Geophys. Res.-Atmos., 122, 12591–12615, https://doi.org/10.1002/2017JD026888, 2017. a
Tilmes, S., MacMartin, D. G., Lenaerts, J. T. M., van Kampenhout, L., Muntjewerf, L., Xia, L., Harrison, C. S., Krumhardt, K. M., Mills, M. J., Kravitz, B., and Robock, A.: Reaching 1.5 and 2.0 °C global surface temperature targets using stratospheric aerosol geoengineering, Earth Syst. Dynam., 11, 579–601, https://doi.org/10.5194/esd-11-579-2020, 2020. a, b, c, d
Trisos, C. H., Amatulli, G., Gurevitch, J., Robock, A., Xia, L., and Zambri, B.: Potentially dangerous consequences for biodiversity of solar geoengineering implementation and termination, Nat. Ecol. Evol., 2, 475–482, https://doi.org/10.1038/s41559-017-0431-0, 2018. a, b
Tye, M. R., Dagon, K., Molina, M. J., Richter, J. H., Visioni, D., Kravitz, B., and Tilmes, S.: Indices of extremes: geographic patterns of change in extremes and associated vegetation impacts under climate intervention, Earth Syst. Dynam., 13, 1233–1257, https://doi.org/10.5194/esd-13-1233-2022, 2022. a
Virgin, J. G. and Fletcher, C. G.: On the Linearity of External Forcing Response in Solar Geoengineering Experiments, Geophys. Res. Lett., 49, e2022GL100200, https://doi.org/10.1029/2022GL100200, 2022. a
Visioni, D., Slessarev, E., MacMartin, D. G., Mahowald, N. M., Goodale, C. L., and Xia, L.: What goes up must come down: impacts of deposition in a sulfate geoengineering scenario, Environ. Res. Lett., 15, 094063, https://doi.org/10.1088/1748-9326/ab94eb, 2020. a
Visioni, D., MacMartin, D. G., and Kravitz, B.: Is Turning Down the Sun a Good Proxy for Stratospheric Sulfate Geoengineering?, J. Geophys. Res.-Atmos., 126, e2020JD033952, https://doi.org/10.1029/2020JD033952, 2021a. a, b, c
Visioni, D., MacMartin, D. G., Kravitz, B., Boucher, O., Jones, A., Lurton, T., Martine, M., Mills, M. J., Nabat, P., Niemeier, U., Séférian, R., and Tilmes, S.: Identifying the sources of uncertainty in climate model simulations of solar radiation modification with the G6sulfur and G6solar Geoengineering Model Intercomparison Project (GeoMIP) simulations, Atmos. Chem. Phys., 21, 10039–10063, https://doi.org/10.5194/acp-21-10039-2021, 2021b. a, b, c
Visioni, D., Bednarz, E. M., MacMartin, D. G., Kravitz, B., and Goddard, P. B.: The Choice of Baseline Period Influences the Assessments of the Outcomes of Stratospheric Aerosol Injection, Earth's Future, 11, e2023EF003851, https://doi.org/10.1029/2023EF003851, 2023a. a, b
Visioni, D., Kravitz, B., Robock, A., Tilmes, S., Haywood, J., Boucher, O., Lawrence, M., Irvine, P., Niemeier, U., Xia, L., Chiodo, G., Lennard, C., Watanabe, S., Moore, J. C., and Muri, H.: Opinion: The scientific and community-building roles of the Geoengineering Model Intercomparison Project (GeoMIP) – past, present, and future, Atmos. Chem. Phys., 23, 5149–5176, https://doi.org/10.5194/acp-23-5149-2023, 2023b. a, b, c, d
Visioni, D., Robock, A., Haywood, J., Henry, M., and Wells, A.: A new era for the Geoengineering Model Intercomparison Project (GeoMIP), B. Am. Meteorol. Soc., 104, E1950–E1955, https://doi.org/10.1175/BAMS-D-23-0232.1, 2023c. a, b, c
WCRP: CMIP6 project data, https://esgf-node.llnl.gov/search/cmip6/, last access: 3 April 2024. a
Wood, R.: Assessing the potential efficacy of marine cloud brightening for cooling Earth using a simple heuristic model, Atmos. Chem. Phys., 21, 14507–14533, https://doi.org/10.5194/acp-21-14507-2021, 2021. a
Zarnetske, P. L., Gurevitch, J., Franklin, J., Groffman, P. M., Harrison, C. S., Hellmann, J. J., Hoffman, F. M., Kothari, S., Robock, A., Tilmes, S., Visioni, D., Wu, J., Xia, L., and Yang, C.-E.: Potential ecological impacts of climate intervention by reflecting sunlight to cool Earth, P. Natl. Acad. Sci. USA, 118, e1921854118, https://doi.org/10.1073/pnas.1921854118, 2021. a, b, c
Zhang, Y., MacMartin, D. G., Visioni, D., Bednarz, E. M., and Kravitz, B.: Hemispherically symmetric strategies for stratospheric aerosol injection, Earth Syst. Dynam., 15, 191–213, https://doi.org/10.5194/esd-15-191-2024, 2024. a, b, c
- Abstract
- Introduction
- Reasons behind a new experiment and its timing
- Required decisions regarding a new experiment
- Experiment proposal for G6-1.5K-SAI
- Data requests for G6-1.5
- Conclusions – the road towards CMIP7
- Code and data availability
- Author contributions
- Competing interests
- Disclaimer
- Financial support
- Review statement
- References