the Creative Commons Attribution 4.0 License.
the Creative Commons Attribution 4.0 License.
 | 09 Apr 2024
A grid model for vertical correction of precipitable water vapor over the Chinese mainland and surrounding areas using random forest
Junyu Li
Yuxin Wang
Lilong Liu
Yibin Yao
Liangke Huang
Feijuan Li
Various ground-based observing techniques provide precipitable water vapor (PWV) products with different spatial resolutions. To effectively integrate these products, especially in terms of vertical orientation, spatial interpolation is essential. In this context, we have developed a model to characterize PWV variation with altitude over our study area. Our model, known as RF-PWV (a PWV vertical correction grid model with a 1° × 1° resolution), is constructed using random forest based on the relationship between the differences in different pressure level PWV data from the fifth-generation European Centre for Medium-Range Weather Forecasts reanalysis (ERA5) monthly average hourly data and corresponding differences in their height differences over time. When validated against 1 h ERA5 PWV profiles, RF-PWV exhibits a 99.84 % reduction in bias and a 63.41 % decrease in the RMSE compared with the most recent model, C-PWVC1. Furthermore, when validated against radiosonde data, RF-PWV shows a 96.36 % reduction in bias and a 5 % decrease in the RMSE compared with C-PWVC1. Additionally, RF-PWV outperforms C-PWVC1 in terms of resistance to seasonal and height difference interference. The model eliminates the need for meteorological parameters, allowing for high-precision PWV vertical correction by inputting only time and height differences. Consequently, RF-PWV can significantly reduce errors in vertical correction, enhance PWV fusion product accuracy, and provide insights into PWV vertical distribution, thereby contributing to climate research.
- Article
(4816 KB) - Full-text XML
- BibTeX
- EndNote


Precipitable water vapor (PWV), the most abundant greenhouse gas, primarily resides in the troposphere and plays a pivotal role in the global energy budget, hydrological cycle, and climate change (Zhang et al., 2018; Li et al., 2022b; Dessler and Sherwood, 2009; Raval and Ramanathan, 1989; Rocken et al., 1997). Various observation platforms, including radiosondes (RSs), microwave water vapor radiometers (WVRs), satellite remote sensing, ground-based global navigation satellite system (GNSS) data, and reanalysis data, have amassed extensive PWV data through long-term data accumulation (Huang et al., 2022). Combining multisource data enables more accurate and comprehensive water vapor monitoring and meteorological research (B. Zhang et al., 2019; Li et al., 2022a; Alshawaf et al., 2015). However, inconsistent pressure levels (heights) for storing PWV data from different sources hinder the fusion and reliability analysis of PWV multisource data (Chen et al., 2023b; Yang et al., 2023). Therefore, precise PWV vertical corrections are indispensable with respect to the utilization of PWV fusion products. The vertical distribution of PWV is closely related to the formation and distribution of rainfall and clouds, which is the pivot of weather forecasting and is also one of the factors affecting convection and monsoon climates (Bevis et al., 1992; Keil et al., 2008; Rose and Rencurrel, 2016). The vertical distribution and temporal variability of PWV are essential for understanding regional weather and global climate, improving the climate models, and predicting future climate change (Jacob, 2001; Renju et al., 2015). Hence, proposing a more accurate and applicable PWV vertical correction model is of paramount importance.
Common methods for PWV vertical correction involve establishing empirical vertical correction models to enhance the applicability of PWV vertical correction (Emardson and Johansson, 1998; Dousa and Elias, 2014; Huang et al., 2023). Reitan (1963) introduced an empirical formula describing water vapor density's exponential decrease in the vertical direction, based on the relationship between PWV near the surface and at high altitudes. The PWV lapse rate (−0.5 mm km−1), estimated by Kouba (2008) using the International GNSS Service (IGS) and the Vienna Mapping Function 1 (VMF1), has been widely adopted. However, considering the seasonal variations in the PWV lapse rate as constant introduces significant errors in PWV vertical correction (Tomasi, 1977; Leckner, 1978; H. X. Zhang et al., 2019; Zhang et al., 2022). Huang et al. (2021) developed a PWV vertical correction model that accounts for seasonal variations in the PWV lapse rate, offering greater accuracy and stability than the classic PWV vertical correction model (PWV lapse rate = −0.5 mm km−1) in China. Wang et al. (2022) incorporated spherical harmonic functions to develop a PWV vertical correction model, achieving high accuracy in the Tibetan Plateau. Nevertheless, many existing models assume PWV's exponential decrease and represent PWV lapse rate variations using periodic functions, failing to address complex nonlinear variations beyond daily/sub-daily and seasonal variations in the PWV lapse rate.
Neural network techniques are well suited for handling nonlinear problems and have found applications in various industries (Zheng et al., 2022). Machine learning has demonstrated promising potential in modeling tropospheric parameters (Ravuri et al., 2021; Lam et al., 2022). Senkal (2015) developed a model for predicting PWV in Turkey (Türkiye) using a resilient propagation (RP) neural network, which provides PWV estimates for a given location. Validation with RS PWV data in the study area revealed good agreement between the new model and RS PWV data. Zhu et al. (2022) created a weighted-mean temperature (Tm) vertical correction grid model (CTm-FNN) employing a feedforward neural network in China. This model outperformed the Chinese Tropospheric Model (CTrop) and Global Pressure and Temperature 3 (GPT3), reducing the root-mean-square error (RMSE) by 86 % and 83 %, respectively.
Therefore, this paper presents a random-forest-based precipitable water vapor vertical correction grid model, termed RF-PWV, for China and surrounding areas, harnessing random forest's powerful nonlinear fitting capability and the high temporal resolution of monthly average hourly PWV data. With RF-PWV, PWV differences can be obtained by simply inputting time and height differences, allowing for high-precision PWV vertical correction. The model offers PWV vertical correction techniques for multisource PWV fusion, weather forecasting, and climate studies.
We begin by providing an overview of the study area and the experimental dataset. Subsequently, we describe the data processing strategy and modeling methodology. Next, we evaluate the performance of the RF-PWV model. Finally, we conclude our study and outline future directions.
2.1 Study area
The study area includes the region between 15 and 55° N and between 70 and 135° E, covering mainland China and its surrounding areas, characterized by extensive land and ocean. China's topography exhibits significant variation, with higher elevations in the west gradually sloping to lower elevations in the east. Influenced by the monsoon climate, the summer monsoon brings substantial moisture from the ocean into the region, while winter introduces cold, dry air inland (Sun et al., 2019; W. X. Zhang et al., 2019). These geographical and climatic factors contribute to a complex spatiotemporal variation in PWV. As a result, the vertical distribution of PWV in this area presents a challenging problem to characterize, making it a suitable choice for our experimental area.
2.2 Datasets
2.2.1 ERA5 PWV
ERA5, the fifth-generation atmospheric reanalysis product developed by the European Centre for Medium-Range Weather Forecasts (ECMWF), offers access to 1 h meteorological data across 37 pressure levels, with a horizontal resolution as fine as 0.25° × 0.25°. This dataset can be downloaded from https://cds.climate.copernicus.eu/ (last access: 29 March 2024) (Albergel et al., 2018). ERA5 is renowned for its superior accuracy compared with its predecessor, ERA-Interim, and has gained widespread usage in meteorological research (Hersbach et al., 2020; Lu et al., 2023; Chen et al., 2023a). Moreover, the monthly averaged dataset, in terms of accuracy, rivals the daily dataset while demonstrating greater stability (Dogan and Erdogan, 2022). Additionally, the monthly average hourly dataset offers the advantage of capturing both seasonal variations in meteorological data and finer-grained sub-daily variations. In this study, we utilize the monthly average hourly dataset, which provides 1 h data at 37 pressure levels with a spatial resolution of 1° × 1°. The PWV for each pressure level is determined through integration, as described by Y. L. Zhang et al. (2019) and X. M. Wang et al. (2016):
Here, n represents the total number of layers; PWVi, qi, and pi represent the PWV (mm), specific humidity (kg kg−1), and pressure (Pa) at the i layer, respectively; ρw is the density of liquid water, which is standardized to 1000 kg m−3; g is the gravitational acceleration (m s−2); and φ denotes the latitude (rad).
It is crucial to emphasize that the upper boundary of the troposphere lies at approximately 10 km altitude (Ding, 2020). Consequently, PWV effectively approaches 0 mm when situated at elevations exceeding 12 km vertically. As a result, we restrict our PWV calculations to cover pressure levels within the range of 0 to 12 km above the grid point for all subsequent analyses and investigations.
2.2.2 RS PWV
RSs are widely recognized for their high-precision PWV measurements and are commonly considered a reference standard for evaluating other measurement techniques (Adeyemi and Joerg, 2012; Wang et al., 2021; Zhao et al., 2022). We obtained RS PWV data from the Integrated Global Radiosonde Archive (IGRA), accessible at https://www1.ncdc.noaa.gov/pub/data/IGRA (last access: 29 March 2024), with a temporal resolution of 12 h. We made use of meteorological data from 148 stations, focusing on pressure levels within the 0–12 km altitude range (as illustrated in Fig. 1). The specific humidity at each pressure level was determined by employing Eqs. (3) and (4), which are as follows (Zhai and Eskridge, 1997; Ross and Elliott, 1996):
Here, RH represents relative humidity (%), es signifies saturated vapor pressure (Pa), e denotes water vapor pressure (Pa), and q represents specific humidity (kg kg−1). Subsequently, RS PWV values for various pressure levels were calculated using Eq. (1).
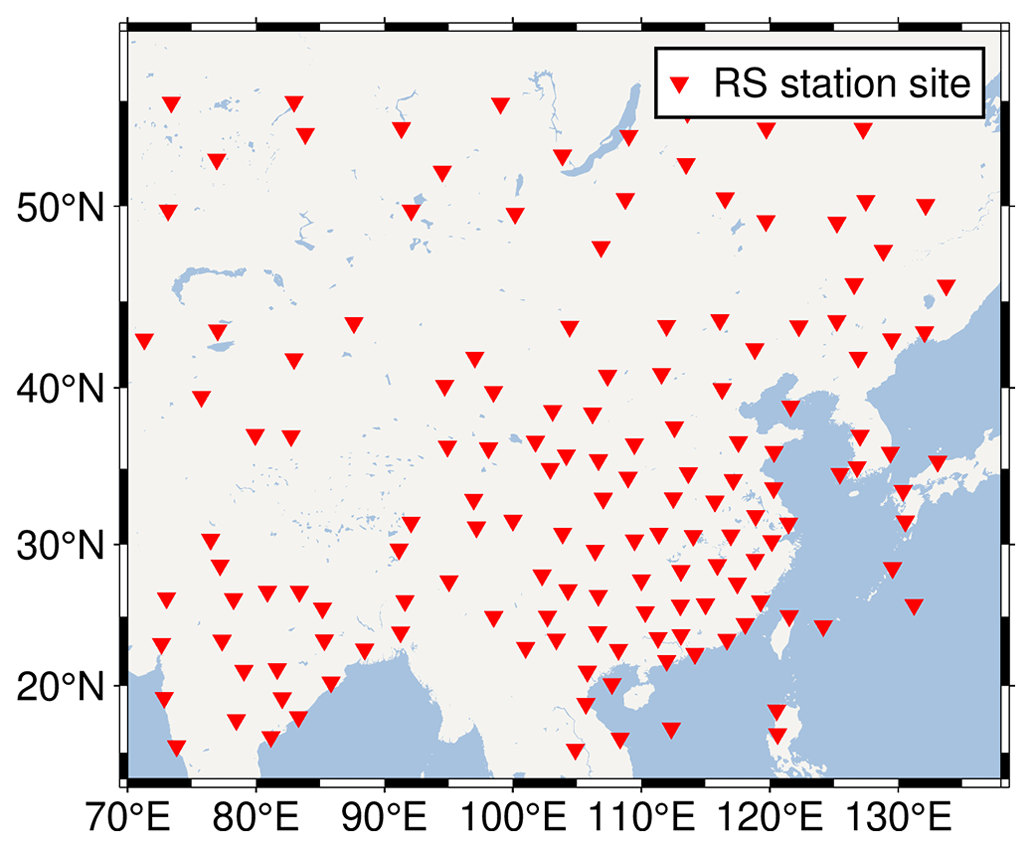
Figure 1Distribution of the selected radiosonde sites.
2.3 Establishment of the RF-PWV model
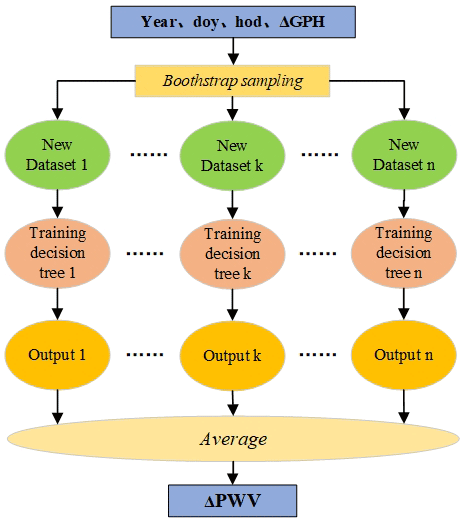
Random forest (RF), an ensemble learning method that combines multiple weak learners to form a single strong learner, typically improves generalization performance and model robustness (Breiman, 2001; Sagi and Rokach, 2018). Compared with the backpropagation neural network (BPNN), random forests are less prone to overfitting, especially with noisier datasets like PWV. Random forests handle noisy data and outliers more efficiently, making new models more robust and often easier to tune (L. A. Wang et al., 2016; Tyralis et al., 2019). In addition, our previous study has shown that RF outperforms BPNN with respect to modeling spatiotemporal variability in tropospheric parameters (Li et al., 2023a). Thus, RF is employed to model the height dependency of PWV. The equation governing random forest's prediction is expressed as follows:
Here, Y(X) is the final prediction result, Tb(X) represents the predicted value of each decision tree, and B denotes the number of decision trees. The selection of an appropriate number of decision trees is pivotal in modeling; too few trees may lead to overfitting, whereas too many trees can result in excessively long modeling times (Sun et al., 2021; Probst and Boulesteix, 2017).
2.3.1 Defining the primary parameter
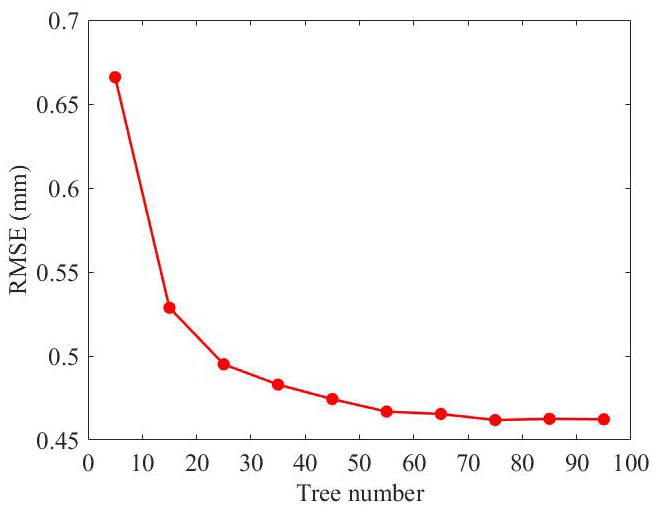
To assess the performance of machine learning models, 10-fold cross-validation is a commonly employed technique (Rodriguez et al., 2010; Zhang and Yao, 2021). In this context, 10-fold cross-validation was employed to ascertain the optimal number of decision trees based on the RMSE. The fundamental principle of 10-fold cross-validation entails dividing the input data into 10 groups. Subsequently, nine randomly selected groups are utilized as the training set, and the remaining group serves as the validation set. This process is reiterated 10 times to ensure that all data are included in both training and testing. This approach provides results that closely approximate the accuracy of the final model while guarding against overfitting (Santos et al., 2018). Based on our experience, we experimented with decision tree numbers ranging from 5 to 95, with a step size of 10, to train the model and evaluate its performance under varying decision tree quantities (Li et al., 2023a). The results, depicted in Fig. 2, exhibit a significant decline in the RMSE as the number of decision trees increases from 5 to 75, reaching a minimum at 75. However, increasing the number of trees to 75 does not significantly enhance accuracy, and it incurs longer training times. In consideration of the need for modeling at multiple grid points and balancing fitting quality with training time, a final decision was made to employ 55 trees to build the model.
2.3.2 Training the model
During the model training phase, we performed individual modeling at each grid point (1° × 1°) using ERA5 monthly average hourly PWV data at pressure levels ranging from 1000 to 225 hPa, within the 0 to 12 km altitude range, spanning the years 2008 to 2017. The ith PWV differences (, where 0 stands for the bottom level) between the i level and the bottom level and the responding height differences () were all computed and utilized as the training dataset. In essence, each grid point contained 63 360 samples (22 levels × 24 h × 12 months × 10 years), and the region consisted of 2706 grid points (66 longitudes × 41 latitudes) at a 1° × 1° resolution. The model, denoted as the RF-PWV model, characterizes the relationship between ΔPWV and ΔGPH, as illustrated in Fig. 3. The input data included year, day of the year (doy is the first day of the corresponding month), hour of the day (hod), and ΔGPH; the output data were ΔPWV. The reason why “year” was included as an input variable to RF-PWV is that the PWV lapse rate has a significant periodic function with a year (Du et al., 2023; Huang et al., 2023). When users employ the model, they are only required to provide the geopotential height of the target point, the datum PWV, the time (year, doy, hod), and the height difference of the target point concerning the datum point (ΔGPH). They can obtain the corresponding ΔPWV and can then get the PWV of the target height by adding the datum PWV to the ΔPWV.
In the application of the RF-PWV model, the four grid points surrounding the target point are determined based on the target point's geographical coordinates (latitude and longitude). Then, the ΔPWV at the corresponding height of the four selected points is calculated using the RF-PWV model. Finally, the ΔPWV at the target point's location is determined through bilinear interpolation. This process involves calculating the difference between the target point's GPH and the reference station's GPH0 to get the ΔGPH. Next, the time information is input into the models for the four nearest grid points to the target point, yielding the ΔPWV at the corresponding height of these grid points. Finally, bilinear interpolation is employed to calculate the ΔPWV at the target point's location. This method offers the advantage of not requiring an exceptionally strong spatial generalization ability for a single model. It comprehensively considers the relationship between the target point and the four nearest grid points within the limited spatial context, resulting in enhanced consistency and higher accuracy at each grid point, ensuring the overall model's robustness.
To validate the RF-PWV model, we employed hourly ERA5 and RS pressure level data from the study area in 2018 as the test set, while also selecting a newly developed PWV vertical correction model (C-PWVC1) for comparison. Note that the authors of the C-PWVC model suggest using C-PWVC1 directly for PWV vertical correction in the study area, so C-PWVC2 is ignored. C-PWVC1 has been proven to be more accurate than the classical PWV vertical correction model (PWV lapse rate = −0.5 mm km−1) in the study area (Huang et al., 2021). C-PWVC1 is a model using the exponential function to account for the height dependency of PWV. C-PWVC1 can be expressed as follows:
Here, and denote the PWV at h1 and h2, respectively; β is the PWV lapse rate; and doy is the day of the year. C-PWVC1 requires inputs of datum height, datum PWV, target height, and time to provide the PWV correction value at the target height, but the model is unable to capture nonlinear variations in the vertical direction. Then, the accuracy metrics employed for evaluation are bias and RMSE, as outlined below:
Here, X′ is the reference values, X denotes model outputs, and n is the number of samples.
3.1 Validation of RF-PWV using ERA5 PWV
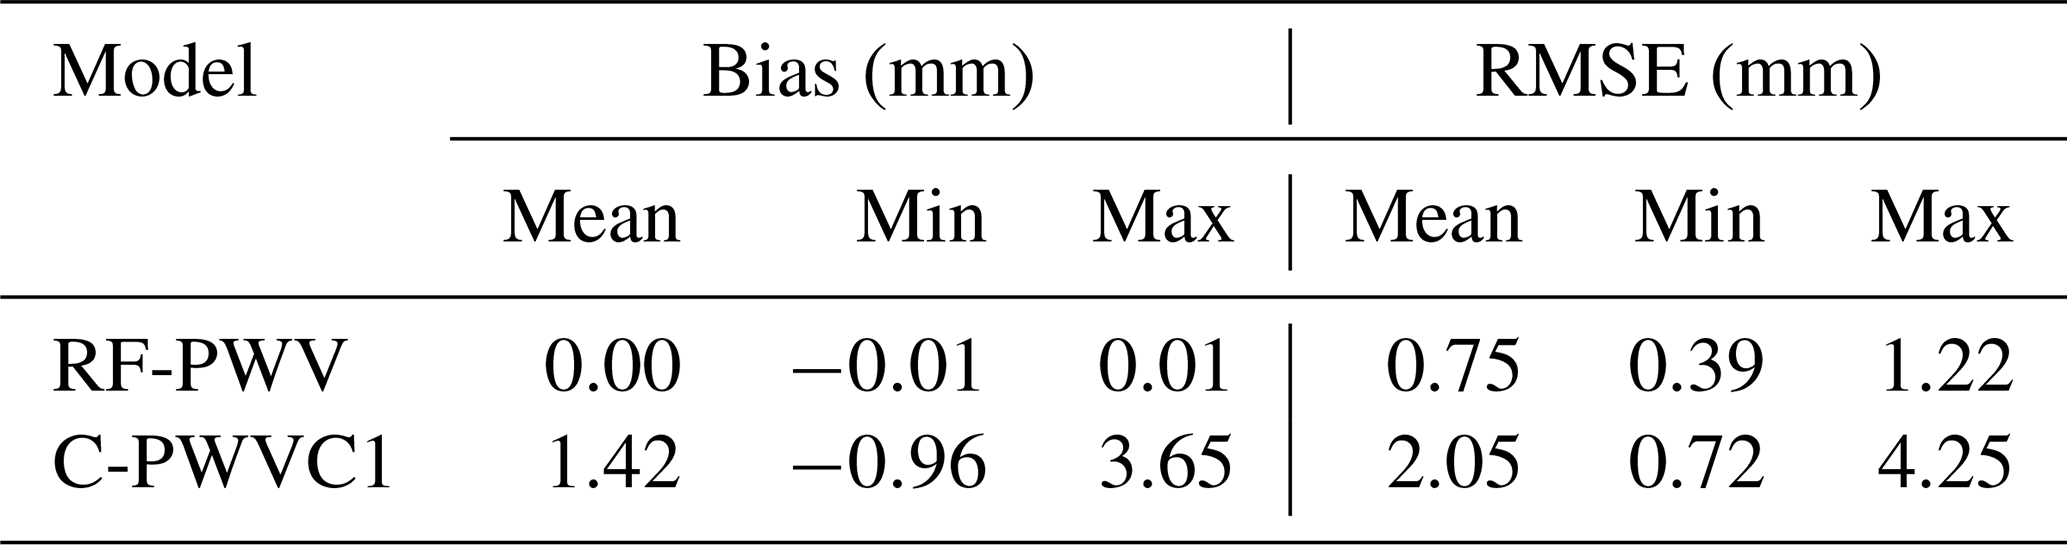
The RF-PWV model and C-PWVC1 were applied to vertically correct the hourly ERA5 bottom-level PWV data (1° × 1°) for the year 2018 to other pressure levels within the 0–12 km altitude range, excluding the bottom level. The results were then compared with ERA5 data, and the overall bias and RMSE are presented in Table 1. RF-PWV exhibited a bias close to 0 mm, indicating minimal systematic bias between the interpolated PWV and ERA5 PWV. Moreover, it reduced bias by 1.42 mm compared with C-PWVC1, corresponding to a remarkable optimization of 99.84 %. The bias values for RF-PWV were observed to fluctuate slightly within the range of −0.01 to 0.01 mm. Additionally, the RF-PWV RMSE showed a substantial reduction of 63.40 % compared with C-PWVC1. Furthermore, the RMSE values for RF-PWV demonstrated a more stable fluctuation pattern with a considerably narrower range. Overall, RF-PWV exhibited significantly higher accuracy than C-PWVC1, with corrected results showing better agreement with the reference values.
Table 1Validation results of the RF-PWV and C-PWVC1 models tested using ERA5 data.
To provide a spatial illustration of the models' consistency with respect to accuracy, Fig. 4 displays the bias and RMSE values for each grid point for both RF-PWV and C-PWVC1. Notably, C-PWVC1 exhibited a significant north–south difference in bias, with larger values in the south and smaller values in the north. In contrast, RF-PWV demonstrated a substantial reduction in bias across almost all grid points in the study area, approaching 0 mm, effectively eliminating the north–south discrepancy. The most noteworthy improvement in accuracy was observed in the Tibetan Plateau and low-latitude regions. Despite the challenging climate conditions in the Tibetan Plateau and the strong land–sea interactions in the study area's low latitudes, which contribute to complex PWV variations, RF-PWV still achieved a bias close to 0 mm. These results highlight RF-PWV's adaptability to diverse weather conditions and its wide applicability. Furthermore, C-PWVC1 displayed a north–south difference in the RMSE. Higher RMSE values were concentrated in the southwestern and southeastern regions, reaching a maximum of 4.25 mm. This phenomenon is mainly attributable to the proximity of these regions to the ocean, frequent water vapor exchange between land and sea, and the complexity of PWV variations. However, RF-PWV's RMSE in these regions was significantly smaller than that of C-PWVC1, consistently measuring below 2 mm. Overall, RF-PWV's RMSE was lower than that of C-PWVC1 across the study area. Furthermore, RF-PWV exhibited excellent agreement, with values mostly hovering around 0.75 mm, nearly independent of spatial variations. These outcomes underscore the higher accuracy and improved spatial accuracy consistency of RF-PWV across the study area.
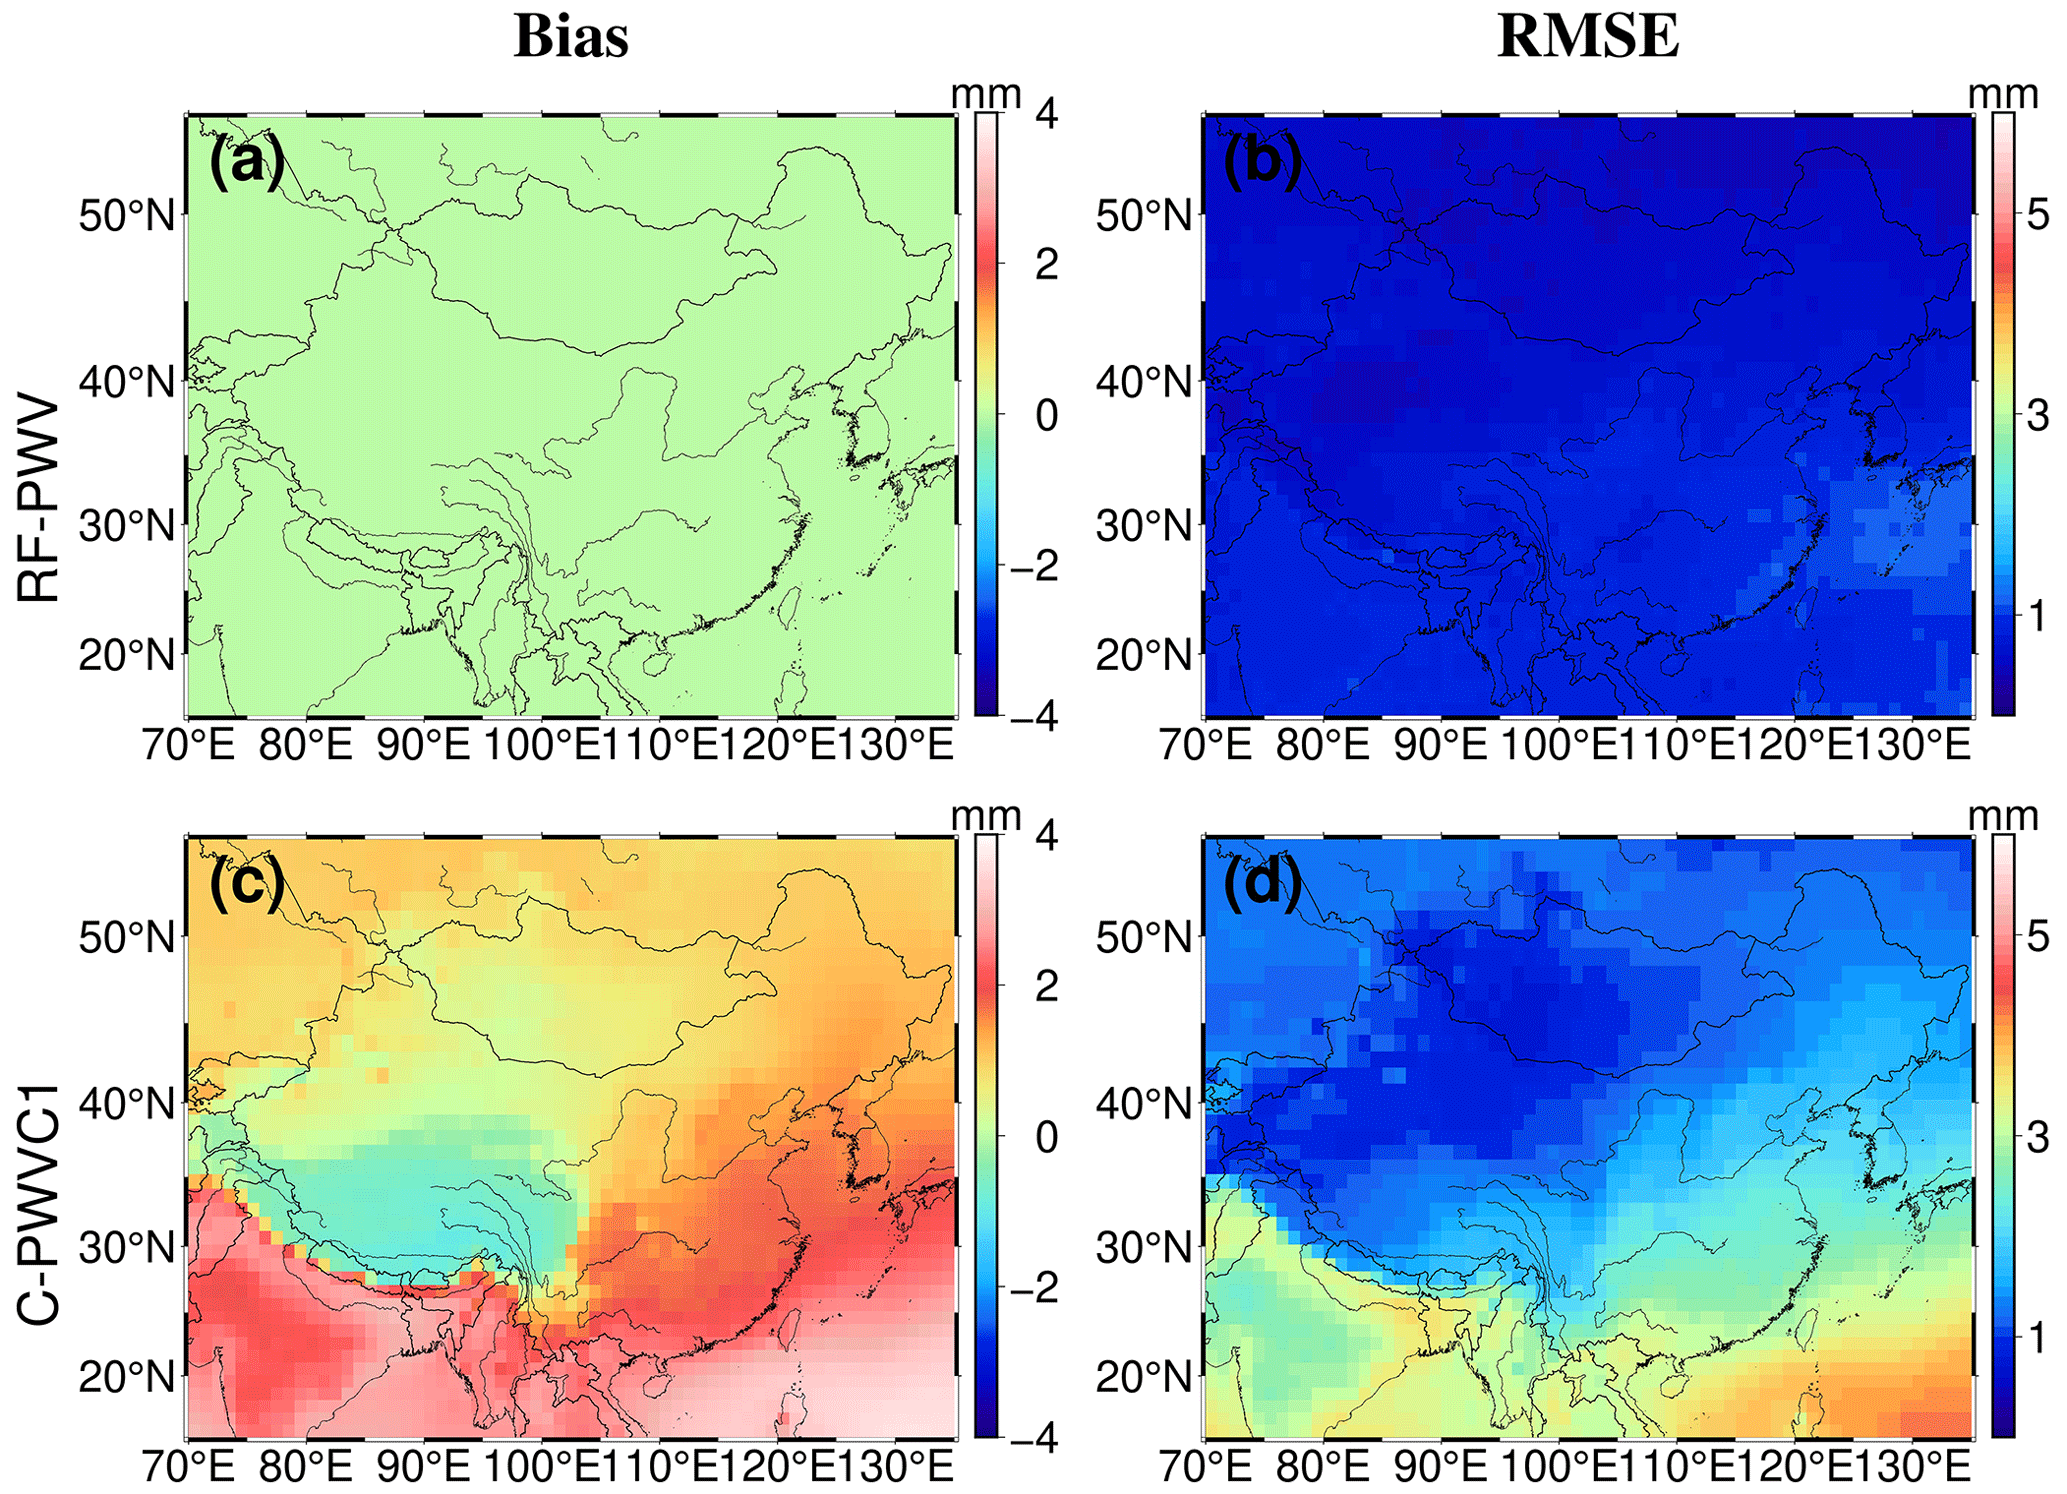
Figure 4Distributions of bias and RMSE for RF-PWV and C-PWVC1 with respect to the ERA5 data.
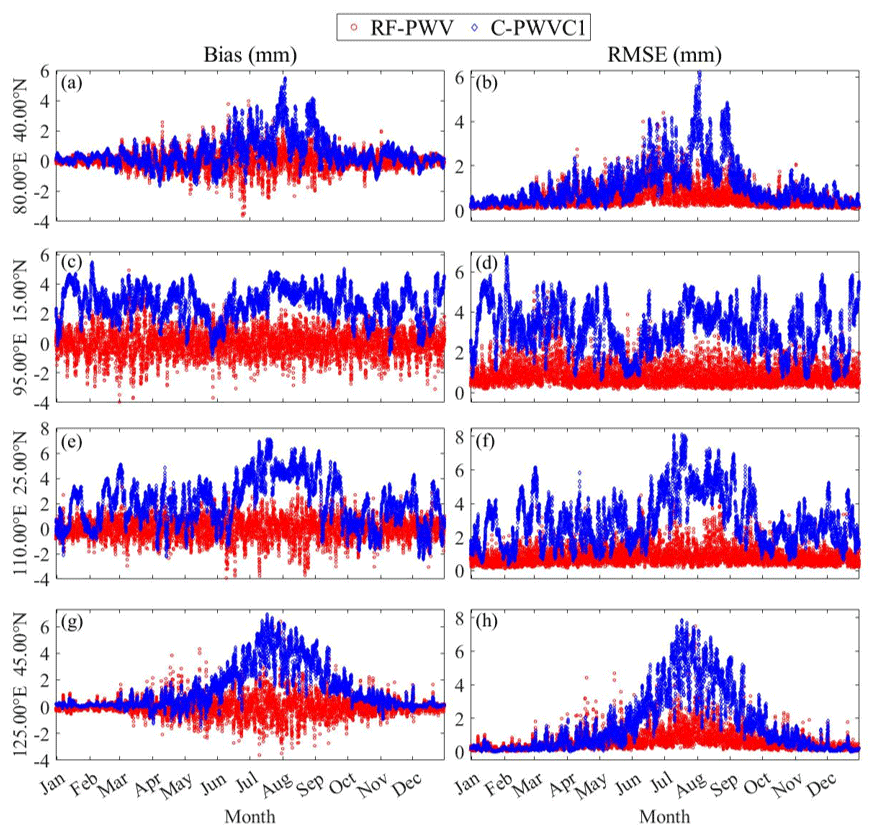
To further evaluate the models' performance across different seasons, we calculated the bias and RMSE values for four representative grid points using data from 2018. These grid points were selected to represent various regions: 40.00° N, 80.00° E in the northwestern region; 15.00° N, 95.00° E in the southwestern region; 25.00° N, 110.00° E in the southeastern region; and 45.00° N, 125.00° E in the northeastern region. Figure 5a, b, g, and h illustrate that C-PWVC1 exhibited the highest bias and RMSE values during June–September, reaching 5.41 and 6.23 mm at 40.00° N, 80.00° E and 6.85 and 7.75 mm at 45.00° N, 125.00° E, respectively. Conversely, the lowest bias and RMSE values were recorded during January–February and November–December, hovering around 0 mm, with discernible seasonal fluctuations. This pattern is primarily attributed to significant PWV variations during the wet and rainy northern summers, compared with relatively mild PWV variations during the cold and dry winters. In contrast, Fig. 5c, d, e, and f show that the seasonal differences in the bias and RMSE for C-PWVC1 were less pronounced in the southern regions than in the northern regions. At 25.00° N, 110.00° E, which experiences abundant PWV changes and heavy rainfall throughout the year, the model's accuracy was relatively lower, with no noticeable seasonal variations. Similarly, near the Equator (15.00° N, 95.00° E), overall bias and RMSE values were more significant, with minimal seasonal differences. Notably, RF-PWV achieved substantially lower bias and RMSE values than C-PWVC1 during the summer months. Throughout the year, RF-PWV's bias and RMSE exhibited relatively stable patterns, with minimal fluctuations around 0 mm. Conversely, Fig. 5c, d, e, and f reveal that RF-PWV maintained bias and RMSE values around 0 mm, offering greater accuracy compared with C-PWVC1 in the southern grid points. In summary, RF-PWV exhibited enhanced resistance to seasonal variations, maintaining stable and accurate performance throughout the year across the study area.
Given that more than three-quarters of the water vapor is concentrated in the lower atmosphere, in practice, most of the vertical correction of PWV occurs in the lower atmosphere (Yang et al., 2020). The bias and RMSE for C-PWVC1 and RF-PWV are statistically determined based on height differences, divided into 12 sections ranging from 0 to 6 km with intervals of 500 m. This division helps assess the applicability of the two models across different height segments, as shown in Fig. 6. Notably, C-PWVC1 exhibits a positive bias in every height difference segment, with the bias increasing as the height difference rises from 0 to 2.5 km, ultimately stabilizing at around 2.0 mm. RF-PWV bias tends to approach 0 mm in all height difference segments and shows negative bias after the height difference exceeds 2.5 km, with the absolute value increasing and reaching a maximum value of less than 0.2 mm. In each height difference segment between 0 and 6 km, RF-PWV bias is closer to 0 mm than C-PWVC1 bias, indicating that the corrected value of RF-PWV is more consistent with the reference value across different height difference segments. Additionally, the RF-PWV RMSE is significantly smaller than that of C-PWVC1 in all height difference segments. The RMSE for C-PWVC1 exhibits the same increasing trend as bias, stabilizing around 3 mm after the height difference exceeds 2.5 km. In contrast, the RF-PWV RMSE is less than 1 mm in all height difference segments. These findings demonstrate that RF-PWV offers improved correction effectiveness and higher accuracy compared with C-PWVC1. This enhanced adaptability to height differences enables a finer-scale description of the vertical distribution of PWV.
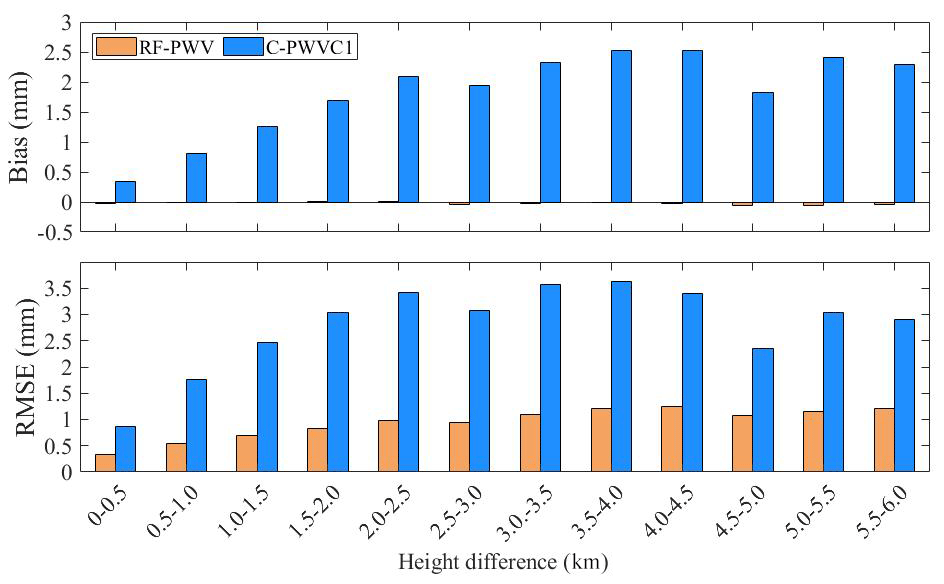
Figure 6Accuracy of RF-PWV and C-PWVC1 in each height difference segment with respect to ERA5 data.
3.2 Validation of RF-PWV using RS PWV
To further validate the applicability of RF-PWV, the PWV data for all pressure levels within the 0–12 km altitude range from 148 RS stations in 2018 were used to assess the accuracy of RF-PWV and C-PWVC1. As the sounding stratified data are not uniformly distributed vertically, the variation in PWV with elevation was fitted using an exponential function based on the 2018 PWV data from each sounding station. Using the fitting results, the PWV data of neighboring levels were interpolated using inverse distance weighting (IDW) to generate a sequence of PWV values within the range of 0–12 km with intervals of 500 m. This sequence of PWV values served as reference values. The datum PWV is the PWV corresponding to the surface height of the RS station. For each RS station, the four grid points (1° × 1°) in proximity were selected, and the ΔPWVi (i=1, 2, 3, 4, where i denotes the four proximity grid points) of the target height relative to the datum height was computed based on the RF model of each grid point. Then ΔPWVi values were bilinearly interpolated to the corresponding location of the RS station to obtain the RF-PWV result. To account for systematic bias between modeling data and reference values data, the average difference between the corrected RF-PWV value and the corresponding reference value was computed as the systematic bias for each level at the RS station. Finally, the statistical accuracy of RF-PWV and C-PWVC1, after eliminating the systematic bias, is presented in Table 2.
Table 2Validation results of the RF-PWV and C-PWVC1 models tested using RS data.
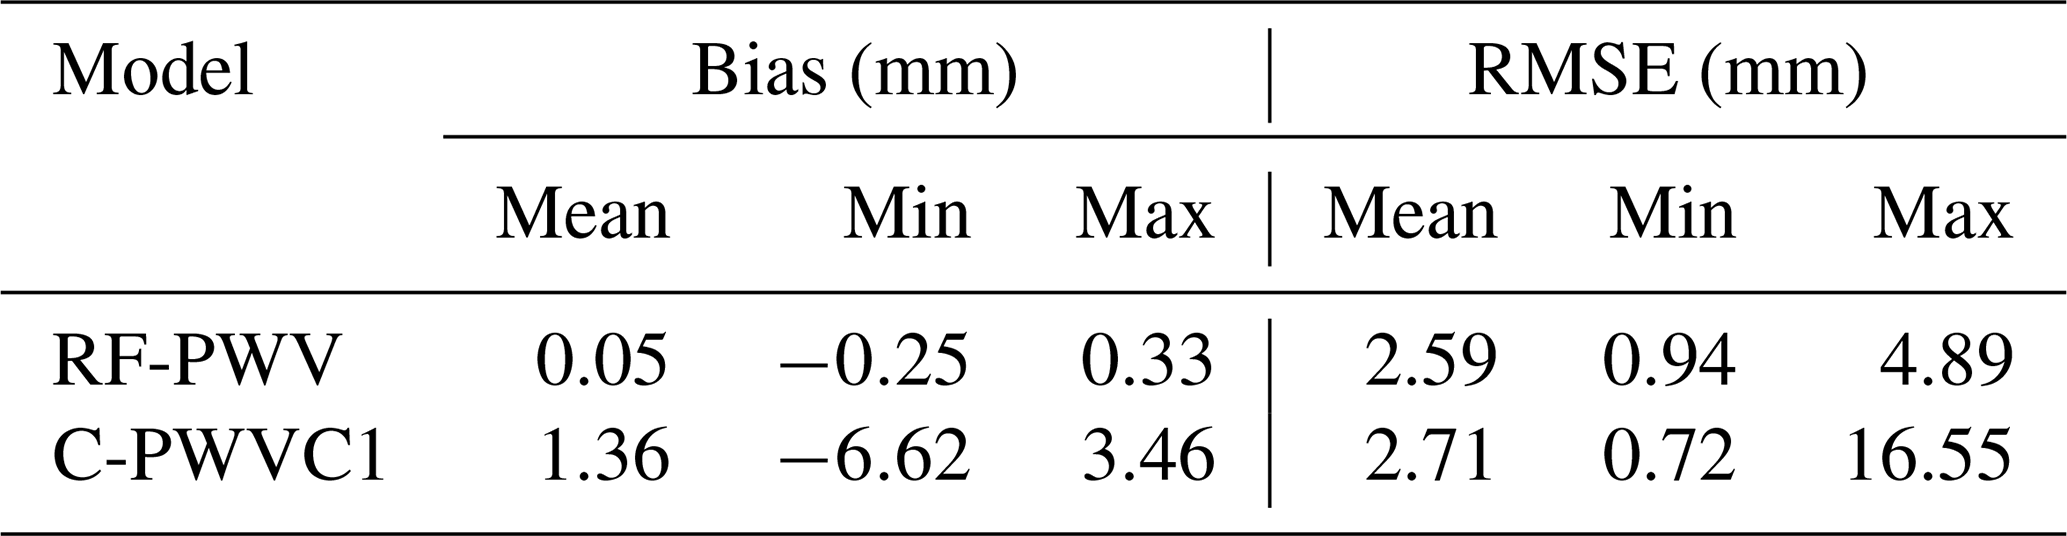
Table 2 reveals that the accuracy of C-PWVC1 is significantly lower than that of RF-PWV. C-PWVC1 exhibits a bias of 1.36 mm, ranging from −6.62 to 3.46 mm, whereas the RF-PWV bias is only 0.05 mm, reduced by 1.31 mm and improved by 96.36 %. The range of variation is notably reduced to −0.25 to 0.33 mm. Moreover, the RF-PWV RMSE is considerably smaller and more stable, with the RMSE reduced to 2.59 mm, ranging from 0.49 to 4.89 mm, corresponding to a decline rate of approximately 5 % compared with C-PWVC1. Consequently, RF-PWV demonstrates superior accuracy and stability in vertical PWV correction at 148 RS stations in the study area. Moreover, these results show that the accuracy analyzed by RS data is slightly lower than that estimated by ERA5 data. This is because of the significant systematic bias between ERA5 and RSs (Zhu et al., 2022; Sun et al., 2019), but such accuracy can still meet the meteorological requirements for PWV accuracy.
The bias and RMSE values for each RS station are also computed to further illustrate the application capabilities of the two models, as shown in Fig. 7. As depicted in Fig. 7a and c, C-PWVC1 exhibits a positive bias for almost all stations except for the RS stations in the Yunnan–Guizhou Plateau, where the bias is less pronounced. In contrast, the RF-PWV bias is consistently less than 0.5 mm and closer to 0 mm. Compared with C-PWVC1, the absolute value of the RF-PWV bias is effectively reduced in the Yunnan–Guizhou Plateau region, with the most significant reduction reaching 3.13 mm. Meanwhile, the positive bias in other areas is also reduced to varying degrees. Figure 7b and d demonstrate that the RF-PWV RMSE exhibits a certain degree of reduction compared with C-PWVC1, with the most substantial decline occurring in the sites located in the Yunnan–Guizhou Plateau. Given the complex terrain and significant undulations in the Yunnan–Guizhou Plateau, where the difference in height between the target point and the reference grid can be up to 1–2 km (Chen et al., 2011), the RF-PWV RMSE at all RS stations is less than 5 mm, with a maximum RMSE reduction of 11.65 mm. Therefore, RF-PWV demonstrates superior performance and more stable accuracy compared with C-PWVC1 across the entire study area. This advantage is particularly pronounced in regions with significant variations in height.
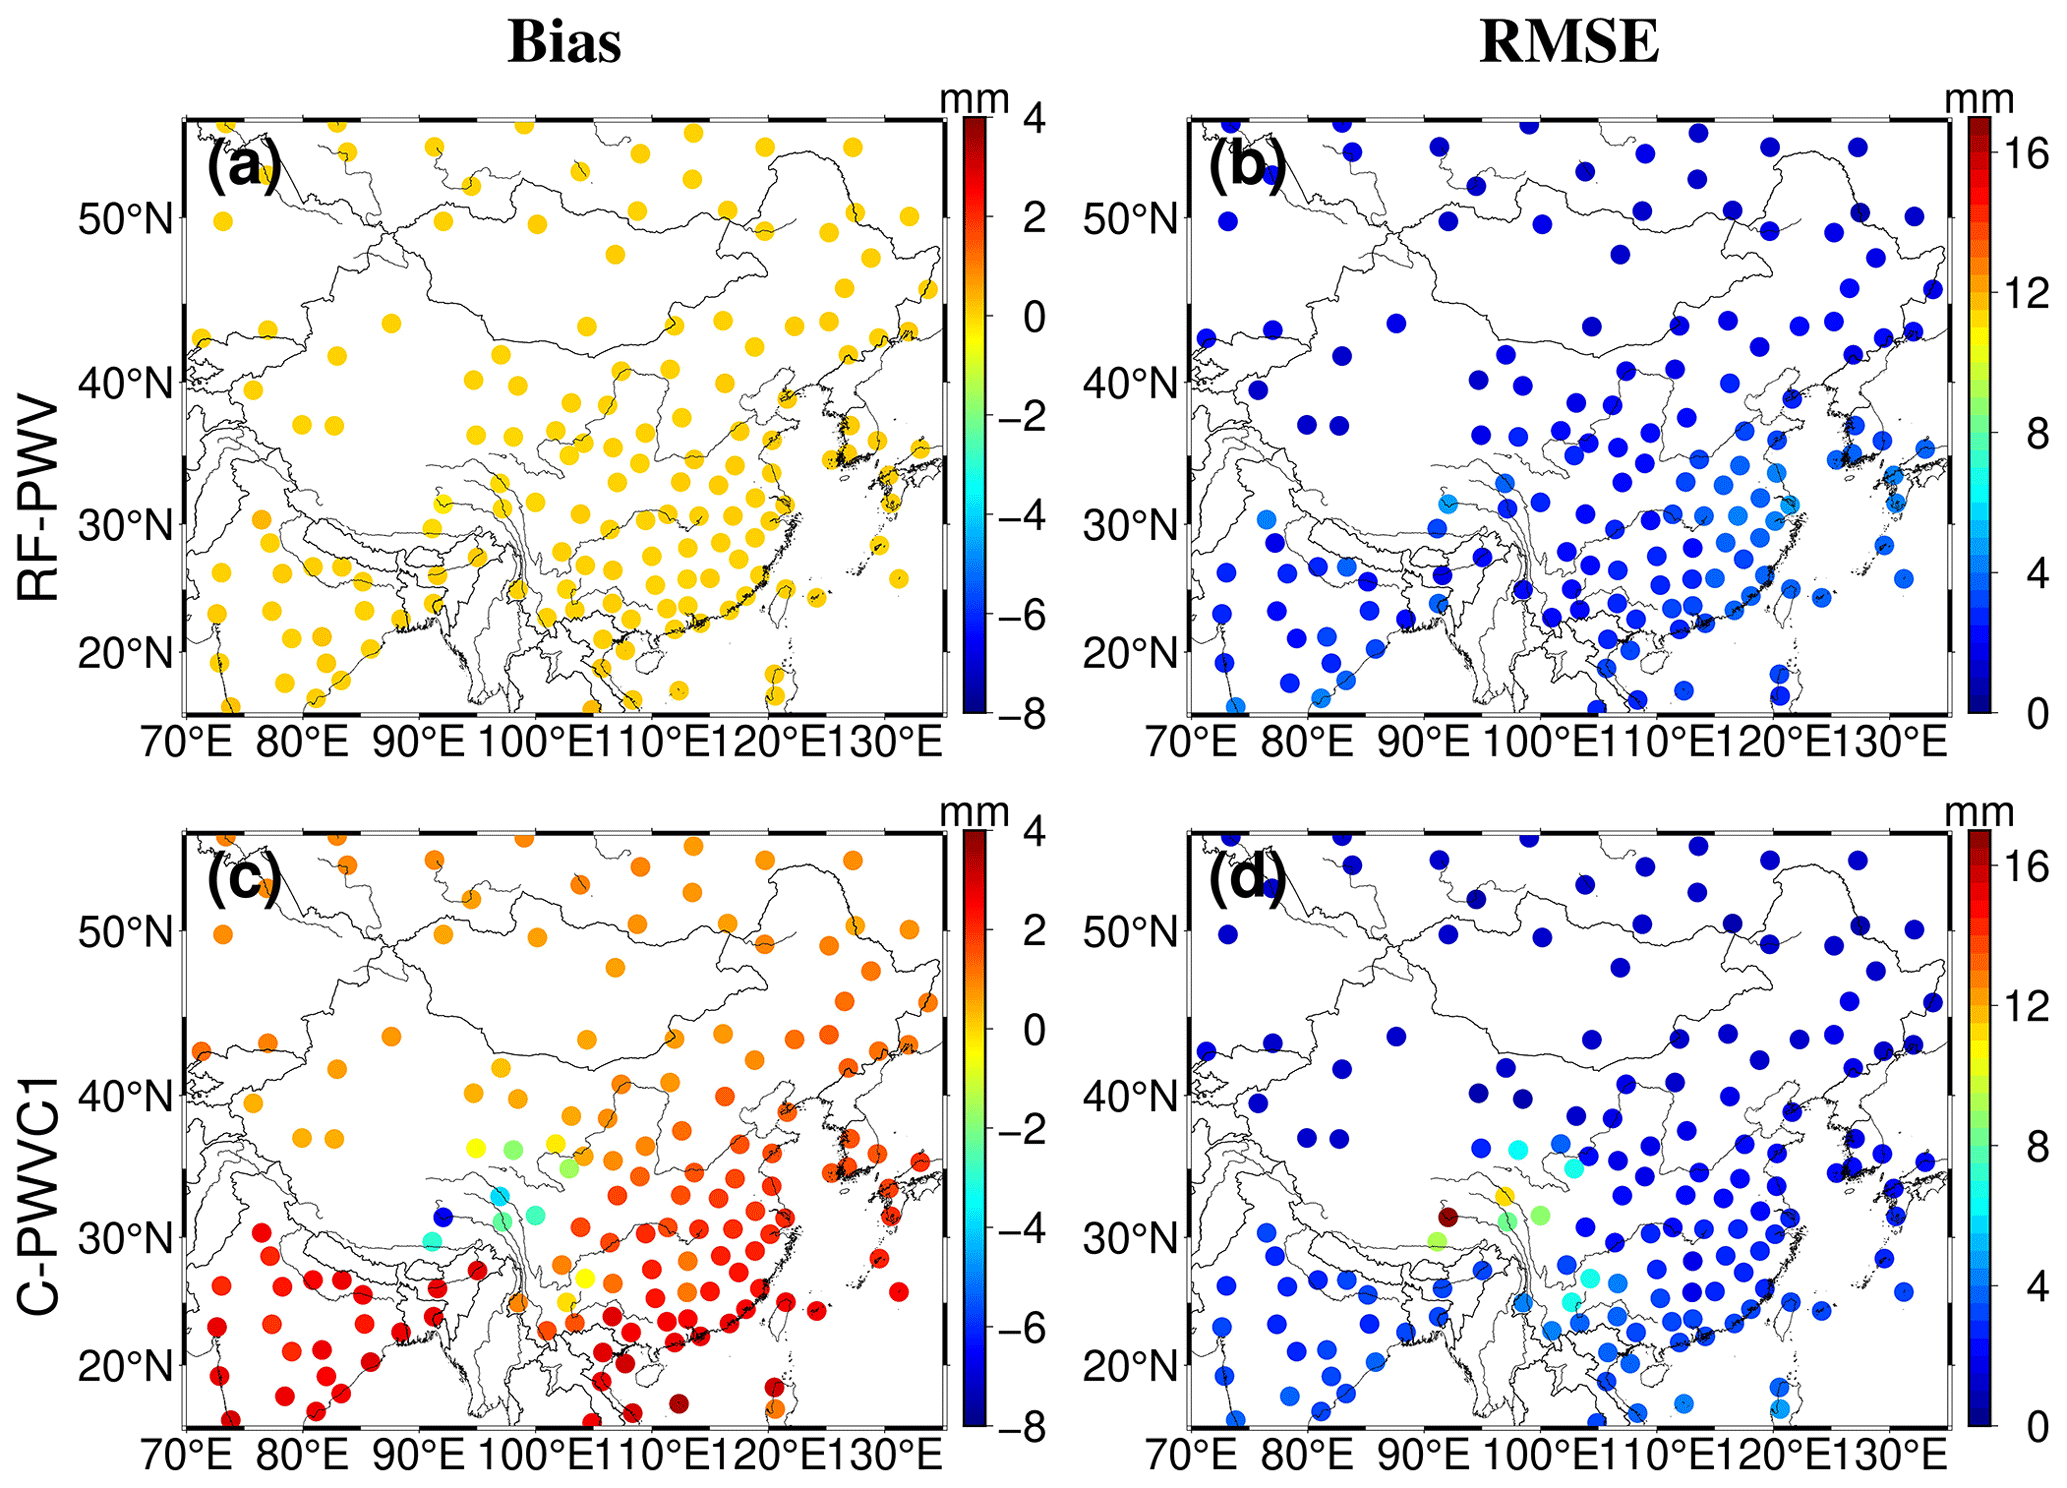
Figure 7Distributions of the bias and RMSE for RF-PWV and C-PWVC1 with respect to the RS data.
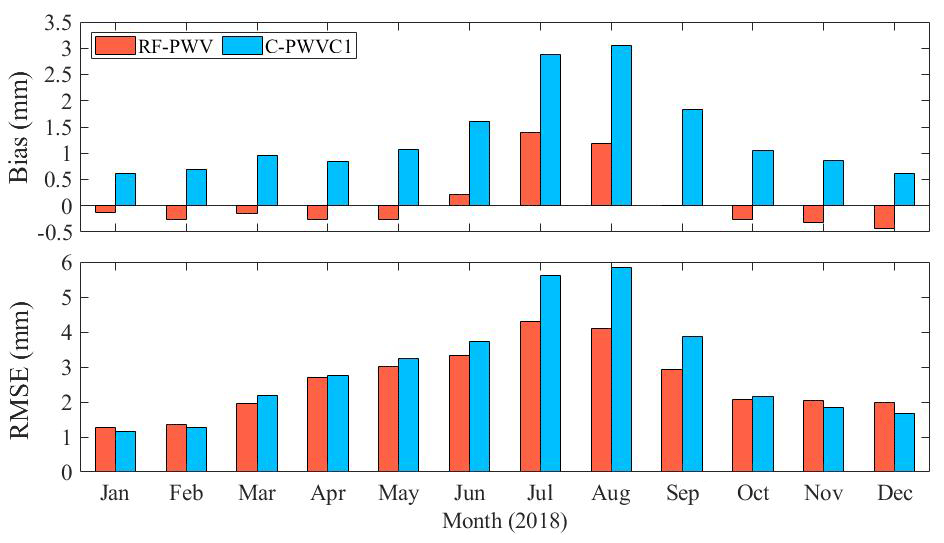
The bias and RMSE values of RF-PWV and C-PWVC1 were also statistically analyzed for each month to assess the models' performance under different seasonal conditions. These results are presented in Fig. 8. The RF-PWV bias demonstrates improvement in every month compared with C-PWVC1. Both models exhibit seasonal variation characteristics, with lower accuracy during summer and higher precision in winter. This seasonal variation is attributed to the warm and humid weather with abundant rainfall in summer, leading to significant PWV fluctuations. Nevertheless, RF-PWV still shows notable bias optimization compared with C-PWVC1. Winters are typically drier and experience less rainfall, resulting in relatively smoother PWV changes. Consequently, both models can accurately capture PWV variations during this period, with RF-PWV having a distinct bias advantage. Furthermore, the RMSE of RF-PWV and C-PWVC1 exhibits similar variations to bias. While the RF-PWV RMSE is slightly larger than that of C-PWVC1 in late autumn and winter, it is smaller than C-PWVC1 in other months, particularly during summer and early autumn. RF-PWV's advantage becomes more pronounced when dealing with spatiotemporal PWV variations that are more drastic. It is important to note that differences between validation results based on radiosonde and ERA5 data may be attributed to certain systematic deviations between radiosonde and ERA5 data. In summary, RF-PWV demonstrates superior performance in vertical PWV correction under various seasonal conditions.
To further evaluate the models' application in the vertical direction, the bias and RMSE of RF-PWV and C-PWVC1 in different height difference segments were examined, and the results are depicted in Fig. 9. In Fig. 9a and c, for C-PWVC1, when the height difference is less than 0 km, the bias and RMSE are −1.81 and 2.89 mm, respectively. As the height difference increases, both the bias and RMSE increase as well. When the height difference exceeds 2.5 km, the bias stabilizes at 2–2.5 mm, while the RMSE remains around 3.5 mm. RF-PWV demonstrates higher accuracy and stability across all height difference segments, with the bias approaching 0 mm and the RMSE being smaller than that of C-PWVC1. Figure 9b and d depict the improvement rates of the absolute values of bias and RMSE for RF-PWV compared with C-PWVC1 (positive values indicate improvement). The absolute value of the bias exhibits an improvement rate of over 80 %, with the maximum value approaching 100 %. Meanwhile, the improvement rate of the RMSE is significantly larger when the height difference is less than 3.5 km; it decreases slightly when the height difference exceeds 3.5 km but still remains around 5 %. In summary, RF-PWV offers higher vertical correction accuracy and improved stability across various height differences, demonstrating its strong applicability at different elevations.
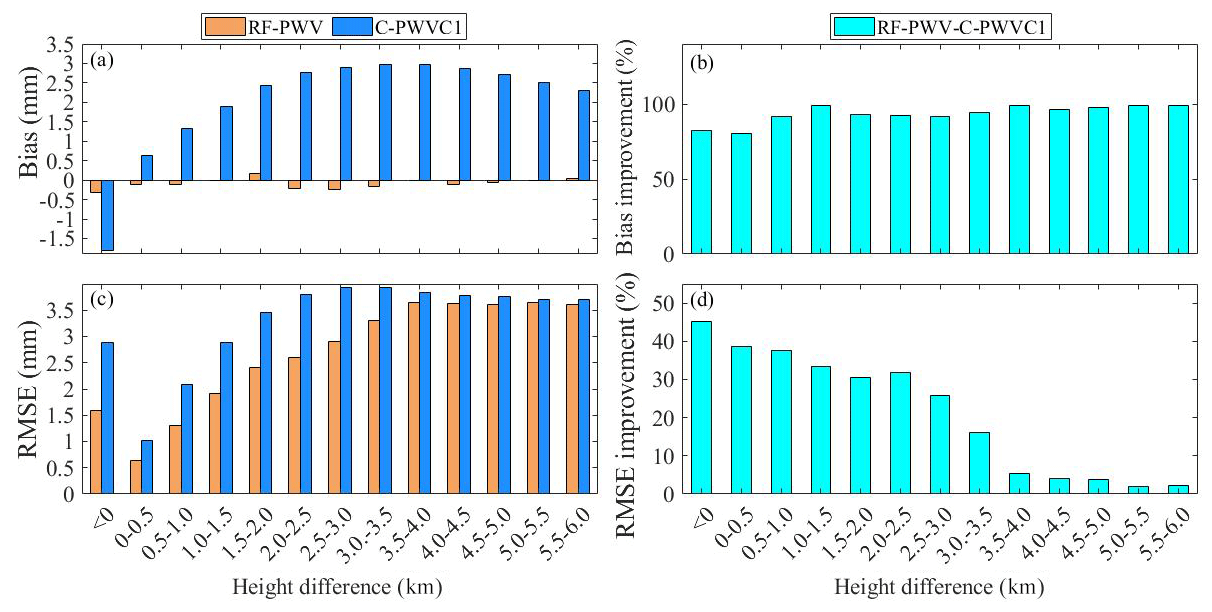
Figure 9Variation in the bias and RMSE with height differences (a, c) and improvement rates of the absolute values of bias and RMSE (b, d). It is noted that, in order to obtain PWV values that are uniformly distributed in the height direction, we obtained PWV values with heights in the range of 0–12 km; when the surface heights of some RS stations are greater than 0 km, their height differences relative to a height of 0 km are less than 0 km.
Modeling accurate PWV vertical corrections benefits PWV fusion and provides detailed PWV vertical distribution information for meteorological studies. The complex terrain in China, characterized by varying climates and frequent water vapor exchanges, makes it challenging to accurately capture PWV variations at different heights. Consequently, this paper aims to develop a high-precision vertical PWV correction grid model. The primary contributions of this research can be summarized as follows:
-
We establish a PWV vertically corrected grid model (RF-PWV) with a resolution of 1° × 1° by integrating RF and monthly averaged hourly PWV data. This model utilizes RF to estimate the vertical variation in PWV at each grid point and demonstrates excellent applicability within a 6 km height difference. It effectively approximates PWV vertical changes. Validation against ERA5 data reveals that RF-PWV reduces the bias and RMSE by 99.84 % and 63.40 %, respectively, compared with C-PWVC1. RS validation also shows a reduction of 96.36 % for the bias and of 5 % for the RMSE compared with C-PWVC1. Furthermore, RF-PWV exhibits robust resistance to seasonal and height difference interference.
-
RF is employed to model each grid point (1° × 1°), with the grid serving to decompose spatial variations and confine RF within the corresponding grid point. This simplifies the features of training samples for each grid point RF, potentially reducing the likelihood of RF getting stuck in a local optimum. Simultaneously, during training, issues with a particular grid will not impact the models of other grid points, thereby enhancing modeling efficiency. This approach also eliminates concerns about spatial generalization ability and ensures relatively stable accuracy across all grid points, contributing to the model's robustness.
Comprehensive validation demonstrates that RF-PWV can more accurately provide PWV vertical corrections in China and its surrounding areas. This model holds great potential for PWV vertical correction and is well suited for delivering detailed PWV vertical distribution information for multisource water vapor fusion and meteorological research. Consequently, this method can be used to develop a globally applicable vertical correction model with higher accuracy, benefiting a wider range of users.
Radiosonde data are available from https://www.ncei.noaa.gov/pub/data/igra/ (University of Wyoming, 2024). ERA5 monthly averaged data are available from https://cds.climate.copernicus.eu/ (European Centre for Medium-Range Weather Forecasts, 2024). All of the data generated during the current study and the code are available on Zenodo (https://doi.org/10.5281/zenodo.10124326, Li et al., 2023b).
JL, YW, LL, YY, LH, and FL: conceptualization; JL, YW, and YY: methodology; JL and YW: formal analysis and writing – original draft, review, and editing; JL, YW, and LL: validation; JL, YW, and YY: data curation; JL, LL, and LH: funding acquisition; LL: investigation; YY: resources; YW and FL: software. All authors were involved in discussions and revising the manuscript.
The contact author has declared that none of the authors has any competing interests.
Publisher's note: Copernicus Publications remains neutral with regard to jurisdictional claims made in the text, published maps, institutional affiliations, or any other geographical representation in this paper. While Copernicus Publications makes every effort to include appropriate place names, the final responsibility lies with the authors.
The authors express gratitude to the reviewers and Geoscientific Model Development editors for their valuable comments on the paper.
This work was supported by the National Natural Science Foundation of China (grant no. 42304018), the Guangxi Natural Science Foundation of China (grant nos. GuikeAD23026177 and 2020GXNSFBA297145), the Foundation of Guilin University of Technology (grant no. GUTQDJJ6616032), Guangxi Key Laboratory of Spatial Information and Geomatics (grant no. 21-238-21-05), the National Natural Science Foundation of China (grant nos. 42330105, 42064002, and 42074035), and the Innovation Project of Guangxi Graduate Education (grant no. YCSW2023341).
This paper was edited by Rohitash Chandra and reviewed by two anonymous referees.
Adeyemi, B. and Joerg, S.: Analysis of Water Vapor over Nigeria Using Radiosonde and Satellite Data, J. Appl. Meteorol. Climatol., 51, 1855–1866, https://doi.org/10.1175/jamc-d-11-0119.1, 2012.
Albergel, C., Dutra, E., Munier, S., Calvet, J.-C., Munoz-Sabater, J., de Rosnay, P., and Balsamo, G.: ERA-5 and ERA-Interim driven ISBA land surface model simulations: which one performs better?, Hydrol. Earth Syst. Sci., 22, 3515–3532, https://doi.org/10.5194/hess-22-3515-2018, 2018.
Alshawaf, F., Fersch, B., Hinz, S., Kunstmann, H., Mayer, M., and Meyer, F. J.: Water vapor mapping by fusing InSAR and GNSS remote sensing data and atmospheric simulations, Hydrol. Earth Syst. Sci., 19, 4747–4764, https://doi.org/10.5194/hess-19-4747-2015, 2015.
Bevis, M., Businger, S., Herring, T. A., Rocken, C., Anthes, R. A., and Ware, R. H.: GPS Meteorology – Remote-Sensing of Atmospheric Water-Vapor Using the Global Positioning System, J. Geophys. Res.-Atmos., 97, 15787–15801, https://doi.org/10.1029/92jd01517, 1992.
Breiman, L.: Random forests, Mach. Learn., 45, 5–32, https://doi.org/10.1023/a:1010933404324, 2001.
Chen, B. Y., Jin, L. J., Wang, J. Y., Jin, W. P., and Wang, W.: Wide-Area Retrieval of Water Vapor Field Using an Improved Node Parameterization Tomography, IEEE Geosci. Remote Sens. Lett., 20, 1–5, https://doi.org/10.1109/lgrs.2023.3293824, 2023a.
Chen, B. Y., Tan, J. S., Wang, W., Dai, W. J., Ao, M. S., and Chen, C. H.: Tomographic Reconstruction of Water Vapor Density Fields From the Integration of GNSS Observations and Fengyun-4A Products, IEEE T. Geosci. Remote, 61, 1–12, https://doi.org/10.1109/tgrs.2023.3239392, 2023b.
Chen, Q. M., Song, S. L., Heise, S., Liou, Y. A., Zhu, W. Y., and Zhao, J. Y.: Assessment of ZTD derived from ECMWF/NCEP data with GPS ZTD over China, GPS Solut., 15, 415–425, https://doi.org/10.1007/s10291-010-0200-x, 2011.
Dessler, A. E. and Sherwood, S. C.: Atmospheric Science a Matter of Humidity, Science, 323, 1020–1021, https://doi.org/10.1126/science.1171264, 2009.
Ding, M. H.: A second generation of the neural network model for predicting weighted mean temperature, GPS Solut., 24, 61, https://doi.org/10.1007/s10291-020-0975-3, 2020.
Dogan, A. H. and Erdogan, B.: A new empirical troposphere model using ERA5's monthly averaged hourly dataset, J. Atmos. Sol.-Terr. Phys., 232, 105865, https://doi.org/10.1016/j.jastp.2022.105865, 2022.
Dousa, J. and Elias, M.: An improved model for calculating tropospheric wet delay, Geophys. Res. Lett., 41, 4389–4397, https://doi.org/10.1002/2014gl060271, 2014.
Du, Z., Yao, Y. B., and Zhao, Q. Z.: Novel Validation and Calibration Strategy for Total Precipitable Water Products of Fengyun-2 Geostationary Satellites, IEEE T. Geosci. Remote, 61, 12, https://doi.org/10.1109/tgrs.2023.3295091, 2023.
Emardson, T. R. and Johansson, J. M.: Spatial interpolation of the atmospheric water vapor content between sites in a ground-based GPS network, Geophys. Res. Lett., 25, 3347–3350, https://doi.org/10.1029/98gl02504, 1998.
European Centre for Medium-Range Weather Forecasts: Monthly averaged data on pressure levels, European Centre for Medium-Range Weather Forecasts [data set], https://cds.climate.copernicus.eu/, last access: 29 March 2024.
Hersbach, H., Bell, B., Berrisford, P., Hirahara, S., Horanyi, A., Munoz-Sabater, J., Nicolas, J., Peubey, C., Radu, R., Schepers, D., Simmons, A., Soci, C., Abdalla, S., Abellan, X., Balsamo, G., Bechtold, P., Biavati, G., Bidlot, J., Bonavita, M., De Chiara, G., Dahlgren, P., Dee, D., Diamantakis, M., Dragani, R., Flemming, J., Forbes, R., Fuentes, M., Geer, A., Haimberger, L., Healy, S., Hogan, R. J., Holm, E., Janiskova, M., Keeley, S., Laloyaux, P., Lopez, P., Lupu, C., Radnoti, G., de Rosnay, P., Rozum, I., Vamborg, F., Villaume, S., and Thepaut, J.-N.: The ERA5 global reanalysis, Q. J. R. Meteorol. Soc., 146, 1999–2049, https://doi.org/10.1002/qj.3803, 2020.
Huang, L., Mo, Z., Liu, L., and Xie, S.: An empirical model for the vertical correction of precipitable water vapor considering the time-varying lapse rate for Mainland China, Acta Geodaetica et Cartographica Sinica, 50, 1320–1330, https://doi.org/10.11947/j.AGCS.2021.20200530, 2021.
Huang, L., Wang, X., Xiong, S., Li, J., Liu, L., Mo, Z., Fu, B., and He, H.: High-precision GNSS PWV retrieval using dense GNSS sites and in-situ meteorological observations for the evaluation of MERRA-2 and ERA5 reanalysis products over China, Atmos. Res., 276, 106247, https://doi.org/10.1016/j.atmosres.2022.106247, 2022.
Huang, L., Liu, W., Mo, Z., Zhang, H., Li, J., Chen, F., Liu, L., and Jiang, W.: A new model for vertical adjustment of precipitable water vapor with consideration of the time-varying lapse rate, GPS Solut., 27, 170, https://doi.org/10.1007/s10291-023-01506-5, 2023.
Jacob, D.: The role of water vapour in the atmosphere. A short overview from a climate modeller's point of view, Phys. Chem. Earth Pt. A, 26, 523–527, https://doi.org/10.1016/s1464-1895(01)00094-1, 2001.
Keil, C., Röpnack, A., Craig, G. C., and Schumann, U.: Sensitivity of quantitative precipitation forecast to height dependent changes in humidity, Geophys. Res. Lett., 35, L09812, https://doi.org/10.1029/2008gl033657, 2008.
Kouba, J.: Implementation and testing of the gridded Vienna Mapping Function 1 (VMF1), J. Geodesy, 82, 193–205, https://doi.org/10.1007/s00190-007-0170-0, 2008.
Lam, R. R., Sanchez-Gonzalez, A., Willson, M., Wirnsberger, P., Fortunato, M., Pritzel, A., Ravuri, S. V., Ewalds, T., Alet, F., Eaton-Rosen, Z., Hu, W., Merose, A., Hoyer, S., Holland, G., Stott, J., Vinyals, O., Mohamed, S., and Battaglia, P. W.: GraphCast: Learning skillful medium-range global weather forecasting, arXiv [preprint], https://doi.org/10.48550/arXiv.2212.12794, 2022.
Leckner, B.: The spectral distribution of solar radiation at the earth's surface – elements of a model, Sol. Energy, 20, 143–150, https://doi.org/10.1016/0038-092X78)90187-1, 1978.
Li, H. B., Wang, X. M., Choy, S., Wu, S. Q., Jiang, C. H., Zhang, J. L., Qiu, C., Li, L., and Zhang, K. F.: A New Cumulative Anomaly-Based Model for the Detection of Heavy Precipitation Using GNSS-Derived Tropospheric Products, IEEE T. Geosci. Remote, 60, 1–18, https://doi.org/10.1109/tgrs.2021.3137014, 2022a.
Li, H. B., Wang, X. M., Choy, S., Jiang, C. H., Wu, S. Q., Zhang, J. L., Qiu, C., Zhou, K., Li, L., Fu, E. R., and Zhang, K. F.: Detecting heavy rainfall using anomaly-based percentile thresholds of predictors derived from GNSS-PWV, Atmos. Res., 265, 105912, https://doi.org/10.1016/j.atmosres.2021.105912, 2022b.
Li, J., Zhang, Q., Liu, L., Yao, Y., Huang, L., Chen, F., Zhou, L., and Zhang, B.: A refined zenith tropospheric delay model for Mainland China based on the global pressure and temperature 3 (GPT3) model and random forest, GPS Solut., 27, 172, https://doi.org/10.1007/s10291-023-01513-6, 2023a.
Li, J., Wang, Y., Liu, L., Yao, Y., Huang, L., and Li, F.: A Grid Model for Vertical Correction of Precipitable Water Vapor over the Chinese Mainland and Surrounding Areas Using Random Forest, Zenodo [data set], https://doi.org/10.5281/zenodo.10124326, 2023b.
Lu, C. X., Zhang, Y. S., Zheng, Y. X., Wu, Z. L., and Wang, Q. Y.: Precipitable water vapor fusion of MODIS and ERA5 based on convolutional neural network, GPS Solut., 27, 15, https://doi.org/10.1007/s10291-022-01357-6, 2023.
Probst, P. and Boulesteix, A.-L.: To tune or not to tune the number of trees in random forest, J. Mach. Learn. Res., 18, 6673–6690, https://doi.org/10.48550/arXiv.1705.05654, 2017.
Raval, A. and Ramanathan, V.: Observational determination of the greenhouse effect, Nature, 342, 758–761, https://doi.org/10.1038/342758a0, 1989.
Ravuri, S., Lenc, K., Willson, M., Kangin, D., Lam, R., Mirowski, P., Fitzsimons, M., Athanassiadou, M., Kashem, S., Madge, S., Prudden, R., Mandhane, A., Clark, A., Brock, A., Simonyan, K., Hadsell, R., Robinson, N., Clancy, E., Arribas, A., and Mohamed, S.: Skilful precipitation nowcasting using deep generative models of radar, Nature, 597, 672–677, https://doi.org/10.1038/s41586-021-03854-z, 2021.
Reitan, C. H.: Surface Dew Point and Water Vapor Aloft, J. Appl. Meteorol., 2, 776–779, https://doi.org/10.1175/1520-0450(1963)002<0776:SDPAWV>2.0.CO;2, 1963.
Renju, R., Raju, C. S., Mathew, N., Antony, T., and Moorthy, K. K.: Microwave radiometer observations of interannual water vapor variability and vertical structure over a tropical station, J. Geophys. Res.-Atmos., 120, 4585–4599, https://doi.org/10.1002/2014jd022838, 2015.
Rocken, C., Anthes, R., Exner, M., Hunt, D., Sokolovskiy, S., Ware, R., Gorbunov, M., Schreiner, W., Feng, D., Herman, B., Kuo, Y. H., and Zou, X.: Analysis and validation of GPS/MET data in the neutral atmosphere, J. Geophys. Res.-Atmos., 102, 29849–29866, https://doi.org/10.1029/97jd02400, 1997.
Rodriguez, J. D., Perez, A., and Lozano, J. A.: Sensitivity Analysis of k-Fold Cross Validation in Prediction Error Estimation, IEEE Trans. Pattern Anal. Mach. Intell., 32, 569–575, https://doi.org/10.1109/tpami.2009.187, 2010.
Rose, B. E. J. and Rencurrel, M. C.: The Vertical Structure of Tropospheric Water Vapor: Comparing Radiative and Ocean-Driven Climate Changes, J. Climate, 29, 4251–4268, https://doi.org/10.1175/jcli-d-15-0482.1, 2016.
Ross, R. J. and Elliott, W. P.: Tropospheric water vapor climatology and trends over North America: 1973–93, J. Climate, 9, 3561–3574, https://doi.org/10.1175/1520-0442(1996)009<3561:Twvcat>2.0.Co;2, 1996.
Sagi, O. and Rokach, L.: Ensemble learning: A survey, Wiley Interdiscip. Rev.-Data Mining Knowl. Discov., 8, e1249, https://doi.org/10.1002/widm.1249, 2018.
Santos, M. S., Soares, J. P., Abreu, P. H., Araujo, H., and Santos, J.: Cross-Validation for Imbalanced Datasets: Avoiding Overoptimistic and Overfitting Approaches, IEEE Comput. Intell. Mag., 13, 59–76, https://doi.org/10.1109/mci.2018.2866730, 2018.
Senkal, O.: Solar radiation and precipitable water modeling for Turkey using artificial neural networks, Meteorol. Atmos. Phys., 127, 481–488, https://doi.org/10.1007/s00703-015-0372-6, 2015.
Sun, Z. Y., Zhang, B., and Yao, Y. B.: An ERA5-Based Model for Estimating Tropospheric Delay and Weighted Mean Temperature Over China With Improved Spatiotemporal Resolutions, Earth and Space Science, 6, 1926–1941, https://doi.org/10.1029/2019ea000701, 2019.
Sun, Z. Y., Zhang, B., and Yao, Y. B.: Improving the Estimation of Weighted Mean Temperature in China Using Machine Learning Methods, Remote Sens., 13, 1016, https://doi.org/10.3390/rs13051016, 2021.
Tomasi, C.: Precipitable water vapor in atmospheres characterized by temperature inversions, J. Appl. Meteorol., 16, 237–243, https://doi.org/10.1175/1520-0450(1977)016<0237:PWW1AC>2.0.C0;2, 1977.
Tyralis, H., Papacharalampous, G., and Langousis, A.: A Brief Review of Random Forests for Water Scientists and Practitioners and Their Recent History in Water Resources, Water, 11, 910, https://doi.org/10.3390/w11050910, 2019.
University of Wyoming: Radiosonde profiles, University of Wyoming [data set], https://www.ncei.noaa.gov/pub/data/igra/, last access: 29 March 2024.
Wang, L. A., Zhou, X. D., Zhu, X. K., Dong, Z. D., and Guo, W. S.: Estimation of biomass in wheat using random forest regression algorithm and remote sensing data, Crop J., 4, 212–219, https://doi.org/10.1016/j.cj.2016.01.008, 2016.
Wang, X. M., Zhang, K. F., Wu, S. Q., Fan, S. J., and Cheng, Y. Y.: Water vapor-weighted mean temperature and its impact on the determination of precipitable water vapor and its linear trend, J. Geophys. Res.-Atmos., 121, 833–852, https://doi.org/10.1002/2015jd024181, 2016.
Wang, X. Z., Chen, F. Y., Ke, F. Y., and Xu, C.: An Empirical Grid Model for Precipitable Water Vapor, Remote Sens., 14, 6174, https://doi.org/10.3390/rs14236174, 2022.
Wang, Y. Z., Liu, H. L., Zhang, Y., Duan, M. Z., Tang, S. H., and Deng, X. B.: Validation of FY-4A AGRI layer precipitable water products using radiosonde data, Atmos. Res., 253, 105502, https://doi.org/10.1016/j.atmosres.2021.105502, 2021.
Yang, F., Guo, J., Meng, X., Shi, J., Zhang, D., and Zhao, Y.: An improved weighted mean temperature (Tm) model based on GPT2w with Tm lapse rate, GPS Solut., 24, 46, https://doi.org/10.1007/s10291-020-0953-9, 2020.
Yang, F., Sun, Y. L., Meng, X. L., Guo, J. M., and Gong, X.: Assessment of tomographic window and sampling rate effects on GNSS water vapor tomography, Satell. Navig., 4, 7, https://doi.org/10.1186/s43020-023-00096-4, 2023.
Zhai, P. M. and Eskridge, R. E.: Atmospheric water vapor over China, J. Climat, 10, 2643–2652, https://doi.org/10.1175/1520-0442(1997)010<2643:Awvoc>2.0.Co;2, 1997.
Zhang, B. and Yao, Y. B.: Precipitable water vapor fusion based on a generalized regression neural network, J. Geodesy, 95, 36, https://doi.org/10.1007/s00190-021-01482-z, 2021.
Zhang, B., Yao, Y. B., Xin, L. Y., and Xu, X. Y.: Precipitable water vapor fusion: an approach based on spherical cap harmonic analysis and Helmert variance component estimation, J. Geodesy, 93, 2605–2620, https://doi.org/10.1007/s00190-019-01322-1, 2019.
Zhang, H. X., Yuan, Y. B., Li, W., and Zhang, B. C.: A Real-Time Precipitable Water Vapor Monitoring System Using the National GNSS Network of China: Method and Preliminary Results, IEEE J. Sel. Top. Appl. Earth Observ. Remote Sens., 12, 1587–1598, https://doi.org/10.1109/jstars.2019.2906950, 2019.
Zhang, K., Wan, M., Wu, S., Zhen, S., Dantong, Z., Sun, P., and Jiang, L.: New Model for Vertical Distribution and Variation of Atmospheric Water Vapor – A Case Study for China, Research Square [preprint], https://doi.org/10.21203/rs.3.rs-1497870/v1, 2022.
Zhang, Q., Ye, J. H., Zhang, S. C., and Han, F.: Precipitable Water Vapor Retrieval and Analysis by Multiple Data Sources: Ground-Based GNSS, Radio Occultation, Radiosonde, Microwave Satellite, and NWP Reanalysis Data, J. Sens., 2018, 3428303, https://doi.org/10.1155/2018/3428303, 2018.
Zhang, W. X., Lou, Y. D., Cao, Y. C., Liang, H., Shi, C., Huang, J. F., Liu, W. X., Zhang, Y., and Fan, B. B.: Corrections of Radiosonde-Based Precipitable Water Using Ground-Based GPS and Applications on Historical Radiosonde Data Over China, J. Geophys. Res.-Atmos., 124, 3208–3222, https://doi.org/10.1029/2018jd029662, 2019.
Zhang, Y. L., Cai, C. S., Chen, B. Y., and Dai, W. J.: Consistency Evaluation of Precipitable Water Vapor Derived From ERA5, ERA-Interim, GNSS, and Radiosondes Over China, Radio Sci., 54, 561–571, https://doi.org/10.1029/2018rs006789, 2019.
Zhao, Y. Y., Zhao, H. W., Li, J. Q., and Xiao, G. W.: Comprehensive Validation and Calibration of MODIS PWV over Mainland China, Atmosphere, 13, 1763, https://doi.org/10.3390/atmos13111763, 2022.
Zheng, Y. X., Lu, C. X., Wu, Z. L., Liao, J. C., Zhang, Y. S., and Wang, Q. Y.: Machine Learning-Based Model for Real-Time GNSS Precipitable Water Vapor Sensing, Geophys. Res. Lett., 49, e2021GL096408, https://doi.org/10.1029/2021gl096408, 2022.
Zhu, M. C., Yu, X. W., and Sun, W.: A coalescent grid model of weighted mean temperature for China region based on feedforward neural network algorithm, GPS Solut., 26, 70, https://doi.org/10.1007/s10291-022-01254-y, 2022.