the Creative Commons Attribution 4.0 License.
the Creative Commons Attribution 4.0 License.
 | 12 Feb 2024
Implementation of the ISORROPIA-lite aerosol thermodynamics model into the EMAC chemistry climate model (based on MESSy v2.55): implications for aerosol composition and acidity
Alexandros Milousis
Alexandra P. Tsimpidi
Holger Tost
Spyros N. Pandis
Athanasios Nenes
Astrid Kiendler-Scharr
Vlassis A. Karydis
This study explores the differences in performance and results by various versions of the ISORROPIA thermodynamic module implemented within the ECHAM/MESSy Atmospheric Chemistry (EMAC) model. Three different versions of the module were used, ISORROPIA II v1, ISORROPIA II v2.3, and ISORROPIA-lite. First, ISORROPIA II v2.3 replaced ISORROPIA II v1 in EMAC to improve pH predictions close to neutral conditions. The newly developed ISORROPIA-lite has been added to EMAC alongside ISORROPIA II v2.3. ISORROPIA-lite is more computationally efficient and assumes that atmospheric aerosols exist always as supersaturated aqueous (metastable) solutions, while ISORROPIA II includes the option to allow for the formation of solid salts at low RH conditions (stable state). The predictions of EMAC by employing all three aerosol thermodynamic models were compared to each other and evaluated against surface measurements from three regional observational networks in the polluted Northern Hemisphere (Interagency Monitoring of Protected Visual Environments (IMPROVE), European Monitoring and Evaluation Programme (EMEP), and Acid Deposition Monitoring Network of East Asia (EANET)). The differences between ISORROPIA II v2.3 and ISORROPIA-lite were minimal in all comparisons with the normalized mean absolute difference for the concentrations of all major aerosol components being less than 11 % even when different phase state assumptions were used. The most notable differences were lower aerosol concentrations predicted by ISORROPIA-lite in regions with relative humidity in the range of 20 % to 60 % compared to the predictions of ISORROPIA II v2.3 in stable mode. The comparison against observations yielded satisfactory agreement especially over the USA and Europe but higher deviations over East Asia, where the overprediction of EMAC for nitrate was as high as 4 µg m−3 (∼20 %). The mean annual aerosol pH predicted by ISORROPIA-lite was on average less than a unit lower than ISORROPIA II v2.3 in stable mode, mainly for coarse-mode aerosols over the Middle East. The use of ISORROPIA-lite accelerated EMAC by nearly 5 % compared to the use of ISORROPIA II v2.3 even if the aerosol thermodynamic calculations consume a relatively small fraction of the EMAC computational time. ISORROPIA-lite can therefore be a reliable and computationally efficient alternative to the previous thermodynamic module in EMAC.
- Article
(3903 KB) - Full-text XML
-
Supplement
(1602 KB) - BibTeX
- EndNote


Aerosols in the atmosphere have a significant impact on climate and air pollution. They contribute to the deterioration of air quality, especially in heavily industrialized regions, leading to increased mortality rates and decreased life expectancy (Héroux et al., 2015). Particulate matter with diameter less than 2.5 µm (PM2.5) is the largest contributor to stroke, cancer, heart conditions and chronic obstructive pulmonary diseases (Brook et al., 2010; Pope et al., 2011), with ambient pollution causing approximately 4.2 million premature deaths in 2019 alone (WHO, 2022). Tarin-Carrasco et al. (2021) predicted that mortality rates in Europe due to air pollution could increase in the next 30 years in the more extreme emission scenarios (e.g., RCP8.5). In addition to the direct threat aerosols pose to humans and ecosystems through their effects on air quality, they can also affect other climate-related processes. For example, they can act as cloud condensation nuclei and modify cloud lifetime and optical properties (Andreae et al., 2005; Klingmüller et al., 2020). Aerosols also affect the energy balance of our planet by reflecting additional solar radiation back to space and thus cooling the atmosphere or by absorbing solar radiation and thus warming the atmosphere (Klingmüller et al., 2019; Miinalainen et al., 2021). Some major inorganic aerosol components also affect various ecosystems. For example, nitrates and sulfates can harm flora by lessening its lifetime and variety (Honour et al., 2009; Manisalidis et al., 2020) and can affect wildlife by causing water eutrophication (Doney et al., 2007). A critical property of atmospheric particles that regulates their impacts on clouds and ecosystems is their acidity (Karydis et al., 2021). Depending on its levels, acidity can affect air quality and human health (Lelieveld et al., 2015) but also the aerosols' hygroscopic characteristics (Karydis et al., 2016). The aerosol pH also drives the partitioning of semivolatile inorganic components between the gas and aerosol phases (Nenes et al., 2020). Finally, aerosol acidity plays a role in the activation of halogens in aerosols (Saiz-Lopez and von Glasow, 2012), their toxicity (Fang et al., 2017) and also in secondary organic aerosol formation (Marais et al., 2016).
Sulfate is the most important component of PM2.5 inorganic aerosol, since it contributes the most in terms of global mass burden (Szopa et al., 2021) and aerosol optical depth (AOD) (Myhre et al., 2013). The nitrate contribution to the PM2.5 aerosol composition is also important in several areas (e.g., Europe, North America, East Asia) and seasons (He et al., 2001; Silva et al., 2007; Weagle et al., 2018; Tang et al., 2021). The quantification of nitrate partitioning between the gas and particulate phases is challenging partly because it is affected by meteorology (temperature, relative humidity) and all ionic aerosol components but also due to the lack of observations to constrain the composition of the gas-phase components and the size distribution of the particulate phase. Nitrate in the form of ammonium nitrate is mainly found in the fine mode (e.g., PM2.5) (Putaud et al., 2010). This is especially the case over polluted regions where there is enough ammonia remaining after the neutralization of sulfate (Karydis et al., 2011, 2016). In coastal and desert areas, nitrate is formed mainly by reactions of HNO3 with sea salt and dust particles (Savoie and Prospero, 1982; Wolff, 1984; Karydis et al., 2016) and therefore is found mainly in the coarse particles. The importance of nitrate in the troposphere is expected to increase in the following decades, because SO2 emissions are anticipated to drop, while NH3 emissions are anticipated to increase (Fu et al., 2017; Chen et al., 2019; Xu et al., 2020). With decreased SO2 concentrations, less ammonia is required to neutralize the sulfates and therefore more is available for ammonium nitrate formation (Tsimpidi et al., 2007).
There have been several thermodynamic models developed in the last decades to calculate the inorganic aerosol concentrations and composition in the atmosphere. Two of the first were EQUIL and KEQUIL, developed by Bassett and Seinfeld (1983). Then the MARS model was developed by Saxena et al. (1986) with the aim of reducing the computational time required in order to be incorporated into larger-scale chemical transport models. MARS was the first model to divide the composition domain into smaller sub-domains, aiming to reduce the number of equations needed to be solved. Then the SEQUILIB model by Pilinis and Seinfeld (1987) was the first to incorporate sodium and chloride as well as the corresponding salts in the simulated aerosol system. Further developments included EQUISOLV by Jacobson et al. (1996) as well as SCAPE by Kim et al. (1993), which simulated temperature-dependent deliquescence following Wexler and Seinfeld (1991) and predicted the presence of liquid-phase aerosols even at low relative humidity (RH). E-AIM is another benchmark thermodynamic model which instead of solving algebraic equations for equilibrium uses the minimization of the Gibbs free energy approach (Wexler and Clegg, 2002). Later versions of E-AIM also include selected organic aerosol components (Clegg et al., 2003). Furthermore, AIOMFAC is a model that utilizes organic–inorganic interactions in aqueous solutions in order to calculate activity coefficients up to high ionic strengths (Zuend et al., 2008) and is based on the LIFAC model by Yan et al. (1999). Further developments in AIOMFAC include a wider variety of organic compounds (Zuend et al., 2011). The EQSAM thermodynamic model was developed by Metzger et al. (2002) with the basic concept that aerosol activities in equilibrium are controlled by RH, and solute activity is a function of RH. The model uses a domain structure based on sulfate availability to increase computational efficiency by solving fewer thermodynamic equations, similar to Nenes et al. (1998). EQSAM and ISORROPIA are the two available options for aerosol thermodynamics in the EMAC model.
Nenes et al. (1998) developed the ISORROPIA model in an effort to increase computational efficiency while maintaining the accuracy of the calculations. The system simulated by ISORROPIA included NH, Na+, Cl−, NO, SO and H2O. ISORROPIA also contains the temperature-dependent equations for deliquescence by Wexler and Seinfeld (1991) and is computationally efficient so that it can be incorporated into 3D atmospheric models. In ISORROPIA, the aerosol state is predicted as a weighted mean value of the dry and wet states. The weighting factors depend on ambient RH, the mutual deliquescence relative humidity (MDRH) and the deliquescence relative humidity (DRH) of the most hygroscopic salt in the mixture. An improved version of ISORROPIA including the mineral ions K+, Ca2+ and Mg+, called ISORROPIA II, was developed by Fountoukis and Nenes (2007). The addition of the above crustal ions resulted in the inclusion of 10 more salts and 3 more ions in the solid and aqueous phases, respectively. The model gained in computational efficiency by performing different calculations for different atmospheric chemical composition regimes, which are determined by the abundance of each aerosol precursor as well as the ambient temperature and relative humidity. Depending on the values of the so-called “sulfate ratio”, the “crustal species and sodium ratio” and the “crustal species ratio”, five aerosol composition regimes are determined in order to calculate the necessary equilibrium equations for the species present in each regime. Furthermore, the use of pre-calculated look-up tables for the activity coefficients (see Sect. 2.2), including their temperature dependence, is another factor for the gain in computational efficiency. Like E-AIM, ISORROPIA II can solve the thermodynamic equilibrium problem under stable or metastable conditions. In the second case, aerosols are assumed to exist only as supersaturated aqueous solutions even at low RH, while in the first case the aerosols are able to form solid salts. A very slightly updated version, called ISORROPIA II v2.3, was introduced to improve aerosol pH predictions close to neutral conditions (Song et al., 2018). More specifically, in some subcases of the ISORROPIA II regime, NH3 evaporation was not taken into account in the aerosol pH calculations, leading to unrealistic estimates close to neutrality (pH ∼7). This error had a minimal effect on the predicted gas-phase NH3 levels and consequently on the inorganic aerosol concentrations. Moreover, it only affected a few subcases and only when the stable mode was used. More details on these differences can be found in Song et al. (2018). The newest development of ISORROPIA II, called ISORROPIA-lite, was designed to be even more computationally efficient than its predecessor and to also include the effects that organic aerosol components have on particle water and the semivolatile inorganic aerosol species partitioning (Kakavas et al., 2022).
This study aims to evaluate the newly developed ISORROPIA-lite thermodynamic module within the EMAC global climate and chemistry model and to explore any discrepancies on a global scale, by utilizing different aerosol phase states. For this reason, our analysis explores the differences in the results between ISORROPIA-lite and ISORROPIA II over diverse conditions and environments. In Sect. 2, the model configuration and the treatment of inorganic aerosol thermodynamics is presented. In Sects. 3 and 4, the results and comparisons between the simulations are analyzed, and in Sect. 5 the major conclusions are presented.
2.1 EMAC model setup
The EMAC (ECHAM5/MESSy) model is a global atmospheric chemistry and climate model (Jöckel et al., 2006). It includes a series of submodels and links them via the Modular Earth Submodel System (Jöckel et al., 2005) to the base model (core) that is the fifth-generation European Center Hamburg general circulation model (Roeckner et al., 2006). Gas-phase chemistry is simulated by MECCA (Sander et al., 2019) with a simplified scheme similar to the one used in CCMI (Chemistry-Climate Model Initiative), like in Jöckel et al. (2016). Aerosol microphysics along with gas–aerosol partitioning are treated by GMXe in which the aerosols are differentiated between soluble and insoluble modes with a total of seven lognormal modes (Pringle et al., 2010a, b). The soluble mode contains the nucleation, Aitken, accumulation and coarse size ranges, while the insoluble mode lacks only the nucleation size range. Transfer of material between the insoluble and soluble modes is calculated in two processes. After coagulation, when a hydrophobic and a hydrophilic particle coagulate, the resulting mass is assumed to reside in the hydrophilic mode and also when soluble material condenses onto a hydrophobic particle (after gas–aerosol partitioning) it is again transferred to the hydrophilic mode (Pringle et al., 2010a, b). Wet deposition of gases and aerosols is described by SCAV (Tost et al., 2006, 2007), dry deposition is described via DRYDEP (Kerkweg et al., 2006) and gravitational sedimentation of aerosols is described by SEDI (Kerkweg et al., 2006). Cloud properties and microphysics are calculated by the CLOUD submodel (Roeckner et al., 2006), utilizing the detailed two-moment liquid and ice-cloud microphysical scheme of Lohmann and Ferrachat (2010) and considering a physically based treatment of the processes of liquid (Karydis et al., 2017) and ice crystal (Bacer et al., 2018) activation. The organic aerosol composition and evolution in the atmosphere is calculated by the ORACLE submodel (Tsimpidi et al., 2014, 2018).
The model simulations in this work were nudged towards actual meteorology using ERA5 data (Hersbach et al., 2020). For the purposes of this study, the spectral resolution applied within EMAC was T63L31, which corresponds to a grid resolution of , covering vertical altitudes up to 25 km with a total of 31 layers. The simulations were all done for the period 2009–2010, with 2009 representing the model spin-up period.
Anthropogenic emissions of aerosols and aerosol precursors were based on the EDGARv4.3.2 inventory (Crippa et al., 2018). Open biomass burning emissions were derived by the GFEDv3.1 database (van der Werf et al., 2010), and natural emissions of NH3 (volatilization from soils and oceans) were based on the GEIA database (Bouwman et al., 1997). SO2 emissions by volcanic eruptions are based on the AEROCOM dataset (Dentener et al., 2006), as are emissions of sea spray aerosols using the chemical composition proposed by Seinfeld and Pandis (2016). Biogenic emissions of NO from soils are calculated online according to the algorithm of Yienger and Levy (1995), while NOx produced by lightning is also calculated online based on the parameterization of Grewe et al. (2001). Oceanic emissions of dimethyl sulfide (DMS) are calculated online by the AIRSEA submodel (Pozzer et al., 2006). Finally, the dust emission fluxes are calculated online according to Astitha et al. (2012), by taking into account the meteorological information for each grid cell (i.e., temperature and relative humidity) as well as the different thresholds of friction velocities above which suspension of dust particles takes place. The emissions of crustal ions (Ca2+, Mg+, K+ and Na+) are estimated as a fraction of the total dust flux based on the soil chemical composition of each individual grid cell (Karydis et al., 2016; Klingmüller et al., 2018). These ions are emitted in the insoluble accumulation and coarse size modes and are subsequently transferred to the soluble aerosols by the processes described above.
2.2 Inorganic aerosol thermodynamics treatment
In this study, the ISORROPIA-lite aerosol thermodynamic model has been implemented in EMAC as part of the GMXe submodel, not as a replacement but as an alternative to the previous version, in order to efficiently calculate the equilibrium partitioning of the inorganic species between gas and aerosol phases. Furthermore, ISORROPIA II v2.3 is used to replace ISORROPIA II v1 in the model.
Kinetic limitations in the partitioning need to be taken into consideration, because only fine aerosols are able to achieve equilibrium within the time frame of one model time step, which in this study equals to 10 min. Therefore, the partitioning calculation is done in two stages according to Pringle et al. (2010a, b). First the amount of the gas-phase species that is able to kinetically condense onto the aerosol phase within the model time step is calculated by assuming diffusion-limited condensation (Vignati et al., 2004). Then, in the second stage, the partitioning between this gas-phase material and the aerosol phase is performed. The partitioning calculation is performed for all seven size modes (i.e., in each model time step, ISORROPIA is called separately for each of them).
According to Kakavas et al. (2022), ISORROPIA-lite features two main modifications in its code, with regard to ISORROPIA II v2.3 (Song et al., 2018) and ISORROPIA II v1 (Fountoukis and Nenes, 2007). First, the routines related to the stable case have been removed, since only the metastable case is considered and all salts formed are deliquesced. However, CaSO4 is the only solid salt allowed to form, as it is considered insoluble for most atmospherically relevant RH values and precipitates spontaneously. Furthermore, for the calculation of binary activity coefficients, ISORROPIA-lite uses the tabulated binary activity coefficient data for each salt from Kusik-Meissner (Kusik and Meissner, 1978) instead of calculating them online, and it includes their temperature dependence according to Meissner and Peppas (1973). This is done by combining the Kusik and Meissner (1978) model for specific ionic pairs with the Bromley (1973) activity coefficient mixing rule for multicomponent mixtures. More information on this procedure can be found in Fountoukis and Nenes (2007). This second modification is the major contributor to the computational speed-up provided by ISORROPIA-lite, which in an offline estimation was reported to be around 35 % (Kakavas et al., 2022). Furthermore, this feature could explain differences in inorganic aerosol estimates with the previous version of ISORROPIA using the same aerosol state assumption (metastable case). Another important modification is that the effect of organic aerosol water on the inorganic semivolatile aerosol components is included. This consideration slightly increases the aerosol pH but more significantly drives the phase partitioning towards the aerosol phase in order to satisfy equilibrium conditions (Kakavas et al., 2022). However, this feature of ISORROPIA-lite was not used in the present study, as the water uptake by organics is treated by other parts of the GMXe aerosol microphysics submodel in the EMAC global model. The effects of the secondary organic aerosol on aerosol water and nitrate partitioning are discussed by Kakavas et al. (2023).
In the updated version of the GMXe submodel, users have the option to select between ISORROPIA-lite and ISORROPIA II v2.3 to perform EMAC simulations depending on the application and the desired phase state assumption. While ISORROPIA-lite utilizes the metastable approach exclusively, ISORROPIA II v2.3 utilizes both and has the stable approach as default.
For reasons of clarity, from this point forward both in the main text as well as in any figure captions, whenever different aerosol sizes are mentioned, total suspended particles (denoted TSP) refer to the sum of the four lognormal size modes of the aerosol microphysics submodel (i.e., nucleation, Aitken, accumulation and coarse modes), fine aerosols refer to the sum of the three smaller size modes (i.e., nucleation, Aitken and accumulation modes) and coarse aerosols refer to the largest size mode of the model exclusively.
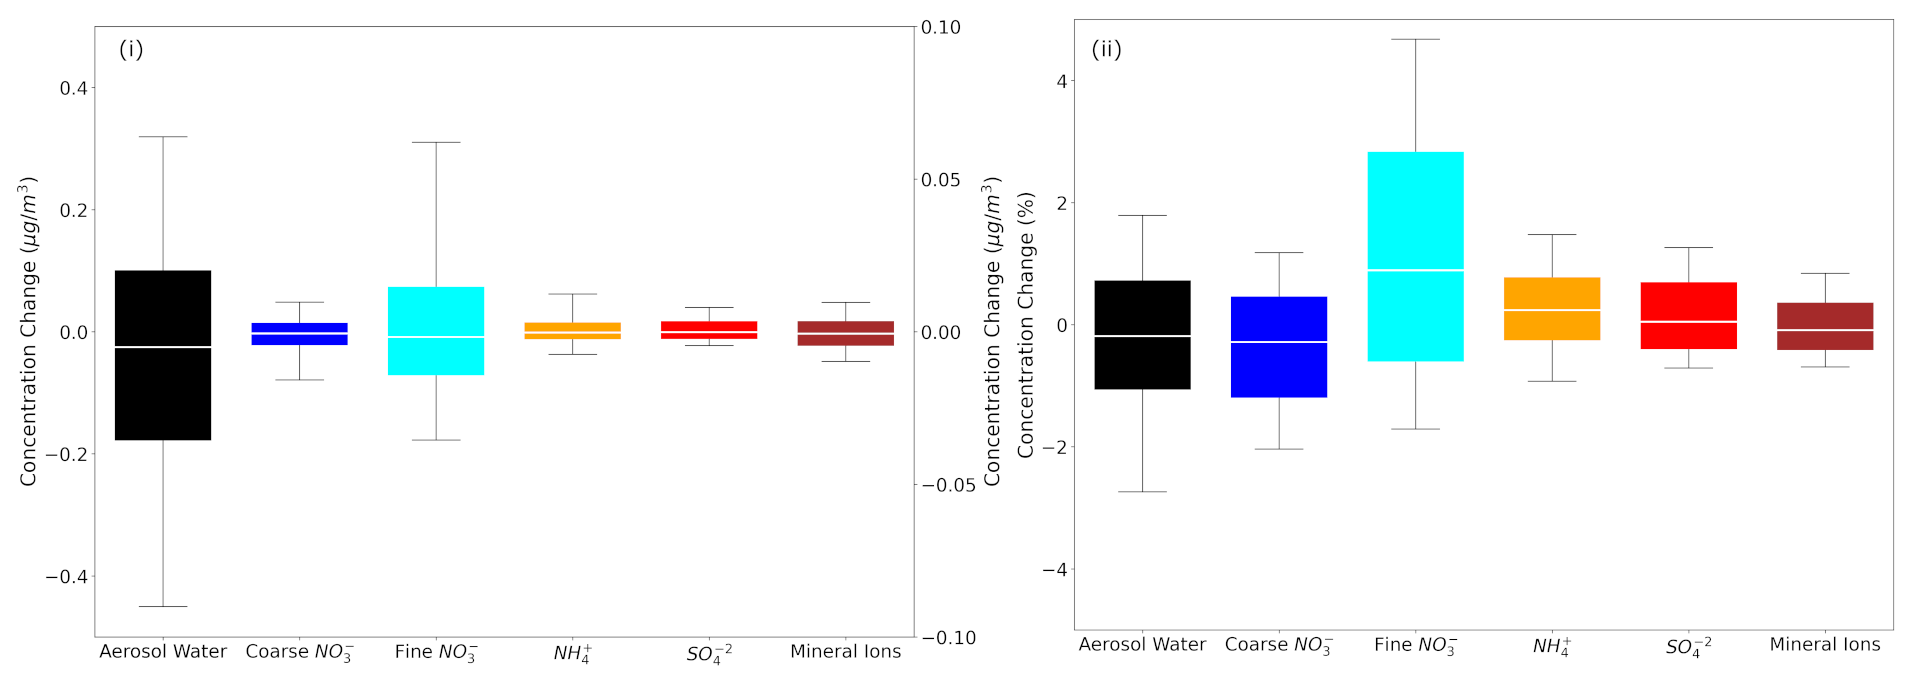
Figure 1Box plots depicting the 25th, 50th and 75th percentiles (box) of the (i) difference and (ii) fractional difference in global daily mean surface concentrations of aerosol water (left y axis), mineral ions, NH and SO in TSP as well as coarse and fine aerosol NO (right y axis), as predicted by EMAC using ISORROPIA II v1 and ISORROPIA II v2.3. The 10th and 90th percentiles (whiskers) for each aerosol component are also shown. Both models assume that the aerosol is at its stable state at low RH and that a positive change corresponds to higher concentrations by ISORROPIA II v1.
Table 1Statistical analysis of EMAC-simulated mean daily surface concentrations by employing ISORROPIA II v1 versus ISORROPIA II v2.3, both in stable mode. Deviations are given as ISORROPIA II v1 minus ISORROPIA II v2.3.
3.1 Comparison of ISORROPIA II v1 against ISORROPIA II v2.3 in stable mode
The first comparison aims to examine how ISORROPIA II v2.3 fares against ISORROPIA II v1 when considering solely the stable assumption, after the latter's replacement in the newer version of the EMAC model.
The differences in global daily mean surface concentrations of NH, SO, mineral ions (sum of Ca2+, K+, Mg2+) and aerosol water in TSP as well as fine and coarse aerosol NO as predicted by the two versions can be seen in Fig. 1. The 25th and 75th percentiles of concentration differences between the two versions for the aerosol water are below 0.2 µg m−3, and for the remaining species they are an order of magnitude less, which translates to differences mostly below 1 % for all species. Therefore, the predictions of inorganic aerosol composition of the two versions agree exceptionally well.
In order to investigate potential differences arising in specific areas, regions affected by high nitrate concentrations were selected, i.e., Europe, the Tibetan Plateau, East Asia, North America and the Middle East. The differences in daily mean coarse and fine NO over these regions are shown in Fig. S1 in the Supplement. The comparison showed that the differences regarding the 25th and 75th percentiles are less than 0.05 µg m−3 (or less than 2.5 %) between the results of the two ISORROPIA II versions for both size modes. A statistical analysis of the results reveals that all differences between the aforementioned species are on average below 3 % (Table 1). Therefore, the replacement of ISORROPIA II v1 by v2.3 in the EMAC model yields only trivial differences in the predicted aerosol ionic composition and water. The following sections focus on the comparison between the results of ISORROPIA-lite against ISORROPIA II v2.3 (called ISORROPIA II hereafter for simplicity), both in stable and metastable states.
3.2 Comparison of ISORROPIA-lite against ISORROPIA II in metastable mode
The model results using ISORROPIA-lite are compared first against those using ISORROPIA II in metastable mode in order to determine whether the ISORROPIA-lite version can produce similar results with the more detailed module in EMAC, under the same conditions. Figure 2 depicts the differences of the global daily mean surface concentrations of the same species that were examined before. The comparison yields differences for the 25th and 75th percentiles that are less than 0.5 µg m−3 for the aerosol water and mostly less than 0.05 µg m−3 for the remaining inorganic aerosol components, which translates into differences of less than 2 % for all species most of the time.
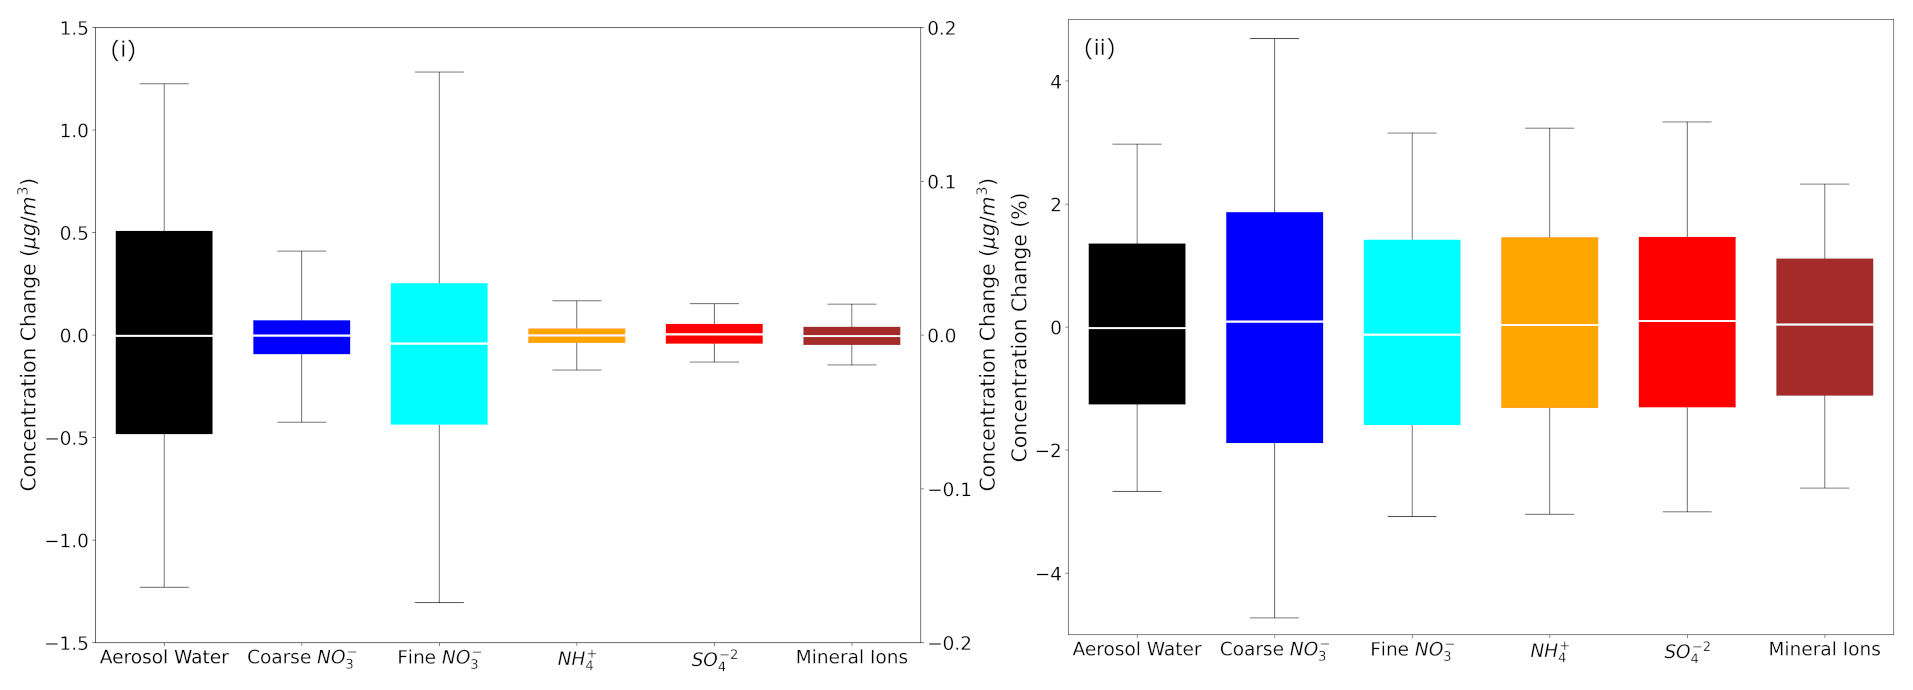
Figure 2Box plots depicting the 25th, 50th and 75th percentiles (box) of the (i) difference and (ii) fractional difference in global daily mean surface concentrations of aerosol water (left y axis), mineral ions, NH and SO in TSP as well as coarse and fine aerosol NO (right y axis), as predicted by EMAC using ISORROPIA-lite and ISORROPIA II. The 10th and 90th percentiles (whiskers) for each aerosol component are also shown. Both models assume that the aerosol is at its metastable state at low RH and that a positive change corresponds to higher concentrations by ISORROPIA-lite.
Table 2Statistical analysis of EMAC-simulated mean daily surface concentrations by employing ISORROPIA-lite versus ISORROPIA II, both in metastable mode. Bias is given as ISORROPIA-lite minus ISORROPIA II.
Figure S2 shows the comparison between predicted global daily mean coarse and fine aerosol nitrate concentrations, focusing on the regions with the higher simulated mean annual concentrations. Across all regions, the concentration differences for both size modes are typically lower than 0.1 µg m−3 (or less than 3 %) and are mostly found over the Himalayan and East Asian regions.
In Table 2, the statistics of the results for the global surface concentrations for all examined aerosol components reveal differences that are on average less than 7 %. Therefore, ISORROPIA-lite does provide quite similar predictions with ISORROPIA II in the EMAC model for simulations using the metastable state assumption.
3.3 Evaluation of inorganic aerosol predictions
EMAC predictions using both ISORROPIA-lite and ISORROPIA II in stable mode for PM2.5 ammonium, sulfate and nitrate were compared against measurements from three observational networks. The networks cover some of the most polluted areas in the Northern Hemisphere. The EPA CASTNET network (U.S. Environmental Protection Agency Clean Air Status and Trends Network, 2024) and the IMPROVE network (Interagency Monitoring of Protected Visual Environments) with 152 stations for nitrate and sulfate and 143 stations for ammonium cover the USA, with IMPROVE concerning mostly rural and/or remote areas. The EMEP network (European Monitoring and Evaluation Programme) includes nine stations for nitrate and sulfate and seven for ammonium covering the European region. Finally, the EANET network (Acid Deposition Monitoring Network in East Asia, 2024) with 33 stations measuring all three major aerosol components covers parts of East Asia. The number of stations refers to the year 2010, which is simulated in this work.
Table 3Statistical evaluation of EMAC-predicted surface concentrations of PM2.5 SO using ISORROPIA-lite against observations during 2010.
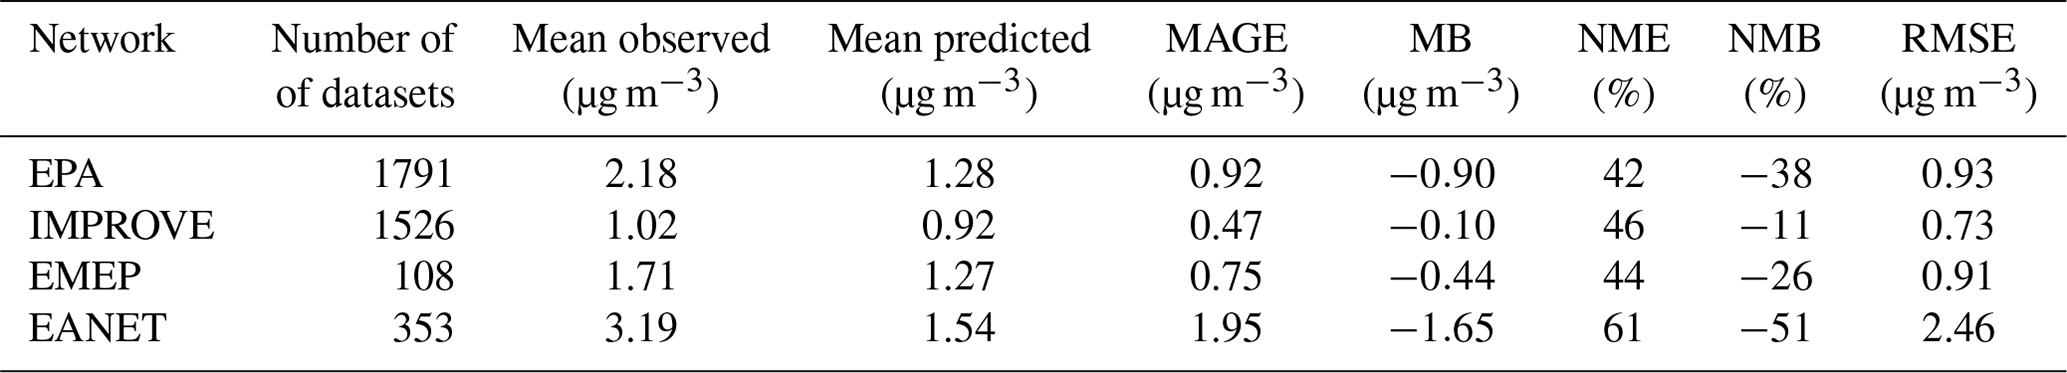
Table 4Statistical evaluation of EMAC-predicted surface concentrations of PM2.5 NH using ISORROPIA-lite against observations during 2010.
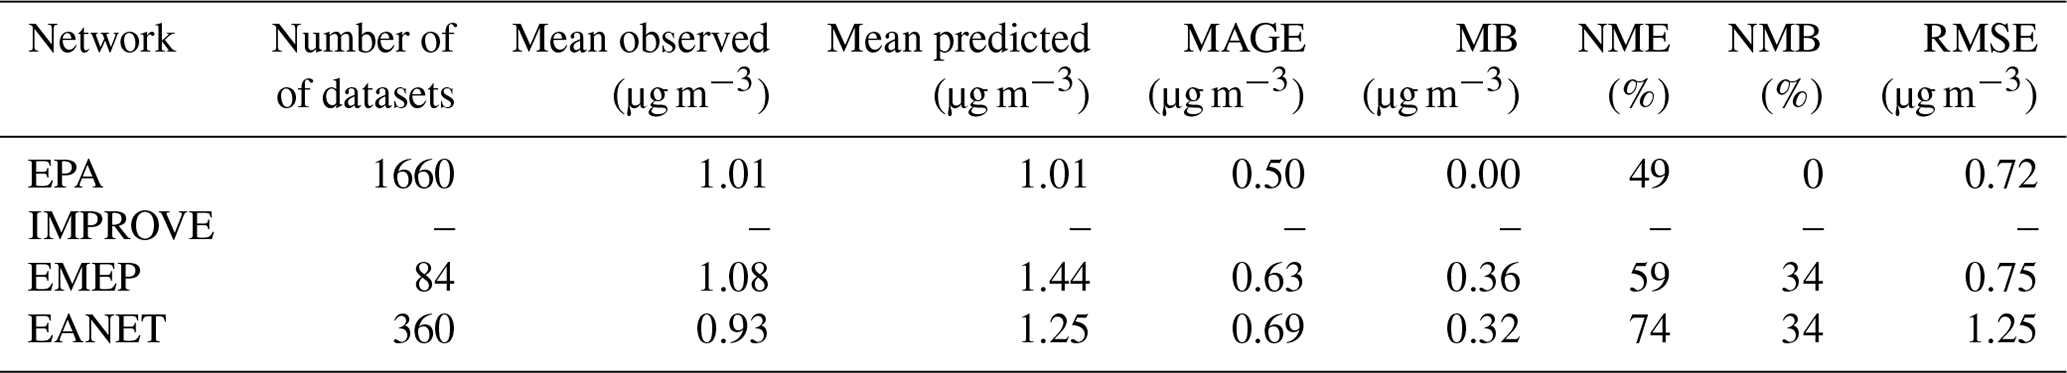
Figure 3 depicts the differences between the model-predicted and the observed mean annual concentration values for SO, NH and NO aerosols, while Tables 3, 4 and 5 contain the overall statistics for the same comparisons. Here, the mean bias (MB), mean absolute gross error (MAGE), normalized mean bias (NMB), normalized mean error (NME) and the root-mean-square error (RMSE) are calculated to assess the model performance. Starting with SO, the model tends to underpredict the observations but with a mean bias (MB) of less than −0.5 µg m−3 for Europe and less than −1 µg m−3 for the USA, capturing both the higher values of the eastern USA and the lower values of the western USA. Its normalized mean error (NME) ranges from 40 % to 60 %, being highest for the East Asian region, which also has the highest MB of −1.65 µg m−3 (Table 3). Seasonally, the largest biases are found during summertime over Europe and the USA and during wintertime over East Asia (Table S4), while the same is true for the predictions of ISORROPIA II in stable mode, exhibiting quite similar metrics (Table S1). NH is much better simulated by the model over the three regions, where the agreement with observations is high with MB values of less than 0.4 µg m−3 but with slightly higher NME values (Table 4). Over East Asia, the only important disparity is a slight underprediction of about 2 µg m−3 around Hong Kong following the underprediction of SO over the same area (Fig. 3). Seasonally, spring is the worst period for the predictions of both versions, while there does not seem to be a consistent pattern of behavior for all three regions which perform best over different periods (Tables S5 and S2). Finally, the model tends to overpredict NO concentrations over the three regions with MB values of less than 1 µg m−3, albeit with high NME values (Table 5). Over East Asia, with the exception of Hong Kong, the model overestimates the NO concentrations by about 3 µg m−3, especially in the Wuhan and Guangzhou areas and also around Beijing (Fig. 3). In general, besides Hong Kong, the model overpredicts the concentrations of all three aerosol components examined here in the East Asian region. For all regions, the best seasonal agreement between the predictions of both versions in terms of MB values is found during the summer period, while the worst agreement occurs around the winter/spring period (Tables S6 and S3). The NME values are lowest in the summer for the USA and, surprisingly, in the winter for Europe and East Asia, even though this is the period with the worst MB values for these regions. Potential explanations include the coarse grid resolution used in this work as well as issues related to emissions (Zakoura and Pandis, 2018). It should be noted that even though the two versions perform similarly, better performance on certain statistical metrics should not be taken as an indication that one state assumption is more scientifically valid than the other. While a stable state could be considered more accurate under very low humidity conditions (e.g., over remote deserts; Karydis et al., 2016), in regions such as those with intermediate RH and low nitrate concentration (e.g., northeastern USA), particles are mostly in the metastable state (Guo et al., 2016). However, the two state assumptions produce very similar results in most cases, as shown here.
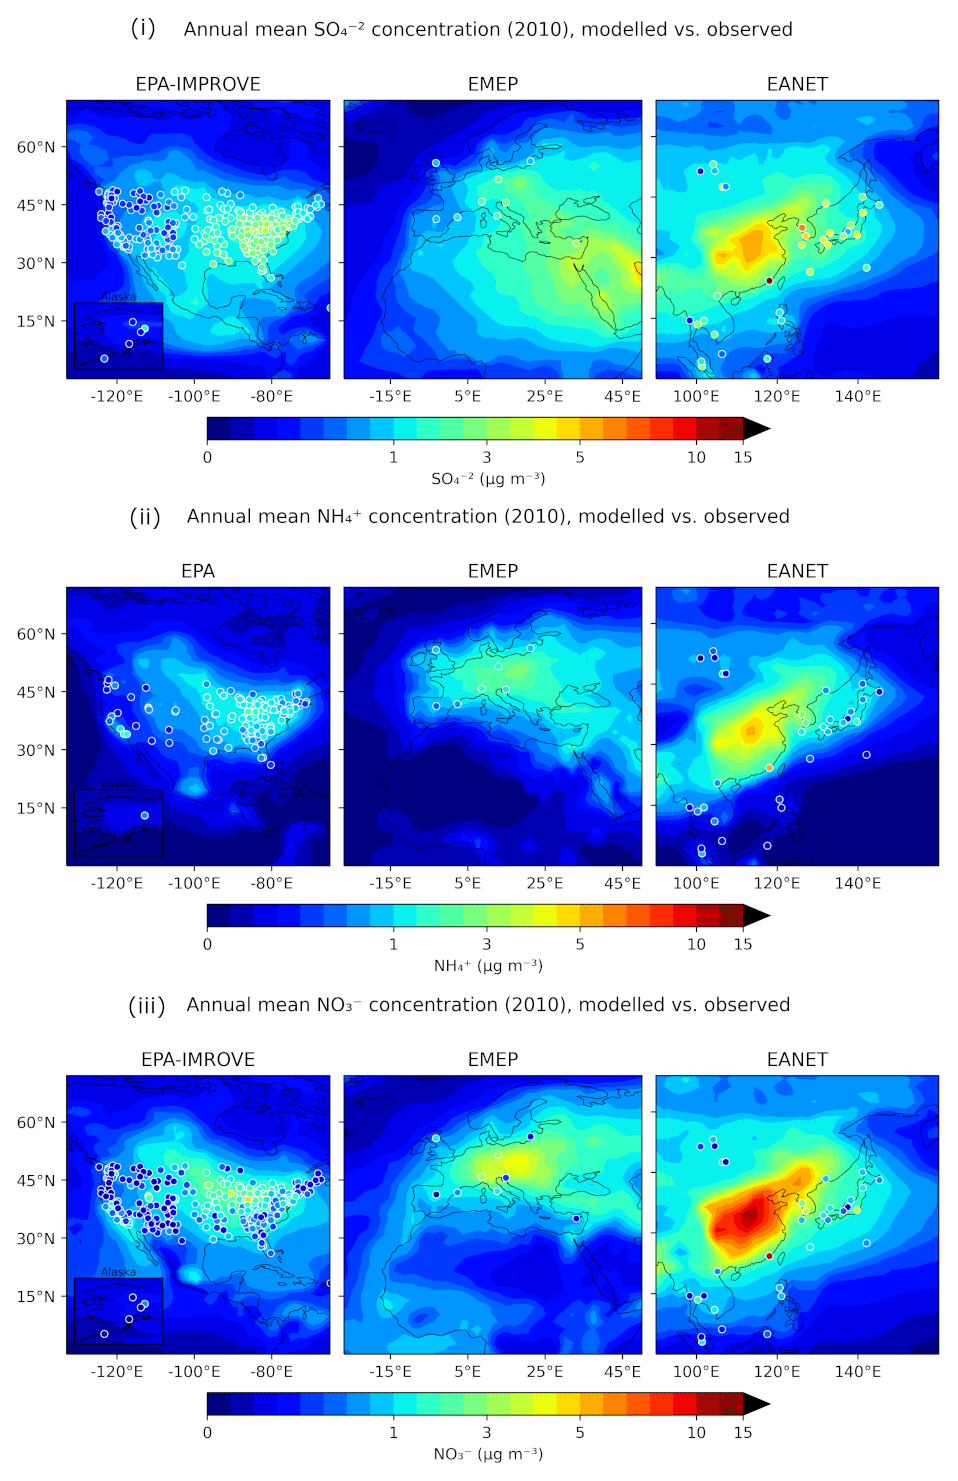
Figure 3Annual mean surface concentrations of PM2.5 for (i) SO, (ii) NH and (iii) NO as simulated by EMAC using ISORROPIA-lite (shaded contours) versus observations of the same species from the IMPROVE, EMEP and EANET networks (colored circles).
Table 5Statistical evaluation of EMAC-predicted surface concentrations of PM2.5 for NO using ISORROPIA-lite against observations during 2010.
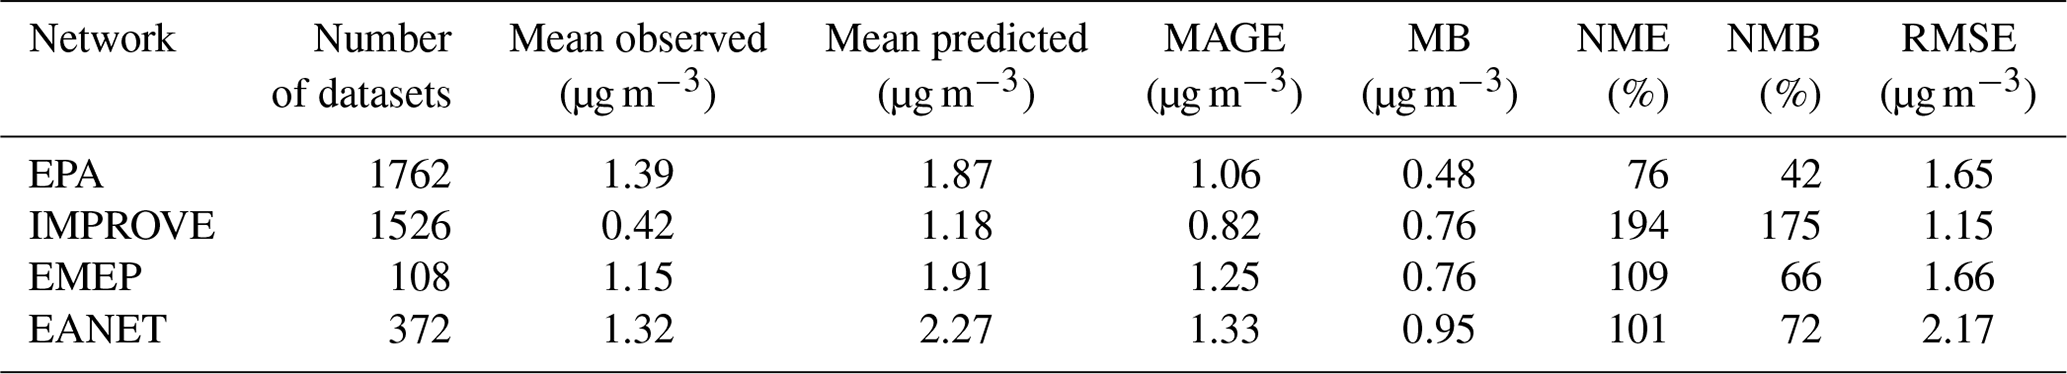
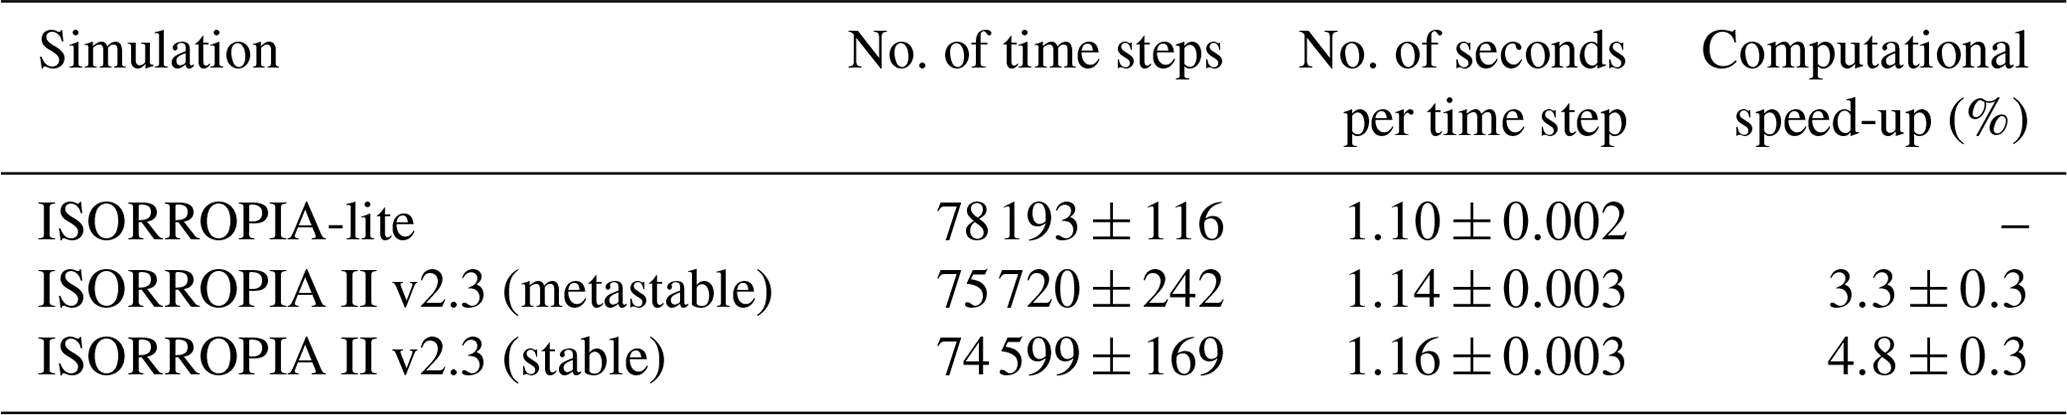
Table 6Total number of time steps that EMAC executed in 24 h of running time and number of seconds needed for each time step, utilizing ISORROPIA-lite and ISORROPIA II (both in stable and metastable). The computational speed-up refers to how much quicker (in %) the process is executed by ISORROPIA-lite in comparison to the previous version in both modes.
3.4 Computational speed-up metrics
The computational efficiency and speed-up that ISORROPIA-lite provides compared to ISORROPIA II in both stable and metastable modes were quantified. Table 6 contains the total number of time steps that the EMAC model performed for the same simulation period (i.e., 24 h of CPU time using 16 nodes), as well as the real time that was needed per individual time step, for each ISORROPIA version. The metrics shown in Table 6 concern the average value of each quantity, along with the corresponding standard deviation, resulting from a total of 18 simulations (6 for each version). From the difference in the real time required by the model to execute each individual time step, the speed-up of ISORROPIA-lite was found to be just above 3 % compared to ISORROPIA II in metastable mode and almost 5 % compared to ISORROPIA II in stable mode. These values are, as expected, lower than the improvement in the computational efficiency that the ISORROPIA-lite version provides compared to the original version, as found in the offline evaluation, because EMAC contains several other modules that are quite computationally expensive. For example, the gas-phase chemistry (MECCA submodel) as well as wet deposition and liquid-phase chemistry (SCAV submodel) are responsible for two-thirds of the total computational cost of the global model. As a comparison, the offline speed-up that ISORROPIA-lite provided was calculated to be 35 % and when utilized in the regional model PMCAMx 3D it was found to be 10 % (Kakavas et al., 2022).
In this section, we present a comparison of the ISORROPIA-lite results in metastable mode against those of the ISORROPIA II results in stable mode. Both versions are now available in the latest version of the EMAC model, and the user has the option to utilize either one. While ISORROPIA-lite always assumes metastable aerosols, ISORROPIA II assumes stable aerosols by default. This comparison is done in an attempt to quantify the effects of using the metastable case in global atmospheric simulations and to identify the regions and conditions under which the two assumptions have any significant differences. Some discrepancies are expected due to the different physical states of aerosols at low RH; however, the choice between a stable state and a metastable state should not be considered obvious. For example, Fountoukis et al. (2009) and Karydis et al. (2010) have shown that the stable assumption is in better agreement with observations under conditions where RH is consistently below 50 %. On the other hand, Ansari and Pandis (2000) emphasize that the metastable assumption must be considered for regions characterized by intermediate RH and low pollutant concentrations (in this case of NO), while there are no significant differences between the two assumptions over regions with high concentrations. Here, differences in the calculated aerosol acidity by the two modules are also investigated.
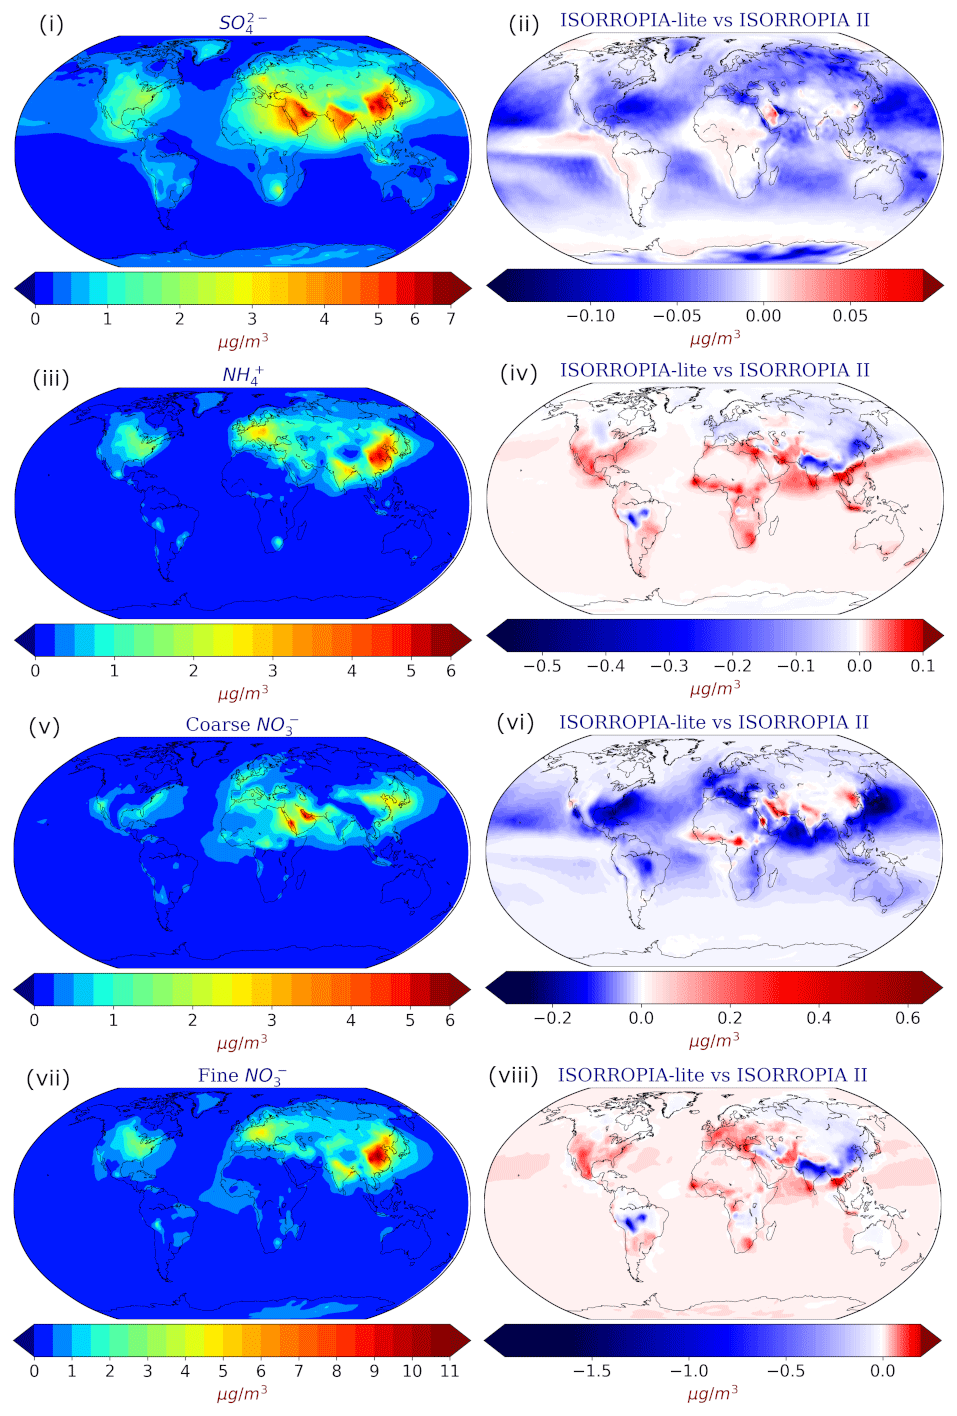
Figure 4Annual mean surface concentrations of (i) SO and (iii) NH in TSP as well as (v) coarse and (vii) fine aerosol NO as predicted by EMAC using ISORROPIA-lite. Change of the annual mean EMAC-simulated surface concentration of (ii) SO and (iv) NH in TSP as well as (vi) coarse and (viii) fine aerosol NO after employing ISORROPIA II. Positive values in red indicate higher concentrations by ISORROPIA-lite. The models assume different aerosol states.
4.1 Spatial variability of mean annual aerosol concentrations
For sulfate in TSP, the predicted maximum annual average concentration was 7 µg m−3 over East Asia, highlighting the large anthropogenic impact over that region, while it was also high (>5 µg m−3) in India, Europe and the Middle East in both simulations (Fig. 4i). Absolute differences for sulfate in TSP were lower than 0.15 µg m−3 (<3 %) and found mainly over the polluted Northern Hemisphere (mainly eastern USA and Europe) with slightly higher values simulated by ISORROPIA II (Fig. 4ii). This is most likely related to the also higher NO aerosol predictions by ISORROPIA-lite over the same regions (see below and Fig. 4viii). The higher SO aerosol concentrations estimated by ISORROPIA II over the Middle East region are mainly due to changes in wet deposition induced by the different physical states of the aerosol due to the higher water content by ISORROPIA-lite. The simulated concentrations of NH in TSP had maximum annual average values of 6 µg m−3 and were found mainly over East Asia, especially around the greater Beijing and Wuhan areas, while India and Europe also exhibited high mean annual values for TSP NH (>3 µg m−3) (Fig. 4iii). The absolute differences for NH in TSP between the two model versions are higher over the Himalayan and East Asian regions (in favor of ISORROPIA II) but apparently weaker over the USA, the Middle East and Africa (ISORROPIA-lite predicts higher values), although never higher than 0.5 µg m−3 (<5 %) (Fig. 4iv). Regarding aerosol NO concentrations in the coarse mode, the maximum annual average of 6 µg m−3 was predicted at the Arabian Peninsula (Fig. 4v), while in the fine mode the maximum annual average value of 11 µg m−3 was predicted over the metropolitan areas of Wuhan and Guangzhou (Fig. 4vii). Other high annual average concentrations of fine aerosol NO are found in the Tibetan Plateau and most prominently in heavy industrial regions such as eastern USA, East Asia and Europe (exceeding 4 µg m−3 in most of these areas), with the latter two regions contributing high annual average concentrations in the coarse mode as well. The absolute differences for coarse NO were similar in magnitude to those of NH in TSP with the Middle East yielding higher values by ISORROPIA-lite, while the opposite is true for Europe and the eastern USA (Fig. 4vi). The absolute differences for fine NO are higher than those for coarse NO, reaching up to 1.75 µg m−3 mainly over the Tibetan Plateau (∼30 %) with ISORROPIA II predicting the higher values (Fig. 4vii). Higher nitrate concentrations were also predicted by ISORROPIA II mainly close to the west coast of South America and north of the Atacama Desert. Around those regions as well as the Tibetan Plateau, the relative humidity is often below 50 % and 30 %, respectively (see Fig. 8), and the metastable assumption results in lower nitrate concentrations, in agreement with the findings of Ansari and Pandis (2000). At the same time, ISORROPIA II predicts a higher aerosol fraction for NO (up to 10 %) for the west coast of South America and the Tibetan Plateau. This is not the case for East Asia (Fig. 5ii), although the low sulfate-to-nitrate ratio of that region results in an excess of available NH3 to react with HNO3 and form ammonium nitrate that would justify the higher fine-mode nitrate concentrations by the stable case of ISORROPIA II (Ansari and Pandis, 2000). A higher NO aerosol fraction (up to 10 %) in the Middle East was exhibited by ISORROPIA-lite (Fig. 5ii). This area is characterized by increased mineral ion concentrations and high sulfate to nitrate ratios (Karydis et al., 2016), which led to higher coarse-mode nitrate predictions by the metastable case (Ansari and Pandis, 2000), although the maximum difference was only 0.6 µg m−3 (Fig. 4vi, viii). The differences in coarse and fine NO among the two versions did not display any strong seasonality as they were only slightly higher during autumn (for East Asia) and winter (for India-Himalaya) (not shown). A comparison of the simulated aerosol concentrations at higher altitudes can be found in Fig. S3, where the zonal mean annual average concentrations as well as their absolute differences between the two model versions are depicted. The deviations between the results of the two ISORROPIA versions become smaller as the air masses move higher in the atmosphere, until they are practically identical at altitudes above 700 hPa. Regarding the behavior of,the mineral ions of Ca2+, K+ and Mg2+, the majority of high concentrations are found around the largest desert regions of the Sahara, Gobi, Atacama and Namib deserts (Fig. S4), with Ca2+ being evidently the most dominant across all minerals. Furthermore, the absolute difference maps (Fig. S4) show minimal differences in mean annual surface concentrations (mostly less than 0.5 µg m−3) between the simulations from the two model versions. This is also reflected in the comparison of zonal mean annual average concentrations and their differences, as shown in Fig. S5.
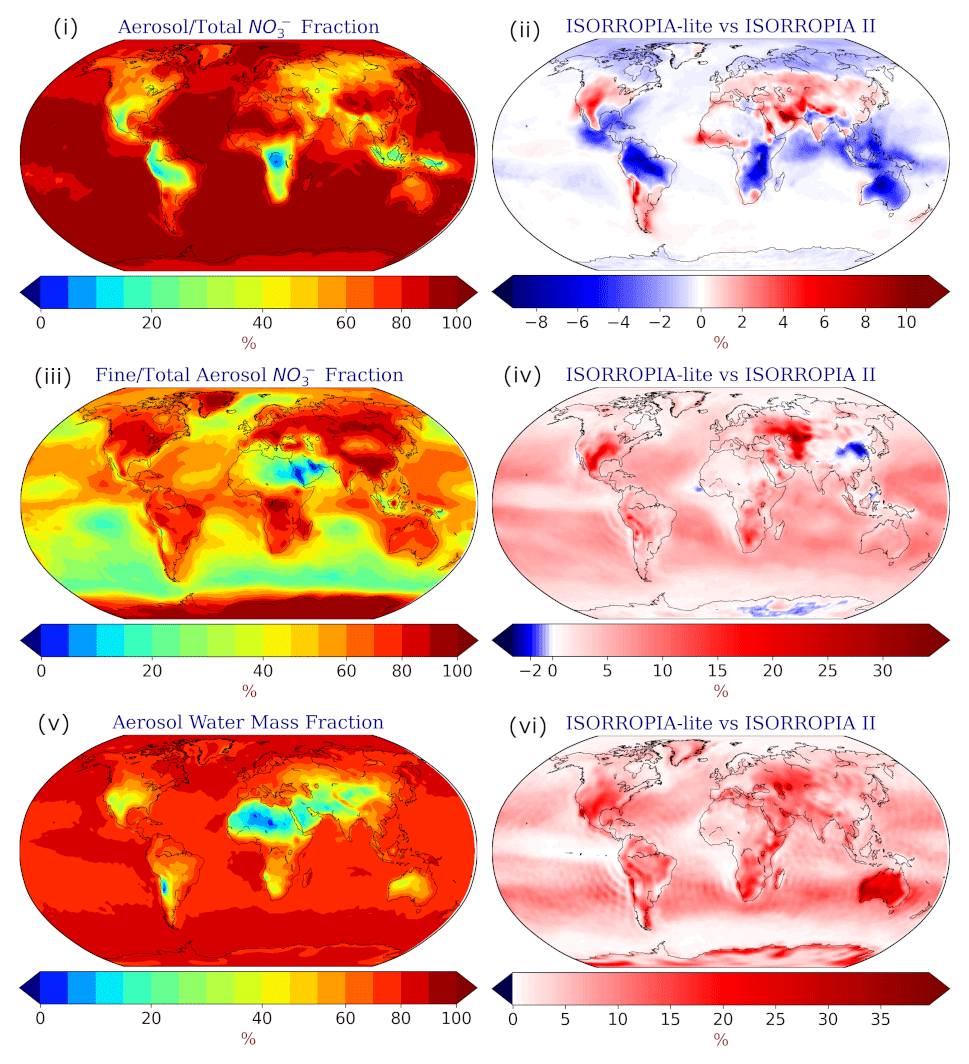
Figure 5Annual mean surface fractions of (i) aerosol/total NO, (iii) fine/total-aerosol NO and (v) aerosol water mass as calculated by EMAC using ISORROPIA-lite. Change of the annual mean EMAC-simulated surface fractions of aerosol/total (ii) NO, (iv) fine/total-aerosol NO and (vi) aerosol water mass after employing ISORROPIA II. Positive values in red indicate higher fractions by ISORROPIA-lite. The models assume different aerosol states.
In the heavily polluted regions (particularly eastern USA, Europe and East Asia), the particulate NO dominates compared to the gas-phase HNO3 (Fig. 5i). The fine-mode fraction of the particulate nitrate burden is higher than the coarse-mode fraction over East Asia, India, Europe or the eastern USA, while in the large desert areas of the Middle East and the Sahara most of the particulate NO exists in the coarse mode (Fig. 5iii). The aerosol water fraction is low (<30 %) across the most arid regions of Sahara, Atacama, Namib and Gobi, while Europe has the highest continental average aerosol water content in the Northern Hemisphere polluted regions (Fig. 5v). ISORROPIA-lite predicts higher average aerosol water concentration globally since the particles cannot form solids because the salts remain in a supersaturated metastable solution (Fig. 5vi).
The absolute differences in global daily mean concentrations are mostly less than 0.3 µg m−3 for all species (NH, SO and mineral cations in TSP as well as coarse and fine aerosol NO) except aerosol water in TSP (Fig. 6). In that case, the absolute differences for the 25th and 75th percentiles are less than 5 µg m−3. This translates to fractional differences for the 25th and 75th percentiles mostly below 20 % for aerosol water in TSP and coarse NO aerosol and mostly below 5 % for all the remaining species.
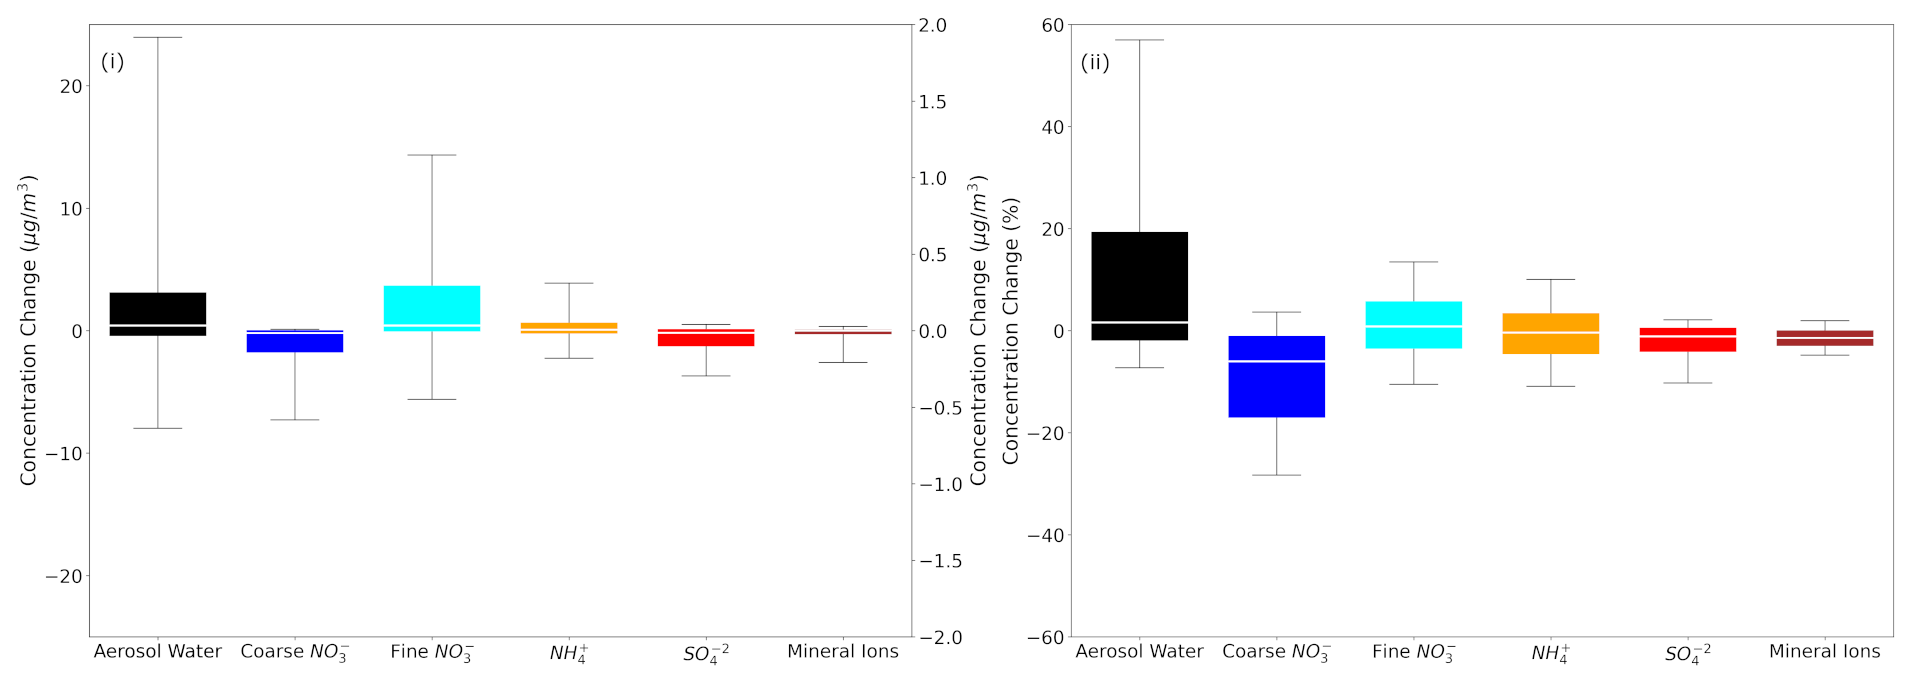
Figure 6Box plots depicting the 25th, 50th and 75th percentiles (box) of the (i) difference and (ii) fractional difference in global daily mean surface concentrations of aerosol water (left y axis), mineral ions, NH and SO in TSP as well as coarse and fine aerosol NO (right y axis), as predicted by EMAC using ISORROPIA-lite and ISORROPIA II. The models assume different aerosol states at low RH and that a positive change corresponds to higher concentrations by ISORROPIA-lite.
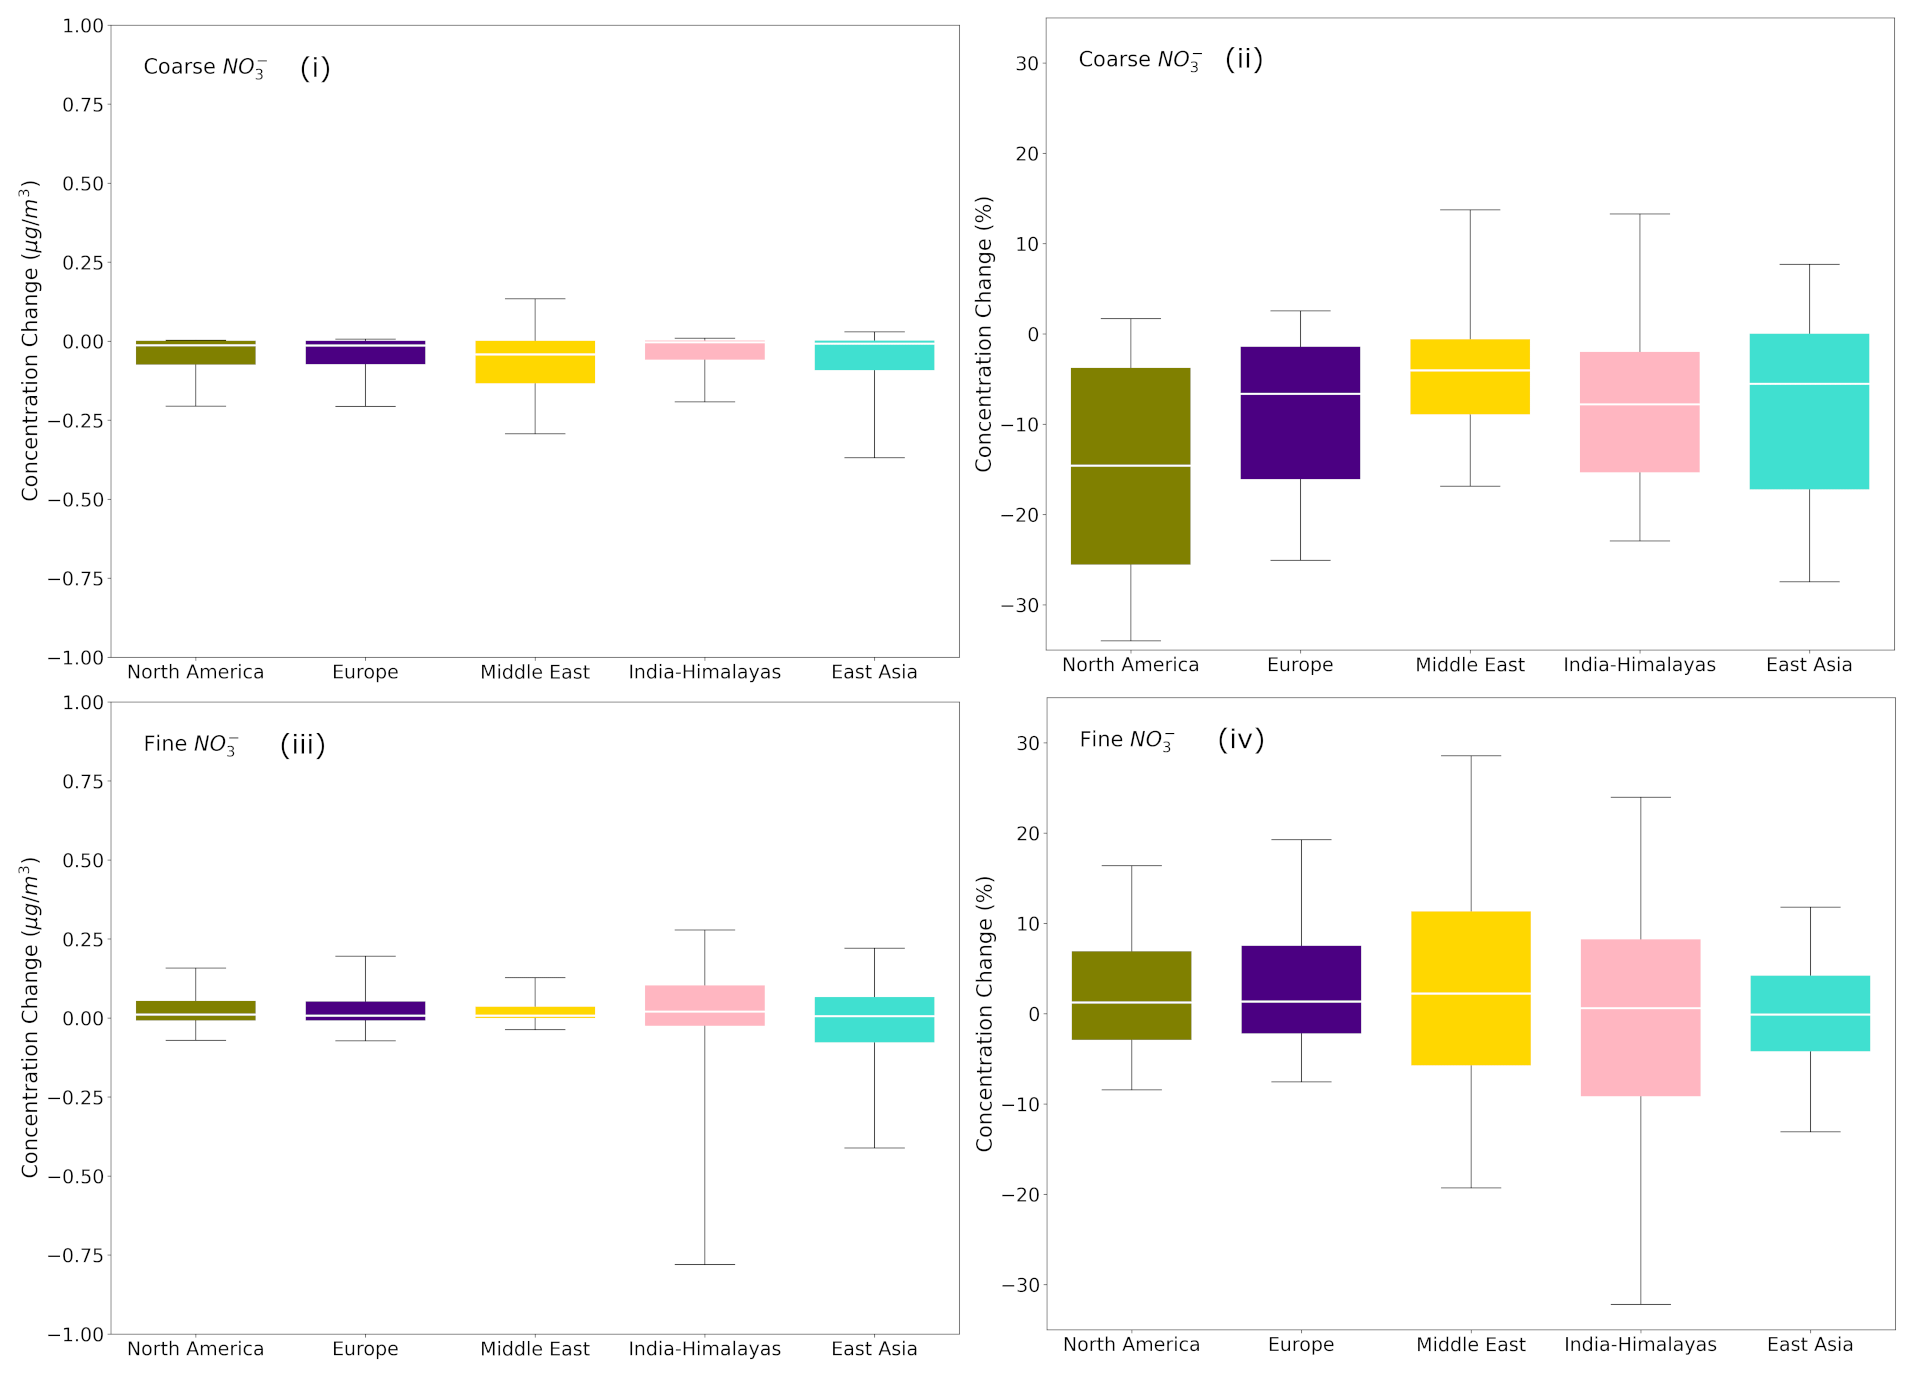
Figure 7Box plots depicting the 25th, 50th and 75th percentiles (box) of the difference in the global daily mean surface concentrations of (i) coarse and (iii) fine aerosol NO for the regions of North America, Europe, the Middle East, India-Himalaya and East Asia, as predicted by EMAC using ISORROPIA-lite and ISORROPIA II. The fractional differences in global daily mean surface concentrations of (ii) coarse and (iv) fine aerosol NO for the same regions are also shown. The models assume different aerosol states at low RH and that a positive change corresponds to higher concentrations by ISORROPIA-lite.
Table 7Statistical analysis of EMAC-simulated mean daily surface concentrations by employing ISORROPIA-lite in metastable mode versus ISORROPIA II in stable mode. Bias is given as ISORROPIA-lite minus ISORROPIA II.
The model results in the regions with the highest mean annual loads of fine and coarse aerosol NO concentrations (see Sect. 3.1) as well as the most significant differences in estimated aerosol water and aerosol acidity (see Sect. 4.3) were further analyzed to determine whether the phase state assumption has a large effect on simulated aerosol nitrate formation (Fig. 7). For both coarse and fine daily mean NO concentrations, Europe and North America are clearly the regions with the smallest differences between the two versions. On the other hand, East Asia and especially the India-Himalaya region are areas where the differences are the highest; ISORROPIA II is predicting higher fine aerosol NO concentrations, while in the Middle East ISORROPIA-lite is predicting higher coarse-mode aerosol NO concentrations. However, even for these areas the differences are typically below 0.25 µg m−3 (25th and 75th percentiles) with the higher differences not exceeding 0.8 µg m−3 (10th and 90th percentiles). This translates to fractional differences below 25 % (25th and 75th percentiles) for all regions, reaching up to 30 % (10th and 90th percentiles) mainly in the Tibetan Plateau and the Middle East.
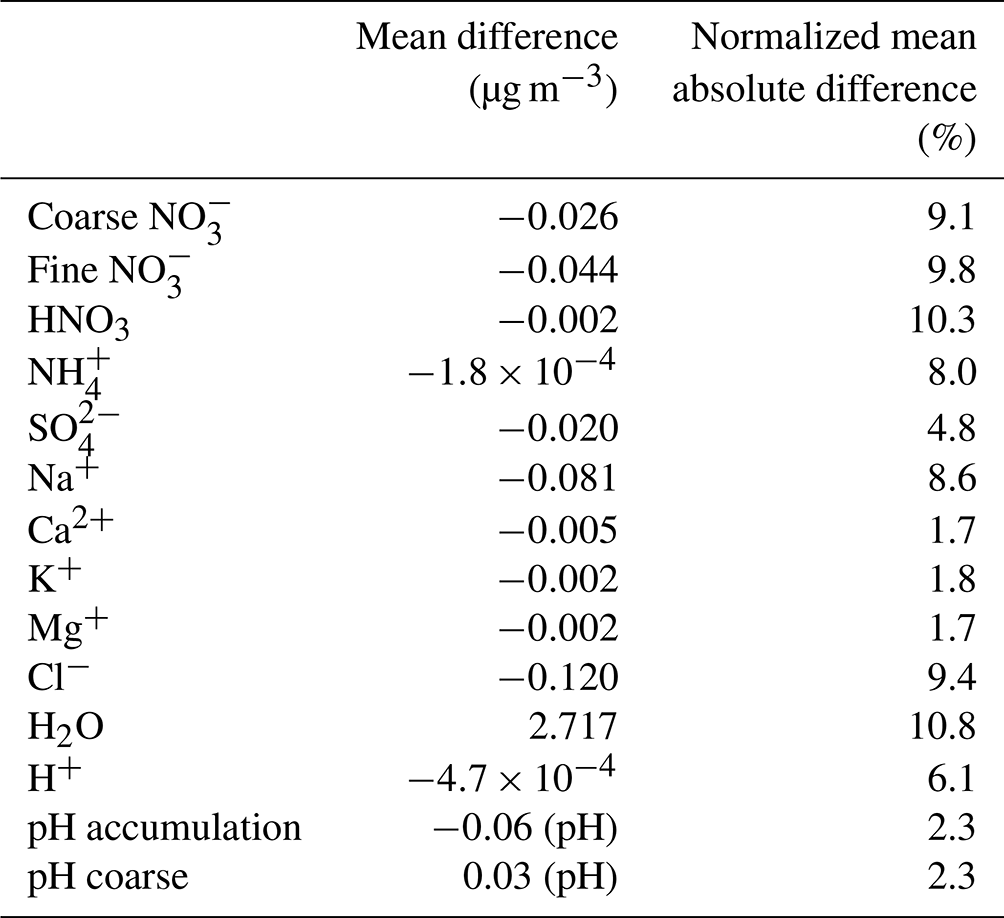
Table 7 contains the statistics for the comparisons of the global daily average surface concentrations calculated by the two simulations. While all the aerosol component concentrations, except for aerosol water, are higher for ISORROPIA II, the differences are still quite low. Furthermore, despite the different aerosol phase state assumptions by the two versions, the normalized mean absolute difference remains low for all species (on average <11 %) except HNO3. The overall statistics support the conclusion that, on the global scale, the phase state assumption for low RH does not have a significant impact on the predicted tropospheric aerosol load. More specifically, ISORROPIA-lite produces a slightly higher tropospheric burden for aerosol NO than ISORROPIA II (0.875 Tg versus 0.861 Tg, respectively), while the opposite was the case for HNO3 (0.921 Tg versus 0.935 Tg). The higher burden of ISORROPIA-lite is due to the fact that the higher aerosol water content favors the partitioning of HNO3 to the particulate phase.
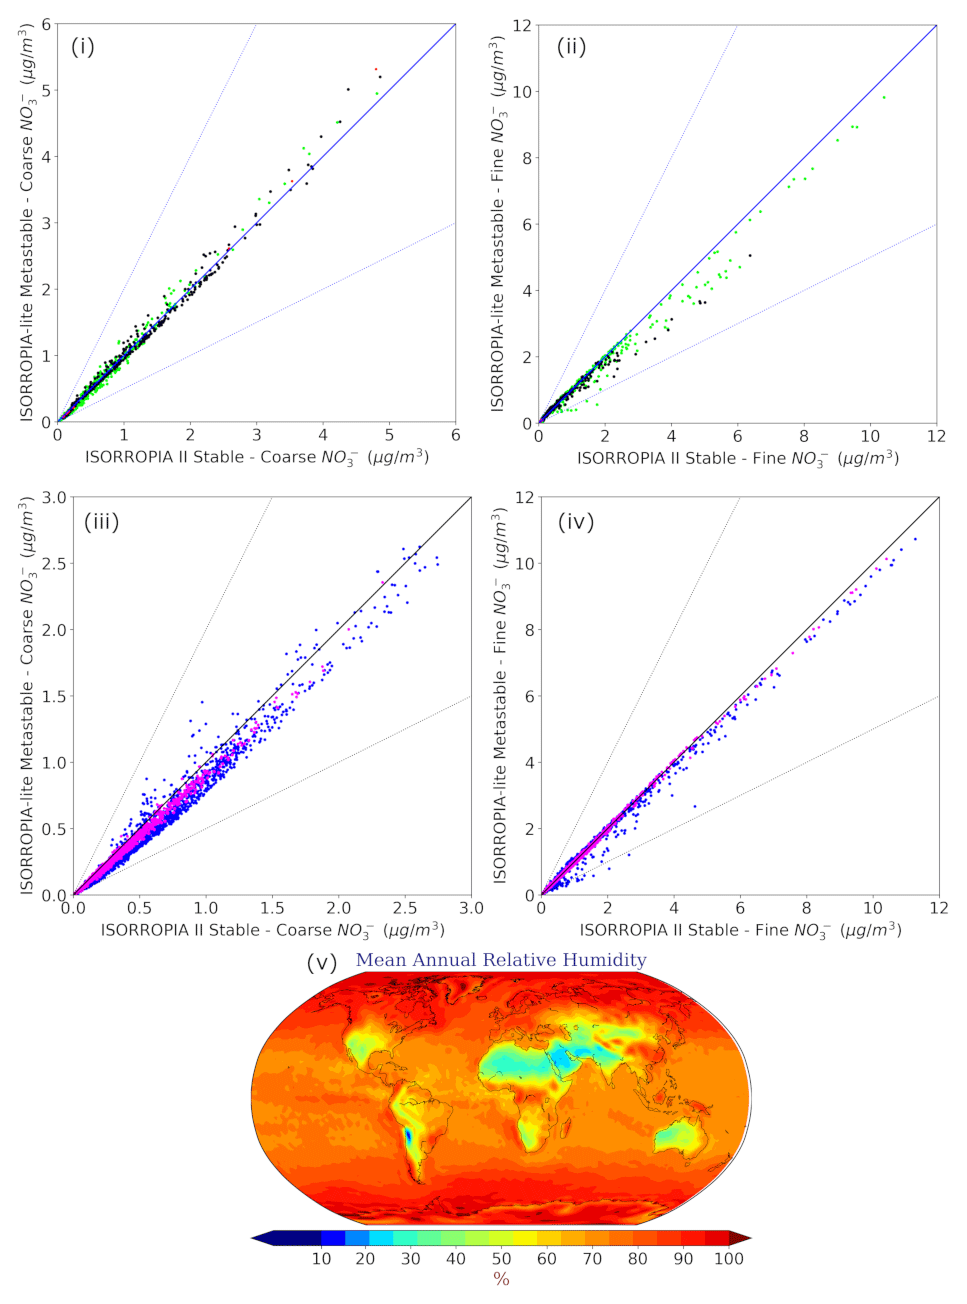
Figure 8Scatterplots comparing the annual mean surface concentrations of coarse (i, iii) and fine aerosol NO (ii, iv) for relative humidity ranges of 20 %–60 % (i, ii) and 60 %–100 % (iii, iv) as predicted by EMAC using ISORROPIA-lite versus ISORROPIA II. The models assume different aerosol states at low RH. Black points represent the 20 %–40 % RH range, green points represent the 40 %–60 % range, blue points represent the 60 %–80 % range and pink points represent the 80 %–100 % range. (v) Mean annual relative humidity as calculated by EMAC using ISORROPIA-lite.
4.2 Relative-humidity-dependent behavior of NO aerosols
The dependence of the differences in nitrate predictions on relative humidity was examined for both fine and coarse mode particles (Fig. 8). The differences between ISORROPIA II and ISORROPIA-lite are higher at intermediate RH ranging from 20 % to 60 %, being more evident in the fine-mode aerosol NO and for high annual mean concentrations of coarse-mode aerosol NO (>4 µg m−3). In this RH range, solid salts can precipitate when the stable equilibrium state is assumed (Seinfeld and Pandis, 2016), while in the metastable state all these salts remain dissolved in water. A region that often has RH in the 20 %–60 % range is the Tibetan Plateau, which leads to discrepancies in the fine-mode particulate nitrate predictions of the two models in this area, while higher coarse-mode particulate nitrate concentrations are predicted by ISORROPIA-lite in the Middle East, which is an area that is also often characterized by intermediate RH. The differences found for coarse-mode particulate nitrate in the higher RH range of 60 %–100 % can account for the respective differences that occurred in areas characterized by such RH values (eastern USA, Europe and East Asia) but concern lower annual mean concentration values (<3 µg m−3).
4.3 Comparison of the estimated aerosol acidity
The estimated aerosol acidity by the two model versions was compared separately for the accumulation and coarse size modes. This comparison aims at verifying the credibility of the estimated inorganic aerosol acidity of ISORROPIA-lite, as the first results of its implementation in the EMAC model are presented here. Since this capability is well established for ISORROPIA II (Karydis et al., 2021), it is of interest to examine any potential, but otherwise expected, differences between the two versions. The pH was computed for the fine- and coarse-mode particles:
The calculations were performed neglecting the water associated with the organic fraction of aerosols, as they are handled by other parts of the aerosol microphysics submodel GMXe. The average pH was calculated based on the instantaneous H+ and H2O values estimated every 5 h. This is because utilizing daily average values for H+ and H2O can result in a low-biased predicted pH of ∼2 units globally (Karydis et al., 2021). The 5 h interval provides a frequent output of values at different times of the day to account for the diurnal variability of pH, since a selection of 6 or 8 h intervals would result in instantaneous H+ and H2O values at identical times on different days; pH calculations are performed only in cases where there is enough water in the aerosol (instantaneous values exceeding 0.05 µg m−3).
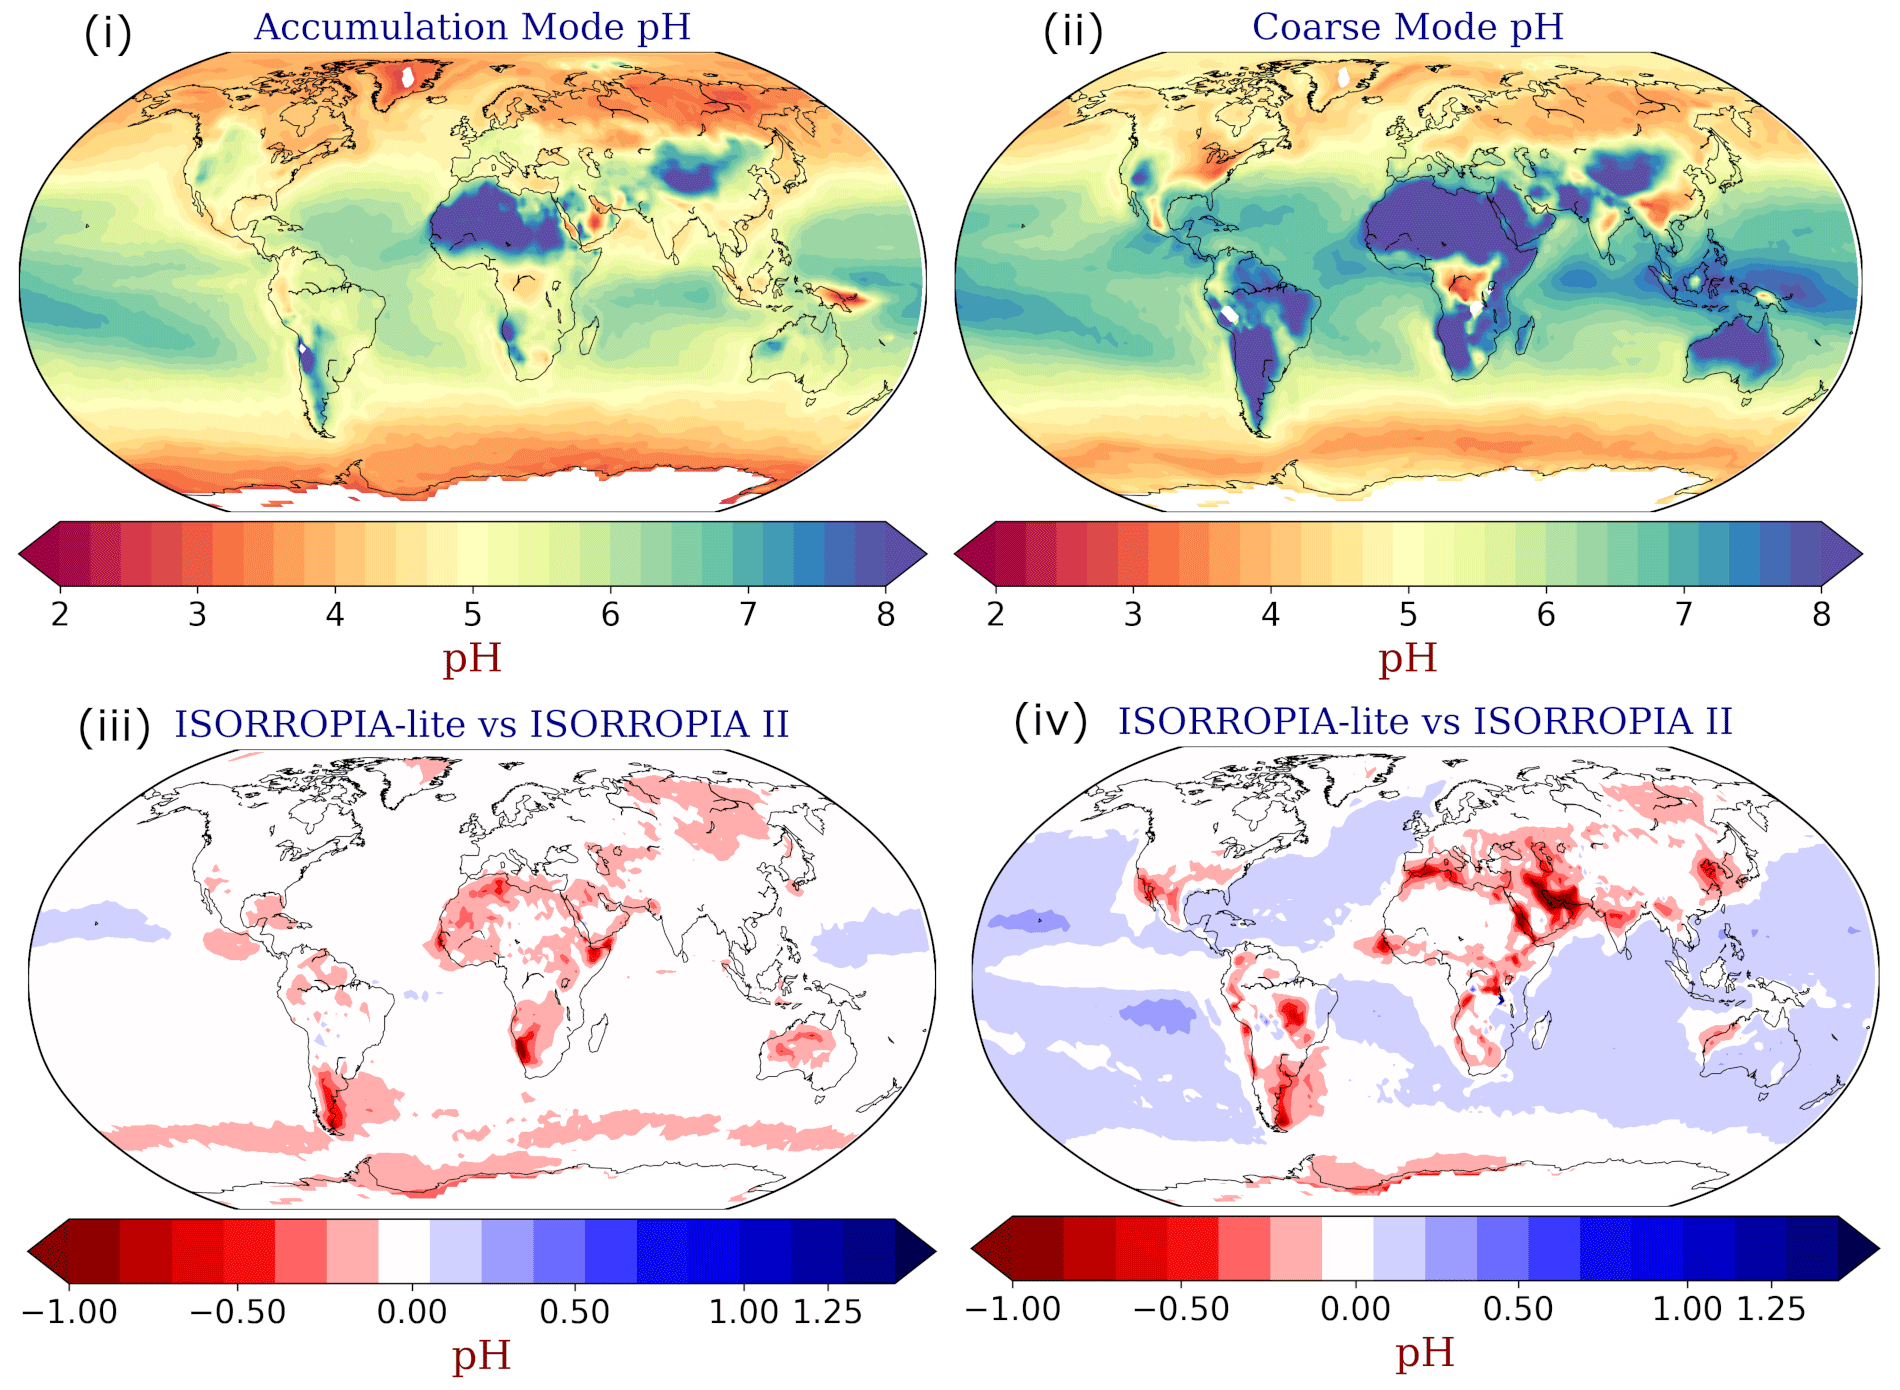
Figure 9Annual mean EMAC-simulated (i) accumulation and (ii) coarse-mode aerosol pH using ISORROPIA-lite. Change of the annual mean EMAC-simulated (iii) accumulation and (iv) coarse-mode aerosol pH after using ISORROPIA II, with negative values in red indicating lower pH by ISORROPIA-lite. The models assume different aerosol states.
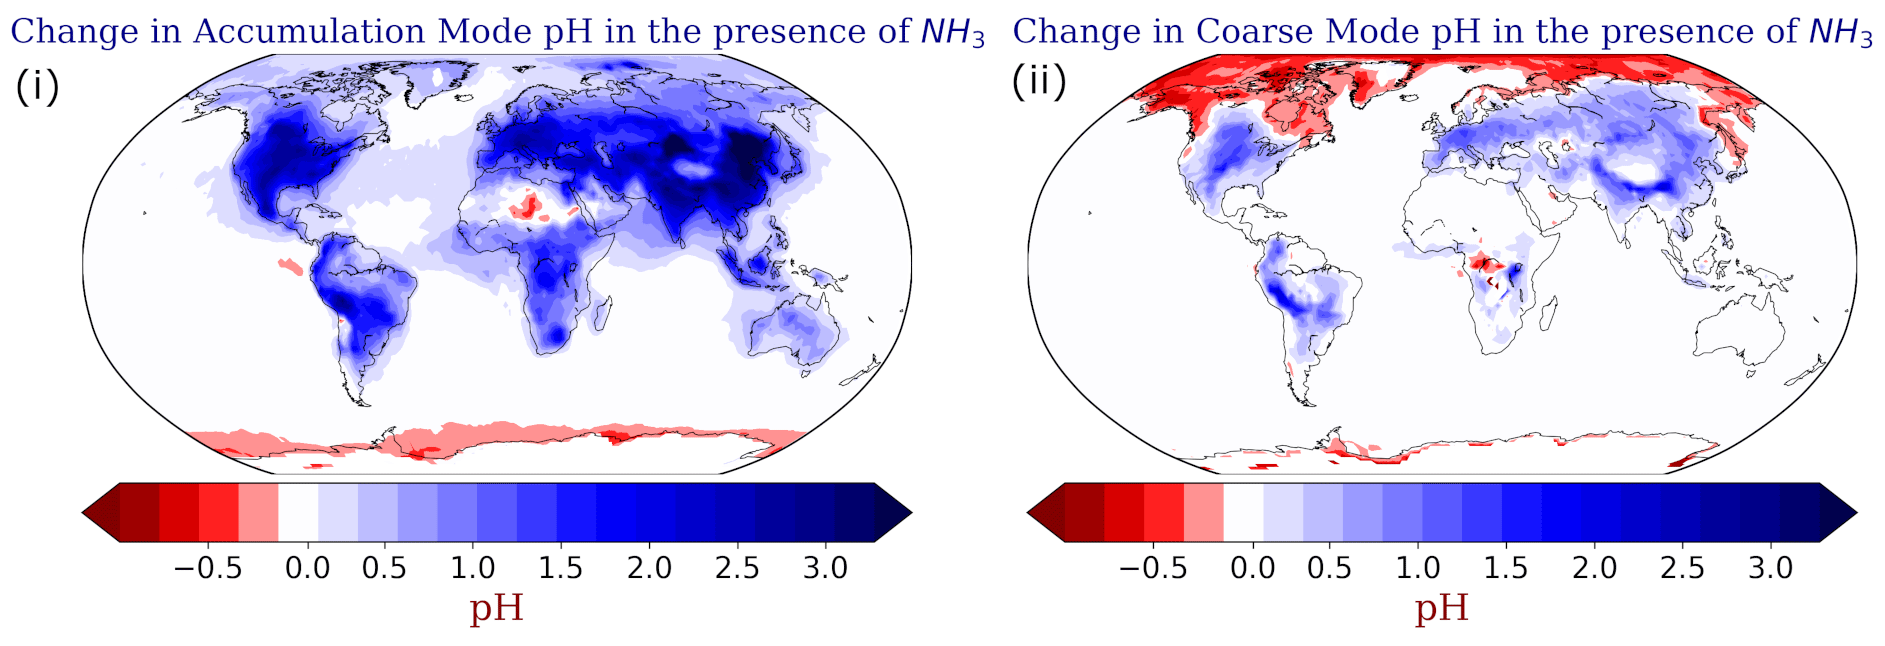
Figure 10Absolute change of the annual mean EMAC-simulated (i) accumulation and (ii) coarse-mode aerosol pH using ISORROPIA-lite after reducing the NH3 emissions by half. Positive values in blue indicate higher aerosol pH when NH3 is present.
ISORROPIA-lite predicts slightly more acidic particles mainly in the coarse mode (Fig. 9iv). The most significant differences (up to 1 unit) in that size range are located over the Middle East and the Arabian Peninsula, while smaller differences can be found in limited parts of the Himalayan and the East Asian regions as well as the western USA and the Amazon Basin. These regions are characterized by high mineral cation concentrations and/or low RH. Therefore, the stable state results in increased pH values due to the precipitation of insoluble salts out of the aqueous phase. On the other hand, in the metastable state all anions remain in the aqueous phase, lowering the particle pH. Differences in accumulation mode particle acidity are not as high (Fig. 9ii). ISORROPIA-lite predicts that accumulation mode particles over heavily industrialized regions such as Southeast Asia, Europe and the eastern USA are moderately acidic with mean pH values in the range of 4–5, while exhibiting alkaline behavior in desert areas where the increased levels of mineral ions elevate the pH above 7 (Fig. 9i). Coarse-mode particles are in general more alkaline than those in the accumulation mode, with a few exceptions over the eastern USA, central Europe, north India and Southeast Asia (Fig. 9iii). These regions are characterized by high NH3 concentrations from agricultural activities.
A sensitivity test was performed by reducing all NH3 emissions by half to investigate if there would be a buffering mechanism that controls the pH of the accumulation mode particles more than in the coarse mode. Figure 10 shows the difference in the mean annual calculated aerosol pH between the base case (NH3 emissions present) and the sensitivity case (half NH3 emissions). When NH3 emissions are switched off, the pH of fine PM decreases by up to 3 units, and the particles become a lot more acidic (Fig. 10i). For the coarse mode, this effect is not that strong (pH reduction of up to 1.5 units) (Fig. 10ii). As expected, this buffering mechanism is mainly observed across the aforementioned regions where NH3 concentrations are high, but it is also observed over areas affected by natural NH3 emissions. This is consistent with the results of Karydis et al. (2021), who found that, in the absence of NH3, aerosol particles would be extremely acidic in most of the world.
The differences in the accumulation mode pH calculated by ISORROPIA-lite and ISORROPIA II are extremely small (i.e., mean difference of 0.06 pH units or 2.3 %) and even smaller for coarse-mode pH (Table 7), indicating an overall good agreement between the two model versions.
This study presents the first results of the implementation of the ISORROPIA-lite thermodynamic module in the EMAC global chemistry and climate model, and it is compared to the previous version, ISORROPIA II v2.3, after the latter has successfully replaced ISORROPIA II v1 to improve pH predictions close to neutral conditions.
The results of ISORROPIA II versions 1 and 2.3 both in stable mode had insignificant differences (<3 %) concerning the global predictions of NH, SO, mineral ions and aerosol water in TSP concentrations as well as fine- and coarse-mode aerosol NO. The comparison of results from ISORROPIA-lite against ISORROPIA II v2.3 in metastable mode showed also negligible differences (<7 %) between all the examined aerosol components on a global scale. The comparison of the ISORROPIA-lite results for PM2.5 NH, SO and NO versus observations from the IMPROVE, EMEP and EANET networks reveals that East Asia is the area with the largest discrepancies. There was satisfactory agreement in Europe and over the USA for NH and SO, while ISORROPIA-lite predicted lower concentrations around Hong Kong with a maximum difference of 1.5 µg m−3 (∼20 %) for these two species. For NO, the discrepancy was up to 3 µg m−3 (∼30 %) in the same region, while a difference of about 1.5 µg m−3 (∼25 %) was found over central Europe with ISORROPIA-lite predicting the higher values. With the exception of Hong Kong, the model in general overpredicted the concentrations of all three aerosol components over the East Asian region.
A comparison between ISORROPIA-lite in the metastable state and ISORROPIA II in the stable state was performed to identify potential discrepancies in the inorganic aerosol concentrations simulated by EMAC. Although differences between the two model versions are to be expected due to the different physical state of aerosols at low RH, it is of interest to examine under which conditions these differences occur so that potential users are informed of the strengths and weaknesses of using either model version depending on the application. Both modules are now available as different options in the EMAC model. The agreement between the two versions was generally quite good for global daily mean surface concentrations of inorganic aerosols, mineral ions and aerosol water. More specifically, mineral ions, SO and NH in TSP had the smallest differences overall, less than 0.5 µg m−3 even in localized extreme cases but in the vast majority less than 0.1 µg m−3 (or less than 5 %). For coarse NO aerosols, the absolute differences were of similar magnitude, with the higher concentrations simulated by ISORROPIA-lite in the Middle East being the most notable. In the case of fine NO aerosols, the differences were larger (up to ∼1.75 µg m−3 in local extremes), mainly over the west coast of South America (north of the Atacama Desert), the Tibetan Plateau and East Asian regions, with higher concentrations simulated by ISORROPIA II but still within ∼30 %. In Europe and the USA, the corresponding differences were less than 0.25 µg m−3. The most important difference was the higher aerosol water calculated by ISORROPIA-lite, especially for relative humidity in the 20 % to 60 % range. However, this was less than 5 µg m−3 or 20 % in most cases. Therefore, even though local differences are expected in regions where the relative humidity is often in this range, on a global scale choosing a different physical state of the aerosol at lower RH does not have such a big impact.
When the relative humidity ranged from 20 % to 60 %, differences in coarse and fine NO concentration predictions among the two versions increased. The highest discrepancies were found in the Tibetan Plateau and the Middle East regions, both of which are dominated by such RH values during most of the year. In the first region, the combination of those RH values with mid-range temperatures does not favor nitrate aerosol formation if the aerosol is in the metastable state (ISORROPIA-lite). In the second region, the low RH values result in very low aerosol water predictions for the stable state assumed by ISORROPIA II, which hinder the condensation of HNO3 into the aerosol phase.
Investigation of the differences in the estimated inorganic aerosol acidity between the two versions, due to the different assumed aerosol phase states, is of great interest for potential future use of ISORROPIA-lite in global climate simulations. ISORROPIA-lite produces slightly more acidic coarse-mode aerosols (in comparison to ISORROPIA II) but by less than 1 pH unit on average. The most important differences were found mainly in the Middle East and the Arabian Peninsula due to the presence of high mineral cation concentrations. The stable state considered by ISORROPIA II allows for the precipitation of insoluble salts and removes anions from the aqueous phase that would otherwise deplete the pH, while this is not the case for the metastable aerosol state considered by ISORROPIA-lite. Furthermore, NH3 is found to control the aerosol acidity of both fine and coarse mode particles; however, it provides a significantly larger buffering capacity to the accumulation mode than to the coarse mode. This results in slightly more basic accumulation particles than coarse in regions with high NH3 from agricultural activities and low mineral cation concentrations (e.g., Europe).
Finally, concerning the computational efficiency that ISORROPIA-lite provides when used by the EMAC global model, a speed-up of more than 3 % was achieved compared to ISORROPIA II in metastable state and nearly 5 % compared to ISORROPIA II in stable state.
The usage of MESSy (Modular Earth Submodel System) and access to the source code is licensed to all affiliates of institutions which are members of the MESSy Consortium. Institutions can become a member of the MESSy Consortium by signing the “MESSy Memorandum of Understanding”. More information can be found on the MESSy Consortium website: http://www.messy-interface.org (last access: 8 February 2024). The code developed in this study and all relevant features, including the ISORROPIA II v2.3 and ISORROPIA-lite v1.0 thermodynamic equilibrium codes as part of MESSy, are archived with a restricted-access DOI (https://doi.org/10.5281/zenodo.8379120, The MESSy Consortium, 2023) and have already been incorporated into the official development branch of the EMAC modeling system and will therefore be part of all future released versions. The data produced in the study are available from the author upon request.
The supplement related to this article is available online at: https://doi.org/10.5194/gmd-17-1111-2024-supplement.
AM and VAK wrote the paper with contributions from all coauthors. VAK planned the research with contributions from AKS, SNP and AN. AN and SNP provided the ISORROPIA-lite model. AM and HT performed the implementation in EMAC. AM performed the simulations and analyzed the results, assisted by VAK and APT. APT provided the observations and performed the model evaluation. All the authors discussed the results and contributed to the paper.
At least one of the (co-)authors is a member of the editorial board of Geoscientific Model Development. The peer-review process was guided by an independent editor, and the authors also have no other competing interests to declare.
Publisher’s note: Copernicus Publications remains neutral with regard to jurisdictional claims made in the text, published maps, institutional affiliations, or any other geographical representation in this paper. While Copernicus Publications makes every effort to include appropriate place names, the final responsibility lies with the authors.
The work described in this paper has received funding from the Initiative and Networking Fund of the Helmholtz Association through the project “Advanced Earth System Modelling Capacity (ESM)”. The authors gratefully acknowledge the Earth System Modelling Project (ESM) for funding this work by providing computing time on the ESM partition of the supercomputer JUWELS (Alvarez, 2021) at the Jülich Supercomputing Centre (JSC).
This research has been supported by the project FORCeS funded from the European Union’s Horizon 2020 research and innovation program under grant agreement no. 821205.
The article processing charges for this open-access publication were covered by the Forschungszentrum Jülich.
This paper was edited by Samuel Remy and reviewed by two anonymous referees.
Alvarez, D.: JUWELS cluster and booster: Exascale pathfinder with modular supercomputing architecture at juelich supercomputing Centre, Journal of large-scale research facilities JLSRF, 7, A183, https://doi.org/10.17815/jlsrf-7-183, 2021.
Andreae, M. O., Jones, C. D., and Cox, P. M.: Strong present-day aerosol cooling implies a hot future, Nature, 435, 1187–1190, https://doi.org/10.1038/nature03671, 2005.
Ansari, A. S. and Pandis, S. N.: The effect of metastable equilibrium states on the partitioning of nitrate between the gas and aerosol phases, Atmos. Environ., 34, 157–168, https://doi.org/10.1016/S1352-2310(99)00242-3, 2000.
Astitha, M., Lelieveld, J., Abdel Kader, M., Pozzer, A., and de Meij, A.: Parameterization of dust emissions in the global atmospheric chemistry-climate model EMAC: impact of nudging and soil properties, Atmos. Chem. Phys., 12, 11057–11083, https://doi.org/10.5194/acp-12-11057-2012, 2012.
Bacer, S., Sullivan, S. C., Karydis, V. A., Barahona, D., Krämer, M., Nenes, A., Tost, H., Tsimpidi, A. P., Lelieveld, J., and Pozzer, A.: Implementation of a comprehensive ice crystal formation parameterization for cirrus and mixed-phase clouds in the EMAC model (based on MESSy 2.53), Geosci. Model Dev., 11, 4021–4041, https://doi.org/10.5194/gmd-11-4021-2018, 2018.
Bassett, M. and Seinfeld, J. H.: Atmospheric equilibrium model of sulfate and nitrate aerosols, Atmos. Environ., 17, 2237–2252, https://doi.org/10.1016/0004-6981(83)90221-4, 1983.
Bouwman, A. F., Lee, D. S., Asman, W. A., Dentener, F. J., Van Der Hoek, K. W., and Olivier, J. G. J.: A global high-resolution emission inventory for ammonia, Global Biogeochem. Cy., 11, 561–587, https://doi.org/10.1029/97GB02266, 1997.
Bromley, L. A.: Thermodynamic properties of strong electrolytes in aqueous solutions, AICHE J., 19, 313–320, https://doi.org/10.1002/aic.690190216, 1973.
Brook, R. D., Rajagopalan, S., Pope, C. A., Brook, J. R., Bhatnagar, A., Diez-Roux, A. V., Holguin, F., Hong, Y., Luepker, R. V., Mittleman, M. A., and Peters, A.: Particulate matter air pollution and cardiovascular disease: an update to the scientific statement from the American Heart Association, Circulation, 121, 2331–2378, https://doi.org/10.1161/CIR.0b013e3181dbece1, 2010.
Chen, Y., Shen, H., and Russell, A. G.: Current and future responses of aerosol pH and composition in the US to declining SO2 emissions and increasing NH3 emissions, Environ. Sci. Technol., 53, 9646–9655, https://doi.org/10.1021/acs.est.9b02005, 2019.
Clegg, S. L., Seinfeld, J. H., and Edney, E. O.: Thermodynamic modelling of aqueous aerosols containing electrolytes and dissolved organic compounds. II. An extended Zdanovskii–Stokes–Robinson approach, J. Aerosol Sci., 34, 667–690, https://doi.org/10.1016/S0021-8502(03)00019-3, 2003.
Crippa, M., Guizzardi, D., Muntean, M., Schaaf, E., Dentener, F., van Aardenne, J. A., Monni, S., Doering, U., Olivier, J. G. J., Pagliari, V., and Janssens-Maenhout, G.: Gridded emissions of air pollutants for the period 1970–2012 within EDGAR v4.3.2, Earth Syst. Sci. Data, 10, 1987–2013, https://doi.org/10.5194/essd-10-1987-2018, 2018.
Dentener, F., Kinne, S., Bond, T., Boucher, O., Cofala, J., Generoso, S., Ginoux, P., Gong, S., Hoelzemann, J. J., Ito, A., Marelli, L., Penner, J. E., Putaud, J.-P., Textor, C., Schulz, M., van der Werf, G. R., and Wilson, J.: Emissions of primary aerosol and precursor gases in the years 2000 and 1750 prescribed data-sets for AeroCom, Atmos. Chem. Phys., 6, 4321–4344, https://doi.org/10.5194/acp-6-4321-2006, 2006.
Doney, S. C., Mahowald, N., Lima, I., Feely, R. A., Mackenzie, F. T., Lamarque, J. F., and Rasch, P. J.: Impact of anthropogenic atmospheric nitrogen and sulfur deposition on ocean acidification and the inorganic carbon system, P. Natl. Acad. Sci. USA, 104, 14580–14585, https://doi.org/10.1073/pnas.0702218104, 2007.
European Monitoring and Evaluation Programme (EMEP): EBAS database online, https://projects.nilu.no/ccc/index.html, last access: 5 February 2024.
Fang, T., Guo, H., Zeng, L., Verma, V., Nenes, A., and Weber, R. J.: Highly acidic ambient particles, soluble metals, and oxidative potential: a link between sulfate and aerosol toxicity, Environ. Sci. Technol., 51, 2611–2620, https://doi.org/10.1021/acs.est.6b06151, 2017.
Fountoukis, C. and Nenes, A.: ISORROPIA II: a computationally efficient thermodynamic equilibrium model for K+–Ca2+–Mg2+–NH–Na+–SO–NO–Cl−–H2O aerosols, Atmos. Chem. Phys., 7, 4639–4659, https://doi.org/10.5194/acp-7-4639-2007, 2007.
Fountoukis, C., Nenes, A., Sullivan, A., Weber, R., Van Reken, T., Fischer, M., Matías, E., Moya, M., Farmer, D., and Cohen, R. C.: Thermodynamic characterization of Mexico City aerosol during MILAGRO 2006, Atmos. Chem. Phys., 9, 2141–2156, https://doi.org/10.5194/acp-9-2141-2009, 2009.
Fu, X., Wang, S., Xing, J., Zhang, X., Wang, T., and Hao, J.: Increasing ammonia concentrations reduce the effectiveness of particle pollution control achieved via SO2 and NOX emissions reduction in east China, Environ. Sci. Tech. Let., 4, 221–227, https://doi.org/10.1021/acs.estlett.7b00143, 2017.
Grewe, V., Brunner, D., Dameris, M., Grenfell, J. L., Hein, R., Shindell, D., and Staehelin, J.: Origin and variability of upper tropospheric nitrogen oxides and ozone at northern mid-latitudes, Atmos. Environ., 35, 3421–3433, https://doi.org/10.1016/S1352-2310(01)00134-0, 2001.
Guo, H., Sullivan, A. P., Campuzano-Jost, P., Schroder, J. C., Lopez-Hilfiker, F. D., Dibb, J. E., Jimenez, J. L., Thornton, J. A., Brown, S. S., Nenes, A., and Weber, R. J.: Fine particle pH and the partitioning of nitric acid during winter in the northeastern United States, J. Geophys. Res.-Atmos., 121, 355–310, https://doi.org/10.1002/2016JD025311, 2016.
He, K., Yang, F., Ma, Y., Zhang, Q., Yao, X., Chan, C. K., Cadle, S., Chan, T., and Mulawa, P.: The characteristics of PM2.5 in Beijing, China, Atmos. Environ., 35, 4959–4970, https://doi.org/10.1016/S1352-2310(01)00301-6, 2001.
Héroux, M. E., Anderson, H. R., Atkinson, R., Brunekreef, B., Cohen, A., Forastiere, F., Hurley, F., Katsouyanni, K., Krewski, D., Krzyzanowski, M., and Künzli, N.: Quantifying the health impacts of ambient air pollutants: recommendations of a WHO/Europe project, Int. J. Public Health, 60, 619–627, https://doi.org/10.1007/s00038-015-0690-y, 2015.
Hersbach, H., Bell, B., Berrisford, P., Hirahara, S., Horanyi, A., Muñoz-Sabater, J., Nicolas, J., Peubey, C., Radu, R., Schepers, D., and Simmons, A.: The ERA5 global reanalysis, Q. J. Roy. Meteor. Soc., 146, 1999–2049, https://doi.org/10.1002/qj.3803, 2020.
Honour, S. L., Bell, J. N. B., Ashenden, T. W., Cape, J. N., and Power, S. A.: Responses of herbaceous plants to urban air pollution: effects on growth, phenology and leaf surface characteristics, Environ. Pollut., 157, 1279–1286, https://doi.org/10.1016/j.envpol.2008.11.049, 2009.
Interagency Monitoring of Protected Visual Environment (IMPROVE): Federal Land Manager Environmental Database, http://vista.cira.colostate.edu/Improve/improve-data/, last access: 5 February 2024.
Jacobson, M. Z., Tabazadeh, A., and Turco, R. P.: Simulating equilibrium within aerosols and nonequilibrium between gases and aerosols, J. Geophys. Res.-Atmos., 101, 9079–9091, https://doi.org/10.1029/96JD00348, 1996.
Jöckel, P., Sander, R., Kerkweg, A., Tost, H., and Lelieveld, J.: Technical Note: The Modular Earth Submodel System (MESSy) - a new approach towards Earth System Modeling, Atmos. Chem. Phys., 5, 433–444, https://doi.org/10.5194/acp-5-433-2005, 2005.
Jöckel, P., Tost, H., Pozzer, A., Brühl, C., Buchholz, J., Ganzeveld, L., Hoor, P., Kerkweg, A., Lawrence, M. G., Sander, R., Steil, B., Stiller, G., Tanarhte, M., Taraborrelli, D., van Aardenne, J., and Lelieveld, J.: The atmospheric chemistry general circulation model ECHAM5/MESSy1: consistent simulation of ozone from the surface to the mesosphere, Atmos. Chem. Phys., 6, 5067–5104, https://doi.org/10.5194/acp-6-5067-2006, 2006.
Jöckel, P., Tost, H., Pozzer, A., Kunze, M., Kirner, O., Brenninkmeijer, C. A. M., Brinkop, S., Cai, D. S., Dyroff, C., Eckstein, J., Frank, F., Garny, H., Gottschaldt, K.-D., Graf, P., Grewe, V., Kerkweg, A., Kern, B., Matthes, S., Mertens, M., Meul, S., Neumaier, M., Nützel, M., Oberländer-Hayn, S., Ruhnke, R., Runde, T., Sander, R., Scharffe, D., and Zahn, A.: Earth System Chemistry integrated Modelling (ESCiMo) with the Modular Earth Submodel System (MESSy) version 2.51, Geosci. Model Dev., 9, 1153–1200, https://doi.org/10.5194/gmd-9-1153-2016, 2016.
Kakavas, S., Pandis, S. N., and Nenes, A.: ISORROPIA-Lite: A Comprehensive Atmospheric Aerosol Thermodynamics Module for Earth System Models, Tellus B, 74, 1–23, https://doi.org/10.16993/tellusb.33, 2022.
Kakavas, S., Pandis, S. N., and Nenes, A.: Effects of simulated secondary organic aerosol water on PM1 levels and composition over the US, Atmos. Chem. Phys., 23, 13555–13564, https://doi.org/10.5194/acp-23-13555-2023, 2023.
Karydis, V. A., Tsimpidi, A. P., Fountoukis, C., Nenes, A., Zavala, M., Lei, W. F., Molina, L. T., and Pandis, S. N.: Simulating the fine and coarse inorganic particulate matter concentrations in a polluted megacity, Atmos. Environ., 44, 608–620, https://doi.org/10.1016/j.atmosenv.2009.11.023, 2010.
Karydis, V. A., Tsimpidi, A. P., Lei, W., Molina, L. T., and Pandis, S. N.: Formation of semivolatile inorganic aerosols in the Mexico City Metropolitan Area during the MILAGRO campaign, Atmos. Chem. Phys., 11, 13305–13323, https://doi.org/10.5194/acp-11-13305-2011, 2011.
Karydis, V. A., Tsimpidi, A. P., Pozzer, A., Astitha, M., and Lelieveld, J.: Effects of mineral dust on global atmospheric nitrate concentrations, Atmos. Chem. Phys., 16, 1491–1509, https://doi.org/10.5194/acp-16-1491-2016, 2016.
Karydis, V. A., Tsimpidi, A. P., Bacer, S., Pozzer, A., Nenes, A., and Lelieveld, J.: Global impact of mineral dust on cloud droplet number concentration, Atmos. Chem. Phys., 17, 5601–5621, https://doi.org/10.5194/acp-17-5601-2017, 2017.
Karydis, V. A., Tsimpidi, A. P., Pozzer, A., and Lelieveld, J.: How alkaline compounds control atmospheric aerosol particle acidity, Atmos. Chem. Phys., 21, 14983–15001, https://doi.org/10.5194/acp-21-14983-2021, 2021.
Kerkweg, A., Buchholz, J., Ganzeveld, L., Pozzer, A., Tost, H., and Jöckel, P.: Technical Note: An implementation of the dry removal processes DRY DEPosition and SEDImentation in the Modular Earth Submodel System (MESSy), Atmos. Chem. Phys., 6, 4617–4632, https://doi.org/10.5194/acp-6-4617-2006, 2006.
Kim, Y. P., Seinfeld, J. H., and Saxena, P.: Atmospheric gas-aerosol equilibrium I. Thermodynamic model, Aerosol Sci. Technol., 19, 157–181, https://doi.org/10.1080/02786829308959628, 1993.
Klingmüller, K., Metzger, S., Abdelkader, M., Karydis, V. A., Stenchikov, G. L., Pozzer, A., and Lelieveld, J.: Revised mineral dust emissions in the atmospheric chemistry–climate model EMAC (MESSy 2.52 DU_Astitha1 KKDU2017 patch), Geosci. Model Dev., 11, 989–1008, https://doi.org/10.5194/gmd-11-989-2018, 2018.
Klingmüller, K., Lelieveld, J., Karydis, V. A., and Stenchikov, G. L.: Direct radiative effect of dust–pollution interactions, Atmos. Chem. Phys., 19, 7397–7408, https://doi.org/10.5194/acp-19-7397-2019, 2019.
Klingmüller, K., Karydis, V. A., Bacer, S., Stenchikov, G. L., and Lelieveld, J.: Weaker cooling by aerosols due to dust–pollution interactions, Atmos. Chem. Phys., 20, 15285–15295, https://doi.org/10.5194/acp-20-15285-2020, 2020.
Kusik, C. L. and Meissner H. P.: Electrolyte Activity Coefficients in Inorganic Processing, AICHE Sym. S., 173, 14–20, 1978.
Lelieveld, J., Evans, J. S., Fnais, M., Giannadaki, D., and Pozzer, A.: The contribution of outdoor air pollution sources to premature mortality on a global scale, Nature, 525, 367–371, https://doi.org/10.1038/nature15371, 2015.
Lohmann, U. and Ferrachat, S.: Impact of parametric uncertainties on the present-day climate and on the anthropogenic aerosol effect, Atmos. Chem. Phys., 10, 11373–11383, https://doi.org/10.5194/acp-10-11373-2010, 2010.
Manisalidis, I., Stavropoulou, E., Stavropoulos, A., and Bezirtzoglou, E.: Environmental and health impacts of air pollution: a review, Frontiers in Public Health, 14, 8–14, https://doi.org/10.3389/fpubh.2020.00014, 2020.
Marais, E. A., Jacob, D. J., Jimenez, J. L., Campuzano-Jost, P., Day, D. A., Hu, W., Krechmer, J., Zhu, L., Kim, P. S., Miller, C. C., Fisher, J. A., Travis, K., Yu, K., Hanisco, T. F., Wolfe, G. M., Arkinson, H. L., Pye, H. O. T., Froyd, K. D., Liao, J., and McNeill, V. F.: Aqueous-phase mechanism for secondary organic aerosol formation from isoprene: application to the southeast United States and co-benefit of SO2 emission controls, Atmos. Chem. Phys., 16, 1603–1618, https://doi.org/10.5194/acp-16-1603-2016, 2016.
Meissner, H. P. and Peppas, N. A.: Activity coefficients – aqueous solutions of polybasic acids and their salts, AICHE J., 19, 806–809, https://doi.org/10.1002/aic.690190419, 1973.
Metzger, S., Dentener, F., Pandis, S., and Lelieveld, J.: Gas/aerosol partitioning, 1, A computationally efficient model, J. Geophys. Res.-Atmos., 107, 16–24, https://doi.org/10.1029/2001JD001102, 2002.
Miinalainen, T., Kokkola, H., Lehtinen, K. E., and Kühn, T.: Comparing the radiative forcings of the anthropogenic aerosol emissions from Chile and Mexico, J. Geophys. Res.-Atmos., 126, 10, https://doi.org/10.1029/2020JD033364, 2021.
Myhre, G., Samset, B. H., Schulz, M., Balkanski, Y., Bauer, S., Berntsen, T. K., Bian, H., Bellouin, N., Chin, M., Diehl, T., Easter, R. C., Feichter, J., Ghan, S. J., Hauglustaine, D., Iversen, T., Kinne, S., Kirkevåg, A., Lamarque, J.-F., Lin, G., Liu, X., Lund, M. T., Luo, G., Ma, X., van Noije, T., Penner, J. E., Rasch, P. J., Ruiz, A., Seland, Ø., Skeie, R. B., Stier, P., Takemura, T., Tsigaridis, K., Wang, P., Wang, Z., Xu, L., Yu, H., Yu, F., Yoon, J.-H., Zhang, K., Zhang, H., and Zhou, C.: Radiative forcing of the direct aerosol effect from AeroCom Phase II simulations, Atmos. Chem. Phys., 13, 1853–1877, https://doi.org/10.5194/acp-13-1853-2013, 2013.
Nenes, A., Pandis, S. N., and Pilinis, C.: ISORROPIA: A new thermodynamic equilibrium model for multiphase multicomponent inorganic aerosols, Aquat. Geochem., 4, 123–152, https://doi.org/10.1023/A:1009604003981, 1998.
Nenes, A., Pandis, S. N., Weber, R. J., and Russell, A.: Aerosol pH and liquid water content determine when particulate matter is sensitive to ammonia and nitrate availability, Atmos. Chem. Phys., 20, 3249–3258, https://doi.org/10.5194/acp-20-3249-2020, 2020.
Pilinis, C. and Seinfeld, J. H.: Continued development of a general equilibrium model for inorganic multicomponent atmospheric aerosols, Atmos. Environ., 21, 2453–2466, https://doi.org/10.1016/0004-6981(87)90380-5, 1987.
Pope, C. A., Burnett, R. T., Turner, M. C., Cohen, A., Krewski, D., Jerrett, M., Gapstur, S. M., and Thun, M. J.: Lung cancer and cardiovascular disease mortality associated with ambient air pollution and cigarette smoke: shape of the exposure–response relationships, Environ. Health Persp., 119, 1616–1621, https://doi.org/10.1289/ehp.1103639, 2011.
Pozzer, A., Jöckel, P., Sander, R., Williams, J., Ganzeveld, L., and Lelieveld, J.: Technical Note: The MESSy-submodel AIRSEA calculating the air-sea exchange of chemical species, Atmos. Chem. Phys., 6, 5435–5444, https://doi.org/10.5194/acp-6-5435-2006, 2006.
Pringle, K. J., Tost, H., Message, S., Steil, B., Giannadaki, D., Nenes, A., Fountoukis, C., Stier, P., Vignati, E., and Lelieveld, J.: Description and evaluation of GMXe: a new aerosol submodel for global simulations (v1), Geosci. Model Dev., 3, 391–412, https://doi.org/10.5194/gmd-3-391-2010, 2010a.
Pringle, K. J., Tost, H., Metzger, S., Steil, B., Giannadaki, D., Nenes, A., Fountoukis, C., Stier, P., Vignati, E., and Lelieveld, J.: Corrigendum to ”Description and evaluation of GMXe: a new aerosol submodel for global simulations (v1)” published in Geosci. Model Dev., 3, 391–412, 2010, Geosci. Model Dev., 3, 413–413, https://doi.org/10.5194/gmd-3-413-2010, 2010b.
Putaud, J. P., Van Dingenen, R., Alastuey, A., Bauer, H., Birmili, W., Cyrys, J., Flentje, H., Fuzzi, S., Gehrig, R., Hansson, H. C., and Harrison, R. M.: A European aerosol phenomenology–3: Physical and chemical characteristics of particulate matter from 60 rural, urban, and kerbside sites across Europe, Atmos. Environ., 44, 1308–1320, https://doi.org/10.1016/j.atmosenv.2009.12.011, 2010.
Roeckner, E., Brokopf, R., Esch, M., Giorgetta, M., Hagemann, S., Kornblueh, L., Manzini, E., Schlese, U., and Schulzweida, U.: Sensitivity of simulated climate to horizontal and vertical resolution in the ECHAM5 atmosphere model, J. Climate, 19, 3771–3791, https://doi.org/10.1175/JCLI3824.1, 2006.
Saiz-Lopez, A. and von Glasow, R.: Reactive halogen chemistry in the troposphere, Chem. Soc. Rev., 41, 6448–6472, https://doi.org/10.1039/C2CS35208G, 2012.
Sander, R., Baumgaertner, A., Cabrera-Perez, D., Frank, F., Gromov, S., Grooß, J.-U., Harder, H., Huijnen, V., Jöckel, P., Karydis, V. A., Niemeyer, K. E., Pozzer, A., Riede, H., Schultz, M. G., Taraborrelli, D., and Tauer, S.: The community atmospheric chemistry box model CAABA/MECCA-4.0, Geosci. Model Dev., 12, 1365–1385, https://doi.org/10.5194/gmd-12-1365-2019, 2019.
Savoie, D. L. and Prospero, J.: Particle size distribution of nitrate and sulfate in the marine atmosphere, Geophys. Res. Lett., 9, 1207–1210, https://doi.org/10.1029/GL009i010p01207, 1982.
Saxena, P., Hudischewskyj, A. B., Seigneur, C., and Seinfeld, J. H.: A comparative study of equilibrium approaches to the chemical characterization of secondary aerosols, Atmos. Environ., 20, 1471–1483, https://doi.org/10.1016/0004-6981(86)90019-3, 1986.
Seinfeld, J. H. and Pandis, S. N.: Atmospheric chemistry and physics: from air pollution to climate change, John Wiley & Sons, ISBN 1118947401, 2016.
Silva, P. J., Vawdrey, E. L., Corbett, M., and Erupe, M.: Fine particle concentrations and composition during wintertime inversions in Logan, Utah, USA, Atmos. Environ., 41, 5410–5422, https://doi.org/10.1016/j.atmosenv.2007.02.016, 2007.
Song, S., Gao, M., Xu, W., Shao, J., Shi, G., Wang, S., Wang, Y., Sun, Y., and McElroy, M. B.: Fine-particle pH for Beijing winter haze as inferred from different thermodynamic equilibrium models, Atmos. Chem. Phys., 18, 7423–7438, https://doi.org/10.5194/acp-18-7423-2018, 2018.
Szopa, S., Naik, V., Adhikary, B., Artaxo, P., Berntsen, T., Collins, W. D., Fuzzi, S., Gallardo, L., Kiendler-Scharr, A., Klimont, Z., Liao, H., Unger, N., and Zanis, P.: Short-Lived Climate Forcers. In Climate Change 2021: The Physical Science Basis, Contribution of Working Group I to the Sixth Assessment Report of the Intergovernmental Panel on Climate Change, edited by: Masson-Delmotte, V., Zhai, P., Pirani, A., Connors, S. L., Péan, C., Berger, S., Caud, N., Chen, Y., Goldfarb, L., Gomis, M. I., Huang, M., Leitzell, K., Lonnoy, E., Matthews, J. B. R., Maycock, T. K., Waterfield, T., Yelekçi, O., Yu, R., and Zhou, B., Cambridge University Press, Cambridge, United Kingdom and New York, NY, USA, 817–922, https://doi.org/10.1017/9781009157896.008, 2021.
Tang, Y. S., Flechard, C. R., Dämmgen, U., Vidic, S., Djuricic, V., Mitosinkova, M., Uggerud, H. T., Sanz, M. J., Simmons, I., Dragosits, U., Nemitz, E., Twigg, M., van Dijk, N., Fauvel, Y., Sanz, F., Ferm, M., Perrino, C., Catrambone, M., Leaver, D., Braban, C. F., Cape, J. N., Heal, M. R., and Sutton, M. A.: Pan-European rural monitoring network shows dominance of NH3 gas and NH4NO3 aerosol in inorganic atmospheric pollution load, Atmos. Chem. Phys., 21, 875–914, https://doi.org/10.5194/acp-21-875-2021, 2021.
Tarin-Carrasco, P., Im, U., Geels, C., Palacios-Peña, L., and Jiménez-Guerrero, P.: Contribution of fine particulate matter to present and future premature mortality over Europe: A non-linear response, Environ. Int., 153, 106517, https://doi.org/10.1016/j.envint.2021.106517, 2021.
The Acid Deposition Monitoring Network in East Asia: EANET Data on the Acid Deposition in the East Asian Region, https://monitoring.eanet.asia/document/public/index, last access: 5 February 2024.
The MESSy Consortium: The Modular Earth Submodel System (2.55.2_842-isorropia-light), Zenodo [code], https://doi.org/10.5281/zenodo.8379120, 2023.
Tost, H., Jöckel, P., Kerkweg, A., Sander, R., and Lelieveld, J.: Technical note: A new comprehensive SCAVenging submodel for global atmospheric chemistry modelling, Atmos. Chem. Phys., 6, 565–574, https://doi.org/10.5194/acp-6-565-2006, 2006.
Tost, H., Jöckel, P., Kerkweg, A., Pozzer, A., Sander, R., and Lelieveld, J.: Global cloud and precipitation chemistry and wet deposition: tropospheric model simulations with ECHAM5/MESSy1, Atmos. Chem. Phys., 7, 2733–2757, https://doi.org/10.5194/acp-7-2733-2007, 2007.
Tsimpidi, A. P., Karydis, V. A., and Pandis, S. N.: Response of Inorganic Fine Particulate Matter to Emission Changes of Sulfur Dioxide and Ammonia: The Eastern United States as a Case Study, J. Air Waste Manage., 57, 1489–1498, https://doi.org/10.3155/1047-3289.57.12.1489, 2007.
Tsimpidi, A. P., Karydis, V. A., Pozzer, A., Pandis, S. N., and Lelieveld, J.: ORACLE (v1.0): module to simulate the organic aerosol composition and evolution in the atmosphere, Geosci. Model Dev., 7, 3153–3172, https://doi.org/10.5194/gmd-7-3153-2014, 2014.
Tsimpidi, A. P., Karydis, V. A., Pozzer, A., Pandis, S. N., and Lelieveld, J.: ORACLE 2-D (v2.0): an efficient module to compute the volatility and oxygen content of organic aerosol with a global chemistry–climate model, Geosci. Model Dev., 11, 3369–3389, https://doi.org/10.5194/gmd-11-3369-2018, 2018.
U.S. Environmental Protection Agency Clean Air Markets Division Clean Air Status and Trends Network (CASTNET): CASTNET Data, https://www.epa.gov/castnet, last access: 5 February 2024.
van der Werf, G. R., Randerson, J. T., Giglio, L., Collatz, G. J., Mu, M., Kasibhatla, P. S., Morton, D. C., DeFries, R. S., Jin, Y., and van Leeuwen, T. T.: Global fire emissions and the contribution of deforestation, savanna, forest, agricultural, and peat fires (1997–2009), Atmos. Chem. Phys., 10, 11707–11735, https://doi.org/10.5194/acp-10-11707-2010, 2010.
Vignati, E., Wilson, J., and Stier, P.: M7: An efficient size-resolved aerosol microphysics module for large-scale aerosol transport models, J. Geophys. Res.-Atmos., 109, D22, https://doi.org/10.1029/2003JD004485, 2004.
Weagle, C. L., Snider, G., Li, C., Van Donkelaar, A., Philip, S., Bissonnette, P., Burke, J., Jackson, J., Latimer, R., and Stone, E.: Global sources of fine particulate matter: interpretation of PM2.5 chemical composition observed by SPARTAN using a global chemical transport model, Environ. Sci. Technol., 52, 11670–11681, https://doi.org/10.1021/acs.est.8b01658, 2018.
Wexler, A. S. and Clegg, S. L.: Atmospheric aerosol models for systems including the ions H+, NH, Na+, SO, NO, Cl−, Br−, and H2O, J. Geophys. Res.-Atmos., 107, ACH-14, https://doi.org/10.1029/2001JD000451, 2002.
Wexler, A. S. and Seinfeld, J. H.: Second-generation inorganic aerosol model, Atmos. Environ. A.-Gen., 25, 2731–2748, https://doi.org/10.1016/0960-1686(91)90203-J, 1991.
Wolff, G. T.: On the nature of nitrate in coarse continental aerosols, Atmos. Environ., 18, 977–981, https://doi.org/10.1016/0004-6981(84)90073-8, 1984.
World Health Organization: Ambient (outdoor) air pollution, https://www.who.int/news-room/fact-sheets/detail/ambient-(outdoor)-air-quality-and-health, last access: 19 December 2022.
Xu, G., Zhang, Q., Yao, Y., and Zhang, X.: Changes in PM2.5 sensitivity to NOx and NH3 emissions due to a large decrease in SO2 emissions from 2013 to 2018, Atmos. Ocean. Sc. Lett., 13, 210–215, https://doi.org/10.1080/16742834.2020.1738009, 2020.
Yan, W., Topphoff, M., Rose, C., and Gmehling, J.: Prediction of vapor–liquid equilibria in mixed-solvent electrolyte systems using the group contribution concept, Fluid Phase Equilibr., 162, 97–113, https://doi.org/10.1016/S0378-3812(99)00201-0, 1999.
Yienger, J. J. and Levy, H.: Empirical model of global soil-biogenic NOx emissions, J. Geophys. Res.-Atmos., 100, 11447–11464, https://doi.org/10.1029/95JD00370, 1995.
Zakoura, M. and Pandis, S. N.: Overprediction of aerosol nitrate by chemical transport models: The role of grid resolution Atmos. Environ., 187, 390–400, https://doi.org/10.1016/j.atmosenv.2018.05.066, 2018.
Zuend, A., Marcolli, C., Luo, B. P., and Peter, T.: A thermodynamic model of mixed organic-inorganic aerosols to predict activity coefficients, Atmos. Chem. Phys., 8, 4559–4593, https://doi.org/10.5194/acp-8-4559-2008, 2008.
Zuend, A., Marcolli, C., Booth, A. M., Lienhard, D. M., Soonsin, V., Krieger, U. K., Topping, D. O., McFiggans, G., Peter, T., and Seinfeld, J. H.: New and extended parameterization of the thermodynamic model AIOMFAC: calculation of activity coefficients for organic-inorganic mixtures containing carboxyl, hydroxyl, carbonyl, ether, ester, alkenyl, alkyl, and aromatic functional groups, Atmos. Chem. Phys., 11, 9155–9206, https://doi.org/10.5194/acp-11-9155-2011, 2011.
- Abstract
- Introduction
- Model configuration
- Evaluation of new aerosol thermodynamic modules within EMAC
- Comparison of ISORROPIA-lite against ISORROPIA II in stable mode
- Conclusions
- Code and data availability
- Author contributions
- Competing interests
- Disclaimer
- Acknowledgements
- Financial support
- Review statement
- References
- Supplement