the Creative Commons Attribution 4.0 License.
the Creative Commons Attribution 4.0 License.
 | 01 Aug 2023
The development and validation of the Inhomogeneous Wind Scheme for Urban Street (IWSUS-v1)
Zhenxin Liu
Yuanhao Chen
Yuhang Wang
Cheng Liu
Shuhua Liu
Hong Liao
The layout of urban buildings shows significant heterogeneity, which leads to the significant spatial inhomogeneity of the wind field in and over the canopy of urban street canyons. However, most of the current urban canopy models do not fully consider the heterogeneity of the urban canopy. Large discrepancies thus exist between the wind speeds simulated by the current urban canopy models and those observed in the street canyon. In this study, a parameterization scheme for wind fields, Inhomogeneous Wind Scheme for Urban Street (IWSUS), is developed to better characterize the heterogeneity of the urban canopy. We use a computational fluid dynamics method to generate the IWSUS scheme and compare it with observations of the wind profile and turbulent flux in and over the street canyon for validation. In IWSUS, the wind speed vertical profiles at six representative positions located in a typical street canyon (i.e., the windward or leeward side of a long straight street or the inflow or outflow end) are parameterized separately. The wind profile by IWSUS thus can better describe the horizontal heterogeneity of the urban near-surface wind field, e.g., the dynamic drag effect of buildings in the lower atmospheric layer over the urbanized land use. The validation based on observations shows that the performance of simulation results by IWSUS is better than that by the exponential–logarithmic (exp-log) law widely used in the current urban schemes. We consider typical building arrangement and specific street orientations in IWSUS for wind field simulations, which can better match the distribution characteristics of street canyons around the observation point in the street canyon. The averaged wind profiles and turbulence energy fluxes in the model grids of urban areas by IWSUS are also nearer to the observations than those by the exp-log law. The normalized mean errors (NMEs) between the simulated and the observed vertical average wind speed are 49.0 % for IWSUS and 56.1 % for exp-log law in the range from the ground to 4 times the average height of the buildings and 70 % for IWSUS and 285.8 % for exp-log law in the street canyon (range from the ground to building top). This study proves that the accuracy of simulations of land surface processes and near-ground meteorological processes over the urban canopy can be improved by fully considering the heterogeneity of the urban canopy layout structures and the inhomogeneity of wind field distributions in and over the street canyon. IWSUS is expected to be coupled with mesoscale atmospheric models to improve the accuracy of the wind field, land surface energy budget, meteorological and atmospheric chemistry simulations.
- Article
(5825 KB) - Full-text XML
-
Supplement
(1283 KB) - BibTeX
- EndNote


The wind speed in the planetary boundary layer (PBL) is one of the key meteorological factors affecting the land surface energy balance, regional weather and climate, as well as the distribution of near-surface atmospheric pollutants (Xu et al., 2015; Deng et al., 2018; Peng et al., 2021). Urbanization causes complex canopy structures based on the building–street canyon unit, which are quite different from the natural vegetation-soil type canopy (Ren et al., 2015; Zhu et al., 2017; Paul et al., 2018; Colter et al., 2019). The complex shapes and arrangement of urban buildings lead to the great complexity in the distributions of the wind and turbulence field and show the obvious spatial inhomogeneity of the three-dimensional wind field in and over the street canyons (Li et al., 2018, 2020). The inhomogeneous wind field in and over the urban street canyon not only leads to quite complex characteristics of momentum and mass fluxes over the urbanized urban land cover (Ryu and Baik, 2013; Ganbat et al., 2014a, b) but also causes the significant spatial variation in air pollutant concentration in urban street canyons (Haman et al., 2012; Banks et al., 2015; Miao et al., 2015; Huang et al., 2017; Jaenicke et al., 2017; Miao and Liu, 2019; De Arruda Moreira et al., 2020; Yang et al., 2021).
The wind parameterization schemes for the urban area applied in most of the current air quality models have not fully considered the heterogeneity of the urban canopy layout structures; thus the inhomogeneity of the wind field in and over the urban canopy has not been fully considered either (Masson, 2000; Kusaka et al., 2001; Kadaverugu et al., 2019; Masson et al., 2020). The classical exponential–logarithmic (exp-log) profile schemes widely applied in those simulations are based on the hypothesis of homogeneity in the horizontal (Masson, 2000; Martilli, 2002), which produces the averaged wind field in the model grid points of the urban land surface. But it is unreasonable to directly compare the wind field simulated by the exp-log law with the observations, since the observation spots located in the urban street canyon are affected by the inhomogeneous airflow field, caused by the layout distribution of surrounding buildings. The measurement experiments set up (Sha et al., 2021) in Nanjing showed the variations in observed surface energy flux in different locations over the urban canopy, which proves the heterogeneity of energy flux over the different representative positions of the urban canopy, e.g., on building roofs or the street canyon. The inconsistency of spatial representativeness between the point observations and the model grid simulation results leads to significant differences in their numerical values. This deviations between the simulations and observations in and over the urban canopy can be found in both meteorological and chemical process modeling studies, e.g., the intensity of the urban heat island (UHI) and nocturnal stability properties of the PBL (Nair, 2011; Kusaka et al., 2012; Schubert and Grossman-Clarke, 2014; Miao et al., 2015; Ren et al., 2019a, b). Husain et al. showed that the Town Energy Budget (TEB) scheme produced a lower daytime maximum and a higher nighttime minimum for temperature simulations in urban regions and overestimated UHI during the late evening hours (Husain et al., 2013). Thus the near-ground pollutant concentrations during the heavy air pollution events in simulations are overestimated in urban areas (Fallmann et al., 2016; Santiago et al., 2020; Xue et al., 2021). Studies suggest that these simulation errors in near-surface pollution concentration mainly come from the inaccurate simulation of near-surface atmospheric environmental capacity by the model, which is due to the fact that the model cannot simulate the energy distribution and dynamic characteristics of the urban surface canopy well (Saiz-Lopez et al., 2007; Baklanov et al., 2011; Harrison, 2018; Khalil, 2018; Chen et al., 2020).
In summary, a scheme that fully considers the heterogeneity of the wind field caused by the heterogeneous urban canopy structure is very important for further accurate simulation of meteorological processes (Sützl et al., 2020), the surface fluxes (Sha et al., 2021), the PBL atmospheric conditions (Miao et al., 2009; Thatcher and Hurley, 2011; Miao and Chen, 2014), and also the air pollution in and around the urban regions (Liu et al., 2020, 2021).
In the present study, we developed the Inhomogeneous Wind Scheme for Urban Street (IWSUS) to fully describe the heterogeneous characteristics of the wind field in and over the urban canopy. Firstly, a typical building–street layout model was constructed by using computational fluid dynamics (CFD) method, and the three-dimensional wind fields inside and above the street canyon were solved under the initial and boundary conditions of different background wind directions and street canyon geometric parameters. Then the characteristic vertical wind profiles were parameterized over six representative positions in the typical street canyon and finally summarized to be the IWSUS scheme. Moreover, the wind profile simulations by IWSUS were verified and corrected by using the wind profile observation data in a street canyon. The validations of IWSUS were also set up by comparing observed vertical wind profiles and surface fluxes with those calculated based on IWSUS.
The brief introductions of the observations and the CFD methods can be found in Sect. 2.1 and 2.2; the initialization settings of the scheme and the introduction of the regression method are described in Sect. 2.3. The parameterization results and discussions are in Sect. 3, and the validation of IWSUS is in Sect. 4. Then the conclusions are given in Sect. 5.
2.1 CFD model description
The CFD method was applied in study to analyze how the geometric characteristics of the street canyon influence the wind field in and over the urban canopy. A series of numerical experiments were set up in the street canyon scenario by the CFD model OpenFOAM-v8 (https://openfoam.org/, last access: 1 September 2020), in which the average street width and building height were set as the control variables. The Navier–Stokes equations with the standard k–ε turbulence closure scheme were solved by the following equations, and the wind velocity and turbulence vertical profiles in the six special locations were obtained:
where ui is the ith component of wind velocity, p* is the modified mean kinematic pressure, νeff is the effective kinematic viscosity which is expressed as with ν for molecular viscosity, νt is turbulence viscosity expressed as , k represents turbulent kinematic energy, and ε is turbulent dissipation. Meanwhile, the k–ε model contains five empirical constants in Eqs. (3) and (4), and the values are listed as follows: , and σε=1.3.
2.2 Simulation initial setup
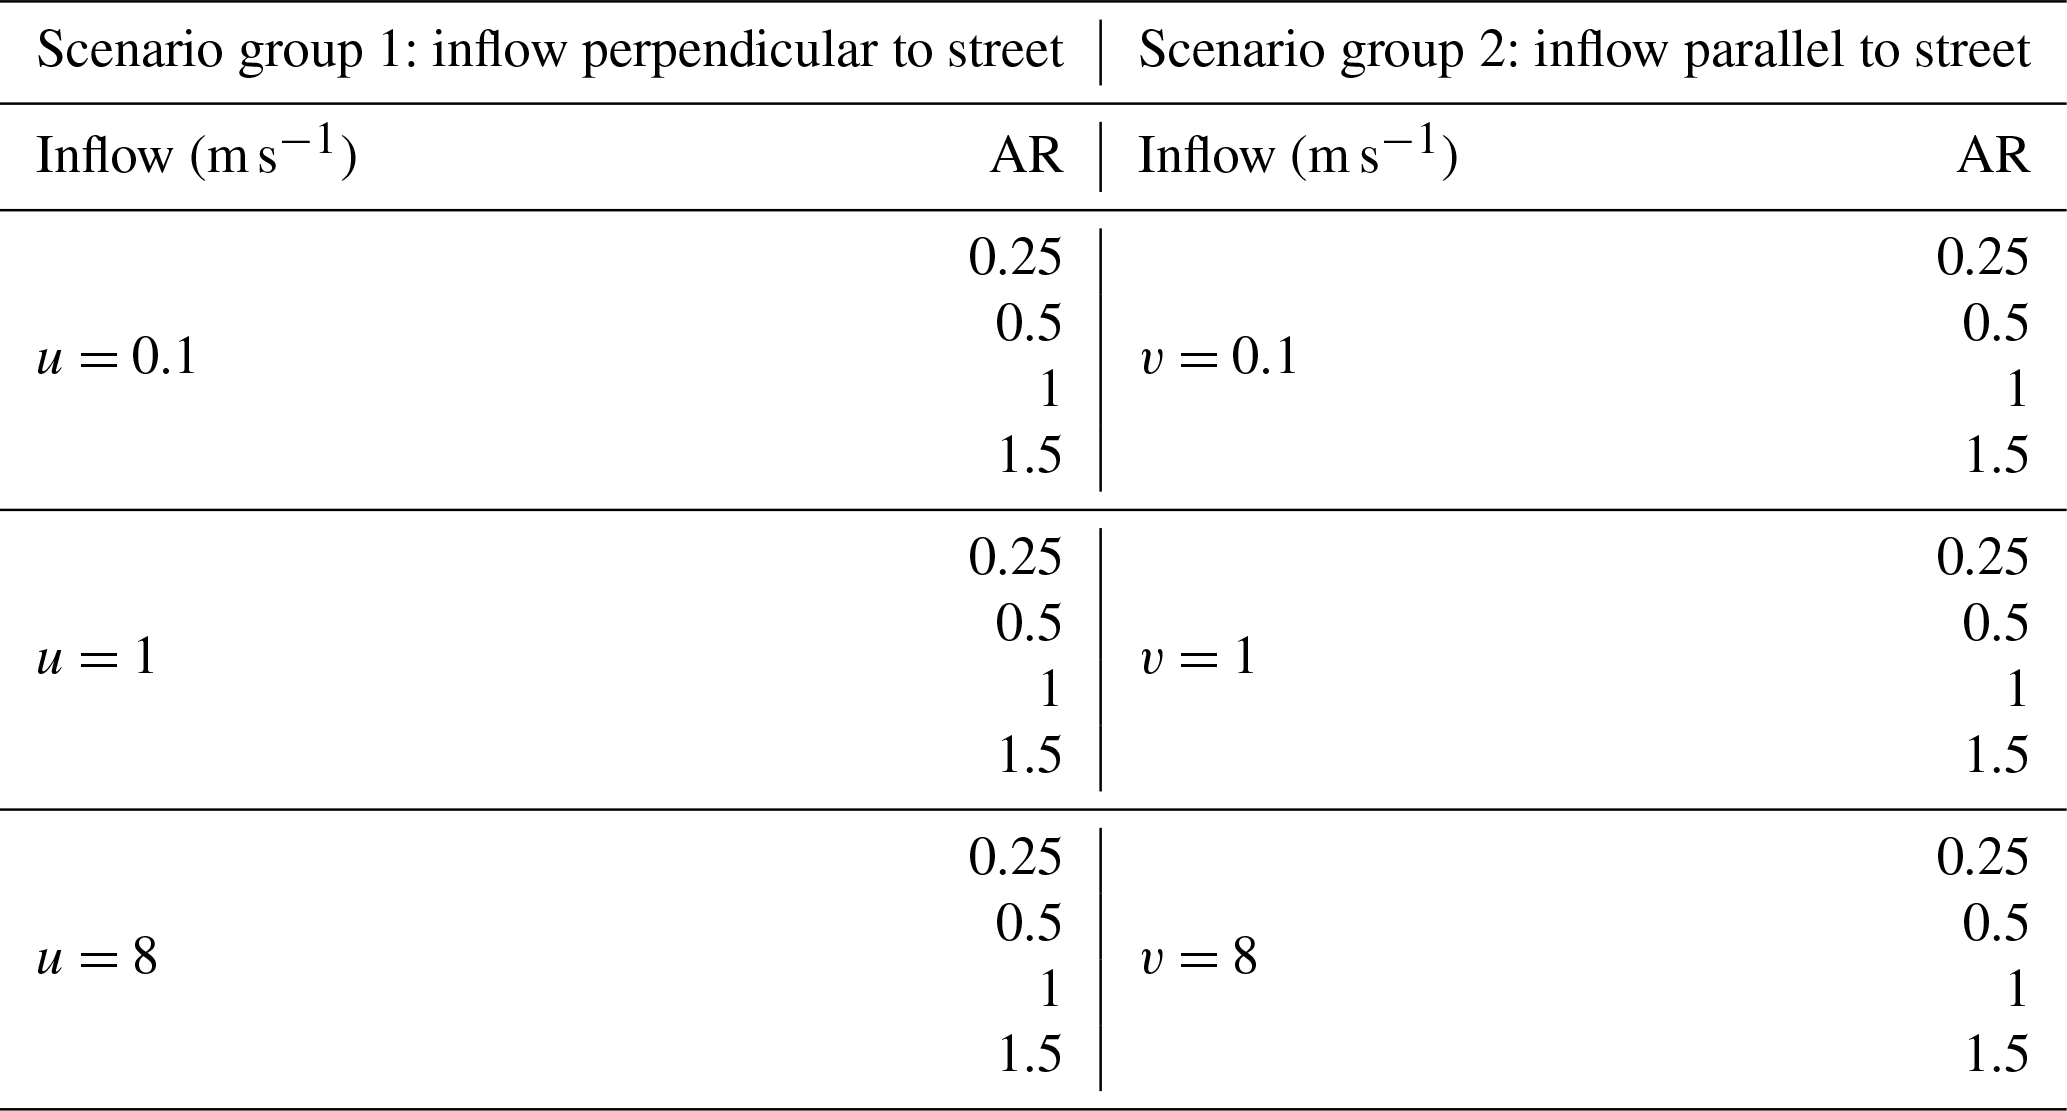
A typical geometric structure for a basic unit of the urban street–building canyon was set up in the OpenFOAM-v8 model. As shown in Fig. 1a, the average height (defined as H for short) and width (W) of buildings and orientation of the street canyon are the key parameters to define the structure. We set length of buildings, width of buildings and width of streets as constants in this research, which were 30, 5 and 20 m, respectively. The aspect ratio (AR) factor, defined as the ratio of building height (H) to street width (W), was used to represent the degree of urban development. AR is a key factor that affects the wind fields in and over the street canyon, as well as the background wind speed. We conducted numerical sensitivity simulations for wind speed and AR factor.
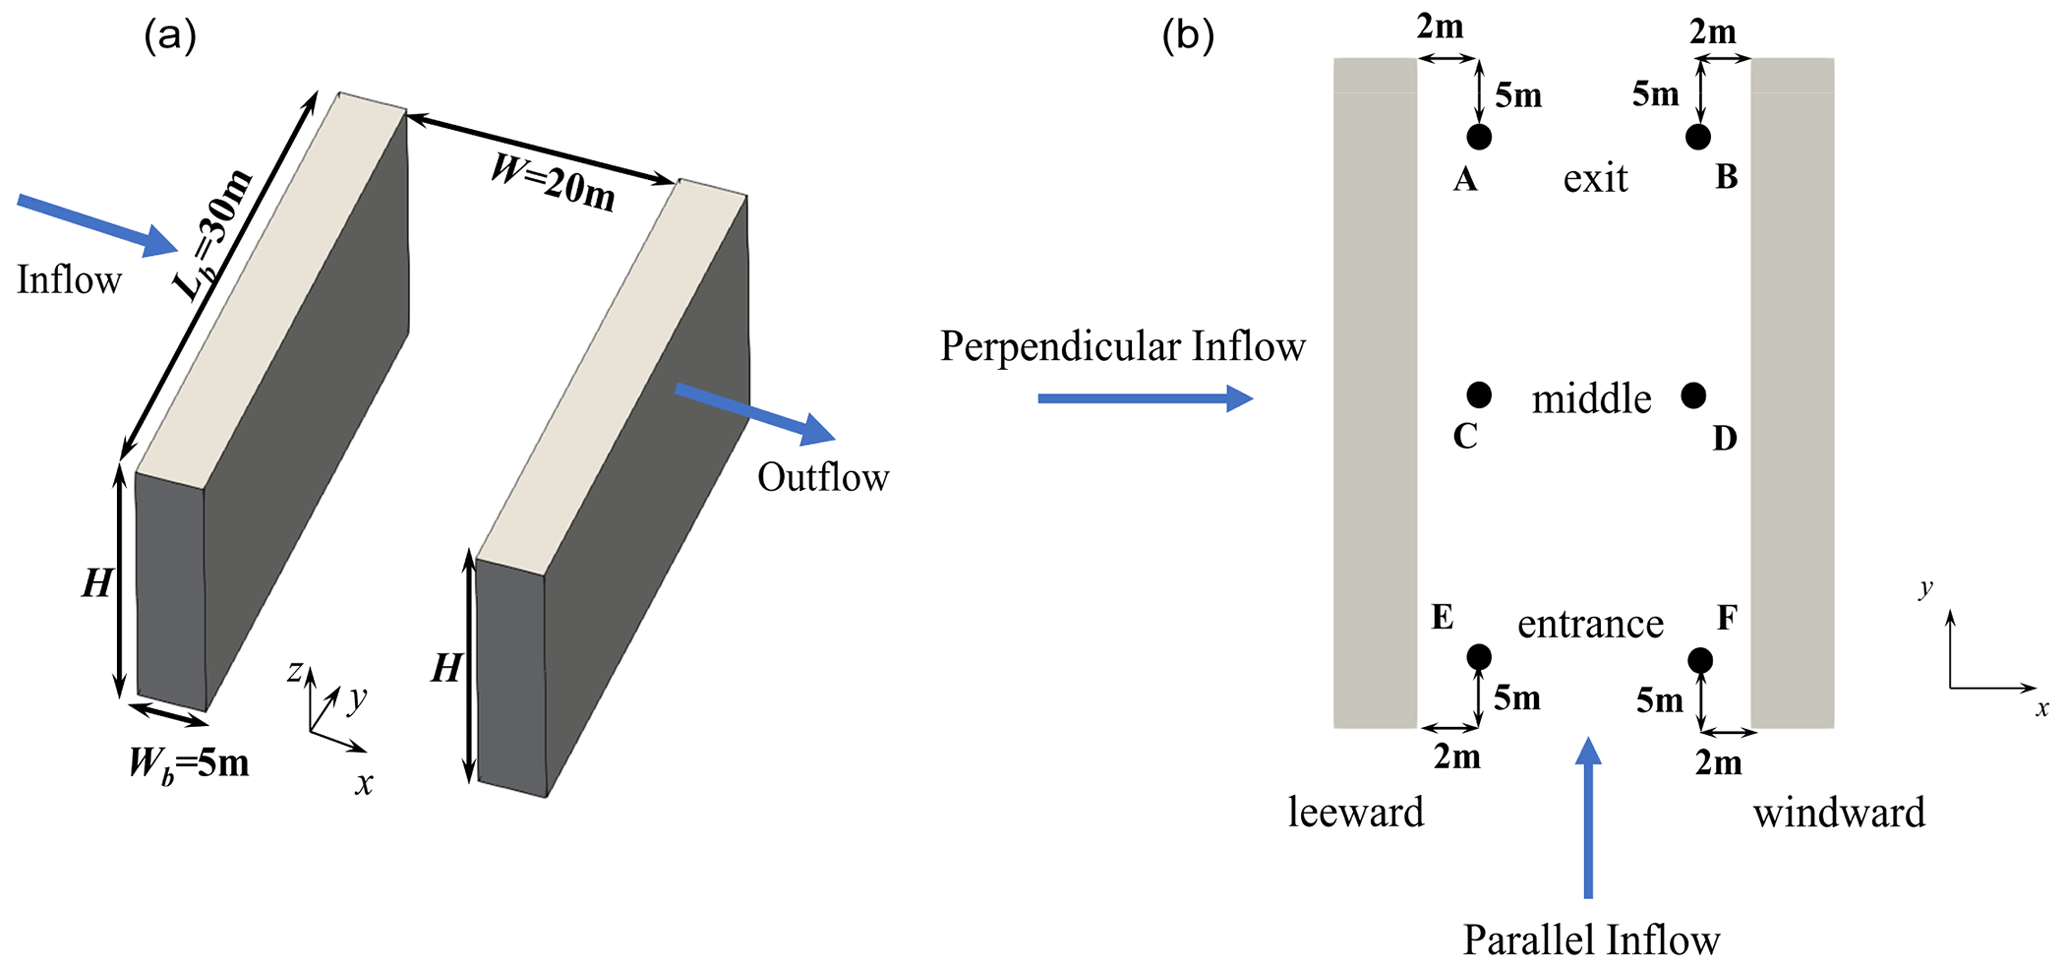
Figure 1The conceptual figure of a typical street canyon and its geometrical parameter initialization. (a) The blue arrows denote the inflow perpendicular to the street canyon. (b) Schematic diagram of six representative positions in the street canyon. A, C and E are on the leeward side and B, D and F on the windward. For oblique inflow, E and F are on the entrance side, A and B on the exit side, and C and D in the middle of the street canyon; the vertical wind profiles over these representative positions are considered to be different from each other.
As the direction of the background wind also influences the wind within the street canyon, we initialized the background wind speed in simulations as the inflow perpendicular (u in x direction) to the orientation of the street canyon. The wind speed was initialized to be 0.1, 1, or 8 m s−1 as the inlet boundary condition in OpenFOAM in different scenarios. The k and ε in the inflow boundary are determined by and , respectively, where I is the turbulent strength and l is the turbulent characteristic length scale. The no-slip boundary is applied in the ground and building walls, and the other boundaries are all set to be zero gradient. The settings of boundary conditions in this study are widely used in urban street CFD simulations, which are validated by wind tunnel experiments (Ai and Mak, 2017, 2018; Huang et al., 2019; Mirzaei, 2021). All the initialization settings for every scenario set in CFD cases are summarized in Table 1. The domain size Lx × Ly × Lz is 200 m × 100 m × 50 m. The grid resolution in CFD modeling was set to be 1 m in all scenarios. The street orientation, lateral and vertical directions are marked as y, x and z, respectively. In mesoscale atmospheric models, the lowest layer of the free atmosphere is often set as about 1.5–2 times the average height of the urban canopy. Since IWSUS will be mainly applied in the mesoscale models, the vertical height of the domain is set as 50 m in our CFD experiments to match with the requirements in the mesoscale model.
Table 1Initial parameters set for a typical street canyon modeled in OpenFOAM.
As shown in Fig. 1b, we select six typical locations (shown as the points from A to F in Fig. 1b) in simulating the street canyon in CFD to represent the typical positions in the street with different aerodynamic characteristics affected by the arrangement of building layouts. The vertical wind profiles over these positions are also considered to be different from each other. The simulated street canyon in CFD is divided into three sections along the running direction: entrance, middle and exit. In each section, one point is selected on each side of the street buildings to represent the windward and leeward wind component of three dimensions. The vertical wind profiles of wind speed components (u, v) at these six typical locations are parameterized and fitted into parameterization equations and can be categorized by different ARs and inflow directions.
In each simulation scenario, the vertical wind profiles over the six typical locations were abstracted from the CFD simulations and fitted by empirical functions. The AR of the street canyon, wind velocity (v) and a series of land surface parameters are the key factors of parameterization expressions. Finally, the cluster of vertical wind profiles on the modeling locations A–F were employed in the IWSUS scheme. IWSUS is developed to improve the simulation accuracy of vertical wind profiles in and over the urban canopy by considering the spatial inhomogeneous of the urban canopy well.
2.3 The definition of the key variables in model
2.3.1 The vertical wind profile ( Utop and Ucan) in exponential–logarithmic law
The exp-log law wind profile is widely used in wind field parameterization simulations for scenarios with an open and flat natural underlying surface, which is considered horizontally uniform. The exp-log wind profile is applied in scenarios of urban street canyons, where the logarithmic and exponential parts are bounded by the displacement height, which are set as two-thirds of buildings' average heights (Masson, 2000). In this wind profile scheme, the wind velocity at canyon top (Utop) and the one in the urban canyon (Ucan) are given by Eqs. (5) and (6):
where H is the average height of building rooftops, z0town is dynamic roughness length for the canyon system, Δz is the height from building roofs to the first atmospheric model level, Ua is the wind velocity at the first level of atmospheric model and AR is aspect ratio.
In this paper, the wind speed profiles by the IWSUS scheme are compared with those by the exponential–logarithmic law (exp-log law) in this section.
2.3.2 The surface turbulence resistance
The surface turbulence resistance (RES) is the key important variable in the urban canopy model, which mainly affects the surface energy flux and near-ground meteorological processes. In IWSUS the RES is calculated based on the vertical profile of wind speed, and this method is also widely used in most of the current land surface models. As shown in Eq. (7), the RES by empirical formula in Masson (2000) is expressed as
where Ucan and Wcan are the horizontal and vertical wind speeds within the street canyon. To calculate the flux from the overall urban canopy, Eqs. (8) and (9) are first applied to integrate the overall RES within the urban grid in the land surface model.
where subscript surf stands for the surface of walls, impervious land and building roof, and H is building heights. Considering the different wind conditions, the weighted sum for two orthogonal inlet conditions, perpendicular and parallel to the street orientation which are set as the base, is applied for RES estimation.
2.3.3 The sensible heat flux over the surfaces
Furthermore, the daily variation in sensible heat flux is also the key index to evaluate the performance of the urban canopy model. The sensible heat fluxes can be calculated based on the RES above and the temperature over each surface in the urban canopy, e.g., paved and unpaved land surface, surface of building roofs, wall on the sun side, wall on the shaded side, and separately. The simulated sensible heat fluxes both in IWSUS and other urban models are calculated following Eqs. (10) to (12) (Masson, 2000):
where is heat capacity of dry air, ρ is air density and amb refers to the air above building roofs.
2.4 Observation dataset
A site observation was set up, and the data of wind speed were collected and applied in this study: the tower samples of the vertical wind profile carried out in the urban canyon and above the building roofs of Nanjing, China, during 22–25 December 2017 (Liu et al., 2020, 2021). The location and surrounding environment of the site are shown in Fig. 2. As is shown in Fig. 1 the experimental observation site is located on a typical urban built-up surface with buildings' orientation mainly from northeast to southwest. The distances between the observation site and the building communities on the north, west and south sides are obviously different, and the west side is relatively open. Therefore, under different wind direction scenarios, the urban canyon structures have different effects on the wind speed at the observation site. Therefore, we distinguish the wind field heterogeneity in street canyons according to the wind profiles observed under different wind direction scenarios and compare them with the simulation results in IWSUS.
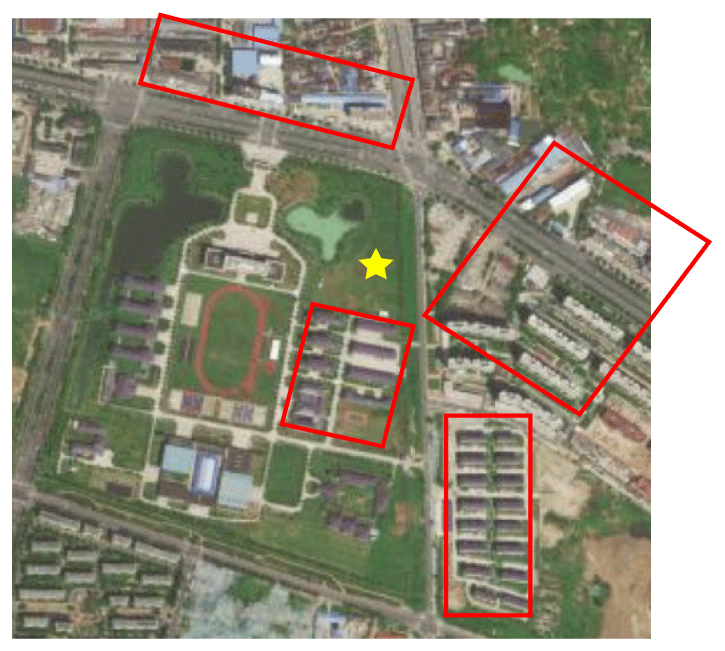
Figure 2The location and surrounding environment of the observation site in Nanjing urban area. The yellow star is the location where the vertical wind profiles were measured, and the red rectangles refer to the main surrounding buildings (from Baidu Maps).
The observations from the boundary-layer wind tunnel experiments by the Meteorological Institute at the University of Hamburg were also used to validate the wind speed in the street canopy in scenarios of the geometry characteristics and orientations of the street canyon (Hertwig et al., 2012). The urban geometry in the wind tunnel is set in a 1:225 scale model of a semi-idealized urban block with ARs ranging from 0.625 to 1.33, which is heterogeneous and morphologically consistent with typical central city characteristics. Due to the similar morphological structure with our CFD model, we apply the vertical profiles of horizontal wind components at plaza edges and the lateral street canyon as the observations at the lower levels of the urban canopy for wind speed comparison. Meanwhile, to assess the performance of IWSUS in urban energy balance, the measurement of fluxes over the building canopy and the air temperatures' diurnal variation in the street canyon were obtained from the observational research in a deep street canyon (AR = 2.1) with both sides having approximately equal building heights in central Gothenburg, Sweden (57∘42′ N, 11∘58′ E) (Offerle et al., 2006). The orientation of the street was approximately north–south. The measurement instruments were installed on both walls, on rooftops and in the center. The temperature and wind speed were collected from June 2004 to August 2004 and averaged hourly as the daily variation for east wall, west wall, roof, road and ambient in summer. The heat flux is calculated based on these observations with Eqs. (10) to (12). We also set the same parameters of the measurement site in IWSUS to obtain the representative simulation results for comparing surface flux under the real situation in Sect. 4.2.
2.5 Method for validation
For validating the simulation accuracy of IWSUS by using the observations mentioned in Sect. 2.4, the exponential–logarithmic wind profile (referred to as exp-log law in the following) scheme widely applied in most of the current urban canopy models (e.g., UCMs) (Kusaka, 2001) was used as the control group. The index of normalized mean error (NME) was applied for simulated wind speed by both IWSUS and the exp-log law to compare with the observations. The NME is defined as follows:
where Csim and Cobs represent the values on the spatial grid in simulations (either IWSUS or exp-log law) and observations, respectively. The subscript i indicates the numbers of vertical layer in the model grids.
The simulation results of turbulence heat flux in and over the urban canopy based on the UCM and IWSUS were also validated by the NME index.
3.1 CFD simulations for inflow scenarios
In each group of scenarios cataloged in Table 1, the three-dimensional wind field was calculated with the CFD method based on different initial parameters in Table 1. Then the vertical wind profiles of the horizontal components (u, v) of the wind speed over the six representative positions were each parameterized. It is noted that the simulation results of the 1 and 8 m s−1 scenarios are very close after being normalized by inflow speed, so the following figures only show the inflow scenarios of 0.1 and 8 m s−1. The original and processed results of wind profiles at different positions can be found via the Zenodo links in the “Code and data availability” section.
As shown in Figs. 3 and 4, the absolute value of u and v represents the wind speed, and the positive and negative signs indicate that the wind direction at this height is the same as or opposite to the wind speed in the free atmosphere above the building canopy.
The vertical profiles of the u and v components by CFD simulations at each representative point when the inflow is perpendicular to the street direction are shown in Fig. 3. First, the vertical profiles of the u component at the six representative points generally show similar structure: in the height range below the building height (H), the u value is small and the value varies little with height, while around the height of H, the u value increases dramatically. It indicates that the u component of the wind speed has an obvious wind shear effect near the average height of the building canopy. Besides, the direction of u also reverses around the height of H: above H, the u component is in the same direction as the upper free atmosphere, while below it is opposite.
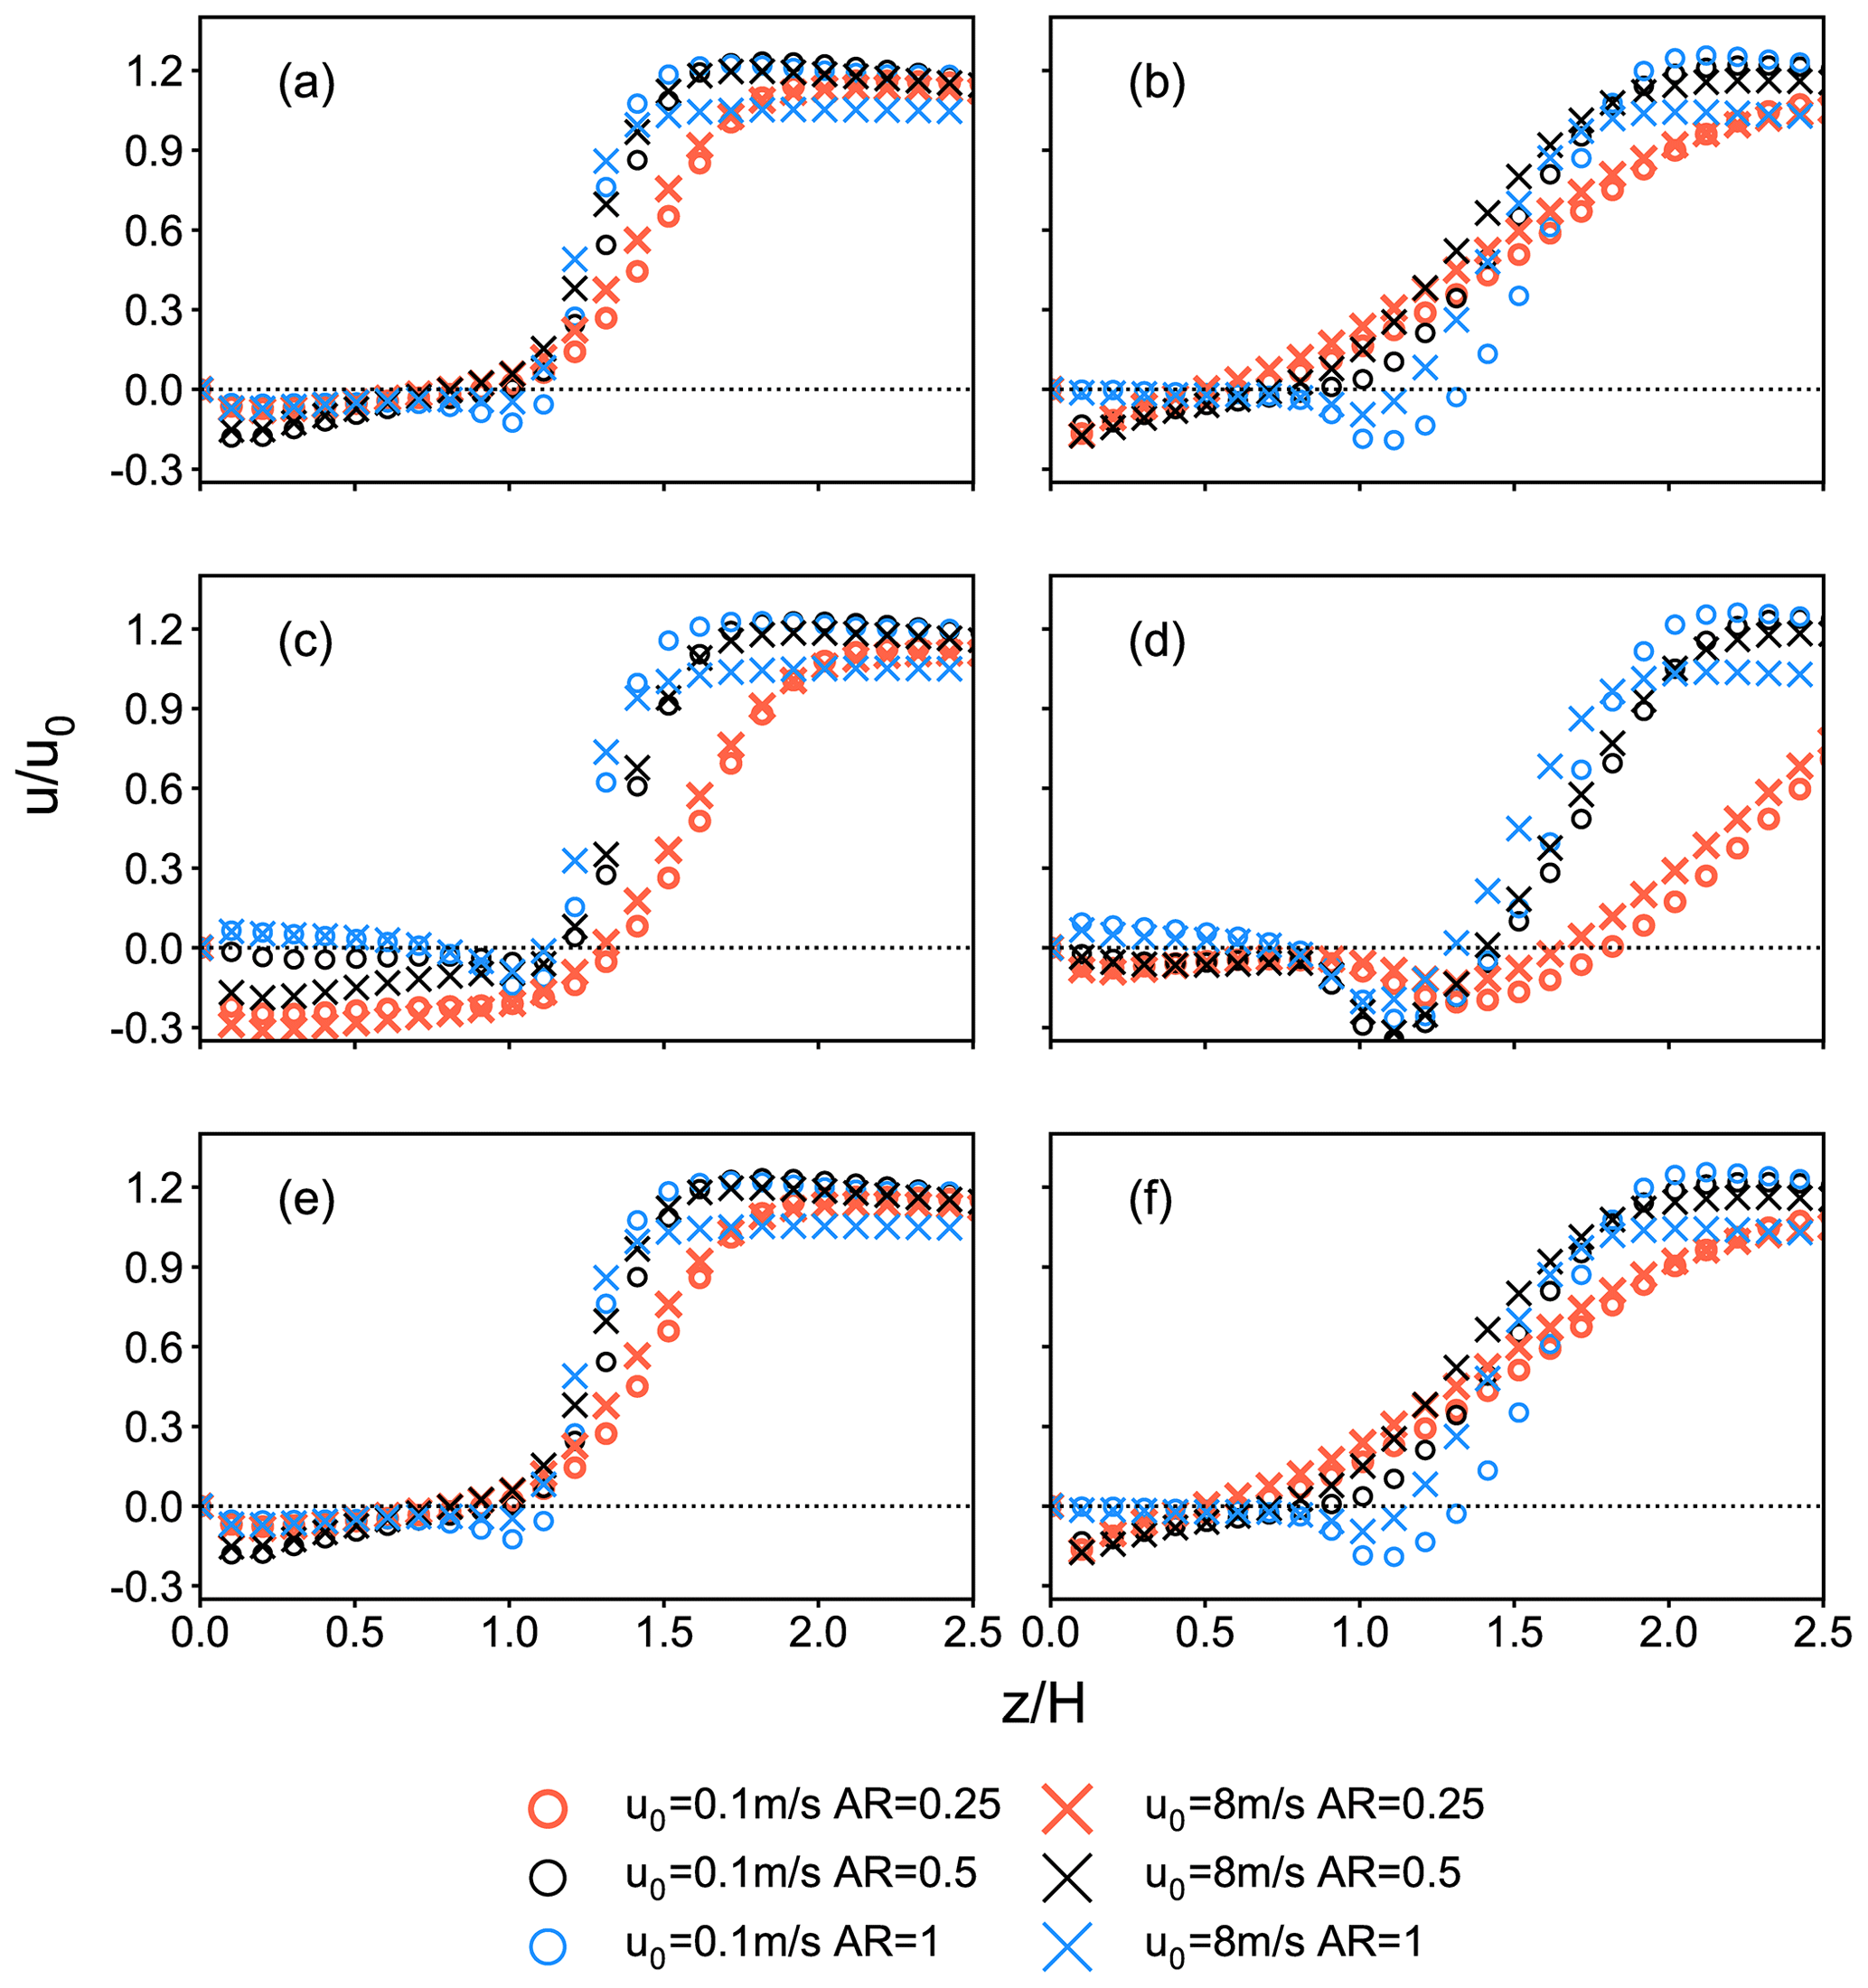
Figure 3Simulated vertical wind profiles of the u component for perpendicular scenarios at six sampling points. Circles and crosses (x) represent the inflow of 0.1 and 8 m s−1, respectively. The red, black and blue scatters represent AR = 0.25, 0.5 and 1. Panels (a)–(f) represent six sample positions A–F sampled in Fig. 1b, respectively. The sign of represents direction along x axis shown in Fig. 2.
The vertical profiles of u values over different representative points are somewhat different in details: the vertical profiles of u on the windward side (Fig. 3b, d, f) change more dramatically near the height H than those on the leeward side (Fig. 3a, c, e), and the increase above the height H on the windward side is slower than that on the leeward side under the same AR. Due to the spatial symmetry setting of the street canyon shape in CFD, the simulated u values at the entrance and exit of the street canyon are quite similar.
The values of the v component at both ends of the street on the leeward side generally increase, first reaching their maximum near the height of H, and then gradually decrease with the increase in height tending to near 0 at the position far above the top of the building (Fig. 4a, e). At both ends of the windward side of the street canyon, because the horizontal airflow is stronger after bypassing the building, the v component has a larger value near the ground when AR is small and maintains a similar change to that on the leeward side when AR is large (Fig. 4b, f). The wind almost flows along the street canyon due to the obstruction of the building facade (Fig. 4c, d). Similarly, due to the geometric symmetry of the model, the v components at both ends of the street canyon are similar in value but opposite in direction.
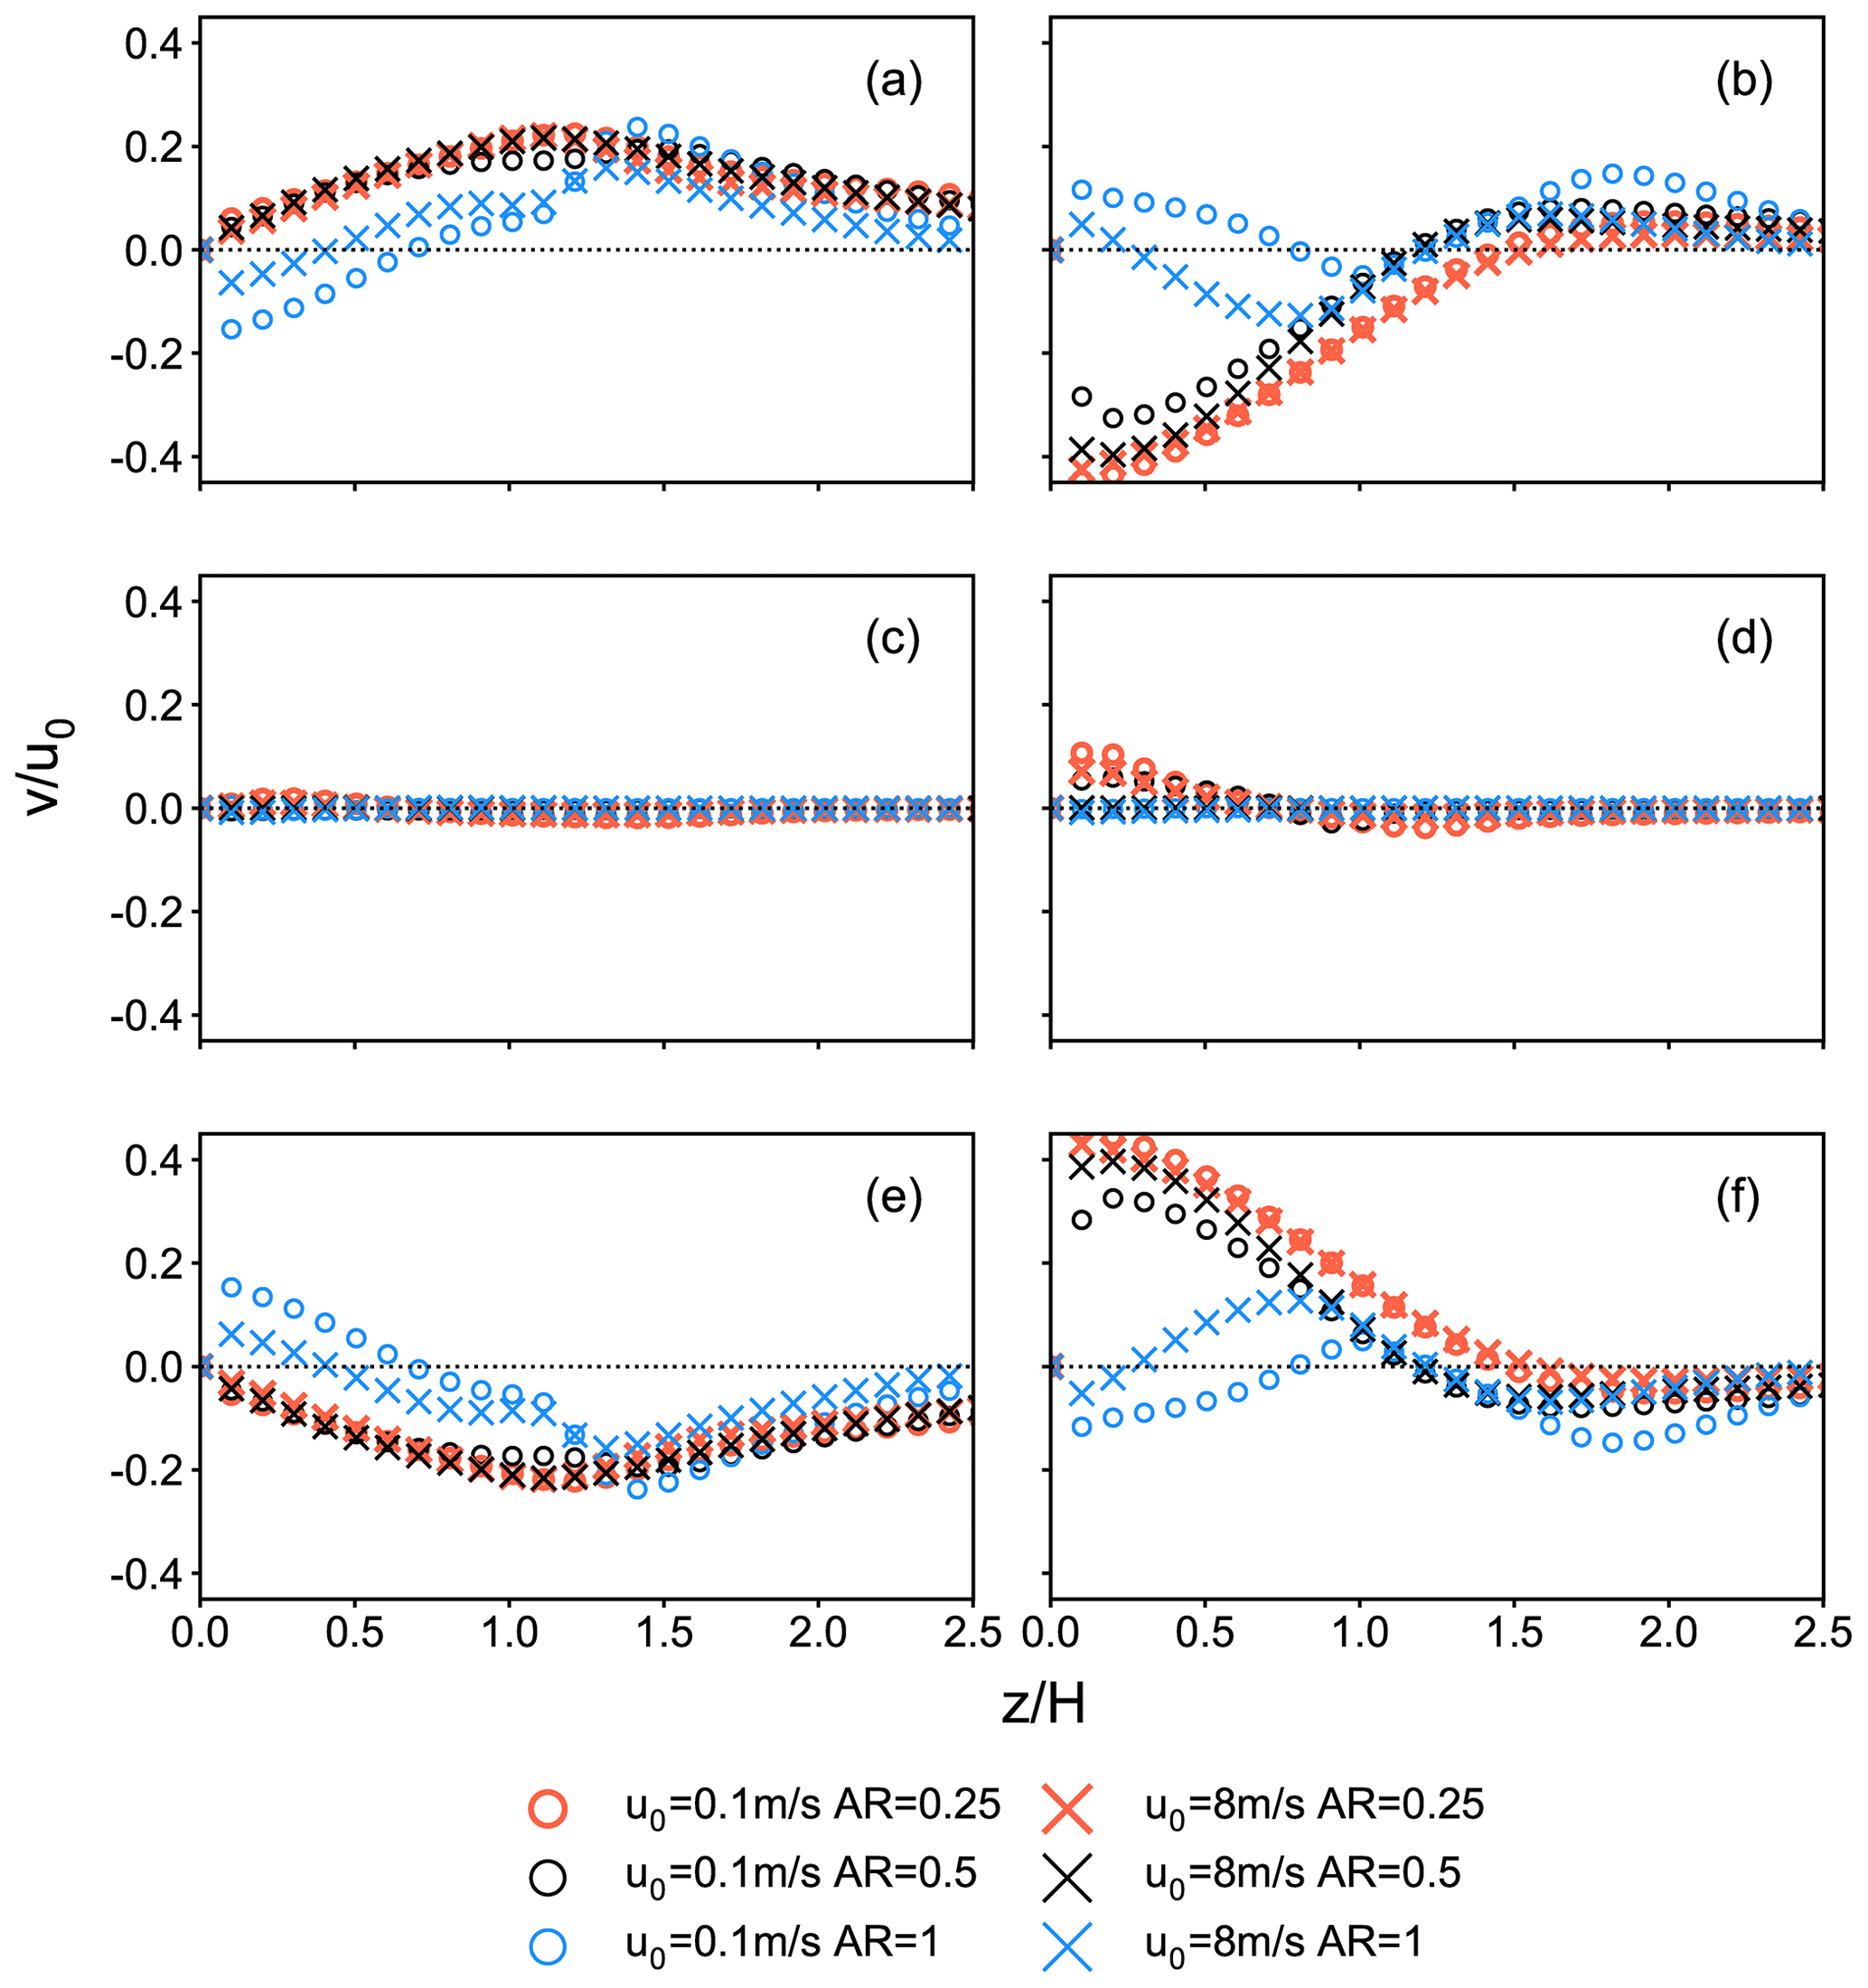
Figure 4Simulated vertical wind profiles of v component for perpendicular scenarios at six sampling points A–F. The representations of shapes and colors are the same as Fig. 3. The sign of represents direction along y axis shown in Fig. 1.
In scenario group 1 that the inflow is perpendicular to the street canyon, the CFD simulation results generally show that the horizontal wind speed is low and changes gently below the height of H. The wind speed then increases rapidly near the height of H forming a strong vertical shear of the horizontal wind speed and finally approaches the background wind speed when the height is far above H. The simulation results by CFD indicate that the vertical profiles of horizontal wind speed in and above the street canyon mostly do not conform to the traditional exponential–logarithmic wind profiles. The vertical profiles of wind speed over the different positions in street canyons are close to each other but quite different in details with different distributions of surrounding buildings. The results support the view that there is a heterogeneous distribution of the wind field in and over the inhomogeneous street canyon. Therefore, the vertical wind profile scheme – exponential in the lower layer and logarithmic in the upper layer, which is widely used in land surface models – cannot simulate the wind spatial distributions in and over the urban canopy well.
The vertical profiles for the v component over the six representative positions by the CFD simulations in scenario group 2, in which the inflow is set to be parallel to the street orientation, are shown in Fig. 5. The results of the u component show convergence in the entrance because of waking flows from building blocking, with relatively small values at the middle and the exit. Due to the lack of blocking effects for the v component in the parallel scenarios, the value of v component is higher and increases rapidly with height at lower levels in the street canyon, which is obvious at the entrance. Reaching half of the building height, the increasing rate is much smaller and gradually approaches the inflow speed. The shapes of these profiles not only are different from those of scenario group 1 but also do not accord with the exponential–logarithmic law in most of the current urban canopy schemes. The height at which vertical wind shear occurs above each of the six representative points also shows obvious differences. Thus, the heterogeneity and complexity of the horizontal and vertical distribution of the wind field in the urban building–street canopy are well reflected in these CFD simulations, which has been proved in a series of observations (Castro, 2017; Liu et al., 2020, 2021).
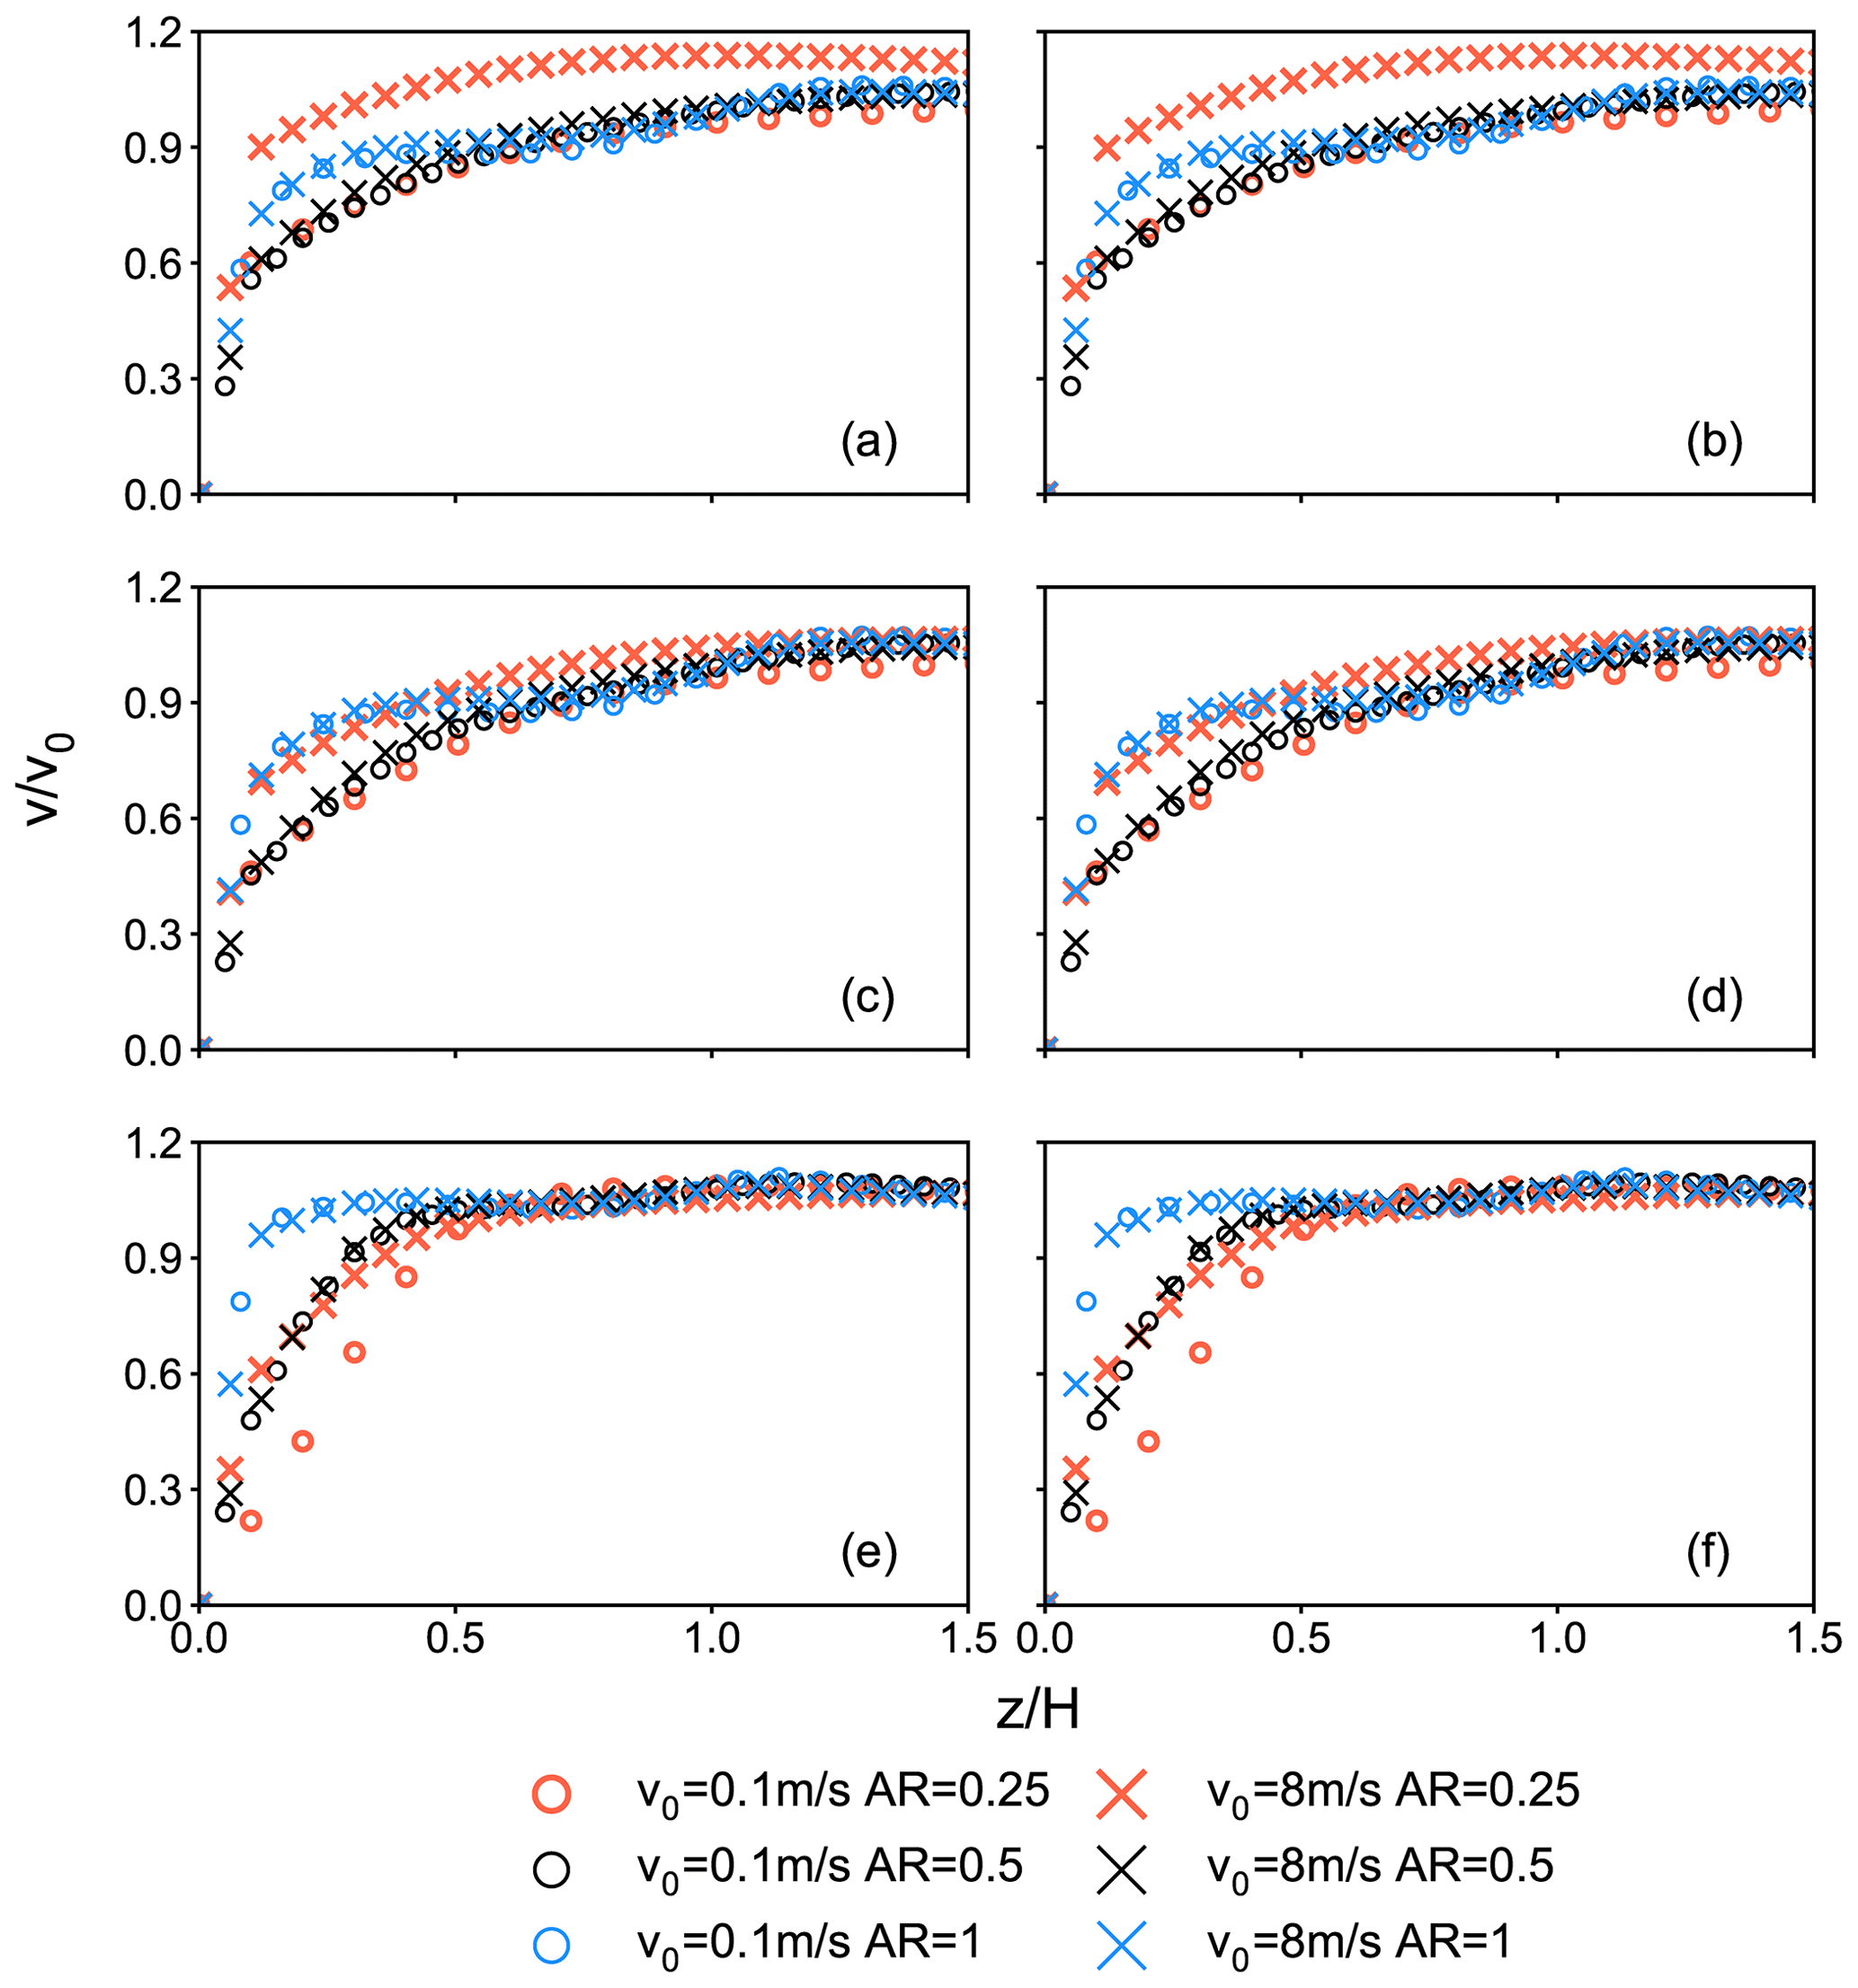
Figure 5Simulated vertical wind profiles of v component for parallel scenarios at six sampling points A–F. The representations of shapes and colors are the same as Fig. 3. The sign of represents direction along y axis shown in Fig. 1.
3.2 Piecewise fitting for wind profile
We employed the piecewise function to fit the vertical profiles of horizontal wind obtained from the CFD simulations. The aspect ratio (AR) of the street canyon is a key important parameter to qualify the degree of urbanization in the urban canopy model. As shown in Figs. 3 and 4, when the inflow wind speed remains the same, the vertical profiles of the u and v components vary with AR: when the value of AR increases, u decreases below the height of H and increases near the H. The v component averagely has a larger value when AR is smaller. Finally, we get the normalized regression expression between the wind speed (ur= , vr= ), relative vertical height (hr) and AR. The hr is defined as the height (z) compared with the height of buildings' top (H):
where H represents the average height of building roofs in the urban model. The parametric fit to the vertical profile of the wind component u is piecewise functions combined by four segments for each represented point in the street canyon, which are the near-ground section, inner street canyon section, the building roof section and the above-the-roof section, divided by three segmentation points (marked as H1, H2, H3, etc.). After determining the normalized height (hr) and normalized wind component (ur etc.) at each segmentation point, the type of function for every piece at different heterogeneous representative positions is specified according to the variation style. The coefficients in these specified functions are solved by substituting the obtained height and wind component values at segmentation points at both ends for every piece. Finally, the expressions of wind profiles are obtained. Here, the fitting results of horizontal components (u and v) in perpendicular scenarios are shown in this section as an example. The other scenarios are listed in the Supplement.
Tables 2 and 3 list the expressions of normalized height (hr) and normalized u component (ur) at each segmentation point, respectively, for different typical locations in the perpendicular scenario. The expressions of the u component vertical profile for the perpendicular scenarios are listed in Table 4. Figure 6 shows the vertical profiles of the u component over the six representative points obtained by fitting methods. The curves in different colors represent the fitting results with different AR parameters listed in Table 1. The results show that the values of the u component are relatively small in the vertical range from ground to around the height of H. It illustrates that the buildings have a strong dragging effect on the airflow perpendicular to the street orientations in the urban street canyons, which results in lower wind speeds near the ground. The value and sign of the u component varies rapidly near the height of H, which illustrates the strong wind shear pattern near the average height of building roofs. In addition, the larger the value of AR, the more intense the wind shear, indicating that there is a positive correlation between the development of the urban canyon and the complexity of the wind field in the urban street canyon.
Table 2The fitting functions of the segmentation points for the wind component u in the perpendicular scenarios.
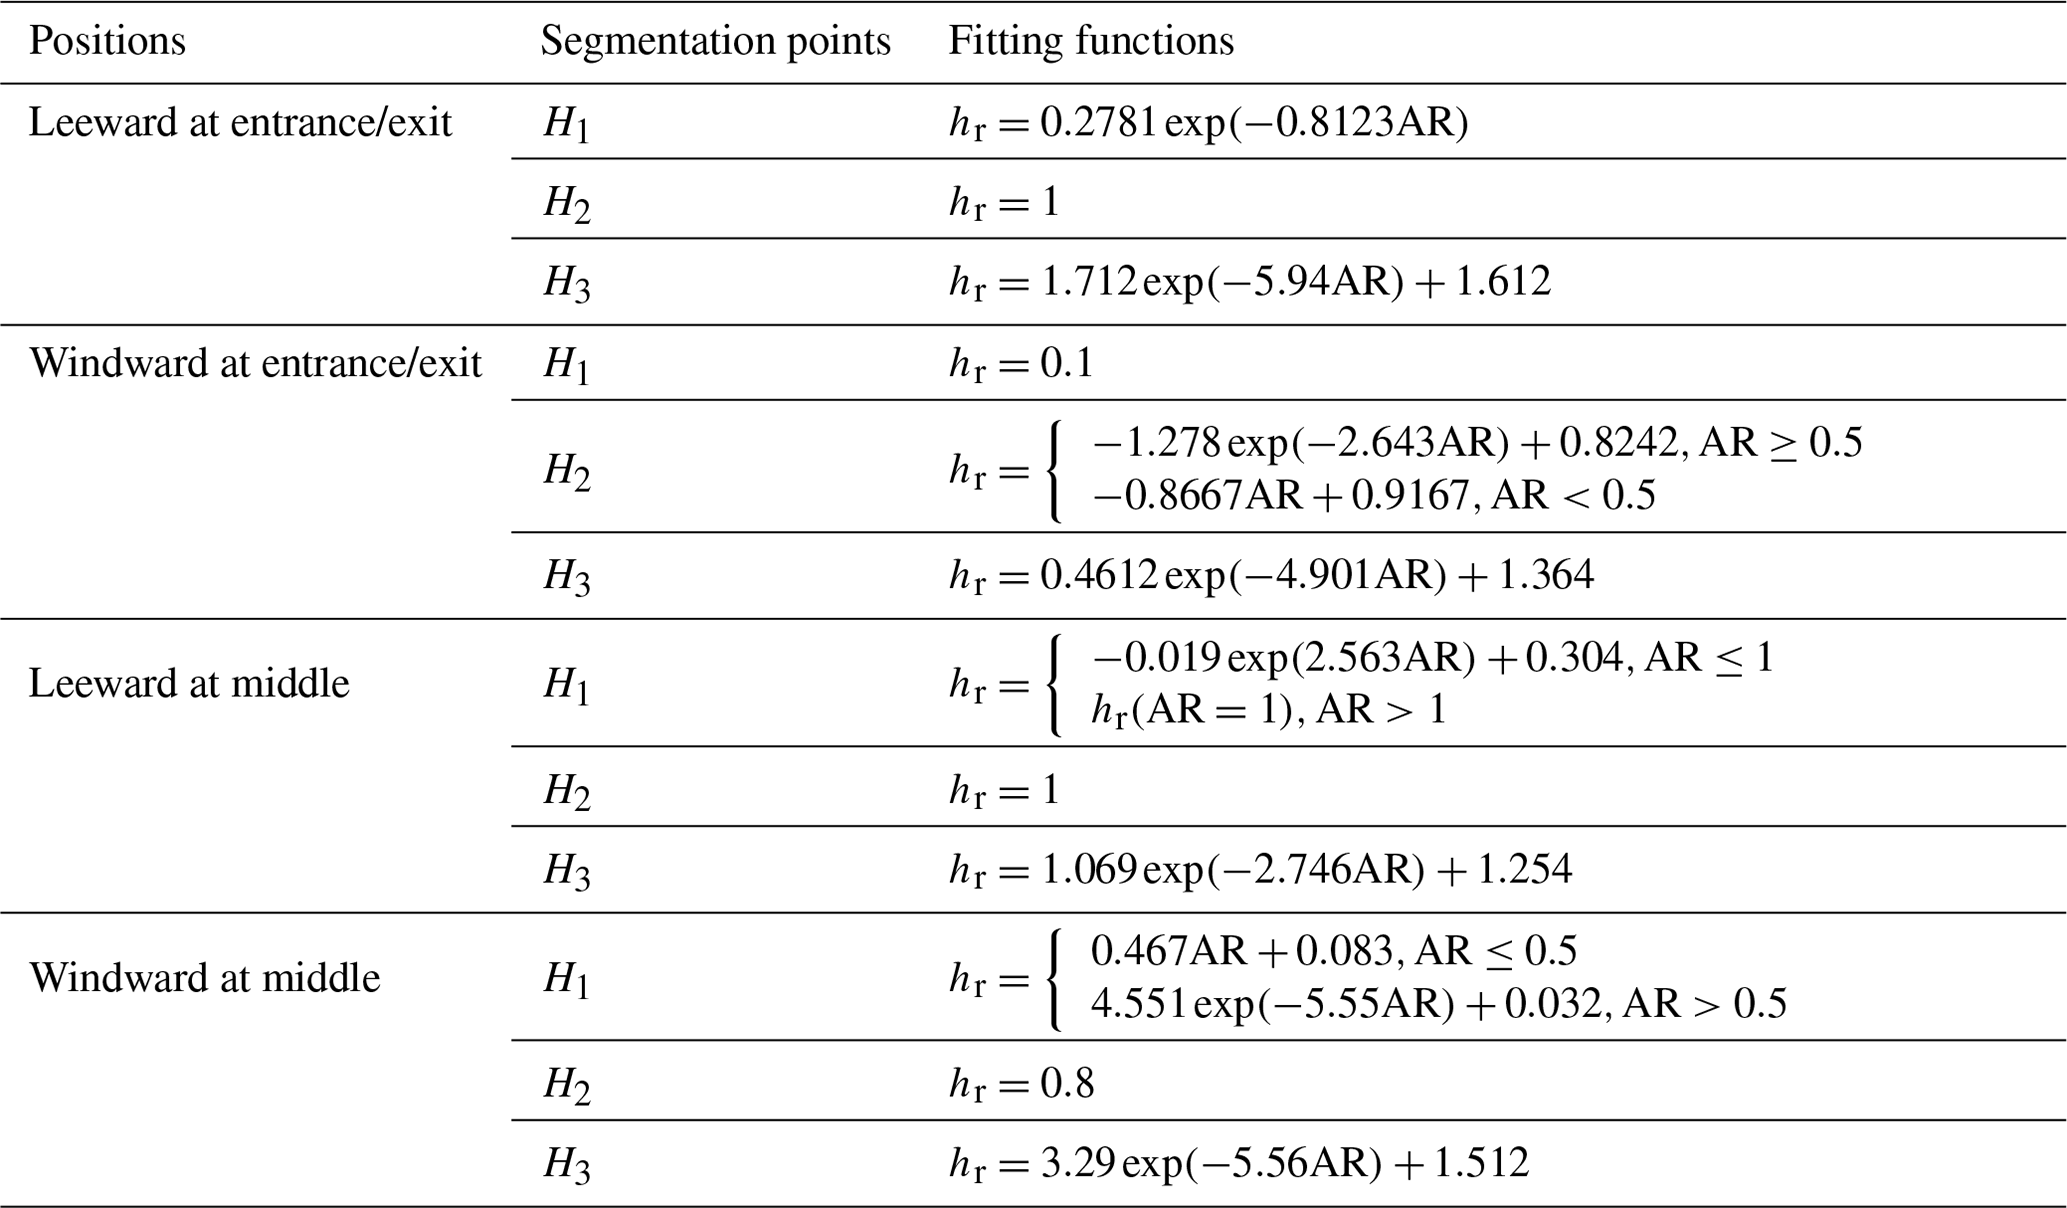
Table 3The fitting functions of the wind component u at the segmentation points (Hi) in the perpendicular scenarios.
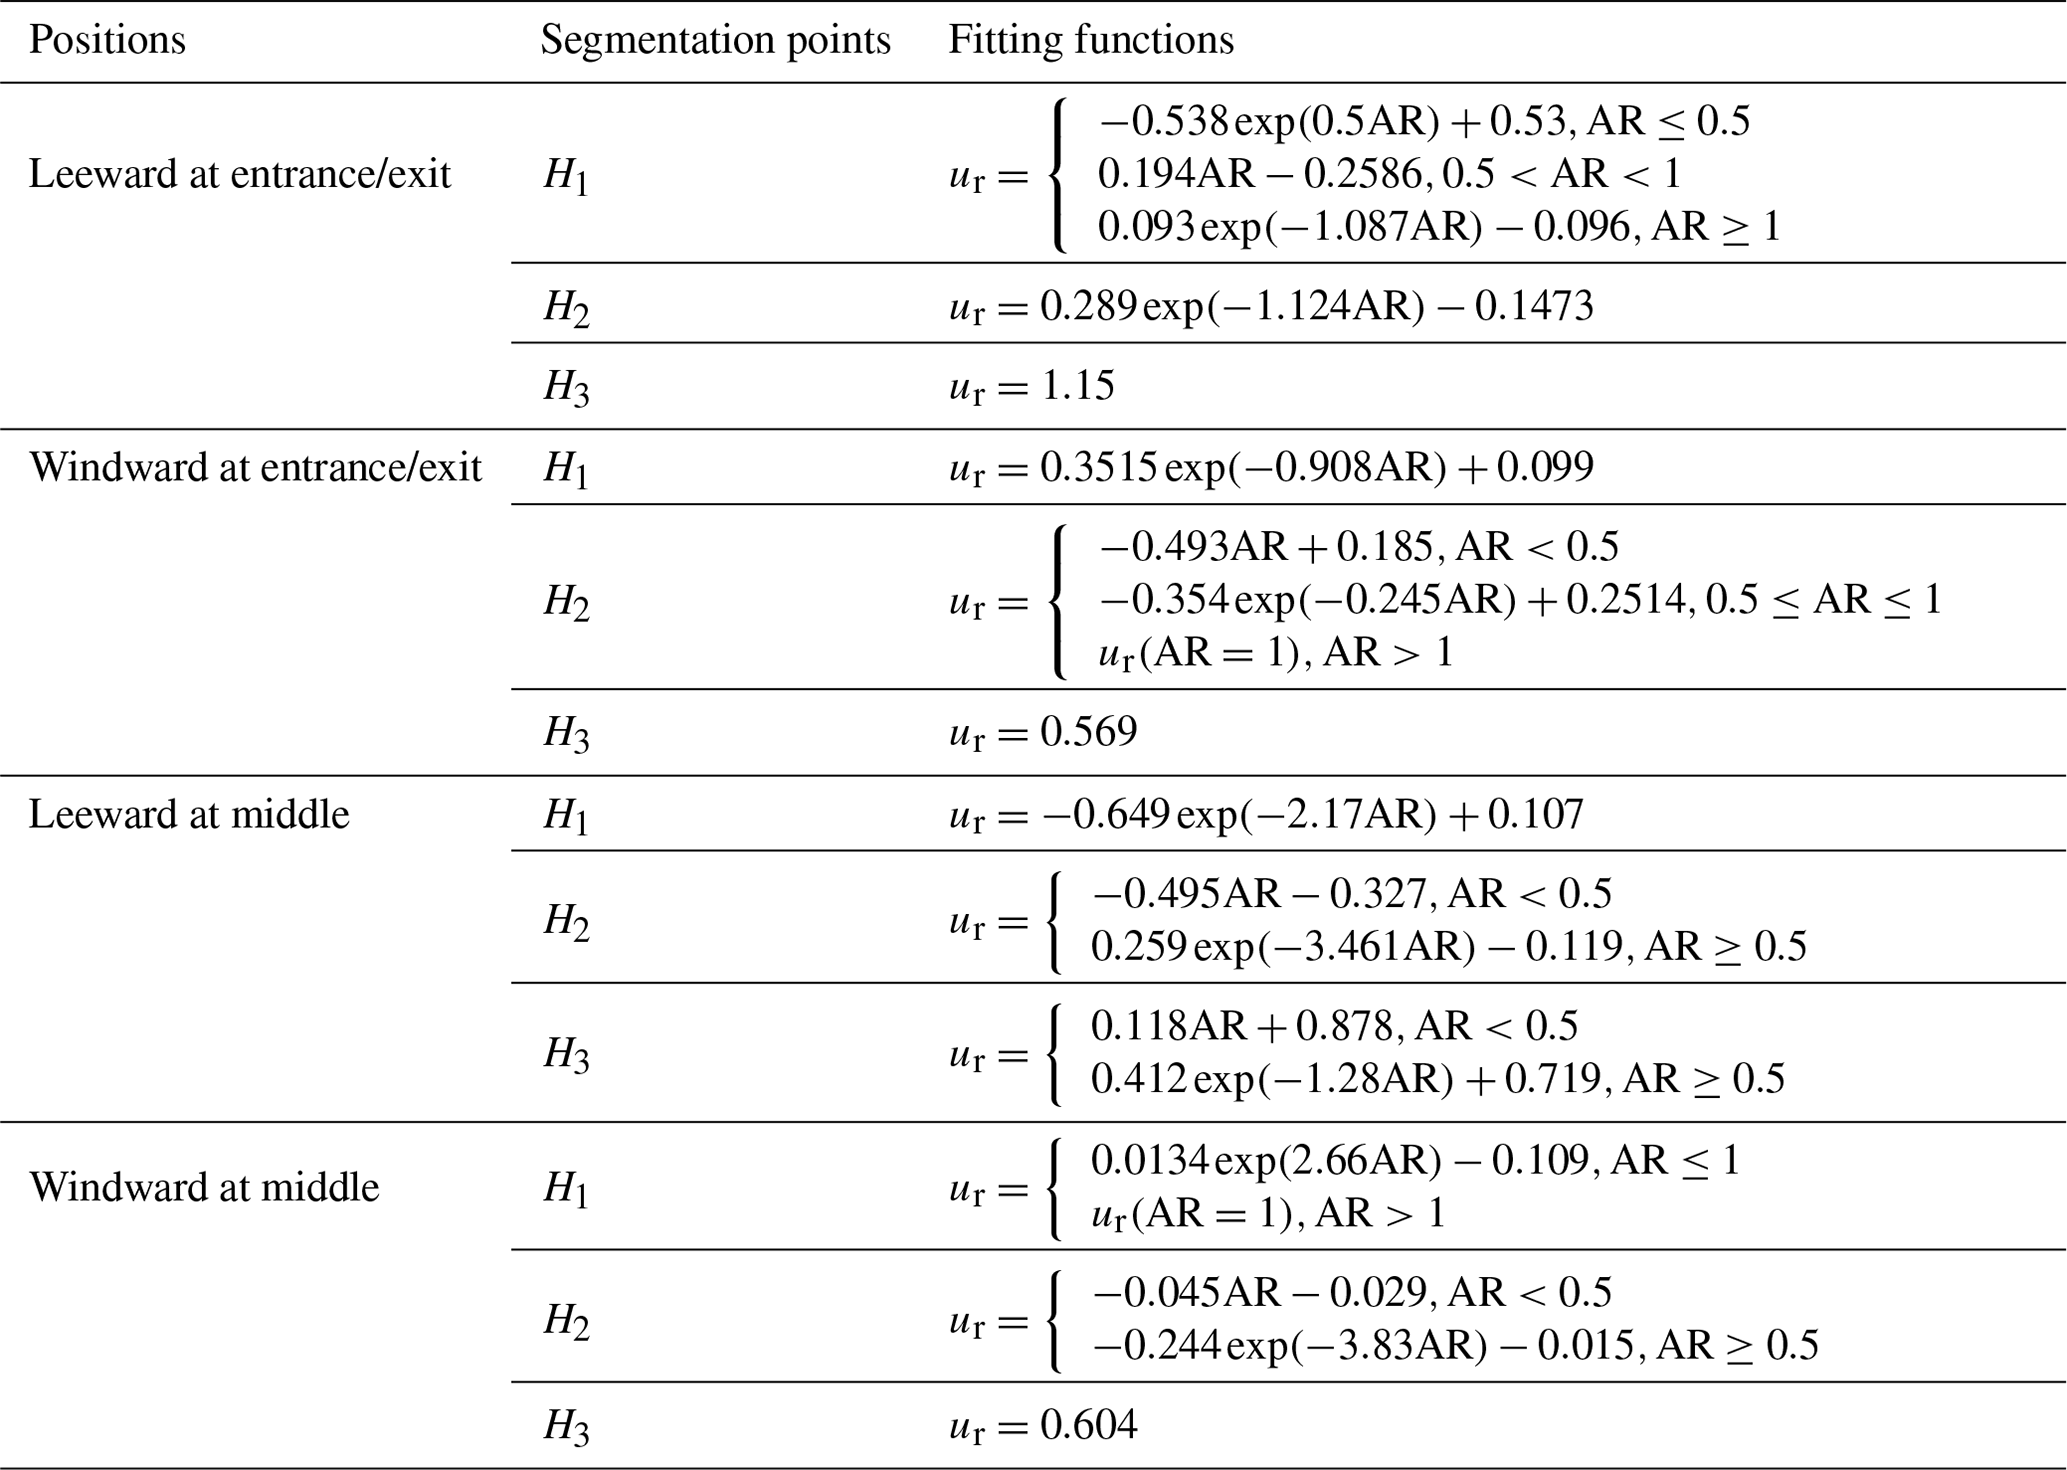
Table 4Expressions of the u component vertical profile for perpendicular scenarios, where the functional relations between ur and hr and determined functions of coefficients in these expressions are listed. The Hi and ur (Hi) represent the relative height and relative wind components speed at the endpoints determined by Tables 2 and 3, respectively.
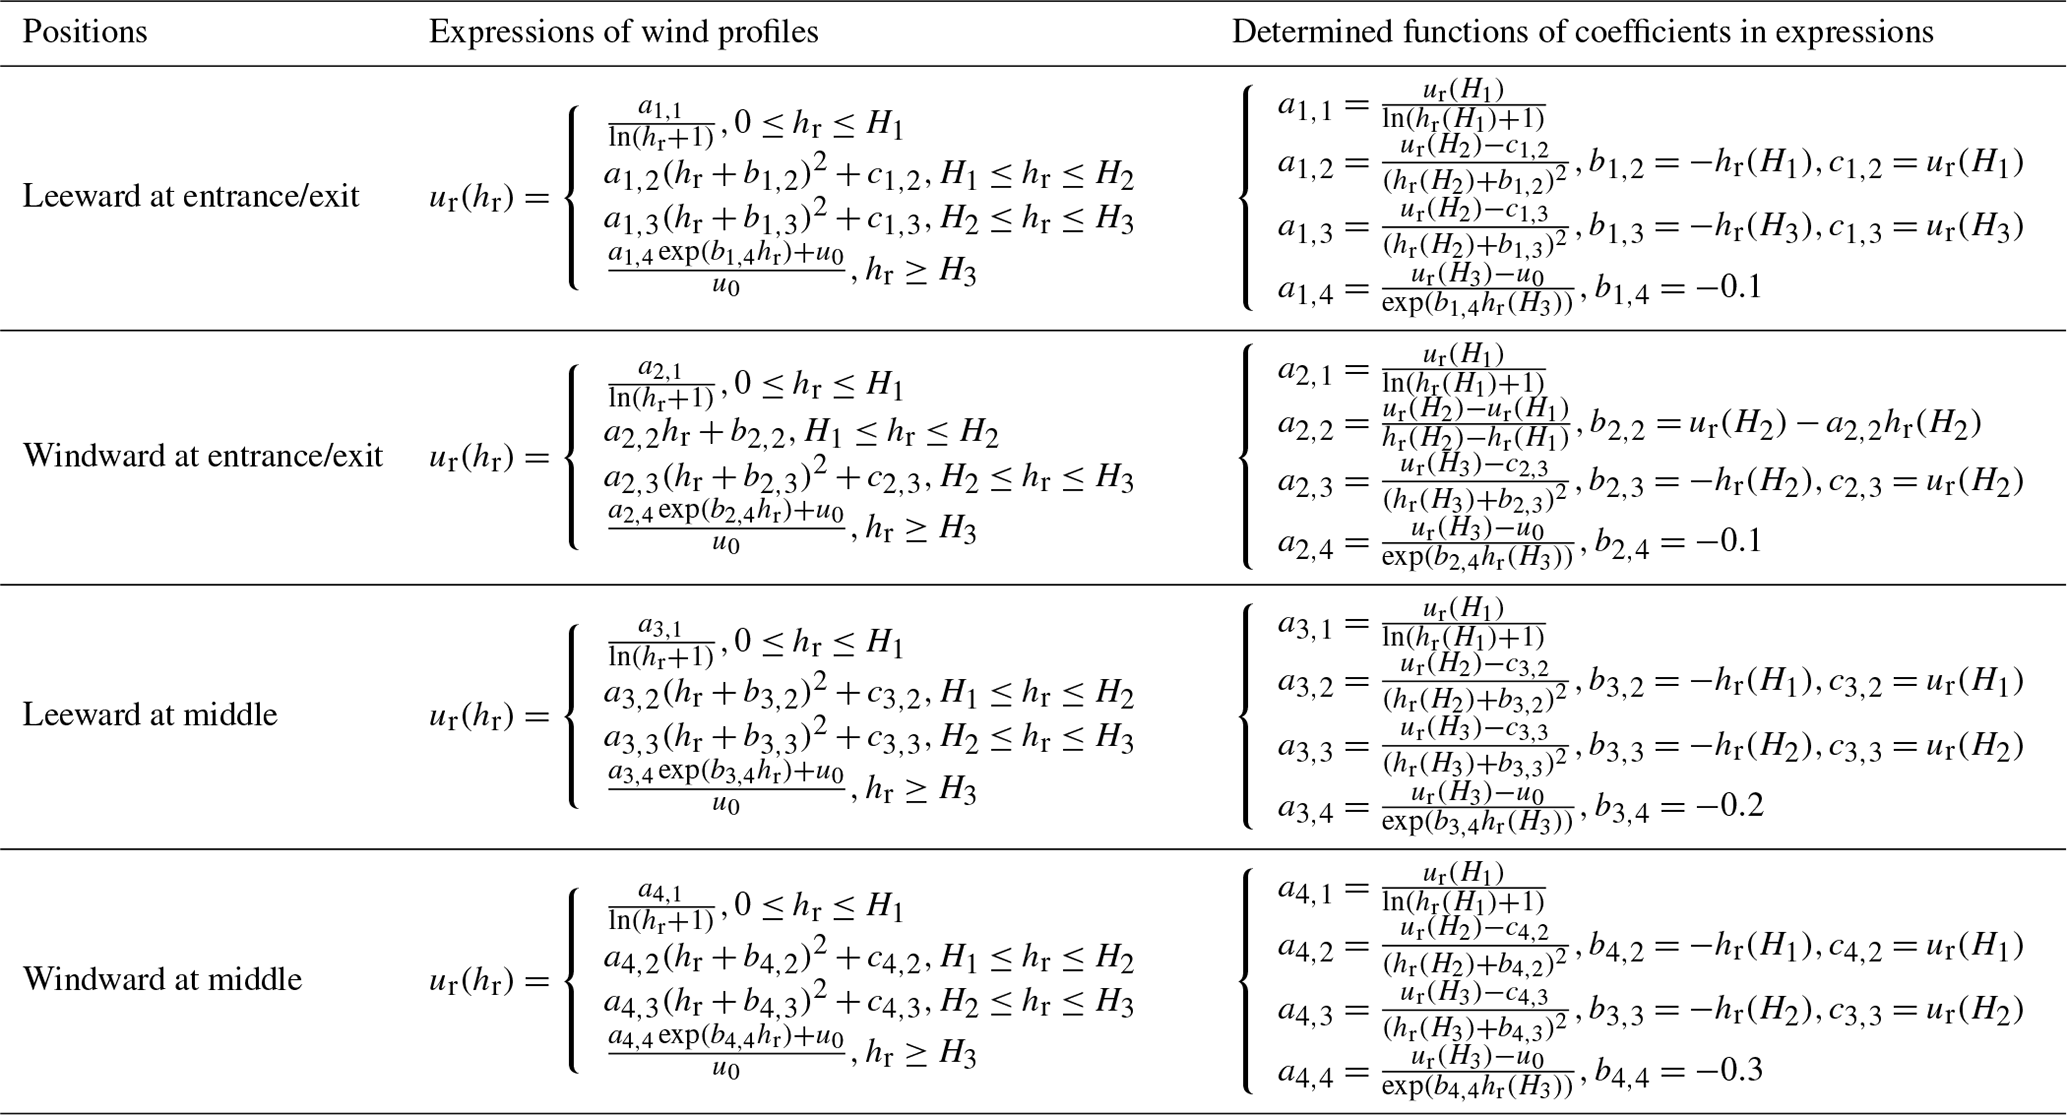
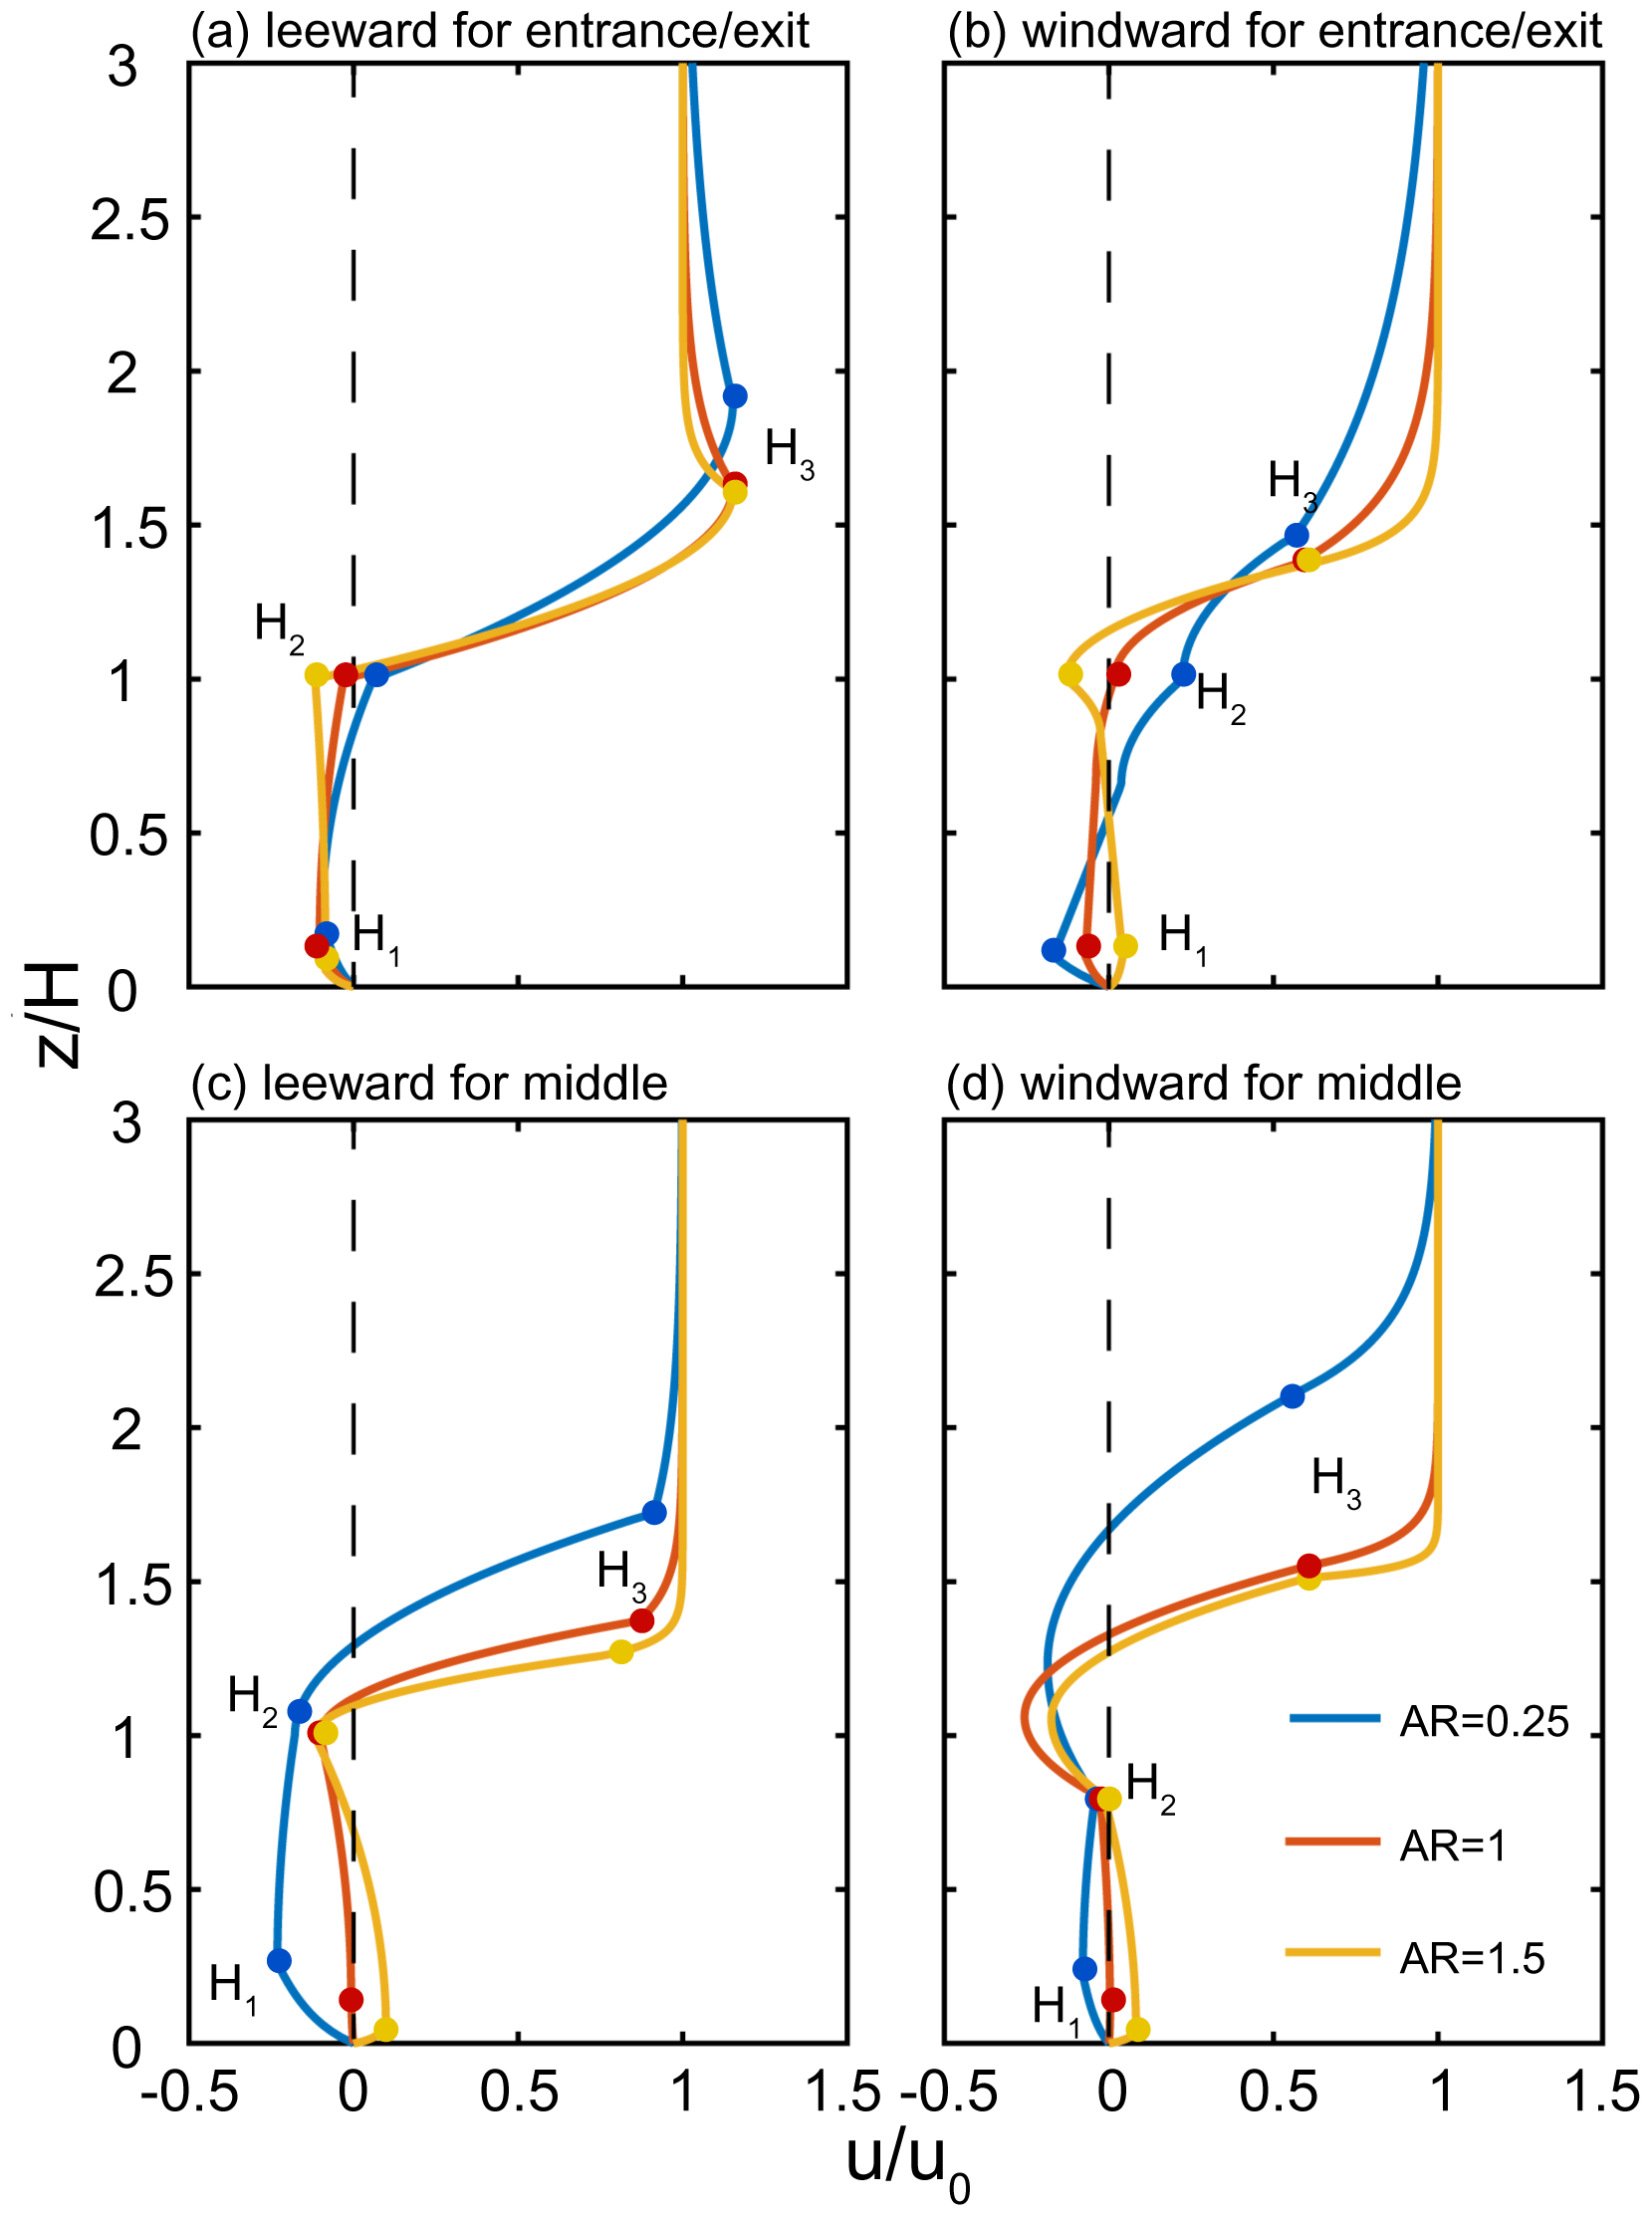
Figure 6Wind profile of the u component obtained from IWSUS at different positions with AR = 0.25, 1 and 1.5. The point Hi are the segmentation points referred to in Tables 2 and 3.
Tables 5 and 6 list the fitting formulas for the v component of the wind speed on the leeward side of the building based on the CFD simulations. The fitted relative height (hr) of the segment points of the fitting curve is calculated by the formulas in Table 5, and the specific equations used to describe the vertical wind profiles vr between the segment points of hr are listed in Table 6. Then the piecewise fitting method similar to the u component mentioned above is also applied for v component profiles.
Table 5The fitting functions of the segmentation points for the wind component v in the perpendicular scenarios.
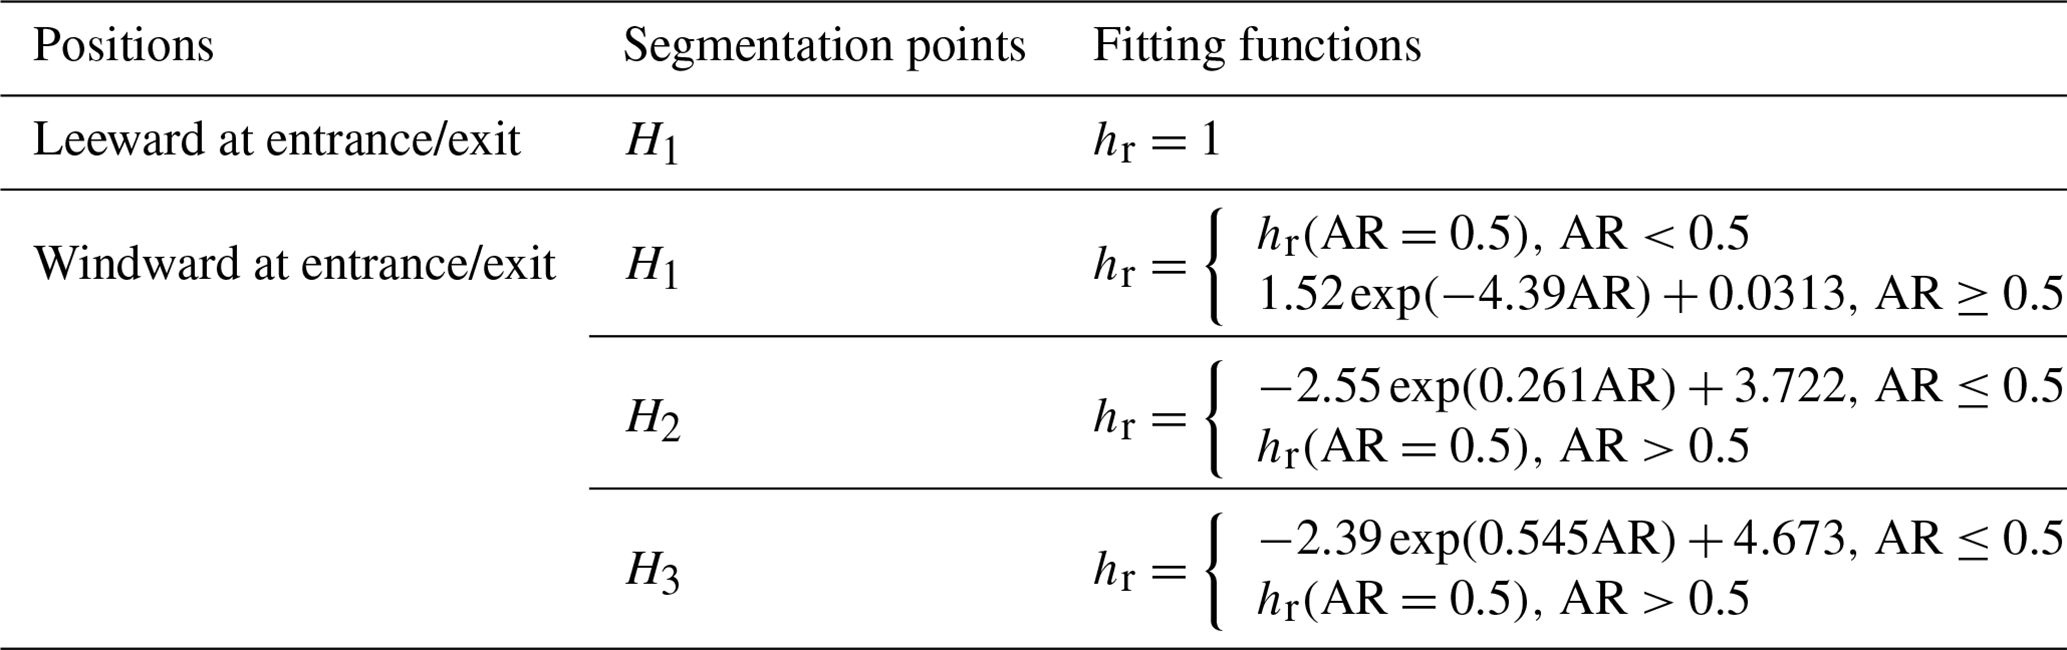
Table 6The fitting functions of the segmentation points (Hi) for the wind component v in perpendicular scenarios.
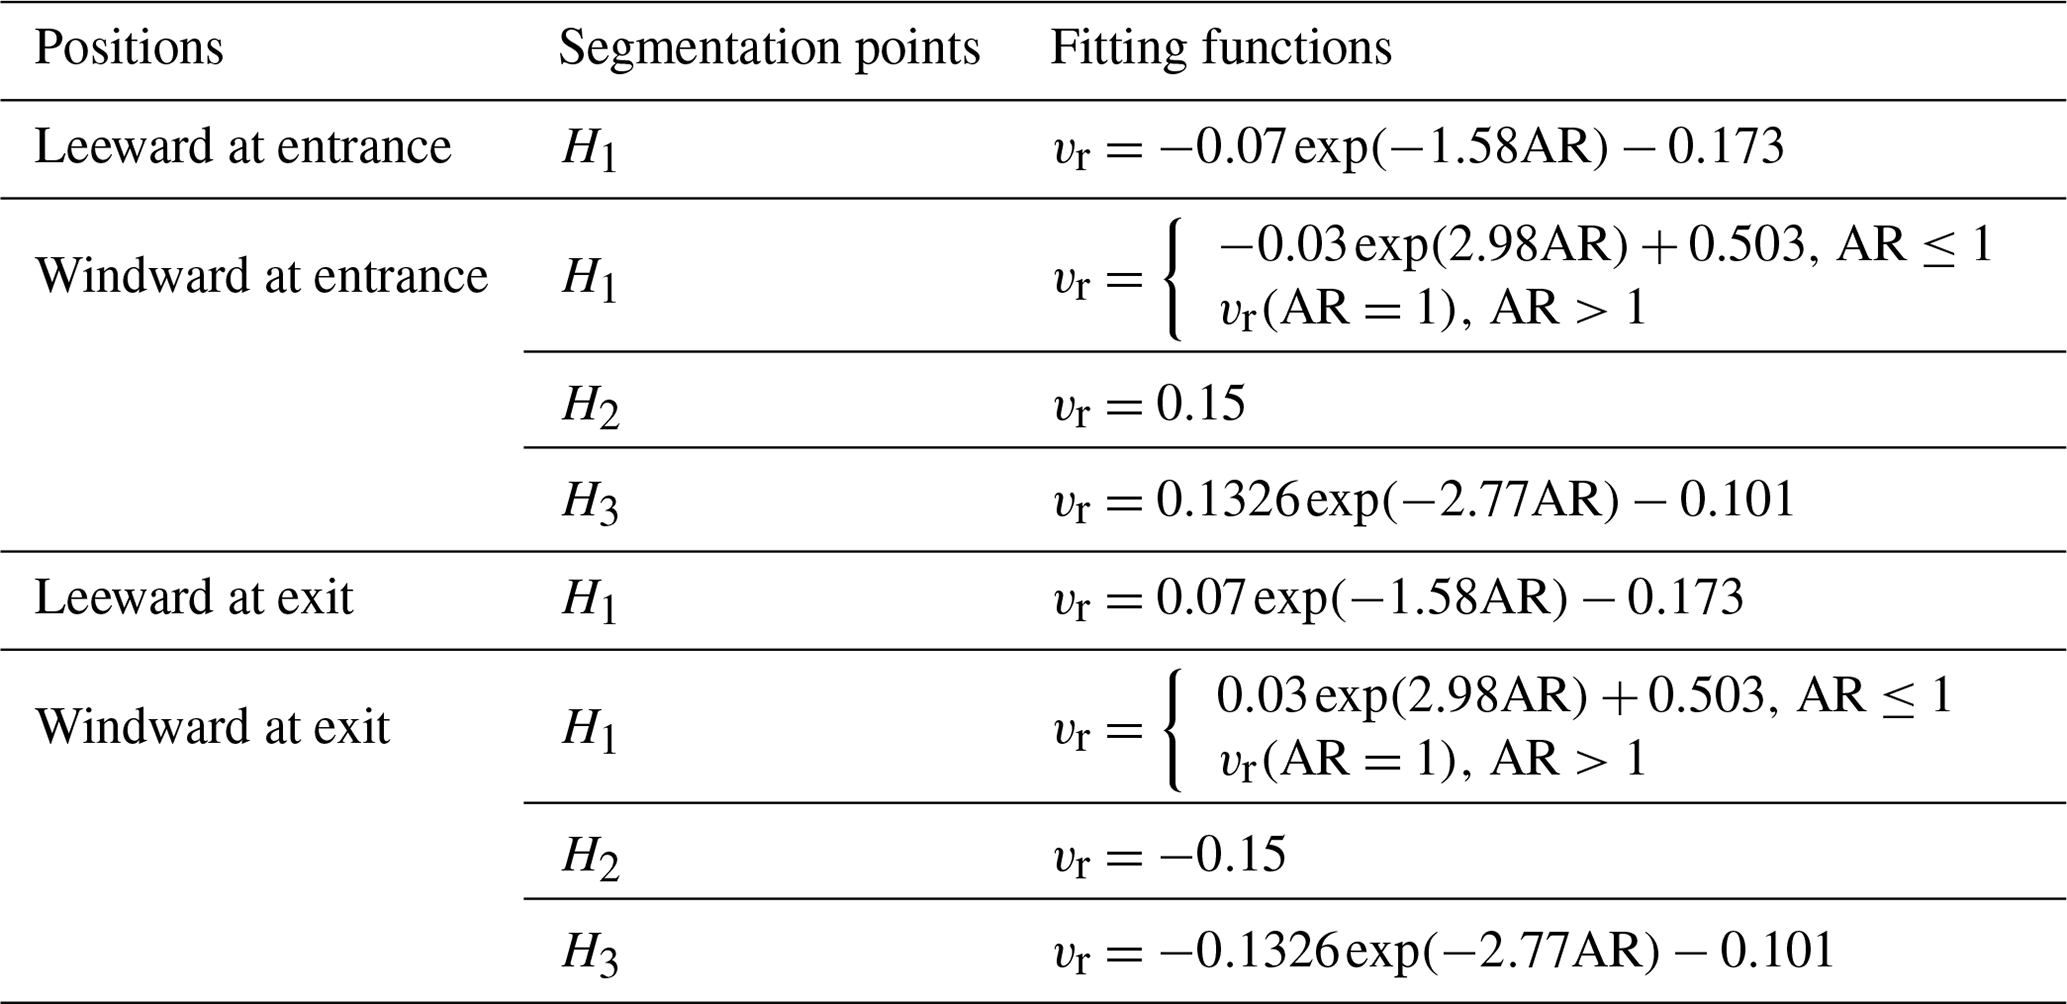
Table 7Expressions of v component vertical profile for perpendicular scenarios, where the functional relations between vr and hr and determined functions of coefficients in these expressions are listed. The Hi and vr(Hi) represent the relative height and relative wind component speeds at the endpoints determined by Tables 5 and 6, respectively.
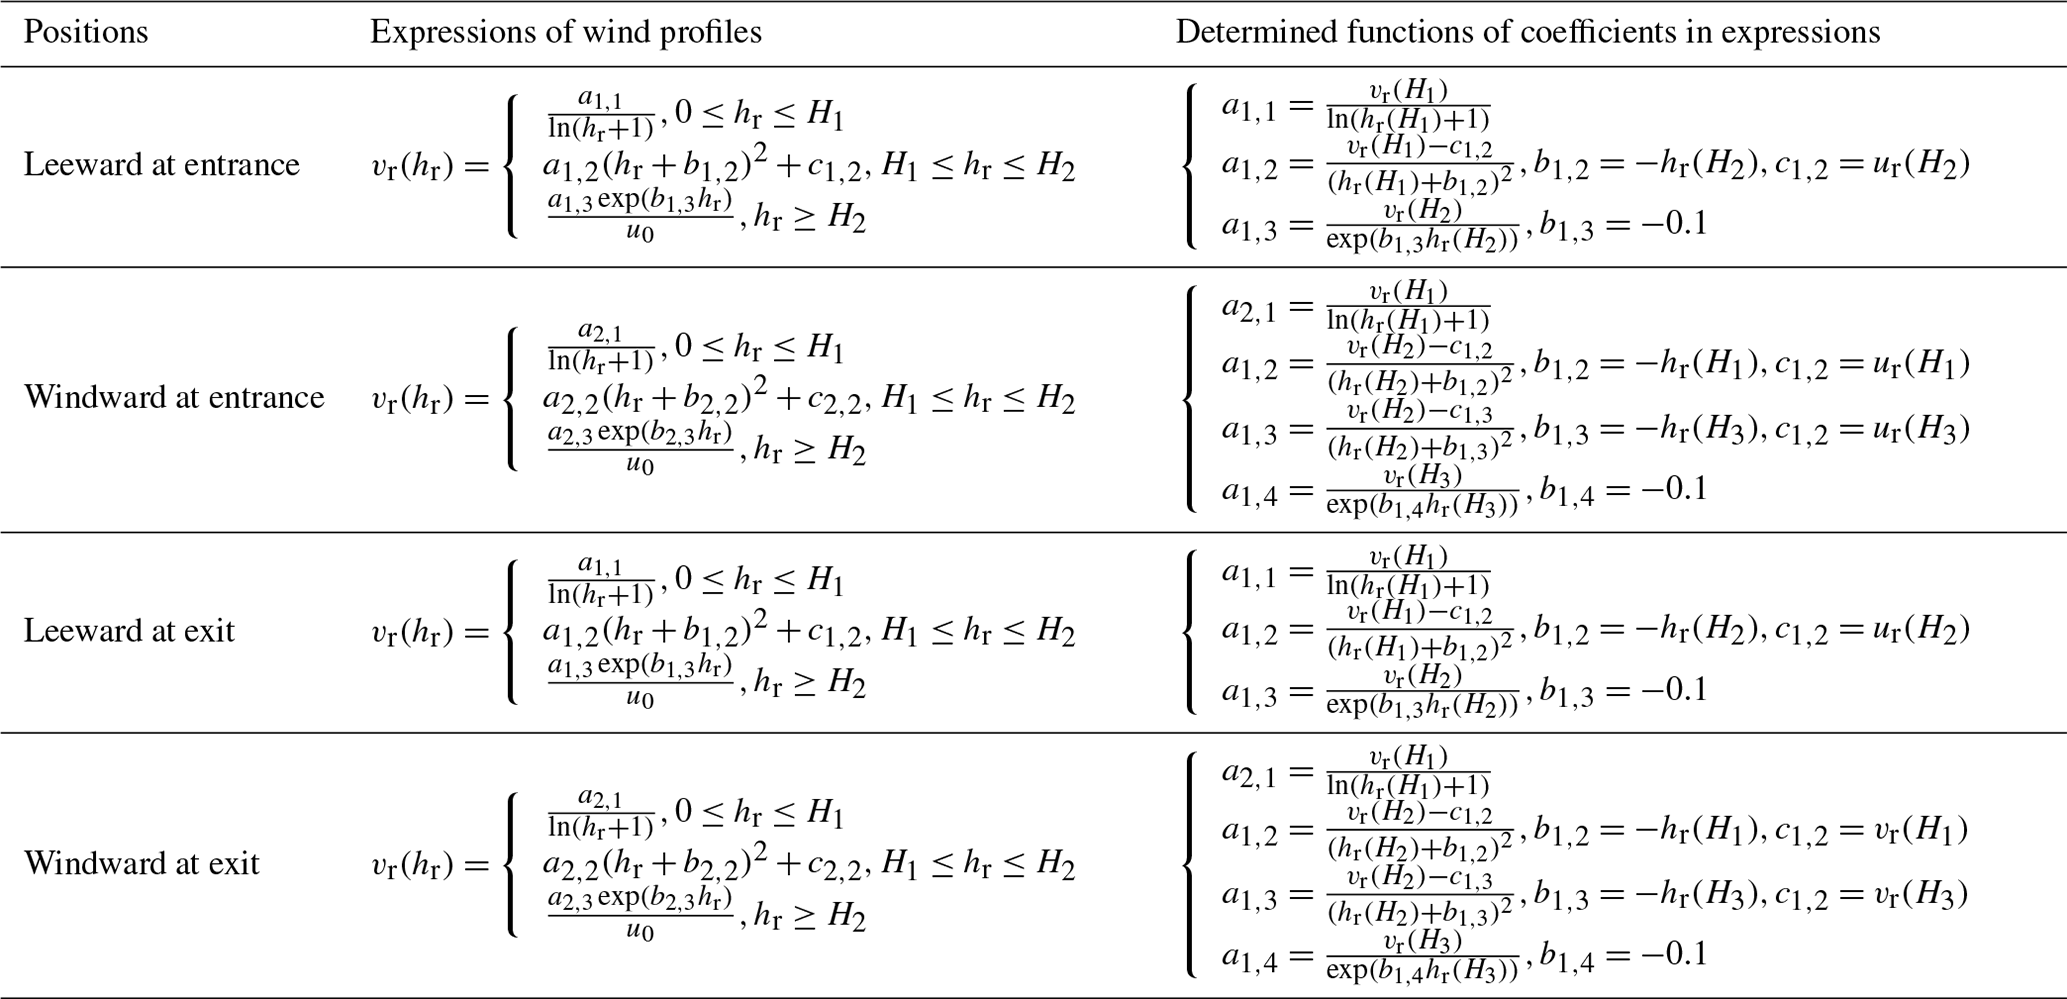
The expressions of the u component vertical profile for the perpendicular scenarios are listed in Table 7, and Fig. 7 shows the fitting curves of v component of wind speed based on IWSUS simulations. The settings of AR are the same as Fig. 6. On the one hand, the simulated wind speed over different representative points varies largely in both the size of the value and the direction, indicating the heterogeneity of the wind speed field in the street canyon. On the other hand, the AR is a sensitive parameter, significantly affecting the shape of the vr-hr curve. It indicates that the development of the urban building–street canopy has an impact on the vertical distribution of wind speed.
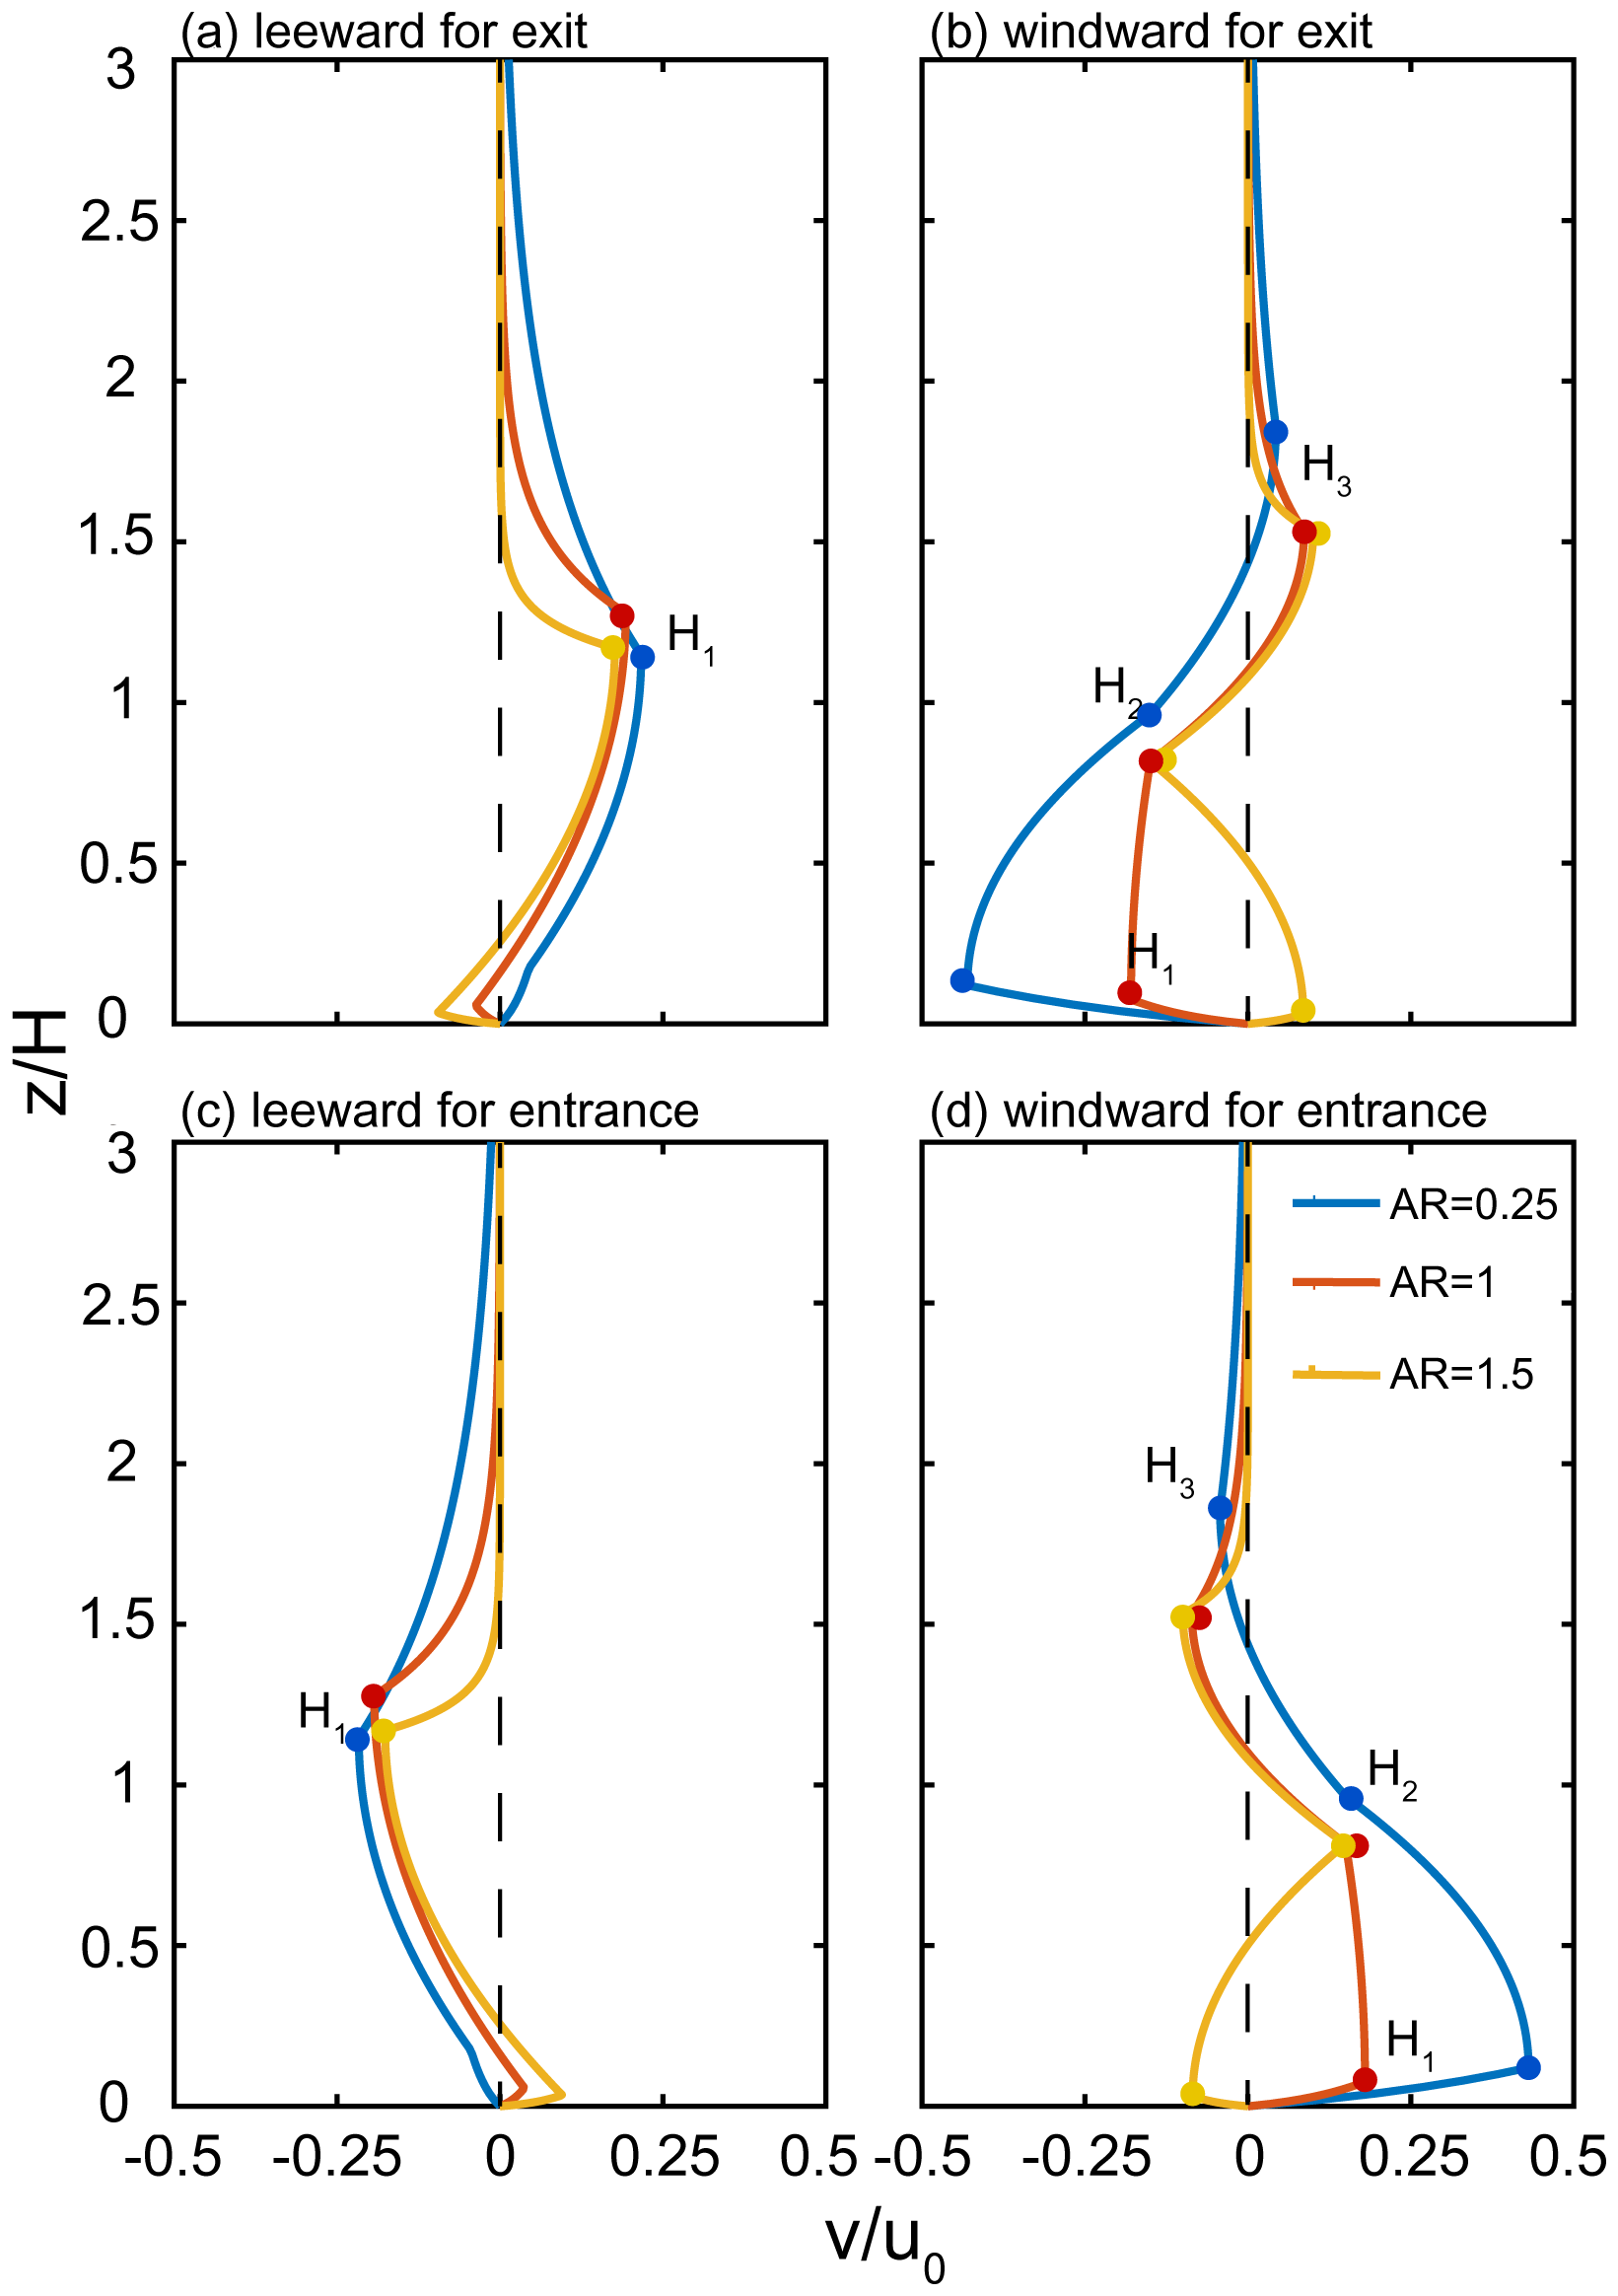
Figure 7Wind profile of v component obtained from IWSUS at different positions with AR = 0.25, 1 and 1.5. The point Hi are the segmentation points referred to in Tables 2 and 3.
The u and v components of wind speed simulated by IWSUS are very sensitive to the width of the street. Inside a narrow street, the wind is relatively weaker, which is a result of the stronger blocking effects. The wind direction is more variable at different levels, indicating different exchange processes between building surfaces and the air inside the street. In the middle part, the direction at lower levels is the same as inflow, capable of leading to heat transfer from the leeward to the windward side, while the opposite direction for higher levels near building roofs indicates reversed heat transfer. Due to the velocity being larger at the upper part of the canyon, the heat transfer mode can cause the warmer air at the top and the cooler air near the ground with the same heat emission from both leeward and windward sides, which refers to the trend of the invasion in the urban canopy and is unfavorable for vertical pollution diffusion. At the ends, the wind tends to flow out of the street at lower levels, which implies that the mass and energy are transported outside of the urban area horizontally at ground level.
For the scenario of a wider street, the wind is relatively stronger for the weaker blocking effects from the sparser building distribution. The direction of u inside the street is almost from the windward to the leeward side, and the scale on the leeward side is larger, which is favorable for accumulating heat and mass on the leeward side, leading to the heterogeneous distribution of meteorological fields. At both ends, the inflow on the windward side is stronger than the outflow on the leeward side, also promoting the heat and mass convergence in the urban area.
In general, the wind condition based on IWSUS is favorable for gathering heat and energy in the urban area, and the weaker wind and probable existence of an invasion layer in narrow streets might be more capable of accumulating heat and air pollutants. For the scenarios of inflow parallel to the street orientation, the specific fitting results can be found in the Supplement.
4.1 Comparison of IWSUS and observations
Figure 8 illustrates the verification of the inhomogeneous effects by validating the vertical wind profile and validates the wind speed profiles in IWSUS simulations by the observations. Figure 8a shows the arrangement of buildings around the observation point. As the heterogeneity of the urban canopy and wind speed in and over the observation spots is fully considered in IWSUS, a proper wind speed vertical profile can always be found in IWSUS to match the building arrangements around the observation position. Specifically for this example, the observation point is closer to the southeast side of the building in the street canyon, and we take the simulation wind over the representative position on the leeward side and the windward side in the street canyon in IWSUS to correspond to the southeast wind and northwest wind scenarios in the observation data.
As shown in Fig. 8b and c, when the leeward scenario (southeast wind, as shown in Fig. 8b) is triggered, the result by IWSUS is generally more consistent with the observations than that by the exp-log law. The horizontal wind speed below the building height maintains a low value of 0.098 in IWSUS, 0.055 in observations and 0.472 with the exp-log law, indicating that the performance of IWSUS is much better than that of the exp-log law. The NME analysis of wind speed shows that the error between IWSUS and observations is 67.0 % from the surface to 4 times the height of buildings, which is slightly lower than that of the exp-log law, 73.1 %. For the interior of the street canyon, the improvement in IWSUS is more obvious, from 756.3 % by the exp-log law to 78.0 % by IWSUS, which shows that IWSUS can grasp the wind profile characteristics of the leeward side of the street canyon well.
In the scenario of the windward side (northwest wind, Fig. 8c), the trend of IWSUS is basically consistent with the observations. The averaged wind speed by IWSUS is lower than observations in the street canyon, while that by the exp-log law is higher. NME analysis shows that the error between IWSUS and observations is 23.4 % from the surface to 4 times the height of the building, which is also slightly better than that of the exp-log law, 33.9 %. The improvement in the wind field inside the street canyon is obvious, from 196.2 % for the exp-log law to 45.6 % for IWSUS.
To sum up, the wind field simulation results by IWSUS in the street canyon fully consider the inhomogeneous characteristics of the near-surface wind field caused by the building street canyon in the urban canopy. Thus, the wind profile by IWSUS shows better agreement with the observed wind speed in the street canyon compared with the wind profile by the exp-log law.
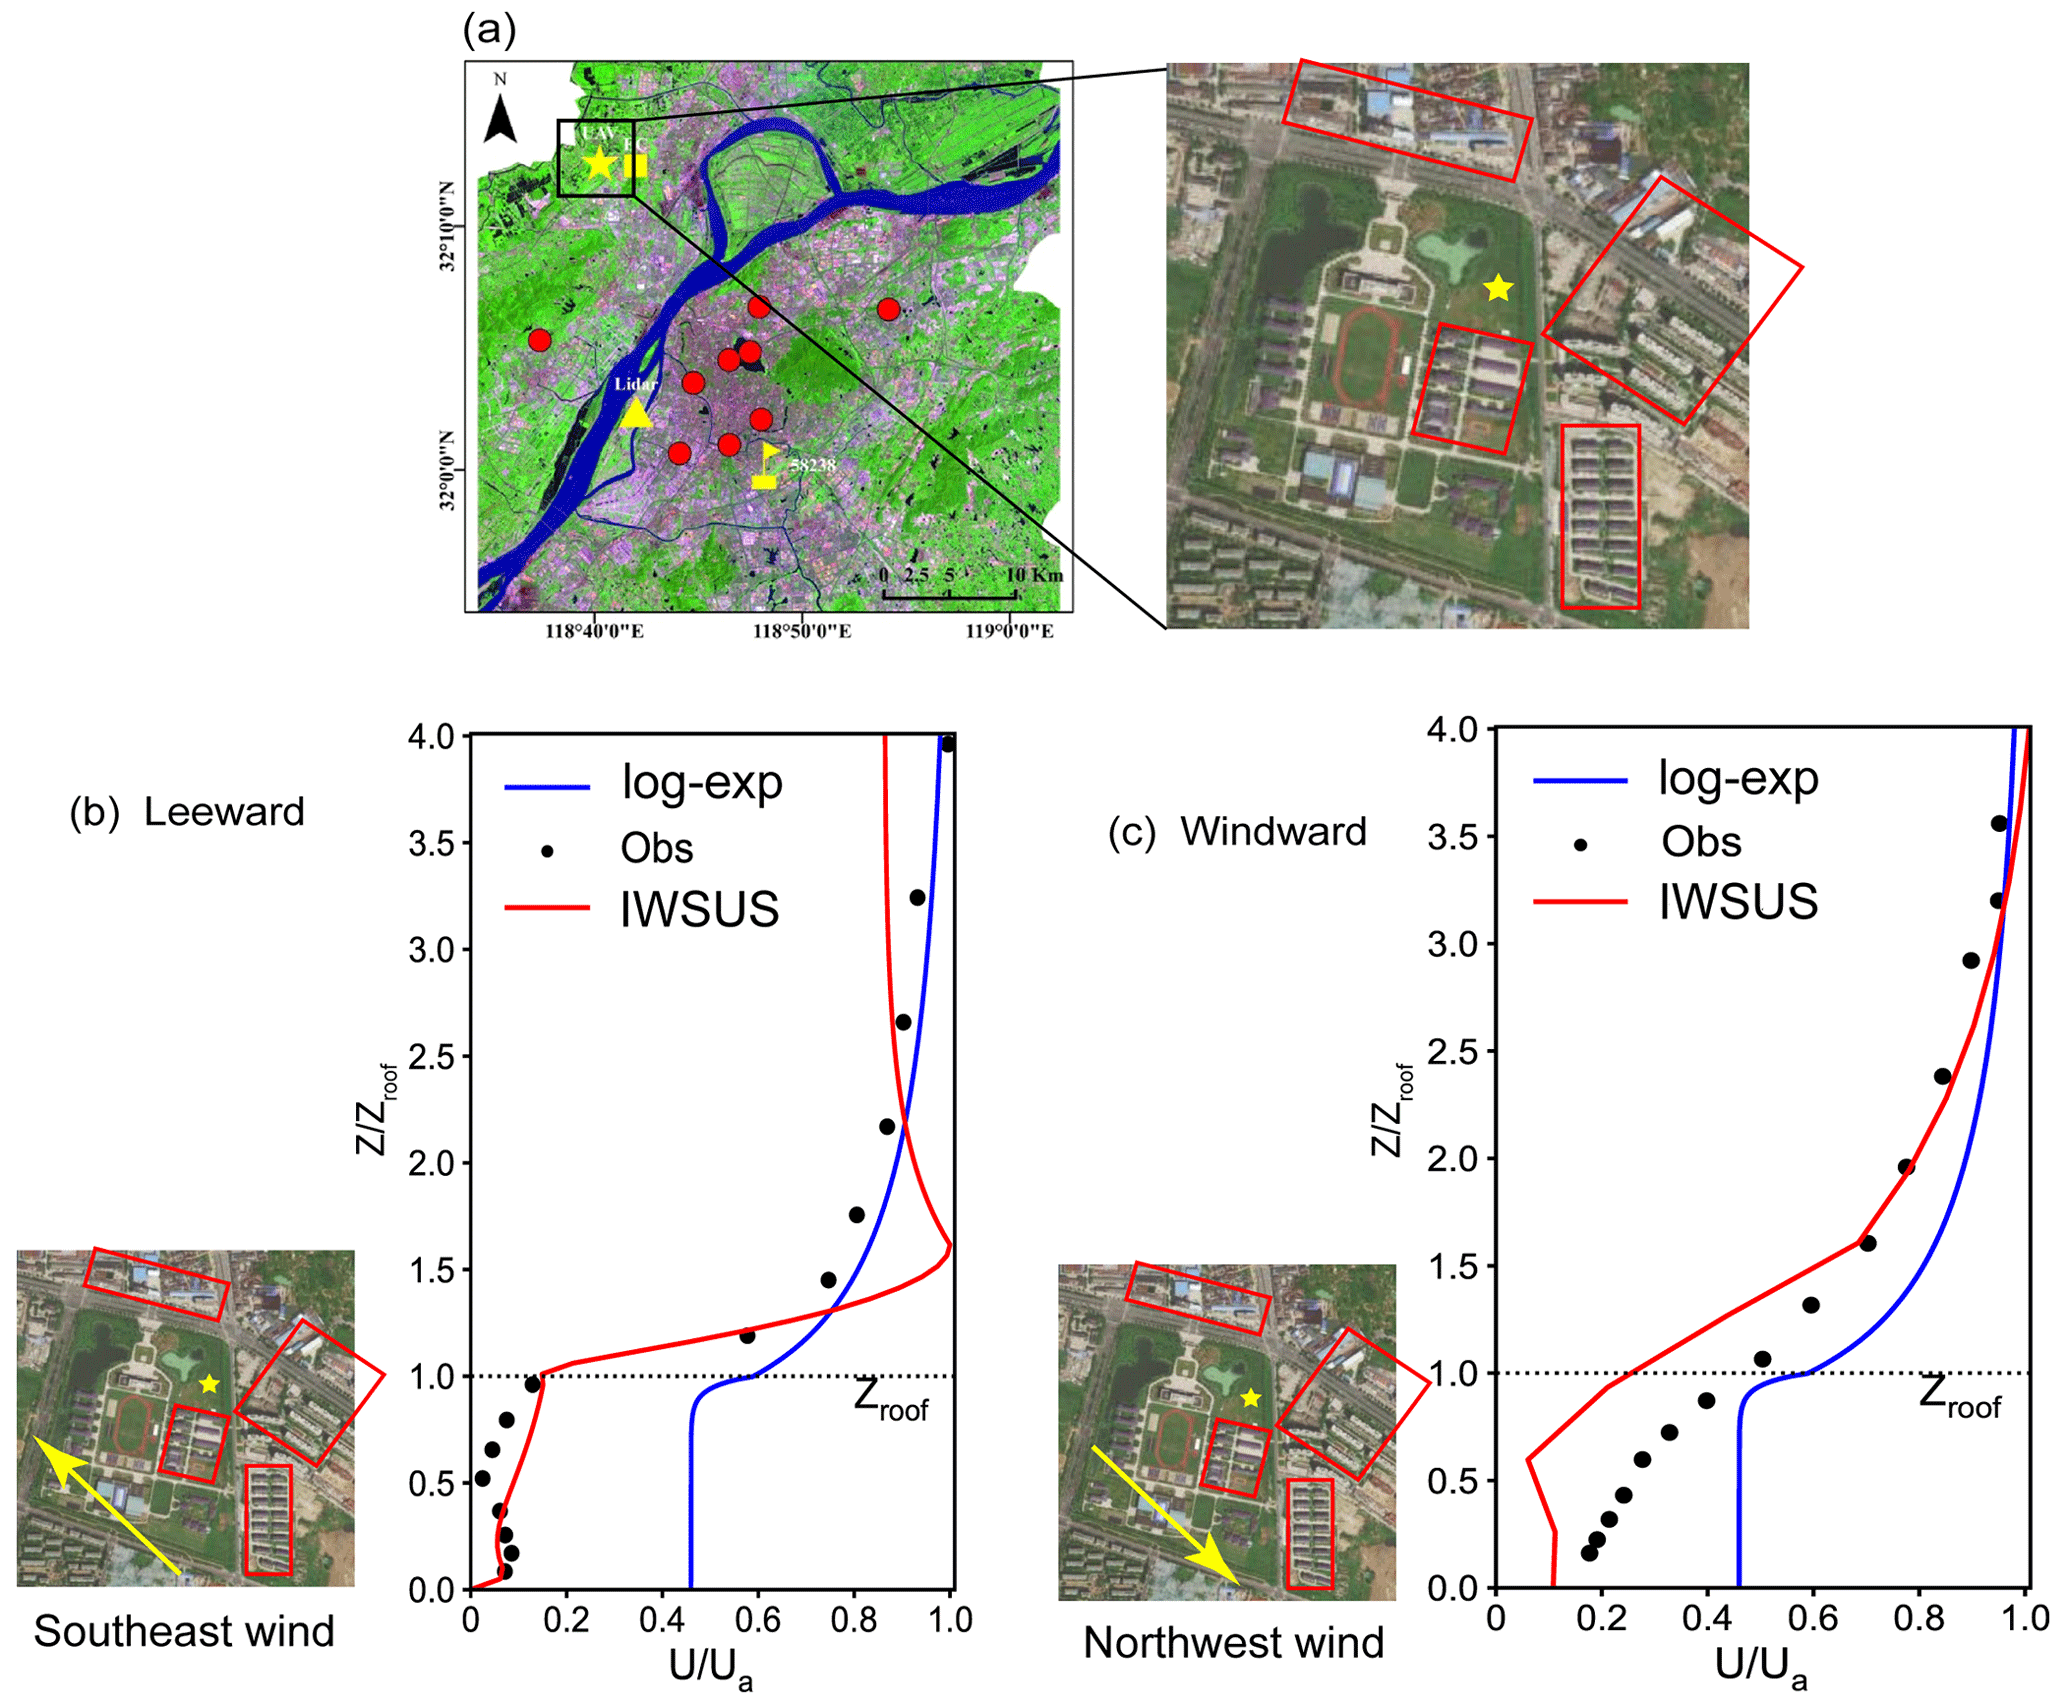
Figure 8Overall vertical wind profile comparisons between IWSUS, exp-log law and observations in various wind direction scenarios. The location of the observation point is marked as a yellow pentagram (Liu et al., 2020, 2021) in the left of panel (a) with the specific surrounding environment (from Baidu Maps) to the right; the red boxes are the main extent of the high-rise buildings nearby; panels (b) and (c) show the vertical wind profile obtained from IWSUS (red line), exp-log (blue line) and observations (black dots) at the observation site on the leeward side in the southeast wind scenarios and windward side in the northwest wind scenarios, respectively.
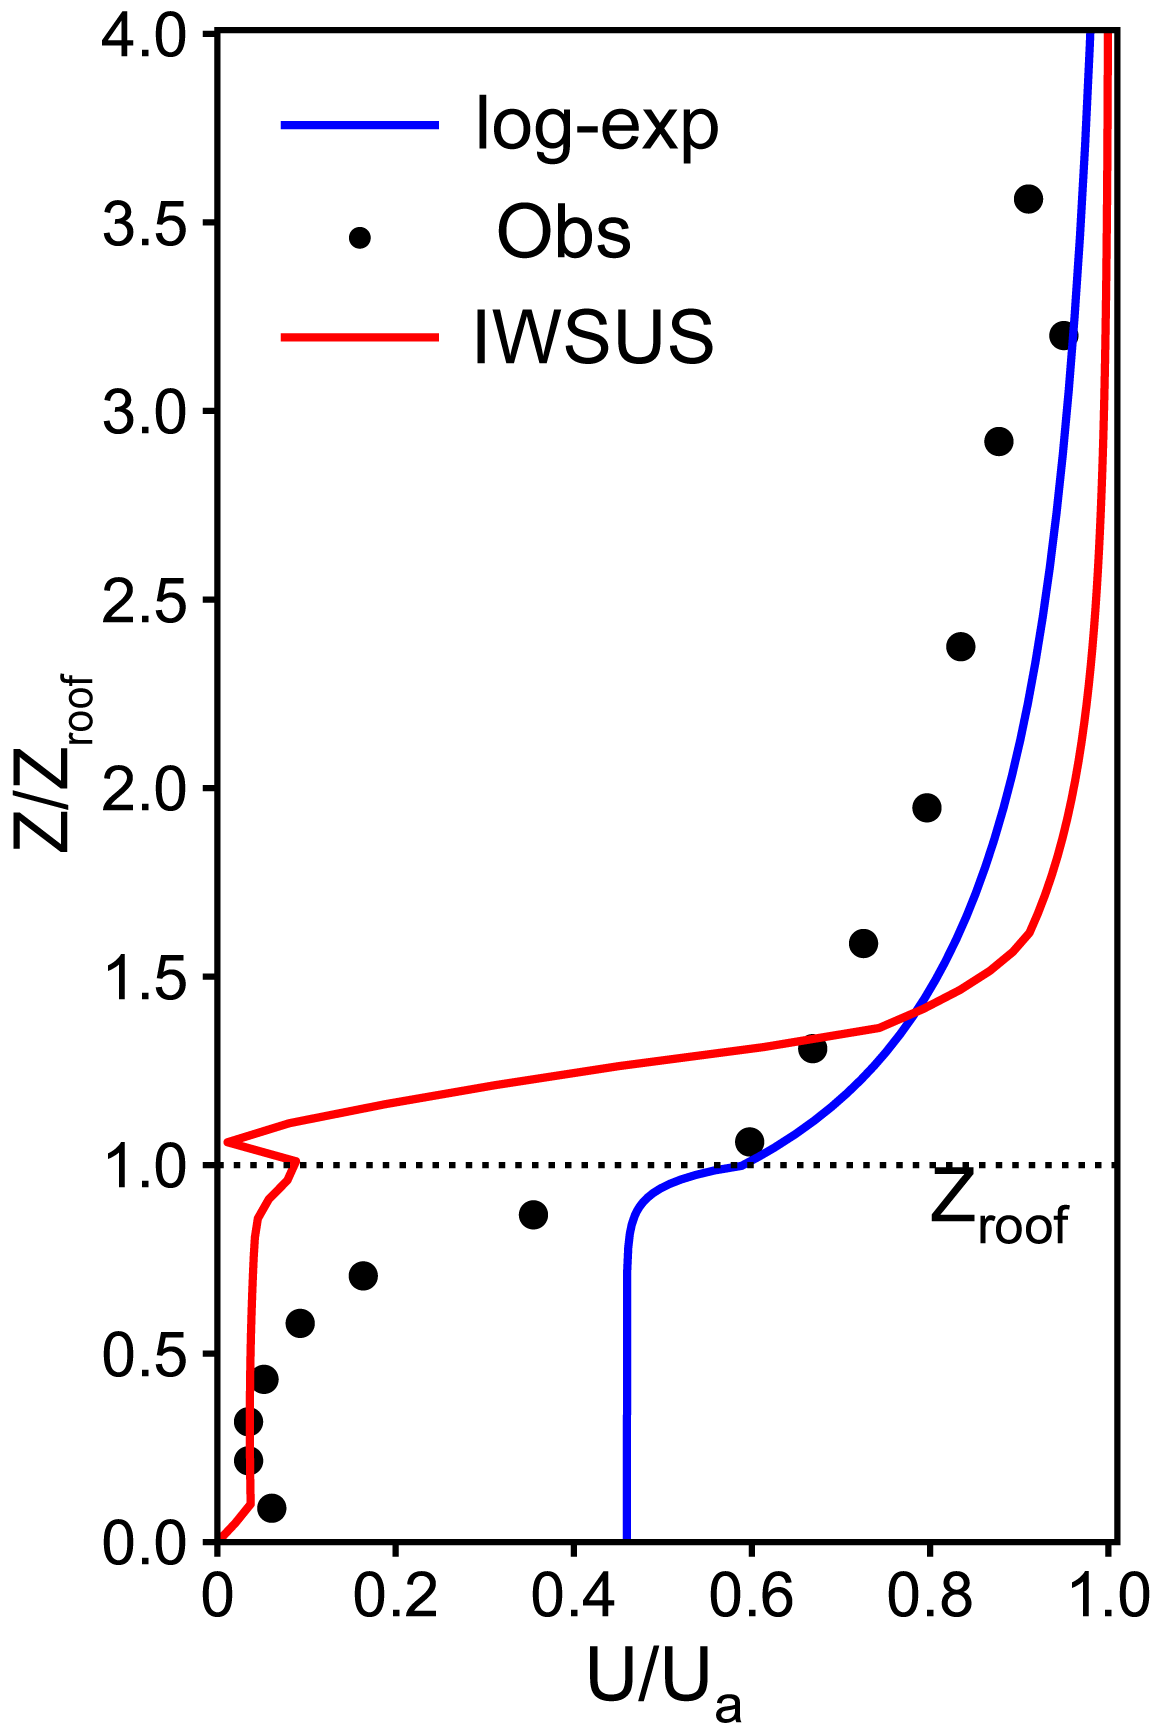
Figure 9 shows the horizontally averaged vertical wind profiles by overall grids of the urban canopy in IWSUS, the exp-log law and the observations. Below the building roof level, the wind speed from IWSUS is obviously closer to the observations than that by the exp-log law, which were obviously overestimated. Thus, IWSUS shows large improvement in the simulation of the averaged wind speed in the street canyon. This is mainly because in IWSUS, the effects of the wind speed in the street canyon by the inhomogeneity of the urban canopy – e.g., street orientation, the background wind speed and the differences in typical positions in the street canyon as set up in Sect. 2.2 – are fully considered. Thus, the various wind speeds in differently oriented streets, some of them even with the opposite direction at different locations in the street, result in the lower averaged wind speed by IWSUS in the model grid than that by the exponential–logarithmic law. The vertical variation in the wind speed in the street canyon both by IWSUS and the exponential–logarithmic law is relatively small. There is more deviation of wind speed by IWSUS compared to observations than that of the exp-log law in and around the height of H. It probably relates to the differences in real street canyon and our CFD setting: the buildings are set to have the same height in our CFD scenarios, while the building height somehow varies around the site of observations. For the levels above building roofs, both IWSUS and the exp-log law coincide with the observations because the inhomogeneity of the atmospheric flow field caused by the street canyon array is weak in the layers higher than the average height of buildings.
However, the thermal heterogeneity of the surfaces in the street canyon have not been further considered in our current study. The main purpose of replacing the exp-log scheme with IWSUS is to fully consider the aerodynamical heterogeneity in and over the urban street canyon. But the buoyancy and thermodynamic conditions also play very important roles in the wind and turbulence simulations over the urban areas. It should be focused on in future studies.
The normalized mean error (NME) is applied in our study to evaluate the wind speed error between simulations and observations. The NME of wind speed by IWSUS is 49.0 %, compared to 56.1 % by the exp-log law for the total vertical layers in the range from the ground to 4 times the average height of the buildings. For the vertically averaged wind speed in the street canyon (range from the ground to building top), the NME of wind speed by IWSUS is 70 %, while those by the exp-log law is 285.8 %. These results prove that the improvement in the vertical wind profiles by IWSUS is obvious compared with the exp-log scheme, which is widely used in most of the current urban models.
4.2 Comparison of surface flux for daily variation
Several modeling studies have shown that the overestimation of the surface fluxes and the lack of aerodynamical blocking effects from building arrays might be the main reasons for higher wind speed in the bottom of urban street canyons (Salamanca et al., 2018; Zhang et al., 2019). Meanwhile, the overestimated wind can also result in the underestimation of peak levels of air pollutants in air quality models since the stronger winds are favorable for the diffusion of pollutants (Jin et al., 2021; Ulpiani, 2021). Therefore, the performances of simulated surface energy flux by IWSUS are also validated in our study.
Table 8 gives the results of RES estimation by IWSUS and exp-log law wind profile with the aspect ratio equal to 1. Considering the different wind conditions, the weighted sum for two orthogonal inlet conditions – perpendicular and parallel to the street orientation, which are set as the base – is applied for RES estimation.
Table 8Average resistance (RES) obtained from IWSUS and exp-log for the urban surface with AR = 1. The RESs of walls, roads and roofs are calculated from IWSUS.
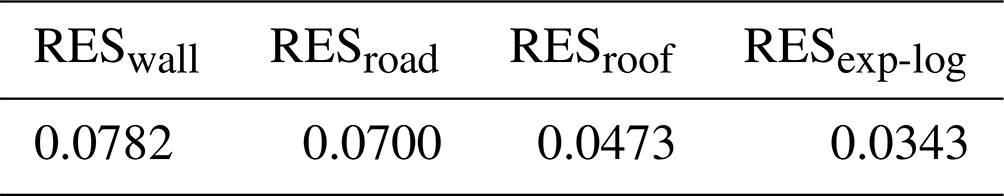
The results show that IWSUS gives larger RES over the different surfaces in the urban canopy than exp-log law does because the aerodynamic drag effects of the street canyon array of urban buildings are fully considered. Thus, IWSUS describes a lower wind speed effect in the street canyon perpendicular to the background wind field.
Furthermore, the daily variation in sensible heat flux is also calculated in IWSUS. The validations were based on observations in a street canyon in central Gothenburg, Sweden (57∘42′ N, 11∘58′ E), in summertime (Offerle et al., 2006). Both the hourly temperature and sensible heat flux in the street canyon were obtained from observations, while the simulated sensible heat fluxes from IWSUS and the exp-log law in Masson's study are calculated with Eqs. (10) to (12).
Figure 10 shows the daily variations in the sensible heat fluxes in IWSUS and by Masson's exponential–logarithmic wind profile scheme, respectively. The observed sensitive fluxes in urban street canyons were also applied for verification. The multiple options of wind directions and representative points were set to coincide with the surrounding environment of observation locations. The solid red line in the figure is the result by IWSUS method, the blue one is based on the exponential–logarithmic scheme and the dotted black line is the observations. It is indicated that diurnal variations in the sensitive fluxes by IWSUS are obviously more consistent with the observations than those by the exp-log law: the NME is 32.3 % lower in the daytime and 36.3 % lower at night by IWSUS than those by the exp-log law. Accordingly, if the IWSUS scheme is applied in the land surface model, the rise rate of near-ground temperature over the urban area during the day and the decline rate at night can be partly improved, since more rapid rising during the daytime and the dropping at night usually happen in most of the current mainstream land surface models for urban grids.
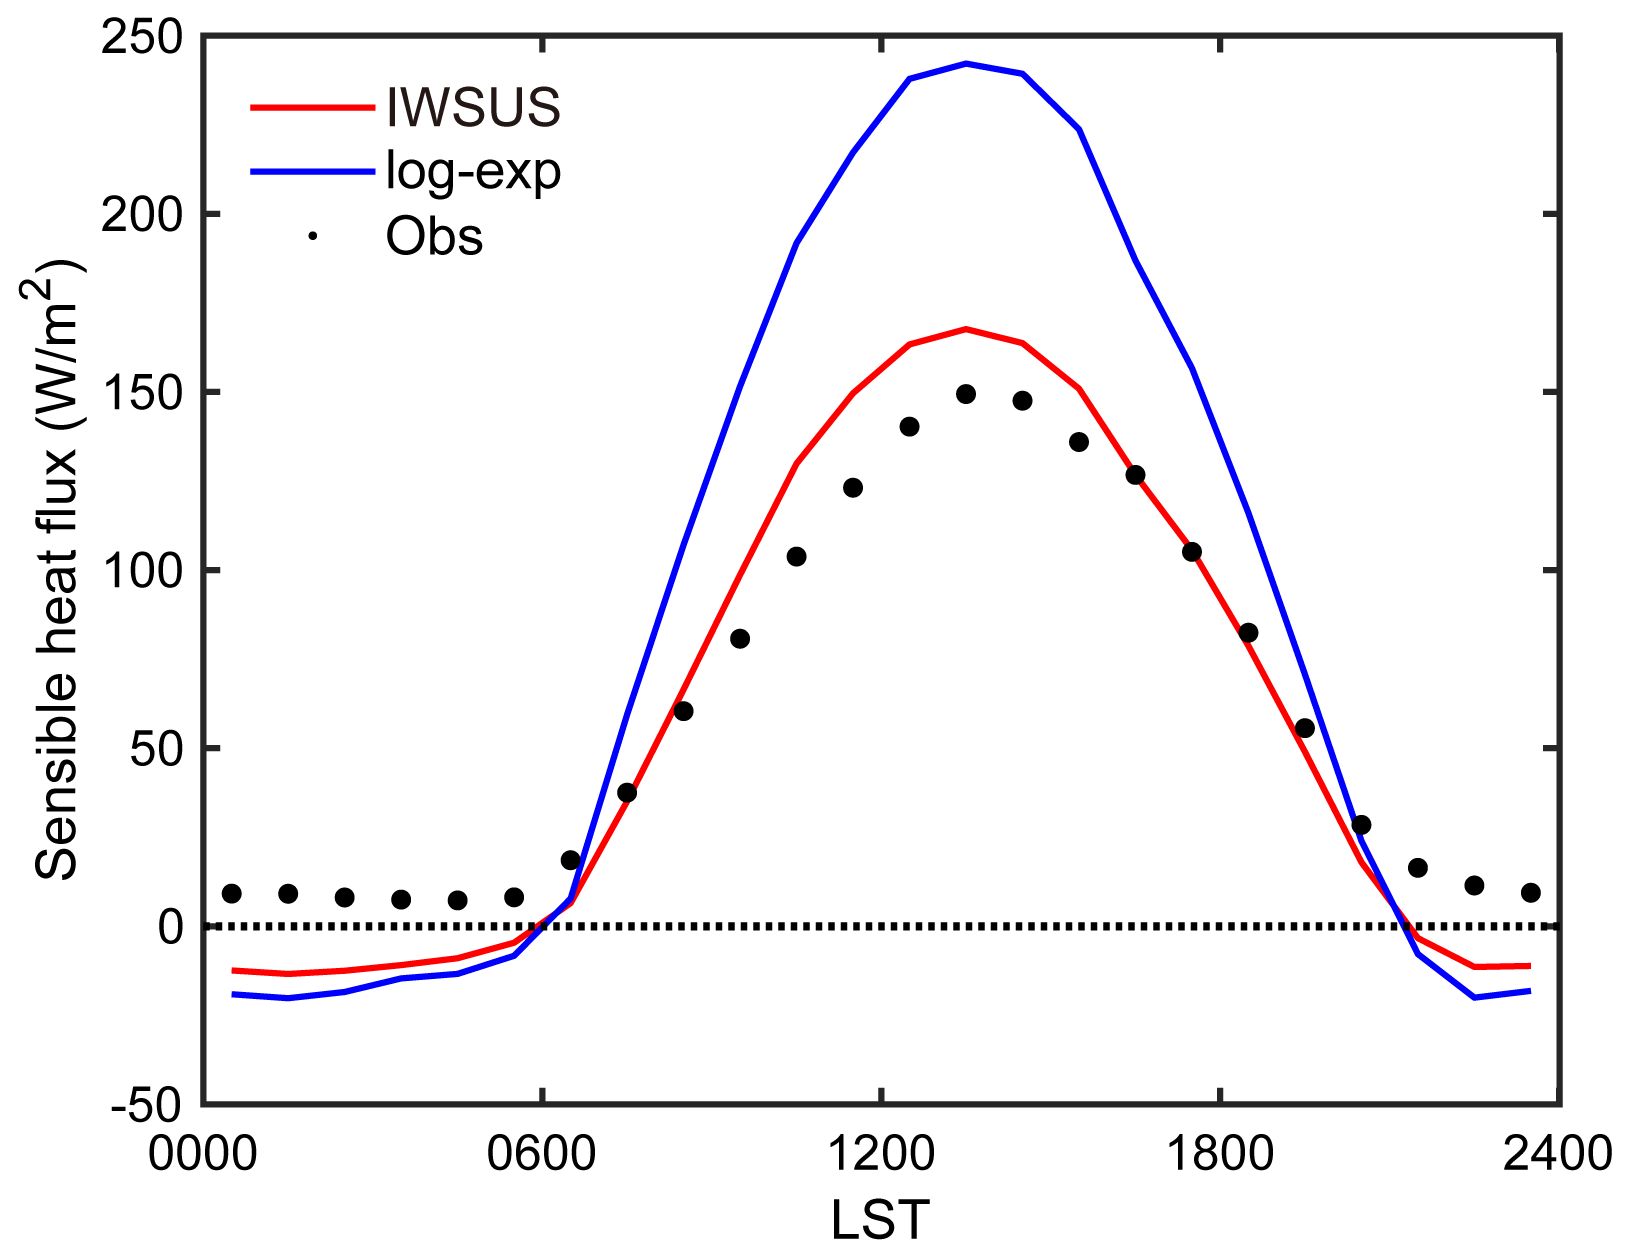
Figure 10Daily variation in sensible heat flux. The red line and blue line represent fluxes obtained from IWSUS and the exp-log law (Masson, 2000), respectively. Dots represent the flux observations from Offerle et al. (2006).
In this study, a new scheme, Inhomogeneous Wind Scheme for Urban Street (IWSUS), based on the CFD simulations was developed to represent the heterogeneity of wind fields in the urban building–street canyon. By comparison with the exp-log scheme which is widely used in most of the current urban canopy models, the IWSUS scheme performs better in describing the spatial heterogeneity of the wind field caused by the complex and heterogeneous urban canopy structure.
-
The wind speed vertical profiles in the IWSUS scheme are quite different from the traditional exponential–logarithmic wind profiles but in better agreement with the observations and CFD simulations because the exp-log wind speed scheme assumes a flat, open and homogeneous land surface, while IWSUS is based on the observations and CFD simulations of the complex and heterogeneous urban canopy structure.
-
In the IWSUS scheme, the wind speed/directions and street canyon geometry (denoted by AR) are taken into account as the main parameters to describe the homogenous wind field distribution in and over the complex and homogenous street canyon. The wind speed vertical profiles over the different representative positions vary in IWSUS. The result by IWSUS is in good agreement with the observations, and its performance is significantly better than that by the exp-log scheme in which the wind speed is uniform in the horizontal direction.
-
The horizontally averaged wind speed and near-surface energy flux over the urban area are simulated by the IWSUS scheme and compared with those by the exp-log scheme. The evaluation by observations shows that the accuracy of IWSUS is significantly higher than that by the exp-log scheme.
Therefore, IWSUS will be suitable for application in the simulation of low-atmospheric meteorological environmental processes in mesoscale atmospheric models.
All of the data generated during the current study and the code of IWSUS are available:
-
The data for all the results included in this paper can be found in Zonodo: https://doi.org/10.5281/zenodo.7372523 (Chen et al., 2022a); a document named supplement.docx, in which more figures and results are included, can also be found via the above link.
-
The source code for IWSUS-v0.1 and the test case can be downloaded at https://doi.org/10.5281/zenodo.7488104 (Chen et al., 2022b).
-
CFD models were used in this study for the simulation of perpendicular and parallel scenarios; all of the files of model settings and simulation output are also available at https://doi.org/10.5281/zenodo.7371305 (Chen et al., 2022c) and https://doi.org/10.5281/zenodo.7371804 (Chen et al., 2022d).
-
The coupling codes for IWSUS-v0.1 with the Weather Research and Forecasting model (WRFV3.9.1.1) and Gothenburg case can be downloaded at https://github.com/krmyArag/IWSUS (last access: 20 July 2023; DOI: https://doi.org/10.5281/zenodo.8167365, Chen et al., 2023).
The supplement related to this article is available online at: https://doi.org/10.5194/gmd-16-4385-2023-supplement.
ZL contributed to the conception and methodology of the study; the work of CFD simulations and parameterization was performed and provided by YC; the field experiments and observation data were provided by CL; and YW, HL and SL provided key expert guidance on the initial settings of simulation experiments. The paper was written by ZL and YC.
The contact author has declared that none of the authors has any competing interests.
Publisher’s note: Copernicus Publications remains neutral with regard to jurisdictional claims in published maps and institutional affiliations.
The authors also would like to thank both reviewers for their constructive and helpful comments and suggestions on the manuscript. We acknowledge the High-Performance Computing Centre of Nanjing University of Information Science and Technology for their support of this work.
This research has been supported by the Natural Science Foundation of Jiangsu Province (grant no. BK20220031) and the National Natural Science Foundation of China (grant nos. 41630530 and 41405019).
This paper was edited by Leena Järvi and reviewed by X.-L. Cheng and one anonymous referee.
Chen, Y., Liu, Z., Wang, Y., Liu, C., Liu, S., and Liao, H.: krmyArag/IWSUS: IWSUS Gothenburg case v0.1 (Urban), Zenodo [code], https://doi.org/10.5281/zenodo.8167365, 2023.
Ai, Z. T. and Mak, C. M.: CFD simulation of flow in a long street canyon under a perpendicular wind direction: Evaluation of three computational settings, Build. Environ., 114, 293–306, https://doi.org/10.1016/j.buildenv.2016.12.032, 2017.
Ai, Z. T. and Mak, C. M.: Wind-induced single-sided natural ventilation in buildings near a long street canyon: CFD evaluation of street configuration and envelope design, J. Wind Eng. Ind. Aerod., 172, 96–106, https://doi.org/10.1016/j.jweia.2017.10.024, 2018.
Baklanov, A. A., Grisogono, B., Bornstein, R., Mahrt, L., Zilitinkevich, S. S., Taylor, P., Larsen, S. E., Rotach, M. W., and Fernando, H.: The nature, theory, and modeling of atmospheric planetary boundary layers, B. Am. Meteorol. Soc., 92, 123–128, https://doi.org/10.1175/2010BAMS2797.1, 2011.
Banks, R. F., Tiana-Alsina, J., Rocadenbosch, F., and Baldasano, J. M.: Performance Evaluation of the Boundary-Layer Height from Lidar and the Weather Research and Forecasting Model at an Urban Coastal Site in the North-East Iberian Peninsula, Bound.-Lay. Meteorol., 157, 265–292, https://doi.org/10.1007/s10546-015-0056-2, 2015.
Castro, I. P.: Are Urban-Canopy Velocity Profiles Exponential?, Bound.-Lay. Meteorol., 164, 337–351, https://doi.org/10.1007/s10546-017-0258-x, 2017.
Chen, Y., Cai, J., Wang, Z., Peng, C., Yao, X., Tian, M., Han, Y., Shi, G., Shi, Z., Liu, Y., Yang, X., Zheng, M., Zhu, T., He, K., Zhang, Q., and Yang, F.: Simultaneous measurements of urban and rural particles in Beijing – Part 1: Chemical composition and mixing state, Atmos. Chem. Phys., 20, 9231–9247, https://doi.org/10.5194/acp-20-9231-2020, 2020.
Chen, Y., Liu, Z., Wang, Y., Liu, C., Liu, S., and Liao, H.: The development and validation of an Inhomogeneous Wind Scheme for Urban Street, Zenodo [data set], https://doi.org/10.5281/zenodo.7372523, 2022a.
Chen, Y., Liu, Z., Wang, Y., Liu, C., Liu, S., and Liao, H.: Inhomogeneous Wind Scheme of Urban Street v0.1 (IWSUS-v0.1) (0.1), Zenodo [code], https://doi.org/10.5281/zenodo.7488104, 2022b.
Chen, Y., Liu, Z., Wang, Y., Liu, C., Liu, S., and Liao, H.: The development and validation of an Inhomogeneous Wind Scheme for Urban Street, Part B: perpendicular CFD simulations, Zenodo [data set], https://doi.org/10.5281/zenodo.7371305, 2022c.
Chen, Y., Liu, Z., Wang, Y., Liu, C., Liu, S., and Liao, H.: The development and validation of an Inhomogeneous Wind Scheme for Urban Street, part C: parallel CFD simulations, Zenodo [data set], https://doi.org/10.5281/zenodo.7371804, 2022d.
Colter, K. R., Middel, A. C., and Martin, C. A.: Effects of natural and artificial shade on human thermal comfort in residential neighborhood parks of Phoenix, Arizona, USA, Urban For. Urban Gree., 44, 124629, https://doi.org/10.1016/j.ufug.2019.126429, 2019.
de Arruda Moreira, G., Luis Guerrero-Rascado, J., Antonio Bravo-Aranda, J., Foyo-Moreno, I., Cazorla, A., Alados, I., Lyamani, H., Landulfo, E., and Alados-Arboledas, L.: Study of the planetary boundary layer height in an urban environment using a combination of microwave radiometer and ceilometer, Atmos. Res., 240, 104932, https://doi.org/10.1016/j.atmosres.2020.104932, 2020.
Deng, X., Cao, W., Huo, Y., Yang, G., Yu, C., He, D., Deng, W., Fu, W., Ding, H., Zhai, J., Cheng, L., and Zhao, X.: Meteorological conditions during a severe, prolonged regional heavy air pollution episode in eastern China from December 2016 to January 2017, Theor. Appl. Climatol., 135, 1105–1122, https://doi.org/10.1007/s00704-018-2426-4, 2018.
Fallmann, J., Forkel, R., and Emeis, S.: Secondary effects of urban heat island mitigation measures on air quality, Atmos. Environ., 125, 199–211, https://doi.org/10.1016/j.atmosenv.2015.10.094, 2016.
Ganbat, G., Baik, J.-J., and Ryu, Y.-H.: A numerical study of the interactions of urban breeze circulation with mountain slope winds, Theor. Appl. Climatol., 120, 123–135, https://doi.org/10.1007/s00704-014-1162-7, 2014a.
Ganbat, G., Seo, J. M., Han, J.-Y., and Baik, J.-J.: A theoretical study of the interactions of urban breeze circulation with mountain slope winds, Theor. Appl. Climatol., 121, 545–555, https://doi.org/10.1007/s00704-014-1252-6, 2014b.
Haman, C. L., Lefer, B., and Morris, G. A.: Seasonal Variability in the Diurnal Evolution of the Boundary Layer in a Near-Coastal Urban Environment, J. Atmos. Ocean. Tech., 29, 697–710, https://doi.org/10.1175/jtech-d-11-00114.1, 2012.
Harrison, R. M.: Urban atmospheric chemistry: a very special case for study, npj Climate and Atmospheric Science, 1, 20175–20180, https://doi.org/10.1038/s41612-017-0010-8, 2018.
Hertwig, D., Efthimiou, G. C., Bartzis, J. G., and Leitl, B.: CFD-RANS model validation of turbulent flow in a semi-idealized urban canopy, J. Wind Eng. Ind. Aerod., 111, 61–72, https://doi.org/10.1016/j.jweia.2012.09.003, 2012.
Huang, M., Gao, Z., Miao, S., Chen, F., LeMone, M. A., Li, J., Hu, F., and Wang, L.: Estimate of Boundary-Layer Depth Over Beijing, China, Using Doppler Lidar Data During SURF-2015, Bound.-Lay. Meteorol., 162, 503–522, https://doi.org/10.1007/s10546-016-0205-2, 2017.
Huang, Y.-D., Hou, R.-W., Liu, Z.-Y., Song, Y., Cui, P.-Y., and Kim, C.-N.: Effects of Wind Direction on the Airflow and Pollutant Dispersion inside a Long Street Canyon, Aerosol Air Qual. Res., 19, 1152–1171, https://doi.org/10.4209/aaqr.2018.09.0344, 2019.
Husain, S. Z., Bélair, S., Mailhot, J., and Leroyer, S.: Improving the Representation of the Nocturnal Near-Neutral Surface Layer in the Urban Environment with a Mesoscale Atmospheric Model, Bound.-Lay. Meteorol., 147, 525–551, https://doi.org/10.1007/s10546-013-9798-x, 2013.
Jaenicke, B., Meier, F., Fenner, D., Fehrenbach, U., Holtmann, A., and Scherer, D.: Urban-rural differences in near-surface air temperature as resolved by the Central Europe Refined analysis (CER): sensitivity to planetary boundary layer schemes and urban canopy models, Int. J. Climatol., 37, 2063–2079, https://doi.org/10.1002/joc.4835, 2017.
Jin, X., Cai, X., Huang, Q., Wang, X., Song, Y., and Zhu, T.: Atmospheric Boundary Layer-Free Troposphere Air Exchange in the North China Plain and its Impact on PM2.5 Pollution, J. Geophys. Res.-Atmos., 126, e2021JD034641, https://doi.org/10.1029/2021JD034641, 2021.
Kadaverugu, R., Sharma, A., Matli, C., and Biniwale, R.: High Resolution Urban Air Quality Modeling by Coupling CFD and Mesoscale Models: a Review, Asia-Pac. J. Atmos. Sci., 55, 539–556, https://doi.org/10.1007/s13143-019-00110-3, 2019.
Khalil, M. A. K.: Steady states and transport processes in urban ozone balances, npj Climate and Atmospheric Science, 1, 22–29, https://doi.org/10.1038/s41612-018-0035-7, 2018.
Kusaka, H., Kondo, H., Kikegawa, Y., and Kimura, F.: A simple single-layer urban canopy model for atmospheric models: Comparison with multi-layer and slab models, Bound.-Lay. Meteorol., 101, 329–358, 2001.
Kusaka, H., Chen, F., Tewari, M., Dudhia, J., Gill, D. O., Duda, M. G., Wang, W., and Miya, Y.: Numerical Simulation of Urban Heat Island Effect by the WRF Model with 4-km Grid Increment: An Inter-Comparison Study between the Urban Canopy Model and Slab Model, J. Meteorol. Soc. Jpn. Ser. II, 90B, 33–45, https://doi.org/10.2151/jmsj.2012-B03, 2012.
Li, H., Meier, F., Lee, X., Chakraborty, T., Liu, J., Schaap, M., and Sodoudi, S.: Interaction between urban heat island and urban pollution island during summer in Berlin, Sci. Total Environ., 636, 818–828, https://doi.org/10.1016/j.scitotenv.2018.04.254, 2018.
Li, J., Zhou, M., Lenschow, D. H., Cheng, Z., and Dou, Y.: Observed Relationships Between the Urban Heat Island, Urban Pollution Island, and Downward Longwave Radiation in the Beijing Area, Earth and Space Science, 7, e2020EA001100, https://doi.org/10.1029/2020ea001100, 2020.
Liu, C., Huang, J., Wang, Y., Tao, X., Hu, C., Deng, L., Xu, J., Xiao, H. W., Luo, L., Xiao, H. Y., and Xiao, W.: Vertical distribution of PM2.5 and interactions with the atmospheric boundary layer during the development stage of a heavy haze pollution event, Sci. Total Environ., 704, 135329, https://doi.org/10.1016/j.scitotenv.2019.135329, 2020.
Liu, C., Huang, J., Hu, X.-M., Hu, C., Wang, Y., Fang, X., Luo, L., Xiao, H.-W., and Xiao, H.-Y.: Evaluation of WRF-Chem simulations on vertical profiles of PM2.5 with UAV observations during a haze pollution event, Atmos. Environ., 252, 11832, https://doi.org/10.1016/j.atmosenv.2021.118332, 2021.
Martilli, A.: Numerical Study of Urban Impact on Boundary Layer Structure: Sensitivity to Wind Speed, Urban Morphology, and Rural Soil Moisture, J. Appl. Meteorol. Clim., 41, 1247–1266, https://doi.org/10.1175/1520-0450(2002)041<1247:NSOUIO>2.0.CO;2, 2002.
Masson, V.: A physically-based scheme for the urban energy budget in atmospheric models, Bound.-Lay. Meteorol., 94, 357–397, https://doi.org/10.1023/A:1002463829265, 2000.
Masson, V., Heldens, W., Bocher, E., Bonhomme, M., Bucher, B., Burmeister, C., de Munck, C., Esch, T., Hidalgo, J., Kanani-Sühring, F., Kwok, Y.-T., Lemonsu, A., Lévy, J.-P., Maronga, B., Pavlik, D., Petit, G., See, L., Schoetter, R., Tornay, N., Votsis, A., and Zeidler, J.: City-descriptive input data for urban climate models: Model requirements, data sources and challenges, Urban Climate, 31, 100536, https://doi.org/10.1016/j.uclim.2019.100536, 2020.
Miao, S. and Chen, F.: Enhanced modeling of latent heat flux from urban surfaces in the Noah/single-layer urban canopy coupled model, Sci. China Earth Sci., 57, 2408–2416, https://doi.org/10.1007/s11430-014-4829-0, 2014.
Miao, S., Chen, F., LeMone, M. A., Tewari, M., Li, Q., and Wang, Y.: An Observational and Modeling Study of Characteristics of Urban Heat Island and Boundary Layer Structures in Beijing, J. Appl. Meteorol. Clim., 48, 484–501, https://doi.org/10.1175/2008jamc1909.1, 2009.
Miao, Y. and Liu, S.: Linkages between aerosol pollution and planetary boundary layer structure in China, Sci. Total Environ., 650, 288–296, https://doi.org/10.1016/j.scitotenv.2018.09.032, 2019.
Miao, Y., Liu, S., Zheng, Y., Wang, S., Liu, Z., and Zhang, B.: Numerical study of the effects of Planetary Boundary Layer structure on the pollutant dispersion within built-up areas, J. Environ. Sci., 32, 168–179, https://doi.org/10.1016/j.jes.2014.10.025, 2015.
Mirzaei, P. A.: CFD modeling of micro and urban climates: Problems to be solved in the new decade, Sustain. Cities Soc., 69, 102839, https://doi.org/10.1016/j.scs.2021.102839, 2021.
Nair, U. S., McNider, R., Patadia, F., Christopher, S. A., and Fuller, K.: Sensitivity of nocturnal boundary layer temperature to tropospheric aerosol surface radiative forcing under clear-sky conditions, J. Geophys. Res.-Atmos., 116, D02205, https://doi.org/10.1029/2010JD014068, 2011.
Offerle, B., Eliasson, I., Grimmond, C. S. B., and Holmer, B.: Surface heating in relation to air temperature, wind and turbulence in an urban street canyon, Bound.-Lay. Meteorol., 122, 273–292, https://doi.org/10.1007/s10546-006-9099-8, 2006.
Paul, S., Ghosh, S., Mathew, M., Devanand, A., Karmakar, S., and Niyogi, D.: Increased Spatial Variability and Intensification of Extreme Monsoon Rainfall due to Urbanization, Sci. Rep., 8, 3918, https://doi.org/10.1038/s41598-018-22322-9, 2018.
Peng, Y., Wang, H., Zhang, X., Zhao, T., Jiang, T., Che, H., Zhang, X., Zhang, W., and Liu, Z.: Impacts of PBL schemes on PM2.5 simulation and their responses to aerosol-radiation feedback in GRAPES_CUACE model during severe haze episodes in Jing-Jin-Ji, China, Atmos. Res., 248, 105268, https://doi.org/10.1016/j.atmosres.2020.105268, 2021.
Ren, Y., Zhang, H., Wei, W., Wu, B., Cai, X., and Song, Y.: Effects of turbulence structure and urbanization on the heavy haze pollution process, Atmos. Chem. Phys., 19, 1041–1057, https://doi.org/10.5194/acp-19-1041-2019, 2019a.
Ren, Y., Zhang, H., Wei, W., Wu, B., Liu, J., Cai, X., and Song, Y.: Comparison of the turbulence structure during light and heavy haze pollution episodes, Atmos. Res., 230, 104645, https://doi.org/10.1016/j.atmosres.2019.104645, 2019b.
Ren, Z., Zheng, H., He, X., Zhang, D., Yu, X., and Shen, G.: Spatial estimation of urban forest structures with Landsat TM data and field measurements, Urban For. Urban Gree., 14, 336–344, https://doi.org/10.1016/j.ufug.2015.03.008, 2015.
Ryu, Y.-H. and Baik, J.-J.: Daytime Local Circulations and Their Interactions in the Seoul Metropolitan Area, J. Appl. Meteorol. Clim., 52, 784–801, https://doi.org/10.1175/jamc-d-12-0157.1, 2013.
Saiz-Lopez, A., Notario, A., Albaladejo, J., and McFiggans, G.: Seasonal Variation of NOx Loss Processes Coupled to the HNO3 Formation in a Daytime Urban Atmosphere: A Model Study, Water Air Soil Poll., 182, 197–206, https://doi.org/10.1007/s11270-006-9332-6, 2007.
Salamanca, F., Zhang, Y., Barlage, M., Chen, F., Mahalov, A., and Miao, S.: Evaluation of the WRF-Urban Modeling System Coupled to Noah and Noah-MP Land Surface Models Over a Semiarid Urban Environment, J. Geophys. Res.-Atmos., 123, 2387–2408, https://doi.org/10.1002/2018jd028377, 2018.
Santiago, J. L., Sanchez, B., Quaassdorff, C., de la Paz, D., Martilli, A., Martín, F., Borge, R., Rivas, E., Gómez-Moreno, F. J., Díaz, E., Artiñano, B., Yagüe, C., and Vardoulakis, S.: Performance evaluation of a multiscale modelling system applied to particulate matter dispersion in a real traffic hot spot in Madrid (Spain), Atmos. Pollut. Res., 11, 141–155, https://doi.org/10.1016/j.apr.2019.10.001, 2020.
Schubert, S. and Grossman-Clarke, S.: Evaluation of the coupled COSMO-CLM/DCEP model with observations from BUBBLE, Q. J. Roy. Meteor. Soc., 140, 2465–2483, https://doi.org/10.1002/qj.2311, 2014.
Sha, J., Zou, J., and Sun, J.: Observational study of land-atmosphere turbulent flux exchange over complex underlying surfaces in urban and suburban areas, Sci. China Earth Sci., 64, 1050–1064, https://doi.org/10.1007/s11430-020-9783-2, 2021.
Sützl, B. S., Rooney, G. G., and van Reeuwijk, M.: Drag Distribution in Idealized Heterogeneous Urban Environments, Bound.-Lay. Meteorol., 178, 225–248, https://doi.org/10.1007/s10546-020-00567-0, 2020.
Thatcher, M. and Hurley, P.: Simulating Australian Urban Climate in a Mesoscale Atmospheric Numerical Model, Bound.-Lay. Meteorol., 142, 149–175, https://doi.org/10.1007/s10546-011-9663-8, 2011.
Ulpiani, G.: On the linkage between urban heat island and urban pollution island: Three-decade literature review towards a conceptual framework, Sci. Total Environ., 751, 141727, https://doi.org/10.1016/j.scitotenv.2020.141727, 2021.
Xu, J., Yan, F., Xie, Y., Wang, F., Wu, J., and Fu, Q.: Impact of meteorological conditions on a nine-day particulate matter pollution event observed in December 2013, Shanghai, China, Particuology, 20, 69–79, https://doi.org/10.1016/j.partic.2014.09.001, 2015.
Xue, W., Shi, X., Yan, G., Wang, J., Xu, Y., Tang, Q., Wang, Y., Zheng, Y., and Lei, Y.: Impacts of meteorology and emission variations on the heavy air pollution episode in North China around the 2020 Spring Festival, Sci. China Earth Sci., 64, 329–339, https://doi.org/10.1007/s11430-020-9683-8, 2021.
Yang, G., Ren, G., Zhang, P., Xue, X., Tysa, S. K., Jia, W., Qin, Y., Zheng, X., and Zhang, S.: PM2.5 Influence on Urban Heat Island (UHI) Effect in Beijing and the Possible Mechanisms, J. Geophys. Res.-Atmos., 126, e2021JD035227, https://doi.org/10.1029/2021jd035227, 2021.
Zhang, D.-L., Jin, M. S., Shou, Y., and Dong, C.: The Influences of Urban Building Complexes on the Ambient Flows over the Washington–Reston Region, J. Appl. Meteorol. Clim., 58, 1325–1336, https://doi.org/10.1175/jamc-d-19-0037.1, 2019.
Zhu, K., Xie, M., Wang, T., Cai, J., Li, S., and Feng, W.: A modeling study on the effect of urban land surface forcing to regional meteorology and air quality over South China, Atmos. Environ., 152, 389–404, https://doi.org/10.1016/j.atmosenv.2016.12.053, 2017.