the Creative Commons Attribution 4.0 License.
the Creative Commons Attribution 4.0 License.
 | 29 Jun 2023
Formulation, optimization, and sensitivity of NitrOMZv1.0, a biogeochemical model of the nitrogen cycle in oceanic oxygen minimum zones
Daniele Bianchi
Daniel McCoy
Simon Yang
Nitrogen (N) plays a central role in marine biogeochemistry by limiting biological productivity in the surface ocean; influencing the cycles of other nutrients, carbon, and oxygen; and controlling oceanic emissions of nitrous oxide (N2O) to the atmosphere. Multiple chemical forms of N are linked together in a dynamic N cycle that is especially active in oxygen minimum zones (OMZs), where high organic matter remineralization and low oxygen concentrations fuel aerobic and anaerobic N transformations. Biogeochemical models used to understand the oceanic N cycle and project its change often employ simple parameterizations of the network of N transformations and omit key intermediary tracers such as nitrite (NO) and N2O. Here we present a new model of the oceanic N cycle (Nitrogen cycling in Oxygen Minimum Zones, or NitrOMZ) that resolves N transformation occurring within OMZs and their sensitivity to environmental drivers. The model is designed to be easily coupled to current ocean biogeochemical models by representing the major forms of N as prognostic tracers and parameterizing their transformations as a function of seawater chemistry and organic matter remineralization, with minimal interference in other elemental cycles. We describe the model rationale, formulation, and numerical implementation in a one-dimensional representation of the water column that reproduces typical OMZ conditions. We further detail the optimization of uncertain model parameters against observations from the eastern tropical South Pacific OMZ and evaluate the model's ability to reproduce observed profiles of N tracers and transformation rates in this region. We conclude by describing the model's sensitivity to parameter choices and environmental factors and discussing the model's suitability for ocean biogeochemical studies.
- Article
(8776 KB) - Full-text XML
- BibTeX
- EndNote


Nitrogen (N) limits phytoplankton production over large swathes of the ocean (Moore et al., 2013). Most of the N in the ocean is present as dissolved dinitrogen gas (N2); however, only fixed N, e.g., ammonium () and nitrate (), can be readily utilized by planktonic microorganisms, with the exception of N-fixing diazotrophs (Capone et al., 2008). The inventory and chemical form of N in the ocean are controlled by an active nitrogen cycle, whereby different chemical forms of the element are utilized as substrates for growth by a variety of microorganisms, either to supply building blocks for organic molecules or to fuel metabolism via redox reactions (Capone et al., 2008; Kuypers et al., 2018). As a result, the residence time of fixed N in the ocean is on the order of 3000 years or less, about 1 order of magnitude shorter than for the macronutrient phosphorous (Gruber and Galloway, 2008; Wang et al., 2019).
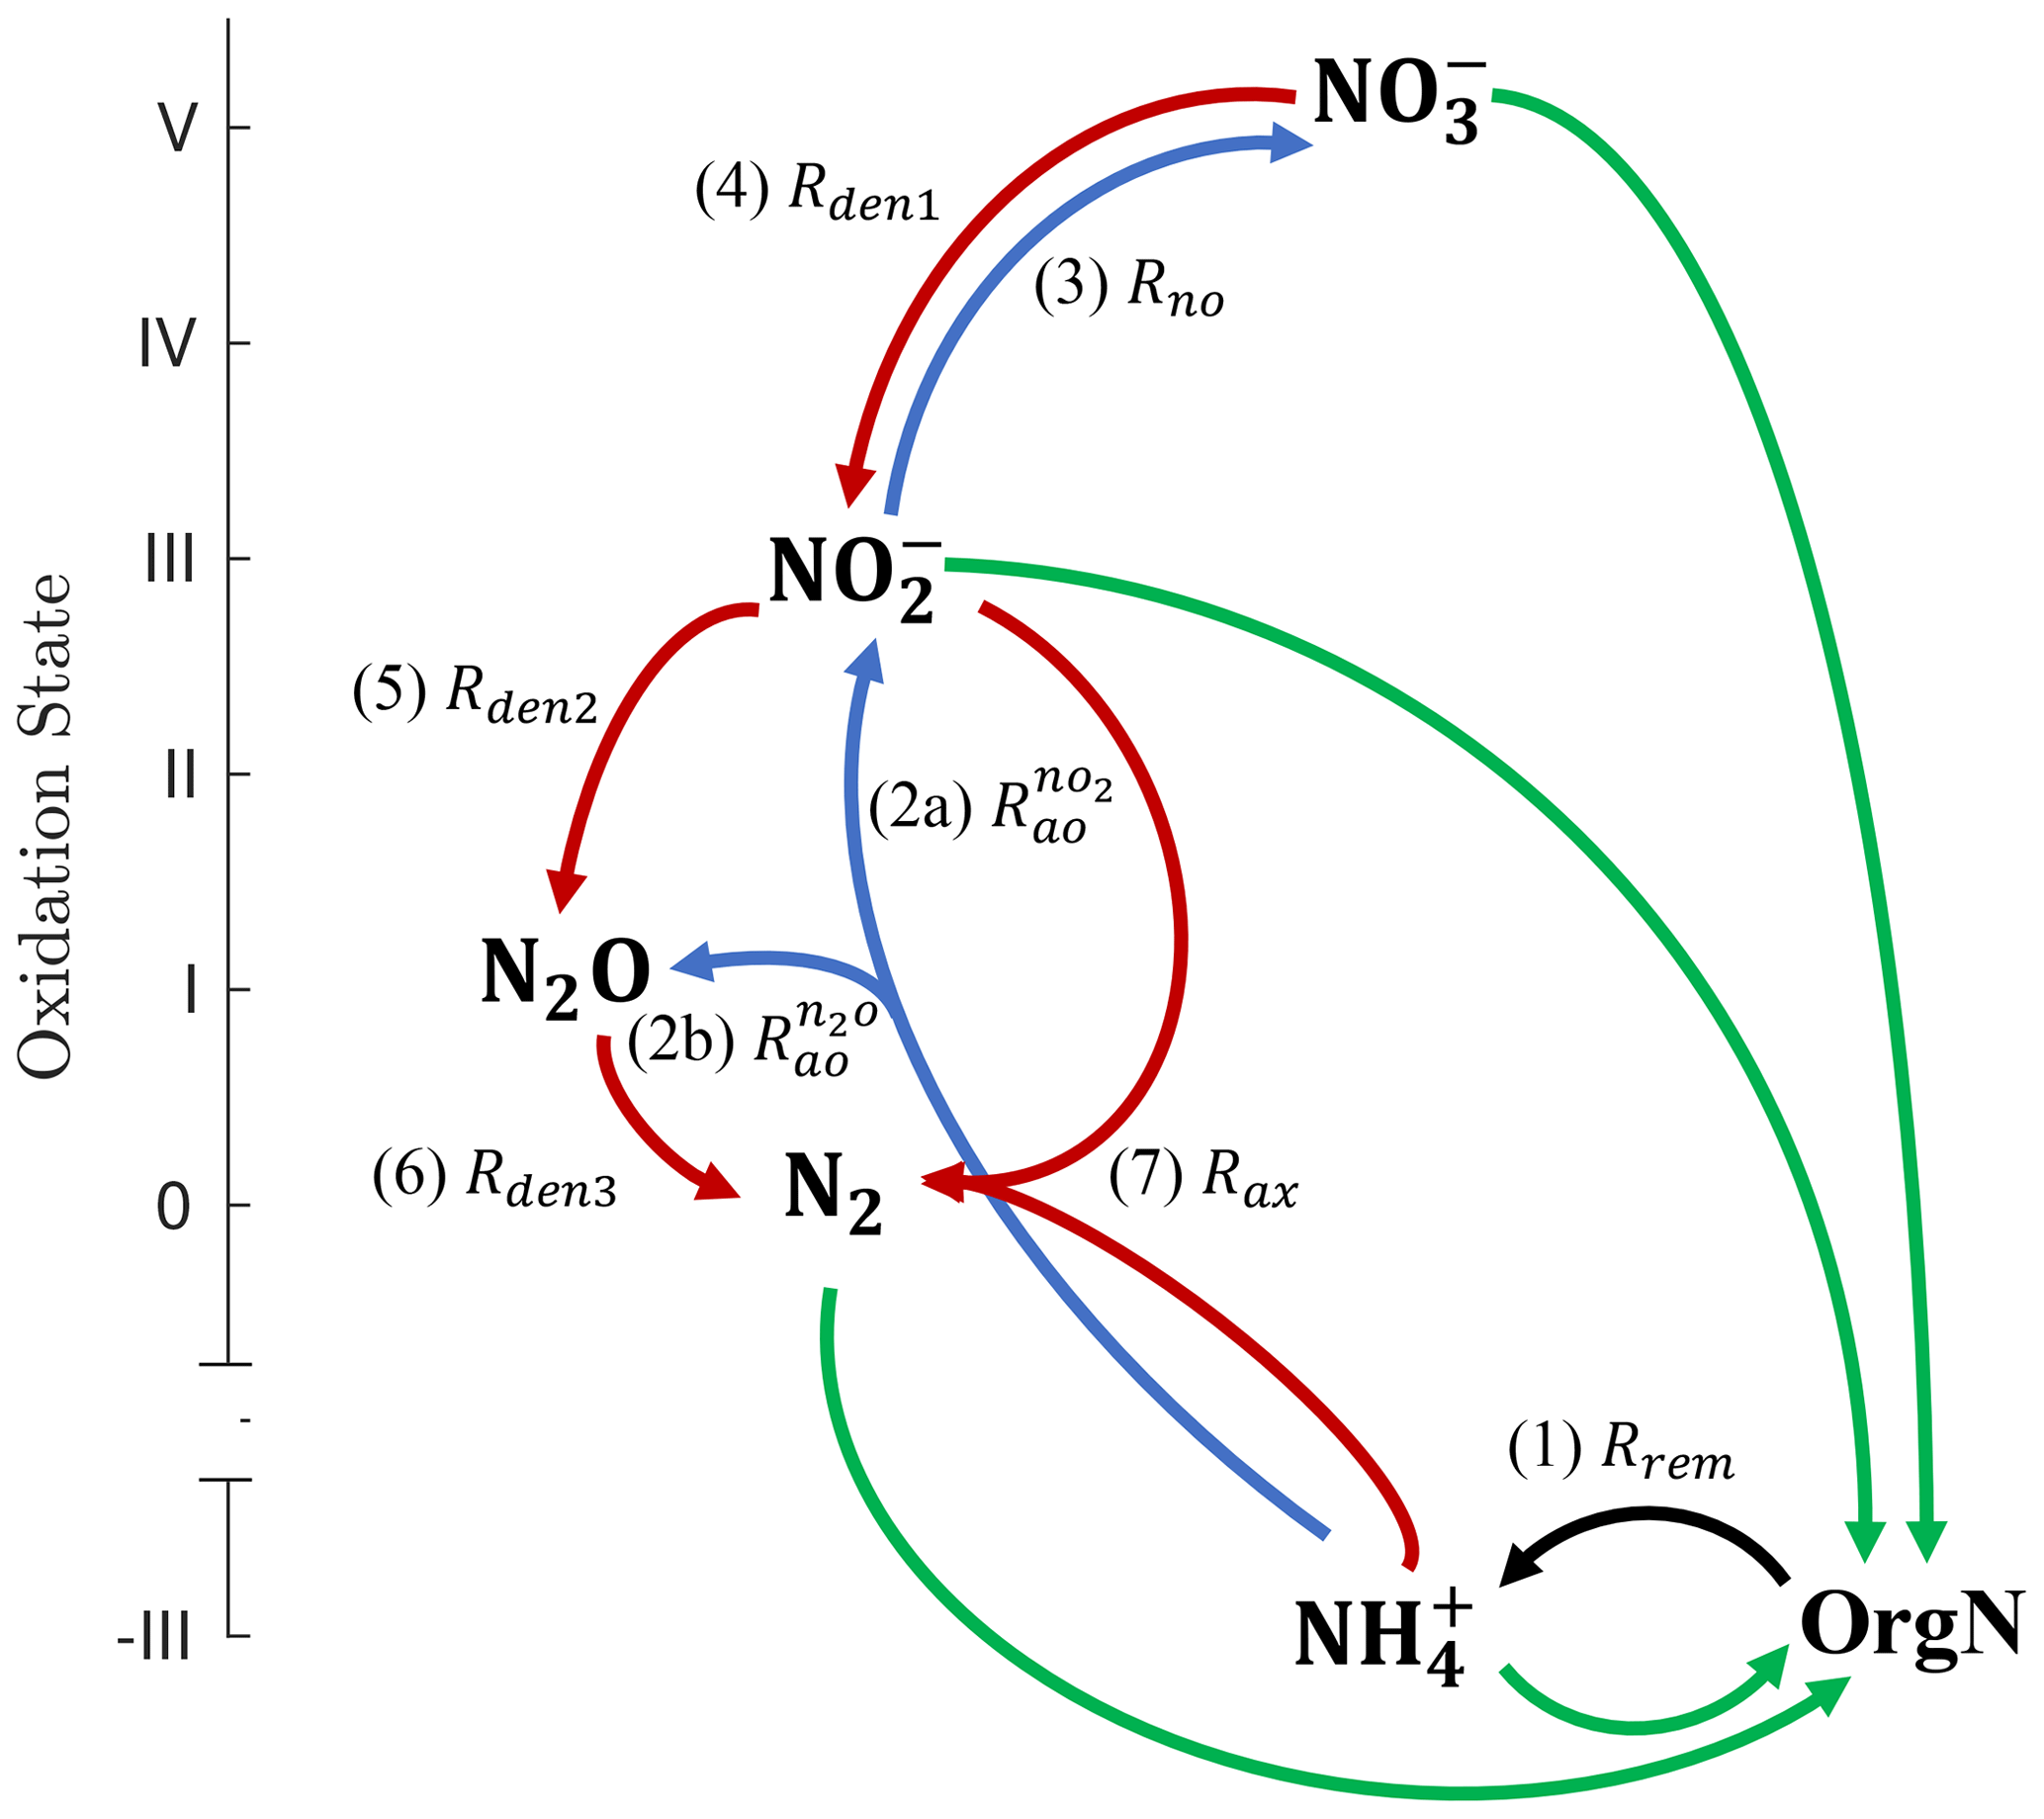
Figure 1Schematic of the main N cycle tracers and reactions represented by NitrOMZ. Tracers are shown in bold, ordered by the oxidation state of N, and consist of organic nitrogen (OrgN), ammonium (), nitrate (), nitrite (), nitrous oxide (N2O), and dinitrogen (N2). N transformation reactions are shown as arrows connecting reactants and products. Green arrows represent nutrient uptake and nitrogen fixation rates (not explicitly represented in the model, which focuses on subsurface reactions). The black arrow corresponds to the (1, Rrem) release of by organic matter remineralization (i.e., ammonification). Blue arrows denote aerobic transformations: (2a, ) oxidation to , (2b, ) oxidation to N2O, and (3, Rno) oxidation to . Red arrows represent anaerobic processes: (4, Rden1) reduction to , (5, Rden2) reduction to N2O, (6, Rden3) N2O reduction to N2, and (7, Rax) anaerobic oxidation (anammox) with to N2.
The ocean's inventory of fixed N is dominated by , and the main N cycle reactions consist of uptake and assimilatory reduction of to (here used interchangeably with ammonia, NH3) and the oxidation of back to following the decomposition of organic matter and nitrification (Fig. 1). Only when the concentration of dissolved oxygen (O2) drops to suboxic or anoxic levels (typically below 5 mmol m−3) do additional metabolic pathways involving N become relevant, as observed in the ocean's oxygen minimum zones (OMZs) and low-O2 sediments (Lam and Kuypers, 2011). These reactions include the three main steps of heterotrophic denitrification, i.e., the oxidation of organic carbon (OrgC) with , nitrite (), and nitrous oxide (N2O), and anammox, the chemolithotrophic oxidation of with . Both denitrification and anammox lead to the production of N2 and thus remove fixed N from the ocean (Bianchi et al., 2012; DeVries et al., 2012, 2013). Ammonia oxidation is another source of N2O – a powerful greenhouse gas and a leading agent of ozone destruction in the stratosphere. The number of N2O molecules produced per NH3 oxidized, i.e., the yield of this reaction, increases as O2 declines (Goreau et al., 1980; Nevison et al., 2003), likely caused by a shift from N2O production as a byproduct of hydroxylamine oxidation to nitrifier denitrification (Hooper and Terry, 1979; Wrage et al., 2001; Stein and Yung, 2003). Because of denitrification and enhanced production by ammonia oxidation, OMZs are important sources of N2O to the atmosphere (Naqvi et al., 2010; Yang et al., 2020), with the largest emissions observed right above shallow oxygen-deficient waters (Arévalo-Martínez et al., 2016).
The emerging picture of the ocean's N cycle is that of a web of inter-dependent transformations that is particularly active in OMZs, where overlapping aerobic and anaerobic reactions exchange nitrogen metabolites and substrates (Lam and Kuypers, 2011; Kuypers et al., 2018), ultimately controlling fixed nitrogen removal and N2O production. While there is evidence that organic matter and O2 regulate the rates and relative importance of N transformations (Babbin et al., 2014; Dalsgaard et al., 2014), our mechanistic understanding of these environmental controls against the backdrop of oceanic variability remains limited. Ocean biogeochemical models can shed light on the expression of the N cycle reactions in a dynamic environment. These models have included N as a macronutrient since the beginning, representing and assimilation by phytoplankton and subsequent nitrification (Fasham et al., 1990; Sarmiento et al., 1993; Moore et al., 2004). With the advent of more complex earth system models, biogeochemical representations have progressively expanded to include more detailed representations of the N cycle, including N fixation, denitrification, and N2O production (Aumont et al., 2015; Séférian et al., 2020; Stock et al., 2020; Long et al., 2021b).
The ultimate goals of these models are multifold and include improving predictability of oceanic N2O emissions (Suntharalingam et al., 2012; Martinez-Rey et al., 2015; Battaglia and Joos, 2018; Buitenhuis et al., 2018; Ji et al., 2018a), providing a more realistic representation of the redox state of seawater (Louca et al., 2016), or resolving aspects of microbial dynamics underlying the oceanic N cycle (Penn et al., 2016; Zakem et al., 2018; Penn et al., 2019).
The representation of N transformations in models often relies on crude assumptions that simplify the network of N reactions and their controls to simple empirical parameterizations. For example, models that include N2O cycling often rely on parameterizations that link N2O production to nitrification or aerobic respiration (Suntharalingam and Sarmiento, 2000; Nevison et al., 2003; Manizza et al., 2012; Jin and Gruber, 2003), overlooking N2O sources and sinks by denitrification. These models also conflate anammox and denitrification into a single N2 production term. Explicit cycling of under low O2, with the observed co-occurrence of production from dissimilatory reactions; reduction to N2O and N2 by denitrification and anammox; and reoxidation to are missing (Lam and Kuypers, 2011; Kalvelage et al., 2013; Babbin et al., 2014, 2015; Buchwald et al., 2015a; Babbin et al., 2017).
The goal of this paper is to present a new model of the oceanic N cycle designed to be incorporated in current ocean biogeochemical models, with a particular focus on processes occurring within OMZs. We refer to this model as NitrOMZ (Nitrogen cycling in Oxygen Minimum Zones). The model explicitly represents the major forms of N found in seawater as prognostic tracers and parameterizes the transformations that connect them as a function of seawater chemistry. This formulation is informed by recent observations that describe the response of N cycle reactions to environmental controls, in particular the availability of substrates and dissolved O2. We detail the implementation of the model in an idealized one-dimensional representation of the water column that allows for comparison to in situ observations, formal optimization, and studies of the model sensitivity to parameter choices and environmental conditions.
The rest of the paper is organized as follows: Sect. 2 discusses the rationale and formulation of the model, Sect. 3 the implementation of the model, Sect. 4 the model optimization against tracer and rate observations, Sect. 5 the performance of the model and its sensitivity to environmental parameters, and Sect. 6 the implications and conclusions of the work.
2.1 Model rationale
The NitrOMZ model is based on the current understanding of the N cycle in OMZs (Lam and Kuypers, 2011; Kuypers et al., 2018) as mediated by six major species: N2, , , N2O, , and organic nitrogen (OrgN) in either dissolved or particulate form. We only explicitly model (the dominant dissolved form) and do not distinguish it from NH3. We also assume that organic nitrogen is linked to organic carbon by fixed stoichiometry (Anderson and Sarmiento, 1994), although variable stoichiometry can easily be accommodated.
A schematic of the model's tracers and transformation is shown in Fig. 1. Our approach represents a natural progression for current biogeochemical ocean models and takes a “system view” of the N cycle by focusing on the biogeochemistry of N transformation reactions (Lam and Kuypers, 2011) rather than on microbial ecology (Penn et al., 2016; Louca et al., 2016; Zakem et al., 2018; Penn et al., 2019). That is, the model explicitly resolves N chemical tracers and their transformations but not the populations of microbes that are responsible for these reactions.
The underlying assumption is that the occurrence and rates of N transformations are controlled by, and can be predicted from, the physical and chemical conditions of the oceanic environment. Implicitly, the model assumes that diverse populations of microbes are always present in the water column and that their activity (i.e., metabolic rate) is controlled by the abundance of substrates, analogous to chemical reactions, and dissolved O2, which inhibits anaerobic reactions (Kalvelage et al., 2011; Babbin et al., 2014; Dalsgaard et al., 2014; Ji et al., 2018a; Sun et al., 2021b). The focus on dissolved N forms and reaction rates bypasses poorly known aspects of microbial population dynamics, which are topics of ongoing research (Louca et al., 2016; Zakem et al., 2018; Penn et al., 2019).
We assume that each reaction is implicitly mediated by specialized microorganism groups, each relying on a distinct metabolism (Lam and Kuypers, 2011; Kuypers et al., 2018). Thus, the model represents a “modular” N cycle, with individual reaction steps (i.e., individual redox reactions) represented separately and connected by the exchange of dissolved substrates (Graf et al., 2014; Kuypers et al., 2018). This premise is grounded on observations of high specialization and streamlined genomes for marine prokaryotes (Giovannoni et al., 2014), including microorganisms carrying genes for N-based metabolic reactions (Ganesh et al., 2015; Kuypers et al., 2018).
These assumptions are sufficient for providing a broad representation of microbial N transformations and their environmental expressions in the ocean, while limiting model complexity and the proliferation of poorly constrained parameters. They are also grounding steps toward models that explicitly represent microbial populations, including their diversity and dynamics in OMZs (Louca et al., 2016; Penn et al., 2016; Zakem et al., 2018; Penn et al., 2019).
2.2 Model tracers and processes
The model focuses on microbial processes that take place below the euphotic zone, as driven by the flux of organic matter produced near the surface and exported into the ocean interior by the biological pump (Boyd et al., 2019). We include heterotrophic and chemolithotrophic pathways that are commonly observed in the open ocean and require N species as substrates (Kuypers et al., 2018) (Fig. 1). Additional pathways, for example, involving sulfur or iron, could also be represented following a similar approach.
Heterotrophic reactions resolved by the model (Fig. 1) consist of aerobic organic matter respiration (Rrem, pathway 1), which relies on O2 as the oxidant, and the three main steps of denitrification: dissimilatory reduction to (Rden1, pathway 4), reduction to N2O (Rden2, pathway 5), and N2O reduction to N2 (Rden3, pathway 6). Chemolithotrophic processes consist of aerobic oxidation of to both (, pathway 2a) and N2O (, pathway 2b, via both hydroxylamine oxidation and nitrifier denitrification); aerobic oxidation of to (Rno, pathway 3); and anammox, the anaerobic oxidation of with to produce N2 gas (Rax, pathway 7). Reactions are parameterized as functions of substrates (i.e., model tracer concentrations) and environmental parameters such as dissolved O2 and organic matter. Tracers are expressed as concentrations, with units of mmol m−3.
We do not include an explicit representation of nitric oxide, NO, because of the poor understanding of its cycle in the marine environment (Ward and Zafiriou, 1988). NO is thought to be an obligate intermediate or a byproduct of N cycle reactions, including nitrification and denitrification (Schreiber et al., 2012). However, it is a very reactive chemical with extremely low concentrations (on the order of pmol m−3) and rapid turnover in seawater (Ward and Zafiriou, 1988). As a consequence, in situ NO observations are limited (Lutterbeck et al., 2018), and rate measurements targeting NO reactions are missing. Implicitly, we assume that NO cycles so rapidly that accumulation and transport by the oceanic circulation are negligible and that its dynamics can be folded into the cycle of other N tracers.
There are also several notable processes that are not represented in the current model formulation but could be introduced in future releases. Some of these processes (e.g., dissimilatory reduction to , DNRA) are not thought to be quantitatively relevant in oceanic oxygen minimum zones. Others, while relevant, require further measurements to constrain their significance and response to environmental variability.
Production of N2O via oxidation in NitrOMZ is represented as a single O2-dependent function designed to model the transition in bacterial metabolisms from predominantly hydroxylamine oxidation to nitrifier denitrification at low O2 (Hooper and Terry, 1979; Wrage et al., 2001; Stein and Yung, 2003; Nevison et al., 2003). However, growing evidence suggests that ammonia-oxidizing archaea (AOA, which greatly outnumber their bacterial counterparts) can also produce N2O via a hybrid mechanism (Santoro et al., 2011; Löscher et al., 2012). Production of N2O via AOA appears to be similarly enhanced at low O2 (Trimmer et al., 2016; Santoro et al., 2021), although evidence from Stieglmeier et al. (2014) argues otherwise.
DNRA, which can be dominant in anoxic sediment, has been sporadically observed in the water column of oxygen-deficient zones, where it may provide an additional source of to anammox bacteria (Lam et al., 2009; Lam and Kuypers, 2011; Kraft et al., 2011; Jensen et al., 2011). However, DNRA is commonly undetectable in OMZ waters (Kalvelage et al., 2013; De Brabandere et al., 2014), and its importance to the N cycle of OMZ is still debated (Long et al., 2021a).
Recent tracer incubation studies show substantial and often dominant formation of N2O from rather than (Ji et al., 2018b; Frey et al., 2020). This suggests that denitrifying bacteria capable of direct production of N2O from reduction (as reduction proceeds entirely within the cell) could be a major source of N2O. This idea, which contrasts with the model assumption of a fully modular N cycle, is further supported by isotopic evidence (Casciotti et al., 2018). However, observations needed to constrain the proportion of N2O from and and its environmental sensitivity remain limited (Ji et al., 2018b; Frey et al., 2020).
Other work suggests the occurrence of oxidation in apparently O2-deficient waters (Buchwald et al., 2015b; Babbin et al., 2020; Sun et al., 2021a). This may involve oxidation coupled to iodate reduction or disproportionation – two poorly characterized processes. It may also reflect the high affinity to O2 of nitrite-oxidizing bacteria (Bristow et al., 2016) in regions where vanishing O2 concentrations are maintained by infrequent lateral intrusions (Buchanan et al., 2023).
Finally, the model could easily accommodate missing processes that couple the N cycle with other elemental cycles, in particular carbon and sulfur. These include formation of organic matter by chemolithotrophy; changes in inorganic carbon chemistry (e.g., pH) by anaerobic reactions (Cinay et al., 2022); and additional metabolic pathways such as anaerobic oxidation of sulfide with (Callbeck et al., 2021) and anaerobic oxidation of methane with (Thamdrup et al., 2019), both chemolithotrophic denitrification reactions.
2.3 Model equations
Heterotrophic reactions (i.e., organic matter remineralization) are parameterized as a function of the respective oxidants and organic matter concentration and expressed in carbon units per unit volume and time. Heterotrophic reaction rates are assumed to be on the first order in the concentration of organic matter and limited by the oxidant, following a Michaelis–Menten formulation (Johnson and Goody, 2011). Anaerobic reactions are inhibited by the presence of O2, based on an exponential limitation term (Dalsgaard et al., 2014). The resulting equation for a general heterotrophic reaction is
Here, H indicates the heterotrophic process considered (e.g., dissimilatory reduction of to ), RH the heterotrophic reaction rate (mmol C m−3 s−1), kH the specific first-order reaction rate (s−1), [X] the concentration of the oxidant (i.e., O2, , , or N2O), the half-saturation constant for oxidant uptake (mmol m−3), the scale for inhibition of the reaction by O2 (mmol m−3), and POC the concentration of particulate organic matter in units of mmol C m−3. No O2 inhibition is applied to aerobic respiration (i.e., can be thought of as arbitrarily large).
Chemolithotrophic reactions are proportional to the respective substrates. A maximum reaction rate is modulated by the concentration of oxidants and reductants, following Michelis–Menten dynamics. For anaerobic reactions (here, anammox), an O2-dependent inhibition term limits the reactions when O2 is present. The resulting equation for a general chemolithotrophic reaction is
Here, A indicates the chemolithotrophic process considered (e.g., anammox); RA the reaction rate (mmol N m−3 s−1); kA the maximum reaction rate when the process is not limited (mmol N m−3 s−1); [X] and [Y] the concentrations of the oxidant and reductant, respectively (e.g., and for anammox); and the half-saturation constants for oxidant and reductant uptake, respectively (mmol m−3); and the scale for inhibition of the reaction by O2 (mmol m−3). For aerobic reactions, is set to infinite, removing O2 inhibition.
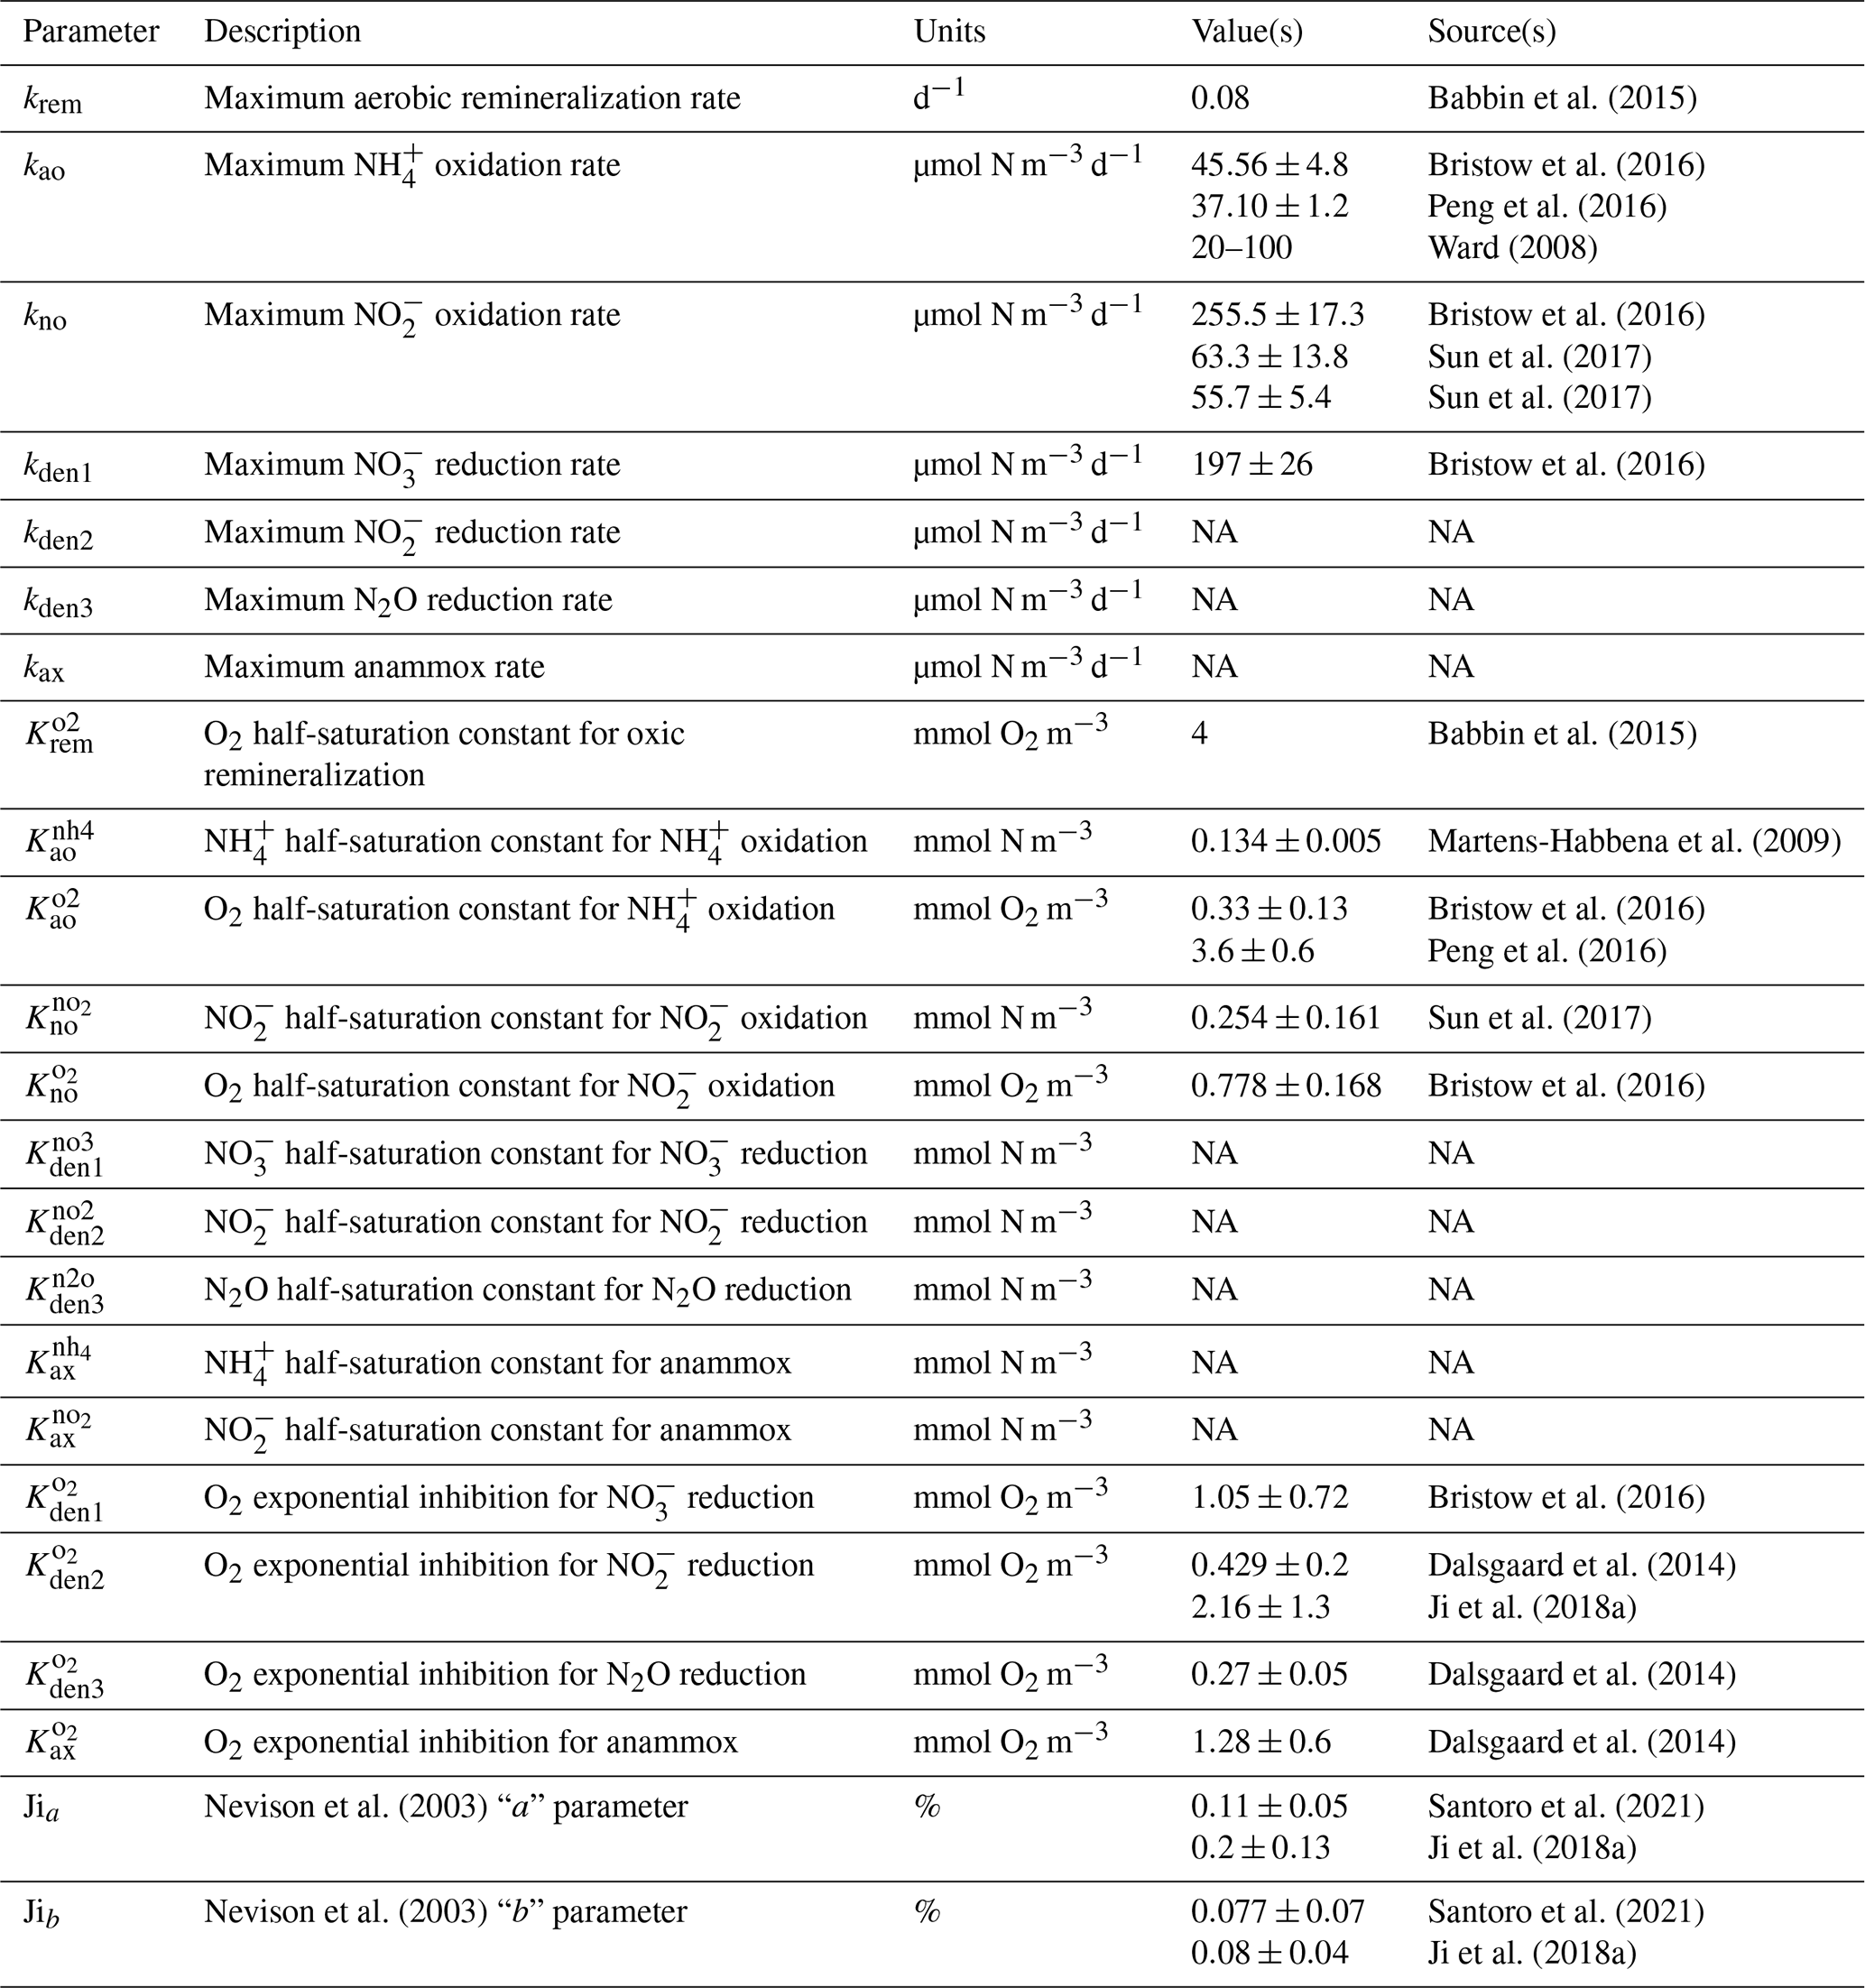
Equations for each of the heterotrophic and chemolithotrophic reactions are presented in Appendix A1 and A2, respectively; parameter names, units, and suggested values from the literature are presented in Table 1.
2.4 Model assumptions and parameterizations
In the model, we assume that heterotrophic reactions are first-order to the concentration of organic matter; thus all organic matter can be utilized by microorganisms without saturation at high concentrations. Because of the low abundance of organic matter in seawater and extensive colonization of particles by heterotrophic bacteria, this is a reasonable first-order assumption. However, see Nguyen et al. (2022) for a discussion of microbial–particle interactions in ocean biogeochemical models and more complex aspects of their dynamics. For simplicity, we represent organic carbon by a single component. This assumption is easily relaxed to include multiple carbon species, for example, separate particulate or dissolved forms.
We do not explicitly model conversion of dissolved CO2 to organic matter by chemolithotrophy because of the small rates compared to the remineralization of organic matter in the upper ocean. This assumption can also be relaxed in future implementations of the model, allowing a more complete integration between chemolithotrophy and the carbon cycle.
The use of an exponential inhibition term for anaerobic reactions by O2 is based on the observation that they are limited at O2 concentrations to a few mmol m−3 or smaller (Dalsgaard et al., 2014; Babbin et al., 2015; Frey et al., 2020). However, coexistence of anaerobic and aerobic reactions at O2 concentrations of 10–20 mmol m−3 or higher is also observed (Kalvelage et al., 2011), perhaps related to the presence of redox microenvironments within organic particles (Bianchi et al., 2018; Smriga et al., 2021), which are not explicitly considered here. The exponential inhibition formulation has the advantage of being controlled by a single parameter, allows anaerobic reactions at concentrations of finite O2, and approximates empirical rates from incubation experiments reasonably well (Dalsgaard et al., 2014).
Parameter values for maximum reaction rates, half-saturation constants, and O2 inhibition terms (Eqs. 1 and 2) are informed by analysis of previous work and further optimized against in situ observations of tracers and rates (Sect. 4). Table 1 presents a list of the model parameters and measured values based on a review of the literature. Note that these studies are based on shipboard and laboratory incubations that differ in the setup, conditions, and microbial populations tested. Despite these caveats, experimental results provide valuable starting points to further constrain parameter values in the model.
Babbin et al. (2015)Bristow et al. (2016)Peng et al. (2016)Ward (2008)Bristow et al. (2016)Sun et al. (2017)Sun et al. (2017)Bristow et al. (2016)Babbin et al. (2015)Martens-Habbena et al. (2009)Bristow et al. (2016)Peng et al. (2016)Sun et al. (2017)Bristow et al. (2016)Bristow et al. (2016)Dalsgaard et al. (2014)Ji et al. (2018a)Dalsgaard et al. (2014)Dalsgaard et al. (2014)Nevison et al. (2003)Santoro et al. (2021)Ji et al. (2018a)Nevison et al. (2003)Santoro et al. (2021)Ji et al. (2018a)Table 1Summary of the main NitrOMZ parameters, with any reported values from the literature (NA – not available).
3.1 One-dimensional model setup
We implement the model for a one-dimensional water column that includes physical transport by vertical advection and turbulent diffusion (Wyrtki, 1962) and, if required, parameterized lateral transport by horizontal currents and eddies (Gnanadesikan et al., 2013; Bettencourt et al., 2015). The model is configured to represent the typical weak upwelling conditions that characterize open ocean oxygen minimum zones, following previous work (Babbin et al., 2015).
In the one-dimensional framework, the conservation equation for the concentration [C] of a generic dissolved tracer can be written as
where wu is the vertical upwelling velocity (m s−1) and Kv is the vertical turbulent diffusion coefficient (m2 s−1, distinct from molecular diffusion, which is much smaller), both of which can be a function of depth. The first and second summations are, respectively, over the NH heterotrophic and NA chemolithotrophic processes that involve the tracer (Eqs. 1 and 2), with and being the corresponding stoichiometric ratios (Appendix A4). LT represents any parameterized lateral transport process. The explicit equations for each of the model tracers are detailed in Appendix A5.
The lateral transport term LT can be included to parameterize horizontal circulation by advection and diffusion in the one-dimensional framework. Typically, these terms are simplified by a linear restoring to far-field tracer concentration profiles (Babbin et al., 2015), [C]far, with a relaxation timescale τC (s):
For typical open ocean conditions, τC can be estimated as the minimum of an advective timescale and a diffusive timescale, , where L, U, and KH are, respectively, the horizontal spatial scale, the horizontal velocity scale, and the horizontal eddy diffusion. Assuming L on the order of 1000 km, U on the order of 0.01 m s−1, and KH on the order of 1000 m2 s−1 results in a timescale τC=108 s, i.e., on the order of 3 years and in agreement with recent estimates of the residence time of water within the eastern tropical South Pacific (ETSP) (Ji et al., 2015b; Johnston et al., 2014).
3.2 Organic matter remineralization
In the one-dimensional model implementation, we represent organic matter (OrgC and OrgN) as a single particulate organic carbon (POC) class that sinks through the water column. We assume that this sinking is rapid compared to advection and diffusion, leading to a steady-state distribution of POC that is only controlled by sinking and remineralization (Kriest and Oschlies, 2008). Since remineralization rates are proportional to the concentration of organic matter, the resulting steady-state one-dimensional equation for POC is
where ws is the depth-dependent sinking speed of POC in the water column, and (s−1) is the effective rate constants for each heterotrophic process, i.e., the maximum rate constants multiplied by the respective substrate limitation and O2 inhibition terms (Eq. 1).
Considering the flux of sinking POC, ΦPOC (mmol C m−2 s−1),
Equation (5) can be written as
or, equivalently,
Equation (7) can be recast to relate the concentration of POC in the water column to the remineralization of the POC flux with depth:
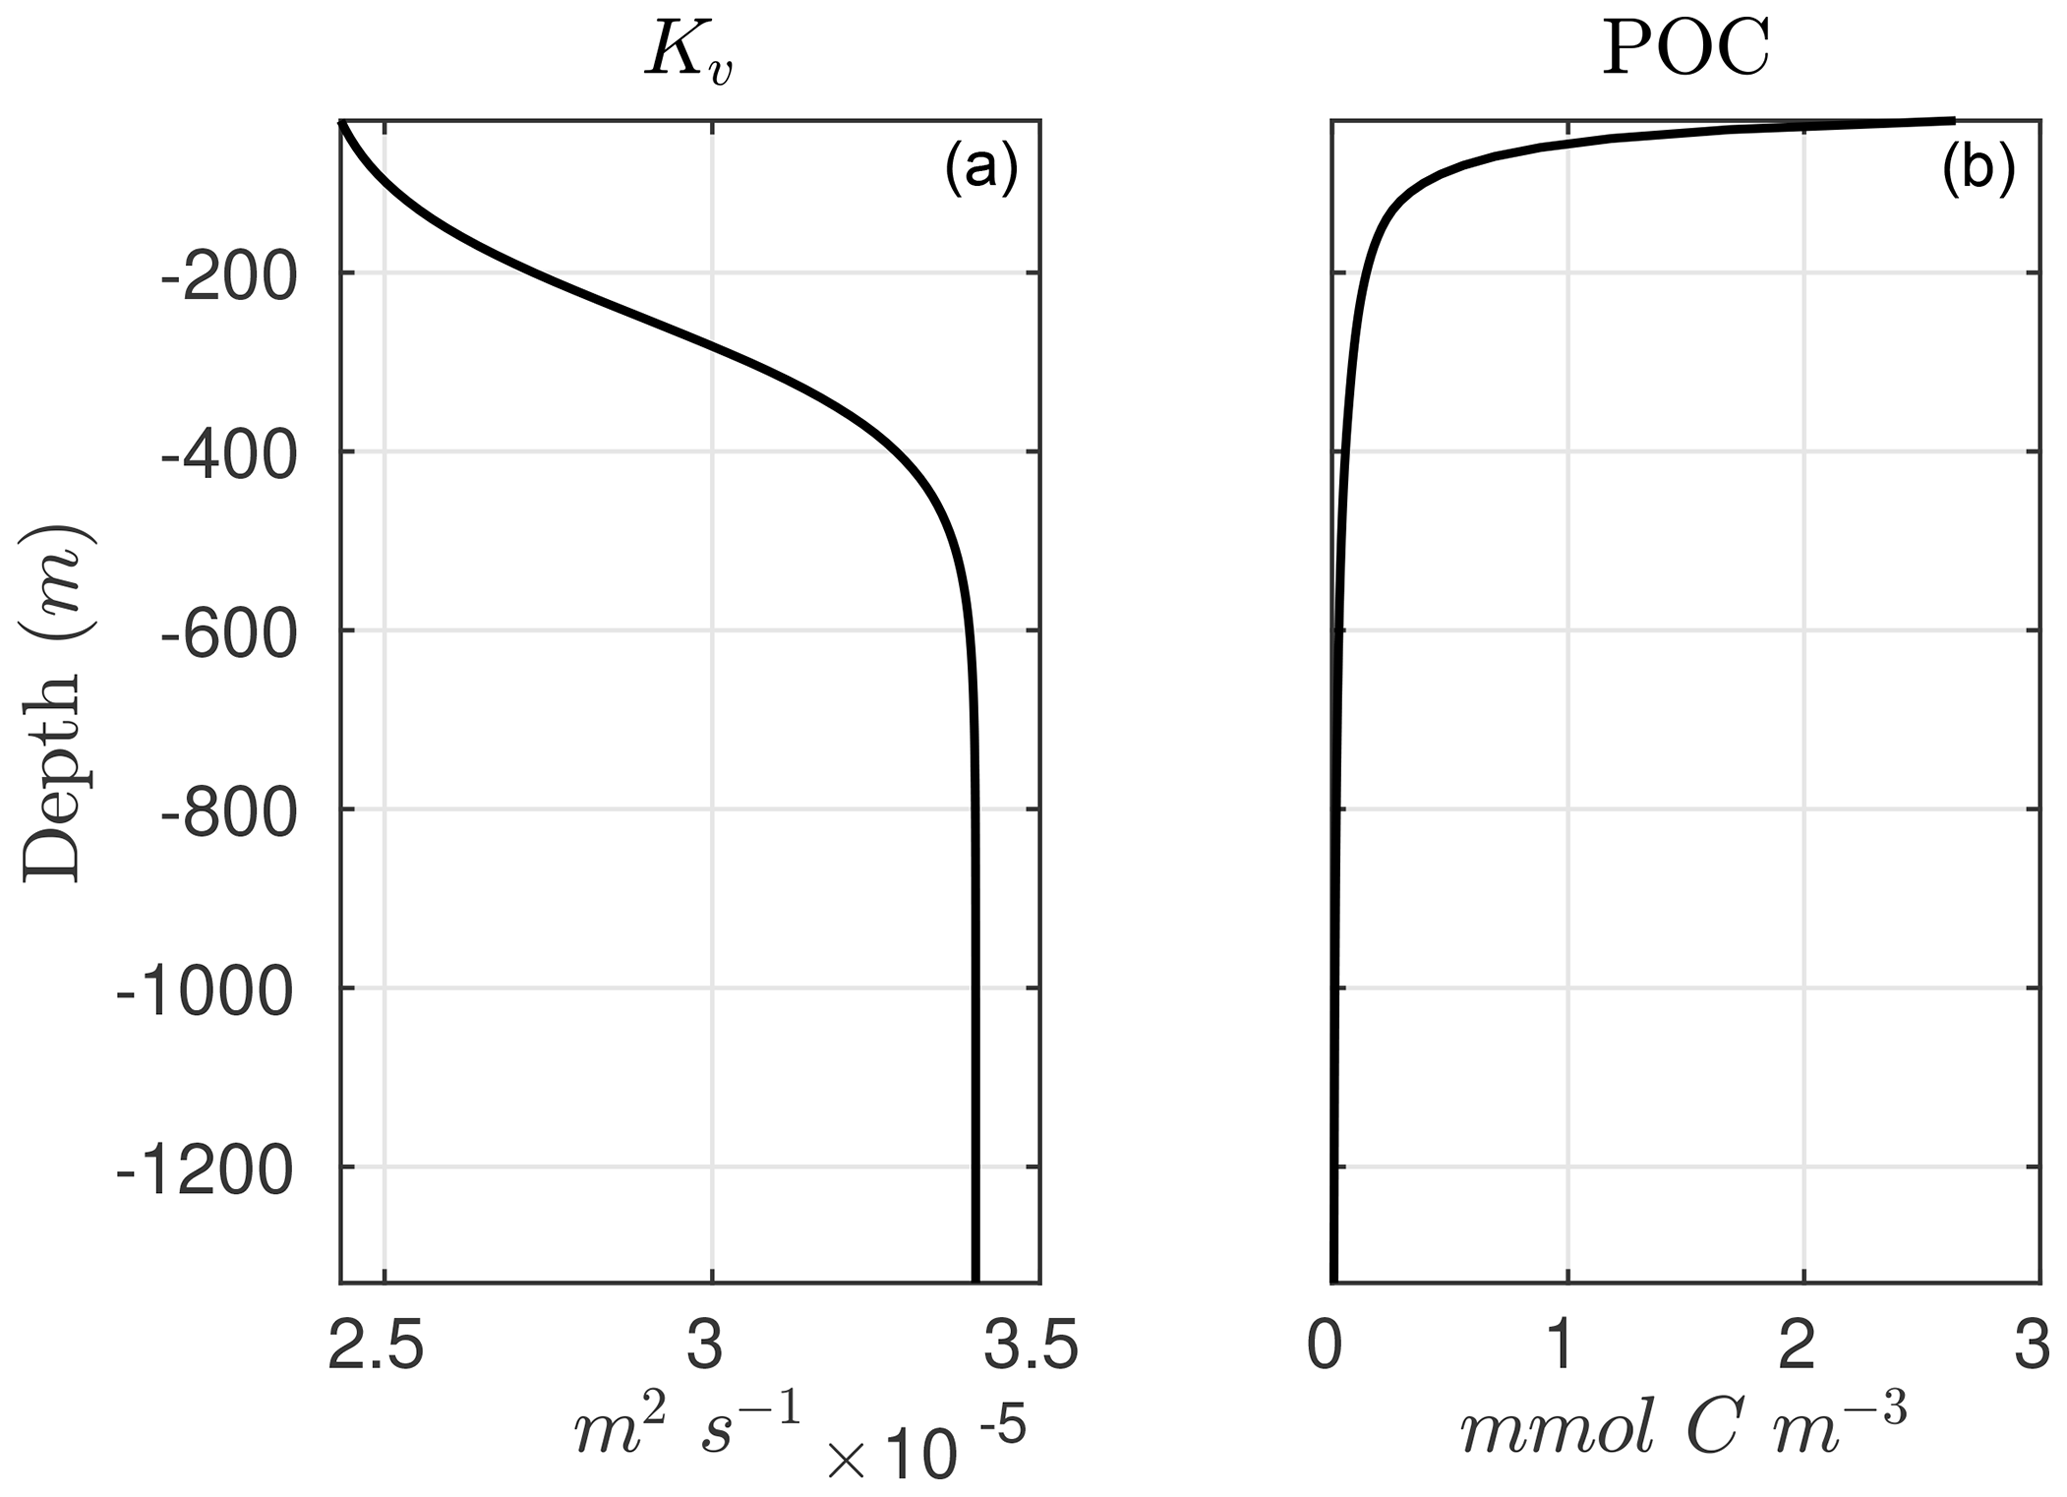
The advantage of Eq. (9) is that it allows us to diagnose sinking POC concentrations when the POC flux and remineralization rate constants are known. In the one-dimensional implementation of the model, we parameterize the POC flux following a typical depth-dependent power-law function or Martin curve (Martin et al., 1987; Berelson, 2001; Primeau, 2006):
where z0 is the upper boundary of the model and b the power-law or Martin coefficient. A plot of the model POC is shown in Fig. C1. Another advantage of this formulation is that it allows coupling NitrOMZ to more complex parameterizations for the remineralization of organic matter in ocean biogeochemical models, some of which rely on explicit representation of sinking organic particles and some of which only represent sinking organic particle fluxes in the water column (Moore et al., 2004; Sarmiento et al., 2010; Aumont et al., 2015; Stock et al., 2020; Long et al., 2021b). Because NitrOMZ's equation can be cast as a function of prescribed vertical organic matter flux or remineralization profiles, the model can be coupled to existing biogeochemical models with minimal interference in their formulation of organic matter cycles.
3.3 Numerical implementation of the one-dimensional model
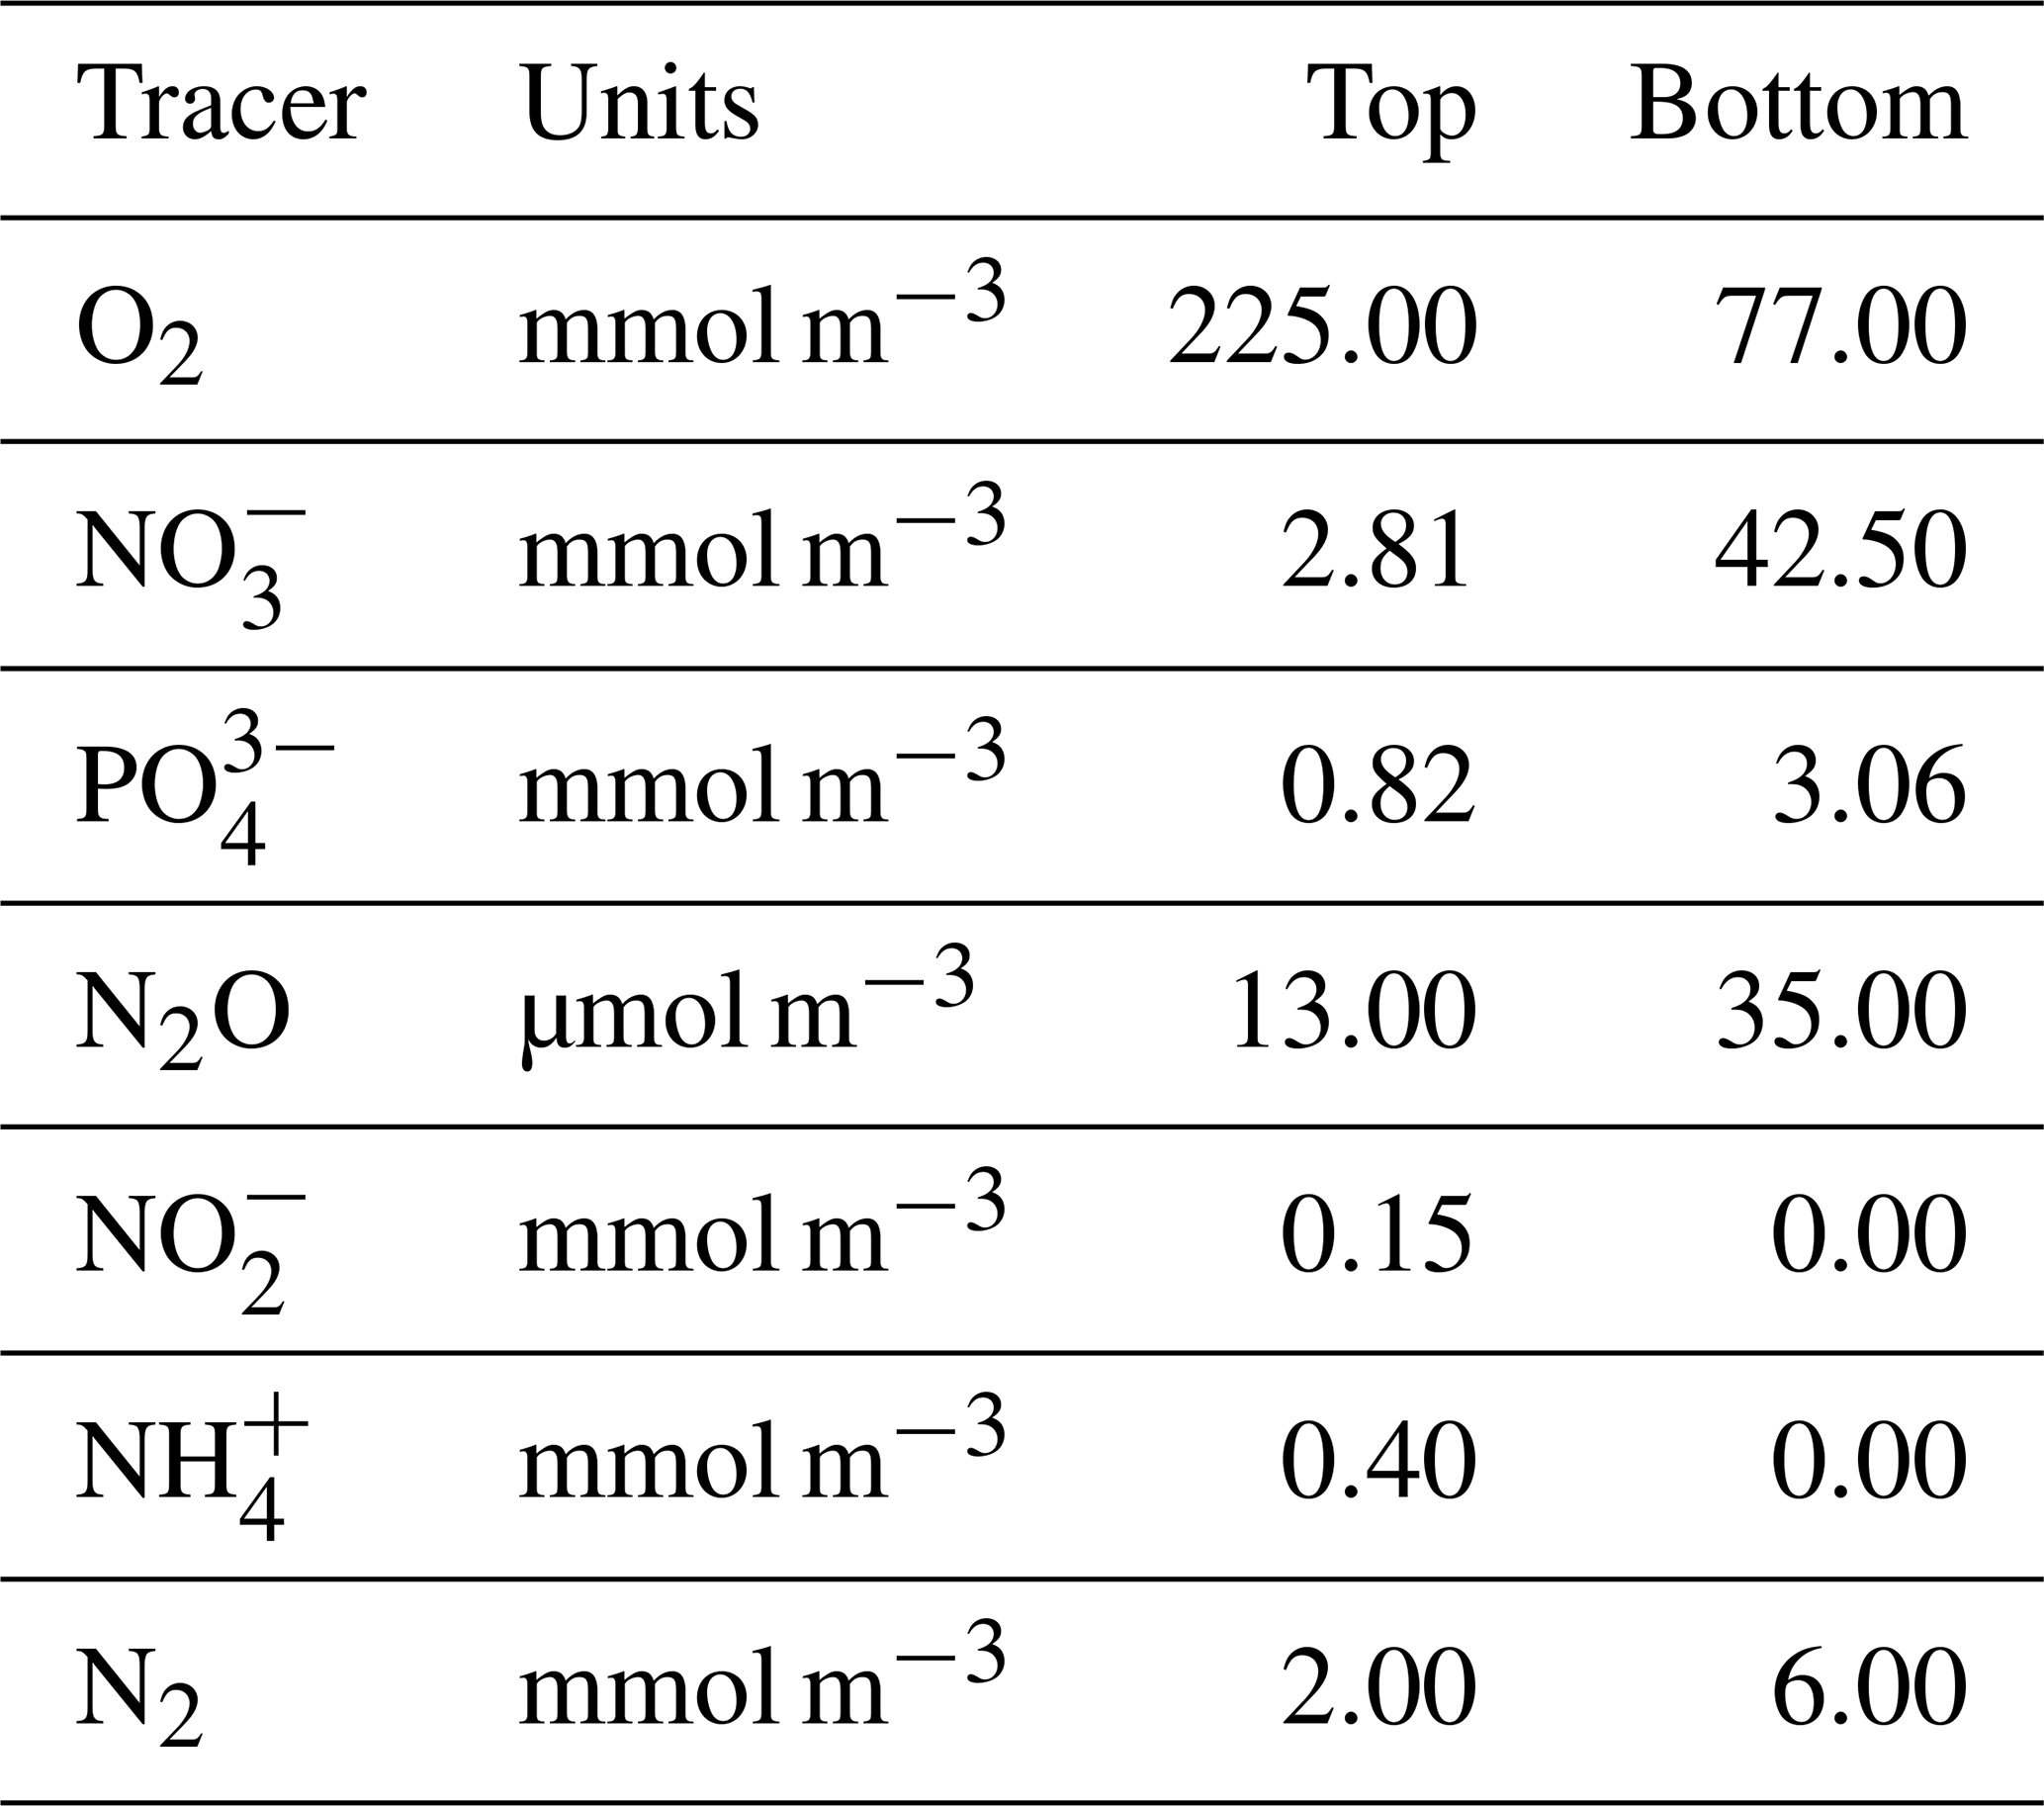
For the purpose of testing and illustration, we implement NitrOMZ in a one-dimensional representation of the water column below the mixed layer, following previous work (Babbin et al., 2015). Model tracers are discretized on a one-dimensional vertical grid, with equal spacing Δz=10 m, where z is depth. Boundary conditions are set at the top (z0) and bottom grid (zbot) cells, as Dirichlet (or fixed concentration) boundary conditions, with values taken from observations (Tables B2–B3). The conservation equation for each tracer (following Eq. 3; see Appendix A5 for full equations) is then solved using a forward-in-time, centered-in-space numerical scheme, with a constant vertical grid spacing, and the option for a variable or constant time step. In the baseline simulations (Fig. 2), we adopt a time step of 5 d for the initial 650-year spinup and decrease it to 3 h for the final 2 years of the simulation (years 698 and 699) to increase accuracy.
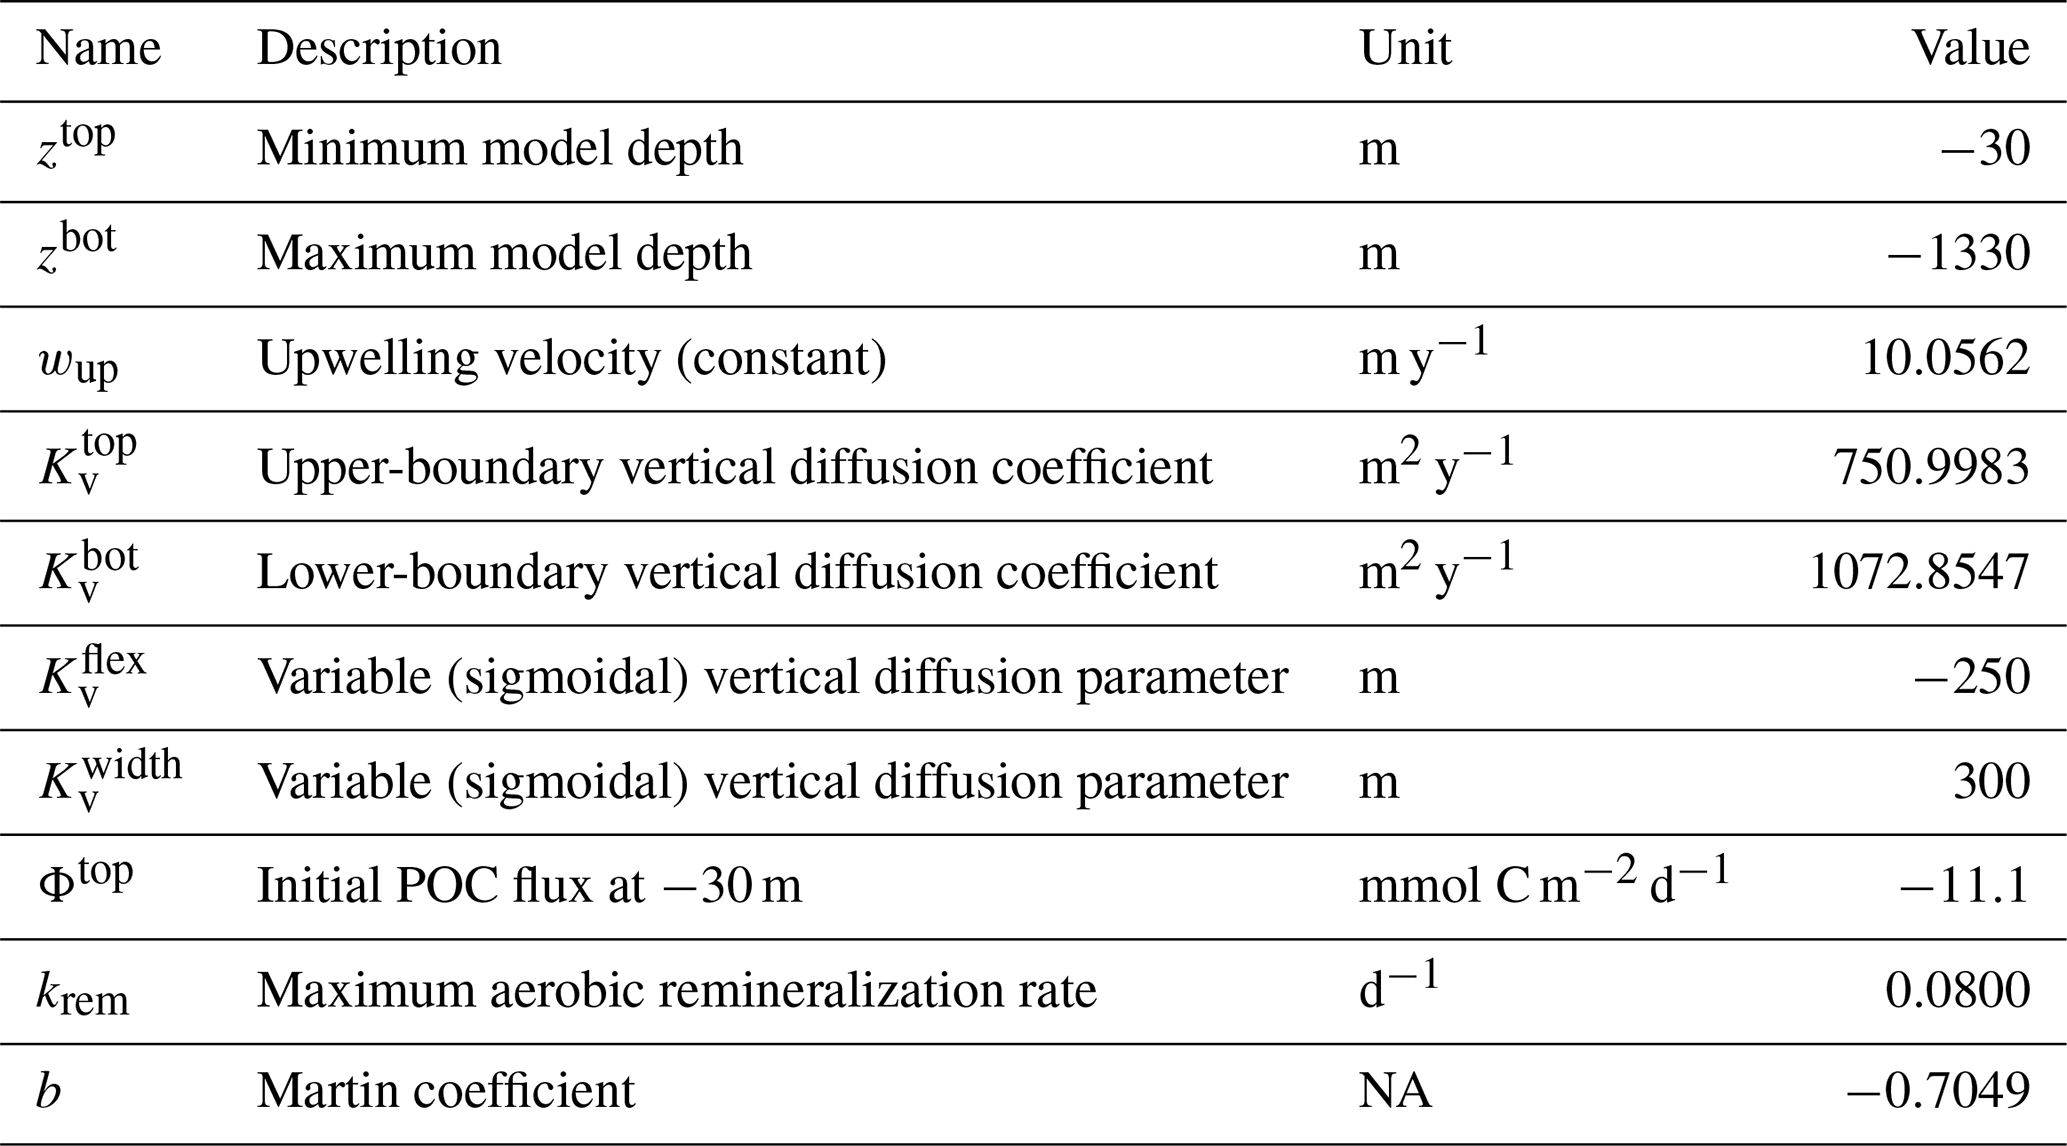
As in Babbin et al. (2015), NitrOMZ does not represent primary production in the surface layer and is instead forced at the uppermost boundary by a flux of sinking POC, , where POC(z0) provides the boundary condition for POC. The flux ΦPOC remineralizes in the water column based on a Martin curve profile (Eq. 10). At each depth, the steady-state conservation equation for POC (Eq. 8) is solved with a forward-in-space method, using a depth-dependent sinking speed ws chosen to produce, together with the maximum aerobic remineralization rate constant, krem, a POC flux profile matching a Martin curve with exponent b appropriate for the oxygenated ocean (Primeau, 2006; Weber and Bianchi, 2020). To this end, the sinking speed is calculated at each depth as
The concentration of POC in the water column is then diagnosed using Eq. (9) and used to calculate the heterotrophic remineralization rates RH in Eq. (1) (see Appendix A1).
Under constant forcings and boundary conditions, the model tracers evolve towards steady state (, Fig. 2) with a timescale τSS that can be estimated from the advection velocity wu, the turbulent vertical diffusion Kv, and the vertical scale H as the minimum between and . For wu on the order of 10 m y−1, Kv on the order of 10−5 m2 s−1, and a vertical scale of 1000 m, the timescale to approach steady state is s or about 100 years.
Figure 2 shows an example of model spinup to steady state in NitrOMZ, with parameters taken from an optimal solution discussed in Sect. 5.2 and uniform initial tracer concentrations in the water column. At the start of the simulation, high water column O2 leads the aerobic remineralization (Rrem) to dominate total POC consumption. As the simulation proceeds, an O2 minimum develops in subsurface waters, reaching suboxic (<10 mmol O2) concentrations around year 100. reduction rates (Rden1) are relieved of O2 inhibition and begin to take up a larger fraction of total POC remineralization, as revealed by the depletion of N*, signaling consumption in the water column. Reduction of also leads to a subsurface peak in within the O2 minimum (Fig. 2). With newly available substrate and low-O2 conditions, reduction (Rden2) begins, resulting first in a subsurface spike in N2O. With further decrease in O2 concentrations, N2O is reduced to N2, leading to a layer of low N2O concentrations within the OMZ that persists to the end of the simulation. Anammox (Rax) is similarly relieved of O2 inhibition as the O2 minimum is established, reaching maximum values near the upper oxycline, reflecting a relatively high supply of both and .
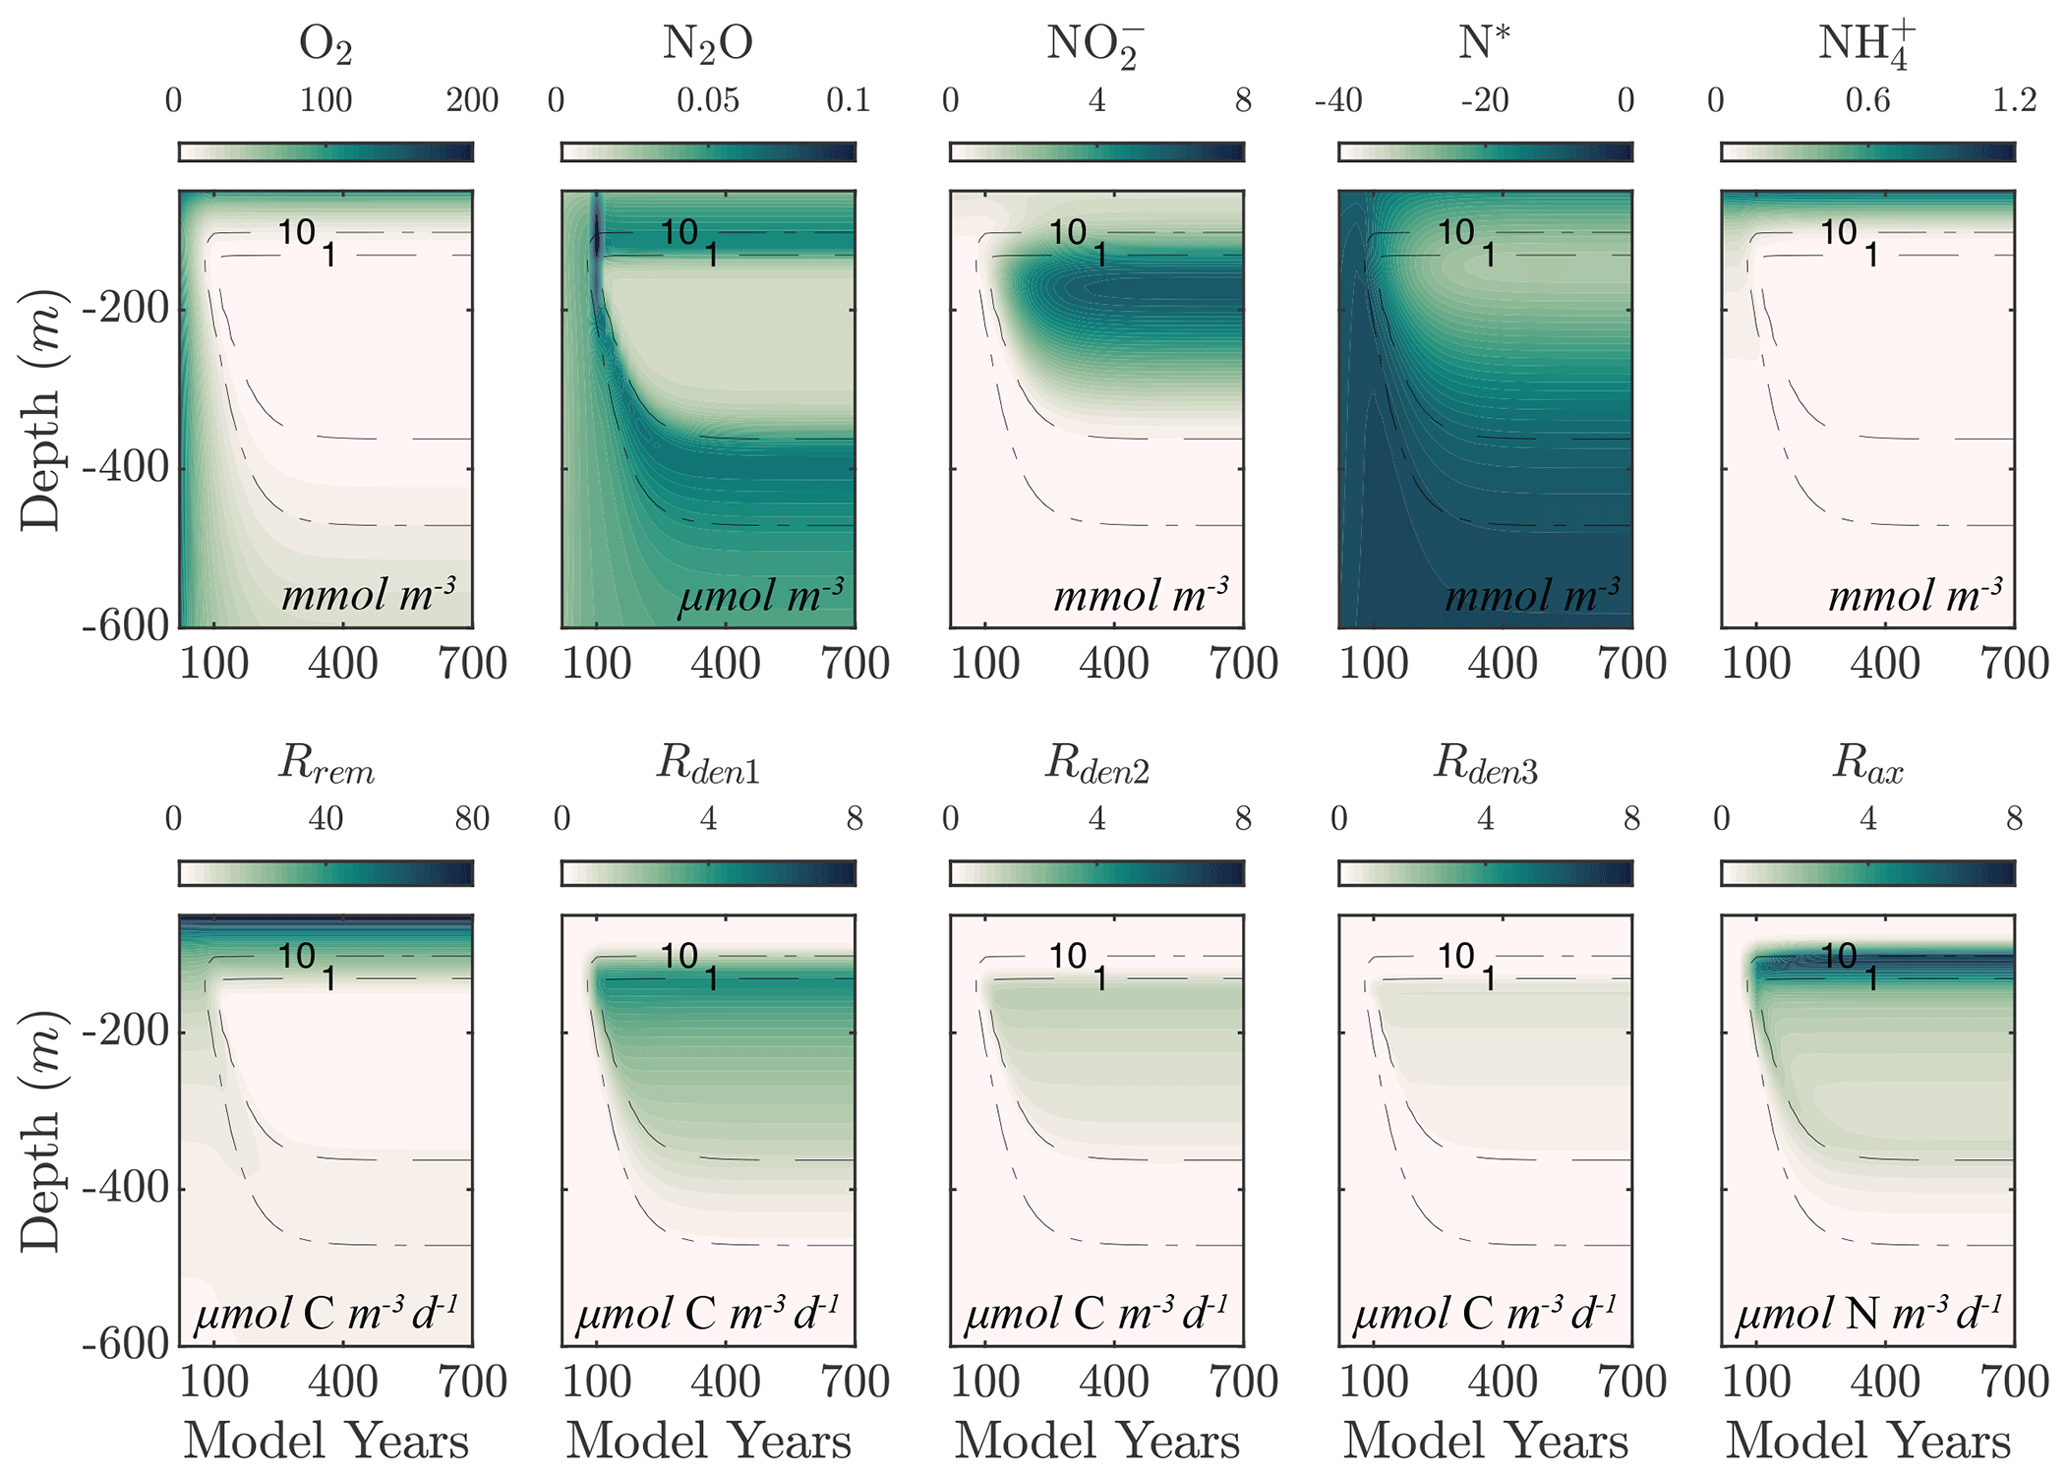
Figure 2Example of spinup of the model. (top) Temporal evolution of O2, N2O, , N*, and from initial ETSP boundary conditions at year 0 to the final model solution at year 700 using the selected parameter set (Optsel) discussed in Sect. 5.2. Dashed black curves highlight the 1 and 10 mmol O2 m−3 contours. (bottom) The same as (top) but for the heterotrophic rates of aerobic respiration (Rrem), reduction (Rden1), reduction (Rden2), and N2O reduction (Rden3). The chemolithotrophic anammox rate (Rax) is also shown in the far-right panel.
The model contains 23 major parameters that control the N cycle, some of which are relatively well constrained by observations, whereas others are poorly known and can plausibly span a broad range of values (Table 1). In the model, these parameters approximate complex or poorly known aspects of microbial physiology, metabolism, and ecology and are thus intrinsically uncertain. In order to select a set of parameters that produces a realistic representation of the N cycle in OMZ, we adopt a “metaheuristic” approach based on application of an optimization algorithm, following an established strategy in ocean biogeochemistry (Schartau and Oschlies, 2003; Ward et al., 2010; Kriest et al., 2017).
To conduct this optimization, we compile available tracer and biogeochemical rate observations for the ETSP OMZ from a July 2013 cruise aboard the R/V Nathaniel B. Palmer, for which abundant trace and rate measurements are available (Fig. 5) (Ji et al., 2015b; Peng et al., 2016; Babbin et al., 2017, 2020), as well as from other cruises in the region (Kalvelage et al., 2013). The observations are then used to define a cost function based on normalized squared deviations between model profiles and observations. The cost function is minimized by applying a covariance matrix adaptation evolutionary strategy algorithm (CMA-ES; discussed in Sect. 4.1), which finds a local optimal solution in the model's multi-dimensional parameter landscape.
The optimization is characterized by large dimensionality, strong non-linearity, a significant computational cost (requiring several 10 000 s model runs to converge), and inherent flexibility in the formulation of the cost function (Schartau and Oschlies, 2003; Kriest et al., 2017). Thus, instead of seeking a single global optimal solution, we generate an ensemble of optimal solutions that provide equally acceptable representations of OMZ processes based on the cost function. To this end, we apply the optimization multiple times, varying the formulation of the cost function slightly and assigning a random error to the observations for each optimization (Table B4). As a result, we produce a set of equally plausible optimal solutions that we further evaluate to select a final parameter set based on additional comparisons with observations, which we use for further analysis.
4.1 Optimization algorithm
The CMA-ES is a stochastic, population-based algorithm that seeks to minimize an objective cost function (Hansen et al., 2009). The CMA-ES falls within the broader class of evolutionary optimization algorithms, where the search for an optimal solution proceeds by an iterative improvement of a population of parameters, with each iteration including a stochastic “evolutionary” element, in loose analogy with biological processes of mutation, recombination, and selection (illustrated in Fig. 3). In contrast with typical evolutionary computation algorithms such as genetic algorithms, in the CMA-ES the mutation and recombination operations are substituted by sampling from a multivariate normal distribution in which parameters (the covariance matrix) are deterministically updated based on previous iteration steps (Hansen, 2006).
The CMA-ES has been shown to be more efficient (i.e., requiring fewer objective function evaluations), accurate (i.e., able to approximate the global optimum when it is known to exist), and robust (i.e., not overly sensitive to the initial choice of parameters) compared to other optimization algorithms, when applied to multi-dimensional, non-linear optimization problems (Hansen et al., 2009; Hansen, 2023). These properties make it suitable for optimization of ocean biogeochemical models (Kriest et al., 2017). A detailed description of the algorithm procedure can be found in Hansen (2023); an overview of the main steps of the algorithm and its application to ocean biogeochemistry are presented in Kriest et al. (2017).
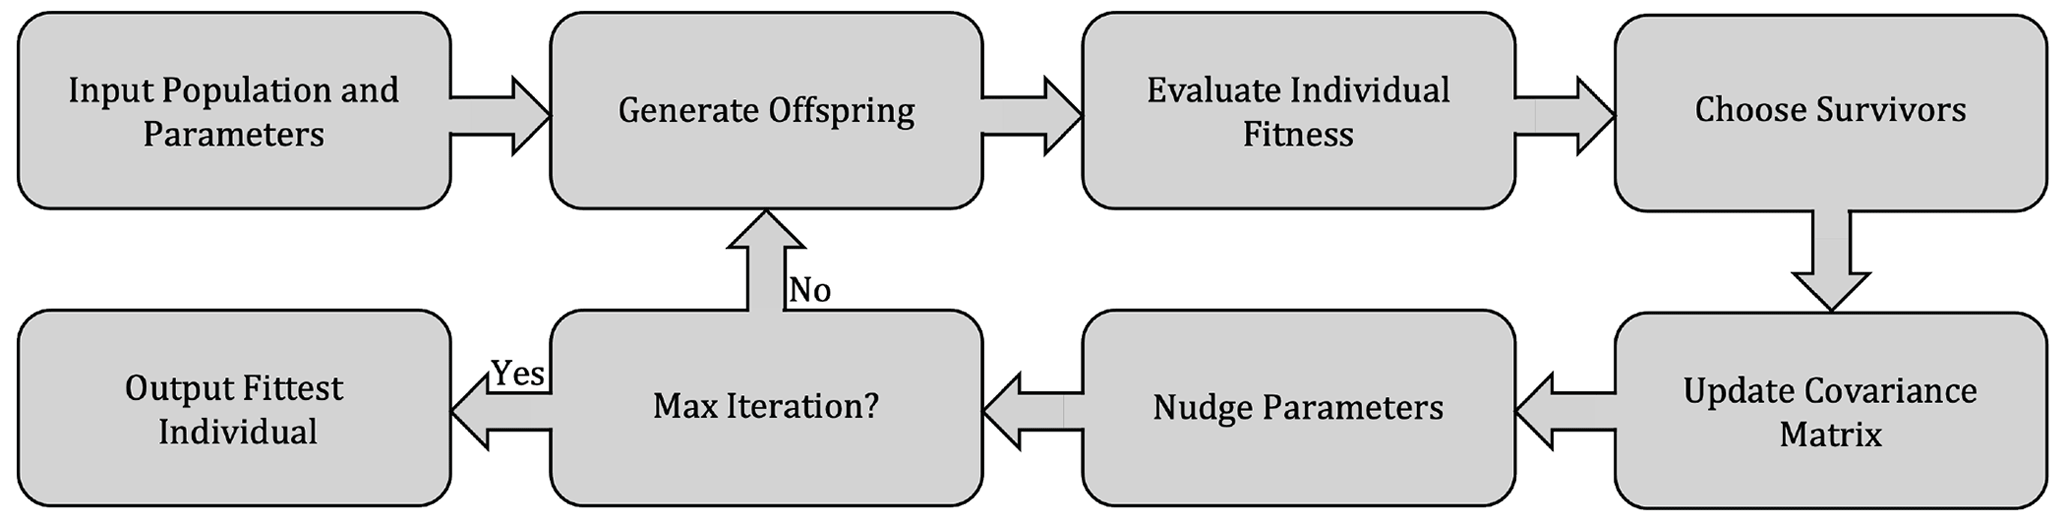
Figure 3Flowchart of the CMA-ES optimization algorithm used to constrain uncertain model parameters.
4.2 Optimization implementation
As an illustration of NitrOMZ, we perform a series of optimizations against ETSP OMZ observations. For this configuration, we set a constant upwelling velocity (wup) but impose a variable vertical diffusion (Kv) profile, with lower diffusion in upper stratified layers, and a transition to higher diffusion in deeper layers (Fischer et al., 2013) (Fig. C1, left panel). This is a simplifying assumption that allows us to control the vertical scale for advective–diffusive transport (given by the ratio between vertical diffusivity and upwelling velocity, ), without requiring vertical divergence terms in the conservation equation for tracers associated with variable vertical velocities. Since this simulation targets the core of the OMZ, generally characterized by sluggish horizontal circulation (Karstensen et al., 2008), we turn off far-field tracer restoring. This simplifies analysis of model balances between transport and reaction rates, while resulting in realistic tracer distributions. The top and bottom boundary conditions are listed in Table B3 and are extracted from observations.
As a first step, we select parameters that control aerobic remineralization processes (Rrem) and lead to a realistic vertical O2 profile relative to ETSP observations, including the vertical position and thickness of oxygen-deficient waters (O2<5 mmol m−3) (Fig. 5). These consist of the vertical diffusion and upwelling magnitude, the Martin curve coefficient (b), and the upper-ocean POC flux (), based on values consistent with observations (Table B2 and Fig. C1). For simplicity, we also set the maximum aerobic remineralization rate (krem) and the O2 half-saturation constants for and oxidation ( and , respectively) to reported values in the literature (see Table 1). We then employ the CMA-ES algorithm in NitrOMZ to optimize the remaining 20 parameters that control heterotrophic and chemolithotrophic reactions in Fig. 1, using the range of parameter values listed in Table B1.
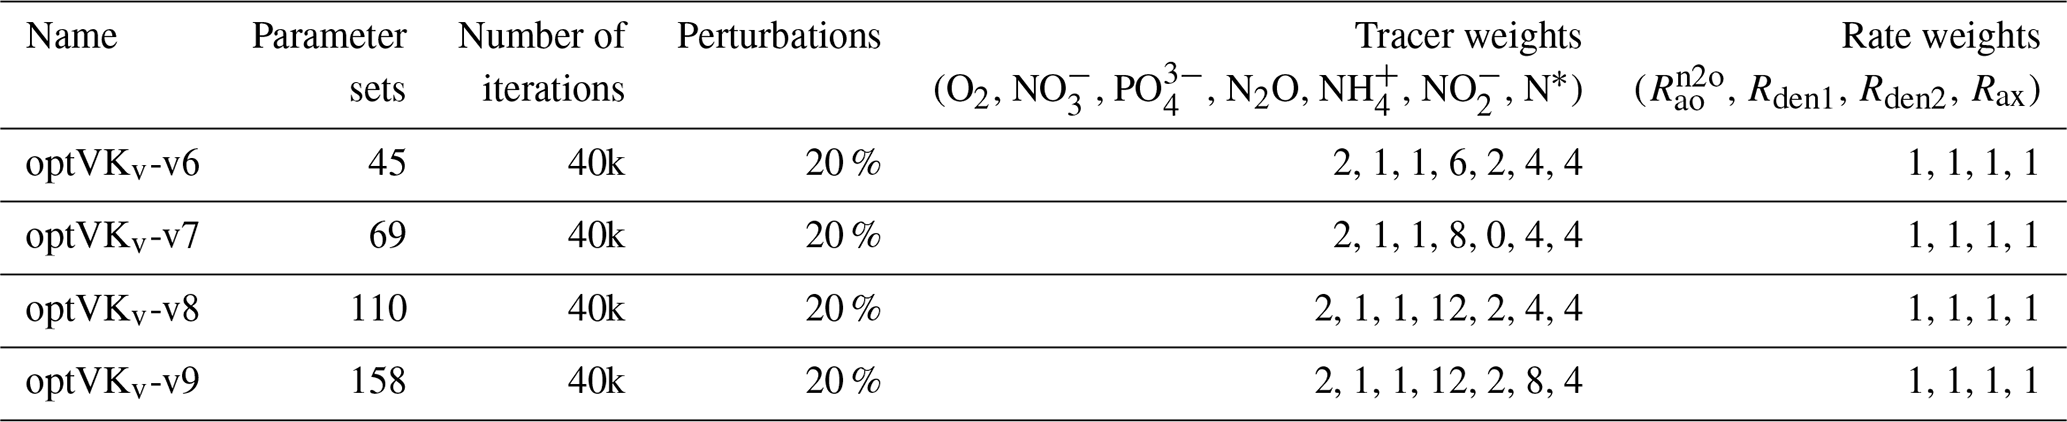
To optimize more uncertain parameters that control the anaerobic N cycle, we then conduct four sets of optimizations, with cost functions devised to match desired characteristics of tracer and rate profiles in the ETSP OMZ. Briefly, the cost function is calculated as the mean square of the difference between observations and model output profiles for a series of variables that include tracers and N transformation rates (listed in Table B4). Before each optimization, a random error of up to 20 % is assigned to each observation to increase the variability in observational constraints and improve the robustness of the optimization ensemble by preventing it from always converging in the neighborhood of a specific local minimum controlled by non-relevant features of the observations. Three additional constraints are imposed to improve the fit to observations for N cycle processes occurring within the core of the OMZ. First, all rates are weighted equally, whereas different weights are assigned to each tracer, giving higher weight to N2O and , which are central to the anaerobic N cycle. Because of possible influence from horizontal advection in observations, discrepancies exist between modeled and observed and . To compensate for this, we also assign lower weights to and and higher weight to N*. Second, a depth-dependent weighting scheme is included to emphasize the match to observations in the OMZ interior. This vertical weight is shaped as a Gaussian curve centered at the core of the observed OMZ, where the bulk of anaerobic transformations targeted by our model occurs so that values within the core of the OMZ are weighted up to twice as much as values outside the OMZ. Finally, N cycle transformation rates are shifted vertically to match their depth relative to the oxycline (here defined as O2=1 mmol m−3) in both model and observations and rescaled by a factor proportional to observed vs. modeled POC flux in the upper ocean. The only difference between the four sets of optimization is the relative weights assigned to each tracer, listed in Table B4. In total, we obtain 382 optimized parameter sets for further analysis.
5.1 Optimization results
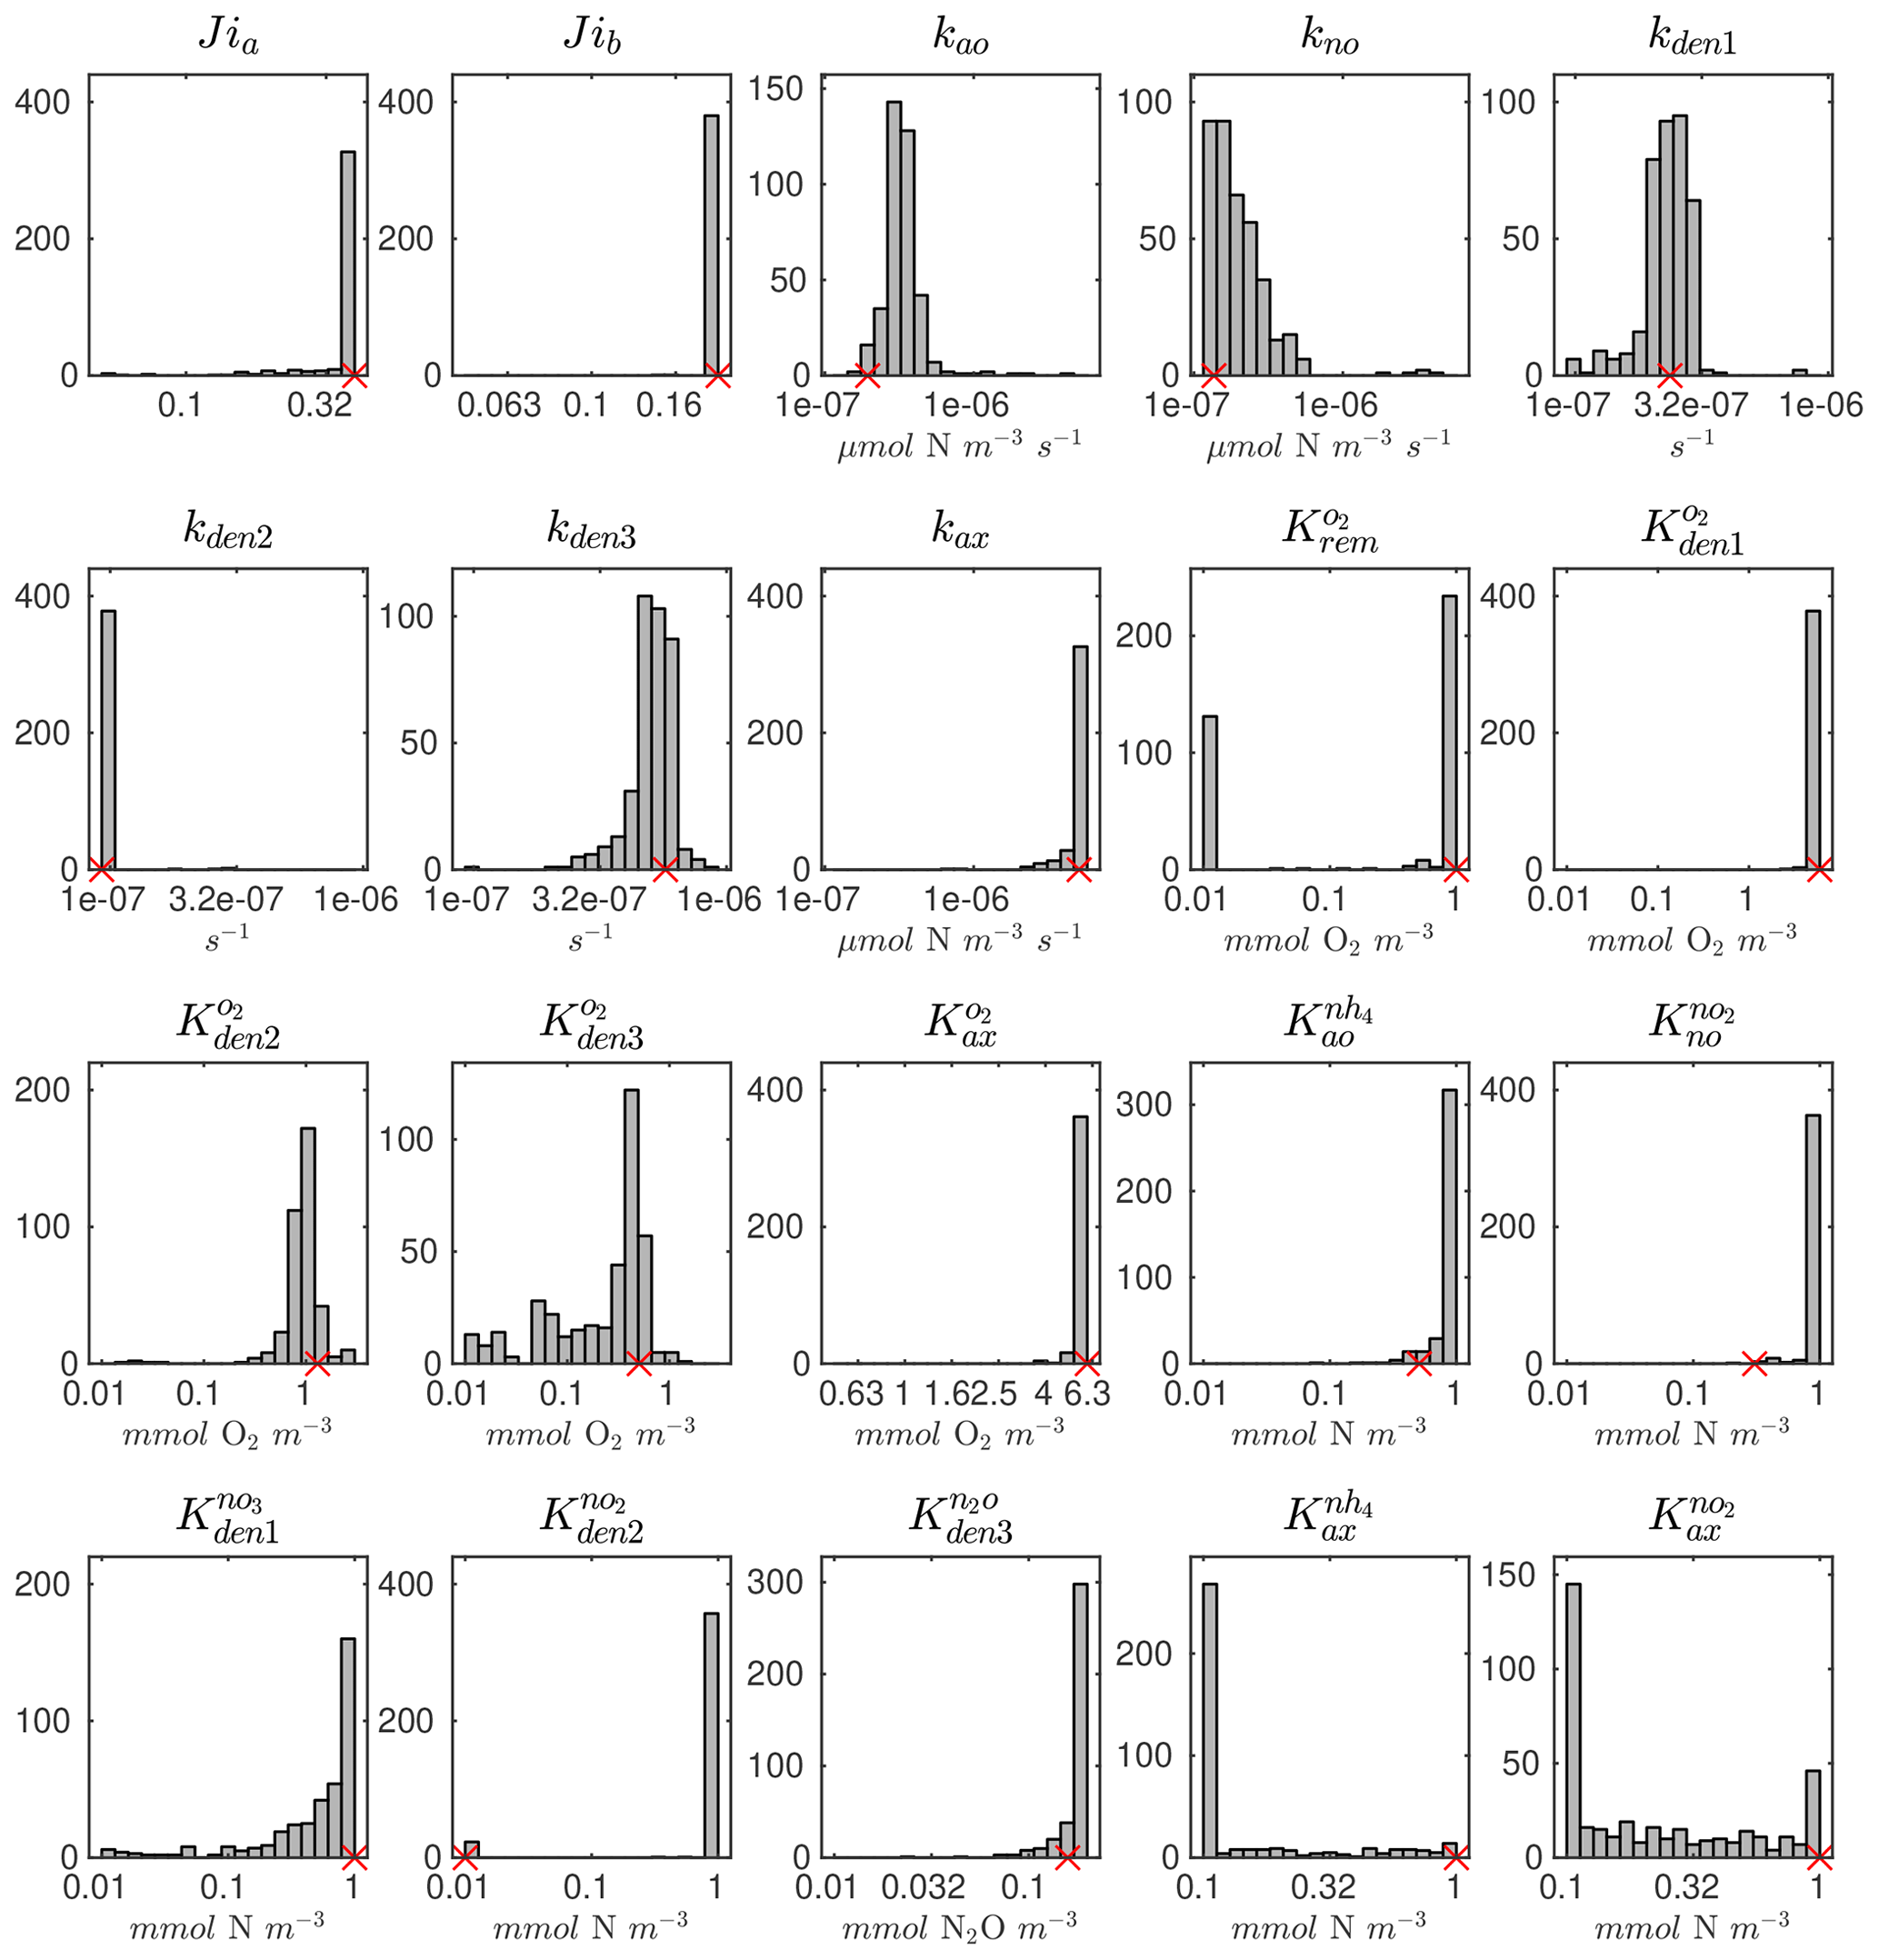
The distributions of the parameter values from the 382 sets of optimizations (see Sect. 4.2 and Table B4) are shown in Fig. C2. Rather than always converging to the same set of parameters, the optimization shows some variability for specific parameters. This reflects the stochastic nature of the CMA-ES algorithm, the inclusion of random variations in the observations, and the highly non-linear nature of the optimization problem, which may allow for non-unique optimal solutions. Optimized maximum rates (such as kao, kno, kden1, and kden3) and exponential O2 inhibition parameters for step-wise denitrification ( and ) reveal more variability than half-saturation concentration coefficients (K terms), which often settle to the minimum or maximum allowed value (Table B1).
Pairwise correlations in Fig. 4 reveal several parameter pairs which exhibit strong relationships, reflecting the fact that in a significantly non-linear optimization, similar results can be obtained by trade-offs between different parameters and processes. Notably, the exponential O2 inhibition constants for and N2O reduction ( and , respectively) are strongly correlated with each other (R=0.73) and with other parameters controlling the denitrification steps. These include positive correlations with the maximum rate parameters for and reduction (kden1 and kden2, respectively) and negative correlations with the half-saturation constants for and N2O reduction ( and , respectively). These correlations suggests tight couplings between modeled denitrification steps, wherein high/low maximum denitrification rates can be compensated by lower/higher half-saturation coefficients, respectively.
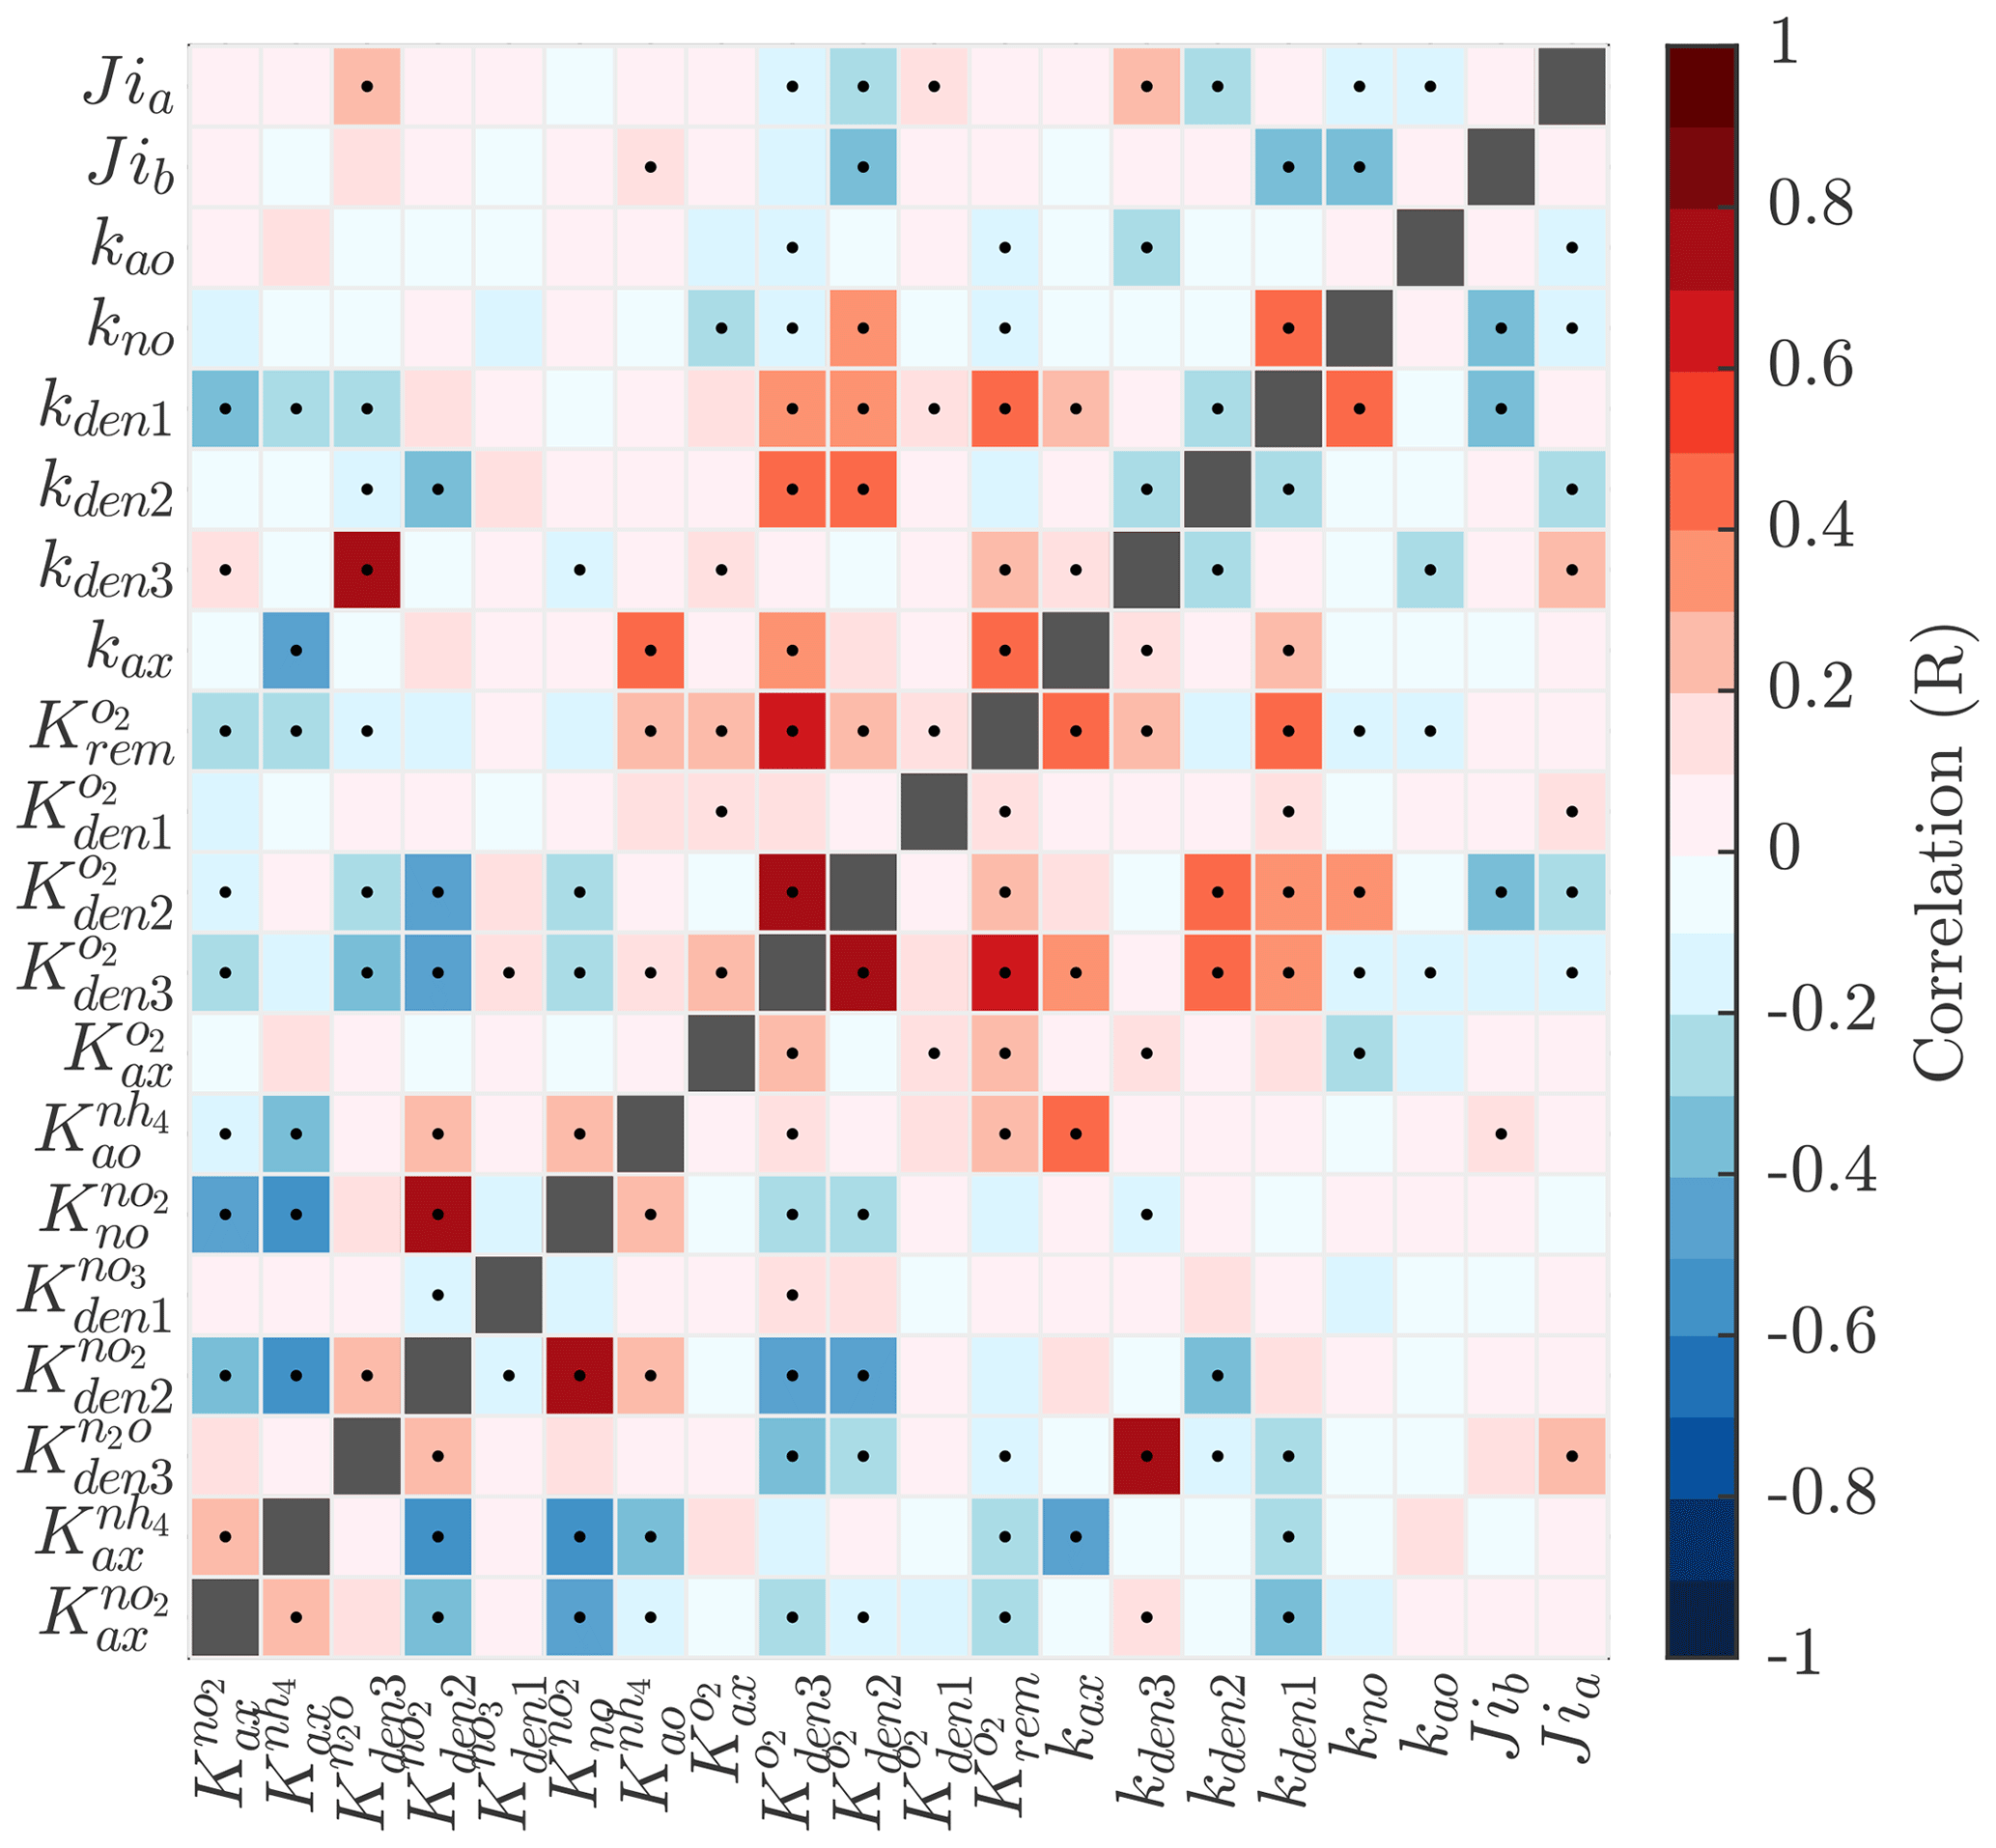
Figure 4Pairwise correlations between model parameters for model solutions optimized for the ETSP OMZ. See Table B1 for a list and a description of the model parameters. Correlation is shown as the Pearson correlation coefficient, with dots representing p values <0.01.
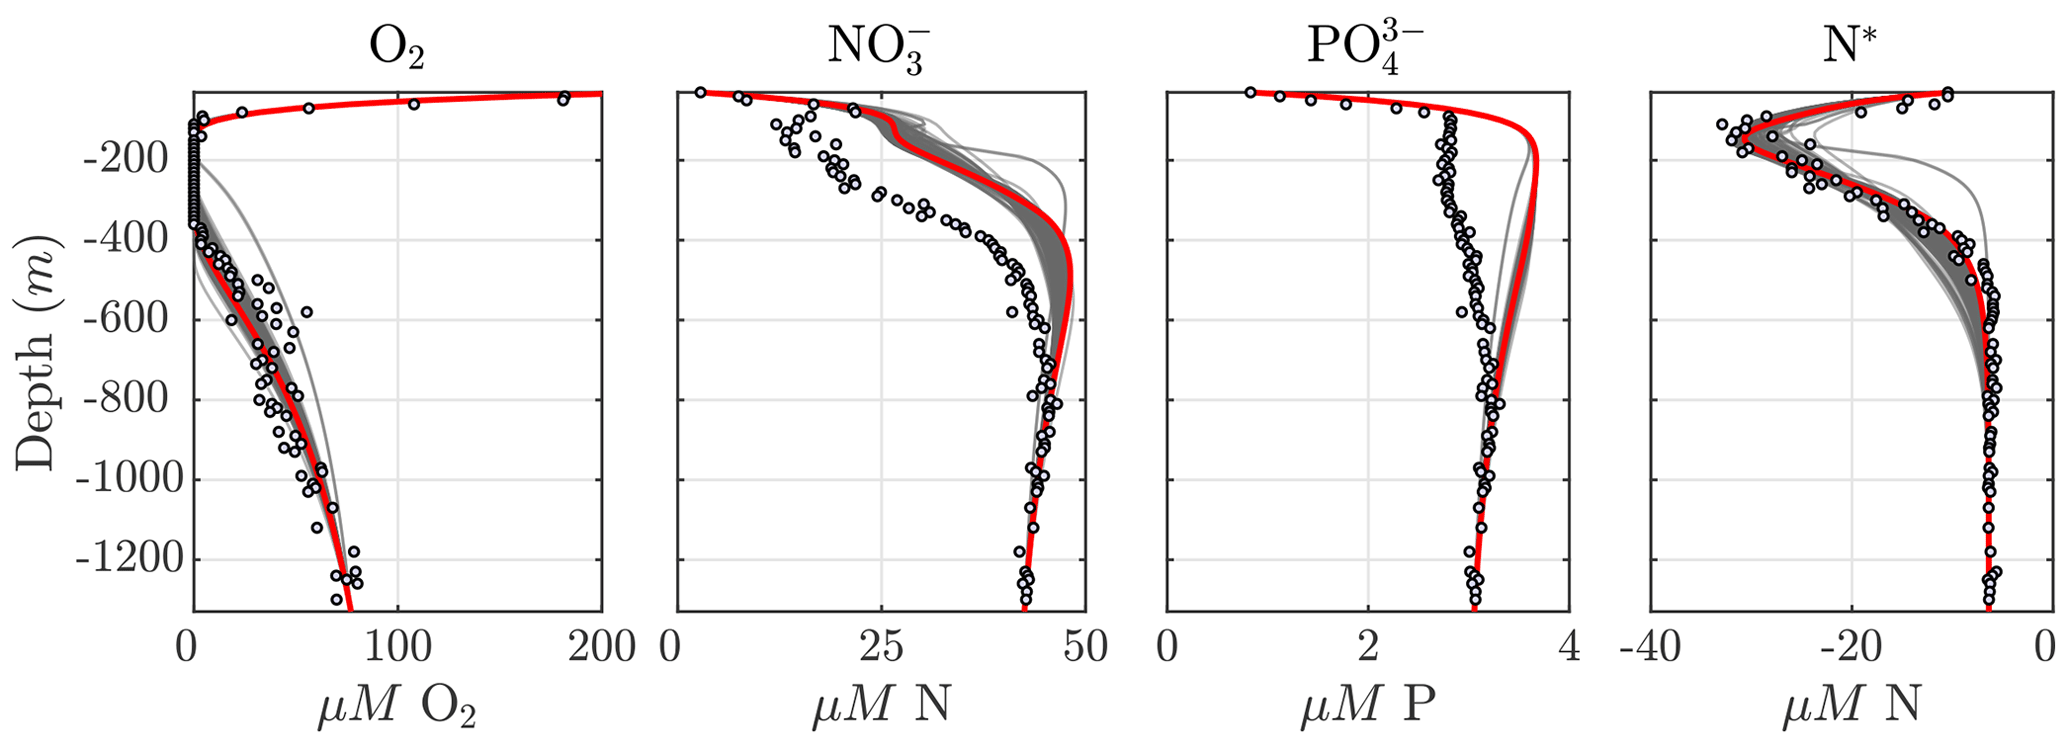
Considering the variability in the optimal parameter sets and the complexity of the cost function, which depends on observations for multiple variables at different depths, the resulting N cycle profiles show similar features across all optimal solutions (Fig. 5, top panels; see also Fig. C3 for macronutrient profiles). When compared to observations, the majority of parameter sets are able to skillfully model (1) the vertical distribution of O2, including the oxygen-deficient layer between roughly 100 to 400 m; (2) the subsurface maximum in ; (3) the rapid attenuation of with depth; and (4) the subsurface minimum in N*.
N cycle transformation rates also show similar consistency in their vertical profiles, albeit with more notable discrepancies with observations, possibly reflecting the higher variability and more complex nature of these measurements. Lower rates than observed may also reflect the fact that incubation experiments provide potential rates rather than in situ rates. In general, the yield of N2O from oxidation () is 𝒪(100) times less than for (), following Eq. (A8) and (A9), consistent with observations (Ji et al., 2015a, 2018a; Santoro et al., 2021). The step-wise denitrification rates (Rden1, Rden2, and Rden3) show remarkably similar vertical profiles, with higher reduction rates (Rden1) and nearly identical magnitudes between Rden2 and Rden3. Anammox (Rax) shows a similar profile as denitrification, albeit with enhanced local maxima near the upper- and lower-oxycline depths surrounding the OMZ core, consistent with observations (Kalvelage et al., 2013).
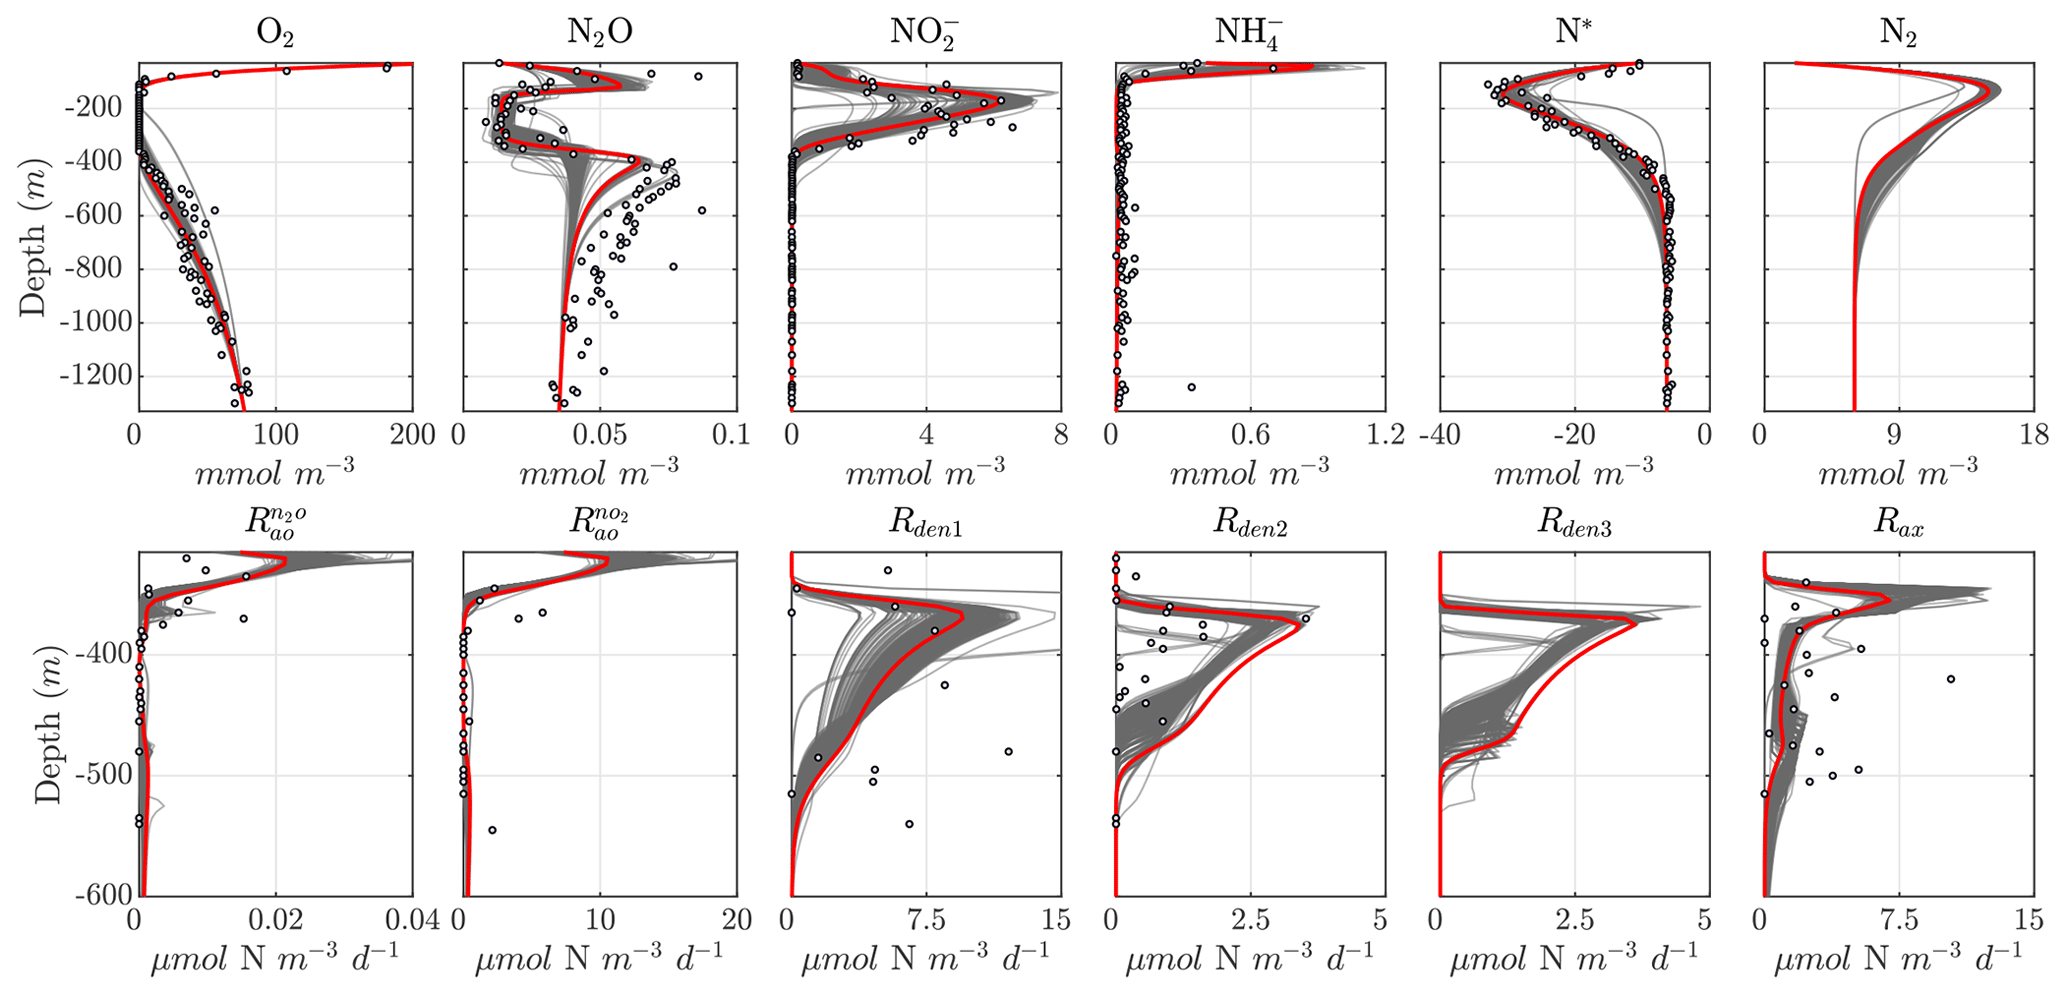
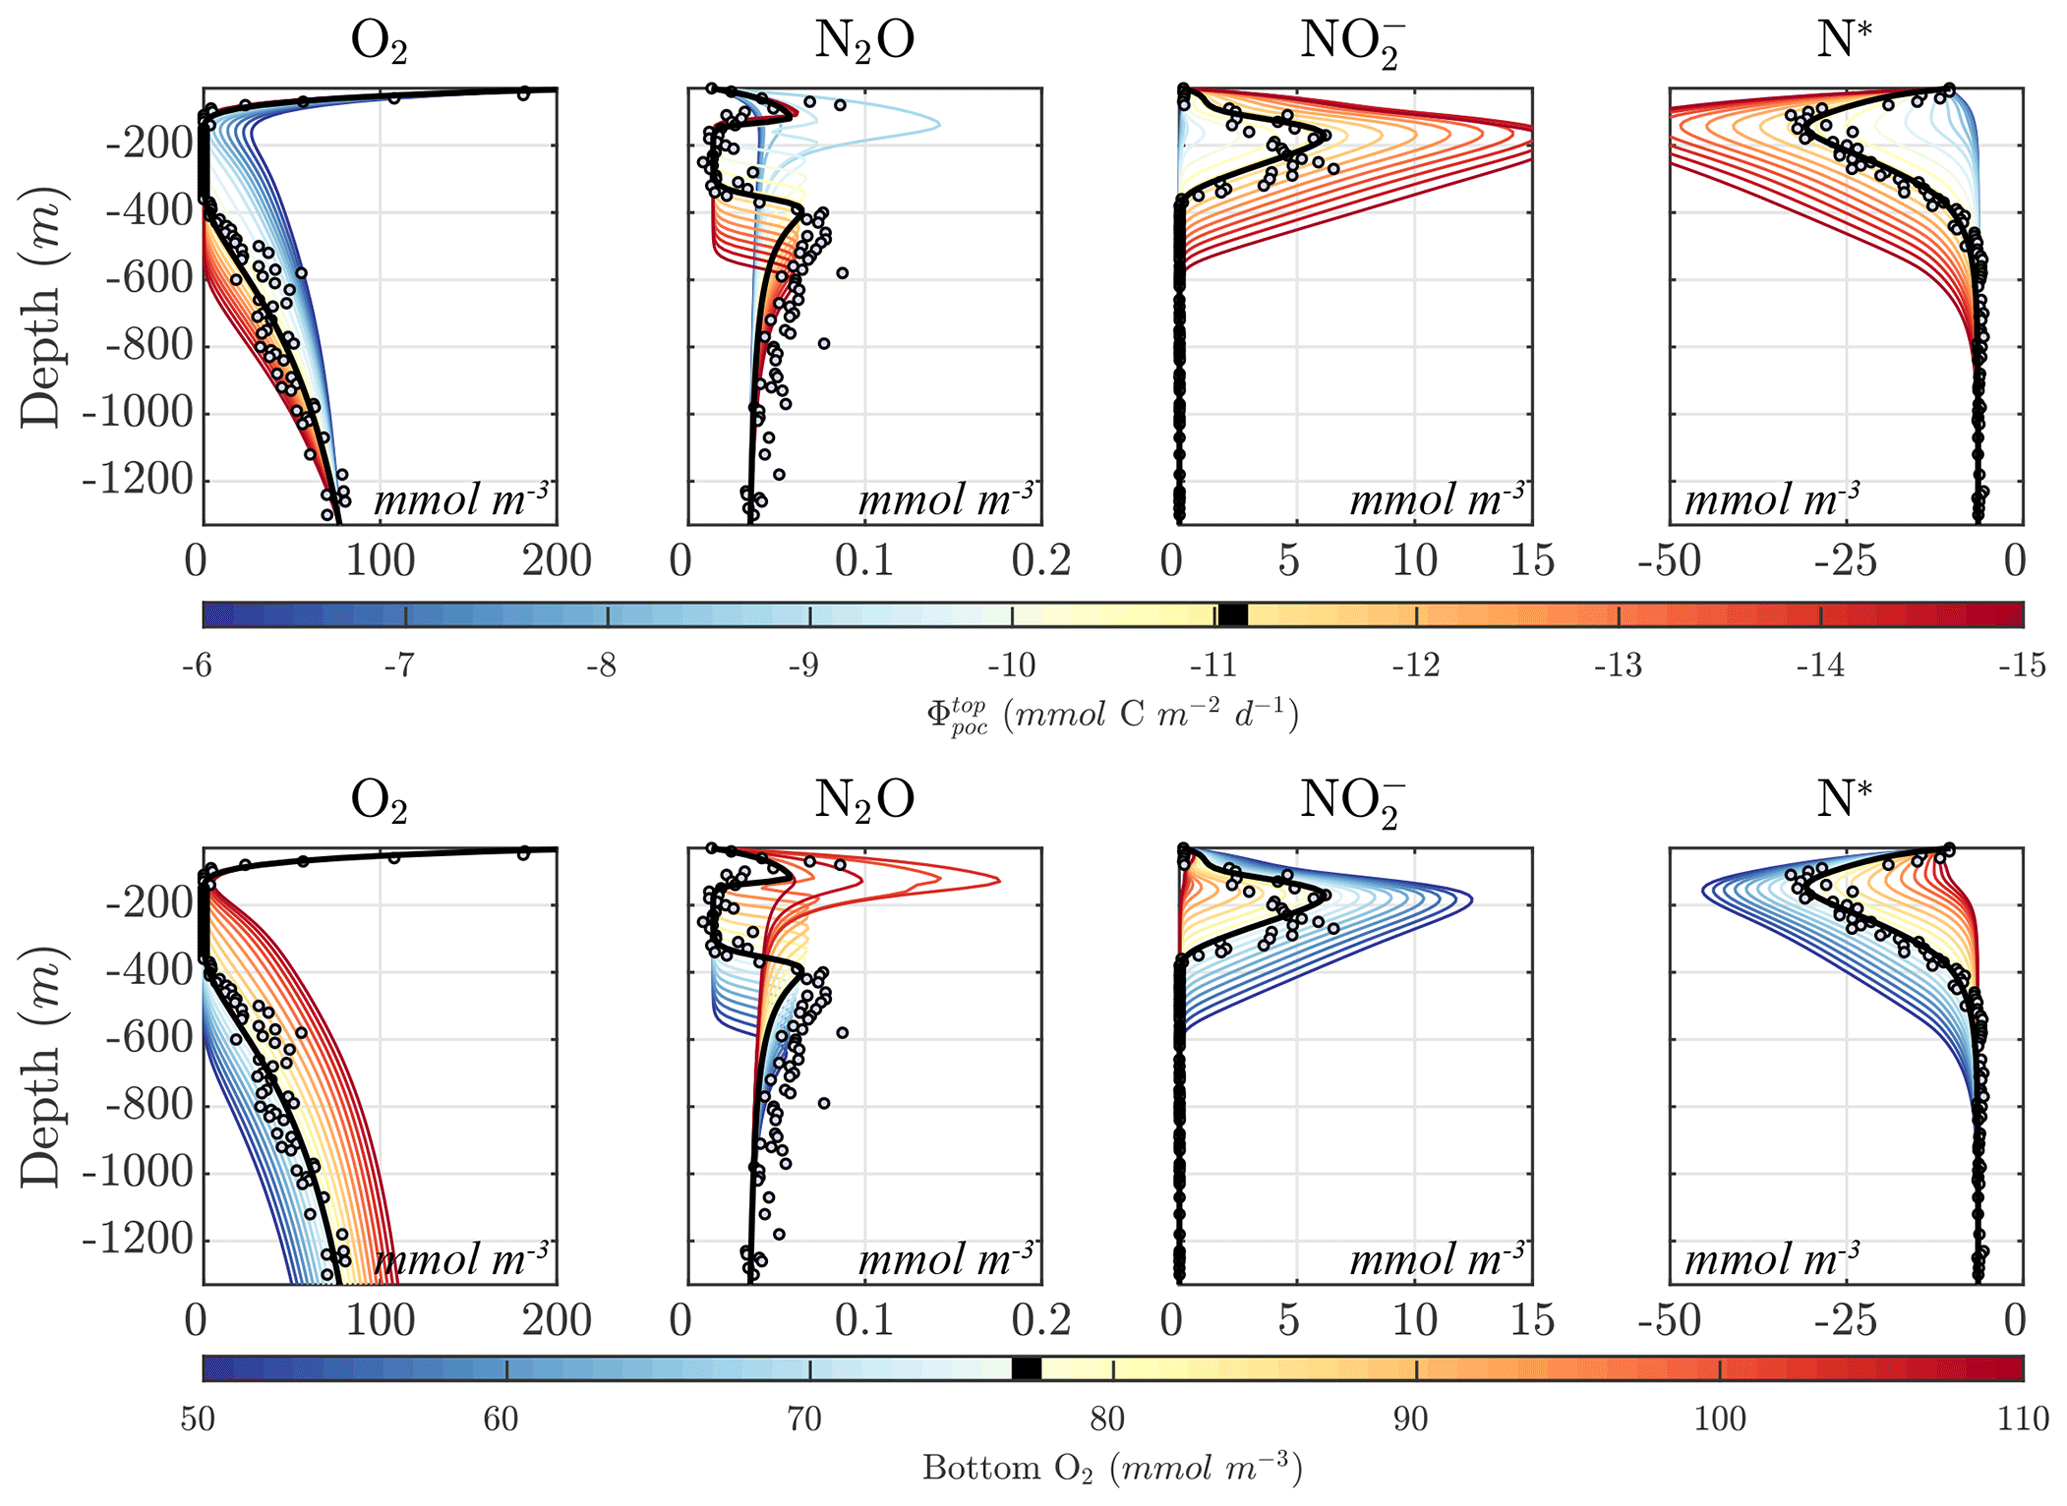
Figure 5Results from the optimized ensemble of model solutions. (top) Tracer (O2, N2O, , , N*, and N2) profiles from all 382 optimized ETSP parameter sets. The bold red curves show the selected parameter set (Optsel) discussed in Sect. 5.2. Observations used to define the optimization cost function are shown as circles in each panel. Macronutrient profiles ( and ) are shown in Fig. C3. (bottom) The same as in (top) but for reaction rate profiles of N2O and production from oxidation ( and , respectively); , , and N2O reduction (Rden1, Rden2, and Rden3, respectively); and anammox (Rax).
Several robust features emerge from the optimized parameter solutions, suggesting underlying mechanisms that need to be captured for a faithful representation of the OMZ N cycle. In particular, the differences in the exponential O2 inhibition parameters for denitrification, shown in Fig. 6 (left panel), reveal the existence of progressively lower O2 tolerance for step-wise denitrification () from all optimized parameter sets. As a result, denitrification can stop at either N2O or as O2 increases above anoxic levels, leading to “incomplete” denitrification (Babbin et al., 2015).
Within the anoxic core of the OMZ (∼100 to 350 m depth), O2 is low enough in all optimizations to allow each of the steps to proceed unimpeded (Fig. 5). The large differences between and reduction (Rden1−Rden2, middle panel of Fig. 6) allow accumulation of a characteristic subsurface peak in near the OMZ core. Conversely, N2O produced via reduction (Rden2) is quickly consumed via N2O reduction (Rden3), leading to a pronounced N2O deficit near the OMZ core. The progressive O2 inhibition of the three steps of denitrification results in a decoupling between these reactions that is particularly evident in the oxycline layers above and below the OMZ, where N2O accumulation dominates, as N2O reduction (i.e., consumption) is more strongly inhibited by O2 than reduction (i.e., N2O production, right panel of Fig. 6). Thus, the O2 range defined by and can be thought of as a N2O production “window” that allows net N2O accumulation in the water column (Babbin et al., 2015). This O2-driven decoupling of anaerobic reactions is consistent with the observed sequential inhibition of N2O and N2 production in incubation experiments (Dalsgaard et al., 2014), although we find O2 inhibition thresholds that are somewhat higher than suggested by those experimental studies. Conversely, other studies have suggested much higher O2 inhibition thresholds for anaerobic processes, on the order of several mmol m−3 (Kalvelage et al., 2011; Ji et al., 2018a).
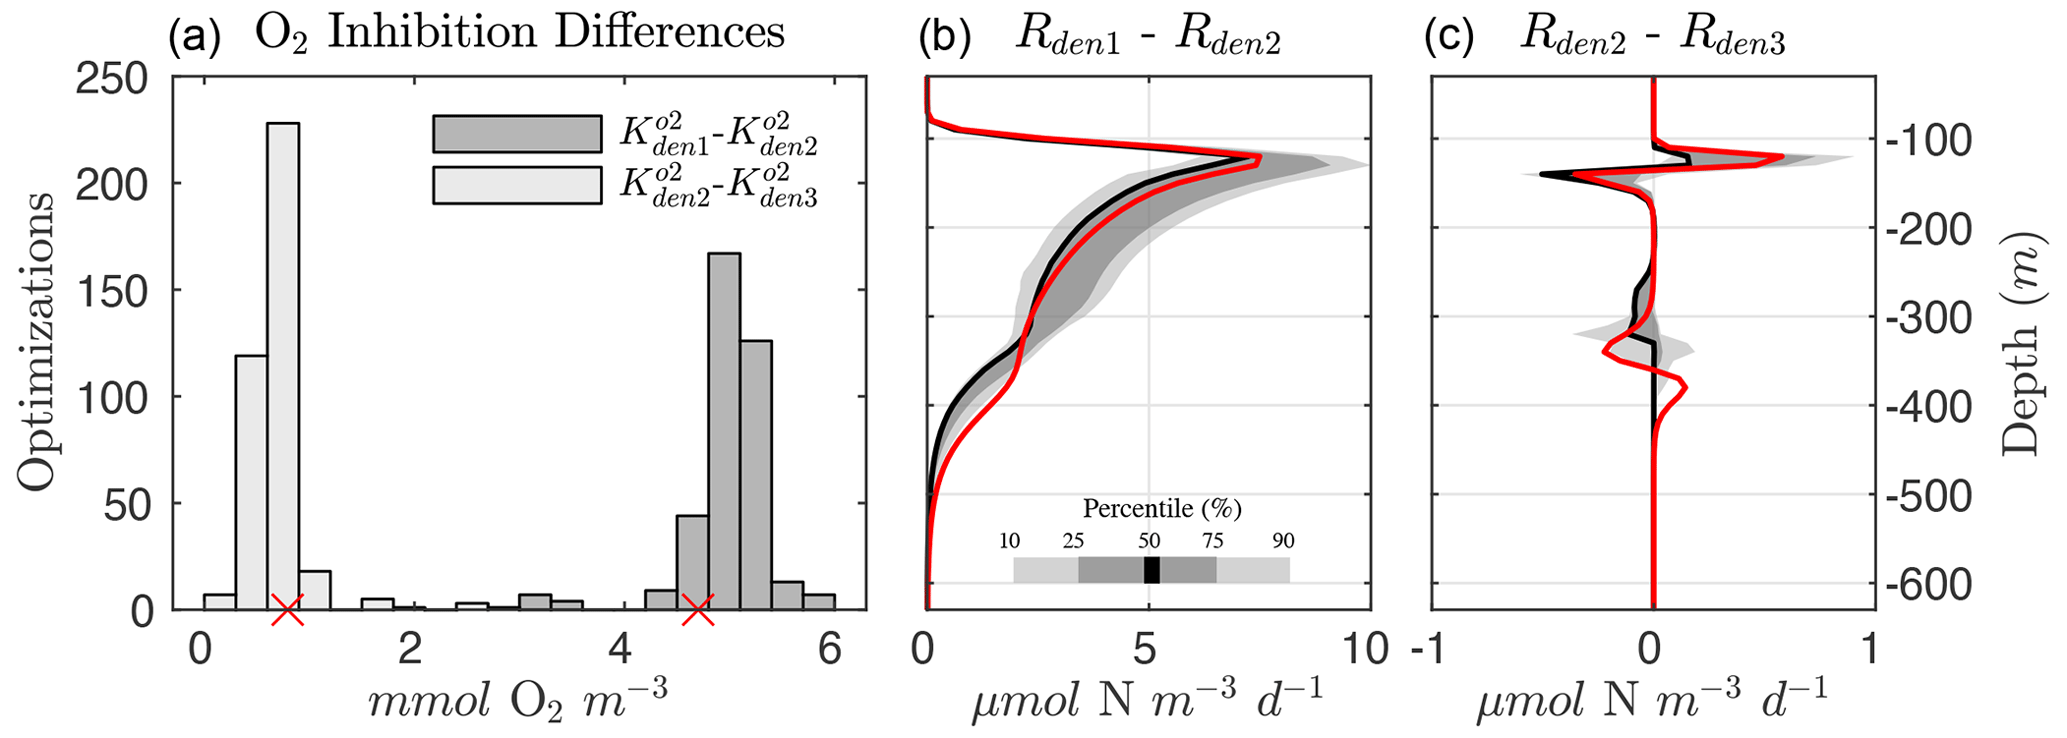
Figure 6Progressive O2 inhibition of denitrification steps. (a) Histogram showing the distribution for all optimized solutions of the difference in the O2 inhibition constant for and reduction ( and , in dark gray) and and N2O reduction ( and , in light gray). The small red markers denote the values from Optsel. (b) Rate differences between and reduction (Rden1 and Rden2). Shading represents the 10/90 and 25/75 percentile at each vertical level from the 382 analyzed parameter sets. The bold red curves denote Optsel results. (c) The same as (b) but for the difference in and N2O reduction rates (Rden2 and Rden3).
The vertical profile of the step-wise denitrification rates (Rden1, Rden2, and Rden3) shows remarkable agreement across solutions, with only a small subset of parameter sets that behave as outliers (Fig. 5). As a consequence, the fraction of POC remineralized by each heterotrophic reaction remains consistent across optimizations (Fig. 7, top panels). Near the base of the euphotic zone, at around 30 m depth, aerobic remineralization (Rrem) far exceeds denitrification, reflecting O2 inhibition of the latter. However, as O2 decreases to suboxic levels around 100 m depth, reduction becomes the dominant remineralization pathway (up to 60 % of total remineralization). As O2 drops further within the OMZ core (∼100 to 350 m depth), and N2O reduction rapidly take up the remaining fraction (∼25 % and 15 %, respectively), albeit with more variability than near the euphotic zone. Below the OMZ, as the water column reverts to oxic conditions, aerobic remineralization dominates, and by 500 m depth, all solutions show essentially no denitrification.
The processes responsible for fixed N loss (anammox, reduction, and N2O production from oxidation) are also consistent across optimizations (Fig. 7, bottom panels). Within oxygenated waters, N2O production from oxidation () is by far the dominant fixed N loss term, as all other sources are inhibited by O2. Anammox (Rax) becomes the dominant term within the upper and lower oxycline due to increased availability of both (from denitrification and nitrification) and (from the decomposition of sinking POC), consistent with observations (Babbin et al., 2020). In the anoxic OMZ core, relief from O2 inhibition allows reduction to outcompete anammox for and contributes up to 60 % of the total N loss, with anammox making up the remaining 40 % (also see Fig. 5). This is somewhat higher than expected from purely stoichiometric constraints (Koeve and Kähler, 2010; Bianchi et al., 2014), likely reflecting vertical transport of and , co-occurrence of aerobic and anaerobic processes, and the higher O2 threshold for anammox inhibition in oxygenated waters. The resulting profile of total N loss thus reveals subsurface maxima predominantly driven by anammox, with denitrification leading total OMZ losses.
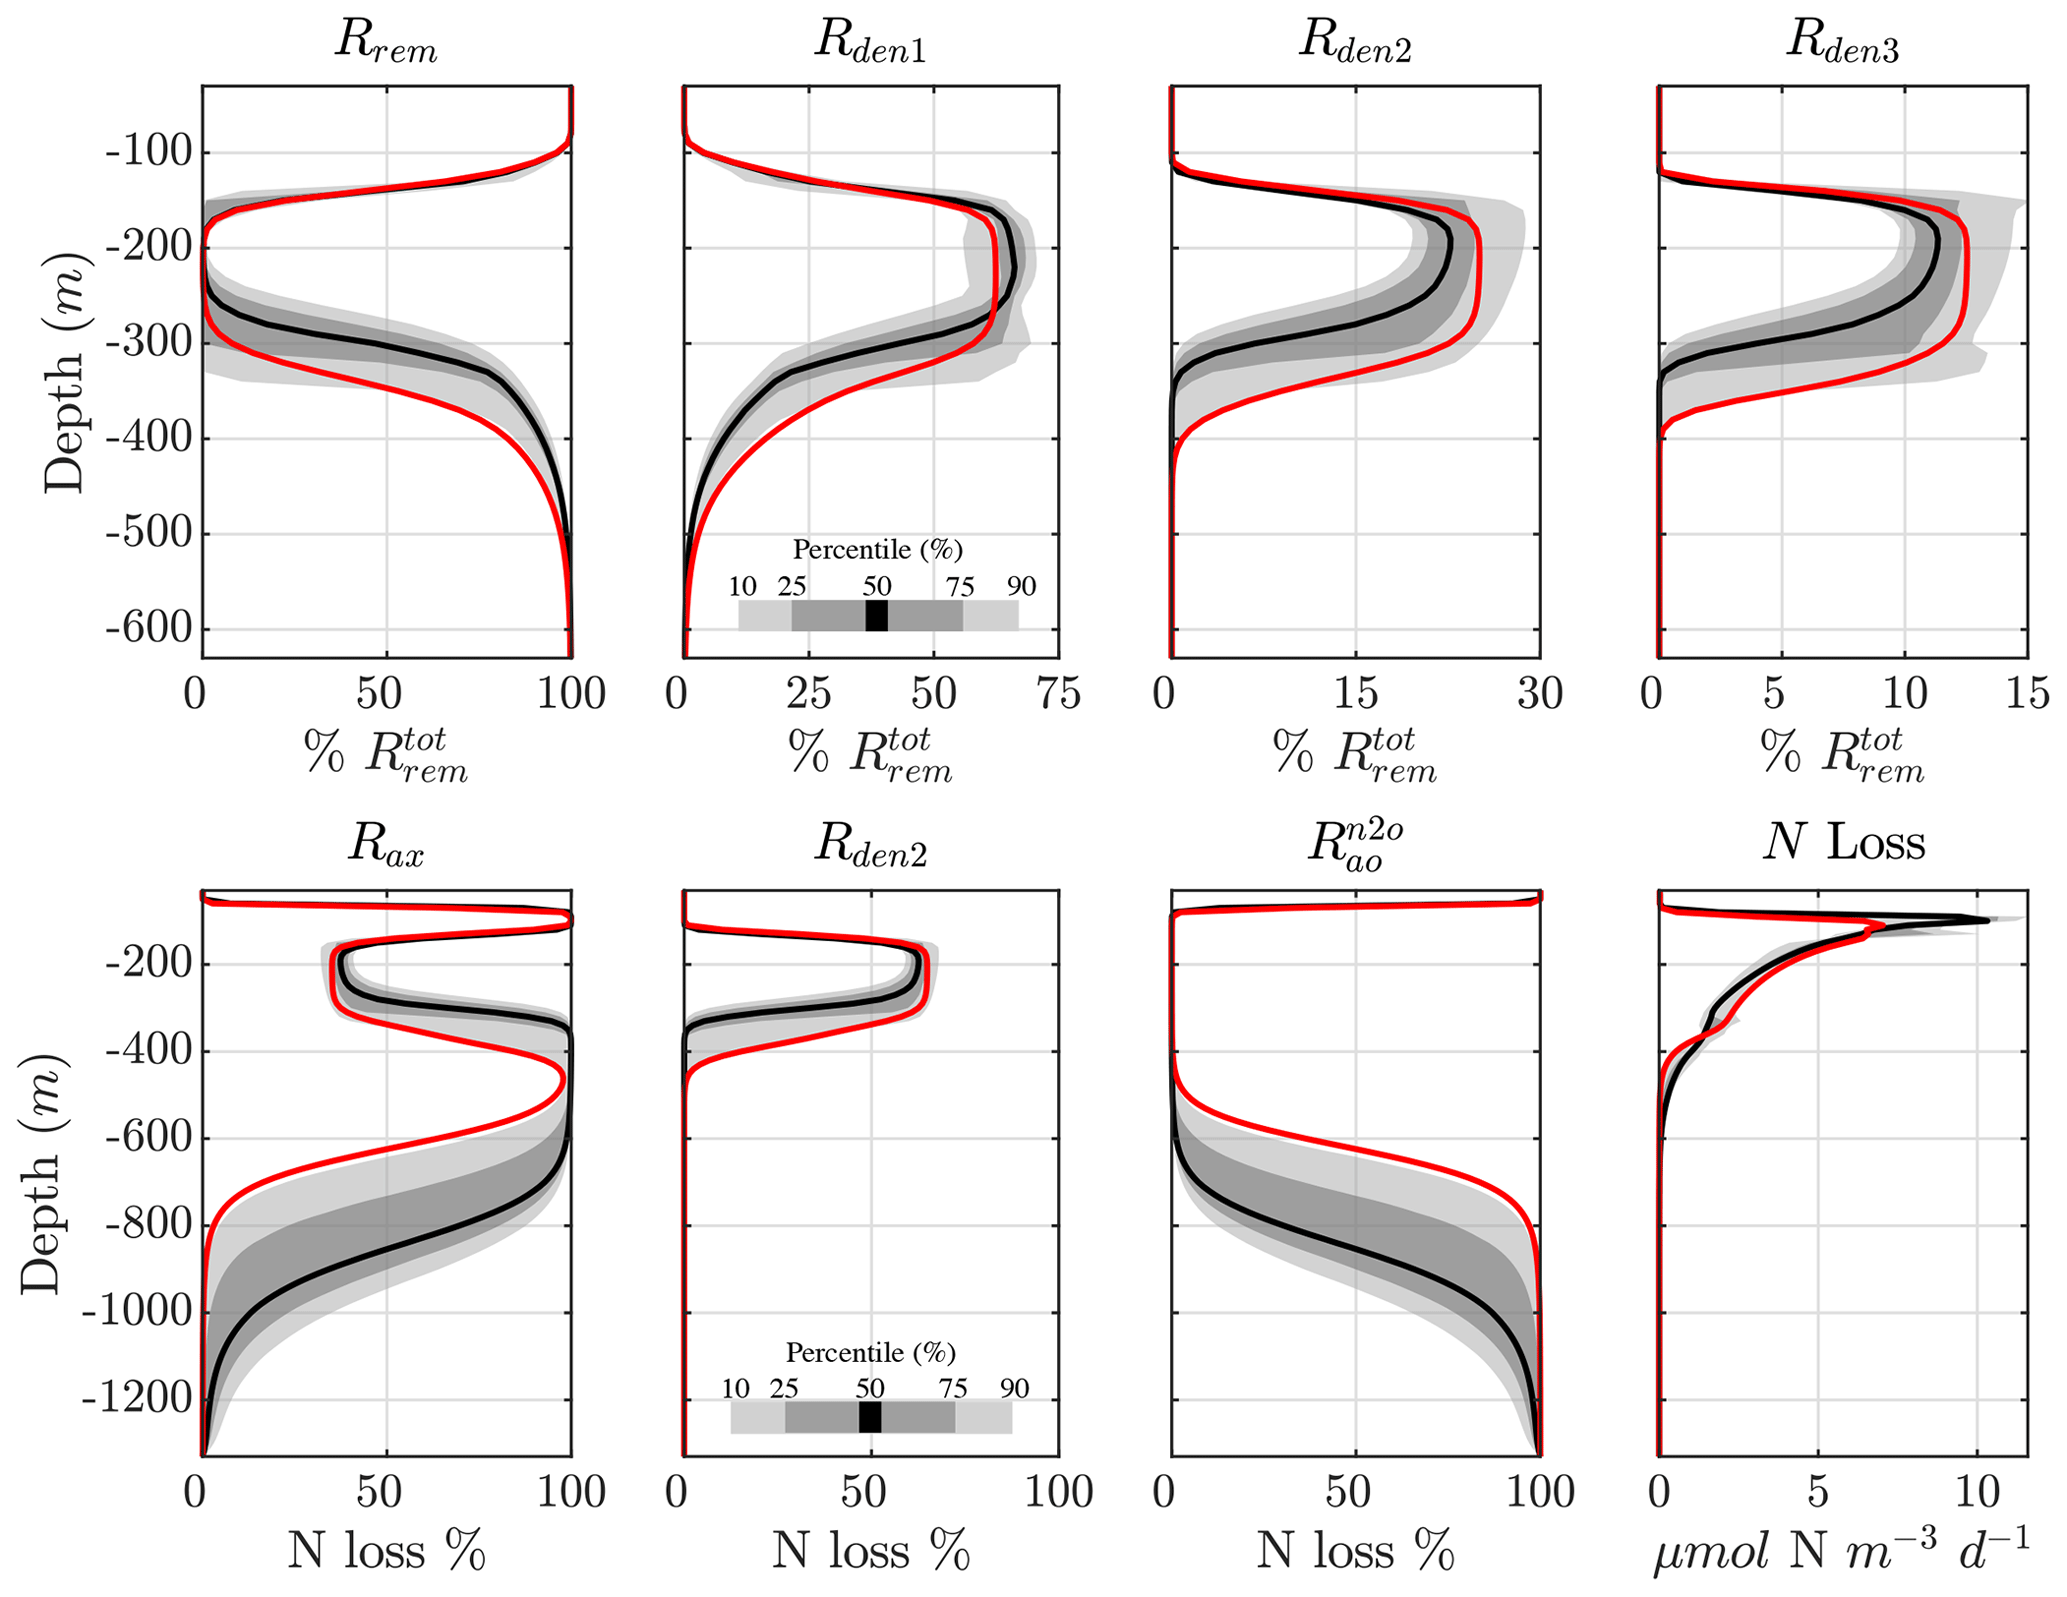
Figure 7Contribution of different reactions to organic matter remineralization and fixed N loss. (top) Fraction of total POC remineralized by each heterotrophic rate (Rrem, Rden1, Rden2, and Rden3). Shading represents the 10/90 and 25/75 percentile at each vertical level from the 382 analyzed parameter sets. The bold red curves denote the selected parameter set (Optsel) discussed in Sect. 5.2. (bottom) The same as (top) but for the fraction of total fixed N loss (via production of N2 and N2O) from anammox (Rax), reduction (Rden2), and N2O production from oxidation (). The total fixed N loss is also shown. Note the different vertical axes for the bottom panels.
5.2 Selected solution for the eastern tropical South Pacific
Among tracers, N2O profiles show significant variability between optimizations. While all optimizations generate two peaks in N2O surrounding the oxygen-deficient core, only a subset is able to reproduce the observed magnitude of the secondary peak at the lower oxycline (roughly 500 m depth; see Fig. 5). This subset forms a “cluster”' of optimizations that share common features that facilitate the formation of a realistic deep N2O peak, including higher O2 inhibition thresholds (between 1.0 and 2.0 mmol m−3 for reduction and between 0.5 and 1.0 mmol m−3 for N2O reduction) and a wider O2 window where net N2O production is favored (between 0.5 and 1.0 mmol m−3 width). Additionally, while most optimizations are able to reproduce the OMZ peak in , significant variability in its magnitude exists. Given the central roles of N2O and in both nitrification and denitrification pathways (Fig. 1) and the importance of oceanic N2O emissions to the atmosphere, we assign high priority to optimizations that reproduce realistic features in the distribution of these tracers, in particular a higher magnitude for the secondary N2O maximum. To this end, we select a parameter set (hereafter Optsel), which results in N2O and profiles closer to observations (bold red curves in Fig. 5, with parameter values reported in Table B1). We use this Optsel parameter set for further analysis of the model sensitivity.
Compared to the other parameter sets, Optsel is characterized by weaker maximum and oxidation rates (kao and kno, respectively) and smaller half-saturation constants for reductant uptake ( and , respectively) (Fig. C2). In surface oxygenated waters, this results in relatively higher and (Fig. 5). In contrast, maximum denitrification rates (kden1, kden2, and kden3) are close to the median values from all optimizations. Rates of and N2O reduction (Rden2 and Rden3, respectively) are generally larger than other solutions, in particular near the lower oxycline (Fig. 5). This increases POC consumption within this depth range via denitrification compared to other solutions (Fig. 7). As a consequence, the residual between the and reduction (Rden1−Rden2; see Fig. 6) leads to higher accumulation at these depths, providing the necessary substrate to fuel either reduction (i.e., N2O production) or anammox. Since the parameterization scheme in Optsel also results in reduced oxidation (Rno) and anammox (Rax) rates (see Fig. 5), likely because of higher anammox half-saturation constants for substrate uptake ( and ), more is available for reduction by denitrification, leading to a surplus in production (Rden2) relative to consumption (Rden3) and high concentrations of N2O at the lower oxycline.
5.3 Sensitivities to model parameters
As shown in Sect. 5.1 and Fig. 4, strong correlations exist between parameter pairs in the optimization ensemble. Since Optsel demonstrates good comparisons with ETSP tracer and rate observations, we perform a series of sensitivity tests around parameters (P) most responsible for controlling specific features (F) of the tracer distributions. These include concentrations of and at 50 m depth, the peak concentration in the OMZ, the N2O concentrations at the primary and secondary N2O maxima, and the minimum in the OMZ deficit (i.e., N*). Additionally, we evaluate which parameters govern total N loss, including the fractional contribution of anammox; the partitioning of POC consumption via , , and N2O reduction; and total N2O production and air–sea flux (here approximated by the vertical transport at the upper model boundary). To this end, we calculated the sensitivity coefficient (ϕij) for each P and F pairing by evaluating the impact of varying each Optsel P value by ±5 % of its range in Table B1 and recording the resulting relative change in the F:
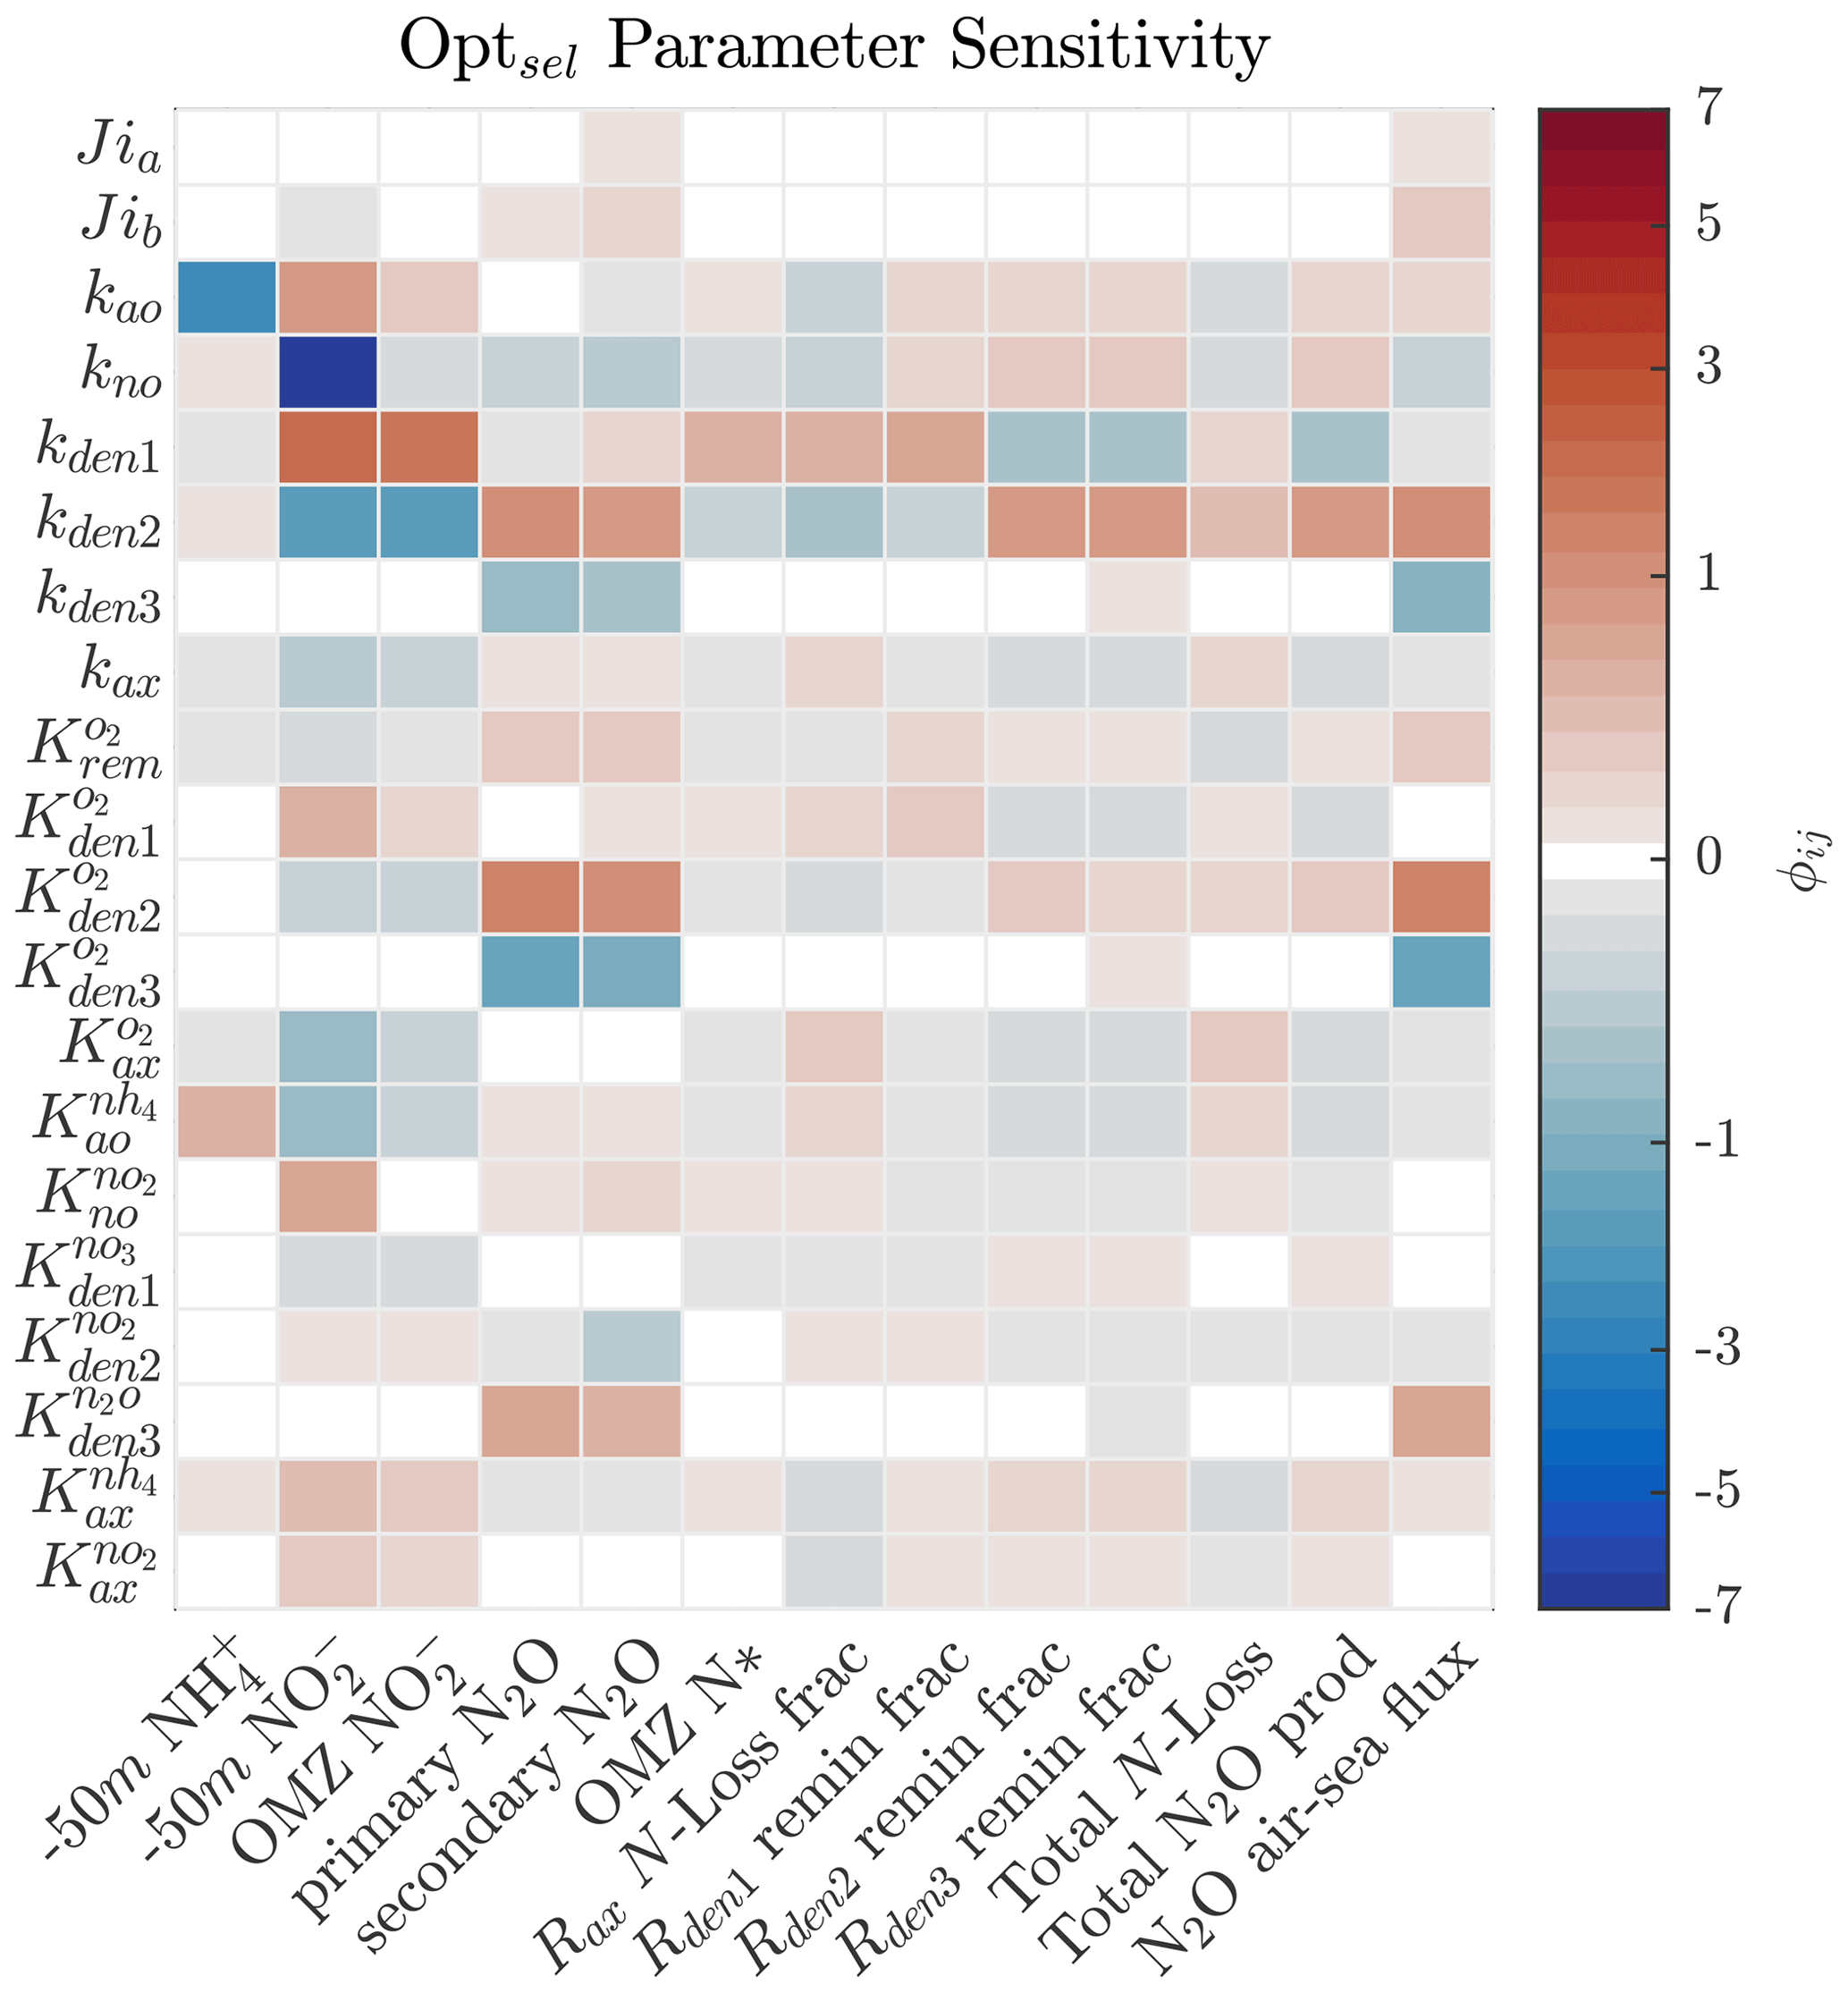
Figure 8Sensitivity coefficient () for Optsel parameters (Pi) and features (Fj) of the model solution. Here, each parameter is varied by ±5 % of their respective CMA-ES-allowed ranges in Table B1 to evaluate the relative impact on each feature of the model solution. Concentrations of and at 50 m depth (−50 m) are used as proxies of near-surface values.
The results demonstrate high sensitivity to changes in the maximum rates for all reactions (Fig. 8). Specifically, higher maximum rates correlate negatively with the concentrations of their substrates and positively with the concentrations of their products. For example, increasing kden1 results in an increase in OMZ and a decrease in OMZ N*. Similarly, increasing kden2 decreases OMZ and increases N2O concentrations in the upper and lower oxycline and its flux to the atmosphere. These impacts are further modulated by the half-saturation and O2 inhibition constants.
Figures 9 and 10 further summarize the sensitivities to the maximum denitrification rates and their inhibition by O2, detailing the resulting changes to O2, N2O, , and N* profiles. As expected, changes in maximum rates affect reaction substrates and products in opposite ways. For example, a positive perturbation of kden1 (top panels) stimulates reduction, causing an increase in OMZ and a decrease in N* as expected. Similarly, a positive perturbation of kden2 increases N2O and decreases nearly everywhere. However, these sensitivities also have specific depth-dependent signatures. While changes in are more pronounced within the OMZ core, in particular the upper section, changes in N2O are stronger at the upper and lower oxyclines, i.e., within the N2O production window defined by and (see Sect. 5.1).
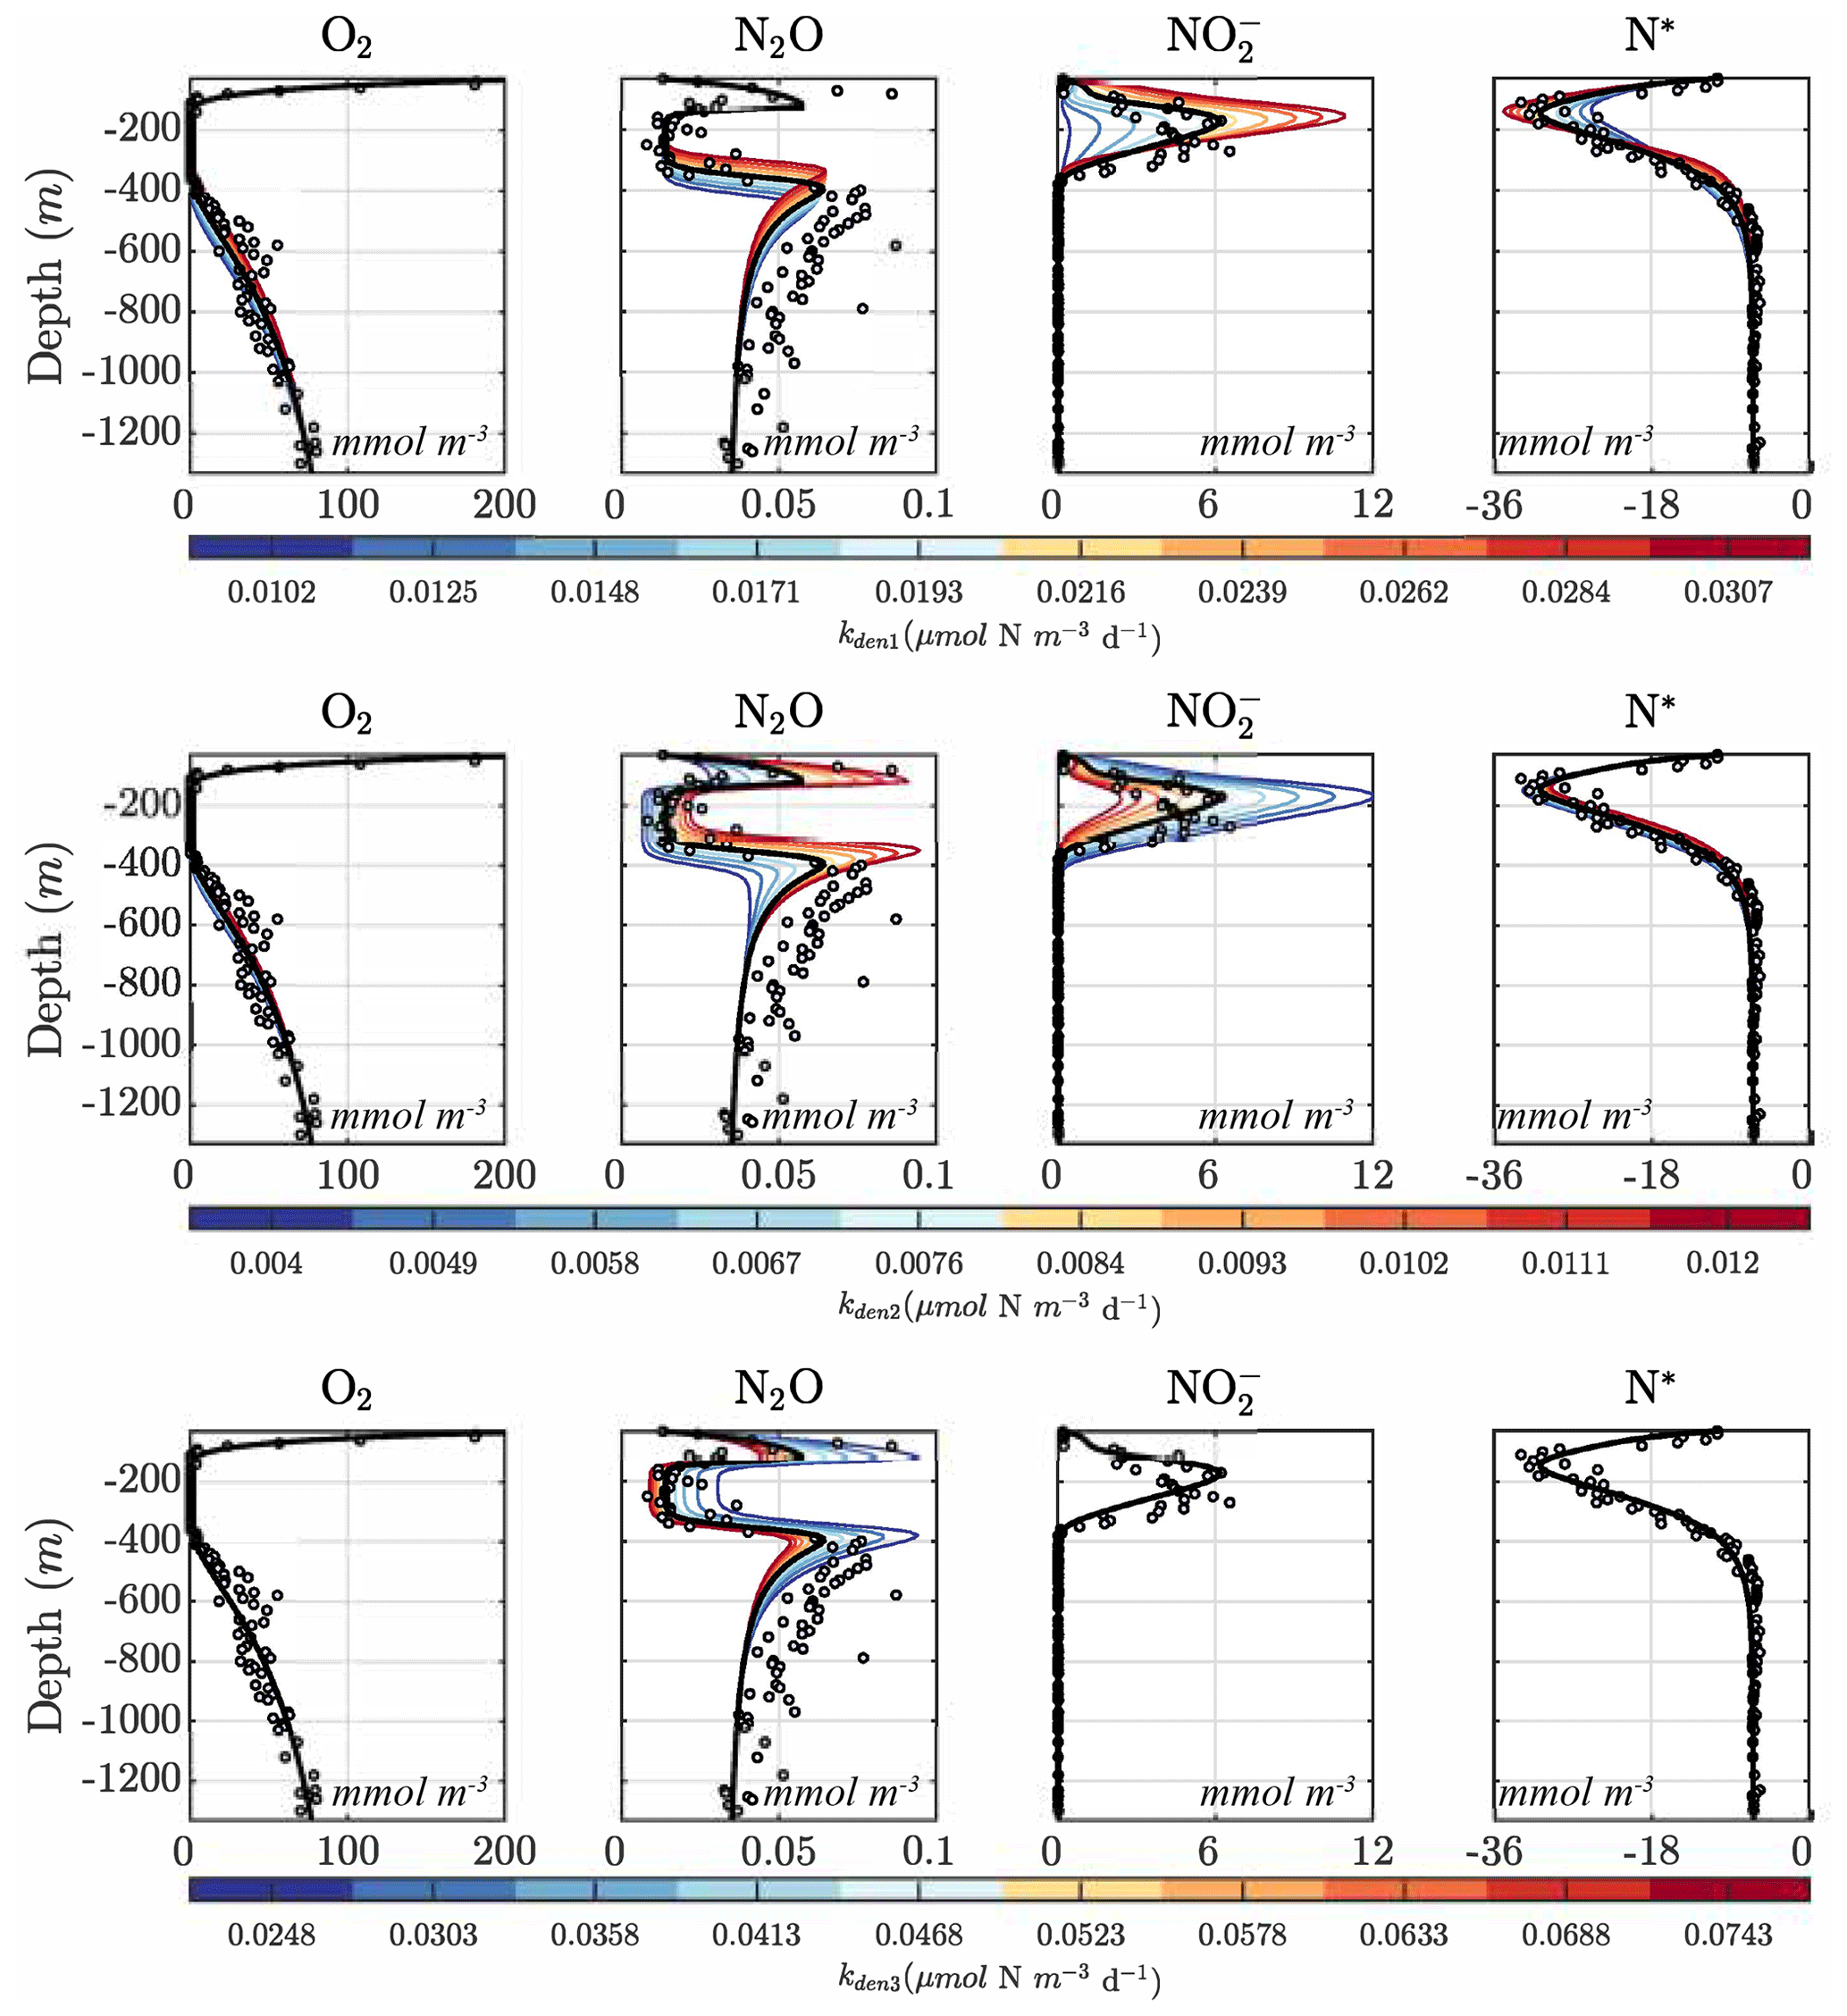
Figure 9Model sensitivity to parameter values. Panels show O2, N2O, , and N* for the Optsel parameter set after varying the maximum , , and N2O reduction rate parameters (kden1, kden2, and kden3) by ±5 % of their Optsel value in Table B1.
Notably, by increasing kden1 (top panels in Fig. 9) or kden2 (middle panels) from Optsel values, the vertical extent of oxygen-deficient waters is reduced as a result of increased POC consumption via denitrification (not shown). This enhances aerobic remineralization and nitrification below the OMZ, providing an enhanced source of that partly offsets the OMZ losses seen via kden1 enhancement. This may indicate a potential negative feedback: if denitrification is locally enhanced (i.e., via increased competition for POC by denitrifying heterotrophs), a resulting reduction in the vertical extent of the OMZ would inhibit further N loss.
Figures 8 and 10 highlight significant sensitivities to the O2 inhibition constants, which control O2-dependent modulation of the maximum reaction rates. These effects are particularly evident at the boundaries of the OMZ. For example, an increase in allows for more reduction at higher O2, leading to a slight depletion in OMZ and, as a consequence, an increase in suboxic N2O concentrations (Fig. 10, middle panels), consistent with observations of these processes in the Peruvian oxygen-deficient zone (Frey et al., 2020). In a similar manner, an increase in leads to more N2O reduction, reducing the magnitude of both the primary and secondary N2O peaks, while leaving other OMZ tracers (, N*) relatively unaffected.
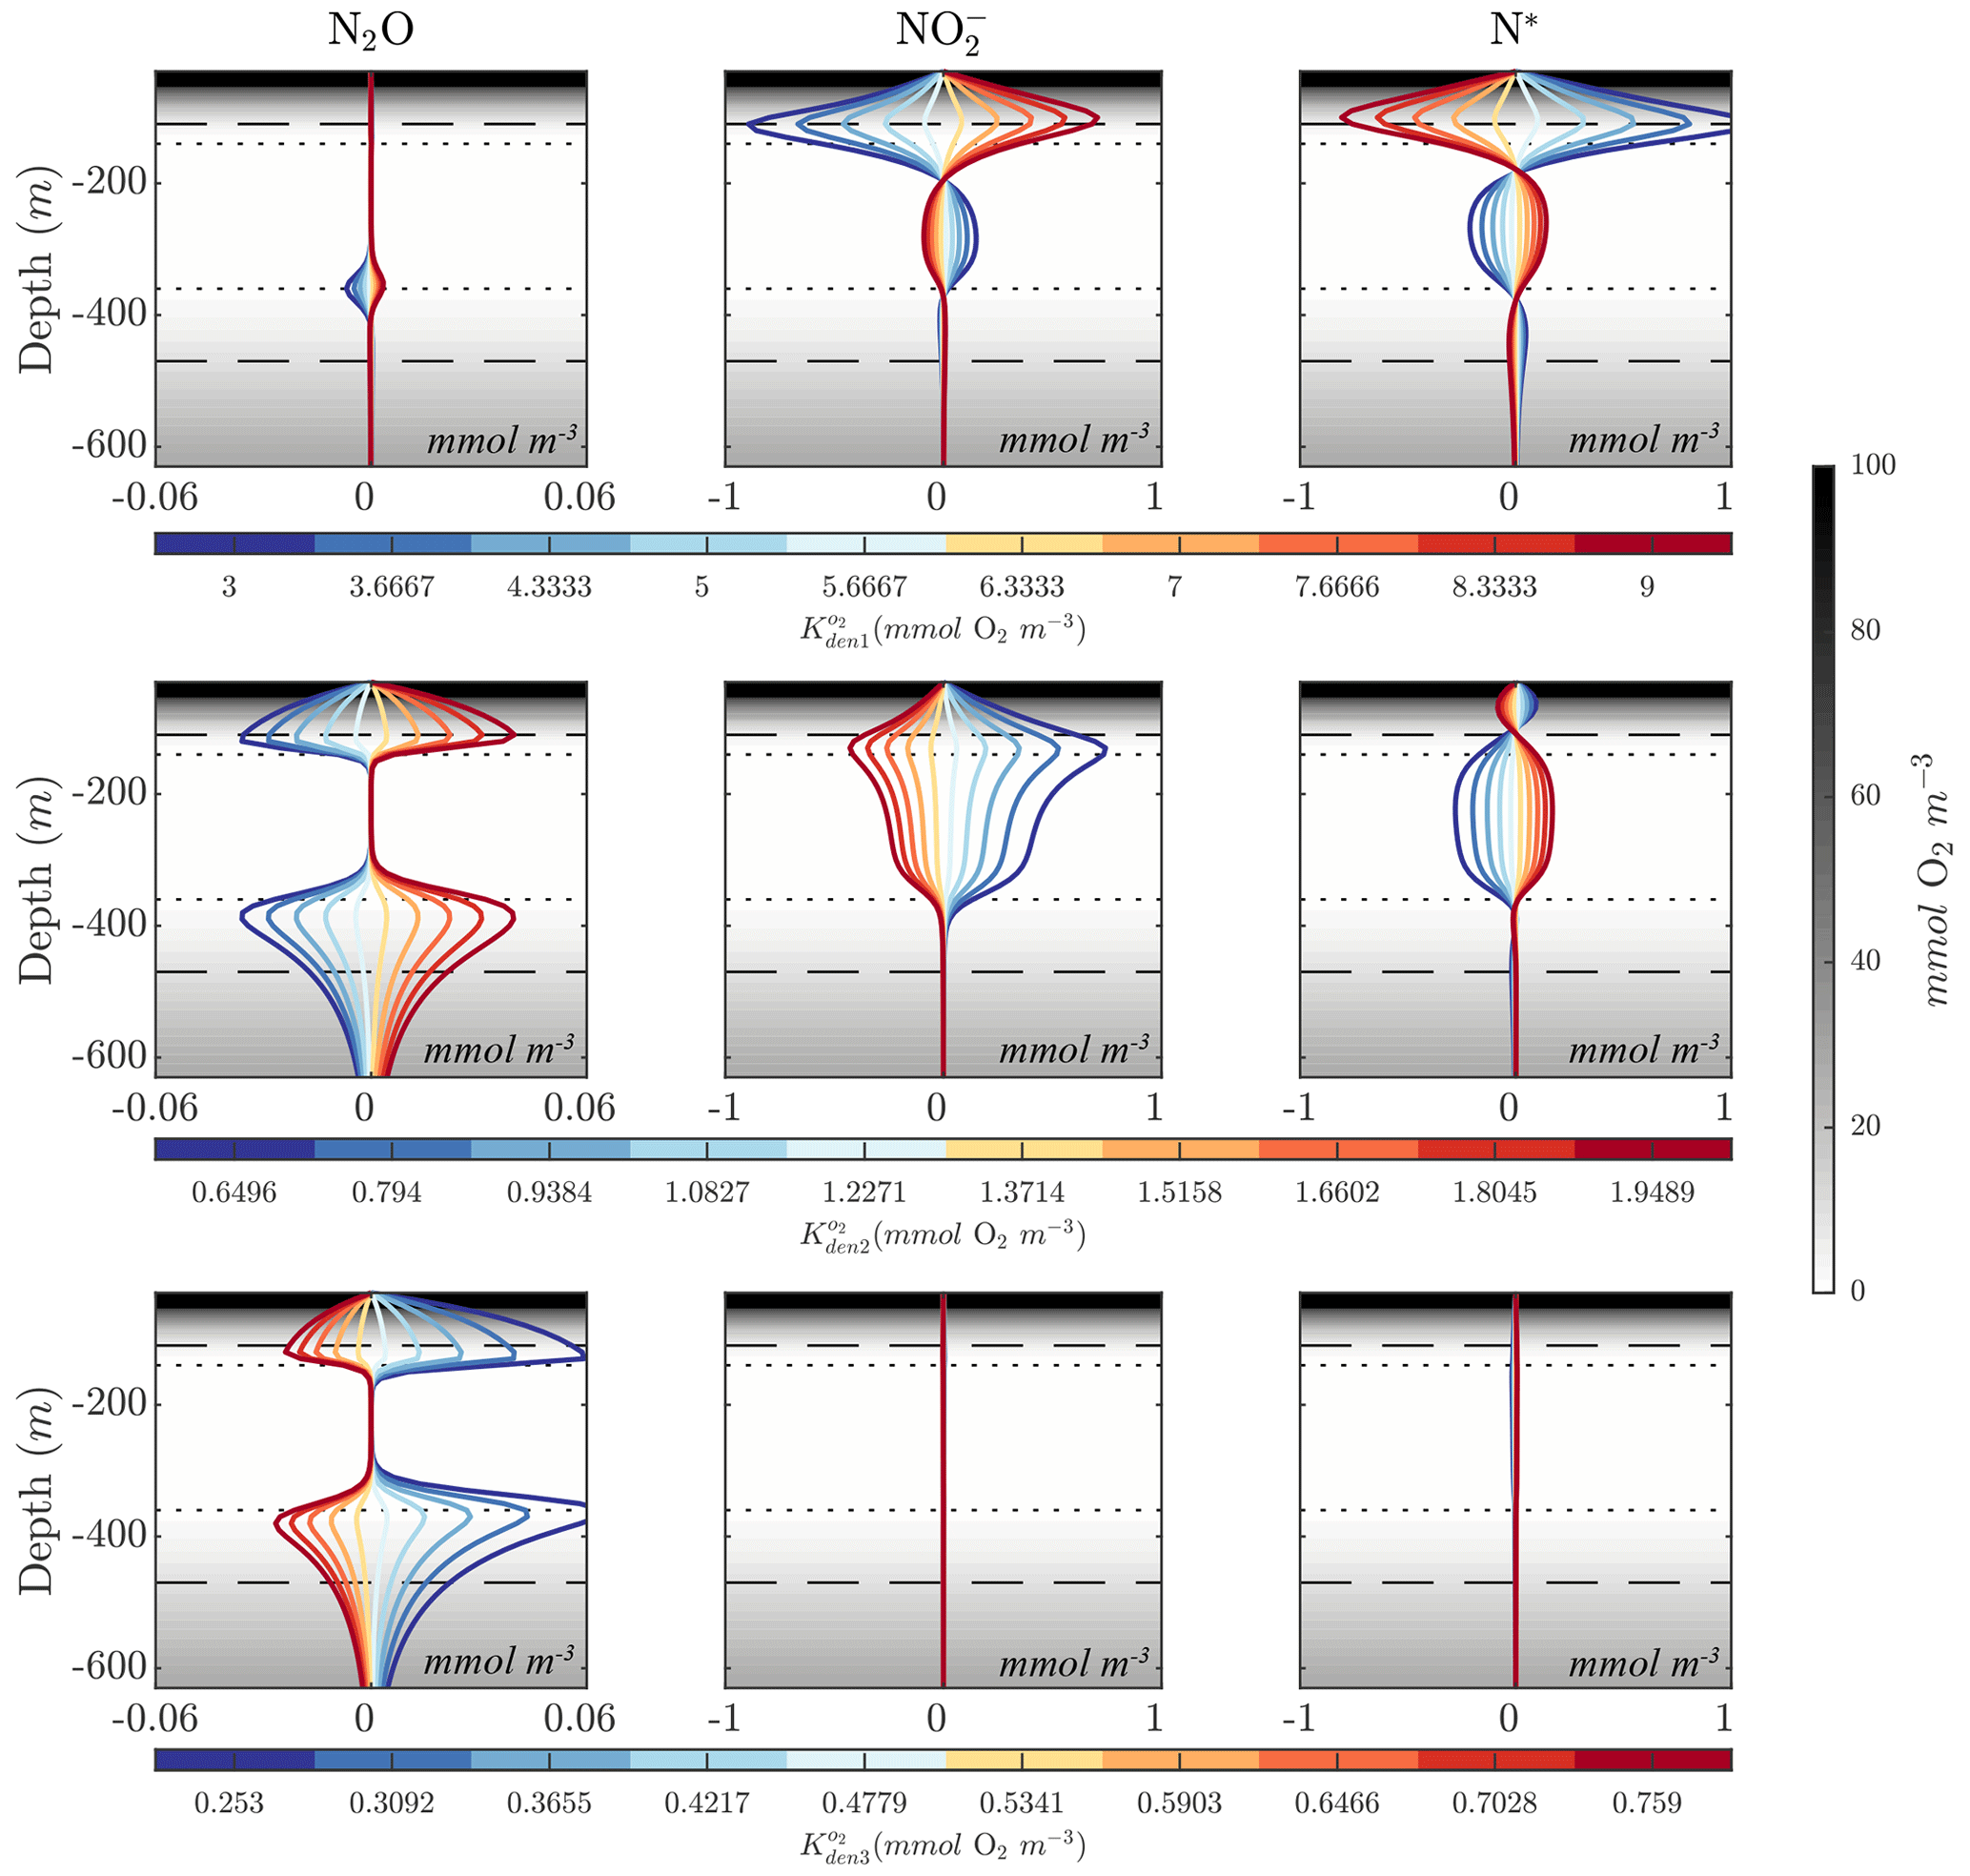
Figure 10Model sensitivity to parameter values. Panels show changes to N2O, , and N* for the Optsel parameter set after varying the O2 inhibition constants for , , and N2O reduction (, , and ) by ±5 % of their Optsel value in Table B1. Background gray shadings show O2 concentrations, with horizontal lines highlighting O2=1 mmol m−3 (dotted lines) and O2=10 mmol m−3 (dashed lines).
5.4 Sensitivities to environmental variables
The main features of the OMZ simulated by the model are strongly dependent on environmental parameters such as upwelling and mixing; organic matter fluxes; and the model boundary conditions, including mixed-layer depth and O2 concentrations. Critically, these parameters are likely to vary over time under the effects of natural climate variability (e.g., Deutsch et al., 2011) and anthropogenic climate change (Bopp et al., 2013). While each of these parameters control OMZ tracer profiles and N cycle reactions in complex ways, the main responses can be ascribed to changes in the position, thickness, and strength of the anoxic OMZ layer. Perturbations that replenish O2 above the thresholds for anoxic processes – such as those predicted under climate warming scenarios (Busecke et al., 2022) – thus have cascading impacts on anaerobic N cycle intermediates, such as and N2O, and on the fixed N removal and deficit of the oxygen-deficient zone.
Figure 11 shows the sensitivity of the optimal solution Optsel to the magnitudes of vertical upwelling (wup) and turbulent diffusion (Kv). Increasing wup results in higher O2 supply from below the OMZ, leading to increasing O2 concentrations, and an upward shift and thinning of the anoxic layers. At high upwelling, the anoxic layer is effectively wiped out and is replaced by a suboxic layer. Similar results are obtained with higher Kv values, with an increase in diffusive O2 supply from both above and below the OMZ, resulting in a progressive shrinking of the anoxic layer. As this layer vanishes, anaerobic processes cease, drastically reducing the concentration of and the N deficit in the OMZ core. Notably, as the OMZ reaches the brink of anoxia, i.e., as the minimum O2 concentration falls within the N2O production window, the upper and lower N2O maxima merge into a single N2O spike with particularly high N2O concentrations, reflecting the largest imbalance between production and consumption.
Opposite changes are observed for a reduction in both wup and Kv, which result in an expansion of the OMZ layer; increased , , and N2O reduction; a larger OMZ peak; and a broader separation of the upper and lower N2O maxima. The interplay between the position of the oxygen-deficient layer, sinking particle fluxes, and transport processes further modulates the response of tracer profiles. For example, as anoxic waters expand upwards following a reduction in Kv, they intercept a higher concentration of sinking organic matter, which in turn fuels higher remineralization rates. Together with reduction in diffusive fluxes, this likely favors the strengthening of the upper N2O maximum at low Kv observed in Fig. 11.
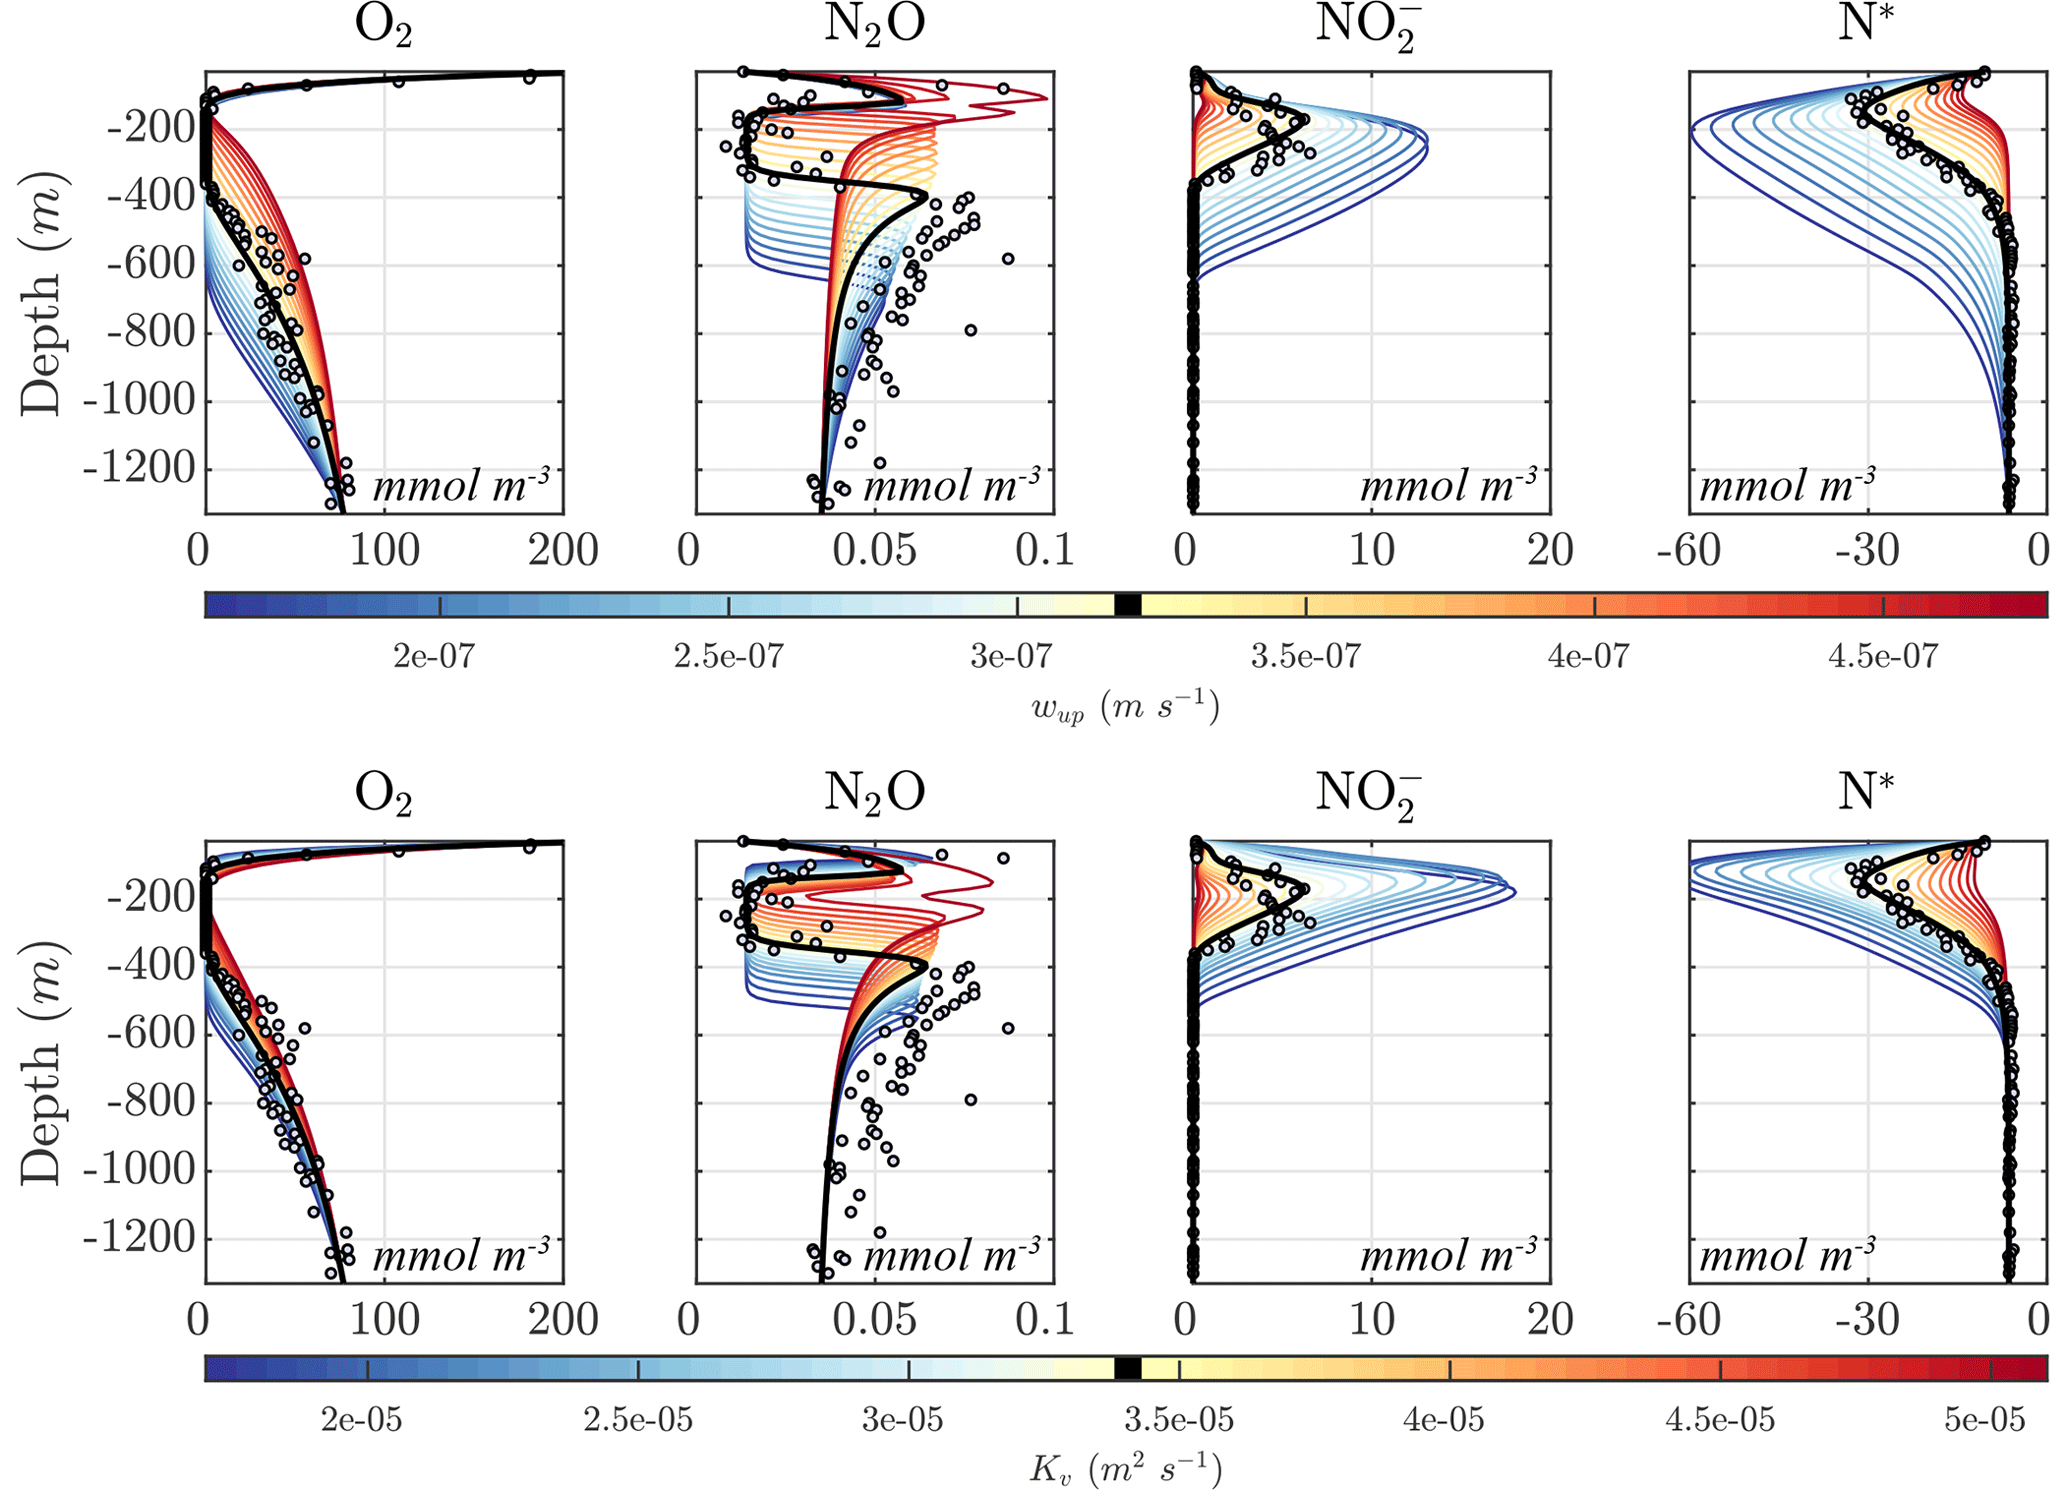
Figure 11Model sensitivity to physical drivers. (top) Sensitivity of the Optsel optimized solution to the constant vertical upwelling velocity (wup). (bottom) Sensitivity to the vertical turbulent diffusion coefficient (Kv). The bold black curves indicate original Optsel values, which are also indicated in their respective color bars.
Because the supply of POC to the OMZ controls the overall magnitude of remineralization reactions, including O2 consumption and denitrification, the model is particularly sensitive to the sinking POC flux at the upper model boundary (, Table B3; Fig. 12, top panel). Increasing causes a greater remineralization rate, which reduces available O2, and drives a progressive thickening of the OMZ, with a series of cascading impacts on tracers similar to the ones discussed above. In contrast, decreasing reduces the Rrem rates and increases O2 to the point that anoxic conditions and their signature disappear.
Similar changes can also be driven by variations in the bottom-boundary O2 concentration, which directly controls upward O2 supply by upwelling (Fig. 12, bottom panel). Increasing bottom O2 progressively decreases the thickness of the OMZ, shifting it upwards and eventually eroding the anoxic layer. Conversely, decreasing bottom O2 leads to a downward expansion of the OMZ and an intensification of anoxic conditions and the resulting anaerobic reactions.
We developed a model of the N cycle in low O2 waters and optimized it to reproduce observations from the ETSP OMZ. The model is able to simulate the distribution of multiple N cycle tracers, including and N2O, and their transformation rates, capturing the underlying dynamics and environmental sensitivity of the underlying reactions (Fig. 5). In general, the model reproduces observed tracer concentration profiles more accurately than transformation rates. Mismatches with transformation rates may point to processes that need improvement in the model but also underscore limitations in rate measurements, which rely on shipboard incubation experiments that are usually more uncertain and limited than tracer measurements and may not perfectly reflect in situ conditions. However, by matching observed reaction rates to a reasonable degree, the model approximates the complex dynamics of the system in a way that allows it to reproduce tracer distributions. Co-located tracer and rate measurements for multiple processes are thus an effective way to constrain the model representation of the N cycle in and around O2-deficient environments.
The optimization indicates that multiple parameter sets can produce equally good fits to tracer and rate profiles (Fig. 5). This is expected given the non-linear nature of the model and limitations in the observations. Even when rate measurements are used to constrain the model, as done here, an ensemble of equally good solutions is thus possible. This optimized ensemble shows that significant variability and trade-offs can exist between specific parameters (Fig. 4), suggesting that compensation between different processes can lead to similar profiles of tracers and transformation rates. Refinements to the criteria used to optimize the model, i.e., additional constraints in the definition of the cost function, could allow us to further narrow down plausible sets of parameters. For example, to evaluate the model sensitivity (Figs. 8–10), we select a parameter set from our optimization ensemble that better captures the magnitude of the secondary N2O maximum, while reproducing other observed features equally well. While we adopt a relatively simple cost function definition, additional constraints such as this one could be explicitly built into its formulation and weighted more heavily to revise model parameters.
A better characterization of environmental sensitivities to substrate concentrations (e.g., half-saturation constant for substrate uptake) and O2 sensitivities would also help parameter selection, for example, by narrowing down the prior and posterior range of values for these and other variables (e.g., maximum reaction rates). To this end, rate measurements under a range of O2 and substrate concentrations are especially helpful. Similarly, simultaneous optimization of the model to reproduce observations across multiple regions of an OMZ characterized by different conditions, e.g., the core and the boundaries, or across different OMZ and oceanographic regimes would likely result in more robust optimizations.
Despite the variability in parameter values, analysis of the optimal ensemble reveals emerging features that appear robust across multiple optimizations and that compare well with observations. For example, the sensitivity of denitrification processes to O2 shows systematic variations, with weaker O2 inhibition for reduction and stronger for N2O reduction (Fig. 6). Accordingly, reduction to tends to occur at higher O2 concentrations than reduction to N2O, which in turn occurs at higher O2 concentrations than N2O reduction to N2. This result is consistent with tracer incubation experiments (Dalsgaard et al., 2014). However, we note that the specific value of these O2 sensitivities is far from well-established, with some experiments showing smaller thresholds than those found in our optimization (Dalsgaard et al., 2014) and others finding similar or larger thresholds (Ji et al., 2018a). In the model, the sequential sensitivity of denitrification steps to O2 supports an O2-dependent window for N2O production, which allows accumulation of N2O at the margins of the OMZ core. This, and other systematic relationships between parameters and features of the solutions, as revealed by a sensitivity analysis (Figs. 8–10), sheds light on specific balances in the N cycle and can be exploited as a powerful tool to fine-tune the model, both in the one-dimensional setup used here and in more complex and resource-intensive three-dimensional implementations where a formal optimization would be unfeasible (McCoy et al., 2022).
Because the model is based on a mechanistic representation of N transformations, it is suitable for investigating the response of the N cycle to environmental variability and other perturbations (Figs. 11–12). For example, the model could be used to investigate the effects of eddy variability near the boundaries of OMZs or the effects of OMZ expansion and change under global warming. With these goals in mind, the model is designed to be coupled to the biogeochemical component of the current generation of earth system models, enabling accurate simulation of and N2O dynamics, with minimal interference in the representation of the cycles of oxygen, nutrients, carbon, and organic matter.
Because the model reflects an evolving understanding of the N cycle, its assumptions should be re-evaluated as new N transformation processes and aspects of microbial dynamics are uncovered. The model is built around two major simplifications: the modularity of the N cycle and the representation of microbial metabolisms as bulk chemical reactions that avoid explicitly tracking diverse microbial populations. Both are approximate views of the N cycle. For example, recent evidence suggests that microorganisms with the ability to carry out intracellular reduction of to and to N2O may dominate production of N2O in oxygen-deficient waters (Ji et al., 2018a; Frey et al., 2020), although the sensitivity of this process to environmental factors is still being uncovered.
Our bulk approach assumes that metabolic reaction rates are proportional to substrates following a Michaelis–Menten dependency. However, in reality, reaction rates also depend on the abundance of microorganisms present in the water column. If microorganism biomass is assumed to be proportional to substrates, then a higher-order dependency of reaction rates may be more appropriate, as adopted by some biogeochemical models (e.g., Paulot et al., 2020). A different dependence on substrates, in turn, may affect the variability of reaction rates with depth and the model sensitivity to parameters such as maximum reaction rates.
Indeed, previous modeling studies have pointed out the value of explicitly resolving the biomass of microbial populations (Penn et al., 2016; Zakem et al., 2020). This, in turn, enables a more direct comparison of model results with molecular observations (Louca et al., 2016) and would favor the emergence of complex feedbacks between microbes and their substrates driven by resource competition and oceanic circulation (Penn et al., 2019). However, explicitly simulating microbial biomass requires a number of additional parameters that remain poorly constrained and adds computational burden that may not always improve the realism of biogeochemical simulations (Galbraith et al., 2015). Our model provides a valuable framework for continuing the exploration of these ideas in both idealized and realistic settings (McCoy et al., 2022).
Based on its modular design, the model can be naturally expanded to represent new processes that, while thought to be relevant in OMZ, are still uncertain. These include (1) additional known N cycle pathways and their sensitivity to environmental variability, such as DNRA (Lam et al., 2009), hybrid N2O production from AOA (Stieglmeier et al., 2014), and direct reduction to N2O (Ji et al., 2018a; Frey et al., 2020); (2) alternative oxidation pathways, for example, oxidation with iodate or disproportionation reactions (Babbin et al., 2020; Buchwald et al., 2015a; Sun et al., 2021a); (3) coupling of N tracers with the cycles of other elements, e.g., carbon, sulfur, and iron, such as chemolithotrophic denitrification coupled to hydrogen sulfide (H2S) oxidation or anaerobic -based methane (CH4) oxidation (Azhar et al., 2014; Scholz et al., 2016; Thamdrup et al., 2019; Callbeck et al., 2021); (4) explicit representation of chemolithotrophy and its effects on organic matter fixation (Swan et al., 2011); (5) explicit coupling to the inorganic carbon cycle by inclusion of CO2 and alkalinity changes associated with N cycle reactions (Cinay et al., 2022); (6) the cycling of nitric oxide (NO) (Ward and Zafiriou, 1988; Lutterbeck et al., 2018); and (7) a more detailed representation of the microbial ecology underlying the N cycle (Louca et al., 2016; Zakem et al., 2018; Penn et al., 2019).
A1 Heterotrophic rate equations
A2 Chemolithotrophic rate equations
A3 Aerobic N2O production
Production of N2O via the nitrification pathway in NitrOMZ (pathway 2b in Fig. 1) is modeled as a byproduct of Rao with enhanced yields at lower O2 concentrations. The partitioning between N2O and production from Rao is calculated using the function proposed by Nevison et al. (2003), which was derived by fitting measured N2O and yields ( and , respectively) to oxygen concentrations (Goreau et al., 1980) and re-fit by multiple observations in the eastern tropical North and South Pacific OMZ (Ji et al., 2015a, 2018a; Santoro et al., 2021):
Nitrification-derived and N2O production rates ( and , respectively; pathways 2a and 2b in Fig. 1) are therefore represented as
A4 Stoichiometry
The stoichiometry of heterotrophic redox reactions is based on an electron balance and follows the procedure outlined in Paulmier et al. (2009), under the assumption that the composition of organic matter (POC) follows the average oceanic ratios from Anderson and Sarmiento (1994): C106H175O42N16P. This chemical composition can be arbitrarily adjusted in NitrOMZ. For example, studies in the eastern tropical South Pacific suggest a C : N ratio closer to 83:1 (Teng et al., 2014). Furthermore, organic matter degradation reactions may also differentially remineralize C, N, and P. For instance, denitrification may preferentially involve degradation of amino acids and thus impact the N : P ratio of remineralization differently from aerobic respiration (Van Mooy et al., 2002).
Based on the stoichiometry of Anderson and Sarmiento (1994), the : C and : C ratios during aerobic respiration are
As a result of the POC composition, a total of 472 electrons are required to oxidize POC to CO2. With four electrons required to reduce O2 to H2O, the oxygen : carbon remineralization ratio for aerobic remineralization to is represented as
This yields a respiration quotient of of 1.11, which is within the range of direct chemical measurements of from Moreno et al. (2020, 2022). For nitrification, the oxygen : nitrogen ratios for and oxidation (Rao and Rno, respectively) are based on the stoichiometry of the relevant redox reactions:
For denitrification, two electrons are required for each respective reduction step ( to , to N2O, and N2O to N2); thus the corresponding ratios are
Finally, for anammox, and are combined in 1:1 ratios to produce N2. The above ratios are then applied to the tracer equations in Appendix A5.
A5 Tracer source-minus-sink equations
Table B1NitrOMZ nitrogen cycle parameters and CMA-ES optimization ranges. NA – not available.
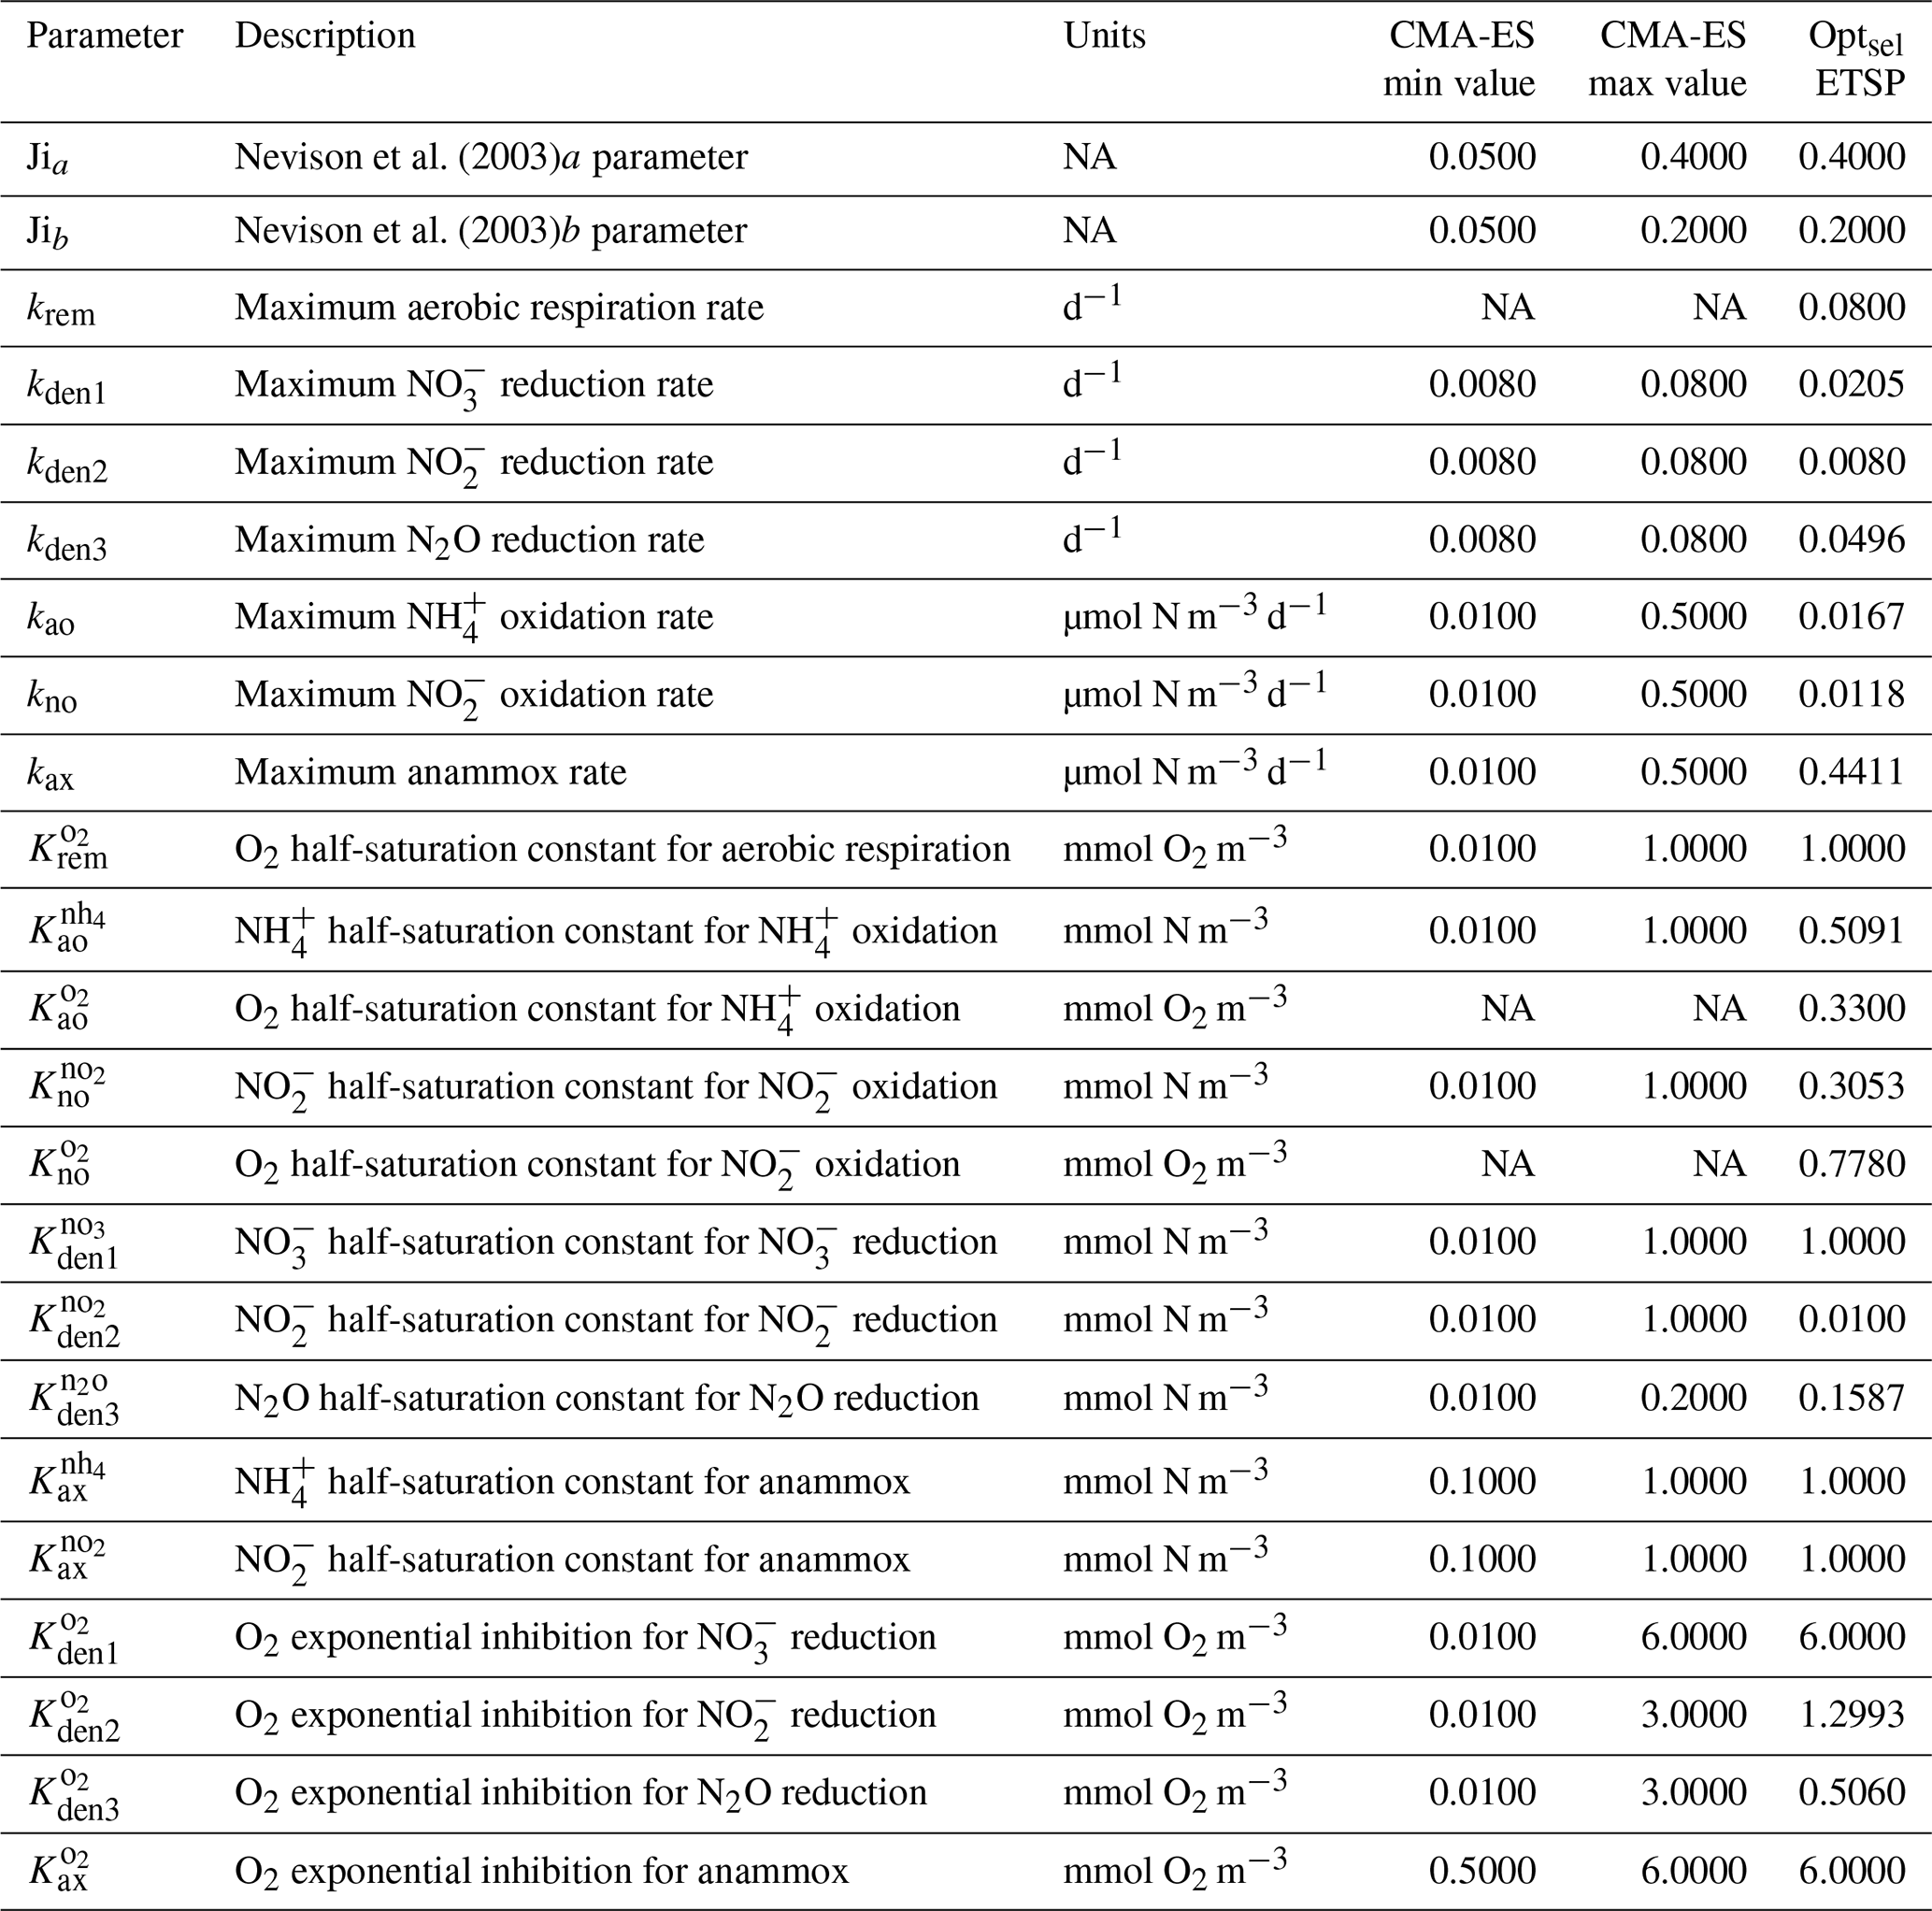
Table B2ETSP configuration for optimization routines. NA – not available.
The current version of NitrOMZv1.0 is available from the project website: https://doi.org/10.5281/zenodo.7106213 (Bianchi et al., 2022). The exact version of the model used to produce the results used in this paper is archived on Zenodo, as are input data and scripts to run the model and produce the plots for all the simulations presented in this paper.
DB conceptualized the formulation of the model; DB and SY developed the model code, including optimization procedures; DB and SY organized the validation data; DB and DM designed the analyses; DM prepared the tables and visualization of data; and DB and DM prepared the manuscript with contributions from SY.
The contact author has declared that none of the authors has any competing interests.
Publisher’s note: Copernicus Publications remains neutral with regard to jurisdictional claims in published maps and institutional affiliations.
Daniele Bianchi acknowledges support from the Alfred P. Sloan Foundation and computational support by the Extreme Science and Engineering Discovery Environment (XSEDE) through allocation TG-OCE17001. The authors wish to thank Andrew Babbin, Alyson Santoro, and Colette Kelly for helpful discussion.
This research has been supported by the Division of Ocean Sciences (grant no. 1847687).
This paper was edited by Heather Hyewon Kim and reviewed by Colette LaMonica Kelly and one anonymous referee.
Anderson, L. A. and Sarmiento, J. L.: Redfield ratios of remineralization determined by nutrient data analysis, Global Biogeochem. Cy., 8, 65–80, https://doi.org/10.1029/93GB03318, 1994. a, b, c
Arévalo-Martínez, D. L., Kock, A., Löscher, C. R., Schmitz, R. A., Stramma, L., and Bange, H. W.: Influence of mesoscale eddies on the distribution of nitrous oxide in the eastern tropical South Pacific, Biogeosciences, 13, 1105–1118, https://doi.org/10.5194/bg-13-1105-2016, 2016. a
Aumont, O., Ethé, C., Tagliabue, A., Bopp, L., and Gehlen, M.: PISCES-v2: an ocean biogeochemical model for carbon and ecosystem studies, Geosci. Model Dev., 8, 2465–2513, https://doi.org/10.5194/gmd-8-2465-2015, 2015. a, b
Azhar, M. A., Canfield, D. E., Fennel, K., Thamdrup, B., and Bjerrum, C. J.: A model-based insight into the coupling of nitrogen and sulfur cycles in a coastal upwelling system, J. Geophys. Res.-Biogeo., 119, 264–285, 2014. a
Babbin, A. R., Keil, R. G., Devol, A. H., and Ward, B. B.: Organic matter stoichiometry, flux, and oxygen control nitrogen loss in the ocean, Science, 344, 406–408, https://doi.org/10.1126/science.1248364, 2014. a, b, c
Babbin, A. R., Bianchi, D., Jayakumar, A., and Ward, B. B.: Rapid nitrous oxide cycling in the suboxic ocean, Science, 348, 1127–1129, https://doi.org/10.1126/science.aaa8380, 2015. a, b, c, d, e, f, g, h, i, j
Babbin, A. R., Peters, B. D., Mordy, C. W., Widner, B., Casciotti, K. L., and Ward, B. B.: Multiple metabolisms constrain the anaerobic nitrite budget in the Eastern Tropical South Pacific, Global Biogeochem. Cy., 31, 258–271, https://doi.org/10.1002/2016GB005407, 2017. a, b
Babbin, A. R., Buchwald, C., Morel, F. M., Wankel, S. D., and Ward, B. B.: Nitrite oxidation exceeds reduction and fixed nitrogen loss in anoxic Pacific waters, Mar. Chem., 224, 103814, https://doi.org/10.1016/j.marchem.2020.103814, 2020. a, b, c, d
Battaglia, G. and Joos, F.: Marine N2O Emissions From Nitrification and Denitrification Constrained by Modern Observations and Projected in Multimillennial Global Warming Simulations, Global Biogeochem. Cy., 32, 92–121, https://doi.org/10.1002/2017GB005671, 2018. a
Berelson, W.: The Flux of Particulate Organic Carbon Into the Ocean Interior: A Comparison of Four U.S. JGOFS Regional Studies, Oceanography, 14, 59–67, https://doi.org/10.5670/oceanog.2001.07, 2001. a
Bettencourt, J. H., Lopez, C., Hernandez-Garcia, E., Montes, I., Sudre, J., Dewitte, B., Paulmier, A., and Garçon, V.: Boundaries of the Peruvian oxygen minimum zone shaped by coherent mesoscale dynamics, Nat. Geosci., 8, 937–940, https://doi.org/10.1038/ngeo2570, 2015. a
Bianchi, D., Dunne, J. P., Sarmiento, J. L., and Galbraith, E. D.: Data-based estimates of suboxia, denitrification, and N2O production in the ocean and their sensitivities to dissolved O2, Global Biogeochem. Cy., 26, GB2009, https://doi.org/10.1029/2011GB004209, 2012. a
Bianchi, D., Babbin, A. R., and Galbraith, E. D.: Enhancement of anammox by the excretion of diel vertical migrators, P. Natl. Acad. Sci. USA, 111, 15653–15658, 2014. a
Bianchi, D., Weber, T. S., Kiko, R., and Deutsch, C.: Global niche of marine anaerobic metabolisms expanded by particle microenvironments, Nat. Geosci., 11, 263–268, https://doi.org/10.1038/s41561-018-0081-0, 2018. a
Bianchi, D., Yang, S., and McCoy, D.: NitrOMZv1.0 Model Code, Zenodo [code, data set], https://doi.org/10.5281/zenodo.7106213, 2022. a
Bopp, L., Resplandy, L., Orr, J. C., Doney, S. C., Dunne, J. P., Gehlen, M., Halloran, P., Heinze, C., Ilyina, T., Séférian, R., Tjiputra, J., and Vichi, M.: Multiple stressors of ocean ecosystems in the 21st century: projections with CMIP5 models, Biogeosciences, 10, 6225–6245, https://doi.org/10.5194/bg-10-6225-2013, 2013. a
Boyd, P. W., Claustre, H., Levy, M., Siegel, D. A., and Weber, T.: Multi-faceted particle pumps drive carbon sequestration in the ocean, Nature, 568, 327–335, 2019. a
Bristow, L. A., Dalsgaard, T., Tiano, L., Mills, D. B., Bertagnolli, A. D., Wright, J. J., Hallam, S. J., Ulloa, O., Canfield, D. E., Revsbech, N. P., and Thamdrup, B.: Ammonium and nitrite oxidation at nanomolar oxygen concentrations in oxygen minimum zone waters, P. Natl. Acad. Sci. USA, 113, 10601–10606, https://doi.org/10.1073/pnas.1600359113, 2016. a, b, c, d, e, f, g
Buchanan, P. J., Sun, X., Weissman, J. L., and Zakem, E.: Oxygen intrusions sustain aerobic nitrite oxidation in anoxic marine zones, bioRxiv, https://doi.org/10.1101/2023.02.22.529547, 2023. a
Buchwald, C., Santoro, A. E., Stanley, R. H., and Casciotti, K. L.: Nitrogen cycling in the secondary nitrite maximum of the eastern tropical North Pacific off Costa Rica, Global Biogeochem. Cy., 29, 2061–2081, 2015a. a, b
Buchwald, C., Santoro, A. E., Stanley, R. H. R., and Casciotti, K. L.: Global Biogeochem. Cy., 29, 2061–2081, https://doi.org/10.1002/2015GB005187, 2015b. a
Buitenhuis, E. T., Suntharalingam, P., and Le Quéré, C.: Constraints on global oceanic emissions of N2O from observations and models, Biogeosciences, 15, 2161–2175, https://doi.org/10.5194/bg-15-2161-2018, 2018. a
Busecke, J. J. M., Resplandy, L., Ditkovsky, S. J., and John, J. G.: Diverging Fates of the Pacific Ocean Oxygen Minimum Zone and Its Core in a Warming World, AGU Advances, 3, e2021AV000470, https://doi.org/10.1029/2021AV000470, 2022. a
Callbeck, C. M., Canfield, D. E., Kuypers, M. M. M., Yilmaz, P., Lavik, G., Thamdrup, B., Schubert, C. J., and Bristow, L. A.: Sulfur cycling in oceanic oxygen minimum zones, Limnol. Oceanogr., 66, 2360–2392, https://doi.org/10.1002/lno.11759, 2021. a, b
Capone, D., Bronk, D., Mulholland, M. R., and Carpenter, E.: Nitrogen in the Marine Environment, Elsevier, https://doi.org/10.1016/B978-0-12-372522-6.X0001-1, 2008. a, b
Casciotti, K., Forbes, M., Vedamati, J., Peters, B., Martin, T., and Mordy, C.: Nitrous oxide cycling in the Eastern Tropical South Pacific as inferred from isotopic and isotopomeric data, Deep-Sea Res. Pt. II, 156, 155–167, https://doi.org/10.1016/j.dsr2.2018.07.014, 2018. a
Cinay, T., Dumit, D., Woosley, R. J., Boles, E. L., Kwiecinski, J. V., Mullen, S., Tamasi, T. J., Wolf, M. J., Kelly, C. L., Travis, N. M., Casciotti, K. L., and Babbin, A. R.: Coincident biogenic nitrite and pH maxima arise in the upper anoxic layer in the Eastern Tropical North Pacific, Global Biogeochem. Cy., 36, e2022GB007470, https://doi.org/10.1029/2022GB007470, 2022. a, b
Dalsgaard, T., Stewart, F. J., Thamdrup, B., De Brabandere, L., Revsbech, N. P., Ulloa, O., Canfield, D. E., and Delong, E. F.: Oxygen at nanomolar levels reversibly suppresses process rates and gene expression in anammox and denitrification in the oxygen minimum zone off Northern Chile, mBio, 5, 1–14, https://doi.org/10.1128/mBio.01966-14, 2014. a, b, c, d, e, f, g, h, i, j, k
De Brabandere, L., Canfield, D. E., Dalsgaard, T., Friederich, G. E., Revsbech, N. P., Ulloa, O., and Thamdrup, B.: Vertical partitioning of nitrogen-loss processes across the oxic-anoxic interface of an oceanic oxygen minimum zone, Environ. Microbiol., 16, 3041–3054, https://doi.org/10.1111/1462-2920.12255, 2014. a
Deutsch, C., Brix, H., Ito, T., Frenzel, H., and Thompson, L.: Climate-forced variability of ocean hypoxia, Science, 333, 336–339, 2011. a
DeVries, T., Deutsch, C., Primeau, F., Chang, B., and Devol, A.: Global rates of water-column denitrification derived from nitrogen gas measurements, Nat. Geosci., 5, 547–550, 2012. a
DeVries, T., Deutsch, C., Rafter, P. A., and Primeau, F.: Marine denitrification rates determined from a global 3-D inverse model, Biogeosciences, 10, 2481–2496, https://doi.org/10.5194/bg-10-2481-2013, 2013. a
Fasham, M. J. R., Ducklow, H. W., and McKelvie, S. M.: A nitrogen-based model of plankton dynamics in the oceanic mixed layer, J. Mar. Res., 48, 591–639, https://doi.org/10.1357/002224090784984678, 1990. a
Fischer, T., Banyte, D., Brandt, P., Dengler, M., Krahmann, G., Tanhua, T., and Visbeck, M.: Diapycnal oxygen supply to the tropical North Atlantic oxygen minimum zone, Biogeosciences, 10, 5079–5093, https://doi.org/10.5194/bg-10-5079-2013, 2013. a
Frey, C., Bange, H. W., Achterberg, E. P., Jayakumar, A., Löscher, C. R., Arévalo-Martínez, D. L., León-Palmero, E., Sun, M., Sun, X., Xie, R. C., Oleynik, S., and Ward, B. B.: Regulation of nitrous oxide production in low-oxygen waters off the coast of Peru, Biogeosciences, 17, 2263–2287, https://doi.org/10.5194/bg-17-2263-2020, 2020. a, b, c, d, e, f
Galbraith, E. D., Dunne, J. P., Gnanadesikan, A., Slater, R. D., Sarmiento, J. L., Dufour, C. O., De Souza, G. F., Bianchi, D., Claret, M., Rodgers, K. B., and Marvasti, S. S.: Complex functionality with minimal computation: Promise and pitfalls of reduced-tracer ocean biogeochemistry models, J. Adv. Model. Earth Sy., 7, 2012–2028, 2015. a
Ganesh, S., Bristow, L. A., Larsen, M., Sarode, N., Thamdrup, B., and Stewart, F. J.: Size-fraction partitioning of community gene transcription and nitrogen metabolism in a marine oxygen minimum zone, ISME J., 9, 2682–2696, https://doi.org/10.1038/ismej.2015.44, 2015. a
Giovannoni, S. J., Cameron Thrash, J., and Temperton, B.: Implications of streamlining theory for microbial ecology, ISME J., 8, 1553–1565, https://doi.org/10.1038/ismej.2014.60, 2014. a
Gnanadesikan, A., Bianchi, D., and Pradal, M. A.: Critical role for mesoscale eddy diffusion in supplying oxygen to hypoxic ocean waters, Geophys. Res. Lett., 40, 5194–5198, https://doi.org/10.1002/GRL.50998, 2013. a
Goreau, T. J., Kaplan, W. A., Wofsy, S. C., McElroy, M. B., Valois, F. W., and Watson, S. W.: Production of NO(2) and N(2)O by Nitrifying Bacteria at Reduced Concentrations of Oxygen., Appl. Environ. Microb., 40, 526–32, https://doi.org/10.1128/aem.40.3.526-532.1980, 1980. a, b
Graf, D. R., Jones, C. M., and Hallin, S.: Intergenomic comparisons highlight modularity of the denitrification pathway and underpin the importance of community structure for N2O emissions, PloS one, 9, e114118, https://doi.org/10.1371/journal.pone.0114118, 2014. a
Gruber, N. and Galloway, J. N.: An Earth-system perspective of the global nitrogen cycle, Nature, 451, 293–296, 2008. a
Hansen, N.: The CMA Evolution Strategy: A Comparing Review, in: Towards a New Evolutionary Computation, edited by: Lozano, J. A., Larrañaga, P., Iñaki, I., and Endika, B., Springer Berlin Heidelberg, Berlin, Heidelberg, 75–102, https://doi.org/10.1007/3-540-32494-1_4, 2006. a
Hansen, N.: The CMA Evolution Strategy: A Tutorial, arXiv [preprint], https://doi.org/10.48550/arXiv.1604.00772, 10 March 2023. a, b
Hansen, N., Niederberger, A., Guzzella, L., and Koumoutsakos, P.: A Method for Handling Uncertainty in Evolutionary Optimization With an Application to Feedback Control of Combustion, IEEE T. Evolut. Comput., 13, 180–197, https://doi.org/10.1109/TEVC.2008.924423, 2009. a, b
Hooper, A. B. and Terry, K.: Hydroxylamine oxidoreductase of Nitrosomonas, Biochim. Biophys. Acta, 571, 12–20, https://doi.org/10.1016/0005-2744(79)90220-1, 1979. a, b
Jensen, M. M., Lam, P., Revsbech, N. P., Nagel, B., Gaye, B., Jetten, M. S., and Kuypers, M. M.: Intensive nitrogen loss over the Omani Shelf due to anammox coupled with dissimilatory nitrite reduction to ammonium, ISME J., 5, 1660–1670, https://doi.org/10.1038/ismej.2011.44, 2011. a
Ji, Q., Babbin, A. R., Jayakumar, A., Oleynik, S., and Ward, B. B.: Nitrous oxide production by nitrification and denitrification in the Eastern Tropical South Pacific oxygen minimum zone, Geophys. Res. Lett., 42, 10–755, 2015a. a, b
Ji, Q., Babbin, A. R., Peng, X., Bowen, J. L., and Ward, B. B.: Nitrogen substrate–dependent nitrous oxide cycling in salt marsh sediments, J. Mar. Res., 73, 71–92, https://doi.org/10.1357/002224015815848820, 2015b. a, b
Ji, Q., Buitenhuis, E., Suntharalingam, P., Sarmiento, J. L., and Ward, B. B.: Global Nitrous Oxide Production Determined by Oxygen Sensitivity of Nitrification and Denitrification, Global Biogeochem. Cy., 32, 1790–1802, https://doi.org/10.1029/2018GB005887, 2018a. a, b, c, d, e, f, g, h, i, j, k
Ji, Q., Buitenhuis, E., Suntharalingam, P., Sarmiento, J. L., and Ward, B. B.: Global Nitrous Oxide Production Determined by Oxygen Sensitivity of Nitrification and Denitrification, Global Biogeochem. Cy., 32, 1790–1802, https://doi.org/10.1029/2018GB005887, 2018b. a, b
Jin, X. and Gruber, N.: Offsetting the radiative benefit of ocean iron fertilization by enhancing N2O emissions, Geophys. Res. Lett., 30, 1–4, https://doi.org/10.1029/2003GL018458, 2003. a
Johnson, K. A. and Goody, R. S.: The Original Michaelis Constant: Translation of the 1913 Michaelis–Menten Paper, Biochemistry, 50, 8264–8269, https://doi.org/10.1021/bi201284u, 2011. a
Johnston, D. T., Gill, B. C., Masterson, A., Beirne, E., Casciotti, K. L., Knapp, A. N., and Berelson, W.: Placing an upper limit on cryptic marine sulphur cycling, Nature, 513, 530–533, https://doi.org/10.1038/nature13698, 2014. a
Kalvelage, T., Jensen, M. M., Contreras, S., Revsbech, N. P., Lam, P., Günter, M., LaRoche, J., Lavik, G., and Kuypers, M. M.: Oxygen sensitivity of anammox and coupled N-cycle processes in oxygen minimum zones, PLoS ONE, 6, e29299, https://doi.org/10.1371/journal.pone.0029299, 2011. a, b, c
Kalvelage, T., Lavik, G., Lam, P., Contreras, S., Arteaga, L., Löscher, C. R., Oschlies, A., Paulmier, A., Stramma, L., and Kuypers, M. M.: Nitrogen cycling driven by organic matter export in the South Pacific oxygen minimum zone, Nat. Geosci., 6, 228–234, https://doi.org/10.1038/ngeo1739, 2013. a, b, c, d
Karstensen, J., Stramma, L., and Visbeck, M.: Oxygen minimum zones in the eastern tropical Atlantic and Pacific oceans, Prog. Oceanogr., 77, 331–350, https://doi.org/10.1016/j.pocean.2007.05.009, 2008. a
Koeve, W. and Kähler, P.: Heterotrophic denitrification vs. autotrophic anammox – quantifying collateral effects on the oceanic carbon cycle, Biogeosciences, 7, 2327–2337, https://doi.org/10.5194/bg-7-2327-2010, 2010. a
Kraft, B., Strous, M., and Tegetmeyer, H. E.: Microbial nitrate respiration – Genes, enzymes and environmental distribution, J. Biotechnol., 155, 104–117, https://doi.org/10.1016/j.jbiotec.2010.12.025, 2011. a
Kriest, I. and Oschlies, A.: On the treatment of particulate organic matter sinking in large-scale models of marine biogeochemical cycles, Biogeosciences, 5, 55–72, https://doi.org/10.5194/bg-5-55-2008, 2008. a
Kriest, I., Sauerland, V., Khatiwala, S., Srivastav, A., and Oschlies, A.: Calibrating a global three-dimensional biogeochemical ocean model (MOPS-1.0), Geosci. Model Dev., 10, 127–154, https://doi.org/10.5194/gmd-10-127-2017, 2017. a, b, c, d
Kuypers, M. M., Marchant, H. K., and Kartal, B.: The microbial nitrogen-cycling network, Nat. Rev. Microbiol., 16, 263–276, 2018. a, b, c, d, e, f, g
Lam, P. and Kuypers, M. M.: Microbial Nitrogen Cycling Processes in Oxygen Minimum Zones, Annu. Rev. Mar. Sci., 3, 317–345, https://doi.org/10.1146/annurev-marine-120709-142814, 2011. a, b, c, d, e, f, g
Lam, P., Lavik, G., Jensen, M. M., van de Vossenberg, J., Schmid, M., Woebken, D., Gutiérrez, D., Amann, R., Jetten, M. S. M., and Kuypers, M. M. M.: Revising the nitrogen cycle in the Peruvian oxygen minimum zone, P. Natl. Acad. Sci. USA, 106, 4752–4757, https://doi.org/10.1073/pnas.0812444106, 2009. a, b
Long, A. M., Jurgensen, S. K., Petchel, A. R., Savoie, E. R., and Brum, J. R.: Microbial Ecology of Oxygen Minimum Zones Amidst Ocean Deoxygenation, Front. Microbiol., 12, 748961, https://doi.org/10.3389/fmicb.2021.748961, 2021a. a
Long, M. C., Moore, J. K., Lindsay, K., Levy, M., Doney, S. C., Luo, J. Y., Krumhardt, K. M., Letscher, R. T., Grover, M., and Sylvester, Z. T.: Simulations with the marine biogeochemistry library (marbl), J. Adv. Model. Earth Sy., 13, e2021MS002647, https://doi.org/10.1029/2021MS002647 2021b. a, b
Löscher, C. R., Kock, A., Könneke, M., LaRoche, J., Bange, H. W., and Schmitz, R. A.: Production of oceanic nitrous oxide by ammonia-oxidizing archaea, Biogeosciences, 9, 2419–2429, https://doi.org/10.5194/bg-9-2419-2012, 2012. a
Louca, S., Hawley, A. K., Katsev, S., Torres-Beltran, M., Bhatia, M. P., Kheirandish, S., Michiels, C. C., Capelle, D., Lavik, G., Doebeli, M., Crowe, S. A., and Hallam, S. J.: Integrating biogeochemistry with multiomic sequence information in a model oxygen minimum zone, P. Natl. Acad. Sci. USA, 113, E5925–E5933, https://doi.org/10.1073/pnas.1602897113, 2016. a, b, c, d, e, f
Lutterbeck, H. E., Arévalo-Martínez, D. L., Löscher, C. R., and Bange, H. W.: Nitric oxide (NO) in the oxygen minimum zone off Peru, Deep-Sea Res. Pt. II, 156, 148–154, https://doi.org/10.1016/j.dsr2.2017.12.023, 2018. a, b
Manizza, M., Keeling, R. F., and Nevison, C. D.: On the processes controlling the seasonal cycles of the air–sea fluxes of O2 and N2O: A modelling study, Tellus B, 64, 18429, https://doi.org/10.3402/tellusb.v64i0.18429, 2012. a
Martens-Habbena, W., Berube, P. M., Urakawa, H., De La Torre, J. R., and Stahl, D. A.: Ammonia oxidation kinetics determine niche separation of nitrifying Archaea and Bacteria, Nature, 461, 976–979, https://doi.org/10.1038/nature08465, 2009. a
Martin, J. H., Knauer, G. A., Karl, D. M., and Broenkow, W. W.: VERTEX: carbon cycling in the northeast Pacific, Deep-Sea Res. Pt. I., 34, 267–285, https://doi.org/10.1016/0198-0149(87)90086-0, 1987. a
Martinez-Rey, J., Bopp, L., Gehlen, M., Tagliabue, A., and Gruber, N.: Projections of oceanic N2O emissions in the 21st century using the IPSL Earth system model, Biogeosciences, 12, 4133–4148, https://doi.org/10.5194/bg-12-4133-2015, 2015. a
McCoy, D., Damien, P., Clements, D. J., Yang, S., and Bianchi, D.: Pathways of Nitrous Oxide Production in the Eastern Tropical South Pacific Oxygen Minimum Zone, Authorea Preprints, https://doi.org/10.22541/essoar.167058932.27589471/v1, 2022. a, b
Moore, J. K., Doney, S. C., and Lindsay, K.: Upper ocean ecosystem dynamics and iron cycling in a global three-dimensional model, Global Biogeochem. Cy., 18, GB4028, https://doi.org/10.1029/2004GB002220, 2004. a, b
Moore, J. K., Lindsay, K., Doney, S. C., Long, M. C., and Misumi, K.: Marine Ecosystem Dynamics and Biogeochemical Cycling in the Community Earth System Model [CESM1(BGC)]: Comparison of the 1990s with the 2090s under the RCP4.5 and RCP8.5 Scenarios, J. Climate, 26, 9291–9312, https://doi.org/10.1175/JCLI-D-12-00566.1, 2013. a
Moreno, A. R., Garcia, C. A., Larkin, A. A., Lee, J. A., Wang, W.-L., Moore, J. K., Primeau, F. W., and Martiny, A. C.: Latitudinal gradient in the respiration quotient and the implications for ocean oxygen availability, P. Natl. Acad. Sci. USA, 117, 22866–22872, https://doi.org/10.1073/pnas.2004986117, 2020. a
Moreno, A. R., Larkin, A. A., Lee, J. A., Gerace, S. D., Tarran, G. A., and Martiny, A. C.: Regulation of the Respiration Quotient Across Ocean Basins, AGU Advances, 3, e2022AV000679, https://doi.org/10.1029/2022AV000679, 2022. a
Naqvi, S. W. A., Bange, H. W., Farías, L., Monteiro, P. M. S., Scranton, M. I., and Zhang, J.: Marine hypoxia/anoxia as a source of CH4 and N2O, Biogeosciences, 7, 2159–2190, https://doi.org/10.5194/bg-7-2159-2010, 2010. a
Nevison, C., Butler, J. H., and Elkins, J. W.: Global distribution of N2O and the ΔN2O-AOU yield in the subsurface ocean, Global Biogeochem. Cy., 17, 1119, https://doi.org/10.1029/2003GB002068, 2003. a, b, c, d, e, f, g, h
Nguyen, T. T., Zakem, E. J., Ebrahimi, A., Schwartzman, J., Caglar, T., Amarnath, K., Alcolombri, U., Peaudecerf, F. J., Hwa, T., Stocker, R., Cordero, O. X., and Levine, N. M.: Microbes contribute to setting the ocean carbon flux by altering the fate of sinking particulates, Nat. Commun., 13, 1–9, 2022. a
Paulmier, A., Kriest, I., and Oschlies, A.: Stoichiometries of remineralisation and denitrification in global biogeochemical ocean models, Biogeosciences, 6, 923–935, https://doi.org/10.5194/bg-6-923-2009, 2009. a
Paulot, F., Stock, C., John, J. G., Zadeh, N., and Horowitz, L. W.: Ocean ammonia outgassing: modulation by CO2and anthropogenic nitrogen deposition, J. Adv. Model. Earth Sy., 12, e2019MS002026, https://doi.org/10.1029/2019MS002026, 2020. a
Peng, X., Fuchsman, C. A., Jayakumar, A., Warner, M. J., Devol, A. H., and Ward, B. B.: Revisiting nitrification in the Eastern Tropical South Pacific: A focus on controls, J. Geophys. Res.-Oceans, 121, 1667–1684, https://doi.org/10.1002/2015JC011455, 2016. a, b, c
Penn, J., Weber, T., and Deutsch, C.: Microbial functional diversity alters the structure and sensitivity of oxygen deficient zones, Geophys. Res. Lett., 43, 9773–9780, https://doi.org/10.1002/2016GL070438, 2016. a, b, c, d
Penn, J. L., Weber, T., Chang, B. X., and Deutsch, C.: Microbial ecosystem dynamics drive fluctuating nitrogen loss in marine anoxic zones, P. Natl. Acad. Sci. USA, 116, 7220–7225, https://doi.org/10.1073/pnas.1818014116, 2019. a, b, c, d, e, f
Primeau, F.: On the variability of the exponent in the power law depth dependence of POC flux estimated from sediment traps, Deep-Sea Res. Pt. I, 53, 1335–1343, 2006. a, b
Santoro, A. E., Buchwald, C., McIlvin, M. R., and Casciotti, K. L.: Isotopic Signature of N2O Produced by Marine Ammonia-Oxidizing Archaea, Science, 333, 1282–1285, https://doi.org/10.1126/science.1208239, 2011. a
Santoro, A. E., Buchwald, C., Knapp, A. N., Berelson, W. M., Capone, D. G., and Casciotti, K. L.: Nitrification and Nitrous Oxide Production in the Offshore Waters of the Eastern Tropical South Pacific, Global Biogeochem. Cy., 35, 1–35, https://doi.org/10.1029/2020GB006716, 2021. a, b, c, d, e
Sarmiento, J. L., Slater, R., Fasham, M., Ducklow, H., Toggweiler, J., and Evans, G.: A seasonal three-dimensional ecosystem model of nitrogen cycling in the North Atlantic euphotic zone, Global Biogeochem. Cy., 7, 417–450, 1993. a
Sarmiento, J. L., Slater, R. D., Dunne, J., Gnanadesikan, A., and Hiscock, M. R.: Efficiency of small scale carbon mitigation by patch iron fertilization, Biogeosciences, 7, 3593–3624, https://doi.org/10.5194/bg-7-3593-2010, 2010. a
Schartau, M. and Oschlies, A.: Simultaneous data-based optimization of a 1D-ecosystem model at three locations in the North Atlantic: Part I–Method and parameter estimates, J. Mar. Res., 61, 765–793, https://doi.org/10.1357/002224003322981147, 2003. a, b
Scholz, F., Löscher, C. R., Fiskal, A., Sommer, S., Hensen, C., Lomnitz, U., Wuttig, K., Göttlicher, J., Kossel, E., Steininger, R., and Canfield, D. E.: Nitrate-dependent iron oxidation limits iron transport in anoxic ocean regions, Earth Planet. Sc. Lett., 454, 272–281, https://doi.org/10.1016/j.epsl.2016.09.025, 2016. a
Schreiber, F., Wunderlin, P., Udert, K. M., and Wells, G. F.: Nitric oxide and nitrous oxide turnover in natural and engineered microbial communities: biological pathways, chemical reactions, and novel technologies, Front. Microbiol., 3, 372, https://doi.org/10.3389/fmicb.2012.00372, 2012. a
Séférian, R., Berthet, S., Yool, A., Palmieri, J., Bopp, L., Tagliabue, A., Kwiatkowski, L., Aumont, O., Christian, J., Dunne, J., Gehlen, M., Ilyina, T., John, J. G., Li, H., Long, M. C., Luo, J. Y., Nakano, H., Romanou, A., Schwinger, J., Stock, C., Santana-Falcón, Y., Takano, Y., Tjiputra, J., Tsujino, H., Watanabe, M., Wu, T., Wu, F., and Yamamoto, A.: Tracking improvement in simulated marine biogeochemistry between CMIP5 and CMIP6, Current Climate Change Reports, 6, 95–119, 2020. a
Smriga, S., Ciccarese, D., and Babbin, A. R.: Denitrifying bacteria respond to and shape microscale gradients within particulate matrices, Communications Biology, 4, 1–9, 2021. a
Stein, L. Y. and Yung, Y. L.: Production, Isotopic Composition, and Atmospheric Fate of Biologically Produced Nitrous Oxide, Annu. Rev. Earth Planet. Sc., 31, 329–356, https://doi.org/10.1146/annurev.earth.31.110502.080901, 2003. a, b
Stieglmeier, M., Mooshammer, M., Kitzler, B., Wanek, W., Zechmeister-Boltenstern, S., Richter, A., and Schleper, C.: Aerobic nitrous oxide production through N-nitrosating hybrid formation in ammonia-oxidizing archaea, ISME J., 8, 1135–1146, https://doi.org/10.1038/ismej.2013.220, 2014. a, b
Stock, C. A., Dunne, J. P., Fan, S., Ginoux, P., John, J., Krasting, J. P., Laufkötter, C., Paulot, F., and Zadeh, N.: Ocean biogeochemistry in GFDL's Earth System Model 4.1 and its response to increasing atmospheric CO2, J. Adv. Model. Earth Sy., 12, e2019MS002043, https://doi.org/10.1029/2019MS002043, 2020. a, b
Sun, X., Ji, Q., Jayakumar, A., and Ward, B. B.: Dependence of nitrite oxidation on nitrite and oxygen in low-oxygen seawater, Geophys. Rese. Lett., 44, 7883–7891, https://doi.org/10.1002/2017GL074355, 2017. a, b, c
Sun, X., Frey, C., Garcia-Robledo, E., Jayakumar, A., and Ward, B. B.: Microbial niche differentiation explains nitrite oxidation in marine oxygen minimum zones, ISME J., 15, 1317–1329, https://doi.org/10.1038/s41396-020-00852-3, 2021a. a, b
Sun, X., Jayakumar, A., Tracey, J. C., Wallace, E., Kelly, C. L., Casciotti, K. L., and Ward, B. B.: Microbial N2O consumption in and above marine N2O production hotspots, ISME J., 15, 1434–1444, 2021b. a
Suntharalingam, P. and Sarmiento, J. L.: Factors governing the oceanic nitrous oxide distribution: Simulations with an ocean general circulation model, Global Biogeochem. Cy., 14, 429–454, 2000. a
Suntharalingam, P., Buitenhuis, E., Le Quéré, C., Dentener, F., Nevison, C., Butler, J. H., Bange, H. W., and Forster, G.: Quantifying the impact of anthropogenic nitrogen deposition on oceanic nitrous oxide, Geophys. Res. Lett., 39, L07605, https://doi.org/10.1029/2011GL050778, 2012. a
Swan, B. K., Martinez-Garcia, M., Preston, C. M., Sczyrba, A., Woyke, T., Lamy, D., Reinthaler, T., Poulton, N. J., Masland, E. D. P., Gomez, M. L., Sieracki, M. E., DeLong, E. F., Herndl, G. J., and Stepanauskas, R.: Potential for Chemolithoautotrophy Among Ubiquitous Bacteria Lineages in the Dark Ocean, Science, 333, 1296–1300, https://doi.org/10.1126/science.1203690, 2011. a
Teng, Y.-C., Primeau, F. W., Moore, J. K., Lomas, M. W., and Martiny, A. C.: Global-scale variations of the ratios of carbon to phosphorus in exported marine organic matter, Nat. Geosci., 7, 895–898, https://doi.org/10.1038/ngeo2303, 2014. a
Thamdrup, B., Steinsdóttir, H. G. R., Bertagnolli, A. D., Padilla, C. C., Patin, N. V., Garcia‐Robledo, E., Bristow, L. A., and Stewart, F. J.: Anaerobic methane oxidation is an important sink for methane in the ocean's largest oxygen minimum zone, Limnol. Oceanogr., 64, 2569–2585, https://doi.org/10.1002/lno.11235, 2019. a, b
Trimmer, M., Chronopoulou, P.-M., Maanoja, S. T., Upstill-Goddard, R. C., Kitidis, V., and Purdy, K. J.: Nitrous oxide as a function of oxygen and archaeal gene abundance in the North Pacific, Nat. Commun., 7, 13451, https://doi.org/10.1038/ncomms13451, 2016. a
Van Mooy, B. A., Keil, R. G., and Devol, A. H.: Impact of suboxia on sinking particulate organic carbon: Enhanced carbon flux and preferential degradation of amino acids via denitrification, Geochim. Cosmochim. Ac., 66, 457–465, https://doi.org/10.1016/S0016-7037(01)00787-6, 2002. a
Wang, W.-L., Moore, J. K., Martiny, A. C., and Primeau, F. W.: Convergent estimates of marine nitrogen fixation, Nature, 566, 205–211, https://doi.org/10.1038/s41586-019-0911-2, 2019. a
Ward, B. and Zafiriou, O.: Nitrification and nitric oxide in the oxygen minimum of the eastern tropical North Pacific, Deep-Sea Res. Pt. I, 35, 1127–1142, https://doi.org/10.1016/0198-0149(88)90005-2, 1988. a, b, c
Ward, B. A., Friedrichs, M. A., Anderson, T. R., and Oschlies, A.: Parameter optimisation techniques and the problem of underdetermination in marine biogeochemical models, J. Marine Syst., 81, 34–43, https://doi.org/10.1016/j.jmarsys.2009.12.005, 2010. a
Ward, B. B.: Nitrification in Marine Systems, in: Nitrogen in the Marine Environment, 199–261, Elsevier, https://doi.org/10.1016/B978-0-12-372522-6.00005-0, 2008. a
Weber, T. and Bianchi, D.: Efficient particle transfer to depth in oxygen minimum zones of the Pacific and Indian Oceans, Front. Earth Sci., 8, 376, https://doi.org/10.3389/feart.2020.00376, 2020. a
Wrage, N., Velthof, G. L., Van Beusichem, M. L., and Oenema, O.: Role of nitrifier denitrification in the production of nitrous oxide, Soil Biol. Biochem., 33, 1723–1732, https://doi.org/10.1016/S0038-0717(01)00096-7, 2001. a, b
Wyrtki, K.: The oxygen minima in relation to ocean circulation, Deep-Sea Res., 9, 11–23, https://doi.org/10.1016/0011-7471(62)90243-7, 1962. a
Yang, S., Chang, B. X., Warner, M. J., Weber, T. S., Bourbonnais, A. M., Santoro, A. E., Kock, A., Sonnerup, R. E., Bullister, J. L., Wilson, S. T., and Bianchi, D.: Global reconstruction reduces the uncertainty of oceanic nitrous oxide emissions and reveals a vigorous seasonal cycle, P. Natl. Acad. Sci. USA, 117, 11954–11960, https://doi.org/10.1073/pnas.1921914117, 2020. a
Zakem, E. J., Al-Haj, A., Church, M. J., Van Dijken, G. L., Dutkiewicz, S., Foster, S. Q., Fulweiler, R. W., Mills, M. M., and Follows, M. J.: Ecological control of nitrite in the upper ocean, Nat. Commun., 9, 1206, https://doi.org/10.1038/s41467-018-03553-w, 2018. a, b, c, d, e
Zakem, E. J., Polz, M. F., and Follows, M. J.: Redox-informed models of global biogeochemical cycles, Nat. Commun., 11, 5680, https://doi.org/10.1038/s41467-020-19454-w, 2020. a
- Abstract
- Introduction
- Nitrogen cycle model formulation
- Model implementation
- Model optimization strategy
- Results and sensitivity
- Discussion and conclusions
- Appendix A: NitrOMZ equations
- Appendix B: NitrOMZ parameters and configurations
- Appendix C: supplemental figures
- Code and data availability
- Author contributions
- Competing interests
- Disclaimer
- Acknowledgements
- Financial support
- Review statement
- References