the Creative Commons Attribution 4.0 License.
the Creative Commons Attribution 4.0 License.
 | 01 Jun 2023
Evaluation of CMIP6 model performances in simulating fire weather spatiotemporal variability on global and regional scales
Carolina Gallo
Jonathan M. Eden
Bastien Dieppois
Igor Drobyshev
Peter Z. Fulé
Jesús San-Miguel-Ayanz
Matthew Blackett
Weather and climate play an important role in shaping global wildfire regimes and geographical distributions of burnable area. As projected by the Sixth Assessment Report of the Intergovernmental Panel on Climate Change (IPCC-AR6), in the near future, fire danger is likely to increase in many regions due to warmer temperatures and drier conditions. General circulation models (GCMs) are an important resource in understanding how fire danger will evolve in a changing climate, but, to date, the development of fire risk scenarios has not fully accounted for systematic GCM errors and biases. This study presents a comprehensive global evaluation of the spatiotemporal representation of fire weather indicators from the Canadian Forest Fire Weather Index System simulated by 16 GCMs from the sixth Coupled Model Intercomparison Project (CMIP6). While at the global scale, the ensemble mean is able to represent variability, magnitude and spatial extent of different fire weather indicators reasonably well when compared to the latest global fire reanalysis, there is considerable regional and seasonal dependence in the performance of each GCM. To support the GCM selection and application for impact studies, the evaluation results are combined to generate global and regional rankings of individual GCM performance. The findings highlight the value of GCM evaluation and selection in developing more reliable projections of future climate-driven fire danger, thereby enabling decision makers and forest managers to take targeted action and respond to future fire events.
- Article
(13550 KB) - Full-text XML
-
Supplement
(631 KB) - BibTeX
- EndNote


Wildfires burn hundreds of millions of hectares each year around the world (Giglio et al., 2013; Yang et al., 2014; van Lierop et al., 2015; van Wees et al., 2021). Their impacts include profound effects on ecosystems, damage to infrastructure, high costs associated with suppression activities and risk to human lives. In recent years, the impacts of devastating individual events have been widely reported. For instance, the 2016 wildfire in Fort McMurray (Alberta, Canada) resulted in the destruction of around 2400 buildings, the evacuation of 88 000 people and financial costs of more than USD 3.5 billion (Mamuji and Rozdilsky, 2019). In California, during the 2020 wildfire season, around 1.7×10⁶ ha burned, causing 33 casualties and damaging more than 10 000 infrastructure elements (Department of Forestry and Fire Protection, 2021). Responding to present and future fire risks is of critical importance, particularly in the world's most vulnerable regions. Given the strong influence of weather and climate on temporal and spatial patterns of wildfire occurrence (Flannigan and Wotton, 2001; Zumbrunnen et al., 2009; Masrur et al., 2018), a better understanding of the impact of climate change on wildfire risk, and the tools used to quantify this impact, is an important step in formulating such responses.
Wildfires are associated with a multitude of drivers, including land use; vegetation type; topography; and, quite significantly, human activity linked to ignitions (Camia et al., 2013; Balch et al., 2017; Gaboriau et al., 2020; Fernández-Guisuraga et al., 2021). In addition, wildfire occurrence, spread and impact (in terms of area burned) are highly dependent on climate and weather conditions (Littell et al., 2009; Abatzoglou and Kolden, 2013; San-Miguel-Ayanz et al., 2013; Harris et al., 2019; Mueller et al., 2020). Across the globe, long-established spatiotemporal patterns of wildfire are being altered by changing land use; population rise; and, perhaps most importantly, changes to the climate system in a warming world (United Nations Environment Programme, 2022). While wildfires cannot strictly be defined as meteorological hazards in the same way as droughts, floods and storms, fire danger is greater during periods of high temperature, minimal precipitation, low relative humidity and strong winds. Notably, higher temperatures are significantly related to wildfire occurrence and a large extent of burned areas (Westerling et al., 2006; Littell et al., 2009; Koutsias et al., 2013; Cardil et al., 2015). The same positive relationship between drought and wildfires has also been documented (Littell et al., 2016). Similarly, lower precipitation and increased dry days intensify wildfire activity (Flannigan and Harrington, 1988; Holden et al., 2018).
Disentangling the respective contribution of different meteorological variables to fire risks is challenging, particularly in a changing climate. It is understood that the intensity and frequency of hot extremes (e.g. heat waves) are an expected consequence of a warmer world, and changes in mean precipitation will vary geographically (IPCC, 2021b). On a global scale, weather conditions may become more favourable to wildfire activity (Jolly et al., 2015; de Rigo et al., 2017; Mueller et al., 2020) and extend over longer periods (Jolly et al., 2015). To better understand past, present and future changes, it is usually preferable to combine the hot, dry and windy conditions that are conducive to fire. The term fire weather was coined to describe the collective influence of local specific weather conditions that may lead to effective ignition and fire spread (Schroeder and Buck, 1970). Fire weather is typically quantified as a series of indicators, generated based on meteorological input variables and established empirical relationships, which can be used to estimate wildfire danger.
Future changes in fire weather will most likely represent an increase in wildfire danger in many regions of the world (de Rigo et al., 2017; Arias et al., 2021). Understanding future meteorologically driven wildfire danger under climate change scenarios relies on projections from general circulation models (GCMs). As mathematical representations of the climate system and its processes, GCMs are the most important tool in understanding how the world's climate has varied in the past and how it will respond to different future scenarios associated with anthropogenic climate change. GCMs have frequently been used to quantify the link between wildfire activity and weather conditions (Bedia et al., 2015; Williams and Abatzoglou, 2016), specifically, to simulate fire weather both in the past and under future climate change scenarios (Moritz et al., 2012; Flannigan et al., 2013; Bedia et al., 2015; Littell et al., 2018; Abatzoglou et al., 2019) and also in recent attribution studies to assess the influence of anthropogenic climate change on fire weather (Barbero et al., 2020; Liu et al., 2022). However, all GCMs are associated with performance limitations that manifest as systematic biases and, ultimately, as uncertainty in GCM projections (Hawkins and Sutton, 2009; Lehner et al., 2020). Evaluation of model outputs, whether generated by individual GCMs or as part of a multi-GCM ensemble, is a continuous challenge and has been the subject of numerous studies (Johns et al., 2006; Flato et al., 2013; Baker and Taylor, 2016; Kotlarski et al., 2019). It is especially important for climate impact studies to (a) use projections from multiple GCMs and (b) evaluate the capacity of each individual GCM to represent characteristics of climate variables or phenomena that are relevant to the impact under investigation. To date, fire weather projections have frequently been based on single GCMs (e.g. Krawchuk et al., 2009; Amatulli et al., 2013), and, even when multiple GCMs have been used (e.g. Moritz et al., 2012; Dowdy et al., 2019), the capacity of each GCM to simulate realistic conditions (i.e. comparable to observed fire weather conditions) has not been thoroughly evaluated. In the absence of a comprehensive GCM evaluation, it is not possible to characterise and quantify the uncertainties that may affect the reliability of multi-GCM means and projections (Moritz et al., 2012; Bedia et al., 2015; Dowdy et al., 2019).
This study aims to evaluate the performance of the latest generation of GCMs from the sixth phase of the Coupled Model Intercomparison Project (CMIP6) in simulating a range of fire weather indicators across all fire-prone regions of the world (see Sect. 2.4). The analysis represents the first global evaluation of GCM capacity to realistically simulate spatiotemporal variability in meteorologically driven wildfire danger. Evaluation is performed at the global and regional scales, accounting for model performance in simulating both mean and extreme fire weather conditions. The results generated are relevant for wildfire risk assessment studies and more informed decision-making and planning to respond to future fire danger. In the context of the ongoing global climate change, more tailored fire management strategies are key to better adapt to future fire weather conditions.
The remainder of this paper is organised into four sections. Section 2 gives an overview of the chosen set of fire weather indicators, the CMIP6 models and the reference datasets used as the basis for evaluation, alongside a description of the evaluation methodology. Section 3 presents the results of the model evaluation on both global and regional scales, initially for the multi-GCM mean and seasonality and subsequently for inter-model performance. Section 4 includes a synthesis and discussion of the implications of the results. Section 5 provides a set of conclusions and an outlook.
2.1 Fire weather indicators
The long-established relationship between climate and wildfire has led to the development of a range of meteorology-based indicators to describe fire weather (and consequently fire danger) in different parts of the world (e.g. McArthur, 1967; Deeming et al., 1972; Van Wagner, 1974). Throughout this study, indicators of fire weather are represented by the Canadian Fire Weather Index System (CFWIS). While originally developed for a standard pine forest in Canada (Van Wagner, 1974, 1987; Wotton, 2009), this system has been proven to be applicable in other regions (Carvalho et al., 2008; Di Giuseppe et al., 2016; Bowman et al., 2017) and is being used by the European Commission for fire weather statistics in Europe (European Forest Fire Information System) and worldwide (Global Wildfire Information System). It is also widely used for projections of future fire weather (Bedia et al., 2015; Camia et al., 2017; Dupuy et al., 2020).
The CFWIS consists of a set of different components, each of them calculated using a combination of daily meteorological variables (Van Wagner, 1987; Fig. 1): temperature, wind speed, relative humidity and precipitation. Firstly, a set of fuel moisture codes describe the quantity of moisture contained by fire fuels: the Fine Fuel Moisture Code (FFMC) represents the moisture content of litter and other fine fuels, indicating the relative ease of ignition and the flammability of fine fuel; the Duff Moisture Code (DMC) represents the average moisture content of loosely compacted organic layers of moderate depth; and the Drought Code (DC) represents the average moisture content of deep, compact organic layers. The following components describe weather-driven fire behaviour: the Initial Spread Index (ISI) represents the expected rate of fire spread, combining the effects of wind and FFMC on the rate of spread without the influence of variable quantities of fuel; and the Buildup Index (BUI) represents the total amount of fuel available for combustion, combining DMC and DC. Finally, two indices are calculated: the Fire Weather Index (FWI) represents fire intensity, combining ISI and BUI, and is often used as the main fire danger indicator (Padilla and Vega-García, 2011; Bedia et al., 2015; de Rigo et al., 2017); the Daily Severity Rating (DSR), an extension of the CFWIS, is a transformation of the daily FWI value, representing the effort required for suppression. All fire weather components of the system are numeric ratings, and a higher number represents a higher potential fire danger. A detailed description of the system and its individual components can be found in Van Wagner (1987).
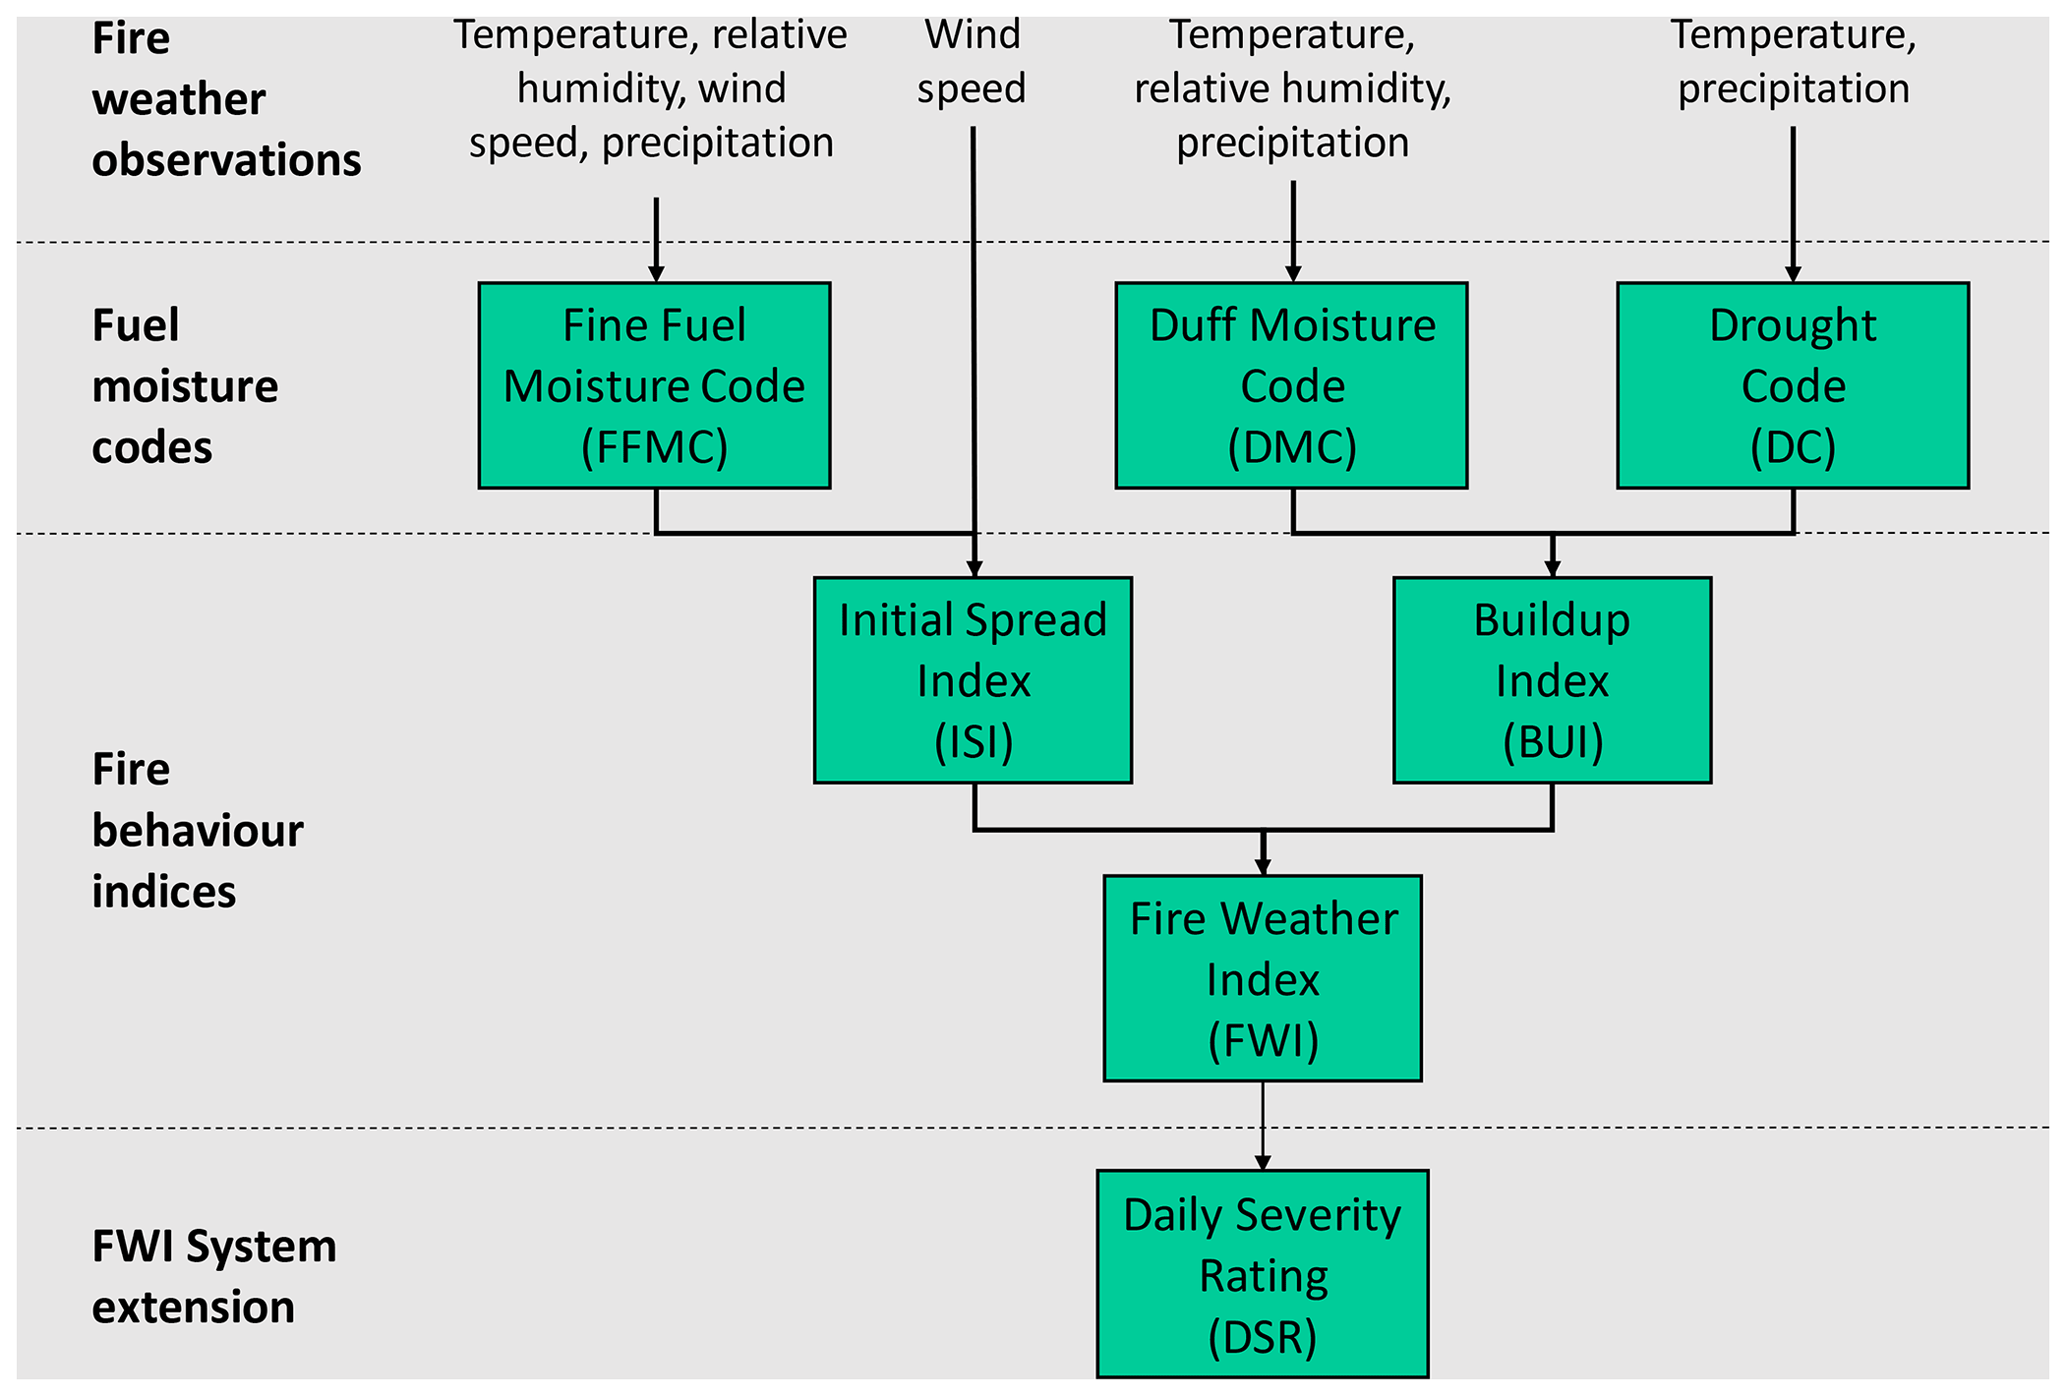
Figure 1Fire weather components of the Canadian Fire Weather Index System (CFWIS). Adapted from Natural Resources Canada (2021).
2.2 CMIP6 models
During recent decades, the development and dissemination of a growing number of GCMs from numerous modelling centres around the world have been coordinated by CMIP (Meehl et al., 2000, 2007; Taylor et al., 2012; Eyring et al., 2016). CMIP supports climate change assessments at national and international levels and brings about climate model improvements. CMIP results have consequently been used to prepare the Intergovernmental Panel on Climate Change (IPCC) assessment reports (IPCC, 2021a). CMIP's sixth and current phase (CMIP6) (Eyring et al., 2016) includes the participation of more institutions (and model versions) in comparison to the project's fifth phase (CMIP5).
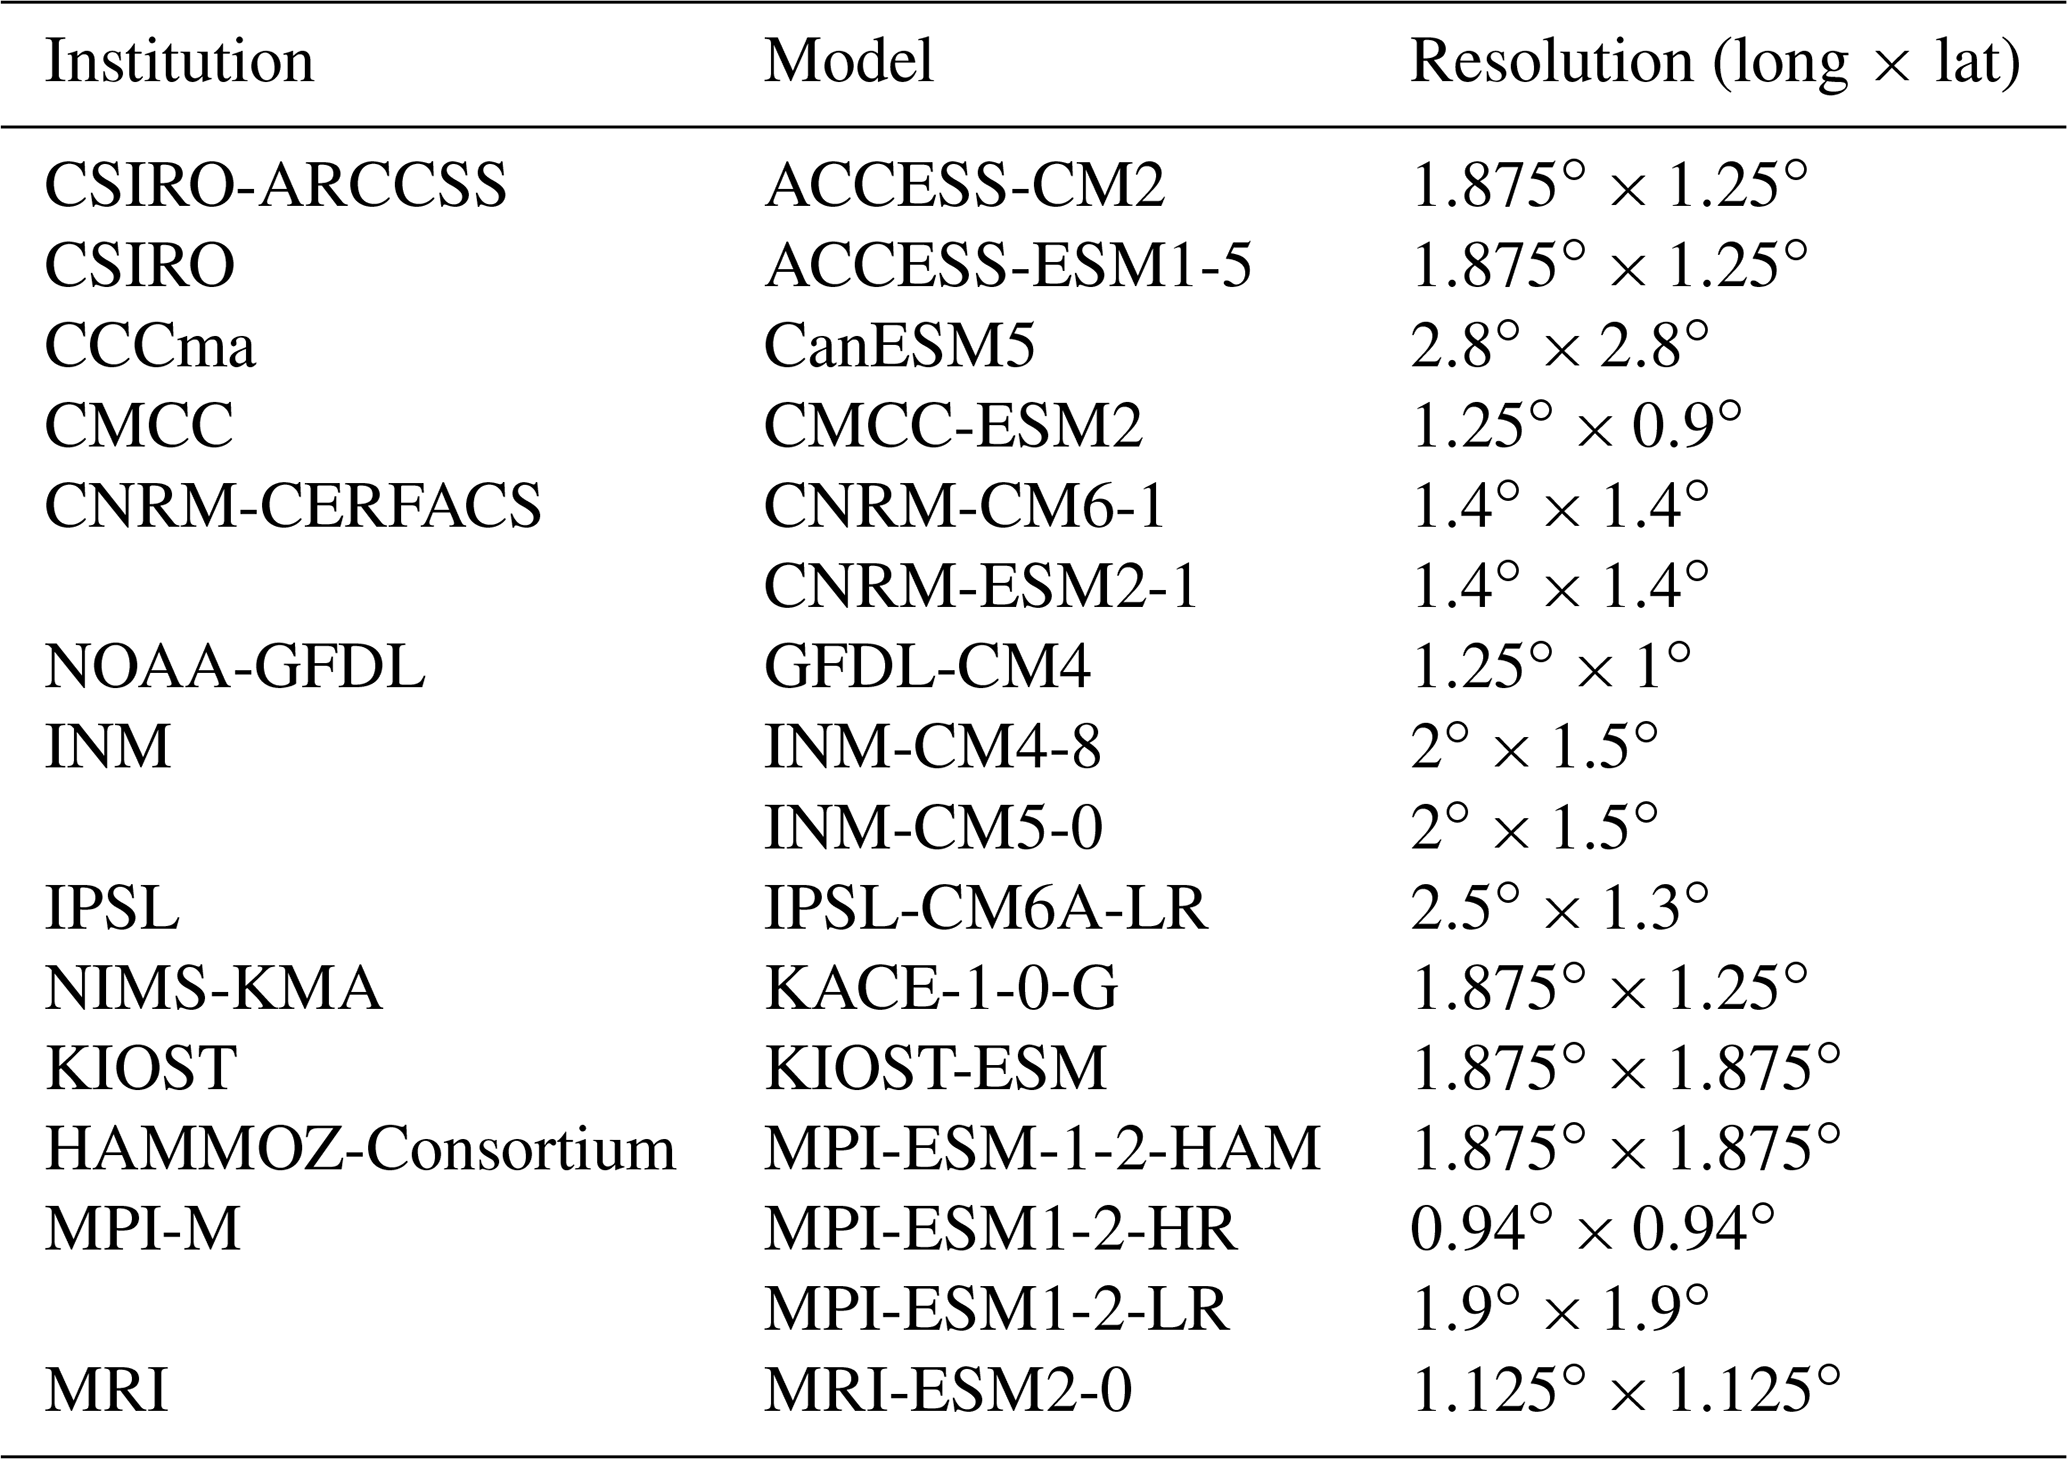
We calculated the CFWIS components using the R package cffdrs (Wang et al., 2017). The CFWIS typically requires observations of temperature, relative humidity and wind speed taken at noon local time, in addition to 24 h accumulated precipitation. For a consistent approach to the global analysis, daily values for maximum temperature, mean wind speed, minimum relative humidity and total precipitation were used as proxies for noon conditions. This approach is similar to that taken by Jolly et al. (2015) and Calheiros et al. (2021). At the time of analysis, the required input fields were available for 16 CMIP6 models (Eyring et al., 2016). Given the disparity in ensemble size among the available models, our analysis is limited to a single ensemble member for each model. The full set of models, developed by a total of 13 institutions, is detailed in Table 1.
Table 1List of the 16 models used to simulate the CFWIS components and their original resolutions.
Following the calculation of the CFWIS components, to permit comparison between CMIP6 models and the reference data, all data were re-gridded to a resolution, using bilinear interpolation.
2.3 Fire danger reanalysis
An obvious choice for observational reference for fire weather is CFWIS data from the Global ECMWF Fire Forecast model (hereafter GEFF-ERA5) (Vitolo et al., 2020). Produced by the European Forest Fire Information System of the Copernicus Emergency Management Service, GEFF-ERA5 offers daily continuous fire weather data of the different CFWIS components at a spatial resolution of 0.25∘ throughout the world's land area. GEFF-ERA5 has been driven by input fields from the ERA5 Reanalysis (ERA5; Hersbach et al., 2020) from 1979 to present and replaces the previous global fire danger reanalysis driven by ERA-Interim (Vitolo et al., 2019). In general, ERA5 provides a realistic and temporally coherent approximation of real-world weather states, with higher spatial and temporal resolutions and better estimates of meteorological variables compared to ERA-Interim (Dee et al., 2011; Hersbach et al., 2019), reducing biases and increasing correlation with observations (Graham et al., 2019; Gleixner et al., 2020; Tarek et al., 2020). GEFF-ERA5 and other reanalysis-derived fire weather indicators have been shown to represent fire danger well. For instance, McElhinny et al. (2020) found a generally good agreement between FWI values and station observations in Canada. In our case, as the CFWIS indicators generated from CMIP6 rely on daily values for the four meteorological components as proxies for noon conditions, and to ensure a fair comparison, we generate CFWIS indicators for ERA5 using the same input components. We make a comparison between ERA5 and GEFF-ERA5 to illustrate the consistency between the two sources of CFWIS information.
2.4 Model evaluation
Model evaluation is limited to the areas of the world considered vulnerable to fire activity. Such fire-prone areas of the world are here defined according to the historical evidence of fire activity, determined using burned area data from version 4 of the Global Fire Emissions Database (GFED4) (Giglio et al., 2013; Poulter et al., 2015; Mezuman et al., 2020). GFED4 burned area data are available for the 1996–2016 period. Following the approach of Liu et al. (2022) in isolating burnable area, all grid points within a 50 km radius of a record of burned area are identified as fire-prone in order to account for the spatial randomness of fire activity and the relatively short record of the GFED4 data.
To understand the overall model representation of all CFWIS components (Fig. 1), historical simulations from each GCM are then compared to corresponding ERA5-calculated fields between 1980 and 2014, the maximum period for which ERA5 and CMIP6 data are concurrently available. Model performance is then quantified through the ability of GCMs to simulate monthly mean climatologies of daily values of each CFWIS indicator with ERA5 used as a reference. Additionally, to account for severe fire weather, performance is also quantified by representation of the 90th percentile, constructed for each month using daily CFWIS values across all years. Evaluation of model representation of spatial and seasonal patterns is undertaken for all CFWIS components at both the global and regional scales, firstly, concerning the multi-model mean (Sect. 3.1 and 3.2) and, secondly, with respect to the inter-model spread (Sect. 3.3). Multiple model performance metrics are used, including (i) spatial correlation to assess the representation of spatial variability, (ii) root mean squared error (RMSE) to assess the representation of mean states and the extent of model bias, and (iii) the ratio of observed standard deviation to assess the representation of spatial variance. Taylor diagrams (Taylor, 2001; Grimmond et al., 2010; Abbasian et al., 2019) are used to visualise and quantify inter-model relative performance in terms of each model's capacity to reproduce the mean, variance and spatial variability of each CFWIS component. Regional analysis is based on 14 GFED-defined fire regions originally presented by Giglio et al. (2006) and Van der Werf et al. (2006) and widely used in subsequent work (e.g. Giglio et al., 2010, 2013; Andela et al., 2019; Mezuman et al., 2020; Grillakis et al., 2022; Liu et al., 2022). To isolate CMIP6 performance during periods that are most conducive to fire activity, a fire season was established for each region based on available GFED4 burned area data. For each GFED-defined region, the fire season was defined by those months for which the total burned area is greater than 50 % of the maximum burned area across all months, averaged for each month over the available 1996–2016 period.
3.1 Evaluation of multi-model CFWIS representation
The ERA5 data suggest that wildfire danger is the largest in dry tropical and subtropical regions such as Australia, sub-Saharan Africa, South America, southern Asia, the Mediterranean Basin and western North America (Fig. 2; second column). These patterns compare favourably to those of the GEFF-ERA5 dataset (Fig. 2; first column). For all CFWIS components, global patterns of the CMIP6 multi-model mean are generally similar for both the multi-annual monthly mean (Fig. 2; third column) and 90th percentile statistics of daily values (Fig. 3; third column).
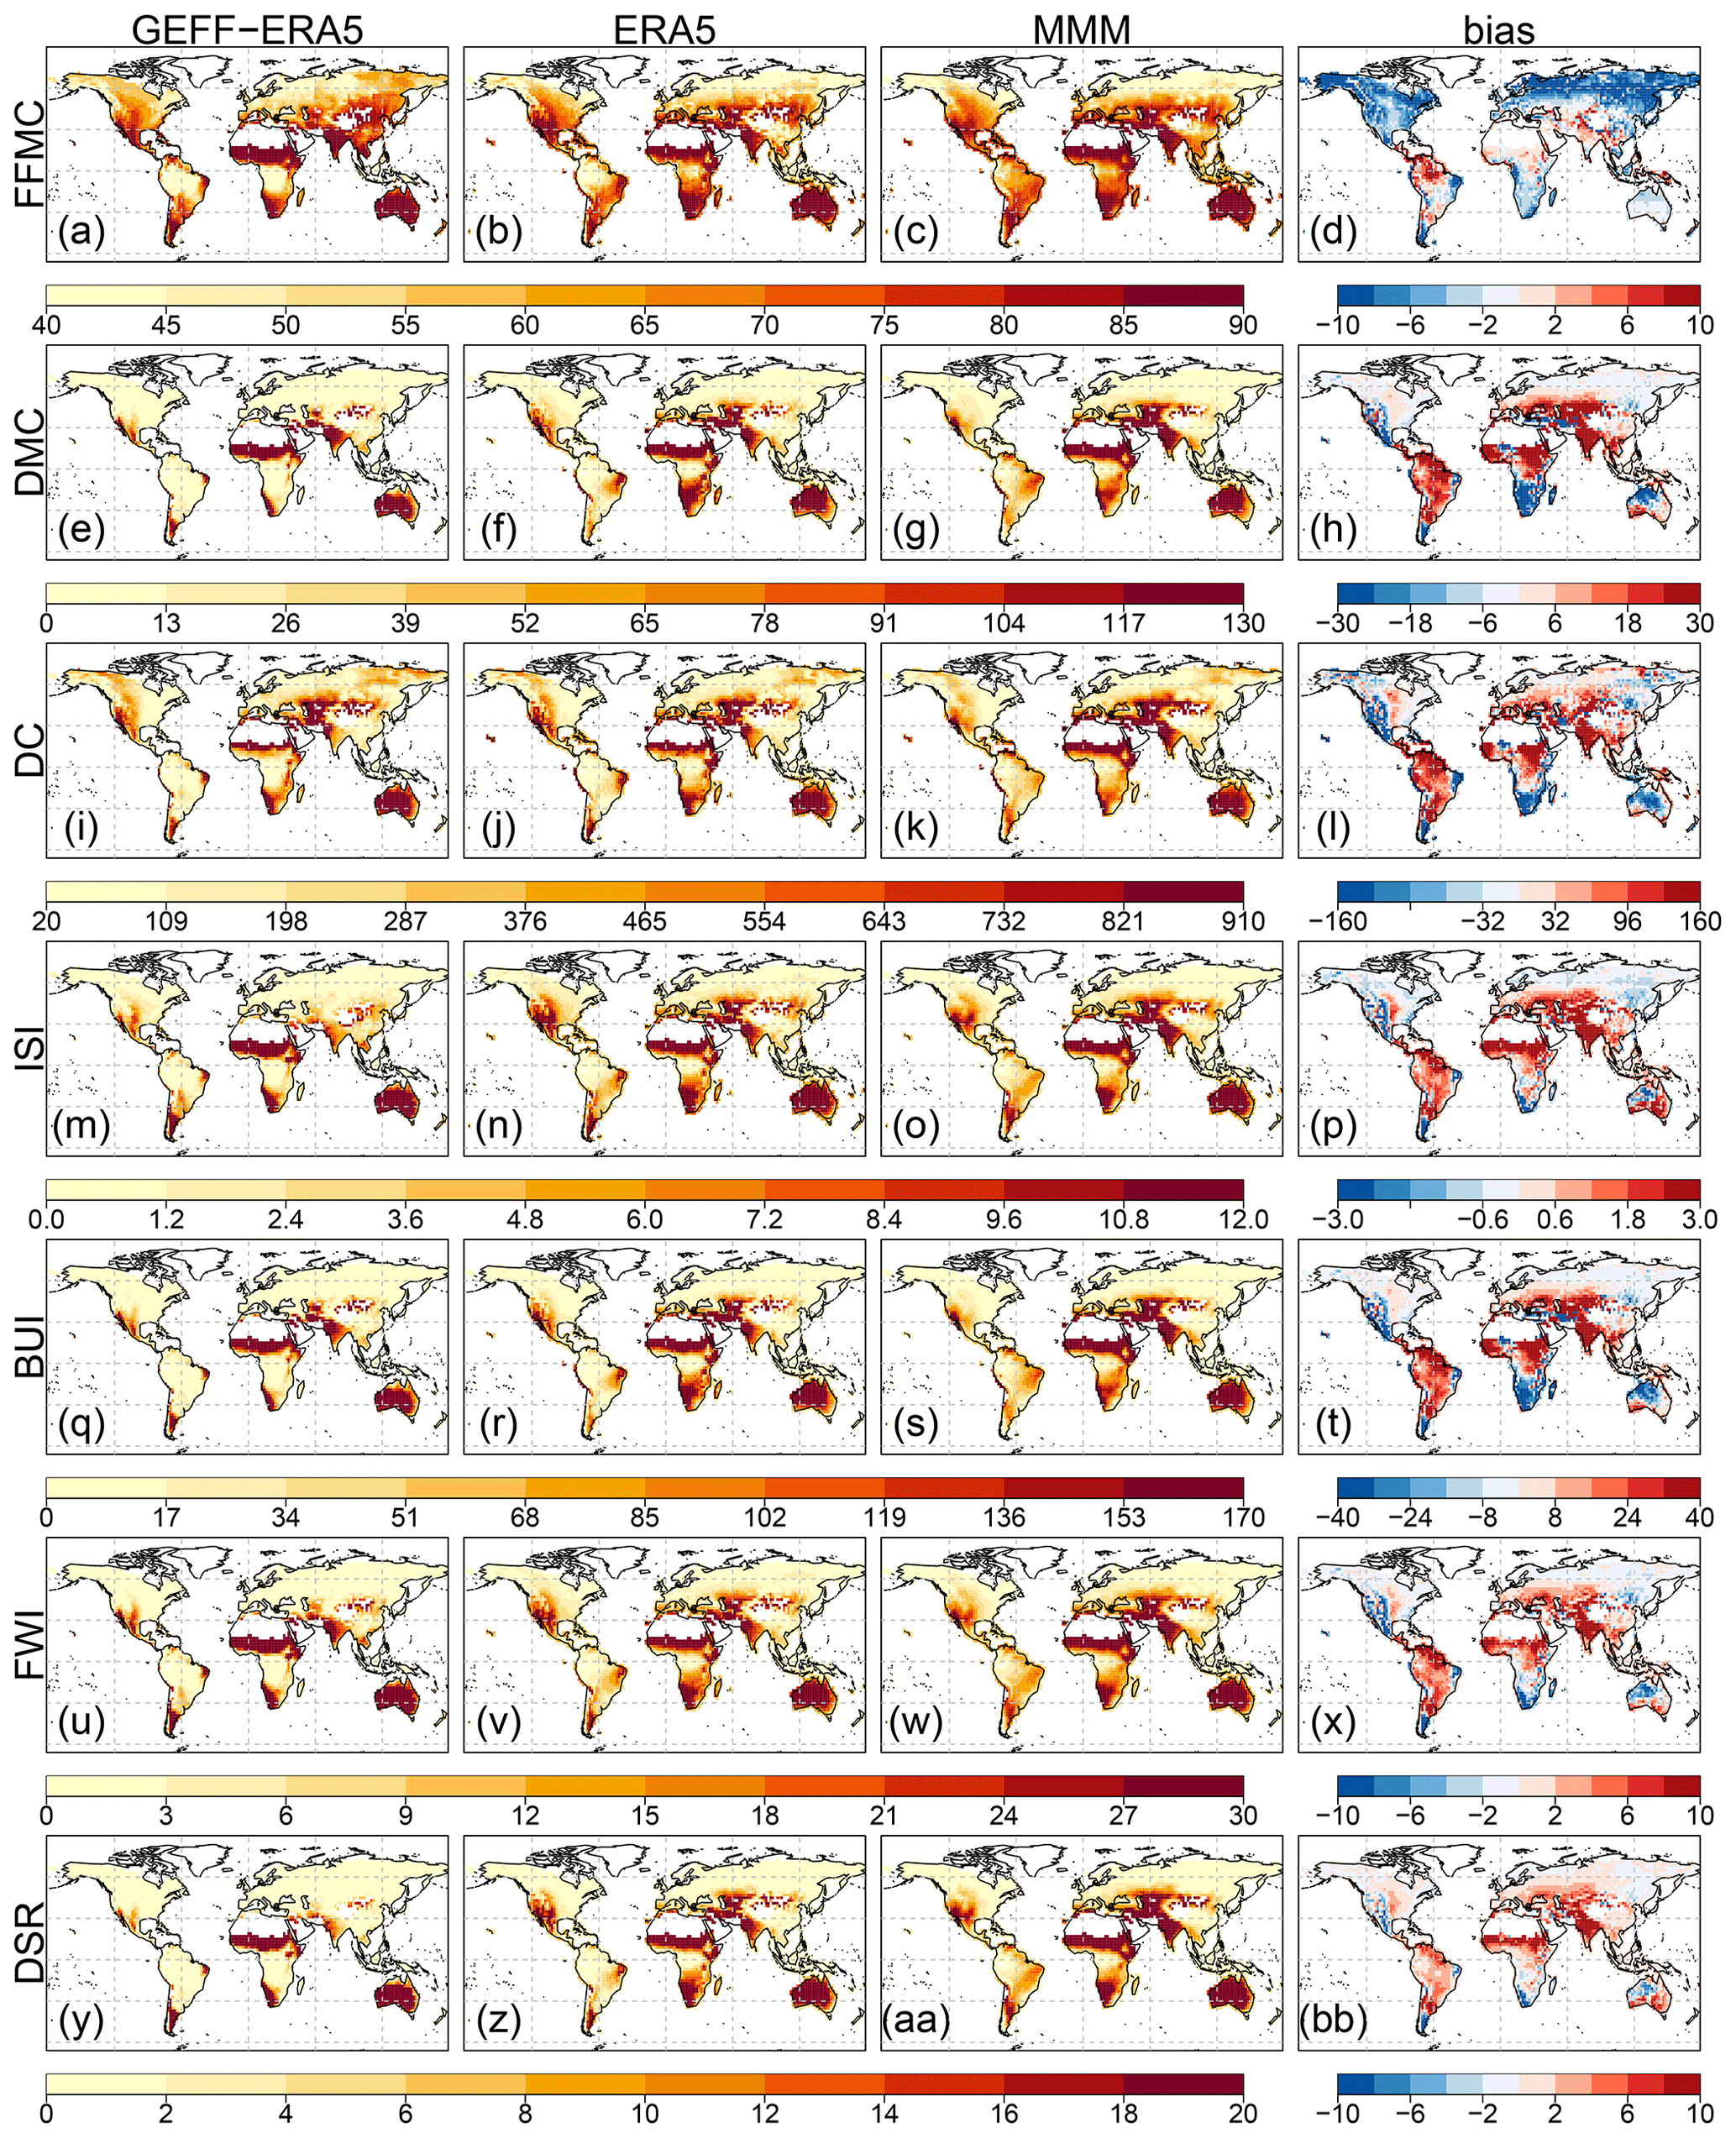
Figure 2Multi-annual monthly mean for GEFF-ERA5 (first column), ERA5 (second column) and the CMIP6 multi-model mean (third column), as well as bias in the CMIP6 multi-model mean with respect to ERA5 (fourth column) for FFMC (a–d), DMC (e–h), DC (i–l), ISI (m–p), BUI (q–t), FWI (u–x) and DSR (y–bb). The lighter yellow colour represents lower danger, and darker brown represents higher danger. Meanwhile, the white colour represents lower bias, and darker blue (red) higher negative (positive) bias.
The CMIP6 multi-model mean reproduces observed spatial patterns, i.e. regions where fire danger is the highest, reasonably well (Figs. 2 and 3). Nevertheless, compared to ERA5 data (Figs. 2 and 3; second column), there is a tendency for CMIP6 models to overestimate fire-prone weather conditions within the tropics, particularly in parts of South America, sub-Saharan Africa and southeast Asia (Figs. 2 and 3). There is also a general tendency for the CMIP6 multi-model mean to underestimate fire danger in South Africa, the western part of North America, some areas of the east of boreal Asia and Australia (Fig. 2h, l, t and x).
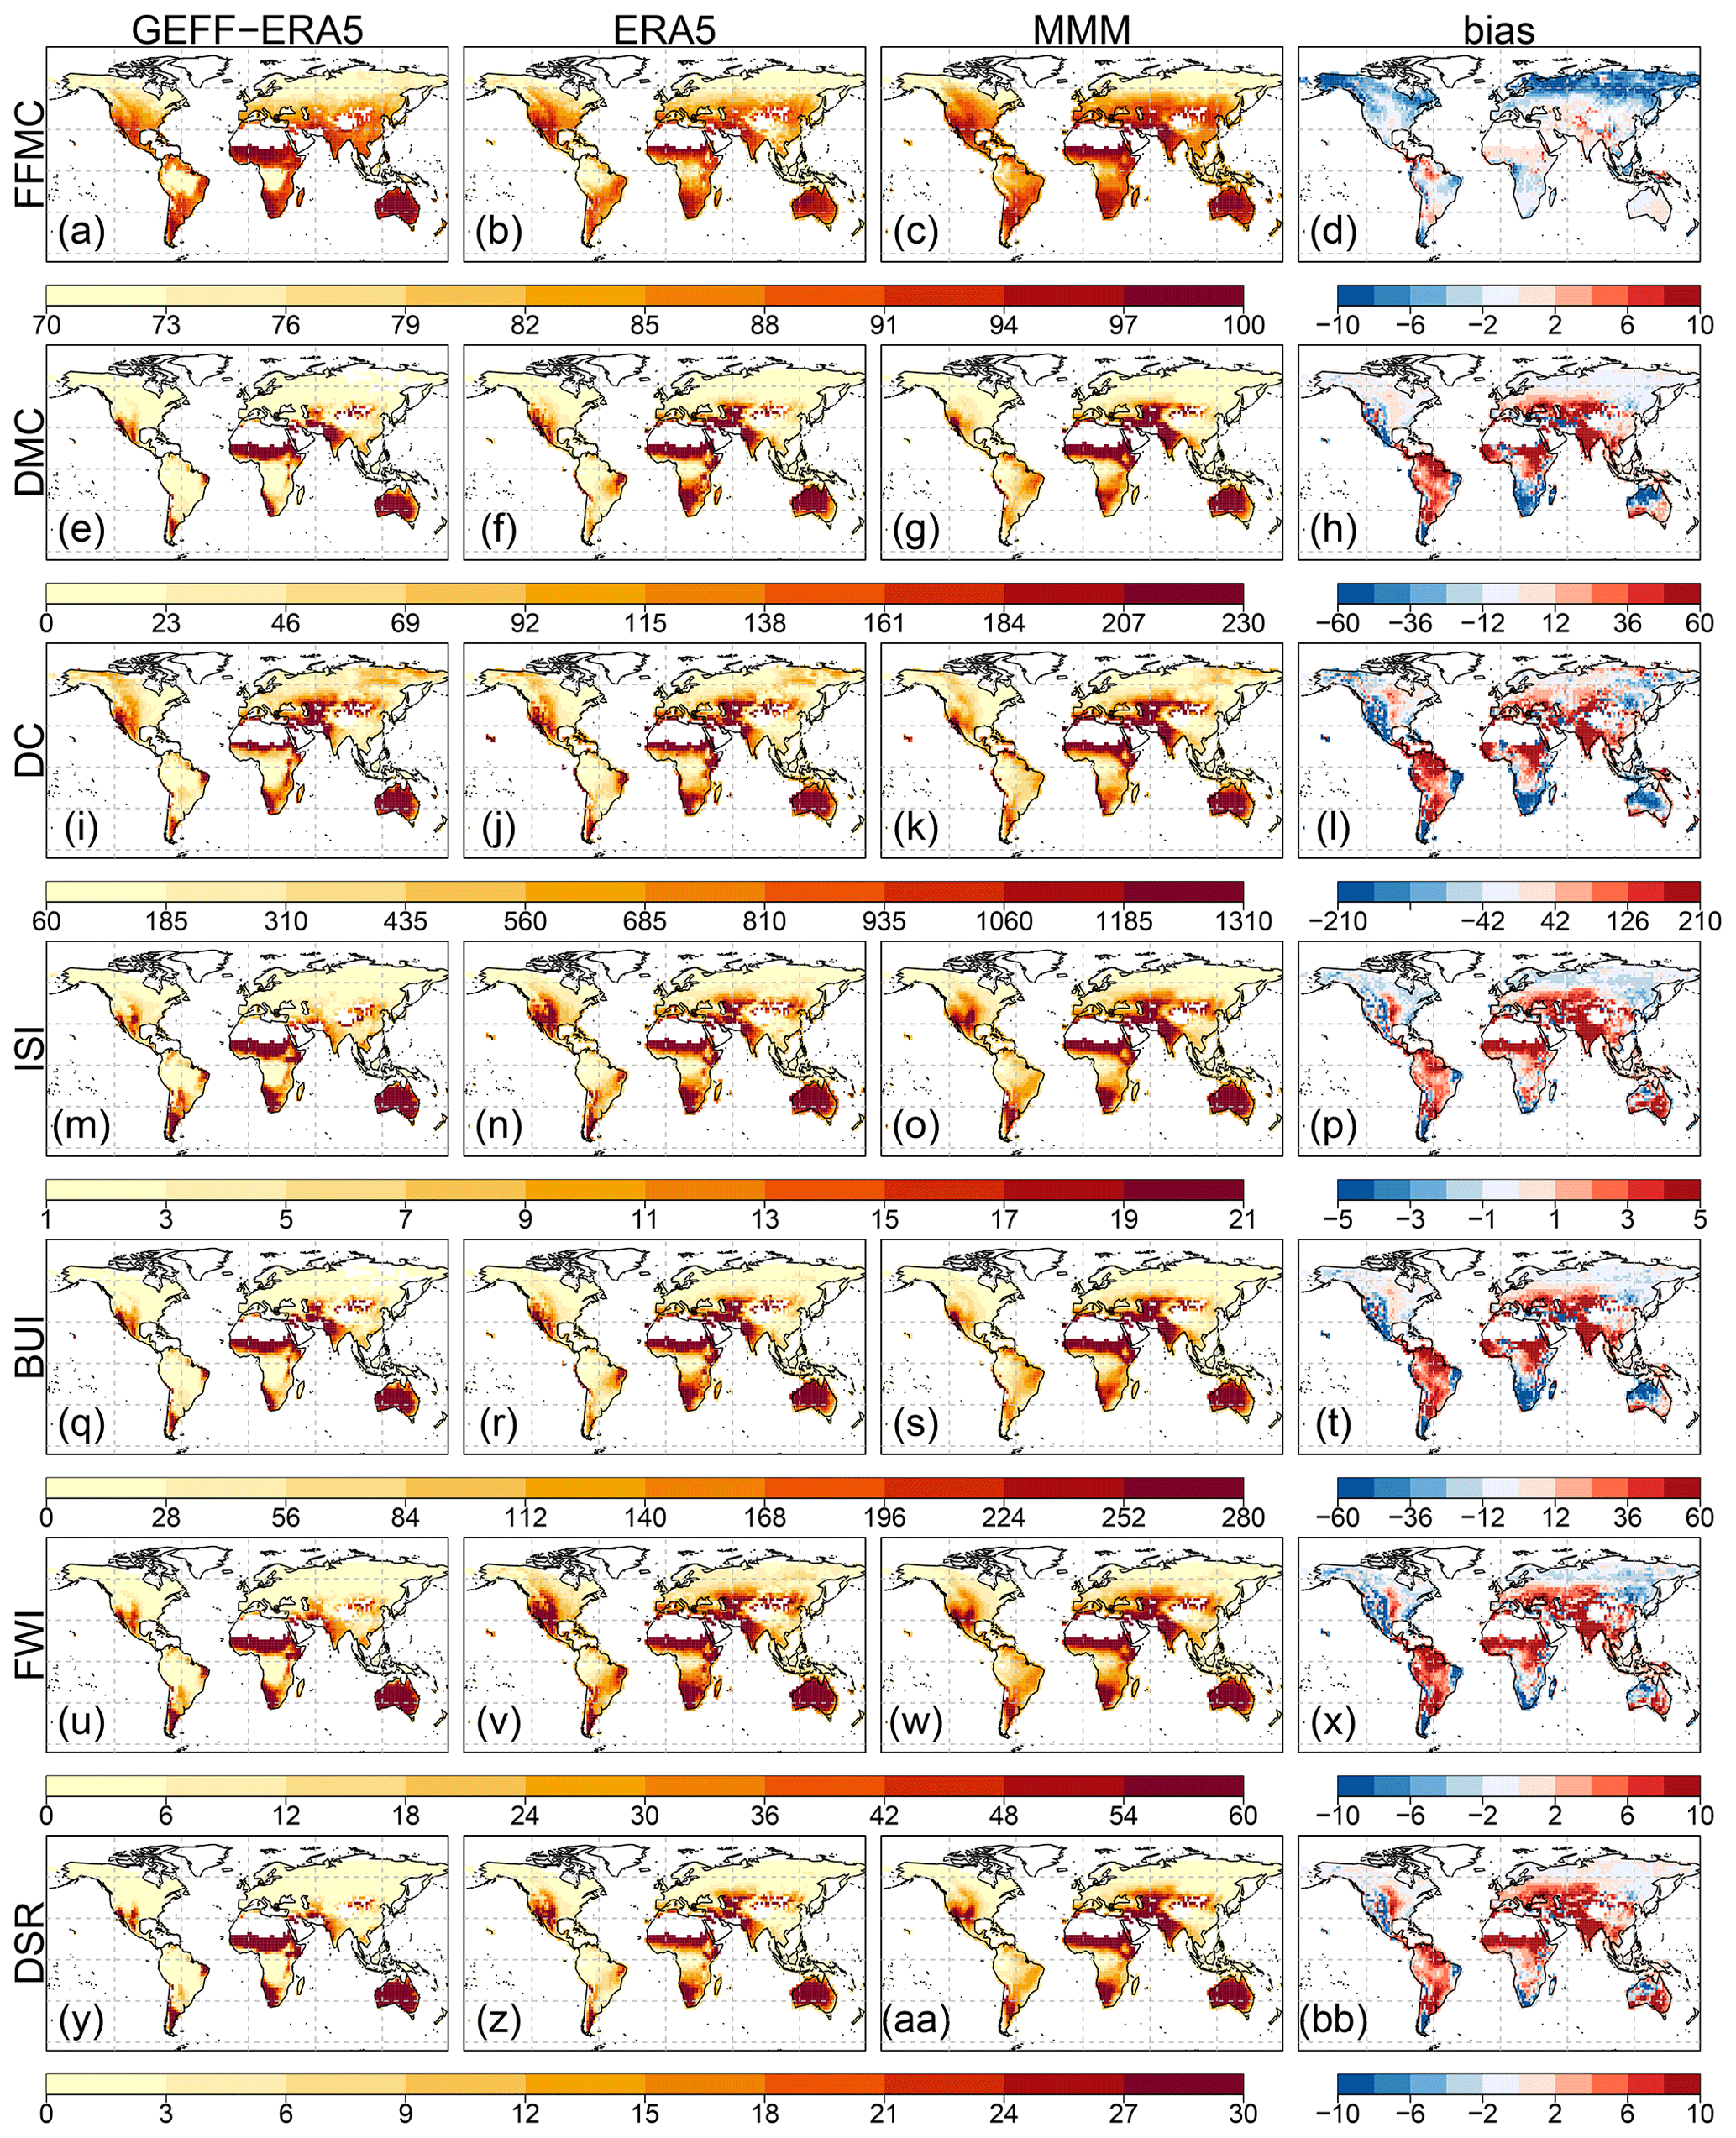
Figure 3Multi-annual monthly 90th percentile for GEFF-ERA5 (first column), ERA5 (second column) and the CMIP6 multi-model mean (third column), as well as bias in the CMIP6 multi-model mean with respect to ERA5 (fourth column) for FFMC (a–d), DMC (e–h), DC (i–l), ISI (m–p), BUI (q–t), FWI (u–x) and DSR (y–bb). The lighter yellow colour represents lower danger, and darker brown represents higher danger. Meanwhile, the white colour represents lower bias and darker blue (red) higher negative (positive) bias.
Regional contrasts are also identified in simulating the fire weather indicators. Looking at the indices describing the quantity of moisture contained by fire fuels, FFMC is overestimated in wet tropical and subtropical regions, such as South America, sub-Saharan Africa and India, for both the mean (Fig. 2d) and, to a lesser extent, the 90th percentile (Fig. 3d). Meanwhile, the same index is particularly underestimated in cold and temperate regions, such as North America, Europe and boreal Asia. DMC is overestimated in South America, sub-Saharan Africa and southeast Asia, while underestimations are found in northern Australia, the southwestern part of North America and southern Africa (Figs. 2h and 3h). DC is generally underestimated in Australia, southern Africa, the east of Central Asia, the western part of northern America and eastern Brazil, whereas overestimation appears in areas of South America, Central America, southeast and western part of Central Asia, southern Europe, and Africa for both the mean (Fig. 2l) and 90th percentile (Fig. 3l).
Regarding fire behaviour indices, ISI is generally well represented across the world, but the mean is overestimated in a number of regions, including southeast Asia, the Middle East, southern Europe, Central and South America, Africa, the greater part of Australia, and some central areas of temperate North America (Fig. 2p). By contrast, ISI is underestimated in some areas of Central Asia, temperate North America, the northern part of Australia, some areas in Brazil, and the southernmost parts of South America and South Africa (Fig. 2p). For BUI, areas of overestimation include South America, southeast Asia and Northern Hemisphere Africa, with underestimation apparent in Australia, the western part of central and temperate North America, and the southernmost parts of South America and South Africa (Fig. 2t). For FWI and DSR, there is a similar pattern as in the other CFWIS components. FWI and DSR are overestimated in southern Australia, southeast Asia, some areas of Central Asia, the Middle East, southern Europe, the Northern and Southern Hemisphere Africa, South and Central America, and the central area of temperate North America (Fig. 2x and bb). Meanwhile, FWI and DSR are underestimated in northern Australia, the western part of Central and temperate North America, southernmost South Africa and South America, eastern Brazil, and some areas of Central Asia (Fig. 2x and bb). In the case of FWI, this underestimation is more widespread in North America and eastern boreal and Central Asia (Fig. 2x).
The biases are driven by multi-model representation of the four meteorological components required as input for the CFWIS indicators: daily values for maximum temperature, mean wind speed, minimum relative humidity and total precipitation. The representation of these fields in ERA5 and CMIP6 is shown in Fig. S1 in the Supplement. Biases are apparent in all four fields, most strikingly in the representation of relative humidity in the Northern Hemisphere (Fig. S1i). However, cooler maximum temperatures in boreal Eurasia (Fig. S1c) do not appear to have an impact on the representation of fire weather (Figs. 2 and 3; fourth column). Overestimation of precipitation in southern Africa (Fig. S1f) may be responsible for an underrepresentation of DC and DMC in particular (Figs. 2 and 3; fourth column).
3.2 Seasonality in multi-model biases
As model bias could exhibit strong seasonal and regional dependencies, we examine how CMIP6 models perform throughout the year for each of the 14 GFED fire regions in Fig. 4. As for Sect. 3.1, model performances are assessed by quantifying the model discrepancy with respect to ERA5. Throughout the year, the results support those already determined from Figs. 2 and 3. CMIP6-simulated CFWIS components generally agree with ERA5 in boreal and temperate North America (BONA and TENA; Fig. 4a and b), South Hemisphere Africa (SHAF; Fig. 4i), and Australia (AUST; Fig. 4n). However, CMIP6 overestimation is found in South America (Fig. 4d and e), as well as southeast and equatorial Asia, (Fig. 4l and m) and, to a lesser extent, Northern Hemisphere Africa (Fig. 4h) and Europe (Fig. 4f) for all CFWIS components, except for FFMC.
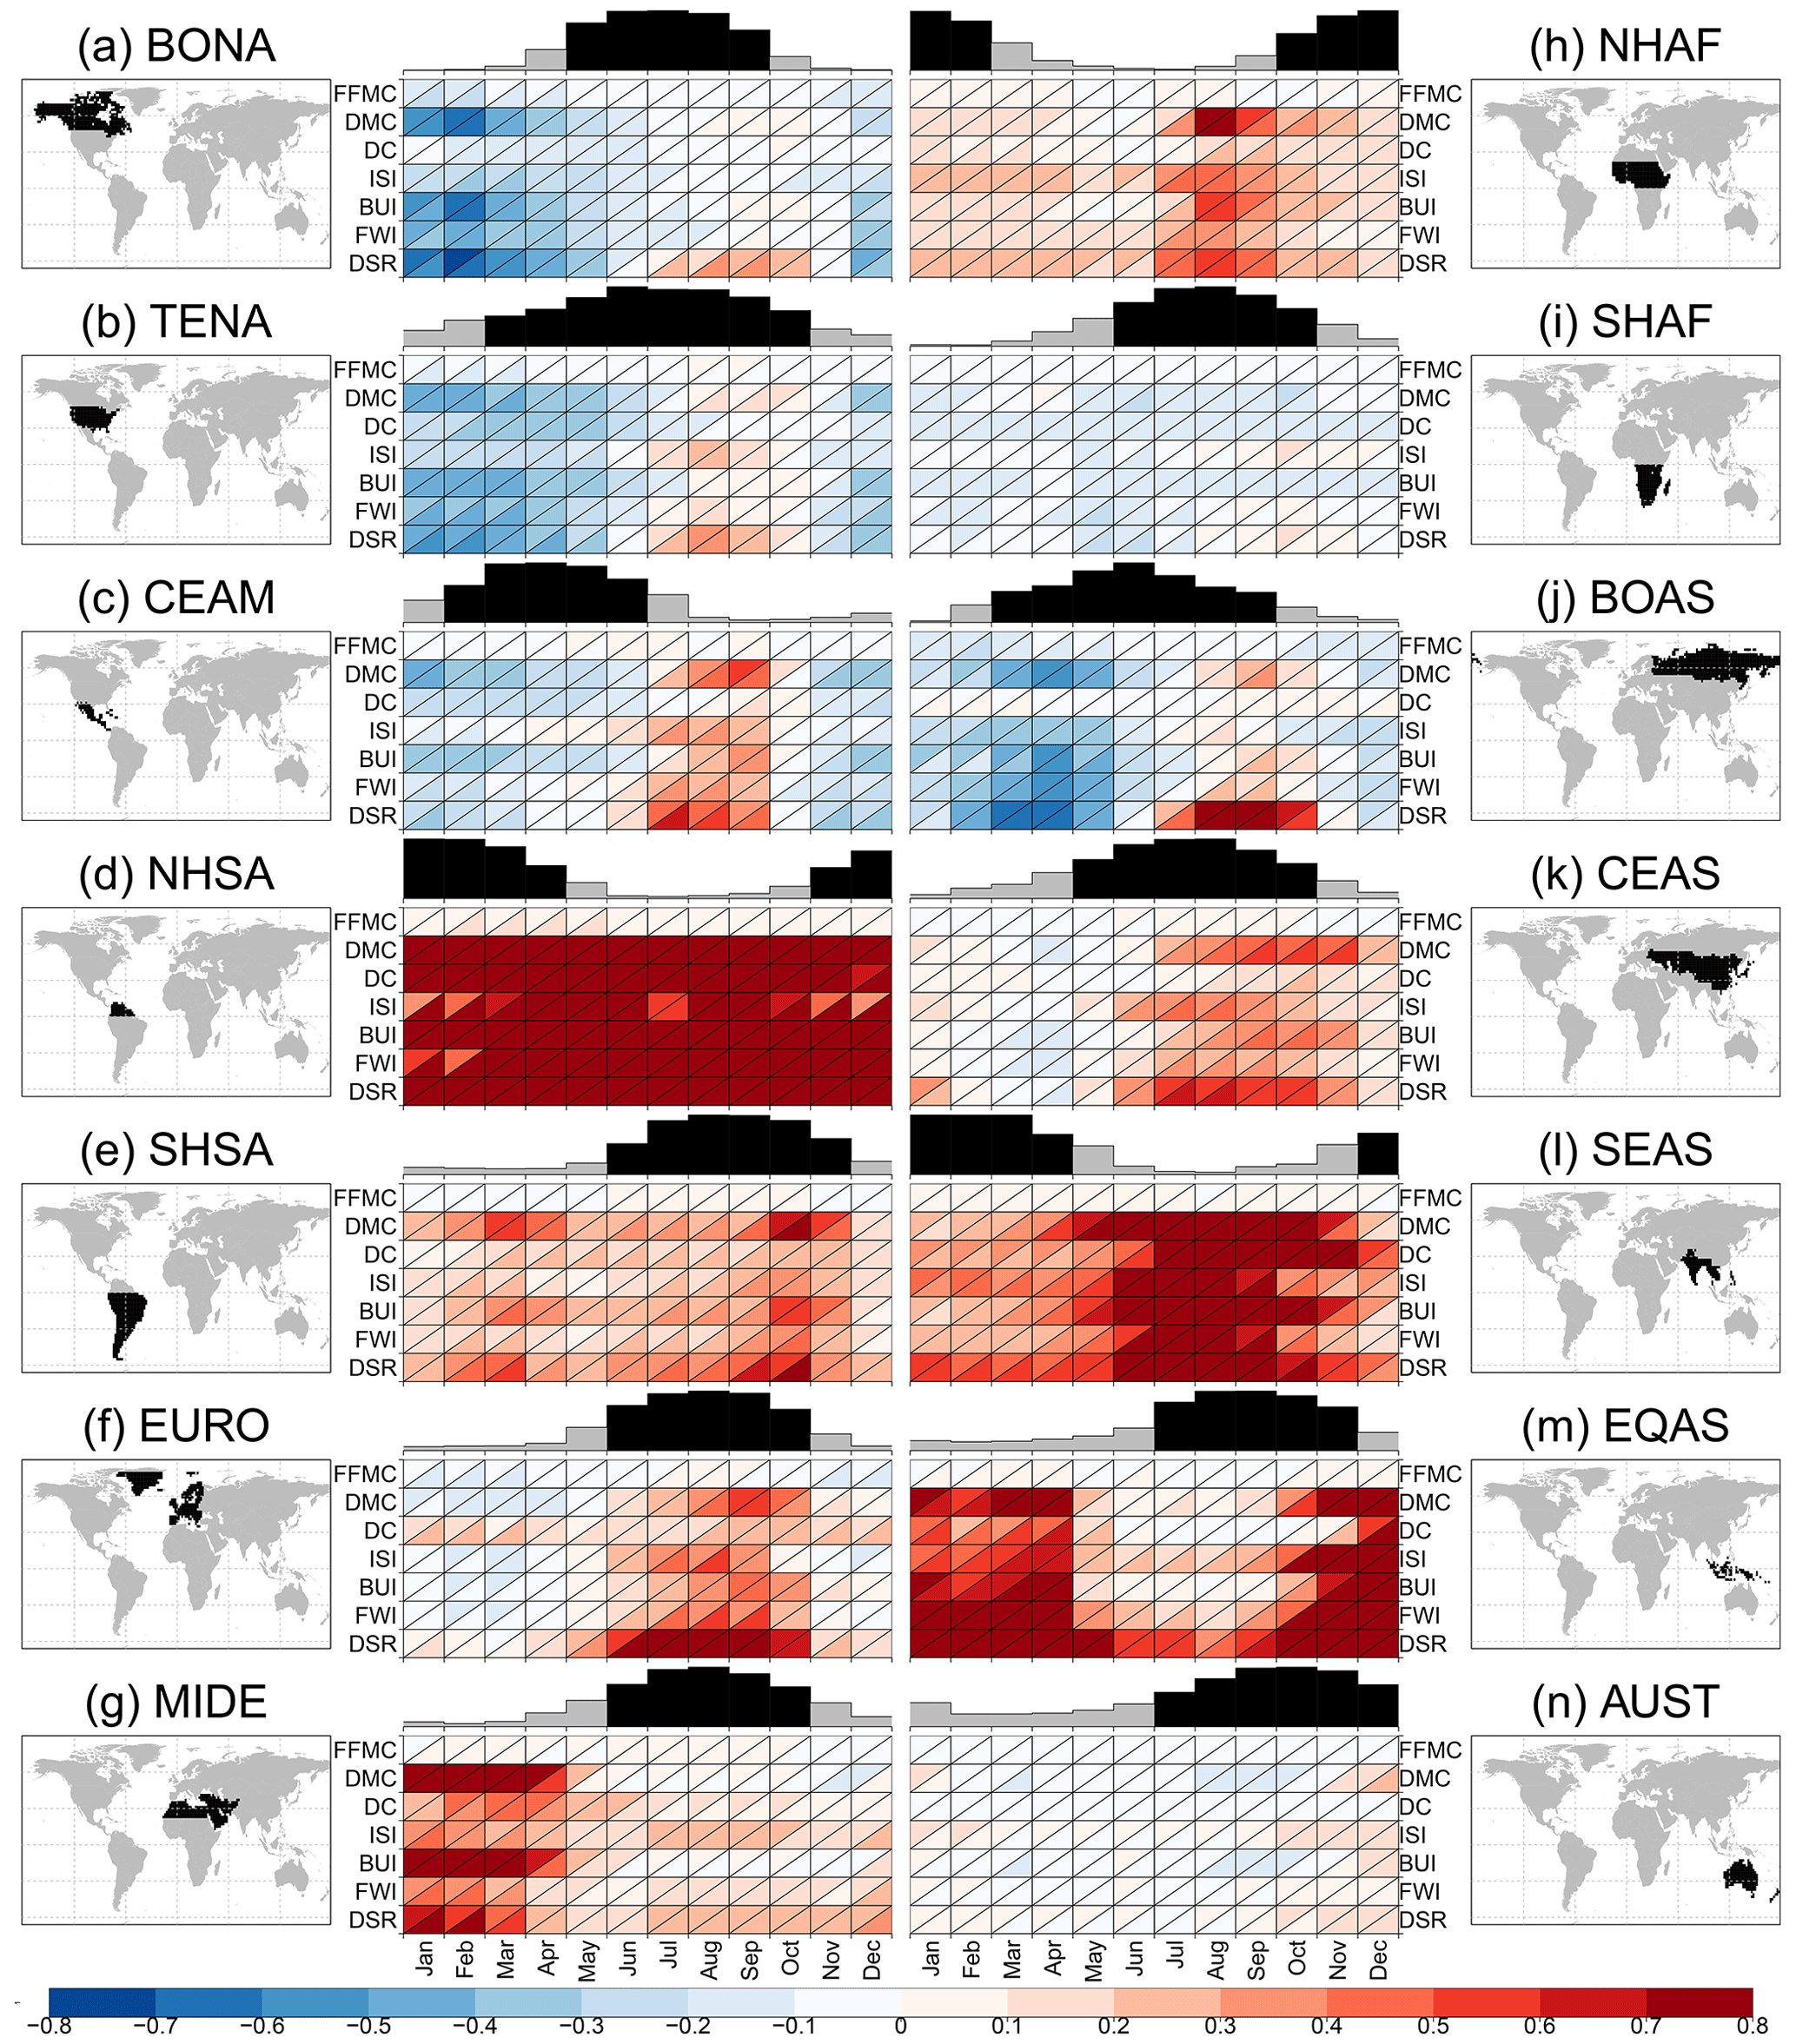
Figure 4Bias in monthly means and 90th percentiles in seven CFWIS components simulated by the CMIP6 multi-model mean with respect to ERA5 across 14 GFED fire regions: (a) boreal North America (BONA), (b) temperate North America (TENA), (c) Central America (CEAM), (d) Northern Hemisphere South America (NHSA), (e) Southern Hemisphere South America (SHSA), (f) Europe (EURO), (g) the Middle East (MIDE), (h) Northern Hemisphere Africa (NHAF), (i) Southern Hemisphere Africa (SHAF), (j) boreal Asia (BOAS), (k) Central Asia (CEAS), (l) southeast Asia (SEAS), (m) equatorial Asia (EQAS), and (n) Australia and New Zealand (AUST). Results show overall model performance, with blue shading indicating underestimation and red shading overestimation. The lower-right triangle represents the monthly mean and the upper-left triangle the monthly 90th percentile. Bar plots show the average monthly burned area for each GFED region, represented as a fraction of the monthly maximum. Black bars highlight months that constitute the fire season, defined as those months for which the average burned area is greater than 50 % of the monthly maximum.
There are some clear seasonal differences in model performances. In boreal North America (BONA) and boreal Asia (BOAS), several CFWIS components, including DMC, BUI, FWI and DSR, are underestimated during the first half of the year, then the rest of the year agrees quite well with ERA5, except for DSR that is overestimated from July to October (Fig. 4a and j). Biases for Central America (CEAM) vary during the year, with higher positive biases from July to September and a general underestimation from November to May (Fig. 4c). In the Middle East (MIDE) region, model biases are positive; however, they present lower values during the fire season and higher values from January to April for all indicators except for FFMC (Fig. 4g).
Looking at the regions with lower bias, in temperate North America (TENA), CFWIS components show good agreement overall, with moderate underestimation evident from December to May and moderate overestimation evident from July to October (Fig. 4b). CMIP6 performance is strong for all CFWIS components in Southern Hemisphere Africa (SHAF), showing marginal underestimation for most indicators and some slight overestimation for ISI, FWI and DSR from August to November (Fig. 4i). In Australia (AUST), CMIP6-simulated CFWIS components show good performances (Fig. 4n), with the lowest negative bias in FFMC, and the rest of the indicators show a low negative bias, except for November–February where biases are positive. In Central Asia (CEAS), the CMIP6 ensemble generally agrees with ERA5 data but exhibits overestimation from June to November, representing most of the fire season (Fig. 4k).
The rest of the regions present positive and higher bias, FFMC being the component with lower values. In Northern Hemisphere South America (NHSA), CFWIS components present a very large positive bias throughout the year, with lower values for FFMC, especially for the 90th percentile (Fig. 4d). In Southern Hemisphere South America (SHSA), indicators also show positive biases, especially in DMC, BUI and DSR (Fig. 4e), which are, however, lower than in NHSA. In Europe (EURO), most simulated indices (DMC, ISI, BUI, FWI, DSR) are especially overestimated compared to observations from June to October, which exactly represents the fire season (Fig. 4f). Similarly, biases in simulating CFWIS components in Northern Hemisphere Africa (NHAF) are generally positive (Fig. 4h). Lastly, in both southeast (SEAS) and equatorial Asia (EQAS) (Fig. 4l and m), model biases are large and positive throughout the year, in particular in the months of the fire season in SEAS (May to November) and from October to April in EQAS.
3.3 Evaluation of inter-model performance
As shown in Sect. 3.1 and 3.2, the CMIP6 multi-model ensemble shows overall good agreement with ERA5 in terms of spatial patterns for both the mean and 90th percentile. In this section, the focus is thus given to the performance of each CMIP6 model to simulate CFWIS components at both global and regional scales. This evaluation is again applied to simulated mean and 90th percentile values for all CFWIS components and is based on spatial correlation, the normalised root mean squared error (RMSE), and the ratio of the observed and simulated standard deviations, which are summarised using Taylor diagrams (Figs. 5 and 6).
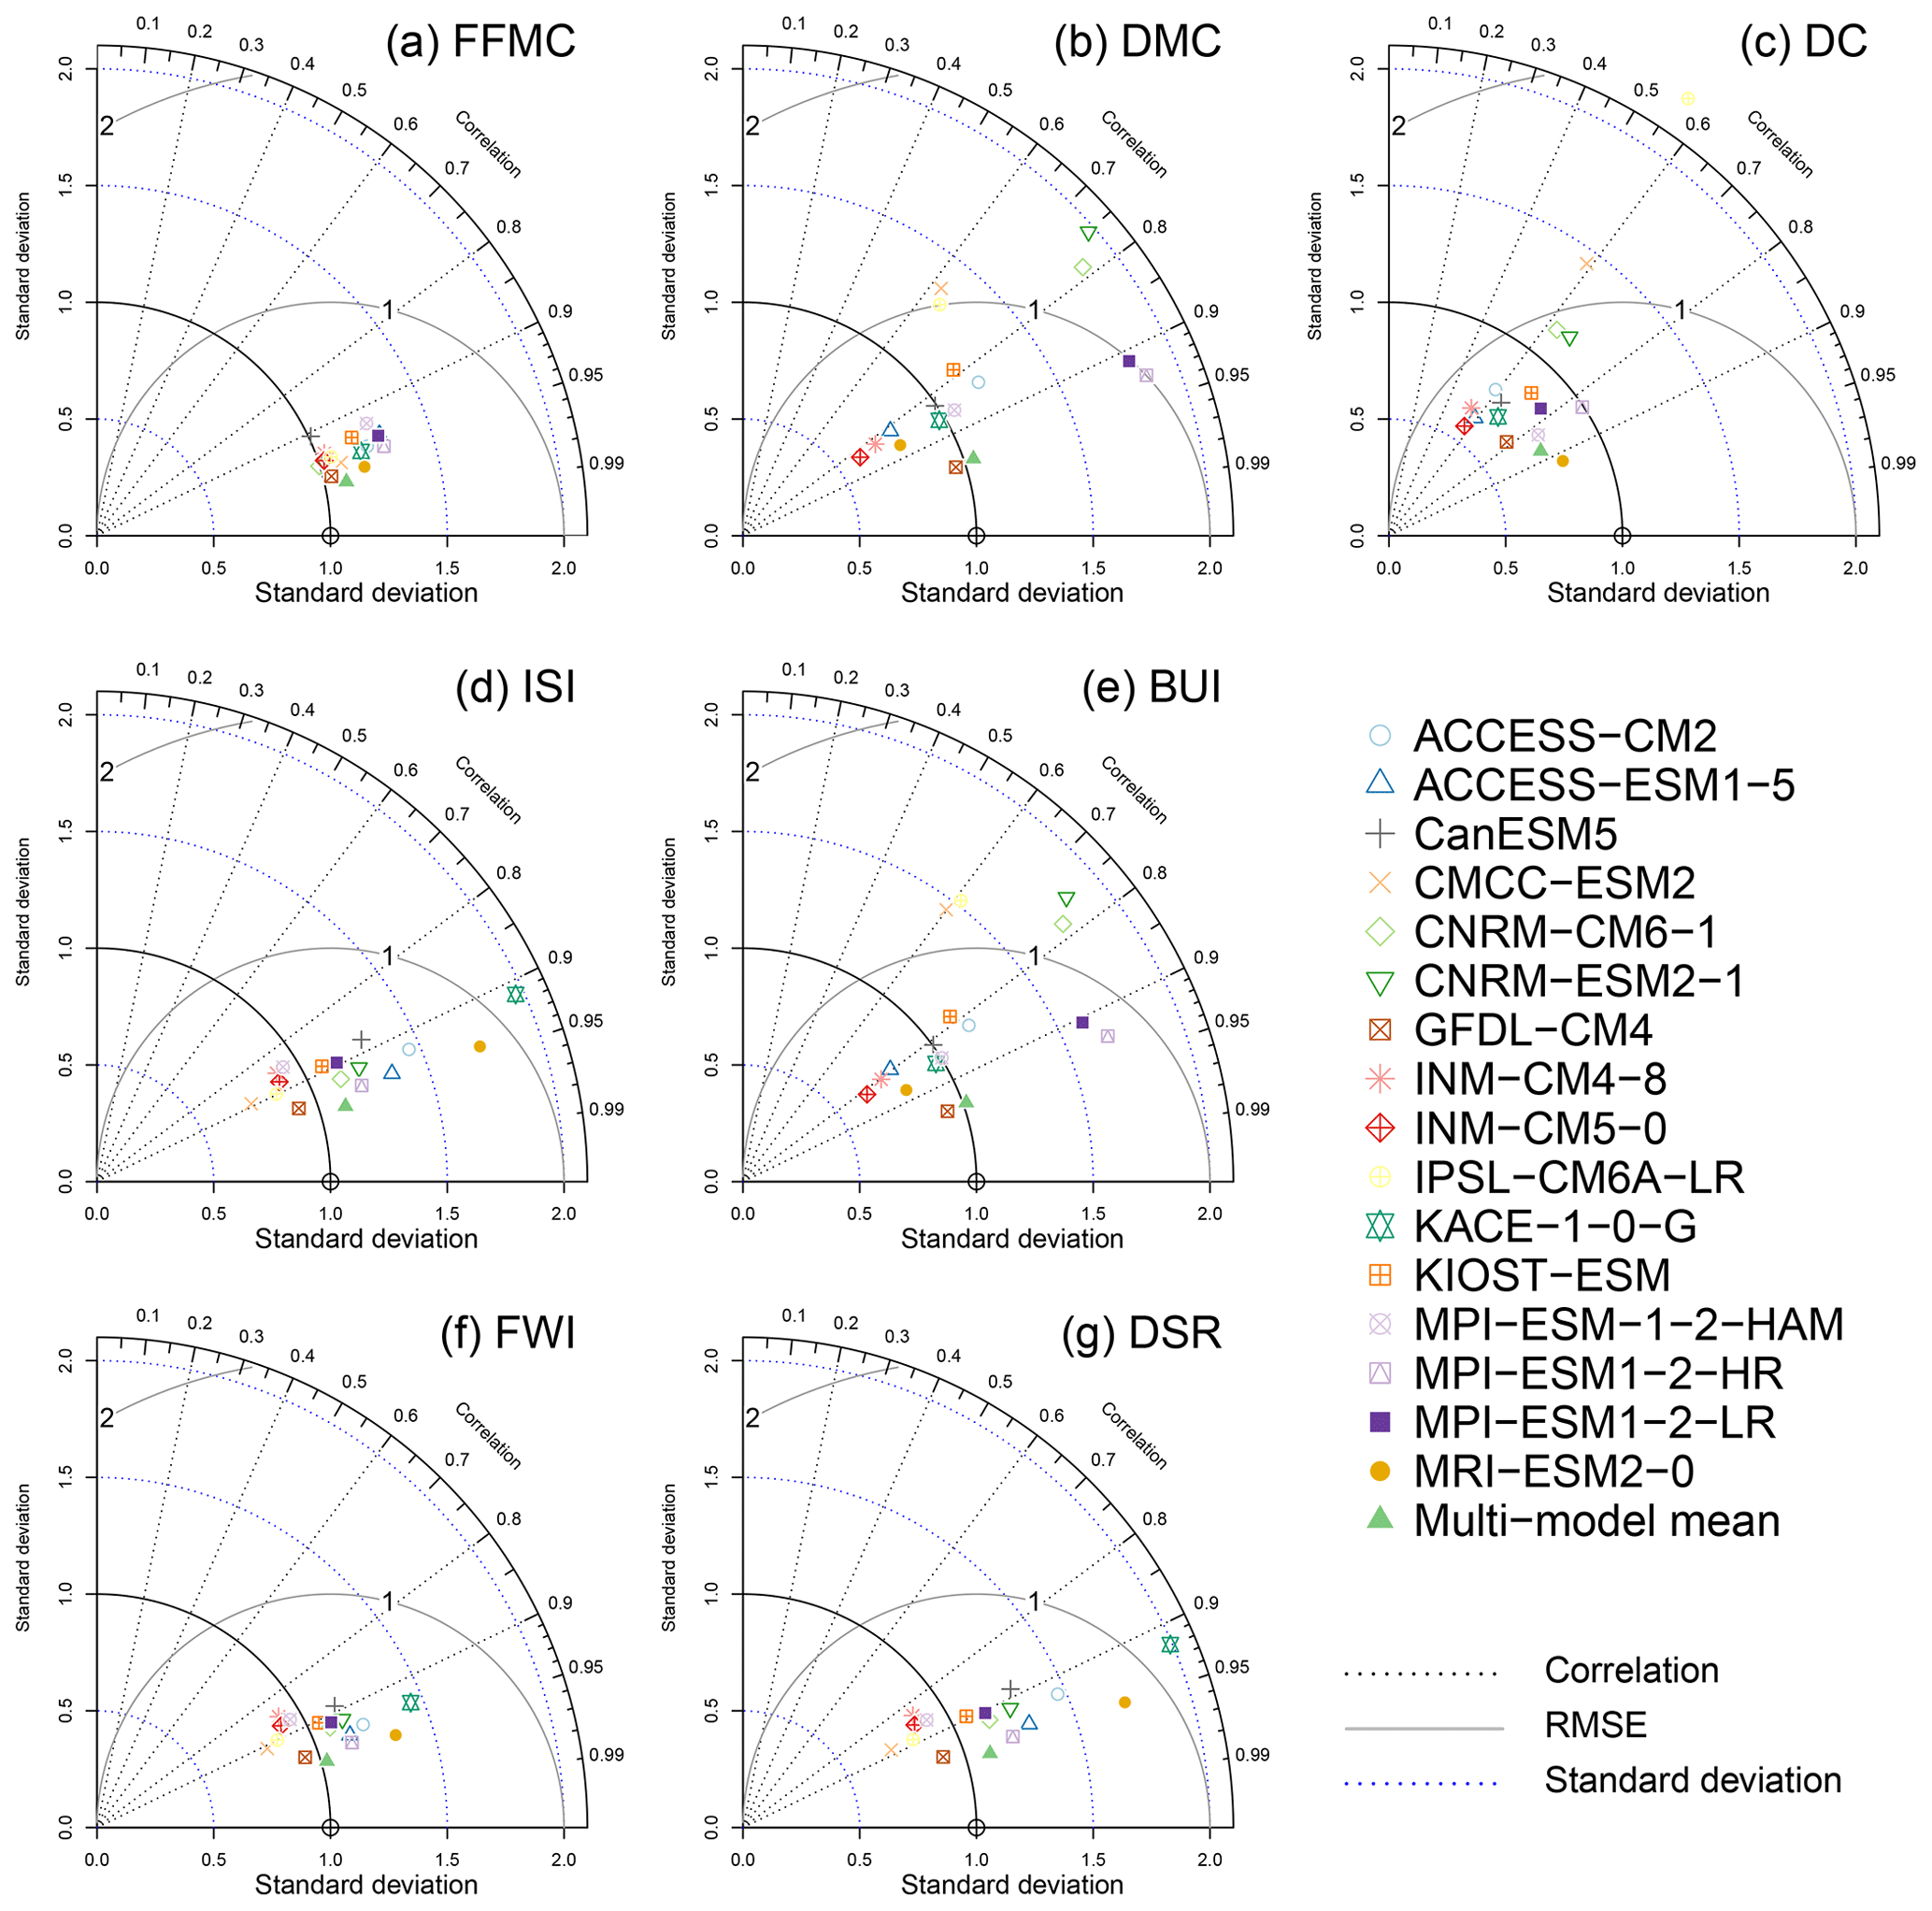
Figure 5Taylor diagrams showing the capacity of 16 CMIP6 models to simulate annual means in the seven CFWIS indices. The correlation coefficient is plotted in relation to the polar axis, the normalised RMSE in relation to the internal circular axis and the normalised standard deviation in relation to the horizontal axis. ERA5 is represented by an empty dot on the horizontal axis.
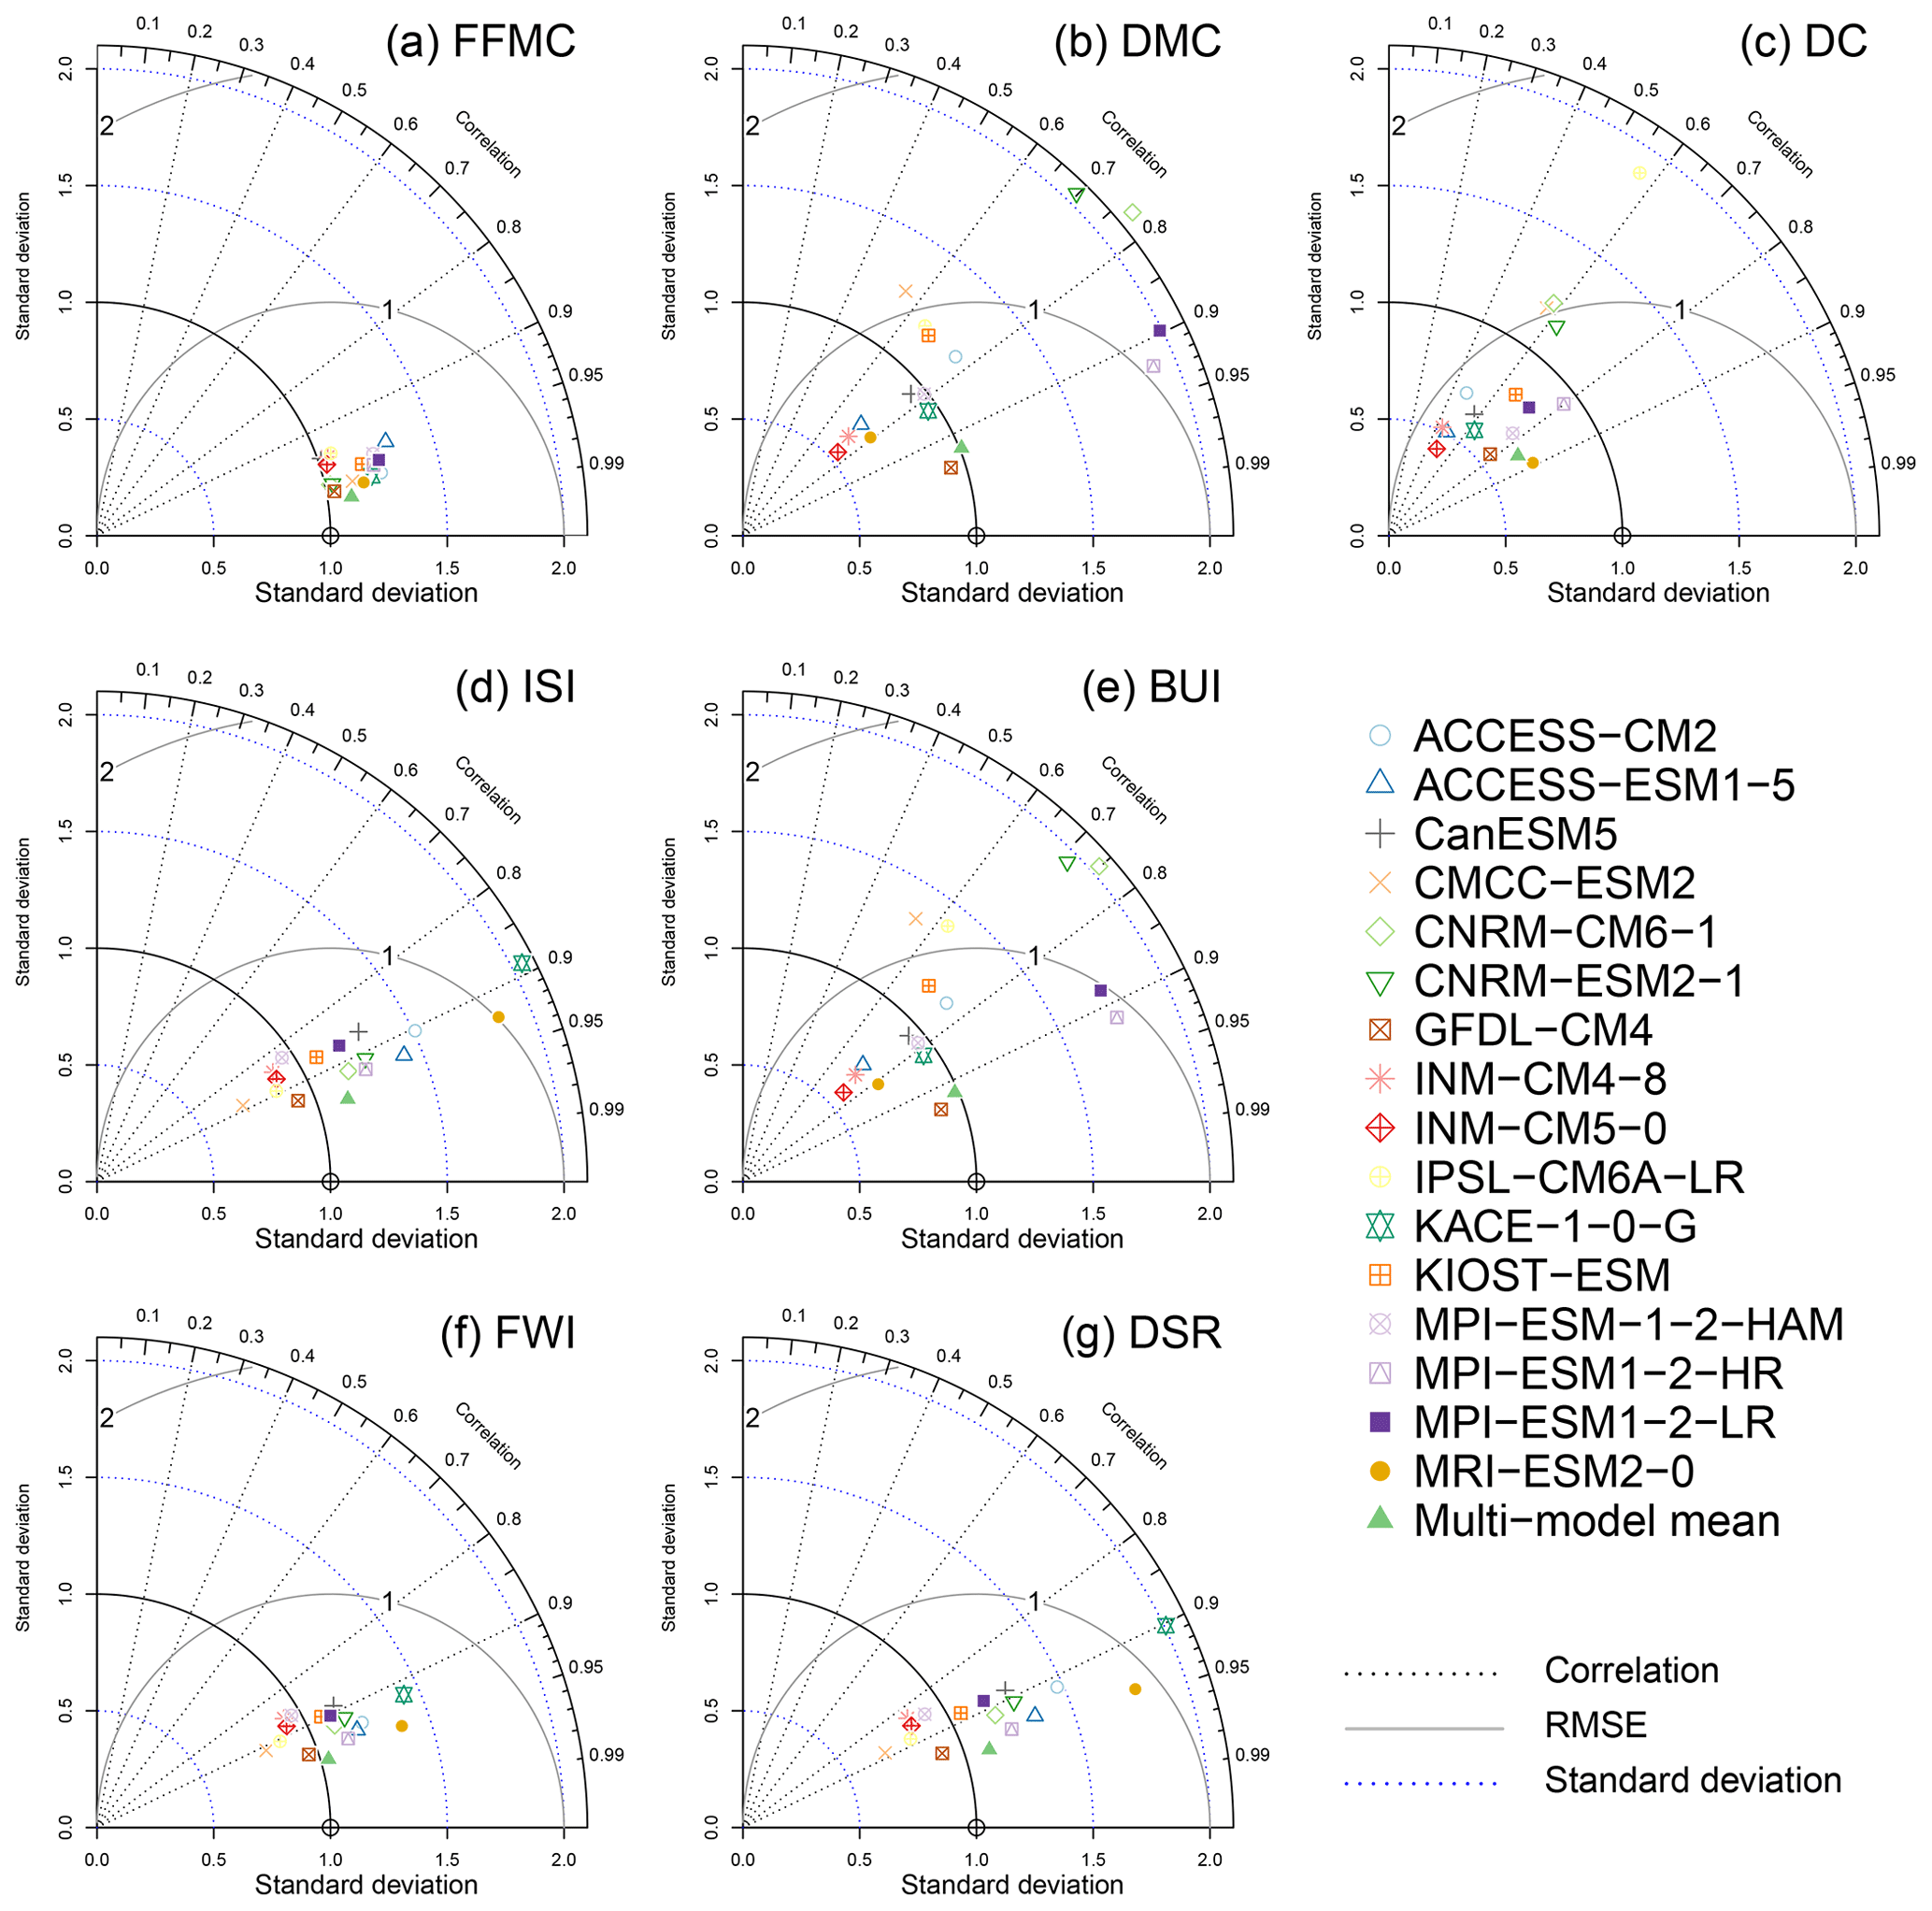
Figure 6Taylor diagrams showing the capacity of 16 CMIP6 models to simulate annual 90th percentiles in the seven CFWIS indices. The correlation coefficient is plotted in relation to the polar axis, the normalised RMSE in relation to the internal circular axis and the normalised standard deviation in relation to the horizontal axis. ERA5 is represented by an empty dot on the horizontal axis.
At the global scale, the representations of DMC, DC and BUI present similar patterns, with greater inter-model variability and thus greater uncertainty than the other indices, for both monthly mean (Fig. 5b, c and e) and 90th percentile annual values (Fig. 6b, c and e). Inter-model variability and uncertainty are smaller for FFMC, ISI, FWI and DSR (Figs. 5 and 6a, d, f and g), for which most models reproduce spatial patterns reasonably well, with a normalised RMSE around 0.5 and a correlation ranging from 0.80 to 0.96.
Looking at the different indicators individually, model performance varies greatly from one indicator to another. For FFMC, the best-performing models are GFDL-CM4, CNRM-CM6-1 and INM-CM5-0, while the poorest performances are found in the MPI group of models (Fig. 5a). The models best representing DMC and BUI are GFDL-CM4, KACE-1-0-G and MPI-ESM-1-2-HAM (Fig. 5b and e). By contrast, the CNRM, MPI-M and CMCC models show poor performances in simulating these two indicators (Fig. 5b and e). DC is well reproduced by MPI-ESM1-2-HR, MRI-ESM2-0 and MPI-ESM-1-2-HAM, while the models IPSL-CM6A-LR and CMCC-ESM2 show poorer skill (Fig. 5c). Finally, for ISI, FWI and DSR, the models with the best skill are GFDL-CM4 and MPI-ESM1-2-HR, and the models with poorer performance are KACE-1-0-G and MRI-ESM2-0 (Fig. 5d, g and f). GFDL-CM4 is an example of a model that performs well for all CFWIS components (Fig. 5).
Regarding the 90th percentile over the different CFWIS components (Fig. 6), individual model performance varies slightly, but patterns of models across regions remain very similar to the fire season mean simulations (Fig. 5).
The CMIP6 ensemble mean results show considerable regional dependencies, and one would expect such differences to be apparent in the performance of individual models. To understand and quantify the relative performance of each model, Fig. 7 details the same set of spatial correlation, normalised RMSE and standard deviation ratio shown in Figs. 5 and 6, this time for each of the 14 GFED regions. Unlike the global analysis shown in Figs. 5 and 6, the results in Fig. 7 only consider the corresponding fire season of each region based on historical burned area (as determined in Fig. 4).
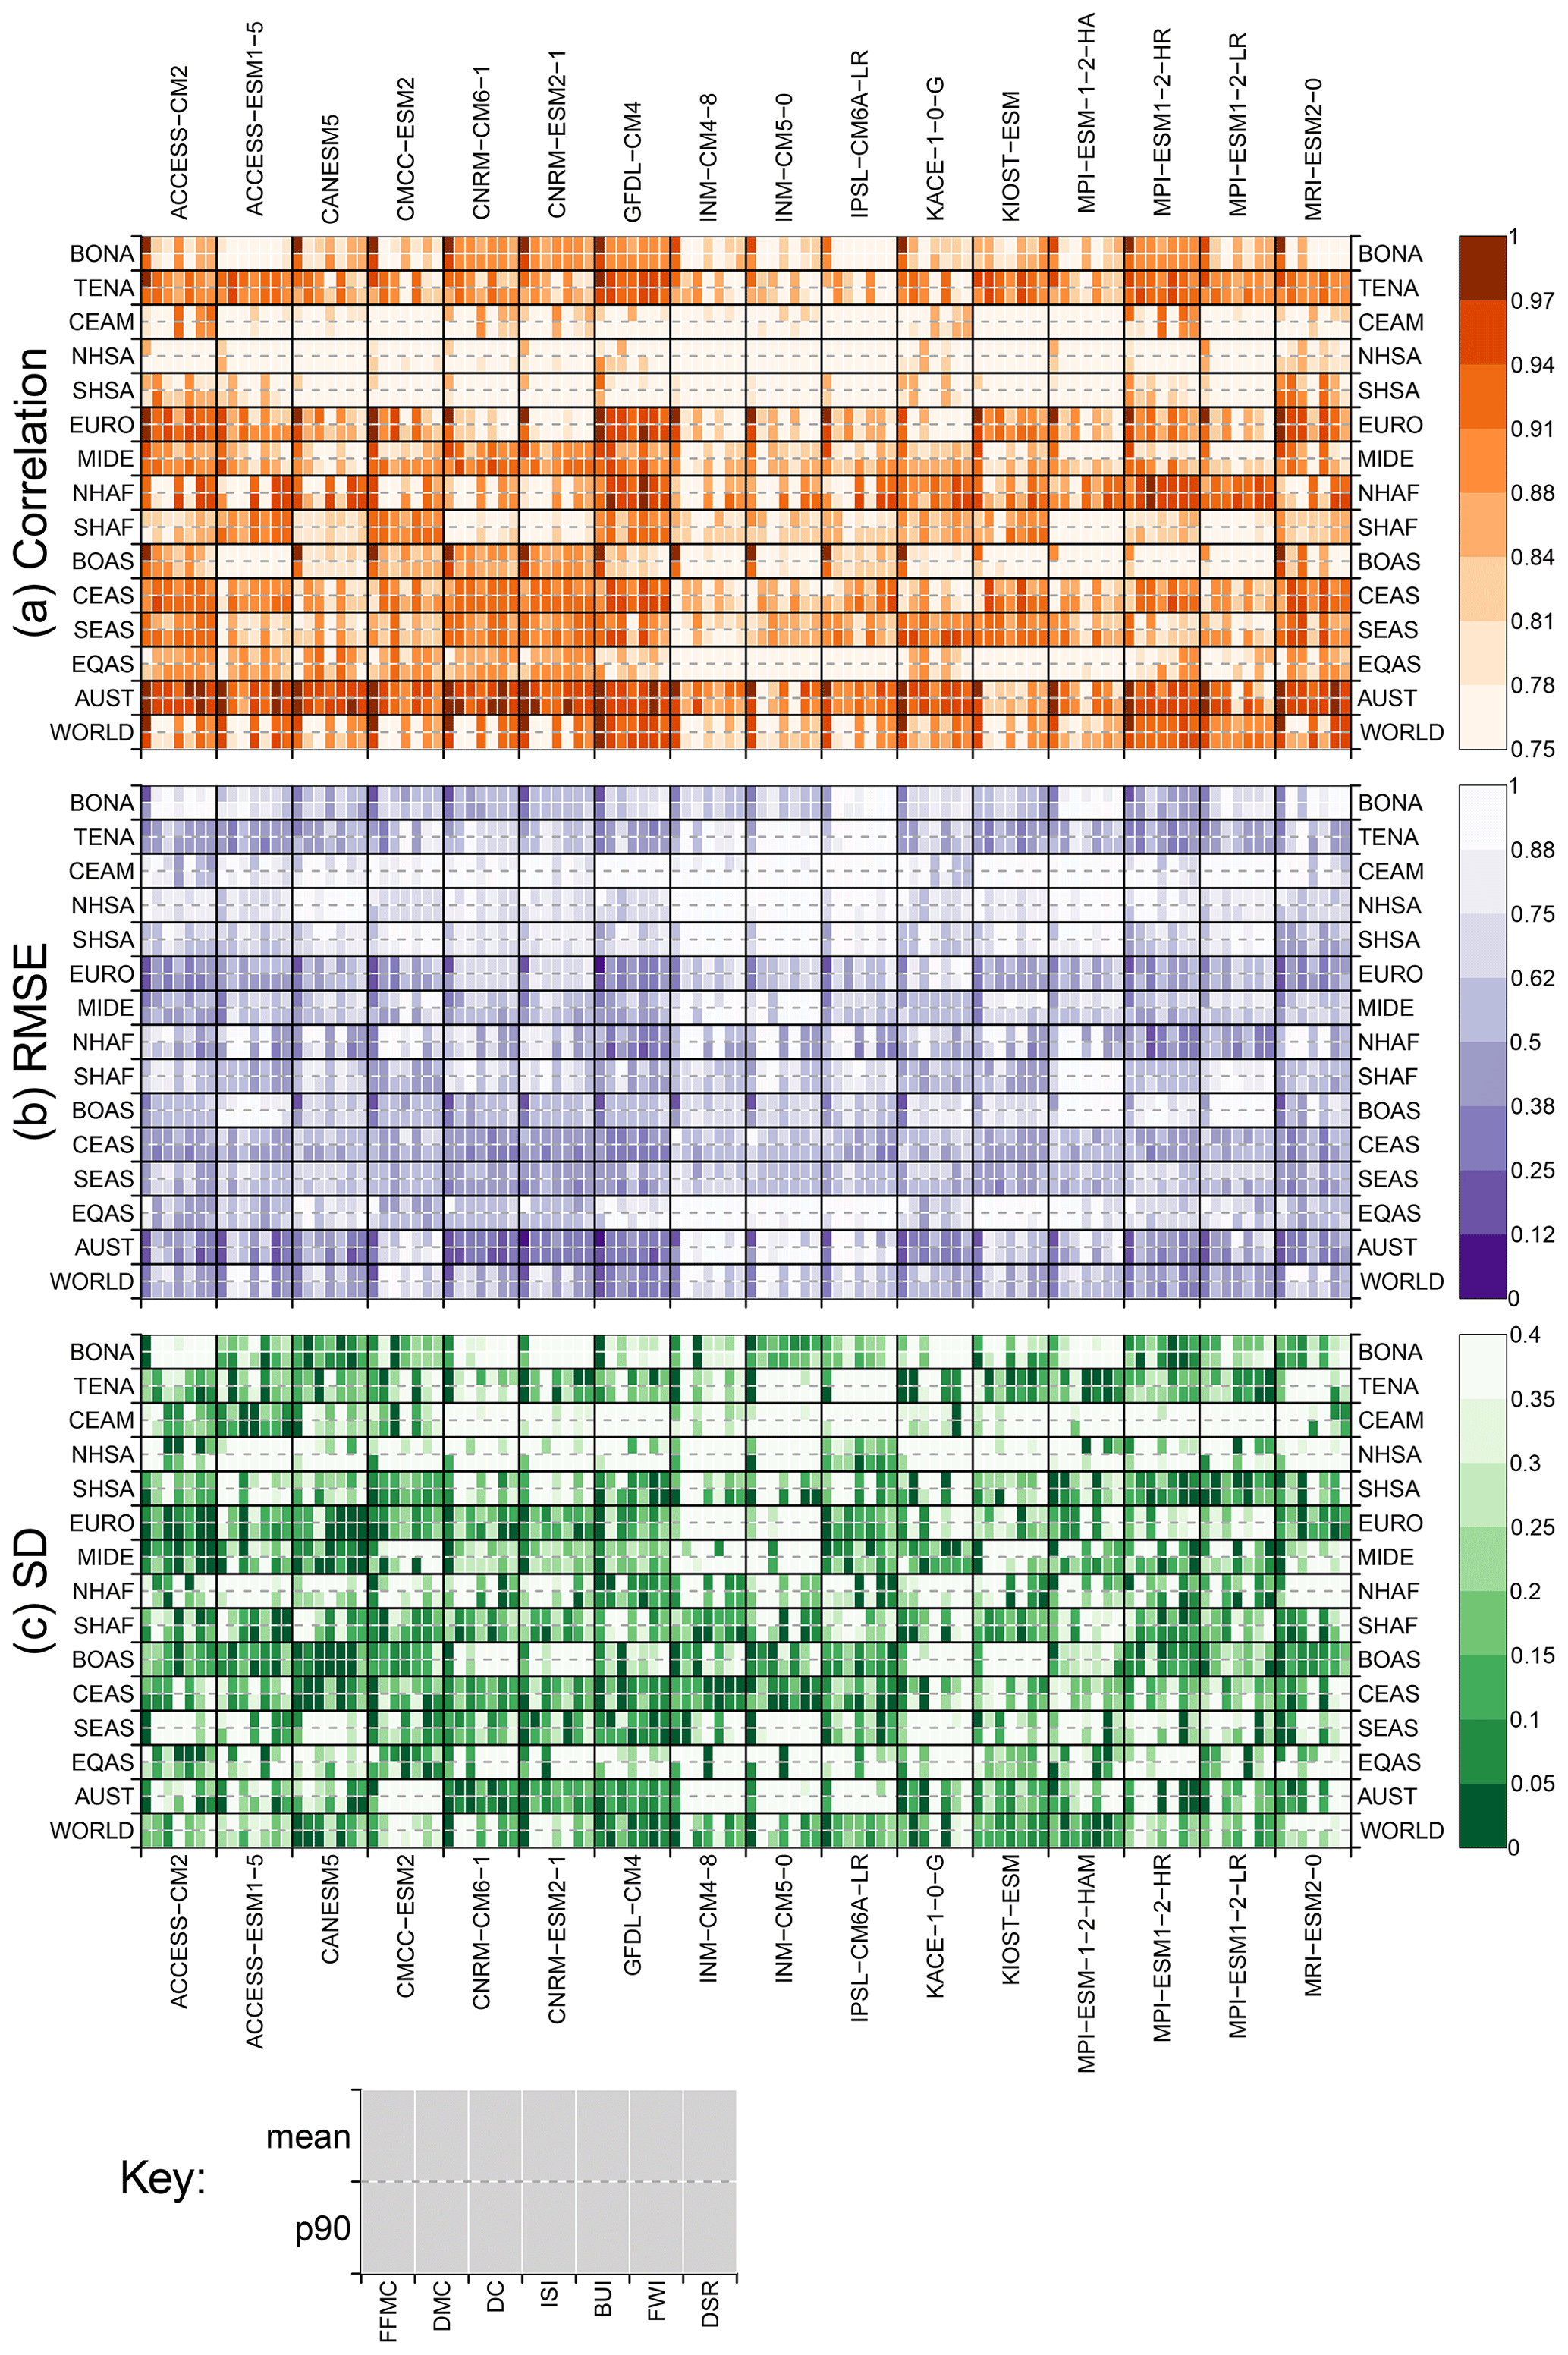
Figure 7Individual CMIP6 model (a) correlation, (b) RMSE, and (c) absolute log of the ratio of standard deviation with respect to ERA5 for the fire season mean and 90th percentile across each of the seven CFWIS indices and each of the 14 GFED fire regions. Darker colours show higher spatial correlations and lighter colours lower. The fire season for each region is defined as those months for which the average burned area is greater than 50 % of the monthly maximum (see Fig. 4).
The values of the three evaluation metrics, both for the mean and 90th percentile, vary greatly from region to region and across individual models (Fig. 7). Looking at the spatial correlation (Fig. 7a) for instance, Australia and southeast Asia are consistently in good agreement with observations across the different models, while for others like Central and South America all models show much weaker performance. For the normalised RMSE (Fig. 7b), most models in Central and South America show larger values, and central and southeast Asia present lower values overall. In the case of the standard deviation (Fig. 7c), there are no clear patterns, and the values are quite heterogeneous both among models and among regions.
Following the approach taken by Dieppois et al. (2015) in the evaluation of CMIP5 models, all three different statistics from Fig. 7 are combined to rank the individual model performance. Models are ranked for each of the three spatiotemporal skill metrics for seasonal mean and 90th percentile in each CFWIS component and each region, with a comprehensive ranking matrix shown in Fig. 8. The overall relative performance of individual models exhibits a strong degree of heterogeneity across the different regions but, in most cases, is consistent among the different CFWIS components (Fig. 8). There are some models (e.g. INM models, IPSL-CM6A-LR and MPI-ESM-1-2-HAM) that consistently show weaker performance in most of the regions (Fig. 8). The CNRM models, for instance, perform relatively poorly in many regions but perform reasonably well in Australia (Fig. 8). By contrast, there are some models, such as ACCESS-CM2, GFDL-CM4 and MRI-ESM2-0, that show better performance in most regions, with some exceptions (Fig. 8).
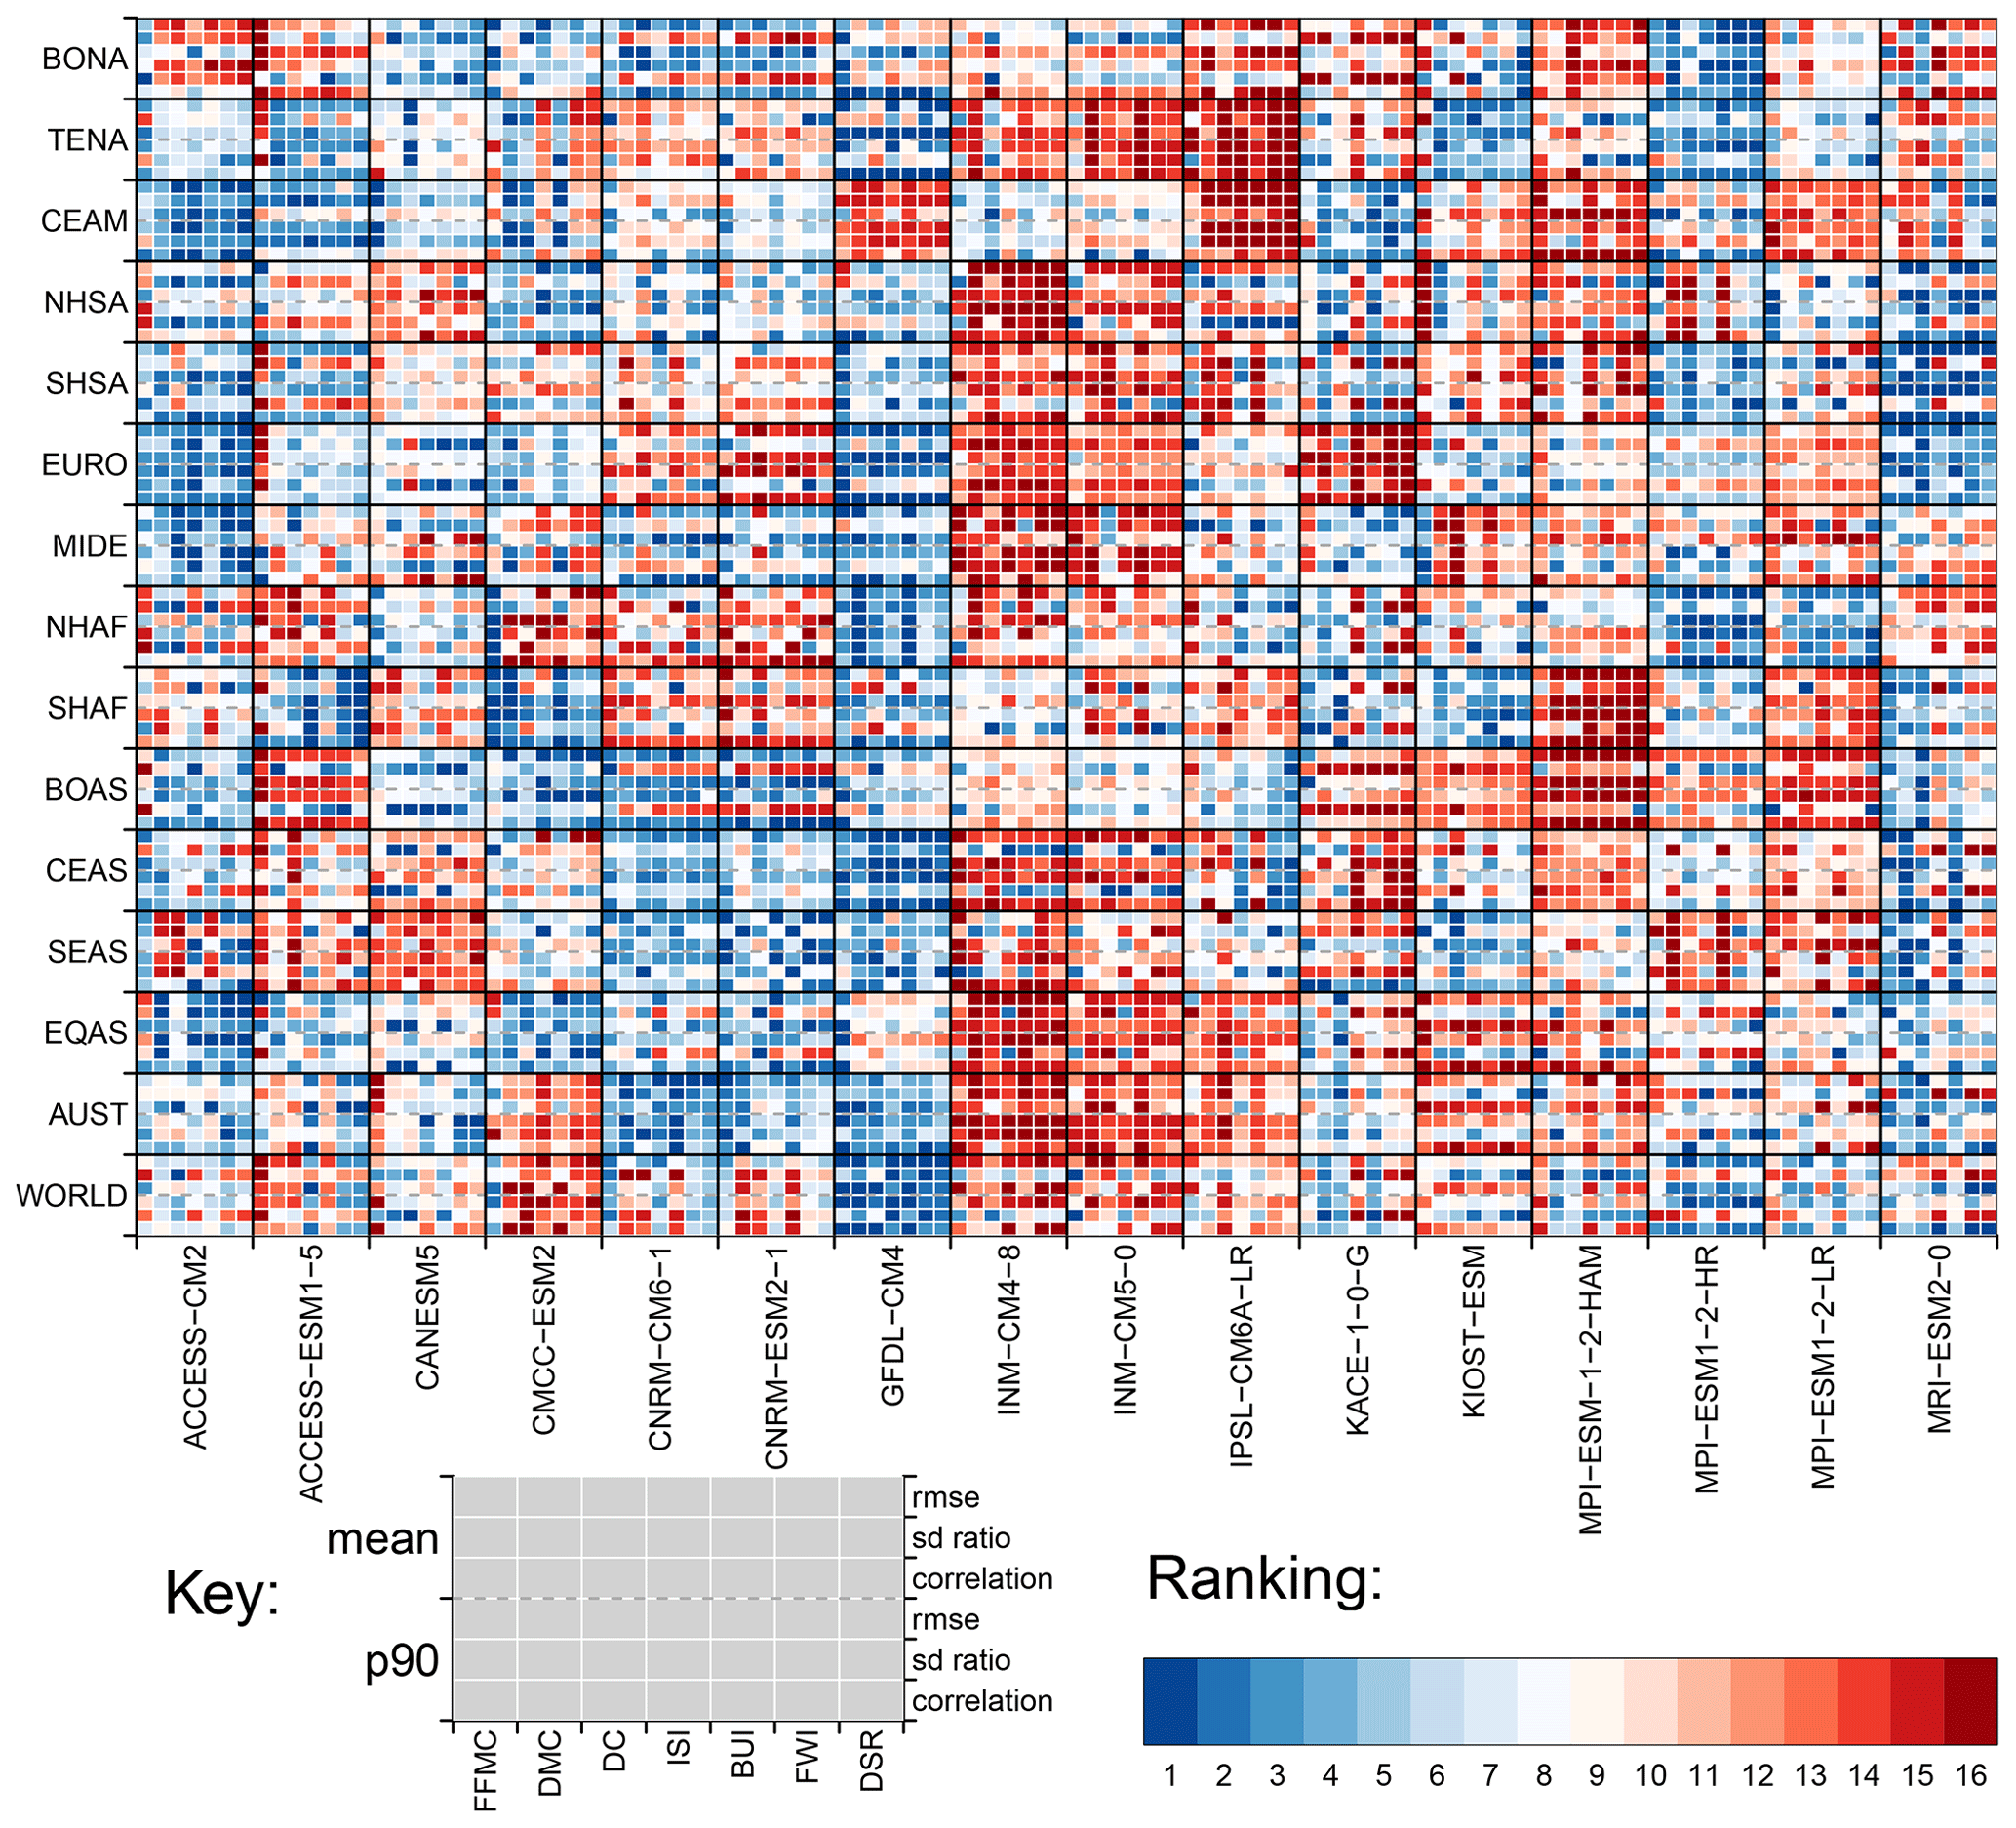
Figure 8CMIP6 inter-model ranking for 14 GFED regions, 7 CFWIS components and 3×2 skill metrics (correlation, RMSE, and ratio of standard deviation for the mean and 90th percentile). For a given region and CFWIS component, models are ranked from 1 (the strongest) to 16 (the weakest) according to a given skill metric. Blue (red) shading is thus indicative of strong (weak) model performance.
To support applications that seek to justify the selection of one or more models on which to base an impact study on, we generated a set of rankings inspired by those produced for the evaluation of the EURO-CORDEX ensemble by Vautard et al. (2021). All 16 models were ranked according to two different measurements: (1) the count of the number of times in which each model falls into the upper tercile in terms of all three skill metrics (i.e. correlation, normalised RMSE and the ratio of standard deviation) for the seasonal mean and 90th percentile in each of the seven CFWIS components and across each of the 14 GFED fire regions (Fig. 9a) and (2) the count of the number of times in which a model falls into the lower tercile, indicating which models exhibit poorer performance more frequently (Fig. 9b).
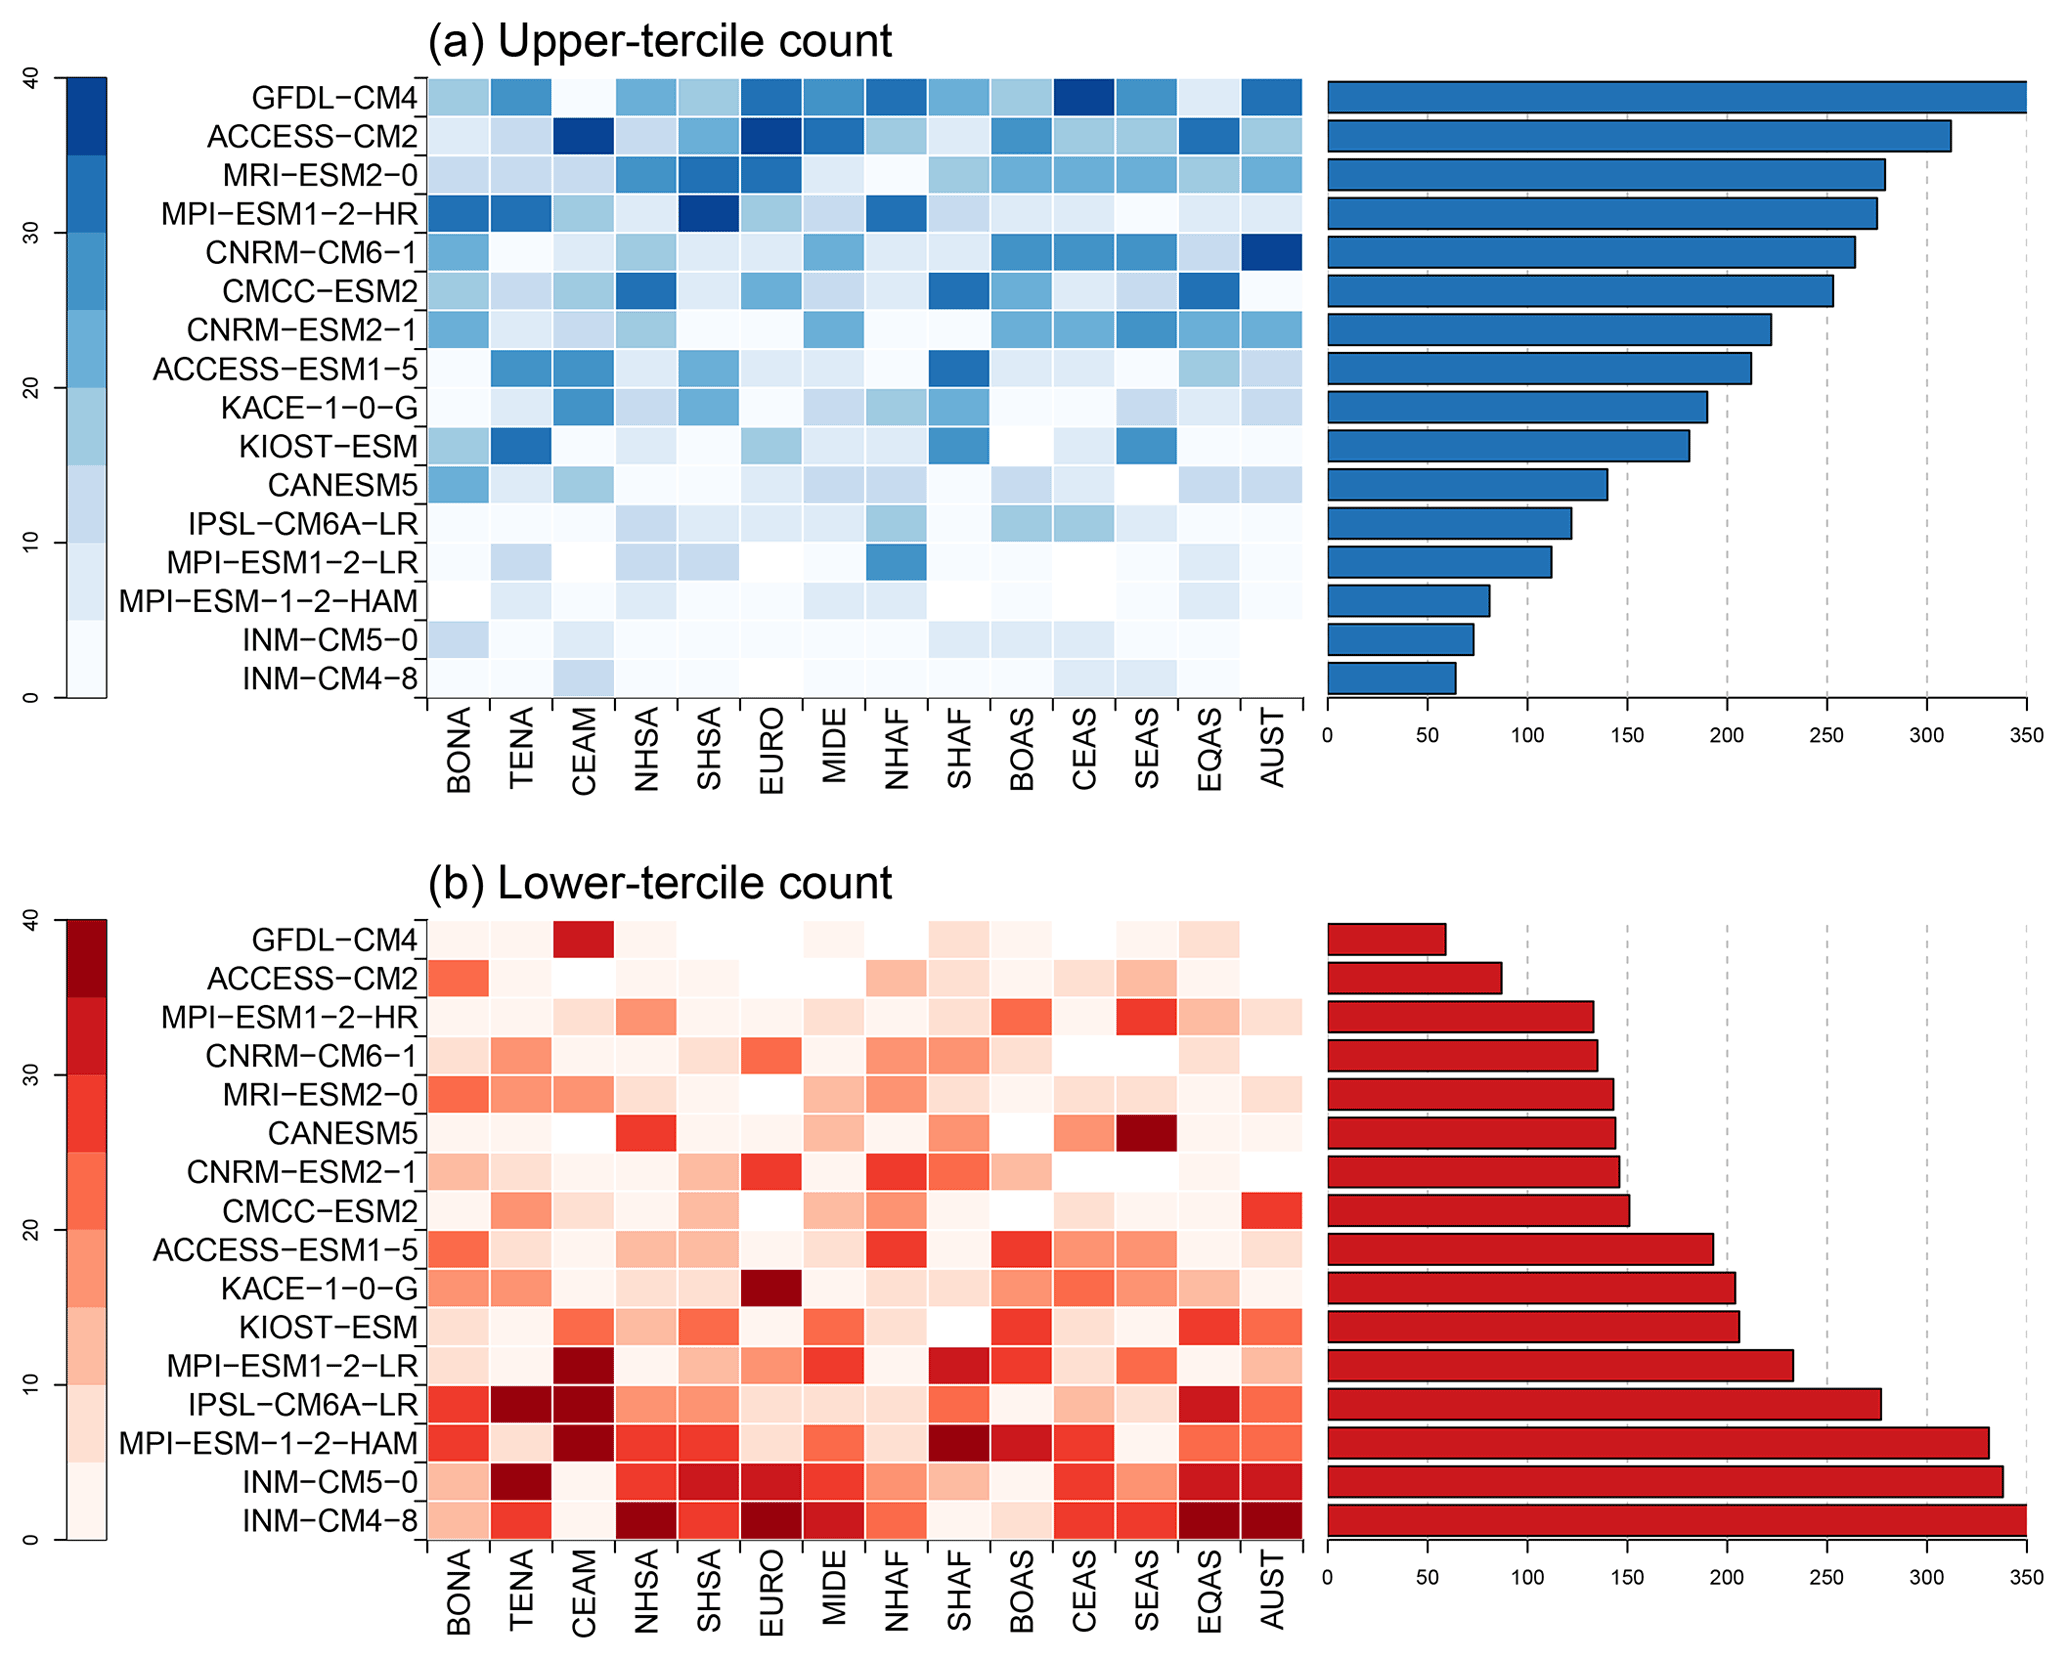
Figure 9(a) Counts of the number of times that each CMIP6 model is ranked in the upper tercile (top five) across all seven CFWIS components and 3×2 skill metrics (correlation, RMSE, and ratio of standard deviation for the mean and 90th percentile). The grid (left) shows the breakdown of total counts for each of the 14 GFED regions. The bars (right) indicate the total counts across all regions. (b) As (a) but for the lower tercile (bottom 5).
Only three models appear in the upper tercile more than 50 % of the time: GFDL-CM4, ACCESS-CM2 and MRI-ESM2-0 (Fig. 9a). GFDL-CM4 is a strong performer in Central Asia, as well as in Europe (EURO), North Hemisphere Africa (NHAF) and Australia (AUST), but is far weaker in Central America (CEAM) and equatorial Asia (EQAS). ACCESS-CM2 features in the upper tercile at least 35 out of 42 times in Europe (EURO) and Central America (CEAM) regions. In boreal (BONA) and temperate North America (TENA), the standout model is MPI-ESM1-2-HR and KIOST-ESM for TENA. In Australia (AUST), CNRM-CM6-1 and GFDL-CM4 perform the best overall. Overall, the two INM models and MPI-ESM-1-2-HAM feature in the upper tercile in less than 20 % of occasions, and there are no individual regions where these models are shown to perform well. MPI-ESM-1-2-HAM and the two INM models also appear in the lower-tercile category more than 300 times (Fig. 9b). GFDL-CM4 and ACCESS-CM2 are the strongest performers in this respect, falling in the lower tercile fewer than 100 times.
In addition, models perform well in simulating some variables but not others. The individual model performance also exhibits a strong regional dependence. For several models, performance was found to be strong across some regions and poorer in others. It is difficult to identify systematic reasons for the inter-model differences based on spatial resolution or shared pathways of model development, otherwise referred to as model genealogy (Masson and Knutti, 2011). Performance is similar between the INM and CNRM model families, but there are considerable differences among the three MPI models. MPI-ESM1-2-HR consistently performs better than its companion lower-resolution models (MPI-ESM1-2-LR and MPI-ESM-1-2-HAM). It is also notable that the CanESM5 model has the lowest resolution () but outperforms many higher-resolution models in several regions, particularly in boreal North America (BONA) and Central America (CEAM). However, this observation aside, there is little evidence for a model's original spatial resolution as an important factor in its performance. Comparison of different models does not provide an ideal framework to draw conclusions, as the impact of resolution is likely to be driven by internal model physics and dynamics.
The models performing better across a wider set of regions are GFDL-CM4, ACCESS-CM2 and MRI-ESM2-0 when assessing model performance region by region and for each region's fire season (Fig. 8). MPI-ESM1-2-HR shows good skill annually and at a global scale (except for DMC and BUI), and it is one of the models performing well in several regions (Figs. 8 and 9). The models that show the poorest skill in most regions are INM-CM4-8, INM-CM5-0 and MPI-ESM-1-2-HAM, and they are also often found in the lower part of the global ranking distribution (lower tercile, Fig. 9). It is advisable not to include models consistently performing poorly, when simulating CFWIS components both at global and at regional scales, in a multi-model study unless for specific regions where they present better skill. Careful consideration to model selection should be given, taking into account the study area and the chosen fire weather indicators under analysis.
Our synthesis does not consider model representation of the meteorological components taken as input in deriving the CFWIS indicators. A first-order analysis of multi-model biases in these fields is given in Sect. 3.1 and Fig. S1, but more in-depth analysis of the relative contribution of biases in each field to the overall representation of fire weather is beyond the scope of this study. Clearly, model development in fire weather representation of fire weather, especially in a changing world, should consider the reasons for model biases in key fire-prone regions. This includes the representation of temperature highs and relative humidity lows in large parts of the Northern Hemisphere.
Changes in the intensity and spatial distribution of wildfires are a likely consequence of a changing global climate. Producing reliable projections of meteorologically driven wildfire danger is crucial for establishing forest management and restoration strategies that will remain resilient in future decades. We presented a detailed evaluation of the performance of a subset of CMIP6 models in simulating spatiotemporal variability in fire weather across all parts of the world currently vulnerable to wildfire. A set of fire weather indicators, defined by the CFWIS, were generated for 16 different CMIP6 models and compared with corresponding fields from the ERA5 fire danger reanalysis for the period 1980–2014. Models were analysed collectively as part of an ensemble mean and in terms of their individual performance on both global and regional scales according to a set of performance criteria. At the global scale, the ensemble mean was found to simulate the set of CFWIS components well, reproducing similar spatial patterns to the ERA5 reference dataset. This is broadly encouraging for the use of the CMIP6 ensemble as a tool for understanding future changes in fire weather associated with a changing climate. At the regional scale, model results showed seasonal and regional variability, with some regions exhibiting very little model bias (e.g. Australia or Southern Hemisphere Africa) and vice-versa in other regions (e.g. Northern Hemisphere South America or southeast Asia).
Our results also have important implications for the use of CMIP6-derived simulations of past, present and future climate-driven fire danger. It is anticipated that the evaluation presented here, while based on solely historical spatiotemporal variability, will serve as an important resource for users of model-simulated fire weather, both during the CMIP6 era and beyond, in three different ways. Firstly, the extent to which any given model performs well is sensitive to the fire weather indicator being evaluated. Ultimately, different indicators, including the CFWIS set evaluated here, have different meanings in meteorological terms, and strong model performance for one indicator does not necessarily mean strong performance for another. At the global scale, FFMC, ISI, FWI and DSR tend to be reproduced with lower uncertainty. The results that are shown here catalogue where and for which model skill is sufficiently strong for a range of fire weather indicators. Secondly, model performance can vary dramatically from one region to another. The evaluation highlights regions where the capacity to reproduce fire weather is strong, at least in a subset of models. These differences should be fully accounted for in regional-scale fire weather studies. Thirdly, the large differences in model performances highlight the importance of a comprehensive model selection. This could significantly affect the conclusion provided in previous assessments of global wildfire projections using a single model (e.g. Krawchuk et al., 2009) or using a multi-model mean (e.g. Moritz et al., 2012; Dowdy et al., 2019). For instance, projected trends derived from multi-model mean could be significantly impacted by outlier models, presenting unrealistic mean, variability and trends. Comprehensive characterisation and quantification of model uncertainties are thus ethically crucial for robust decision-making (Knutti, 2010; Daron et al., 2021). The results presented here not only demonstrate the value of model selection but also provide a potential foundation for projections that take individual model skill and/or independence into account (e.g. Eyring et al., 2019). Future analysis will explore how the multi-model mean bias could be potentially reduced using a weighted mean or a multi-model mean with those models showing better performance and see how it is reflected in the projections for different shared socioeconomic pathway (SSP) scenarios.
While here we provide a robust, meaningful and useful global evaluation of CMIP6-simulated fire weather, it is necessary to outline potential caveats and opportunities for expansion. The availability of the input fields necessary to construct the full set of CFWIS components limited the evaluation to 16 CMIP6 models out of more than 50. Further study may consider additional models that contribute to CMIP6 for which input data may become available in the future. Furthermore, as some of the models only had one realisation available, we only consider here differences between single members, which could potentially affect the model variability on regional scales (Deser, 2020). The currently used CFWIS indicators (Van Wagner, 1987) were firstly defined for specific stand conditions at noon time. In order to update the system, so it provides better fire danger information, moisture codes and behaviour indices are being reviewed to consider peak daily burning conditions, and a new version of the system will be released by 2025 (Canadian Forest Service Fire Danger Group, 2021). In addition, analysis of fire weather indicators from other risk assessment systems would complement the results presented here. Global analysis of the CFWIS (e.g. Liu et al., 2022) has recommended extension to fire weather indicators from systems such as the McArthur Forest Fire Danger Index from the Centre for Australia Weather and Climate Research (McArthur, 1967), the Keetch–Byram drought index from the US Department of Agriculture's Forest Service (Keetch and Byram, 1968), and the Energy Release Component from the US National Fire Danger Rating System (Deeming et al., 1972). To truly understand the sources of error and biases for a given index, an in-depth analysis of the relative contribution of the meteorological fields used to construct it is required. Such an analysis is not trivial and should be an important focus for future study. A final point concerns the GFED fire regions taken as the basis for the regional-scale analysis: while they are a useful categorisation for the purpose of this evaluation, fire regimes vary substantially at the intra-regional scale. Potential alternative categorisations, in Europe for example, include the fire regimes defined by Galizia et al. (2021), while fire-prone areas may be better isolated using high-resolution land surface data (e.g. normalised difference vegetation index). It is important for studies requiring GCM-simulated fire weather data to consider that such intra-regional variability will likely extend to model performance. We also note that CMIP6 models have been found to show a greater warming extent than CMIP5 (Coppola et al., 2020; Hausfather et al., 2022), with several models exhibiting far greater equilibrium climate sensitivity (Forster et al., 2020; Zelinka et al., 2020). It remains unclear to what extent some warming rates may be unrealistic and how this might manifest in the calculated indicators.
Wildfires are complex events that involve not only forest dynamics but also climate conditions and human activity, so their projection under climate change is challenging. Given the predicted changes in fire regimes, their intensity and spatial distribution, current forest management and restoration strategies may not be effective for future conditions. This is particularly crucial as changes in wildfire activity become more evident both in fire-prone regions and in regions where wildfire danger was previously minimal (Mamuji and Rozdilsky, 2019; Boer et al., 2020; McCarty et al., 2020). The approach presented here aimed to characterise uncertainty in the latest generation of GCMs (CMIP6) when simulating fire weather and to evaluate model fidelity in order to reduce those uncertainties when informing future projections. Evaluation and model selection will support more appropriate and informed decision-making and aid forest managers in formulating strategies to respond to future wildfire events.
The reanalysis data (GEFF-ERA5) are available via the Copernicus Climate Change Service, Climate Data Store (2019, https://doi.org/10.24381/cds.0e89c522).
The R package used for the calculation of the components of the Canadian Forest Fire Weather Index System was developed by Wang et al. (2017).
The supplement related to this article is available online at: https://doi.org/10.5194/gmd-16-3103-2023-supplement.
CG, JME and BD designed the methodology; CG analysed the data with support from JME and BD; CG wrote the manuscript draft, supported by JME and BD; ID, PZF, JSM and MB contributed to the discussion of the results and to the final version of the paper.
The contact author has declared that none of the authors has any competing interests.
Publisher's note: Copernicus Publications remains neutral with regard to jurisdictional claims in published maps and institutional affiliations.
We acknowledge the World Climate Research Programme, which, through its Working Group on Coupled Modelling, coordinated and promoted CMIP6. We thank the climate modelling groups for producing and making available their model output, the Earth System Grid Federation (ESGF) for archiving the data and providing access, and the multiple funding agencies who support CMIP6 and ESGF.
This paper was edited by Fiona O'Connor and reviewed by Matthew Kasoar and two anonymous referees.
Abbasian, M., Moghim, S., and Abrishamchi, A.: Performance of the general circulation models in simulating temperature and precipitation over Iran, Theor. Appl. Climatol., 135, 1465–1483, https://doi.org/10.1007/s00704-018-2456-y, 2019.
Abatzoglou, J. T. and Kolden, C. A.: Relationships between climate and macroscale area burned in the western United States, Int. J. Wildland Fire, 22, 1003–1020, https://doi.org/10.1071/WF13019, 2013.
Abatzoglou, J. T., Williams, A. P., and Barbero, R.: Global Emergence of Anthropogenic Climate Change in Fire Weather Indices, Geophys. Res. Lett., 46, 326–336, https://doi.org/10.1029/2018GL080959, 2019.
Amatulli, G., Camia, A., and San-Miguel-Ayanz, J.: Estimating future burned areas under changing climate in the EU-Mediterranean countries, Sci. Total Environ., 450–451, 209–222, https://doi.org/10.1016/j.scitotenv.2013.02.014, 2013.
Andela, N., Morton, D. C., Giglio, L., Paugam, R., Chen, Y., Hantson, S., van der Werf, G. R., and Randerson, J. T.: The Global Fire Atlas of individual fire size, duration, speed and direction, Earth Syst. Sci. Data, 11, 529–552, https://doi.org/10.5194/essd-11-529-2019, 2019.
Arias, P. A., Bellouin, N., Coppola, E., Jones, R. G., Krinner, G., Marotzke, J., Naik, V., Palmer, M. D., Plattner, G.-K., Rogelj, J., Rojas, M., Sillmann, J., Storelvmo, T., Thorne, P. W., Trewin, B., Rao, K. A., Adhikary, B., Allan, R. P., Armour, K., Bala, G., Barimalala, R., Berge, S., and Zickfeld, K.: Technical summary, in: Climate Change 2021: The Physical Science Basis. Contribution of Working Group I to the Sixth Assessment Report of the Intergovernmental Panel on Climate Change, edited by: Masson-Delmotte, V., Zhai, P., Pirani, A., Connors, S. L., Péan, C., Berger, S., Caud, N., Chen, Y., Goldfarb, L., Gomis, M. I., Huang, M., Leitzell, K., Lonnoy, E., Matthews, J. B. R., Maycock, T. K., Waterfield, T., Yelekçi, O., Yu, R., and Zhou, B., Cambridge University Press, Cambridge, UK, and New York, USA, 33–144, https://doi.org/10.1017/9781009157896.002, 2021.
Baker, N. C. and Taylor, P. C.: A framework for evaluating climate model performance metrics, J. Climate, 29, 1773–1782, https://doi.org/10.1175/JCLI-D-15-0114.1, 2016.
Balch, J. K., Bradley, B. A., Abatzoglou, J. T., Chelsea Nagy, R., Fusco, E. J., and Mahood, A. L.: Human-started wildfires expand the fire niche across the United States, P. Natl. Acad. Sci. USA, 114, 2946–2951, https://doi.org/10.1073/pnas.1617394114, 2017.
Barbero, R., Abatzoglou, J. T., Pimont, F., Ruffault, J., and Curt, T.: Attributing increases in fire weather to anthropogenic climate change over France, Front. Earth Sci., 8, 104, https://doi.org/10.3389/feart.2020.00104, 2020.
Bedia, J., Herrera, S., Gutiérrez, J. M., Benali, A., Brands, S., Mota, B., and Moreno, J. M.: Global patterns in the sensitivity of burned area to fire-weather: Implications for climate change, Agr. Forest Meteorol., 214–215, 369–379, https://doi.org/10.1016/j.agrformet.2015.09.002, 2015.
Boer, M. M., Resco de Dios, V., and Bradstock, R. A.: Unprecedented burn area of Australian mega forest fires, Nat. Clim. Change, 10, 171–172, https://doi.org/10.1038/s41558-020-0710-7, 2020.
Bowman, D. M. J. S., Williamson, G. J., Abatzoglou, J. T., Kolden, C. A., Cochrane, M. A., and Smith, A. M. S.: Human exposure and sensitivity to globally extreme wildfire events, Nat. Ecol. Evol., 1, 1–6, https://doi.org/10.1038/s41559-016-0058, 2017.
Calheiros, T., Pereira, M. G., and Nunes, J. P.: Assessing impacts of future climate change on extreme fire weather and pyro-regions in Iberian Peninsula, Sci. Total Environ., 754, 142233, https://doi.org/10.1016/j.scitotenv.2020.142233, 2021.
Camia, A., Durrant, T., and San-Miguel-Ayanz, J.: Harmonized classification scheme of fire causes in the EU adopted for the European Fire Database of EFFIS, EUR – Scientific and Technical Research, Publications Office of the European Union, Luxembourg, 51 pp., https://doi.org/10.2788/86859, 2013.
Camia, A., Libertà, G., and San-Miguel-Ayanz, J.: Modeling the impacts of climate change on forest fire danger in Europe: sectorial results of the PESETA II Project, Publications Office of the European Union, Luxembourg, 24 pp., https://doi.org/10.2760/768481, 2017.
Canadian Forest Service Fire Danger Group: An overview of the next generation of the Canadian Forest Fire Danger Rating System, Information Report GLC-X-26, Natural Resources Canada, Canadian Forest Service, Great Lakes Forestry Centre, Sault Ste. Marie, 70 pp., ISBN 978-0-660-37266-2, 2021.
Cardil, A., Eastaugh, C. S., and Molina, D. M.: Extreme temperature conditions and wildland fires in Spain, Theor. Appl. Climatol., 122, 219–228, https://doi.org/10.1007/s00704-014-1295-8, 2015.
Carvalho, A., Flannigan, M. D., Logan, K., Miranda, A. I., and Borrego, C.: Fire activity in Portugal and its relationship to weather and the Canadian Fire Weather Index System, Int. J. Wildland Fire, 17, 328–338, https://doi.org/10.1071/WF07014, 2008.
Copernicus Climate Change Service: Fire danger indices historical data from the Copernicus Emergency Management Service, Copernicus Climate Change Service (C3S) Climate Data Store (CDS) [data set], https://doi.org/10.24381/cds.0e89c522, 2019.
Coppola, E., Nogherotto, R., Ciarlo, J. M., Giorgi, F., van Meijgaard, E., Kadygrov, N., Iles, C., Corre, L., Sandstad, M., Somot, S., Nabat, P., Vautard, R., Levavasseur, G., Schwingskackl, C., Sillmann, J., Kjellström, E., Nikulin, G., Aalbers, E., Lenderink, G., Christensen, O. B., Boberg, F., Sørland, S. L., Demory, M., Bülow, K., Teichmann, C., Warrach-Sagi, K., and Wulfmeyer, V.: Assessment of the European climate projections as simulated by the large EURO-CORDEX regional and global climate model ensemble, J. Geophys. Res.-Atmos., 126, e2019JD032356, https://doi.org/10.1029/2019JD032356, 2020.
Daron, J., Lorenz, S., and Taylor, A.: Communicating future climate projections of precipitation change, Climatic Change, 166, 23, https://doi.org/10.1007/s10584-021-03118-9, 2021.
de Rigo, D., Libertà, G., Houston Durrant, T., Artés Vivancos, T., and San-Miguel-Ayanz, J.: Forest fire danger extremes in Europe under climate change: variability and uncertainty, Publications Office of the European Union, Luxembourg, 71 pp., https://doi.org/10.2760/13180, 2017.
Dee, D. P., Uppala, S. M., Simmons, A. J., Berrisford, P., Poli, P., Kobayashi, S., Andrae, U., Balmaseda, M. A., Balsamo, G., Bauer, P., Bechtold, P., Beljaars, A. C. M., van de Berg, L., Bidlot, J., Bormann, N., Delsol, C., Dragani, R., Fuentes, M., Geer, A. J., Haimberger, L., Healy, S. B., Hersbach, H., Hólm, E. V., Isaksen, L., Kållberg, P., Köhler, M., Matricardi, M., Mcnally, A. P., Monge-Sanz, B. M., Morcrette, J. J., Park, B. K., Peubey, C., de Rosnay, P., Tavolato, C., Thépaut, J. N., and Vitart, F.: The ERA-Interim reanalysis: Configuration and performance of the data assimilation system, Q. J. Roy. Meteor. Soc., 137, 553–597, https://doi.org/10.1002/qj.828, 2011.
Deeming, J. E., Lancaster, J. W., Fosberg, M. A., Furman, R. W., and Schroeder, M. J.: National Fire-Danger Rating System, Research Paper RM-84, USDA Forest Service, Fort Collins, 165 pp., 1972.
Department of Forestry and Fire Protection: https://www.fire.ca.gov/incidents/2020/, last access: 8 June 2021.
Deser, C.: Certain Uncertainty: The Role of Internal Climate Variability in Projections of Regional Climate Change and Risk Management, Earths Future, 8, 12, e2020EF001854, 2020.
Di Giuseppe, F., Pappenberger, F., Wetterhall, F., Krzeminski, B., Camia, A., Libertá, G., and San Miguel, J.: The potential predictability of fire danger provided by numerical weather prediction, J. Appl. Meteorol. Clim., 55, 2469–2491, https://doi.org/10.1175/JAMC-D-15-0297.1, 2016.
Dieppois, B., Rouault, M., and New, M.: The impact of ENSO on Southern African rainfall in CMIP5 ocean atmosphere coupled climate models, Clim. Dynam., 45, 2425–2442, https://doi.org/10.1007/s00382-015-2480-x, 2015.
Dowdy, A. J., Ye, H., Pepler, A., Thatcher, M., Osbrough, S. L., Evans, J. P., Di Virgilio, G., and McCarthy, N.: Future changes in extreme weather and pyroconvection risk factors for Australian wildfires, Sci. Rep.-UK, 9, 1–11, https://doi.org/10.1038/s41598-019-46362-x, 2019.
Dupuy, J.-L., Fargeon, H., Martin-StPaul, N., Pimont, F., Ruffault, J., Guijarro, M., Hernando, C., Madrigal, J., and Fernandes, P.: Climate change impact on future wildfire danger and activity in southern Europe: a review, Ann. For. Sci., 77, 35, https://doi.org/10.1007/s13595-020-00933-5, 2020.
Eyring, V., Bony, S., Meehl, G. A., Senior, C. A., Stevens, B., Stouffer, R. J., and Taylor, K. E.: Overview of the Coupled Model Intercomparison Project Phase 6 (CMIP6) experimental design and organization, Geosci. Model Dev., 9, 1937–1958, https://doi.org/10.5194/gmd-9-1937-2016, 2016.
Eyring, V., Cox, P. M., Flato, G. M., Gleckler, P. J., Abramowitz, G., Caldwell, P., Collins, W. D., Gier, B. K., Hall, A. D., Hoffman, F. M., Hurtt, G. C., Jahn, A., Jones, C. D., Klein, S. A., Krasting, J. P., Kwiatkowski, L., Lorenz, R., Maloney, E., Meehl, G. A., Pendergrass, A. G., Pincus, R., Ruane, A. C., Russell, J. L., Sanderson, B. M., Santer, B. D., Sherwood, S. C., Simpson, I. R., Stouffer, R. J., and Williamson, M. S.: Taking climate model evaluation to the next level, Nat. Clim. Change, 9, 102–110, https://doi.org/10.1038/s41558-018-0355-y, 2019.
Fernández-Guisuraga, J. M., Suárez-Seoane, S., García-Llamas, P., and Calvo, L.: Vegetation structure parameters determine high burn severity likelihood in different ecosystem types: A case study in a burned Mediterranean landscape, J. Environ. Manage., 288, 1124622, https://doi.org/10.1016/j.jenvman.2021.112462, 2021.
Flannigan, M. D. and Harrington, J. B.: A study of the relation of meteorological variables to monthly provincial area burned by wildfire in Canada, J. Appl. Meteorol. Clim., 27, 441–452, https://doi.org/10.1175/1520-0450(1988)027<0441:ASOTRO>2.0.CO;2, 1988.
Flannigan, M. D. and Wotton, B. M.: Climate, Weather, and Area Burned, in: Forest Fires, edited by: Johnson, E. A. and Miyanishi, K., Academic Press, 351–373, https://doi.org/10.1016/b978-012386660-8/50012-x, 2001.
Flannigan, M., Cantin, A. S., De Groot, W. J., Wotton, M., Newbery, A., and Gowman, L. M.: Global wildland fire season severity in the 21st century, Forest Ecol. Manag., 294, 54–61, https://doi.org/10.1016/j.foreco.2012.10.022, 2013.
Flato, G., Marotzke, J., Abiodun, B., Braconnot, P., Chou, S. C., Collins, W., Cox, P., Driouech, F., Emori, S., Eyring, V., Forest, C., Gleckler, P., Guilyardi, E., Jakob, C., Kattsov, V., Reason, C., and Rummukainen, M.: Evaluation of climate models, Clim. Chang. 2013. Phys. Sci. Basis Work. Gr. I Contrib. to Fifth Assess. Rep. Intergov. Panel Clim. Chang., Cambridge, Cambridge University Press, 741–866, https://doi.org/10.1017/CBO9781107415324.020, 2013.
Forster, P. M., Maycock, A. C., McKenna, C. M., and Smith, C. J.: Latest climate models confirm need for urgent mitigation, Nat. Clim. Change, 10, 7–10, https://doi.org/10.1038/s41558-019-0660-0, 2020.
Gaboriau, D. M., Remy, C. C., Girardin, M. P., Asselin, H., Hély, C., Bergeron, Y., and Ali, A. A.: Temperature and fuel availability control fire size/severity in the boreal forest of central Northwest Territories, Canada, Quaternary Sci. Rev., 250, 106697, https://doi.org/10.1016/j.quascirev.2020.106697, 2020.
Galizia, L. F., Curt, T., Barbero, R., and Rodrigues, M.: Understanding fire regimes in Europe, Int. J. Wildland Fire, 31, 56–66, https://doi.org/10.1071/WF21081, 2021.
Giglio, L., van der Werf, G. R., Randerson, J. T., Collatz, G. J., and Kasibhatla, P.: Global estimation of burned area using MODIS active fire observations, Atmos. Chem. Phys., 6, 957–974, https://doi.org/10.5194/acp-6-957-2006, 2006.
Giglio, L., Randerson, J. T., van der Werf, G. R., Kasibhatla, P. S., Collatz, G. J., Morton, D. C., and DeFries, R. S.: Assessing variability and long-term trends in burned area by merging multiple satellite fire products, Biogeosciences, 7, 1171–1186, https://doi.org/10.5194/bg-7-1171-2010, 2010.
Giglio, L., Randerson, J. T., and Van Der Werf, G. R.: Analysis of daily, monthly, and annual burned area using the fourth-generation global fire emissions database (GFED4), J. Geophys. Res.-Biogeo., 118, 317–328, https://doi.org/10.1002/jgrg.20042, 2013.
Gleixner, S., Demissie, T., and Diro, G. T.: Did ERA5 improve temperature and precipitation reanalysis over East Africa?, Atmosphere-Basel, 11, 1–19, https://doi.org/10.3390/atmos11090996, 2020.
Graham, R. M., Hudson, S. R., and Maturilli, M.: Improved Performance of ERA5 in Arctic Gateway Relative to Four Global Atmospheric Reanalyses, Geophys. Res. Lett., 46, 6138–6147, https://doi.org/10.1029/2019GL082781, 2019.
Grillakis, M., Voulgarakis, A., Rovithakis, A., Seiradakis, K. D., Koutroulis, A., Field, R. D., Kasoar, M., Papadopoulos, A., and Lazaridis, M.: Climate drivers of global wildfire burned area, Environ. Res. Lett., 17, 045021, https://doi.org/10.1088/1748-9326/ac5fa1, 2022.
Grimmond, C. S. B., Blackett, M., Best, M. J., Barlow, J., Baik, J-J., Belcher, S. E., Bohnenstengel, S. I., Calmet, I., Chen, F., Dandou, A., Fortuniak, K., Gouvea, M. L., Hamdi, R., Hendry, M., Kawai, T., Kawamoto, Y., Kondo, H., Krayenhoff, E. S., Lee, S-H., Loridan, T., Martilli, A., Masson, V., Miao, S., Oleson, K., Pigeon, G., Porson, A., Ryu, Y-H., Salamanca, F., Shashua-Bar, L., Steeneveld, G-J., Tombrou, M., Voogt, J., Young, D., and Zhang, N.: The International Urban Energy Balance Models Comparison Project: First Results from Phase 1, J. Appl. Meteorol. Clim., 49, 1268–1292, https://doi.org/10.1175/2010JAMC2354.1, 2010.
Harris, S., Nicholls, N., Tapper, N., and Mills, G.: The sensitivity of fire activity to interannual climate variability in Victoria, Australia, J. South. Hemisph. Earth Syst. Sci., 69, 146, https://doi.org/10.1071/es19008, 2019.
Hausfather, Z., Marvel, K., Schmidt, G. A., Nielsen-Gammon, J., and Zelinka, M.: Climate simulations: recognize the “hot model” problem, Nature, 605, 26–29, 2022.
Hawkins, E. and Sutton, R.: The potential to narrow uncertainty in regional climate predictions, B. Am. Meteorol. Soc., 90, 1095–1107, https://doi.org/10.1175/2009BAMS2607.1, 2009.
Hersbach, H., Bell, B., Berrisford, P., Horányi, A., Sabater, J. M., Nicolas, J., Radu, R., Schepers, D., Simmons, A., Soci, C., and Dee, D.: Global reanalysis: goodbye ERA-Interim, hello ERA5, ECMWF Newsl., 17–24, https://doi.org/10.21957/vf291hehd7, 2019.
Hersbach, H., Bell, B., Berrisford, P., Hirahara, S., Horányi, A., Muñoz-Sabater, J., Nicolas, J., Peubey, C., Radu, R., Schepers, D., Simmons, A., Soci, C., Abdalla, S., Abellan, X., Balsamo, G., Bechtold, P., Biavati, G., Bidlot, J., Bonavita, M., De Chiara, G., Dahlgren, P., Dee, D., Diamantakis, M., Dragani, R., Flemming, J., Forbes, R., Fuentes, M., Geer, A., Haimberger, L., Healy, S., Hogan, R. J., Hólm, E., Janisková, M., Keeley, S., Laloyaux, P., Lopez, P., Lupu, C., Radnoti, G., de Rosnay, P., Rozum, I., Vamborg, F., Villaume, S., and Thépaut, J. N.: The ERA5 global reanalysis, Q. J. Roy. Meteor. Soc., 146, 1999–2049, https://doi.org/10.1002/qj.3803, 2020.
Holden, Z. A., Swanson, A., Luce, C. H., Jolly, W. M., Maneta, M., Oyler, J. W., Warren, D. A., Parsons, R., and Affleck, D.: Decreasing fire season precipitation increased recent western US forest wildfire activity, P. Natl. Acad. Sci. USA, 115, E8349–E8357, https://doi.org/10.1073/pnas.1802316115, 2018.
IPCC: Climate Change 2021: The Physical Science Basis. Contribution of Working Group I to the Sixth Assessment Report of the Intergovernmental Panel on Climate Change, edited by: Masson-Delmotte, V., Zhai, P., Pirani, A., Connors, S. L., Péan, C., Berger, S., Caud, N., Chen, Y., Goldfarb, L., Gomis, M. I., Huang, M., Leitzell, K., Lonnoy, E., Matthews, J. B. R., Maycock, T. K., Waterfield, T., Yelekçi, O., Yu, R., and Zhou, B., Cambridge University Press, 2021a.
IPCC: Summary for Policymakers, in: Climate Change 2021: The Physical Science Basis. Contribution of Working Group I to the Sixth Assessment Report of the Intergovernmental Panel on Climate Change, edited by: Masson-Delmotte, V., Zhai, P., Pirani, A., Connors, S. L., Péan, C., Berger, S., Caud, N., Chen, Y., Goldfarb, L., Gomis, M. I., Huang, M., Leitzell, K., Lonnoy, E., Matthews, J. B. R., Maycock, T. K., Waterfield, T., Yelekçi, O., Yu, R., and Zhou, B., Cambridge University Press, Cambridge, UK, and New York, USA, 3–32, https://doi.org/10.1017/9781009157896.001, 2021b.
Johns, T. C., Durman, C. F., Banks, H. T., Roberts, M. J., McLaren, A. J., Ridley, J. K., Senior, C. A., Williams, K. D., Jones, A., Rickard, G. J., Cusack, S., Ingram, W. J., Crucifix, M., Sexton, D. M. H., Joshi, M. M., Dong, B. W., Spencer, H., Hill, R. S. R., Gregory, J. M., Keen, A. B., Pardaens, A. K., Lowe, J. A., Bodas-Salcedo, A., Stark, S., and Searl, Y.: The new Hadley Centre Climate Model (HadGEM1): Evaluation of coupled simulations, J. Climate, 19, 1327–1353, https://doi.org/10.1175/JCLI3712.1, 2006.
Jolly, W. M., Cochrane, M. A., Freeborn, P. H., Holden, Z. A., Brown, T. J., Williamson, G. J., and Bowman, D. M. J. S.: Climate-induced variations in global wildfire danger from 1979 to 2013, Nat. Commun., 6, 1–11, https://doi.org/10.1038/ncomms8537, 2015.
Keetch, J. J. and Byram, G. M.: A Drought Index for Forest Fire Control, U. S. Department of Agriculture. Forest Service. Southeastern Forest Experiment Station, Asheville, NC, 35 pp., 1968.
Knutti, R.: The end of model democracy?, Climatic Change, 102, 395–404, https://doi.org/10.1007/s10584-010-9800-2, 2010.
Kotlarski, S., Szabó, P., Herrera, S., Räty, O., Keuler, K., Soares, P. M., Cardoso, R. M., Bosshard, T., Pagé, C., Boberg, F., Gutiérrez, J. M., Isotta, F. A., Jaczewski, A., Kreienkamp, F., Liniger, M. A., Lussana, C., and Pianko-Kluczyńska, K.: Observational uncertainty and regional climate model evaluation: A pan-European perspective, Int. J. Climatol., 39, 3730–3749, https://doi.org/10.1002/joc.5249, 2019.
Koutsias, N., Xanthopoulos, G., Founda, D., Xystrakis, F., Nioti, F., Pleniou, M., Mallinis, G., and Arianoutsou, M.: On the relationships between forest fires and weather conditions in Greece from long-term national observations (1894–2010), Int. J. Wildland Fire, 22, 493–507, https://doi.org/10.1071/WF12003, 2013.
Krawchuk, M. A., Moritz, M. A., Parisien, M. A., Van Dorn, J., and Hayhoe, K.: Global pyrogeography: The current and future distribution of wildfire, PLoS One, 4, e5102, https://doi.org/10.1371/journal.pone.0005102, 2009.
Lehner, F., Deser, C., Maher, N., Marotzke, J., Fischer, E. M., Brunner, L., Knutti, R., and Hawkins, E.: Partitioning climate projection uncertainty with multiple large ensembles and CMIP5/6, Earth Syst. Dynam., 11, 491–508, https://doi.org/10.5194/esd-11-491-2020, 2020.
Littell, J. S., Mckenzie, D., Peterson, D. L., and Westerling, A. L.: Climate and wildfire area burned in western U. S. ecoprovinces, 1916–2003, Ecol. Appl., 19, 1003–1021, https://doi.org/10.1890/07-1183.1, 2009.
Littell, J. S., Peterson, D. L., Riley, K. L., Liu, Y., and Luce, C. H.: A review of the relationships between drought and forest fire in the United States, Glob. Change Biol., 22, 2353–2369, https://doi.org/10.1111/gcb.13275, 2016.
Littell, J. S., McKenzie, D., Wan, H. Y., and Cushman, S. A.: Climate Change and Future Wildfire in the Western United States: An Ecological Approach to Nonstationarity, Earths Future, 6, 1097–1111, https://doi.org/10.1029/2018EF000878, 2018.
Liu, Z., Eden, J. M., Dieppois, B., and Blackett, M.: A Global View of Observed Changes in Fire Weather Extremes: Uncertainties and Attribution To Climate, Climatic Change, 173, 14, https://doi.org/10.1007/s10584-022-03409-9, 2022.
Mamuji, A. A. and Rozdilsky, J. L.: Wildfire as an increasingly common natural disaster facing Canada: understanding the 2016 Fort McMurray wildfire, Nat. Hazards, 98, 163–180, 2019.
Masrur, A., Petrov, A. N., and DeGroote, J.: Circumpolar spatio-temporal patterns and contributing climatic factors of wildfire activity in the Arctic tundra from 2001–2015, Environ. Res. Lett., 13, 014019, https://doi.org/10.1088/1748-9326/aa9a76, 2018.
Masson, D. and Knutti, R.: Climate model genealogy. Geophys. Res. Lett., 38, L08703, https://doi.org/10.1029/2011GL046864, 2011.
McArthur, A. G.: Fire behaviour in Eucalyptus forests, Leaflet no., Commonw. of Australia Forestry and Timber Bureau, 36 pp., 1967.
McCarty, J. L., Smith, T. E. L., and Turetsky, M. R.: Arctic fres re-emerging, Nat. Geosci., 13, 668–660, https://doi.org/10.1038/s41561-020-0641-y, 2020.
McElhinny, M., Beckers, J. F., Hanes, C., Flannigan, M., and Jain, P.: A high-resolution reanalysis of global fire weather from 1979 to 2018 – overwintering the Drought Code, Earth Syst. Sci. Data, 12, 1823–1833, https://doi.org/10.5194/essd-12-1823-2020, 2020.
Meehl, G. A., Boer, G. J., Covey, C., Latif, M., and Stouffer, R. J.: The Coupled Model Intercomparison Project (CMIP), B. Am. Meteorol. Soc., 81, 313–318, http://www.jstor.org/stable/26215108 (last access: 1 June 2022), 2000.
Meehl, G. A., Covey, C., Delworth, T., Latif, M., McAvaney, B., Mitchell, J. F. B., Stouffer, R. J., and Taylor, K. E.: The WCRP CMIP3 Multimodel Dataset: A New Era in Climate Change Research, B. Am. Meteorol. Soc., 88, 1383–1394, 2007.
Mezuman, K., Tsigaridis, K., Faluvegi, G., and Bauer, S. E.: The interactive global fire module pyrE (v1.0), Geosci. Model Dev., 13, 3091–3118, https://doi.org/10.5194/gmd-13-3091-2020, 2020.
Moritz, M. A., Parisien, M.-A., Batllori, E., Krawchuk, M. A., Van Dorn, J., Ganz, D. J., and Hayhoe, K.: Climate change and disruptions to global fire activity, Ecosphere, 3, art49, https://doi.org/10.1890/es11-00345.1, 2012.
Mueller, S. E., Thode, A. E., Margolis, E. Q., Yocom, L. L., Young, J. D., and Iniguez, J. M.: Climate relationships with increasing wildfire in the southwestern US from 1984 to 2015, Forest Ecol. Manag., 460, 117861, https://doi.org/10.1016/j.foreco.2019.117861, 2020.
Natural Resources Canada: https://cwfis.cfs.nrcan.gc.ca/background/summary/fwi, last access: 15 June 2021.
Padilla, M. and Vega-García, C.: On the comparative importance of fire danger rating indices and their integration with spatial and temporal variables for predicting daily human-caused fire occurrences in Spain, Int. J. Wildland Fire, 20, 46–58, https://doi.org/10.1071/WF09139, 2011.
Poulter, B., Cadule, P., Cheiney, A., Ciais, P., Hodson, E., Peylin, P., Plummer, S., Spessa, A., Saatchi, S., Yue, C., and Zimmermann, N. E.: Global Biogeochemical Cycles to variability in satellite-observed burned area, Global Biogeochem. Cy., 29, 207–222, https://doi.org/10.1002/2013GB004655, 2015.
San-Miguel-Ayanz, J., Moreno, J. M., and Camia, A.: Analysis of large fires in European Mediterranean landscapes: Lessons learned and perspectives, Forest Ecol. Manag., 294, 11–22, https://doi.org/10.1016/j.foreco.2012.10.050, 2013.
Schroeder, M. J. and Buck, C. C.: Fire weather: A guide for application of meteorological information to forest fire control operations, Agricultur., Handbook 360, US Department of Agriculture, Forest Service, 228 pp., 1970.
Tarek, M., Brissette, F. P., and Arsenault, R.: Evaluation of the ERA5 reanalysis as a potential reference dataset for hydrological modelling over North America, Hydrol. Earth Syst. Sci., 24, 2527–2544, https://doi.org/10.5194/hess-24-2527-2020, 2020.
Taylor, K. E.: Summarizing multiple aspects of model performance in a single diagram, J. Geophys. Res., 106, 7183–7192, 2001.
Taylor, K. E., Stouffer, R. J., and Meehl, G. A.: An overview of CMIP5 and the experiment design, B. Am. Meteorol. Soc., 93, 485–498, https://doi.org/10.1175/BAMS-D-11-00094.1, 2012.
United Nations Environment Programme: Spreading like wildfire – The rising threat of extraordinary landscape fires, edited by: Sullivan, A., Baker, E., and Kurvits, T., A UNEP Rapid Response Assessment, Nairobi, 2022.
van der Werf, G. R., Randerson, J. T., Giglio, L., Collatz, G. J., Kasibhatla, P. S., and Arellano Jr., A. F.: Interannual variability in global biomass burning emissions from 1997 to 2004, Atmos. Chem. Phys., 6, 3423–3441, https://doi.org/10.5194/acp-6-3423-2006, 2006.
van Lierop, P., Lindquist, E., Sathyapala, S., and Franceschini, G.: Global forest area disturbance from fire, insect pests, diseases and severe weather events, Forest Ecol. Manag., 352, 78–88, https://doi.org/10.1016/j.foreco.2015.06.010, 2015.
Van Wagner, C. E.: Structure of the Canadian Forest Fire Weather Index, Canadian Forestry Service Publication no. 1333, Ottawa, 49 pp., 1974.
Van Wagner, C. E.: Development and structure of the Canadian forest fire weather index system, Canadian Forestry Service, Forestry Technical Report 35, Ottawa, 37 pp., ISBN 0-662-15198-4, 1987.
van Wees, D., van der Werf, G. R., Randerson, J. T., Andela, N., Chen, Y., and Morton, D. C.: The role of fire in global forest loss dynamics, Glob. Change Biol., 27, 2377–2391, https://doi.org/10.1111/gcb.15591, 2021.
Vautard, R., Kadygrov, N., Iles, C., Boberg, F., Buonomo, E., Bülow, K., Coppola, E., Corre, L., van Meijgaard, E., Nogherotto, R., Sandstad, M., Schwingshackl, C., Somot, S., Aalbers, E., Christensen, O. B., Ciarlo, J. M., Demory, M. E., Giorgi, F., Jacob, D., Jones, R. G., Keuler, K., Kjellström, E., Lenderink, G., Levavasseur, G., Nikulin, G., Sillmann, J., Solidoro, C., Sørland, S. L., Steger, C., Teichmann, C., Warrach-Sagi, K., and Wulfmeyer, V.: Evaluation of the Large EURO-CORDEX Regional Climate Model Ensemble, J. Geophys. Res.-Atmos., 126, 1–28, https://doi.org/10.1029/2019JD032344, 2021.
Vitolo, C., Di Giuseppe, F., Krzeminski, B., and San-Miguel-Ayanz, J.: Data descriptor: A 1980–2018 global fire danger re-analysis dataset for the Canadian fire weather indices, Sci. Data, 6, 1–10, https://doi.org/10.1038/sdata.2019.32, 2019.
Vitolo, C., Di Giuseppe, F., Barnard, C., Coughlan, R., San-Miguel-Ayanz, J., Libertá, G., and Krzeminski, B.: ERA5-based global meteorological wildfire danger maps, Sci. Data, 7, 1–11, https://doi.org/10.1038/s41597-020-0554-z, 2020.
Wang, X., Wotton, B. M., Cantin, A. S., Parisien, M. A., Anderson, K., Moore, B., and Flannigan, M. D.: cffdrs: an R package for the Canadian Forest Fire Danger Rating System, Ecol. Process., 6, 1–11, https://doi.org/10.1186/s13717-017-0070-z, 2017.
Westerling, A. L., Hidalgo, H. G., Cayan, D. R., and Swetnam, T. W.: Warming and earlier spring increase Western U. S. forest wildfire activity, Science, 313, 940–943, https://doi.org/10.1126/science.1128834, 2006.
Williams, A. P. and Abatzoglou, J. T.: Recent Advances and Remaining Uncertainties in Resolving Past and Future Climate Effects on Global Fire Activity, Curr. Clim. Chang. Reports, 2, 1–14, https://doi.org/10.1007/s40641-016-0031-0, 2016.
Wotton, B. M.: Interpreting and using outputs from the Canadian Forest Fire Danger Rating System in research applications, Environ. Ecol. Stat., 16, 107–131, https://doi.org/10.1007/s10651-007-0084-2, 2009.
Yang, J., Tian, H., Tao, B., Ren, W., Kush, J., Liu, Y., and Wang, Y.: Spatial and temporal patterns of global burned area in response to anthropogenic and environmental factors: Reconstructing global fire history for the 20th and early 21st centuries, J. Geophys. Res.-Biogeo., 119, 249–263, https://doi.org/10.1002/2013JG002532, 2014.
Zelinka, M. D., Myers, T. A., McCoy, D. T., Po-Chedley, S., Caldwell, P. M., Ceppi, P., Klein, S. A., and Taylor, K. E.: Causes of higher climate sensitivity in CMIP6 models, Geophys. Res. Lett., 47, e2019GL085782, https://doi.org/10.1029/2019JD032356, 2020.
Zumbrunnen, T., Bugmann, H., Conedera, M., and Bürgi, M.: Linking forest fire regimes and climate – A historical analysis in a dry inner Alpine valley, Ecosystems, 12, 73–86, https://doi.org/10.1007/s10021-008-9207-3, 2009.