the Creative Commons Attribution 4.0 License.
the Creative Commons Attribution 4.0 License.
 | 26 Apr 2023
Implementation of trait-based ozone plant sensitivity in the Yale Interactive terrestrial Biosphere model v1.0 to assess global vegetation damage
Yimian Ma
Stephen Sitch
Nadine Unger
Johan Uddling
Lina M. Mercado
Cheng Gong
Zhaozhong Feng
Huiyi Yang
Chenguang Tian
Yang Cao
Yadong Lei
Alexander W. Cheesman
Yansen Xu
Maria Carolina Duran Rojas
A major limitation in modeling global ozone (O3) vegetation damage has long been the reliance on empirical O3 sensitivity parameters derived from a limited number of species and applied at the level of plant functional types (PFTs), which ignore the large interspecific variations within the same PFT. Here, we present a major advance in large-scale assessments of O3 plant injury by linking the trait leaf mass per area (LMA) and plant O3 sensitivity in a broad and global perspective. Application of the new approach and a global LMA map in a dynamic global vegetation model reasonably represents the observed interspecific responses to O3 with a unified sensitivity parameter for all plant species. Simulations suggest a contemporary global mean reduction of 4.8 % in gross primary productivity by O3, with a range of 1.1 %–12.6 % for varied PFTs. Hotspots with damage >10 % are found in agricultural areas in the eastern US, western Europe, eastern China, and India, accompanied by moderate to high levels of surface O3. Furthermore, we simulate the distribution of plant sensitivity to O3, which is highly linked with the inherent leaf trait trade-off strategies of plants, revealing high risks for fast-growing species with low LMA, such as crops, grasses, and deciduous trees.
- Article
(5526 KB) - Full-text XML
-
Supplement
(3456 KB) - BibTeX
- EndNote


Tropospheric ozone (O3) has long been recognized as a hazardous pollutant for plants (Richards et al., 1958; Reich and Amundson, 1985). As a strong oxidant, O3 can cause damage to leaf cells (Feng et al., 2014), impact stomata conductance (Buker et al., 2015), and reduce photosynthesis and biomass (Wittig et al., 2009). These negative impacts dampen global plant productivity (Ainsworth et al., 2012, 2020) and crop yield (Tai et al., 2014; Emberson et al., 2018; Feng et al., 2022), altering multiple ecosystem functions and services across various spatiotemporal scales (Agathokleous et al., 2020; Feng et al., 2021). Thus, it is of crucial importance to quantify O3 plant damage in global modeling and assess its coupling effects in biosphere–atmosphere systems (Zhou et al., 2018).
To date, O3 fumigation experiments have been conducted for various plant species. Accordingly, O3 damage sensitivities, denoted as the dose–response relationships (DRRs), were derived as regressions between O3 exposure metrics and changes in biotic indicators (Mills et al., 2011). The widely used O3 metrics include ambient O3 concentrations for AOT40 (accumulated O3 concentration above the threshold of 40 ppbv; Fuhrer et al., 1997) or the stomatal O3 flux for PODy (phytotoxic O3 dose above a threshold flux of y; Buker et al., 2015). The biotic indicators include visual leaf states, photosynthetic rate, biomass, or crop yield. Normally, the DRRs were derived for typical tree/grass species in specific regions, for example, Norway spruce, birch, and beech in Europe (Buker et al., 2015) or poplar (Shang et al., 2017) and crops (Peng et al., 2019) in East Asia.
Some assessment studies used DRRs to derive contemporary O3 plant damage patterns at large scales. Concentration-based DRRs were widely measured and applied on the homogenized land cover, mostly for estimating crop yield loss (Feng et al., 2022; Tai et al., 2021; Hong et al., 2020). However, such DRRs do not include information about biochemical defense and stomatal regulation. In comparison, flux-based DRRs reflect a more detailed consideration in biological processes but are limited by the application scales in both space and time (Mills et al., 2011, 2018b). For example, the estimate of PODy needs a dry deposition model, “DO3SE” (Deposition of Ozone for Stomatal Exchange) (LRTAP Convention, 2017), or an equivalent model to account for environmental constraints on plant stomatal uptake during the whole growing season. Furthermore, the application of DRRs might introduce uncertainties due to the omission of complex interactions among biotic and abiotic factors at varied spatiotemporal scales.
Alternatively, more and more mechanistic schemes were developed and implemented in dynamic global vegetation models (DGVMs) to assess the joint effects of environmental factors and O3 on plants. Felzer et al. (2004) considered both the damaging (through AOT40) and healing (through growth) processes related to O3 effects within the framework of the Terrestrial Ecosystem Model. They further estimated a reduction of 2.6 %–6.8 % in the net primary productivity by O3 pollution in the US during 1980–1990. Different from Felzer et al. (2004), Sitch et al. (2007) proposed a flux-based scheme linking the instantaneous PODy with plant damage through the coupling between stomatal conductance and photosynthetic rate. Implementing this scheme into the Yale Interactive terrestrial Biosphere (YIBs) vegetation model, Yue and Unger (2015) predicted a range of 2 %–5 % reduction in global gross primary productivity (GPP) taking into account the low to high O3 sensitivities for each vegetation type. Lombardozzi et al. (2015) collected hundreds of measurements and derived the decoupled responses on stomatal conductance and photosynthesis for the same O3 uptake fluxes. They further implemented the separate response relationships into the Community Land Model and estimated a reduction of 8 %–12 % in GPP by O3 in the present day. Coupling these schemes with Earth system models, studies have assessed interactive O3 impacts on the carbon sink (Oliver et al., 2018; Yue and Unger, 2018), global warming (Sitch et al., 2007), and air pollution (Zhou et al., 2018; Gong et al., 2020, 2021; Zhu et al., 2022).
Although different schemes considered varied physical processes (Ollinger et al., 1997; Felzer et al., 2004, 2009; Sitch et al., 2007; Lombardozzi et al., 2015; Oliver et al., 2018), they followed the same principle that different O3 sensitivities should be applied for varied plant functional types (PFTs), as revealed by many measurements in the past 4 decades (Buker et al., 2015; Mills et al., 2018b) (Table S1 in the Supplement). Generally, needleleaf trees, deciduous woody plants, and crop species show ascending sensitivities to O3 (Reich and Amundson, 1985; Davison and Barnes, 1998; Buker et al., 2015). But the cause of such variation is not fully understood and thus has not been uniformly described in vegetation models (Massman et al., 2000; Tiwari et al., 2016). As a result, all large-scale assessments of O3 vegetation damage had to rely on a PFT-based range of sensitivity parameters derived from a limited number of plant species and attempted to envelop the range of O3 impacts by assuming all species within a PFT have either a “high” or “low” sensitivity to O3. For example, Felzer et al. (2004) defined empirical sensitivity coefficients for three major plants including deciduous trees, coniferous trees, and crops. In Sitch et al. (2007), the sensitivity coefficients were defined separately for five PFTs with high/low ranges calibrated by DRRs of typical species. These synthesized assumptions cannot resolve the intra-PFT variations in the O3 sensitivity and thus may cause large uncertainties in regional to global assessments.
Recent observations revealed a uniform plant sensitivity to O3 if stomatal O3 flux was expressed based on a leaf mass rather than leaf area basis (Li et al., 2016, 2022; Feng et al., 2018). The trait of leaf mass per area (LMA) is an important metric linking leaf area to mass. In a comparative study with 21 woody species (Li et al., 2016) and a meta-analysis of available experimental data (Feng et al., 2018), the DRR showed convergent O3 sensitivities for conifer and broadleaf trees if the area-based stomatal uptake was converted to the mass-based flux with LMA. This is likely related to the diluting effect of thicker leaves, which normally have stronger defenses against O3 in their cross-section. Nowadays, a large number of trait observations have been synthesized by global networks (Gallagher et al., 2020). The TRY initiative (Kattge et al., 2011) was one of the most influential datasets with 2.3 billion trait data by the year 2021. Based on the TRY dataset, global LMA was estimated with upscaling techniques such as Bayesian modeling (Butler et al., 2017) (hereafter B2017) or the random forest model (Moreno-Martinez et al., 2018) (hereafter M2018). These advances in the retrieval of LMA provide the possibility to depict more accurate O3 vegetation damage at the global scale.
Here, we present a major advance in large-scale assessments of O3 plant damage using a trait-based approach. We implement LMA into a stomatal flux-based O3 damage framework aiming at a unified representation of plant O3 sensitivities over the global grids. We couple this new approach to the Yale Interactive terrestrial Biosphere (YIBs) model (Yue and Unger, 2015) and evaluate the derived O3 sensitivities against observations. We further assess contemporary O3 impacts on global GPP in combination with the recently developed LMA datasets (Butler et al., 2017; Moreno-Martinez et al., 2018; Gallagher et al., 2020) (Fig. 1a) and the multi-model ensemble mean surface O3 concentrations (Fig. 1b). The updated risk map for O3 vegetation damage is used to identify the regions and vegetation types most at risk of O3 damage.
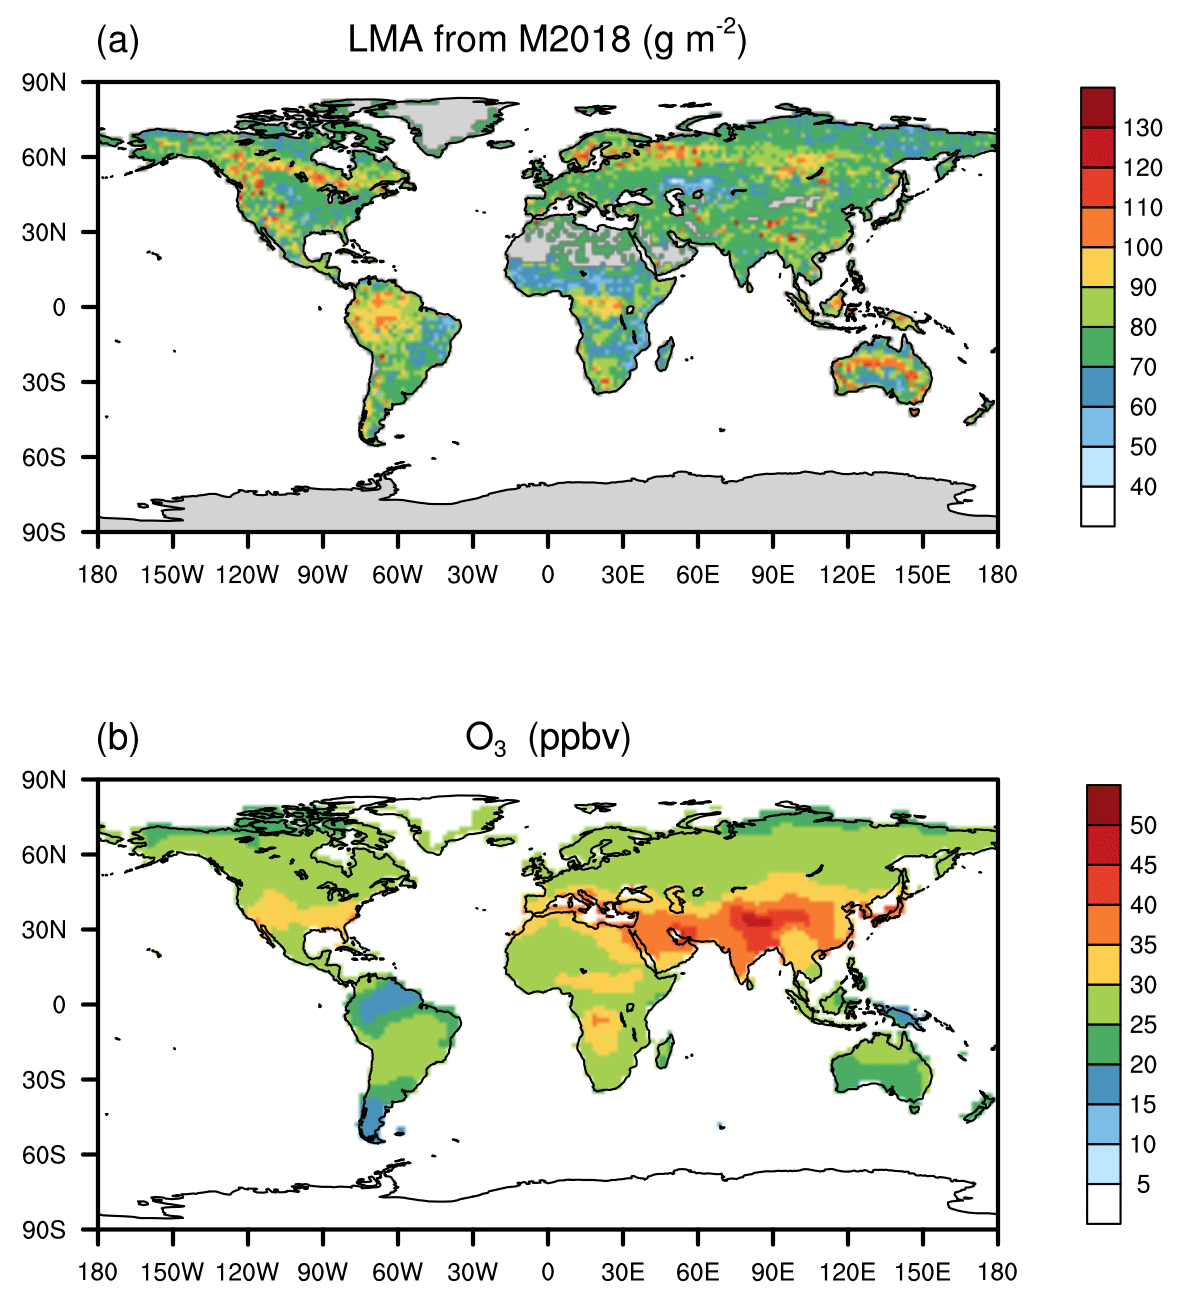
Figure 1Global leaf mass per area (LMA) and surface ozone (O3) concentrations. The (a) LMA is adopted from Moreno-Martinez et al. (2018) (M2018) and (b) annual mean O3 is derived from TF-HTAP (Turnock et al., 2018).
2.1 The trait-based O3 vegetation damage scheme
We develop the new scheme based on the Sitch et al. (2007) (hereafter S2007) framework for transient O3 damage calculation. In the original S2007 scheme, the undamaged fraction F for net photosynthetic rate is dependent on the excessive area-based stomatal O3 flux, which is calculated as the difference between and PFT-specific area-based threshold y, and modulated by the sensitivity parameter aPFT:
where aPFT is calibrated and varies among PFTs with a typical range from “low” to “high” values indicating uncertainties of plant species within the same PFT. The stomatal O3 flux (nmol m−2 s−1) is calculated as
where [O3] is the O3 concentration at the reference level (nmol m−3), and r is the aerodynamic and boundary layer resistance between leaf surface and reference level (s m−1). The setting of to 1.67 represents the ratio of leaf resistance for O3 to that for water vapor. gp represents potential stomata conductance for H2O (m s−1).
Studies suggested that LMA could be used to unify the area-based plant sensitivities to O3 (Li et al., 2016; Feng et al., 2018), resulting in a constant mass-based parameter a independent of plant species and PFTs:
Here, we convert the area-based O3 stomatal flux expression in Eq. (1) to a mass-based flux as follows:
where the new sensitivity parameter a is a cross-species constant (nmol−1 s g), LMA is leaf mass per area (g m−2), and the flux threshold is replaced by a mass-based value of x (nmol g−1 s−1) (Feng et al., 2018). Equations (2) and (4) can form a quadratic equation. F can be derived at each time step (i.e., hourly) and applied to net photosynthetic rate and stomatal conductance to calculate the O3-induced damage. The updated LMA-based framework (YIBs-LMA) reduces the number of O3 sensitivity parameters from three for each PFT (Sitch et al., 2007) in S2007 to a single parameter a for all PFTs. For the YIBs-LMA framework, the default value of the x threshold in Eq. (4) is set to 0.019 nmol g−1 s−1, as recommended by Feng et al. (2018).
2.2 Dose–response relationship (DRR)
We compare the simulated and observed sensitivities to O3 so as to calibrate the LMA-based scheme. In field experiments, DRR is used to quantify species-specific damage by O3 with a generic format as follows:
where R (%) is the relative percentage of a biotic indicator (such as biomass or yield) after and before O3 damage, is an area-based O3 metric (e.g., PODy measured in sunlit leaves at the top of canopy), and SO (usually negative) is the observed sensitivity derived as the slope of linear relationship between R and . We collected SO from DRRs with conventional criteria (typically PODy=1 for natural PFTs and PODy=6 for crops as dose metrics (LRTAP Convention, 2017); the biotic indicators include the relative biomass for natural PFTs and relative yield for crops) among plant species from the International Cooperative Programme on Effects of Air Pollution on Natural Vegetation and Crops (CLRTAP) (LRTAP Convention, 2017) and multiple literature sources (Table S1). Such observations are used to calibrate the LMA-based scheme.
As a comparison with observations, we calculate annual relative GPP percentage (RGPP, %) and PODy of sunlit leaves in the first canopy layer (mmol m−2 yr−1, based on per leaf area) from the vegetation model to derive the slopes (SS) of simulated DRRs. Here, PODy is a diagnostic variable calculated as
where represents the stomatal O3 flux under instant O3 stimulus at each time step, which can be calculated following Eq. (2) at the leaf level, and y is the prescribed critical level (1 nmol m−2 s−1 for natural or 6 nmol m−2 s−1 for crop species; LRTAP Convention, 2017). Excessive O3 flux above y is accumulated for the sunlit leaves of the top canopy layer and over the growing season to derive the PODy. The simulated SS is calculated as the slope of the regression between simulated RGPP (%) and PODy at the PFT level. Only the dominant PFT in each grid is considered for the estimate of SS at both PFT level and gridded analyses.
Similarly, the mass-based PODx is derived from O3-impacted (nmol m−2 s−1) in Eq. (2), together with gridded LMA (g m−2) and mass-based threshold x (nmol g−1 s−1), as
Table 1Summary of simulations.
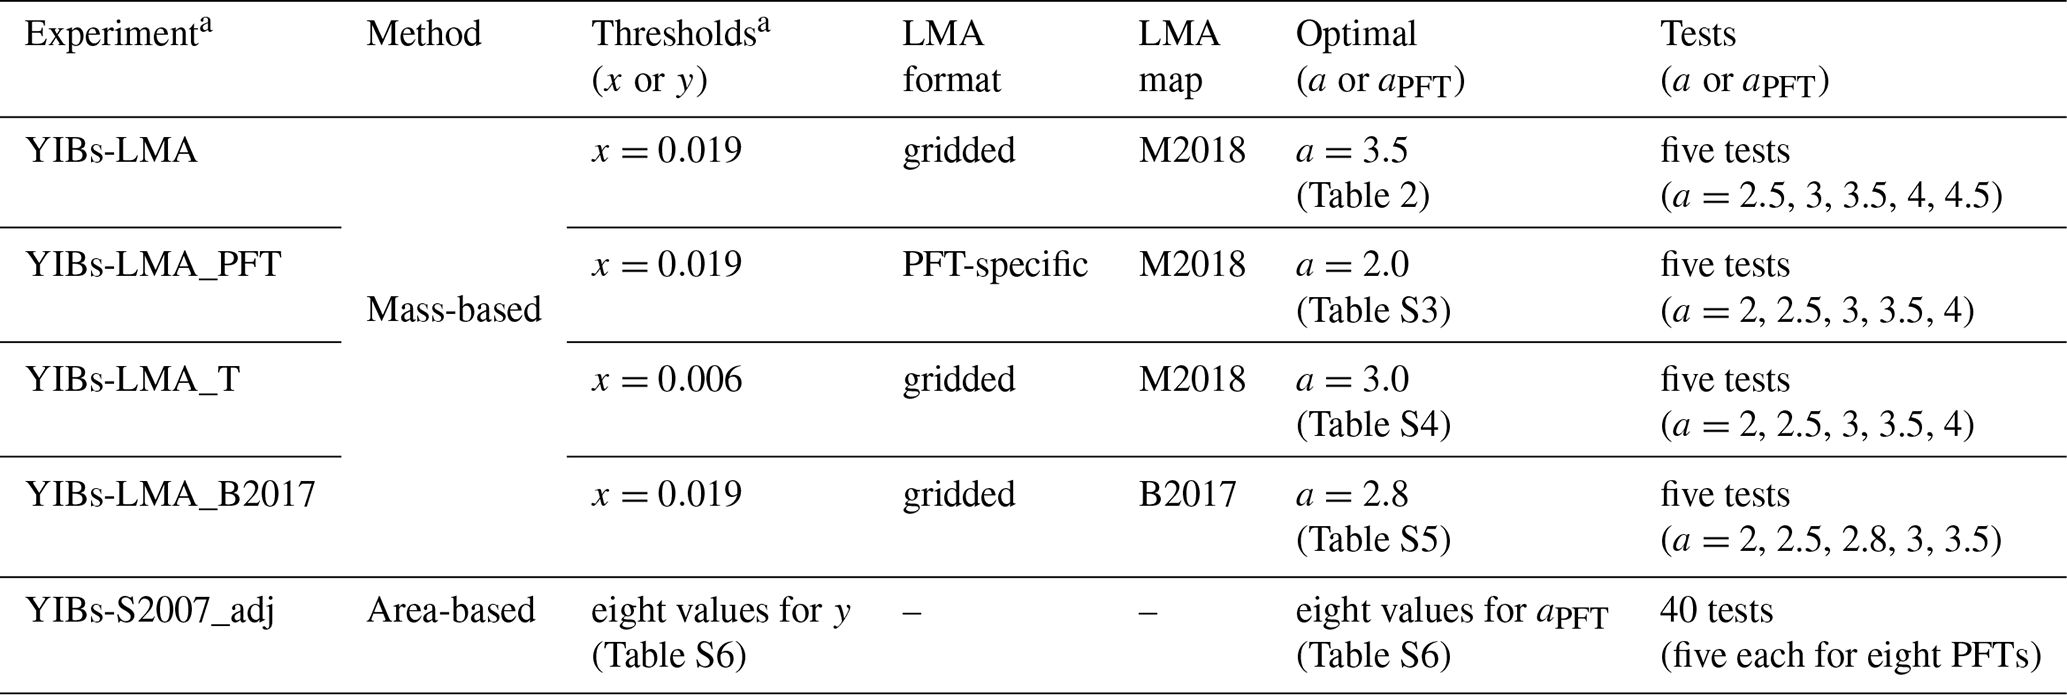
a Units of thresholds are nmol g−1 s−1 for x and nmol m−2 s−1 for y. b Units of key parameters are nmol−1 s g for a and nmol−1 m2 s for aPFT.
2.3 Simulations and calibrations
We perform two groups of supporting experiments (Table 1). The first group explores modeling uncertainties associated with the mass-based framework: (1) YIBs-LMA_B2017 replaces the default LMA map of M2018 (Moreno-Martinez et al., 2018) with B2017 (Butler et al., 2017). (2) YIBs-LMA_PFT applies PFT-specific LMA values (Table S2) for each PFT without considering global LMA geo-gradient. (3) YIBs-LMA_T replaces the default threshold of x=0.019 nmol g−1 s−1 with x=0.006 nmol g−1 s−1, which is an alternative parameter suggested by observations (Feng et al., 2018). The second group of supporting experiments explores the differences between mass-based and S2007 area-based frameworks. Typically, S2007 has a “low to high” aPFT range for each PFT. Here, a mean sensitivity parameterization of S2007 (YIBs-S2007_adj) is re-calibrated according to SO in Table S1.
Table 2Calibrations of the YIBs-LMAa experiment with varied a.
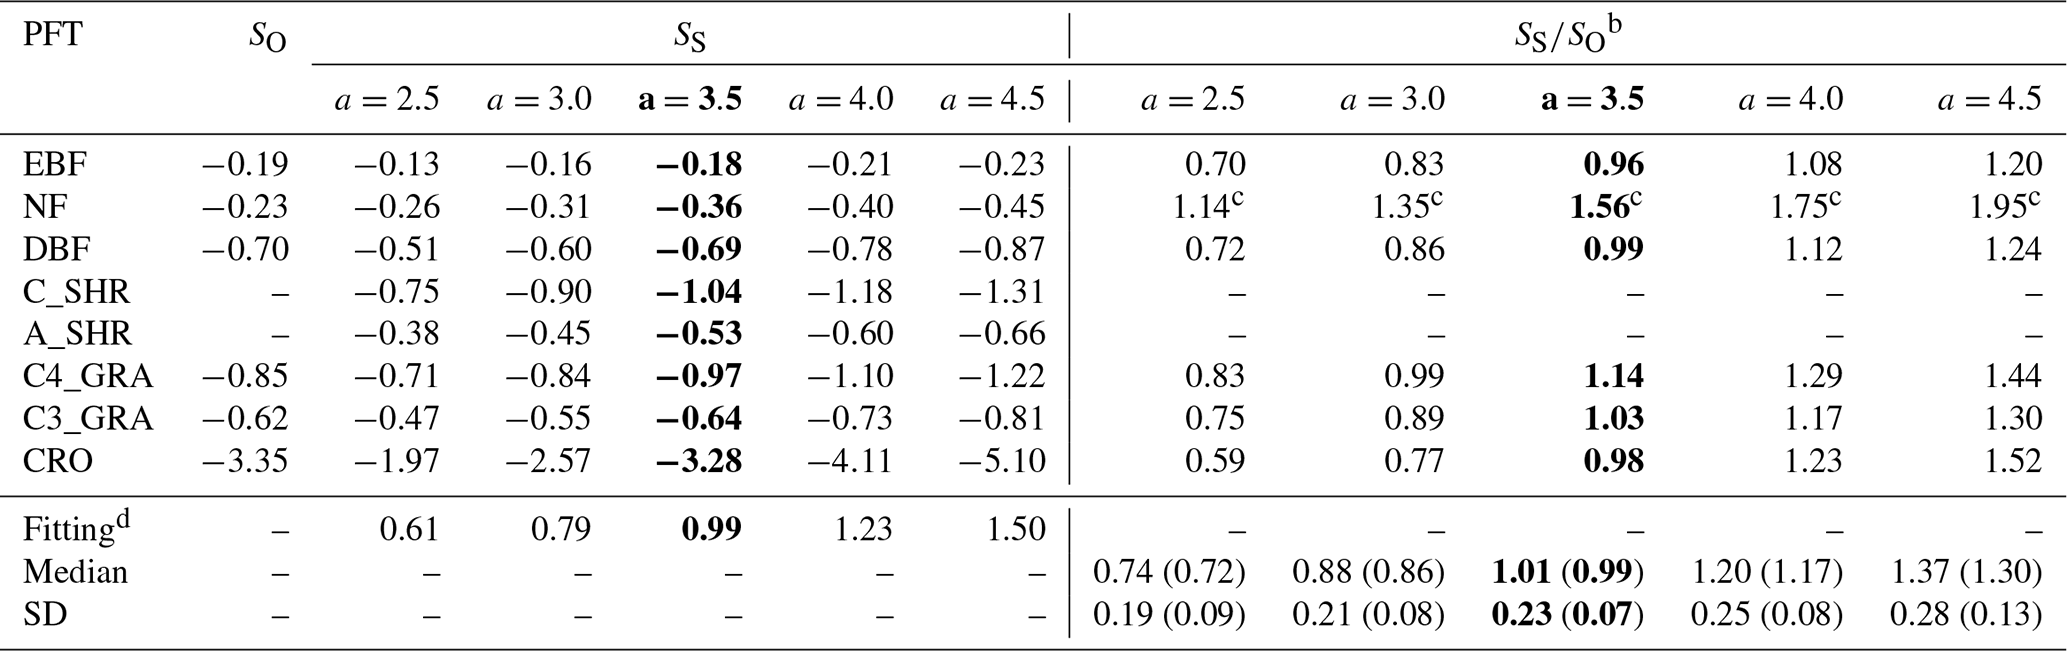
a All runs from the YIBs-LMA experiment use x=0.019 nmol g−1 s−1 and the LMA map from M2018. b Slopes of simulated DRRs (SS) are divided by observations (SO, Table S1) to derive the model-to-observation ratios (“”). The O3 dose metric is PODy=1 for natural PFTs and PODy=6 for crops. The median and standard deviation (SD) of ratios of all PFTs are calculated for each set of specific parameter a. The values in parentheses exclude the effect of those numbers marked with c that are beyond 1 standard deviation. d The slopes (fitting) of linear regressions between SO and SS are listed for each a. The optimal a values with 1:1 fitting between SS and SO are shown in bold.
For all supporting experiments, the parameter a for YIBs-LMA or the eight mean aPFT values for YIBs-S2007_adj are derived with the optimal 1:1 fitting between SS and SO to minimize the possible biases (Tables 2 and S3–S6). The basic method for calibration is feeding the model with series values of a or aPFT until the predicted O3 damage matches observations with the lowest normalized mean bias (NMB). For all LMA-based experiments, SS values from varied PFTs grouped for the calibration of a, while for aPFT in YIBs-S2007_adj, each aPFT is determined individually by matching simulated SS with SO. Since SO values are available only for six out of the eight YIBs PFTs, including evergreen broadleaf forest (EBF), needleleaf forest (NF), deciduous broadleaf forest (DBF), C3 grass, C4 grass, and crop (Table S1), SO values of these PFTs are used for calibration. All runs are summarized in Table 1.
2.4 YIBs model and forcing data
In this study, all O3 vegetation damage schemes are implemented in the YIBs model (Yue and Unger, 2015), which is a process-based dynamic global vegetation model incorporated with well-established carbon, energy, and water interactive schemes. The model applies the same PFT classifications as the Community Land Model (Bonan et al., 2003) (Fig. S1 in the Supplement). Eight PFTs are employed including evergreen broadleaf forest (EBF), needleleaf forest (NF), deciduous broadleaf forest (DBF), cold shrub (C_SHR), arid shrubland (A_SHR), C3 grassland (C3_GRA), C4 grassland (C4_GRA), and cropland (CRO) (Fig. S1). For each PFT, phenology is well evaluated (Yue and Unger, 2015) to generate a reliable growing season, which is crucial for the simulation of stomatal O3 uptake (Anav et al., 2018). Photosynthesis and stomatal processes are calculated using Farquhar et al. (1980) and Ball et al. (1987) algorithms, respectively. Leaf area index (LAI) and tree height are predicted dynamically based on vegetation carbon allocation. The YIBs model has joined the multi-model ensemble project TRENDY and showed reasonable performance in the simulations of global biomass, GPP, LAI, net ecosystem exchange, and soil carbon relative to observations (Friedlingstein et al., 2022). Key plant biogeochemical parameters of the YIBs model are adjusted for this research (Table S7).
The hourly Modern-Era Retrospective Analysis for Research and Applications version 2 (MERRA2) climate reanalyses (Gelaro et al., 2017) are used to drive the YIBs model. The gridded LMA required for the main mass-based simulation is derived from Moreno-Martinez et al. (2018) (M2018), which shows the highest value of >150 g m−2 for needleleaf forest at high latitudes while low values of ∼40 g m−2 for grassland and cropland (Figs. 1a and S1). Grids with missing LMA data are filled with the mean of the corresponding PFT. Contemporary O3 concentration fields in the year 2010 from the multi-model mean in Task Force on Hemispheric Transport of Air Pollutants (TF-HTAP) experiments (Turnock et al., 2018) (Fig. 1b) are used as forcing data. The original monthly O3 data are downscaled to an hourly scale using the diurnal cycle predicted by the chemistry–climate–carbon fully coupled model ModelE2-YIBs (Yue and Unger, 2015). Generally, areas of severe O3 pollution are found in the midlatitudes of the Northern Hemisphere, with the highest annual average O3 concentration of over 40 ppbv in East Asia. All data are interpolated to a spatial resolution of .

Figure 2Simulated area-based (a, b, c) or mass-based (d, e, f) DRRs for the YIBs-LMA experiment. Three tests from the YIBs-LMA experiment all adopt x=0.019 nmol g−1 s−1 and gridded LMA from M2018 with parameter a=2.5, 3.5, and 4.5 nmol−1 s g, respectively. Each dot represents estimated POD-RGPP (PODy=1 for a–c, PODx=0.019 for d–e) at a grid with corresponding PFT. The PFT-specific regressions between area- or mass-based POD and RGPP are displayed with solid lines shown in legend. Regression relationships of all PFTs are displayed by the dashed black line, with coefficients of determination (R2) denoted in each panel. Note the differences of ranges in x axis among PFTs. The YIBs-LMA experiment is summarized in Table 1.
3.1 Comparison of simulated sensitivities with observations
Simulated relative GPP percentage (RGPP) values at global grids were sorted by dominant PFTs (Fig. S1) and plotted against area-based accumulated phytotoxic O3 dose above a threshold y nmol m−2 s−1 (PODy=1) at the corresponding grids (Fig. 2). The DRR shows varied slopes among different PFTs, resulting in a coefficient of determination (R2) around 0.54 for all PFTs (Fig. 2a–c). We further calculated the mass-based accumulated phytotoxic O3 dose above a threshold of 0.019 nmol g s−1 (PODx=0.019) and compared it with RGPP. The updated DRR showed convergent slopes and reached a high R2 of 0.77 across all PFTs (Fig. 2d–f), suggesting that the mass-based scheme could better unify O3 sensitivities among different PFTs.
We then calibrated the single, best-fit a value for the YIBs-LMA framework by minimizing the absolute difference between simulated (SS) and observed (SO) slopes of O3 DRR for all PFTs. With different a parameters, the YIBs-LMA framework yielded considerably high R2 values of ∼1.0 but varied biases between simulated and observed O3 impacts across PFTs (Fig. 3). Both the 1:1 fitting and the lowest bias between SS and SO were achieved with an optimal a=3.5 nmol−1 s g (Fig. 3c). Notably, such calibration of a is robust under different O3 fields (see Fig. S2). Consistent with observations, YIBs-LMA with this optimal a parameter simulated low SS values of −0.18 % and −0.36 % per mmol m−2 yr−1 of PODy=1 for evergreen broadleaf forest and needleleaf forest, respectively (Fig. 4a, b); median SS values from −0.53 % per mmol m−2 yr−1 for arid shrubland (Fig. 4e); and high SS values from −0.64 % to −1.04 % per mmol m−2 yr−1 for deciduous broadleaf forest, C3 and C4 grassland, cropland, and cold shrubland (−3.28 % for crops with PODy=6; Fig. 4c–d, f–h).

Figure 3Comparison between SO (% per mmol m−2) and SS (% per mmol m−2) for the YIBs-LMA experiment. Five tests from the YIBs-LMA experiment all adopt x=0.019 nmol g−1 s−1 and gridded LMA from M2018 but with varied parameter a from (a) 2.5 to (e) 4.5 nmol−1 s g. SO values are from Table S1. SS values are derived as the slope between RGPP and PODy. The linear regression (dashed lines), 1:1 fitting (light-grey lines), normalized mean bias (NMB), and correlation coefficient (r) between SS and SO for varied PFTs are shown on each panel. The SS and SO of CRO are derived using PODy=6, while other PFTs use PODy=1. The YIBs-LMA experiment is described in Table 1.
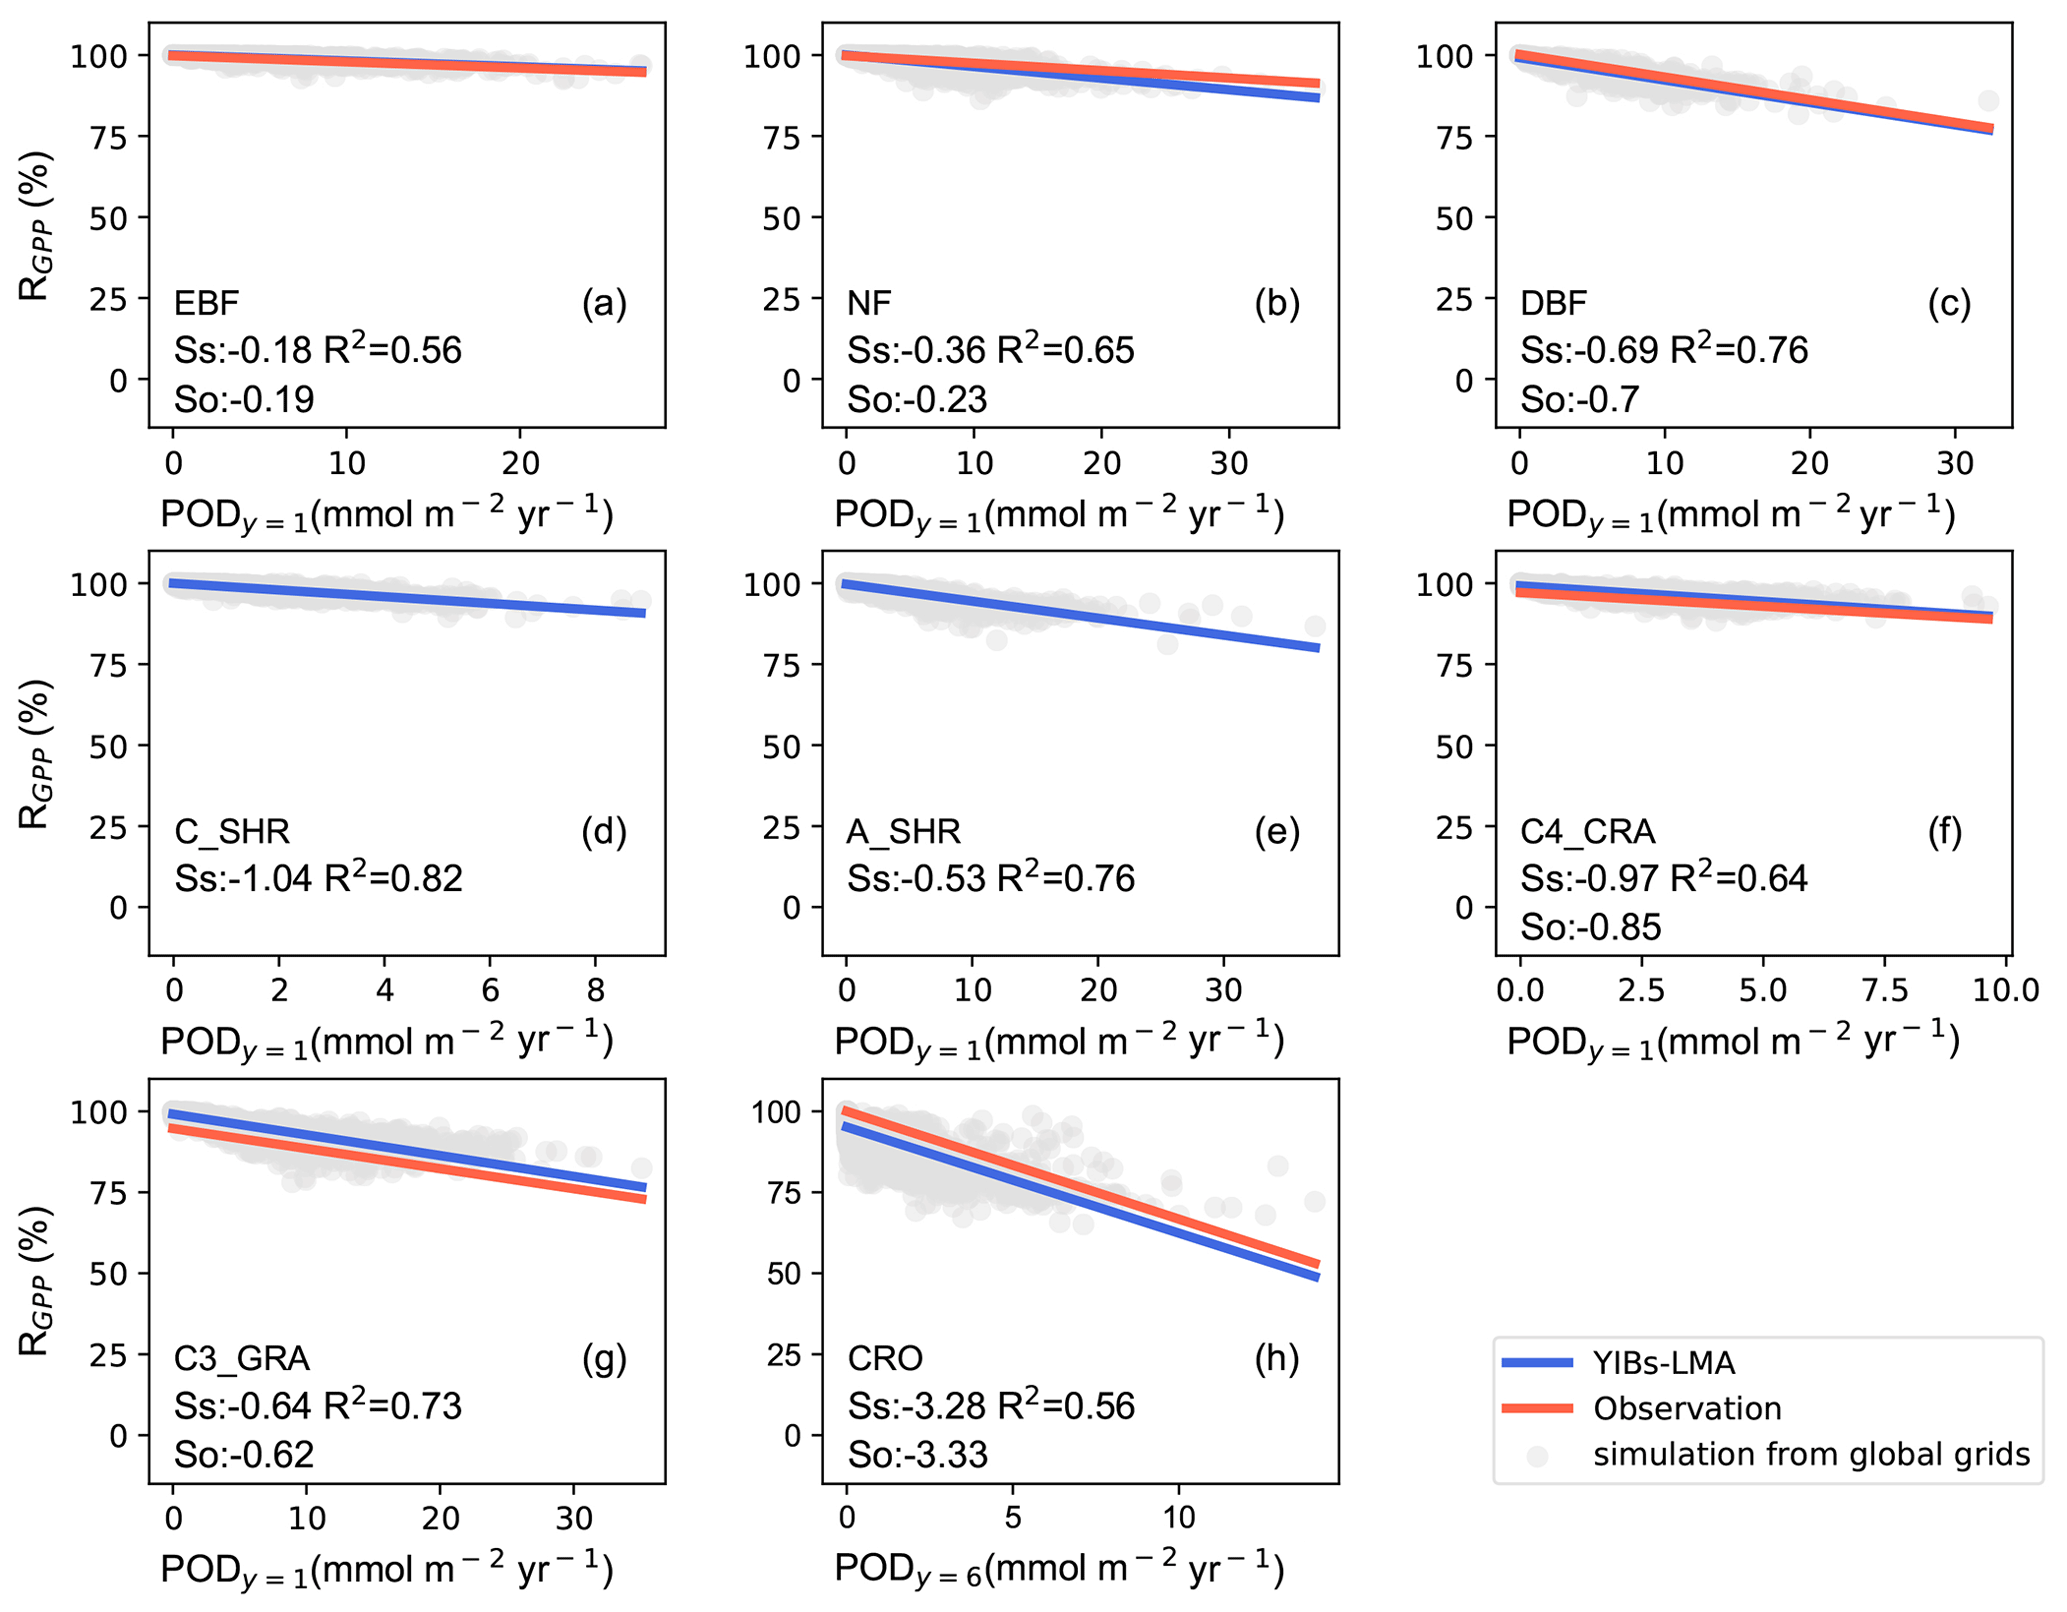
Figure 4Comparisons of observed and simulated dose–response relationships. Simulated PFT-specific DRRs are derived from YIBs-LMA with gridded LMA from M2018, x=0.019 nmol g−1 s−1, and a=3.5 nmol−1 s g. Each dot represents results from a grid cell with corresponding PFT. The regressions between relative GPP percentage (RGPP) and leaf area-based stomatal O3 uptake fluxes (PODy=1 for natural PFTs and PODy=6 for crops) are shown for observations (red; see Table S1) and simulations (blue) with slopes of DRRs denoted as SO and SS, respectively. SO values are missing for (d) cold and (e) arid shrubs. Coefficients of determination (R2) of simulations are displayed in each panel. Note the differences of ranges in x axis among PFTs (PFTs are shown in Fig. S1).
3.2 Global map of O3 vegetation damage
We estimated contemporary GPP reductions induced by O3 with the global concentrations of surface O3 (Fig. 1b) in the year 2010. The YIBs-LMA framework using an increase of a parameter yielded an almost linear enhancement of global GPP reduction (Fig. S3) with consistent spatial distributions (Fig. S4). The simulation with the optimal a=3.5 nmol−1 s g predicted a global GPP reduction of 4.8 % (Fig. 5a), which was similar to the value estimated with the area-based S2007 scheme (YIBs-S2007_adj, Table 1). Large reductions of >10 % were predicted over the eastern US, western Europe, eastern China, and India (Fig. 5a). Hotspots were mainly located in cropland and agricultural areas mixed with deciduous broadleaf forest or grassland, accompanied by moderate to high levels of surface O3. Few discrepancies between the damage maps of YIBs-LMA and YIBs-S007_adj were found (Figs. 5b and S5), even though the number of parameters was greatly reduced in the YIBs-LMA scheme.
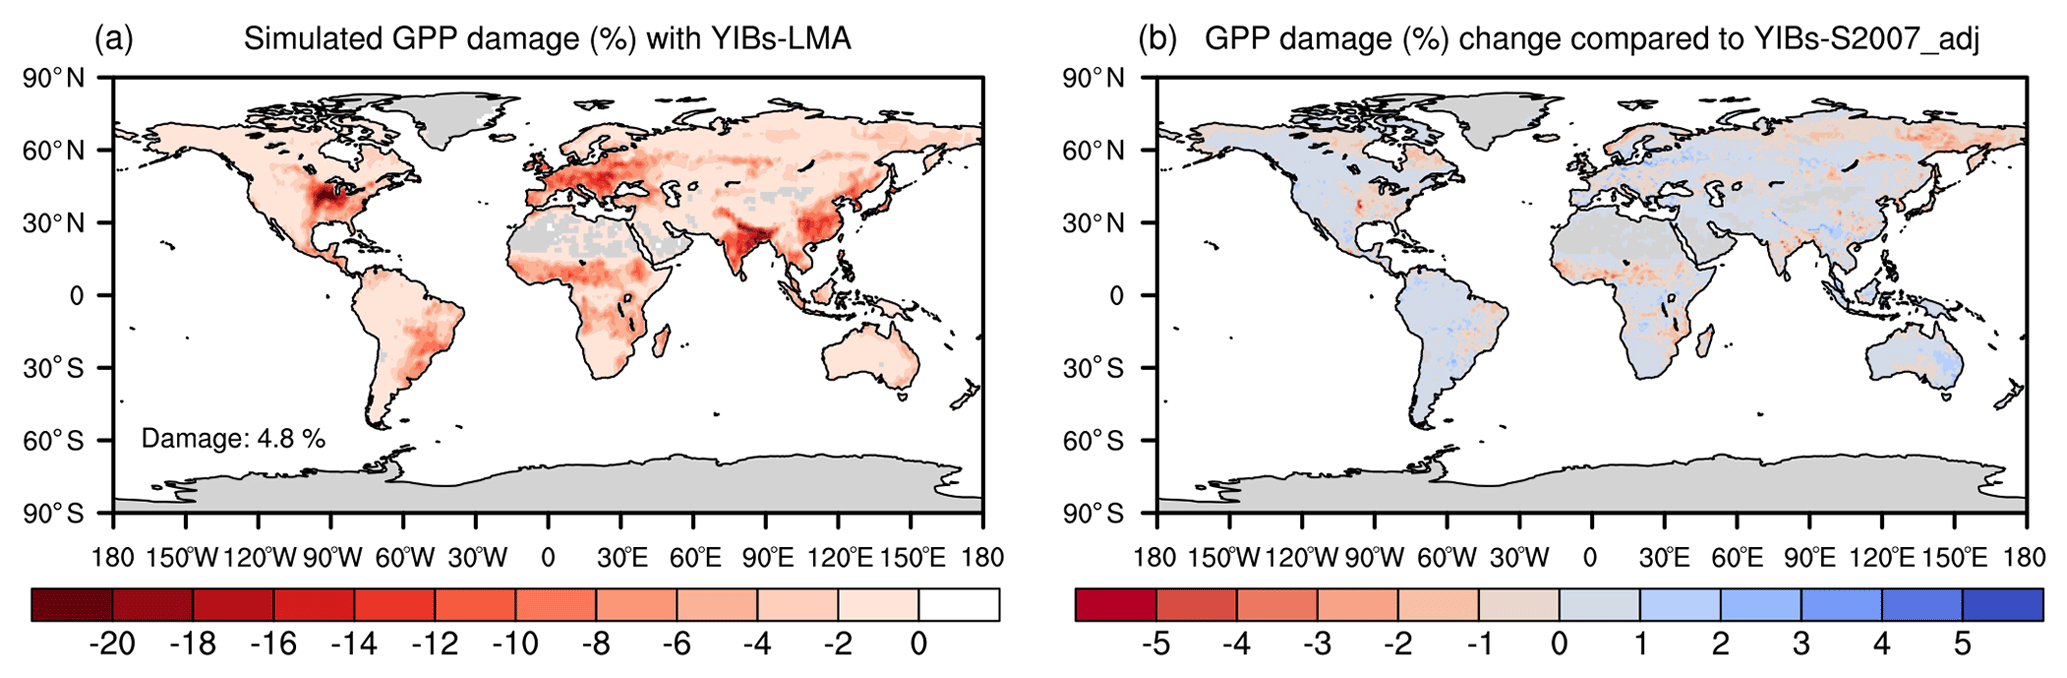
Figure 5Global O3 vegetation damage simulated with the LMA-based scheme. Results shown are the (a) GPP reduction percentages by O3 simulated with the YIBs-LMA framework (gridded LMA from M2018, x=0.019 nmol g−1 s−1, and a=3.5 nmol−1 s g) and (b) their differences compared to the predictions from YIBs-S2007_adj simulation. Blue (red) patches indicate the regions where damage predicted in YIBs-LMA is lower (higher) than in YIBs-S2007_adj.
For YIBs-LMA, PFTs with low LMA such as cropland, grassland, and deciduous broadleaf forest account for 73.3 Pg C yr−1 (50.0 %) of the global GPP (Table S8). However, these PFTs contributed to a total GPP reduction of 5.4 Pg C yr−1 (75.5 % of total GPP loss) by O3 damage. In contrast, evergreen broadleaf and needleleaf forests with high LMA accounted for 48.8 Pg C yr−1 (33.0 %) of total GPP but yielded only a reduction of 0.75 Pg C yr−1 (10.5 % of total GPP loss). Differences in GPP percentage losses were in part associated with the global pattern of O3 concentrations, which were usually higher over midlatitudes with populated cities and dense crop plantations (Fig. 1b). However, the differences in LMA and simulated O3 sensitivities of these PFTs also made important contributions to such discrepancies in GPP damage.
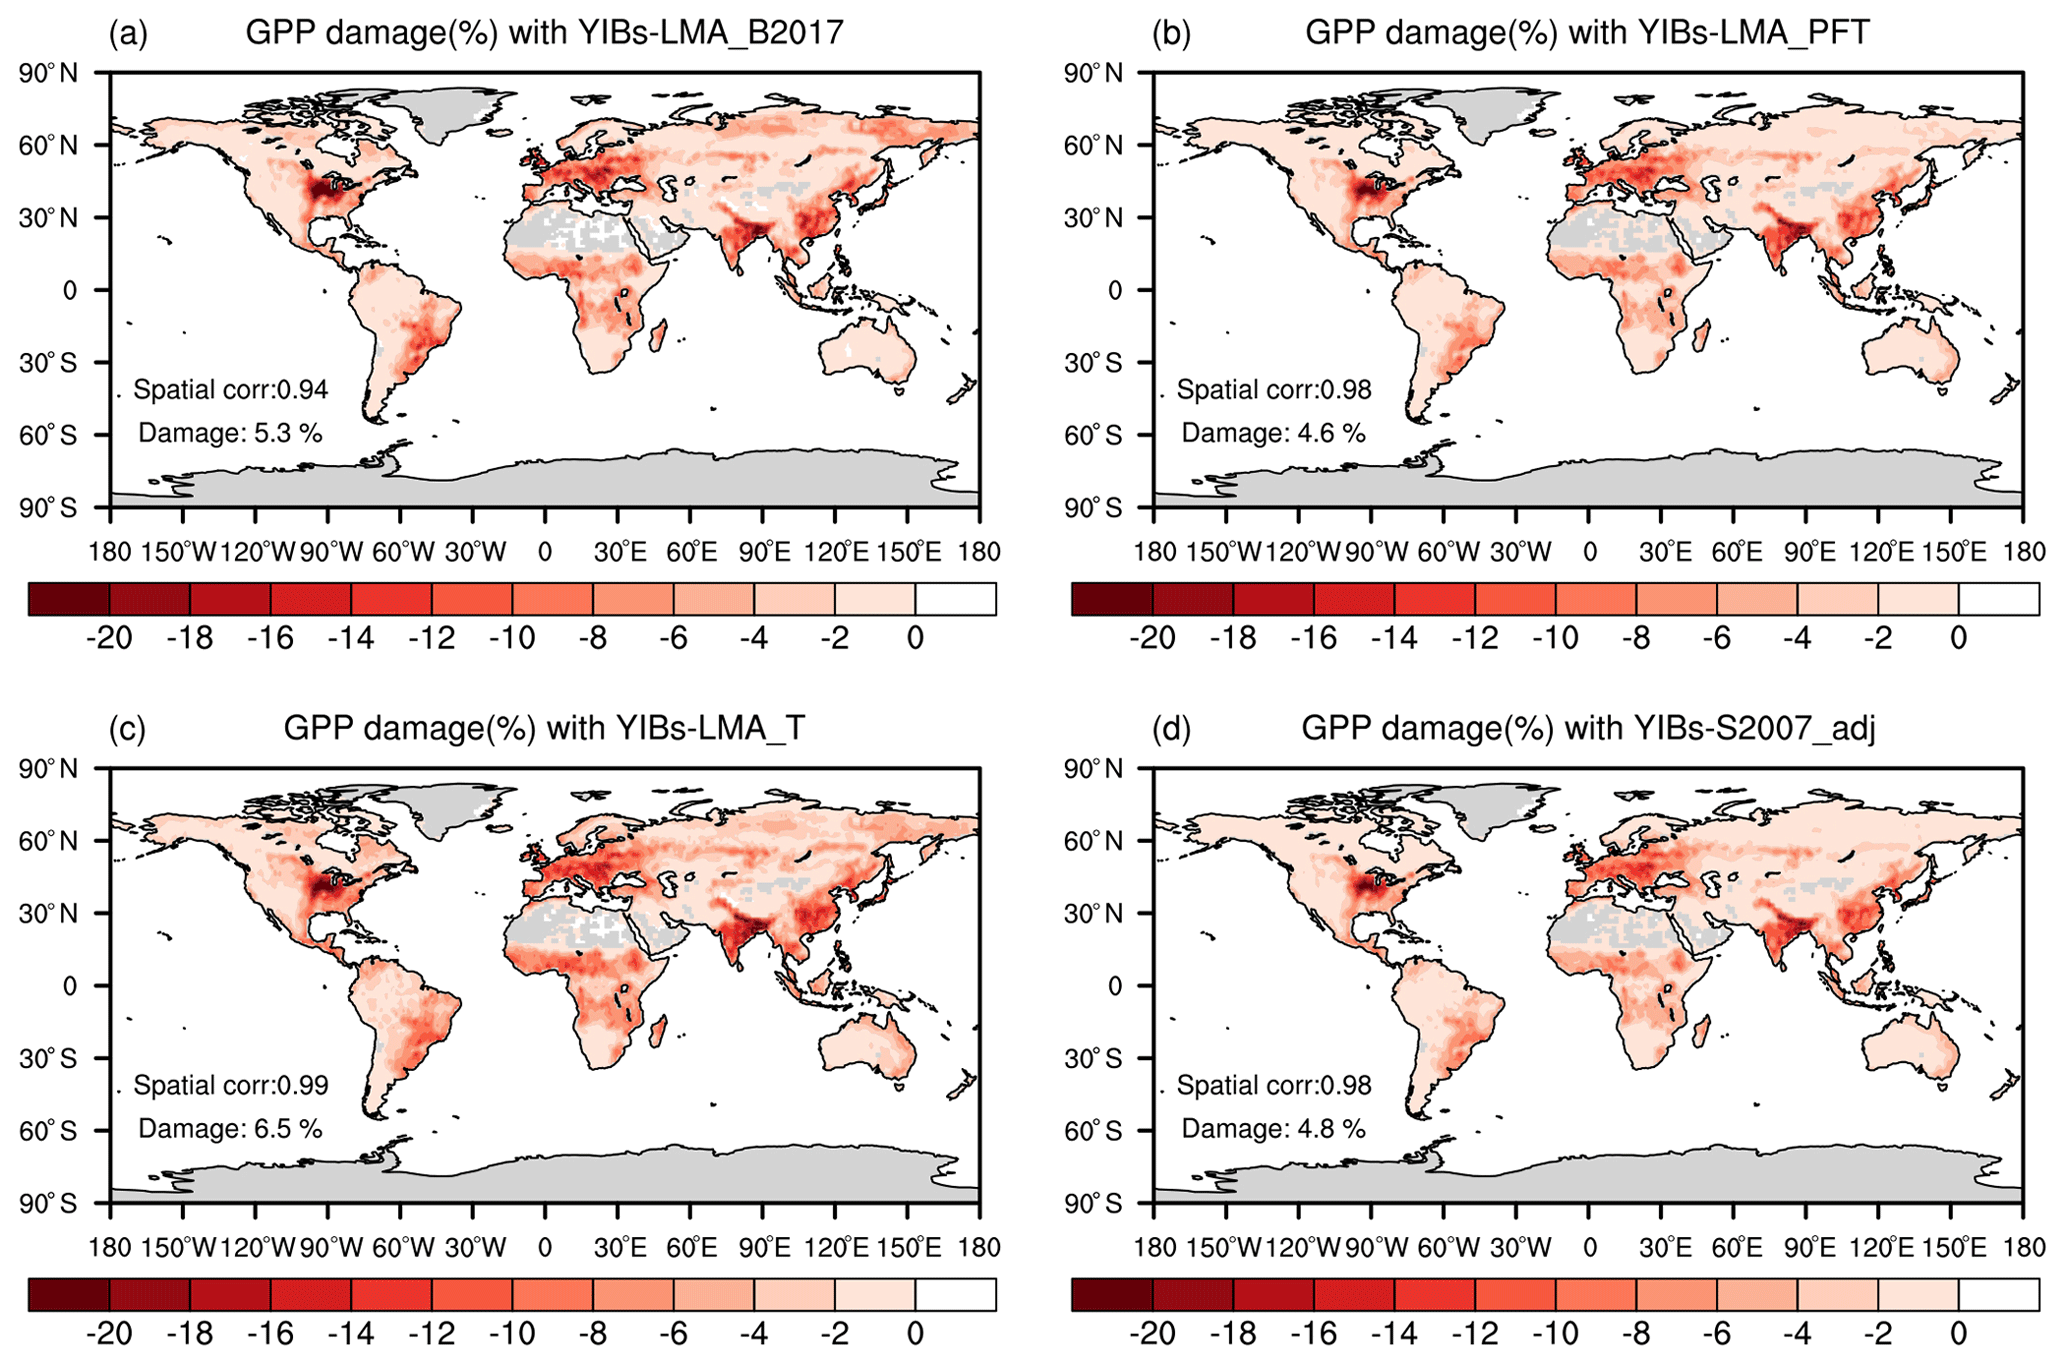
Figure 6Global O3-induced GPP reductions simulated in four supporting experiments. All damage maps are based on optimal parameters shown in Table 1. The spatial correlation coefficients between YIBs-LMA and these supporting simulations are shown in each panel as well as the global average damage percentage of each map. Simulations are described in Table 1.
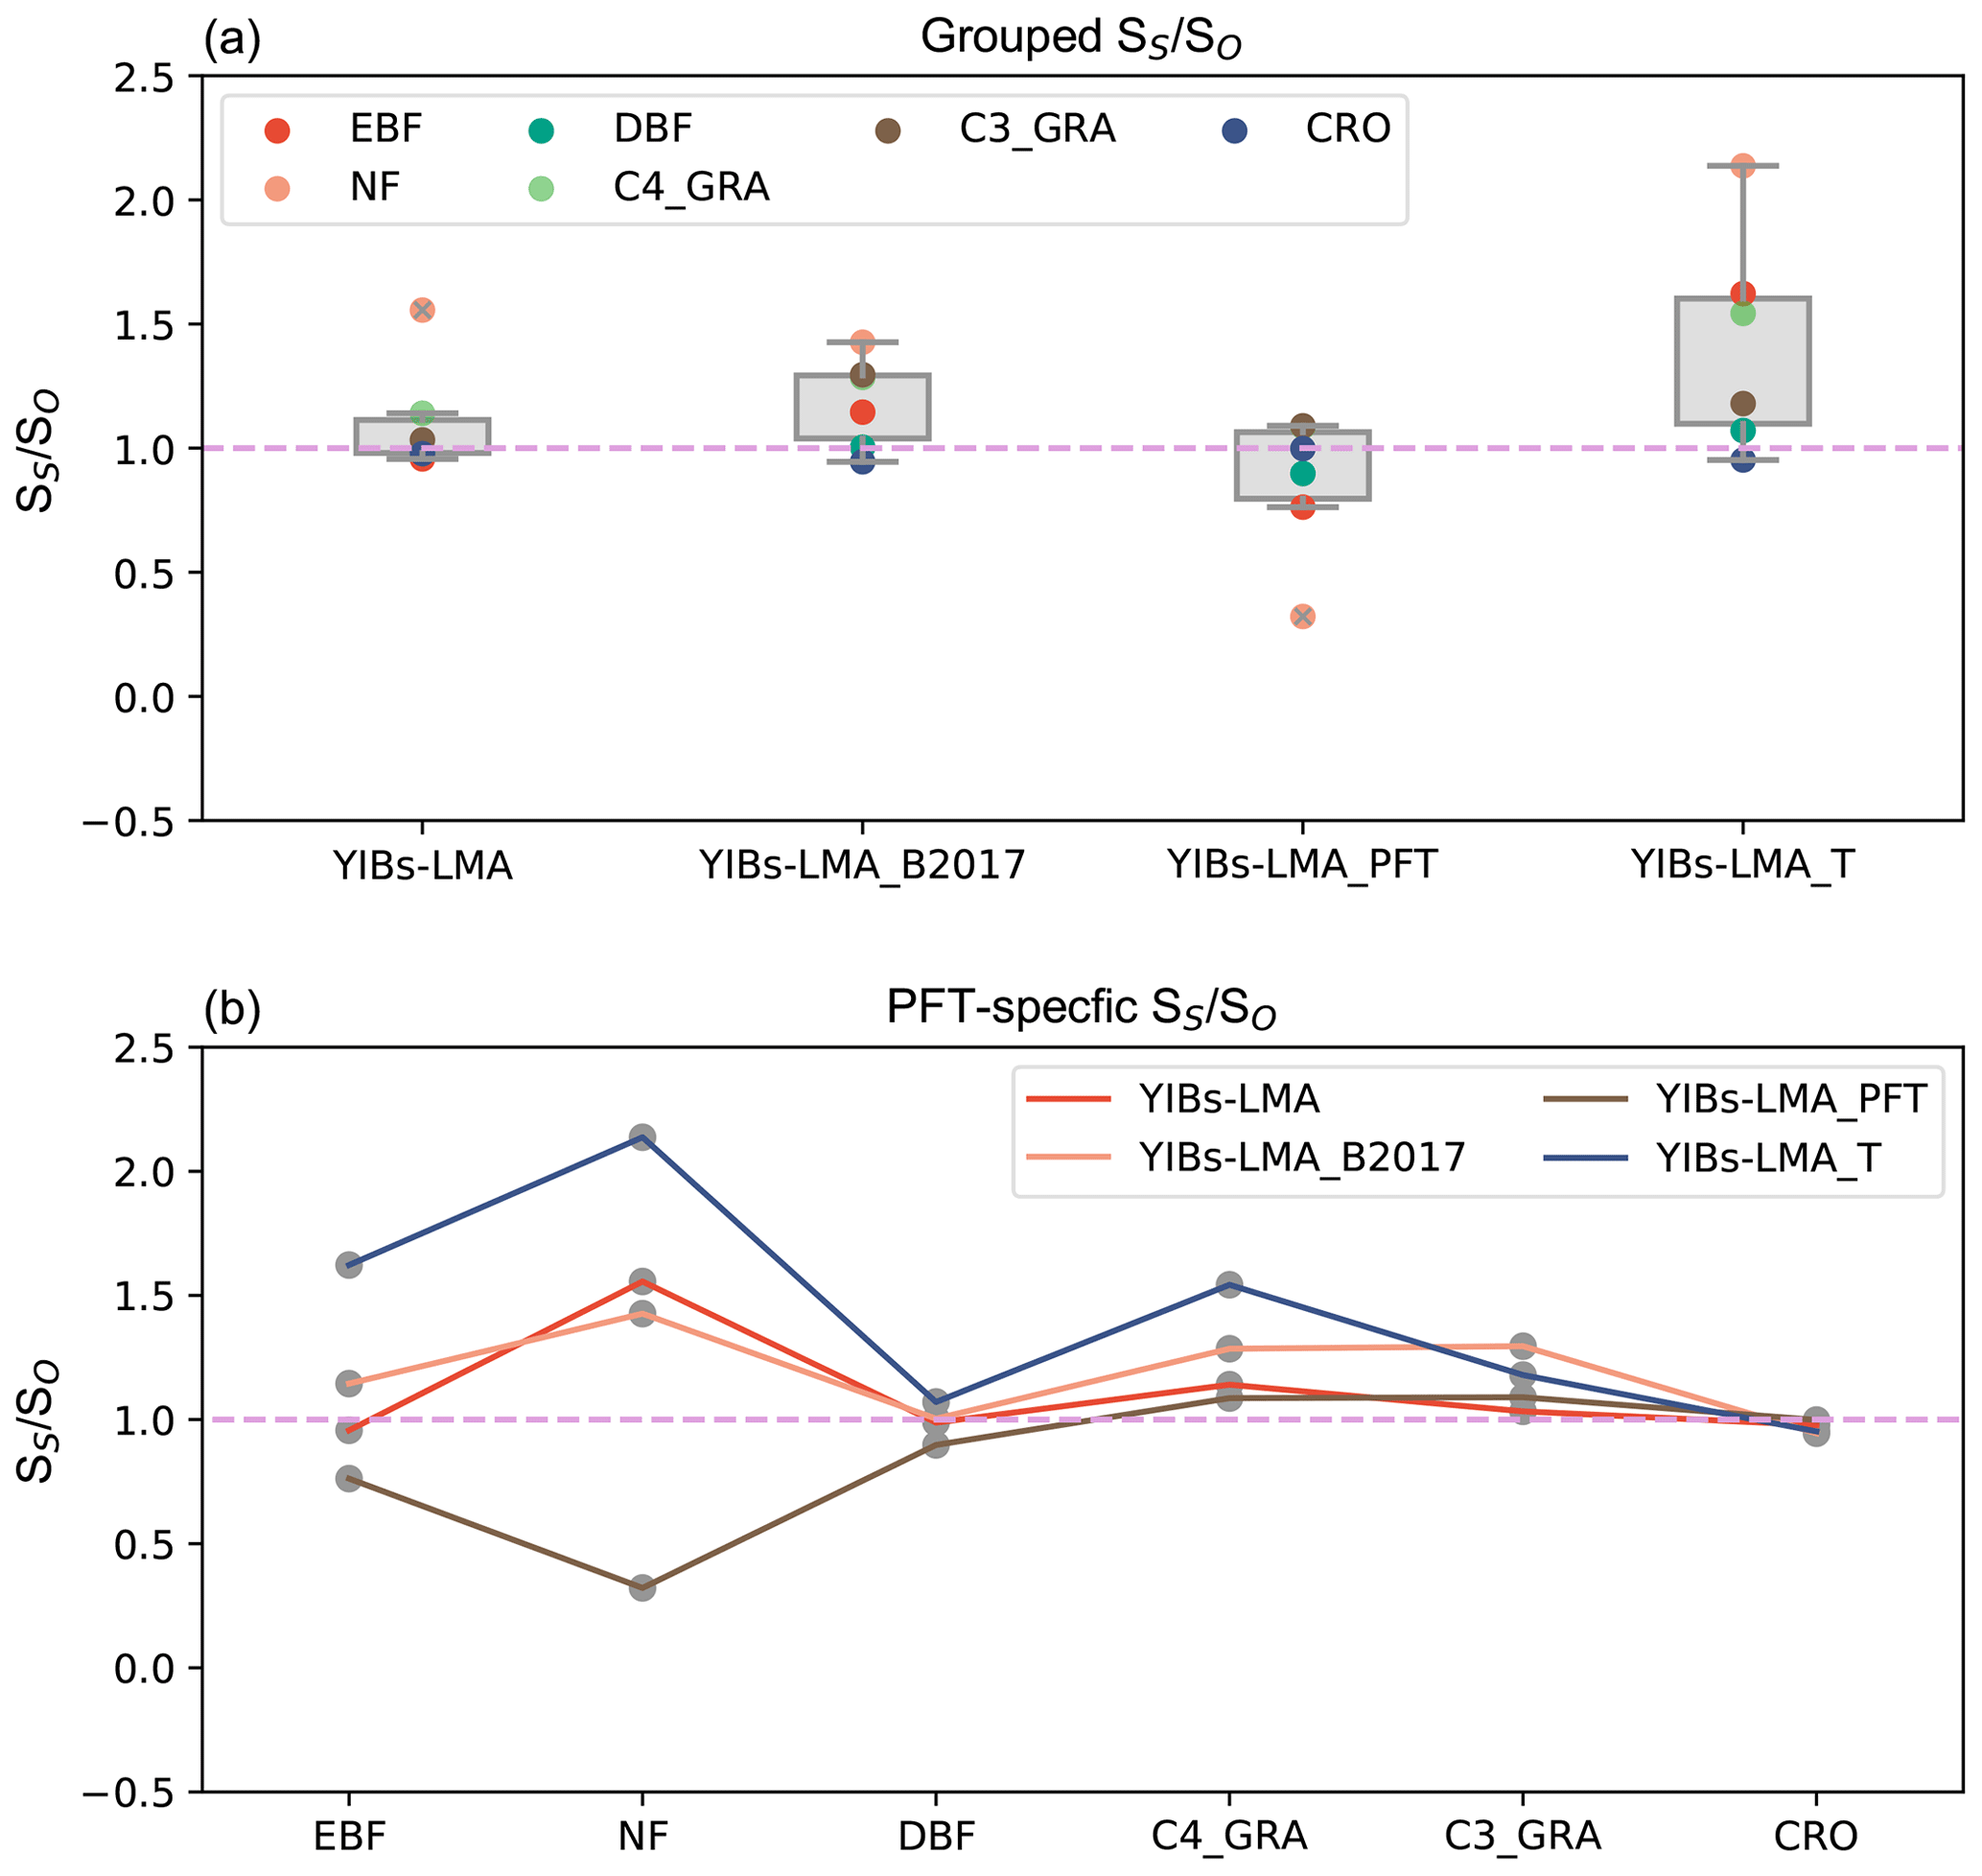
Figure 7Comparison of among supporting experiments. Individual ratios for (b) different PFTs are grouped to the box plot in (a). All experiments adopt optimal parameters shown in Table 1.
3.3 Uncertainties of the LMA-based scheme
We quantified the uncertainties in the LMA-based scheme by comparing simulated GPP damage among different experiments (Table 1). The experiment with the alternative LMA map of B2017 (Fig. S6) showed similar spatial patterns but a slightly enhanced GPP reduction of 5.3 % (Fig. 6a) compared to the simulations using LMA map of M2018 (Fig. 5a). The B2017 map contains more LMA data than M2018 (∼40 %), leading to unexpected high O3 threats over the tundra in the Arctic (Fig. S7). Another experiment using PFT-specific LMA estimated a global GPP reduction of 4.6 % (Fig. 6b) with a consistent spatial pattern similar to the prediction in YIBs-LMA, suggesting that the PFT-level LMA can be used in the case of a lack of regional LMA data. The third experiment with an alternative threshold flux (Feng et al., 2018) of 0.006 nmol g−1 s−1 estimated a high GPP reduction of 6.5 % (Fig. 6c) due to the overestimations of O3 sensitivities for some tree PFTs (Fig. 7). The fourth run, YIBs-S2007_adj, predicted a similar global GPP damage of 4.79 %, similar to the YIBs-LMA run, with a high spatial correlation coefficient of 0.98 (Fig. 6d). Such good consistency is mainly due to the application of recalibrated PFT-level sensitivities in YIBs-S2007_adj. Finally, we tested a new calibration excluding CRO, the PFT that contributed the most to the calibration biases (shown by dashed orange lines in Fig. S8). The results gave an optimal a of 3.2, with global damage of 4.5 %. All sensitivity experiments achieved results consistent with the YIBs-LMA simulation, with damage ranging from 4.5 % to 6.5 % and spatial correlation coefficients larger than 0.94.
4.1 Mechanisms behind the LMA-based approach
In recent decades, the plant science community has examined how traits could be used to differentiate and predict the function of plant species (Reich et al., 1997, 1999). LMA, related to leaf density and thickness, is a key trait reflecting many aspects of leaf function (Reich et al., 1998). In the field of O3 phytotoxicology, experiments have revealed plants with high LMA usually have thick leaves with physical and chemical defenses (Poorter et al., 2009), which can strengthen their resistance to O3 (Li et al., 2016; Feng et al., 2018). Conversely, plants with low LMA normally have thin leaves which are likely to be less O3-tolerant (Li et al., 2016; Feng et al., 2018). Moreover, it seems plausible that the oxidative stress caused by a given amount of stomatal O3 flux per unit leaf area would be distributed over a larger leaf mass, and hence diluted, in a leaf with high LMA. Such an LMA–O3 sensitivity relationship can be well reproduced by our LMA-based model (Fig. 8a and b). Below we explore the linkage between O3 plant sensitivities and the mutual adaptation of growth strategies and leaf morphology with plant leaf trade-off theory (Reich et al., 1999; Shipley et al., 2006).
In the natural world, plants often adapt to maximize carbon uptake under prevailing conditions (Reich et al., 1998; Shipley et al., 2006). To make full use of resources in the growing season, leaves under varied living conditions choose either fast photosynthetic rates (fast-growing deciduous types) or long photosynthesis duration (slow-growing evergreen types) with compatible leaf structures (Reich, 2014; Diaz et al., 2016). The former species expand leaf area (low LMA) to maximize light interception, while the latter species produce thick and mechanically strong leaves (high LMA) with ample resistant substances for durable utilization (Poorter et al., 2009) in resource-limited and/or environment-stressed habitats (Wright et al., 2002). As a side effect of such leaf trade-offs, deciduous plants with their high rates of photosynthesis, associated large stomatal conductance (Davison and Barnes, 1998; Henry et al., 2019), and less total defense capacity through the leaf profile (Poorter et al., 2009), are highly O3-sensitive (Mode1 in Fig. 9). In contrast, moderate photosynthesis, relatively low maximum stomatal conductance (Davison and Barnes, 1998; Henry et al., 2019), and reinforced dense leaves (Poorter et al., 2009) lead to low sensitivity for evergreen plants (Mode2 in Fig. 9). Therefore, in our modeling practice, the mass-based O3 gas exchange algorithm can be regarded as taking into account several interrelated factors such as growth-driven gas exchange requirements, gas path length, and biochemical reserves, in a unified, simplified, and effective manner via LMA.
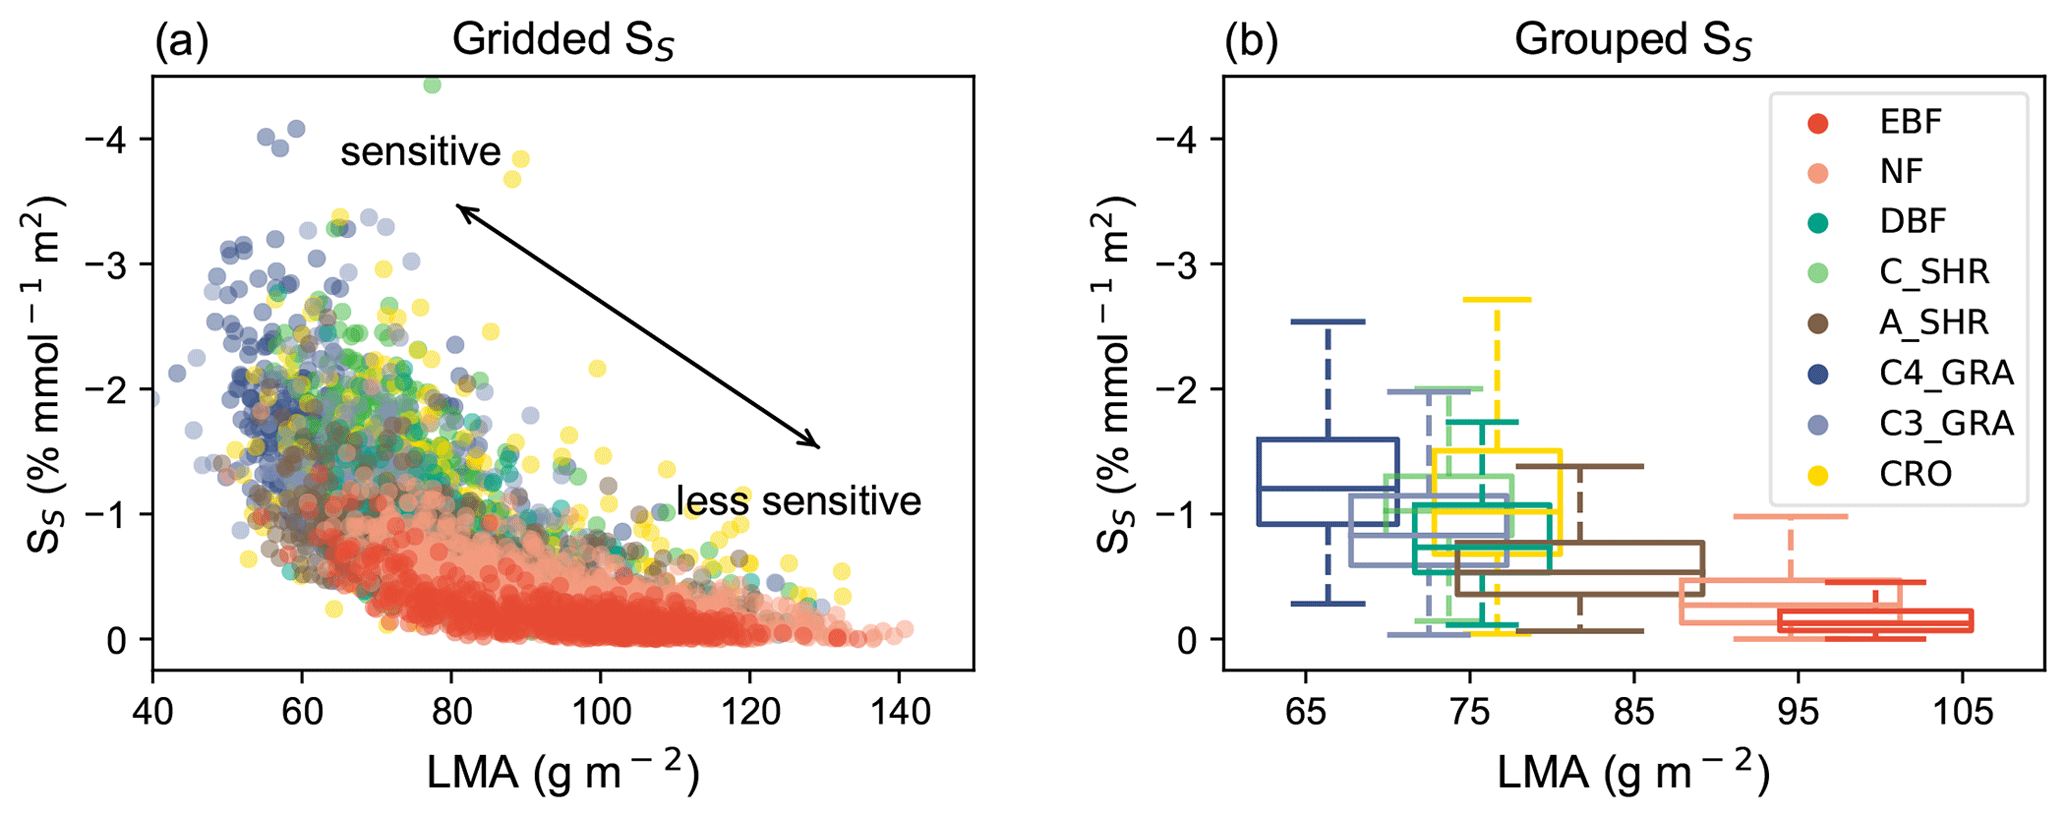
Figure 8Relationships between O3 sensitivity and LMA. (a) Simulated O3 sensitivity (SS) at each grid is compared with LMA for different PFTs. Gridded SS is derived as GPP change per unit PODy=1 from the YIBs-LMA simulation. Each point represents the value in a grid cell with a dominant PFT. (b) The PFT-level relationships between LMA and O3 sensitivity are grouped as box plots, which indicate the median, 25th percentile, and 75th percentile of y-axis variables within the same PFT. The width of box plots represents 1 standard deviation of LMA for a specific PFT.
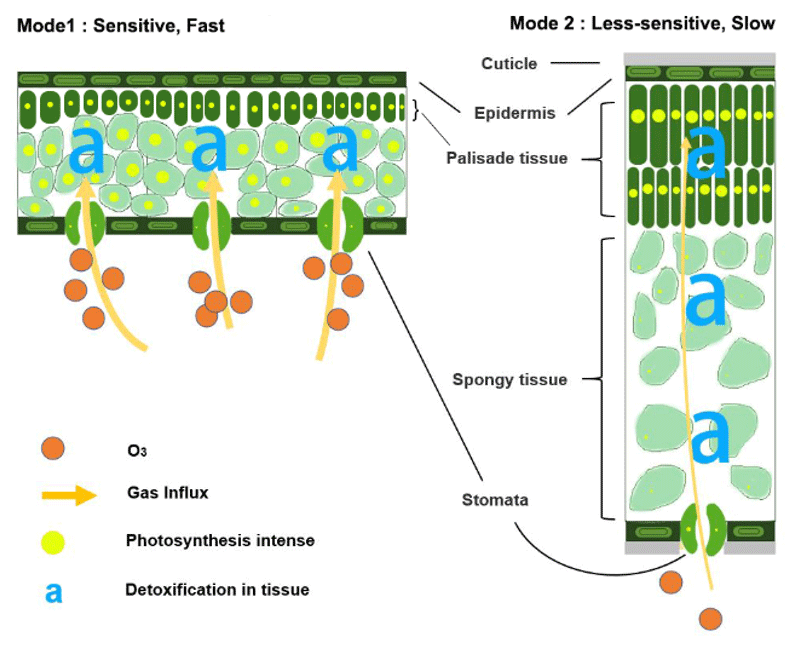
Figure 9Illustration of the relationships between leaf trade-off strategy and its sensitivity to O3.
4.2 Implication of potential risks for fast-growing plants
Our new approach reflected the general experimental findings that deciduous plants are much more vulnerable to O3 than evergreen species (Li et al., 2017; Feng et al., 2018), and in turn within a PFT, early-successional/pioneers with low LMA are likely more vulnerable than late-successional/canopy trees with high LMA (Fyllas et al., 2012). This law has been neglected in previous modeling studies due to the dependence on the limited observed data used for PFT-specific tuning. Our LMA-based approach bridges this gap through grid-based parameterization, and in addition, our data–model integration specifically emphasizes the broad high risks for fast-growing plants, especially for crops. Among PFTs, crops may endure the largest O3 threats (Davison and Barnes, 1998; Feng et al., 2021; Mukherjee et al., 2021) because they are artificially bred with high photosynthetic capacities (Richards, 2000), stomatal conductance, generally low LMA (Bertin and Gary, 1998; Wang and Shangguan, 2010; Wu et al., 2018; Li et al., 2018) (roughly 30–60 g m−2), and cultivated in populated regions with high ambient O3 concentrations. Modern technology aims to promote crop yield (Herdt, 2005), but this can potentially elevate crop sensitivities to O3 (Biswas et al., 2008, 2013). This study estimated the highest annual mean GPP damage for crop, 12.6 %, which is at the high end of the 4.4 %–12.4 % of the O3-induced yield loss estimated for global modeling of soybean, wheat, rice, and maize (Mills et al., 2018a). Furthermore, human-induced land use activities may also increase O3 damage risks. The global demand for food and commodities leads to the conversion of natural forests to irrigated croplands, grazing pastures, and economical-tree plantations (Curtis et al., 2018; Zalles et al., 2021). Meanwhile, the urgent actions to combat climate change promote large-scale afforestation and reforestation (Cook-Patton et al., 2020). These land use changes with fast-growing plant species may increase the risks of terrestrial ecosystems to surface O3.
4.3 Advances in the global O3 damage assessment
For the first time, we implemented plant trait LMA into a process-based O3 impact modeling scheme and obtained reasonable interspecific and inter-PFT O3 responses supported by observations. The similarity between YIBs-S2007 and YIBs-LMA shown in Fig. 5 revealed an advance in the modeling strategy. Simulated O3 damage in YIBs-S2007 is based on the PFT-level calibrations that tuned sensitivity parameters of each PFT with observed DRRs. Such refinement is a data-driven approach without clear physical reasons. Instead, the YIBs-LMA framework converts the area-based responses to mass-based ones and achieves better unification in O3 sensitivities among different PFTs. In this algorithm, the O3 damage efficiency is inversely related to plant LMA, which influences both the O3 uptake potential and the detoxification capability of the vegetation. The similarity in the global assessment of O3 vegetation damage between YIBs-S2007 and YIBs-LMA further demonstrated the physical validity of the LMA-based scheme in Earth system modeling because the independent LMA map was applied in the latter approach.
In addition to the advance in physical mechanisms, the LMA-based approach improves global O3 damage assessments in the following aspects. First, it significantly reduces the number of required key parameters. To account for interspecific sensitivities, many schemes have to define PFT-level parameters to capture the ranges of plant responses (Sitch et al., 2007; Felzer et al., 2009; Lombardozzi et al., 2015). As a result, those schemes rely on dozens of parameters, which increases the uncertainties of modeling and the difficulties for model calibration. The LMA-based approach requires the calibration of one single parameter a, largely facilitating its application across different vegetation models. Second, the new approach accounts for the continuous spectrum of O3 sensitivities. Previous studies usually categorized species into groups of low or high O3 sensitivity, depending on very limited data from O3 exposure experiments. As a result, grid cells for a specific PFT share the same sensitivities regardless of their geographic locations and ecosystem characteristics. In reality, there are hundreds and thousands of plant species in each PFT, and they usually have large variations in biophysical parameters including LMA and O3 sensitivities. The LMA-based approach takes advantage of the newly revealed unifying concept in O3 sensitivity (Li et al., 2016, 2022; Feng et al., 2018) and the recent development of a trait-based LMA global map (Fig. 1a). Such configurations present a spectrum of gridded O3 sensitivities (Fig. 8a) following the variations of LMA distribution.
In nature, all aspects of plant physiochemical processes, such as growth, development, reproduction, and defense, are influenced by abiotic factors like water availability, temperature, CO2 concentration, and light resources (Kochhar and Gujral, 2020). In our modeling, the cumulative O3 fluxes are based on dynamic plant simulations with well-established DGVM to calculate the effects of these abiotic factors. LMA is considered a factor representing the vulnerability of each species, by which divergent responses to the same O3 stomatal dose can be further differentiated. In fact, many other key variables in DGVMs, for example, leaf photosynthetic traits (Vcmax and Jmax), nutrient traits (leaf nitrogen and phosphorus), morphological traits (leaf thickness and size), and phenology-related traits (leaf life span) are all more or less interlinked with LMA (Walker et al., 2014). There are some generic regression relationships between them. In addition, efforts are being made to directly predict key traits, including LMA, through environmental factors. As a result, considerable improvements can be made in the direction of trait-flexible modeling within the existing DGVM frameworks. Our study demonstrates the validity of LMA-based approach for the O3 plant damage modeling.
Although we used the most advanced LMA integrated from available observations, this dataset was developed based on static global grids and revealed the mean state for each pixel. In reality, LMA can vary with biotic/abiotic factors like leaf position in the canopy (Keenan and Niinemets, 2017), phenology, plant health, living environment (Fritz et al., 2018), and climate (Wright et al., 2005; Cui et al., 2020). Even long-term exposure to O3 can alter leaf morphological characteristics and LMA (Li et al., 2017). In future studies, simulations from local to global scales could implement the spatiotemporal variations in LMA taking into account the demographic information and environmental forcings. We expect a breakthrough in the calculation of reliable LMA to achieve fully dynamic predictions of O3 plant damage in Earth system modeling, thus facilitating the research of plant response and adaption in changing environments.
The codes of the YIBs model with the LMA-based O3 damaging scheme are shared at https://doi.org/10.5281/zenodo.6348731 (Ma and Yue, 2022).
Results of all simulations (listed in Table 1) are available upon request. Data for figures in the main article are shared at https://doi.org/10.5281/zenodo.6348731 (Ma and Yue, 2022). The global maps of specific leaf area (SLA) to derive LMA for M2018 and B2017 are from https://www.try-db.org/TryWeb/Data.php#59 (last access: 20 April 2023) with DOI https://doi.org/10.17871/TRY.59 (Moreno-Martínez et al., 2020) and https://github.com/abhirupdatta/global_maps_of_plant_traits (Butler et al., 2017), respectively. Monthly O3 data is from https://doi.org/10.5194/acp-18-8953-2018 (Turnock et al., 2018). Calibration data are summarized in Table S1.
The supplement related to this article is available online at: https://doi.org/10.5194/gmd-16-2261-2023-supplement.
XY, SS, and NU designed the research, and YM performed modeling, data analyses, and visualization and wrote the draft. JU, LMM, ZF, and AWC advised on concepts and methods. CG helped write the draft. HY and MCDR helped with coding. HZ, CT, YC, YL, and YX helped with data collection. All authors commented on and revised the manuscript.
The contact author has declared that none of the authors has any competing interests.
Publisher's note: Copernicus Publications remains neutral with regard to jurisdictional claims in published maps and institutional affiliations.
We acknowledge the financial support provided by our funding sources. We also thank the editors and reviewers for their valuable feedback on the revisions.
Xu Yue has received funding from the National Natural Science Foundation of China (grant no. 42293323) and the Jiangsu Science Fund for Distinguished Young Scholars (grant no. BK20200040). Stephen Sitch, Nadine Unger, Lina M. Mercado, and Alexander W. Cheesman were supported by NERC funding (grant no. NE/R001812/1). Johan Uddling has been supported by the strategic research area “Biodiversity and Ecosystems in a Changing Climate” (BECC).
This paper was edited by Christoph Müller and reviewed by two anonymous referees.
Agathokleous, E., Feng, Z., Oksanen, E., Sicard, P., Wang, Q., Saitanis, C. J., Araminiene, V., Blande, J. D., Hayes, F., Calatayud, V., Domingos, M., Veresoglou, S. D., Penuelas, J., Wardle, D. A., De Marco, A., Li, Z., Harmens, H., Yuan, X., Vitale, M., and Paoletti, E.: Ozone affects plant, insect, and soil microbial communities: A threat to terrestrial ecosystems and biodiversity, Sci. Adv., 6, eabc1176, https://doi.org/10.1126/sciadv.abc1176, 2020.
Ainsworth, E. A., Lemonnier, P., and Wedow, J. M.: The influence of rising tropospheric carbon dioxide and ozone on plant productivity, Plant Biol., 22, 5–11, https://doi.org/10.1111/plb.12973, 2020.
Ainsworth, E. A., Yendrek, C. R., Sitch, S., Collins, W. J., and Emberson, L. D.: The Effects of Tropospheric Ozone on Net Primary Productivity and Implications for Climate Change, Annu. Rev. Plant Biol., 63, 637–661, https://doi.org/10.1146/Annurev-Arplant-042110-103829, 2012.
Anav, A., Liu, Q., De Marco, A., Proietti, C., Savi, F., Paoletti, E., and Piao, S.: The role of plant phenology in stomatal ozone flux modeling, Glob. Change Biol., 24, 235–248, https://doi.org/10.1111/gcb.13823, 2018.
Ball, J. T., Woodrow, I. E., and Berry, J. A.: A model predicting stomatal conductance and its contribution to the control of photosynthesis under different environmental conditions, Progress in Photosynthesis Research: volume 4 proceedings of the VIIth international congress on photosynthesis providence, Rhode Island, USA, 10–15 August 1986, 221–224, https://doi.org/10.1007/978-94-017-0519-6_48, 1987.
Bertin, N. and Gary, C.: Short and long term fluctuations of the leaf mass per area of tomato plants – Implications for growth models, Ann. Bot.-London, 82, 71–81, https://doi.org/10.1006/anbo.1998.0647, 1998.
Biswas, D. K., Xu, H., Li, Y. G., Ma, B. L., and Jiang, G. M.: Modification of photosynthesis and growth responses to elevated CO2 by ozone in two cultivars of winter wheat with different years of release, J. Exp. Bot., 64, 1485–1496, https://doi.org/10.1093/jxb/ert005, 2013.
Biswas, D. K., Xu, H., Li, Y. G., Sun, J. Z., Wang, X. Z., Han, X. G., and Jiang, G. M.: Genotypic differences in leaf biochemical, physiological and growth responses to ozone in 20 winter wheat cultivars released over the past 60 years, Glob. Change Biol., 14, 46–59, https://doi.org/10.1111/j.1365-2486.2007.01477.x, 2008.
Bonan, G. B., Levis, S., Sitch, S., Vertenstein, M., and Oleson, K. W.: A dynamic global vegetation model for use with climate models: concepts and description of simulated vegetation dynamics, Glob. Change Biol., 9, 1543–1566, https://doi.org/10.1046/J.1365-2486.2003.00681.X, 2003.
Buker, P., Feng, Z., Uddling, J., Briolat, A., Alonso, R., Braun, S., Elvira, S., Gerosa, G., Karlsson, P. E., Le Thiec, D., Marzuoli, R., Mills, G., Oksanen, E., Wieser, G., Wilkinson, M., and Emberson, L. D.: New flux based dose-response relationships for ozone for European forest tree species, Environ. Pollut., 206, 163–174, https://doi.org/10.1016/j.envpol.2015.06.033, 2015.
Butler, E. E., Datta, A., Flores-Moreno, H., Chen, M., Wythers, K. R., Fazayeli, F., Banerjee, A., Atkin, O. K., Kattge, J., Amiaud, B., Blonder, B., Boenisch, G., Bond-Lamberty, B., Brown, K. A., Byun, C., Campetella, G., Cerabolini, B. E. L., Cornelissen, J. H. C., Craine, J. M., Craven, D., de Vries, F. T., Diaz, S., Domingues, T. F., Forey, E., Gonzalez-Melo, A., Gross, N., Han, W., Hattingh, W. N., Hickler, T., Jansen, S., Kramer, K., Kraft, N. J. B., Kurokawa, H., Laughlin, D. C., Meir, P., Minden, V., Niinemets, U., Onoda, Y., Penuelas, J., Read, Q., Sack, L., Schamp, B., Soudzilovskaia, N. A., Spasojevic, M. J., Sosinski, E., Thornton, P. E., Valladares, F., van Bodegom, P. M., Williams, M., Wirth, C., and Reich, P. B.: Mapping local and global variability in plant trait distributions, P. Natl. Acad. Sci. USA, 114, E10937–E10946, https://doi.org/10.1073/pnas.1708984114, 2017 (data available at: https://github.com/abhirupdatta/global_maps_of_plant_traits, last access: 20 April 2023).
Cook-Patton, S. C., Leavitt, S. M., Gibbs, D., Harris, N. L., Lister, K., Anderson-Teixeira, K. J., Briggs, R. D., Chazdon, R. L., Crowther, T. W., Ellis, P. W., Griscom, H. P., Herrmann, V., Holl, K. D., Houghton, R. A., Larrosa, C., Lomax, G., Lucas, R., Madsen, P., Malhi, Y., Paquette, A., Parker, J. D., Paul, K., Routh, D., Roxburgh, S., Saatchi, S., van den Hoogen, J., Walker, W. S., Wheeler, C. E., Wood, S. A., Xu, L., and Griscom, B. W.: Mapping carbon accumulation potential from global natural forest regrowth, Nature, 585, 545–550, https://doi.org/10.1038/s41586-020-2686-x, 2020.
Cui, E., Weng, E., Yan, E., and Xia, J.: Robust leaf trait relationships across species under global environmental changes, Nat. Commun., 11, 2999, https://doi.org/10.1038/s41467-020-16839-9, 2020.
Curtis, P. G., Slay, C. M., Harris, N. L., Tyukavina, A., and Hansen, M. C.: Classifying drivers of global forest loss, Science, 361, 1108–1111, https://doi.org/10.1126/science.aau3445, 2018.
Davison, A. W. and Barnes, J. D.: Effects of ozone on wild plants, New Phytol., 139, 135–151, https://doi.org/10.1046/j.1469-8137.1998.00177.x, 1998.
Diaz, S., Kattge, J., Cornelissen, J. H., Wright, I. J., Lavorel, S., Dray, S., Reu, B., Kleyer, M., Wirth, C., Prentice, I. C., Garnier, E., Bonisch, G., Westoby, M., Poorter, H., Reich, P. B., Moles, A. T., Dickie, J., Gillison, A. N., Zanne, A. E., Chave, J., Wright, S. J., Sheremet'ev, S. N., Jactel, H., Baraloto, C., Cerabolini, B., Pierce, S., Shipley, B., Kirkup, D., Casanoves, F., Joswig, J. S., Gunther, A., Falczuk, V., Ruger, N., Mahecha, M. D., and Gorne, L. D.: The global spectrum of plant form and function, Nature, 529, 167–171, https://doi.org/10.1038/nature16489, 2016.
Emberson, L. D., Pleijel, H., Ainsworth, E. A., van den Berg, M., Ren, W., Osborne, S., Mills, G., Pandey, D., Dentener, F., Buker, P., Ewert, F., Koeble, R., and Van Dingenen, R.: Ozone effects on crops and consideration in crop models, Eur. J. Agron., 100, 19–34, https://doi.org/10.1016/j.eja.2018.06.002, 2018.
Farquhar, G. D., Caemmerer, S. V., and Berry, J. A.: A biochemical-model of photosynthetic CO2 assimilation in leaves of C3 Species, Planta, 149, 78–90, https://doi.org/10.1007/Bf00386231, 1980.
Felzer, B., Kicklighter, D., Melillo, J., Wang, C., Zhuang, Q., and Prinn, R.: Effects of ozone on net primary production and carbon sequestration in the conterminous United States using a biogeochemistry model, Tellus B, 56, 230–248, https://doi.org/10.1111/j.1600-0889.2004.00097.x, 2004.
Felzer, B. S., Cronin, T. W., Melillo, J. M., Kicklighter, D. W., and Schlosser, C. A.: Importance of carbon-nitrogen interactions and ozone on ecosystem hydrology during the 21st century, J. Geophys. Res., 114, G01020, https://doi.org/10.1029/2008jg000826, 2009.
Feng, Z., Xu, Y., Kobayashi, K., Dai, L., Zhang, T., Agathokleous, E., Calatayud, V., Paoletti, E., Mukherjee, A., Agrawal, M., Park, R. J., Oak, Y. J., and Yue, X.: Ozone pollution threatens the production of major staple crops in East Asia, Nature Food, 3, 47–56, https://doi.org/10.1038/s43016-021-00422-6, 2022.
Feng, Z., Agathokleous, E., Yue, X., Oksanen, E., Paoletti, E., Sase, H., Gandin, A., Koike, T., Calatayud, V., Yuan, X., Liu, X., De Marco, A., Jolivet, Y., Kontunen-Soppela, S., Hoshika, Y., Saji, H., Li, P., Li, Z., Watanabe, M., and Kobayashi, K.: Emerging challenges of ozone impacts on asian plants: actions are needed to protect ecosystem health, Ecosystem Health and Sustainability, 7, 1911602, https://doi.org/10.1080/20964129.2021.1911602, 2021.
Feng, Z. Z., Sun, J. S., Wan, W. X., Hu, E. Z., and Calatayud, V.: Evidence of widespread ozone-induced visible injury on plants in Beijing, China, Environ. Pollut., 193, 296–301, https://doi.org/10.1016/j.envpol.2014.06.004, 2014.
Feng, Z. Z., Buker, P., Pleijel, H., Emberson, L., Karlsson, P. E., and Uddling, J.: A unifying explanation for variation in ozone sensitivity among woody plants, Glob. Change Biol., 24, 78–84, https://doi.org/10.1111/gcb.13824, 2018.
Friedlingstein, P., O'Sullivan, M., Jones, M. W., Andrew, R. M., Gregor, L., Hauck, J., Le Quéré, C., Luijkx, I. T., Olsen, A., Peters, G. P., Peters, W., Pongratz, J., Schwingshackl, C., Sitch, S., Canadell, J. G., Ciais, P., Jackson, R. B., Alin, S. R., Alkama, R., Arneth, A., Arora, V. K., Bates, N. R., Becker, M., Bellouin, N., Bittig, H. C., Bopp, L., Chevallier, F., Chini, L. P., Cronin, M., Evans, W., Falk, S., Feely, R. A., Gasser, T., Gehlen, M., Gkritzalis, T., Gloege, L., Grassi, G., Gruber, N., Gürses, Ö., Harris, I., Hefner, M., Houghton, R. A., Hurtt, G. C., Iida, Y., Ilyina, T., Jain, A. K., Jersild, A., Kadono, K., Kato, E., Kennedy, D., Klein Goldewijk, K., Knauer, J., Korsbakken, J. I., Landschützer, P., Lefèvre, N., Lindsay, K., Liu, J., Liu, Z., Marland, G., Mayot, N., McGrath, M. J., Metzl, N., Monacci, N. M., Munro, D. R., Nakaoka, S.-I., Niwa, Y., O'Brien, K., Ono, T., Palmer, P. I., Pan, N., Pierrot, D., Pocock, K., Poulter, B., Resplandy, L., Robertson, E., Rödenbeck, C., Rodriguez, C., Rosan, T. M., Schwinger, J., Séférian, R., Shutler, J. D., Skjelvan, I., Steinhoff, T., Sun, Q., Sutton, A. J., Sweeney, C., Takao, S., Tanhua, T., Tans, P. P., Tian, X., Tian, H., Tilbrook, B., Tsujino, H., Tubiello, F., van der Werf, G. R., Walker, A. P., Wanninkhof, R., Whitehead, C., Willstrand Wranne, A., Wright, R., Yuan, W., Yue, C., Yue, X., Zaehle, S., Zeng, J., and Zheng, B.: Global Carbon Budget 2022, Earth Syst. Sci. Data, 14, 4811–4900, https://doi.org/10.5194/essd-14-4811-2022, 2022.
Fritz, M. A., Rosa, S., and Sicard, A.: Mechanisms Underlying the Environmentally Induced Plasticity of Leaf Morphology, Front. Genet., 9, 478, https://doi.org/10.3389/fgene.2018.00478, 2018.
Fuhrer, J., Skarby, L., and Ashmore, M. R.: Critical levels for ozone effects on vegetation in Europe, Environ. Pollut., 97, 91–106, https://doi.org/10.1016/s0269-7491(97)00067-5, 1997.
Fyllas, N. M., Quesada, C. A., and Lloyd, J.: Deriving Plant Functional Types for Amazonian forests for use in vegetation dynamics models, Perspect. Plant Ecol., 14, 97–110, https://doi.org/10.1016/j.ppees.2011.11.001, 2012.
Gallagher, R. V., Falster, D. S., Maitner, B. S., Salguero-Gomez, R., Vandvik, V., Pearse, W. D., Schneider, F. D., Kattge, J., Poelen, J. H., Madin, J. S., Ankenbrand, M. J., Penone, C., Feng, X., Adams, V. M., Alroy, J., Andrew, S. C., Balk, M. A., Bland, L. M., Boyle, B. L., Bravo-Avila, C. H., Brennan, I., Carthey, A. J. R., Catullo, R., Cavazos, B. R., Conde, D. A., Chown, S. L., Fadrique, B., Gibb, H., Halbritter, A. H., Hammock, J., Hogan, J. A., Holewa, H., Hope, M., Iversen, C. M., Jochum, M., Kearney, M., Keller, A., Mabee, P., Manning, P., McCormack, L., Michaletz, S. T., Park, D. S., Perez, T. M., Pineda-Munoz, S., Ray, C. A., Rossetto, M., Sauquet, H., Sparrow, B., Spasojevic, M. J., Telford, R. J., Tobias, J. A., Violle, C., Walls, R., Weiss, K. C. B., Westoby, M., Wright, I. J., and Enquist, B. J.: Open Science principles for accelerating trait-based science across the Tree of Life, Nat. Ecol. Evol., 4, 294–303, https://doi.org/10.1038/s41559-020-1109-6, 2020.
Gelaro, R., McCarty, W., Suarez, M. J., Todling, R., Molod, A., Takacs, L., Randles, C. A., Darmenov, A., Bosilovich, M. G., Reichle, R., Wargan, K., Coy, L., Cullather, R., Draper, C., Akella, S., Buchard, V., Conaty, A., da Silva, A. M., Gu, W., Kim, G.-K., Koster, R., Lucchesi, R., Merkova, D., Nielsen, J. E., Partyka, G., Pawson, S., Putman, W., Rienecker, M., Schubert, S. D., Sienkiewicz, M., and Zhao, B.: The Modern-Era Retrospective Analysis for Research and Applications, Version 2 (MERRA-2), J. Climate, 30, 5419–5454, https://doi.org/10.1175/jcli-d-16-0758.1, 2017.
Gong, C., Lei, Y., Ma, Y., Yue, X., and Liao, H.: Ozone–vegetation feedback through dry deposition and isoprene emissions in a global chemistry–carbon–climate model, Atmos. Chem. Phys., 20, 3841–3857, https://doi.org/10.5194/acp-20-3841-2020, 2020.
Gong, C., Liao, H., Yue, X., Ma, Y., and Lei, Y.: Impacts of Ozone-Vegetation Interactions on Ozone Pollution Episodes in North China and the Yangtze River Delta, Geophys. Res. Lett., 48, e2021GL093814, https://doi.org/10.1029/2021gl093814, 2021.
Henry, C., John, G. P., Pan, R., Bartlett, M. K., Fletcher, L. R., Scoffoni, C., and Sack, L.: A stomatal safety-efficiency trade-off constrains responses to leaf dehydration, Nat. Commun., 10, 3398, https://doi.org/10.1038/s41467-019-11006-1, 2019.
Herdt, R. W.: The state of food and agriculture, 2003–2004: Agricultural biotechnology: Meeting the needs of the poor?, Agr. Econ., 32, 109–110, https://doi.org/10.1111/j.0169-5150.2005.t01-7-00008.x, 2005.
Hong, C., Mueller, N. D., Burney, J. A., Zhang, Y., AghaKouchak, A., Moore, F. C., Qin, Y., Tong, D., and Davis, S. J.: Impacts of ozone and climate change on yields of perennial crops in California, Nat. Food, 1, 166–172, https://doi.org/10.1038/s43016-020-0043-8, 2020.
Kattge, J., Diaz, S., Lavorel, S., Prentice, C., Leadley, P., Bonisch, G., Garnier, E., Westoby, M., Reich, P. B., Wright, I. J., Cornelissen, J. H. C., Violle, C., Harrison, S. P., van Bodegom, P. M., Reichstein, M., Enquist, B. J., Soudzilovskaia, N. A., Ackerly, D. D., Anand, M., Atkin, O., Bahn, M., Baker, T. R., Baldocchi, D., Bekker, R., Blanco, C. C., Blonder, B., Bond, W. J., Bradstock, R., Bunker, D. E., Casanoves, F., Cavender-Bares, J., Chambers, J. Q., Chapin, F. S., Chave, J., Coomes, D., Cornwell, W. K., Craine, J. M., Dobrin, B. H., Duarte, L., Durka, W., Elser, J., Esser, G., Estiarte, M., Fagan, W. F., Fang, J., Fernandez-Mendez, F., Fidelis, A., Finegan, B., Flores, O., Ford, H., Frank, D., Freschet, G. T., Fyllas, N. M., Gallagher, R. V., Green, W. A., Gutierrez, A. G., Hickler, T., Higgins, S. I., Hodgson, J. G., Jalili, A., Jansen, S., Joly, C. A., Kerkhoff, A. J., Kirkup, D., Kitajima, K., Kleyer, M., Klotz, S., Knops, J. M. H., Kramer, K., Kuhn, I., Kurokawa, H., Laughlin, D., Lee, T. D., Leishman, M., Lens, F., Lenz, T., Lewis, S. L., Lloyd, J., Llusia, J., Louault, F., Ma, S., Mahecha, M. D., Manning, P., Massad, T., Medlyn, B. E., Messier, J., Moles, A. T., Muller, S. C., Nadrowski, K., Naeem, S., Niinemets, U., Nollert, S., Nuske, A., Ogaya, R., Oleksyn, J., Onipchenko, V. G., Onoda, Y., Ordonez, J., Overbeck, G., Ozinga, W. A., Patino, S., Paula, S., Pausas, J. G., Penuelas, J., Phillips, O. L., Pillar, V., Poorter, H., Poorter, L., Poschlod, P., Prinzing, A., Proulx, R., Rammig, A., Reinsch, S., Reu, B., Sack, L., Salgado-Negre, B., Sardans, J., Shiodera, S., Shipley, B., Siefert, A., Sosinski, E., Soussana, J. F., Swaine, E., Swenson, N., Thompson, K., Thornton, P., Waldram, M., Weiher, E., White, M., White, S., Wright, S. J., Yguel, B., Zaehle, S., Zanne, A. E., and Wirth, C.: TRY – a global database of plant traits, Glob. Change Biol., 17, 2905–2935, https://doi.org/10.1111/J.1365-2486.2011.02451.X, 2011.
Keenan, T. F. and Niinemets, U.: Global leaf trait estimates biased due to plasticity in the shade, Nat. Plants, 3, 16201, https://doi.org/10.1038/nplants.2016.201, 2017.
Kochhar, S. and Gujral, S.: Abiotic and Biotic Stress, in: Plant Physiology: Theory and Applications, 2 ed., edited by: Kochhar, S. L. and Gujral, S. K., Cambridge University Press, Cambridge, 545–589, https://doi.org/10.1017/9781108486392.021, 2020.
Li, D., Wang, X., Zheng, H., Zhou, K., Yao, X., Tian, Y., Zhu, Y., Cao, W., and Cheng, T.: Estimation of area- and mass-based leaf nitrogen contents of wheat and rice crops from water-removed spectra using continuous wavelet analysis, Plant Methods, 14, 76, https://doi.org/10.1186/s13007-018-0344-1, 2018.
Li, P., Calatayud, V., Gao, F., Uddling, J., and Feng, Z. Z.: Differences in ozone sensitivity among woody species are related to leaf morphology and antioxidant levels, Tree Physiol., 36, 1105–1116, https://doi.org/10.1093/treephys/tpw042, 2016.
Li, P., Feng, Z., Catalayud, V., Yuan, X., Xu, Y., and Paoletti, E.: A meta-analysis on growth, physiological, and biochemical responses of woody species to ground-level ozone highlights the role of plant functional types, Plant Cell Environ., 40, 2369–2380, https://doi.org/10.1111/pce.13043, 2017.
Li, S., Moller, C. A., Mitchell, N. G., Lee, D., Sacks, E. J., and Ainsworth, E. A.: Testing unified theories for ozone response in C-4 species, Glob. Change Biol., 28, 3379–3393, https://doi.org/10.1111/gcb.16108, 2022.
Lombardozzi, D., Levis, S., Bonan, G., Hess, P. G., and Sparks, J. P.: The Influence of Chronic Ozone Exposure on Global Carbon and Water Cycles, J. Climate, 28, 292–305, https://doi.org/10.1175/Jcli-D-14-00223.1, 2015.
LRTAP Convention: UNECE: Mapping Critical Levels for Vegetation, Revised Chapter 3 of the UNECE Manual on methodologies and criteria for Modelling and Mapping Critical Loads & Levels and Air Pollution Effects, Risks and Trends, Prepared under the Convention on Long-range Transboundary Air Pollution (UNECE) by the International Cooperative Programme on Effects of Air Pollution on Natural Vegetation and Crops, 1–66, 2017.
Ma, Y. and Yue, X.: Trait-based ozone plant sensitivity to assess global vegetation damage risks, Zenodo [code and data set], https://doi.org/10.5281/zenodo.6348731, 2022.
Massman, W. J., Musselman, R. C., and Lefohn, A. S.: A conceptual ozone dose-response model to develop a standard to protect vegetation, Atmos. Environ., 34, 745–759, https://doi.org/10.1016/s1352-2310(99)00395-7, 2000.
Mills, G., Hayes, F., Simpson, D., Emberson, L., Norris, D., Harmens, H., and Buker, P.: Evidence of widespread effects of ozone on crops and (semi-)natural vegetation in Europe (1990–2006) in relation to AOT40-and flux-based risk maps, Glob. Change Biol., 17, 592–613, https://doi.org/10.1111/j.1365-2486.2010.02217.x, 2011.
Mills, G., Sharps, K., Simpson, D., Pleijel, H., Frei, M., Burkey, K., Emberson, L., Uddling, J., Broberg, M., Feng, Z., Kobayashi, K., and Agrawal, M.: Closing the global ozone yield gap: Quantification and cobenefits for multistress tolerance, Glob. Chang Biol., 24, 4869–4893, https://doi.org/10.1111/gcb.14381, 2018a.
Mills, G., Sharps, K., Simpson, D., Pleijel, H., Broberg, M., Uddling, J., Jaramillo, F., Davies, W. J., Dentener, F., Van den Berg, M., Agrawal, M., Agrawal, S. B., Ainsworth, E. A., Buker, P., Emberson, L., Feng, Z. Z., Harmens, H., Hayes, F., Kobayashi, K., Paoletti, E., and Van Dingenen, R.: Ozone pollution will compromise efforts to increase global wheat production, Glob. Change Biol., 24, 3560–3574, https://doi.org/10.1111/gcb.14157, 2018b.
Moreno-Martinez, A., Camps-Valls, G., Kattge, J., Robinson, N., Reichstein, M., van Bodegom, P., Kramer, K., Cornelissen, J. H. C., Reich, P., Bahn, M., Niinemets, U., Penuelas, J., Craine, J. M., Cerabolini, B. E. L., Minden, V., Laughlin, D. C., Sack, L., Allred, B., Baraloto, C., Byun, C., Soudzilovskaia, N. A., and Running, S. W.: A methodology to derive global maps of leaf traits using remote sensing and climate data, Remote Sens. Environ., 218, 69–88, 2018.
Moreno-Martínez, Á., Camps-Valls, G., Kattge, J., Robinson, N., Reichstein, M., Bodegom, P. V., and Running, S. W.: Global maps of leaf traits at 3km resolution, TRY File Archive [data set], https://doi.org/10.17871/TRY.59, 2020.
Mukherjee, A., Yadav, D. S., Agrawal, S. B., and Agrawal, M.: Ozone a persistent challenge to food security in India: Current status and policy implications, Current Opinion in Environmental Science & Health, 19, 100220, https://doi.org/10.1016/j.coesh.2020.10.008, 2021.
Oliver, R. J., Mercado, L. M., Sitch, S., Simpson, D., Medlyn, B. E., Lin, Y.-S., and Folberth, G. A.: Large but decreasing effect of ozone on the European carbon sink, Biogeosciences, 15, 4245–4269, https://doi.org/10.5194/bg-15-4245-2018, 2018.
Ollinger, S. V., Aber, J. D., and Reich, P. B.: Simulating Ozone Effects on Forest Productivity: Interactions among Leaf-, Canopy-, and Stand-Level Processes, Ecol. Appl., 7, 1237–1251, https://doi.org/10.2307/2641211, 1997.
Peng, J. L., Shang, B., Xu, Y. S., Feng, Z. Z., Pleijel, H., and Calatayud, V.: Ozone exposure- and flux-yield response relationships for maize, Environ. Pollut., 252, 1–7, 2019.
Poorter, H., Niinemets, U., Poorter, L., Wright, I. J., and Villar, R.: Causes and consequences of variation in leaf mass per area (LMA): a meta-analysis, New Phytol., 182, 565–588, https://doi.org/10.1111/j.1469-8137.2009.02830.x, 2009.
Reich, P. B.: The world-wide “fast-slow” plant economics spectrum: a traits manifesto, J. Ecol., 102, 275–301, https://doi.org/10.1111/1365-2745.12211, 2014.
Reich, P. B. and Amundson, R. G.: Ambient levels of ozone reduce net photosynthesis in tree and crop species, Science, 230, 566–570, https://doi.org/10.1126/science.230.4725.566, 1985.
Reich, P. B., Ellsworth, D. S., and Walters, M. B.: Leaf structure (specific leaf area) modulates photosynthesis-nitrogen relations: evidence from within and across species and functional groups, Funct. Ecol., 12, 948–958, https://doi.org/10.1046/j.1365-2435.1998.00274.x, 1998.
Reich, P. B., Walters, M. B., and Ellsworth, D. S.: From tropics to tundra: Global convergence in plant functioning, P. Natl. Acad. Sci. USA, 94, 13730–13734, https://doi.org/10.1073/pnas.94.25.13730, 1997.
Reich, P. B., Ellsworth, D. S., Walters, M. B., Vose, J. M., Gresham, C., Volin, J. C., and Bowman, W. D.: Generality of leaf trait relationships: A test across six biomes, Ecology, 80, 1955–1969, https://doi.org/10.1890/0012-9658(1999)080[1955:goltra]2.0.co;2, 1999.
Richards, B. L., Middleton, J. T., and Hewitt, W. B.: Air Pollution With Relation to Agronomic Crops: V. Oxidant Stipple of Grape, Agron. J., 50, 559–561, 1958.
Richards, R. A.: Selectable traits to increase crop photosynthesis and yield of grain crops, J. Exp. Bot., 51, 447–458, https://doi.org/10.1093/jexbot/51.suppl_1.447, 2000.
Shang, B., Feng, Z. Z., Li, P., Yuan, X. Y., Xu, Y. S., and Calatayud, V.: Ozone exposure- and flux-based response relationships with photosynthesis, leaf morphology and biomass in two poplar clones, Sci. Total Environ., 603, 185–195, https://doi.org/10.1016/j.scitotenv.2017.06.083, 2017.
Shipley, B., Lechowicz, M. J., Wright, I., and Reich, P. B.: Fundamental trade-offs generating the worldwide leaf economics spectrum, Ecology, 87, 535–541, https://doi.org/10.1890/05-1051, 2006.
Sitch, S., Cox, P. M., Collins, W. J., and Huntingford, C.: Indirect radiative forcing of climate change through ozone effects on the land-carbon sink, Nature, 448, 791–794, https://doi.org/10.1038/Nature06059, 2007.
Tai, A. P. K., Martin, M. V., and Heald, C. L.: Threat to future global food security from climate change and ozone air pollution, Nat. Clim. Change, 4, 817–821, https://doi.org/10.1038/nclimate2317, 2014.
Tai, A. P. K., Sadiq, M., Pang, J. Y. S., Yung, D. H. Y., and Feng, Z.: Impacts of Surface Ozone Pollution on Global Crop Yields: Comparing Different Ozone Exposure Metrics and Incorporating Co-effects of CO2, Frontiers in Sustainable Food Systems, 5, 534616, https://doi.org/10.3389/fsufs.2021.534616, 2021.
Tiwari, S., Grote, R., Churkina, G., and Butler, T.: Ozone damage, detoxification and the role of isoprenoids – new impetus for integrated models, Funct. Plant Biol., 43, 324–336, https://doi.org/10.1071/fp15302, 2016.
Turnock, S. T., Wild, O., Dentener, F. J., Davila, Y., Emmons, L. K., Flemming, J., Folberth, G. A., Henze, D. K., Jonson, J. E., Keating, T. J., Kengo, S., Lin, M., Lund, M., Tilmes, S., and O'Connor, F. M.: The impact of future emission policies on tropospheric ozone using a parameterised approach, Atmos. Chem. Phys., 18, 8953–8978, https://doi.org/10.5194/acp-18-8953-2018, 2018.
Walker, A. P., Beckerman, A. P., Gu, L., Kattge, J., Cernusak, L. A., Domingues, T. F., Scales, J. C., Wohlfahrt, G., Wullschleger, S. D., and Woodward, F. I.: The relationship of leaf photosynthetic traits – Vcmax and Jmax – to leaf nitrogen, leaf phosphorus, and specific leaf area: a meta-analysis and modeling study, Ecol. Evol., 4, 3218–3235, https://doi.org/10.1002/ece3.1173, 2014.
Wang, K. and Shangguan, Z.: Photosynthetic characteristics and resource utilization efficiency of maize (Zea maysL.) and millet (Setaria italicaL.) in a semi-arid hilly loess region in China, New Zeal. J. Crop Hort., 38, 247–254, https://doi.org/10.1080/01140671.2010.503987, 2010.
Wittig, V. E., Ainsworth, E. A., Naidu, S. L., Karnosky, D. F., and Long, S. P.: Quantifying the impact of current and future tropospheric ozone on tree biomass, growth, physiology and biochemistry: a quantitative meta-analysis, Glob. Change Biol., 15, 396–424, 2009.
Wright, I. J., Westoby, M., and Reich, P. B.: Convergence towards higher leaf mass per area in dry and nutrient-poor habitats has different consequences for leaf life span, J. Ecol., 90, 534–543, https://doi.org/10.1046/j.1365-2745.2002.00689.x, 2002.
Wright, I. J., Reich, P. B., Cornelissen, J. H. C., Falster, D. S., Groom, P. K., Hikosaka, K., Lee, W., Lusk, C. H., Niinemets, U., Oleksyn, J., Osada, N., Poorter, H., Warton, D. I., and Westoby, M.: Modulation of leaf economic traits and trait relationships by climate, Global Ecol. Biogeogr., 14, 411–421, https://doi.org/10.1111/j.1466-822x.2005.00172.x, 2005.
Wu, Y., Gong, W., Wang, Y., Yong, T., Yang, F., Liu, W., Wu, X., Du, J., Shu, K., Liu, J., Liu, C., and Yang, W.: Leaf area and photosynthesis of newly emerged trifoliolate leaves are regulated by mature leaves in soybean, J. Plant Res., 131, 671–680, https://doi.org/10.1007/s10265-018-1027-8, 2018.
Yue, X. and Unger, N.: The Yale Interactive terrestrial Biosphere model version 1.0: description, evaluation and implementation into NASA GISS ModelE2, Geosci. Model Dev., 8, 2399–2417, https://doi.org/10.5194/gmd-8-2399-2015, 2015.
Yue, X. and Unger, N.: Fire air pollution reduces global terrestrial productivity, Nat. Commun., 9, 5413, https://doi.org/10.1038/s41467-018-07921-4, 2018.
Zalles, V., Hansen, M. C., Potapov, P. V., Parker, D., Stehman, S. V., Pickens, A. H., Parente, L. L., Ferreira, L. G., Song, X.-P., Hernandez-Serna, A., and Kommareddy, I.: Rapid expansion of human impact on natural land in South America since 1985, Sci. Adv., 7, eabg1620, https://doi.org/10.1126/sciadv.abg1620, 2021.
Zhou, S. S., Tai, A. P. K., Sun, S., Sadiq, M., Heald, C. L., and Geddes, J. A.: Coupling between surface ozone and leaf area index in a chemical transport model: strength of feedback and implications for ozone air quality and vegetation health, Atmos. Chem. Phys., 18, 14133–14148, https://doi.org/10.5194/acp-18-14133-2018, 2018.
Zhu, J., Tai, A. P. K., and Hung Lam Yim, S.: Effects of ozone–vegetation interactions on meteorology and air quality in China using a two-way coupled land–atmosphere model, Atmos. Chem. Phys., 22, 765–782, https://doi.org/10.5194/acp-22-765-2022, 2022.