the Creative Commons Attribution 4.0 License.
the Creative Commons Attribution 4.0 License.
 | 23 Mar 2023
Validation of a new spatially explicit process-based model (HETEROFOR) to simulate structurally and compositionally complex forest stands in eastern North America
Arthur Guignabert
Quentin Ponette
Frédéric André
Christian Messier
Philippe Nolet
Mathieu Jonard
Process-based forest growth models with spatially explicit representation are relevant tools to investigate innovative silviculture practices and/or climate change effects because they are based on key ecophysiological processes and account for the effects of local competition for resources on tree growth. Such models are rare and are often calibrated for a very limited number of species and rarely for mixed and/or uneven-aged stands, and none are suitable for the temperate forests of Québec. The aim of this study was to calibrate and evaluate HETEROFOR (HETEROgeneous FORest), a process-based and spatially explicit model based on resource sharing, for 23 functionally diverse tree species in forest stands with contrasting species compositions and environmental conditions in southern Quebec. Using data from the forest inventory of Quebec, we evaluated the ability of HETEROFOR to predict the short-term growth (5–16 years) of these species at the tree and stand levels and the long-term dynamics (120 years) of red and sugar maple stands. The comparison between the prediction quality of the calibration and evaluation datasets showed the robustness of the model performance in predicting individual-tree growth. The model reproduced correctly the individual basal area increment (BAI) of the validation dataset, with a mean Pearson's correlation coefficient of 0.56 and a mean bias of 18 %. Our results also highlighted that considering tree position is of importance for predicting individual-tree growth most accurately in complex stands with both vertically and horizontally heterogeneous structures. The model also showed a good ability to reproduce BAI at the stand level, both for monospecific (bias of −3.7 %; Pearson's r=0.55) and multi-species stands (bias of −9.1 %; Pearson's r=0.62). Long-term simulations of red maple and sugar maple showed that HETEROFOR was able to accurately predict the growth (basal area and height) and mortality processes from the seedling stage to the mature stand. Our results suggest that HETEROFOR is a reliable option to simulate forest growth in southern Quebec and to test new forestry practices under future climate scenarios.
- Article
(4566 KB) - Full-text XML
-
Supplement
(1027 KB) - BibTeX
- EndNote


Forest ecosystems are subject to an increased disturbance frequency and intensity caused by global changes, leading to large-scale mortalities and jeopardizing the ability of forests to sustain the provision of crucial ecosystem services (Trumbore et al., 2015; Seidl et al., 2017; McDowell et al., 2020). It is therefore necessary to account for the high level of uncertainty related to these ongoing and future changes by considering flexible management strategies that increase forest resilience and multifunctionality, particularly those that promote multi-species and uneven-aged stands (Messier et al., 2021; Jactel et al., 2021; Brockerhoff et al., 2017). However, there is still a lack of knowledge about the ecology of mixed stands, as well as of guidelines for their long-term management (del Río et al., 2021; Forrester, 2019).
Performing experiments to test the effects of various management strategies and/or future environmental conditions on forests is complicated due to the longevity and slow growth of tree species. Modelling approaches are therefore a useful tool for studying these issues on a long timescale (Pretzsch et al., 2015; Maréchaux et al., 2021; Ruiz-Benito et al., 2020). Of the many different types of models used in forest management, which differ in their structure and complexity depending on the initial objectives (Makela et al., 2000; Porté and Bartelink, 2002), there are three main types: empirical models, process-based models, and hybrid models (i.e., using both empirical and process-based approaches; Fontes et al., 2010). Empirical models are usually calibrated from descriptive relationships derived from inventory data and are only suitable for extrapolation to systems and environmental conditions for which they have been parameterized (Fontes et al., 2010). On the contrary, process-based models (PBMs) are more appropriate for investigating innovative silviculture and/or climate change effects, as they rely on key ecophysiological processes (e.g., photosynthesis, light interception, and respiration) to simulate forest growth using a set of interdependent sub-models (Bohn et al., 2014; Makela et al., 2000). These PBMs can spatially represent the forest in several ways (Pretzsch et al., 2015): at the stand scale by considering an average tree of the stand, at the cohort scale by handling the forest as horizontally homogeneous layers, or at the individual-tree scale by considering each tree in the stand. Furthermore, these PBMs may be spatially explicit (e.g., BALANCE; Grote and Pretzsch, 2002) or not (e.g., PPA; Purves et al., 2008; Strigul et al., 2008). Spatially explicit models allow one to account for the effects of local competition for resources on tree growth and for the disturbance dynamics and their effects on regeneration (light heterogeneity in the understorey); they are therefore the most relevant model type for studying forest management strategies in changing environments for uneven-aged and mixed stands (Seidl et al., 2005; Pretzsch, 2022). Individual-based and spatially explicit models are particularly well suited to testing silvicultural approaches that conduct to structurally complex stands such as the continuous-cover forestry.
The present study is the first step toward the development of a stand-level modelling project that aims to test how contrasting management strategies affect the resilience and multifunctionality of eastern North American forests. Long-term simulations will be carried out by crossing future climate scenarios and disturbances (e.g., windstorms, droughts, and biotic outbreaks) with current and alternative management strategies: (i) business as usual, i.e., the same management as that practised in the last decades; (ii) enriching forests with drought-tolerant species adapted to the expected climate change; and (iii) enriching forests with species based on the functional-level approach (Aubin et al., 2016; Messier et al., 2021; Aquilué et al., 2021). This latter approach promotes both the functional diversity (i.e., the diversity of traits represented in the stand) as a means of increasing adaptation to disturbances through the partitioning of ecological niches and also the functional redundancy (i.e., when multiple species share similar traits) to ensure the continuity of a function if one species is lost (Messier et al., 2019; Oliver et al., 2015; Mori et al., 2013). To do so, we require a spatially explicit individual- and process-based model in which the main processes, such as light interception, carbon allocation, phenology, and water balance, are included. Several forest growth models already exist and have been calibrated for temperate species in eastern North America, including empirical models, e.g., Artémis (Power, 2016) and MGM (Bokalo et al., 2013); hybrid models such as TRIPLEX (Peng et al., 2002) and ZELIG-CFS (Larocque et al., 2011); and process-based models, e.g., SORTIE/BC (Coates et al., 2003) and Forest v5.1 (Schwalm and Ek, 2004). However, neither of these two PBMs, which are the only two PBMs in this region that consider individual-tree growth (Pretzsch et al., 2015), correspond to our expectations. Forest v5.1, although very exhaustive regarding the processes integrated, does not consider the spatial representation of each tree. In contrast, SORTIE/BC is spatially explicit but does not integrate water and phenological processes and/or climate change.
Here, we describe the parameterization and validation of the HETEROFOR (HETEROgeneous FORest) model in structurally and compositionally complex stands in eastern North America. HETEROFOR is a spatially explicit and process-based model that describes individual-tree growth based on resource sharing (light and water), and it was specifically developed to simulate complex uneven-aged and mixed stands under various disturbance scenarios (de Wergifosse et al., 2020; Jonard et al., 2020). More specifically, we (i) calibrated the model for 23 tree species that represent a wide range of functional groups and that are already present in Quebec or are from southern provenances which could be suitable for planting in the future; (ii) evaluated the ability of HETEROFOR to predict the short-term growth (5–16 years) of these species at the tree and stand levels using data from the forest inventory of Quebec; and (iii) tested if the model could reproduce growth and mortality processes in the long-term (120 years) with a focus on red maple and sugar maple, the two major species of Quebec's temperate forests.
2.1 HETEROFOR
HETEROFOR is a tree-scale and spatially explicit process-based model designed to investigate the response of structurally complex stands (i.e., uneven-aged and/or mixed stands) to changing environmental conditions and management options (Jonard et al., 2020; de Wergifosse et al., 2020). It is implemented and freely available on Capsis (Dufour-Kowalski et al., 2012), a collaborative simulation platform for forest growth and dynamics modelling. An overview of the functioning of the model, as well as the description of the carbon-related processes (photosynthesis, respiration, carbon allocation, and tree dimensional growth), can be found in Jonard et al. (2020), while the phenology and water balance modules are described by de Wergifosse et al. (2020), the light interception module is described by André et al. (2021), and the regeneration module is described by Ryelandt (2019).
In short, HETEROFOR starts by running the phenology routine from meteorological data. It determines for each species the budburst, yellowing, and falling dates, as well as the daily foliage stage (foliage development stage and green leaf proportion). Furthermore, for the deciduous species, phenology is calculated at the tree scale to account for the extended vegetation period of understorey trees (de Wergifosse et al., 2020). The solar radiation intercepted by the trunk and the crown of each tree is then calculated using a ray-tracing approach with the SAMSARALIGHT library of Capsis (Courbaud et al., 2003; André et al., 2021). The gross primary production (GPP) is calculated hourly from the photosynthetically active radiation absorbed per unit of leaf area and from the soil water potential using the photosynthesis model CASTANEA, also available on Capsis (Dufrêne et al., 2005; Farquhar et al., 1980). The net primary production (NPP) is estimated as a fraction of the GPP, depending on the tree dimensions, neighbour competition, and air temperature. This approach implicitly accounts for carbon losses due to maintenance and growth respiration. The NPP is first allocated to foliage and fine roots and, for trees over a given size, to fruits. The remaining NPP is then allocated to structural components (trunk, branches, and structural roots) using allometric equations, which derive tree dimensional growth (primarily for growth in height, with the remainder for growth in diameter) while considering competition with neighbouring trees (Jonard et al., 2020). A distance-dependent approach was used to estimate the changes in crown dimensions in the four cardinal directions based on the competition with the neighbouring trees (for more details, see Jonard et al., 2020). When a tree does not have enough NPP to support its growth (due to light competition, water stress, or ageing), the leaf biomass is reduced, inducing a defoliation, which will ultimately lead to the death of the tree when the defoliation reaches a given threshold (90 % by default; Jonard et al., 2020).
HETEROFOR also includes a regeneration module based on the regeneration library of Capsis. Considering the large number of seedlings that may be present in the understorey, explicitly locating all of them would be too time consuming and unrealistic. Instead, the stand is divided into square cells of a given size (10 m × 10 m by default), and seedlings are managed as cohorts of species structured vertically in several size classes, with all individuals within a size class having the same dendrometric characteristics. From the tallest size class to the shortest, the radiation absorbed by each one and transmitted to the next one is computed following the Beer–Lambert law. The individual growth increment is calculated from the transmittance, and other morphological attributes (crown radius, woody biomass, leaf biomass) are derived from the height or the diameter using allometric relationships. GPP and NPP are calculated for the whole size class using CASTANEA and are compared to the individual biomass increment (i.e., individual NPP, based on annual height increment) to deduce the number of seedlings able to survive with the available radiation (Ryelandt, 2019). Saplings are recruited and spatialized once they reach the recruitment height (10 m by default).
2.2 Species
The calibration and evaluation of HETEROFOR were completed for 23 North American tree species – 14 broadleaved and 9 coniferous species (Table 1) – including all the major species of managed forests in the Quebec temperate forests (Abies balsamea, Acer rubrum, Acer saccharum, Betula alleghaniensis, Picea glauca, Pinus strobus, Populus tremuloides, and Tsuga canadensis). We also selected species that are present to a limited extent in Quebec but which could be suitable for planting in the coming years, mainly northern US species currently at their northern range limit in Quebec (e.g., Acer saccharinum, Prunus serotina, Quercus rubra, and Tilia americana; Fig. S1 in the Supplement). These 23 species belong to seven functional groups (Table 1; Fig. S2) according to the clustering of Mina et al. (2022), which considers 77 North American tree species and is based on nine functional traits identified as essential for ecosystem functioning and resilience to disturbances (Aquilué et al., 2021; Kühn et al., 2021). Thus, this set of species will allow us to study various types of species mixtures and management scenarios, particularly those based on functional diversity and redundancy. Mean tree diameter at breast height (DBH) in the selected sites from the Quebec forest inventory (see Sect. 2.3) varied from 11.7 cm for Betula populifolia to 21.3 cm for Tilia americana (15.9 cm on average for all species), and the range of diameter for a single species varied from 11.6 cm for Betula populifolia to 57.4 cm for Pinus strobus (34.6 cm on average for all species; Table 1).
2.3 Sites
We selected 200 plots from the permanent sample plots (PSPs) of the forest inventory of Quebec (MFFP, 2021) to calibrate and evaluate the model. The plot size was 400 m2, and the time span between two inventories for a given plot ranged between 5 and 16 years (Table S1). In each survey, the diameter at breast height was measured on every tree larger than 9.1 cm DBH (some smaller ones are still present in the dataset – they were considered to be recruited trees and were kept for calibration and evaluation; see Table 1), whereas tree height was only measured on a subsample of trees (about 15 % of the trees). Social status (dominant, co-dominant, intermediate, and oppressed) and sun exposure class (from 1, where a tree grows in full light, to 4, where it grows in the absence of light) of each recorded tree were also indicated in only a few plots.
All plots were selected within the temperate deciduous forest area (latitude < 47∘; Fig. 1) and based on their species composition to ensure a sufficient number of individuals of each species of interest. They were also selected to be evenly distributed among the three physiographic regions characterizing this part of Quebec (Appalachians, Canadian Shield, and Saint Lawrence Lowlands; Fig. 1), which can be distinguished by soil parent material, topography, distribution of permafrost, and tree line location (Acton et al., 2015). The plots covered a wide variety of environmental conditions and stand characteristics: mean annual temperature ranged from 0.6 to 7.1 ∘C, mean annual precipitation comprised of rain and snow from 919 to 1446 mm (average over the 1970–2019 period), mean DBH from 10.3 to 27.7 cm, tree density from 325 to 2725 trees ha−1, and basal area from 3.5 to 60.6 m2 ha−1 (Table S1 in the Supplement). There were also large variations in soil properties. Soil coarse fraction varied between 0 % and 80 %; soil depth varied between 0.12 and 1 m; and 10 different soil textures derived from the USDA textural triangle (Schoeneberger et al., 2012) were represented among all sites, with four types dominating (sandy loam, loamy sand, sand, and loam accounted for 85 % of the sites; Table S1).
Table 1Selected characteristics of the 23 tree species sampled from 200 permanent plots of the Quebec forest inventory.
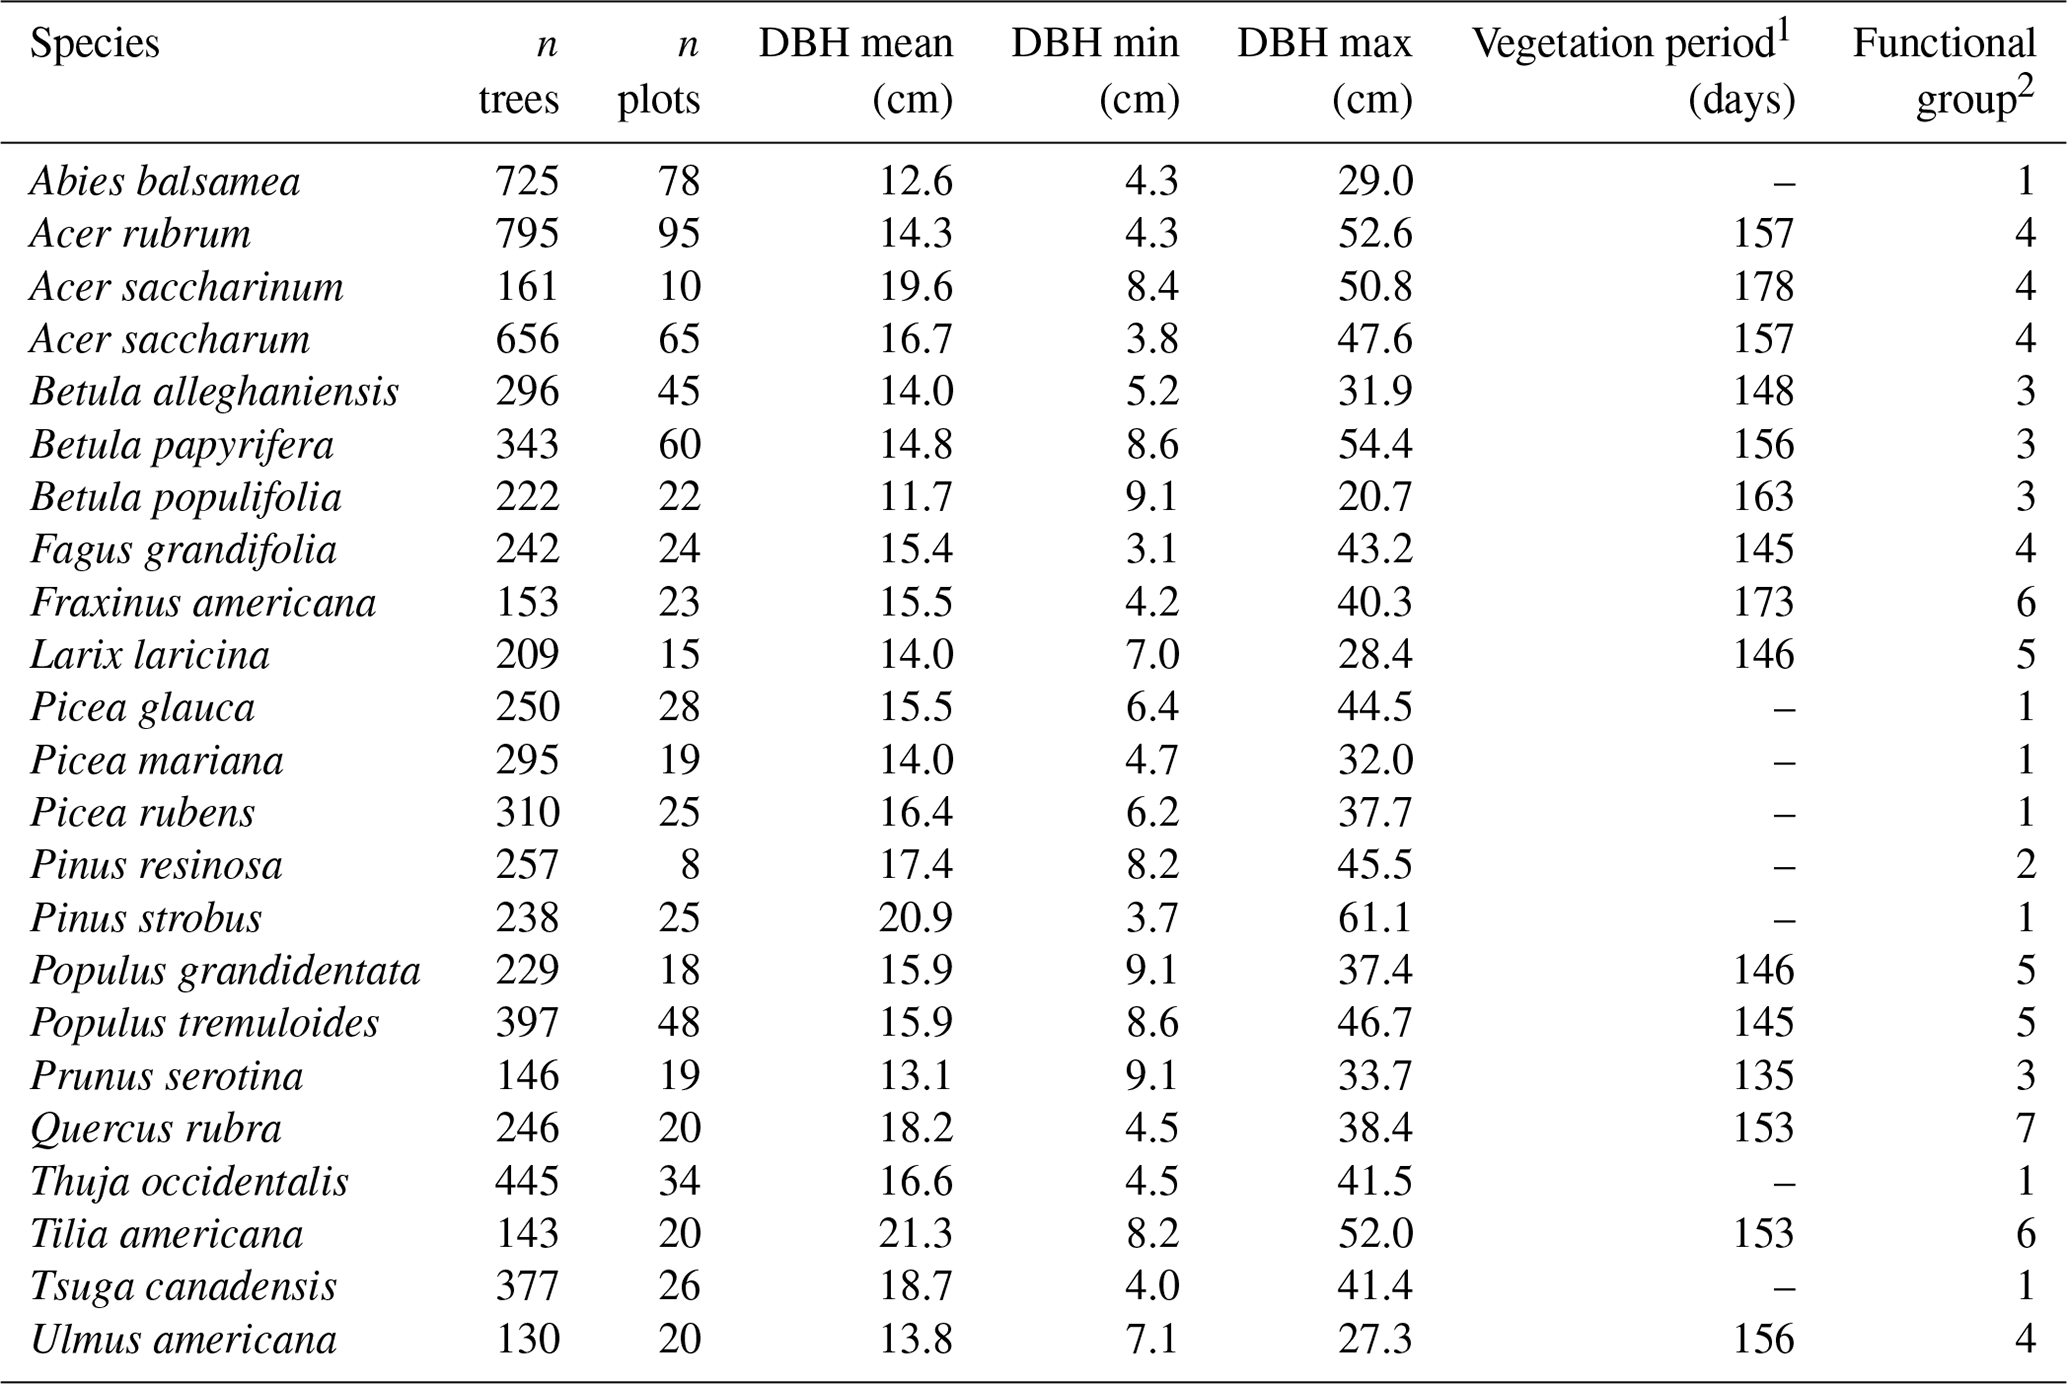
1 From budburst date to falling starting date. 2 See Fig. S2 for more details about functional group characteristics.
The 200 stands were classified into five forest types based on their species composition: monospecific broadleaved and monospecific coniferous when a single species accounted for more than 75 % of the total basal area of the stand; multi-species broadleaved and multi-species coniferous when, respectively, broadleaved or coniferous trees represented at least 75 % of the total basal area of the stand with two species representing at least 25 %; and mixed when both coniferous and broadleaved species accounted for more than 25 % of the total basal area. In total, there were 32 monospecific broadleaved stands, 26 monospecific coniferous stands, 71 multi-species broadleaved stands, 26 multi-species coniferous stands, and 45 mixed stands. In addition, species richness ranged from 2 to 12 species per stand, and functional richness ranged from 1 to 6, illustrating a high diversity of the selected stands. This provided an adequate dataset to evaluate the ability of the model to simulate growth in structurally complex stands.
To perform an evaluation with a dataset independent from the one used to calibrate the model (see Sect. 2.4), the 200 sites were split into two datasets of 100 sites (Fig. 1). Therefore, sites numbered 1–100 (Table S1; total n trees = 3754) were used for calibration, and sites numbered 101–200 (Table S1; total n trees = 3511) were dedicated to model evaluation, with both datasets being similar in terms of environmental conditions and stand characteristics. This splitting of the sites was also made based on species composition to have at least 100 individuals for each species in each dataset. However, five species were sparsely represented in the forest inventory plots (Acer saccharinum, Fraxinus americana, Prunus serotina, Tilia americana, and Ulmus americana). For those species, we chose to use a greater number of individuals for the calibration (for a minimum of around 100 trees for each species), resulting in around 40 trees per species remaining to perform the evaluation. Therefore, these five species were calibrated independently but were grouped together as “other broadleaved” for the evaluation.

Figure 1Location of the 200 selected permanent sample plots of the forest inventory of Quebec. The red square in the insert locates the study area within Quebec (in blue) and Canada.
2.4 Model calibration
Most of the parameters needed by HETEROFOR are species-specific and are described in Table 2. Values were either retrieved from the literature or were fitted with available data when dealing with empirical relationships (see the “source” column in Table 2). Phenological parameters were calibrated using the Phenological Modelling Platform (Chuine et al., 2013). All values for each species are given in Table S2. Some other parameters are generic for all species or by species type (broadleaved vs. coniferous, deciduous vs. evergreen) and are presented in Table S3. The regeneration module has been fully calibrated for only six species so far. Parameters and values for these species are presented in Table S4.
The carbon use efficiency (CUE, kgC kgC−1 – corresponding to the NPP-to-GPP ratio) is a crucial parameter and the only one for which running the model is necessary for the calibration. The CUE was determined for each tree using an empirical relationship based on tree diameter, a light competition index, and temperature and was computed following de Wergifosse et al. (2022):
where dbh (cm) is the diameter at breast height; LCI is the light competition index; Tair (∘C) is the mean annual temperature; and α, β, γ, δ and ε are species-specific parameters. The LCI corresponds to the ratio between the absorbed radiation with and without neighbouring trees and ranges from 0 (no light reaching the tree) to 1 (no light competition; Jonard et al., 2020). This equation was fitted with data from our first dataset of inventory plots dedicated to calibration (sites numbered from 1 to 100 in Table S1). The NPP was obtained from the two inventories for each tree using the reconstruction mode in HETEROFOR (for detailed information, see Jonard et al., 2020) and then divided by the predicted GPP to estimate CUE.
2.5 Model evaluation
2.5.1 Short-term evaluation: individual-tree growth increments
Model initialization
HETEROFOR requires three different files to be initialized: stand characteristics, soil properties, and meteorological data.
The stand characteristics file contains the position of each tree () and its main dendrological characteristics: girth at breast height (cm), total height (m), crown base height (m), height of the maximum crown extension (m), and crown radii in the four cardinal directions (m). The initial observations on each monitoring plot were used for stand input data. However, only the diameter was available for every tree, and total height was available for only a small subset of the trees. Thus, crown dimensions and total height (when not measured) were estimated using previously calibrated species-specific allometric equations (see Jonard et al., 2020, for the equations and Table S2 for parameters). Tree positions were randomly generated considering the social status of the tree and/or the sun exposure class when available, as well as the size of the trees. The procedure starts by randomly positioning the dominant trees and/or those with a maximum sun exposure class (the tree receives direct sunlight both on the top and on its four sides), without any crown overlapping between them. When this information was not available, the 15 % tallest trees and the 15 % with the largest diameters were considered to be dominant. The position of the remaining trees is randomly assigned but constrained by the position of the dominant trees: a tree cannot be positioned close to a dominant one if its total height exceeds the height of the largest crown extension of the dominant tree nearby. Crown overlapping is possible for non-dominant trees and is bounded by a maximum value. Finally, the stand file also includes the longitude, latitude, slope, and aspect of the site.
The model also needs a description of the soil horizons. For each horizon, this file includes the upper and lower limits (m); the coarse fraction (m3 m−3); the bulk density (kg m−3); sand, silt, and clay contents (g g−1); organic carbon content (mg g−1); soil pH (H2O); and fine-root proportion (%). All of these data were collected from various sources. The organic horizon thickness; sand, silt, and clay contents; coarse fraction; and soil pH of the horizons were recorded in the forest permanent-inventory database. The description of the soil profile was found in the ecological inventory of Quebec, conducted by the Ministry of Natural Resources, le point d'observation ecologique (POE; Saucier, 1994). For each inventory plot, we selected the closest POE that had the same soil type. Bulk density and organic carbon content for each soil type were retrieved from the National Soil Database of the Canadian Soil Information Service (NSDB, 2021).
Lastly, meteorological inputs were obtained from the ERA5 global reanalysis (Bell et al., 2021; Hersbach et al., 2020) and provided hourly data of air temperature (∘C), soil surface temperature (∘C), solar radiation (W m−2), rainfall (mm), relative humidity (%), wind speed (m s−1), and wind direction (∘).
Table 2Description of the species-specific parameters used in HETEROFOR (see Table S3 for the generic parameters).
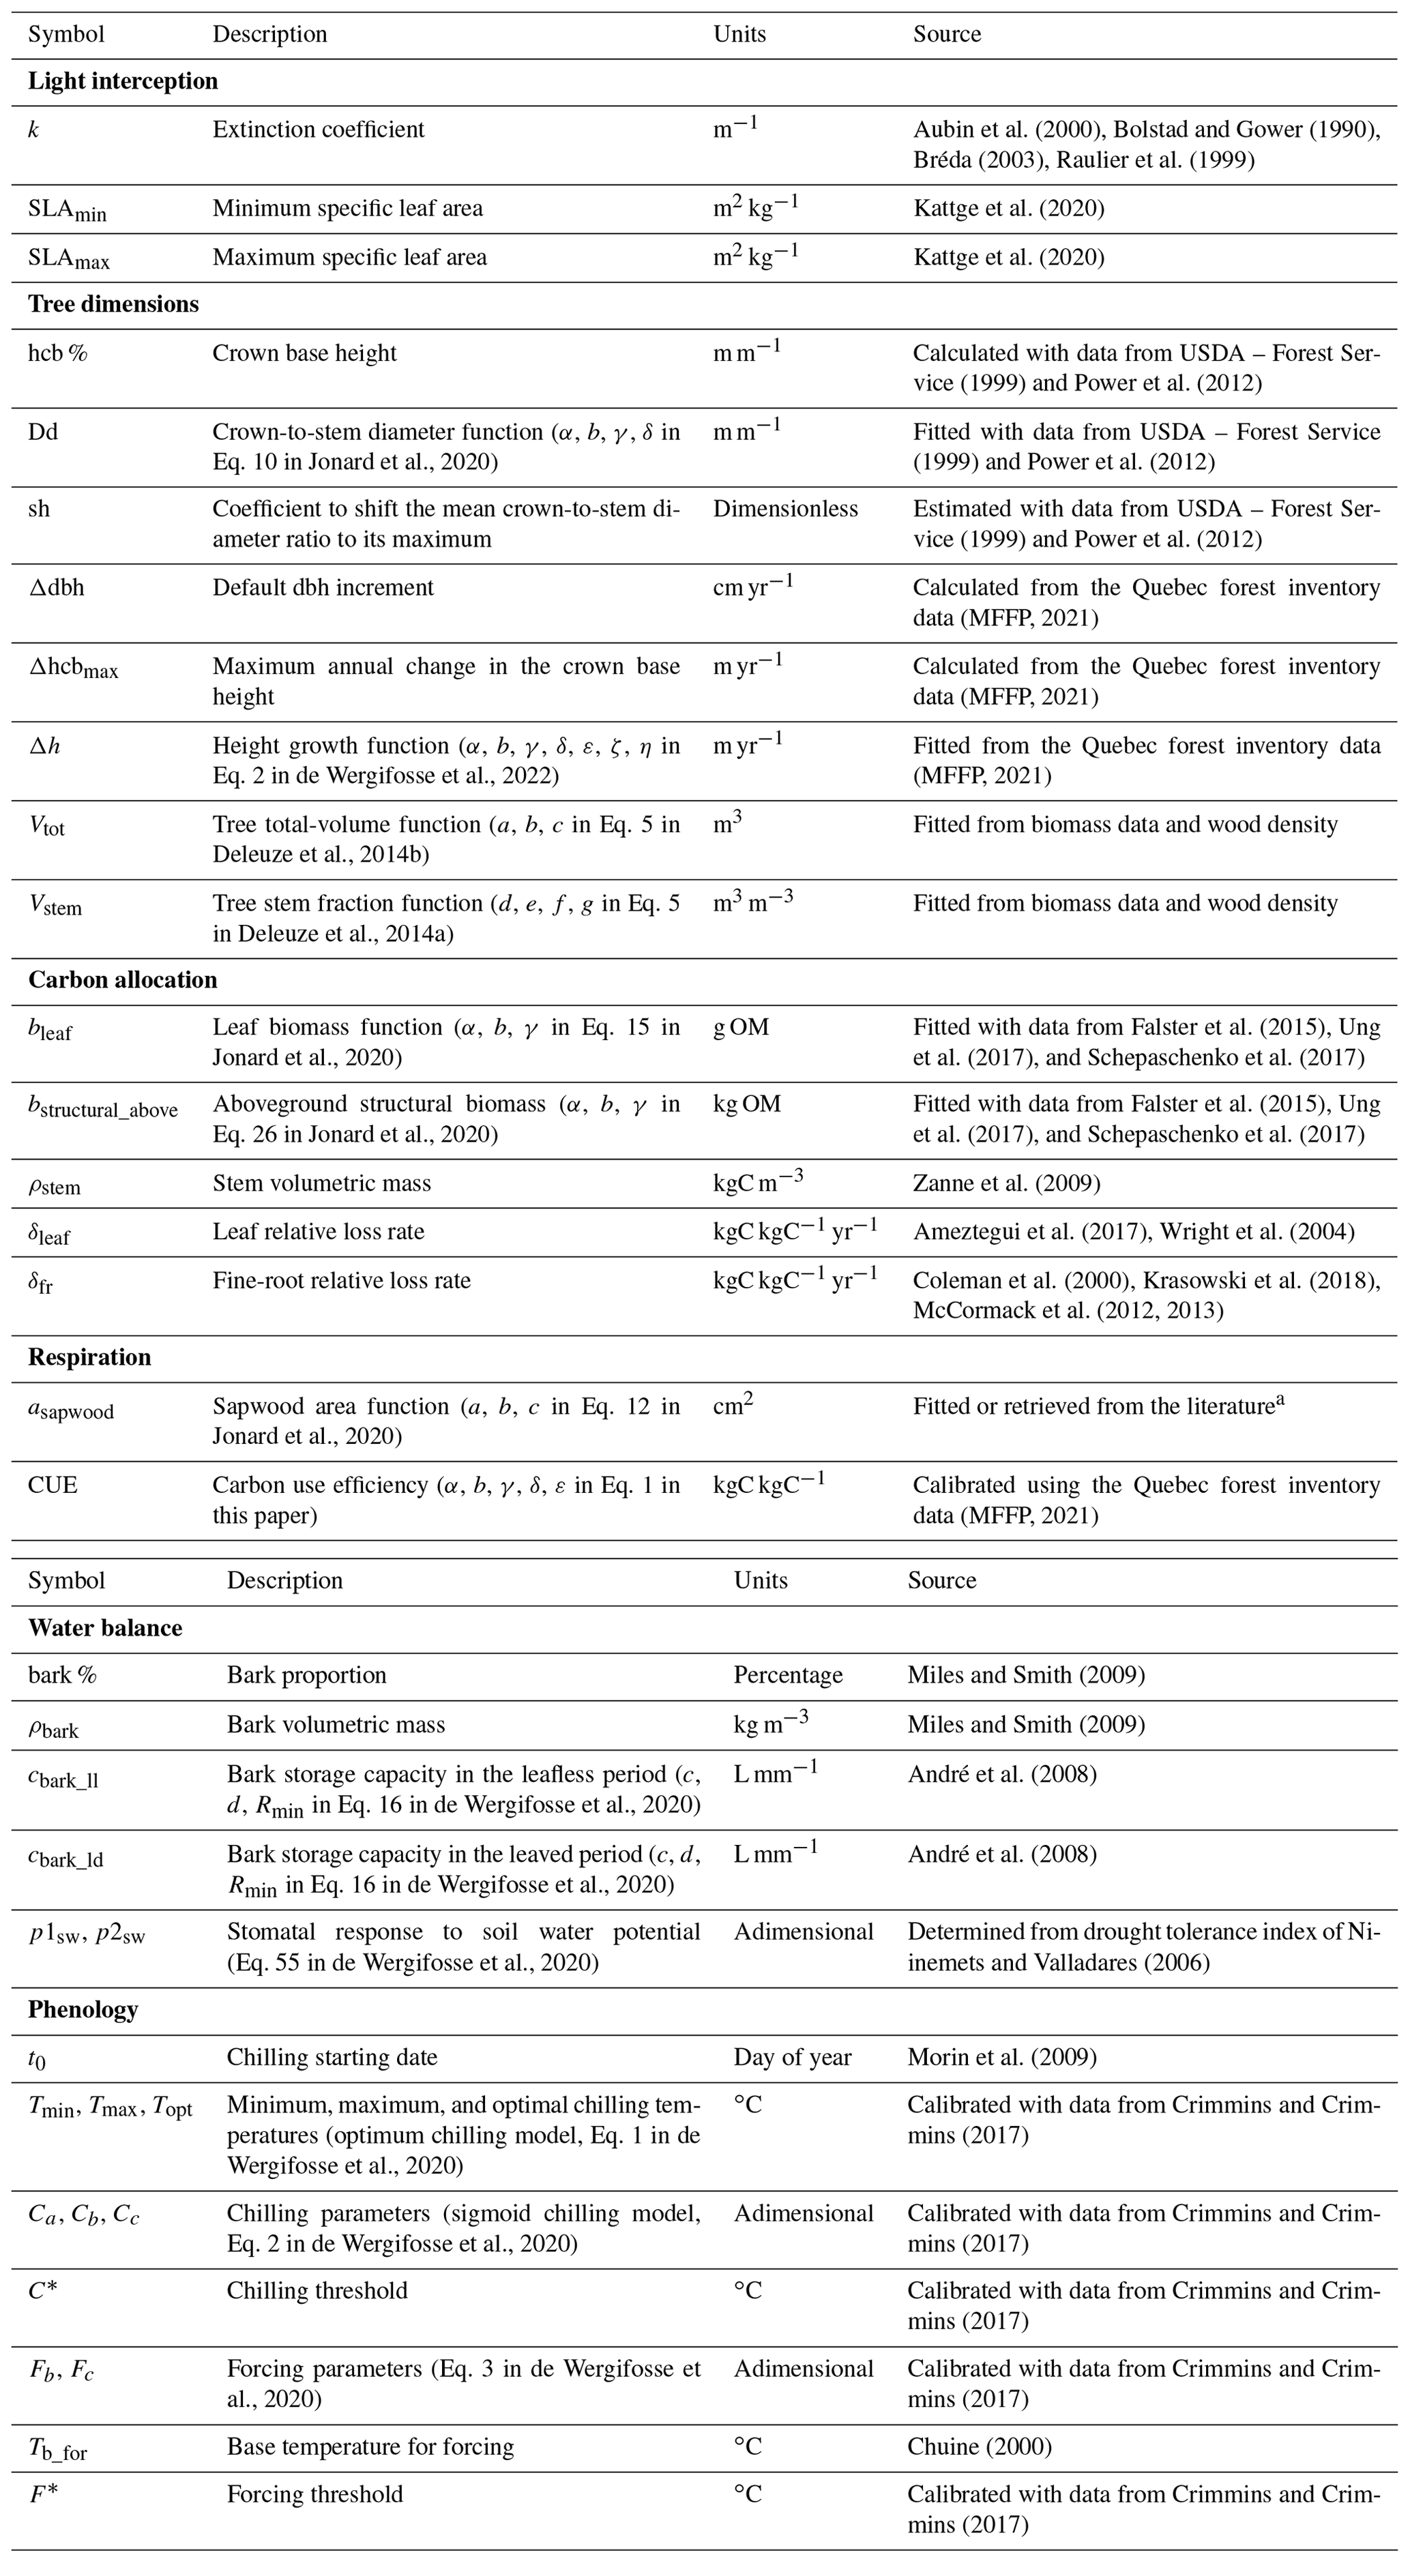
a Anderson-Teixeira et al. (2015), Bond-Lamberty et al. (2002), Bovard et al. (2005), Falster et al. (2015), Hadiwijaya et al. (2020), Hernandez-Hernandez (2014), Hernandez-Santana et al. (2015), Kenefic and Seymour (1999), McIntire (2018), Penner and Deblonde (1996), Quiñonez-Piñón and Valeo (2017), Thurner et al. (2019), and Wullschleger et al. (2001)
Simulations
Stand structure is known to influence light interception and tree growth and needs to be integrated when modelling structurally complex stands by considering the precise tree position and spatial configuration of crowns (Forrester, 2014; Pretzsch, 2022). To investigate the importance of the spatially explicit representation to the prediction accuracy of tree growth increments, we carried out 10 simulations per plot, each simulation having a new spatial arrangement of trees. To do this, we ran the semi-random procedure used to locate the trees 10 times per plot, resulting in 10 stands that were different in terms of spatial arrangement but had the same species composition, tree density, and basal area.
Model performances
The evaluation of the model outputs was performed at the individual-tree level, focusing on the basal area increment (BAI, cm2 yr−1) and height increment (m yr−1) following a two-step procedure: (i) comparison of the mean predicted increment (basal area or height) from the 10 simulations to those observed from the forest inventories and (ii) comparison, for each tree, of the best prediction within the 10 simulations with the observed value. This evaluation was done using the hundred plots dedicated to evaluation (plot IDs from 101 to 200; Table S1) to perform an independent evaluation, using 3511 trees with BAI measurements and 508 trees with height measurements.
The evaluation of BAI was carried out for 18 species individually, and the other five (Acer saccharinum, Fraxinus americana, Prunus serotina, Tilia americana, and Ulmus americana) were evaluated together as “other broadleaved” (but calibrated independently; see Sect. 2.3). Regarding tree height increment, sample size for each species was not sufficient to perform a species-specific evaluation. Therefore, we evaluated height increment by grouping all trees as either broadleaved (n=247) or coniferous trees (n=259).
We assessed the accuracy of the model using several metrics. The relative bias identifies underestimated (negative bias) or overestimated (positive bias) overall model predictions and is calculated as follows:
where and are the means of the predictions and observations, respectively. A paired t test was performed to test bias significance. The root-mean-square error (RMSE) quantifies the quadratic mean of the differences between predictions and observations and is computed as follows:
where Obsi are the observed values, Predi are the predicted values, and n is the number of observations.
The strength of the relationship between observations and predictions was investigated with the Pearson's correlation coefficient (r) and with a Deming regression (mcr package; Manuilova et al., 2021), which considered errors for both observations and predictions. All the above-mentioned procedures were carried out with the R software version 4.1.0. (R Core Team, 2021).
2.5.2 Long-term evaluation: growth and mortality processes starting from regeneration
To evaluate the ability of HETEROFOR to predict growth and mortality processes in the long term, we conducted 120-year simulations starting with a cohort of 1-year-old seedlings. We focused this evaluation on stands dominated by the two major species of Quebec's temperate forests, sugar maple (Acer saccharum) and red maple (Acer rubrum).
The inventory files used to initialize the simulations contained only a regeneration cohort of 20 000 1-year-old seedlings of 20 cm in height per hectare, with no overstorey trees. For each stand type (red maple or sugar maple), we compared four different compositions of regeneration: (i) 100 % maple (either red or sugar maple); (ii) 75 % maple (either red or sugar maple) and 25 % species A; (iii) 75 % maple (either red or sugar maple) and 25 % species B; and (iv) 50 % maple (either red or sugar maple), 25 % species A, and 25 % species B. Species A and B associated with red maple were yellow birch (Betula alleghaniensis) and black cherry (Prunus serotina), and those associated with sugar maple were American beech (Fagus grandifolia) and white ash (Fraxinus americana). Average values for southern Quebec were used for soil and meteorological inputs required by the model.
We used data from the PSPs to compare predicted total stand basal area (m2 ha−1) and mean stand height to observed field data. The selected PSPs were located in the temperate forest area (latitude < 47∘), had a regular structure, had not been disturbed, and were composed of at least 50 % red or sugar maple in terms of basal area. The PSPs considered in this sampling may include some PSPs used for the calibration or the short-term evaluation. Tree height was only measured on a subsample of trees in the PSPs, where selected trees were chosen to represent three size classes of the dominant species (largest diameters, around quadratic mean diameters, and small diameters). This implies that the heights measured in our sampling plots are almost exclusively those of maple trees. To be consistent with these characteristics of the PSP dataset, we therefore considered the mean height of maple trees instead of the dominant height in this long-term evaluation. For sugar maple, we also compared the simulations to a dataset from a study by Nolet et al. (2010) about the productivity of even-aged sugar maple stands established following a clear cut or fire. We used self-thinning relationships to evaluate the ability of HETEROFOR to reproduce the mortality process. Also known as maximum size density, this relationship describes at maximum stand density the natural process in which tree density per area decreases over time as the average tree size increases (Reineke, 1933). The self-thinning lines from our simulations were compared to those of Andrews et al. (2018) and those of Lhotka and Loewenstein (2008), which were obtained from data in eastern North America, and to the dataset of Nolet et al. (2010).
3.1 Short-term evaluation
3.1.1 Tree basal area increment
We found that HETEROFOR was able to predict the basal area increment of the various species (Fig. 2), but prediction accuracy strongly varied between species. The Pearson's correlation coefficient was highly significant (p<0.001) for almost all species, ranging from 0.328 for Q. rubra to 0.759 for P. glauca, except in the case of B. populifolia (r=0.23; p<0.05). The bias was less than 25 % for 15 of the 19 species, and the RMSE was 5.25 cm2 yr−1 on average. BAI was weakly predicted for the trees with the largest BAI of a few species (A. saccharum, B. papyrifera, and P. resinosa), but the slope of the regression of observations vs. predictions was close to 1 on average (averaged slope = 1.12), and the 1:1 line was within the confidence interval of the regression for 10 of the 19 species (Fig. 2).
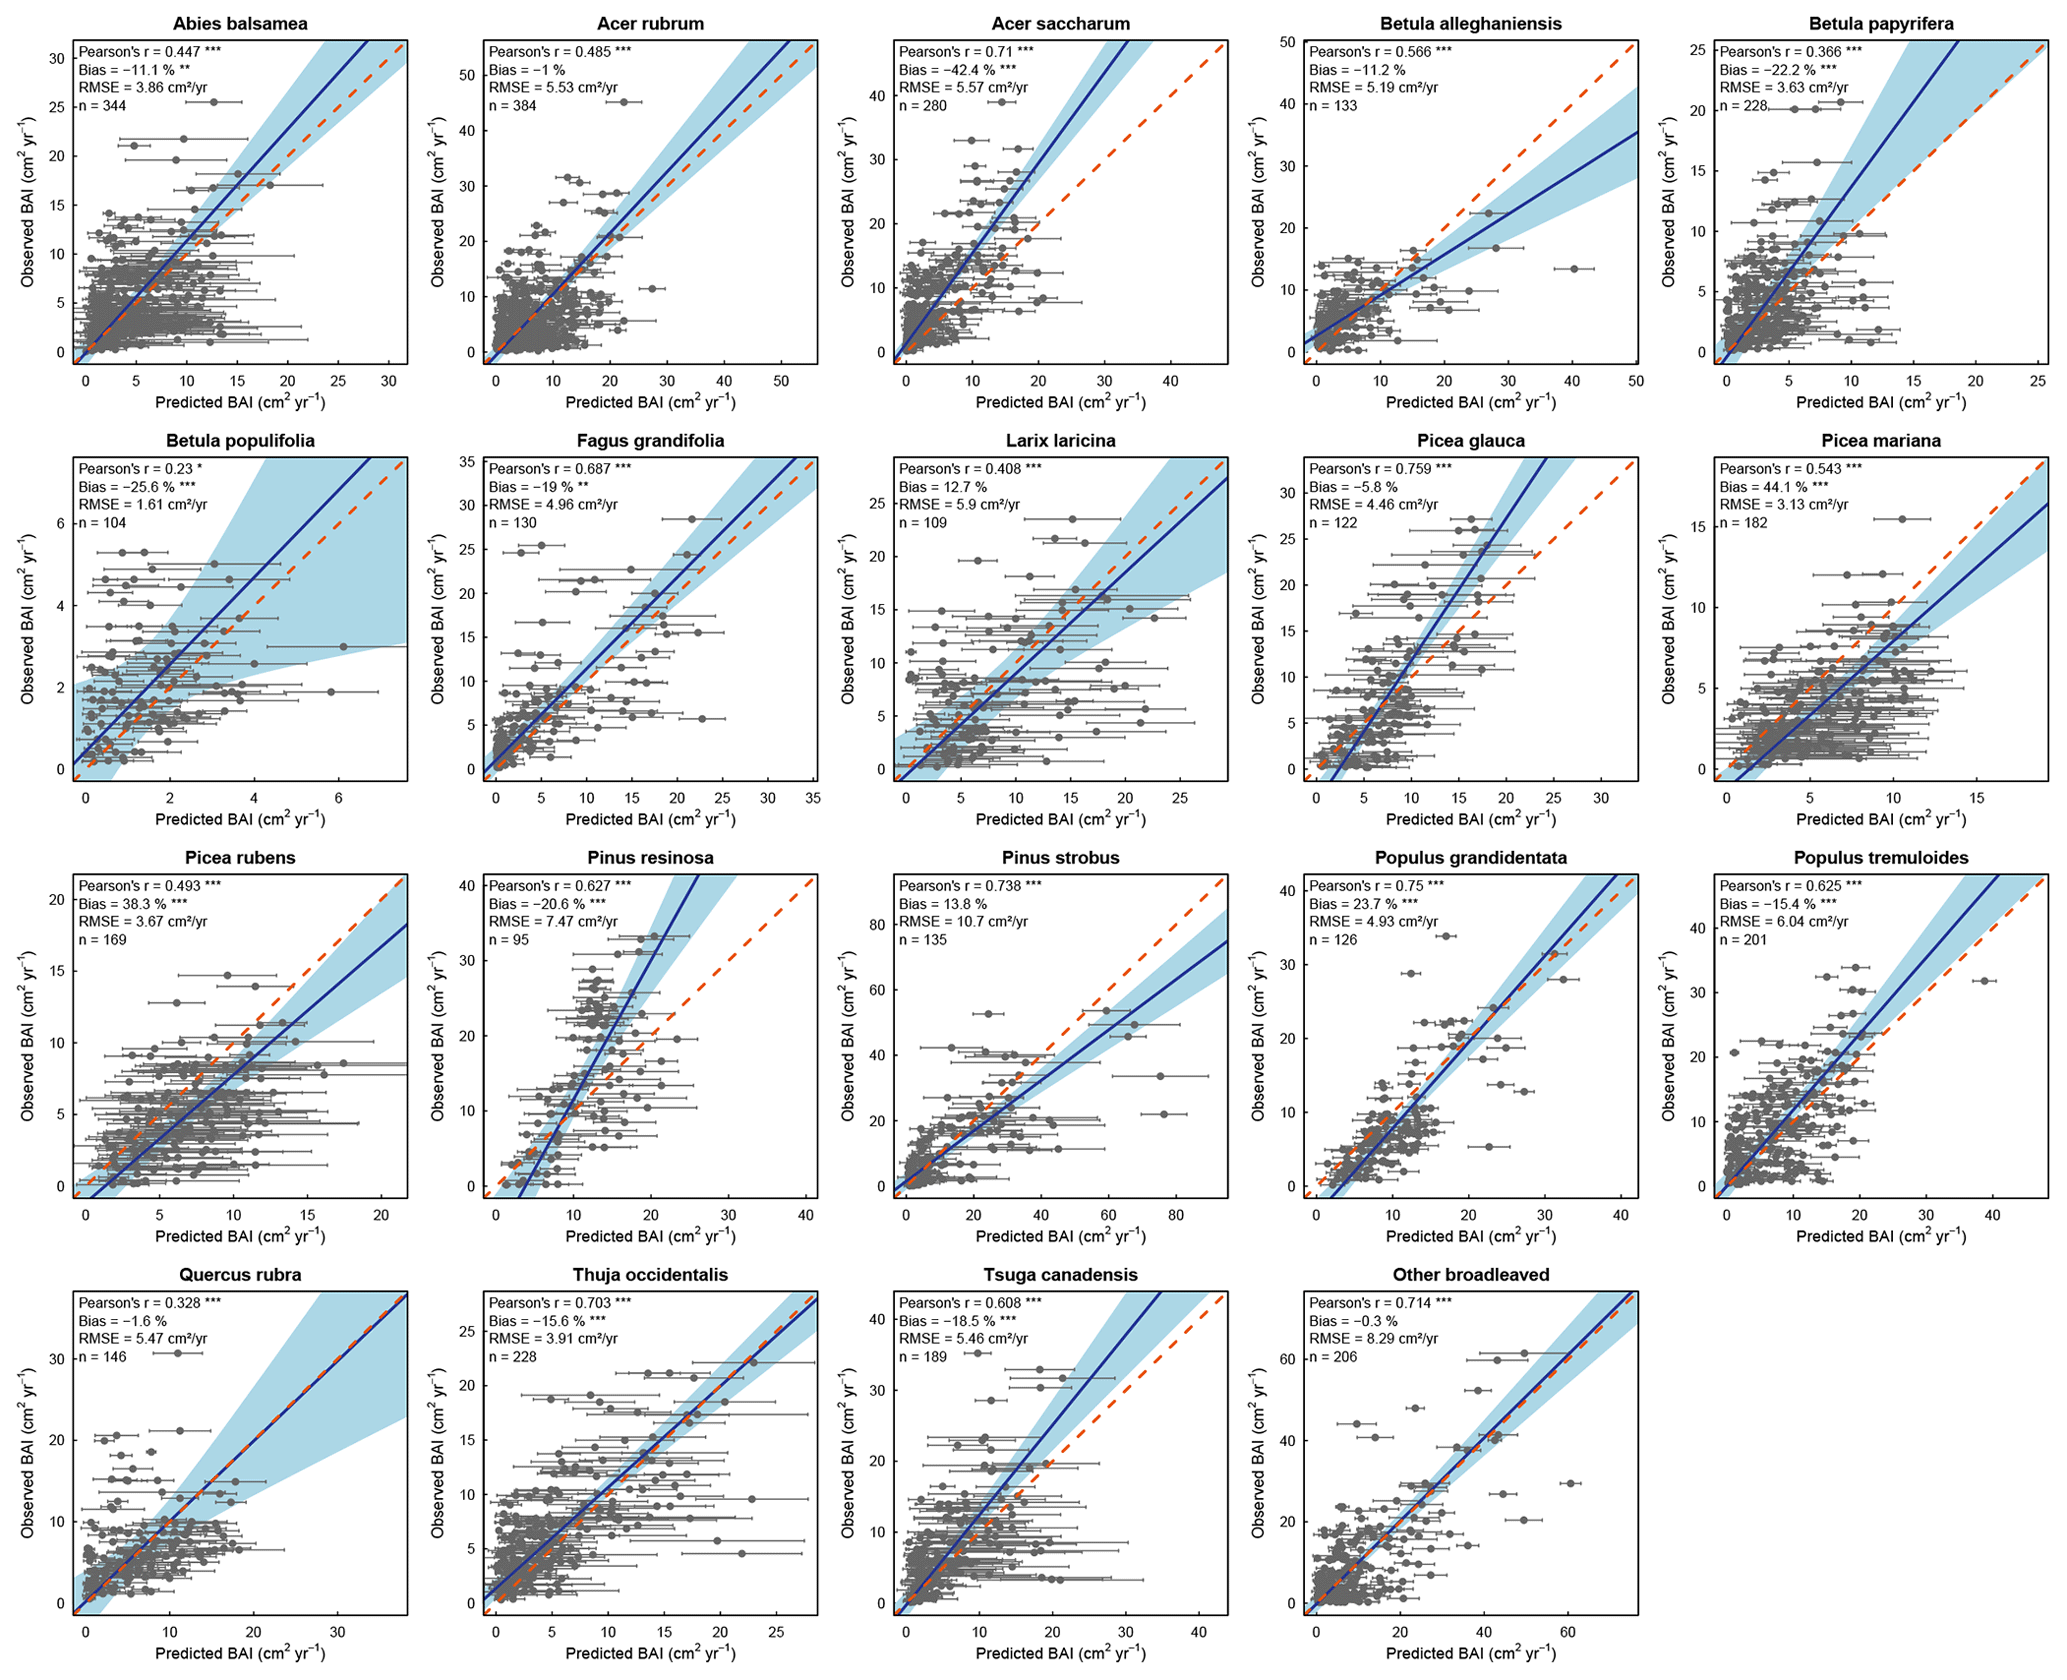
Figure 2Observed versus mean predicted basal area increment for each species (or group of species) using the evaluation dataset. Each dot represents the mean of the 10 predictions for a single tree, with the error bars indicating the standard deviation. The blue line represents the Deming regression between observed and predicted values, the light-blue area is the confidence interval at 95 %, and the dashed red line corresponds to the 1:1 line. Model performance is indicated using Pearson's r (p value: .001; .05), the relative bias (paired t test – p value: .001; .01), and the RMSE.
Compared to the mean predictions of BAI performed with the calibration dataset, we observed that modelling performance with the evaluation dataset was slightly less reliable (Fig. 3). With the evaluation dataset, correlations were lower for all species except A. saccharum, and predictions were more biased for all species except Q. rubra (Fig. 3). On average, the correlation coefficient between observed and predicted BAI values decreased from 0.678 with calibration plots to 0.568 with evaluation plots, and the bias (in absolute values) increased from 8.8 % to 18 %. Only a limited number of species showed a strong difference between the two datasets for some of the performance metrics considered (i.e., B. populifolia and Q. rubra with regards to the Pearson's coefficient; P. resinosa with regards to the RMSE; and B. populifolia, P. mariana, and P. rubens with regards to the bias). Regressions between observations and predictions were very similar between both datasets (average slope of 1.15 and 1.12, average intercept of −0.94 and −0.55), and predictions with the evaluation dataset showed an even better relationship for five species, with a slope closer to 1 and an intercept closer to 0 (A. balsamea, L. laricina, P. mariana, P. rubens, and P. strobus; Fig. 3).
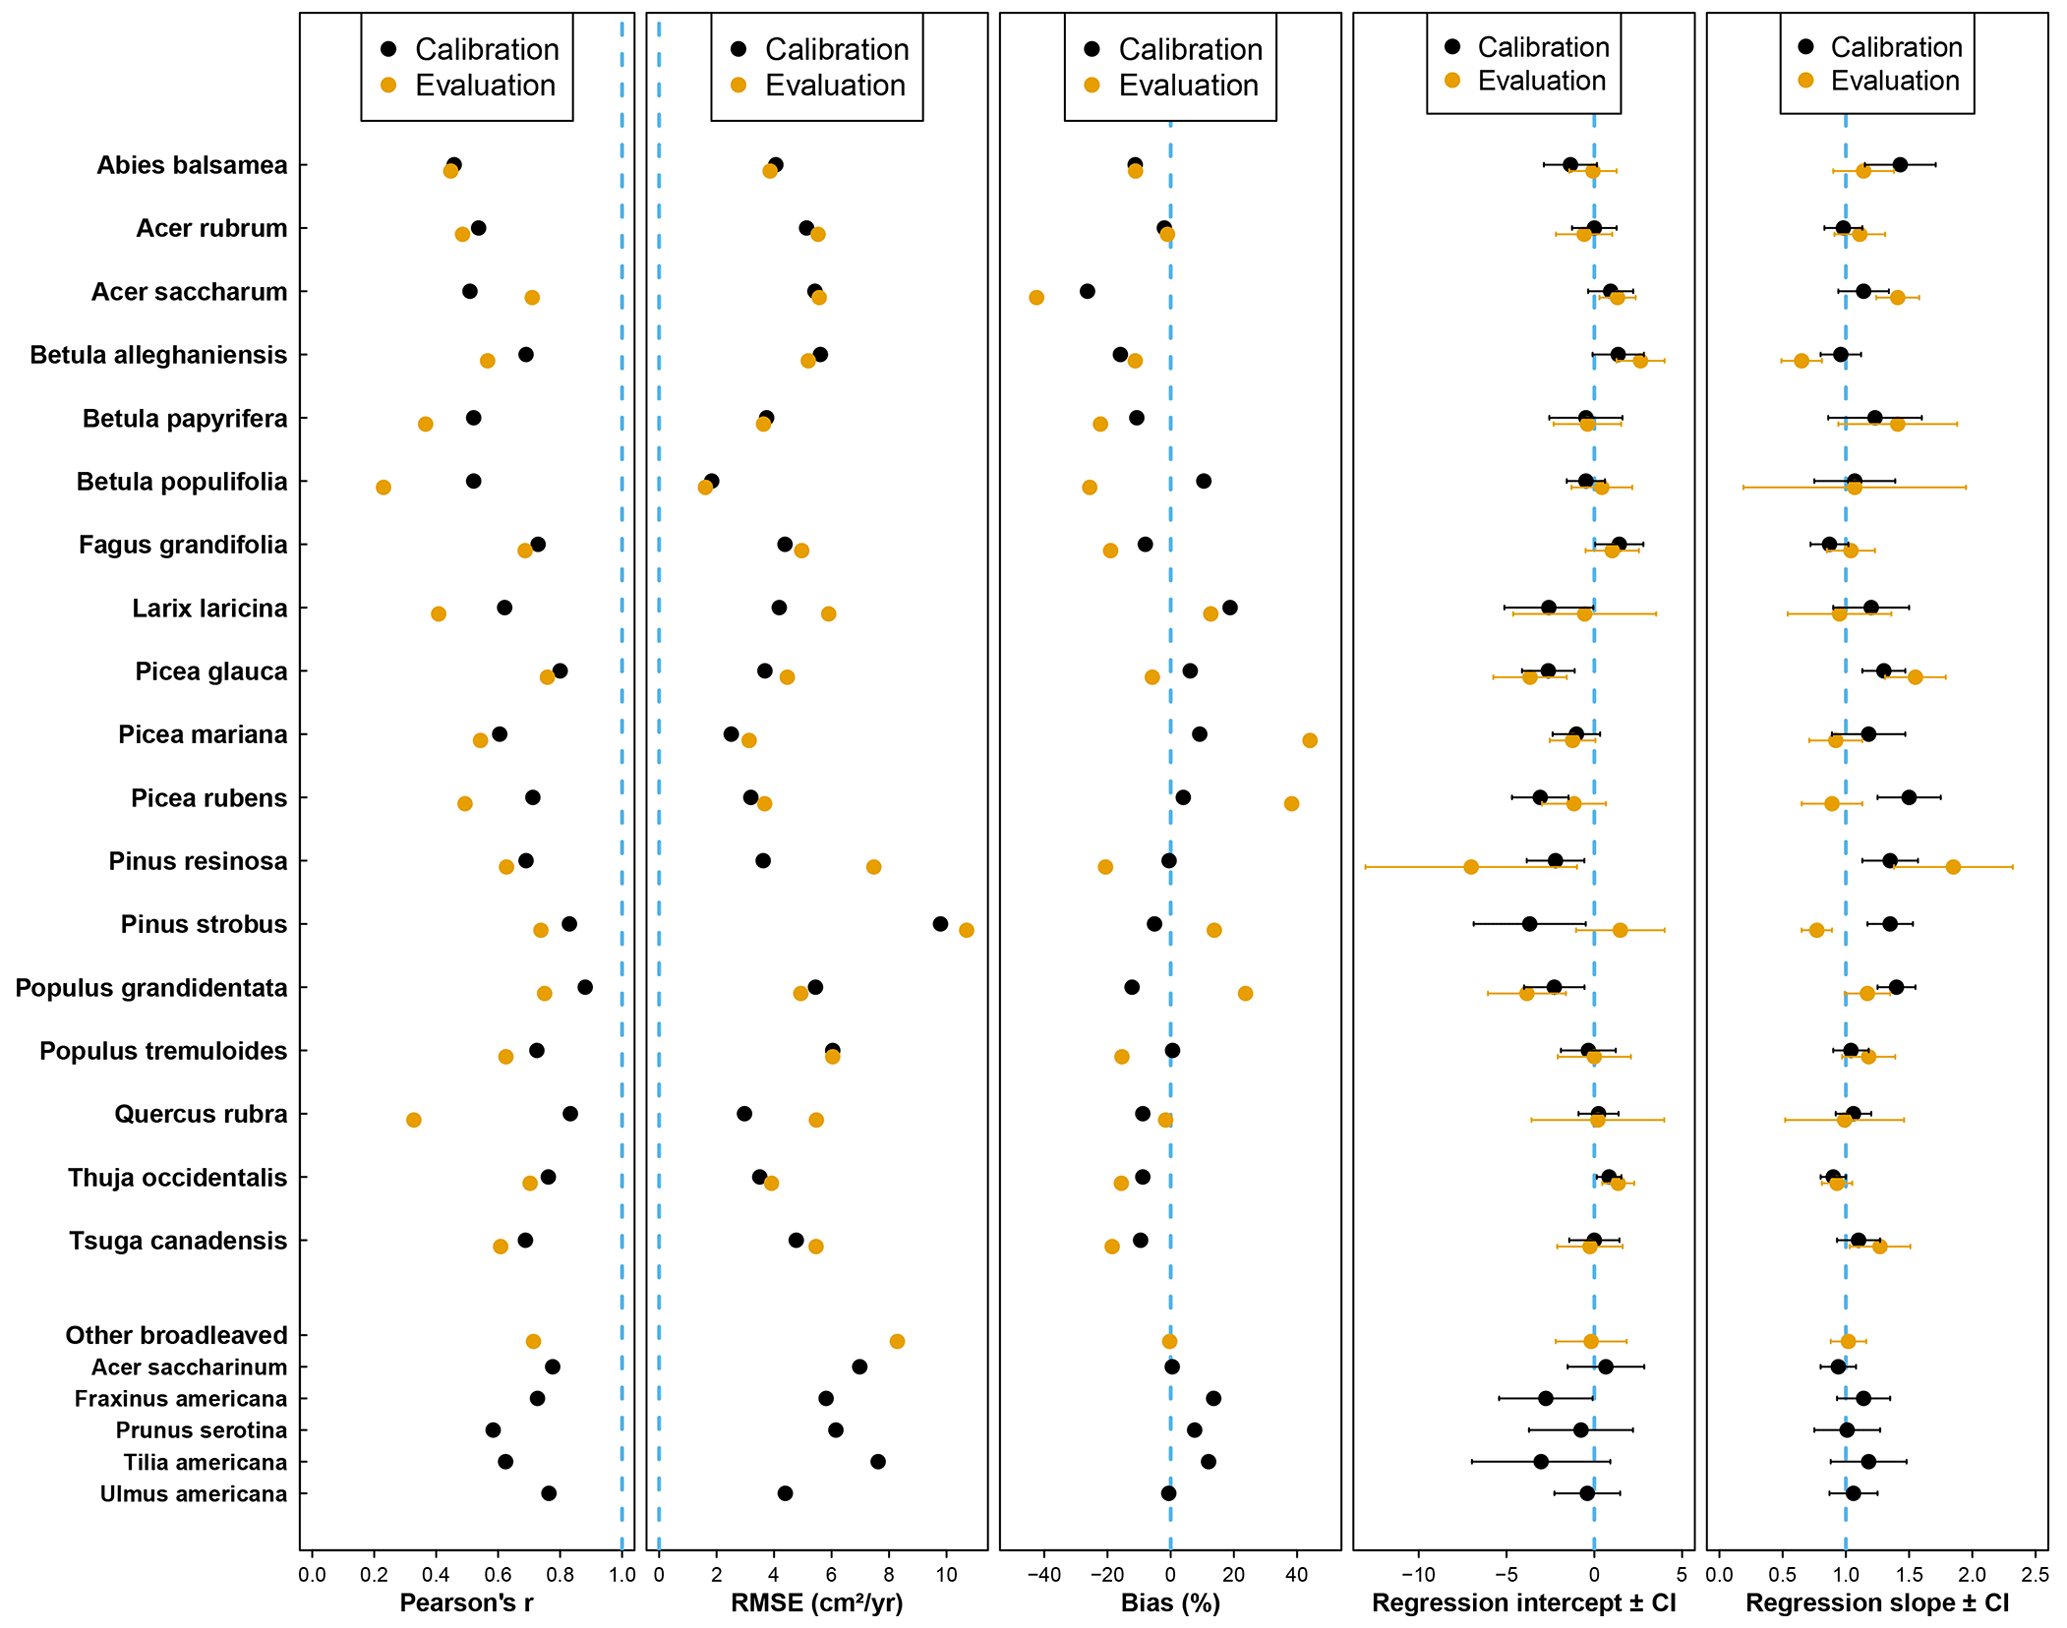
Figure 3Statistical parameters (from left to right: Pearson's correlation coefficient, root-mean-square error, relative bias, intercept, and slope of the Deming regression) assessing the performance of the model for each species using the calibration (black dots) or the evaluation (yellow dots) dataset. The dotted blue line indicates the best agreement between observations and predictions for each parameter.
With the random selection of tree positions (10 replicates), we observed a large variation in predictions for a single tree, as illustrated by the error bars in Fig. 2. The relative difference between the minimum and maximum predicted basal area for a single tree ranged from 0 to 138 %, with 94 % of the trees having a difference of less than 10 %. This relative difference was related to initial tree size, with the largest differences being associated with smaller trees (Fig. S3). Predictions were greatly improved for all species when focusing solely on the best prediction for each tree (Fig. 4). Pearson's coefficient was always highly significant and ranged from 0.696 (Q. rubra) to 0.958 (P. glauca). Differences between observations and predictions were less biased for all species, with a maximum bias of 24.1 % (A. saccharum) and a bias < 15 % for 16 of the 19 species (Fig. 4). The confidence intervals of the regressions were smaller than those obtained from the mean predictions: the slopes were, on average, similar, although the slopes furthest from 1 were much improved (e.g., P. glauca and P. resinosa).
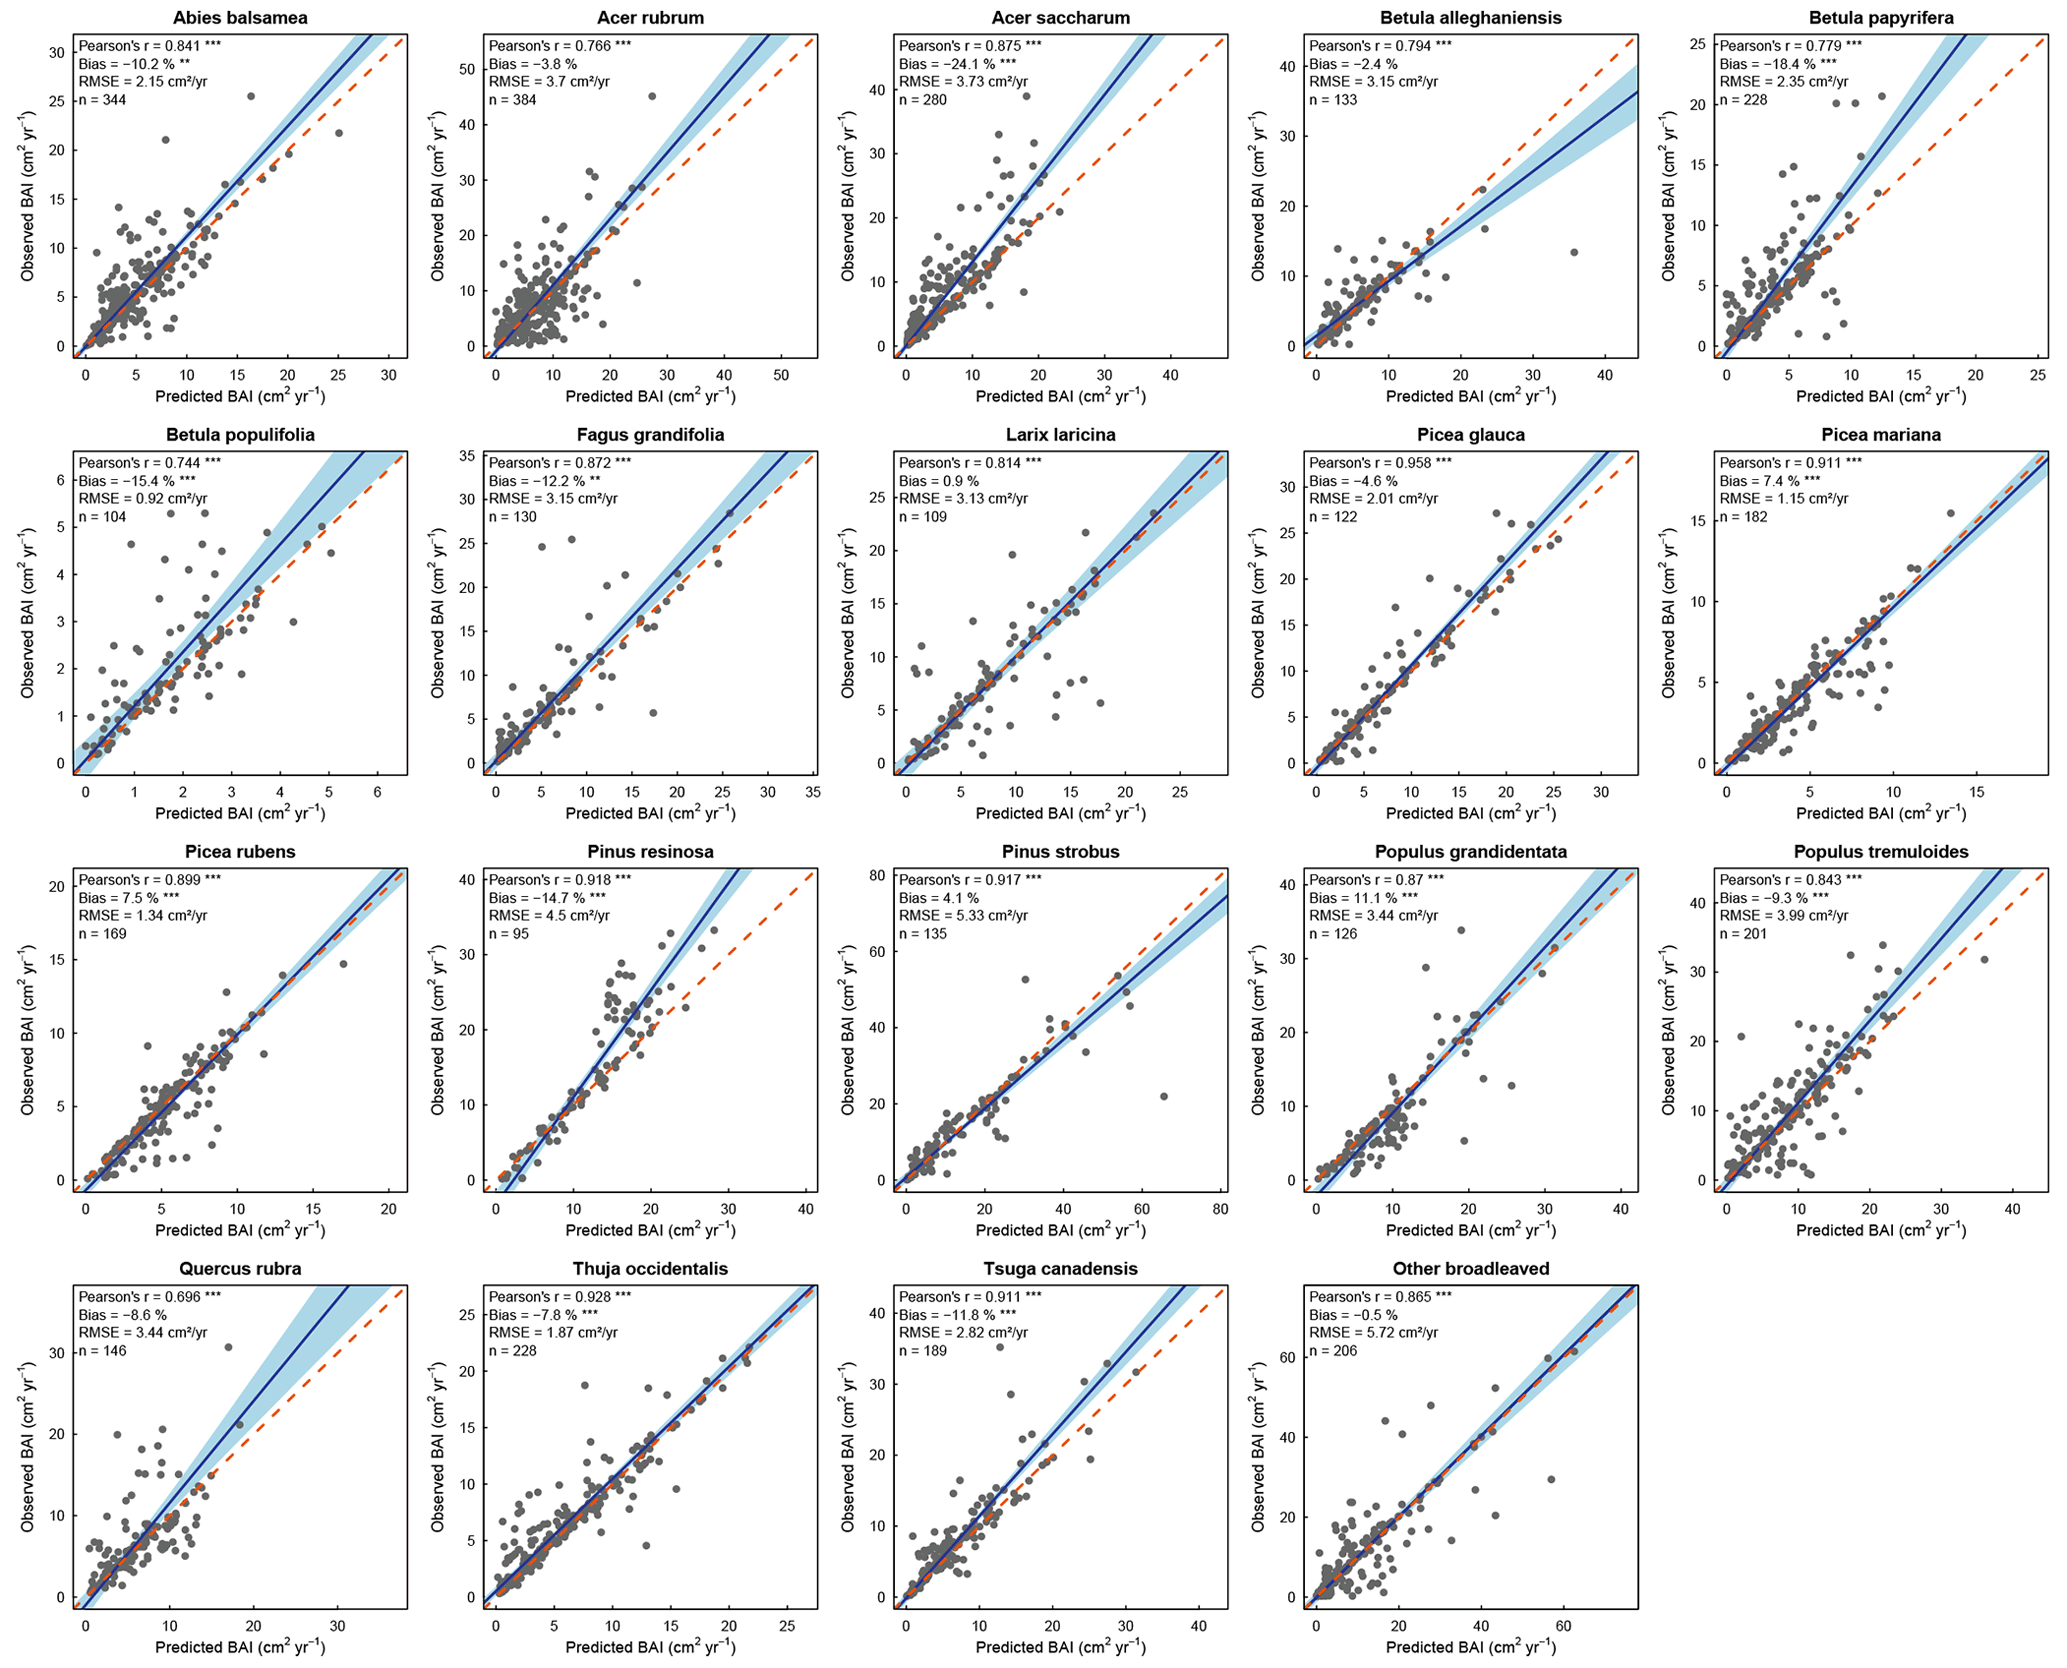
Figure 4Observed versus best predicted basal area increment for each species (or group of species) using the evaluation dataset. Each dot represents the best prediction within the 10 simulations for a single tree. The blue line represents the Deming regression between observed and predicted values, the light-blue area is the confidence interval at 95 %, and the dashed red line corresponds to the 1:1 line. Model performance is indicated using Pearson's r (p value: .001), the relative bias (paired t test – p value: .001; .01), and the RMSE.
3.1.2 Height growth increment
Predictions of height increment for the two groups of species were less accurate than the predictions of basal area increment (Fig. S4). Considering the mean predictions, the correlation coefficient was 0.304 (p<0.001) for broadleaved species and 0.123 (p<0.05) for coniferous species, and predictions were significantly underestimated in both cases (biases of −33.3 % and −31.7 %; Fig. S4). We observed a large variation in predictions for a single tree, with a relative difference between the minimum and maximum predicted height ranging from 0.3 % to 5.7 %. As for BAI, this difference increased as initial tree size decreased (Fig. S3). Focusing on the correlation coefficient, modelling performances of height increment were strongly improved when only considering the best prediction for each tree: Pearson's r increased from 0.304 to 0.729 for broadleaved trees and from 0.123 to 0.718 for coniferous species (Fig. S4). However, the slopes were similar, and the biases, which decreased to around −20 %, remained significant.
3.1.3 Stand basal area increment
The model showed a good ability to reproduce observed mean BAI at the stand level, both for monospecific and multi-species stands, as shown by the regression tests, with a slope very close to 1, and the 1:1 line was within the confidence interval (Fig. 5). Moreover, the correlations were strong between observations and predictions (r=0.547 and 0.624), and predictions were slightly underestimated in both cases.

Figure 5Observed versus predicted basal area increment at the stand level for the 100 stands of the evaluation dataset, grouped by forest type: monospecific stands (left panel) vs. multi-species stands (right panel). The blue line represents the Deming regression between observed and predicted values, the light-blue area is the confidence interval at 95 %, and the dashed red line corresponds to the 1:1 line. Model performance is indicated using Pearson's r (p value: .001; p value: .01), the relative bias (paired t test – p value: .05) and the RMSE.
3.2 Long-term evaluation
3.2.1 Basal area
The simulated total stand basal area over 120 years is shown in Fig. 6a–b in comparison with forest inventories. For the six species used in the simulations, recruitment height was reached between 26 and 36 years. Our results showed that values of basal area for all the different regeneration combinations matched the PSP data at 30 years, suggesting that the regeneration module simulated seedling growth efficiently. Growth from regeneration module outputs to 120 years were similar for the four simulations of red-maple-dominated stands. Simulations reached a value of basal area around 35 m2 ha−1 at 120 years and agreed with the PSP data over the whole period (Fig. 6a). For sugar maple stands, simulations starting with 100 % maple or 75 % maple + 25 % American beech showed similar basal area and were closely related to the PSP data but were at the lower range of the values from Nolet et al. (2010). The other two simulations showing a higher growth after 50 years had stands containing 25 % white ash. Both of these simulations were more consistent with the basal area recorded by Nolet et al. (2010) between 70 and 90 years and reached 36–39 m2 ha−1 at 120 years, which is still within the upper range of the PSP data.
3.2.2 Height
The simulated evolution of mean height demonstrated a good fit with the PSP data for both maples (Fig. 6c–d). The height was slightly lower than the average PSP value around 30 years for both species and increased in agreement with the main range of the PSP values over time until the height reached 22.1 and 24.6 m for sugar maple and red maple stands, respectively. Regarding the red maple simulations, mean height was similar among the three stand compositions until 60 years. By the end of the 120 years, height growth was highest in the pure stands (25.6 m) followed by the stimulations with 75 % maple (24.8 m) and 50 % maple (23.8 m; Fig. 6c). The four simulations were quite similar over time for the sugar maple stands, with final mean heights between 21.2 and 22.6 m (Fig. 6d). Mean height values from Nolet et al. (2010) range from 13.1 to 24.8 m (mean 18.6 m) but did not show any consistent trend. As a result, the curves simulated for sugar maple stands did not match their values over the whole time period but were consistent with the overall range (Fig. 6d).
3.2.3 Mortality
A visual assessment of the predicted self-thinning lines vs. the self-thinning lines of Andrews et al. (2018) and of Lhotka and Loewenstein (2008) confirmed the adequacy of the model in reproducing mortality over time for both species, regardless of the initial regeneration composition (Fig. 6e–f). Compared to the theoretical lines, the predicted density–size relationships at 120 years were excellent for both species, while tree density started to decrease a bit earlier with our simulations than what was reported by Andrews et al. (2018), especially for sugar maple (Fig. 6f). Our predictions also match the values of Nolet et al. (2010) very well, as the predicted curve passes through the scatterplot (Fig. 6f).
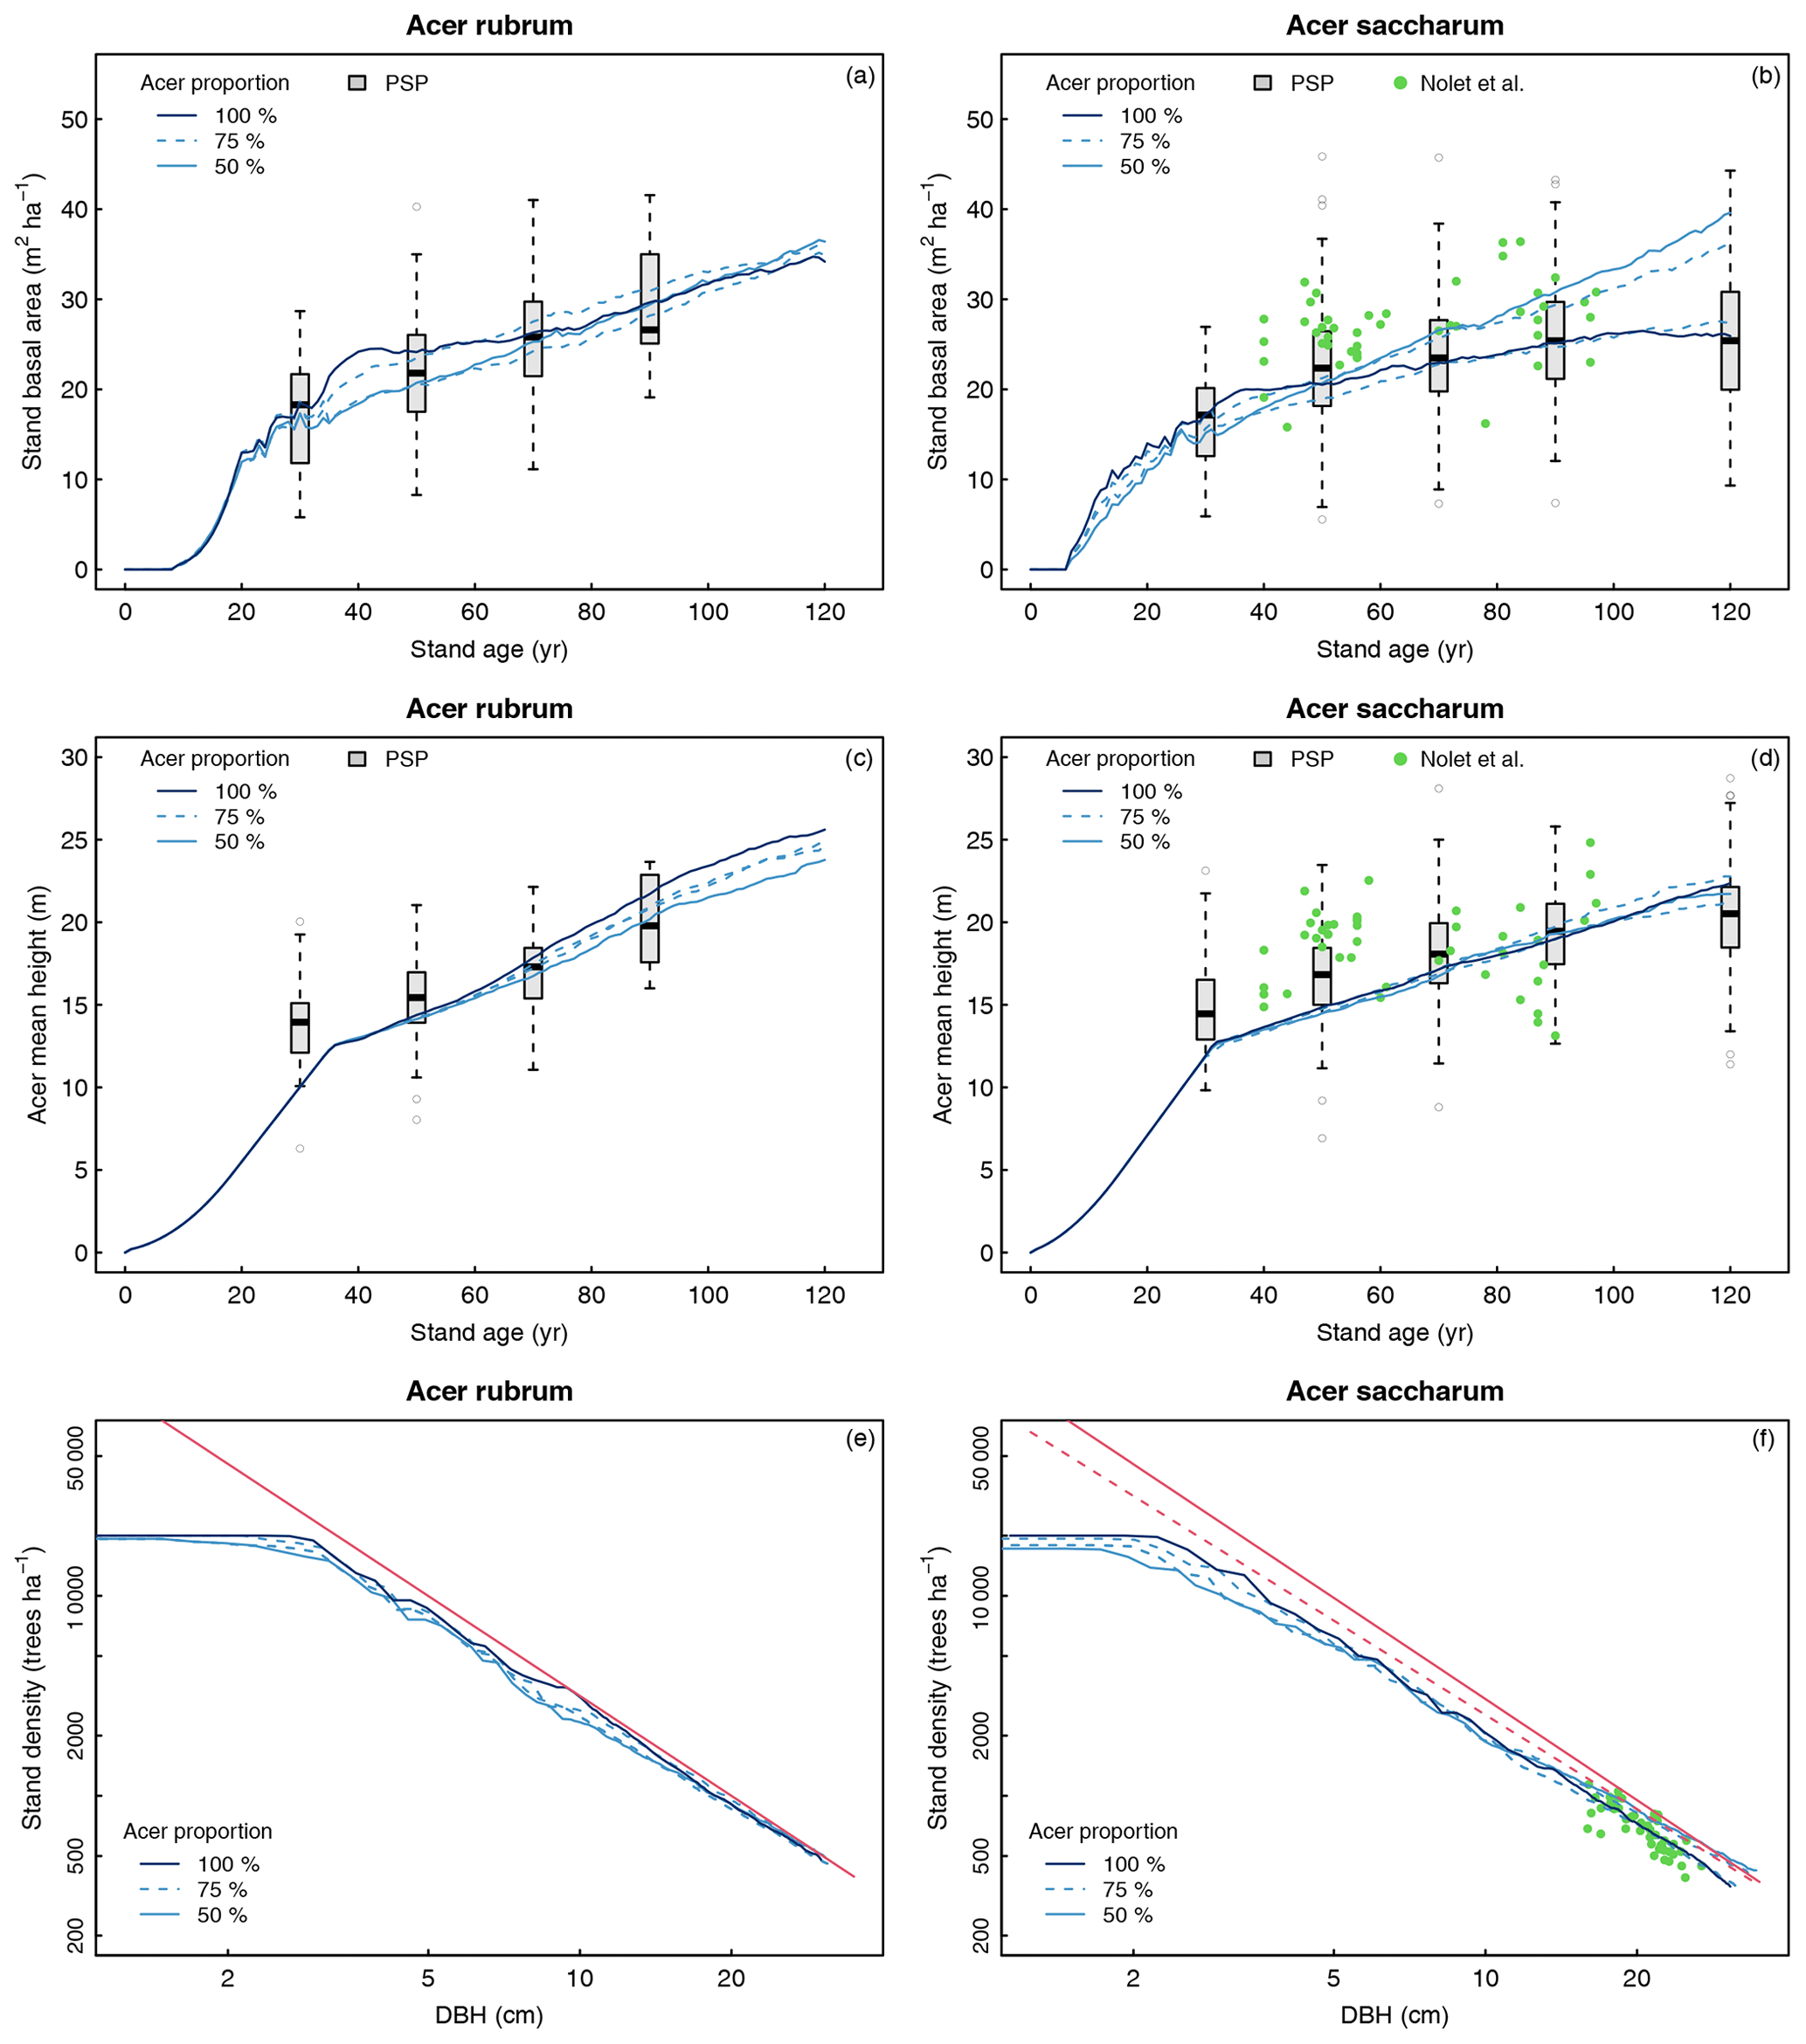
Figure 6Evaluation of stand basal area (a, b), mean height of maple species (c, d), and stand density (e, f) over 120 years for stands dominated by Acer rubrum (a, c, e) or Acer saccharum (b, d, f). The red line represents the self-thinning curves of Andrews et al. (2018), and the dashed red line represents the self-thinning line of Lhotka and Loewenstein (2008). PSP refers to permanent sample plot of the forest inventory of Quebec. Stand ages in the PSP dataset are grouped into 20-year classes (e.g., age class 30 refers to stands between 21 and 40 years), except for age class 120 (stands > 100 years). The green dots in panels (b), (d), and (f) are from Nolet et al. (2010). Acer proportion corresponds to the initial proportion of maple in the regeneration used in the four different simulations: (i) 100 % maple, (ii) 75 % maple – 25 % species A, (iii) 75 % maple – 25 % species B, (iv) 50 % maple – 25 % species A – 25 % species B.
4.1 Ability of HETEROFOR to reproduce individual-tree growth
Short-term model evaluation (i.e., 5–16 years) was conducted using forest inventory data from monospecific and multi-species stands, focusing on basal area increment for each species and height increment at the broadleaf and conifer levels. Our results regarding basal area increment are consistent with previous studies that evaluated HETEROFOR in Europe for a more limited number of tree species (European beech and sessile and pedunculate oaks). Compared to Jonard et al. (2020), we found a lower RMSE for all species except Pinus strobus, as well as a lower correlation between observations and predictions (Pearson's r between 0.23 and 0.76 here versus 0.63 and 0.83 in Jonard et al., 2020). In another study dealing with the same two species from 36 sites in Europe, de Wergifosse et al. (2022) evaluated individual-tree growth based on girth increment and found a correlation of 0.58 for sessile and pedunculate oaks and of 0.75 for European beech and found a bias lower than 14 %. Biases are higher in our study, ranging from −42 % to 38 % depending on the species, with half of the species showing a bias lower than −14 % or of 14 %. Although our predictions are overall less accurate with respect to most indicators, some species are still predicted more accurately than oak and as well as beech (e.g., Pinus strobus, Thuja occidentalis, and Picea glauca). It should also be noted that these two European studies used many more characteristics (i.e., tree positions, crown dimensions, soil profile, etc.) to calibrate the CUE and to evaluate the model, which definitely increased the accuracy of their model predictions. Comparing our results with other process-based models is difficult, as there are only a few spatially explicit PBMs accounting for light-, water-, and phenology-related processes (Pretzsch et al., 2015) and where the evaluation of the model performance, when available, is not performed on individual-tree growth but mostly on stand level predictions. However, our results are in the same range of biases as the process-based model BALANCE (18 % to 47 %; Grote and Pretzsch, 2002), as well as those of two hybrid models evaluated at the individual-tree level, SILVA (−47 % to 70 %; Schmid et al., 2006; Pretzsch, 2002) and ForCEEPS (−7.3 % to 89.9 %; Morin et al., 2021). Looking at the stand level, predictions of basal area increment were in good agreement with observed values in both monospecific and multi-species stands. BAI was slightly underestimated in multi-species stands compared to in the monospecific stands, but the prediction errors were smaller, and the correlation between predictions and observations was higher. The values of the different evaluation metrics at the stand level were consistent with those of other process-based modelling studies (Schwalm and Ek, 2004; Forrester et al., 2021; Gonzalez-Benecke et al., 2014, 2016).
Height growth was predicted less accurately than BAI and was underestimated for both conifers and broadleaved species (negative bias of 31.7 % and 33.3 %), particularly for trees with the highest height increment. This lower accuracy in height predictions is common in forest growth models (Schwalm and Ek, 2004; de Wergifosse et al., 2022; Korol et al., 1995; Strimbu et al., 2017), notably due to the higher potential measurement errors of height than of diameter. These inaccuracies in height measurements, which can be estimated within 1 m (Jurjević et al., 2020), are present during both initial and final inventories and have a greater impact on predictions in areas like Quebec, where tree height growth is limited. Nevertheless, although tree height predictions were not perfectly accurate, the height growth over the long term in both sugar and red maple stands was consistent with observed data. Compared to the study of de Wergifosse et al. (2022) using HETEROFOR, our results are aligned regarding Pearson's r and the RMSE; however, although our results also reported an underestimation of height growth predictions, the bias was higher in our study (31 %–33 % versus 10 %–20 %).
Considering the large range of stand compositions and environmental conditions covered by the plots for most of the 23 species, our evaluation of HETEROFOR demonstrated its ability to accurately predict individual-tree growth for these species. The comparison between the prediction strength for the calibration and evaluation datasets illustrates that our model is robust and can be confidently used to capture the variations in individual-tree growth in the temperate forests of Quebec. Very few species showed a clear difference in more than one indicator between the two datasets (Pinus resinosa, Betula populifolia, and Quercus rubra). A recalibration of the CUE by combining the two datasets could bring about more accuracy in the tree growth prediction for these species, especially for red pine, which is only present in a few sites (three for the calibration and five for the evaluation) with a lack of large trees (> 25 cm in DBH) in the calibration sites that could explain the poor prediction related to the trees with the largest BAIs.
With more detailed inventory data, two key functions of HETEROFOR involved in carbon allocation processes could also be refined, allowing for a better consideration of competition and tree dimension when predicting tree growth. The first key function is the CUE, for which a simplified version based on DBH, LCI, and air temperature was used in our study (see Eq. 1 in Sect. 2.4). However, other predictors based on tree height, crown base height, and crown diameter could be added to this equation to account for the effect of tree size and tree shape (slenderness and/or crown extension) on the CUE (see Eq. 1 in de Wergifosse et al., 2022). The second key function is the height growth function, which predicts the annual height growth based on DBH, height, the potential height growth (i.e., potential height increment if all the growth potential is allocated to the primary growth in height and nothing is left for the secondary growth in DBH), the light competition index (LCI), and an error term (standard error of the residuals). As tree positions and most tree height measurements were not available in our dataset, the LCI was not considered when fitting this equation in our study (b=0 in Δh; see Table S2). However, including the LCI in this function would allow us to consider the fact that understorey trees experiencing high levels of competition for light would generally invest more carbon for height growth than diameter growth (Trouvé et al., 2015).
4.2 Influence of tree position on model predictions
Changing tree positions within the stand had a strong effect on tree growth predictions, particularly for smaller trees. This seems logical because the more dominant a tree is, the less it will be affected by the neighbouring trees and therefore by the change in its position. When focusing on the best prediction for each tree, we showed that the model predictions were greatly improved for all species. This illustrates that considering tree position in process-based tree-level models is necessary to predict individual-tree growth most accurately in complex stands with both vertically and horizontally heterogeneous structures (Pretzsch et al., 2015). However, this does not mean that our predictions would match the best predictions if we had the initial tree positions, but we can assume that the predictions would probably be between the mean and the best predictions.
The variation in the position of a tree and the modification of its local environment influence HETEROFOR through three variables: (i) the amount of absorbed photosynthetically active radiation, determined from a ray-tracing approach and consequently impacted by the crowns of neighbouring trees; (ii) the specific leaf area, which varies according to the local position of the crown within the canopy; and (iii) a defoliation factor – i.e., the leaf biomass of a tree is reduced by defoliation when the available carbon is not sufficient to ensure normal leaf development (Jonard et al., 2020). However, a random term in the height growth function (hereafter referred to as height effect) can also have an influence on tree growth between each simulation and may be confounded by the position effect. To disentangle the importance of these two factors (position effect vs. height effect) in the simulations, we performed additional simulations on 10 sites, considering five different positions per site and five repetitions per position within each site. The five repetitions of each position within each site allowed us to account for only the height effect. We then determined the variation explained by the position and height effects using a linear mixed model that uses the girth increment as the response variable and the site and the tree as random factors. The variation explained by the position accounted for 95.05 % compared to the 4.95 % explained by the height effect, which confirmed that the position was the most important factor for explaining the variations in the predictions among the simulations.
4.3 Simulation of maple stand dynamics
The results of the long-term simulations for even-aged stands dominated by red maple or sugar maple showed that HETEROFOR was able to accurately predict the growth and mortality processes from the seedling stage to the mature stand. Indeed, the evolution of basal area and height growth over time corresponds to the data from the Quebec forest inventory, and the self-thinning curves correspond to those previously reported in the same area (Lhotka and Loewenstein, 2008; Andrews et al., 2018).
The calibration and performance of the regeneration module were satisfactory for both maple stand types. The basal area at the time of recruitment (around 30 years old), i.e., when the saplings are individualized in the model, was very close to that observed in the PSPs. However, the seedling height growth was slightly underestimated for the two species, and the mortality was initiated somewhat early for the sugar maple, depending on the self-thinning curve considered. These discrepancies could be due to the type of data used to calibrate the seedling height growth function, which determined annual height growth and is also used to estimate seedling mortality within the cohorts. As the height increment in the seedling calibration dataset was not measured directly, it was deduced from the collar diameter using allometric relationships.
Our results are thus promising regarding the suitability of the model for simulating seedling growth and mortality processes and thereby for testing the introduction of new species during the regeneration phase, which is a crucial step of forest dynamics and presents the greatest potential for adapting to future environmental conditions and unknown disturbance events (König et al., 2022; Kitajima and Fenner, 2000). Further evaluation of seedling growth using long-term regeneration data for maples and other species, as well as considering a variety of light conditions in the understorey, will be of great importance.
Regarding the dynamic of basal area once the trees are recruited, our predictions for the pure maple stands of the two species were very close to the middle range of the PSPs. This may be somewhat surprising for sugar maple given the results presented in the short-term evaluation section, where the model tended to underestimate basal area increment at the individual-tree level. However, by looking further into the evaluation site by site, it is evident that the predictions for some sites are very good, while others are not, with biases between 1.5 % and 62 % and Pearson's r between 0.04 and 0.87. The purpose of these long-term simulations was to observe whether the model was able to plausibly reproduce the whole of the stand dynamics. We only did one simulation with an average soil and climate, which seem to correspond to the mean environmental conditions for the observations. In addition, our results regarding sugar maple growth are quite different from those of Nolet et al. (2010), who observed higher basal areas and mean height, particularly for younger stands. Sugar maples can establish themselves in a wide variety of sites more or less favourable to their growth (Nolet and Boureima, 2009), and several studies and yield tables in Quebec, Ontario, and the northeastern United States have shown basal area increments similar to ours (Carpentier, 1987; Eyre, 1980; Reed et al., 1994), while others are more in agreement with the values observed by Nolet et al. (2010; Nolet et al., 2008; Nyland et al., 2004). In the Nolet et al. (2010) dataset, older stands are characterized by poorer and thinner soils compared to younger ones, which may explain the same productivity of their sites regardless of age. Therefore, HETEROFOR appears to be more adequate for simulating sugar maple growth on sites with thin and/or poor soils, as well as on mixed stands, as shown by the short-term evaluation, but it may be less suitable when growing in full light in nutrient-rich soils. Finally, the results of the simulations with two or three species were consistent with the diameter growth increment of the different associated species. The white ash is the species with the highest diameter growth increment (0.45 cm yr−1) compared to the other five species that are within a similar range (0.26–0.34 cm yr−1; MFFP, 2021), clearly showing that the basal area of the stands containing white ash was significantly higher.
The purpose of this study was to calibrate and evaluate the performance of the spatially explicit process-based model HETEROFOR for southern Quebec using the plots of the Quebec forest inventory, representing a large range of environmental conditions and stand structures. Despite the lack of some information needed to initialize the model (tree position, tree height, and crown dimensions), our evaluation demonstrated the ability of HETEROFOR to predict both the individual-tree growth of 23 species of eastern North America over the short term and the stand dynamics of the two major species in southern Quebec over the long term. The continuation of this study will include a more detailed assessment of the regeneration module using long-term regeneration surveys, the calibration of the regeneration parameters for all 23 species, and a refinement of the CUE for a few species. However, HETEROFOR can now be considered an appropriate option to simulate forest growth in Quebec's temperate forests and to test innovative management strategies under future climate scenarios.
The source codes of Capsis and HETEROFOR are accessible to all of the members of the Capsis co-development community. Those who want to join this community are welcome, but they must contact François de Coligny (francois.decoligny@inrae.fr) and sign the Capsis charter (Dufour-Kowalski et al., 2012). This charter grants access to all the models to the modellers of the Capsis community. The modellers may distribute the Capsis platform with their own model but not with the models of others without their agreement. Capsis4 is a free software (LGPL licence) which includes the kernel, the generic pilots, the extensions, and the libraries. For HETEROFOR, we also chose an LGPL licence and decided to freely distribute it through an installer containing the Capsis4 kernel, and the latest version (or any previous one) of HETEROFOR is available upon request from Mathieu Jonard (mathieu.jonard@uclouvain.be). The end users can install Capsis from an installer containing only the HETEROFOR model, while the modellers who signed the Capsis charter can access the complete version of Capsis with all of the models. Depending on your status (end user vs. modeller or developer), the instructions to install Capsis are given on the Capsis website (http://capsis.cirad.fr/capsis/documentation, last access: 4 November 2022). The source code for the modules published in Geoscientific Model Development (Jonard et al., 2020; de Wergifosse et al., 2020) can be downloaded from https://doi.org/10.5281/zenodo.3591348 (Jonard et al., 2019).
The version of HETEROFOR used for this paper, a user guide of the model, and the data and scripts used for this study are available from https://doi.org/10.5281/zenodo.7225303 (Guignabert et al., 2022).
The supplement related to this article is available online at: https://doi.org/10.5194/gmd-16-1661-2023-supplement.
AG carried out the calibration, performed the simulations, and analyzed the model outputs with support from MJ and FA. AG, MJ, and QP interpreted the results. FA and MJ developed the model code. CM and PN provided data. QP, CM, and MJ acquired financial support for the project. AG led the writing of the paper with contributions from all the authors.
The contact author has declared that none of the authors has any competing interests.
Publisher's note: Copernicus Publications remains neutral with regard to jurisdictional claims in published maps and institutional affiliations.
We are grateful to Bert Van Schaeybroeck for the meteorological data acquisition and processing, to Louis de Wergifosse for sharing the R script about random tree location, and to Lana Ruddick for revising the English of this paper.
This study was supported by the Fonds de Recherche du Québec (FRQ) and the Fonds de la Recherche Scientifique (FNRS) through the project “Forests in an uncertain context: comparing contrasting strategies of risk management at the local and regional scales” (contract PINT-BILAT-P – R.P00419). Arthur Guignabert is funded by a postdoctoral grant from the FNRS in the framework of this project. Mathieu Jonard was supported through the 5-year forest research program “Accord-cadre de recherche et de vulgarisation forestières” funded by the Public Service of Wallonia/Regional Forest Service (SPW-DNF).
This paper was edited by Christian Folberth and reviewed by Mats Mahnken and one anonymous referee.
Acton, D. F., Ryder, J. M., French, H., Slaymaker, O., and Brookes, I. A.: Physiographic Regions, in: The Canadian Encyclopedia, https://www.thecanadianencyclopedia.ca/en/article/physiographic-regions (last access: 1 March 2021), 2015.
Ameztegui, A., Paquette, A., Shipley, B., Heym, M., Messier, C., and Gravel, D.: Shade tolerance and the functional trait: demography relationship in temperate and boreal forests, Funct. Ecol., 31, 821–830, https://doi.org/10.1111/1365-2435.12804, 2017.
Anderson-Teixeira, K. J., McGarvey, J. C., Muller-Landau, H. C., Park, J. Y., Gonzalez-Akre, E. B., Herrmann, V., Bennett, A. C., So, C. V., Bourg, N. A., Thompson, J. R., McMahon, S. M., and McShea, W. J.: Size-related scaling of tree form and function in a mixed-age forest, Funct. Ecol., 29, 1587–1602, https://doi.org/10.1111/1365-2435.12470, 2015.
André, F., Jonard, M., and Ponette, Q.: Influence of species and rain event characteristics on stemflow volume in a temperate mixed oak-beech stand, Hydrol. Process., 22, 4455–4466, https://doi.org/10.1002/hyp.7048, 2008.
André, F., de Wergifosse, L., de Coligny, F., Beudez, N., Ligot, G., Gauthray-Guyénet, V., Courbaud, B., and Jonard, M.: Radiative transfer modeling in structurally complex stands: towards a better understanding of parametrization, Ann. For. Sci., 78, 92, https://doi.org/10.1007/s13595-021-01106-8, 2021.
Andrews, C., Weiskittel, A., D'Amato, A. W., and Simons-Legaard, E.: Variation in the maximum stand density index and its linkage to climate in mixed species forests of the North American Acadian Region, Forest Ecol. Manag., 417, 90–102, https://doi.org/10.1016/j.foreco.2018.02.038, 2018.
Aquilué, N., Messier, C., Martins, K. T., Dumais-Lalonde, V., and Mina, M.: A simple-to-use management approach to boost adaptive capacity of forests to global uncertainty, Forest Ecol. Manag., 481, https://doi.org/10.1016/j.foreco.2020.118692, 2021.
Aubin, I., Beaudet, M., and Messier, C.: Light extinction coefficients specific to the understory vegetation of the southern boreal forest, Quebec, Can. J. Forest Res., 30, 168–177, https://doi.org/10.1139/x99-185, 2000.
Aubin, I., Munson, A. D., Cardou, F., Burton, P. J., Isabel, N., Pedlar, J. H., Paquette, A., Taylor, A. R., Delagrange, S., Kebli, H., Messier, C., Shipley, B., Valladares, F., Kattge, J., Boisvert-Marsh, L., and McKenney, D.: Traits to stay, traits to move: a review of functional traits to assess sensitivity and adaptive capacity of temperate and boreal trees to climate change, Environ. Rev., 24, 164–186, https://doi.org/10.1139/er-2015-0072, 2016.
Bell, B., Hersbach, H., Simmons, A., Berrisford, P., Dahlgren, P., Horányi, A., Muñoz-Sabater, J., Nicolas, J., Radu, R., Schepers, D., Soci, C., Villaume, S., Bidlot, J., Haimberger, L., Woollen, J., Buontempo, C., and Thépaut, J.: The ERA5 global reanalysis: Preliminary extension to 1950, Q. J. Roy. Meteor. Soc., 147, 4186–4227, https://doi.org/10.1002/qj.4174, 2021.
Bohn, F. J., Frank, K., and Huth, A.: Of climate and its resulting tree growth: Simulating the productivity of temperate forests, Ecol. Modell., 278, 9–17, https://doi.org/10.1016/J.ECOLMODEL.2014.01.021, 2014.
Bokalo, M., Stadt, K., Comeau, P., and Titus, S.: The Validation of the Mixedwood Growth Model (MGM) for Use in Forest Management Decision Making, Forests, 4, 1–27, https://doi.org/10.3390/f4010001, 2013.
Bolstad, P. V. and Gower, S. T.: Estimation of leaf area index in fourteen southern Wisconsin forest stands using a portable radiometer, Tree Physiol., 7, 115–124, https://doi.org/10.1093/treephys/7.1-2-3-4.115, 1990.
Bond-Lamberty, B., Wang, C., and Gower, S. T.: Aboveground and belowground biomass and sapwood area allometric equations for six boreal tree species of northern Manitoba, Can. J. Forest Res., 32, 1441–1450, https://doi.org/10.1139/x02-063, 2002.
Bovard, B. D., Curtis, P. S., Vogel, C. S., Su, H.-B., and Schmid, H. P.: Environmental controls on sap flow in a northern hardwood forest, Tree Physiol., 25, 31–38, https://doi.org/10.1093/treephys/25.1.31, 2005.
Bréda, N. J. J.: Ground-based measurements of leaf area index: a review of methods, instruments and current controversies, J. Exp. Bot., 54, 2403–2417, https://doi.org/10.1093/jxb/erg263, 2003.
Brockerhoff, E. G., Barbaro, L., Castagneyrol, B., Forrester, D. I., Gardiner, B., González-Olabarria, J. R., Lyver, P. O. B., Meurisse, N., Oxbrough, A., Taki, H., Thompson, I. D., van der Plas, F., and Jactel, H.: Forest biodiversity, ecosystem functioning and the provision of ecosystem services, Biodivers. Conserv., 26, 3005–3035, https://doi.org/10.1007/s10531-017-1453-2, 2017.
Carpentier, J.-P.: Modélisation de la croissance et du rendement des peuplements d'érable à sucre, Gouvernement du Québec, Ministère de l'Energie et des Ressources, Direction de la recherche et du développement, Mémoire de recherche forestière no. 91, 1987.
Chuine, I.: A Unified Model for Budburst of Trees, J. Theor. Biol., 207, 337–347, https://doi.org/10.1006/jtbi.2000.2178, 2000.
Chuine, I., de Cortazar-Atauri, I. G., Kramer, K., and Hänninen, H.: Plant Development Models, in: Phenology: An Integrative Environmental Science, Springer Netherlands, Dordrecht, 275–293, https://doi.org/10.1007/978-94-007-6925-0_15, 2013.
Coates, K. D., Canham, C. D., Beaudet, M., Sachs, D. L., and Messier, C.: Use of a spatially explicit individual-tree model (SORTIE/BC) to explore the implications of patchiness in structurally complex forests, Forest Ecol. Manag., 186, 297–310, https://doi.org/10.1016/S0378-1127(03)00301-3, 2003.
Coleman, M. D., Dickson, R. E., and Isebrands, J. G.: Contrasting fine-root production, survival and soil CO2 efflux in pine and poplar plantations, Plant Soil, 225, 129–139, https://doi.org/10.1023/A:1026564228951, 2000.
Courbaud, B., de Coligny, F., and Cordonnier, T.: Simulating radiation distribution in a heterogeneous Norway spruce forest on a slope, Agr. Forest Meteorol., 116, 1–18, https://doi.org/10.1016/S0168-1923(02)00254-X, 2003.
Crimmins, T. M. and Crimmins, M. A.: Plant Phenology Site Phenometrics + Accumulated Growing Degree Day Calculations for the continental United States (2009–2016): U.S. Geological Survey data release, GS ScienceBase [data set], https://doi.org/10.5066/F7XG9Q0X, 2017.
Deleuze, C., Morneau, F., Renaud, J. P., Vivien, Y., Rivoire, M., Santenoise, P., Longuetaud, F., Mothe, F., and Hervé, J. C.: Estimation harmonisée du volume de tige à différentes découpes, Rendez-vous Tech. ONF, 44, 33–42, 2014a.
Deleuze, C., Morneau, F., Renaud, J. P., Vivien, Y., Rivoire, M., Santenoise, P., Longuetaud, F., Mothe, F., Hervé, J. C., and Vallet, P.: Estimer le volume total d'un arbre, quelles que soient l'essence, la taille, la sylviculture, la station, Rendez-vous Tech. ONF, 44, 22–32, 2014b.
del Río, M., Löf, M., Bravo-Oviedo, A., and Jactel, H.: Understanding the complexity of mixed forest functioning and management: Advances and perspectives, Forest Ecol. Manag., 489, 119138, https://doi.org/10.1016/j.foreco.2021.119138, 2021.
de Wergifosse, L., André, F., Beudez, N., de Coligny, F., Goosse, H., Jonard, F., Ponette, Q., Titeux, H., Vincke, C., and Jonard, M.: HETEROFOR 1.0: a spatially explicit model for exploring the response of structurally complex forests to uncertain future conditions – Part 2: Phenology and water cycle, Geosci. Model Dev., 13, 1459–1498, https://doi.org/10.5194/gmd-13-1459-2020, 2020.
de Wergifosse, L., André, F., Goosse, H., Boczon, A., Cecchini, S., Ciceu, A., Collalti, A., Cools, N., D'Andrea, E., De Vos, B., Hamdi, R., Ingerslev, M., Knudsen, M. A., Kowalska, A., Leca, S., Matteucci, G., Nord-Larsen, T., Sanders, T. G., Schmitz, A., Termonia, P., Vanguelova, E., Van Schaeybroeck, B., Verstraeten, A., Vesterdal, L., and Jonard, M.: Simulating tree growth response to climate change in structurally diverse oak and beech forests, Sci. Total Environ., 806, 150422, https://doi.org/10.1016/j.scitotenv.2021.150422, 2022.
Dufour-Kowalski, S., Courbaud, B., Dreyfus, P., Meredieu, C., and de Coligny, F.: Capsis: an open software framework and community for forest growth modelling, Ann. Forest Sci., 69, 221–233, https://doi.org/10.1007/s13595-011-0140-9, 2012.
Dufrêne, E., Davi, H., François, C., Maire, G. le, Dantec, V. Le, and Granier, A.: Modelling carbon and water cycles in a beech forest, Ecol. Modell., 185, 407–436, https://doi.org/10.1016/j.ecolmodel.2005.01.004, 2005.
Eyre, F. H.: Forest cover types of United States and Canada, edited by: Society of American Foresters, Washington, DC, 148 pp., ISBN 9780686306979, 1980.
Falster, D. S., Duursma, R. A., Ishihara, M. I., Barneche, D. R., FitzJohn, R. G., Vårhammar, A., Aiba, M., Ando, M., Anten, N., Aspinwall, M. J., Baltzer, J. L., Baraloto, C., Battaglia, M., Battles, J. J., Bond-Lamberty, B., van Breugel, M., Camac, J., Claveau, Y., Coll, L., Dannoura, M., Delagrange, S., Domec, J.-C., Fatemi, F., Feng, W., Gargaglione, V., Goto, Y., Hagihara, A., Hall, J. S., Hamilton, S., Harja, D., Hiura, T., Holdaway, R., Hutley, L. S., Ichie, T., Jokela, E. J., Kantola, A., Kelly, J. W. G., Kenzo, T., King, D., Kloeppel, B. D., Kohyama, T., Komiyama, A., Laclau, J.-P., Lusk, C. H., Maguire, D. A., le Maire, G., Mäkelä, A., Markesteijn, L., Marshall, J., McCulloh, K., Miyata, I., Mokany, K., Mori, S., Myster, R. W., Nagano, M., Naidu, S. L., Nouvellon, Y., O'Grady, A. P., O'Hara, K. L., Ohtsuka, T., Osada, N., Osunkoya, O. O., Peri, P. L., Petritan, A. M., Poorter, L., Portsmuth, A., Potvin, C., Ransijn, J., Reid, D., Ribeiro, S. C., Roberts, S. D., Rodríguez, R., Saldaña-Acosta, A., Santa-Regina, I., Sasa, K., Selaya, N. G., Sillett, S. C., Sterck, F., Takagi, K., Tange, T., Tanouchi, H., Tissue, D., Umehara, T., Utsugi, H., Vadeboncoeur, M. A., Valladares, F., Vanninen, P., Wang, J. R., Wenk, E., Williams, R., de Aquino Ximenes, F., Yamaba, A., Yamada, T., Yamakura, T., Yanai, R. D., and York, R. A.: BAAD: a Biomass And Allometry Database for woody plants, Ecology, 96, 1445–1445, https://doi.org/10.1890/14-1889.1, 2015.
Farquhar, G. D., von Caemmerer, S., and Berry, J. A.: A biochemical model of photosynthetic CO2 assimilation in leaves of C3 species, Planta, 149, 78–90, https://doi.org/10.1007/BF00386231, 1980.
Fontes, L., Bontemps, J.-D., Bugmann, H., Van Oijen, M., Gracia, C., Kramer, K., Lindner, M., Rötzer, T., and Skovsgaard, J. P.: Models for supporting forest management in a changing environment, For. Syst., 3, 8–29, https://doi.org/10.5424/fs/201019S-9315, 2010.
Forrester, D. I.: The spatial and temporal dynamics of species interactions in mixed-species forests: From pattern to process, Forest Ecol. Manag., 312, 282–292, https://doi.org/10.1016/j.foreco.2013.10.003, 2014.
Forrester, D. I.: Linking forest growth with stand structure: Tree size inequality, tree growth or resource partitioning and the asymmetry of competition, Forest Ecol. Manag., 447, 139–157, https://doi.org/10.1016/j.foreco.2019.05.053, 2019.
Forrester, D. I., Hobi, M. L., Mathys, A. S., Stadelmann, G., and Trotsiuk, V.: Calibration of the process-based model 3-PG for major central European tree species, Eur. J. Forest Res., 140, 847–868, https://doi.org/10.1007/s10342-021-01370-3, 2021.
Gonzalez-Benecke, C. A., Jokela, E. J., Cropper, W. P., Bracho, R., and Leduc, D. J.: Parameterization of the 3-PG model for Pinus elliottii stands using alternative methods to estimate fertility rating, biomass partitioning and canopy closure, Forest Ecol. Manag., 327, 55–75, https://doi.org/10.1016/j.foreco.2014.04.030, 2014.
Gonzalez-Benecke, C. A., Teskey, R. O., Martin, T. A., Jokela, E. J., Fox, T. R., Kane, M. B., and Noormets, A.: Regional validation and improved parameterization of the 3-PG model for Pinus taeda stands, Forest Ecol. Manag., 361, 237–256, https://doi.org/10.1016/j.foreco.2015.11.025, 2016.
Grote, R. and Pretzsch, H.: A Model for Individual Tree Development Based on Physiological Processes, Plant Biol., 4, 167–180, https://doi.org/10.1055/s-2002-25743, 2002.
Guignabert, A., Ponette, Q., André, F., Messier, C., Nolet, P., and Jonard, M.: Validation of a new spatially-explicit process-based model (HETEROFOR) to simulate structurally and compositionally complex stands in Eastern North-America: Dataset (Version 1), Zenodo [data set], https://doi.org/10.5281/zenodo.7225303, 2022.
Hadiwijaya, B., Pepin, S., Isabelle, P.-E., and Nadeau, D. F.: The Dynamics of Transpiration to Evapotranspiration Ratio under Wet and Dry Canopy Conditions in a Humid Boreal Forest, Forests, 11, 237, https://doi.org/10.3390/f11020237, 2020.
Hernandez-Hernandez, A.: Effects of nutrient amendments on water use and water use efficiency in a Northeastern forest ecosystem, University of New Hampshire, 65 pp., 2014.
Hernandez-Santana, V., Hernandez-Hernandez, A., Vadeboncoeur, M. A., and Asbjornsen, H.: Scaling from single-point sap velocity measurements to stand transpiration in a multispecies deciduous forest: uncertainty sources, stand structure effect, and future scenarios, Can. J. Forest Res., 45, 1489–1497, https://doi.org/10.1139/cjfr-2015-0009, 2015.
Hersbach, H., Bell, B., Berrisford, P., Hirahara, S., Horányi, A., Muñoz-Sabater, J., Nicolas, J., Peubey, C., Radu, R., Schepers, D., Simmons, A., Soci, C., Abdalla, S., Abellan, X., Balsamo, G., Bechtold, P., Biavati, G., Bidlot, J., Bonavita, M., Chiara, G., Dahlgren, P., Dee, D., Diamantakis, M., Dragani, R., Flemming, J., Forbes, R., Fuentes, M., Geer, A., Haimberger, L., Healy, S., Hogan, R. J., Hólm, E., Janisková, M., Keeley, S., Laloyaux, P., Lopez, P., Lupu, C., Radnoti, G., Rosnay, P., Rozum, I., Vamborg, F., Villaume, S., and Thépaut, J.: The ERA5 global reanalysis, Q. J. Roy. Meteor. Soc., 146, 1999–2049, https://doi.org/10.1002/qj.3803, 2020.
Jactel, H., Moreira, X., and Castagneyrol, B.: Tree Diversity and Forest Resistance to Insect Pests: Patterns, Mechanisms, and Prospects, Annu. Rev. Entomol., 66, 277–296, https://doi.org/10.1146/annurev-ento-041720-075234, 2021.
Jonard, M., André, F., and de Wergifosse, L.: Code of HETEROFOR 1.0, Zenodo [code], https://doi.org/10.5281/zenodo.3591348, 2019.
Jonard, M., André, F., de Coligny, F., de Wergifosse, L., Beudez, N., Davi, H., Ligot, G., Ponette, Q., and Vincke, C.: HETEROFOR 1.0: a spatially explicit model for exploring the response of structurally complex forests to uncertain future conditions – Part 1: Carbon fluxes and tree dimensional growth, Geosci. Model Dev., 13, 905–935, https://doi.org/10.5194/gmd-13-905-2020, 2020.
Jurjević, L., Liang, X., Gašparović, M., and Balenović, I.: Is field-measured tree height as reliable as believed – Part II, A comparison study of tree height estimates from conventional field measurement and low-cost close-range remote sensing in a deciduous forest, ISPRS J. Photogramm., 169, 227–241, https://doi.org/10.1016/J.ISPRSJPRS.2020.09.014, 2020.
Kattge, J., Bönisch, G., Díaz, S., Lavorel, S., Prentice, I. C., Leadley, P., Tautenhahn, S., Werner, G. D. A., Aakala, T., Abedi, M., Acosta, A. T. R., Adamidis, G. C., Adamson, K., Aiba, M., Albert, C. H., Alcántara, J. M., Alcázar C, C., Aleixo, I., Ali, H., Amiaud, B., Ammer, C., Amoroso, M. M., Anand, M., Anderson, C., Anten, N., Antos, J., Apgaua, D. M. G., Ashman, T., Asmara, D. H., Asner, G. P., Aspinwall, M., Atkin, O., Aubin, I., Baastrup‐Spohr, L., Bahalkeh, K., Bahn, M., Baker, T., Baker, W. J., Bakker, J. P., Baldocchi, D., Baltzer, J., Banerjee, A., Baranger, A., Barlow, J., Barneche, D. R., Baruch, Z., Bastianelli, D., Battles, J., Bauerle, W., Bauters, M., Bazzato, E., Beckmann, M., Beeckman, H., Beierkuhnlein, C., Bekker, R., Belfry, G., Belluau, M., Beloiu, M., Benavides, R., Benomar, L., Berdugo‐Lattke, M. L., Berenguer, E., Bergamin, R., Bergmann, J., Bergmann Carlucci, M., Berner, L., Bernhardt‐Römermann, M., Bigler, C., Bjorkman, A. D., Blackman, C., Blanco, C., Blonder, B., Blumenthal, D., Bocanegra‐González, K. T., Boeckx, P., Bohlman, S., Böhning‐Gaese, K., Boisvert‐Marsh, L., Bond, W., Bond‐Lamberty, B., Boom, A., Boonman, C. C. F., Bordin, K., Boughton, E. H., Boukili, V., Bowman, D. M. J. S., Bravo, S., Brendel, M. R., Broadley, M. R., Brown, K. A., Bruelheide, H., Brumnich, F., Bruun, H. H., Bruy, D., Buchanan, S. W., Bucher, S. F., Buchmann, N., Buitenwerf, R., Bunker, D. E., et al.: TRY plant trait database – enhanced coverage and open access, Glob. Change Biol., 26, 119–188, https://doi.org/10.1111/gcb.14904, 2020.
Kenefic, L. S. and Seymour, R. S.: Leaf area prediction models for Tsuga canadensis in Maine, Can. J. Forest Res., 29, 1574–1582, https://doi.org/10.1139/cjfr-29-10-1574, 1999.
Kitajima, K. and Fenner, M.: Ecology of seedling regeneration, in: Seeds: the ecology of regeneration in plant communities, CAB International, Wallingford, UK, 331–359, https://doi.org/10.1079/9780851994321.0331, 2000.
König, L. A., Mohren, F., Schelhaas, M.-J., Bugmann, H., and Nabuurs, G.-J.: Tree regeneration in models of forest dynamics – Suitability to assess climate change impacts on European forests, Forest Ecol. Manag., 520, 120390, https://doi.org/10.1016/J.FORECO.2022.120390, 2022.
Korol, R. L., Running, S. W., and Milner, K. S.: Incorporating intertree competition into an ecosystem model, Can. J. Forest Res., 25, 413–424, https://doi.org/10.1139/x95-046, 1995.
Krasowski, M. J., Lavigne, M. B., Szuter, M. A., Olesinski, J., Kershaw, J. A., and McGarrigle, E.: Age-related changes in survival and turnover rates of balsam fir (Abies balsamea (L.) Mill.) fine roots, Tree Physiol., 38, 865–876, https://doi.org/10.1093/treephys/tpy010, 2018.
Kühn, N., Tovar, C., Carretero, J., Vandvik, V., Enquist, B. J., and Willis, K. J.: Globally important plant functional traits for coping with climate change, Front. Biogeogr., 13, 4, https://doi.org/10.21425/F5FBG53774, 2021.
Larocque, G. R., Archambault, L., and Delisle, C.: Development of the gap model ZELIG-CFS to predict the dynamics of North American mixed forest types with complex structures, Ecol. Modell., 222, 2570–2583, https://doi.org/10.1016/j.ecolmodel.2010.08.035, 2011.
Lhotka, J. M. and Loewenstein, E. F.: An examination of species-specific growing space utilization, Can. J. Forest Res., 38, 470–479, https://doi.org/10.1139/X07-147, 2008.
Makela, A., Landsberg, J., Ek, A. R., Burk, T. E., Ter-Mikaelian, M., Agren, G. I., Oliver, C. D., and Puttonen, P.: Process-based models for forest ecosystem management: current state of the art and challenges for practical implementation, Tree Physiol., 20, 289–298, https://doi.org/10.1093/treephys/20.5-6.289, 2000.
Manuilova, E., Schuetzenmeister, A., and Model, F.: mcr: Method Comparison Regression, R package version 1.2.2, https://CRAN.R-project.org/package=mcr (last access: 15 September 2022), 2021.
Maréchaux, I., Langerwisch, F., Huth, A., Bugmann, H., Morin, X., Reyer, C. P. O., Seidl, R., Collalti, A., Dantas de Paula, M., Fischer, R., Gutsch, M., Lexer, M. J., Lischke, H., Rammig, A., Rödig, E., Sakschewski, B., Taubert, F., Thonicke, K., Vacchiano, G., and Bohn, F. J.: Tackling unresolved questions in forest ecology: The past and future role of simulation models, Ecol. Evol., 11, 3746–3770, https://doi.org/10.1002/ece3.7391, 2021.
McCormack, M. L., Adams, T. S., Smithwick, E. A. H., and Eissenstat, D. M.: Predicting fine root lifespan from plant functional traits in temperate trees, New Phytol., 195, 823–831, https://doi.org/10.1111/j.1469-8137.2012.04198.x, 2012.
McCormack, M. L., Eissenstat, D. M., Prasad, A. M., and Smithwick, E. A. H.: Regional scale patterns of fine root lifespan and turnover under current and future climate, Glob. Change Biol., 19, 1697–1708, https://doi.org/10.1111/gcb.12163, 2013.
McDowell, N. G., Allen, C. D., Anderson-Teixeira, K., Aukema, B. H., Bond-Lamberty, B., Chini, L., Clark, J. S., Dietze, M., Grossiord, C., Hanbury-Brown, A., Hurtt, G. C., Jackson, R. B., Johnson, D. J., Kueppers, L., Lichstein, J. W., Ogle, K., Poulter, B., Pugh, T. A. M., Seidl, R., Turner, M. G., Uriarte, M., Walker, A. P., and Xu, C.: Pervasive shifts in forest dynamics in a changing world, Science, 80, 368, https://doi.org/10.1126/SCIENCE.AAZ9463, 2020.
McIntire, C. D.: Impacts and management of foliar pathogens of eastern white pine (Pinus strobus) in the northeastern United States, University of New Hampshire, Durham, Doctoral Dissertation 2397, 2018.
Messier, C., Bauhus, J., Doyon, F., Maure, F., Sousa-Silva, R., Nolet, P., Mina, M., Aquilué, N., Fortin, M.-J., and Puettmann, K.: The functional complex network approach to foster forest resilience to global changes, Forest Ecosyst., 6, 21, https://doi.org/10.1186/s40663-019-0166-2, 2019.
Messier, C., Bauhus, J., Sousa-Silva, R., Auge, H., Baeten, L., Barsoum, N., Bruelheide, H., Caldwell, B., Cavender-Bares, J., Dhiedt, E., Eisenhauer, N., Ganade, G., Gravel, D., Guillemot, J., Hall, J. S., Hector, A., Hérault, B., Jactel, H., Koricheva, J., Kreft, H., Mereu, S., Muys, B., Nock, C. A., Paquette, A., Parker, J. D., Perring, M. P., Ponette, Q., Potvin, C., Reich, P. B., Scherer-Lorenzen, M., Schnabel, F., Verheyen, K., Weih, M., Wollni, M., and Zemp, D. C.: For the sake of resilience and multifunctionality, let's diversify planted forests!, Conserv. Lett., 15, e12829, https://doi.org/10.1111/conl.12829, 2021.
MFFP: Inventaire écoforestier, Ministère des Forêts, de la Faune et des Parcs, Réseaux des placettes-échantillons permanentes du Québec, http://mffp.gouv.qc.ca/les-forets/inventaire-ecoforestier/, last access: January 2021.
Miles, P. D. and Smith, W. B.: Specific gravity and other properties of wood and bark for 156 tree species found in North America, Res. Note. NRS-38, 35 pp., https://doi.org/10.2737/NRS-RN-38, 2009.
Mina, M., Messier, C., Duveneck, M. J., Fortin, M. J., and Aquilué, N.: Managing for the unexpected: Building resilient forest landscapes to cope with global change, Glob. Change Biol., 1–19, https://doi.org/10.1111/gcb.16197, 2022.
Mori, A. S., Furukawa, T., and Sasaki, T.: Response diversity determines the resilience of ecosystems to environmental change, Biol. Rev., 88, 349–364, https://doi.org/10.1111/BRV.12004, 2013.
Morin, X., Lechowicz, M. J., Augspurger, C., O'Keefe, J., Viner, D., and Chuine, I.: Leaf phenology in 22 North American tree species during the 21st century, Glob. Change Biol., 15, 961–975, https://doi.org/10.1111/j.1365-2486.2008.01735.x, 2009.
Morin, X., Bugmann, H., Coligny, F., Martin-StPaul, N., Cailleret, M., Limousin, J., Ourcival, J., Prevosto, B., Simioni, G., Toigo, M., Vennetier, M., Catteau, E., and Guillemot, J.: Beyond forest succession: A gap model to study ecosystem functioning and tree community composition under climate change, Funct. Ecol., 35, 955–975, https://doi.org/10.1111/1365-2435.13760, 2021.
Niinemets, Ü. and Valladares, F.: Tolerance to shade, drought, and waterlogging of temperate northern hemisphere trees and shrubs, Ecol. Monogr., 76, 521–547, https://doi.org/10.1890/0012-9615(2006)076[0521:TTSDAW]2.0.CO;2, 2006.
Nolet, P. and Boureima, I.: Indicateurs de qualité de site pour l'érable à sucre., québécois d'Aménagment de la Forêt feuillue, Ripon, Québec, 34 pp., 2009.
Nolet, P., Bouffard, D., Doyon, R., and Delagrange, S.: Relationship between canopy disturbance history and current sapling density of Fagus grandifolia and Acer saccharum in a northern hardwood landscape, Can. J. Forest Res., 38, 216–225, https://doi.org/10.1139/X07-160, 2008.
Nolet, P., Boureima, I., and Ostojic, S.: Rendement des érablières sous aménagement équienne en Outaouais., Institut Québécois d'Aménagement de la Forêt Feuillue, Ripon, Québec, 82 pp., 2010.
Nyland, R. D., Ray, D. G., and Yanai, R. D.: Height Development of Upper-Canopy Trees Within Even-Aged Adirondack Northern Hardwood Stands, North. J. Appl. For., 21, 117–122, https://doi.org/10.1093/njaf/21.3.117, 2004.
Oliver, T. H., Heard, M. S., Isaac, N. J. B., Roy, D. B., Procter, D., Eigenbrod, F., Freckleton, R., Hector, A., Orme, C. D. L., Petchey, O. L., Proença, V., Raffaelli, D., Suttle, K. B., Mace, G. M., Martín-López, B., Woodcock, B. A., and Bullock, J. M.: Biodiversity and Resilience of Ecosystem Functions, Trends Ecol. Evol., 30, 673–684, https://doi.org/10.1016/J.TREE.2015.08.009, 2015.
Peng, C., Liu, J., Dang, Q., Apps, M. J., and Jiang, H.: TRIPLEX: a generic hybrid model for predicting forest growth and carbon and nitrogen dynamics, Ecol. Modell., 153, 109–130, https://doi.org/10.1016/S0304-3800(01)00505-1, 2002.
Penner, M. and Deblonde, G.: The relationship between leaf area and basal area growth in jack and red pine trees, Forest Chron., 72, 170–175, https://doi.org/10.5558/tfc72170-2, 1996.
Porté, A. and Bartelink, H. H.: Modelling mixed forest growth: a review of models for forest management, Ecol. Modell., 150, 141–188, https://doi.org/10.1016/S0304-3800(01)00476-8, 2002.
Power, H.: Comparaison des biais et de la précision des estimations des modèles Artémis-2009 et Artémis-2014 pour la surface terrière totale des peuplements forestiers, avec et sans coupe partielle, sur une période de 40 ans, Note de recherche forestière no. 143, MFFP – Direction de la recherche forestière, 1–22, 2016.
Power, H., LeMay, V., Berninger, F., Sattler, D., and Kneeshaw, D.: Differences in crown characteristics between black (Picea mariana) and white spruce (Picea glauca), Can. J. Forest Res., 42, 1733–1743, https://doi.org/10.1139/x2012-106, 2012.
Pretzsch, H.: Application and Evaluation of the Growth Simulator SILVA 2.2 for Forest Stands, Forest Estates and Large Regions, Forstwiss. Centralbl., 121, 28–51, 2002.
Pretzsch, H.: Facilitation and competition reduction in tree species mixtures in Central Europe: Consequences for growth modeling and forest management, Ecol. Modell., 464, 109812, https://doi.org/10.1016/j.ecolmodel.2021.109812, 2022.
Pretzsch, H., Forrester, D. I., and Rötzer, T.: Representation of species mixing in forest growth models. A review and perspective, Ecol. Modell., 313, 276–292, https://doi.org/10.1016/j.ecolmodel.2015.06.044, 2015.
Purves, D. W., Lichstein, J. W., Strigul, N., and Pacala, S. W.: Predicting and understanding forest dynamics using a simple tractable model, P. Natl. Acad. Sci. USA, 105, 17018–17022, https://doi.org/10.1073/pnas.0807754105, 2008.
Quiñonez-Piñón, M. and Valeo, C.: Allometry of Sapwood Depth in Five Boreal Trees, Forests, 8, 457, https://doi.org/10.3390/f8110457, 2017.
Raulier, F., Bernier, P. Y., and Ung, C.-H.: Canopy photosynthesis of sugar maple (Acer saccharum): comparing big-leaf and multilayer extrapolations of leaf-level measurements, Tree Physiol., 19, 407–420, https://doi.org/10.1093/treephys/19.7.407, 1999.
R Core Team: R: A language and environment for statistical computing, R Foundation for Statistical Computing, Vienna, Austria, https://www.r-project.org/ (last access: 15 September 2022), 2021.
Reed, D. D., Pregitzer, K. S., Liechty, H. O., Burton, A. J., and Mroz, G. D.: Productivity and growth efficiency in sugar maple forests, Forest Ecol. Manag., 70, 319–327, https://doi.org/10.1016/0378-1127(94)90097-3, 1994.
Reineke, L. H.: Perfecting a stand-density index for even-aged forests, J. Agric. Res., 46, 627–638, 1933.
Ruiz-Benito, P., Vacchiano, G., Lines, E. R., Reyer, C. P. O., Ratcliffe, S., Morin, X., Hartig, F., Mäkelä, A., Yousefpour, R., Chaves, J. E., Palacios-Orueta, A., Benito-Garzón, M., Morales-Molino, C., Camarero, J. J., Jump, A. S., Kattge, J., Lehtonen, A., Ibrom, A., Owen, H. J. F., and Zavala, M. A.: Available and missing data to model impact of climate change on European forests, Ecol. Modell., 416, 108870, https://doi.org/10.1016/j.ecolmodel.2019.108870, 2020.
Ryelandt, B.: Modeling oak and beech regeneration in mixed and uneven-aged forests: a process-based approach for changing environments, Université Catholique de Louvain, Master thesis, 2019.
Saucier, J.-P.: Le point d'observation eìcologique: normes techniques, Ministère des Ressources naturelles du Québec, ISBN 2551132738, 1994.
Schepaschenko, D., Shvidenko, A., Usoltsev, V., Lakyda, P., Luo, Y., Vasylyshyn, R., Lakyda, I., Myklush, Y., See, L., McCallum, I., Fritz, S., Kraxner, F., and Obersteiner, M.: A dataset of forest biomass structure for Eurasia, Sci. Data, 4, 170070, https://doi.org/10.1038/sdata.2017.70, 2017.
Schmid, S., Zingg, A., Biber, P., and Bugmann, H.: Evaluation of the forest growth model SILVA along an elevational gradient in Switzerland, Eur. J. Forest Res., 125, 43–55, https://doi.org/10.1007/s10342-005-0076-4, 2006.
Schoeneberger, P. J., Wysocki, D. A., Benham, E. C., and Soil Survey Staff: Field book for describing and sampling soils, Version 3.0, Natural Resources Conservation Service, National Soil Survey Center, Lincoln, NE, ISBN 9781782664093, 2012.
Schwalm, C. R. and Ek, A. R.: A process-based model of forest ecosystems driven by meteorology, Ecol. Modell., 179, 317–348, https://doi.org/10.1016/j.ecolmodel.2004.04.016, 2004.
Seidl, R., Lexer, M. J., Jager, D., and Honninger, K.: Evaluating the accuracy and generality of a hybrid patch model, Tree Physiol., 25, 939–951, https://doi.org/10.1093/treephys/25.7.939, 2005.
Seidl, R., Thom, D., Kautz, M., Martin-Benito, D., Peltoniemi, M., Vacchiano, G., Wild, J., Ascoli, D., Petr, M., Honkaniemi, J., Lexer, M. J., Trotsiuk, V., Mairota, P., Svoboda, M., Fabrika, M., Nagel, T. A., and Reyer, C. P. O.: Forest disturbances under climate change, Nat. Clim. Change, 7, 395–402, https://doi.org/10.1038/nclimate3303, 2017.
Strigul, N., Pristinski, D., Purves, D., Dushoff, J., and Pacala, S.: Scaling from trees to forests: tractable macroscopic equations for forest dynamics, Ecol. Monogr., 78, 523–545, https://doi.org/10.1890/08-0082.1, 2008.
Strimbu, V. C., Bokalo, M., and Comeau, P. G.: Deterministic models of growth and mortality for jack pine in boreal forests of Western Canada, Forests, 8, 410, https://doi.org/10.3390/f8110410, 2017.
TNSDB: The National Soil Database: Canadian Soil Information Service, Government of Canada, https://sis.agr.gc.ca/cansis/nsdb/index.html, last access: 23 October 2021.
Thurner, M., Beer, C., Crowther, T., Falster, D., Manzoni, S., Prokushkin, A., and Schulze, E.: Sapwood biomass carbon in northern boreal and temperate forests, Global Ecol. Biogeogr., 28, 640–660, https://doi.org/10.1111/geb.12883, 2019.
Trouvé, R., Bontemps, J.-D., Seynave, I., Collet, C., and Lebourgeois, F.: Stand density, tree social status and water stress influence allocation in height and diameter growth of Quercus petraea (Liebl.), Tree Physiol., 35, 1035–1046, https://doi.org/10.1093/treephys/tpv067, 2015.
Trumbore, S., Brando, P., and Hartmann, H.: Forest health and global change, Science, 349, 814–818, https://doi.org/10.1126/science.aac6759, 2015.
Ung, C.-H., Lambert, M. C., Raulier, F., Guo, J., and Bernier, P. Y.: Biomass of trees sampled across Canada as part of the Energy from the Forest Biomass (ENFOR) Program, Natural Resouces Canada, https://doi.org/10.23687/fbad665e-8ac9-4635-9f84-e4fd53a6253c, 2017.
USDA – Forest Service: Section 2. Crown condition classification, in: Forest Health Monitoring: field methods guide, USDA, Forest Service, National Forest Health Monitoring Program: 2.1–2.7, Research Triangle Park, NC, ISBN 1288804784, 1999.
Wright, I. J., Reich, P. B., Westoby, M., Ackerly, D. D., Baruch, Z., Bongers, F., Cavender-Bares, J., Chapin, T., Cornelissen, J. H. C., Diemer, M., Flexas, J., Garnier, E., Groom, P. K., Gulias, J., Hikosaka, K., Lamont, B. B., Lee, T., Lee, W., Lusk, C., Midgley, J. J., Navas, M.-L., Niinemets, Ü., Oleksyn, J., Osada, N., Poorter, H., Poot, P., Prior, L., Pyankov, V. I., Roumet, C., Thomas, S. C., Tjoelker, M. G., Veneklaas, E. J., and Villar, R.: The worldwide leaf economics spectrum, Nature, 428, 821–827, https://doi.org/10.1038/nature02403, 2004.
Wullschleger, S. D., Hanson, P., and Todd, D.: Transpiration from a multi-species deciduous forest as estimated by xylem sap flow techniques, Forest Ecol. Manag., 143, 205–213, https://doi.org/10.1016/S0378-1127(00)00518-1, 2001.
Zanne, A. E., Lopez-Gonzalez, G., Coomes, D. A., Ilic, J., Jansen, S., Lewis, S. L., Miller, R. B., Swenson, N. G., Wiemann, M. C., and Chave, J.: Data from: Towards a worldwide wood economics spectrum, Dryad [data set], https://doi.org/10.5061/dryad.234, 2009.