the Creative Commons Attribution 4.0 License.
the Creative Commons Attribution 4.0 License.
 | 04 Jan 2023
Climate impacts of parameterizing subgrid variation and partitioning of land surface heat fluxes to the atmosphere with the NCAR CESM1.2
Yilun Han
Yong Wang
Wenqi Sun
Jianbo Deng
Daoming Wei
Ying Kong
Bin Wang
All current global climate models (GCMs) utilize only grid-averaged surface heat fluxes to drive the atmosphere, and thus their subgrid horizontal variations and partitioning are absent. This can result in many simulation biases. To address this shortcoming, a novel parameterization scheme considering the subgrid variations of the sensible and latent heat fluxes to the atmosphere and the associated partitioning is developed and implemented into the National Center for Atmospheric Research (NCAR) Climate Earth System Model 1.2 (CESM1.2). Compared to the default model, in addition to the improved boreal summer precipitation simulation over eastern China and the coastal areas of the Bay of Bengal, the long-standing overestimations of precipitation on the southern and eastern margins of the Tibetan Plateau (TP) in most GCMs are alleviated. The improved precipitation simulation on the southern margin of the TP is from suppressed large-scale precipitation, while that on the eastern edge of the TP is due to decreased convective precipitation. Moisture advection is blocked toward the southern edge of the TP, and the anomaly of anticyclonic moisture transport over northern China extends westward, suppressing local convection on the eastern edge of the TP. The altered large-scale circulation in the lower atmosphere resulting from anomalous heating and cooling in the planetary boundary layer is responsible for the change in moisture transport. The performance of other key variables (e.g., surface energy fluxes, clouds and 2 m temperature) is also evaluated thoroughly using the default CESM1.2, the new scheme and the scheme stochastically allocating the subgrid surface heat fluxes to the atmosphere (i.e., without subgrid partitioning included). This study highlights the importance of subgrid surface energy variations and partitioning to the atmosphere in simulating the hydrological and energy cycles in GCMs.
- Article
(19323 KB) - Full-text XML
-
Supplement
(2909 KB) - BibTeX
- EndNote


The importance of land surface heterogeneity has been identified through many observational and modeling studies (e.g., Taylor et al., 2007; Lothon et al., 2011; Rochetin et al., 2017; Wang et al., 2017). The variability in surface heat fluxes caused by the heterogeneity of surface properties is crucial to turbulence in the planetary boundary layer (PBL), as well as the evolution of large-scale atmospheric circulation and clouds (Rieck et al., 2014; Lee et al., 2019). In most global climate models (GCMs), confined by the horizontal resolution (∼ 100–200 km), the subgrid surface heat fluxes to the atmosphere are averaged out, thus degrading the simulation of convection and PBL processes. This is one of the causes of precipitation simulation biases in GCMs, such as “too much light rain and too little heavy rain” (e.g., Dai, 2006; O'Brien et al., 2016; Na et al., 2020; Wang et al., 2021a), unrealistic precipitation evolution over the Indian summer monsoon region (e.g., Waliser et al., 2012; Wang et al., 2018), and extremely excessive precipitation over the eastern and southern parts of the steep Tibetan Plateau (TP) (e.g., Zhou et al., 2021).
The land surface energy balance involves biophysical and biogeochemical processes (Lee et al., 2011; Liu et al., 2014; Duveiller et al., 2018; Chakraborty and Lee, 2019; Liu et al., 2022), which are closely related to surface properties. For instance, forests dissipate sensible heat to the PBL more efficiently than open landscapes (Rotenberg and Yakir, 2010; Wei et al., 2021), and the increase in vegetation density has been found to favor the release of latent heat rather than sensible heat during the past three and a half decades (Forzieri et al., 2020). The different performance of the energy terms suggests the potential importance of surface energy partitioning. However, the grid-scale surface heat fluxes to the atmosphere are rudimentarily treated by calculating the weighted averages within each grid cell in all GCMs. This simplified approach inevitably hampers our understanding of small-scale land–atmosphere feedback, which is among the critical processes in efforts to project future climate change through GCMs (Miralles et al., 2019; Forzieri et al., 2020).
To incorporate the subgrid horizontal variations in the surface heat fluxes to the atmosphere, a recent study (Sun et al., 2021) proposed a parameterization using stochastic sampling and tested it in the National Center for Atmospheric Research (NCAR) Climate Earth System Model 1.2 (CESM1.2). It was found that this scheme improved the boreal summer precipitation simulation over eastern China. However, Sun et al. (2021) did not comprehensively assess the overall performance of other variables. Another important limitation is that there is no advance in reducing excessive summer precipitation on the southern and eastern margins of the TP, which, is a long-standing issue in GCMs (Mueller and Seneviratne, 2014; Ma et al., 2015).
In the Sun et al. (2021) scheme, although the subgrid surface heat fluxes to the atmosphere are parameterized via stochastic sampling and internal multiple calls of the PBL and convection schemes, the underlying relationship between the subgrid heat fluxes is neglected. The conversion of the surface available energy into latent and sensible heat fluxes on a subgrid scale exerts a strong control on global water and energy cycles (Pitman, 2003; Tang et al., 2014; Wang et al., 2021b) by regulating land–atmosphere feedback, especially in regions with complicated land surface features, such as the TP and its surrounding areas (Pielke, 2001; Findell et al., 2011; Forzieri et al., 2018, 2020). As the next logical step, in this study, the Sun et al. (2021) parameterization is updated by taking the partitioning between the subgrid sensible and latent heat fluxes into account. Given that only the simulated precipitation by the Sun et al. (2021) scheme was investigated, the performance on the simulations of other variables such as grid-scale surface energy fluxes, clouds and 2 m temperature is further evaluated thoroughly along with the modified parameterization.
The paper is organized as follows. Section 2 briefly describes the Sun et al. (2021) parameterization scheme and further modifications, CESM and the experiments, and the observation and reanalysis datasets. The evaluations of the two schemes are presented in Sect. 3. The uncertainties are discussed in Sect. 4, while the conclusions are given in Sect. 5.
2.1 CESM and subgrid heat flux scheme
To compare with Sun et al. (2021), the GCM used in this study is NCAR CESM1.2. The atmospheric component is the Community Atmosphere Model, version 5 (CAM5). The land model is the Community Land Model, version 4 (CLM4). The spatial land surface heterogeneity in the default CLM4 is represented as a nested subgrid hierarchy in which the grid cells are composed of multiple land units, snow and soil columns, and plant functional types (PFTs) (Oleson et al., 2010). All of the fluxes to and from the surface, including the heat fluxes, are defined at the PFT level. Since the subgrid heat fluxes exported to the CAM5 are weighted averages and their weights depend on the fractional coverage of each PFT within the grid cell, the subgrid variations in the land surface fluxes are missing during the land–atmosphere coupling process (Sun et al., 2021).
To consider the influences of the heterogeneity of the subgrid heat fluxes to the atmosphere in CESM1.2, a parameterization scheme is developed and implemented in CLM4. This scheme establishes the truncated normal distributions of the subgrid sensible and latent heat fluxes independently within the grid cell at each time step. The probability density function (PDF) of subgrid sensible and latent heat fluxes in a given grid cell is calculated by
where is the weighted average value of all subgrid heat fluxes, σ is the standard deviation, Fmin and Fmax are the minima and maxima of the subgrid heat fluxes, respectively, and ϕ and Ψ are the PDF and the cumulative distribution function (CDF) of the standard normal distribution, respectively. N (i.e., the maximum number of PFTs coexisting in the grid cell) samples of sensible and latent heat fluxes are independently and randomly paired with each other to drive N independent groups of the PBL and the deep convection parameterization schemes in CAM5. The outputs from these N calls of the schemes are then averaged with equal weights as the inputs of the other schemes.
The stochastic sampling implicitly parameterizes the uncertainties of the PBL and convection processes to a certain degree. As stated in Sun et al. (2021), the sampled fluxes from a statistical distribution rather than the fluxes directly from individual PFTs can represent the mix of subgrid fluxes from mixed land cover types in reality. Moreover, the distribution of the sampled subgrid surface heat fluxes based on the assumed normal distribution resembles the distribution of realistic subgrid PFT heat fluxes within the grid cell in long-term statistics. As shown in Fig. 1, for the sensible heat flux, over the grid cells with 16 and 8 PFTs, the two distributions are highly consistent, in terms of mean value, variance and skewness. The latent heat flux has similar results (not shown). Given that those grid cells are stochastically selected and cover different climatic regimes (Fig. S1 in the Supplement), the assumed normal distribution works well and thus the sampled samples can represent the realistic features for climate simulation.
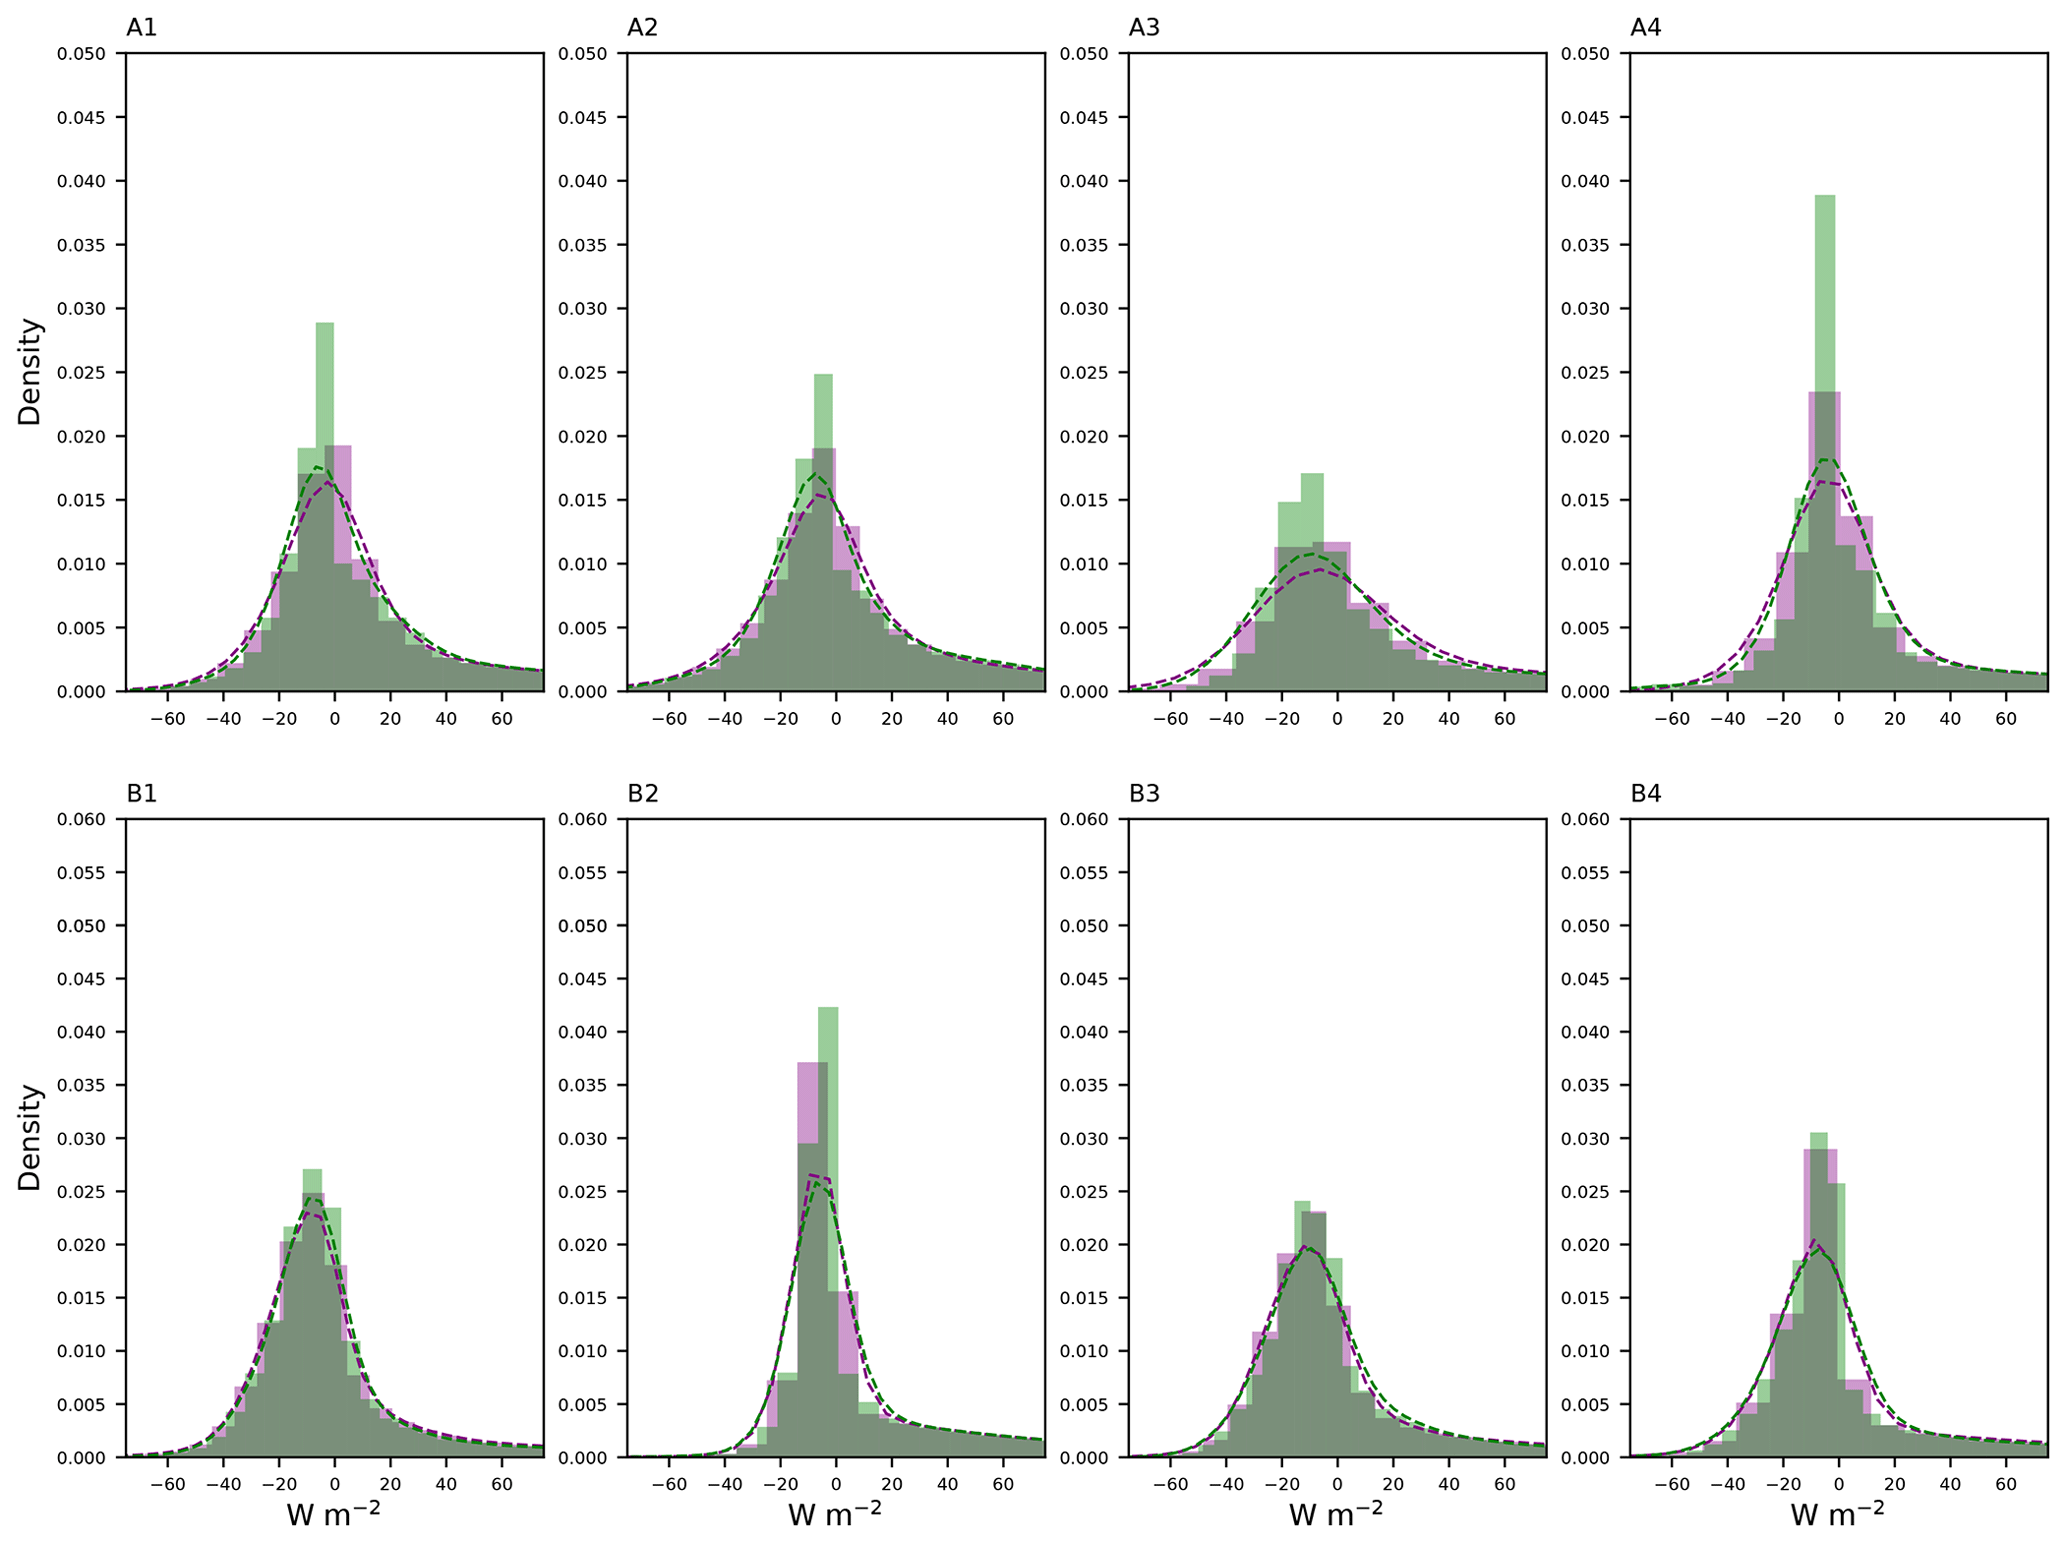
Figure 1Histograms and Gaussian kernel density estimates (KDEs) (dashed line) for realistic (green) and sampled (purple) sensible heat fluxes at the PFT in the eight grid cells with 16 (top row) and 8 (bottom row) PFTs, respectively.
Note that the closure of the surface energy balance at the grid scale is not affected by the stochastic sampling method. The surface energy balance is closed at the grid scale in the default land–atmosphere coupling way. Therefore, the stochastic sampling at the subgrid scale based on the truncated normal distributions with mean values equal to the default grid averages calculated by the weighted fluxes on each PFT within the grid cell (Fig. 1) can assure that the grid-scale surface energy balance is closed as well in the long-term statistics, although at a given time step this might be broken up.
2.2 Modified subgrid heat flux scheme
In the stochastic scheme proposed by Sun et al. (2021), the sampled subgrid sensible heat and latent heat fluxes are stochastically paired, without considering the underlying relationship between them. However, we can compute the correlation coefficients between the subgrid sensible and latent heat fluxes within each grid cell at every time step (i.e., 30 min) using the following equation:
where n is the number of PFTs within a grid cell in the land model, wi is the area percentage of each PFT within the grid cell, and are the subgrid surface sensible and latent heat fluxes of each PFT, respectively, and are their weighted averages, and σSH and σLH are their standard deviations. The correlation coefficients vary with time. Figure 2a shows the annual mean distribution of the energy partitioning between the sensible heat and latent heat fluxes at the subgrid scale. There are negative correlations at low latitudes in the Northern Hemisphere (NH) and most of the Southern Hemisphere (SH), whereas most regions have positive correlations in the middle and high latitudes in the NH and on the TP. In boreal summer (June–July–August, JJA) (Fig. 2b), the sensible and latent heat fluxes in most regions of the world are negatively correlated, except for the TP, Greenland, the central US and southern Australia (Fig. 2b). In boreal winter (December–January–February, DJF) (Fig. 2c), the global distribution is similar to that of the annual mean, showing larger positive correlation coefficients but smaller negative correlation coefficients. Positive correlation coefficients in both summer and winter mainly persist in high latitudes and altitudes. This is because as snow melts in summer the land surface gains more water for evaporation (i.e., latent heat flux). Sensible heat flux increases synchronously from enhanced surface net radiation as a result of increased incoming solar radiation and reduced snow albedo. In winter, decreased solar radiation and increased snow cover reduce both sensible and latent heat fluxes.
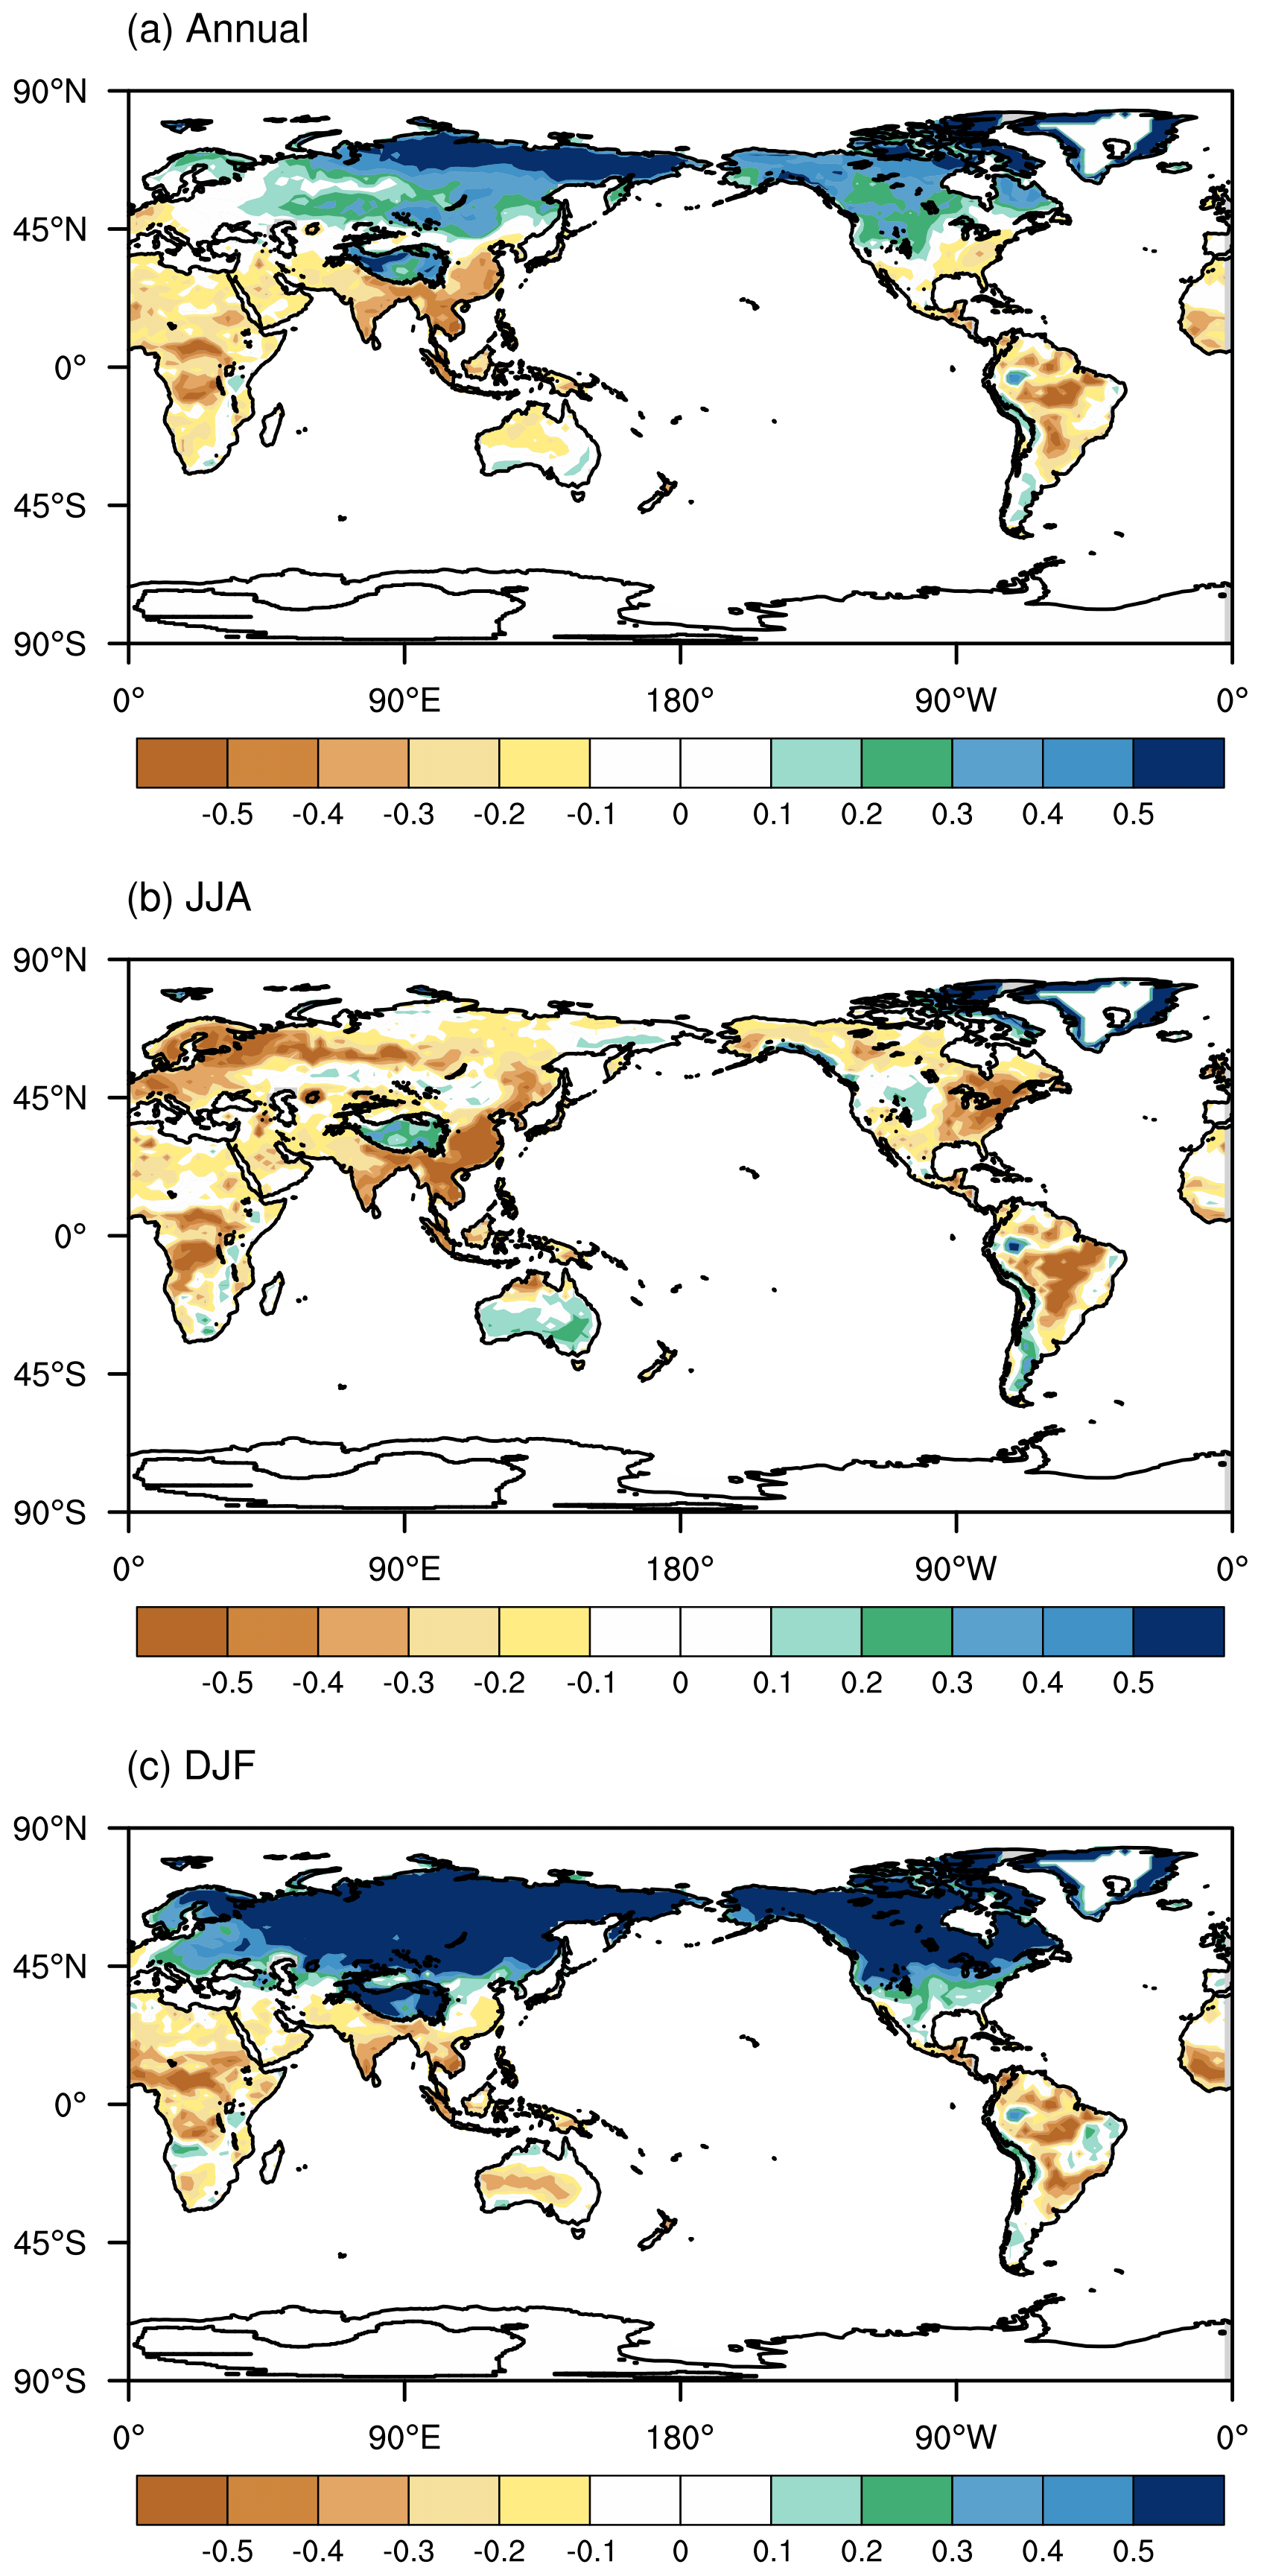
Figure 2Spatial distribution of (a) annual, (b) JJA (June–July–August) and (c) DJF (December–January–February) mean correlation coefficients r between the subgrid surface sensible and latent heat fluxes in the EXP_COR simulation.
Here we propose two methods below based on the subgrid surface energy partitioning between sensible and latent heat fluxes.
-
Arrange the randomly selected N subgrid sensible heat fluxes and N subgrid latent heat fluxes in each grid cell from largest to smallest and pair them in turn to drive the atmosphere independently. In this case, a large (small) sensible heat flux corresponds to a large (small) latent heat flux.
-
Use the same method as (1) but arrange the randomly selected N subgrid sensible heat fluxes from largest to smallest and the N latent heat fluxes from smallest to largest in each grid cell. In this case, a large (small) subgrid sensible heat flux corresponds to a small (large) subgrid latent heat flux.
Which one of the above methods is used for a given grid cell depends on the time-varying correlation coefficient r. If the correlation coefficient r in the grid cell is positive, the PBL and convection parameterizations are driven using the heat fluxes derived in method (1). Otherwise, the heat fluxes selected using method (2) will be passed to the atmosphere. The arithmetic mean of the outputs from N calls of the PBL and the convection parameterizations is passed into the other following schemes. Given that the surface energy balance closure at the grid scale is not affected by the stochastic sampling method, the follow-up collocation of the sampled sensible and latent heat fluxes according to their correlation coefficient does not break up this rule. This is because this process just rearranges the sequence of heat fluxes rather than altering the values.
2.3 Experiments
Three Atmospheric Model Intercomparison Project (AMIP)-type experiments with a finite-volume dynamical core at a horizontal resolution of 1.9∘ × 2.5∘ (∼ 2∘) and 30 vertical levels from the surface to 3.6 hPa are conducted using observed climatological (1982–2001 mean) monthly sea surface temperature and sea ice extent data (Stone et al., 2018). The control simulation (CTL) uses the standard CESM1.2, the experimental simulation (EXP) uses the Sun et al. (2021) parameterization in CESM1.2 (also the same as the EXP run in their study) and the EXP_COR run uses the modifications as described in Sect. 2.2. All of the simulations were run for 6 years, with the first year discarded as the spin-up stage. The value of N in each grid cell was fixed to 16, which equals the maximum number of PFTs ever coexisting on a single column in the land model, although different grid cells have different numbers of PFTs (Sun et al., 2021). As noted by Sun et al. (2021), further increasing N has negligible impacts on the model performance compared with setting N to 16 and enhances computational loading instead.
2.4 Observations and reanalyses
To evaluate the model performance, the simulation results are compared with the available observation and reanalysis datasets. The Tropical Rainfall Measuring Mission (TRMM; Huffman et al., 2014) observations (0.25∘ × 0.25∘) and the Modern-Era Retrospective Analysis for Research and Applications version 2 (MERRA-2; Gelaro et al., 2017) reanalysis (0.5∘ × 0.625∘) are used for precipitation. The other datasets include surface radiative fluxes from the Clouds and the Earth's Radiation Energy Systems (CERES) Energy Balanced and Filled (1.0∘ × 1.0∘) (EBAF; Loeb et al., 2012), sensible heat and latent heat fluxes from the Global Land Data Assimilation System version 2.1 (GLDAS-2.1) Noah monthly data (1.0∘ × 1.0∘) (Rodell et al., 2004) and 2 m air temperature from the Climatic Research Unit with a 0.5∘ resolution (CRU; Harris et al., 2020). For consistency, all of the observation and reanalysis datasets are regridded to the same grid size as CAM5.
Sun et al. (2021) found that the improved precipitation simulation with the parameterization of subgrid surface heat fluxes to the atmosphere is most prominent for boreal summer. Therefore, to compare with Sun et al. (2021), the analyses are first focused on boreal summer followed by a thorough evaluation of the two parameterizations on simulated climate variables for four seasons at the global scale.
3.1 Precipitation
Sun et al. (2021) (i.e., the EXP run) improved the simulation of summer precipitation over eastern China and the coastal areas of the Bay of Bengal (Fig. 3b–d), which is attributed to altered vertical diffusion and convection. In particular, it still produces excessive precipitation on the eastern and southern margins of the TP. After taking the subgrid energy partitioning into account in the EXP_COR run, the overall performance in terms of the root-mean-square error (RMSE) and the spatial correlation coefficient (COR) is comparable to that of the EXP run (Fig. 3d and f). The long-standing overestimations of precipitation on the southern and eastern margins of the TP are alleviated by up to −2.5 mm d−1 (Fig. 3b–f), although the simulated precipitation is still excessive. Over other regions such as southern China, the Middle East and Indonesia, there are some slight degradations.
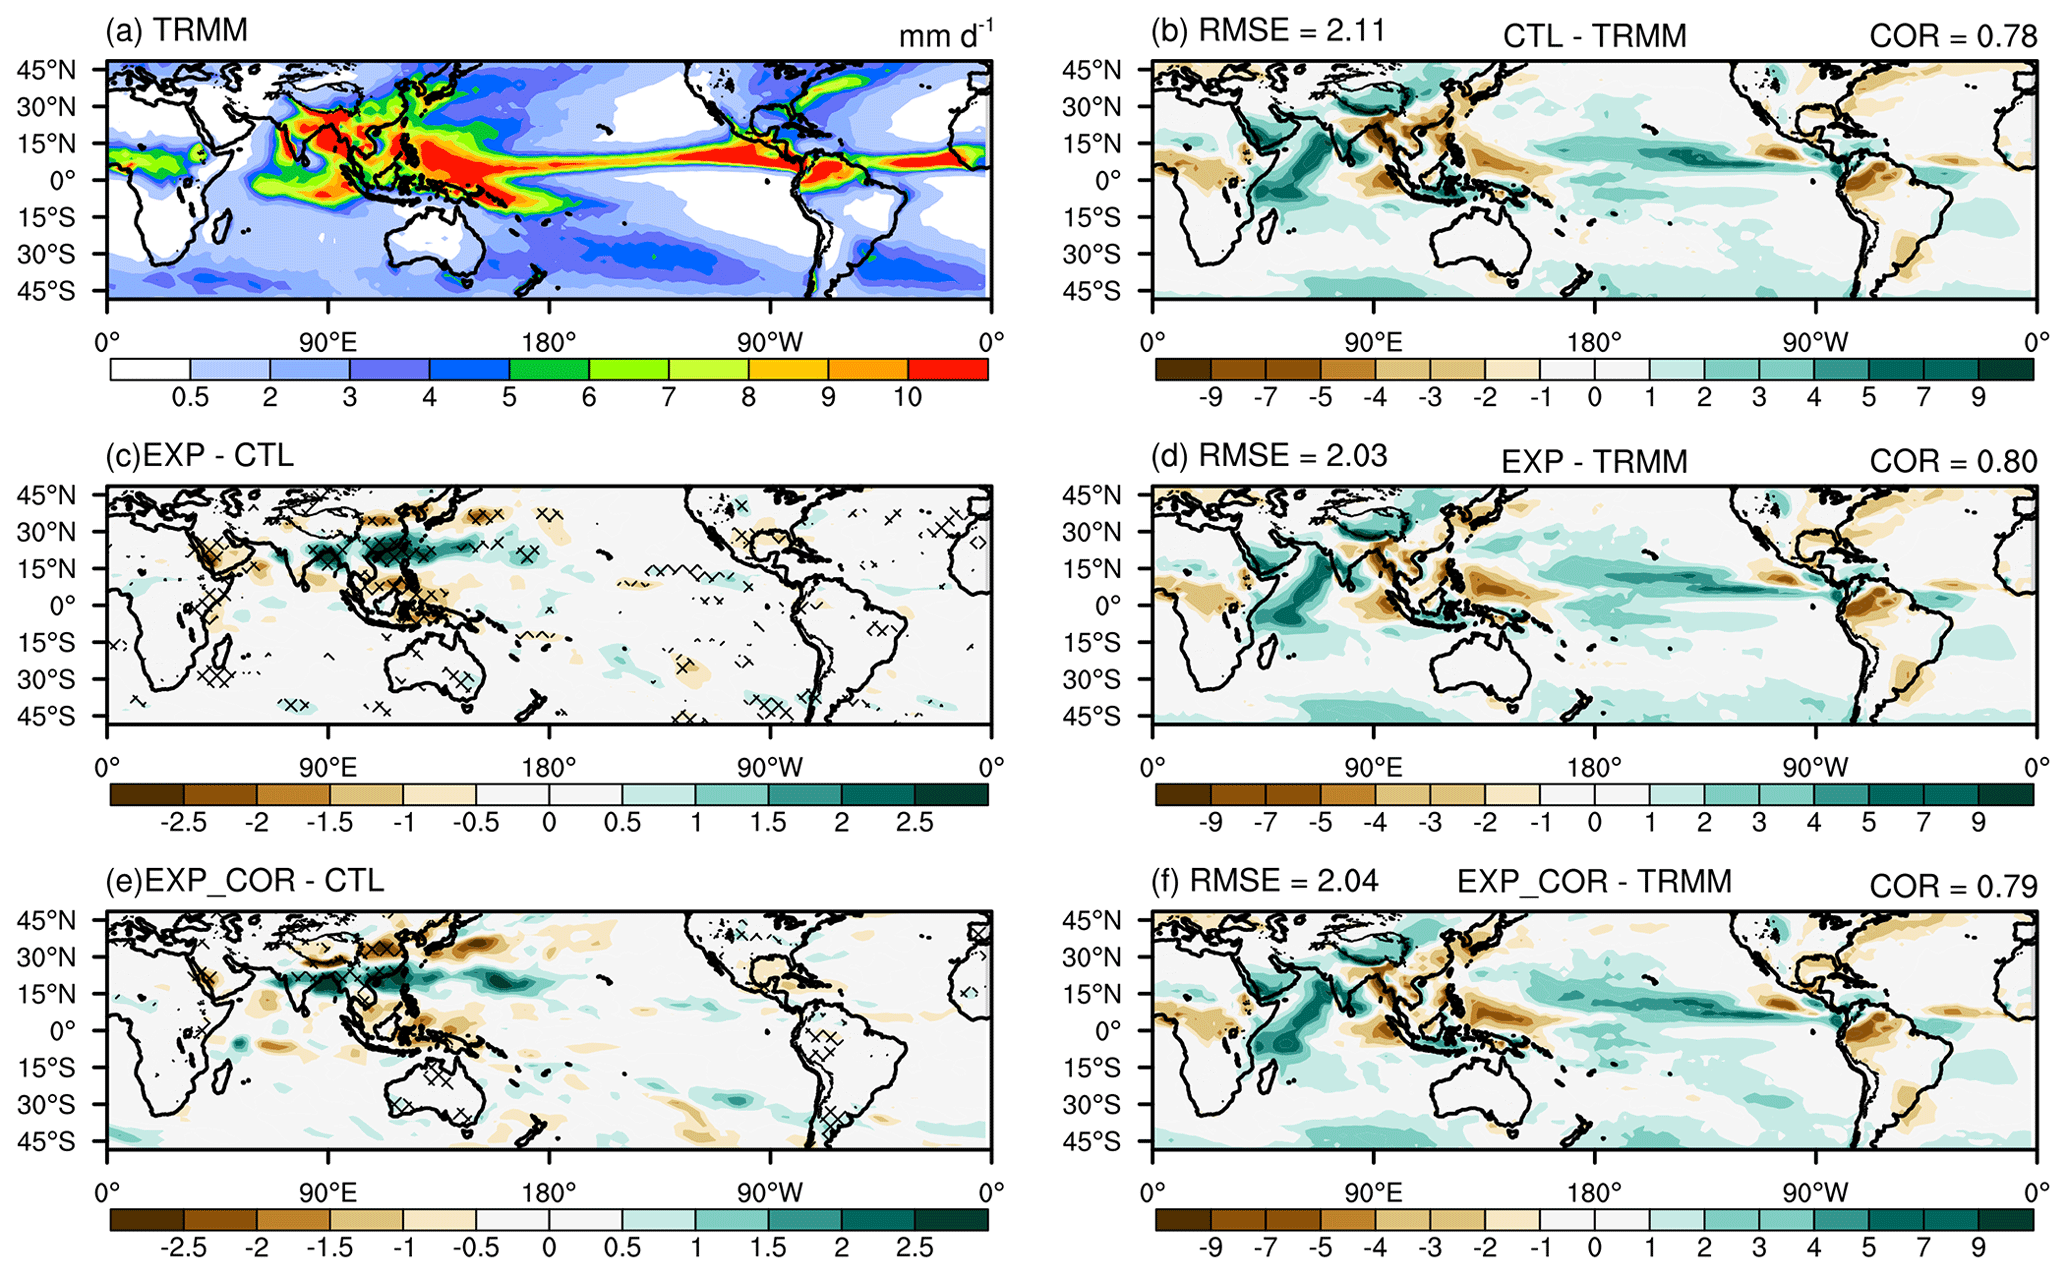
Figure 3Spatial distributions of JJA (June–July–August) mean precipitation for (a) TRMM; the biases of (b) CTL, (d) EXP, and (f) EXP_COR with respect to TRMM; and the differences (c) between EXP and CTL and (e) between EXP_COR and CTL. The crossed areas are significant at the 95 % level. The spatial correlation coefficient (COR) and the root-mean-square error (RMSE) are given at the top of (b), (d) and (f).
Figure 4 zooms in on the region (20–50∘ N, 75–125∘ E) where the simulated precipitation exhibits obvious improvements in the EXP_COR run. In the CTL run, the wet bias over the southern margin of the TP can exceed 11 mm d−1, while that over the eastern margin of the TP is approximately 7 mm d−1. In CMIP5&6 models, the biases along the TP are much larger than those in the rest of the world (Fig. 3) (Su et al., 2013; Yu et al., 2015; Zhu and Yang, 2020; Lun et al., 2021). In contrast, in the EXP_COR run, the reduced biases over these two regions can be as much as 2.5 mm d−1 accounting for a reduction of approximately 25 %, especially over the southern margin of the TP. Given that there are many causes (e.g., unrealistic water vapor advection and the absence of subgrid topographic effects) for the severe overestimation of precipitation along the TP, the improvement in this study, to some extent, is impressive. The regionally averaged RMSE decreases from 4.51 in the CTL run and 4.07 in the EXP run to 3.71 in the EXP_COR run, and the COR increases from 0.48 in the CTL run to 0.60 in both the EXP and EXP_COR runs.
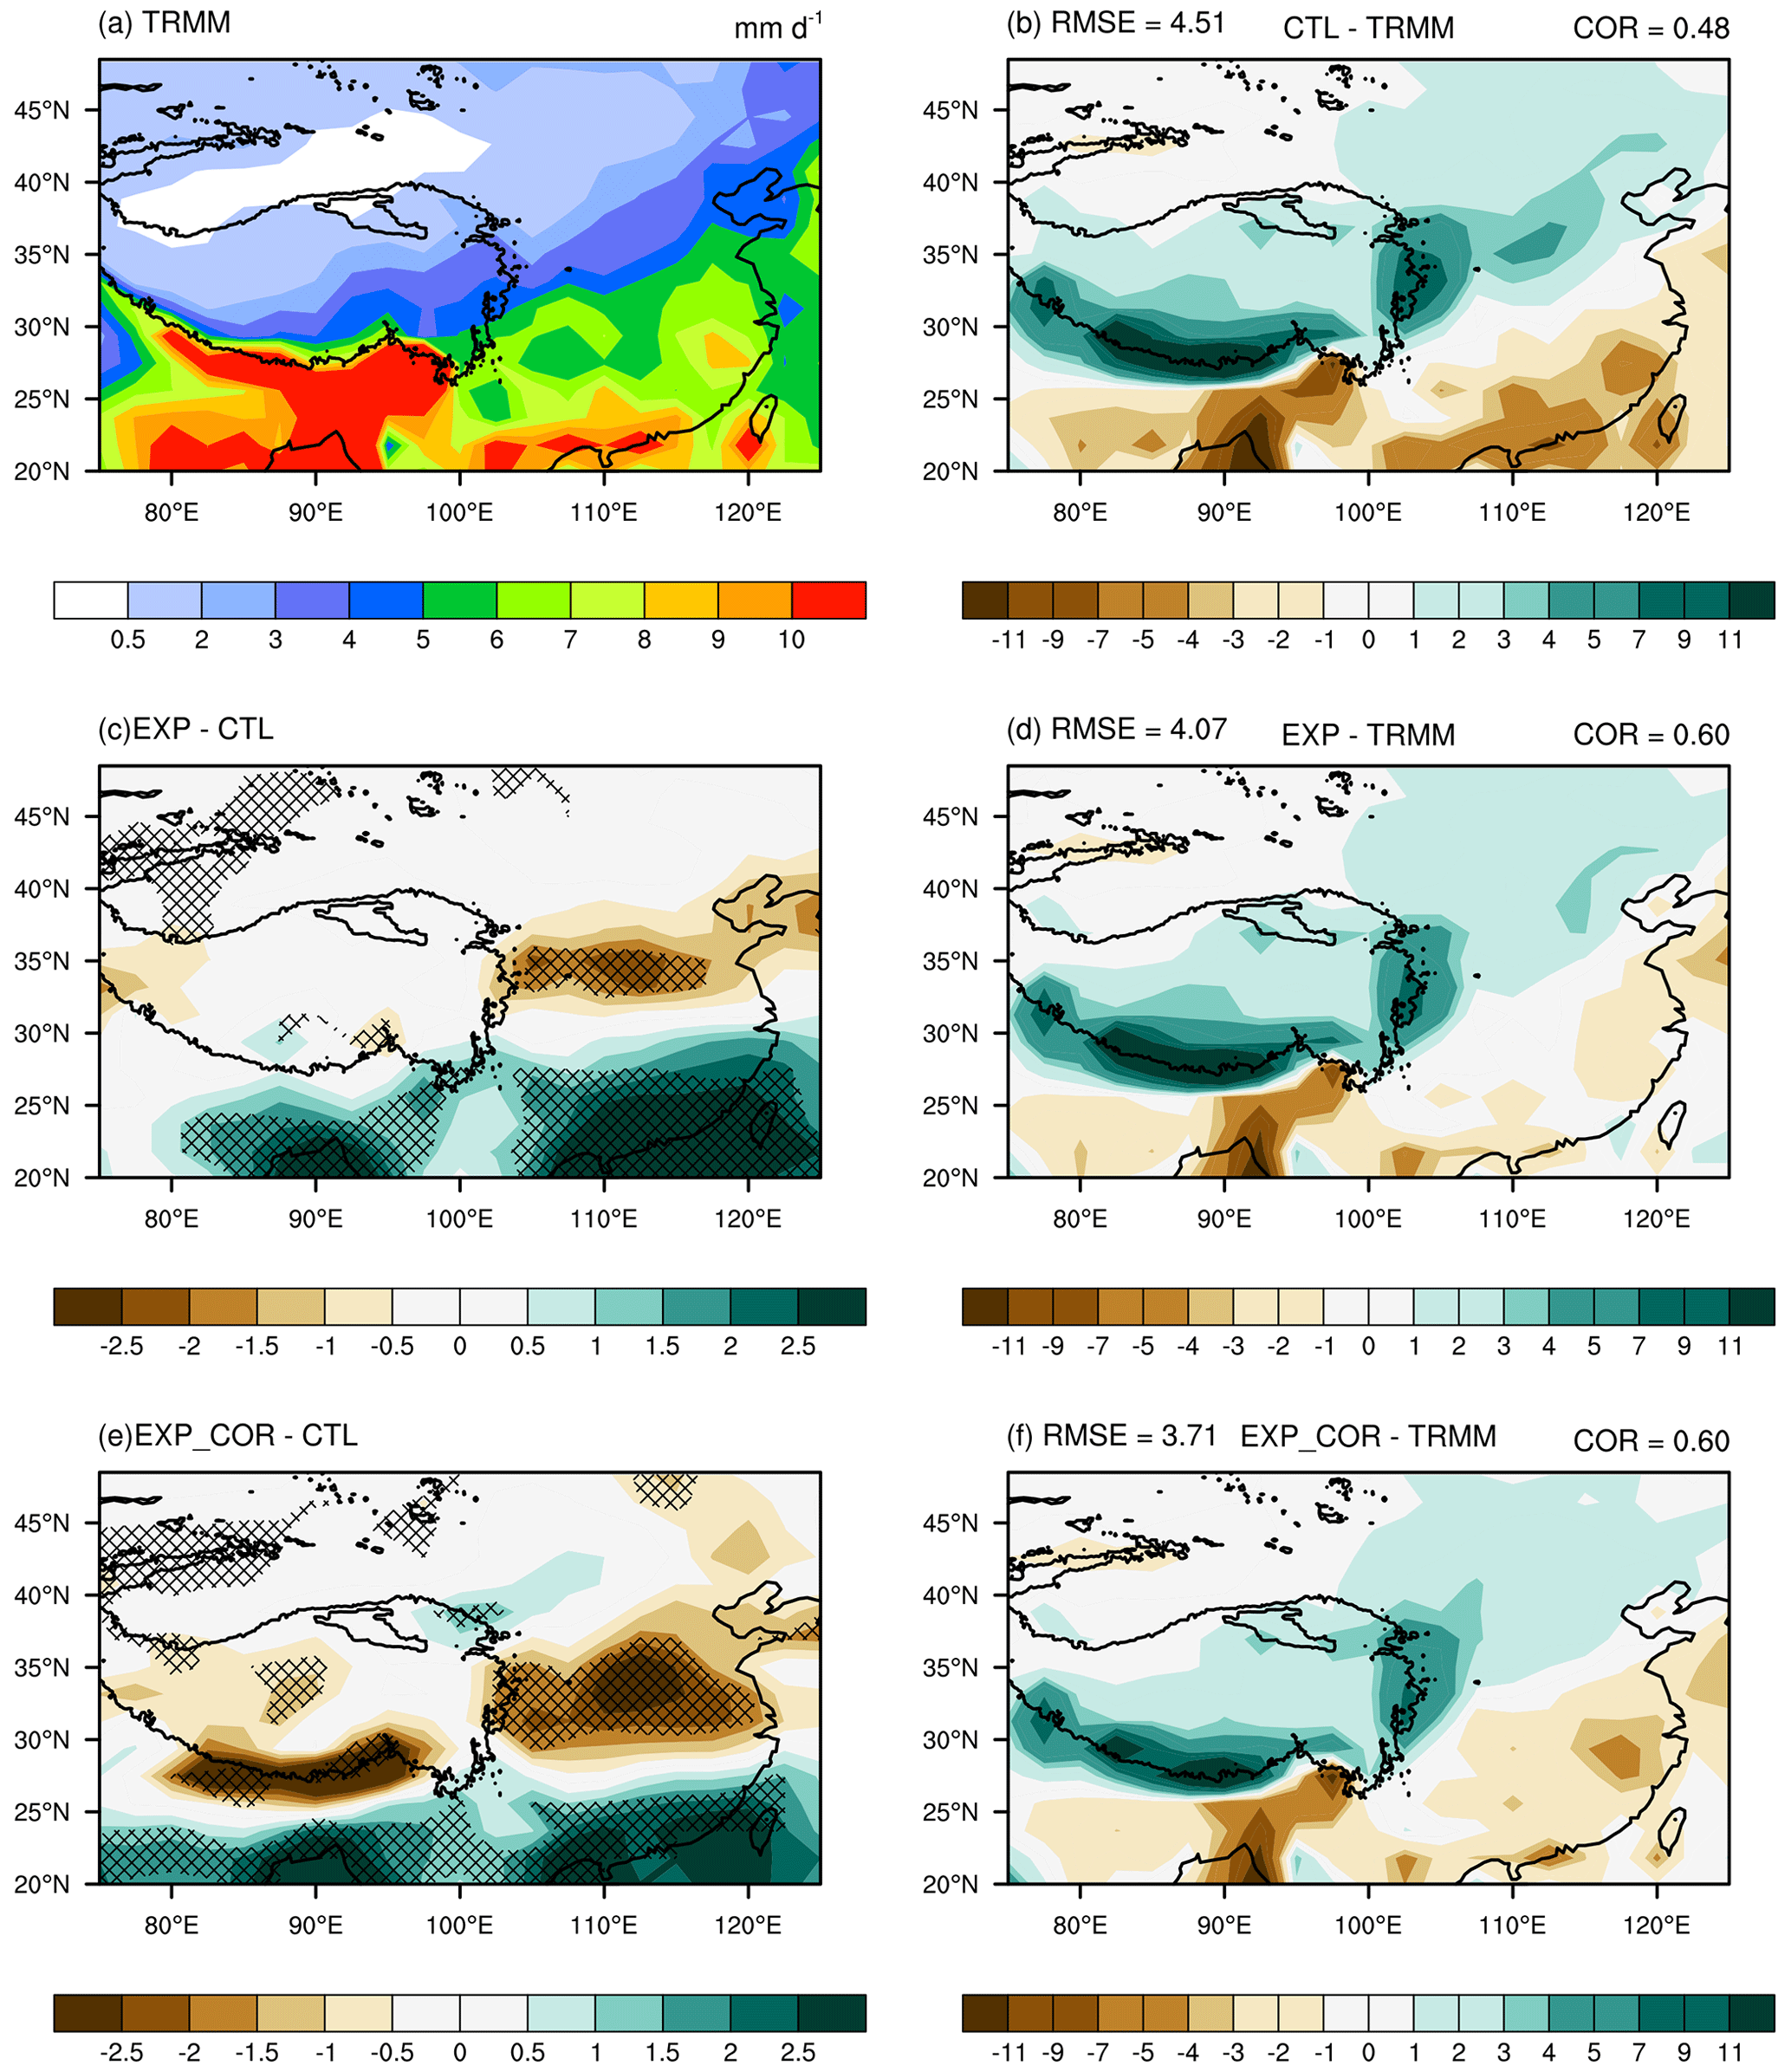
Figure 4The same as Fig. 3 but focusing on the study area (20–50∘ N, 75–125∘ E). The regionally averaged spatial COR and RMSE are given at the top of (b), (d) and (f).
Total precipitation in the model consists of convective and large-scale components. Their contributions are analyzed accordingly. Compared with the EXP run, large-scale precipitation is significantly suppressed on the southern fringe (Fig. 5a and b), and more large-scale precipitation and convective precipitation are reduced on the eastern margin in the EXP_COR run.

Figure 5Spatial distribution of the differences in (a, b) large-scale precipitation and (c, d) convective precipitation between (left) EXP and CTL and between (right) EXP_COR and CTL and the differences in (e–h) the contributions (moisture convergence Qcnvg, moisture advection Qadvt, evaporation E and the sum TOT) to total precipitation between EXP_COR and CTL. The crossed areas are significant at the 95 % level.
A moisture budget analysis widely used in previous studies (Gao et al., 2017; Wang et al., 2016) is conducted to examine the causes of precipitation changes. Following Sun et al. (2021), the atmospheric water vapor budget equation is given below:
where P is precipitation and E is evaporation. W is the column-integrated moisture given by , in which q is the specific humidity, Ptop and Pbot are the top and surface pressures, respectively, and g is the acceleration due to gravity. The vector V (with units of m s−1), given by , represents the total horizontal moisture transport normalized to the column-integrated moisture, where u is the horizontal wind vector. The first term on the right-hand side of Eq. (3) is the moisture convergence Qcnvg, and the second term is the moisture advection Qadvt. The tendency of the term on the left-hand side of Eq. (3) is negligible for seasonal averages of multiple years.
Compared with the CTL run, moisture convergence weakens on the eastern edge of the TP, while moisture advection increases in the EXP_COR run (Fig. 5e and f). On the southern edge of the TP, moisture advection decreases, and moisture convergence slightly increases. Overall, consistent with the change in total precipitation, the total water vapor contributions decrease on the eastern and southern edges of the TP (Fig. 5h). We note that the spatial pattern of Qcnvg changes in the EXP_COR run relative to the CTL run and resembles that in the EXP run (Fig. 4d and f in Sun et al., 2021), which is linked with the changes in the heating rate due to vertical diffusion in the PBL caused by the subgrid variations in land surface heat fluxes. In comparison with the EXP run, the negative moisture convergence anomaly is further aggravated, and the positive bias of moisture advection on the eastern margin of the TP is smaller (Sun et al., 2021). The negative maximum of the total contribution thus shifts westward to the eastern margin of the TP. Overall, moisture convergence dominates the change in precipitation on the eastern border of the TP (Fig. 5e and h). On the southern edge of the TP, the main term contributing to precipitation changes is the reduced moisture advection (Fig. 5f and h).
The causes of the altered moisture convergence and advection are illustrated in Figs. 6 and S2, where the MERRA-2 reanalysis is included for reference. In the EXP run, the subgrid variations of the land surface heat fluxes increase (decrease) PBL heating over southern (northern) China (Fig. 6a). With the partitioning of subgrid surface heat fluxes included, the increase (decrease) in the heating rate over southern (northern) China is strengthened (Fig. 6b). Therefore, destabilization (stabilization) in the lower atmosphere is further enhanced, promoting (suppressing) local convection. Lower (higher) sea level pressure (SLP) anomalies over southern (northern) China are generated in the EXP_COR run than in the EXP run. In particular, compared with the EXP run, the anomalous high SLP over northern China extends further to the south and to the eastern border of the TP, with the anomalous low SLP over southern China retreating (Fig. 6d–h). The anomalous anticyclonic moisture transport associated with downdraft expands accordingly, which engenders decreased precipitation on the eastern border of the TP and slight dry biases over southern China. Similar to the EXP run, convective precipitation dominates the changes in total precipitation over eastern China and the eastern margin of the TP in the EXP_COR run. In the EXP run, negative SLP anomalies appear along the Bay of Bengal, leading to cyclonic moisture transport from the ocean in the south (Fig. 6e). As a result, excessive moisture is transported to the southern edge of the TP producing overestimated rainfall there. In contrast, in the EXP_COR run (Fig. 6g), the easterly anomaly along 25–30∘ N partly blocks moisture transport from the ocean in the south to the southern margin of the TP, and hence the decrease in large-scale precipitation plays a first-order role on the southern margin of the TP.
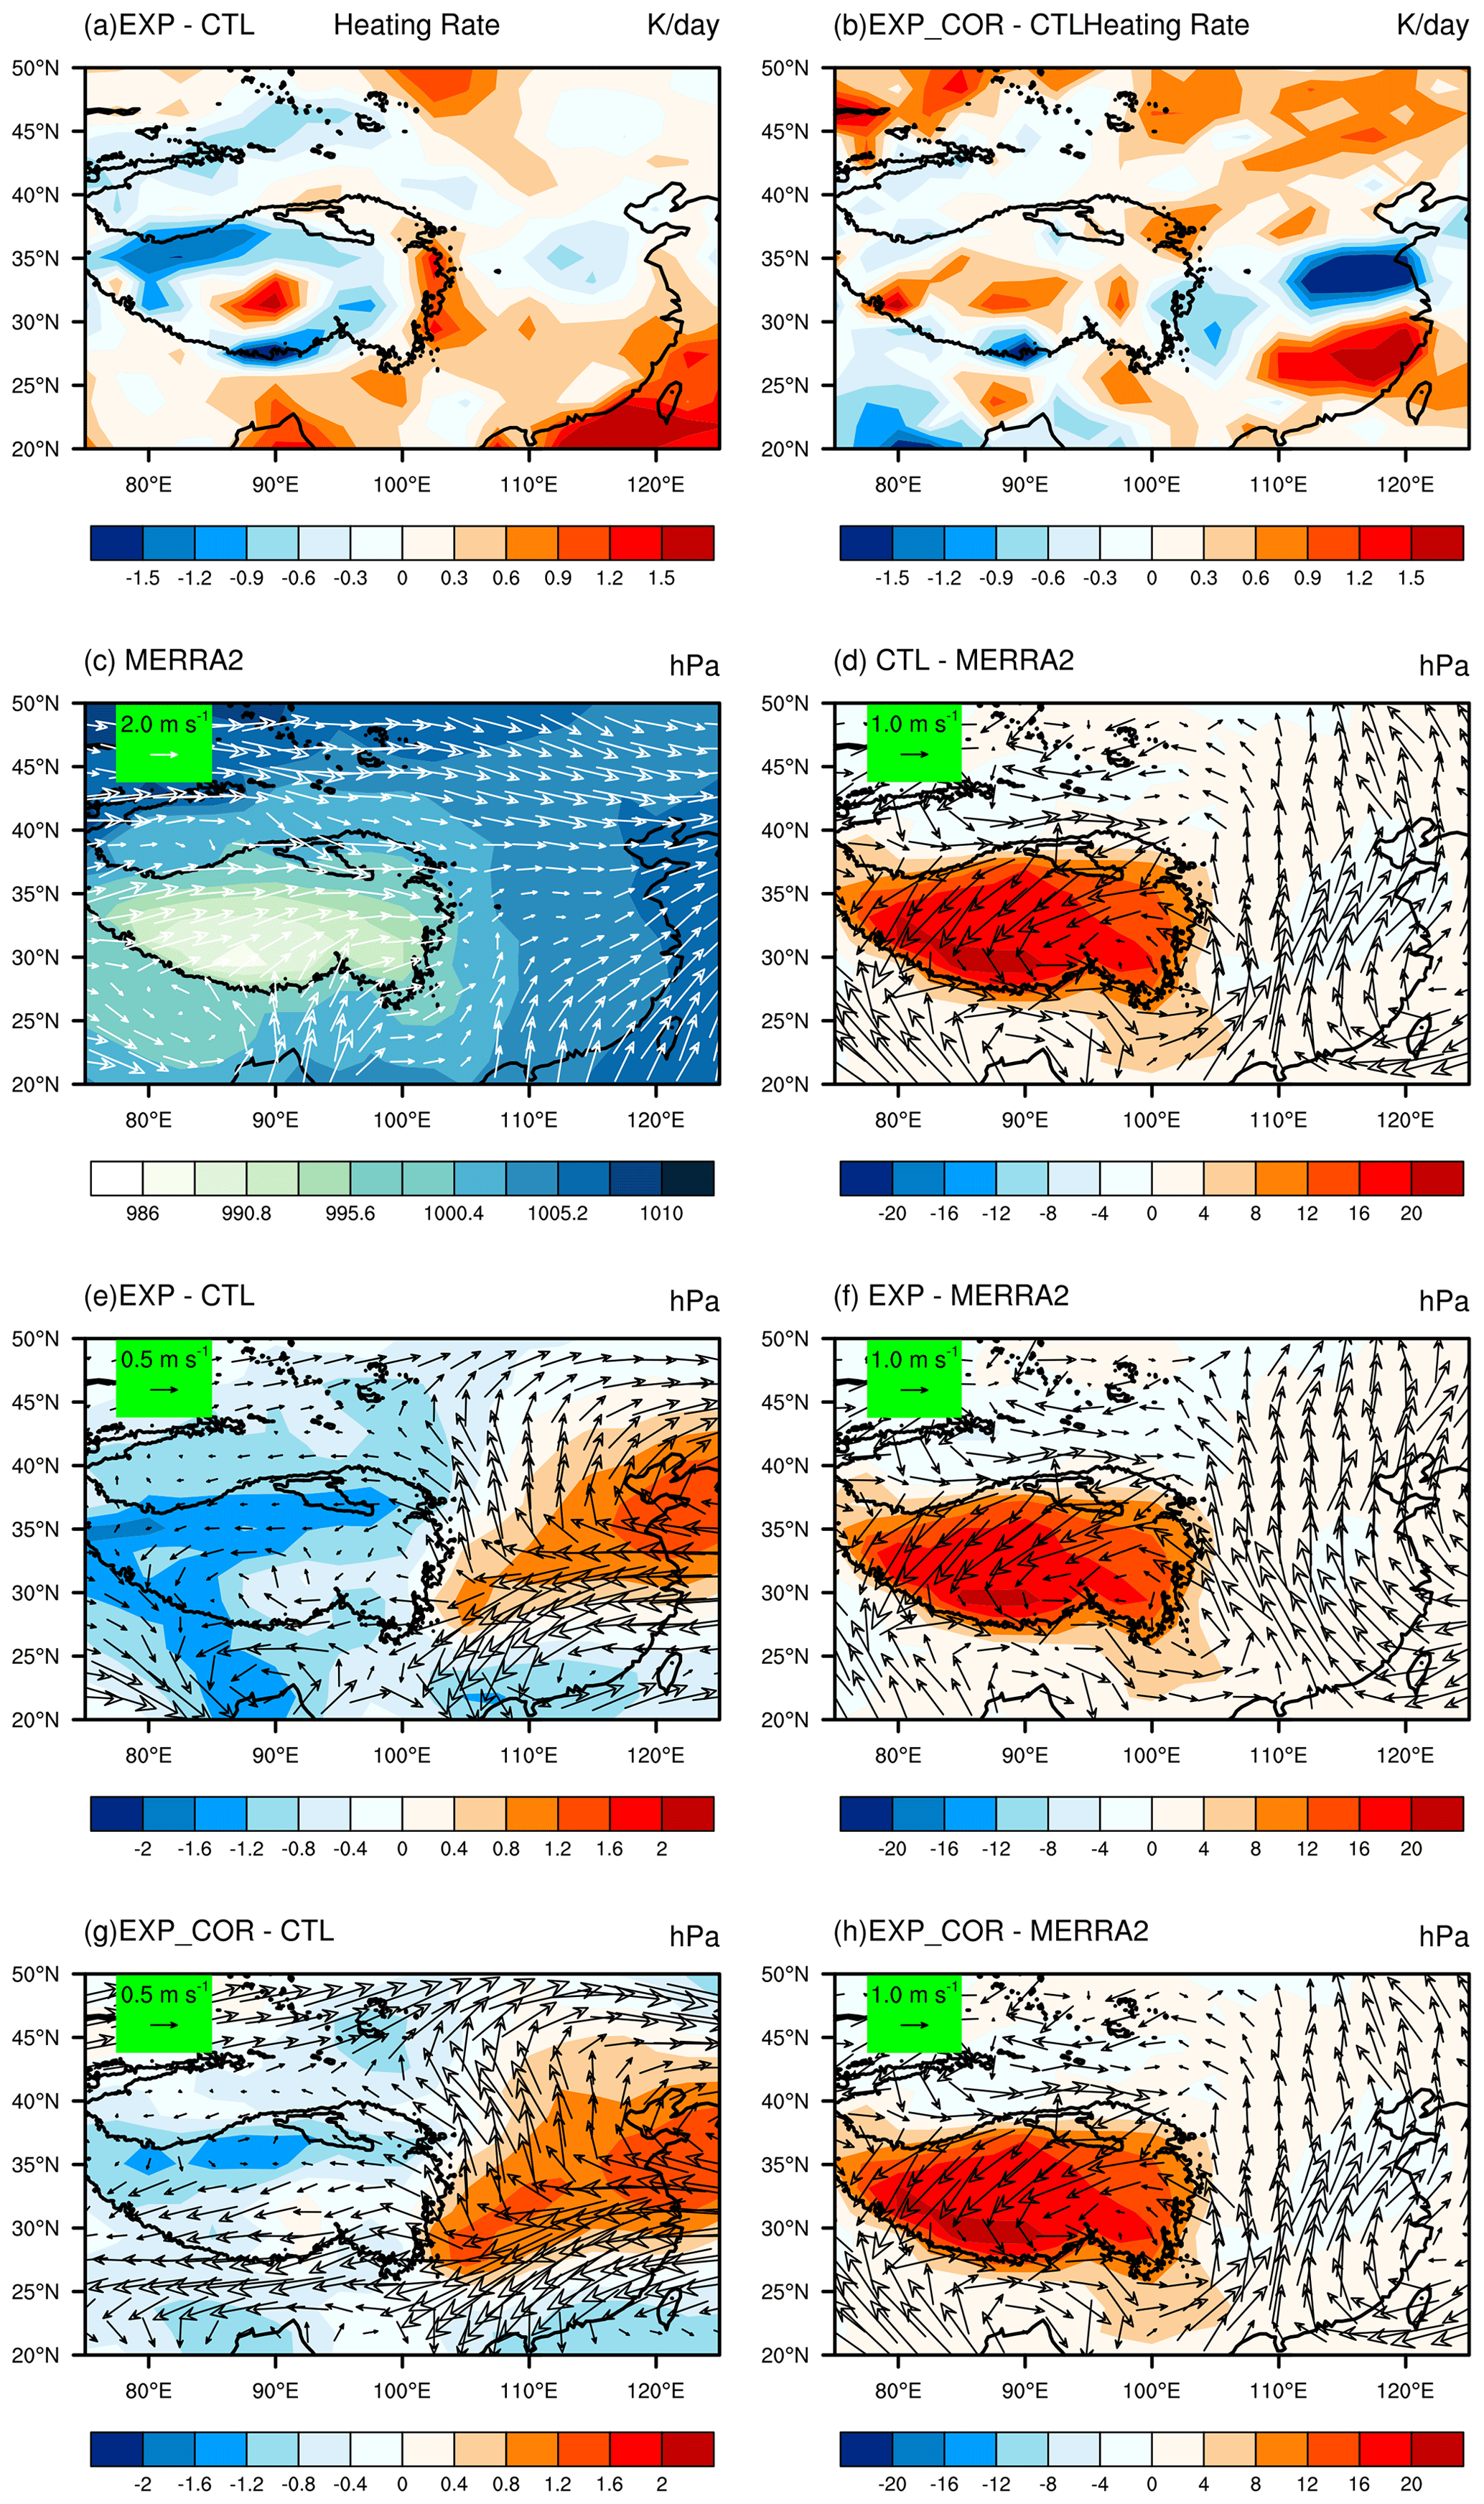
Figure 6Spatial distributions of the differences of JJA-mean PBL heating (a) between EXP and CTL and (b) between EXP_COR and CTL; SLP superposed by the vector V from (c) MERRA-2; and the differences (d) between CTL and MERRA-2, (e) between EXP and CTL, (f) between EXP and MERRA2, (g) between EXP_COR and CTL, and (h) between EXP_COR and MERRA2. The vector V is defined in Eq. (3).

Figure 7Spatial distributions of the JJA-mean latent heat flux in (a) GLDAS (upward positive); the biases of (b) CTL, (c) EXP, and (d) EXP_COR with respect to GLDAS; and the differences between (e) EXP and CTL and between (f) EXP_COR and CTL. The crossed areas are significant at the 95 % level. The averaged spatial COR and RMSE values for the three simulations are given in (b)–(d).
3.2 Surface heat fluxes, clouds and 2 m air temperature
The above analysis indicates that the precipitation simulation is improved through the adjustment of large-scale atmospheric circulation in the lower atmosphere, which is highly linked with grid-scale surface heating or cooling (Sun et al., 2021). The following analyses will evaluate the performance of other variables such as surface energy budgets, clouds and 2 m air temperature in JJA globally.
The evaluations of the latent heat flux simulation are shown in Fig. 7. In those regions with large latent heat fluxes in GLDAS (e.g., the eastern US, northern South America, eastern China), the simulated values are generally underestimated in the CTL run, while in the regions with relatively small latent fluxes (e.g., the Arabian Peninsula, the Sahara and the northwestern TP), CTL tends to overestimate values. Overall, the three simulations have similar distributions and comparable CORs. This is probably because the low accuracy of land cover data in CLM is the major culprit for those biases (Liu et al., 2021). In the regions with small correlation coefficients r (Australia, the Arabian Peninsula, the Sahara Desert) (Fig. 2a), there are no improvements noticed in the EXP_COR run even with the simulation degraded.
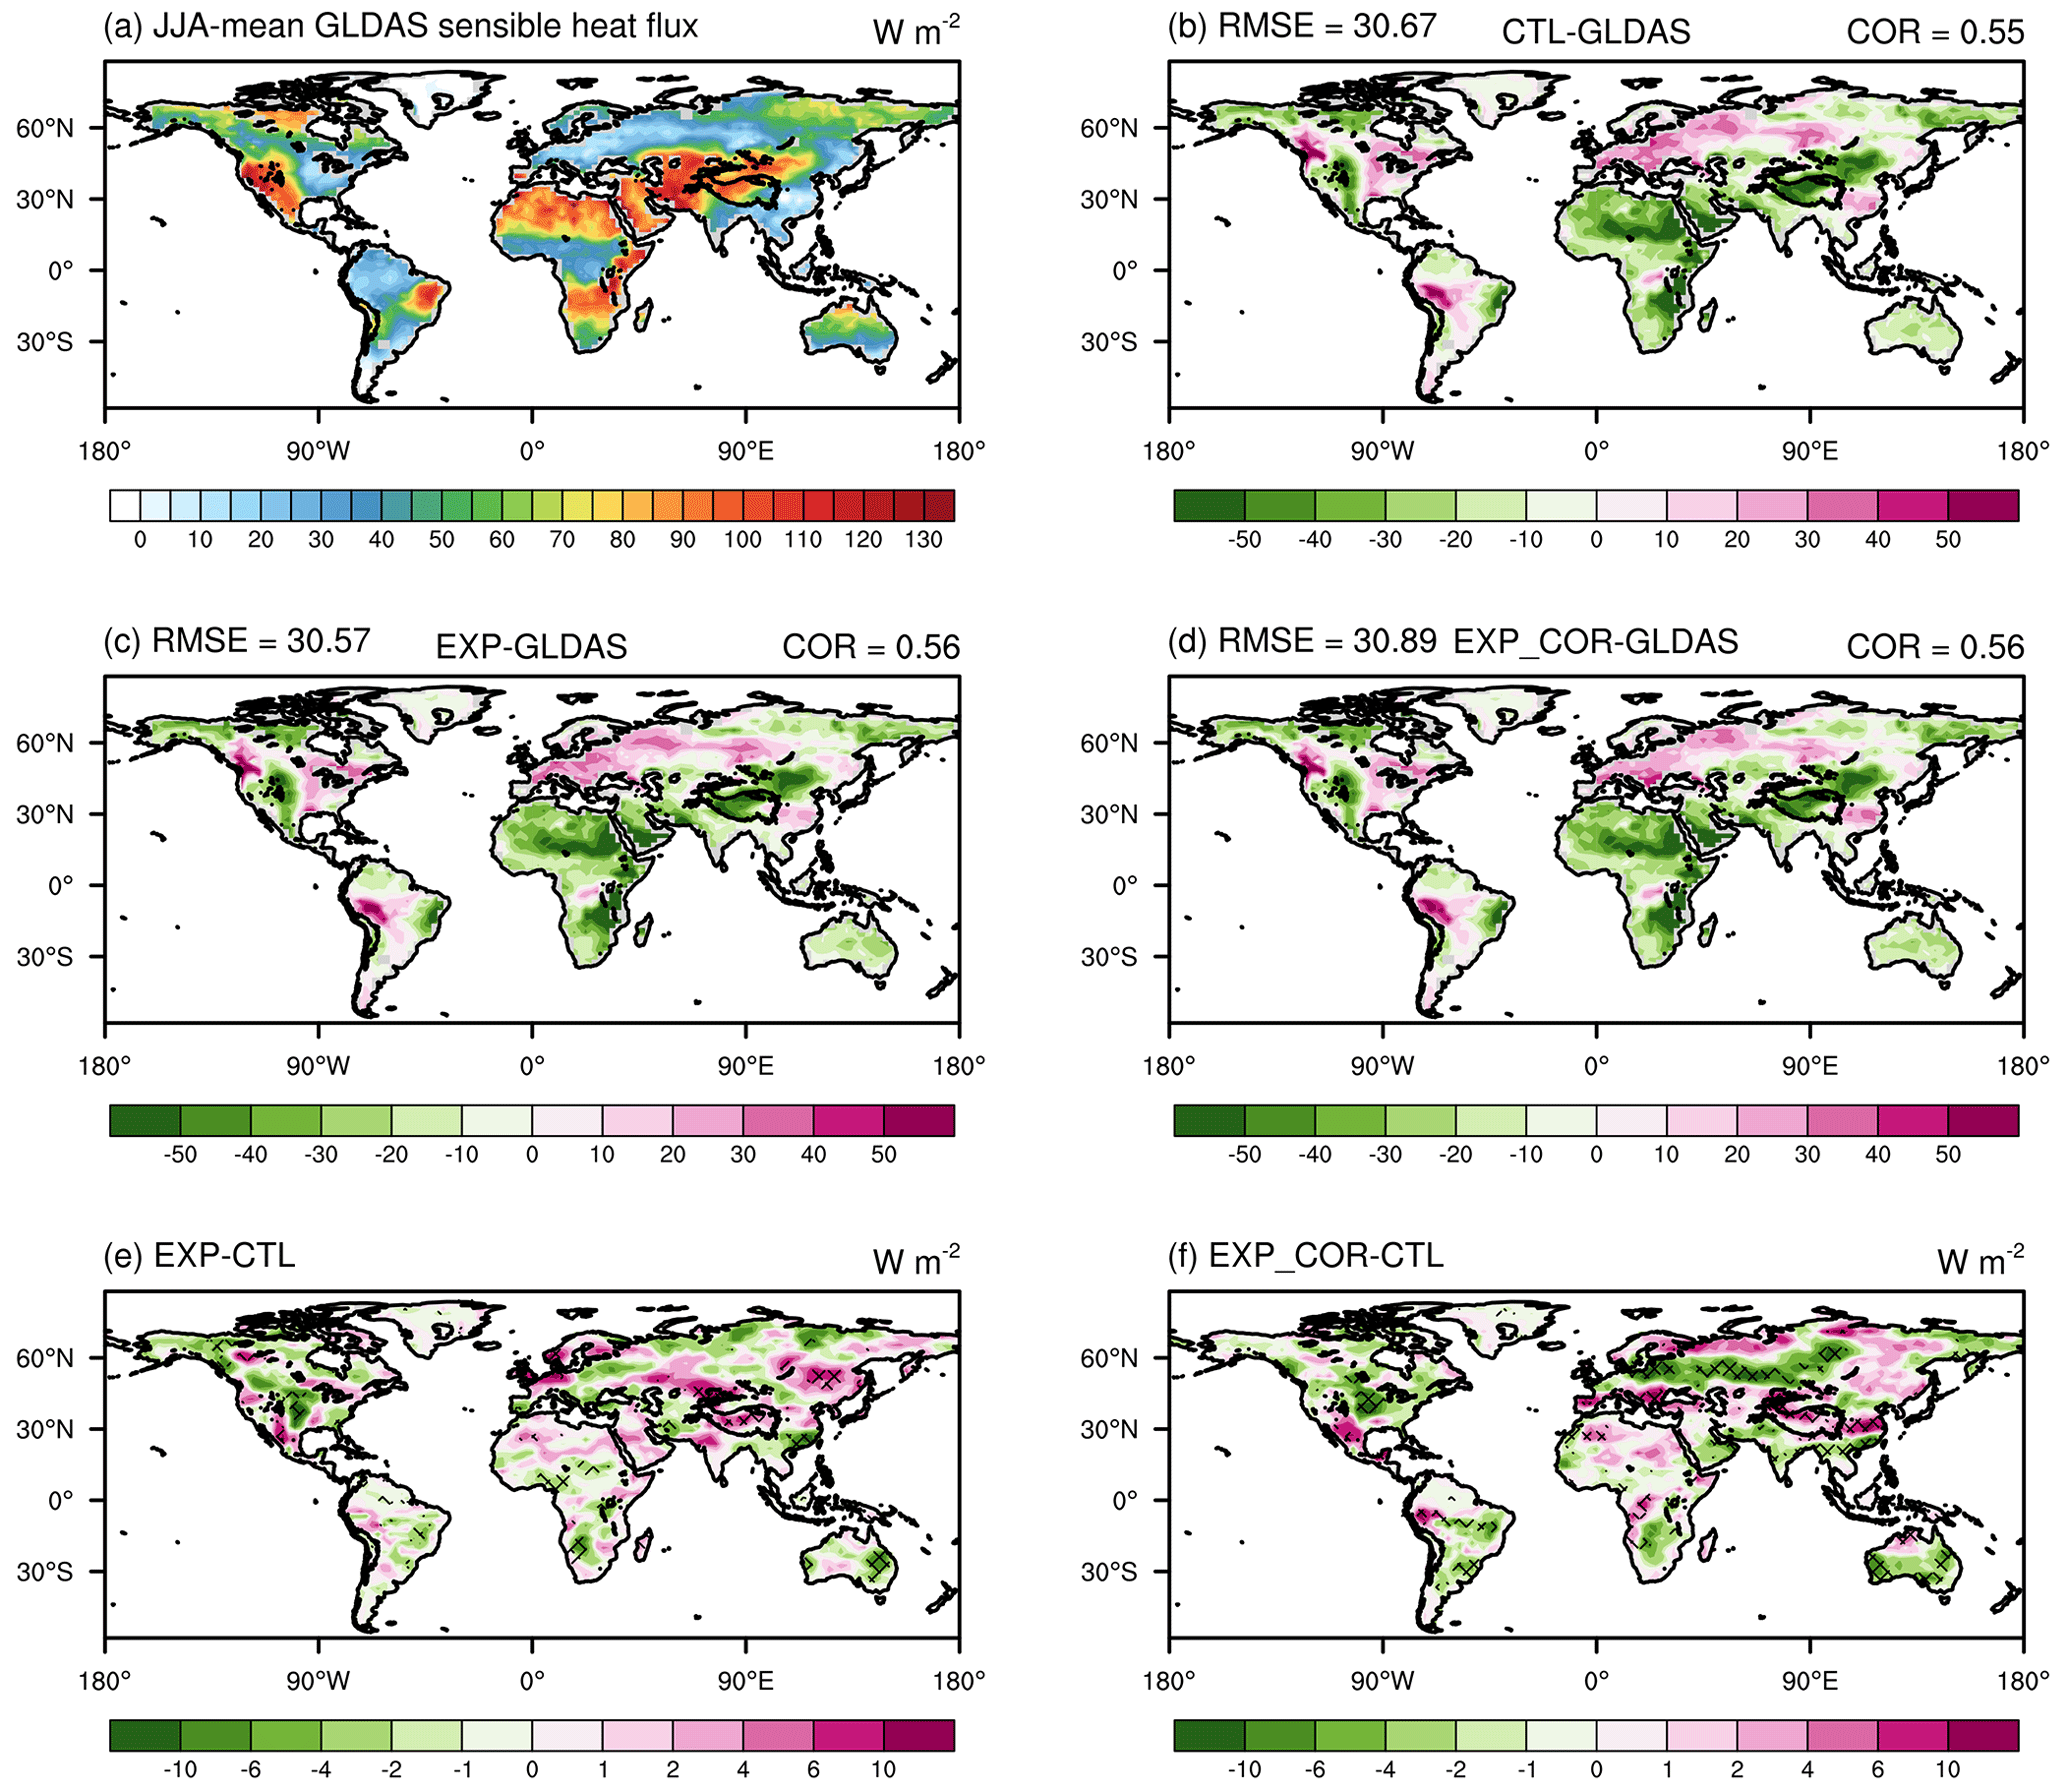
Figure 8Spatial distributions of the JJA-mean sensible heat flux in (a) GLDAS (upward positive); the biases of (b) CTL, (c) EXP, and (d) EXP_COR with respect to GLDAS; and the differences between (e) EXP and CTL and between (f) EXP_COR and CTL. The crossed areas are significant at the 95 % level. The averaged spatial COR and RMSE values for the three simulations are given in (b)–(d).
For the sensible heat flux simulation (Fig. 8) over those regions with large and small values in GLDAS, the CTL run underestimates and overestimates them, respectively. Similar to latent heat fluxes, the three experiments resemble each other, except that EXP_COR further alleviates the overestimation along 45–60∘ N over the Eurasian continent where sensible heat fluxes and latent heat fluxes are highly correlated (Fig. 2b). The positive changes over the southern and eastern margins of the TP in the EXP_COR run are more significant than those in the EXP run (Fig. 8e and f). Nonetheless, we note some degradations from EXP to EXP_COR (e.g., over southern China).
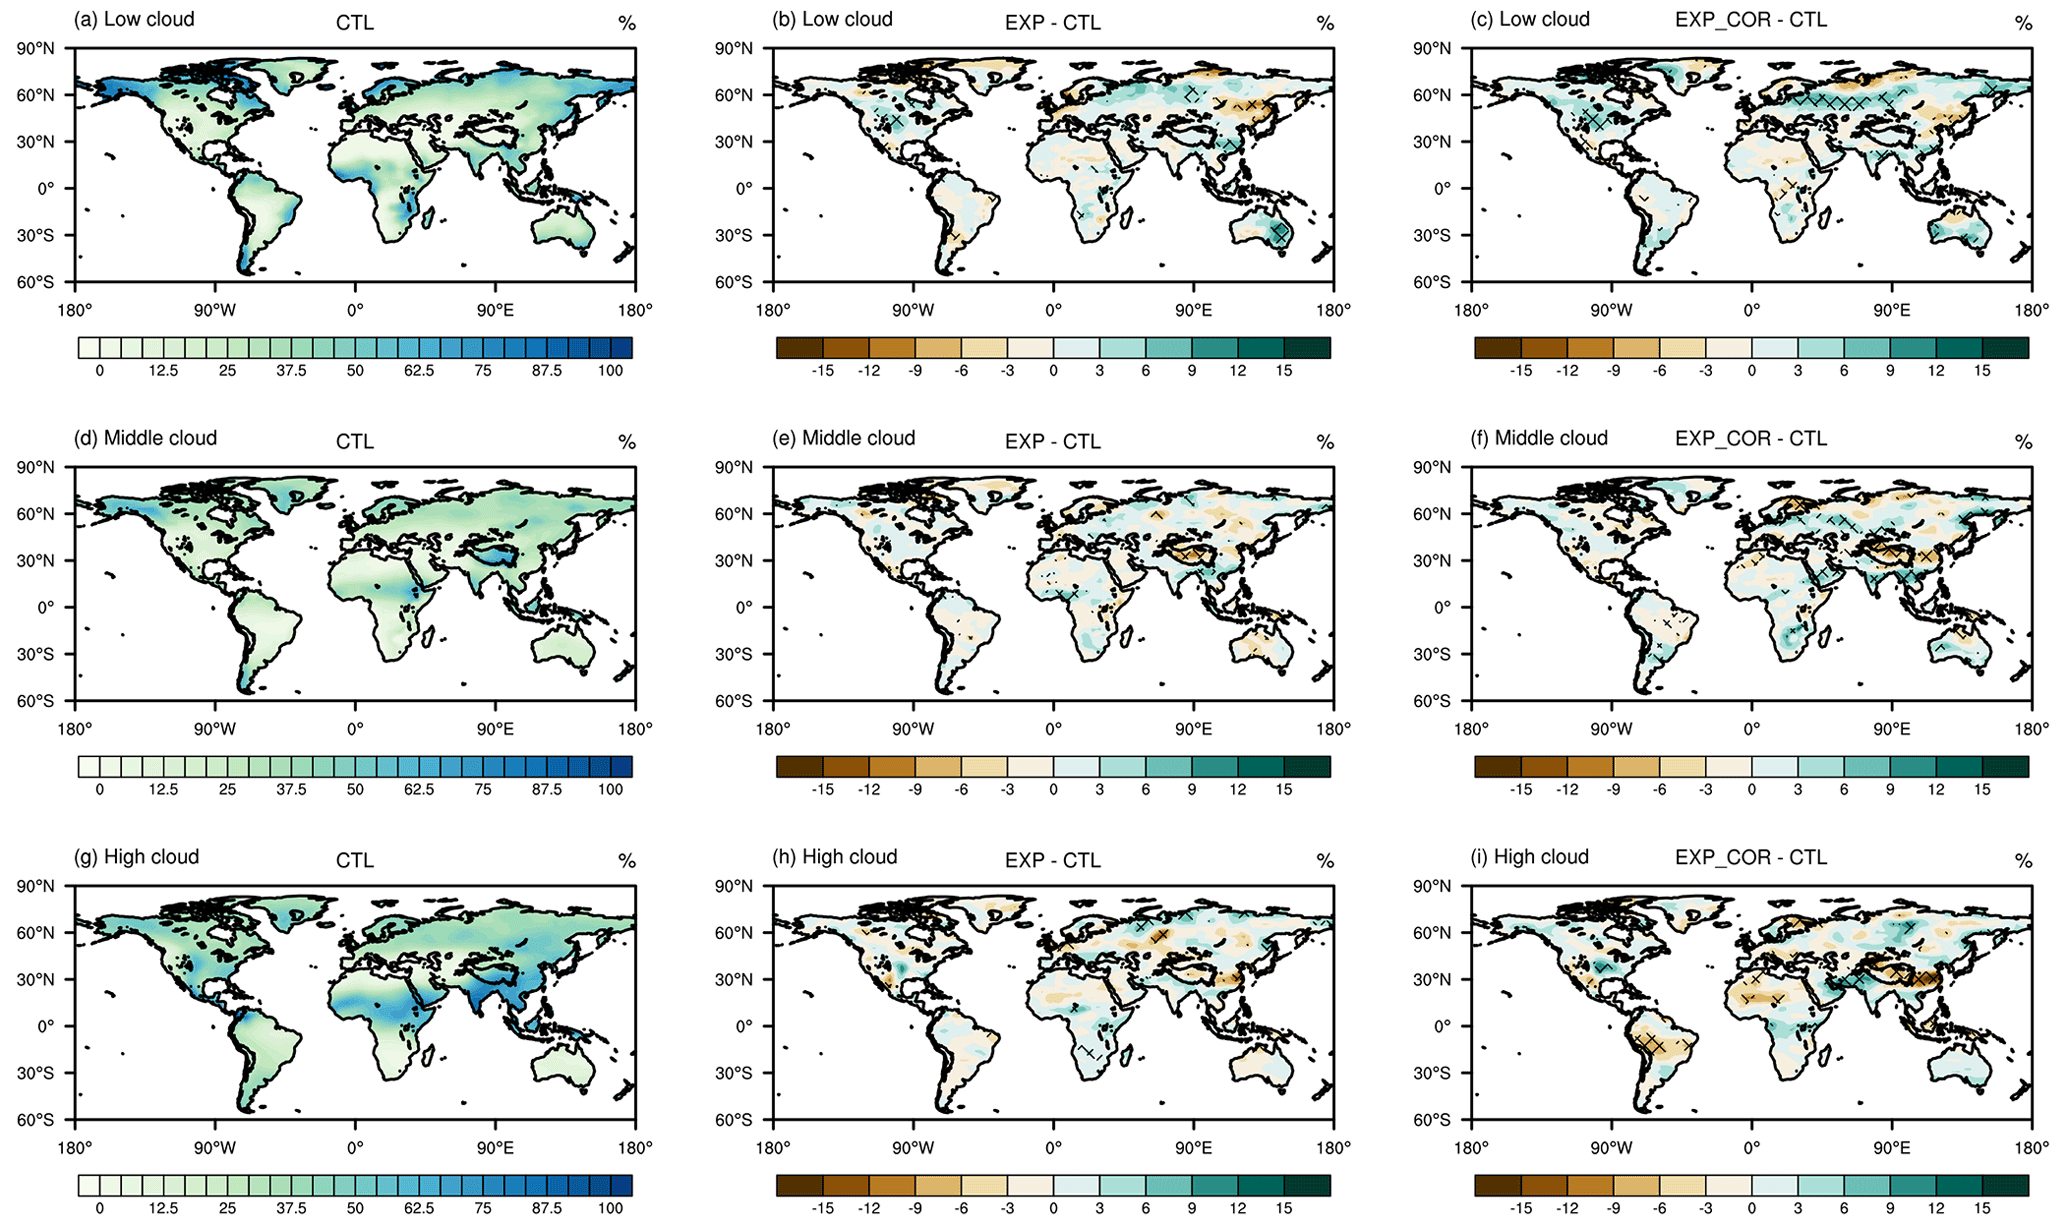
Figure 9Spatial distributions of JJA-mean (a–c) low, (d–f) middle and (g–i) high clouds in (a, d, g) the CTL run and their differences (b, e, h) between EXP and CTL and (c, f, i) between EXP_COR and CTL. The crossed areas are significant at the 95 % level.
As indicated in Sect. 3.1, large-scale atmospheric circulation in the lower atmosphere and local convection are altered as PBL heating changes, which affects clouds as well. The changes in clouds in turn influence surface radiation and thus surface heat fluxes. The cloud properties affecting cloud radiative effects include their macrostructures (e.g., fraction, top and base heights, and vertical overlap) and microphysical properties (e.g., particle size distribution and geometric configuration, cloud phase, and water condensation). As shown in Fig. 9c, the EXP_COR run reduces low clouds over northern China and southeastern Russia and increases them over southern China and along 45–60∘ N in comparison with the CTL run. The EXP run has a similar pattern of changes but with smaller magnitudes compared with the EXP_COR run (Fig. 9a–c). Low clouds reflect a large amount of incoming solar radiation and emit longwave radiation at relatively high temperatures, so they exert an overall net cooling effect on the Earth (Klein and Hartmann, 1993; Hartmann, 1994). Compared with the CTL run, the middle and high clouds on the TP are dramatically decreased in the EXP_COR run. Especially for high clouds, the decrease in the EXP_COR run is much larger than that in the EXP run.
The simulations of the total cloud water path (vertically integrated cloud liquid and ice water content, CWP) are shown in Fig. 10d–f. A higher cloud water content reflects more solar radiation. The EXP run increases the total CWP over southern China and along the Bay of Bengal. Northern China, the TP and southeastern Russia feature CWP decreases. In the EXP_COR run, the simulated CWP is further decreased on the TP and over northern China, while it is increased in southern China and along 45–60∘ N, especially over the Eurasian continent. The spatial distribution of the total ice water path (IWP) changes resembles that of the total CWP changes (Fig. 10g–i).
Generally, the radiative effect of clouds is quantified by cloud radiative forcing (CRF) (the difference in the surface net flux between all-sky and clear-sky conditions). It includes shortwave cloud forcing (SWCF) and longwave cloud forcing (LWCF). Realistic simulation of the CRF is another important measure of the performance of climate models (Sun et al., 2016). SWCF is negative, and a smaller value indicates a stronger reflection of solar shortwave radiation. The strengthened SWCF over the central US, the Eurasian continent along 45–60∘ N and southern China in EXP_COR (Fig. 10c) originates from the increased cloud water (Fig. 10f) and low clouds (Fig. 9c). Similarly, the decreased SWCF over northern China, the TP and southeastern Russia is due to their reductions. LWCF is positive, and a larger value means a stronger warming effect on the land surface. The LWCF increases over southern China and decreases over northern China in EXP_COR (figure not shown). The distribution of the net CRF (figure not shown) resembles that of the SWCF, which implies that the SWCF changes dominate the CRF variations.
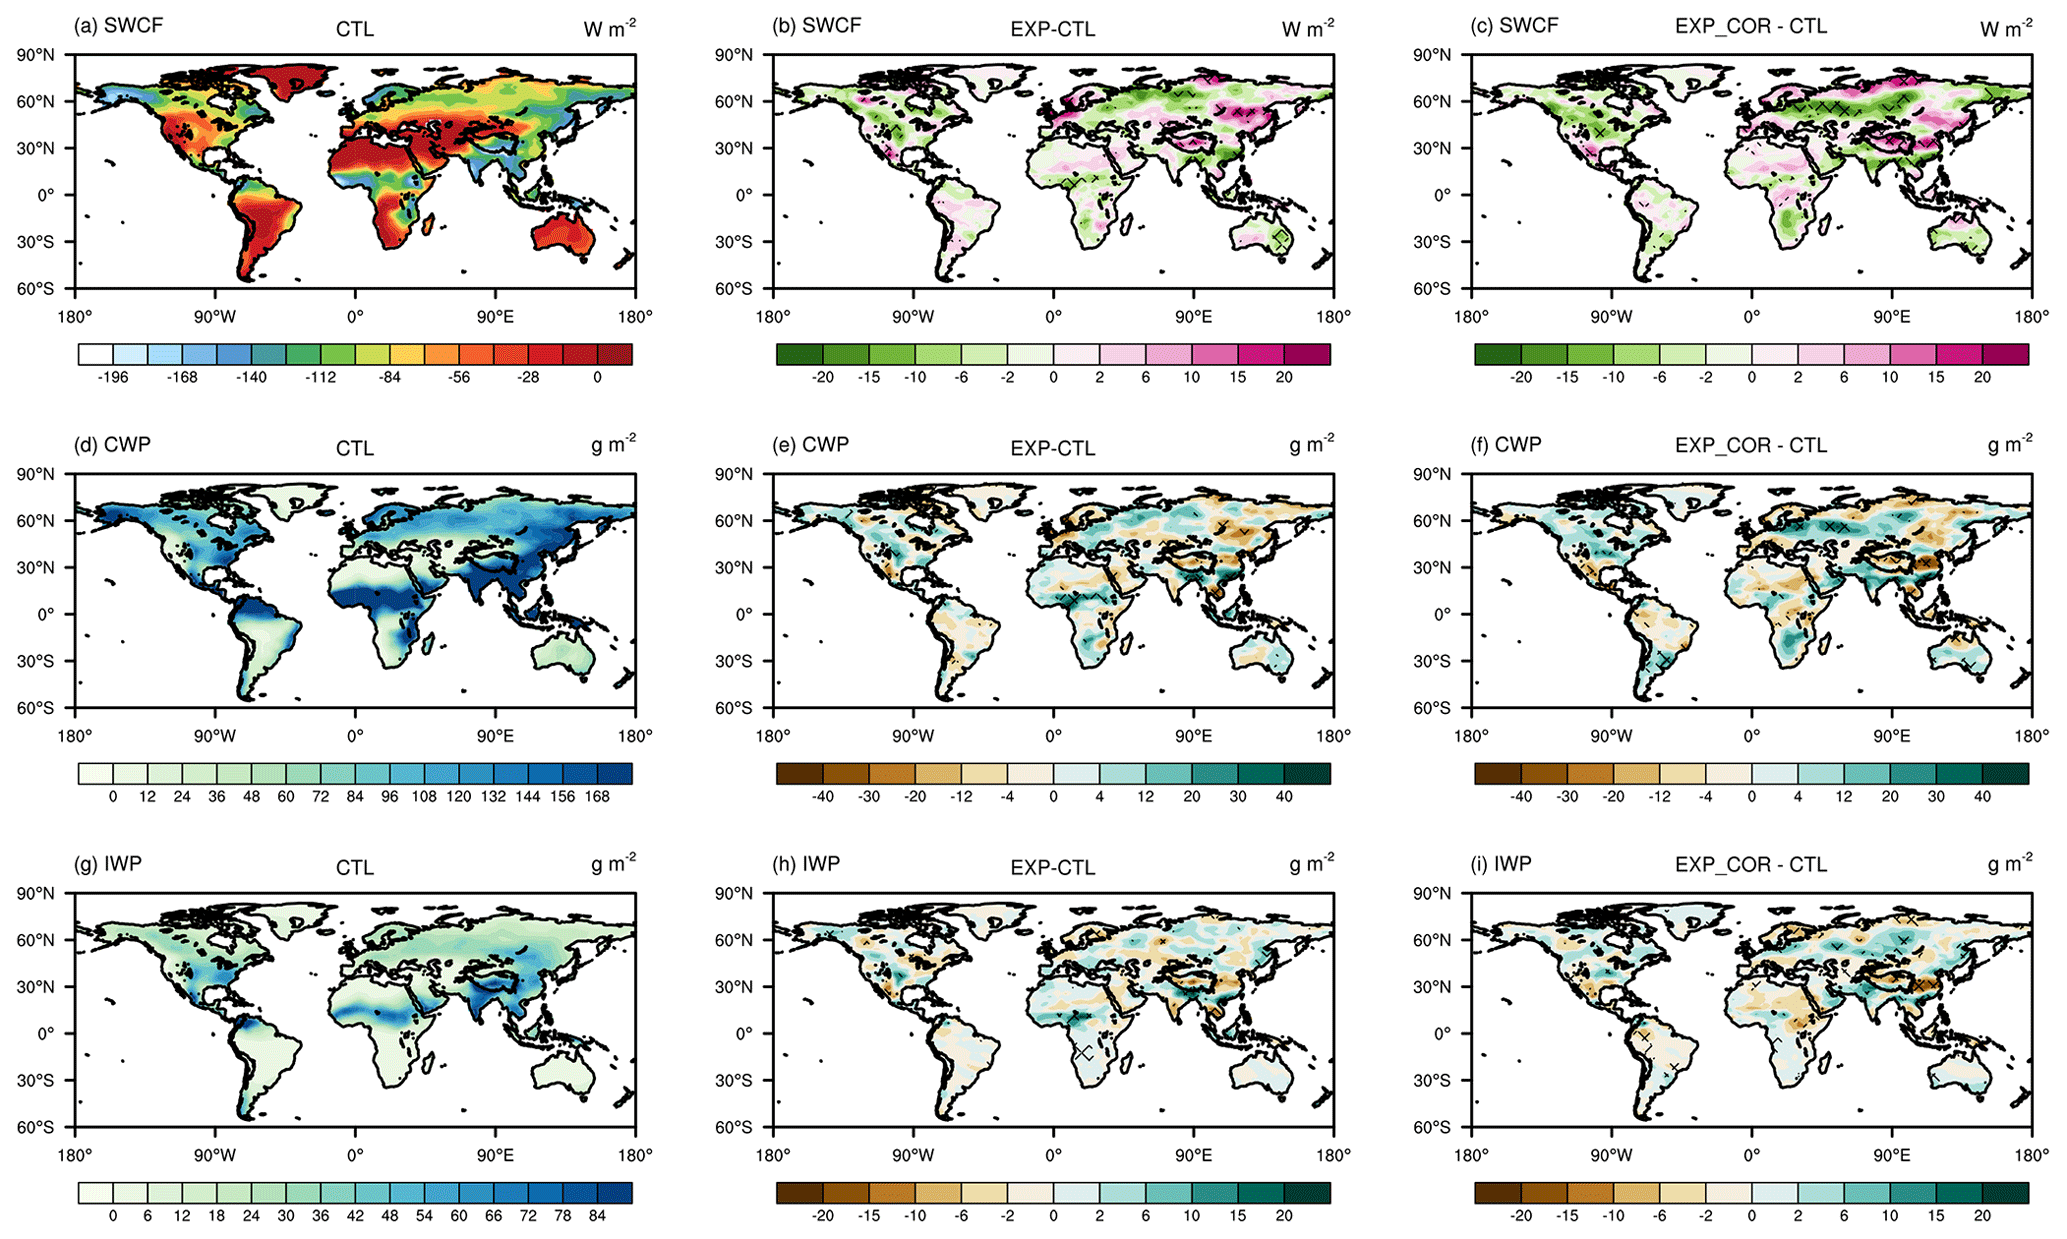
Figure 10The same as Fig. 9 but for (a–c) shortwave cloud radiative forcing (W m−2), (d–f) total cloud water path (g m−2) and (h–k) ice water path (g m−2).
The simulation of the net surface shortwave flux is demonstrated in Fig. 11. Globally, the RMSE and COR values are similar to each other in the three simulations. In the EXP_COR run, the underestimation over the TP in both the CTL and EXP runs is alleviated, although it slightly degrades the simulation over eastern China. The negative biases over southeastern Russia in EXP_COR are also larger than those in EXP. The changes in the net surface shortwave flux (Fig. 11e and f) are very consistent with those in SWCF (Fig. 10b and c) implying that the net surface radiation fluxes are mainly controlled by the shortwave radiation reflected by the adjustment of clouds as a result of the altered PBL heating rates and the associated changes in local convection.
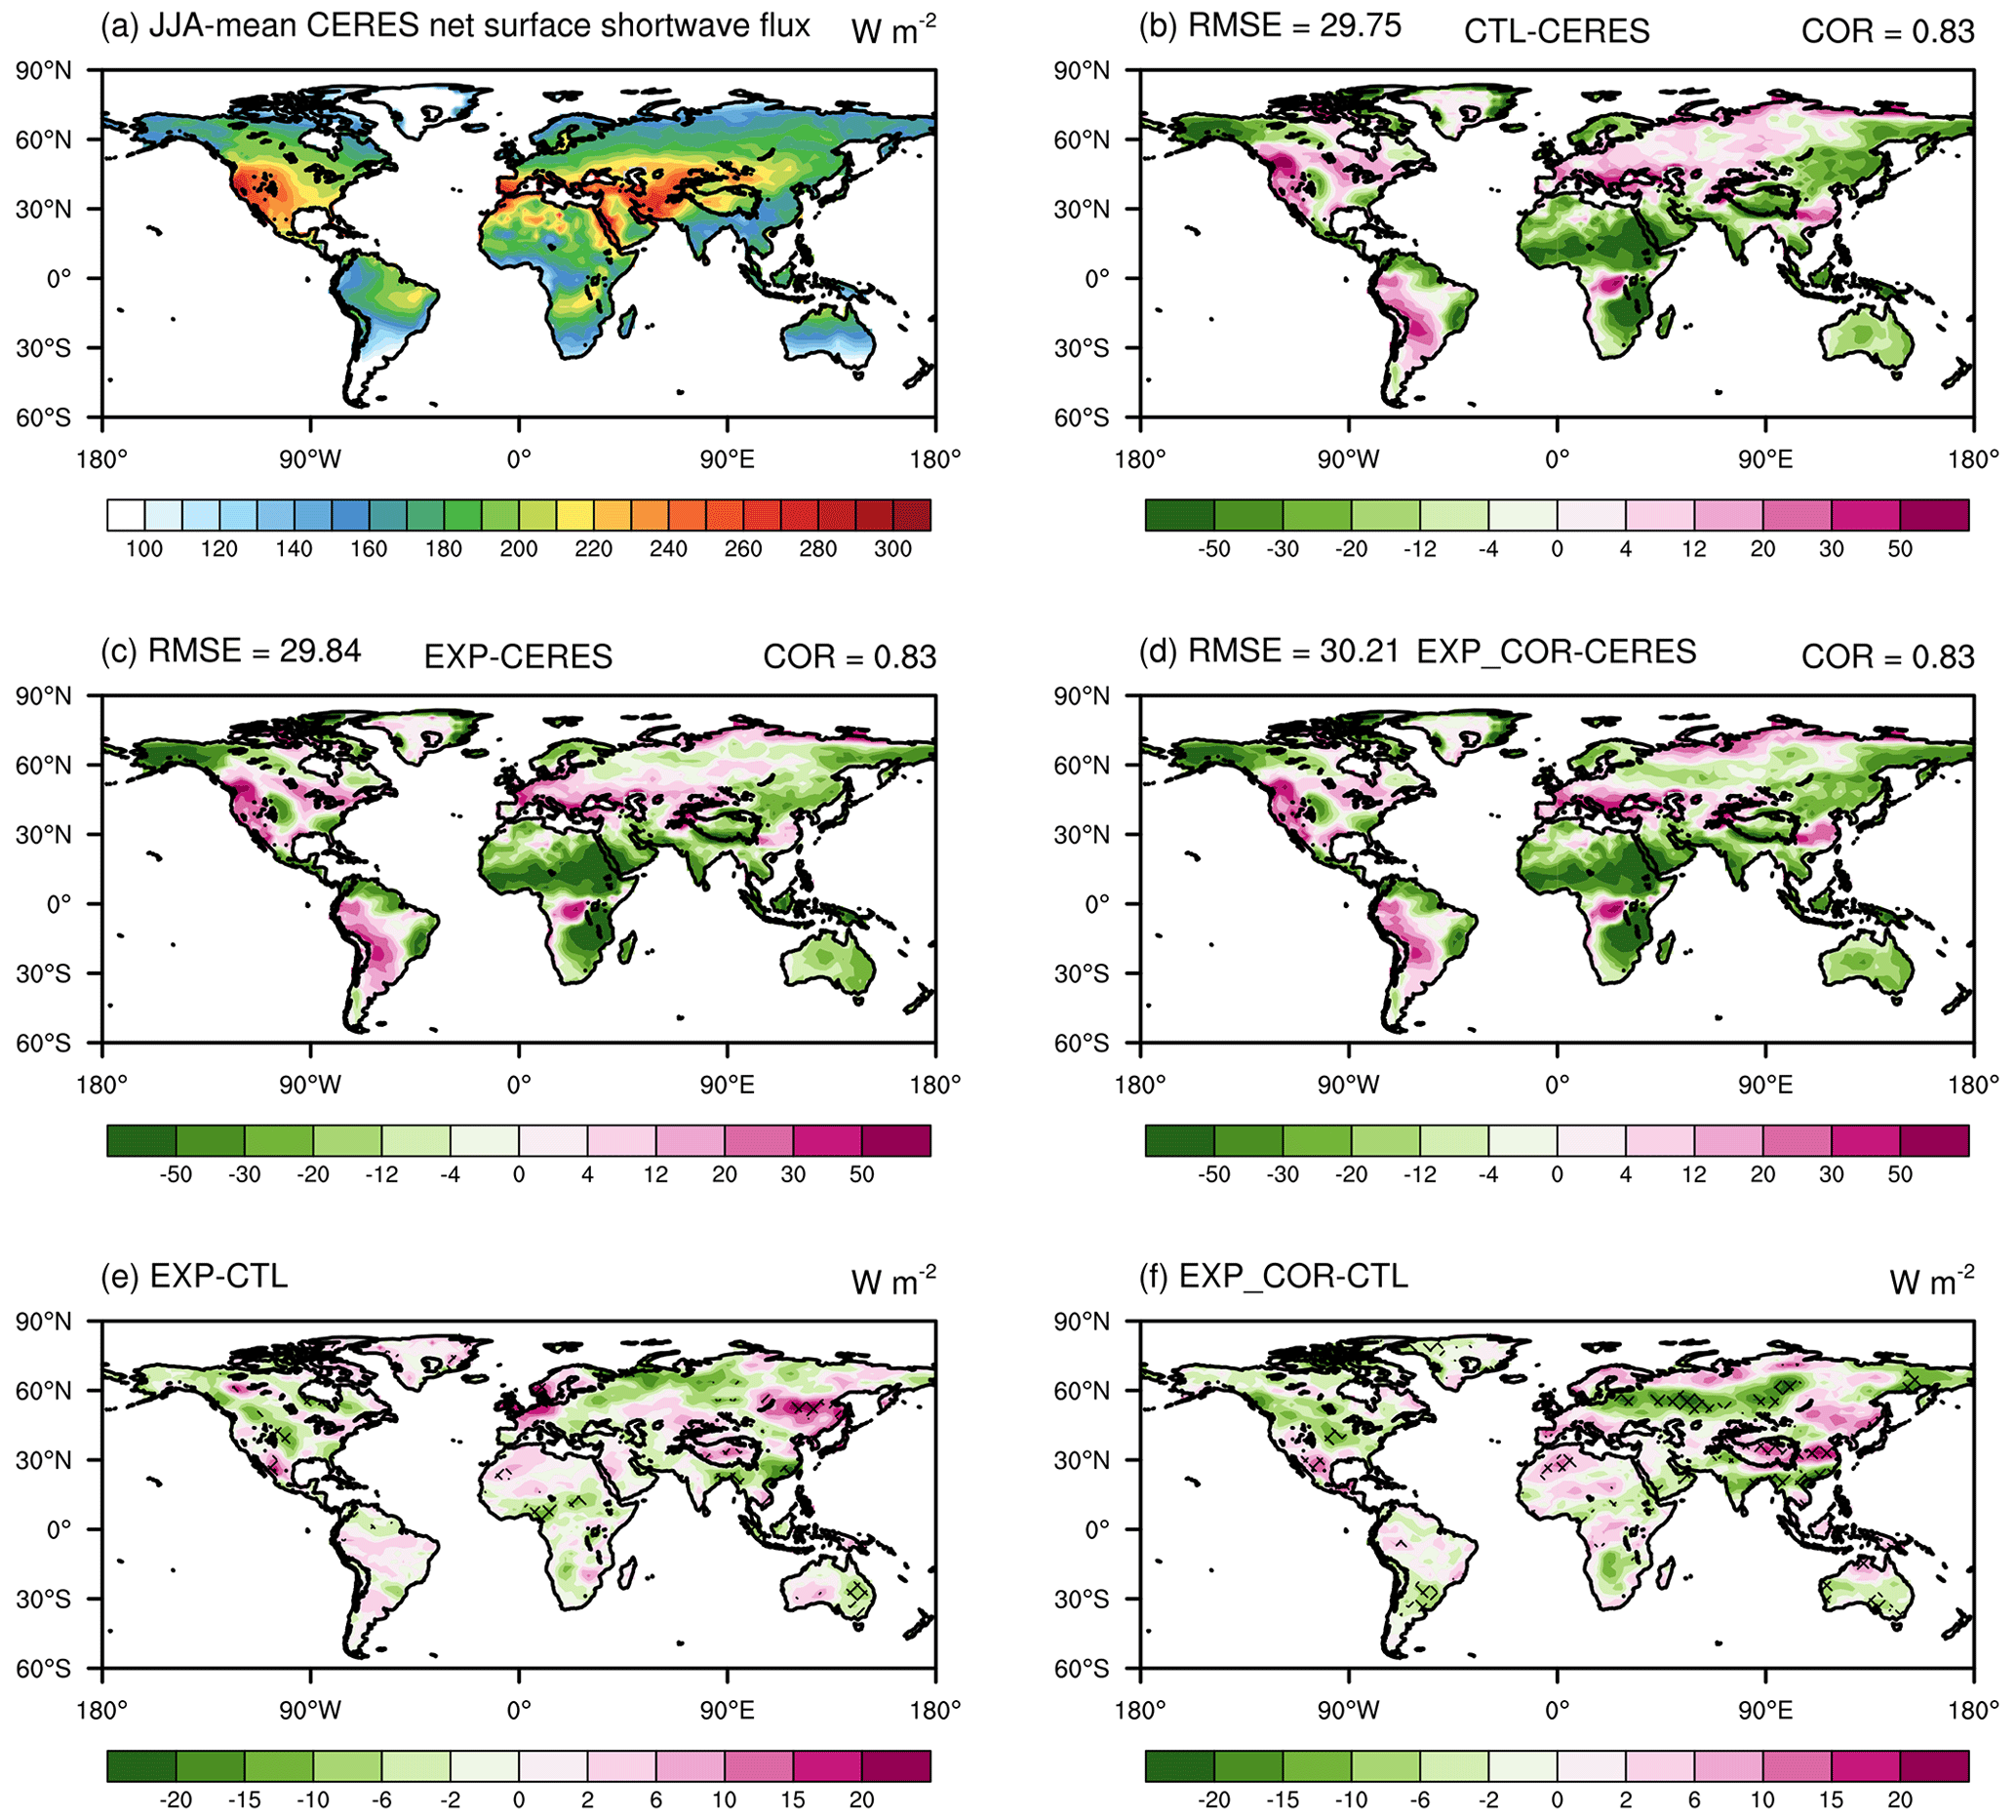
Figure 11Spatial distributions of the JJA-mean net surface shortwave flux in (a) CERES-EBAF (downward positive); the biases of (b) CTL, (c) EXP, and (d) EXP_COR with respect to CERES-EBAF; and the differences (e) between EXP and CTL and (f) between EXP_COR and CTL. The crossed areas are significant at the 95 % level. The averaged spatial COR and RMSE values for the three simulations are given in (b)–(d).
In response to the adjustment of the surface energy budget, the global distributions of JJA mean 2 m air temperature from CRU and the difference between the observations and the three experiments are shown in Fig. 12. The three simulations have comparable CORs and RMSEs globally. Compared with the CTL run, the EXP run alleviates the overestimations in the middle and high latitudes, although the performance over central Africa and northern South America is slightly degraded (Fig. 12b, c and e). In the EXP_COR run, the overestimations over the central US and the Eurasian continent are further alleviated, while the negative biases over central Africa and the positive biases over southern South America are worsened (Fig. 12b, d and f). The simulated 2 m air temperature over northern China and the TP is increased, reintroducing some positive biases. In short, in the EXP_COR run the decreased net surface shortwave flux associated with the increases in low clouds and cloud water content over southern China, over the central US, over the Eurasian continent along 45–60∘ N and along the Bay of Bengal might contribute to local cooling, while the warming over the TP and northern China is attributed to the opposite changes accordingly (Figs. 9–11).

Figure 12Spatial distributions of the JJA-mean 2 m temperature in (a) CRU, the biases of (b) CTL, (c) EXP and (d) EXP_COR with respect to CRU. The differences (e) between EXP and CTL and (f) between EXP_COR and CTL are also shown. The crossed areas are significant at the 95 % level. The averaged spatial COR and RMSE values for the three simulations are given in (b)–(d).
3.3 Mean states
The analyses presented above demonstrate that the introduction of the subgrid heat flux schemes (EXP and EXP_COR) improves the simulations of summer precipitation in eastern China in EXP and additional TP regions in EXP_COR compared to the default model. The improvements and degradations in simulated surface heat fluxes, cloud properties and 2 m air temperature in boreal summer at the global scale are also discussed. The precipitation improvements over eastern China are mainly from the consideration of subgrid variations in surface heat fluxes (i.e., the EXP run where the sampled subgrid sensible and latent heat fluxes are stochastically paired with each other), while the improved precipitation simulations on the southern and eastern margins of the TP are attributed to the further inclusion of the partitioning of the subgrid surface heat fluxes (the EXP_COR run). A thorough evaluation of the global annual and seasonal means of those variables is necessary because from the perspective of climate model development, the incorporation of a new parameterization scheme to improve some aspects should not obviously cause the degradation of other aspects (Wang et al., 2021b). As presented in Table 1 (global distributions shown in Figs. S3–S9), the overall simulation statistics of the EXP and EXP_COR runs are comparable to those of the CTL run, although they are slightly different in some seasons. When focusing on East Asia (Table S1 in the Supplement), the new schemes outperform the default scheme, implying the importance of parameterizing the subgrid land surface heat fluxes to the atmosphere in GCMs in regions with complex terrain (e.g., the TP) and multiple surface types (e.g., eastern China).
Table 1The COR and RMSE values in the CTL, EXP and EXP_COR runs. MAM is for March–April–May, JJA is for June–July–August, SON is for September–October–November, and DJF is for December–January–February. The best performance among the three experiments is highlighted in bold.

The zonal means of temperature and specific humidity from the European Centre for Medium-Range Weather Forecasts (ECMWF) ERA-Interim reanalysis dataset and the model biases are shown in Fig. 13. In the CTL run, the temperature is overestimated at lower levels in the tropics and midlatitudes in the SH, whereas it is underestimated at higher levels in other latitudes (Fig. 13a). The EXP run reverses the positive biases to negative biases with an excessive reduction at lower levels, and the negative biases at higher altitudes are further exacerbated (Figs. 13b and S10b). In contrast, the biases in the EXP_COR run are comparable to those in the CTL run (Fig. 13a and c). The low-latitude overestimations in the lower troposphere and the high-latitude underestimations across the troposphere are alleviated (Fig. S10c). In the simulation of specific humidity, the main positive biases occur in the low latitudes and midlatitudes below 400 hPa. For the midlatitudes, there are negative biases in the lower troposphere (Fig. 13d). In general, there are no significant differences among the three simulations (Fig. 13d–f). In the EXP run, the positive biases in the lower and middle troposphere are alleviated (Fig. S10e). In contrast, the EXP_COR run is similar to the CTL run, with negligible differences (Fig. S10f). In summary, the performance of the mean state simulations does not change significantly when using the two modified schemes (the EXP and EXP_COR runs).
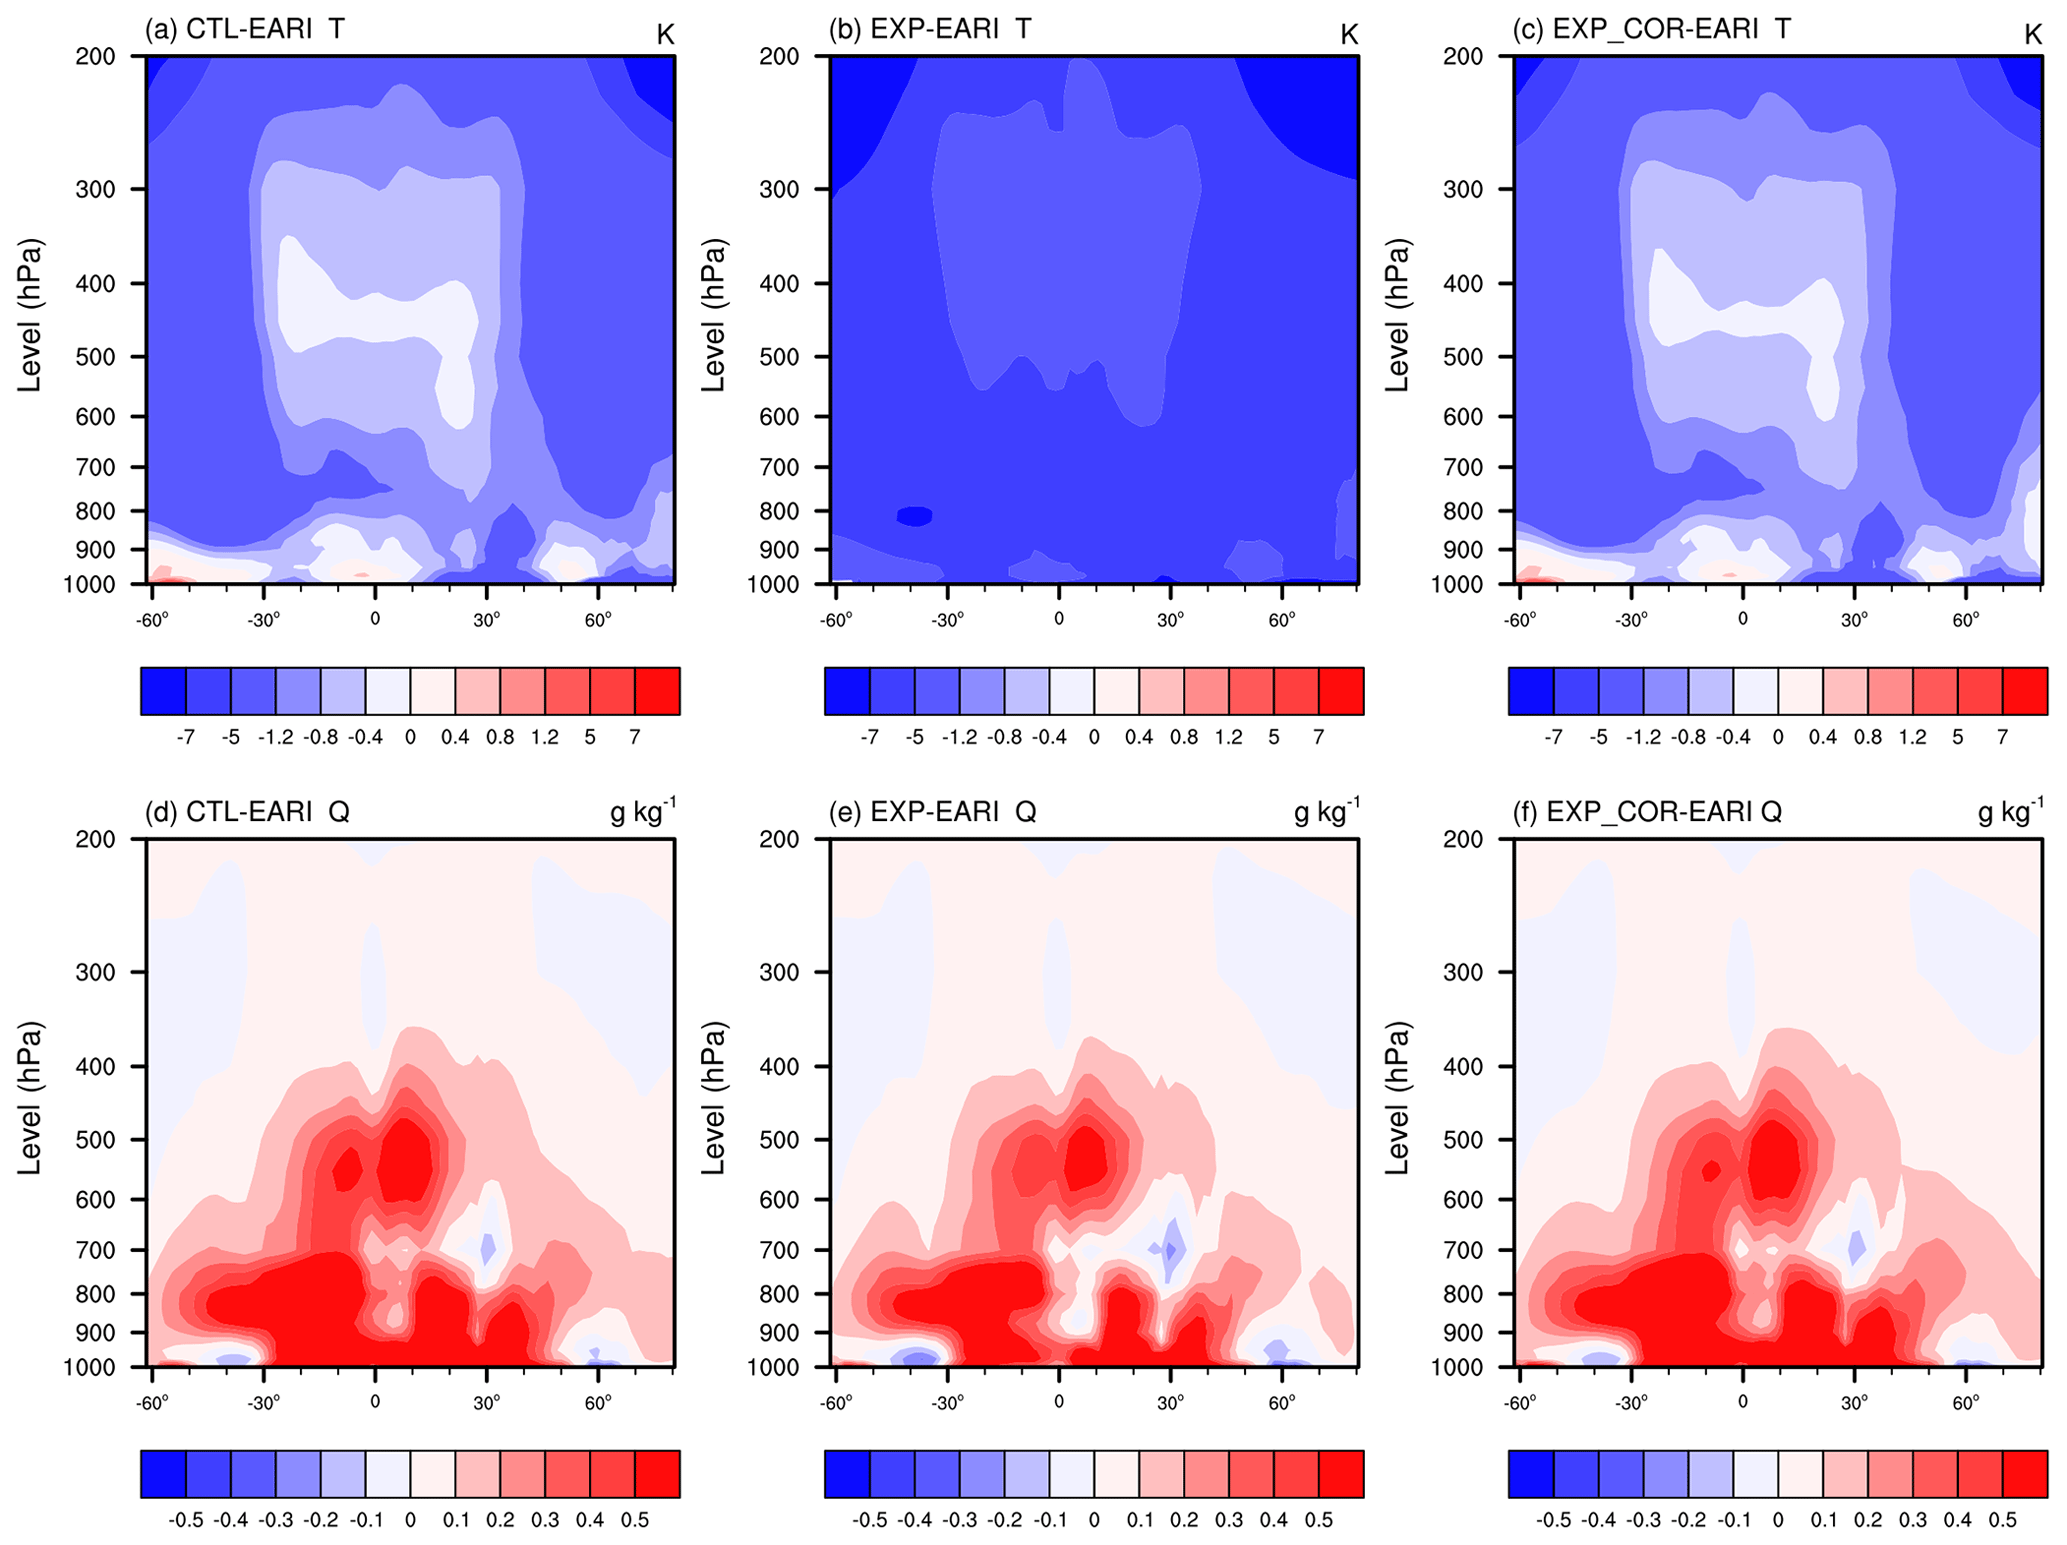
Figure 13Annual and zonal mean cross sections of the (a–c) temperature and (d–f) specific humidity differences for (a, d) CTL-ERAI, (b, e) EXP-ERAI and (c, f) EXP_COR-ERAI.
Despite the uncertainties in the observations, the overestimated rainfall on the southern and eastern margins of the Tibetan Plateau in the GCMs is widely acknowledged when comparing multisource observations (Mehran et al., 2014; Yu et al., 2015). The uncertainties for the evaluations of other modeled variables are discussed below. The CERES-EBAF datasets provide long-term global Earth radiation budget records from the surface to the top of the atmosphere (TOA) together with the associated cloud and aerosol properties. Extensive validation has been conducted for both TOA and surface radiation in CERES-EBAF using TOA consistency tests and direct comparisons of surface fluxes with ground-based measurements over both land and ocean (Loeb et al., 2007, 2012). Although some weaknesses are noted (e.g., LW cloud radiative effects at the surface on the TP are overestimated due to poor sampling of clear sky scenes during the night), they are widely used for climate model evaluations (Loeb et al., 2018; Hinkelman, 2019), and this flaw does not affect the conclusions in this study. For surface sensible and latent heat fluxes, there are few observations covering the whole TP. Instead, among various reanalysis datasets, GLDAS has been evaluated and investigated extensively (Novick et al., 2018; Sun et al., 2018; Laloyaux et al., 2016). For instance, Jiménez et al. (2011) conducted a global intercomparison of monthly mean land surface heat flux products, including space-based observations and reanalyses including GLDAS. They demonstrated that the spatial distributions related to the major climatic regimes and geographical features are well reproduced by GLDAS. With comprehensive validations, the GLDAS product has been widely used in evaluating model-based studies (Saha et al., 2014; Xia et al., 2019), such as water resource management (Zaitchik et al., 2010) and drought monitoring and prediction (Hao et al., 2016). The CRU gridded dataset for 2 m air temperature has undergone a series of technical validations, such as quality control of input data, comparisons between versions and with alternative datasets, and cross-validation of the interpolated anomalies (Osborn et al., 2017; Harris et al., 2020).
In addition to subgrid variation and partitioning of surface heat fluxes, other factors can impact the precipitation simulation on the TP as well. For instance, subgrid topographic effects have large effects on latent heat and sensible heat fluxes. Parameterizing them in GCMs influences the simulated surface energy balance, boundary conditions and precipitation on the TP (Lee et al., 2019; Hao et al., 2021, 2022). Alternatively, the accurate representation of land cover types and soil properties is vital to the realistic simulation of surface radiative fluxes and heat fluxes and thus TP rainfall (Liu et al., 2021; Yue et al., 2021).
With 208 CPU cores in total for each simulation, the total run time per step (∼ 0.50 s) in the EXP_COR run is almost twice that in the CTL run (∼ 0.26 s) as a result of calling the PBL and convective parameterizations 16 times and the resulting extra communication cost (Table S2). However, compared with the additional computational costs of the four-mode version of the Modal Aerosol Module (MAM4) updated from MAM3 and the Cloud Layers Unified by Binormals (CLUBB) scheme, instead of the CAM5 boundary layer turbulence, shallow convection, and cloud macrophysics schemes, respectively, in CESM2 (CESM version 2), the increased computational cost in EXP_COR relative to CTL is much smaller and thus acceptable. Given the heavy computational cost of CLUBB, this could be challenging for computational efficiency if using this scheme in CESM2. Therefore, further improvements are needed. For example, according to the number of PFTs in each grid cell, the number of multiple calls (up to 16) of the CLUBB can be varied in different grid cells. Alternatively, this can be done only when the number of PFTs is larger than a threshold. In the meantime, parallel optimization should be applied to multiple calls.
The GCM used to test the schemes is CESM1.2, in which the land model is CLM4. Similar to CLM4, CLM5 (CLM version 5) in CESM2 and other land surface models in the GCMs use the PFT structure as well. Additionally, the parameterization of subgrid heat fluxes proposed in this study is not dependent on the specific parameterizations of the PBL and convection processes. Therefore, it is conveniently applied to other GCMs.
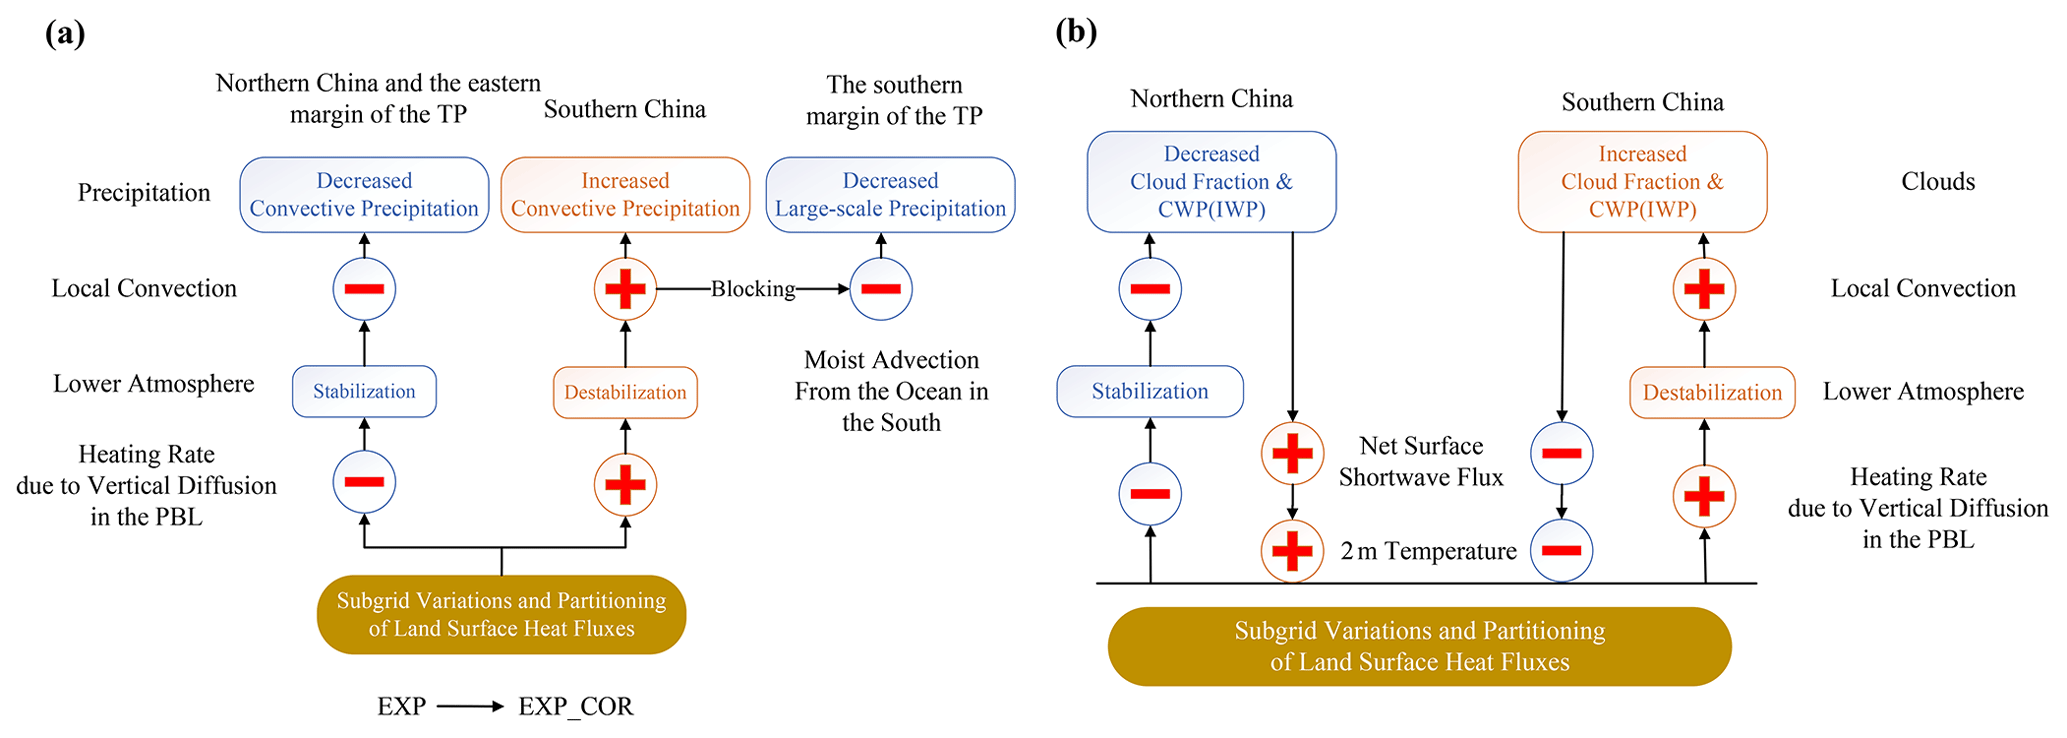
Figure 14Schematic diagram summarizing the climate impacts of parameterizing subgrid variations and partitioning of land surface heat fluxes to the atmosphere.
In this study, a parameterization of the subgrid variations and partitioning of the land surface heat fluxes to the atmosphere was developed and implemented in the NCAR CESM1.2. The modification to the Sun et al. (2021) scheme is based on the fact that energy redistribution between the land surface and the PBL plays an essential role in global and regional energy cycles (Liu et al., 2014; Chakraborty and Lee, 2019; Wei et al., 2021). Three experiments were conducted to evaluate the updated scheme (CTL, EXP and EXP_COR). The precipitation improvements over eastern China using the original scheme (EXP) are retained in the new scheme (EXP_COR), although slight dry biases are reintroduced over southern China. In addition, the stubborn overestimations of precipitation on the southern and eastern margins of the TP are alleviated.
The causes are briefly summarized in Fig. 14a. The subgrid variations of the land surface heat fluxes increase (decrease) PBL heating over southern (northern) China. With the further introduction of the partitioning of subgrid surface heat fluxes, the increase (decrease) in PBL heating over southern (northern) China is elevated, thus destabilizing (stabilizing) the lower atmosphere. As a result, local convection is promoted (suppressed) over southern (northern) China. The changes in convective precipitation dominate the changes in total precipitation over eastern China and the eastern margin of the TP. The altered large-scale circulation associated with the easterly anomaly along 25–30∘ N partly blocks moisture transport from the ocean in the south to the southern margin of the TP. Accordingly, the decrease in large-scale precipitation is responsible for the reduced precipitation there.
The links among clouds, net surface shortwave flux and 2 m air temperature over eastern China are shown in Fig. 14b. As PBL heating decreases in northern China, the lower atmosphere stabilizes and local convection is suppressed. Accordingly, middle and high clouds and the associated CWP decrease (Figs. 9 and 10). Thus, SWCF decreases over northern China, which increases the net surface shortwave flux. As the surface gains more energy, the near-surface air temperature warms. In contrast, southern China features the opposite changes.
The Sun et al. (2021) scheme offers a novel method of parametrizing the subgrid heterogeneity of surface heat fluxes to the atmosphere in GCMs. As a further modification, the significance of the correlation coefficients between the subgrid-scale sensible and latent heat fluxes is considered for a more realistic interpretation of the energy exchange processes. The findings of these two studies highlight the importance of the energy variation and redistribution between the land surface and the lower atmosphere at the subgrid scale.
The CESM1.2.1–CAM5.3 source code can be downloaded through the official CESM website https://www.cesm.ucar.edu/models/cesm1.2/cesm/doc/usersguide/x290.html#download_ccsm_code (CESM Soft Engineering Group, 2022). The modified CESM code and the CAM5 output for all simulations in the study are both provided in an open repository on Zenodo (https://doi.org/10.5281/zenodo.6606418, Yin et al., 2022). The TRMM data are available from https://gpm.nasa.gov/data/directory (Huffman et al., 2014). The MERRA-2 data files are available from https://doi.org/10.5067/2E096JV59PK7 (GMAO, 2015a) and https://doi.org/10.5067/0JRLVL8YV2Y4 (GMAO, 2015b). The CERES EBAF data are available from https://climatedataguide.ucar.edu/climate-data/ceres-ebaf-clouds-and-earths-radiant-energy-systems-ceres-energy-balanced-and-filled (Loeb et al., 2012). The GLDAS-2.1 data are available from https://doi.org/10.5067/LWTYSMP3VM5Z (Beaudoing et al., 2020). The CRU data are available from https://crudata.uea.ac.uk/cru/data/hrg/?_ga=2.162163900.162961233.1636977076-620633058.1635581908 (Harris et al., 2020).
The supplement related to this article is available online at: https://doi.org/10.5194/gmd-16-135-2023-supplement.
YW conceived the idea. WS developed the model code. WS and YH conducted the model simulations. MY and YW performed the analysis. MY and YW interpreted the results and wrote the paper. MY, YW and YH revised the manuscript. All authors participated in the discussion of the paper.
The contact author has declared that none of the authors has any competing interests.
Publisher's note: Copernicus Publications remains neutral with regard to jurisdictional claims in published maps and institutional affiliations.
Yong Wang is supported by the National Natural Science Foundation of China (grant no. 41975126), the National Key Research and Development Program of China (grant no. 2022YFF0802002), and the Tsinghua University Initiative Scientific Research Program (grant no. 20223080041). We thank the two reviewers for their comments, which significantly improved the quality of the paper.
This research has been supported by the National Natural Science Foundation of China (grant no. 41975126), the National Key Research and Development Program of China (grant no. 2022YFF0802002), and the Tsinghua University Initiative Scientific Research Program (grant no. 20223080041).
This paper was edited by David Lawrence and reviewed by two anonymous referees.
Beaudoing, H., Rodell, M., and NASA/GSFC/HSL: GLDAS Noah Land Surface Model L4 monthly 1.0 x 1.0 degree V2.1, Greenbelt, Maryland, USA, Goddard Earth Sciences Data and Information Services Center (GES DISC) [data set], https://doi.org/10.5067/LWTYSMP3VM5Z, 2020.
CESM Software Engineering Group: CESM User’s Guide (CESM1.2 Release Series User’s Guide), https://www2.cesm.ucar.edu/models/cesm1.2/cesm/doc/usersguide/x290.html#download_ccsm_code, last access: 21 December 2022.
Chakraborty, T. and Lee, X.: Land Cover Regulates the Spatial Variability of Temperature Response to the Direct Radiative Effect of Aerosols, Geophys. Res. Lett., 46, 8995–9003, https://doi.org/10.1029/2019gl083812, 2019.
Dai, A.: Precipitation Characteristics in Eighteen Coupled Climate Models, J. Climate, 19, 4605–4630, https://doi.org/10.1175/JCLI3884.1, 2006.
Duveiller, G., Forzieri, G., Robertson, E., Li, W., Georgievski, G., Lawrence, P., Wiltshire, A., Ciais, P., Pongratz, J., Sitch, S., Arneth, A., and Cescatti, A.: Biophysics and vegetation cover change: a process-based evaluation framework for confronting land surface models with satellite observations, Earth Syst. Sci. Data, 10, 1265–1279, https://doi.org/10.5194/essd-10-1265-2018, 2018.
Findell, K. L., Gentine, P., Lintner, B. R., and Kerr, C.: Probability of afternoon precipitation in eastern United States and Mexico enhanced by high evaporation, Nat. Geosci., 4, 434–439, https://doi.org/10.1038/ngeo1174, 2011.
Forzieri, G., Duveiller, G., Georgievski, G., Li, W., Robertson, E., Kautz, M., Lawrence, P., Garcia San Martin, L., Anthoni, P., Ciais, P., Pongratz, J., Sitch, S., Wiltshire, A., Arneth, A., and Cescatti, A.: Evaluating the Interplay Between Biophysical Processes and Leaf Area Changes in Land Surface Models, J. Adv. Model Earth Sy., 10, 1102–1126, https://doi.org/10.1002/2018MS001284, 2018.
Forzieri, G., Miralles, D. G., Ciais, P., Alkama, R., Ryu, Y., Duveiller, G., Zhang, K., Robertson, E., Kautz, M., Martens, B., Jiang, C., Arneth, A., Georgievski, G., Li, W., Ceccherini, G., Anthoni, P., Lawrence, P., Wiltshire, A., Pongratz, J., Piao, S., Sitch, S., Goll, D. S., Arora, V. K., Lienert, S., Lombardozzi, D., Kato, E., Nabel, J. E. M. S., Tian, H., Friedlingstein, P., and Cescatti, A.: Increased control of vegetation on global terrestrial energy fluxes, Nat. Clim. Change, 10, 356–362, https://doi.org/10.1038/s41558-020-0717-0, 2020.
Gao, Y., Leung, L. R., Zhao, C., and Hagos, S.: Sensitivity of U.S. summer precipitation to model resolution and convective parameterizations across gray zone resolutions, J. Geophys. Res.-Atmos., 122, 2714–2733, https://doi.org/10.1002/2016jd025896, 2017.
Gelaro, R., McCarty, W., Suarez, M. J., Todling, R., Molod, A., Takacs, L., Randles, C., Darmenov, A., Bosilovich, M. G., Reichle, R., Wargan, K., Coy, L., Cullather, R., Draper, C., Akella, S., Buchard, V., Conaty, A., da Silva, A., Gu, W., Kim, G. K., Koster, R., Lucchesi, R., Merkova, D., Nielsen, J. E., Partyka, G., Pawson, S., Putman, W., Rienecker, M., Schubert, S. D., Sienkiewicz, M., and Zhao, B.: The Modern-Era Retrospective Analysis for Research and Applications, Version 2 (MERRA-2), J. Climate, 30, 5419–5454, https://doi.org/10.1175/JCLI-D-16-0758.1, 2017.
Global Modeling and Assimilation Office (GMAO): MERRA-2 instM_3d_asm_Np: 3d,Monthly mean,Instantaneous,Pressure-Level,Assimilation,Assimilated Meteorological Fields V5.12.4, Greenbelt, MD, USA, Goddard Earth Sciences Data and Information Services Center (GES DISC) [data set], https://doi.org/10.5067/2E096JV59PK7, 2015a.
Global Modeling and Assimilation Office (GMAO): MERRA-2 tavgM_2d_flx_Nx: 2d,Monthly mean,Time-Averaged,Single-Level,Assimilation,Surface Flux Diagnostics V5.12.4, Greenbelt, MD, USA, Goddard Earth Sciences Data and Information Services Center (GES DISC) [data set], https://doi.org/10.5067/0JRLVL8YV2Y4, 2015b.
Hao, D., Bisht, G., Gu, Y., Lee, W.-L., Liou, K.-N., and Leung, L. R.: A parameterization of sub-grid topographical effects on solar radiation in the E3SM Land Model (version 1.0): implementation and evaluation over the Tibetan Plateau, Geosci. Model Dev., 14, 6273–6289, https://doi.org/10.5194/gmd-14-6273-2021, 2021.
Hao, D., Bisht, G., Huang, M., Ma, P. L., Tesfa, T., Lee, W. L., Gu, Y., and Leung, L. R.: Impacts of Sub-Grid Topographic Representations on Surface Energy Balance and Boundary Conditions in the E3SM Land Model: A Case Study in Sierra Nevada, J. Adv. Model Earth Sy., 14, 4, https://doi.org/10.1029/2021ms002862, 2022.
Hao, Z., Hao, F., Xia, Y., Singh, V. P., Hong, Y., Shen, X., and Ouyang, W.: A Statistical Method for Categorical Drought Prediction Based on NLDAS-2, J. Appl. Meteorol. Clim., 55, 1049–1061, https://doi.org/10.1175/jamc-d-15-0200.1, 2016.
Harris, I., Osborn, T. J., Jones, P., and Lister, D.: Version 4 of the CRU TS monthly high-resolution gridded multivariate climate dataset, Sci. Data, 7, 109, https://doi.org/10.1038/s41597-020-0453-3, 2020.
Hartmann, D. L.: Global Physical Climatology, Academic Press, San Diego, America, 1994.
Hinkelman, L. M.: The Global Radiative Energy Budget in MERRA and MERRA-2: Evaluation with Respect to CERES EBAF Data, J. Climate, 32, 1973–1994, https://doi.org/10.1175/jcli-d-18-0445.1, 2019.
Huffman, G. J., Dan, B., Bolvin, A., Hsu, K., Joyce, R., and Xie, P.: Integrated Multi-satellitE Retrievals for GPM (IMERG), version 4.4. NASA's Precipitation Processing Center, ftp://arthurhou.pps.eosdis.nasa.gov/gpmdata/ (last access: 21 December 2022), 2014.
Jiménez, C., Prigent, C., Mueller, B., Seneviratne, S. I., McCabe, M. F., Wood, E. F., Rossow, W. B., Balsamo, G., Betts, A. K., Dirmeyer, P. A., Fisher, J. B., Jung, M., Kanamitsu, M., Reichle, R. H., Reichstein, M., Rodell, M., Sheffield, J., Tu, K., and Wang, K.: Global intercomparison of 12 land surface heat flux estimates, J. Geophys. Res., 116, D02102, https://doi.org/10.1029/2010jd014545, 2011.
Klein, S. A. and Hartmann, D. L.: The Seasonal Cycle of Low Stratiform Clouds, J. Climate, 6, 1587–1606, https://doi.org/10.1175/1520-0442(1993)006<1587:TSCOLS>2.0.CO;2, 1993.
Laloyaux, P., Balmaseda, M., Dee, D., Mogensen, K., and Janssen, P.: A coupled data assimilation system for climate reanalysis, Q. J. Roy. Meteor. Soc., 142, 65–78, https://doi.org/10.1002/qj.2629, 2016.
Lee, J. M., Zhang, Y., and Klein, S. A.: The effect of land surface heterogeneity and background wind on shallow cumulus clouds and the transition to deeper convection, J. Atmos. Sci., 76, 401–419, https://doi.org/10.1175/JAS-D-18-0196.1, 2019.
Lee, W. L., Liou, K. N., Wang, C. c., Gu, Y., Hsu, H. H., and Li, J. L. F.: Impact of 3-D Radiation-Topography Interactions on Surface Temperature and Energy Budget Over the Tibetan Plateau in Winter, J. Geophys. Res.-Atmos., 124, 1537–1549, https://doi.org/10.1029/2018jd029592, 2019.
Lee, X., Goulden, M. L., Hollinger, D. Y., Barr, A., Black, T. A., Bohrer, G., Bracho, R., Drake, B., Goldstein, A., Gu, L., Katul, G., Kolb, T., Law, B. E., Margolis, H., Meyers, T., Monson, R., Munger, W., Oren, R., Paw, U. K., Richardson, A. D., Schmid, H. P., Staebler, R., Wofsy, S., and Zhao, L.: Observed increase in local cooling effect of deforestation at higher latitudes, Nature, 479, 384–387, https://doi.org/10.1038/nature10588, 2011.
Liu, S., Chen, M., and Zhuang, Q.: Aerosol effects on global land surface energy fluxes during 2003–2010, Geophys. Res. Lett., 41, 7875–7881, https://doi.org/10.1002/2014gl061640, 2014.
Liu, S., Liu, X., Yu, L., Wang, Y., Zhang, G. J., Gong, P., Huang, W., Wang, B., Yang, M., and Cheng, Y.: Climate response to introduction of the ESA CCI land cover data to the NCAR CESM, Clim. Dynam., 56, 4109–4127, https://doi.org/10.1007/s00382-021-05690-3, 2021.
Liu, S., Wang, Y., Zhang, G. J., Wei, L., Wang, B., and Yu, L.: Contrasting influences of biogeophysical and biogeochemical impacts of historical land use on global economic inequality, Nat. Commun., 13, 2479, https://doi.org/10.1038/s41467-022-30145-6, 2022.
Loeb, N. G., Kato, S., Loukachine, K., Manalo-Smith, N., and Doelling, D. R.: Angular Distribution Models for Top-of-Atmosphere Radiative Flux Estimation from the Clouds and the Earth's Radiant Energy System Instrument on the Terra Satellite. Part II: Validation, J. Atmos. Ocean Tech., 24, 564–584, https://doi.org/10.1175/jtech1983.1, 2007.
Loeb, N. G., Lyman, J. M., Johnson, G. C., Allan, R. P., Doelling, D. R., Wong, T., Soden, B. J., and Stephens, G. L.: Observed changes in top-of-the-atmosphere radiation and upper-ocean heating consistent within uncertainty, Nat. Geosci., 5, 110–113, https://doi.org/10.1038/ngeo1375, 2012.
Loeb, N. G., Doelling, D. R., Wang, H., Su, W., Nguyen, C., Corbett, J. G., Liang, L., Mitrescu, C., Rose, F. G., and Kato, S.: Clouds and the Earth's Radiant Energy System (CERES) Energy Balanced and Filled (EBAF) Top-of-Atmosphere (TOA) Edition-4.0 Data Product, J. Climate, 31, 895–918, https://doi.org/10.1175/jcli-d-17-0208.1, 2018.
Lothon, M., Campistron, B., Chong, M., Couvreux, F., Guichard, F., Rio, C., and Williams, E.: Life Cycle of a Mesoscale Circular Gust Front Observed by a C-Band Doppler Radar in West Africa, Mon. Weather Rev., 139, 1370–1388, https://doi.org/10.1175/2010MWR3480.1, 2011.
Lun, Y., Liu, L., Cheng, L., Li, X., Li, H., and Xu, Z.: Assessment of GCMs simulation performance for precipitation and temperature from CMIP5 to CMIP6 over the Tibetan Plateau, Int. J. Climatol., 41, 3994–4018, https://doi.org/10.1002/joc.7055, 2021.
Ma, J., Wang, H., and Fan, K.: Dynamic downscaling of summer precipitation prediction over China in 1998 using WRF and CCSM4, Adv. Atmos. Sci., 32, 577–584, https://doi.org/10.1007/s00376-014-4143-y, 2015.
Mehran, A., AghaKouchak, A., and Phillips, T. J.: Evaluation of CMIP5 continental precipitation simulations relative to satellite-based gauge-adjusted observations, J. Geophys. Res.-Atmos., 119, 1695–1707, https://doi.org/10.1002/2013jd021152, 2014.
Miralles, D. G., Gentine, P., Seneviratne, S. I., and Teuling, A. J.: Land-atmospheric feedbacks during droughts and heatwaves: state of the science and current challenges, Ann. N. Y. Acad. Sci., 1436, 19–35, https://doi.org/10.1111/nyas.13912, 2019.
Mueller, B. and Seneviratne, S. I.: Systematic land climate and evapotranspiration biases in CMIP5 simulations, Geophys. Res. Lett., 41, 128–134, https://doi.org/10.1002/2013GL058055, 2014.
Na, Y., Fu, Q., and Kodama, C.: Precipitation Probability and Its Future Changes From a Global Cloud-Resolving Model and CMIP6 Simulations, J. Geophys. Res.-Atmos., 125, e2019JD031926, https://doi.org/10.1029/2019jd031926, 2020.
Novick, K. A., Biederman, J. A., Desai, A. R., Litvak, M. E., Moore, D. J. P., Scott, R. L., and Torn, M. S.: The AmeriFlux network: A coalition of the willing, Agr. Forest Meteorol., 249, 444–456, https://doi.org/10.1016/j.agrformet.2017.10.009, 2018.
O'Brien, T. A., Collins, W. D., Kashinath, K., Rübel, O., Byna, S., Gu, J., Krishnan, H., and Ullrich, P. A.: Resolution dependence of precipitation statistical fidelity in hindcast simulations, J. Adv. Model Earth Sy., 8, 976–990, https://doi.org/10.1002/2016ms000671, 2016.
Oleson, K. W., Lawrence, D. M., Bonan, G. B., Flanner, M. G., Kluzek, E., Lawrence, P. J., Levis, S., Swenson, S. C., Thornton, P. E., Dai, A., Decker, M., Dickinson, R., Feddema, J., Heald, C. L., Hoffman, F., Lamarque, J.-F., Mahowald, N., Niu, G.-Y., Qian, T., Randerson, J., Running, S., Sakaguchi, K., Slater, A., Stockli, R., Wang, A., Yang, Z.-L., and Zeng, X.: Technical description of version 4.0 of the Community Land Model (CLM), NCAR Technical Note NCAR/TN-478+STR, 257 pp., 2010.
Osborn, T. J., Jones, P. D., and Joshi, M.: Recent United Kingdom and global temperature variations, Weather, 72, 323–329, https://doi.org/10.1002/wea.3174, 2017.
Pielke, R. A.: Influence of the spatial distribution of vegetation and soils on the prediction of cumulus Convective rainfall, Rev. Geophys., 39, 151–177, https://doi.org/10.1029/1999rg000072, 2001.
Pitman, A. J.: The evolution of, and revolution in, land surface schemes designed for climate models, Int. J. Climatol., 23, 479–510, https://doi.org/10.1002/joc.893, 2003.
Rieck, M., Hohenegger, C., and van Heerwaarden, C. C.: The Influence of Land Surface Heterogeneities on Cloud Size Development, Mon. Weather Rev., 142, 3830–3846, https://doi.org/10.1175/mwr-d-13-00354.1, 2014.
Rochetin, N., Couvreux, F., and Guichard, F.: Morphology of breeze circulations induced by surface flux heterogeneities and their impact on convection initiation, Q. J. Roy. Meteor. Soc., 143, 463–478, https://doi.org/10.1002/qj.2935, 2017.
Rodell, M., Houser, P. R., Jambor, U., Gottschalck, J., Mitchell, K., Meng, C. J., Arsenault, K., Cosgrove, B., Radakovich, J., Bosilovich, M., Entin, J. K., Walker, J. P., Lohmann, D., and Toll, D.: The Global Land Data Assimilation System, B. Am. Meteorol. Roc., 85, 381–394, https://doi.org/10.1175/bams-85-3-381, 2004.
Rotenberg, E. and Yakir, D.: Contribution of semi-arid forests to the climate system, Science, 327, 451–454, https://doi.org/10.1126/science.1179998, 2010.
Saha, S., Moorthi, S., Wu, X., Wang, J., Nadiga, S., Tripp, P., Behringer, D., Hou, Y.-T., Chuang, H.-Y., Iredell, M., Ek, M., Meng, J., Yang, R., Mendez, M. P., van den Dool, H., Zhang, Q., Wang, W., Chen, M., and Becker, E.: The NCEP Climate Forecast System Version 2, J. Climate, 27, 2185–2208, https://doi.org/10.1175/jcli-d-12-00823.1, 2014.
Stone, D. A., Risser, M. D., Angélil, O. M., Wehner, M. F., Cholia, S., Keen, N., Krishnan, H., O'Brien, T. A., and Collins, W. D.: A basis set for exploration of sensitivity to prescribed ocean conditions for estimating human contributions to extreme weather in CAM5.1-1degree, Weather and Climate Extremes, 19, 10–19, https://doi.org/10.1016/j.wace.2017.12.003, 2018.
Su, F., Duan, X., Chen, D., Hao, Z., and Cuo, L.: Evaluation of the Global Climate Models in the CMIP5 over the Tibetan Plateau, J. Climate, 26, 3187–3208, https://doi.org/10.1175/jcli-d-12-00321.1, 2013.
Sun, Q., Miao, C., Duan, Q., Ashouri, H., Sorooshian, S., and Hsu, K. L.: A Review of Global Precipitation Data Sets: Data Sources, Estimation, and Intercomparisons, Rev. Geophys., 56, 79–107, https://doi.org/10.1002/2017rg000574, 2018.
Sun, W., Li, L., and Wang, B.: Reducing the biases in shortwave cloud radiative forcing in tropical and subtropical regions from the perspective of boundary layer processes, Sci. China Earth Sci., 59, 1427–1439, https://doi.org/10.1007/s11430-016-5290-z, 2016.
Sun, W., Wang, B., Wang, Y., Zhang, G. J., Han, Y., Wang, X., and Yang, M.: Parameterizing Subgrid Variations of Land Surface Heat Fluxes to the Atmosphere Improves Boreal Summer Land Precipitation Simulation with the NCAR CESM1.2, Geophys. Res. Lett., 48, e2020GL090715, https://doi.org/10.1029/2020gl090715, 2021.
Tang, Y., Wen, X., Sun, X., and Wang, H.: Interannual variation of the Bowen ratio in a subtropical coniferous plantation in southeast China, 2003–2012, PLoS One, 9, e88267, https://doi.org/10.1371/journal.pone.0088267, 2014.
Taylor, C. M., Parker, D. J., and Harris, P. P.: An observational case study of mesoscale atmospheric circulations induced by soil moisture, Geophys. Res. Lett., 34, L15801, https://doi.org/10.1029/2007gl030572, 2007.
Waliser, D. E., Moncrieff, M. W., Burridge, D., Fink, A. H., and Yuter, S.: The “year” of tropical convection (May 2008–April 2010): Climate variability and weather highlights, B. Am. Meteorol. Soc., 93, 1189–1218, https://doi.org/10.1175/2011bams3095.1, 2012.
Wang, Y., Zhang, G. J., and Craig, G. C.: Stochastic convective parameterization improving the simulation of tropical precipitation variability in the NCAR CAM5, Geophys. Res. Lett., 43, 6612-6619, https://doi.org/10.1002/2016gl069818, 2016.
Wang, Y., Zhang, G. J., and He, Y. J.: Simulation of Precipitation Extremes Using a Stochastic Convective Parameterization in the NCAR CAM5 Under Different Resolutions, J. Geophys. Res.-Atmos., 122, 12875–12891, https://doi.org/10.1002/2017jd026901, 2017.
Wang, Y., Zhang, G. J., and Jiang, Y.: Linking Stochasticity of Convection to Large-Scale Vertical Velocity to Improve Indian Summer Monsoon Simulation in the NCAR CAM5, J. Climate, 31, 6985–7002, https://doi.org/10.1175/jcli-d-17-0785.1, 2018.
Wang, Y., Xia, W., Liu, X., Xie, S., Lin, W., Tang, Q., Ma, H.-Y., Jiang, Y., Wang, B., and Zhang, G. J.: Disproportionate control on aerosol burden by light rain, Nat. Geosci., 14, 72–76, https://doi.org/10.1038/s41561-020-00675-z, 2021a.
Wang, Y., Zhang, G. J., Xie, S., Lin, W., Craig, G. C., Tang, Q., and Ma, H.-Y.: Effects of coupling a stochastic convective parameterization with the Zhang–McFarlane scheme on precipitation simulation in the DOE E3SMv1.0 atmosphere model, Geosci. Model Dev., 14, 1575–1593, https://doi.org/10.5194/gmd-14-1575-2021, 2021b.
Wei, L., Wang, Y., Liu, S., Zhang, G. J., and Wang, B.: Distinct roles of land cover in regulating spatial variabilities of temperature responses to radiative effects of aerosols and clouds, Environ. Res. Lett., 16, 124070, https://doi.org/10.1088/1748-9326/ac3f04, 2021.
Xia, Y., Hao, Z., Shi, C., Li, Y., Meng, J., Xu, T., Wu, X., and Zhang, B.: Regional and Global Land Data Assimilation Systems: Innovations, Challenges, and Prospects, J. Meteorol. Res.-Prc., 33, 159–189, https://doi.org/10.1007/s13351-019-8172-4, 2019.
Yin, M., Wang, Y., and Sun, W.: Climate Impacts of Parameterizing Subgrid Partitioning of Land Surface Heat Fluxes to the Atmosphere with the NCAR CESM1.2, Zenodo [data set], https://doi.org/10.5281/zenodo.6606418, 2022.
Yu, R., Li, J., Zhang, Y., and Chen, H.: Improvement of rainfall simulation on the steep edge of the Tibetan Plateau by using a finite-difference transport scheme in CAM5, Clim. Dynam., 45, 2937–2948, https://doi.org/10.1007/s00382-015-2515-3, 2015.
Yue, S., Yang, K., Lu, H., Zhou, X., Chen, D., and Guo, W.: Representation of Stony Surface-Atmosphere Interactions in WRF Reduces Cold and Wet Biases for the Southern Tibetan Plateau, J. Geophys. Res.-Atmos., 126, e2021JD035291, https://doi.org/10.1029/2021jd035291, 2021.
Zaitchik, B. F., Rodell, M., and Olivera, F.: Evaluation of the Global Land Data Assimilation System using global river discharge data and a source-to-sink routing scheme, Water Resour. Res., 46, W06507, https://doi.org/10.1029/2009wr007811, 2010.
Zhou, X., Yang, K., Beljaars, A., Li, H., Lin, C., Huang, B., and Wang, Y.: Dynamical impact of parameterized turbulent orographic form drag on the simulation of winter precipitation over the western Tibetan Plateau, Clim. Dynam., 53, 707–720, https://doi.org/10.1007/s00382-019-04628-0, 2019.
Zhou, X., Yang, K., Ouyang, L., Wang, Y., Jiang, Y., Li, X., Chen, D., and Prein, A.: Added value of kilometer-scale modeling over the third pole region: a CORDEX-CPTP pilot study, Clim. Dynam., 57, 1673–1687, https://doi.org/10.1007/s00382-021-05653-8, 2021.
Zhu, Y.-Y. and Yang, S.: Evaluation of CMIP6 for historical temperature and precipitation over the Tibetan Plateau and its comparison with CMIP5, Adv. Clim. Change Res., 11, 239–251, https://doi.org/10.1016/j.accre.2020.08.001, 2020.