the Creative Commons Attribution 4.0 License.
the Creative Commons Attribution 4.0 License.
 | 16 Nov 2022
Importance of different parameterization changes for the updated dust cycle modeling in the Community Atmosphere Model (version 6.1)
Natalie M. Mahowald
Jasper F. Kok
Xiaohong Liu
Mingxuan Wu
Danny M. Leung
Douglas S. Hamilton
Louisa K. Emmons
Yue Huang
Neil Sexton
Jessica Wan
The Community Atmosphere Model (CAM6.1), the atmospheric component of the Community Earth System Model (CESM; version 2.1), simulates the life cycle (emission, transport, and deposition) of mineral dust and its interactions with physio-chemical components to quantify the impacts of dust on climate and the Earth system. The accuracy of such quantifications relies on how well dust-related processes are represented in the model. Here we update the parameterizations for the dust module, including those on the dust emission scheme, the aerosol dry deposition scheme, the size distribution of transported dust, and the treatment of dust particle shape. Multiple simulations were undertaken to evaluate the model performance against diverse observations, and to understand how each update alters the modeled dust cycle and the simulated dust direct radiative effect. The model–observation comparisons suggest that substantially improved model representations of the dust cycle are achieved primarily through the new more physically-based dust emission scheme. In comparison, the other modifications induced small changes to the modeled dust cycle and model–observation comparisons, except the size distribution of dust in the coarse mode, which can be even more influential than that of replacing the dust emission scheme. We highlight which changes introduced here are important for which regions, shedding light on further dust model developments required for more accurately estimating interactions between dust and climate.
- Article
(11270 KB) - Full-text XML
-
Supplement
(19888 KB) - BibTeX
- EndNote


Mineral dust accounts for most aerosol mass in the Earth's atmosphere and plays an important role in different aspects of the coupled Earth–human–climate system. For example, dust modifies the radiative budget and atmospheric dynamics via direct, semi-direct, and indirect interactions with radiation (Sokolik and Toon, 1996; Miller and Tegen, 1999; Pérez et al., 2006; Li and Sokolik, 2018a) and clouds (DeMott et al., 2003; Rosenfeld et al., 2001; Shi and Liu, 2019). In addition, the deposition of mineral dust perturbs the energy budget by darkening snow and glacial ice sheets directly due to the relatively darker color of dust particles (Skiles et al., 2018; Sarangi et al., 2020) and indirectly by providing nutrients (e.g., phosphorus) to snow algae (McCutcheon et al., 2021). Dust deposited onto land and ocean can also affect the biogeochemistry by adding nutrients (iron and phosphorus) and/or pollutants to ecosystems (Martin et al., 1990; Swap et al., 1992; Shinn et al., 2000; Tie and Cao, 2009; Mahowald, 2011; Mahowald et al., 2017, 2010; Hamilton et al., 2020).
To quantify the climate and biogeochemical impacts of dust, accurately reproducing the dust cycle (e.g., emission, transport, and deposition) with models is required. However, previous studies have shown substantial differences between the modeled dust cycle and observations (e.g., surface dust concentration and dust deposition) (Albani et al., 2014; C. Wu et al., 2020). These uncertainties in the dust cycle modeling, as well as uncertainties in optical properties due primarily to dust size and mineral composition, suggest a large uncertainty in estimating the dust direct radiative effect (DRE) (Kok et al., 2017; Li et al., 2021).
The difficulty in modeling dust results primarily from a limited understanding of the processes that control the emission, aging, and removal of dust during transport (Sokolik et al., 2001). Past studies have documented a nonlinear response of dust emission to the soil surface state and meteorological fields (Kok et al., 2012), strong regional variation of the erodible soil composition (Claquin et al., 1999; Journet et al., 2014), complex chemical and physical aging of dust during transport (Cwiertny et al., 2008; Usher et al., 2003) at varied time and spatial scales, a wide range of dust particle size (Mahowald et al., 2014), and irregular shape of dust aerosol particles (E. Reid et al., 2003; Wang et al., 2015). These complexities impose a great challenge to parameterizing dust-related processes (e.g., dust emissions and dust deposition) and thus to accurately simulating the dust cycle in climate models. In addition, in situ or station-based measurements of dust aerosols are highly limited at both temporal and spatial scales, which makes representation of those measurements challenging, especially considering the episodic character of dust events (Mahowald et al., 2009). As such, the modeling community is still moving toward better parametrizing the different phases of the dust cycle.
To account for regional variations in dust composition and the resultant dust optical properties in estimating the dust DRE, several common and radiatively important minerals found in dust from major dust sources were introduced to the Community Atmosphere Model versions 4 (CAM4) and 5 (CAM5) (Scanza et al., 2015) and migrated to CAM6.1 (Li et al., 2021), which are the atmospheric components of the Community Earth System Model (CESM: version 1 and 2, respectively). Including the ability to resolve dust speciation along with the addition of an atmospheric iron cycle module (Scanza et al., 2018; Hamilton et al., 2019) facilitates the study of dust impacts on biogeochemical cycles (Hamilton et al., 2020).
As one of the widely used climate models, the CAM contains several weaknesses in modeling the dust cycle, as follows for example:
-
The default scheme in CAM6.1 (Zender et al., 2003a; Dust Entrainment And Deposition DEAD model, referred to as DEAD) relies on an empirical geomorphic dust source function, created based on satellite retrievals of dust source regions, to model dust emissions.
-
The current default CESM2.1 is using the dry deposition scheme Zhang et al. (2001; Z01 hereafter) developed for particle deposition over smooth and non-vegetated surfaces. This scheme, however, underemphasizes the interception loss, the mechanism of which is less influential over the other surfaces such as grassland. The use of the Z01 in the current default CESM2.1 is thus very likely overestimating the dry deposition velocity of fine-sized aerosols (diameter < 1.0 µm; referring to the geometric diameter herein unless stated otherwise) and slightly underestimating that of aerosols with diameter > 5.0 µm (Wu et al., 2018), especially over non-vegetated surfaces (Petroff and Zhang, 2010).
-
One of the changes from CAM5 to CAM6.1 was replacing the size distribution of aerosols in the coarse mode in CAM5 with the one that has a much narrower width in CAM6.1 (Table 1). This change was to accommodate stratospheric aerosols in the coarse mode (e.g., volcanic sulfate) compared to an early officially released version of this model (Mills et al., 2016). A recent model evaluation against satellite retrievals (M. Wu et al., 2020) suggests that CESM2.1-CAM6.1 worsened the dust cycle representation and stands out in simulating the relative importance of wet to dry deposition, compared with the other global climate models or model versions, such as CESM1-CAM5, due partially to the narrow coarse-mode geometric standard deviation.
-
Dust aerosols are typically aspherical particles in shape. The dust asphericity could lengthen the dust lifetime by ∼ 20 %, compared to modeling dust as spherical particles (Huang et al., 2020). Still, CAM6.1 simulates dust as spherical particles, though the impact of dust asphericity on optical depth and resulting DRE of dust (Kok et al., 2017) has been previously introduced to CAM6.1 (Li et al., 2021).
Correspondingly, this paper describes several updates to the dust representation in CAM6.1 on the four aspects and evaluates whether and for what conditions they improve the dust model comparison to observations in the present climate. Specifically, we do the following:
-
We replace DEAD with a new more physically based dust emission scheme, Kok et al. (2014a; referred to as BRIFT) previously developed for the climate models within the framework of DEAD. This scheme performs well against observations in CESM-CAM4 (Kok et al., 2014b) without the aid of the empirical geomorphic dust source function.
-
We replace Z01 with the dry deposition scheme developed by Petroff and Zhang (2010) (PZ10 hereafter) to mediate the overestimation of the dry deposition velocity of fine-sized aerosols.
-
We revert size distribution of dust aerosol particles in the coarse mode to the one previously employed in CAM5.
-
We account for the lifetime effect of dust asphericity by decreasing the modeled gravitational settling velocity.
These updates are based on up-to-date knowledge of the dust cycle and are thus more physically realistic than the default dust parameterizations in CAM6.1/Community Land Model (version 5; CLM5).
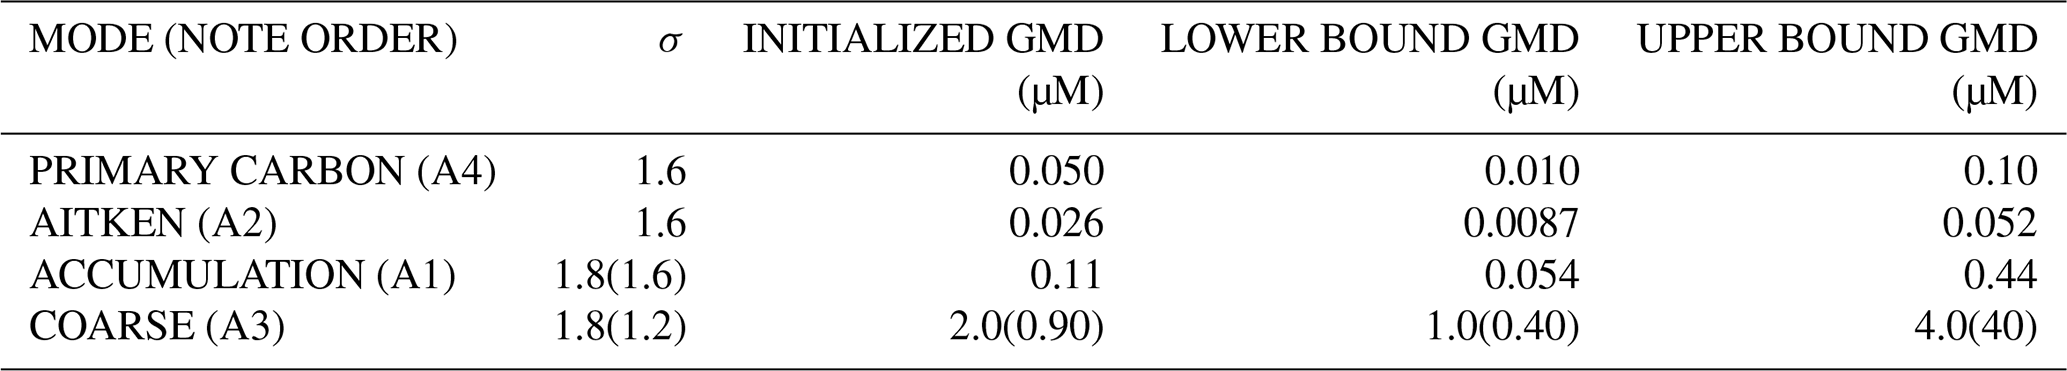
Table 1Mode parameters for the Modal Aerosol Module version 4 (MAM4) used in CAM5 (CAM5 size) and CAM6.1 (CAM6 size) by default: geometric standard deviations (σ) and initialized geometric mean diameter (GMD) and its ranges. Values in parentheses if present are for CAM6.1; cells without parentheses are kept the same between CAM5 and CAM6.1.
We organize the paper as follows: Sect. 2 describes the model (Sect. 2.1–2.3), the modifications we made to the model (Sect. 2.5), and the experiment we conducted (Sect. 2.6) under present climate conditions to achieve our purpose. Section 3 presents the observation and semi-observation for model evaluation in current climate. Section 4 describes metrics used to assess the model performance. Section 5 evaluates the performance of the updated model by comparing simulated dust properties (e.g., surface dust concentrations, deposition fluxes, vertical distribution, and size distribution of transported dust) against measurements, retrievals, and model–observation integration (Sect. 5.1), quantifies the influence of each modification on those simulated dust properties (Sect. 5.2), documents the influence of those modifications on the estimate of the dust DRE (Sect. 5.3), and compares these changes in order to recommend which are the most important for other models to consider (Sect. 5.4). Section 6 shows the difference between the bulk- (consisting of single “bulk” composition, so no composition distinguished between particles) and speciated-dust (consisting of mineral components) models on the dust cycle modeling and the resultant dust climatic effects. Furthermore, we discuss limitations in the model–observation comparison in Sect. 7, and discussions and conclusions in Sect. 8.
We used CAM6.1 (Sect. 2.1), embedded within the National Center for Atmospheric Research CESM2.1, to simulate the dust cycle in all the numerical experiments. This section describes bulk- (Sect. 2.2) and speciated-dust model (Sect. 2.3), dust optical properties and radiation flux diagnostics in CAM6.1 (Sect. 2.4), and our modifications to the base code (Sect. 2.5): the new dust emission scheme and change to the aerosol dry deposition and gravitational settling velocity to include dust asphericity. Two sets of simulations with offline dynamics (meteorology field nudged toward reanalysis data) were conducted (Table 2; Sect. 2.6) using bulk and speciated dust. A total of nine experiments were conducted to evaluate the performance of each development that a future version of official model release will likely include on reproducing the dust cycle against that of the current schemes and observations. Three out of the nine experiments quantify how the size treatment for transported dust affects the dust cycle modeling. We do not evaluate the model performance on simulating the dust cycle in the preindustrial considering the scarcity of measurements relative to the current climate (Mahowald et al., 2010).
Table 2Simulations performed in this study for years 2006–2011. Treatment of dust tracers: speciated dust with separate tracers (mineralogy), or no dust speciation (bulk); the dust emission scheme: Zender et al. (2003a; DEAD) or Kok et al. (2014a; BRIFT); with or without accounting for the lifetime effect of dust asphericity (asp versus sph); dry deposition scheme: Zhang et al. (2001; Z01) or Petroff and Zhang (2010; PZ10); parameters for size distribution taken from the released version of CAM5 and CAM6.1 (see Table 1 for CAM5 and CAM6 sizes, respectively); additional tests on dust size distribution using the coarse-mode σ=1.2 from the released version of CAM6.1 and the other parameters (e.g., boundaries of the geometric mean diameter) from the released version of CAM5; dust tuning parameter includes the CAM namelist variable (dust_emis_fact) and “b” used in the calculation of the threshold gravimetric water content (see Sect. 2.5.1). The variable fclay denotes the clay fraction in CLM5. CAM6.1 and CAM6.α in bold refer to the default model and proposed new model versions, respectively, with bulk dust. Note negligible influence on the dust cycle modeling and corresponding direct radiative effect by changing the size parameters of the accumulation mode between CAM5 and CAM6 size.

2.1 Aerosol representation
We used the Modal Aerosol Model version 4 (MAM4) in the CESM2.1-CAM6.1 (Liu et al., 2016). We consider both the default DEAD dust emission scheme (Zender et al., 2003a) in the current officially released version of CAM6.1 model as well as that of Kok et al. (2014a) (Sect. 2.5.1).
CAM6.1 simulates the advection, deposition, and aerosol microphysics (e.g., coagulation and nucleation) during transport via MAM4 using four log-normal size modes (Liu et al., 2016): Aitken (containing dust, sulfate, sea salt, and secondary organic matter), accumulation (containing sulfate, secondary organic matter, primary organic matter, black carbon, sea salt, and soil dust), coarse (containing dust, sea salt, and sulfate), and a primary carbonaceous mode (primary organic matter and black carbon). Within each mode, aerosol tracers are transported as an internal mixture of the species present, while aerosol species from different modes are externally mixed. Also advected in each of the four modes is the number concentration of aerosol particles (Liu et al., 2016), allowing an effective radius to be calculated and the effect of aerosol–cloud interactions to be diagnosed. The removal of dust aerosols is mainly through dry deposition and wet deposition (including in- and below-cloud processes, as detailed in Neale et al., 2010). In the formation of precipitating clouds, dust particles can serve as cloud condensation nuclei (CCN) and/or ice nucleating particles (INPs) and thus can be removed via nucleation scavenging (Zender et al., 2003a). In addition, the model accounts for the in-cloud scavenging of dust in the Aitken mode by Brownian diffusion, but neglects the other scavenging processes (Easter et al., 2004), which are relatively slow (Pruppacher et al., 1998), such as thermophoresis. Below the cloud, dust particles can be removed by the sub-cloud scavenging. This sub-cloud scavenging of dust aerosols follows a first order loss as the product of the precipitation flux, dust mass mixing ratio, and the scavenging efficiency (Dana and Hales, 1976), for example. The wet deposition rate thus depends on the hygroscopicity of dust (= 0.068; Scanza et al., 2015) as CCN/INPs and the prescribed scavenging coefficient (Neale et al., 2010), both of which are currently constant with respect to the dust size (and composition for speciated dust) in CAM6.1. This size independency of the scavenging coefficient may be an oversimplification, since measurements suggest that it can vary intensively on an order or two even within a size mode (Wang et al., 1978).
The geometric standard deviation of each mode is prescribed, and default values for CAM5 and CAM6.1 are given in Table 1, along with the initialized geometric mean diameter (GMD), based on which the model predicates the GMD online, and its ranges. Note that the current default CAM6.1 employs a narrow coarse-mode size distribution but a broad boundary width (high bound minus low bound), likely resulting in the GMD bounds less in effect, compared to that in CAM5. The narrower set of the coarse-mode size distribution was designed to accommodate for stratospheric aerosols (e.g., volcanic sulfate) (Mills et al., 2016), but was not previously compared to dust aerosol observations in detail.
2.2 Bulk-dust modeling
Parameterization of the default dust emissions in DEAD generally follows the dust mobilization mechanism developed by Marticorena and Bergametti (1995) (referred to as DEAD hereafter as well). As a component of CESM2, the CLM initiates dust entrainment once the near-surface friction velocity exceeds the soil threshold friction velocity, which primarily depends on the physical characteristics of the soil (e.g., soil moisture content and grain size distribution) and land cover (Kok et al., 2012; Shao, 2008). The downwind transfer of wind momentum to the surface soil to produce dust emissions is assumed to be completely prevented by vegetation when the leaf area index (LAI) exceeds a threshold value, 0.3 m2 m−2 (Mahowald et al., 2006a). Below the threshold value, the fraction of a grid cell capable of releasing dust aerosols is parameterized as an inverse and linear function of LAI (Mahowald et al., 2006a). The inhibition of soil moisture on dust deflation, and thus dust emission, activates when the near-surface soil gravimetric water content exceeds a threshold value, determined by the static mass fraction of the clay soil, and is parameterized in the land model according to a semi-empirical relation (Fécan et al., 1999) (see Sect. 2.5.1).
The size distribution of the emitted dust was derived using the brittle fragmentation theory developed by Kok (2011b) distributing 0.1 %, 1.0 %, and 98.9 % percentage of dust mass into Aitken, accumulation, and coarse modes, respectively, independent of the friction velocity upon dust emissions (Kok, 2011a).
2.3 Speciated-dust aerosol modeling
The bulk-dust model (Sect. 2.2) has previously been modified to speciate the bulk dust into eight mineral tracers, which allows more detailed optical properties as a function of minerals (Scanza et al., 2015; Li et al., 2021). Using the approach of Claquin et al. (1999), Li et al. (2021) estimated a mean mineralogical composition in the soil at each model grid cell for the minerals illite, kaolinite, montmorillonite, hematite, quartz, calcite, feldspar, and gypsum (Fig. S2 of Li et al., 2021). These minerals represent the most common classes for clay- (soil grain diameter < 2 µm including the first five minerals) and silt-sized (diameter between 2–63 µm including the last five minerals) soil categories (Claquin et al., 1999). As detailed in Scanza et al. (2015) and Li et al. (2021), additional modifications include (1) the mineral components in soil types of Gypsic Xerosols and Yermosols, Gleyic and Orthic Solonchaks and salt flats were normalized to unity; (2) the same amount of hematite in the clay- and silt-sized categories was prescribed with equal and opposite change to the illite percentage; (3) the nearest neighborhood algorithm was applied to fill in the grid cells for dust emission; and (4) the soil mineralogy was converted to that of the dust aerosol following the brittle fragmentation theory (Kok, 2011b), as detailed in Scanza et al. (2015).
The distribution of the mass flux for each mineral into the three emission modes follows that of the bulk-dust modeling (Sect. 2.2). The sum of the masses of the eight considered minerals equals the total bulk-dust mass without dust speciation. Each of the mineral aerosols are treated as a separate tracer in the same manner as bulk dust, experiencing advection, deposition, and aerosol microphysics (e.g., coagulation).
2.4 Dust optical properties and radiation flux diagnostic
We show results of the DRE calculations from two code versions: one with the bulk dust and the other with speciated dust. Aerosol optical properties (e.g., single scattering albedo and asymmetry factor) of the internal mixture in an aerosol mode are parameterized based upon the complex refractive index (CRI) of the mixture, which is calculated as the volume-weighted CRI of each component, including water (Ghan and Zaveri, 2007) in that mode. The wet size due to growth of aerosol particles by adsorbing water vapor follows the κ-Köhler theory with a time-invariant hygroscopicity for each aerosol species (Petters and Kreidenweis, 2007). CAM6.1 computes the net radiative flux based on the radiation fluxes diagnosed for each model layer at 14 shortwave and 16 longwave spectral bands per model hour. The DRE by dust aerosols under all-sky conditions was then determined by calculating the difference of the net radiative flux with and without dust at the top of the atmosphere. We augmented the longwave DRE from the model by 51 % to account for the dust scattering (Dufresne et al., 2002). The DRE efficiency, which we used to evaluate the model performance on simulating the dust optical properties, is defined as the ratio of dust DRE to dust optical depth (DOD) under clear conditions. This study does not consider the indirect radiative effect which is subject to substantially larger uncertainty due to the complexity involved in cloud microphysics (IPCC, 2021).
2.5 Changes to the dust parameterizations in CAM6.1/CLM5
The model developments introduced in this section are closely related to the three major components of the dust cycle (emission, transport, and removal mechanisms) and the radiative effects. Specifically, we incorporate into CAM6.1 the relatively new dust emission scheme originally developed by Kok et al. (2014a, b), the dry deposition scheme developed by Petroff and Zhang (2010) and incorporated in CAM5 by Wu et al. (2018), and the influence of dust non-spherical shape on the removal rate of dust aerosol particles (Huang et al., 2020).
2.5.1 Dust emission schemes
The vertical flux of dust emitted by wind erosion in a model grid cell is represented by
where λ is a global tuning factor, Sf is the source function that shifts the dust emission to the most erodible sources, such as the Bodélé depression in North Africa (Zender et al., 2003a), and Fd,CLM5 is the vertical emission flux predicted by the dust emission scheme in CLM5 (Kok et al., 2014a).
As part of the DEAD scheme (Zender et al., 2003a), dust sources are strongly associated with the erodible soils (Ginoux et al., 2001). These source regions are parameterized using information contained in the time invariant geomorphology map (Zender et al., 2003b) which was optimized (Albani et al., 2014) to match the observed DOD. The vertical dust emission in CLM5 occurs when the friction velocity () exceeds the threshold friction velocity () on the entire surfaces including nonerodible roughness elements, which is parameterized in DEAD as
where CMB is a dimensionless proportionality constant; fbare is the bare soil fraction; ρa is the atmospheric density; and the sandblasting efficiency χ is written as a function of the clay fraction (fclay),
Kok et al. (2014a) developed a new dust emission scheme for climate models based on the brittle fragmentation theory (Kok, 2011b), which avoided the use of a static soil erodibility map (the source function, Sf in Eq. 1) while improving the accuracy of the dust cycle modeling (Kok et al., 2014b); although even dust modeling with DEAD can be improved if optimized against observations (Kok et al., 2021b). Improvements are likely achieved because, compared to that in DEAD, the dust emission in BRIFT tends to be more sensitive to the soil's threshold friction velocity and thus to the surface physical conditions when soil becomes more erodible, owing to the introduced dust emission coefficient (Kok et al., 2014a) and the new method of calculating the threshold gravimetric water content in the top soil layer (see Eq. 4 of Kok et al., 2014b). Below we briefly introduce the new dust emission scheme.
In this new scheme the vertical dust emission in CLM5 is expressed as
where u∗ and u∗t are friction velocity and threshold friction velocity on the bare erodible soil surfaces; u∗st is the threshold friction velocity standardized according to atmospheric density and the standard atmospheric density of ρa0=1.225 kg m−3,
and u∗st0 is the minimal value of u∗st equaling 0.16 m s−1.
Since the presence of non-erodible roughness elements, such as rocks, is not considered in CLM5,
Because of the neglection of the non-erodible elements, u∗t is mostly determined by soil moisture content, which means that the augmentation factor of u∗t is
where w and w′ are soil moisture content and the threshold gravimetric water content of the top soil layer in percentage.
Fécan et al. (1999) parameterized the threshold gravimetric water content (w) of the top soil layer by
where b is a tuning factor.
Equations (8) and (9) are also used in DEAD with an equivalent tuning factor b set to be which in BRIFT is set as unity. The clay fraction is taken from the FAO et al. (2012) soil database (see Fig. S1 of Kok et al., 2014b).
The dust emission coefficient, Cd, in Eq. (4) is expressed as
where Cd0 equals and Ce equals 2.0.
2.5.2 Dry deposition schemes
The default dry deposition scheme, Z01
As is typical among aerosols dry deposition resistance models, CAM6.1 includes parameterizations of gravitational settling (Vg), and aerodynamic (Ra) and surface resistance (Rs).
The gravitational settling is parameterized following
where ρp is the particle density (unit: kg m−3), dp is the particle diameter (unit: m), g the acceleration of gravity, Cc is the Cunningham correction factor as a function of dp and the mean free path of air molecules, and μ is the viscosity coefficient of air.
Aerodynamic resistance is parameterized following
where ZR is the reference height; Z0 is the roughness length; φH is the stability function, κ is the von Karman constant set as 0.4; and u∗ is the friction velocity.
The surface resistance dominates over aerodynamic resistance under turbulent conditions, and is written as
where ε0 is an empirical constant set as 3.0; R1 is the factor to represent particle rebound; EB,EIM, and EIN are collection efficiencies due to Brownian diffusion, impaction, and interception, parameterized respectively as
where Sc is the Schmidt number, defined as the ratio of the kinematic viscosity of air ( m2 s−1) to the particle Brownian diffusivity (D); γ depends on land use categories, typically ranging between [0.50, 0.67]; α depends on the land use categories; β=2; A is the characteristic radius of collectors depending on land use categories; and St is the Stokes number parameterized following
According to Eq. (13), the surface resistance consists of three processes, two applicable to all land types (Brownian diffusion and impaction), and one only to non-smooth surfaces (interception). All the three processes are a function of aerosol size through empirical coefficients constrained by matching the modeled dry deposition velocity with field and laboratory measurements.
The dry deposition velocity then has the form of
With more observations available to constrain these coefficients, the default Z01 (Zhang et al., 2001) used in CAM6.1 was found to greatly overestimate dry deposition rates for fine particles (diameter < 1 µm: Aitken and accumulation modes) and slightly underestimate (relative to the large change with fine particles) the rates for coarse particles (diameter around 1 or 2 µm) (Petroff and Zhang, 2010; Wu et al., 2018).
The new dry deposition scheme, PZ10
The new scheme (PZ10; Petroff and Zhang, 2010) uses a quite different formula to calculate the dry deposition scheme as follows:
where the drift velocity,
Therefore, this new scheme includes the effect (Vphor) of different physical processes (thermophoresis, diffusiophoresis, and electricity) occurring between water, ice, and snow surfaces and the air immediately above them, which can result in a downward flux of particles (the phoretic effect; Petroff et al., 2008). PZ10 accounts for such effects of thermophoresis and diffusiophoresis for particle deposition over the three surface types by assigning constant values of m s−1 to water and m s−1 to ice and snow surfaces, which allows the scheme to better reproduce the available measurements than Z01 (Petroff and Zhang, 2010). This constant is set to zero for all the other surface types. The phoretic effect tends to dominate deposition of fine particles over Brownian diffusion under low wind conditions (friction velocity less than ∼ 11 cm s−1). Because of the reduced Brownian diffusion efficiency compared to Z01, PZ10 corrects the high bias seen in Z01 for the deposition of fine particles (Emerson et al., 2020; Petroff and Zhang, 2010; Wu et al., 2018).
PZ10 parameterizes the gravitational settling velocity Vg in the same way as Z01 but the aerodynamic resistance (Ra) in a different formula.
For non-vegetated surfaces,
where d and Lo are the displacement height of the canopy and the Obhukov length, respectively; and Ψh is the integrated form of the stability function for heat.
The surface dry deposition velocity is expressed as
where EIT is the efficiency of collections by turbulent impaction; Egb represents Brownian diffusion, written as
For vegetated surfaces,
where h is the canopy height.
The expression for surface deposition velocity is written as
where Eg is the collection efficiency on the ground below the canopy.
Eg includes Brownian diffusion and the turbulent impaction, Egt, given as
where CIT equals 0.14 and τph is the dimensionless particle relaxation time.
Q and Qg in Eq. (25) are given as
where LAI is the two-sized leaf area index; EB, EIN, and EIM, are Brownian diffusion, interception, and inertial impaction, respectively.
In Eq. (25),
where the aerodynamic extinction coefficient δ is expressed as
where kx is the inclination coefficient of the canopy elements and ϕm is the nondimensional stability function for momentum.
2.5.3 Dust asphericity
To account for the influence of dust asphericity on the gravitational settling velocity, we first calculated the asphericity factor γ (defined as the ratio of the gravitational settling velocity of aspherical dust to that of spherical dust) offline based on a combination of observed dust shape parameters (Fs) previously compiled by Huang et al. (2020) following
Fs is parameterized by the dust shape parameters,
where Dg is the volume-equivalent diameter of the dust particle defined by three axes (L: length, W: width, and H: height, respectively) of the ellipsoid having a form of
The orientation of particles during gravitational settling determines the drag coefficient. Equation (31) assumes that during settling, aerosol particles randomly orientate. This assumption is reasonable, since for dust falling in the Earth's atmosphere, (1) the Reynolds number, Re≪1 (Kok et al., 2012), and especially (2) CAM6 does not simulate super coarse dust particles (diameter > 10 µm), for which such an assumption may introduce high errors. A previous study (Bagheri and Bonadonna, 2016) suggests that this approximation of the influence of the dust asphericity on the gravitational settling velocity is accurate and reliable with the mean and the maximum errors of 2.4 %, and 33.9 %, respectively. Equations (31)–(33) indicate a range of γ between 0 and 1. When a dust particle becomes less ellipsoidal, γ is getting closer to 1.
In the Stokes regime (Kok et al., 2012), where the gravitational settling of dust usually occurs, the terminal velocity of spherical (sph) and ellipsoidal (asp) dust is approximated as
and
respectively, where g is the gravitational constant (∼ 9.8 m s−2), ρp is the dust density (∼ 2500 kg m−3), and μ is the dynamic viscosity of air ( Pa s).
In this calculation, we also assume that the dust shape parameters are independent of the size of dust aerosol particles. Therefore, a constant revision of the dust gravitational settling velocity (the calculated value in the model by default is for spherical aerosols) due to dust asphericity by multiplying the velocity by γ was applied to dust species in the three modes that contains dust aerosols (Aitken, accumulation, and coarse). The size independency assumption of dust asphericity follows the recent observational evidence that there does not exist a statistically significant relationship between the shape parameters (aspect ratio and height-to-width ratio) and dust sizes (Huang et al., 2020).
Measurements made at different locations show that the shape parameters (e.g., aspect ratio; Fig. 3 of Huang et al., 2020), which we used to calculate Vg,asp, change for dust during transport. But, because of highly limited measurements of dust shape parameters, we subjectively divided the dust coverage into “close-to-source”, “short-range”, and “long-range” zones and calculated the asphericity factor γ for each of the zones, the global map of which is shown in Fig. S1 in the Supplement, ranging between 0.82 and 0.93. In the regions where the shape parameter measurement is sparse or unavailable, such as those in the Southern Hemisphere, the shape parameters from the global median were used instead to calculate the asphericity factor yielding a value of 15 %.
We acknowledge limitation of the methodology here to account for the lifetime effect of dust asphericity, anticipating improvements on modeling this effect when more high-quality dust shape measurements become available.
Matching modeled DOD to observations requires the model to account for dust asphericity, which acts to enhance the mass extinction efficiency of particles, particularly in the coarse mode (Kok et al., 2017). This enhancement in the mass extinction efficiency due to the dust asphericity is not included in the current version of CESM2.1 but will be likely incorporated into a future officially released CESM version. According to calculations of Kok et al. (2017), the dust mass extinction efficiency at the visible band due to dust asphericity is approximately 16 % and 28 % higher for non-spherical particles than for spherical particles in the fine (accumulation plus Aitken) and coarse modes, respectively. Consequently, the model requires lower dust emissions to achieve a global DOD of ∼ 0.030 compared to simulations without considering dust asphericity. The shape effect on the mass extinction efficiency may also explain the difference between the global mean DOD in Aerosol Comparisons between Observations and Models (AEROCOM; median: 0.023) (Huneeus et al., 2011) and that in Ridley et al. (2016) (0.03 ± 0.005) near the visible band. We have included the enhanced dust mass extinction efficiency due to dust asphericity in our previous studies (e.g., Li et al., 2021; Kok et al., 2021b), which suggests that the inclusion of this enhanced dust mass extinction efficiency would reduce the overestimation of the surface concentration (Kok et al., 2021b). Here we do not investigate its impact on the simulated dust cycle.
2.6 Experiment design
Table 2 lists the simulations designed for the present study. In all simulations, the CAM6.1 with different modifications was configured as a standalone model where the atmosphere is coupled to active land and sea ice models, and to data ocean and slab glacier models. Each simulation in these sets was performed at the spatial resolution of 1.25∘ × 0.9∘ × 56 (longitude by latitude by vertical layers) using a data ocean for years 2006–2011, with the simulated data for the last 5 years used for analysis. In addition, the meteorology field (horizontal wind, air temperature T, and relative humidity) was nudged toward the Modern-Era Retrospective analysis for Research and Applications, version 2 (MERRA-2) at a 6 h relaxation timescale. The anthropogenic emissions were taken from the Climate Model Intercomparison Program (CMIP6) inventory for the year 2000 (Eyring et al., 2016).
The enhancement of the mass extinction efficiency of aerosol particles by dust asphericity is included in all the simulations, since we do not attempt to quantify how this enhancement impacts the simulated dust cycle. An offline sensitivity test (Table S1 in the Supplement) supports the use of unity tuning factor to calculate the threshold gravimetric water content which we employed in the experiments for quantifying influence of each modification (speciated-dust simulations listed in Table 2).
NEW_EMIS serves as the baseline simulation for quantifying the impact of the coarse-mode size change on the dust cycle modeling. NEW_EMIS_SIZE completely and NEW_EMIS_SIZE_WIDTH partly reverted the coarse-mode size distribution to that used in CAM5 (Table 1). The other changes to the width of the accumulation mode and the bounds of the simulated GMD online impose negligible impacts on the dust cycle modeling, thus we did not construct sensitivity tests on them in this study. We investigate how the incorrect dust size distribution influences the dust cycle modeling and the estimate of dust DRE in the bulk-dust model rather than in the speciated-dust model, because this incorrect size distribution has been employed in previous studies using the officially released bulk-dust CAM6 only and not in any study using the speciated-dust CAM. It is also reasonable to make all the quantifications in the model that uses a correct dust size distribution. Therefore, we reverted the dust size distribution in all the speciated-dust runs to that configured in CAM5.
We quantified the impact of each of the modifications (Z01 to PZ10, spherical to aspherical dust, and DEAD to BRIFT) on the simulated dust cycle and DRE by differentiating corresponding results in the paired simulations that contain identical developments except for the targeted modification. Specifically, we quantified the impact of changing the following: (1) Z01 to PZ10 by taking the difference between the simulation with Z01 (MINE_NEW_ EMIS_SHAPE) and that with PZ10 (CAM6.α_MINE), (2) spherical to aspherical dust between the simulation with spherical dust (MINE_NEW_EMIS) and that with aspherical dust (MINE_NEW_EMIS_SHAPE), and (3) DEAD to BRIFT between the simulation using DEAD (MINE_BASE) and that using BRIFT (MINE_NEW_EMIS).
Note that there are many ways to conduct sensitivity studies, which could lead to slightly different results. We added the modification on top of the previous change to understand how the simulated dust cycle evolves while updating the model (MINE_BASE) toward the most advanced version (CAM6.α_MINE). This may not hinder a clean comparison of the effect of each development, since the “interaction” between the existing and the newly introduced parameterizations appears weak (Fig. S2).
With the dust tuning applied toward the similar global mean DOD of ∼ 0.030, the modeled dust cycle (i.e., burdens, concentrations, loadings, and deposition fluxes) would be similar between the bulk- and speciated-dust models that are nudged toward identical offline dynamics and are using the same dust size distribution (see Sect. 6). The quantified effect of each of the modifications would thus be similar if using the bulk-dust model instead (Fig. S2), except that the modeled dust optical properties (e.g., single scattering albedo) by the bulk- and speciated-dust models would differ considerably, resulting in considerably different dust DRE (Scanza et al., 2015) and DRE efficiencies between NEW_EMIS (CAM6.α) and MINE_NEW_EMIS (CAM6.α_MINE). A comparison of the bulk- and speciated-dust models on simulating dust DRE had been previously documented (Scanza et al., 2015). This study includes the speciated-dust runs, because we want to verify as well if the updates help improve the agreement with the observed dust DRE efficiency in the speciated-dust model which could better represent the spatial variation of the dust optical properties.
We tuned CAM6.1, NEW_EMIS, CAM6.α, MINE_BASE, and MINE_NEW_EMIS, following Albani et al. (2014), by modifying a CAM namelist variable, dust_emis_fact, such that the simulated global mean DOD is ∼ 0.030 at the visible band centered at 0.53 µm (hereafter unless stated otherwise), an estimate obtained by an integrated analysis of the Aerosol Robotic Network (AERONET)-based measurements, bias-corrected satellite retrievals, and a model ensemble (Ridley et al., 2016). We prefer to tuning the model to reproduce the global mean DOD, 0.030, because DOD is currently the best estimate of global dust quantities compared to the others (i.e., dust concentrations). It turns out that doing so can also reasonably reproduce the other quantities with no need of a regional tuning. MINE_NEW_EMIS requires the dust tuning to use a much larger tuning parameter (dust_emis_fact = 3.6; Table 2) than MINE_BASE (dust_emis_fact = 1.6), because otherwise, if using the same dust_emis_fact as in DEAD, the dust emissions in BRIFT would lead to an unrealistically high global mean DOD (> ∼ 0.50).
The dust tuning was not applied to NEW_EMIS_SIZE and NEW_EMIS_SIZE_WIDTH, but the emissions in which were kept identical to NEW_EMIS, to see how changes in the transported dust size distribution affects the DOD calculation. Because of the rough linearity among DOD, DRE, and dust burdens (Liao and Seinfeld, 1998; Mahowald et al., 2006b), when comparing surface dust concentrations, dust loadings, and deposition fluxes, we rescaled each of them using the same factor to achieve the global mean DOD ∼ 0.030. For the other cases (MINE_NEW_EMIS_SHAPE and CAM6.α_MINE), as will be seen, the global mean DOD only changes slightly within the uncertainty range (0.025–0.035; Ridley et al., 2016). The model retuning is thus not required.
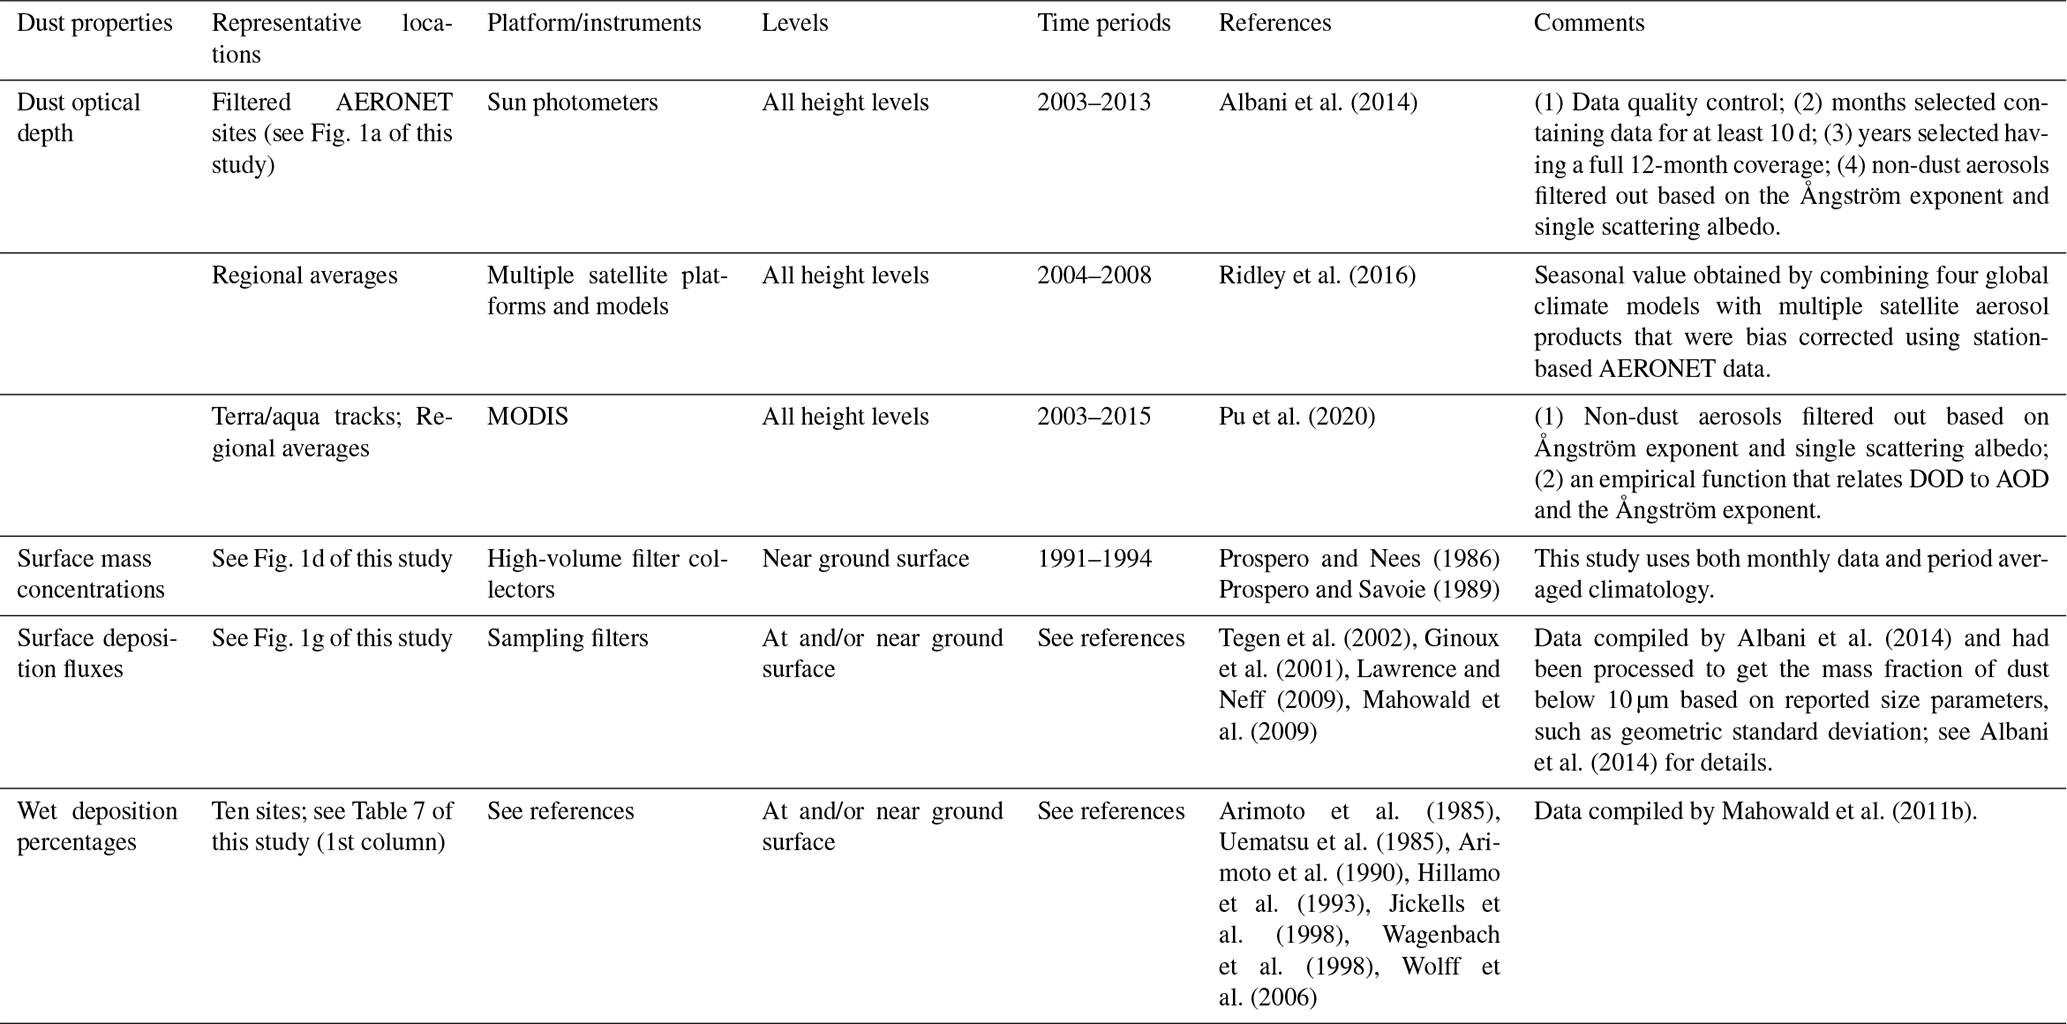
Tables 3–5 summarize available datasets used to evaluate the model performance, detailed descriptions about each datum, and how they are used in the model–data comparison. Due to limitations in precisely matching the period and locations between model results and data, the evaluations focus on checking if models can capture overall features of the observed dust cycle and the corresponding dust DRE efficiency. We summarize limitations going beyond this mismatch on period and location and common in all the model–data comparisons in Sect. 7.
3.1 Surface dust concentrations and dust aerosol optical depth from AERONET
We used monthly surface dust concentration data that Albani et al. (2014) compiled from measurements made using high-volume filter collectors at the University of Miami Ocean Aerosol Network and station-based data that have been previously compiled on annual averages (Mahowald et al., 2009; Zuidema et al., 2019). Because the model only simulates dust < 10 µm (the cut-off value of aerosol size) in diameter, the Albani et al. (2014) compilation had been processed to estimate the flux of dust below the size cut-off according to reported or assumed parameters (e.g., geometric standard deviation) for the size distribution of transported dust. Simulated DOD is compared to AERONET retrievals, which were subject to data quality control and station selection based on the dust dominance in the reported aerosol optical depth (AOD). The data quality control includes a minimum of 10 d per month that contains valid retrievals, the annually averaged Angstrom Exponent < 1.2 (the larger the value, the smaller the aerosol size), and a full coverage of the data availability through a year within the observation period (Albani et al., 2014).
3.2 Surface dust deposition fluxes
The dust deposition flux data used here include those that Albani et al. (2014) compiled from publications (Tegen et al., 2002; Ginoux et al., 2001; Lawrence and Neff, 2009; Mahowald et al., 2009) for the present-day climate. Since the model only simulates dust < 10 µm in diameter, the Albani et al. (2014) compilation was processed to estimate the surface deposition fluxes of dust below the size cut-off, according to reported or assumed parameters (e.g., geometric standard deviation) for the size distribution of transported dust.
Table 3Observed/retrieved cycle for dust model evaluations including optical depth, surface mass concentrations, surface deposition fluxes, and wet deposition percentages. AERONET: Aerosol Robotic Network; MODIS: Moderate Resolution Imaging Spectroradiometer; AOD: aerosol optical depth; DOD: dust optical depth.
3.3 Size distributions of dust aerosol
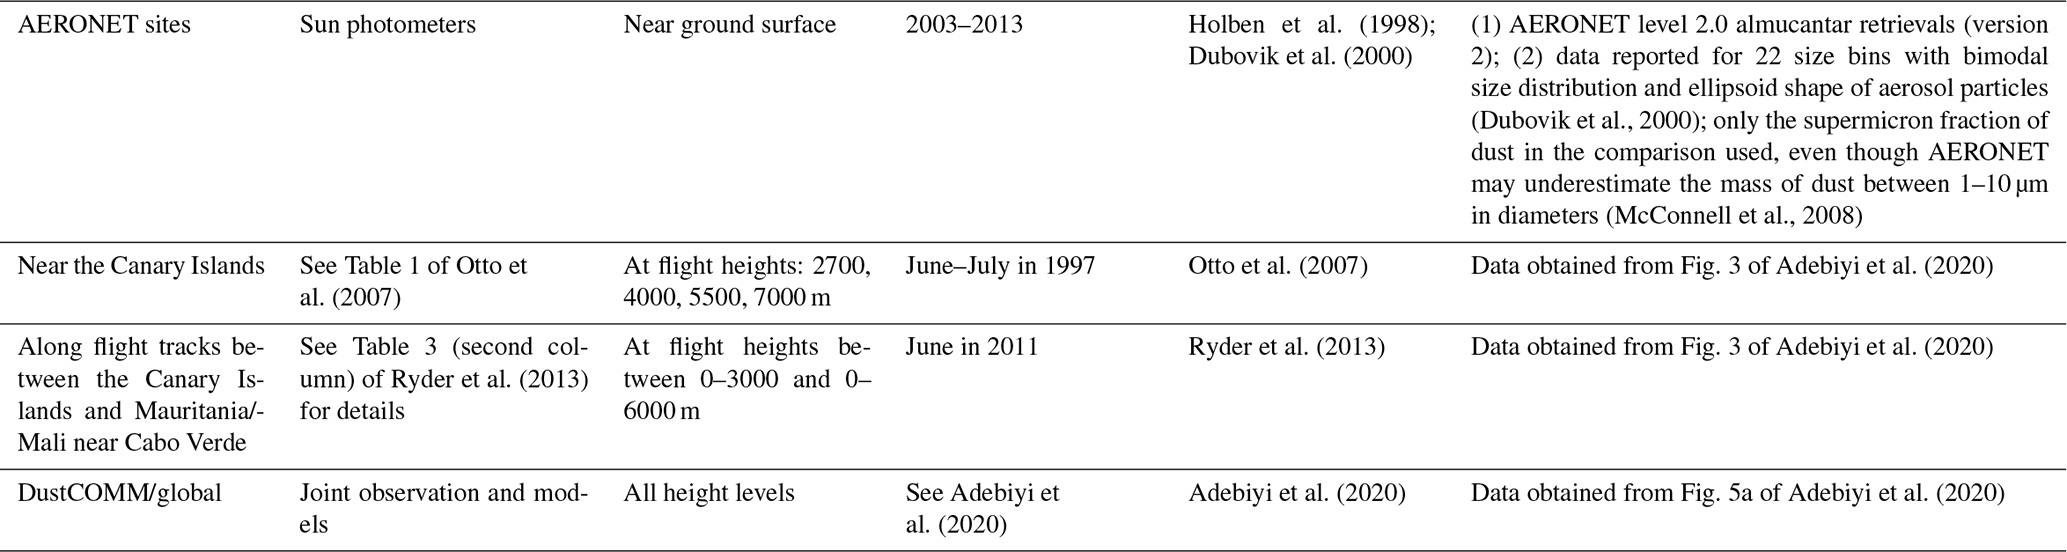
Most of the remotely sensed, size-resolved dust volume retrievals used here were taken from the AERONET level 2.0 almucantar retrievals (version 2), which is reported for 22 size bins with bimodal size distribution and ellipsoid shape of aerosol particles (Dubovik et al., 2000). These data overestimate dust mass in the submicron size range and have possible contamination by non-dust aerosols (Albani et al., 2014; Dubovik et al., 2000; Mahowald et al., 2014). We therefore only retained the supermicron fraction of dust in the comparison, even though AERONET may underestimate the mass of dust between 1–10 µm in diameters (McConnell et al., 2008). The data processing procedure is detailed in Albani et al. (2014). Near North Africa, we also compare the modeled size distribution of dust aerosols with measurements from Otto et al. (2007) taken in the vicinity of the Canary Islands, from Ryder et al. (2013) by aircraft with a track between the Canary Islands and Mauritania/Mali, and from Ryder et al. (2018) near Cape Verde.
Table 4Measured/retrieved dust size distribution for model evaluations. AERONET: Aerosol Robotic Network; DustCOMM: Dust Constraints from joint Observational–Modelling–experiMental analysis.
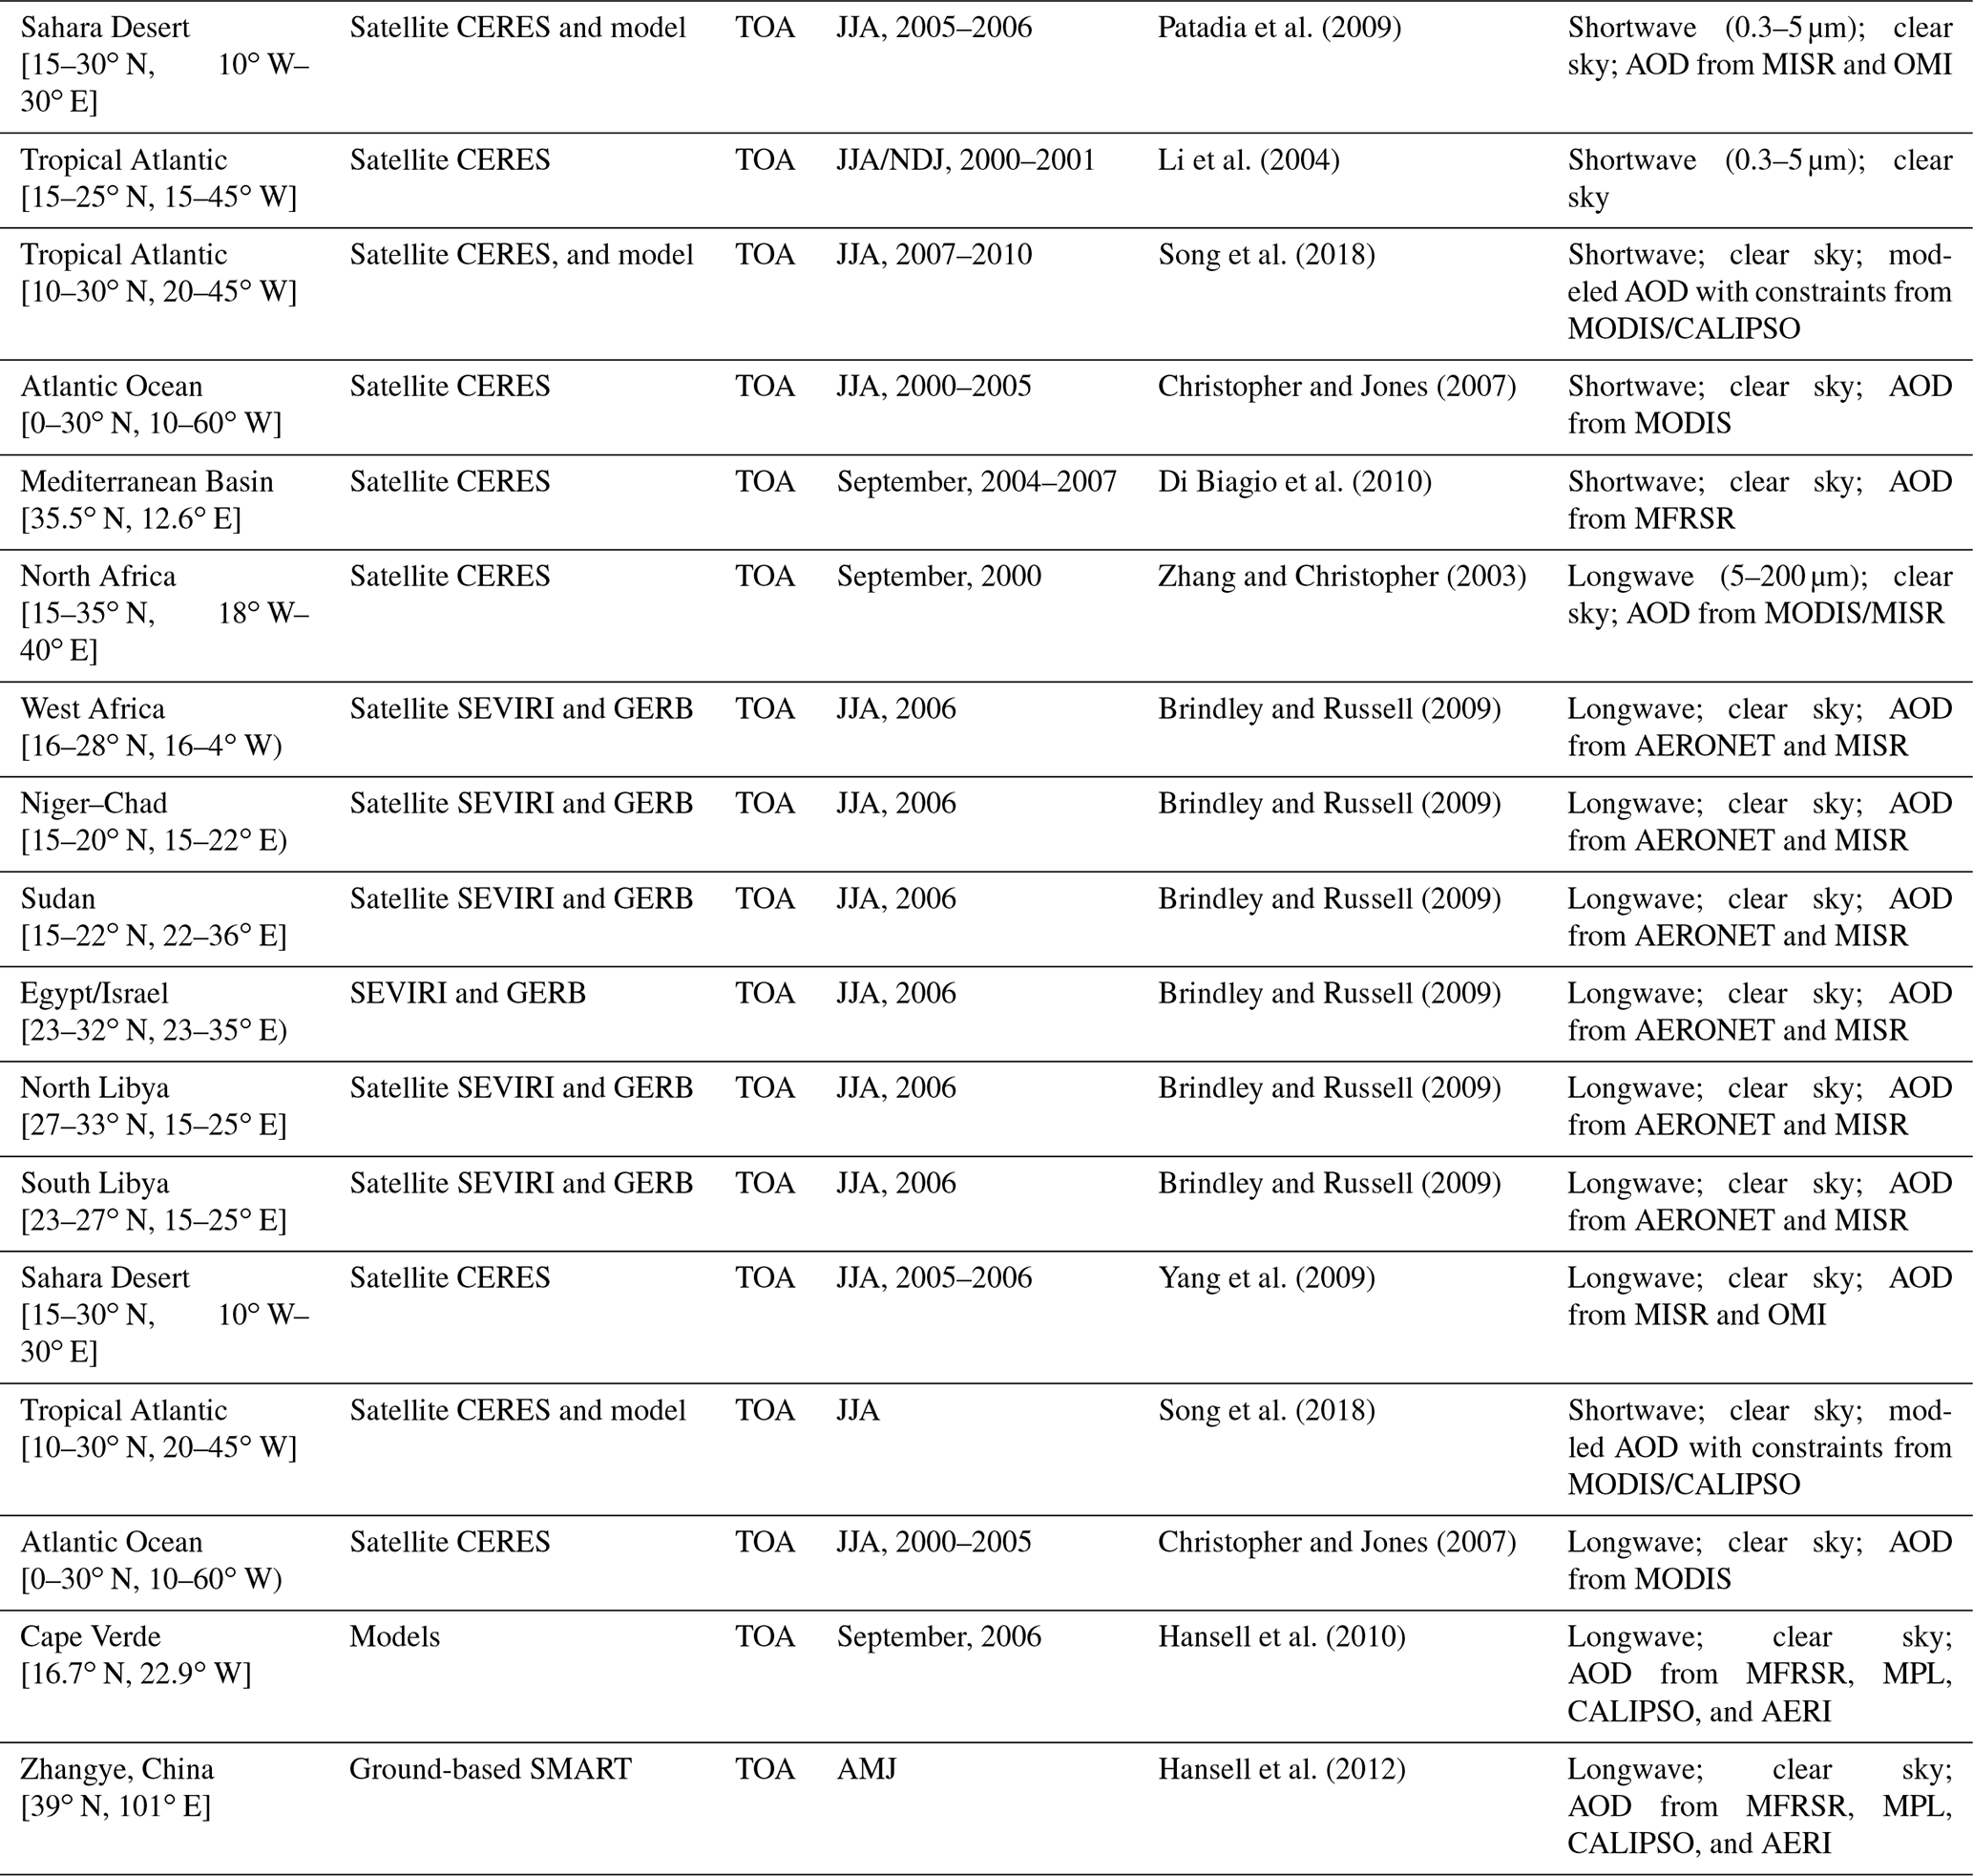
3.4 The direct radiative effect efficiency of dust
The modeled dust DRE efficiency (ratio of dust DRE to DOD) is compared to satellite-based observations under clear-sky conditions at the top of the atmosphere. These observations include the following:
-
Longwave dust DRE efficiency derived over North Africa by Zhang and Christopher (2003) for September 2000 based on measured longwave (5–200 µm) fluxes at the top of the atmosphere from the Multi-angle Imaging SpectroRadiometer (MISR), and the Clouds and the Earth's Radiant Energy System (CERES) instrument and AOD at 0.55 µm from Moderate Resolution Imaging Spectroradiometer (MODIS).
-
The shortwave (0.3–5 µm) dust DRE efficiency obtained by Li et al. (2004) with the measured shortwave flux from CERES and AOD at 0.55 µm from MODIS near North Africa (15–25∘ N, 45–15∘ W) in the summer to winter months between 2000 and 2001.
-
The shortwave (0.3–5 µm) dust DRE efficiency that Patadia et al. (2009) derived using a 1-D radiative transfer model, radiative fluxes from CERES, and AOD at 0.55 µm from MISR and Ozone Monitoring Instrument (OMI) over the high-reflective regions (surface albedo and 0.55 µm > 0.35) of Saharan desert (15–30∘ N, 10∘ W–30∘ E) for the summer months in 2005 and 2006.
Table 5Retrieved dust direct radiative effect efficiency (DREE) for model evaluations. CERES: Clouds and the Earth's Radiant Energy System; TOA: top of the atmosphere; JJA: June, July, and August; AOD: aerosol optical depth; MISR: Multi-angle Imaging SpectroRadiometer; OMI: Ozone Monitoring Instrument; NDJ: November, December, and January; MODIS: Moderate Resolution Imaging Spectroradiometer; CALIPSO: Cloud–Aerosol Lidar and Infrared Pathfinder Satellite Observations; MFRSR: MultiFilter Rotating Shadowband Radiometer; SEVIRI: Spinning Enhanced Visible and Infrared Imager; GERB: Geostationary Earth Radiation Budget; AERONET: Aerosol Robotic Network; MPL: micro-pulse lidar; AERI: Atmospheric Emitted Radiance Interferometer; SMART: Surface-sensing Measurements for Atmospheric Radiative Transfer; AMJ: April, May, and June.
3.5 Other datasets
In addition to the abovementioned observations, we compare our results to datasets which combine model simulations and observations. Specifically, we compare (1) the modeled transported dust size distribution with that from the Dust Constraints from joint Observational–Modelling–experiMental analysis (DustCOMM) (Adebiyi et al., 2020) in global average; (2) regional dust deposition fluxes with the semi-observational data that were inverted based on an integration of a global model ensemble and quality-controlled observational constraints on the transported dust size distribution, extinction efficiency, and regional DOD (Kok et al., 2021a); this set of semi-observational data were shown to compare better with the high-quality measurement than model ensemble means or any individual model (Kok et al., 2021a); and (3) regional DOD in different seasons with the estimates of Ridley et al. (2016), who obtained DOD by combining four global climate models with multiple satellite aerosol products that were bias corrected using station-based AEROENT data.
Metrics used to evaluate the model performance against observations include the root mean square error (RMSE) and correlation efficient (Kendall's τ or Spearman's correlation). Both the Kendall's τ and Spearman's correlation are non-parametric methods which do not require a distribution of the data, such as Gaussian or normal. For dust deposition and loadings, correlations were calculated to assess how well models reproduce both their regional climatology mean or one-time observation and the seasonal cycles. However, because of a lack of reliable monthly data, assessments for the dust DRE efficiency, DOD from Ridley et al. (2016) and percentages of wet deposition in the total deposition on spatial variability are based on the regional climatology mean or one-time observations. We tested the correlation significance of the metrics at the statistical confidence level of 95 %. For the dust DRE efficiency and percentages of wet deposition, some domains only have a range available, such as the Sahara Desert (15–30∘ N, 10∘ W–30∘ E) in the longwave spectral range. For those domains, a mean of the low and high boundaries of the range was used in the calculation of the Spearman's correlation and the corresponding significance test.
Each of the modifications made to CAM6.1 (described in Sect. 2.5) is relevant to the modeled dust cycle, and thus relevant to the estimate of dust climatic impacts (e.g., DRE). The proposed new (CAM6.α) and default model versions (CAM6.1) simulate a similar (Fig. S3a: relative change ∼ 16 %; CAM6.α relative to CAM6.1) global mean dust loading of 24 and 29 Tg, respectively, and DOD of 0.032 (Fig. S3c: relative change ∼ 1.3 %) (Table 6). Comparing to the recent estimates that include very coarse dust which are not included in this model, the dust loadings here are well within the range of 22–30 Tg in Kok et al. (2021a) (Table 1 of their study), and are close to the 30 Tg in Adebiyi and Kok (2020). But globally, CAM6.α shows 54 % more dust deposition than in CAM6.1 (Fig. S3b). The general spatial distributions of the relative change of dust loadings, deposition fluxes, and DOD are similar, though the magnitude of this change differs for some regions (e.g., North Africa and India).
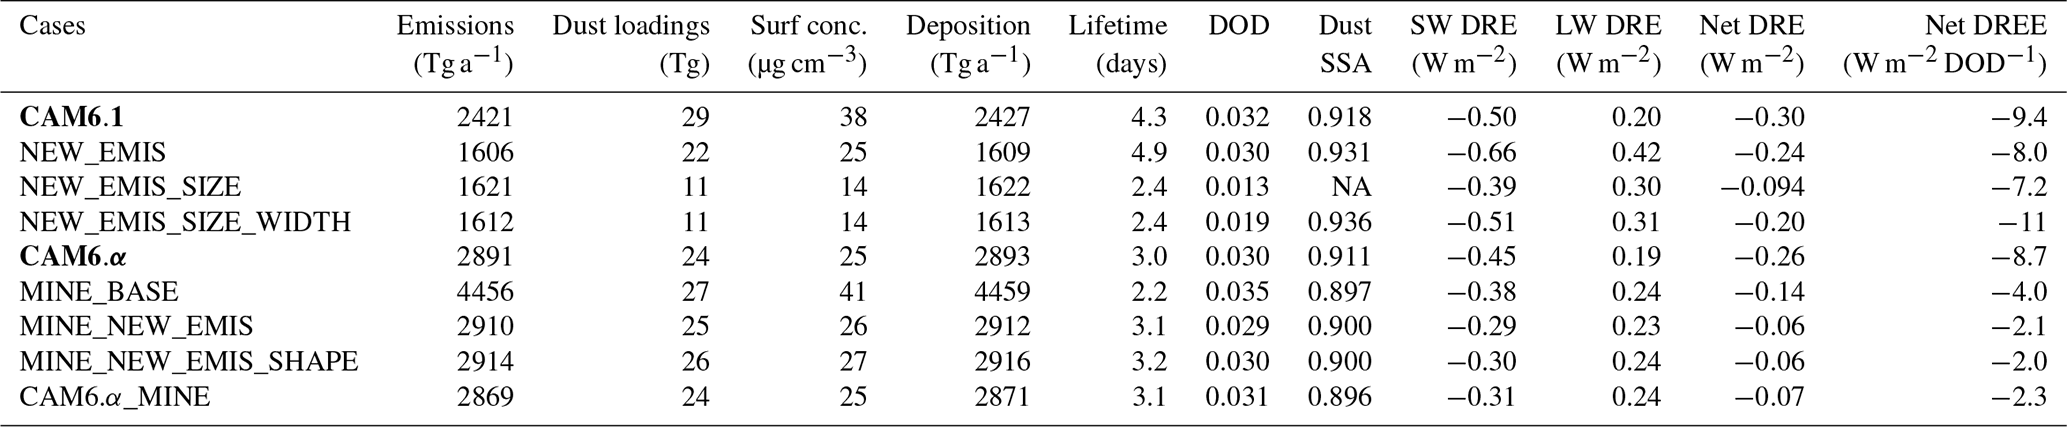
Table 6Simulated annual emission, loading, surface concentration, deposition, lifetime, direct radiative effect (DRE; all-sky conditions), and DREE (DRE efficiency; clear-sky conditions) of dust speciated by mineralogy and bulk-dust CAM6 with offline dynamics. The longwave DRE by dust was augmented by 51 % (Dufresne et al., 2002) to account for dust scattering which is not represented in CAM by default. Dust optical depth (DOD) and single scattering albedo (SSA) shown are for the CAM6.1 visible band centered at 0.53 µm. The global mean dust SSA was calculated over model pixels where DOD/total AOD (aerosol optical depth) > 0.5 as previously done (Scanza et al., 2015; Li et al., 2021). CAM6.α and CAM6.1 in bold represent the proposed new and default model versions, respectively. NA – not available
5.1 Evaluation of model performance and improvements on the dust cycle modeling
5.1.1 Dust emissions
To achieve the global mean DOD of ∼ 0.030, CAM6.α requires a dust emission of 2891 Tg a−1 (Table 6), which falls below the estimate of 3400–9100 Tg a−1 by Kok et al. (2021a; their Table 1) that accounts for dust between 0.1–20 µm in diameter and above the median, 1123 Tg a−1, reported in AEROCOM phase I (Huneeus et al., 2011). The dust emission in CAM6.1 is also much lower than their estimate: 2421 Tg a−1, which is however higher than the previous estimate (1490 Tg a−1) with the same emission scheme (DEAD) and dust size range (< 10 µm) but using the binned method (Zender et al., 2003a).
There are no dust emission estimates from observations at a global-scale coverage. We thus infer the model performance on simulating dust emissions using model–data comparisons on the surface dust concentration and deposition flux. Note that such an evaluation of emission is probably achievable only when the observation site is close to the dust source. Otherwise, the reasoning would become incorrect, because of probable additional errors from the model representation on processes of dust transport and deposition, and interaction of dust with non-dust aerosols (e.g., sea salt and biomass burning). As will be seen in Sect. 5.1.2–5.1.4, in most of the grid cells containing the observational sites in North Africa, all experiments overestimate the deposition fluxes (Fig. 1g) and the surface dust concentrations (at Bani). This might suggest that when turning the global DOD toward ∼ 0.030, the model with the current settings and modifications probably overestimates dust emissions from North African sources, which is also shown in Kok et al. (2021a) using an integrated model ensemble and observational constraints. The smoother distribution of the dust emission in BRIFT than DEAD is due primarily to the use of the source function in DEAD that shifts dust emissions toward the most erodible soil, while in BRIFT, the near-surface friction velocity frequently exceeds the calculated threshold wind fraction velocity, causing dust to emit at more grid cells.
The locally emitted dust from the high-latitude region (> 50∘ N and < 40∘ S) in CAM6.α constitutes ∼ 1.6 % of the global total emitted dust flux, which is below the estimate of ∼ 5 % (2 %–3 % for each hemisphere) derived from field and satellite observations (Bullard et al., 2016; Bullard, 2017). Especially for the northern high-latitude region, where local dust sources may dominate the near surface dust concentrations (Groot Zwaaftink et al., 2016), CAM6.α substantially underestimates its contribution to the global dust (< 0.1 %). This underestimation is what we expected, since the new scheme is designed to simulate dust emissions in low-latitude regions predominantly from the impact of saltators (Kok et al., 2012), and thus may not well capture the high-latitude dust emissions which occur through different physical processes.
In comparison, despite missing dust sources > 60∘ S (Fig. 2a), CAM6.1 may overestimate the contribution of the high-latitude dust emission to the global dust total emission (8.0 %). We attribute the much higher dust emission in the southern high-latitude region in CAM6.1 primarily to the higher emission from the South American sources (i.e., the Patagonian Desert) than in CAM6.α. This much higher dust emission is not due to local dust emissions from the Antarctic, because the local emission in the Antarctic though exists (Delmonte et al., 2013; Meinander et al., 2022; and Fig. 2b), it is weaker in strength (the contribution percentage < 0.01 %) than Patagonian deserts (Fig. 2b), and the two models (CAM6.1 and CAM6.α) also simulate a percentage contribution of dust emission from the Antarctic sources comparable to each other.
Since both dust emission schemes are far from perfect in reproducing the percentage contribution to the global dust emission and thus probably the high-latitude dust loadings, especially in the Arctic (i.e., Fig. 1e of Shi and Liu, 2019) where dust aerosol could impose big impacts on polar clouds (Shi et al., 2022), a regional tuning of the local emission in the high-latitude regions is needed to better quantify the DRE and indirect radiative effect by dust there.
5.1.2 Climatology annual means of dust optical depth, surface concentrations, and deposition fluxes
In over 90 % of the measurement sites, all models reproduce the climatology of DOD from AERONET retrievals, the surface concentration, and deposition within a factor of 10 (Figs. 1 and S4), with the spatial correlation between the models and observations statistically significant. Analysis of the spatial correlation (Pearson; R) and root mean square error (RMSE) suggests a substantial and statistically significant improvement in simulating DOD close to the source region (Fig. 1c versus Fig. 1b: R2=0.63 versus 0.41 for CAM6.α and CAM6.1, respectively, in log space; RMSE = 0.30 versus 0.41 in log space). Note we obtained the RMSE in log space which removes the dominant influence of stations with high DOD (e.g., sites in North Africa and Middle East). So the reduced bias is because the new model better captures DOD over North Africa and Australia. Compared to the improvement in DOD, the modifications do not notably better improve modeling the surface dust concentrations (Fig. 1f versus Fig. 1e: R2=0.86 versus 0.75 for CAM6.α and CAM6.1, respectively; similar RMSE ≈ 0.70 in both models) and dust deposition (Fig. 1i and h; R2: 0.78 versus 0.69 and RMSE = 0.85 versus 0.97 g m−2 a−1). This is mainly because the model's ability to simulate DOD, especially close to source regions, is subject to fewer potential errors than for surface dust concentration and deposition, which also requires the model to simulate a correct vertical distribution. Therefore, the model's ability to reproduce DOD close to the source region appears to be improved at most of the sites (33 out of a total of 36 sites; especially in Australia as shown in Fig. 1a), but this improvement does not propagate to simulations of the dust surface concentrations (Fig. 1d: improvement at 24 out of a total of 47 sites) and deposition (Fig. 1g: improvement at 62 out of a total of 108 sites).
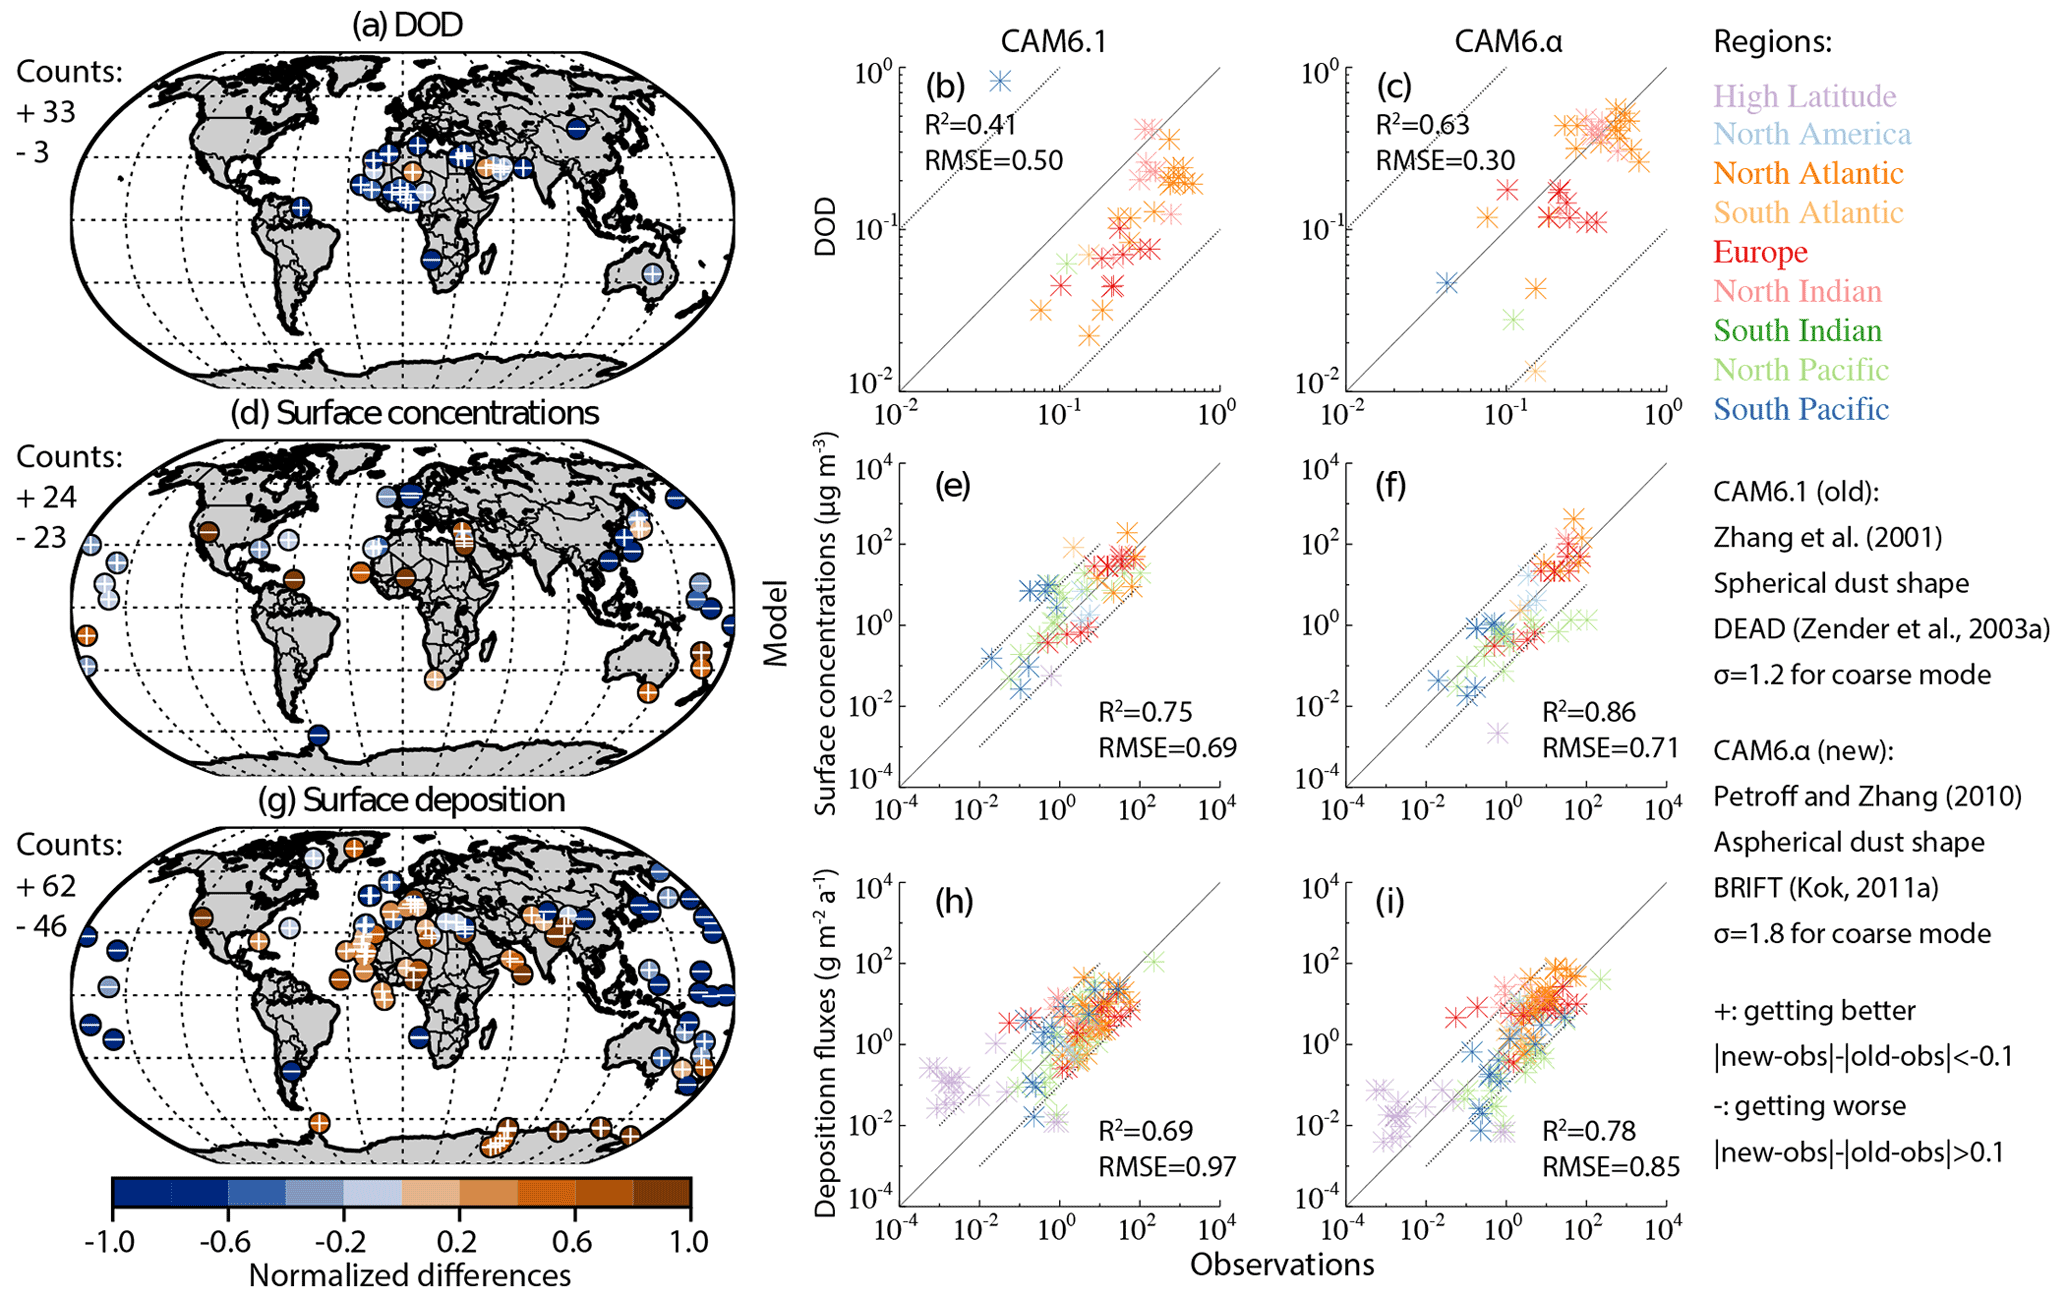
Figure 1Model–observation (AERONET) comparison for DOD (dust optical depth) at the visible band centered at 0.53 µm (a, b, c), dust surface concentrations (d, e, f), and surface deposition fluxes (g, h, i). Colored dots in (a), (d), and (g) show the difference between the proposed new model (CAM6.α) and observations. White symbols indicate the new model CAM6.α improves (plus sign) or worsens (minus sign) the model–observation comparison over that between the default model (CAM6.1) and observations with the metric included in the bottom right-hand corner of the figure. Numbers listed in (a), (d), and (g) are counts of the number of improved or worsened stations. The spatial correlation coefficients between model (CAM6.1: b, e, and h; CAM6.α: c, f, and i), and observations were calculated based on the annual mean values in log space (the log of each model and observational value was taken before calculating the correlation coefficient, since the values span several orders of magnitude except DOD). Dashed lines in the scatter plot show 10:1 or 1:10 lines.
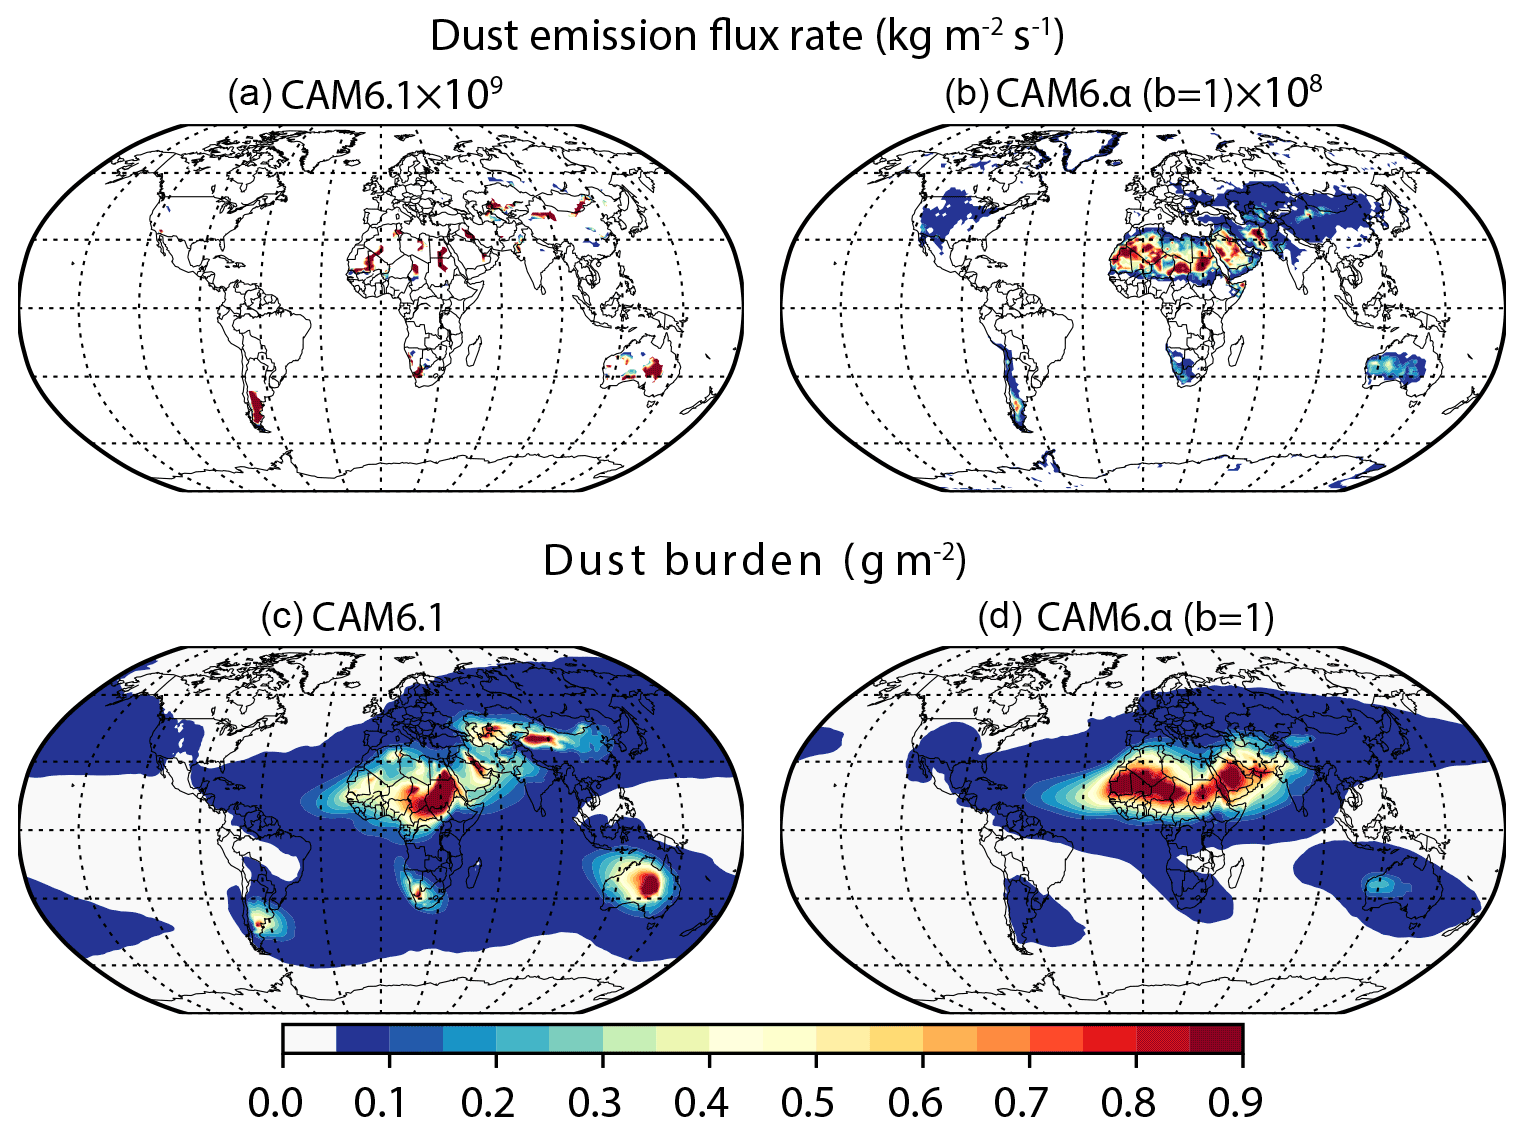
Figure 2Dust emission flux rate (kg m−2 s−1; panels a and b) and dust burdens (c, d) simulated in default CAM6.1 (panels a and c; dust emission flux rate rescaled up by 109) and new model CAM6.α with the threshold gravimetric water content calculated following Fécan et al. (1999) using unity tuning factor (b=1 in panels b and d; dust emission flux rate rescaled up by 108 in panel b).
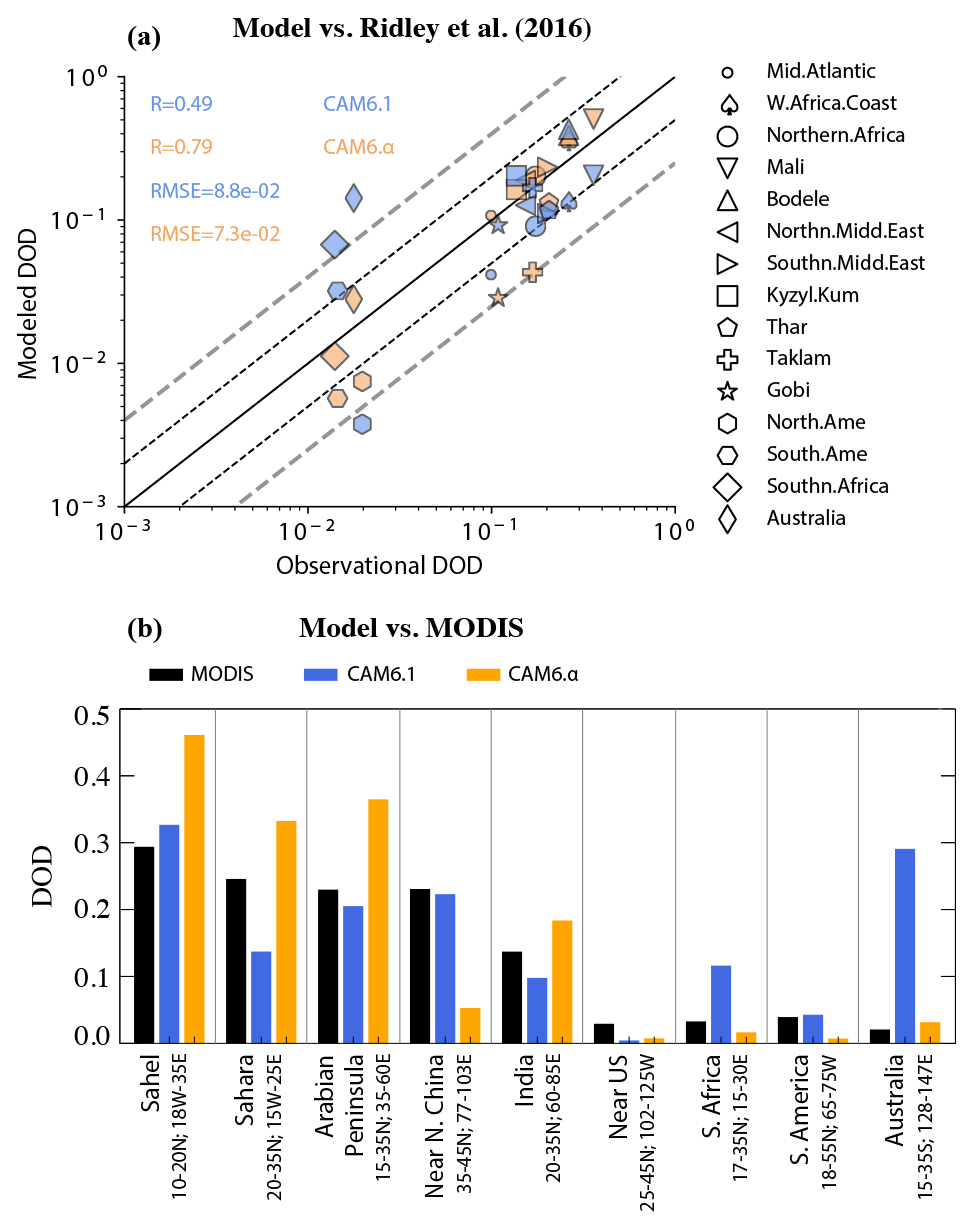
Figure 3Modeled DOD in CAM6.1 (blue) and CAM6.α (orange) in comparison with that from Ridley et al. (2016) at sub regions as defined in their Fig. 1 and from MODIS retrievals (b) at sub regions (see x axis labels). Both correlations, shown as the Kendall's τ in panel (a), are statistically significant at the 95 % confidence level. Black and gray dashed lines in panel (a) represent a factor of 2 and 4 differences.
Improvements are also seen if the climatologic DOD is compared to regional averages of the observationally constrained DOD in Ridley et al. (2016) (Fig. 3a). The new model CAM6.α substantially improves the modeled DOD, increasing the correlation (Kendall's τ coefficient) from 0.49 to 0.79, and reducing RMSE from 0.088 to 0.077, compared to CAM6.1. Spatially, CAM6.α better captures the regional DOD averaged over Australia and South Africa, which is consistent with comparison to the regional MODIS DOD (Fig. 3b). Over Taklamakan and Gobi deserts, however, the new model greatly underestimates the regional DOD compared to both estimates from Ridley et al. (2016) (Fig. 3a) and MODIS DOD (Fig. 3b; near northern China), whereas the default CAM6.1 works better, due very likely to lower dust emissions in the source regions in CAM6.α than in CAM6.1 (Fig. 2b versus Fig. 2a). Comparing with both datasets suggests that the new model may overestimate the regional DOD over North Africa and the Middle East within a factor of 2. Despite the imperfect match on the period between data and model, this overestimated regional DOD probably results from the retuning method, which provides more credits to dust emissions from North Africa and the Middle East. This overestimated DOD in the model near the source regions resulting from the tuning method may also partly explain the imperfect match between the modeled and AERONET-based DOD (Fig. 1a).
The underestimation in the surface dust concentration and overestimation in deposition occurring at several sites (near the El Djouf; near the Antarctic from our model in all cases; Fig. 1d versus Fig. 1g) is noteworthy. At some sites, such as King George in the Antarctic (62∘ S, 58∘ W), this phenomenon had been previously revealed by studies with multiple model ensemble mean or individual models, including an earlier version of CAM, model–data integrated study (Kok et al., 2021a), in the results of models other than CAM6.1, such as GFDL Atmospheric Model (version 2) (Li et al., 2008), and in earlier versions of CAM (Albani et al., 2014).
We suggest that the phenomenon occurs likely in part due to the following. (1) Model errors occur in simulating dust wet and dry deposition which are substantially larger than in simulating DOD and surface concentrations (Kok et al., 2021b). In addition to errors in dust emissions, and the parameterization of the dry and wet deposition schemes, MAM4 in CAM6.1 represents dust transport as an internal mixture with other species (e.g., sea salt) in the accumulation and coarse modes (Liu et al., 2016), which may have unduly increased the particle size and hygroscopicity, and thus the removal rate (dry and wet) of dust during transport to the sites (i.e., King George). (2) Dust sources are possibly misrepresented in the Southern Hemisphere in the model. With current emission sources, the increase of the emission rate with BRIFT from Patagonia compared to DEAD slightly mediates the underestimation of dust surface concentration at King George. A further increase of the dust emission may help reduce the underestimation of dust deposition in land and the surface concentration at King George, but it would then exacerbate the bias in simulating the surface deposition at that site. (3) The limited observation period could result in the climatology representative issue, considering the episodic character of dust events. This limitation due to observation period may be particularly important for observed dust in the Southern Hemisphere where the dust quantities tend to be more episodic than in the Northern Hemisphere (Mahowald et al., 2011b).
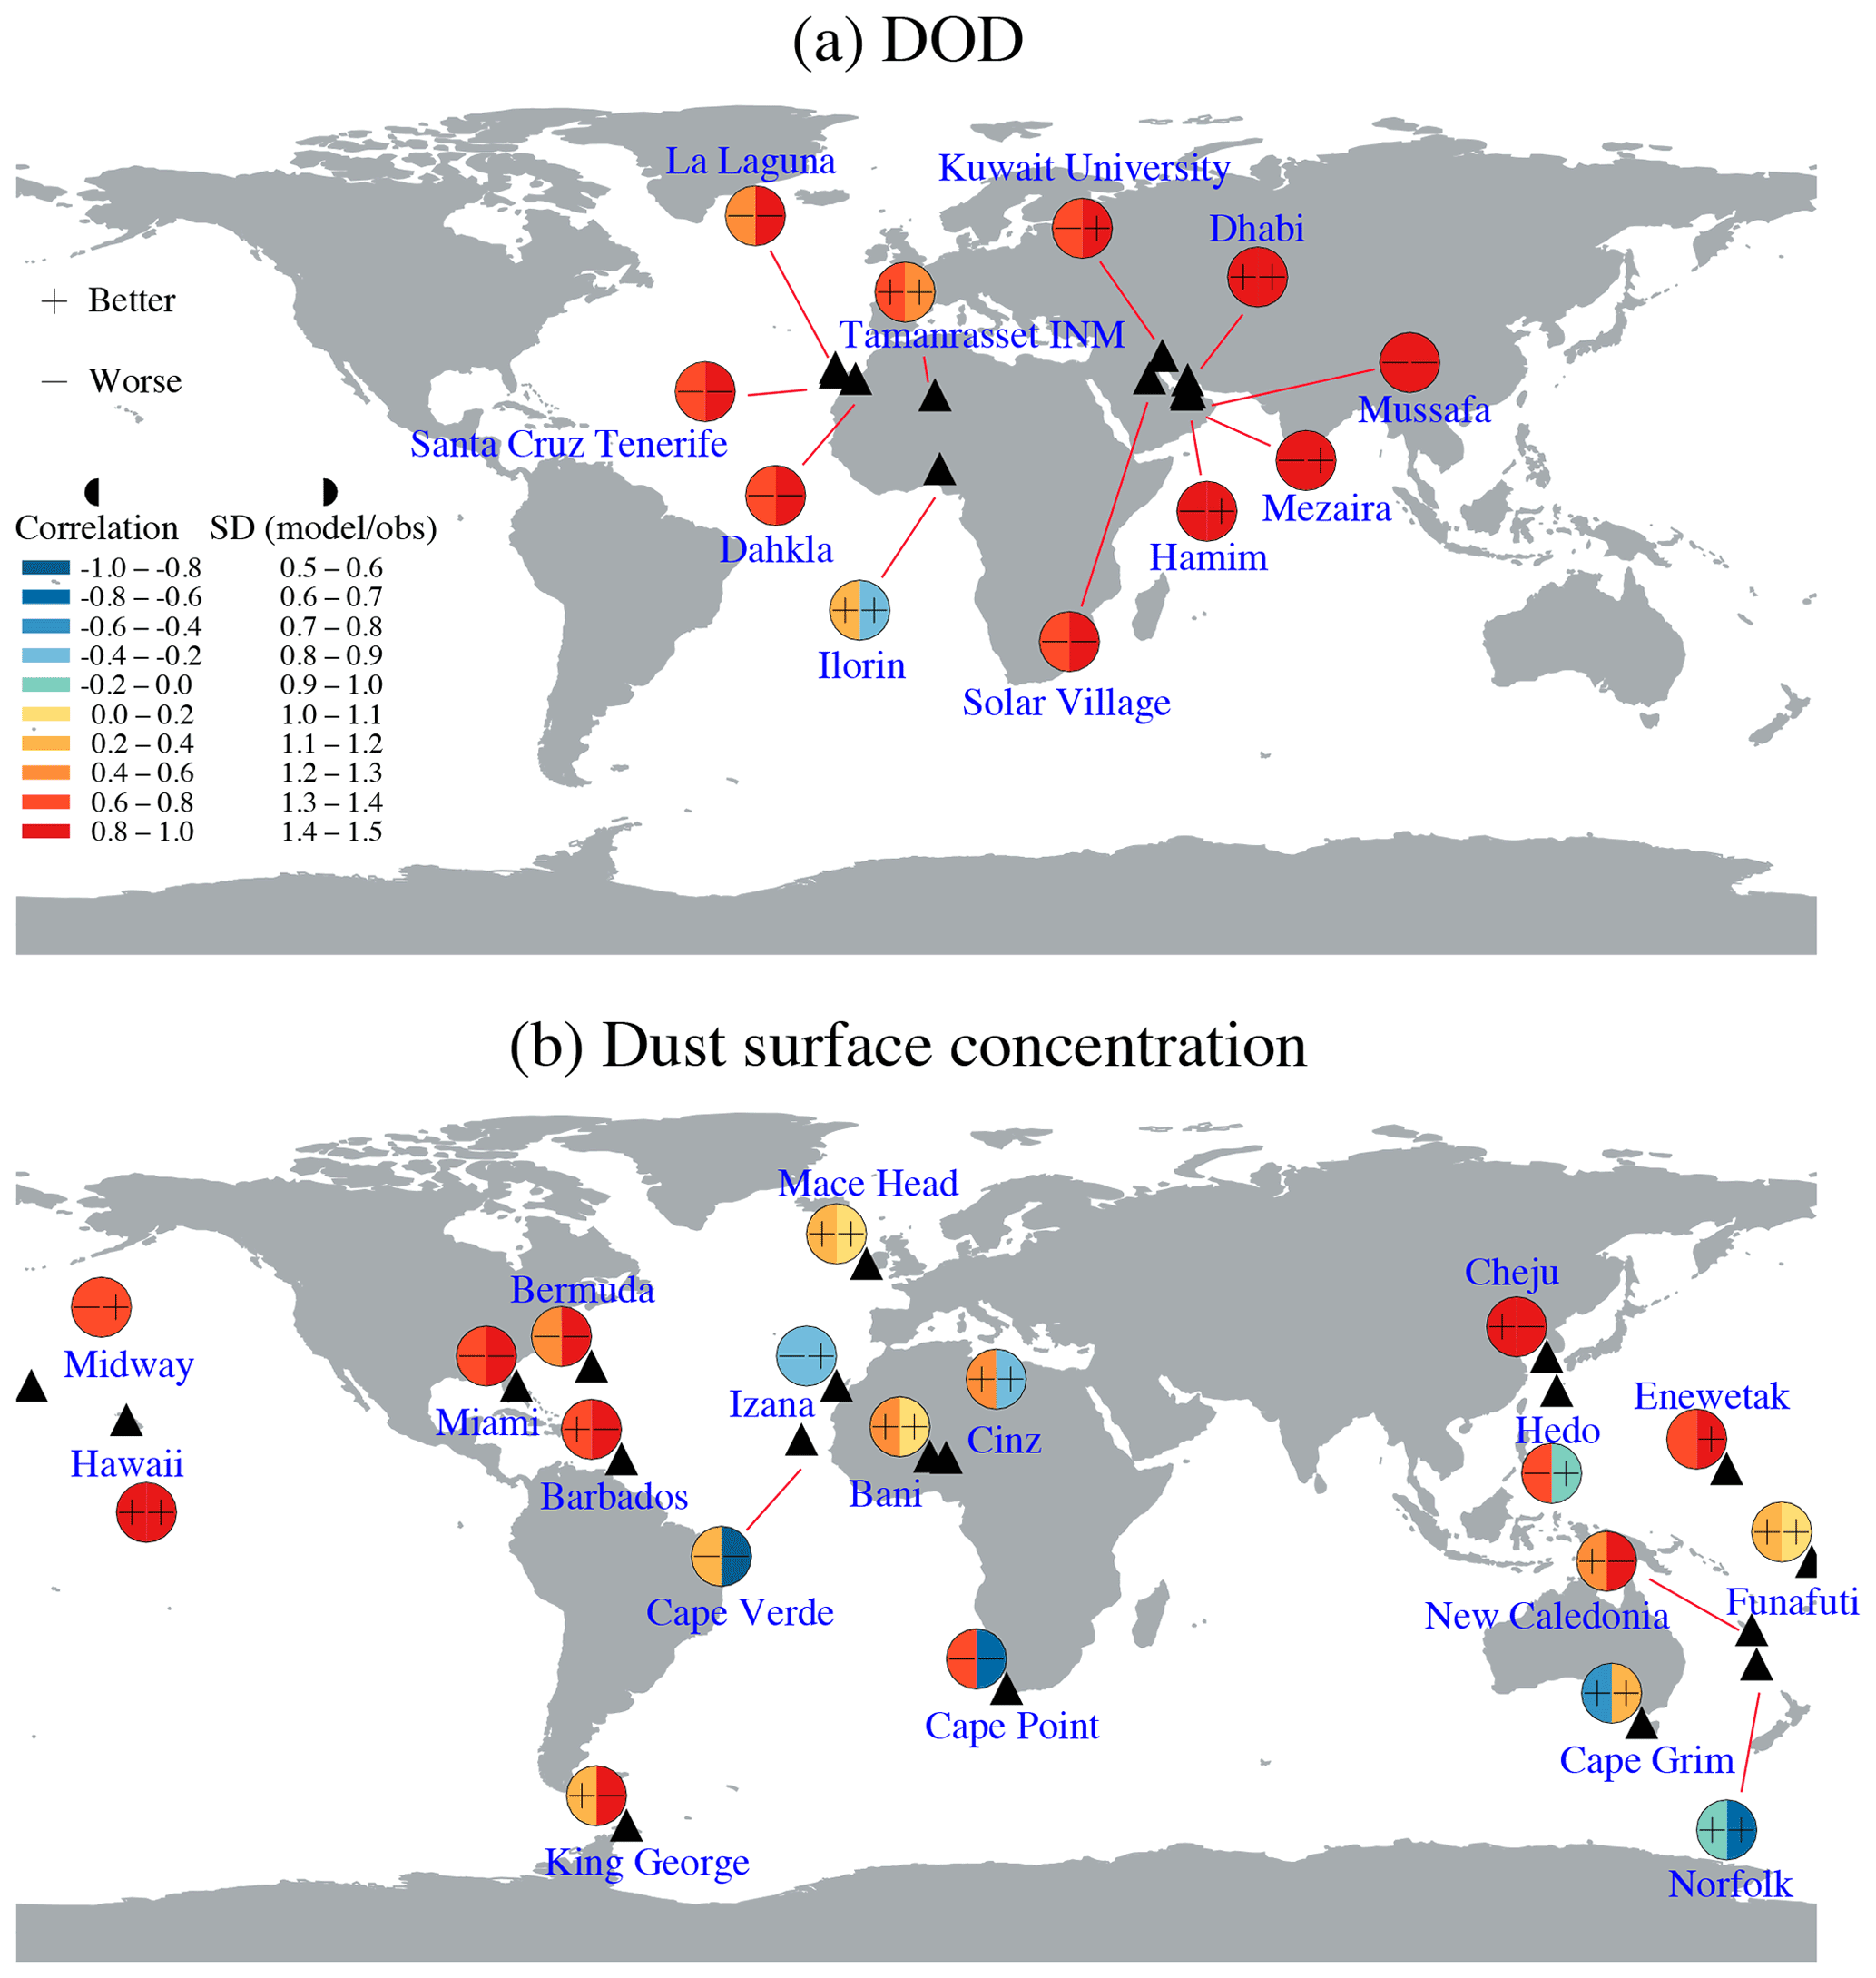
Figure 4Modeling performance for the seasonal cycle of DOD (a) and dust surface concentrations (b) by CAM6.α (new model) against in situ (site names listed in the figure) measurements, relative to the performance of CAM6.1 (default model) against in situ measurements (improvement, degradation, no change indicated by “+”, “−”, and none characters, respectively). Colored left and right semi-circles represent Kendell's τ coefficient between CAM6.α and observations and the ratio of standard deviation (CAM6.α over observation; each normalized by annual mean values), respectively.
As to the relative importance of dry and wet deposition, we find that the dust wet deposition may dominate the total deposition of dust in the remote oceanic area (Fig. S5a; Table 7), and thus affects the long-range dust transport. The models tend to overestimate the observed percentages of the wet deposition (Table 7). This overestimation could be due partly to the internal mixing assumption of dust aerosols with sea salts which increases hygroscopicity of the aerosol mixture during transport. Correcting the coarse-mode distribution, following we suggest (Table 1), does not help improve the model performance (Table 7). With that said, a recent study had shown that the CMIP6 models overestimate the precipitation frequency, particularly for the light precipitation (0.1–20 mm d−1) (Na et al., 2020). It could be the same reason – the unduly simulated precipitation frequency in CAM6.1 – that explains the overestimated importance of wet deposition compared to the observations we have here. Therefore, future model changes on the cloud physics that reduce the light precipitation frequency may help better simulate the transport of dust aerosols across zones where frequent precipitation occurs (e.g., the intertropical convergence zone (ITCZ)). Considering the limited observations on the partitioning of the dust total deposition between dry and wet processes however, we cannot draw a concrete conclusion that CAM6.1 overestimates the wet dust deposition fluxes (Table 7).
Table 7Percentage (%) of wet deposition. Observations compiled by Mahowald et al. (2011b) from data at Bermuda (Jickells et al., 1998), Amsterdam Island, Cap Ferrat, Enewetak Atoll (Arimoto et al., 1985), Samoa; New Zealand sites (Arimoto et al., 1990); North Pacific sites (Uematsu et al., 1985); Greenland dye 3 (Hillamo et al., 1993), coastal Antarctica (Wagenbach et al., 1998), and Dome C of Antarctica (Wolff et al., 2006). RMSE: root mean square error; R: Spearman's correlation.
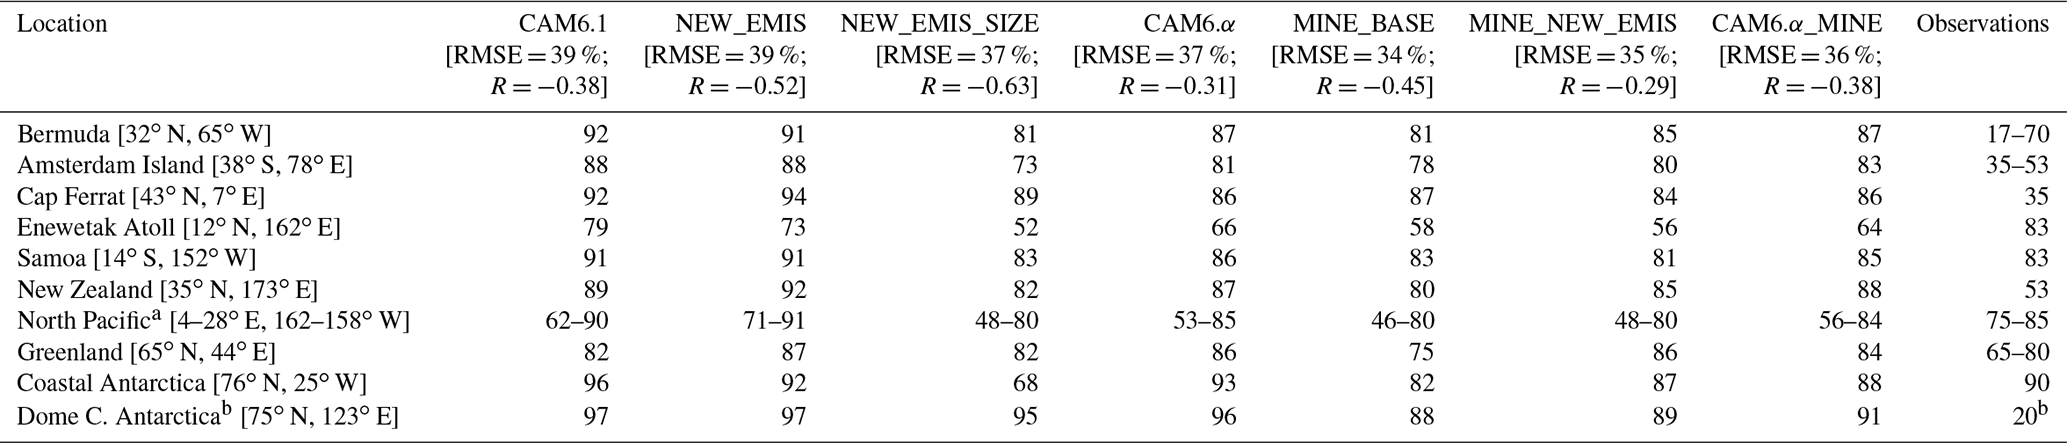
a shown are minimum and maximum of the annual wet percent among the four sites. b Non sea salt-sulfate.
5.1.3 Seasonal cycle of climatology dust optical depth and surface dust concentrations
Dust optical depth
Both CAM6.1 and CAM6.α reasonably reproduce the retrieved seasonal cycle at the selected AERONET sites except Ilorin (Fig. S6), where both models greatly underestimate the observed DOD in winter (Fig. S6b). It is possible that non-dust aerosols (e.g., black carbon) transported from South Africa contaminated the observation, leading to an artificially high DOD during the winter season at that site.
The new model CAM6.α improves both the temporal correlation based on the monthly values and standard deviation, compared to CAM6.1, only at three (Ilorin, Dhabi, and Tamanrasset_INM; Fig. 4a) out of a total of the 11 selected AERONET sites where the measurements cover the whole 12 months in a year (this reduced the number of the total sites, compared to that used in the climatology comparison). Significant improvements on the modeled seasonal cycle of DOD occurs at Tamanrasset_INM (25∘ N, 4∘ E). CAM6.α increases the temporal correlation coefficient from 0.42 to 0.82 (Fig. S6e). Despite the improvement, the new model continues largely overestimating the observed DOD at this site, especially in the peak month of June (Fig. S6e), resulting in an overestimated annual mean DOD.
Similar results are obtained if the seasonal cycle of DOD is compared to model–data constraints on regional DOD in Ridley et al. (2016) (Fig. S7): spatial correlation analysis on the seasonal mean DOD suggests that the new model CAM6.α substantially improves the modeled DOD in all seasons (Fig. S7) with higher correlations that are statistically significant (Fig. S7), compared to simulations using CAM6.1 (e.g., in JJA CAM6.α: R = 0.71 versus CAM6.1: R = 0.48), though CAM6.α does not reduce the RMSEs in all the seasons.
5.1.4 Surface dust concentrations
In terms of temporal correlation and standard deviation for assessing the seasonal cycle, the modifications do not uniformly improve the model performance on reproducing the surface dust concentration (Fig. 4b). Only at 7 out of the 19 sites in total (a reduced number of the total sites, compared to that used in the climatology comparison, due to the removal of sites where there is no full coverage of the measurement over the 12 months in a year) – Bani and Cinz in North Africa, Mace Head in the North Atlantic, Cape Grim in Australia, Funafuti and Norfolk in the Eastern Pacific, and Hawaii in the North Pacific (Fig. 4b) – the modifications result in improvements using both metrics. Examining a third metric, the difference between modeled and observed surface concentration in specific months, we have 13 of the 19 sites where at least half a year shows improvement. Still, the new model overestimates the surface concentration of dust at many of those 13 and the other sites during most months in the year (Figs. S8–S9). This overestimation is particularly pronounced for Cape Verde, likely mainly because of the strong dust emission in western North Africa using BRIFT compared to DEAD. The new model produces significant improvement in terms of all the three metrics at Bani (14∘ N, 3∘ E; Fig. S9i), increasing the temporal correlation from 0.21 (insignificant at the 95 % confidence level) between CAM6.1 and the observations to 0.58 (significant at the same confidence level) between CAM6.α and the observations.
5.1.5 Size distribution of transported dust
Figure 5 shows the simulated size-resolved dust mass compared to AERONET retrievals and in situ measurements. In general, the new model CAM6.α with the mode size distribution from CAM5 better reproduces the retrieved atmospheric size distribution than the default CAM6.1 with the size distribution from CAM6.1 over most sites. At only three sites (La Laguna: 28∘ N, 17∘ W; Santa Cruz Tenerife: 29∘ N, 16∘ W; and Puerto Rico: 18∘ N, 67∘ W) the mass size distribution from CAM6.α becomes evidently worse than from CAM6.1. Compared to CAM6.α, CAM6.1 tends to carry more dust in mass with the diameter > ∼ 5.0 µm, which also overshoots AERONET retrievals in that size range (Fig. 5). This bias in CAM6.1 could be lower for mass of dust > ∼ 5.0 µm, considering that AERONET retrievals might have a bias towards fine dust when compared to in situ measurements (McConnell et al., 2008).
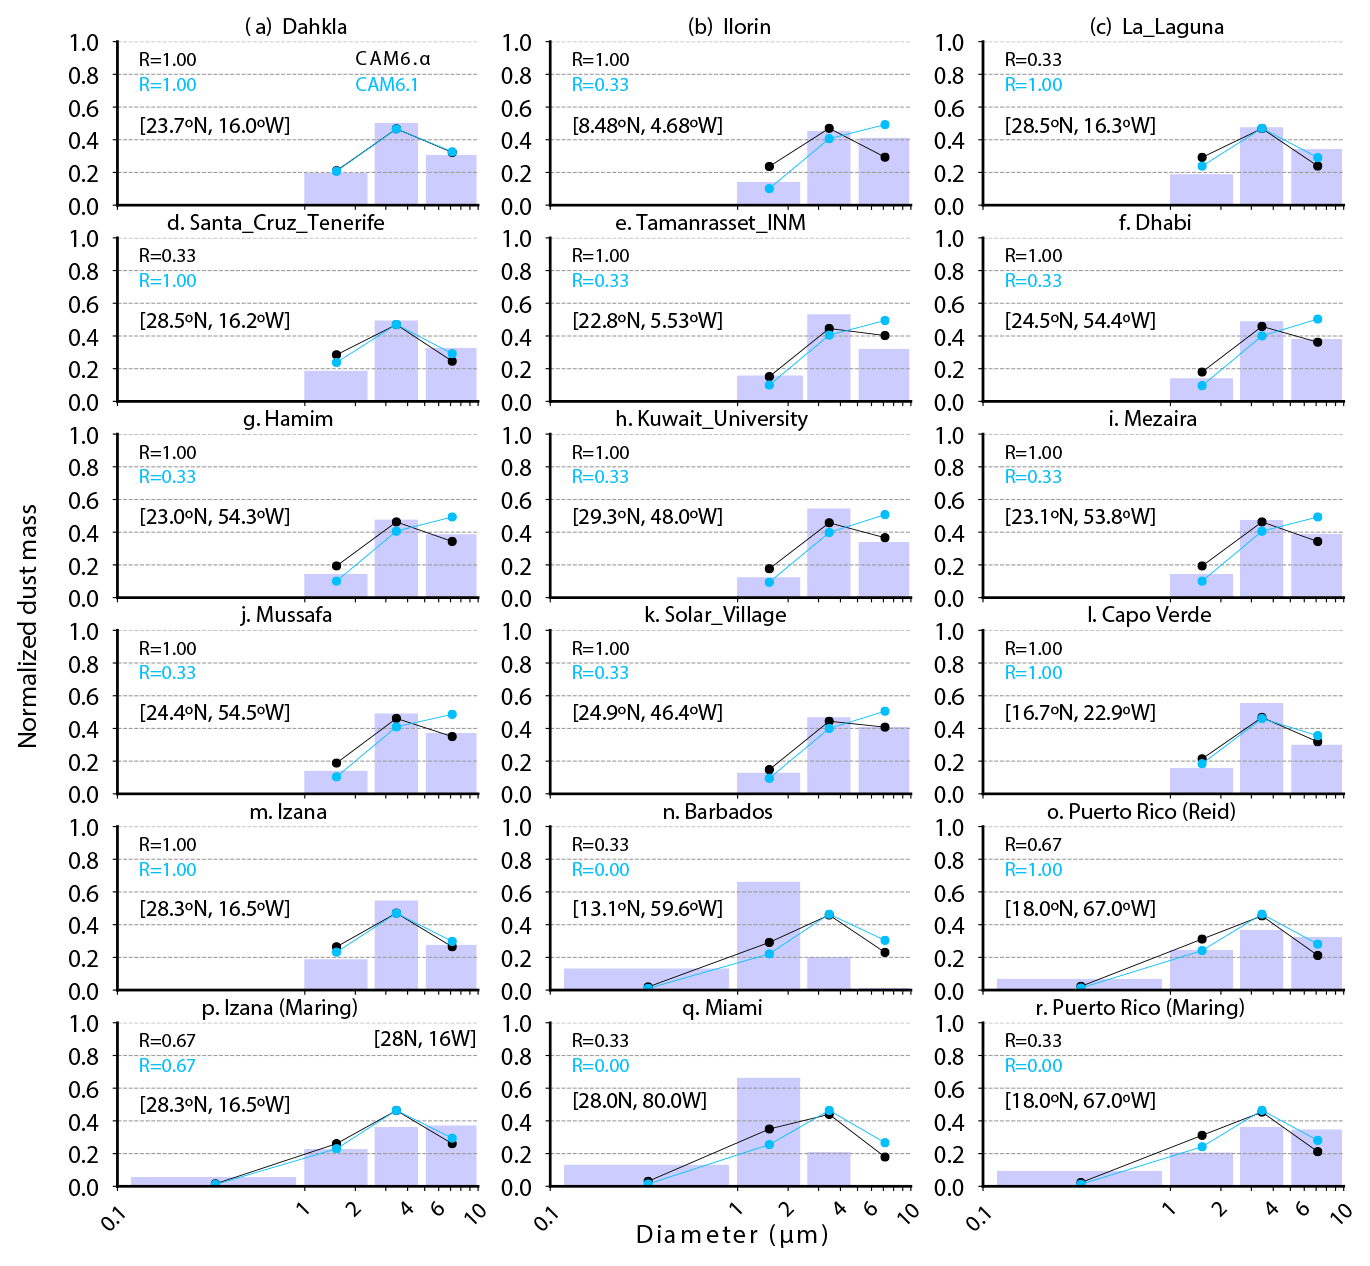
Figure 5Modeled and observed atmospheric size-resolved dust mass in the geometric diameter range of 1–10 µm at AERONET stations. Numbers in each plot indicate the Kendall's τ coefficient between model and observations (blue bars). The model runs here include the one using the old model with the mode size parameters from CAM6 by default (CAM6.1 in cyan) and the other one using the new model with the mode size parameters from CAM5 (CAM6.α in black). In (a), only results from CAM6.1 can be clearly seen because the two lines are overlapping.
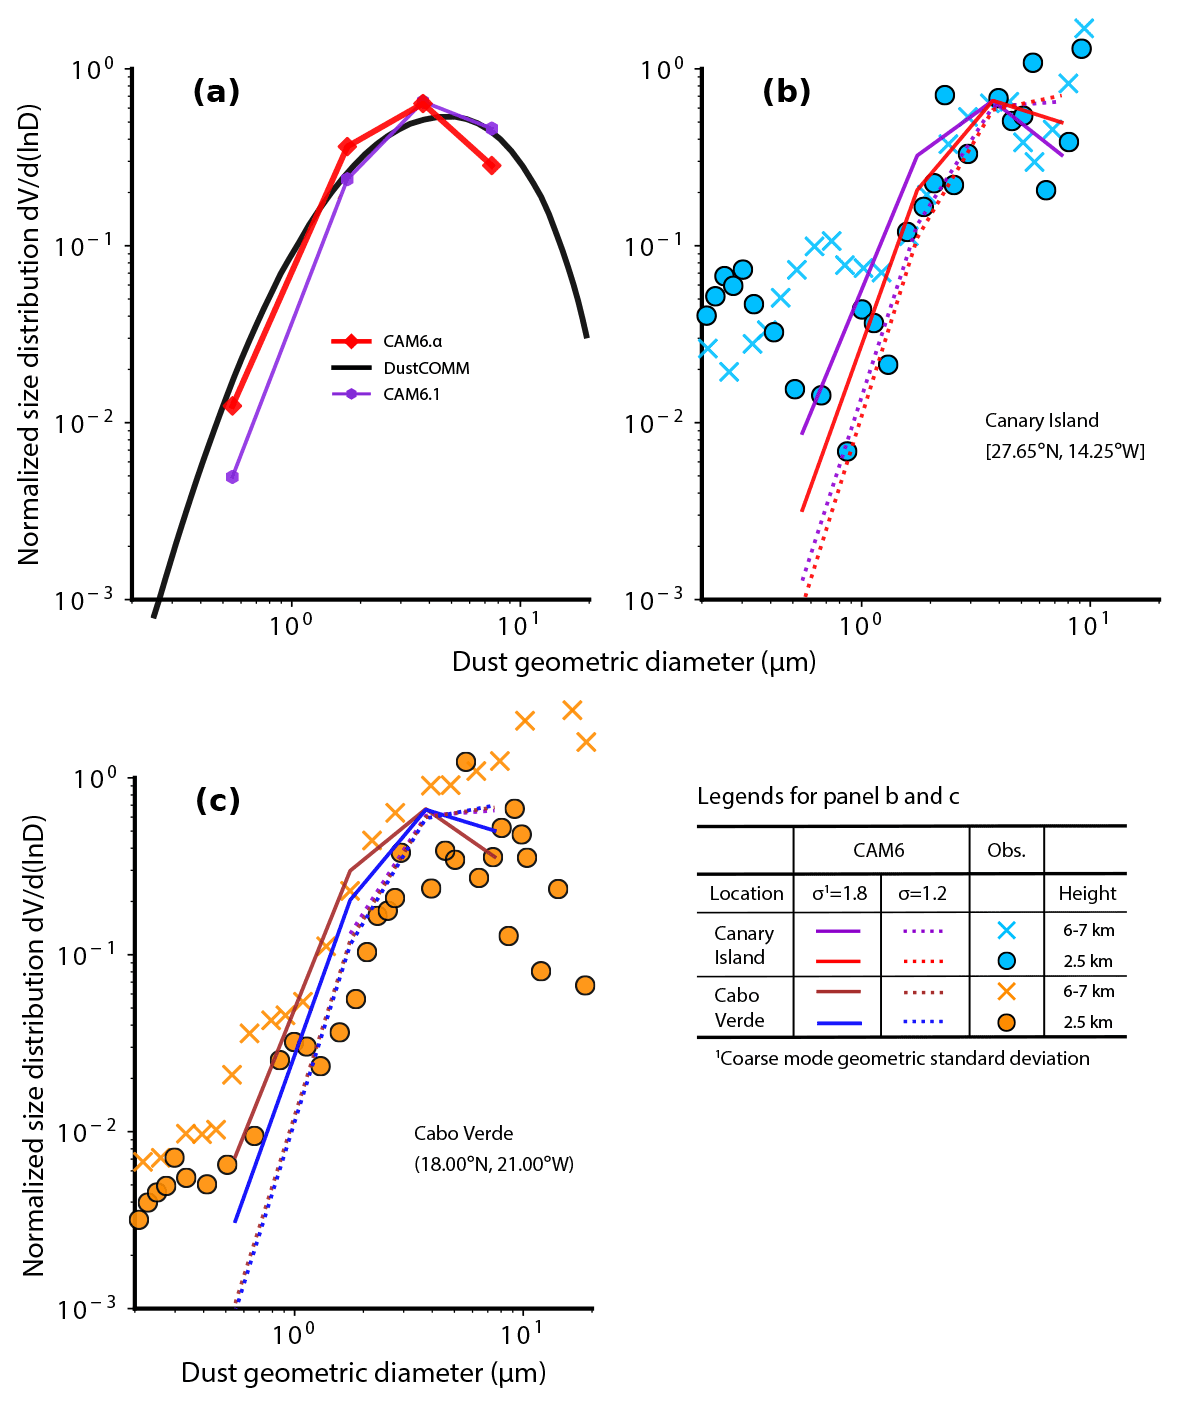
Figure 6Normalized size distribution of dust between 0.2 and 10 µm diameter in the global average (a), near Canary Island (blue colors in b; dot: 2.5 km; cross: 6–7 km; data for June/July 1997 from Otto et al., 2007), and near Cabo Verde (orange colors in c; dot: 2.5 km; cross: 6–7 km; data for August 2015 taken from Ryder et al., 2018). The default model, CAM6.1: (purple line); the new model, CAM6.α: (red line); semi-observations: DustCOMM (black line) inverted based on an integration of a global model ensemble and quality-controlled observational constraints on the transported dust size distribution, extinction efficiency, and regional DOD with data taken from Adebiyi et al. (2020). We chose the model layers and grid cells that are closest to the location and atmospheric height, as well as the months, where and when the measurements were made for comparison.
When comparing global mean model results to those from DustCOMM (Adebiyi et al., 2020) (Fig. 6a), generally CAM6.α better reproduces the atmospheric size distribution (ddlnD) than most of the other models (e.g., WRF-Chem: Weather Research Forecasting-Chemistry) (Adebiyi et al., 2020) in the full size range, and CAM6.α for dust < 2 µm in diameter (Fig. 6a). Like most climate models shown (Adebiyi et al., 2020), CAM6.α tends to underestimate coarse dust with the diameter greater than ∼ 5 µm (our model currently excludes dust with diameter > 10 µm), which is consistent with the finding suggested by the comparison between CM6.1 and AERONET observations (Fig. 5). The size distribution from CAM6.1 compares well with the DustCOMM result for dust between 1–2 µm in diameter. But it greatly underestimates the fine dust fraction (diameter < 2 µm) which CAM6.α can better capture due primarily to the more correct gravitational settling velocity modeled by using the new dry deposition scheme.
We then evaluate the model's performance in reproducing the size distribution measurements at the high-atmosphere levels (2–5 and 6–7 km) near the Canary Island (Fig. 6b) and Cabo Verde (Fig. 6c) by Ryder et al. (2018) and Otto et al. (2007) for transported dust (for the model–observation comparison at other atmospheric levels, see Fig. S10). Overall, CAM6.α better reproduces the size distribution at the higher atmospheric level (6–7 km) than CAM6.1, but CAM6.α substantially overestimates the mass of dust < 5 µm at the lower atmospheric level (2–5 km) compared to the measurements where CAM6.1 performs better. As also suggested in the global size distribution comparison, CAM6.1 simulates more dust > 5 µm and less dust < 5 µm than CAM6.α. However, both models underestimate the observed mass fraction of dust > 5 µm at the high-atmosphere level (6–7 km) near the Cabo Verde. The models also fail to capture the change in the size distribution between the two atmospheric levels that the measurements suggest. It is worth noting that the measurements are from single campaigns or flights that may have representative issues not reflecting the climatological size and vertical distributions of dust aerosols (i.e., limited by the space and time coverage), and the model results do not perfectly match the periods and locations of the measurements.
5.2 Impacts of each modification on the dust cycle modeling
This section details the relative importance of each modification to the modeled dust properties (loading and/or other dust variables). We show in Sect. 5.2.1–5.2.4 the results on the global mean and spatial distribution, and in Sect. 5.2.5 how the modifications affect the dust properties on the regional mean basis.
5.2.1 Dust emission schemes: BRIFT versus DEAD
The dust emission in MINE_NEW_EMIS using BRIFT (2910 Tg a−1) is 35 % lower than in MINE_BASE using DEAD (4456 Tg a−1), consistent with the lower DOD (0.035 versus 0.029), due primarily to higher dust lifetime in the former (3.1 and 2.2 d) (Table 6). The relative strength of dust emissions for different sources also differs between DEAD and BRIFT, as Kok et al. (2011b) documented based on CAM4. The comparison between the two emission schemes in CAM6 here on the spatial distribution of the dust emission largely remains as in CAM4. For example, the preferential source function of Zender et al. (2003b) used in DEAD simulates most of the emission in the central part of North Africa (e.g., the Bodélé depression) (Fig. 2a). In comparison, the dust emission coefficient in BRIFT (Eq. 10) and the new method of calculating the threshold gravimetric water content of the topsoil layer (Eq. 9; see values for the tuning factor “b” in Table 2) shifts the main dust emission in North African source westward and southward into the dust source belt (Kok et al., 2011b). This shifting in BRIFT, compared to DEAD, tends to have the dust emission occur in the wind erodible areas that satellite-based retrievals suggest (Ashpole and Washington, 2013; Ginoux et al., 2012), though the retrieval of dust beneath clouds are unavailable which may lead to a missing of potential dust sources that satellite retrievals cannot detect, for example, dust emissions occurring at the presence of deep convection (Engelstaedter and Washington, 2007; Marsham et al., 2013). The much lower dust emission in Taklamakan and Gobi deserts in China relative to that from North Africa using BRIFT, concerning that comparison using DEAD (Fig. 2b), is likely due to the high soil moisture simulated in CAM6 in both deserts in China.
Another pronounced difference in the modeled dust emission occurs in less erodible areas (i.e., North America, South Africa, Australia), where BRIFT tends to decrease the emission flux compared to using DEAD, an opposite response than that simulated for the North African sources. Such as in Australia, both schemes simulate the maximum in dust emissions from the Great Artesian Basin and the Murray–Darling Basin, but BRIFT reduces the dust emissions there, bringing a better agreement on the climatological DOD with AERONET observations than DEAD. However, BRIFT, using the unity tuning factor to calculate the threshold gravimetric water content, simulates high dust emissions in western Australia instead of central and eastern Australia as previously documented (Ginoux et al., 2012). Sensitivity tests suggest that using inversed clay fraction can likely better capture the spatial emission pattern in Australia (Fig. S11). In Patagonia, as Kok et al. (2014b) found based on CAM4 simulations, using BRIFT in CAM6.1 substantially increases the dust emission compared to DEAD. In addition, BRIFT simulates the dust emission from a source in northern Chile (the Atacama Desert) and the high-latitude area, where no dust emits in DEAD.
Due to the southwestward shifting of dust emissions in BRIFT to the “real” dust belt in North Africa (Sect. 5.2.1), dust aerosol particles experience stronger vertical transport by near-surface convergence that controls the annual cycle of North African dust (Engelstaedter and Washington, 2007). The lifetime of dust thus tends to be higher for aerosol particles experiencing strong convection, which uplifts them high above the surface (Cakmur et al., 2004), increasing the dust lifetime from 2.2 d in MINE_BASE to 3.1 d in MINE_NEW_EMIS. This lifetime-changing mechanism in turn indicates the importance of accurately simulating convergence-related convection (i.e., haboob) (Marsham et al., 2011) and where the dust emission occurs for dust transport modeling, especially the cross-Atlantic/Pacific (Prospero, 1999; Prospero et al., 2020) and cross-equatorial transport (Kok et al., 2021a; Li et al., 2008), which currently the models do not well represent.
In response to the change in dust emissions due to shifting from DEAD to BRIFT, the global annual mean dust deposition and loadings decrease by 35 % and 7 %, respectively (Table 6). Considering the lower global DOD in BRIFT than in DEAD (0.035 versus 0.029), differences between the global annual mean dust deposition in BRIFT and DEAD would become smaller, if we rescaled the global annual mean dust deposition and loadings offline using factors to make the global mean DOD in the two experiments exactly equal 0.030. The change in the total dust loadings (Fig. 7a) and deposition (Fig. 7b) has a similar spatial distribution: a great increase occurs primarily in the Southern Ocean, the Middle East, and the western Atlantic Ocean, western Australia and its downwind areas, and a great decrease in the Pacific Ocean due primarily to reduced dust emissions in East and Central Asia (Fig. 2b versus Fig. 2a); near Greenland, BRIFT simulates more dust deposition and slightly less dust loadings, owing to the local dust emission that occurs in BRIFT (Fig. 2b) but not in DEAD (Fig. 2a), and the ability of transporting further for dust aerosols in BRIFT because of the increased lifetime (Table 6).
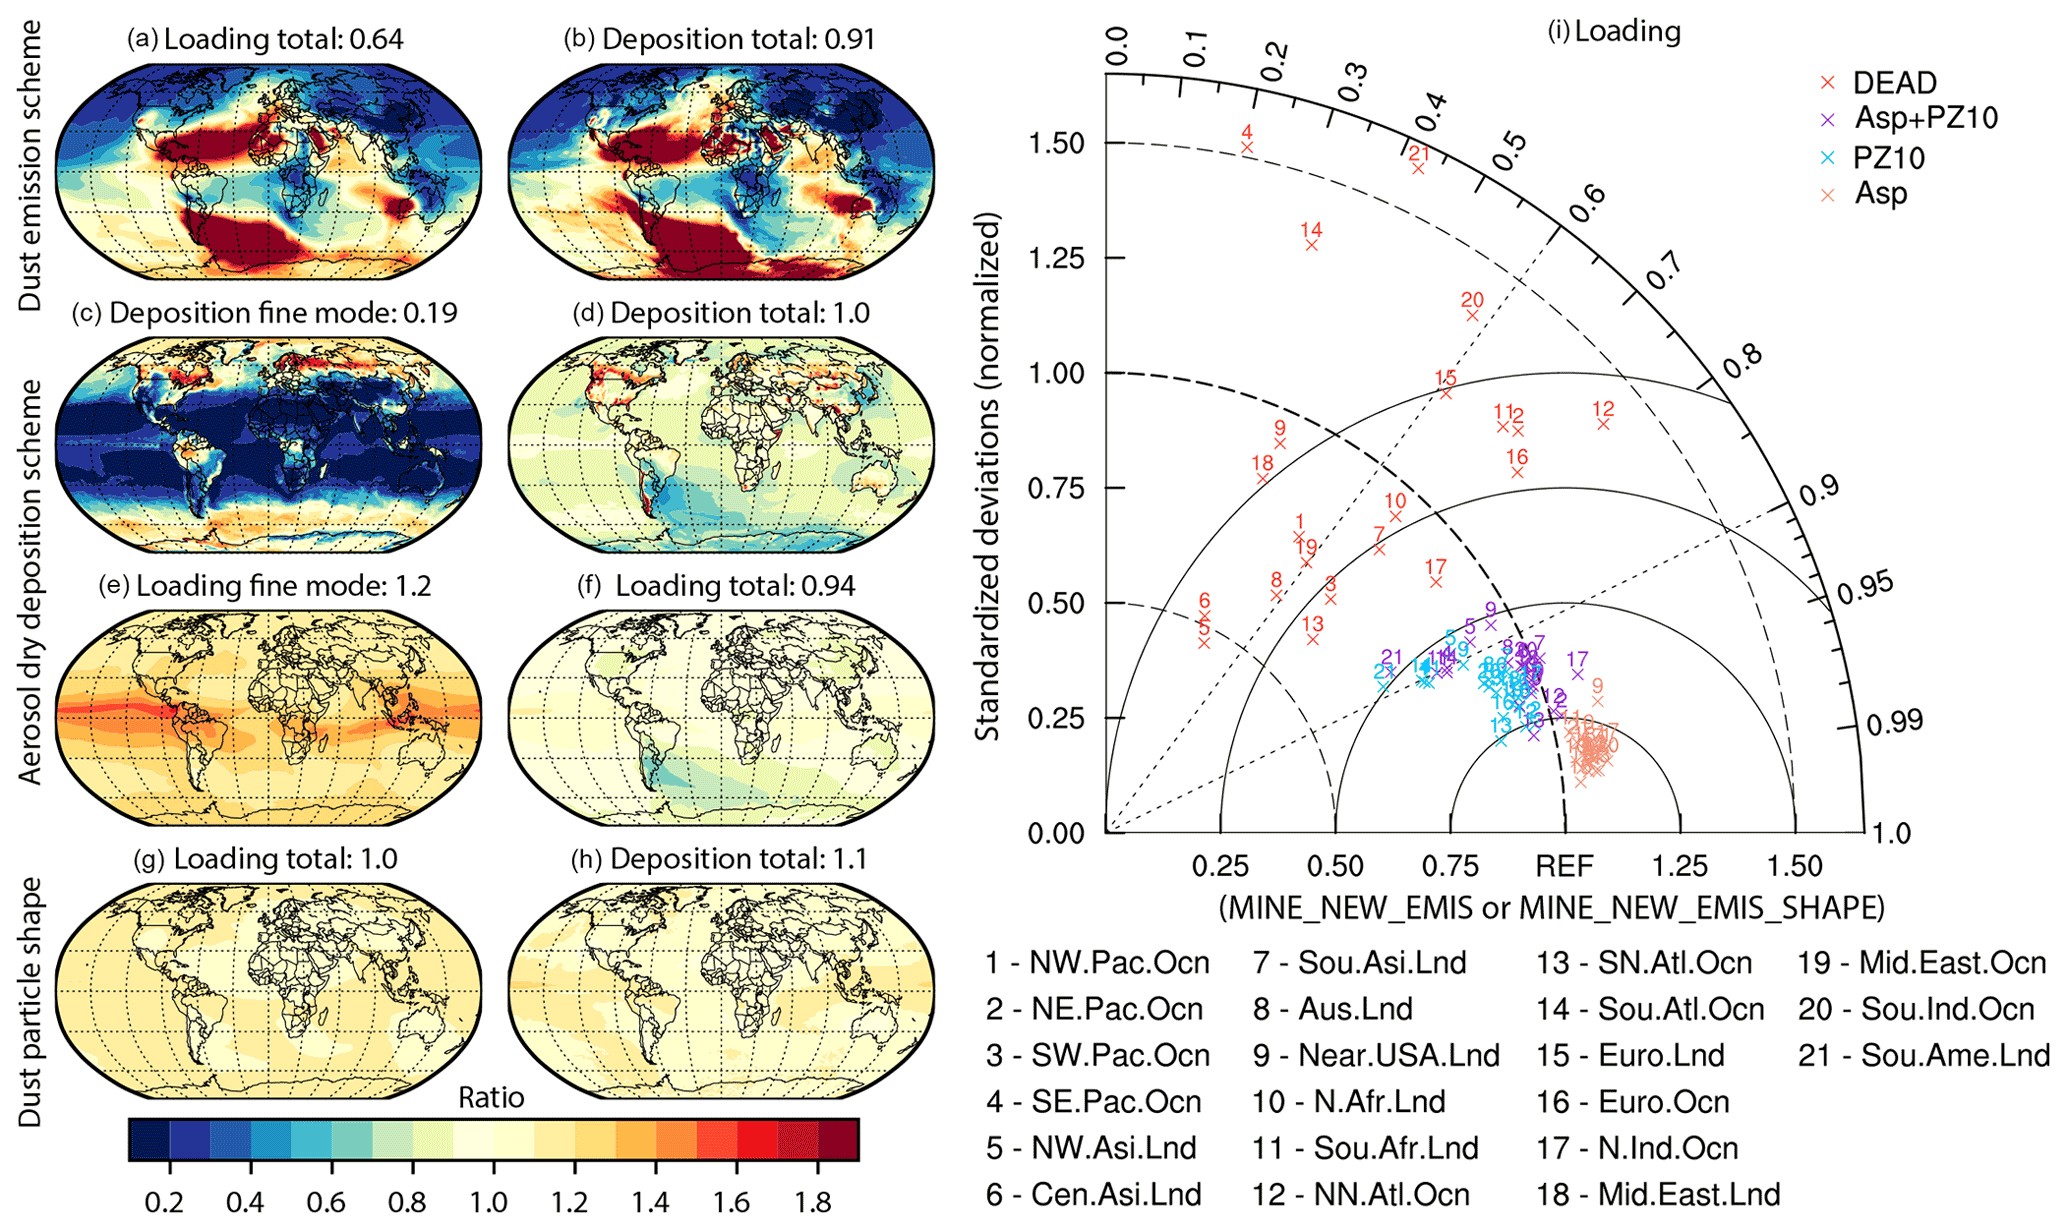
Figure 7Impacts of the dust emission scheme (a and b: ratio of BRIFT to DEAD), aerosol dry deposition scheme (c–f: ratio of PZ10 to Z01), and dust shape (g and h: ratio of ellipsoidal to spherical dust) on the modeled dust deposition (total: b, d, and h; fine mode: c), and dust loading (total: a, f, and g; fine mode: e). The Taylor diagram (i) compares dust loading in 21 sub-regions defined in Fig. S16. In panels (i), DEAD shows comparison between MINE_BASE and MINE_NEW_EMIS; Asp+PZ10 between CAM6.α_MINE and MINE_NEW_EMIS; PZ10 between CAM6.α_MINE and MINE_NEW_EMIS_SHAPE; the Kendall's τ temporal correlation and the standard deviation were obtained based on monthly values with the seasonal cycle removed.
Interestingly, we also find considerable changes to the simulated mass fraction of dust minerals between using BRIFT and DEAD (Fig. S12). These changes are as expected, given the redistributed “hot spots” where dust emission occurs by switching to BRIFT (Fig. 2) and the grid-dependency of the soil mineralogy that we used to initialize the dust speciation (Fig. 1 of Scanza et al., 2015 and Fig. S2 of Li et al., 2021). This change in the simulated mineral mass fractions of dust matters for quantifying the dust shortwave DRE (e.g., hematite) at the top of the atmosphere (Sokolik and Toon, 1999; Balkanski et al., 2007; Li and Sokolik, 2018b; Li et al., 2021), the cloud–aerosol interaction (e.g., feldspar) (Atkinson et al., 2013), and biogeochemistry effect (e.g., irons) (Mahowald et al., 2011a). It thus deserves quantifying how the shift of dust sources changes the simulated mineral content of iron-bearing minerals, including hematite and illite, and feldspar in the dust.
The results suggest that BRIFT simulates 10 times more hematite than DEAD in terms of mass (or volume) fraction in the Northern Hemisphere (BRIFT: 1.0 %; DEAD: 0.098 %) and 25 % less in the Southern Hemisphere (BRIFT: 1.2 %; DEAD: 1.6 %). Such a decreasing of the simulated mass fraction of hematite aerosol in the Southern Hemisphere is due primarily to reduced dust emissions from the Australian deserts, the soil of which enriches iron oxides (Claquin et al., 1999; Journet et al., 2014). BRIFT also shifts the dust emission westward in Australia (Fig. 2b versus Fig. 2a) where the soil abundance of hematite is lower than in the Australian deserts. Similarly, the increased mass fraction of hematite aerosol in the Northern Hemisphere can be partially attributed to the reduced dust emission from East Asia. The change is also evident (increase with the relative change > 30 %) to feldspar in the South Ocean (Fig. S12d) and to calcite in the North Pacific Ocean (decreasing; Fig. S12f), which may have implications for the amount of the ice nucleation by mineral dust since this nucleation could be dominated by feldspar in mixed-phase clouds (Atkinson et al., 2013).
5.2.2 Dust deposition schemes: PZ10 vs. Z01
The comparison of the dry deposition velocity between PZ10 and Z01 is size dependent. Because of the reduced dry deposition velocity in the fine mode, moving to PZ10 from Z01 greatly decreases the dry deposition of fine-mode (Aitken plus accumulation) dust within the low-to-mid latitude regions (between 40∘ S and 40∘ N; Fig. 7c; PZ10 : Z01 < 0.3; similar in the accumulation mode only as Fig. S13b suggests). Since most dust mass is in the coarse mode, the small change of dust deposition in this mode, because of the slightly larger dry deposition velocity in the coarse mode in PZ10 than in Z01, results in a slight change in the total dust deposition in the low-to-mid latitude regions (Fig. 7d or Fig. S14b). Even for dust deposition in the fine mode, the increased wet deposition by using PZ10 (such as in the accumulation mode shown in Fig. S15b) offsets the reduced dry deposition in the low-to-mid latitude regions, resulting in a negligible change spatially and on global average. In the South Ocean (downwind of the Patagonian deserts), a decrease of dry deposition fluxes causes more fine-mode dust aerosol particles near the source regions, which then become cloud borne. The increased cloud-borne particles in turn increase the possibility of horizontal transport and release of particles by the cloud droplet evaporation, leading to an increase of the dry deposition flux at the downwind regions (Fig. 7c). But the reduced total (dry plus wet) dust deposition in the coarse mode dominates over the increased dry deposition flux at the downwind regions, leading to a considerable decrease of total dust deposition by > 30 % (relative change; Fig. 7d).
Compared to Z01, PZ10 increases the global mean dust loading in the fine mode by ∼ 20 % (Fig. 7e). Particularly in the tropics, such an increase in the remote areas can be over 60 %, though the dust abundance there is low. The slight decrease of dust in the coarse mode dominates the change in the total dust loading, resulting in a slight decrease of the global mean total dust loading by 6 % (Fig. 7f). Correspondingly, the global mean DOD remains almost the same between the simulations using PZ10 and Z01 (Table 6).
5.2.3 Dust asphericity
The overall change to the spatial distribution of dry deposition induced by dust asphericity is not as important as the change induced by changing to the dry deposition scheme PZ10. The models simulate similar overall spatial distributions of dust deposition at the surface between modeling dust as spherical and ellipsoid shaped particles (Fig. 7h). The lower gravitational settling velocity when modeling dust as ellipsoids induces a considerable change to dust deposition only locally within remote areas: the South Pacific, western and eastern equatorial Pacific, and downwind of Patagonia has an increase of the dry deposition by up to 30 % (MINE_NEW_ EMIS_SHAPE versus MINE_NEW_EMIS). In comparison, little change to the dust deposition by dust asphericity occurs near/over major dust source regions. This contrast in the changes in the dry deposition flux between close-to-source and remote areas suggests that including dust asphericity could potentially mediate the overestimated dust emission from source regions (e.g., North Africa), because dust asphericity could enlengthen the lifetime in the atmosphere, and thus it takes less amount of dust to have the same amount of dust loadings and DOD as spherical shape assumption does.
5.2.4 Dust size representation
The removal rates of dust aerosol particles by both dry and wet deposition highly depends on their size (Mahowald et al., 2014). Since most of dust loadings are in the coarse mode, changing parameters of the coarse-mode size distribution (σ, initialized GMD, and the prescribed minimal and maximum boundaries within which the modeled GMD can vary, Table 1) from σ=1.2 to 1.8 halves the lifetime of dust (lifetime = 4.9 d versus 2.4 d; Table 6). This reduction of dust lifetime is primarily due to the change in σ of the coarse mode rather than the initialized GMD and its boundaries, as we obtain almost the same dust lifetime (∼ 2.4 d) between experiments with different parameters for dust size distribution but identical σ=1.8 (NEW_EMIS_SIZE versus NEW_EMIS_SIZE_WIDTH; Table 6).
We also notice a different DOD simulated by NEW_EMIS_SIZE (DOD = 0.013) and NEW_EMIS_SIZE_WIDTH (DOD = 0.019). The prescribed GMD boundaries do not affect the simulated dust loadings and DOD, because the predicted GMD in the model varies little. We can therefore derive that the initialized GMD itself is also relevant to simulated DOD, but its influence (relative change = 20 %) is second to that of changing the coarse-mode σ. Thus, it is the increased σ of the coarse mode that explains the reduced dust loadings (22 versus 11 Tg in NEW_EMIS and NEW_EMIS_SIZE, respectively; Table 6; Fig. 8b) and DOD (0.030 versus 0.013 in NEW_EMIS and NEW_EMIS_SIZE, respectively; Table 6). This impact of changing the coarse-mode σ is also greater than that of the other modifications (e.g., speciating dust or changing the dust emission scheme from DEAD to BRIFT) on the simulated dust lifetime which appears trivial (e.g., dust lifetime increased by 0.6 d only by changing to the new emission scheme). Correspondingly, given a similar emission rate, changing the coarse-mode σ affects DOD most, compared to the other modifications we made.
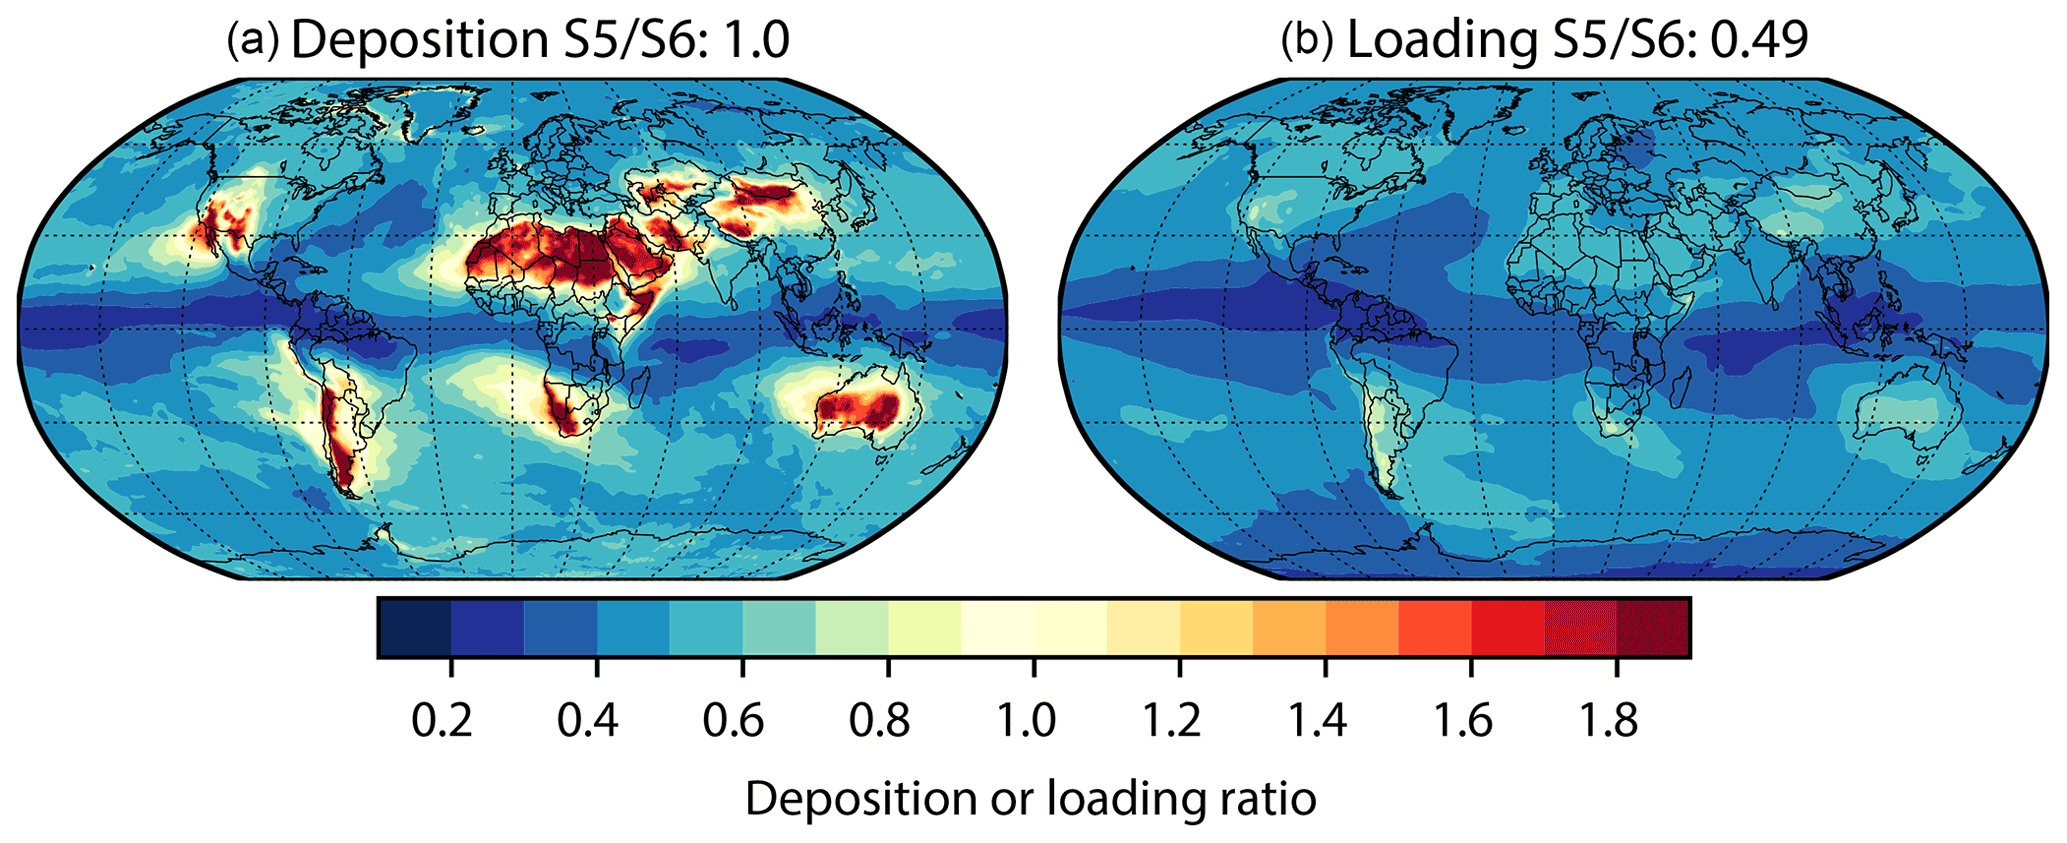
Figure 8Impact of changing the coarse-mode geometric standard deviation (σ) for transported dust aerosol on the modeled dust surface deposition fluxes and column loading: ratio of NEW_EMIS_SIZE (S5: σ=1.8) to NEW_EMIS (S6: σ=1.2) (see Table 2 for case names). Numbers on the top of the plot show ratios on global average.
5.2.5 Impacts of the modifications on the regional mean basis
The regional analysis over 21 selected sub-regions (Fig. S16 for definition) suggests that over most of those sub-regions, the simulated dust loading/deposition flux using the model under different modifications (PZ10 and/or dust asphericity) except to the dust emission scheme closely correlates (temporal correlation coefficient > 0.85 based on monthly values) with that in the reference case MINE_NEW_EMIS (Fig. 7i). In addition to slightly increasing dust loading, introducing dust asphericity to the model slightly increases the temporal variability of the modeled dust loading, while replacing Z01 with PZ10 slightly decreases the variability of the simulated dust loading with respect to the reference case generally in nearly all the 21 sub-regions (Fig. 7i). The combined effect of the two modifications on this temporal variability is more determined by the choice between PZ10 and Z01 than dust asphericity.
Using different dust emission schemes changes the regional dust loading/deposition flux the most among those modifications in terms of the standard deviation (the BRIFT DEAD ratio > 1.25 or < 0.75 in many regions) and temporal correlation (low-to-moderate temporal correlation between 0.15 and 0.85) (Fig. 7i). Particularly, the strong regional contrast on the dust loading/deposition exists in northwest Asia (region 5: the BRIFT DEAD ratio < 0.5 and temporal correlation < 0.5), Central Asia (region 6: the BRIFT DEAD ratio < 0.6 and temporal correlation < 0.5), southeastern Pacific Ocean (region 4: the BRIFT DEAD ratio > 1.5 and temporal correlation = ∼ 0.2), and southern America (region 21: the BRIFT DEAD ratio > 1.5 and temporal correlation < 0.5).
5.3 Dust direct radiative effect
CAM6.α yields a global mean net dust DRE of ∼ −0.26 W m−2 (shortwave plus longwave; longwave has been augmented by 51 % to include dust scattering), which is slightly less cooling than in CAM6.1 (∼ −0.30 W m−2). But the net dust DRE can strongly differ between the two model versions at regional scales (Fig. S17b). For example, CAM6.α suggests more warming (difference > 2 W m−2 in amplitude) near Australia due to reduced dust loadings (thus DOD) (Fig. 7a) and hematite mass fraction (Fig. S12a), and more cooling (difference > 2 W m−2 in amplitude) in downwind regions of North Africa primarily due to increased dust loadings (Fig. 7a). The opposite change in one region relative to another however cancels out, resulting in a negligible net DRE change at the global scale (−0.04 W m−2). The following subsections evaluate the model performance on reproducing the observed dust DRE efficiency (Sect. 5.3.1), and quantify the impact of each modification on the estimate of dust DRE (Sect. 5.3.2 and 5.3.3).
5.3.1 Dust direct radiative effect efficiency
All model versions as shown in Fig. 9 have difficulty in reproducing the dust DRE efficiency under clear-sky conditions. In the shortwave spectral range (Fig. 9a), the new model, CAM6.α, does not show improvement in general. It works better in reproducing the retrievals only in the Atlantic Ocean (tropical Atlantic-3: 10–30∘ N, 20–45∘ W) in the summer and at a site in the Mediterranean Basin (33.5∘ N, 12.6∘ W) in September. In the longwave spectral range (Fig. 9b), the dust DRE efficiency in the new model, CAM6-α, agrees better with retrievals than that in CAM6.1 with higher correlation coefficients (CAM6.α: R = 0.86 versus CAM6.1: R = 0.60) and reduced RMSEs (CAM6.α: RMSE = 4.0 W m−2 DOD−1 versus CAM6.1: R = 5.7 W m−2 DOD−1), likely mainly owing to the improved representation of the dust cycle. It is worth noting that, in addition to uncertainty due to the imperfect representation of the spatial distribution of dust aerosols (Fig. 1), the different spectral ranges in the model and the satellite-based sensors and radiation parameterization in the model (Jones et al., 2017) may also contribute to the difference between dust DRE efficiency from the model and observations.
All the modifications do not change the global mean net DRE efficiency (Table 6; quantified using the mineralogy runs), except that BRIFT yields the global mean net efficiency value that substantially differs in the shortwave spectral range compared to DEAD (MINE_NEW_EMIS: −2.1 W m−2 DOD−1 versus MINE_BASE: −4.0 W m−2 DOD−1; Table 6).
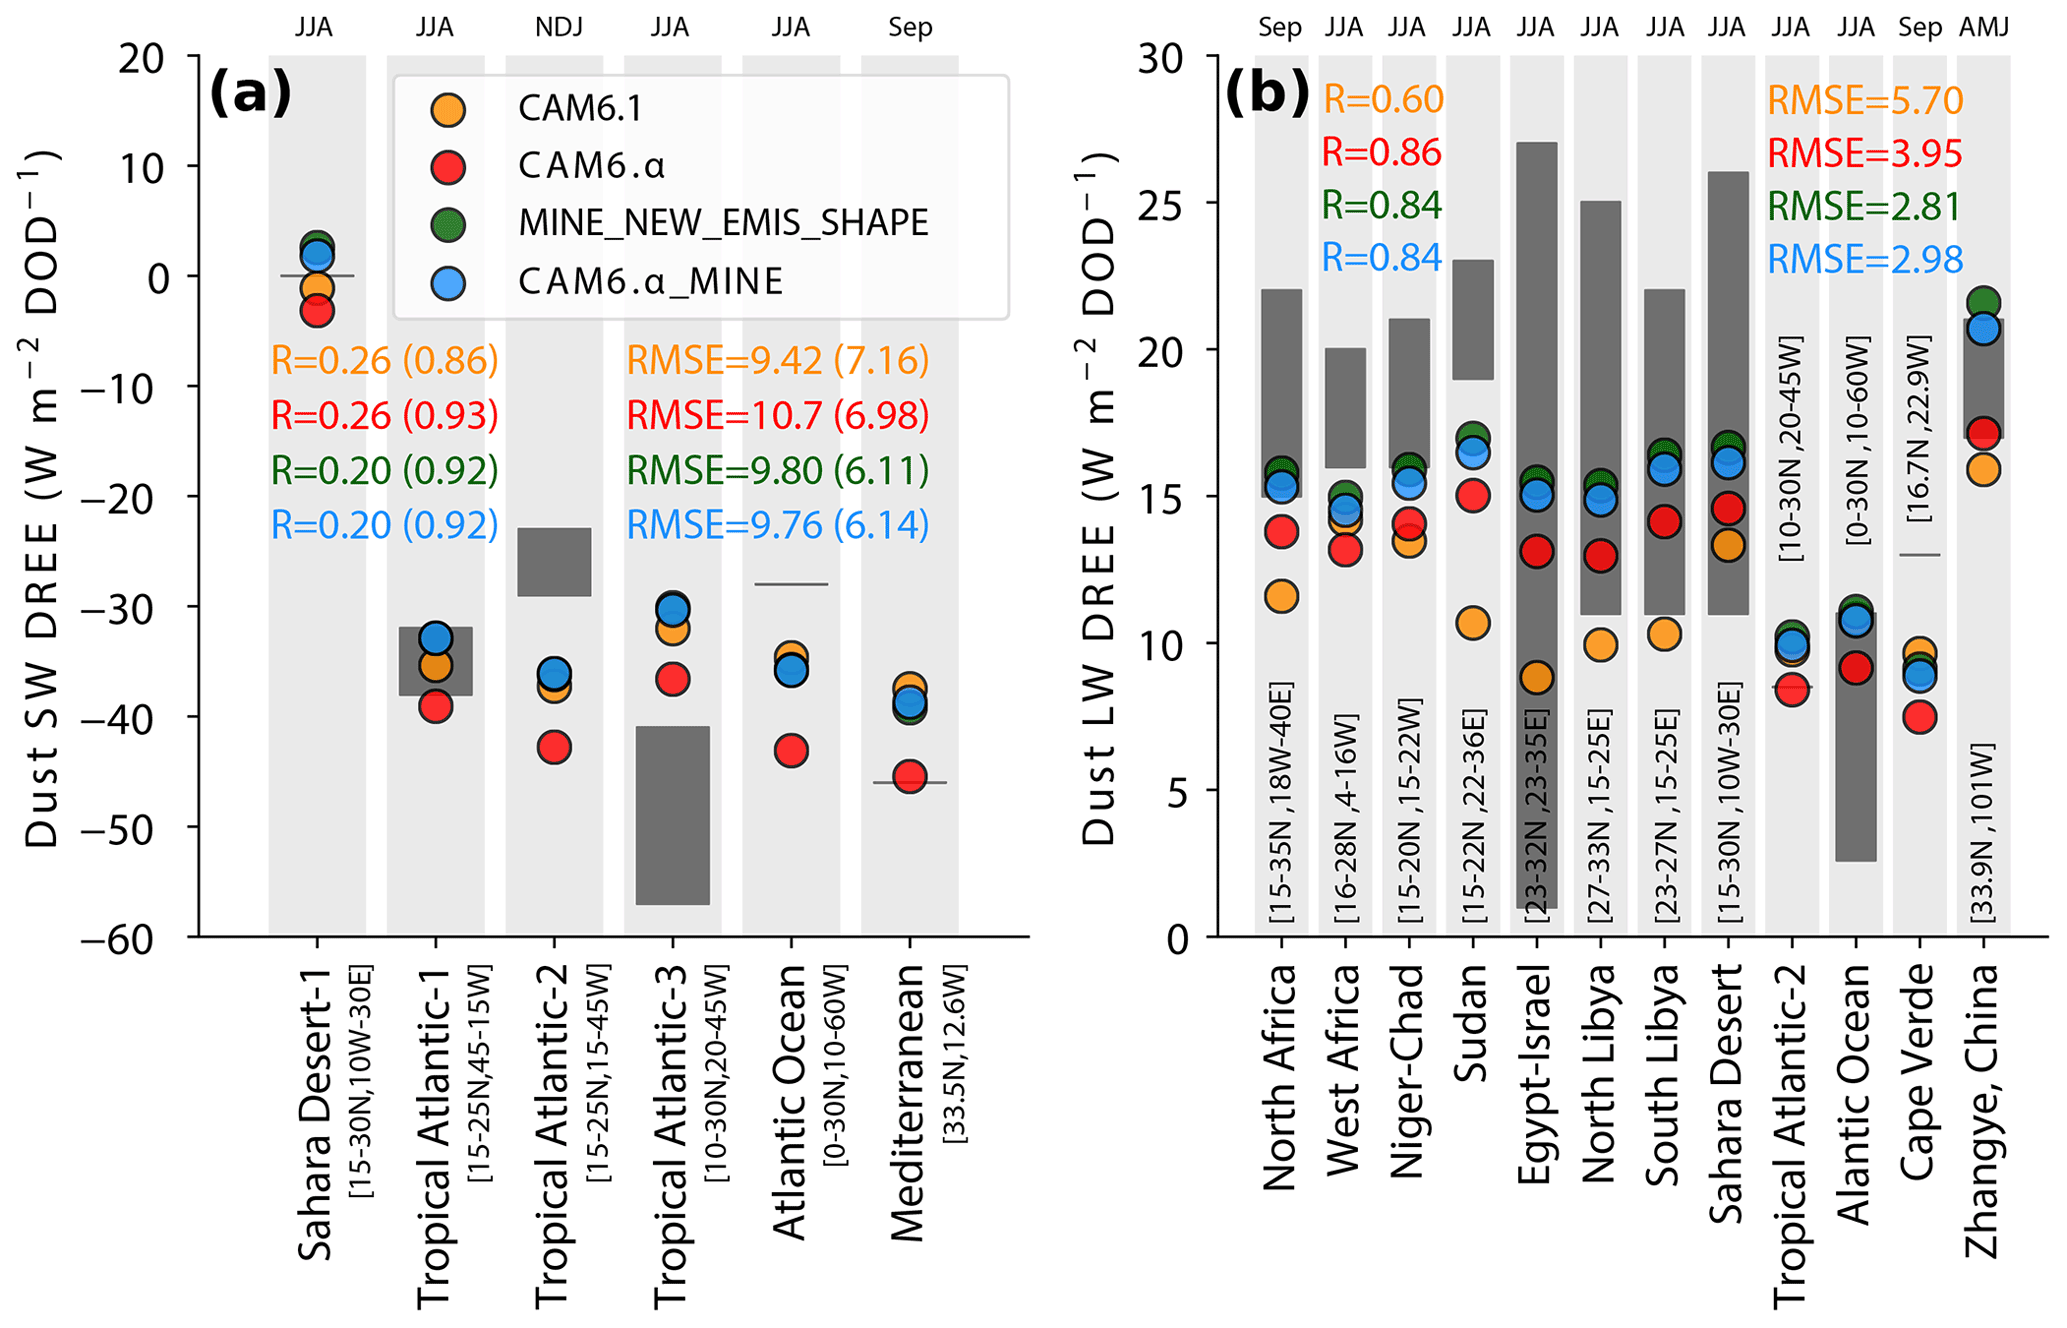
Figure 9Modeled and observed dust direct radiative effect efficiency (DREE) in the shortwave (SW; a) and longwave (LW; b) spectral ranges under clear-sky conditions at the TOA over the sub-domains (see labels of the x axes) in April–June (AMJ), summer (JJA), fall (NDJ), and September (Sep) for the 2000s climate. The DREE is defined as the ratio of DRE to DOD, so has units of W m−2 DOD−1. Included cases from left are CAM6.1, CAM6.α, MINE_NEW_EMIS_SHAPE, and CAM6.α_MINE. Colored numbers show correlation coefficient (R) and the root mean square error (RMSE) between the model and retrievals in the SW and LW spectral ranges or in both spectral ranges (numbers in parenthesis in panel a).
5.3.2 Impacts of dust asphericity, dry deposition scheme, and dust emission scheme
The dust asphericity introduces negligible (relative change < 10 %) impacts on the global net dust DRE, and PZ10 enhances the net dust cooling by ∼ 18 % relative to that using Z01 (Table 6). Regionally, the slightly higher/lower dust loading or DOD due to dust asphericity only slightly enhances the warming over land (Fig. 10a; e.g., North African land; net DRE: 0.97 and 1.1 W m−2 for MINE_NEW_EMIS and MINE_NEW_EMIS_SHAPE, respectively; the single scattering albedo at the visible band ∼ 0.90 for both runs, not shown) and enhances the cooling over ocean (e.g., downwind of North Africa). PZ10 simulates a slightly enhanced cooling relative to Z01 almost everywhere (Fig. 10b; e.g., south northern Atlantic Ocean, net DRE: −0.72 and −0.76 W m−2 for MINE_NEW_EMIS_SHAPE and CAM6.α_MINE, respectively).
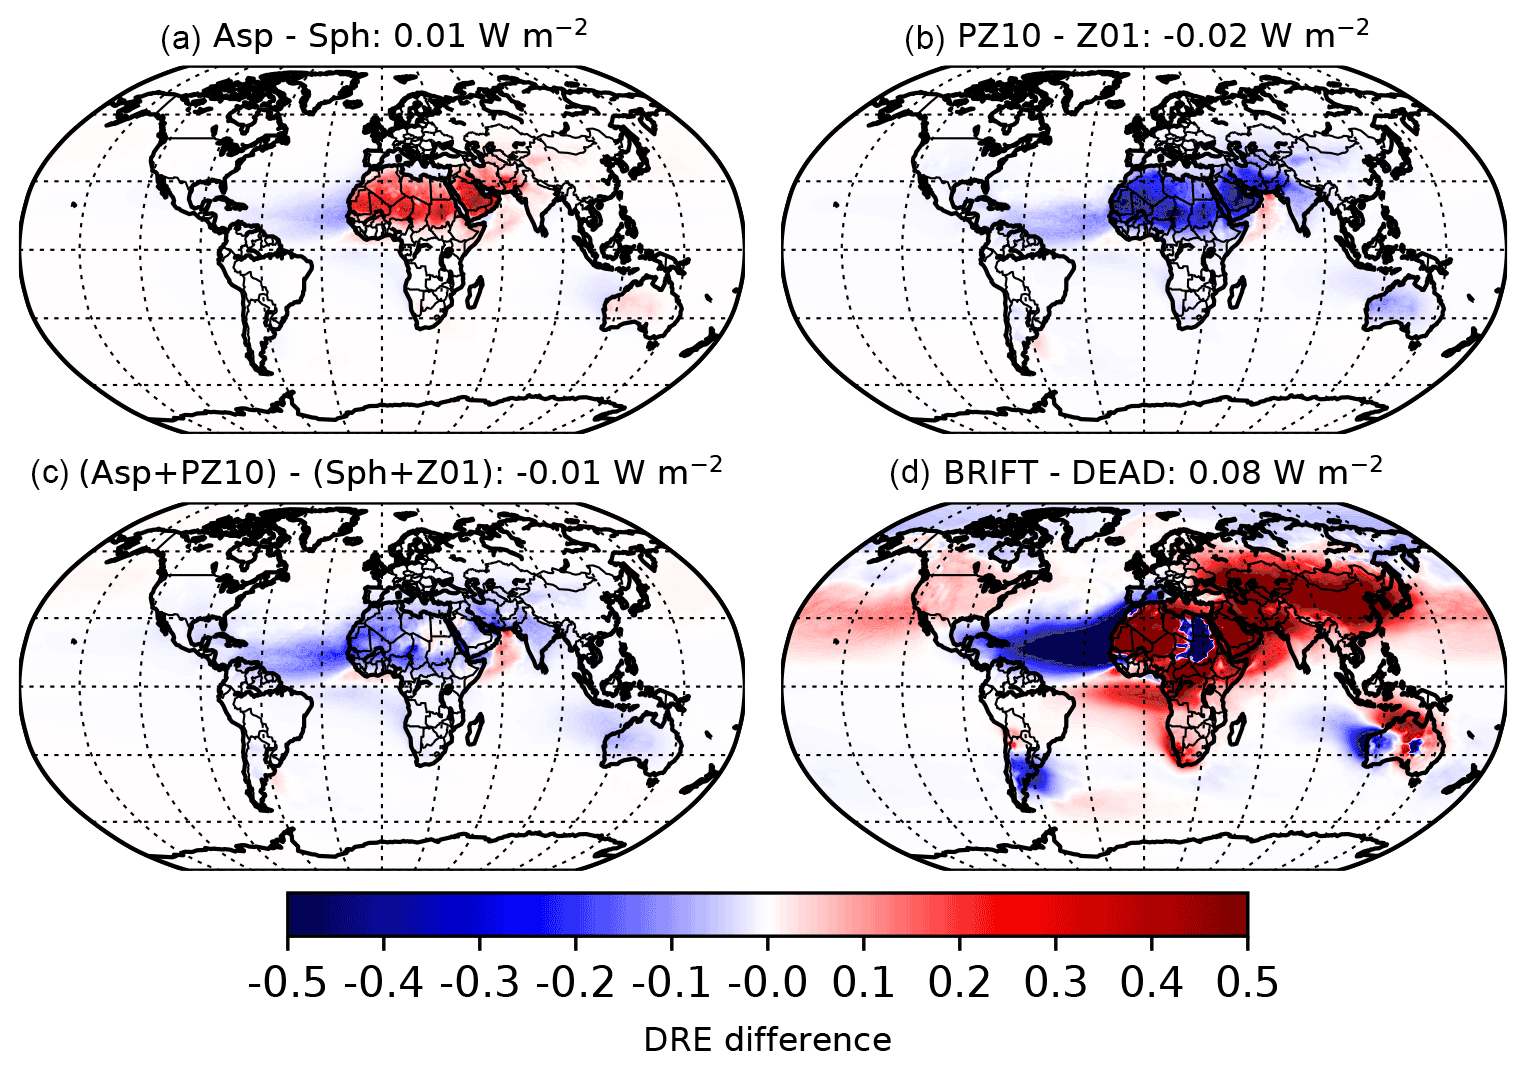
Figure 10Spatial distribution of the net (shortwave plus longwave) direct radiative effect (DRE) difference (unit: W m−2) at the top of the atmosphere under all-sky conditions in current climate between model results using non-spherical (asp) and aspherical dust (sph) (a), PZ10 and Z01 (b), Asp+PZ10 and Sph+Z01 (c), and BRIFT and DEAD (d). The longwave DRE was augmented by 51 % to account for the dust scattering. Numbers shown in each panel title represent annual mean difference in global average.
Calculations suggest a regionally strongly contrasted change to net dust DRE when shifting from DEAD to BRIFT (Fig. 10d), but the enhanced cooling in one region (i.e., the downwind Atlantic Ocean of North Africa: BRIFT: −0.76 W m−2; DEAD: −0.64 W m−2) and warming in another (i.e., western Africa) cancel out, resulting in a weaker global dust cooling, −0.08 W m−2 (Table 6). These regional dust DRE differences primarily result from the regional changes to DOD/dust loadings in response to the spatial change in dust emissions, especially for North African sources, and are due partially to the change in hematite mass fractions (Fig. S12a).
5.3.3 Sensitivity to the size distribution
In NEW_EMIS_SIZE, the dust DRE at the shortwave bands at the top of the atmosphere under all-sky conditions is ∼ −0.39 W m−2 (Table 6). In contrast, NEW_EMIS yields approximately 70 % and 62 % stronger cooling effects of −0.66 W m−2 by dust aerosols. We attribute this strong shortwave cooling in NEW_EMIS primarily to the greatly overestimated mass fraction of fine dust, which is more scattering than coarse dust. The other parameters, such as the GMD bounds of the coarse mode is also relevant to the shortwave dust DRE calculation, inducing a change of 0.12 W m−2 (NEW_EMIS_SIZE minus NEW_EMIS_SIZE_WIDTH), which is only slightly smaller than 0.15 W m−2 (NEW_EMIS_SIZE_WIDTH minus NEW_ EMIS) that results from the σ change from 1.2 to 1.8 (Table 6). Compared to its influence at the shortwave bands, the size change only slightly affects the longwave dust DRE calculation (relative change < 30 %).
Spatially, big differences (less cooling; absolute difference > 3.5 W m−2) on shortwave dust DRE caused by the size change (from CAM6 size to CAM5 size) mainly appear over areas close to the non-reflective regions (e.g., dust source regions where annual surface albedo at visible band < ∼ 0.2 and oceanic regions adjacent to North Africa and the Middle East) (Fig. S18a). The coarse mode size change from CAM6 size to CAM5 size systematically reduces the longwave warming over all grid cells (Fig. S18c) primarily due to the σ change, as the other parameters enhance the warming effect instead (Fig. S18d).
5.4 Relative importance of each modification
Figure 11 compares the relative importance of each modification on the modeled dust quantities, and the dust DRE at grid cell scales and on the global average. Overall, replacing the size distribution of dust aerosol and the dust emission scheme with new ones are more influential on the modeled quantities of dust (DOD, burden, and deposition) and the DRE estimate, compared to the other modifications. At model grid cell scales, this is especially true for close-to-source regions: the size change dominates over all the others to be the most important factor in modeling the surface dust concentration which occurs everywhere (Fig. 11a), modeling DOD (Fig. 11c), and estimating the dust lifetime (Fig. 11e) and DRE (Fig. 11f) which occurs at most cells; the choice of the dust emission scheme could be most important in modeling the dust burden (Fig. 11b) and deposition (Fig. 11d). Dust asphericity can only dominate the change to the modeled dust burdens or loadings in the South Pacific Ocean (Fig. 11b), where the dust mass is low relative to close-to-source regions. As for the dry deposition scheme, switching to PZ10 can dominate the change to the dust lifetime at the north polar region (Fig. 11e) where the total dust is more in the fine mode for which PZ10 reduces the dry deposition velocity (Petroff and Zhang, 2010).
On the global average (Fig. 11g–l), the size change is most important in modeling most of the dust quantities, except deposition (Fig. 11j) and in estimating the dust DRE at the top of the atmosphere (Fig. 11l) for which the choice of the dust emission scheme becomes more influential.
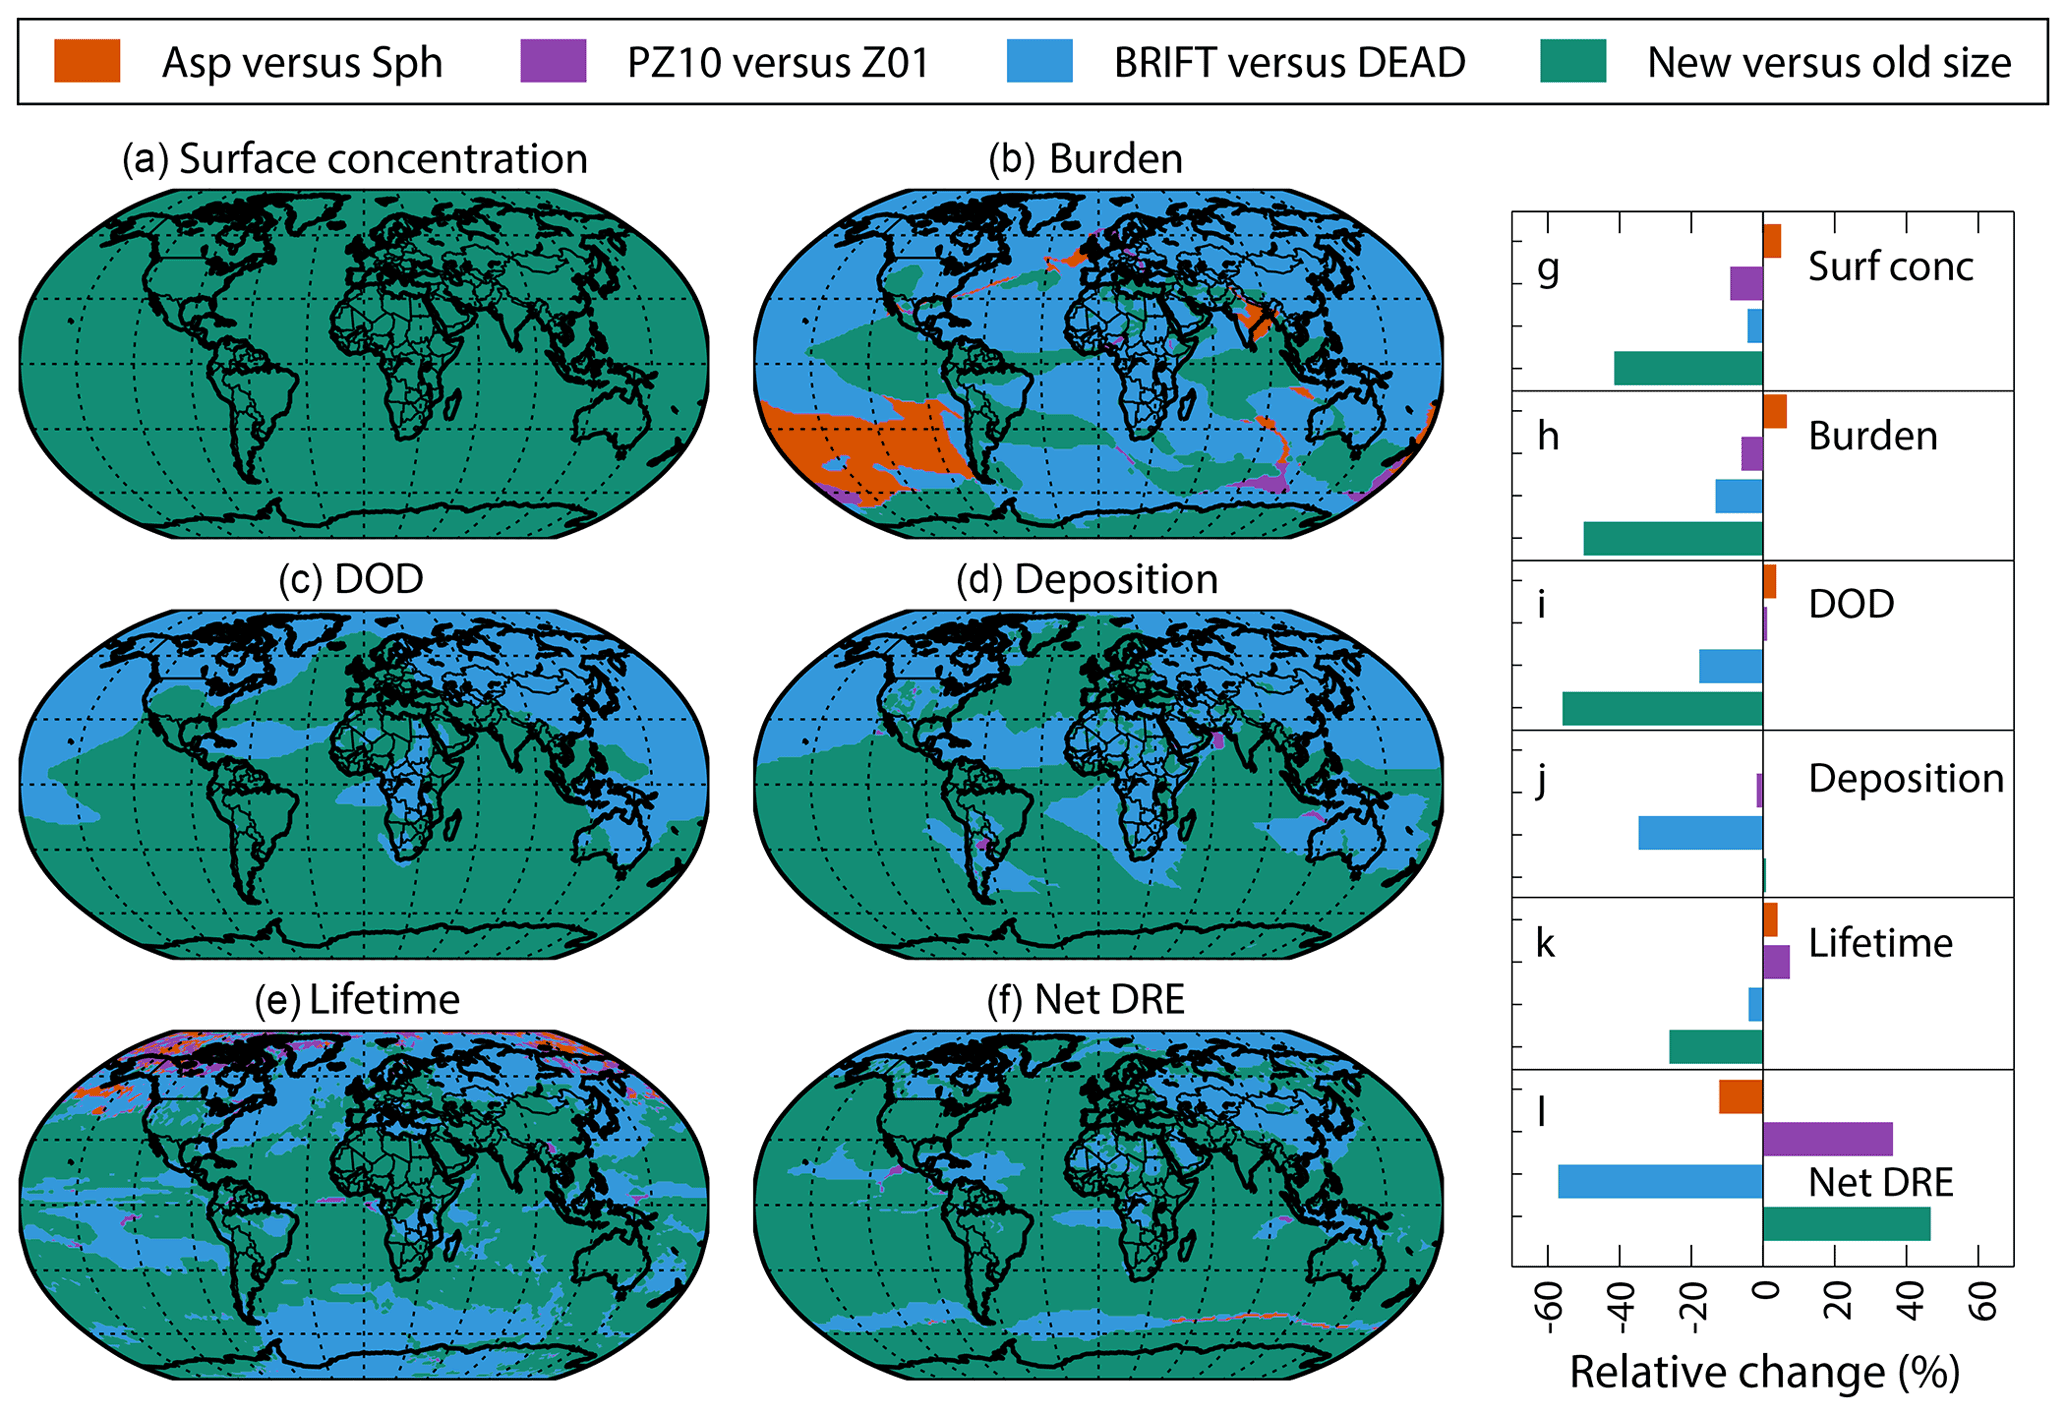
Figure 11Summary of the relative importance of the modifications (spherical, sph versus non-spherical dust, asp; default dry deposition scheme, Z01 versus new, PZ10; DEAD versus BRIFT dust emission scheme; and coarse-mode size distribution used in CAM5, new size, versus that used in CAM6.1, old size) at grid cell levels (a–f) and in global average (g–i) on surface concentration (a, g), burden (b, h), DOD (c, i), surface deposition (d, j), lifetime (e, k), and net DRE (f, i) from simulations with offline dynamics.
The bulk- (CAM6.α) and speciated-dust (CAM6.α_MINE) models simulate a similar dust cycle with the difference between the two types of models orders of magnitude smaller than the dust cycle itself modeled either by CAM6.α or CAM6.α_MINE (e.g., Figs. 12 and 13). This similarity results from several factors including:
-
tuning the dust cycle to a global mean DOD of 0.03;
-
nudging both models towards the same meteorology dynamics; and
-
conserving the dust mass when speciating the dust aerosols, such that summing the mass fraction of each dust species equals unity. For the same reasons, the influence of each of the modifications on the modeled dust cycle quantified using the bulk-dust model instead of the speciated-dust model, as this study used, would be similarly comparable.
What differs remarkably is the modeled dust optical properties between the speciated- and bulk-dust simulations. For example, the speciated-dust model (CAM6.α_MINE) yields a lower global-mean dust SSA than the bulk-dust model (CAM6.α): 0.896 versus 0.911 (Table 6), at the visible band centered at 0.53 µm. Note that the dust DRE is sensitive to variation of the dust SSA. This lower dust SSA obtained here in the speciated-dust model than in the bulk-dust model is consistent with the finding of a previous study (Scanza et al., 2015) using an earlier model version (CAM5). Correspondingly, CAM6.α_MINE yields a reduced dust cooling (Table 6) and DRE efficiency (Fig. 9) relative to CAM6.α.
For dust DRE efficiency (Fig. 9), speciating dust in CAM6 tends to reduce the RMSE while retaining the horizontal spatial correlation in either shortwave (CAM6.α: RMSE = 11 W m−2 DOD−1; R = 0.26 versus CAM6.α_MINE: RMSE = 10 W m−2 DOD−1; R = 0.20) or longwave (CAM6.α: RMSE = 4.0 W m−2 DOD−1; R = 0.86 versus CAM6.α_MINE: RMSE = 3.0 W m−2 DOD−1; R = 0.84) or both spectral ranges (CAM6.α: RMSE = 7.0 W m−2 DOD−1; R = 0.93 versus CAM6.α_MINE: RMSE = 6.0 W m−2 DOD−1; R = 0.92). This comparison suggests that modeling dust as component minerals with the coarse-mode dust size distribution of MINE_NEW_EMIS_SIZE could help improve the model performance relative to modeling dust as a bulk to reproduce the retrieved dust DRE efficiency (Fig. 9).
It is worth noting that the improvement in modeling the dust DRE efficiency could be artificial because of the combined use of imaginary part of the complex refractive index of hematite (see Fig. 1b of Li et al., 2021) and the volume mixing rule used in the dust speciated model to compute the bulk-dust complex refractive index, leading to artificially more absorptive dust than in the bulk-dust model (Fig. 9a and Table 6).
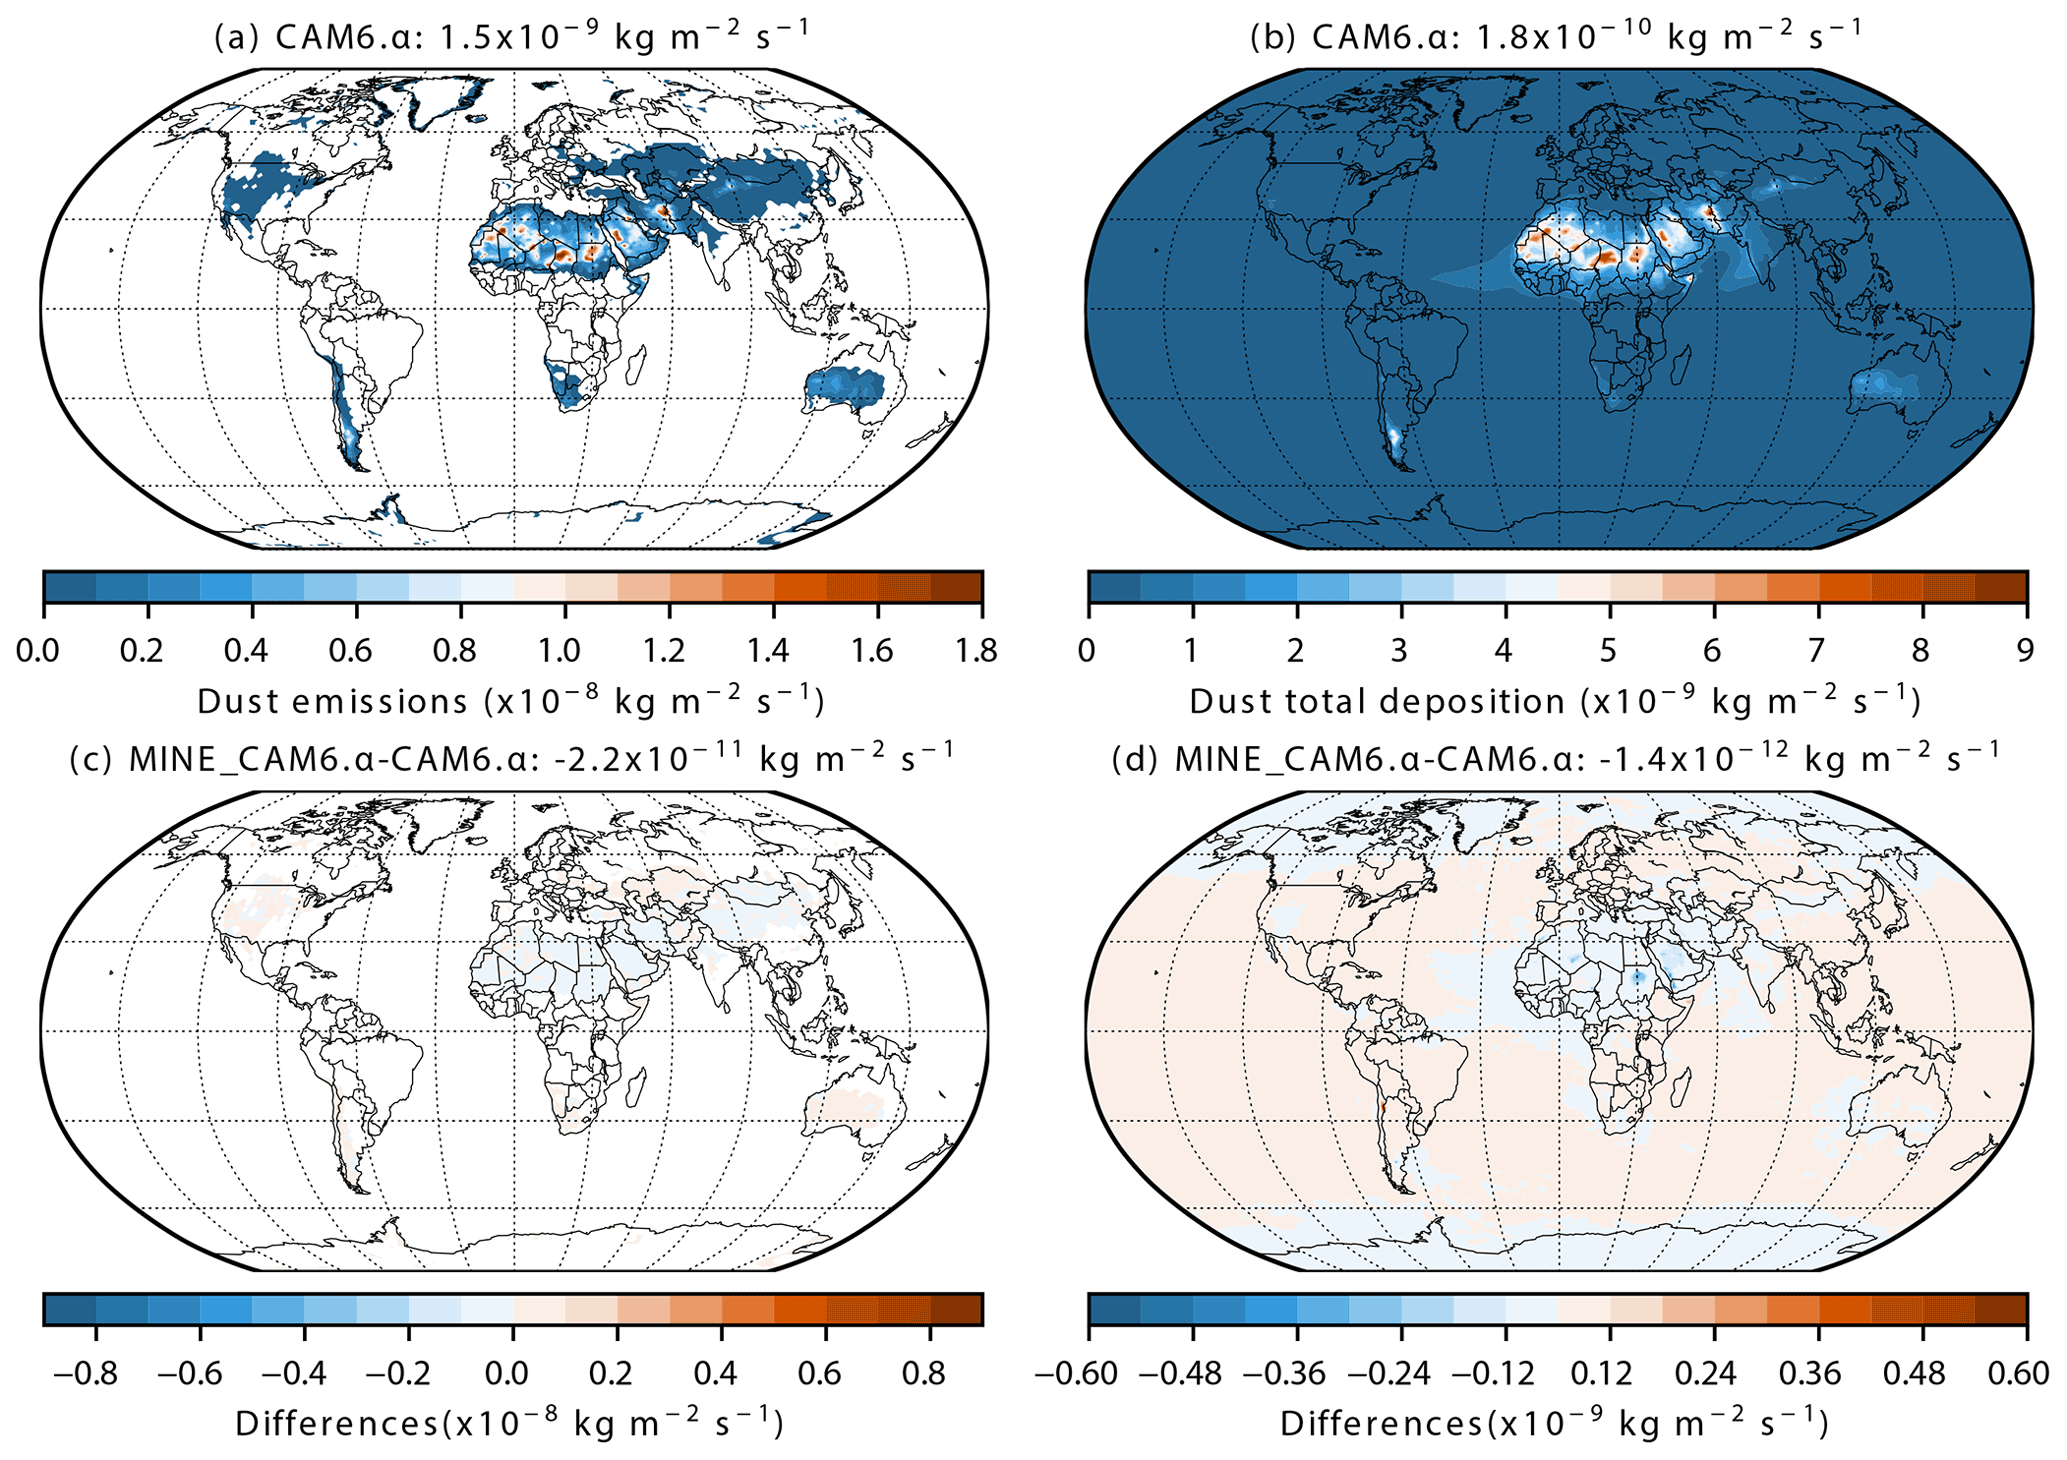
Figure 12Surface dust emissions (a; global annual mean = 2891 Tg) and deposition fluxes (b; global annual mean = 2893 Tg) simulated by CAM6.α and their differences (c and d) between CAM6.α_MINE and CAM6.α.
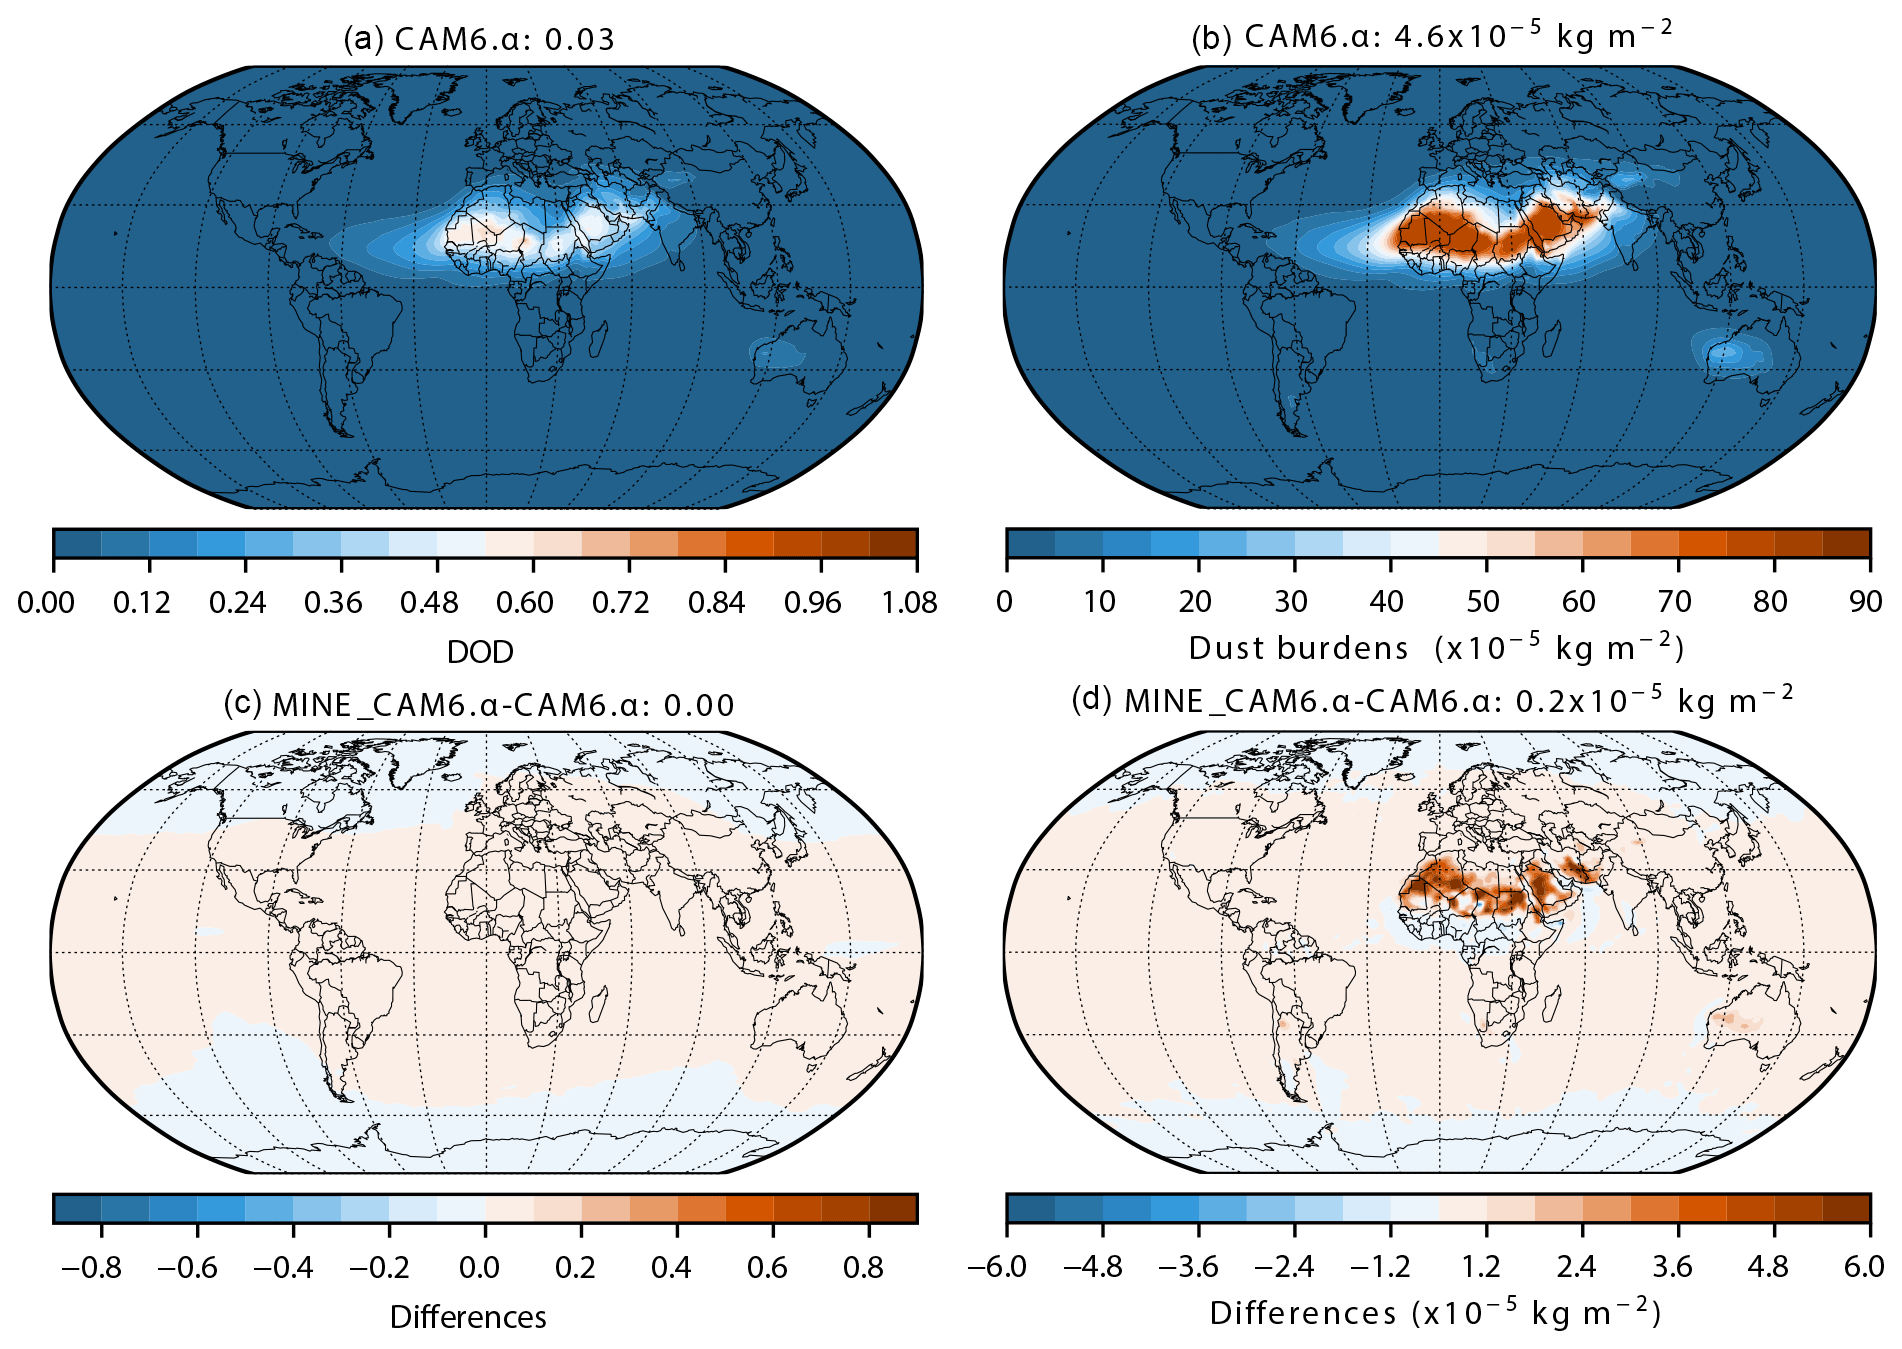
Figure 13The same as Fig. 12 but for DOD (a: global annual mean = 0.030 and (c) global mean difference = 0.001) and dust burdens (b: global annual mean of dust mass = 24 Tg and (d) global mean difference ≈ 0 Tg), respectively.
The following are issues which may affect the model–observation comparison when interpreting the comparison:
-
The period when the measurements were made not perfectly matching with when the simulations were performed for.
-
Different representative space volume between the model results and observations. The model results are representative of a colocation in space which is determined by the spatial resolution and often too large compared to the volume that observations represent (Hamilton et al., 2019; Wang et al., 2014). Ground stations measure dust-related quantities using stationary instruments, and aircraft-onboard instrument measures dust along with the flight tracks.
-
Different size cut-offs. Some observations include dust of size > 10 µm in diameter (between 10–20 µm; dust particles in this size range are also present over the source regions and regions downwind of North Africa as Ryder et al. found in 2019, but nearly all the observational constraints used in this study do not include those dust particles) which our models do not simulate. This might be an important error source (Adebiyi and Kok, 2020). On the other hand, the observations of PM10 are likely to include only PM6.9, because what is measured is in aerodynamic not geometric diameters (Huang et al., 2021; J. S. Reid et al., 2003). Finally, the modeled dust mass is for dust with our own defined mineralogy composition only (Li et al., 2021; Scanza et al., 2015), but the measured mass could likely also include non-dust particles, such as sea salt (Kandler et al., 2011; Zhang et al., 2006), sulfate (Kandler et al., 2007), biomass burning aerosols (Ansmann et al., 2011; Johnson et al., 2008), or other air pollution aerosols (Huang et al., 2010; Yuan et al., 2008). This contamination of non-dust aerosols on the measurement is especially important for dust in the fine-mode size where the instrument cannot distinguish dust from the fine-sized non-dust aerosols.
-
Different representative periods. Some of the observations were not made for a period long enough to be taken as a representative of climatology (see Tables 3–5). Also considering point (1), the model–observation comparison may be subject to change because of interannual variability or the episodic character of dust aerosols (Li and Sokolik, 2018b; Mahowald et al., 2011b).
-
Uncertainty in the measurements. In addition to contamination of non-dust aerosols on the measurement of dust, there is also uncertainty due to assumed dust shape and complex refractive index to derive dust size, particularly for particles > 1 µm (Laskin et al., 2006), and error in AERONET AOD retrievals (e.g., the cloud-screening algorithms; Levy et al., 2010) and in the method used to filter out the contribution of non-dust aerosols. Note that difference exists between clear-sky from observations and all-sky AOD/DOD from the model and aerosol models but the difference is not a considerable error source (tested; not shown).
-
The method of selecting AERONET sites may introduce uncertainty because of the possible mismatch between simulated and observed AOD for both dust and non-dust aerosols.
This study has compared how different modeling representations of the dust emission schemes, the aerosol dry deposition schemes, transported dust particle size distributions, and the dust shape treatments affect the modeled dust cycle in CESM2.1–CAM6.1. We have evaluated model performance using different combinations of those modifications using offline dynamics by comparing the modeled dust properties (DOD, dust surface concentrations, dust deposition fluxes, atmospheric size distribution of transported dust, and dust DRE efficiency at the top of the atmosphere) that are related to the dust life cycle with (semi-) observations in the current climate. Since the new more physically based dust emission scheme shows substantial improvements on the model–observation comparison and the updated aerosol dry deposition scheme corrects the overestimated fine-mode deposition velocity, future model developments will be focused on introducing both these features into a future official CAM version for the benefit and use of the whole community. Results of this work therefore inform modelers how well these new features will improve model performance in reproducing the dust cycle in CESM.
Our analysis suggests that reverting the geometric standard deviation of the transported dust size distribution (coarse mode) from the default 1.2 to 1.8 imposes the most important change among what we introduced to CAM6.1 to the modeled dust cycle, though the linear assumption between DOD and the other dust quantities based on which we rescaled up the concentrations, deposition, burdens, and DRE of dust in the size distribution simulations introduces uncertainty. Since the defaulted 1.2 is too narrow to simulate the dust lifetime, in the next released model version, we recommend reverting the geometric standard deviation to 1.8, as in CAM5. This reverse may require a split of representation of dust and the stratospheric aerosols in the coarse mode, for which the narrow coarse-mode size distribution works better (Mills et al., 2016), and some changes to sea salt.
With the global DOD similarly comparable in different cases because of the retuning we applied or slight impacts by the updates on DOD, the modifications on dry deposition and emission schemes, and the gravitational settling due to dust asphericity only slightly changed the simulated global dust loadings/burdens and deposition. However, regionally, large difference among different model results for dust loadings/burden/DOD and deposition are found. These stem either from the choice of the dust emission schemes (BRIFT versus DEAD) or the width of the coarse-mode size distribution. Consequently, it is due primarily to the inclusion of the new dust emission scheme and the correction to the transported dust size contribution but not use of the new dry deposition scheme and accounting for dust asphericity that the new model, CAM6.α, shows improvements. It is worth noting that the results obtained in this study rely on the models with the offline dynamics, which is subject to change while using the predicted meteorology field online.
Overall, with the offline dynamics, the new model, CAM6.α:
-
can better capture the climatology and seasonal variation of DOD at more observational sites than the default model, CAM6.1, bearing in mind the uncertainty in the measurement and in the way that we did the model–data comparison;
-
results in a dust DRE that is regionally substantially different from CAM6.1 (e.g., stronger warming over most land areas except over South America and stronger cooling over the North Atlantic Ocean; Fig. 10d). Though the opposite change to dust DRE in one region to another partially cancels, (Fig. S17), its influence on the global mean dust DRE remains large (relative change > 55 %; Fig. 1l).
Still, there exists large uncertainty in modeling the global and regional dust cycle in comparison with observations. This large uncertainty could partially result from the constants used in the parametrizations that affect the dust emission and transport processes, such as the critical LAI threshold, the hygroscopicity of dust, and the prescribed scavenging coefficient, though the default values in the model have been used during the past decade in CAM of different versions. In addition, further development and studies focusing on the following processes and dust properties, which the current model does not represent well or omits entirely, may be helpful for further improving the simulation of the dust cycle in CESM:
-
For the dust emission parameterization, the threshold friction velocity calculated in both BRIFT and DEAD does not account for the spatiotemporal variability of the soil properties (e.g., soil grain size distribution, aggregate state, and static drag partition due to rocks etc.; Leung et al., 2022; mainly limited by the sparse information; Kok et al., 2014b) in addition to the soil moisture. The current dust module in CAM6.1 also does not consider the roughness effect due to the presence of non-erodible elements (i.e., rocks and pebbles) on the threshold velocity calculation (Marticorena and Bergametti, 1995). Also, crusted surface layer present at the erodible surface can greatly reduce the wind erodibility by increasing the particle cohesion, and thus the dust emission rate, compared to the surface that does not consist of consolidated aggregates (Rice and McEwan, 2001; Rodriguez-Caballero et al., 2022).
-
The models used here did not simulate anthropogenic dust emissions due to human activities (i.e., agricultural practices, such as overgrazing, and fugitive dust from roads and construction), which may constitute a considerable fraction of the total dust emissions (Ginoux et al., 2012). This could likely be a reason for the underestimated dust emission in the northern high-latitude regions (Sect. 5.1.1), for instance, at the Moscow metropolitan area (∼ 56∘ N, ∼ 37∘ E), one of the most significant northern high-latitude sources generated on paved roads and roadside soils (Kasimov et al., 2020), which the current model does not include.
-
Comparisons with the constrained global dust size distribution and measurements downwind of North Africa suggest that the model underestimates dust aerosols in the coarse mode with the geometric diameter > 5 µm and misses aerosol particles with the geometric diameter > 10 µm (Fig. 6). The former happens likely due to an underestimate of dust aerosol particles in that size range upon emissions and/or the removal rate of those particles being too high during transport in the model (Adebiyi and Kok, 2020; Meng et al., 2022), the reason for which is still under exploration. For the latter, extending the dust size range to include particles with the geometric diameter > 10 µm in CAM6 is a worthy endeavor, such as in CAM5 by Ke et al. (2022).
-
As previously noted (Wu et al., 2018), some of the variables in the dry deposition parameterizations could vary in different seasons for certain land cover and land use types, such as the roughness length, Z0, in Z01 and the displacement height of the canopy, h, in PZ10, for which a fixed climatological mean is used in the models. How accounting for the seasonal variation of those variables in the model can affect the dust cycle modeling deserves further exploration.
-
Compared to bulk dust, modeling dust aerosol as component minerals could better reproduce the observed spatiotemporal variability of dust optical properties and thus the dust DRE efficiency (Fig. 9) with the offline dynamics in the current climate. But the current atlas of soil mineralogy and the optical properties of key minerals (i.e., iron oxides) contain large uncertainties which should be better quantified in the future, such as that planned for the Earth Surface Mineral Dust Source Investigation (EMIT) (Green et al., 2020; Thompson et al., 2020) and in our ongoing work, respectively.
The comparison of modeling the global and regional dust cycle with observations itself is limited by the spatial and temporal coverage of observations, especially for high-latitude dust, particularly dust in the Southern Hemisphere. More intensive measurements on concentration, deposition, atmospheric loading, shape parameters, size distribution, and optical properties of dust aerosols at varied spatiotemporal scales would also help better represent dust and project climate changes in the global climate models.
The updated model code, key model results, and observations are available in a publicly accessible repository (https://doi.org/10.5281/zenodo.6989502, Li et al., 2022b). DustCOMM data are available at https://dustcomm.atmos.ucla.edu (last access: 4 November 2022) and https://doi.org/10.5281/zenodo.2620475 (Adebiyi et al., 2019).
The supplement related to this article is available online at: https://doi.org/10.5194/gmd-15-8181-2022-supplement.
LL and NMM designed the study. LL updated the CAM6.1, performed all the simulations, analyzed the model results with comments from NMM and JFK, and wrote the original paper with comments from NMM. XL and MW provided the new aerosol deposition code. All authors commented on and edited the paper.
The contact author has declared that none of the authors has any competing interests.
Publisher's note: Copernicus Publications remains neutral with regard to jurisdictional claims in published maps and institutional affiliations.
We thank the two anonymous reviewers for their constructive comments that helped improve the paper and thank Paul Ginoux for his helpful comments. Longlei Li and Natalie M. Mahowald acknowledge the high-performance computing resources from Cheyenne provided by NCAR's Computational and Information Systems Laboratory (CISL), sponsored by the National Science Foundation.
Longlei Li, Natalie M. Mahowald, and Douglas S. Hamilton were supported by the Department of Energy (DOE) DE-SC0021302. A portion of this work was also supported by the Earth Surface Mineral Dust Source Investigation (EMIT), a NASA Earth Ventures- Instrument (EVI-4) Mission. Xiaohong Liu and Mingxuan Wu were supported by NASA CloudSat and CALIPSO Science Program (grant NNX16AO94G/80NSSC20K0952). Mingxuan Wu was also supported by the US DOE, Office of Science, Office of Biological and Environmental Research, Earth and Environmental System Modeling program as part of the Energy Exascale Earth System Model (E3SM) project. The Pacific Northwest National Laboratory (PNNL) is operated for DOE by the Battelle Memorial Institute under contract DE-AC05-76RLO1830.
This paper was edited by Samuel Remy and reviewed by two anonymous referees.
Adebiyi, A. A. and Kok, J. F.: Climate models miss most of the coarse dust in the atmosphere, Sci. Adv., 6, 1–10, https://doi.org/10.1126/sciadv.aaz9507, 2020.
Adebiyi, A. A., Kok, J. F., Wang, Y., Ito, A., Ridley, D. A., Nabat, P., and Zhao, C: Dust Constraints from joint Observational-Modelling-experiMental analysis – DustCOMM Version 1, Zenodo [data set], https://doi.org/10.5281/zenodo.2620475, 2019.
Adebiyi, A. A., Kok, J. F., Wang, Y., Ito, A., Ridley, D. A., Nabat, P., and Zhao, C.: Dust Constraints from joint Observational-Modelling-experiMental analysis (DustCOMM): comparison with measurements and model simulations, Atmos. Chem. Phys., 20, 829–863, https://doi.org/10.5194/acp-20-829-2020, 2020.
Albani, S., Mahowald, N. M., Perry, A. T., Scanza, R. A., Zender, C. S., Heavens, N. G., Maggi, V., Kok, J. F. and Otto-Bliesner, B. L.: Improved dust representation in the Community Atmosphere Model, J. Adv. Model. Earth Syst., 6, 541–570, https://doi.org/10.1002/2013MS000279, 2014.
Ansmann, A., Petzold, A., Kandler, K., Tegen, I., Wendisch, M., Müller, D., Weinzierl, B., Müller, T., and Heintzenberg, J.: Saharan Mineral Dust Experiments SAMUM-1 and SAMUM-2: What have we learned?, Tellus B, 63, 403–429, https://doi.org/10.1111/j.1600-0889.2011.00555.x, 2011.
Arimoto, R., Duce, R. A., Ray, R. J., Unni, C. K., Arimoto, R., Duce, R. A., Ray, B., and Umni, C.: Atmospheric trace elements at Enewetak Atoll, 2. Transport to the ocean by wet and dry deposition, J. Geophys. Res., 90, 2391–2408, 1985.
Arimoto, R., Ray, B. J., Duce, R. A., Hewitt, A. D., Boldi, R., and Hudson, A.: Concentrations, sources and fluxes of trace elements in the remote marine atmosphere of New Zealand, J. Geophys. Res., 93, 22389–22405, 1990.
Ashpole, I. and Washington, R.: A new high-resolution central and western Saharan summertime dust source map from automated satellite dust plume tracking, J. Geophys. Res.-Atmos., 118, 6981–6995, https://doi.org/10.1002/jgrd.50554, 2013.
Atkinson, J., Murray, B., Woodhouse, M., Whale, T., Baustian, K., Carslaw, K. S., Doobie, S., O'Sullivan, D., and Malkin, T.: The importance of feldspar for ice nucleation by mineral dust in mixed-phase clouds, Nature, 498, 355–358 https://doi.org/10.1038/nature12278, 2013.
Bagheri, G. and Bonadonna, C.: On the drag of freely falling non-spherical particles, Powder Technol., 301, 526–544, https://doi.org/10.1016/j.powtec.2016.06.015, 2016.
Balkanski, Y., Schulz, M., Claquin, T., and Guibert, S.: Reevaluation of Mineral aerosol radiative forcings suggests a better agreement with satellite and AERONET data, Atmos. Chem. Phys., 7, 81–95, https://doi.org/10.5194/acp-7-81-2007, 2007.
Brindley, H. E. and Russell, J. E.: An assessment of Saharan dust loading and the corresponding cloud-free longwave direct radiative effect from geostationary satellite observations, J. Geophys. Res.-Atmos., 114, 1–24, https://doi.org/10.1029/2008JD011635, 2009.
Bullard, J. E.: The distribution and biogeochemical importance of highlatitude dust in the Arctic and Southern Ocean- Antarctic regions, J. Geophys. Res., 122, 3098–3103, https://doi.org/10.1002/2016JD026363, 2017.
Bullard, J. E., Baddock, M., Bradwell, T., Crusius, J., Darlington, E., Gaiero, D., Gassó, S., Gisladottir, G., Hodgkins, R., McCulloch, R., McKenna-Neuman, C., Mockford, T., Stewart, H., and Thorsteinsson, T.: High-latitude dust in the Earth system, Rev. Geophys., 54, 447–485, https://doi.org/10.1002/2016RG000518, 2016.
Cakmur, R., Miller, R., and Torres, O.: Incorporating the effect of small-scale circulations upon dust emission in an atmospheric general circulation model, J. Geophys. Res., 109, D07201, https://doi.org/10.1029/2003JD004067, 2004.
Christopher, S. A. and Jones, T.: Satellite-based assessment of cloud-free net radiative effect of dust aerosols over the Atlantic Ocean, Geophys. Res. Lett., 34, 4–7, https://doi.org/10.1029/2006GL027783, 2007.
Claquin, T., Schulz, M., and Balkanski, Y. J.: Modeling the Minerology of Atmospheric Dust Sources, J. Geophys. Res., 104, 22243–22256, 1999.
Cwiertny, D. M., Young, M. A., and Grassian, V. H.: Chemistry and photochemistry of mineral dust aerosol, Annu. Rev. Phys. Chem., 59, 27–51, https://doi.org/10.1146/annurev.physchem.59.032607.093630, 2008.
Dana, M. T. and Hales, J. M.: Statistical Aspects of the Washout of Polydisperse Aerosols, Atmos. Environ., 10, 45–50, 1976.
Delmonte, B., Baroni, C., Andersson, P. S., Narcisi, B., Salvatore, M. C., Petit, J. R., Scarchilli, C., Frezzotti, M., Albani, S., and Maggi, V.: Modern and Holocene aeolian dust variability from Talos Dome (Northern Victoria Land) to the interior of the Antarctic ice sheet, Quaternary Sci. Rev., 64, 76–89, https://doi.org/10.1016/j.quascirev.2012.11.033, 2013.
DeMott, P. J., Sassen, K., Poellot, M. R., Baumgardner, D., Rogers, D. C., Brooks, S. D., Prenni, A. J., and Kreidenweis, S. M.: African dust aerosols as atmospheric ice nuclei, Geophys. Res. Lett., 30, 1732, doi:10/1029/2003GL017410, 2003, 2003.
Di Biagio, C., Di Sarra, A., and Meloni, D.: Large atmospheric shortwave radiative forcing by Mediterranean aerosols derived from simultaneous ground-based and spaceborne observations and dependence on the aerosol type and single scattering albedo, J. Geophys. Res.-Atmos., 115, 1–11, https://doi.org/10.1029/2009JD012697, 2010.
Dubovik, O., Smirnov, A., Holben, B. N., King, M. D., Kaufman, Y. J., Eck, T. F., and Slutsker, I.: Accuracy assessments of aerosol optical properties retrieved from Aerososl Robotic Network (AERONET) Sun and sky radiance measurments, J. Geophys. Res., 105, 9791–9806, 2000.
Dufresne, J.-L., Gauier, C., Ricchiazzi, P., and Rouquart, Y.: Longwave Scattering Effects of Mineral Aerosols, Am. Meteorl. Soc., 59, 1959–1966, 2002.
Easter, R. C., Ghan, S. J., Zhang, Y., Saylor, R. D., Chapman, E. G., Laulainen, N. S., Abdul-Razzak, H., Leung, L. R., Bian, X., and Zaveri, R. A.: MIRAGE: Model description and evaluation of aerosols and trace gases, J. Geophys. Res.-Atmos., 109, 1–46, https://doi.org/10.1029/2004JD004571, 2004.
Emerson, E. W., Hodshire, A. L., Debolt, H. M., Bilsback, K. R. and Pierce, J. R.: Revisiting particle dry deposition and its role in radiative effect estimates, P. Natl. Acad. Sci. USA, 117, 26076–26082, https://doi.org/10.1073/pnas.2014761117, 2020.
Engelstaedter, S. and Washington, R.: Atmospheric controls on the annual cycle of North African dust, J. Geophys. Res.-Atmos., 112, 1–14, https://doi.org/10.1029/2006JD007195, 2007.
Eyring, V., Bony, S., Meehl, G. A., Senior, C. A., Stevens, B., Stouffer, R. J., and Taylor, K. E.: Overview of the Coupled Model Intercomparison Project Phase 6 (CMIP6) experimental design and organization, Geosci. Model Dev., 9, 1937–1958, https://doi.org/10.5194/gmd-9-1937-2016, 2016.
FAO/IIASA/ISRIC/ISSCAS/JRC: Harmonized World Soil Database (version 1.2), FAO, Rome, Italy and IIASA, Laxenburg, Austria, 2012.
Fécan, F., Marticorena, B., and Bergametti, G.: Parametrization of the increase of the aeolian erosion threshold wind friction velocity due to soil moisture for arid and semi-arid areas, Ann. Geophys., 17, 149–157, https://doi.org/10.1007/s00585-999-0149-7, 1999.
Ghan, S. J. and Zaveri, R. A.: Parameterization of optical properties for hydrated internally mixed aerosol, J. Geophys. Res.-Atmos., 112, 1–10, https://doi.org/10.1029/2006JD007927, 2007.
Ginoux, P., Chin, M., Tegen, I., Prospero, J. M., Holben, B., Dubovik, O., and Lin, S.-J.: Sources and distributions of dust aerosols simulated with the GOCART model, J. Geophys. Res., 106, 20255–20273, https://doi.org/10.1029/2000JD000053, 2001.
Ginoux, P., Prospero, J., Gill, T. E., Hsu, N. C., and Zhao, M.: Global scale attribution of anthropogenic and natural dust sources and their emission rates based on MODIS deep blue aerosol products, Rev. Geophys., 50, RG3005, https://doi.org/10.1029/2012RG000388, 2012.
Green, R. O., Mahowald, N., Ung, C., Thompson, D. R., Bator, L., Bennet, M., Bernas, M., Blackway, N., Bradley, C., Cha, J., Clark, P., Clark, R., Cloud, D., Diaz, E., Ben Dor, E., Duren, R., Eastwood, M., Ehlmann, B. L., Fuentes, L., Ginoux, P., Gross, J., He, Y., Kalashnikova, O., Kert, W., Keymeulen, D., Klimesh, M., Ku, D., Kwong-Fu, H., Liggett, E., Li, L., Lundeen, S., Makowski, M. D., Mazer, A., Miller, R., Mouroulis, P., Oaida, B., Okin, G. S., Ortega, A., Oyake, A., Nguyen, H., Pace, T., Painter, T. H., Pempejian, J., Garcia-Pando, C. P., Pham, T., Phillips, B., Pollock, R., Purcell, R., Realmuto, V., Schoolcraft, J., Sen, A., Shin, S., Shaw, L., Soriano, M., Swayze, G., Thingvold, E., Vaid, A., and Zan, J.: The Earth Surface Mineral Dust Source Investigation: An Earth Science Imaging Spectroscopy Mission, IEEE Aerosp. Conf. Proc., https://doi.org/10.1109/AERO47225.2020.9172731, 2020.
Groot Zwaaftink, C. D., Grythe, H., Skov, H., and Stohl, A.: Substantial contribution of northern high-latitude sources to mineral dust in the Arctic, J. Geophys. Res., 121, 13678–13697, https://doi.org/10.1002/2016JD025482, 2016.
Hamilton, D. S., Scanza, R. A., Feng, Y., Guinness, J., Kok, J. F., Li, L., Liu, X., Rathod, S. D., Wan, J. S., Wu, M., and Mahowald, N. M.: Improved methodologies for Earth system modelling of atmospheric soluble iron and observation comparisons using the Mechanism of Intermediate complexity for Modelling Iron (MIMI v1.0), Geosci. Model Dev., 12, 3835–3862, https://doi.org/10.5194/gmd-12-3835-2019, 2019.
Hamilton, D. S., Moore, J. K., Arneth, A., Bond, T. C., Carslaw, K. S., Hantson, S., Ito, A., Kaplan, J. O., Lindsay, K., Nieradzik, L., Rathod, S. D., Scanza, R. A., and Mahowald, N. M.: Impact of Changes to the Atmospheric Soluble Iron Deposition Flux on Ocean Biogeochemical Cycles in the Anthropocene, Global Biogeochem. Cy., 34, 1–22, https://doi.org/10.1029/2019GB006448, 2020.
Hansell, R. A., Tsay, S. C., Ji, Q., Hsu, N. C., Jeong, M. J., Wang, S. H., Reid, J. S., Liou, K. N., and Ou, S. C.: An assessment of the surface longwave direct radiative effect of airborne Saharan dust during the NAMMA field campaign, J. Atmos. Sci., 67, 1048–1065, https://doi.org/10.1175/2009JAS3257.1, 2010.
Hansell, R. A., Tsay, S. C., Hsu, N. C., Ji, Q., Bell, S. W., Holben, B. N., Welton, E. J., Roush, T. L., Zhang, W., Huang, J., Li, Z., and Chen, H.: An assessment of the surface longwave direct radiative effect of airborne dust in Zhangye, China, during the Asian Monsoon Years field experiment (2008), J. Geophys. Res.-Atmos., 117, 1–16, https://doi.org/10.1029/2011JD017370, 2012.
Hillamo, R. E., Kerminen, V.-M., Maenhaut, W., Jaffrezo, J.-L., Balachandran, S., and Davidson, C. I.: Size Distributions of Atmospheric Trace Elements at Dye 3. Greenland – I. Distribution Characteristics and Dry Deposition Velocities, Atmos. Environ., 27A, 2787–2802, 1993.
Holben, B. N., Eck, T., Slutsker, I., Tanré, D., Buis, J. P., Setzer, A., Vermote, E., Reagan, J. A., Kaufman, Y. J., Nakajima, T., Lavenu, F., Jankowiak, I., and Smirnov, A.: AERONET – A Federated Instrument Network and Data Archive for Aerosol Characterization, Remote Sens. Environ., 66, 1–16, https://doi.org/10.1016/S0034-4257(98)00031-5, 1998.
Huang, K., Zhuang, G., Li, J., Wang, Q., Sun, Y., Lin, Y., and Fu, J. S.: Mixing of Asian dust with pollution aerosol and the transformation of aerosol components during the dust storm over China in spring 2007, J. Geophys. Res., 115, 1–13, https://doi.org/10.1029/2009jd013145, 2010.
Huang, Y., Kok, J. F., Kandler, K., Lindqvist, H., Nousiainen, T., Sakai, T., Adebiyi, A. and Jokinen, O.: Climate Models and Remote Sensing Retrievals Neglect Substantial Desert Dust Asphericity, Geophys. Res. Lett., 47, 1–11, https://doi.org/10.1029/2019GL086592, 2020.
Huang, Y., Adebiyi, A. A., Formenti, P., and Kok, J. F.: Linking the Different Diameter Types of Aspherical Desert Dust Indicates That Models Underestimate Coarse Dust Emission, Geophys. Res. Lett., 48, 1–12, https://doi.org/10.1029/2020GL092054, 2021.
Huneeus, N., Schulz, M., Balkanski, Y., Griesfeller, J., Prospero, J., Kinne, S., Bauer, S., Boucher, O., Chin, M., Dentener, F., Diehl, T., Easter, R., Fillmore, D., Ghan, S., Ginoux, P., Grini, A., Horowitz, L., Koch, D., Krol, M. C., Landing, W., Liu, X., Mahowald, N., Miller, R., Morcrette, J.-J., Myhre, G., Penner, J., Perlwitz, J., Stier, P., Takemura, T., and Zender, C. S.: Global dust model intercomparison in AeroCom phase I, Atmos. Chem. Phys., 11, 7781–7816, https://doi.org/10.5194/acp-11-7781-2011, 2011.
IPCC: Summary for Policymakers, in: Climate Change 2021: The Physical Science Basis, Contribution of Working Group I to the Sixth Assessment Report of the Intergovernmental Panel on Climate Change, Cambridge University Press, https://www.ipcc.ch/report/ar6/wg1/ (last access: 4 November 2022), 2021.
Jickells, T. D., Dorling, S., Deuser, W. G., Church, T. M., Arimoto, R., and Prospero, J. M.: Air-borne dust fluxes to a deep water sediment trap in the Sargasso Sea, Global Biogeochem. Cy., 12, 311–320, 1998.
Johnson, B. T., Heese, B., McFarlane, S. A., Chazette, P., Jones, A., and Bellouin, N.: Vertical distribution and radiative effects of mineral dust and biomass burning aerosol over West Africa during DABEX, J. Geophys. Res.-Atmos., 113, 1–16, https://doi.org/10.1029/2008JD009848, 2008.
Jones, A. L., Feldman, D. R., Freidenreich, S., Paynter, D., Ramaswamy, V., Collins, W. D., and Pincus, R.: A New Paradigm for Diagnosing Contributions to Model Aerosol Forcing Error, Geophys. Res. Lett., 44, 12004–12012, https://doi.org/10.1002/2017GL075933, 2017.
Journet, E., Balkanski, Y., and Harrison, S. P.: A new data set of soil mineralogy for dust-cycle modeling, Atmos. Chem. Phys., 14, 3801–3816, https://doi.org/10.5194/acp-14-3801-2014, 2014.
Kandler, K., Benker, N., Bundke, U., Cuevas, E., Ebert, M., Knippertz, P., Rodríguez, S., Schütz, L., and Weinbruch, S.: Chemical composition and complex refractive index of Saharan Mineral Dust at Izaña, Tenerife (Spain) derived by electron microscopy, Atmos. Environ., 41, 8058–8074, https://doi.org/10.1016/j.atmosenv.2007.06.047, 2007.
Kandler, K., Lieke, K., Benker, N., Emmel, C., Küpper, M., Müller-Ebert, D., Ebert, M., Scheuvens, D., Schladitz, A., Schütz, L., and Weinbruch, S.: Electron microscopy of particles collected at Praia, Cape Verde, during the Saharan Mineral Dust Experiment: Particle chemistry, shape, mixing state and complex refractive index, TellusB, 63, 475–496, https://doi.org/10.1111/j.1600-0889.2011.00550.x, 2011.
Kasimov, N. S., Vlasov, D. V., and Kosheleva, N. E.: Enrichment of road dust particles and adjacent environments with metals and metalloids in eastern Moscow, Urban Clim., 32, 100638, https://doi.org/10.1016/j.uclim.2020.100638, 2020.
Ke, Z., Liu, X., Wu, M., Shan, Y. and Shi, Y.: Improved dust representation and impacts on dust transport and radiative effect in CAM5, J. Adv. Model. Earth Sy., 14, e2021MS002845, https://doi.org/10.1029/2021MS002845, 2022.
Kok, J., Parteli, E., Michaels, T., and Karam, D.: The physics of wind blown sand and dust, Reports Prog. Phys., 75, 106901, https://doi.org/10.1088/0034-4885/75/10/106901, 2012.
Kok, J. F.: Does the size distribution of mineral dust aerosols depend on the wind speed at emission?, Atmos. Chem. Phys., 11, 10149–10156, https://doi.org/10.5194/acp-11-10149-2011, 2011b.
Kok, J. F.: A scaling theory for the size distribution of emitted dust aerosols suggests climate models underestimate the size of the global dust cycle, P. Natl. Acad. Sci. USA, 108, 1016–1021, https://doi.org/10.1073/pnas.1014798108, 2011b.
Kok, J. F., Mahowald, N. M., Fratini, G., Gillies, J. A., Ishizuka, M., Leys, J. F., Mikami, M., Park, M.-S., Park, S.-U., Van Pelt, R. S., and Zobeck, T. M.: An improved dust emission model – Part 1: Model description and comparison against measurements, Atmos. Chem. Phys., 14, 13023–13041, https://doi.org/10.5194/acp-14-13023-2014, 2014a.
Kok, J. F., Albani, S., Mahowald, N. M., and Ward, D. S.: An improved dust emission model – Part 2: Evaluation in the Community Earth System Model, with implications for the use of dust source functions, Atmos. Chem. Phys., 14, 13043–13061, https://doi.org/10.5194/acp-14-13043-2014, 2014b.
Kok, J. F., Ridley, D. A., Zhou, Q., Miller, R. L., Zhao, C., Heald, C. L., Ward, D. S., Albani, S., and Haustein, K.: Smaller desert dust cooling effect estimated from analysis of dust size and abundance, Nat. Geosci., 10, 274–278, https://doi.org/10.1038/ngeo2912, 2017.
Kok, J. F., Adebiyi, A. A., Albani, S., Balkanski, Y., Checa-Garcia, R., Chin, M., Colarco, P. R., Hamilton, D. S., Huang, Y., Ito, A., Klose, M., Li, L., Mahowald, N. M., Miller, R. L., Obiso, V., Pérez García-Pando, C., Rocha-Lima, A., and Wan, J. S.: Contribution of the world's main dust source regions to the global cycle of desert dust, Atmos. Chem. Phys., 21, 8169–8193, https://doi.org/10.5194/acp-21-8169-2021, 2021a.
Kok, J. F., Adebiyi, A. A., Albani, S., Balkanski, Y., Checa-Garcia, R., Chin, M., Colarco, P. R., Hamilton, D. S., Huang, Y., Ito, A., Klose, M., Leung, D. M., Li, L., Mahowald, N. M., Miller, R. L., Obiso, V., Pérez García-Pando, C., Rocha-Lima, A., Wan, J. S., and Whicker, C. A.: Improved representation of the global dust cycle using observational constraints on dust properties and abundance, Atmos. Chem. Phys., 21, 8127–8167, https://doi.org/10.5194/acp-21-8127-2021, 2021b.
Laskin, A., Cowin, J. P., and Iedema, M. J.: Analysis of individual environmental particles using modern methods of electron microscopy and X-ray microanalysis, J. Electron Spectros. Relat. Phenomena, 150, 260–274, https://doi.org/10.1016/j.elspec.2005.06.008, 2006.
Lawrence, C. R. and Neff, J.: The contemporary physical and chemical flux of Aeolian dust: a synthesis of direct measurements of dust deposition, Chem. Geol., 257, 46–63, https://doi.org/10.1016/j.chemgeo.2009.02.005, 2009.
Leung, D. M., Kok, J. F., Li, L., Okin, G. S., Prigent, C., Klose, M., Garcia-Pando, C. P., Menut, L., Mahowald, N. M., Lawrence, D. M., and Chamecki, M.: A new process-based and scale-respecting desert dust emission scheme for global climate models – Part I: description and evaluation against inverse modeling emissions, Atmos. Chem. Phys. Discuss. [preprint], https://doi.org/10.5194/acp-2022-719, in review, 2022.
Levy, R. C., Remer, L. A., Kleidman, R. G., Mattoo, S., Ichoku, C., Kahn, R., and Eck, T. F.: Global evaluation of the Collection 5 MODIS dark-target aerosol products over land, Atmos. Chem. Phys., 10, 10399–10420, https://doi.org/10.5194/acp-10-10399-2010, 2010.
Li, F., Vogelmann, A. M., and Ramanathan, V.: Saharan dust aerosol radiative forcing measured from space, J. Climate, 17, 2558–2571, https://doi.org/10.1175/1520-0442(2004)017<2558:SDARFM>2.0.CO;2, 2004.
Li, F., Ginoux, P., and Ramaswamy, V.: Distribution, transport, and deposition of mineral dust in the Southern Ocean and Antarctica: Contribution of major sources, J. Geophys. Res., 113, D10207, https://doi.org/10.1029/2007JD009190, 2008.
Li, L. and Sokolik, I. N.: Analysis of dust aerosol retrievals using satellite data in Central Asia, Atmos.-Basel, 9, 288, https://doi.org/10.3390/atmos9080288, 2018a.
Li, L. and Sokolik, I. N.: The Dust Direct Radiative Impact and Its Sensitivity to the Land Surface State and Key Minerals in the WRF-Chem-DuMo Model: A Case Study of Dust Storms in Central Asia, J. Geophys. Res.-Atmos., 123, 4564–4582, https://doi.org/10.1029/2017JD027667, 2018b.
Li, L., Mahowald, N. M., Miller, R. L., Pérez García-Pando, C., Klose, M., Hamilton, D. S., Gonçalves Ageitos, M., Ginoux, P., Balkanski, Y., Green, R. O., Kalashnikova, O., Kok, J. F., Obiso, V., Paynter, D., and Thompson, D. R.: Quantifying the range of the dust direct radiative effect due to source mineralogy uncertainty, Atmos. Chem. Phys., 21, 3973–4005, https://doi.org/10.5194/acp-21-3973-2021, 2021.
Li, L., Mahowald, N. M., Kok, J. F., Liu, X., Wu, M., Leung, D. M., Hamilton, D. S., Emmons, L. K., Huang, Y., Sexton, N., Meng, J., and Wan, J.: Data and codes for “Importance of different parameterization changes for the updated dust cycle modelling in the Community Atmosphere Model (version 6.1)” (1.0.0), Zenodo [data set], https://doi.org/10.5281/zenodo.6989502, 2022b.
Liao, H. and Seinfeld, J. H.: Radiative forcing by mineral dust aerosols: sensitivity to key variables, J. Geophys. Res., 103, 31637–31645, https://doi.org/10.1029/1998JD200036, 1998.
Liu, X., Ma, P.-L., Wang, H., Tilmes, S., Singh, B., Easter, R. C., Ghan, S. J., and Rasch, P. J.: Description and evaluation of a new four-mode version of the Modal Aerosol Module (MAM4) within version 5.3 of the Community Atmosphere Model, Geosci. Model Dev., 9, 505–522, https://doi.org/10.5194/gmd-9-505-2016, 2016.
Mahowald, N.: Aerosol indirect effect on biogeochemical cycles and climate, Science, 334, 6057, https://doi.org/10.1126/science.1207374, 2011.
Mahowald, N., Ward, D. S., Kloster, S., Flanner, M. G., Heald, C. L., Heavens, N. G., Hess, P. G., Lamarque, J.-F., and Chuang, P. Y.: Aerosol Impacts on Climate and Biogeochemistry, Annu. Rev. Env. Resour., 36, 45–74, 2011a.
Mahowald, N., Albani, S., Engelstaedter, S., Winckler, G., and Goman, M.: Model insight into glacial-interglacial paleodust records, Quaternary Sci. Rev., 30, 832–854, https://doi.org/10.1016/j.quascirev.2010.09.007, 2011b.
Mahowald, N., Albani, S., Kok, J. F., Engelstaeder, S., Scanza, R., Ward, D. S., and Flanner, M. G.: The size distribution of desert dust aerosols and its impact on the Earth system, Aeolian Res., 15, 53–71, https://doi.org/10.1016/j.aeolia.2013.09.002, 2014.
Mahowald, N. M., Muhs, D., Levis, S., Rasch, P. J., Yoshioka, M., Zender, C. S., Muhs, D. R., Levis, S., Rasch, P. J., Yoshioka, M., Zender, C. S., and Luo, C.: Change in atmospheric mineral aerosols in response to climate: last glacial period, pre-industrial, modern and doubled-carbon dioxide climates, J. Geophys. Res., 111, D10202, https://doi.org/10.1029/2005JD006653, 2006a.
Mahowald, N. M., Yoshioka, M., Collins, W. D., Conley, A. J., Fillmore, D. W. and Coleman, D. B.: Climate response and radiative forcing from mineral aerosols during the last glacial maximum, pre-industrial, current and doubled-carbon dioxide climates, Geophys. Res. Lett., 33, 382–385, https://doi.org/10.1029/2006GL026126, 2006b.
Mahowald, N. M., Engelstaedter, S., Luo, C., Sealy, A., Artaxo, P., Benitez-Nelson, C., Bonnet, S., Chen, Y., Chuang, P. Y., Cohen, D. D., Dulac, F., Herut, B., Johansen, A. M., Kubilay, N., Losno, R., Maenhaut, W., Paytan, A., Prospero, J. M., Shank, L. M., and Siefert, R. L.: Atmospheric iron deposition: Global distribution, variability, and human perturbations, Annu. Rev. Mar. Sci., 1, 245–278, https://doi.org/10.1146/annurev.marine.010908.163727, 2009.
Mahowald, N. M., Kloster, S., Engelstaedter, S., Moore, J. K., Mukhopadhyay, S., McConnell, J. R., Albani, S., Doney, S. C., Bhattacharya, A., Curran, M. A. J., Flanner, M. G., Hoffman, F. M., Lawrence, D. M., Lindsay, K., Mayewski, P. A., Neff, J., Rothenberg, D., Thomas, E., Thornton, P. E., and Zender, C. S.: Observed 20th century desert dust variability: impact on climate and biogeochemistry, Atmos. Chem. Phys., 10, 10875–10893, https://doi.org/10.5194/acp-10-10875-2010, 2010.
Mahowald, N. M., Scanza, R., Brahney, J., Goodale, C. L., Hess, P. G., Moore, J. K., and Neff, J.: Aerosol Deposition Impacts on Land and Ocean Carbon Cycles, Curr. Clim. Chang. Rep., 3, 16–31, https://doi.org/10.1007/s40641-017-0056-z, 2017.
Marsham, J. H., Knippertz, P., Dixon, N. S., Parker, D. J., and Lister, G. M. S.: The importance of the representation of deep convection for modeled dust-generating winds over West Africa during summer, Geophys. Res. Lett., 38, L16803, https://doi.org/10.1029/2011gl048368, 2011.
Marsham, J. H., Hobby, M., Allen, C. J. T., Banks, J. R., Bart, M., Brooks, B. J., Cavazos-Guerra, C., Engelstaedter, S., Gascoyne, M., Lima, A. R., Martins, J. V., McQuaid, J. B., O'Leary, A., Ouchene, B., Ouladichir, A., Parker, D. J., Saci, A., Salah-Ferroudj, M., Todd, M. C., and Washington, R.: Meteorology and dust in the central Sahara: Observations from Fennec supersite-1 during the June 2011 Intensive Observation Period, J. Geophys. Res.-Atmos., 118, 4069–4089, https://doi.org/10.1002/jgrd.50211, 2013.
Marticorena, B. and Bergametti, G.: Modeling the atmospheric dust cycle: 1. Design of a soil-derived dust emission scheme, J. Geophys. Res., 100, 16415–16430, https://doi.org/10.1029/95JD00690, 1995.
Martin, J. H., Fitzwater, S. E., and Gordon, R. M.: Iron deficiency limits phytoplankton growth in Antarctic waters, Global Biogeochem. Cy., 4, 5–12, https://doi.org/10.1029/GB004i001p00005, 1990.
McConnell, C. L., Highwood, E. J., Coe, H., Formenti, P., Anderson, B., Osborne, S., Nava, S., Desboeufs, K., Chen, G., and Harrison, M. A. J.: Seasonal variations of the physical and optical characteristics of saharan dust: Results from the dust outflow and deposition to the ocean (DODO) experiment, J. Geophys. Res., 113, 1–19, https://doi.org/10.1029/2007JD009606, 2008.
McCutcheon, J., Lutz, S., Williamson, C., Cook, J. M., Tedstone, A. J., Vanderstraeten, A., Wilson, S. A., Stockdale, A., Bonneville, S., Anesio, A. M., Yallop, M. L., McQuaid, J. B., Tranter, M., and Benning, L. G.: Mineral phosphorus drives glacier algal blooms on the Greenland Ice Sheet, Nat. Commun., 12, 1–11, hhttps://doi.org/10.1038/s41467-020-20627-w, 2021.
Meinander, O., Dagsson-Waldhauserova, P., Amosov, P., Aseyeva, E., Atkins, C., Baklanov, A., Baldo, C., Barr, S. L., Barzycka, B., Benning, L. G., Cvetkovic, B., Enchilik, P., Frolov, D., Gassó, S., Kandler, K., Kasimov, N., Kavan, J., King, J., Koroleva, T., Krupskaya, V., Kulmala, M., Kusiak, M., Lappalainen, H. K., Laska, M., Lasne, J., Lewandowski, M., Luks, B., McQuaid, J. B., Moroni, B., Murray, B., Möhler, O., Nawrot, A., Nickovic, S., O’Neill, N. T., Pejanovic, G., Popovicheva, O., Ranjbar, K., Romanias, M., Samonova, O., Sanchez-Marroquin, A., Schepanski, K., Semenkov, I., Sharapova, A., Shevnina, E., Shi, Z., Sofiev, M., Thevenet, F., Thorsteinsson, T., Timofeev, M., Umo, N. S., Uppstu, A., Urupina, D., Varga, G., Werner, T., Arnalds, O., and Vukovic Vimic, A.: Newly identified climatically and environmentally significant high-latitude dust sources, Atmos. Chem. Phys., 22, 11889–11930, https://doi.org/10.5194/acp-22-11889-2022, 2022.
Meng, J., Huang, Y., Leung, D. M., Li, L., Adebiyi, A. A., Ryder, C. L., Mahowald, N. M., and Kok, J. F.: Improved Parameterization for the Size Distribution of Emitted Dust Aerosols Reduces Model Underestimation of Super Coarse Dust, Geophys. Res. Lett., 49, 1–12, https://doi.org/10.1029/2021GL097287, 2022.
Miller, R. L. and Tegen, I.: Radiative Forcing of a Tropical Direct Circulation by Soil Dust Aerosols, J. Atmos. Sci., 56, 2403–2433, https://doi.org/10.1175/1520-0469(1999)056<2403:RFOATD>2.0.CO;2, 1999.
Mills, M. J., Schmidt, A., Easter, R., Solomon, S., Kinnison, D. E., Ghan, S. J., Neely, R. R., Marsh, D. R., Conley, A., Bardeen, C. G., and Gettelman, A.: Global volcanic aerosol properties derived from emissions, 1990–2014, using CESM1(WACCM), J. Geophys. Res., 121, 2332–2348, https://doi.org/10.1002/2015JD024290, 2016.
Na, Y., Fu, Q., and Kodama, C.: Precipitation Probability and Its Future Changes From a Global Cloud-Resolving Model and CMIP6 Simulations, J. Geophys. Res.-Atmos., 125, 1–23, https://doi.org/10.1029/2019JD031926, 2020.
Neale, R. B., Chen, C., Lauritzen, P. H., Williamson, D. L., Conley, A. J., Smith, A. K., Mills, M., and Morrison, H.: Description of the NCAR Community Atmosphere Model (CAM5.0), Boulder, CO, 2010.
Otto, S., de Reus, M., Trautmann, T., Thomas, A., Wendisch, M., and Borrmann, S.: Atmospheric radiative effects of an in situ measured Saharan dust plume and the role of large particles, Atmos. Chem. Phys., 7, 4887–4903, https://doi.org/10.5194/acp-7-4887-2007, 2007.
Patadia, F., Yang, E.-S., and Christopher, S.: Does dust change the clear sky top of atmosphere shortwave flux over high surface reflectance regions?, Geophys. Res. Lett., 36, L15825, https://doi.org/10.1029/2009GL039092, 2009.
Pérez, C., Nickovic, S., Pejanovic, G., Baldasano, J. M., and Özsoy, E.: Interactive dust-radiation modeling: A step to improve weather forecasts, J. Geophys. Res. Atmos., 111, D16206, https://doi.org/10.1029/2005JD006717, 2006.
Petroff, A. and Zhang, L.: Development and validation of a size-resolved particle dry deposition scheme for application in aerosol transport models, Geosci. Model Dev., 3, 753–769, https://doi.org/10.5194/gmd-3-753-2010, 2010.
Petroff, A., Mailliat, A., Amielh, M., and Anselmet, F.: Aerosol dry deposition on vegetative canopies. Part I: Review of present knowledge, Atmos. Environ., 42, 3625–3653, https://doi.org/10.1016/j.atmosenv.2007.09.043, 2008.
Petters, M. D. and Kreidenweis, S. M.: A single parameter representation of hygroscopic growth and cloud condensation nucleus activity, Atmos. Chem. Phys., 7, 1961–1971, https://doi.org/10.5194/acp-7-1961-2007, 2007.
Prospero, J. M.: Long-range transport of mineral dust in the global atmosphere: Impact of African dust on the environment of the southeastern United States, P. Natl. Acad. Sci. USA, 96, 3396–3403, 1999.
Prospero, J. M. and Nees, R. T.: Impact of the North African drought and El Niño on mineral dust in the Barbados trade winds, Nature, 320, 735–738, https://doi.org/10.1038/320735a0, 1986.
Prospero, J. M. and Savoie, D. L.: Effect of continental sources on nitrate concentrations over the Pacific Ocean, Nature, 339, 687–689, https://doi.org/10.1038/339687a0, 1989.
Prospero, J. M., Barkley, A. E., Gaston, C. J., Gatineau, A., Campos y Sansano, A., and Panechou, K.: Characterizing and Quantifying African Dust Transport and Deposition to South America: Implications for the Phosphorus Budget in the Amazon Basin, Global Biogeochem. Cy., 34, e2020GB006536, https://doi.org/10.1029/2020GB006536, 2020.
Pruppacher, H. R., Klett, J. D., and Wang, P. K.: Microphysics of Clouds and Precipitation, Aerosol. Sci. Tech., 28, 381–382, https://doi.org/10.1080/02786829808965531, 1998.
Pu, B., Ginoux, P., Guo, H., Hsu, N. C., Kimball, J., Marticorena, B., Malyshev, S., Naik, V., O'Neill, N. T., Pérez García-Pando, C., Paireau, J., Prospero, J. M., Shevliakova, E., and Zhao, M.: Retrieving the global distribution of the threshold of wind erosion from satellite data and implementing it into the Geophysical Fluid Dynamics Laboratory land–atmosphere model (GFDL AM4.0/LM4.0), Atmos. Chem. Phys., 20, 55–81, https://doi.org/10.5194/acp-20-55-2020, 2020.
Reid, E., Reid, J., Meier, M., Dunlap, M., Cliff, S., Broumas, A., Perry, K., and Maring, H.: Characterization of African dust transported to Puerto Rico by individual particle and size segregated bulk analysis, J. Geophys. Res.-Atmos., 108, 8591, https://doi.org/10.1029/2002JD002935, 2003.
Reid, J. S., Jonsson, H. H., Maring, H. B., Smirnov, A., Savoie, D. L., Cliff, S. S., Reid, E. A., Livingston, J. M., Meier, M. M., Dubovik, O., and Tsay, S. C.: Comparison of size and morphological measurements of coarse mode dust particles from Africa, J. Geophys. Res.-Atmos., 108, 8593, https://doi.org/10.1029/2002JD002485, 2003.
Rice, M. A. and McEwan, I. K.: Crust strength: A wind tunnel study of the effect of impact by saltating particles on cohesive soil surfaces, Earth Surf. Proc. Land., 26, 721–733, https://doi.org/10.1002/esp.217, 2001.
Ridley, D. A., Heald, C. L., Kok, J. F., and Zhao, C.: An observationally constrained estimate of global dust aerosol optical depth, Atmos. Chem. Phys., 16, 15097–15117, https://doi.org/10.5194/acp-16-15097-2016, 2016.
Rodriguez-Caballero, E., Stanelle, T., Egerer, S., Cheng, Y., Su, H., Canton, Y., Belnap, J., Andreae, M. O., Tegen, I., Reick, C. H., Pöschl, U., and Weber, B.: Global cycling and climate effects of aeolian dust controlled by biological soil crusts, Nat. Geosci., 15, 458–463, https://doi.org/10.1038/s41561-022-00942-1, 2022.
Rosenfeld, D., Rudich, Y., and Lahav, R.: Desert dust suppressing precipitation: a possible desertification feedback loop, P. Natl. Acad. Sci. USA, 98, 5975–5980, 2001.
Ryder, C. L., Highwood, E. J., Rosenberg, P. D., Trembath, J., Brooke, J. K., Bart, M., Dean, A., Crosier, J., Dorsey, J., Brindley, H., Banks, J., Marsham, J. H., McQuaid, J. B., Sodemann, H., and Washington, R.: Optical properties of Saharan dust aerosol and contribution from the coarse mode as measured during the Fennec 2011 aircraft campaign, Atmos. Chem. Phys., 13, 303–325, https://doi.org/10.5194/acp-13-303-2013, 2013.
Ryder, C. L., Marenco, F., Brooke, J. K., Estelles, V., Cotton, R., Formenti, P., McQuaid, J. B., Price, H. C., Liu, D., Ausset, P., Rosenberg, P. D., Taylor, J. W., Choularton, T., Bower, K., Coe, H., Gallagher, M., Crosier, J., Lloyd, G., Highwood, E. J., and Murray, B. J.: Coarse-mode mineral dust size distributions, composition and optical properties from AER-D aircraft measurements over the tropical eastern Atlantic, Atmos. Chem. Phys., 18, 17225–17257, https://doi.org/10.5194/acp-18-17225-2018, 2018.
Ryder, C. L., Highwood, E. J., Walser, A., Seibert, P., Philipp, A., and Weinzierl, B.: Coarse and giant particles are ubiquitous in Saharan dust export regions and are radiatively significant over the Sahara, Atmos. Chem. Phys., 19, 15353–15376, https://doi.org/10.5194/acp-19-15353-2019, 2019.
Sarangi, C., Qian, Y., Rittger, K., Ruby Leung, L., Chand, D., Bormann, K. J., and Painter, T. H.: Dust dominates high-altitude snow darkening and melt over high-mountain Asia, Nat. Clim. Chang, 10, 1045–1051, https://doi.org/10.1038/s41558-020-00909-3, 2020.
Scanza, R. A., Mahowald, N., Ghan, S., Zender, C. S., Kok, J. F., Liu, X., Zhang, Y., and Albani, S.: Modeling dust as component minerals in the Community Atmosphere Model: development of framework and impact on radiative forcing, Atmos. Chem. Phys., 15, 537–561, https://doi.org/10.5194/acp-15-537-2015, 2015.
Scanza, R. A., Hamilton, D. S., Perez Garcia-Pando, C., Buck, C., Baker, A., and Mahowald, N. M.: Atmospheric processing of iron in mineral and combustion aerosols: development of an intermediate-complexity mechanism suitable for Earth system models, Atmos. Chem. Phys., 18, 14175–14196, https://doi.org/10.5194/acp-18-14175-2018, 2018.
Shao, Y.: Physics and Modelling of Wind Erosion, Springer, 34–35, 37, ISBN 1402088957, 9781402088957, 2008.
Shi, Y. and Liu, X.: Dust Radiative Effects on Climate by Glaciating Mixed-Phase Clouds, Geophys. Res. Lett., 46, 6128–6137, https://doi.org/10.1029/2019GL082504, 2019.
Shi, Y., Liu, X., Wu, M., Zhao, X., Ke, Z., and Brown, H.: Relative importance of high-latitude local and long-range-transported dust for Arctic ice-nucleating particles and impacts on Arctic mixed-phase clouds, Atmos. Chem. Phys., 22, 2909–2935, https://doi.org/10.5194/acp-22-2909-2022, 2022.
Shinn, A., Smith, W., and Barber, T.: African Dust and the Demise of Caribbean Coral Reefs, Geophys. Res. Lett., 27, 3029–3032, https://doi.org/10.1029/2000GL011599, 2000.
Skiles, S. M. K., Flanner, M., Cook, J. M., Dumont, M., and Painter, T. H.: Radiative forcing by light-absorbing particles in snow, Nat. Clim. Change, 8, 964–971, https://doi.org/10.1038/s41558-018-0296-5, 2018.
Sokolik, I. N. and Toon, O. B.: Direct radiative forcing by anthropogenic airborne mineral aerosols, Nature, 381, 681–683, 1996.
Sokolik, I. N. and Toon, O. B.: Incorporation of mineralogical composition into models of the radiative properties of mineral aerosol form UV to IR wavelengths, J. Geophys. Res., 104, 9423–9444, 1999.
Sokolik, I. N., Winker, D. M., Bergametti, G., Gillette, D. A., Carmichael, Y. J., Kaufman, Y. J., Gomes, L., Schuetz, L., and Penner, J. E.: Introduction to special section: Outstanding problems in quantifying the radiative impacts of mineral dust, J. Geophys. Res.-Atmos., 106, 18015–18027, https://doi.org/10.1029/2000jd900498, 2001.
Song, Q., Zhang, Z., Yu, H., Kato, S., Yang, P., Colarco, P., Remer, L. A., and Ryder, C. L.: Net radiative effects of dust in the tropical North Atlantic based on integrated satellite observations and in situ measurements, Atmos. Chem. Phys., 18, 11303–11322, https://doi.org/10.5194/acp-18-11303-2018, 2018.
Swap, R., Garstang, M., Greco, S., Talbot, R., and Kallberg, P.: Saharan dust in the Amazon Basin, Tellus, 44B, 133–149, 1992.
Tegen, I., Harrison, S. P., Kohfeld, K., Prentice, C., Coe, M., and Heimann, M.: The impact of vegetation and preferential source areas on global dust aerosol: Results from a model study, J. Geophys. Res., 107, 4576–4597, https://doi.org/10.1029/2001JD000963, 2002.
Thompson, D. R., Braverman, A., Brodrick, P. G., Candela, A., Carmon, N., Clark, R. N., Connelly, D., Green, R. O., Kokaly, R. F., Li, L., Mahowald, N., Miller, R. L., Okin, G. S., Painter, T. H., Swayze, G. A., Turmon, M., Susilouto, J., and Wettergreen, D. S.: Quantifying uncertainty for remote spectroscopy of surface composition, Remote Sens. Environ., 247, 111898, https://doi.org/10.1016/j.rse.2020.111898, 2020.
Tie, X. and Cao, J.: Aerosol pollution in China: Present and future impact on environment, Particuology, 7, 426–431, https://doi.org/10.1016/j.partic.2009.09.003, 2009.
Uematsu, M., Duce, R. A., and Prospero, J. M.: Deposition of Atmospheric Mineral Particles in the North Pacific Ocean, J. Atmos. Chem., 3, 123–138, 1985.
Usher, C. R., Michel, A. E., and Grassian, V. H.: Reactions on Mineral Dust, Chem. Rev., 103, 4883–4939, https://doi.org/10.1021/cr020657y, 2003.
Wagenbach, D., Ducroz, F., Mulvaney, R., Keck, L., Minikin, A., Legrand, M., Hall, J. S., and Wolff, E. W.: Sea-salt aerosol in coastal Antarctic regions, J. Geophys. Res., 103, 10961–10974, https://doi.org/10.1029/97jd01804, 1998.
Wang, P. K., Grover, S. N., and Pruppacher, H. R.: On the Effect of Electric Charges on the Scavenging of Aerosol Particles by Clouds and Small Raindrops, J. Atmos. Sci., 35, 1735–1743, https://doi.org/10.1175/1520-0469(1978)035<1735:OTEOEC>2.0.CO;2, 1978.
Wang, R., Tao, S., Balkanski, Y., Ciais, P., Boucher, O., Liu, J., Piao, S., Shen, H., Vuolo, M. R., Valari, M., Chen, H., Chen, Y., Cozic, A., Huang, Y., Li, B., Li, W., Shen, G., Wang, B., and Zhang, Y.: Exposure to ambient black carbon derived from a unique inventory and high-resolution model, P. Natl. Acad. Sci. USA, 111, 2459–2463, https://doi.org/10.1073/pnas.1318763111, 2014.
Wang, Y., Chakrabarti, A., and Sorensen, C. M.: A light-scattering study of the scattering matrix elements of Arizona Road Dust, J. Quant. Spectrosc. Ra., 163, 72–79, https://doi.org/10.1016/j.jqsrt.2015.05.002, 2015.
Wolff, E., Fischer, H., Fundel, F., Ruth, U., Twarloh, B., Littot, G., Mulvaney, R., Rothlistberger, R., DeAngelis, M., Boutron, C., Hasson, M., Jonsell, U., Hutterli, M., Lambert, F., Kaufmann, P. R., Stauffer, B., Socker, T., Steffensen, J. P., Bigler, M., Siggard-Andersen, Udisti, R., Becagli, S., Castellano, E., Severi, M., Wagenbach, D., Barbante, C., Gabrielli, P., and Gaspari, V.: Southern Ocean sea-ice extent, productivity and iron flux over the past eight glacial cycles, Nature, 440, 491–496, https://doi.org/10.1038/nature04614, 2006.
Wu, C., Lin, Z., and Liu, X.: The global dust cycle and uncertainty in CMIP5 (Coupled Model Intercomparison Project phase 5) models, Atmos. Chem. Phys., 20, 10401–10425, https://doi.org/10.5194/acp-20-10401-2020, 2020.
Wu, M., Liu, X., Zhang, L., Wu, C., Lu, Z., Ma, P. L., Wang, H., Tilmes, S., Mahowald, N., Matsui, H., and Easter, R. C.: Impacts of Aerosol Dry Deposition on Black Carbon Spatial Distributions and Radiative Effects in the Community Atmosphere Model CAM5, J. Adv. Model. Earth Syst., 10, 1150–1171, https://doi.org/10.1029/2017MS001219, 2018.
Wu, M., Liu, X., Yu, H., Wang, H., Shi, Y., Yang, K., Darmenov, A., Wu, C., Wang, Z., Luo, T., Feng, Y., and Ke, Z.: Understanding processes that control dust spatial distributions with global climate models and satellite observations, Atmos. Chem. Phys., 20, 13835–13855, https://doi.org/10.5194/acp-20-13835-2020, 2020.
Yang, E. S., Gupta, P., and Christopher, S. A.: Net radiative effect of dust aerosols from satellite measurements over Sahara, Geophys. Res. Lett., 36, 1–5, https://doi.org/10.1029/2009GL039801, 2009.
Yuan, H., Zhuang, G., Li, J., Wang, Z., and Li, J.: Mixing of mineral with pollution aerosols in dust season in Beijing: Revealed by source apportionment study, Atmos. Environ., 42, 2141–2157, https://doi.org/10.1016/j.atmosenv.2007.11.048, 2008.
Zender, C., Bian, H., and Newman, D.: Mineral Dust Entrainment and Deposition (DEAD) model: Description and 1990s dust climatology, J. Geophys. Res., 108, 4416, https://doi.org/10.1029/2002JD002775, 2003a.
Zender, C., Newman, D. and Torres, O.: Spatial Heterogeneity in Aerolian Erodibility: Uniform, Topographic, Geomorphic and Hydrologic Hypotheses, J. Geophys. Res., 108, 1–18, https://doi.org/10.1029/2002JD003039, 2003b.
Zhang, D., Iwasaka, Y., Matsuki, A., Ueno, K., and Matsuzaki, T.: Coarse and accumulation mode particles associated with Asian dust in southwestern Japan, Atmos. Environ., 40, 1205–1215, https://doi.org/10.1016/j.atmosenv.2005.10.037, 2006.
Zhang, J. and Christopher, S.: Long wave radiative forcing of Saharan dust aerosols estimated from MODIS, MISR and CERES observations on TERRA, Geophys. Res. Lett., 30, 2188, https://doi.org/10.1029/2003GL018479, 2003.
Zhang, L., Gong, S. L., Padro, J., and Barrie, L.: A size-segregated dry depositoin scheme for an atmospheric aerosol module, Atmos. Environ., 35, 549–560, https://doi.org/10.1016/S1352-2310(00)00326-5, 2001.
Zuidema, P., Alvarez, C., Kramer, S. J., Custals, L., Izaguirre, M., Sealy, P., Prospero, J. M., and Blades, E.: Is summer African dust arriving earlier to Barbados?, B. Am. Meteorol. Soc., 100, 1981–1986, https://doi.org/10.1175/BAMS-D-18-0083.1, 2019.
- Abstract
- Introduction
- Model descriptions
- Observational datasets for model evaluations
- Model assessment metrics
- Results
- Bulk- versus speciated-dust model
- Limitations in the model–observation comparison
- Concluding remarks and outlook
- Code and data availability
- Author contributions
- Competing interests
- Disclaimer
- Acknowledgements
- Financial support
- Review statement
- References
- Supplement