the Creative Commons Attribution 4.0 License.
the Creative Commons Attribution 4.0 License.
 | 30 Aug 2022
Climate and parameter sensitivity and induced uncertainties in carbon stock projections for European forests (using LPJ-GUESS 4.0)
Johannes Oberpriller
Christine Herschlein
Peter Anthoni
Almut Arneth
Andreas Krause
Anja Rammig
Mats Lindeskog
Stefan Olin
Florian Hartig
Understanding uncertainties and sensitivities of projected ecosystem dynamics under environmental change is of immense value for research and climate change policy. Here, we analyze sensitivities (change in model outputs per unit change in inputs) and uncertainties (changes in model outputs scaled to uncertainty in inputs) of vegetation dynamics under climate change, projected by a state-of-the-art dynamic vegetation model (LPJ-GUESS v4.0) across European forests (the species Picea abies, Fagus sylvatica and Pinus sylvestris), considering uncertainties of both model parameters and environmental drivers. We find that projected forest carbon fluxes are most sensitive to photosynthesis-, water-, and mortality-related parameters, while predictive uncertainties are dominantly induced by environmental drivers and parameters related to water and mortality. The importance of environmental drivers for predictive uncertainty increases with increasing temperature. Moreover, most of the interactions of model inputs (environmental drivers and parameters) are between environmental drivers themselves or between parameters and environmental drivers. In conclusion, our study highlights the importance of environmental drivers not only as contributors to predictive uncertainty in their own right but also as modifiers of sensitivities and thus uncertainties in other ecosystem processes. Reducing uncertainty in mortality-related processes and accounting for environmental influence on processes should therefore be a focus in further model development.
- Article
(2550 KB) - Full-text XML
- BibTeX
- EndNote


Terrestrial ecosystem models have emerged in the last 3 decades as a central tool for decision making and basic research on vegetation ecosystems (Cramer et al., 2001; Fisher et al., 2018; IPCC, 2014; Smith et al., 2001; Snell et al., 2014). Projections from different vegetation models, however, often disagree on important details, for example regarding the observable past (Bastos et al., 2020) or the future carbon uptake of forest ecosystems (Huntzinger et al., 2017; Krause et al., 2019). Among the possible reasons for such differences is the uncertainty in climate scenarios (Saraiva et al., 2019), model structural uncertainty (Bugmann et al., 2019; Oberpriller et al., 2021a; Prestele et al., 2016), initial condition uncertainty (Dietze, 2017b), and uncertainty about the model parametrization (Grimm, 2005), which in turn make models' projections themselves uncertain (Dietze, 2017a). It is widely appreciated that understanding which exact factors drive these uncertainties is of immense value for directing research (Tomlin, 2013) and also for interpreting and understanding projections (Dietze et al., 2018). For example, the IPCC started in its Fifth Assessment Report to systematically analyze uncertainties and attribute them to model inputs (IPCC, 2014) similar to other predictive sciences (e.g., nuclear reactor safety (Chauliac et al., 2011), energy assessment for buildings (Tian et al., 2018), or policy analysis (Maxim and van der Sluijs, 2011).
The two main tools to understand how uncertainties in model inputs (drivers, parameters, and model structure) affect model outputs are sensitivity analysis (SA) and uncertainty analysis (UA) (Cariboni et al., 2007; Caswell, 2019; Saltelli, 2002; Saltelli et al., 2008). The key difference between these two methods is that in a UA the central starting point is the quantification of uncertainty in the model inputs (e.g., parameters, typically determined via expert elicitations and previous studies Matott et al., 2009). This uncertainty is then propagated to the model outputs and back-attributed to the different inputs. An SA, on the other hand, calculates how the model output changes per unit or percentage of change in the respective input (Jørgensen and Bendoricchio, 2001). This calculation is primarily independent of the inputs' uncertainties, although local SAs can be affected by the reference point, and global SAs can be affected by the range over which the sensitivity is calculated. Overall, however, both methods share the goal of identifying inputs with a high influence on model outputs, with the underlying idea that better constraining these will increase robustness and reliability of model projections (Balaman, 2019).
Although the benefits for understanding model behavior and predictive uncertainties are obvious, relatively few SAs and UAs have been applied to complex ecosystem models and especially the widely used dynamic global vegetation models (DGVMs) that project terrestrial ecosystem responses to climate change or land management (see, e.g., Courbaud et al., 2015; Cui et al., 2019; Huber et al., 2018; Reyer et al., 2016; Tian et al., 2014; Wang et al., 2013). A reason for this is arguably the complex structure of most DGVMs (Fer et al., 2018), which makes SAs and UAs computationally demanding and difficult to interpret, especially when performing state-of-the-art global SAs and UAs that compute sensitivities and uncertainties across the entire parameter space (Saltelli et al., 2008) rather than just locally around a reference parameter set (see, e.g., Hamby, 1994). Moreover, several studies highlight that sensitivities and uncertainties of DGVMs also exist with respect to environmental drivers (Barman et al., 2014; Wu et al., 2017, 2018), especially solar radiation (Barman et al., 2014; Wu et al., 2018), temperature (Barman et al., 2014), and precipitation (Wu et al., 2017), and it is reasonable to expect that there can be interactions between parameter and environmental sensitivities, meaning that certain parameters are more sensitive in some environments than in others. It therefore seems important to investigate parametric sensitivities in conjunction with their environmental sensitivities in one combined analysis.
In this study, we concentrate on a well-established and widely applied DGVM, the Lund–Potsdam–Jena General Ecosystem Simulator (LPJ-GUESS) (Gerten et al., 2004; Sitch et al., 2003; Smith et al., 2001). Three previous SAs or UAs for the LPJ family identified the intrinsic quantum efficiency of CO2 uptake (alpha_C3) and the photosynthesis scaling parameter (from leaf to canopy) (alpha_a) as the main contributors of sensitivity for net primary production (NPP) (about 50 %–60 % of the overall sensitivity, Zaehle et al., 2005; Pappas et al., 2013) or foliage projective cover (Jiang et al., 2012). Additionally, these previous studies show that LPJ-GUESS projections of NPP and vegetation carbon pools showed high sensitivity to tree-structure-related (sapwood to heartwood turnover rate, longevity of trees; Pappas et al., 2013; Wramneby et al., 2008; Zaehle et al., 2005), establishment-related (maximum sapling establishment rate, minimum forest floor photosynthetically active radiation for tree establishment; Jiang et al., 2012; Wramneby et al., 2008; Zaehle et al., 2005), mortality-related (threshold for growth suppression mortality; Pappas et al., 2013) and water-related parameters (minimum canopy conductance not associated with photosynthesis, maximum daily transpiration; Pappas et al., 2013; Zaehle et al., 2005). Regarding uncertainties, strong impacts on LPJ-GUESS projections of NPP and vegetation carbon pools (FPC in Jiang et al., 2012) were found for photosynthesis-related parameters (Jiang et al., 2012; Zaehle et al., 2005) but also for water-related (minimum canopy conductance not associated with photosynthesis; Zaehle et al., 2005) and structure-related parameters (tree leaf to sapwood area ratio, crown area to height function Jiang et al., 2012), whereas soil hydrology parameters were not identified as very sensitive in earlier studies (Pappas et al., 2013).
Since the publication of these studies, however, the structure of the LPJ-GUESS model changed substantially. The most important changes are the inclusion of the nitrogen cycle (Smith et al., 2014) and new management modules (Lindeskog et al., 2021). Since these changes, no study has systematically examined how model sensitivities and uncertainties were affected by the new model structure. Moreover, previous SAs and UAs ignored management parameters, which are expected to have large impacts on carbon pools and fluxes (Lindeskog et al., 2021).
A further limitation of most previous studies for LPJ-GUESS and other models (e.g., Mäkelä et al., 2020) is that they either analyzed sensitivities and uncertainties to parameter changes or changes in the environmental drivers (but not both). As discussed earlier, however, there are good reasons to expect that the sensitivity of parameters will change if environmental drivers change. Given that previous sensitivity analyses used different choices for these boundary conditions (different sensitivities for the climate scenarios and sites in Jiang et al., 2012; for different elevations in Pappas et al., 2013; different sites in Wramneby et al., 2008), this not only limits the comparability between studies but also questions the generality of the results for all climatic conditions. Only Jiang et al. (2012) combined parameter and driver sensitivities but used for the latter only a number of fixed climate scenarios instead of a range of possible values, which prohibits a systematic joint analysis. Moreover, it would be interesting to compare the relative importance of drivers and parameters for the predictive uncertainty of model simulations and how these change between environmental zones (here we use the classification of Metzger et al., 2005) and thus on an environmental gradient. When sensitivities or uncertainties of parameters belonging to a specific process increase on an environmental gradient, this indicates that the process itself becomes more important on the gradient (Saltelli, 2002). By comparing such changes to existing ecological hypotheses, we can test if model sensitivities and thus process descriptions are in line with ecological expectations.
To answer these questions, we analyzed sensitivities and uncertainties in LPJ-GUESS for 200 randomly distributed sites across Europe (see Appendix A1.1). We address the issue of interactions between environmental and parametric sensitivities by simultaneously investigating uncertainty in environmental drivers (precipitation, temperature, solar radiation, CO2, and nitrogen deposition) with parametric uncertainty in the most important processes (photosynthesis, establishment, nitrogen, water cycle, mortality, disturbance and management, and growth) for dynamic climate change from 2001–2100 and steady climate from 2100–2200. We simulated the most abundant tree species in Europe (Fagus sylvatica Pinus sylvestris, and Picea abies) individually and in mixed stands, as these species are suffering from climate change (e.g., Buras et al., 2018; Walentowski et al., 2017) and could benefit from mixed stands (e.g., Pretzsch et al., 2015). To test climate change impacts, we randomly sampled climate projections within the boundaries of RCP2.6 and RCP8.5. Thereby, our key objectives were to understand the sensitivities and uncertainties of LPJ-GUESS due to environmental drivers and parameters. We were especially interested in (1) overall sensitivities and uncertainties across European forests, (2) uncertainties per environmental zone, and (3) uncertainties on a temperature gradient. Moreover, we investigated (4) if and how environmental conditions change the uncertainties of environmental processes.
2.1 The LPJ-GUESS vegetation model
LPJ-GUESS is a process-based ecosystem model that simulates vegetation growth, vegetation dynamics, biogeography, and biogeochemical (e.g., nitrogen and carbon) and water cycles (Lindeskog et al., 2013; Olin et al., 2015; Smith et al., 2014). Ecosystem dynamic processes in the model include establishment; growth; mortality; and competition for light, space, and soil resources. To simulate these processes, the model combines time steps on different scales from daily (e.g., phenological and photosynthesis processes) to yearly (e.g., allocation of net primary production to tree carbon components). LPJ-GUESS includes forest gap dynamics succession of cohorts (each represented by an average individual) of different plant functional types (PFTs) or species. Each PFT and species has a unique parameter set.
In this study, we use a model version that was slightly modified from Lindeskog et al. (2021), which is based on the LPJ-GUESS 4.0 version, with a re-parameterization for spruce (Picea abies), pine (Pinus sylvestris), and beech (Fagus sylvatica) (see Appendix A1.2 for Pin. syl. and Pic. abi.). To account for the stochastic components of establishment, mortality, and patch-destroying disturbances, LPJ-GUESS simulates several replicate patches (25 for the simulation with the reference parametrization and 1 for each simulation in the SA and UA) representing “snapshots” of the grid cell. In this model version, fire is based on the BLAZE model (Rabin et al., 2017). Thus, annually burned area is generated based on fire weather and fuel continuity and distributed to monthly intervals based on climatology (Giglio et al., 2010). Tree mortality is then estimated by computing fire lines based on weather and is converted into height-dependent survival probabilities (see Haverd et al., 2014) depending on empirical biome-specific parameters.
A first set of key parameters from our expert elicitation (see below) for establishment are the bioclimatic limits (i.e., minimum growing degree days (gdd5min_est), minimum 20-year coldest month (tcmin_est), maximum 20-year coldest month (tcmax_est), and minimum forest photoactive radiation at forest floor (parff_min)), which build the environmental envelope for establishment. Given that the bioclimatic limits are fulfilled, at regular intervals new PFTs are established (here 1 year) given enough space, light, soil, water, and photoactive radiation are all available for establishment at the forest floor (Smith et al., 2001). Moreover, each of our three investigated species has a maximum establishment rate (est_max) (Smith et al., 2001).
The structure of trees in the model is mainly linked to the simulated growth of trees, which is triggered by allocating all net primary production (NPP) besides a reproduction debt of 10 % (reprfrac) to tree components, thereby satisfying the mechanical balance, e.g., the allometric equation for the relationship between height and diameter with allometric parameters (k_allom2, k_allom3; e.g., Huang et al., 1992), the relationship between tree leaf to sapwood area (k_latosa; e.g., Robichaud and Methven, 1992), the relationship between crown area and height (k_rp or packing constraint; Zeide, 1993), the maximum crown area (crownarea_max), and leaf longevity (leaflong), and functional balance, as well as demographic constraints (Sitch et al., 2003). Each living tissue is assigned a turnover rate transferring sapwood into heartwood (turnover_sap) and leaves (turnover_leaf) and fine roots (turnover_root) to litter. Investment into aboveground and belowground growth is influenced by the resource stress as individuals are competing for light, space, nitrogen, and water. Competition for light is determined by the photosynthetic response and light extinction in the canopy. Competition for space (self-thinning) is represented in the model via allometric equations between crown area and stem diameter (Sitch et al., 2003). Competition for nitrogen and water is determined by individual tree demand for nitrogen and water, soil availability of nitrogen and water, and the PFT-specific root profile. Competition between species will favor certain life history strategies in particular situations, for example shade-tolerant (e.g., Fagus sylvatica and Picea abies) or intermediate-shade-tolerant (e.g., Pinus sylvestris) growth responses and dynamically changing root-to-shoot ratios.
Tree mortality (natural or via harvest) in the model responds to growth efficiency (ratio of annual NPP to leaf area) being too low over a 5-year period, e.g., due to light competition, maximum longevity of a PFT, or changes in environmental conditions (e.g., tolerance to drought (drought_tolerance) changes water uptake) exceeding the species suitable range. Light competition is modeled using the foliage projective cover (FPC), defined as the area of ground with foliage directly above it using Beer's Law (Smith et al., 2011). The resulting shading mortality is distributed proportional to species' FPC growth in the respective year due to their biomass increase. Mortality is modeled inversely proportional to the growth efficiency (with a given species-specific threshold (greff_min), e.g., Waring, 1983). Moreover, negative NPP of a species kills all individuals of the respective cohort. Background mortality probability increases with tree age, reaching 1 at the maximum longevity (longevity). Mortality has also a stochastic component. Natural disturbances are implemented in the model as process-based wildfires (with a given fire resistance for each species (fireresist)) and as patch-destroying disturbances (e.g., windthrow and landslides) with the same yearly occurrence probability for all patches (inverse of distinterval). Additional mortality arises from forest management activities, determined by thinning intensity (percentage of all trees cut, thinning_intensity) and cutting intervals (cut_interval), which can be set for each species individually. For a more detailed description of the management module and the additional management parameters, see Lindeskog et al. (2021).
Nitrogen input is implemented in the model through nitrogen deposition (prescribed) and biological nitrogen fixation. The latter is simulated empirically as a linear function with intercept (nfix_a) and slope (nfix_b) of the 5-year-averaged actual evapotranspiration (Cleveland et al., 1999). The resulting amount of nitrogen accumulates in the ecosystem equally over the year and directly adds to the available mineral soil nitrogen pool. When nitrogen is in living tissue, a fraction (nrelocfrac) is re-translocated before leaf and root shedding.
Photosynthesis is modeled as a function of absorbed photosynthetically active radiation, temperature (optimum temperature range for photosynthesis determined by pstemp_low and pstemp_high, Larcher, 1983), intercellular CO2 (i.e., non-water stressed ratio of intercellular to ambient CO2 (lambda_max)), and canopy conductance, and thus it considers species-specific respiration coefficients (respcoeff) (Smith et al., 2001) and nitrogen availability. The photosynthesis scheme is a modified version of the Farquhar photosynthesis model, but instead of prescribed values for the RuBisCO capacity it is optimized for maximum net CO2 assimilation at the canopy level (Smith et al., 2014).
Water availability for plants is based on precipitation and snowmelt in the two-layer soil hydrology submodule (for details, see Hickler et al., 2004; Smith et al., 2001). Vegetation transpiration and evaporation (with a maximum evapotranspiration rate (emax)) from bare ground and leaves both reduce water availability and runoff from saturated soil (Sitch et al., 2003). Water vapor exchange by the vegetation canopy is calculated on a daily basis within the photosynthesis scheme (e.g., minimum canopy conductance not associated with photosynthesis (gmin)). The water supply and transpiration demand are calculated on a daily basis and converted into a drought stress coefficient. Given this coefficient, the investment in roots at the costs of leaves is calculated.
2.2 Simulation setup
We selected 200 study sites (see Appendix A1.1) spatially and environmentally stratified over Europe by applying random stratified sampling (using the R package splitstackshape, Mahto, 2019) with longitudinal and latitudinal coordinates and mean precipitation, solar radiation, and temperature as categories based on IPSL-CM5 Earth System Model CMIP5 (Dufresne et al., 2013) climate data. We chose 200 sites as a compromise between the high computational demand of running LPJ-GUESS multiple times for all sites and a good spatial and environmental coverage of Europe. For these sites, we performed simulations for each of the three most common species in Europe (Fagus sylvatica, Pinus sylvestris, and Picea abies) as monospecific stands and additionally all three species together as mixed stands.
The simulation period was from 1861 to 2199. To start the simulations with equilibrium carbon pools and fluxes, we spun up LPJ-GUESS vegetation and soil carbon and nitrogen pools to pre-industrial equilibrium by recycling the 1861 to 1900 climate, the 1861 CO2 concentration (Meinshausen et al., 2011), and nitrogen deposition. For the transient and future simulation runs, we used the bias-corrected monthly IPSL-CM5 Earth System Model CMIP5 (Dufresne et al., 2013). From this data set, we extracted temperature, precipitation, number of wet days per month, and incoming solar radiation from 1861 to 2099 for RCP4.5 as base scenario and RCP2.6 (RCP8.5) as lower (upper) boundaries for the climate ranges (see below). In addition to these data, monthly nitrogen deposition was extracted from Lamarque et al. (2013), and soil texture data was taken from Batjes (2005). All of these driving data have a spatial resolution of 0.5∘ × 0.5∘. We recycled detrended data from 2090–2099 for all environmental drivers except CO2 and nitrogen deposition and used these as potential stable climates for the 2100–2199 period.
2.3 Selection of parameters and drivers and their ranges
The a priori selection of the most influential parameters that can be specified in the parameter file and their ranges was based on our expert knowledge (following the SHELF expert elicitation protocol; see Gosling, 2018) and a literature review. The resulting 11 (33 %) parameters common for all species and 22 (20 %) species-specific parameters (see Table 1) were grouped to the specific processes they contribute most to (Table 1, Grouping).
Table 1The model inputs investigated in the sensitivity analysis can be grouped into (a) common parameters, (b) species-specific parameters, and (c) drivers. The ranges for the parameters have been determined from experts and literature, and default parameter values that changed from Hickler et al. (2012) due to the re-parameterization are explained in Appendix A1.2.

* denotes an averaging over sites.
From the environmental drivers of the model, we selected incoming solar radiation, temperature, precipitation, atmospheric CO2, and nitrogen deposition for our analysis. To obtain uncertainties for temperature, precipitation, and solar radiation, we calculated the mean deviations of RCP8.5 (RCP2.6) to our base scenario RCP4.5 plus (minus) 1 standard deviation as maximal (minimal) values per site. As the CO2 data are global and not site specific, we calculated ranges from the global data set (RCP2.6 as minimum, RCP8.5 as maximum) averaged over time and plus or minus a standard deviation. For nitrogen deposition, we used RCP6.0 as the maximum value and RCP2.6 as the minimum value with the same procedure as for the other drivers.
2.4 Sensitivity analysis and uncertainty analysis
LPJ-GUESS predicts a substantial number of output variables, which could all be examined regarding their sensitivities and uncertainties. Here, we concentrate on carbon outputs (gross primary production, GPP; total standing biomass, TSB; and net biome productivity, NBP) because of forests' role for carbon cycling (Bonan, 2008), their large contribution to the land carbon sink (Pugh et al., 2019), and the economic importance of tree growth for forest owners (Pearce, 2001).
Sensitivities and uncertainties were calculated by Monte Carlo sampling from the assumed multivariate parameter and climate uncertainty. For the monospecific and mixed simulations, we randomly drew 10 000 and 50 000 parameter and climate combinations, respectively, randomly from the prespecified uncertainty ranges and ran the model based on these combinations for each of the 200 sites. For the mixed simulations we individually drew parameter combinations for each species for each simulation, meaning that the same parameter could be different for different species. In total, this means that 16 million () LPJ-GUESS simulations were run.
We quantified sensitivity and uncertainty indices by running multiple linear regressions with the model output averaged over time as a response and parameters and drivers, as well as their second-order interactions, as predictors. With 200 sites, each having three monospecific and one mixed stand setup, we ran linear regressions overall. This analysis corresponds to a global SA and UA in the context of regression analysis and has been applied to other system models (e.g., Sobie, 2009). The estimated effects from the regression can be interpreted as sensitivities, as the effect of a unit change of the driver on the response (model output) is estimated. By scaling the predictors to the range [−0.5, 0.5], we obtained the corresponding uncertainties. To check whether we missed nonlinear effects, we additionally applied a random forest and extracted the variable importance (following Augustynczik et al., 2017; see Appendix A1.3). To calculate mean sensitivities and uncertainties for each species, we averaged site-specific sensitivities over all sites with an average annual biomass production greater than 2 tC ha−1. We have chosen this threshold because smaller values indicate that the environment is not suitable for the species; however, for each site at least one species was able to establish. For the mixed stands, we first averaged the three species-specific sensitivities and uncertainties per site and then averaged them over all sites. Mean percentual sensitivities were calculated by dividing by the mean model output, while mean uncertainty contributions were calculated by dividing by the entire uncertainty budget. Thereby, positive values mean that the respective output increases with increasing parameter values, while negative values mean that it decreases.
It is important to note that uncertainties and sensitivities have different interpretations, and which of these two is more relevant strongly depends on the purpose. The calculated percentual sensitivities can be interpreted as percentage change in the corresponding output when changing a parameter value 1 % in the prespecified range. The calculated uncertainties per parameter or driver can be interpreted as relative proportion of the overall uncertainty budget coming from environmental drivers and parameters. For scenario analysis, e.g., comparing different cut intervals of forests, sensitivities provide a direct estimate of the model response, e.g., how much biomass changes when the cut interval is changed. For a comparison of different model forecasts, uncertainties are usually more relevant. If a reduction of uncertainty via a model–data comparison is the purpose, both measures are important, as parameters with high sensitivities can contribute more or less predictive uncertainty depending on their input uncertainty.
3.1 Mean sensitivities over Europe
Regardless of the output variable, LPJ-GUESS was most sensitive to photosynthesis-related parameters (respcoeff, lambda_max), parameters controlling the wood turnover (turnover_sap) and tree allometry (k_rp), water-related parameters (emax), mortality-related parameters (greffmin), and environmental drivers (temperature, CO2 and solar radiation) (Fig. 1). When looking at differences in the strength of sensitivities for different outputs, TSB was most sensitive to the respiration coefficient (respcoeff), the growth suppression mortality threshold (greff_min), and solar radiation, while NBP projections showed negative sensitivity to wood turnover rates (turnover_sap) and longevity and positive sensitivity to temperature, CO2, and the ratio of intercellular to ambient CO2 (lambda_max). GPP was negatively sensitive to the respiration coefficient (respcoeff), growth suppression mortality threshold (greffmin), tree allometry (k_rp), and temperature and positive to CO2, solar radiation, and the maximum transpiration rate (emax). Establishment and nitrogen showed the smallest sensitivities for all three carbon-related projections (Fig. 1). Note that NBP also had higher percentual sensitivities than GPP and TSB.
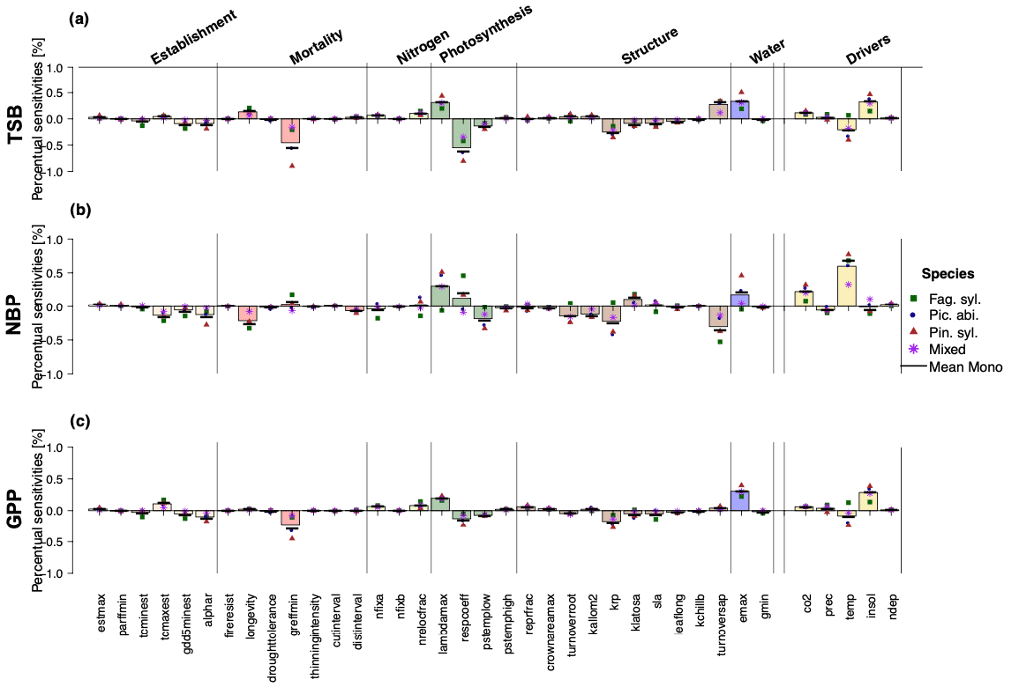
Figure 1Relative sensitivities (percent output change per percent parameter change) of the individual parameters and environmental drivers regarding (a) total standing biomass, (b) net biome productivity, and (c) gross primary production. Sensitivities were not substantially different between Fag. syl. (green squares), Pic. abi. (blue circles), and Pin. syl. (red triangles), but parameter sensitivities were stronger for monospecific stands than mixed stands (purple asterisks). The height of the bar reflects the mean over monospecific and mixed stands. Positive values for points and bars indicate a positive and negative values a negative relationship with the corresponding output.
Mixed stands were less sensitive to changes in parameters than monospecific stands (Fig. 1). For monospecific simulations, species sometimes showed different magnitudes and even directions of sensitivities. In comparison to the other species, Fag. syl. was more strongly affected by bioclimatic limits, while Pin. syl. showed higher sensitivity to environmental drivers (temperature and solar radiation). Moreover, TSB and GPP are negatively sensitive to temperature, except for Fag. syl. For NBP, the direction of sensitivities changes between species for the non-water-stressed ratio of intercellular to ambient CO2 (lambdamax), the respiration coefficient (respcoeff), the root turnover (turnoverroot), an allometric constant (krp), and the maximum evapotranspiration rate (emax).
3.2 Mean uncertainties over Europe
Looking at uncertainties, we found that environmental drivers contributed most of all processes and drivers to the predictive uncertainty (Fig. 2), regardless of the considered model output. For TSB projections, CO2, solar radiation, and temperature contributed substantial uncertainty (Fig. 2a). Additionally, large uncertainty contributions arose from growth-suppression mortality thresholds (greffmin) and the respiration coefficient (lambda_max). Uncertainty in NBP projections was substantially affected by model parameters (longevity (mortality process), tcmax_est (establishment process), turnover_sap (tree structure process), greffmin (mortality process), emax (water process), and the high contributions of temperature and CO2 (Fig. 2b). For GPP projections, solar radiation and CO2 contributed the most to climate-induced uncertainty, while the threshold for growth suppression mortality (greffmin) and maximum evaporation rate (emax) contributed the most to parameter-induced uncertainty (Fig. 2c). Notably, nitrogen-fixation-induced uncertainty was also substantial (7 %–9 %) for TSB and GPP. Most tree-structure-related parameters except the sapwood to heartwood turnover rate (turnoversap) and the fraction of NPP allocated to reproduction (repfrac) contributed only small uncertainties (Fig. 2). Uncertainty contributions analyzed by a random forest are similar to linear regression results (see Appendix 1.3).
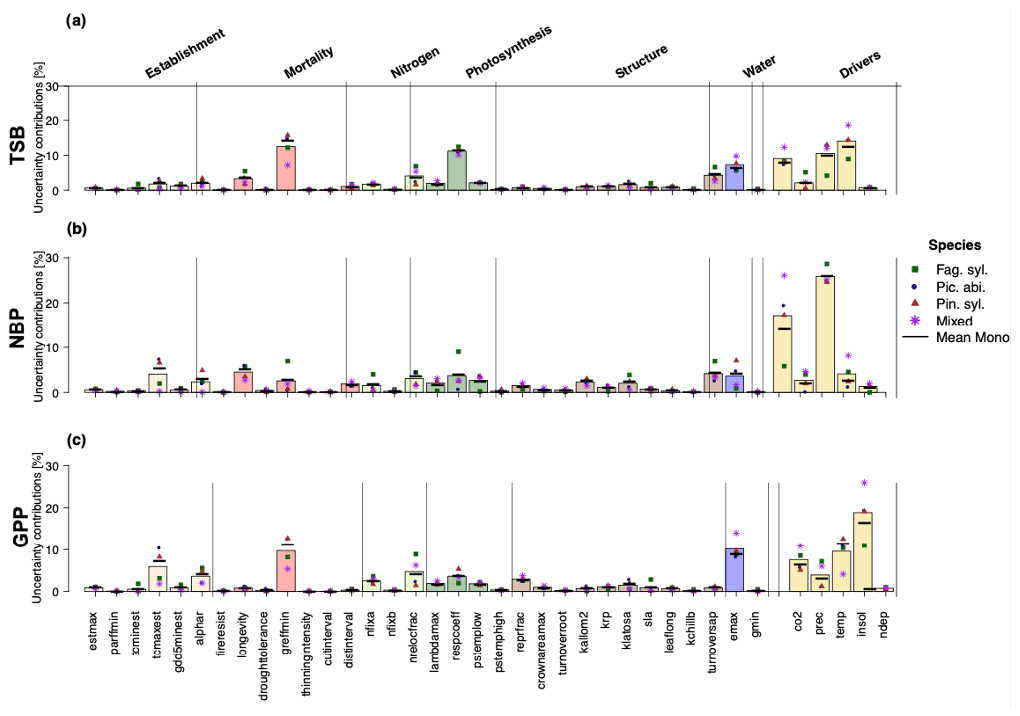
Figure 2Uncertainty contributions in percent of the individual parameters and environmental drivers regarding (a) total standing biomass, (b) net biome productivity, and (c) gross primary production showed no strong differences between Fag. syl. (green squares), Pic. abi. (blue circles), and Pin. syl. (red triangles) and were stronger for monospecific stands than mixed stands (purple asterisks). The height of the bars reflects the mean over monospecific and mixed stands. Positive values for points and bars indicate a positive and negative values a negative relationship with the corresponding output.
By analyzing uncertainty contributions on a species level, a more diverse picture emerged. Fag. syl. was more affected by temperature and less affected by solar radiation than the other species. Additionally, we found that uncertainty contributions of environmental drivers were substantially higher for mixed stands than for monospecific stands.
3.3 Geographic variation in uncertainties of TSB across Europe
To project the uncertainties of TSB (for GPP and NBP, see Appendix 1.4) into the European environmental space, we filtered stands according to environmental zones and then calculated mean uncertainties per environmental zone and aggregated these per process.
The broad pattern of TSB uncertainty contributions for all three monospecific and mixed stands remains similar in all environmental zones. On average across all environmental zones, stands and species about 45 % of the uncertainty was due to environmental drivers, 15 % was due to mortality-related parameters, 14 % was due to photosynthesis-related parameters, 12 % was due to structure-related parameters, 7 % was due to water-related parameters, and 7 % was due to nitrogen-related parameters (Fig. 3).
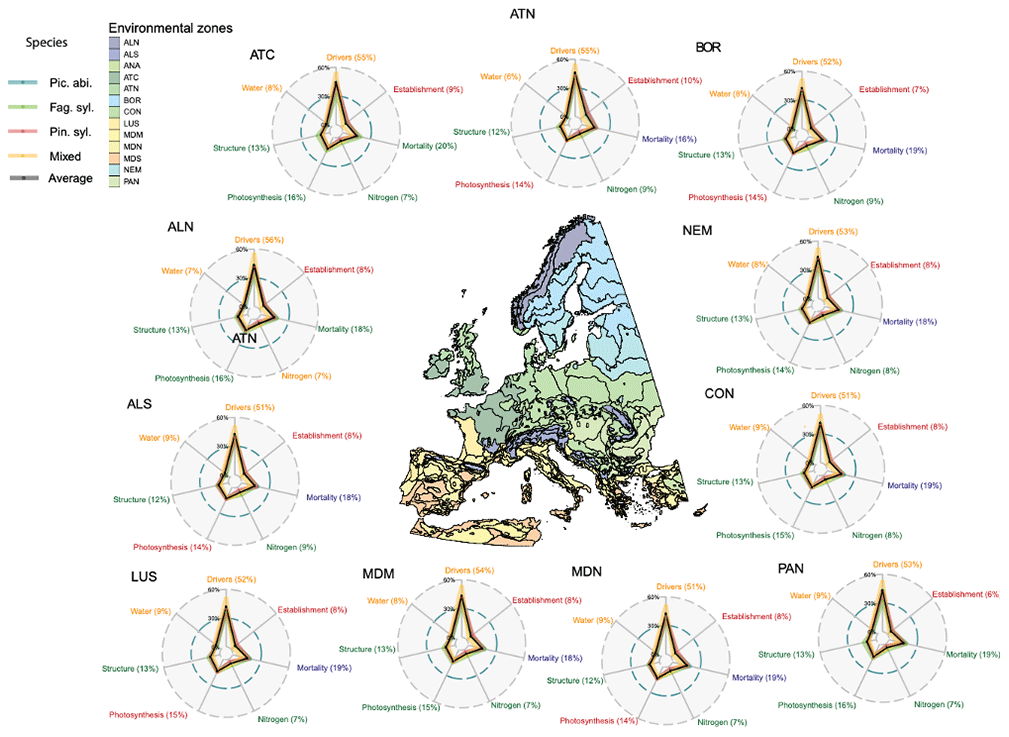
Figure 3The aggregated relative uncertainties of total standing biomass per environmental zone (with more than five sites) show a higher importance of drivers in the south than in the north. The environmental zones are from Metzger et al. (2005) and are defined as follows: ALN, Alpine north; ALS, Alpine south; ANA, Anatolian; ATC, Atlantic central; ATN, Atlantic north; BOR, Boreal; CON, Continental; LUS, Lusitanian; MDM, Mediterranean mountains; MDN, Mediterranean north; MDS, Mediterranean south; NEM, Nemoral; and PAN, Pannonian. In the radar plots of each environmental zone, the color and percentage value of the process label indicates which simulation setup (monospecific with corresponding species or mixed stands) has contributed most uncertainty and how much.
For the individual environmental zones, however, there were subtle differences. In the Mediterranean mountain (MDN) and Pannonian (PAN) zones, environmental-driver-induced uncertainty was higher than on average, especially for monospecific stands (Fig. 3). In the Boreal (BOR), Atlantic central (ATC), and Atlantic north (ATN) zones, tree-structure-related uncertainty increased compared to the average pattern (Fig. 3). In the Atlantic central (ATC) and Atlantic north (ATN) zones, nitrogen-related uncertainty increased for all species and stands (Fig. 3).
To examine this spatial pattern further, we investigated the change of uncertainties across a temperature gradient. To this end, we aggregated the uncertainties per site and process or driver and then fitted a linear regression with the process or driver as a predictor and the aggregated uncertainties as dependent variables.
For TSB, we found that increasing mean annual temperature increased the uncertainty contributions of environmental drivers and water and establishment parameters, while the uncertainty due to nitrogen-related and tree-structure-related parameters decreased (Fig. 4a). Thereby, the uncertainty contributions of environmental drivers (≈0.4 % ∘C−1) increased the most (measured in percentage points per ∘C) and uncertainty contributions of nitrogen fixation decreased most ( % ∘C−1). Mortality and photosynthesis stayed approximately constant on the gradient (Fig. 4b).

Figure 4The uncertainty contributions to total standing biomass projections of parameters and environmental drivers change across a mean annual temperature gradient across Europe from north to south (with p values and R2 for the processes and drivers). With increasing temperature, the importance of drivers and establishment became higher for total standing biomass, while the uncertainty contributions from nitrogen and structure declined (a). The uncertainty contributions due to temperature increased on the temperature gradient, and the contributions from solar radiation decreased (c).
Looking in more detail at the environmental drivers, uncertainty induced by temperature ( % ∘C−1), CO2 ( % ∘C−1), and precipitation ( % ∘C−1) increased with mean annual temperature, while the uncertainty contribution of solar radiation ( % ∘C−1) decreased with mean annual temperature (Fig. 4c). Nitrogen-deposition-induced uncertainty contributions stayed approximately constant on a mean annual temperature gradient.
The above geographical and correlative observations of changing uncertainties across Europe receive further support when looking at the interactions between uncertainties of different drivers and parameters (Fig. 5). Interaction indices were calculated by averaging the interactions found in the linear regression over all sites and species (Fig. 5b). Moreover, to investigate the overall influence on other parameters or drivers we summed the absolute individual interaction indices of each parameter together (Fig. 5a).
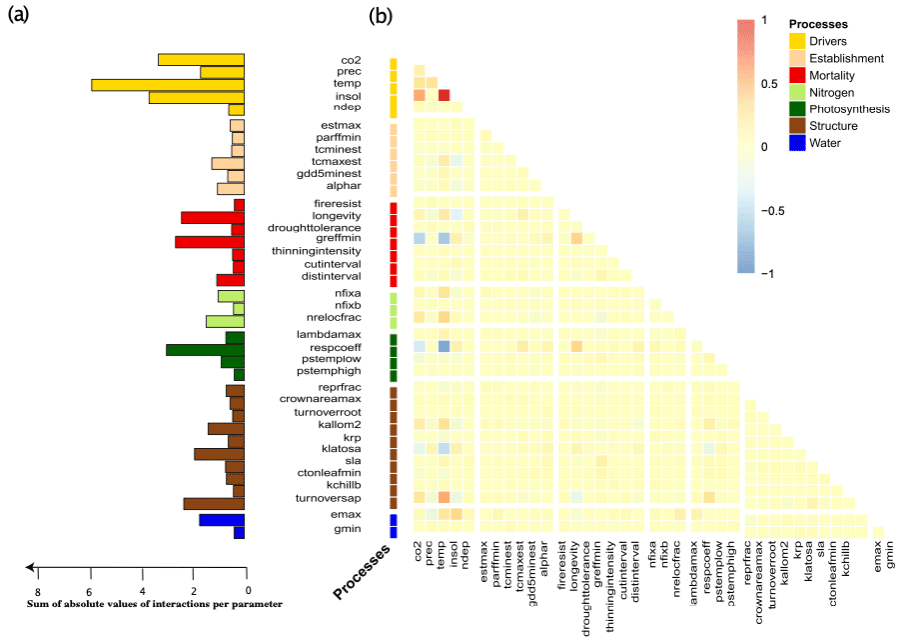
Figure 5The induced uncertainty of environmental drivers and mortality- and photosynthesis-related parameters changed the most depending on other parameters (a). Strong individual interactions between parameters and environmental drivers in monospecific projections of total standing biomass were rare (b). If strong interactions occurred, these were mainly between two environmental drivers or environmental drivers and parameters and only rarely between two parameters (b).
We found that environmental drivers (temperature, solar radiation, CO2 and precipitation) had the highest sum of interactions for TSB (Fig. 5a). Moreover, the respiration coefficient (respcoeff), growth suppression mortality threshold (greffmin), longevity, sapwood to heartwood turnover rate (turnover_sap), and maximum evaporation rate (emax) had a lower but still high sum of interactions (Fig. 5a). Establishment and nitrogen-related parameters had only a few weak interactions (Fig. 5). Strong interaction effects occurred mostly with environmental drivers (Fig. 5b). A main part of these interactions was between the different environmental drivers themselves, i.e., solar radiation–CO2 and solar radiation–temperature. Additionally, we found interactions of parameters and environmental drivers, i.e., temperature–sapwood to hardwood turnover (turnover_sap), temperature–threshold for growth suppression mortality (greffmin), and temperature–respiration coefficient (respcoeff) (Fig. 5b), and moderate parameter–parameter interactions, i.e., longevity (mortality process) and greffmin (mortality process), respcoeff (water process) and longevity (mortality process) (Fig. 5b)). Similar patterns were present for the other two carbon outputs (see Appendix A1.4).
In this study, we analyzed sensitivities and uncertainties of the LPJ-GUESS vegetation model due to environmental driver and parameter variations across European forests. We found that the model is most sensitive to relative (percentage) changes in photosynthesis-related parameters, structure-related parameters controlling the wood turnover and tree allometry, water-related parameters, mortality-related parameters, and environmental drivers (Fig. 1), irrespective of the considered output variable. When considering the different uncertainties (i.e., the entire plausible range) in these parameters and the environmental inputs, we found that environmental drivers and parameters controlling evapotranspiration, background mortality, and nitrogen cycling contribute most to predictive uncertainty (Fig. 2). When correlated against a temperature gradient and thus geographically from north to south, uncertainty contributions to TSB increased for environmental drivers and decreased for tree-structure- and nitrogen-related parameters (Figs. 3, 4). Interactions between the uncertainty contributions were mainly between different drivers or between model parameters and drivers, whereas only a few parameter–parameter interactions were present (Fig. 5).
Our finding that average sensitivities of carbon-related projections across European forests were highest for photosynthesis-related parameters amplifies the evidence from earlier studies (Pappas et al., 2013; Zaehle et al., 2005), although we have used different parameter ranges. In addition, the finding about high sensitivity of LPJ-GUESS to parameters controlling tree structure and especially carbon turnover (turnover_sap) (Fig. 1) is in line with results reported for a previous version of LPJ-GUESS (Pappas et al., 2013) and its important role for carbon allocation in trees found in empirical studies (e.g., Herrero de Aza et al., 2011). The finding that carbon-related projections are very sensitive to mortality-related parameters (greffmin) is also supported by previous studies on the sensitivity of vegetation models and underlines the importance of improving mortality submodules for generating precise projections of vegetation dynamics (Bugmann et al., 2019; Hardiman et al., 2011). Moreover, sensitivities in mixed stands were lower than in monospecific stands for NBP and GPP (Fig. 1) (in line with Wramneby et al., 2008). The reason for that imbalance may be that other species can dampen and even benefit from non-optimal life history strategies of an individual species (Loehle, 2000). Another reason might be that we sampled parameters for each species individually for mixed simulations, which reduces the influence of each parameter on stand-level carbon projections.
We found that uncertainty contributions of environmental drivers were comparable to the uncertainty contributions of all parameters together (Figs. 2–5; see also Snell et al., 2018, for the FLMs model; in addition, see Petter et al., 2020, who found that most uncertainty is induced by the choice of the forest model). Particularly high uncertainty contributions arose from temperature (negative effect for TSB, GPP positive for NBP), CO2 (positive effect for all variables) and solar radiation (positive effect for all variables). These results are supported by the earlier studies on the effect of environmental drivers in DGVMs (Barman et al., 2014; Wu et al., 2017, 2018). The positive effect of CO2 could be explained by increased water-use efficiency and the CO2 fertilization effect (also found for other DGVMs Keenan et al., 2011; Galbraith et al., 2010), which in LPJ-GUESS is an emerging property of the formulation of photosynthesis and respiration (see Hickler et al., 2008). However, empirical studies do not find such an effect (Körner, 2006), which could be linked to the fact that LPJ-GUESS does not model phosphor cycling, which could be the limiting nutrient (for a DVGM study, see Fleischer et al., 2019). We speculate that the negative effect of temperature (also found for multiple DGVMs; see Galbraith et al., 2010) arises from decreased photosynthetic efficiency and increased respiration rates with higher temperatures (see the empirical study of Gustafson et al., 2018, here confirmed by the negative relationship between temperature and the respiration coefficient). This effect, however, differed in magnitude and direction between tree species (Fig. 2), while there was a strong effect for Pic. abi. and Pin. syl., Fag. syl. was less affected, which could be a sign of its higher resistance to increasing drought (Buras and Menzel, 2019; Tegel et al., 2014; Charru et al., 2010). From the parameters, water-, nitrogen- and mortality-related parameters in particular contributed a substantial amount of uncertainty. The uncertainty contributions from mortality parameters (see Bugmann et al., 2019, for a variety of DGVMs) and water (Pappas et al., 2013, with different parameter ranges for LPJ-GUESS) were already highlighted by earlier studies.
4.1 Geographical and environmental patterns in sensitivities and uncertainties
Several of our results suggest that environmental context influences the sensitivity of LPJ-GUESS model parameters. First, we found changing uncertainties across different vegetation zones (Fig. 3) and on an environmental gradient (Fig. 4) and that most interactions occurred with environmental drivers (Fig. 5). Moreover, uncertainty contributions analyzed by a random forest were similar to the linear regression results but assign higher importance to environmental drivers (see Appendix A1.3). All of these findings indicate that environmental context can change the importance of different processes in the model, which is in line with the biological expectation that the environment affects the physiology of organisms directly, and thus indirectly affects fitness and biotic interactions (e.g., Seebacher and Franklin, 2012; Tylianakis et al., 2008), and the expectation that environmental responses can be particularly nonlinear (e.g., Burkett et al., 2005) or show higher-order interactions.
Interestingly, our results of decreased uncertainty contributions of structure-related parameters and increased contributions of environmental drivers on the temperature gradient (Fig. 4) also seem in line with the stress-gradient hypothesis (Maestre et al., 2009), an empirically observed pattern that states that in stressful environments, positive interactions should occur more often than in benign environments (e.g., Callaway, 2007). For the ecosystem that we consider, we interpret increasing temperature as increasing stress (e.g., Ruiz-Pérez and Vico, 2020) and structure as the best indicator for competitive interactions as the structure dictates resource allocation (e.g., bigger crown but identical stem diameter leads to more photosynthesis, or more sapwood to heartwood turnover requires less NPP). With this interpretation, one would conclude that under increasing stress the importance of competition-related parameters decreases in the model, as expected from the stress-gradient hypothesis. We acknowledge that a fair amount of interpretation is needed to arrive at this conclusion, and we do not claim that this result lends evidence to the empirical discussion about the generality of the stress-gradient hypothesis, but we find it noteworthy that such a large-scale pattern emerges in the model from lower-level processes without having been imposed (see also Levin, 1992).
4.2 Associated uncertainties of previous changes in model structure and implications for future model development
The management and the nitrogen cycling module are the most recent improvements of the LPJ-GUESS model (Smith et al., 2014; Lindeskog et al., 2021). Compared to previous sensitivity and uncertainty analysis, the high contributions of the nitrogen fixation to the predictive uncertainty of TSB and GPP (Fig. 2a, c) are novel (albeit not surprising), as nitrogen is an important factor for the productivity of most temperate and boreal ecosystems (Vitousek and Howarth, 1991). The main reason why few earlier studies report those uncertainties is that vegetation models have only recently begun to integrate nitrogen cycling and limitation (e.g., Smith et al., 2014). The management module showed only small uncertainties, which could be due to the narrow parameter ranges for the cut interval and thinning intensity reflecting typical forest owners' choices. As forest owners usually try to maximize their profits (Johansson, 1986; Brazee and Amacher, 2000) and thus biomass production, the low sensitivity of the management module is not surprising. A more suitable and important test case and application of the management module would be a historical reconstruction of foliage projective cover data or similar outputs of the LPJ-GUESS model.
Our study helps to guide the model application, discussion of uncertainties, and model development of LPJ-GUESS and other DGVMs. First, future model applications and model comparisons should focus on mortality as this process contributes high uncertainties for carbon-related projections (see Figs. 1–3; see also Fisher et al., 2018). Thereby, it should be investigated if these uncertainties stem from the intra-specific variability of the parameters itself (Bolnick et al., 2011) or the parameters not being identifiable (see Marsili-Libelli et al., 2014) or if a model–data comparison could reduce uncertainties in the parameters (e.g., Hartig et al., 2011; Dietze, 2017b). Using time series inventory data might help as they are informative for constraining mortality modules (Cailleret et al., 2020). Second, lower sensitivities of establishment-related parameters are surprising as we know that not all three investigated species can effortlessly establish across all of Europe, e.g., Fag. syl. can only establish in locations with no extreme drought and heat and no extreme winter frosts (Bolte et al., 2007). Thus, either we missed important parameters of this module or the parametrization of the model needs to be updated. Third, when introducing new processes or coupling with other models (e.g., Forrest et al., 2020) calculating interactions helps to get a first impression as to how these new processes influence other model processes and to potentially detect missing links. Moreover, future model applications can interpret their results with regard to the sensitivities in different factors (Saltelli et al., 2019) and discuss uncertainties and the causing factors when used in policy advice (Laberge, 2013).
4.3 Limitations
We caution that our results regarding the importance of different factors for predictive uncertainties (but not sensitivities) depend on the a priori-defined uncertainty range of the contributing factors (see Wallach and Genard, 1998), as well as on several other technical choices in our study. For determining uncertainty ranges of the drivers, we used RCP scenarios; however, these were not created as probabilistic minimum and maximum ranges. For the model parameters, we relied on expert guesses, reducing subjectivity as far as possible by following the SHELF expert elicitation protocol (Gosling, 2018). Future studies could include more experts and their opinion on parameter distributions to reduce variability in this protocol. As the model is sensitive to parameters and environmental drivers and these elements influence each other, we treated them in a combined sensitivity and uncertainty analysis (Saltelli et al., 2019); however, when interpreting it should be kept in mind that the one group relates to uncertainties in the model, while the other is external, meaning that the two are conceptually very different (see also Dietze, 2017b). A certain ambiguity also arises from the definition of the indicators: here, we calculated sensitivities and uncertainties by capturing only linear components and second-order interactions, and we may therefore miss highly nonlinear (and in particular hump-shaped) responses in LPJ-GUESS (Roux et al., 2021). However, our comparison to uncertainties calculated with random forest variable importance, a method that would also capture nonlinearities, did not reveal any qualitative differences in the ranking of parameter importance (Appendix A1.3). Overall, while we acknowledge that a certain amount of subjectivity exists in the choice of input uncertainty and calculation of indices, we believe that our results are quantitatively robust to those choices.
Moreover, we acknowledge that LPJ-GUESS is known to be sensitive to the scaling parameters alpha_a and alpha_C3 (Pappas et al., 2013; Zaehle et al., 2005), which we have omitted from our analysis. However, these parameters are not accessible in the parameter input file. Instead, they are hard coded in the model's source code, and therefore a normal user would not change them. We argue that these parameters should thus be counted towards the more general and here neglected contribution of structural uncertainty (i.e., the uncertainty regarding the functional form of processes or even to entire modules) to the joint model uncertainty. Several previous studies suggest that the sensitivity of vegetation models to structural changes can be large and often larger than that to parameters (e.g., Bugmann et al., 2019), and it would certainly be useful (although very complicated) to explore these uncertainties together with the factors considered here in a joint analysis. In the present study, however, we considered only the parameters that would be accessible to normal LPJ-GUESS users and neglect structural uncertainty that could be explored by changing the source code.
Our findings highlight the relative importance of parametric uncertainties in different processes and their interactions with uncertainties in environmental drivers for carbon projections with LPJ-GUESS. Our results demonstrate that environmental context changes uncertainty contributions of other processes across the European environmental gradient. The pattern of decreasing importance of competition towards the warmer areas is in line with the stress-gradient hypothesis, which posits that the importance of competition decreases with increasing environmental stress. Our findings improve our understanding of forest ecosystem models, enable pathways for future ecosystem model development, and thus build a basis for more realistic projections. In the future, parametric uncertainties could be reduced by model–data fusion (e.g., Trotsiuk et al., 2020) of LPJ-GUESS, concentrating on the parameters contributing most uncertainty in each geographic region (Fig. 3). Reducing uncertainties in the drivers is more difficult. To some extent, environmental drivers are themselves influenced by the vegetation (Strengers et al., 2010), and thus model–data fusion on a fully coupled model including feedback loops between vegetation and climate and a general improvement of climate models could reduce driver uncertainty to some degree. However, much of the uncertainty in this section effectively arises from potential greenhouse gas emission trajectories, for which a probabilistic assignment is difficult due to their dependency on human decision-making.
A1 Site selection
We sampled 200 geographically and environmentally stratified sites over Europe and thereby avoided sites near the sea. The corresponding sites with their average temperatures are shown in Fig. A1 and cover most European climates and vegetation zones.
Table A1Differences in parametrization of Hickler et al. (2012) and our study for the investigated species (Fag. syl., Pic. abi. and Pin. syl).


Figure A1Our 200 sampled sites, which were geographically and environmentally stratified over Europe to cover the most important countries and climate and temperature zones.
A2 Re-parametrization for better fit to observed data
There are several technical and methodological reasons requiring a re-parametrization of LPJ-GUESS for our study. First, most European forests are managed and species are planted far outside of their natural distribution. Second, the introduction of the nitrogen cycle (Smith et al., 2014) changed the model structure, and thus the parameters require an adjustment. Third, the productivity of trees in managed forests did not fit to the reported inventory data (Fig. A2). To account for all these issues, we adjusted the parametrization of (Hickler et al., 2012) to allow species growing according to their actual (i.e., caused by forest management) distribution instead of their natural distribution.
Picea abies and Pinus sylvestris are planted especially far outside their natural distribution (Fig. A2). Therefore, we specifically adjusted bioclimatic limits, drought tolerances, longevity, leaf turnover, disturbance intervals, and allometry for these species.
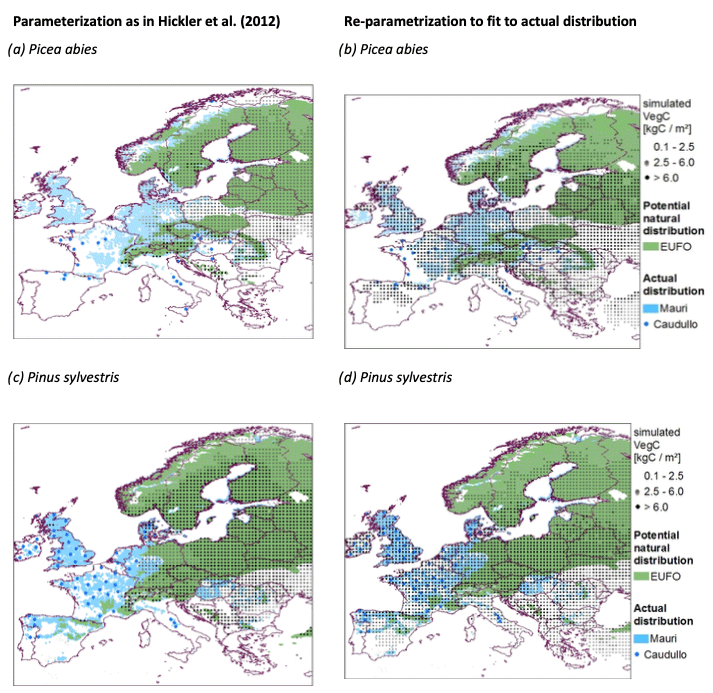
Figure A2Simulated (black points), observed (blue), and natural distributions (green) of the adjusted parametrization (b, d) compared to applying the parametrization from Hickler et al. (2012) (a, c) for Picea abies and Pinus sylvestris. EUFO indicates data from EUFROGEN (2008 and 2013), Mauri indicates data from Mauri et al. (2017), and Caudullo indicates data from Caudullo (2017). The simulations were run from 1600 to 2010 without management and without competition between species. The plotted biomasses were averages over the last 20 years.
A3 Random forest results
To check the consistency of the results obtained via linear regressions, we compare them to the variable importance of random forest. The variable importance measures additionally nonlinear effects, and thus it should be able to deal with nonlinear models like DGVMs. We calculated the variable importance the same way as we did for the linear regression by fitting a random forest with all parameters against the sum of differences between model outputs with default values and model outputs with sampled parameters. As our parameters were sampled from a uniform distribution with no correlation between the individual parameters, random forest variable importance can be compared to linear regression results.
The ranking is very similar to the ranking of the parameters and environmental drivers obtained via linear regression (Fig. A3). There is, however, a difference in the magnitude of the uncertainty induced by drivers, which is higher compared to linear regression (Fig. A3). The higher uncertainty due to drivers is thus a nonlinear effect and stresses our conclusion that environmental conditions change the uncertainty contributions of other parameters.

Figure A3Results of the random forest uncertainty contributions. The uncertainties due to environmental drivers are higher than the uncertainties due to parameters compared to linear regression results, but the ranking of parameters is similar to linear regression results.
A4 Interactions of GPP and NBP
Interactions of gross primary production (Fig. A4a, b) and net biome production (Fig. A4c, d) are similar to the interactions of total standing biomass. These interactions are mostly between environmental drivers and environmental drivers or between environmental drivers and parameters (Fig. A4). Some strong interactions are between parameters and parameters, however, in such interactions there are always parameters included that have strong interactions with environmental drivers (Fig. A4).
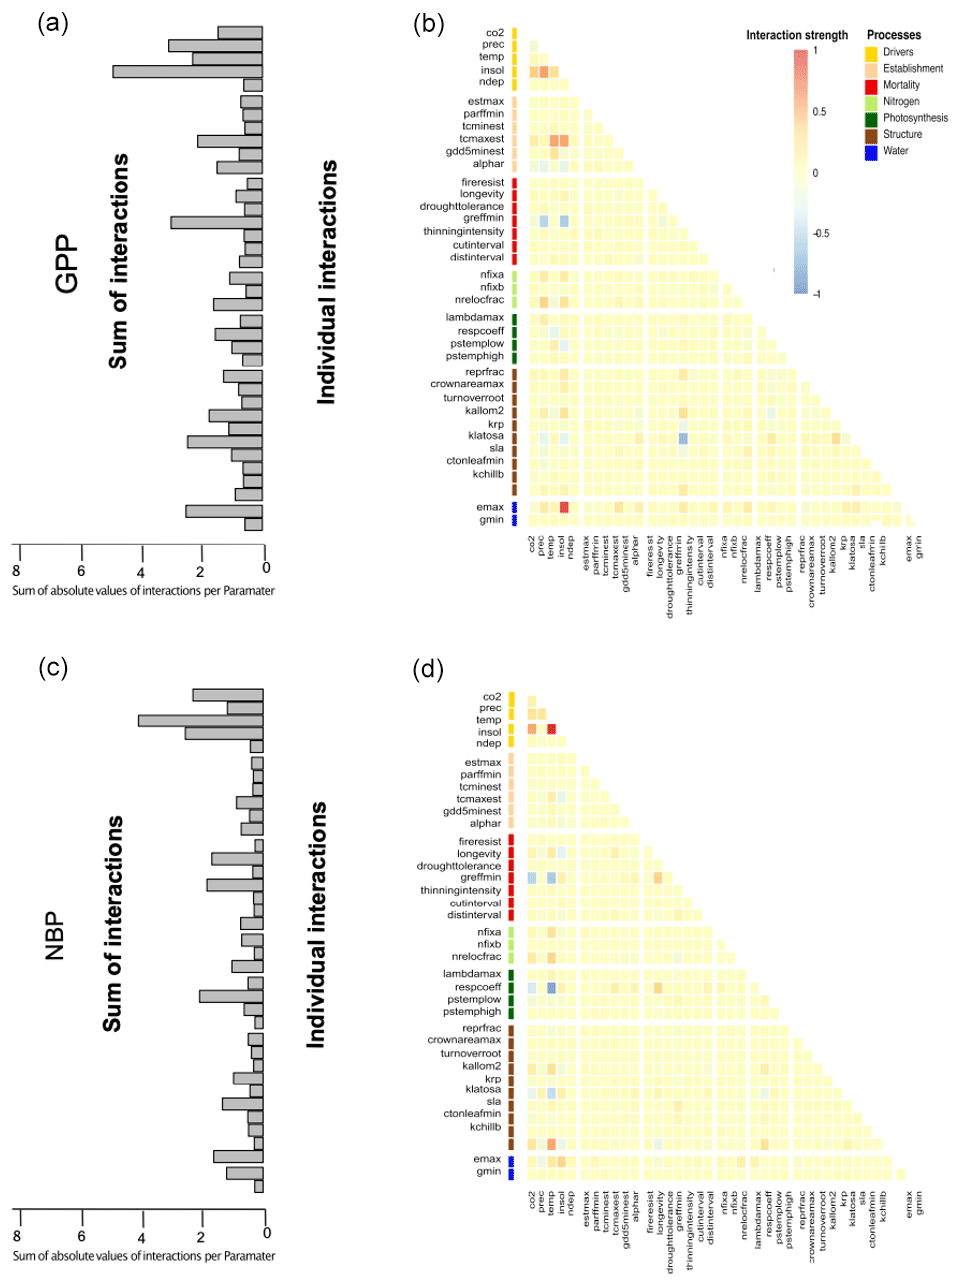
Figure A4Interactions of uncertainty contributions of GPP and total standing biomass are similar to net biome productivity, with most interactions arising from environmental drivers.
High sums of strong interactions arise from temperature, precipitation, solar radiation, greffmin, emax, and respcoeff (Fig. A4a, b).
LPJ-GUESS development is managed and maintained in a permanent repository at Lund University, Sweden. Source code is made available on request. The model version presented in this paper is identified by the permanent revision number r10207 in the code repository. There is no DOI associated with the code. Code to perform the sensitivity and uncertainty analysis can be found on Zenodo under https://doi.org/10.5281/zenodo.5873672 (Oberpriller, 2022). Results from the LPJ-GUESS runs are available under https://doi.org/10.5281/zenodo.4670295 (Oberpriller et al., 2021b).
JO and FH conceived and designed the study and wrote a first draft. CH, AK, PA, ML, SO, and AA advised regarding running the LPJ-GUESS model. JO implemented the case studies, ran the experiments, and analyzed the results. CH, AK, and PA advised regarding running the LPJ-GUESS model. CH, AR, and AK determined the prior ranges for the parameters. All authors contributed to discussing and interpreting the results and to the preparation of the manuscript.
The contact author has declared that neither they nor their co-authors have any competing interests.
Publisher's note: Copernicus Publications remains neutral with regard to jurisdictional claims in published maps and institutional affiliations.
We acknowledge funding from the Bavarian Ministry of Science and the Arts in the context of Bavarian Climate Research Network (bayklif). We thank the LPJ-GUESS developers for developing and maintaining the LPJ-GUESS model. We also thank two anonymous reviewers for their valuable comments and feedback on an earlier version of the manuscript.
This research has been supported by the Bayerisches Staatsministerium für Wissenschaft, Forschung und Kunst (Bavarian Climate Research Network).
This paper was edited by Tomomichi Kato and reviewed by two anonymous referees.
Augustynczik, A. L. D., Hartig, F., Minunno, F., Kahle, H.-P., Diaconu, D., Hanewinkel, M., and Yousefpour, R.: Productivity of Fagus sylvatica under climate change – A Bayesian analysis of risk and uncertainty using the model 3-PG, Forest Ecol. Manag., 401, 192–206, https://doi.org/10.1016/j.foreco.2017.06.061, 2017.
Balaman, Ş. Y.: Chapter 5 – Uncertainty Issues in Biomass-Based Production Chains, in: Decision-Making for Biomass-Based Production Chains, edited by: Balaman, Ş. Y., Academic Press, 113–142, https://doi.org/10.1016/B978-0-12-814278-3.00005-4, 2019.
Barman, R., Jain, A. K., and Liang, M.: Climate-driven uncertainties in modeling terrestrial gross primary production: a site level to global-scale analysis, Glob. Change Biol., 20, 1394–1411, https://doi.org/10.1111/gcb.12474, 2014.
Bastos, A., O'Sullivan, M., Ciais, P., Makowski, D., Sitch, S., Friedlingstein, P., Chevallier, F., Rödenbeck, C., Pongratz, J., Luijkx, I. T., Patra, P. K., Peylin, P., Canadell, J. G., Lauerwald, R., Li, W., Smith, N. E., Peters, W., Goll, D. S., Jain, A. k., Kato, E., Lienert, S., Lombardozzi, D. L., Haverd, V., Nabel, J. E. M. S., Poulter, B., Tian, H., Walker, A. P., and Zaehle, S.: Sources of Uncertainty in Regional and Global Terrestrial CO2 Exchange Estimates, 34, e2019GB006393, https://doi.org/10.1029/2019GB006393, 2020.
Batjes, N. H.: ISRIC-WISE global data set of derived soil properties on a 0.5 by 0.5 degree grid (ver. 3.0), 24, https://www.isric.org/sites/default/files/isric_report_2005_08.pdf (last access: 10 December 2020), 2005.
Bolnick, D. I., Amarasekare, P., Araújo, M. S., Bürger, R., Levine, J. M., Novak, M., Rudolf, V. H. W., Schreiber, S. J., Urban, M. C., and Vasseur, D. A.: Why intraspecific trait variation matters in community ecology, Trends Ecol. Evol., 26, 183–192, https://doi.org/10.1016/j.tree.2011.01.009, 2011.
Bolte, A., Czajkowski, T., and Kompa, T.: The north-eastern distribution range of European beech – a review, Forestry, 80, 413–429, https://doi.org/10.1093/forestry/cpm028, 2007.
Bonan, G. B.: Forests and Climate Change: Forcings, Feedbacks, and the Climate Benefits of Forests, Science, 320, 1444–1449, https://doi.org/10.1126/science.1155121, 2008.
Brazee, R. J. and Amacher, G. S.: Duality and Faustmann: Implications for the Evaluation of Landowner Behavior, Forest Sci., 46, 132–138, https://academic.oup.com/forestscience/article/46/1/132/4617376 (last access: 21 November 2021), 2000.
Bugmann, H., Seidl, R., Hartig, F., Bohn, F., Brůna, J., Cailleret, M., François, L., Heinke, J., Henrot, A.-J., Hickler, T., Hülsmann, L., Huth, A., Jacquemin, I., Kollas, C., Lasch-Born, P., Lexer, M. J., Merganič, J., Merganičová, K., Mette, T., Miranda, B. R., Nadal-Sala, D., Rammer, W., Rammig, A., Reineking, B., Roedig, E., Sabaté, S., Steinkamp, J., Suckow, F., Vacchiano, G., Wild, J., Xu, C., and Reyer, C. P. O.: Tree mortality submodels drive simulated long-term forest dynamics: assessing 15 models from the stand to global scale, Ecosphere, 10, e02616, https://doi.org/10.1002/ecs2.2616, 2019.
Buras, A. and Menzel, A.: Projecting Tree Species Composition Changes of European Forests for 2061–2090 Under RCP 4.5 and RCP 8.5 Scenarios, Front. Plant Sci., 9, https://doi.org/10.3389/fpls.2018.01986, 2019.
Buras, A., Schunk, C., Zeiträg, C., Herrmann, C., Kaiser, L., Lemme, H., Straub, C., Taeger, S., Gößwein, S., Klemmt, H.-J., and Menzel, A.: Are Scots pine forest edges particularly prone to drought-induced mortality?, Environ. Res. Lett., 13, 025001, https://doi.org/10.1088/1748-9326/aaa0b4, 2018.
Burkett, V. R., Wilcox, D. A., Stottlemyer, R., Barrow, W., Fagre, D., Baron, J., Price, J., Nielsen, J. L., Allen, C. D., Peterson, D. L., Ruggerone, G., and Doyle, T.: Nonlinear dynamics in ecosystem response to climatic change: Case studies and policy implications, Ecol. Complex., 2, 357–394, https://doi.org/10.1016/j.ecocom.2005.04.010, 2005.
Cailleret, M., Bircher, N., Hartig, F., Hülsmann, L., and Bugmann, H.: Bayesian calibration of a growth-dependent tree mortality model to simulate the dynamics of European temperate forests, Ecol. Appl., 30, e02021, https://doi.org/10.1002/eap.2021, 2020.
Callaway, R. M.: Positive Interactions and Interdependence in Plant Communities, 1st edn., Springer Netherlands, Hardcover ISBN 978-1-4020-6223-0, Softcover ISBN 978-90-481-7573-4, eBook ISBN 978-1-4020-6224-7, https://doi.org/10.1007/978-1-4020-6224-7, 2007.
Cariboni, J., Gatelli, D., Liska, R., and Saltelli, A.: The role of sensitivity analysis in ecological modelling, Ecol. Model., 203, 167–182, https://doi.org/10.1016/j.ecolmodel.2005.10.045, 2007.
Caswell, H.: Introduction: Sensitivity Analysis – What and Why?, in: Sensitivity Analysis: Matrix Methods in Demography and Ecology, edited by: Caswell, H., Springer International Publishing, Cham, 3–12, Print ISBN 978-3-030-10533-4, Online ISBN 978-3-030-10534-1, https://doi.org/10.1007/978-3-030-10534-1_1, 2019.
Caudullo, G., Welk, E., and San-Miguel-Ayanz, J.: Chorological maps for the main European woody species, Data in Brief, 12, 662–666, https://doi.org/10.1016/j.dib.2017.05.007, 2017.
Charru, M., Seynave, I., Morneau, F., and Bontemps, J.-D.: Recent changes in forest productivity: An analysis of national forest inventory data for common beech (Fagus sylvatica L.) in north-eastern France, Forest Ecol. Manag., 260, 864–874, https://doi.org/10.1016/j.foreco.2010.06.005, 2010.
Chauliac, C., Aragonés, J.-M., Bestion, D., Cacuci, D. G., Crouzet, N., Weiss, F.-P., and Zimmermann, M. A.: NURESIM – A European simulation platform for nuclear reactor safety: Multi-scale and multi-physics calculations, sensitivity and uncertainty analysis, Nucl. Eng. Des., 241, 3416–3426, https://doi.org/10.1016/j.nucengdes.2010.09.040, 2011.
Cleveland, C. C., Townsend, A. R., Schimel, D. S., Fisher, H., Howarth, R. W., Hedin, L. O., Perakis, S. S., Latty, E. F., Fischer, J. C. V., Elseroad, A., and Wasson, M. F.: Global patterns of terrestrial biological nitrogen (N2) fixation in natural ecosystems, Global Biogeochem. Cy., 13, 623–645, https://doi.org/10.1029/1999GB900014, 1999.
Courbaud, B., Lafond, V., Lagarrigues, G., Vieilledent, G., Cordonnier, T., Jabot, F., and de Coligny, F.: Applying ecological model evaludation: Lessons learned with the forest dynamics model Samsara2, Ecol. Model., 314, 1–14, https://doi.org/10.1016/j.ecolmodel.2015.06.039, 2015.
Cramer, W., Bondeau, A., Woodward, F. I., Prentice, I. C., Betts, R. A., Brovkin, V., Cox, P. M., Fisher, V., Foley, J. A., Friend, A. D., Kucharik, C., Lomas, M. R., Ramankutty, N., Sitch, S., Smith, B., White, A., and Young-Molling, C.: Global response of terrestrial ecosystem structure and function to CO2 and climate change: results from six dynamic global vegetation models, Global Change Biol., 7, 357–373, https://doi.org/10.1046/j.1365-2486.2001.00383.x, 2001.
Cui, E., Huang, K., Arain, M. A., Fisher, J. B., Huntzinger, D. N., Ito, A., Luo, Y., Jain, A. K., Mao, J., Michalak, A. M., Niu, S., Parazoo, N. C., Peng, C., Peng, S., Poulter, B., Ricciuto, D. M., Schaefer, K. M., Schwalm, C. R., Shi, X., Tian, H., Wang, W., Wang, J., Wei, Y., Yan, E., Yan, L., Zeng, N., Zhu, Q., and Xia, J.: Vegetation Functional Properties Determine Uncertainty of Simulated Ecosystem Productivity: A Traceability Analysis in the East Asian Monsoon Region, Global Biogeochem. Cy., 33, 668–689, https://doi.org/10.1029/2018GB005909, 2019.
Dietze, M. C.: Ecological Forecasting, 1st edn., Princeton University Press, 284 pp., ISBN 9780691160573, 2017a.
Dietze, M. C.: Prediction in ecology: a first-principles framework, Ecol. Appl., 27, 2048–2060, https://doi.org/10.1002/eap.1589, 2017b.
Dietze, M. C., Fox, A., Beck-Johnson, L. M., Betancourt, J. L., Hooten, M. B., Jarnevich, C. S., Keitt, T. H., Kenney, M. A., Laney, C. M., Larsen, L. G., Loescher, H. W., Lunch, C. K., Pijanowski, B. C., Randerson, J. T., Read, E. K., Tredennick, A. T., Vargas, R., Weathers, K. C., and White, E. P.: Iterative near-term ecological forecasting: Needs, opportunities, and challenges, P. Natl. Acad. Sci. USA, 115, 1424–1432, https://doi.org/10.1073/pnas.1710231115, 2018.
Dufresne, J.-L., Foujols, M.-A., Denvil, S., Caubel, A., Marti, O., Aumont, O., Balkanski, Y., Bekki, S., Bellenger, H., Benshila, R., Bony, S., Bopp, L., Braconnot, P., Brockmann, P., Cadule, P., Cheruy, F., Codron, F., Cozic, A., Cugnet, D., de Noblet, N., Duvel, J.-P., Ethé, C., Fairhead, L., Fichefet, T., Flavoni, S., Friedlingstein, P., Grandpeix, J.-Y., Guez, L., Guilyardi, E., Hauglustaine, D., Hourdin, F., Idelkadi, A., Ghattas, J., Joussaume, S., Kageyama, M., Krinner, G., Labetoulle, S., Lahellec, A., Lefebvre, M.-P., Lefevre, F., Levy, C., Li, Z. X., Lloyd, J., Lott, F., Madec, G., Mancip, M., Marchand, M., Masson, S., Meurdesoif, Y., Mignot, J., Musat, I., Parouty, S., Polcher, J., Rio, C., Schulz, M., Swingedouw, D., Szopa, S., Talandier, C., Terray, P., Viovy, N., and Vuichard, N.: Climate change projections using the IPSL-CM5 Earth System Model: from CMIP3 to CMIP5, Clim. Dynam., 40, 2123–2165, https://doi.org/10.1007/s00382-012-1636-1, 2013.
EUFORGEN: Distribution map of norway spruce (Picea abies), https://www.euforgen.org/species/pinus-sylvestris/ (last access: 20 August 2020), 2013.
EUFORGEN: Distribution map of scots pine (Pinus sylvestris), https://www.euforgen.org/species/picea-abies/ (last access: 21 August 2020), 2008.
Fer, I., Kelly, R., Moorcroft, P. R., Richardson, A. D., Cowdery, E. M., and Dietze, M. C.: Linking big models to big data: efficient ecosystem model calibration through Bayesian model emulation, Biogeosciences, 15, 5801–5830, https://doi.org/10.5194/bg-15-5801-2018, 2018.
Fisher, R. A., Koven, C. D., Anderegg, W. R. L., Christoffersen, B. O., Dietze, M. C., Farrior, C. E., Holm, J. A., Hurtt, G. C., Knox, R. G., Lawrence, P. J., Lichstein, J. W., Longo, M., Matheny, A. M., Medvigy, D., Muller-Landau, H. C., Powell, T. L., Serbin, S. P., Sato, H., Shuman, J. K., Smith, B., Trugman, A. T., Viskari, T., Verbeeck, H., Weng, E., Xu, C., Xu, X., Zhang, T., and Moorcroft, P. R.: Vegetation demographics in Earth System Models: A review of progress and priorities, Global Change Biol., 24, 35–54, https://doi.org/10.1111/gcb.13910, 2018.
Fleischer, K., Rammig, A., De Kauwe, M. G., Walker, A. P., Domingues, T. F., Fuchslueger, L., Garcia, S., Goll, D. S., Grandis, A., Jiang, M., Haverd, V., Hofhansl, F., Holm, J. A., Kruijt, B., Leung, F., Medlyn, B. E., Mercado, L. M., Norby, R. J., Pak, B., von Randow, C., Quesada, C. A., Schaap, K. J., Valverde-Barrantes, O. J., Wang, Y.-P., Yang, X., Zaehle, S., Zhu, Q., and Lapola, D. M.: Amazon forest response to CO2 fertilization dependent on plant phosphorus acquisition, Nat. Geosci., 12, 736–741, https://doi.org/10.1038/s41561-019-0404-9, 2019.
Forrest, M., Tost, H., Lelieveld, J., and Hickler, T.: Including vegetation dynamics in an atmospheric chemistry-enabled general circulation model: linking LPJ-GUESS (v4.0) with the EMAC modelling system (v2.53), Geosci. Model Dev., 13, 1285–1309, https://doi.org/10.5194/gmd-13-1285-2020, 2020.
Galbraith, D., Levy, P. E., Sitch, S., Huntingford, C., Cox, P., Williams, M., and Meir, P.: Multiple mechanisms of Amazonian forest biomass losses in three dynamic global vegetation models under climate change, New Phytol., 187, 647–665, https://doi.org/10.1111/j.1469-8137.2010.03350.x, 2010.
Gerten, D., Schaphoff, S., Haberlandt, U., Lucht, W., and Sitch, S.: Terrestrial vegetation and water balance – hydrological evaluation of a dynamic global vegetation model, J. Hydrol., 286, 249–270, https://doi.org/10.1016/j.jhydrol.2003.09.029, 2004.
Giglio, L., Randerson, J. T., van der Werf, G. R., Kasibhatla, P. S., Collatz, G. J., Morton, D. C., and DeFries, R. S.: Assessing variability and long-term trends in burned area by merging multiple satellite fire products, Biogeosciences, 7, 1171–1186, https://doi.org/10.5194/bg-7-1171-2010, 2010.
Gosling, J. P.: SHELF: The Sheffield Elicitation Framework, in: Elicitation: The Science and Art of Structuring Judgement, 1st edn., edited by: Dias, L. C., Morton, A., and Quigley, J., Springer International Publishing, Cham, 61–93, ISBN 978-3-319-65052-4, https://doi.org/10.1007/978-3-319-65052-4_4, 2018.
Grimm, V.: Pattern-Oriented Modeling of Agent-Based Complex Systems: Lessons from Ecology, Science, 310, 987–991, https://doi.org/10.1126/science.1116681, 2005.
Gustafson, E. J., Miranda, B. R., and Sturtevant, B. R.: Can Future CO2 Concentrations Mitigate the Negative Effects of High Temperature and Longer Droughts on Forest Growth?, Forests, 9, 664, https://doi.org/10.3390/f9110664, 2018.
Hamby, D. M.: A review of techniques for parameter sensitivity analysis of environmental models, Environ. Monit. Assess., 32, 135–154, https://doi.org/10.1007/BF00547132, 1994.
Hardiman, B. S., Bohrer, G., Gough, C. M., Vogel, C. S., and Curtis, P. S.: The role of canopy structural complexity in wood net primary production of a maturing northern deciduous forest, Ecology, 92, 1818–1827, https://doi.org/10.1890/10-2192.1, 2011.
Hartig, F., Calabrese, J. M., Reineking, B., Wiegand, T., and Huth, A.: Statistical inference for stochastic simulation models – theory and application, Ecol. Lett., 14, 816–827, https://doi.org/10.1111/j.1461-0248.2011.01640.x, 2011.
Haverd, V., Smith, B., Nieradzik, L. P., and Briggs, P. R.: A stand-alone tree demography and landscape structure module for Earth system models: integration with inventory data from temperate and boreal forests, Biogeosciences, 11, 4039–4055, https://doi.org/10.5194/bg-11-4039-2014, 2014.
Herrero de Aza, C., Turrión, M. B., Pando, V., and Bravo, F.: Carbon in heartwood, sapwood and bark along the stem profile in three Mediterranean Pinus species, Ann. For. Sci., 68, 1067, https://doi.org/10.1007/s13595-011-0122-y, 2011.
Hickler, T., Smith, B., Sykes, M. T., Davis, M. B., Sugita, S., and Walker, K.: USING A GENERALIZED VEGETATION MODEL TO SIMULATE VEGETATION DYNAMICS IN NORTHEASTERN USA, Ecology, 85, 519–530, https://doi.org/10.1890/02-0344, 2004.
Hickler, T., Smith, B., Prentice, I. C., Mjöfors, K., Miller, P., Arneth, A., and Sykes, M. T.: CO2 fertilization in temperate FACE experiments not representative of boreal and tropical forests, Global Change Biol., 14, 1531–1542, https://doi.org/10.1111/j.1365-2486.2008.01598.x, 2008.
Hickler, T., Vohland, K., Feehan, J., Miller, P. A., Smith, B., Costa, L., Giesecke, T., Fronzek, S., Carter, T. R., Cramer, W., Kühn, I., and Sykes, M. T.: Projecting the future distribution of European potential natural vegetation zones with a generalized, tree species-based dynamic vegetation model, Global Ecol. Biogeogr., 21, 50–63, https://doi.org/10.1111/j.1466-8238.2010.00613.x, 2012.
Huang, S., Titus, S. J., and Wiens, D. P.: Comparison of nonlinear height–diameter functions for major Alberta tree species, Can. J. Forest Res., 22, 1297–1304, https://doi.org/10.1139/x92-172, 1992.
Huber, N., Bugmann, H., and Lafond, V.: Global sensitivity analysis of a dynamic vegetation model: Model sensitivity depends on successional time, climate and competitive interactions, Ecol. Model., 368, 377–390, https://doi.org/10.1016/j.ecolmodel.2017.12.013, 2018.
Huntzinger, D. N., Michalak, A. M., Schwalm, C., Ciais, P., King, A. W., Fang, Y., Schaefer, K., Wei, Y., Cook, R. B., Fisher, J. B., Hayes, D., Huang, M., Ito, A., Jain, A. K., Lei, H., Lu, C., Maignan, F., Mao, J., Parazoo, N., Peng, S., Poulter, B., Ricciuto, D., Shi, X., Tian, H., Wang, W., Zeng, N., and Zhao, F.: Uncertainty in the response of terrestrial carbon sink to environmental drivers undermines carbon-climate feedback predictions, Sci. Rep., 7, 4765, https://doi.org/10.1038/s41598-017-03818-2, 2017.
IPCC: Climate Change 2014: Synthesis Report, Contribution of Working Groups I, II and III to the Fifth Assessment Report of the Intergovernmental Panel on Climate Change, edited by: Core Writing Team, Pachauri, R. K., and Meyer, L. A., IPCC, Geneva, Switzerland, 151 pp., https://epic.awi.de/id/eprint/37530/1/IPCC_AR5_SYR_Final.pdf (last access: 13 January 2021), 2014.
Jiang, Y., Zhuang, Q., Schaphoff, S., Sitch, S., Sokolov, A., Kicklighter, D., and Melillo, J.: Uncertainty analysis of vegetation distribution in the northern high latitudes during the 21st century with a dynamic vegetation model, Ecol. Evol., 2, 593–614, https://doi.org/10.1002/ece3.85, 2012.
Johansson, P. O.: The economics of forestry and natural resources, 1st edn., Basil Blackwell Ltd., ISBN 9780631141624, 1986.
Jørgensen, S. E. and Bendoricchio, G.: Fundamentals of Ecological Modelling, 4th edn., Elsevier, 544 pp., Hardcover ISBN 9780444535672, eBook ISBN 9780444535689, 2001.
Keenan, T., Serra, J. M., Lloret, F., Ninyerola, M., and Sabate, S.: Predicting the future of forests in the Mediterranean under climate change, with niche- and process-based models: CO2 matters!, Global Change Biol., 17, 565–579, https://doi.org/10.1111/j.1365-2486.2010.02254.x, 2011.
Körner, C.: Plant CO2 responses: an issue of definition, time and resource supply, New Phytol., 172, 393–411, https://doi.org/10.1111/j.1469-8137.2006.01886.x, 2006.
Krause, A., Haverd, V., Poulter, B., Anthoni, P., Quesada, B., Rammig, A., and Arneth, A.: Multimodel Analysis of Future Land Use and Climate Change Impacts on Ecosystem Functioning, Earth's Future, 7, 833–851, https://doi.org/10.1029/2018EF001123, 2019.
Laberge, Y.: Simulating nature: a philosophical study of computer-simulation uncertainties and their role in climate science and policy advice, J. Appl. Stat., 40, 919–920, https://doi.org/10.1080/02664763.2012.749047, 2013.
Lamarque, J.-F., Dentener, F., McConnell, J., Ro, C.-U., Shaw, M., Vet, R., Bergmann, D., Cameron-Smith, P., Dalsoren, S., Doherty, R., Faluvegi, G., Ghan, S. J., Josse, B., Lee, Y. H., MacKenzie, I. A., Plummer, D., Shindell, D. T., Skeie, R. B., Stevenson, D. S., Strode, S., Zeng, G., Curran, M., Dahl-Jensen, D., Das, S., Fritzsche, D., and Nolan, M.: Multi-model mean nitrogen and sulfur deposition from the Atmospheric Chemistry and Climate Model Intercomparison Project (ACCMIP): evaluation of historical and projected future changes, Atmos. Chem. Phys., 13, 7997–8018, https://doi.org/10.5194/acp-13-7997-2013, 2013.
Larcher, W.: Ökophysiologische Konstitutionseigenschaften von Gebirgspflanzen, Ber. Deut. Bot. Ges., 96, 73–85, 1983.
Levin, S. A.: The Problem of Pattern and Scale in Ecology: The Robert H. MacArthur Award Lecture, Ecology, 73, 1943–1967, https://doi.org/10.2307/1941447, 1992.
Lindeskog, M., Arneth, A., Bondeau, A., Waha, K., Seaquist, J., Olin, S., and Smith, B.: Implications of accounting for land use in simulations of ecosystem carbon cycling in Africa, Earth Syst. Dynam., 4, 385–407, https://doi.org/10.5194/esd-4-385-2013, 2013.
Lindeskog, M., Smith, B., Lagergren, F., Sycheva, E., Ficko, A., Pretzsch, H., and Rammig, A.: Accounting for forest management in the estimation of forest carbon balance using the dynamic vegetation model LPJ-GUESS (v4.0, r9710): implementation and evaluation of simulations for Europe, Geosci. Model Dev., 14, 6071–6112, https://doi.org/10.5194/gmd-14-6071-2021, 2021.
Loehle, C.: Strategy Space and the Disturbance Spectrum: A Life-History Model for Tree Species Coexistence, Am. Nat., 156, 14–33, https://doi.org/10.1086/303369, 2000.
Maestre, F. T., Callaway, R. M., Valladares, F., and Lortie, C. J.: Refining the stress-gradient hypothesis for competition and facilitation in plant communities, J. Ecol., 97, 199–205, https://doi.org/10.1111/j.1365-2745.2008.01476.x, 2009.
Mahto, A.: splitstackshape: Stack and Reshape Datasets After Splitting Concatenated Values, CRAN R package, https://github.com/mrdwab/splitstackshape (last access: 22 July 2022), 2019.
Mäkelä, J., Minunno, F., Aalto, T., Mäkelä, A., Markkanen, T., and Peltoniemi, M.: Sensitivity of 21st century simulated ecosystem indicators to model parameters, prescribed climate drivers, RCP scenarios and forest management actions for two Finnish boreal forest sites, Biogeosciences, 17, 2681–2700, https://doi.org/10.5194/bg-17-2681-2020, 2020.
Marsili-Libelli, S., Beck, M. B., Brunner, P., Croke, B., Guillaume, J., Jakeman, A., Jakeman, J., Keesman, K. J., and Stigter, H.: Practical identifiability analysis of environmental models, in: International Environmental Modelling and Software Society (iEMSs) 7th International Congress on Environmental Modelling and Software San Diego, California, USA, 15–19 June 2014, edited by: Ames, D. P. and Quinn, N., http://www.iemss.org/society/index.php/iemss-2014-proceedings (last access: 21 July 2021), 2014.
Matott, L. S., Babendreier, J. E., and Purucker, S. T.: Evaluating uncertainty in integrated environmental models: A review of concepts and tools, Water Resour. Res., 45, W06421, https://doi.org/10.1029/2008WR007301, 2009.
Mauri, A., Strona, G., and San-Miguel-Ayanz, J.: EU-Forest, a high-resolution tree occurrence dataset for Europe, Sci. Data, 4, 160123, https://doi.org/10.1038/sdata.2016.123, 2017.
Maxim, L. and van der Sluijs, J. P.: Quality in environmental science for policy: Assessing uncertainty as a component of policy analysis, Environ. Sci. Policy, 14, 482–492, https://doi.org/10.1016/j.envsci.2011.01.003, 2011.
Meinshausen, M., Smith, S. J., Calvin, K., Daniel, J. S., Kainuma, M. L. T., Lamarque, J.-F., Matsumoto, K., Montzka, S. A., Raper, S. C. B., Riahi, K., Thomson, A., Velders, G. J. M., and van Vuuren, D. P. P.: The RCP greenhouse gas concentrations and their extensions from 1765 to 2300, Climatic Change, 109, 213, https://doi.org/10.1007/s10584-011-0156-z, 2011.
Mencuccini, M. and Bonosi, L.: Leaf/sapwood area ratios in Scots pine show acclimation across Europe, Can. J. Forest Res., 31, 442–456, 2001.
Metzger, M. J., Bunce, R. G. H., Jongman, R. H. G., Mücher, C. A., and Watkins, J. W.: A climatic stratification of the environment of Europe, Global Ecol. Biogeogr., 14, 549–563, https://doi.org/10.1111/j.1466-822X.2005.00190.x, 2005.
Oberpriller, J.: JohannesOberpriller/SensitivityAnalysisLPJ: Release for revision (v1.0.1), Zenodo [code], https://doi.org/10.5281/zenodo.5873672, 2022.
Oberpriller, J., Cameron, D. R., Dietze, M. C., and Hartig, F.: Towards robust statistical inference for complex computer models, Ecol. Lett., 24, 1251–1261, https://doi.org/10.1111/ele.13728, 2021a.
Oberpriller, J., Anthoni, P., Herschlein, C., Arneth, A., Krause, A., Rammig, A., and Hartig, F.: Parameters and model results for sensitivity and uncertainty analysis of LPJ-GUESS, Zenodo [data set], https://doi.org/10.5281/zenodo.4670295, 2021b.
Olin, S., Schurgers, G., Lindeskog, M., Wårlind, D., Smith, B., Bodin, P., Holmér, J., and Arneth, A.: Modelling the response of yields and tissue C:N to changes in atmospheric CO2 and N management in the main wheat regions of western Europe, Biogeosciences, 12, 2489–2515, https://doi.org/10.5194/bg-12-2489-2015, 2015.
Pappas, C., Fatichi, S., Leuzinger, S., Wolf, A., and Burlando, P.: Sensitivity analysis of a process-based ecosystem model: Pinpointing parameterization and structural issues, J. Geophys. Res.-Biogeo., 118, 505–528, https://doi.org/10.1002/jgrg.20035, 2013.
Pearce, D. W.: The Economic Value of Forest Ecosystems, Ecosyst. Health, 7, 284–296, https://doi.org/10.1046/j.1526-0992.2001.01037.x, 2001.
Petter, G., Mairota, P., Albrich, K., Bebi, P., Brůna, J., Bugmann, H., Haffenden, A., Scheller, R. M., Schmatz, D. R., Seidl, R., Speich, M., Vacchiano, G., and Lischke, H.: How robust are future projections of forest landscape dynamics? Insights from a systematic comparison of four forest landscape models, Environ. Modell. Softw., 134, 104844, https://doi.org/10.1016/j.envsoft.2020.104844, 2020.
Prestele, R., Alexander, P., Rounsevell, M. D. A., Arneth, A., Calvin, K., Doelman, J., Eitelberg, D. A., Engström, K., Fujimori, S., Hasegawa, T., Havlik, P., Humpenöder, F., Jain, A. K., Krisztin, T., Kyle, P., Meiyappan, P., Popp, A., Sands, R. D., Schaldach, R., Schüngel, J., Stehfest, E., Tabeau, A., Meijl, H. V., Vliet, J. V., and Verburg, P. H.: Hotspots of uncertainty in land-use and land-cover change projections: a global-scale model comparison, Global Change Biol., 22, 3967–3983, https://doi.org/10.1111/gcb.13337, 2016.
Pretzsch, H., del Río, M., Ammer, Ch., Avdagic, A., Barbeito, I., Bielak, K., Brazaitis, G., Coll, L., Dirnberger, G., Drössler, L., Fabrika, M., Forrester, D. I., Godvod, K., Heym, M., Hurt, V., Kurylyak, V., Löf, M., Lombardi, F., Matović, B., Mohren, F., Motta, R., den Ouden, J., Pach, M., Ponette, Q., Schütze, G., Schweig, J., Skrzyszewski, J., Sramek, V., Sterba, H., Stojanović, D., Svoboda, M., Vanhellemont, M., Verheyen, K., Wellhausen, K., Zlatanov, T., and Bravo-Oviedo, A.: Growth and yield of mixed versus pure stands of Scots pine (Pinus sylvestris L.) and European beech (Fagus sylvatica L.) analysed along a productivity gradient through Europe, Eur. J. Forest. Res., 134, 927–947, https://doi.org/10.1007/s10342-015-0900-4, 2015.
Pugh, T. A. M., Lindeskog, M., Smith, B., Poulter, B., Arneth, A., Haverd, V., and Calle, L.: Role of forest regrowth in global carbon sink dynamics, P. Natl. Acad. Sci. USA, 116, 4382–4387, https://doi.org/10.1073/pnas.1810512116, 2019.
Rabin, S. S., Melton, J. R., Lasslop, G., Bachelet, D., Forrest, M., Hantson, S., Kaplan, J. O., Li, F., Mangeon, S., Ward, D. S., Yue, C., Arora, V. K., Hickler, T., Kloster, S., Knorr, W., Nieradzik, L., Spessa, A., Folberth, G. A., Sheehan, T., Voulgarakis, A., Kelley, D. I., Prentice, I. C., Sitch, S., Harrison, S., and Arneth, A.: The Fire Modeling Intercomparison Project (FireMIP), phase 1: experimental and analytical protocols with detailed model descriptions, Geosci. Model Dev., 10, 1175–1197, https://doi.org/10.5194/gmd-10-1175-2017, 2017.
Renwick, K. M., Fellows, A., Flerchinger, G. N., Lohse, K. A., Clark, P. E., Smith, W. K., Emmett, K., and Poulter, B.: Modeling phenological controls on carbon dynamics in dryland sagebrush ecosystems, Agr. Forest Meteorol., 274, 85–94, https://doi.org/10.1016/j.agrformet.2019.04.003, 2019.
Reyer, C. P. O., Flechsig, M., Lasch-Born, P., and van Oijen, M.: Integrating parameter uncertainty of a process-based model in assessments of climate change effects on forest productivity, Climatic Change, 137, 395–409, https://doi.org/10.1007/s10584-016-1694-1, 2016.
Robichaud, E. and Methven, I. R.: The applicability of the pipe model theory for the prediction of foliage biomass in trees from natural, untreated black spruce stands, Can. J. Forest Res., 22, 1118–1123, https://doi.org/10.1139/x92-148, 1992.
Roux, S., Buis, S., Lafolie, F., and Lamboni, M.: Cluster-based GSA: Global sensitivity analysis of models with temporal or spatial outputs using clustering, Environ. Modell. Softw., 140, 105046, https://doi.org/10.1016/j.envsoft.2021.105046, 2021.
Ruiz-Pérez, G. and Vico, G.: Effects of Temperature and Water Availability on Northern European Boreal Forests, Frontiers in Forests and Global Change, 3, 34, https://doi.org/10.3389/ffgc.2020.00034, 2020.
Saltelli, A.: Sensitivity Analysis for Importance Assessment, 22, 579–590, Risk. Anal., 22, 579–590, https://doi.org/10.1111/0272-4332.00040, 2002.
Saltelli, A., Ratto, M., Andres, T., Campolongo, F., Cariboni, J., Gatelli, D., Saisana, M., and Tarantola, S. (Eds.): Global sensitivity analysis: the primer, 1st edn., John Wiley, Chichester, England; Hoboken, NJ, 292 pp., ISBN 978-0-470-05997-5, 2008.
Saltelli, A., Aleksankina, K., Becker, W., Fennell, P., Ferretti, F., Holst, N., Li, S., and Wu, Q.: Why so many published sensitivity analyses are false: A systematic review of sensitivity analysis practices, Environ. Modell. Softw., 114, 29–39, https://doi.org/10.1016/j.envsoft.2019.01.012, 2019.
Saraiva, S., Meier, H. E. M., Andersson, H., Höglund, A., Dieterich, C., Gröger, M., Hordoir, R., and Eilola, K.: Uncertainties in Projections of the Baltic Sea Ecosystem Driven by an Ensemble of Global Climate Models, Front. Earth Sci., 6, https://doi.org/10.3389/feart.2018.00244, 2019.
Schibalski, A., Lehtonen, A., Hickler, T., and Schröder, B.: Identifying important topics for model refinement in a widely used process-based model informed by correlative model analyses in a boreal forest, Silva Fenn., 51, 6977, https://doi.org/10.14214/sf.6977, 2017.
Seebacher, F. and Franklin, C. E.: Determining environmental causes of biological effects: the need for a mechanistic physiological dimension in conservation biology, Philos. T. R. Soc. Lond. B Biol. Sci., 367, 1607–1614, https://doi.org/10.1098/rstb.2012.0036, 2012.
Sitch, S., Smith, B., Prentice, I. C., Arneth, A., Bondeau, A., Cramer, W., Kaplan, J. O., Levis, S., Lucht, W., Sykes, M. T., Thonicke, K., and Venevsky, S.: Evaluation of ecosystem dynamics, plant geography and terrestrial carbon cycling in the LPJ dynamic global vegetation model, Glob. Change Biol., 9, 161–185, https://doi.org/10.1046/j.1365-2486.2003.00569.x, 2003.
Smith, B., Prentice, I. C., and Sykes, M. T.: Representation of vegetation dynamics in the modelling of terrestrial ecosystems: comparing two contrasting approaches within European climate space, Global Ecol. Biogeogr., 10, 621–637, https://doi.org/10.1046/j.1466-822X.2001.t01-1-00256.x, 2001.
Smith, B., Samuelsson, P., Wramneby, A., and Rummukainen, M.: A model of the coupled dynamics of climate, vegetation and terrestrial ecosystem biogeochemistry for regional applications, Tellus A, 63, 87–106, https://doi.org/10.1111/j.1600-0870.2010.00477.x, 2011.
Smith, B., Wårlind, D., Arneth, A., Hickler, T., Leadley, P., Siltberg, J., and Zaehle, S.: Implications of incorporating N cycling and N limitations on primary production in an individual-based dynamic vegetation model, Biogeosciences, 11, 2027–2054, https://doi.org/10.5194/bg-11-2027-2014, 2014.
Snell, R. S., Huth, A., Nabel, J. E. M. S., Bocedi, G., Travis, J. M. J., Gravel, D., Bugmann, H., Gutiérrez, A. G., Hickler, T., Higgins, S. I., Reineking, B., Scherstjanoi, M., Zurbriggen, N., and Lischke, H.: Using dynamic vegetation models to simulate plant range shifts, Ecography, 37, 1184–1197, https://doi.org/10.1111/ecog.00580, 2014.
Snell, R. S., Elkin, C., Kotlarski, S., and Bugmann, H.: Importance of climate uncertainty for projections of forest ecosystem services, Reg. Environ. Change, 18, 2145–2159, https://doi.org/10.1007/s10113-018-1337-3, 2018.
Sobie, E. A.: Parameter Sensitivity Analysis in Electrophysiological Models Using Multivariable Regression, Biophys. J., 96, 1264–1274, https://doi.org/10.1016/j.bpj.2008.10.056, 2009.
Strengers, B. J., Müller, C., Schaeffer, M., Haarsma, R. J., Severijns, C., Gerten, D., Schaphoff, S., van den Houdt, R., and Oostenrijk, R.: Assessing 20th century climate–vegetation feedbacks of land-use change and natural vegetation dynamics in a fully coupled vegetation–climate model, Int. J. Climatol., 30, 2055–2065, https://doi.org/10.1002/joc.2132, 2010.
Tegel, W., Seim, A., Hakelberg, D., Hoffmann, S., Panev, M., Westphal, T., and Büntgen, U.: A recent growth increase of European beech (Fagus sylvatica L.) at its Mediterranean distribution limit contradicts drought stress, Eur. J. Forest Res., 133, 61–71, https://doi.org/10.1007/s10342-013-0737-7, 2014.
Tian, S., Youssef, M. A., Amatya, D. M., and Vance, E. D.: Global sensitivity analysis of DRAINMOD-FOREST, an integrated forest ecosystem model: Global sensitivity analysis of DRAINMOD-FOREST, an integrated forest ecosystem model, Hydrol. Process., 28, 4389–4410, https://doi.org/10.1002/hyp.9948, 2014.
Tian, W., Heo, Y., de Wilde, P., Li, Z., Yan, D., Park, C. S., Feng, X., and Augenbroe, G.: A review of uncertainty analysis in building energy assessment, Renew. Sust. Energ. Rev., 93, 285–301, https://doi.org/10.1016/j.rser.2018.05.029, 2018.
Tomlin, A. S.: The role of sensitivity and uncertainty analysis in combustion modelling, P. Combust. Inst., 34, 159–176, https://doi.org/10.1016/j.proci.2012.07.043, 2013.
Trotsiuk, V., Hartig, F., Cailleret, M., Babst, F., Forrester, D. I., Baltensweiler, A., Buchmann, N., Bugmann, H., Gessler, A., Gharun, M., Minunno, F., Rigling, A., Rohner, B., Stillhard, J., Thürig, E., Waldner, P., Ferretti, M., Eugster, W., and Schaub, M.: Assessing the response of forest productivity to climate extremes in Switzerland using model–data fusion, Global Change Biol., 26, 2463–2476, https://doi.org/10.1111/gcb.15011, 2020.
Tylianakis, J. M., Didham, R. K., Bascompte, J., and Wardle, D. A.: Global change and species interactions in terrestrial ecosystems, Ecol. Lett., 11, 1351–1363, https://doi.org/10.1111/j.1461-0248.2008.01250.x, 2008.
Vermeulen, M. H., Kruijt, B. J., Hickler, T., and Kabat, P.: Modelling short-term variability in carbon and water exchange in a temperate Scots pine forest, Earth Syst. Dynam., 6, 485–503, https://doi.org/10.5194/esd-6-485-2015, 2015.
Vitousek, P. M. and Howarth, R. W.: Nitrogen limitation on land and in the sea: How can it occur?, Biogeochemistry, 13, 87–115, https://doi.org/10.1007/BF00002772, 1991.
Walentowski, H., Falk, W., Mette, T., Kunz, J., Bräuning, A., Meinardus, C., Zang, C., Sutcliffe, L. M. E., and Leuschner, C.: Assessing future suitability of tree species under climate change by multiple methods: a case study in southern Germany, Ann. For. Res., 60, 101–126, https://doi.org/10.15287/afr.2016.789, 2017.
Wallach, D. and Genard, M.: Effect of uncertainty in input and parameter values on model prediction error, Ecol. Model., 105, 337–345, https://doi.org/10.1016/S0304-3800(97)00180-4, 1998.
Wang, F., Mladenoff, D. J., Forrester, J. A., Keough, C., and Parton, W. J.: Global sensitivity analysis of a modified CENTURY model for simulating impacts of harvesting fine woody biomass for bioenergy, Ecol. Model., 259, 16–23, https://doi.org/10.1016/j.ecolmodel.2013.03.008, 2013.
Waring, R. H.: Estimating Forest Growth and Efficiency in Relation to Canopy Leaf Area, in: Advances in Ecological Research, vol. 13, 1st edn., edited by: MacFadyen, A. and Ford, E. D., Academic Press, 327–354, ISSN 0065-2504, ISBN 9780120139132, https://doi.org/10.1016/S0065-2504(08)60111-7, 1983.
Wramneby, A., Smith, B., Zaehle, S., and Sykes, M. T.: Parameter uncertainties in the modelling of vegetation dynamics – Effects on tree community structure and ecosystem functioning in European forest biomes, Ecol. Model., 216, 277–290, https://doi.org/10.1016/j.ecolmodel.2008.04.013, 2008.
Wu, Z., Ahlström, A., Smith, B., Ardö, J., Eklundh, L., Fensholt, R., and Lehsten, V.: Climate Data Induced Uncertainty in Model-Based Estimations of Terrestrial Primary Productivity, Environ. Res. Lett., 12, 064013, https://doi.org/10.1088/1748-9326/aa6fd8, 2017.
Wu, Z., Boke-Olén, N., Fensholt, R., Ardö, J., Eklundh, L., and Lehsten, V.: Effect of climate dataset selection on simulations of terrestrial GPP: Highest uncertainty for tropical regions, PLOS ONE, 13, e0199383, https://doi.org/10.1371/journal.pone.0199383, 2018.
Xiao, C.-W., Janssens, I. A., Curiel Yuste, J., and Ceulemans, R.: Variation of specific leaf area and upscaling to leaf area index in mature Scots pine, Trees, 20, 304, https://doi.org/10.1007/s00468-005-0039-x, 2006.
Zaehle, S., Sitch, S., Smith, B., and Hatterman, F.: Effects of parameter uncertainties on the modeling of terrestrial biosphere dynamics, Global Biogeochem. Cy., 19, GB3020, https://doi.org/10.1029/2004GB002395, 2005.
Zeide, B.: Analysis of Growth Equations, Forest Sci., 39, 594–616, https://doi.org/10.1093/forestscience/39.3.594, 1993.
Zhang, H., Yuan, W., Dong, W., and Liu, S.: Seasonal patterns of litterfall in forest ecosystem worldwide, Ecol. Complex., 20, 240–247, https://doi.org/10.1016/j.ecocom.2014.01.003, 2014.